

Compact Muon Solenoid
LHC, CERN
| CMS-PAS-TOP-22-007 | ||
| Searches for violation of Lorentz invariance in $ \mathrm{t}\mathrm{\bar{t}} $ production using dilepton events in proton-proton collisions at $ \sqrt{s}= $ 13 TeV | ||
| CMS Collaboration | ||
| 24 May 2023 | ||
| Abstract: Violation of Lorentz invariance is searched for using top quark pair ($ \mathrm{t}\mathrm{\bar{t}} $) production in proton-proton collisions at the LHC, at a center-of-mass energy of $ \sqrt{s}= $ 13 TeV. Events containing one electron and one muon collected with the CMS detector are analyzed in a data sample corresponding to an integrated luminosity of 77.4 fb$ ^{-1} $. A measurement of the differential normalized cross section for $ \mathrm{t}\mathrm{\bar{t}} $ production as a function of sidereal time is performed. Potential violation of Lorentz invariance is introduced as an extension of the standard model (SM), with an effective field theory predicting the modulation of the $ \mathrm{t}\mathrm{\bar{t}} $ cross section with sidereal time. Bounds on Lorentz-violating couplings are extracted, and found to be compatible with Lorentz invariance with an absolute precision of 0.1 $ {-}$0.8%. This search can also be interpreted as a precision test of special relativity with top quarks, improving precision by two orders of magnitude over a previous such measurement. | ||
| Links: CDS record (PDF) ; CADI line (restricted) ; | ||
| Figures & Tables | Summary | Additional Figures | References | CMS Publications |
|---|
| Figures | |
png pdf |
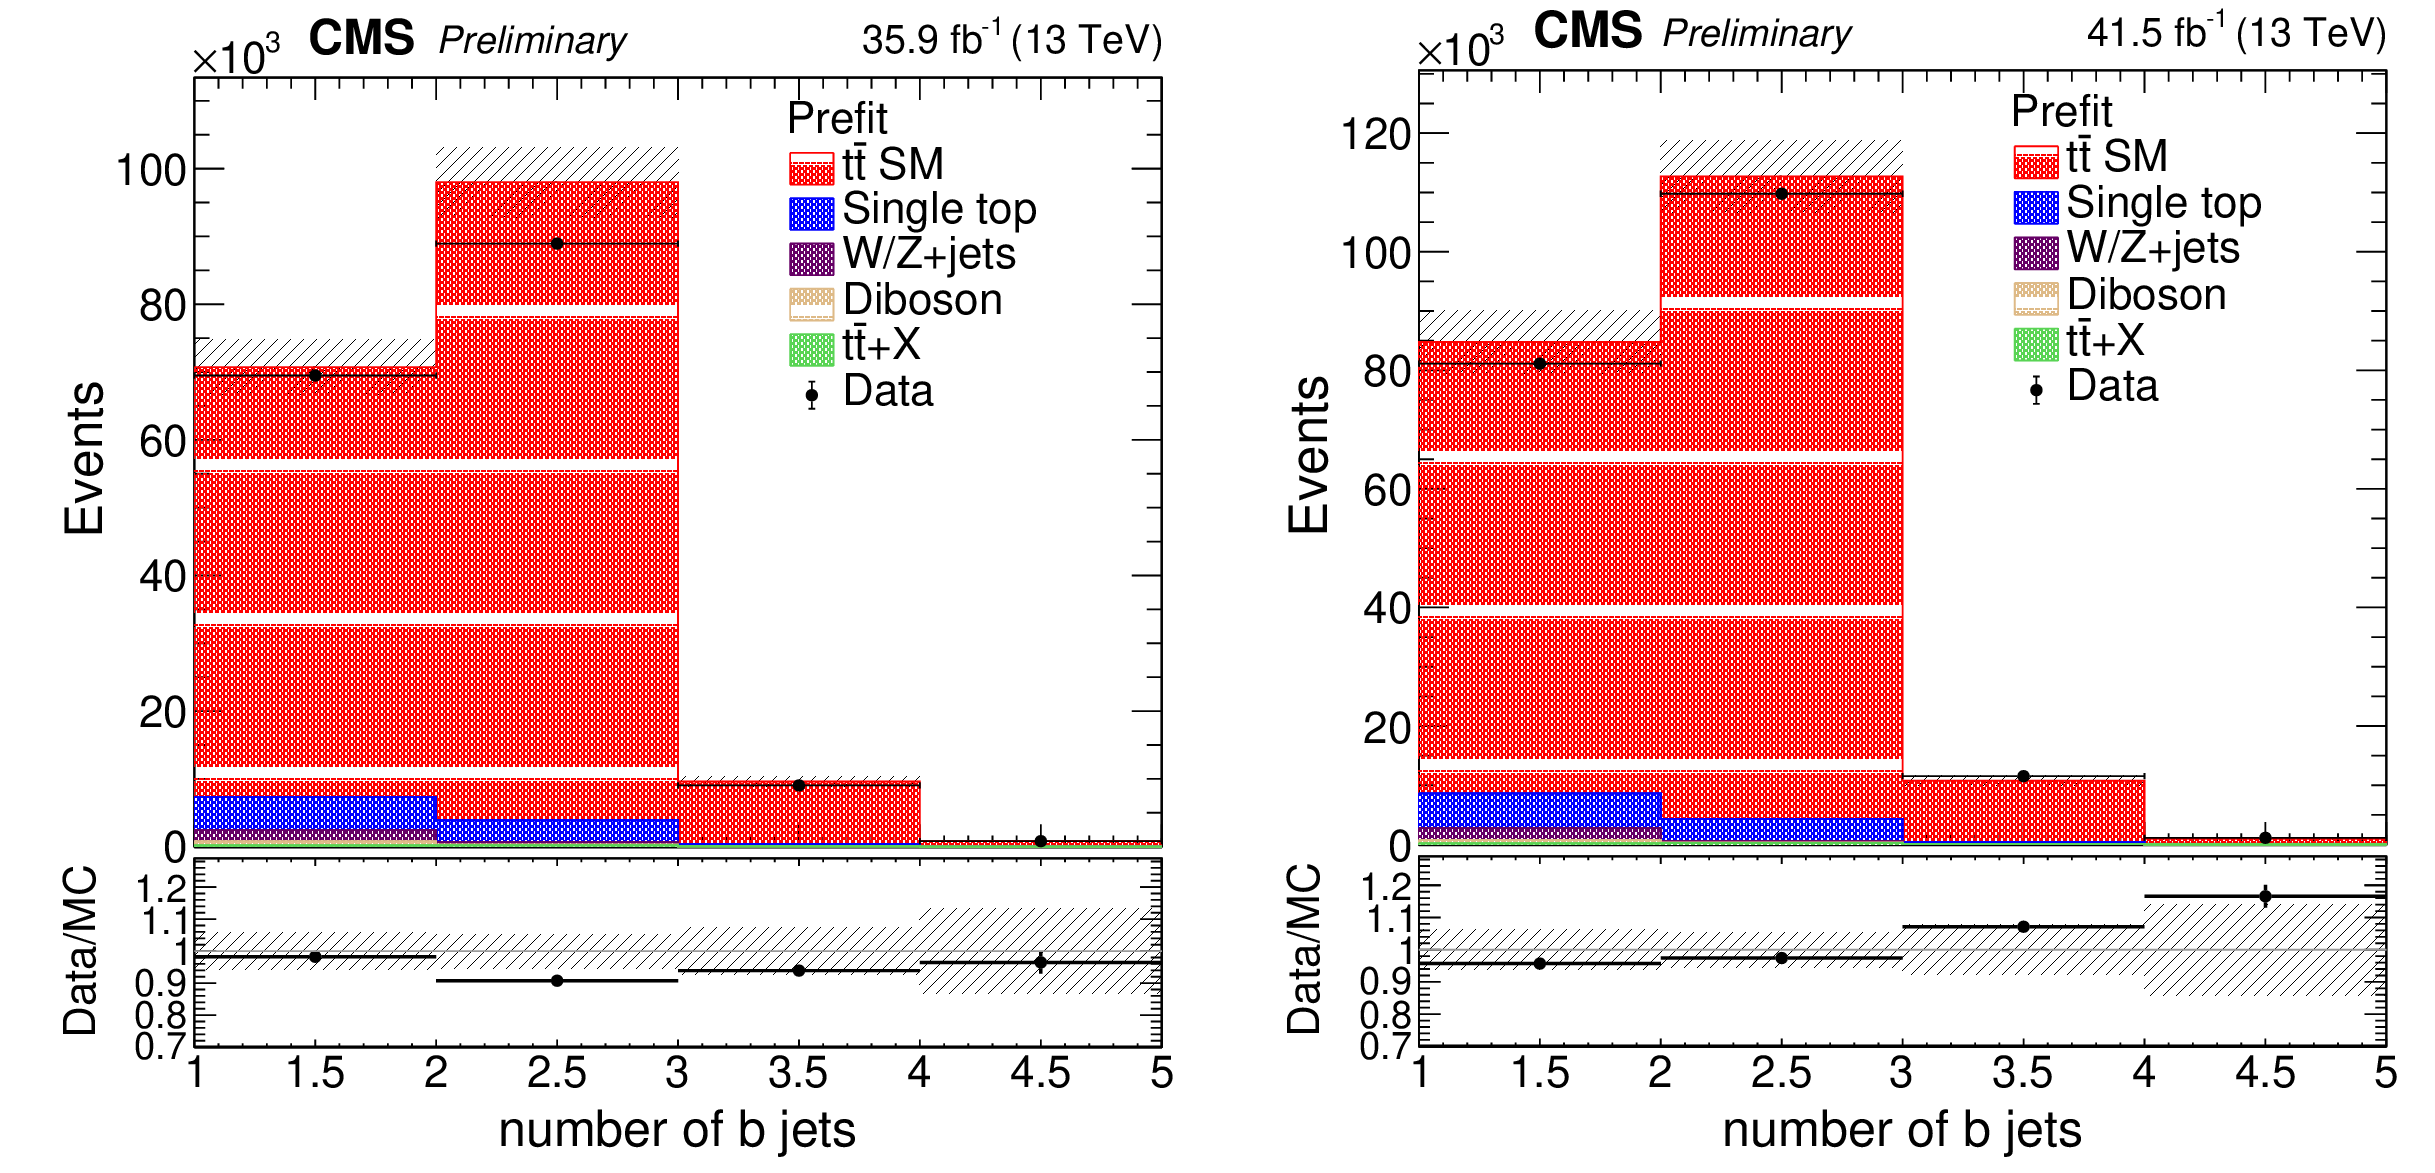
Figure 1:
Distribution of the number of b jets in data and simulation, after the event selection, (left) in 2016 and (right) in 2017 samples. The error band includes statistical and systematic uncertainties of the predictions. |

png pdf |
Figure 1-a:
Distribution of the number of b jets in data and simulation, after the event selection, (left) in 2016 and (right) in 2017 samples. The error band includes statistical and systematic uncertainties of the predictions. |
png pdf |
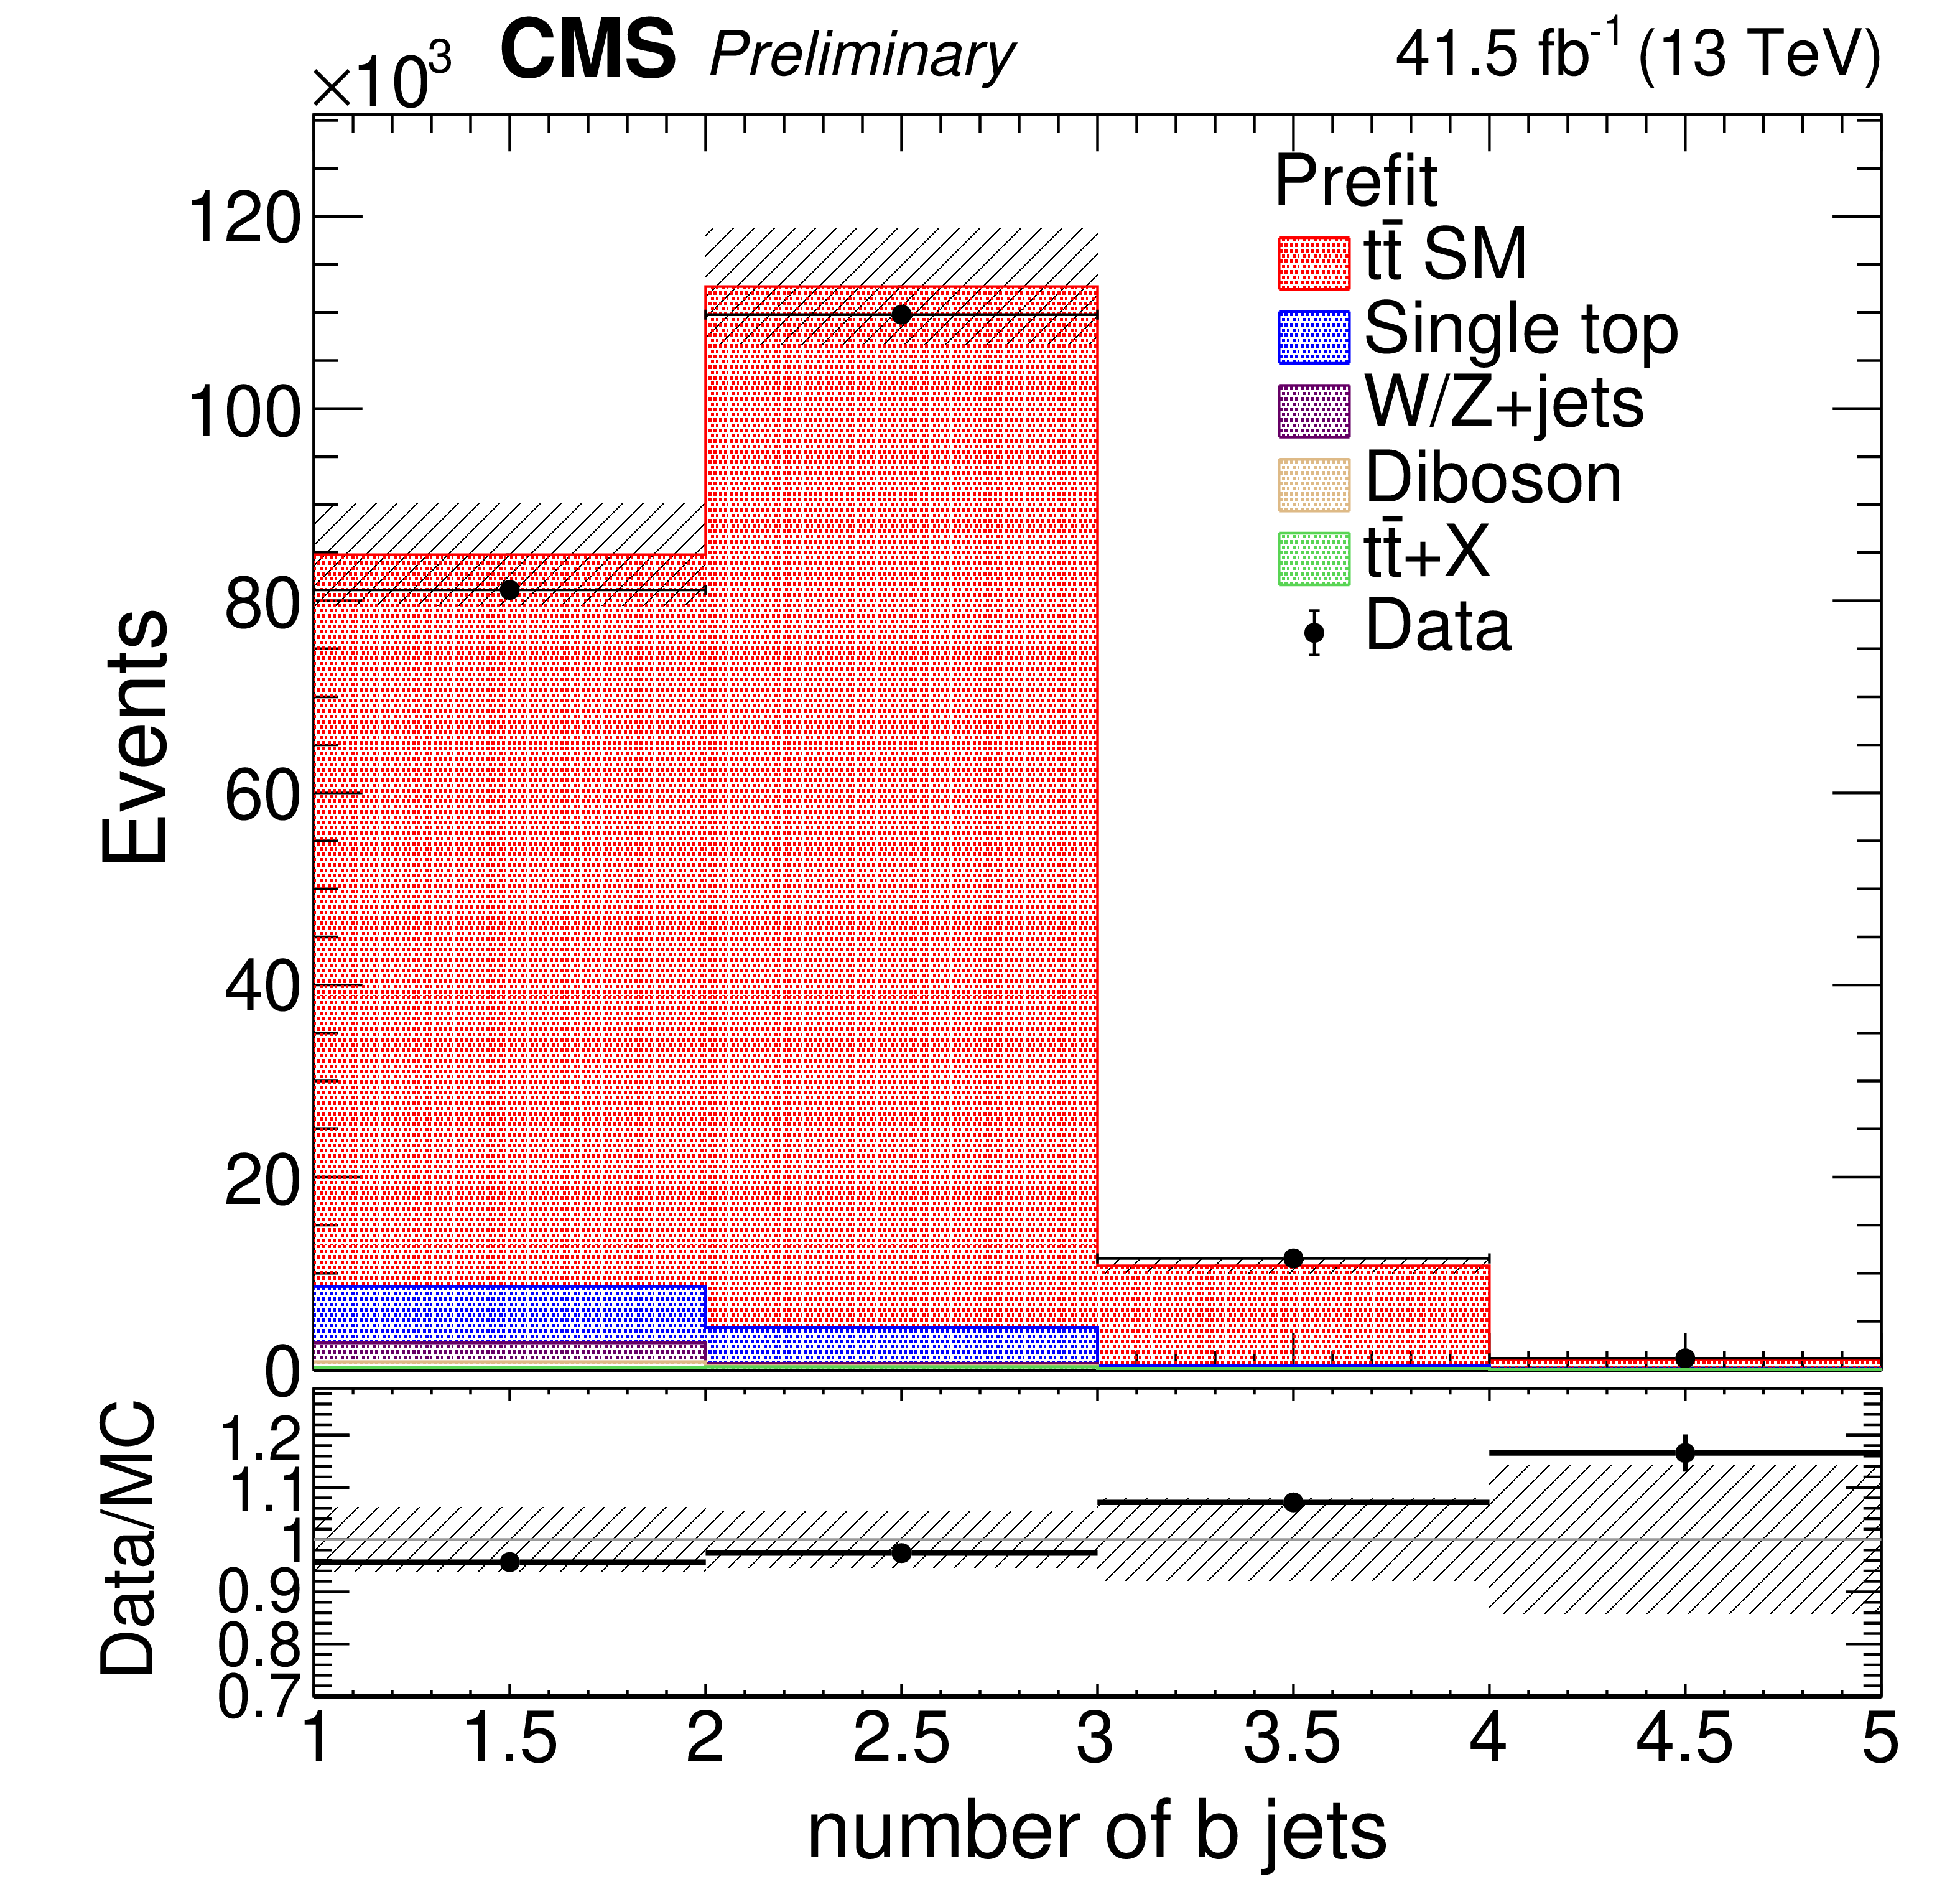
Figure 1-b:
Distribution of the number of b jets in data and simulation, after the event selection, (left) in 2016 and (right) in 2017 samples. The error band includes statistical and systematic uncertainties of the predictions. |

png pdf |
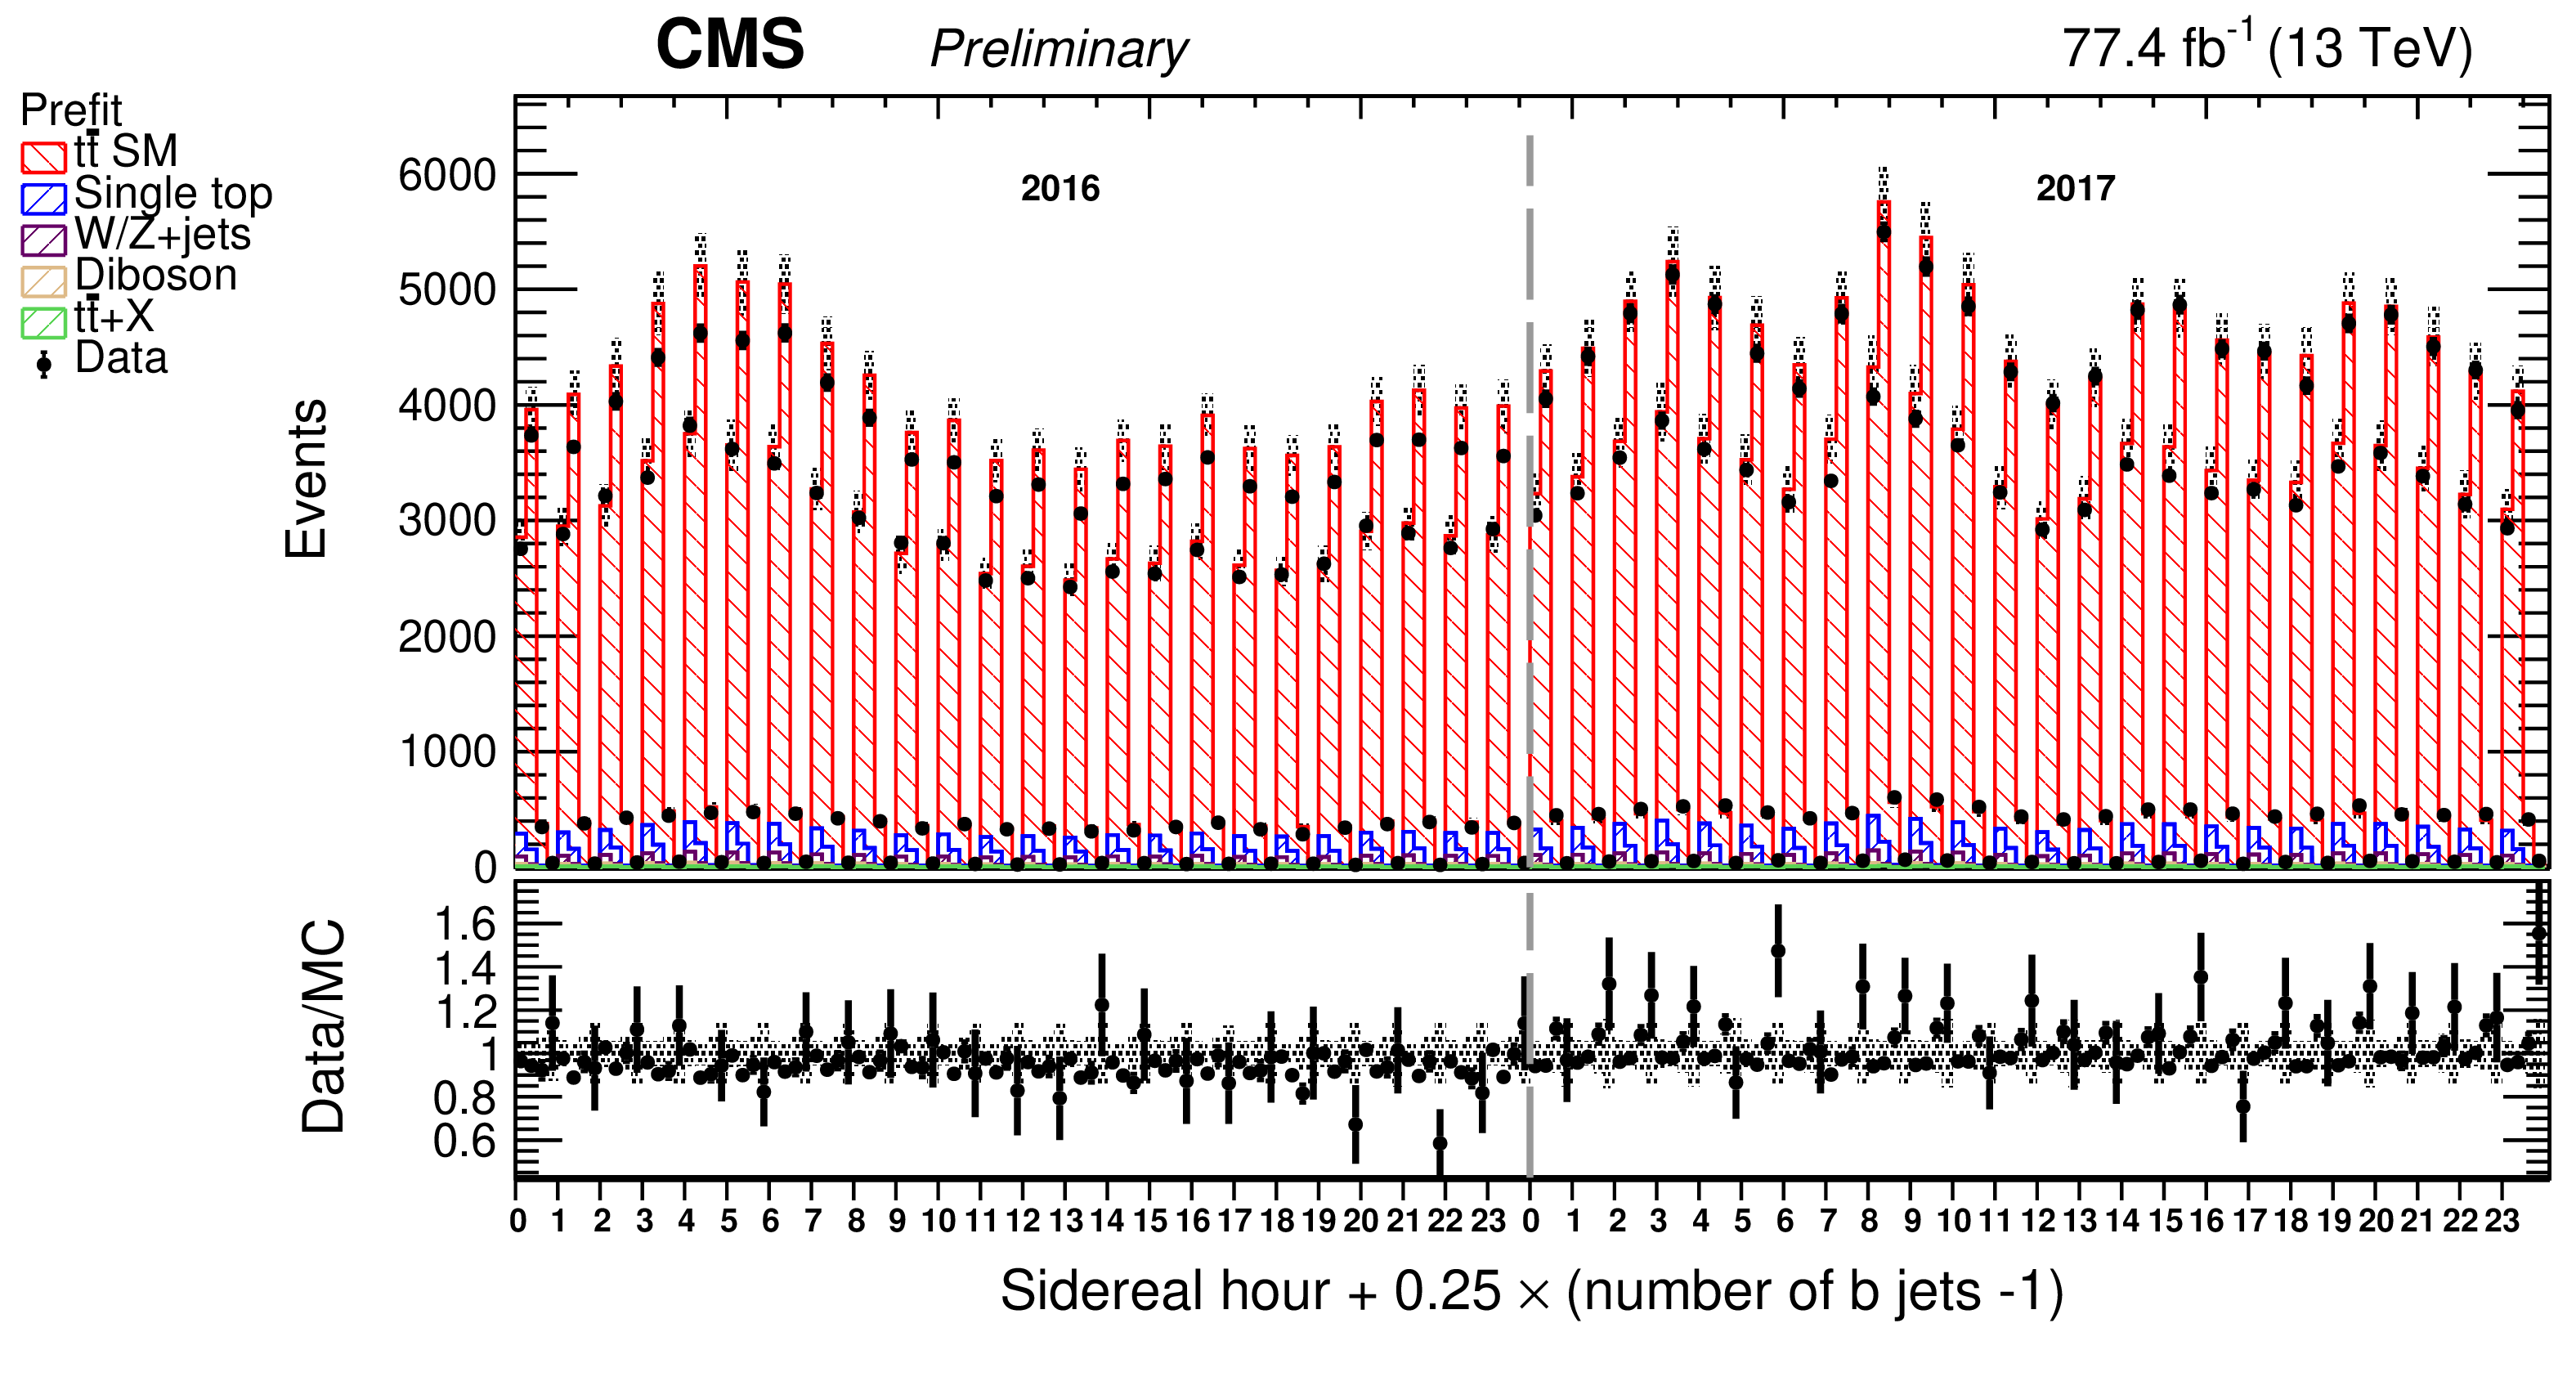
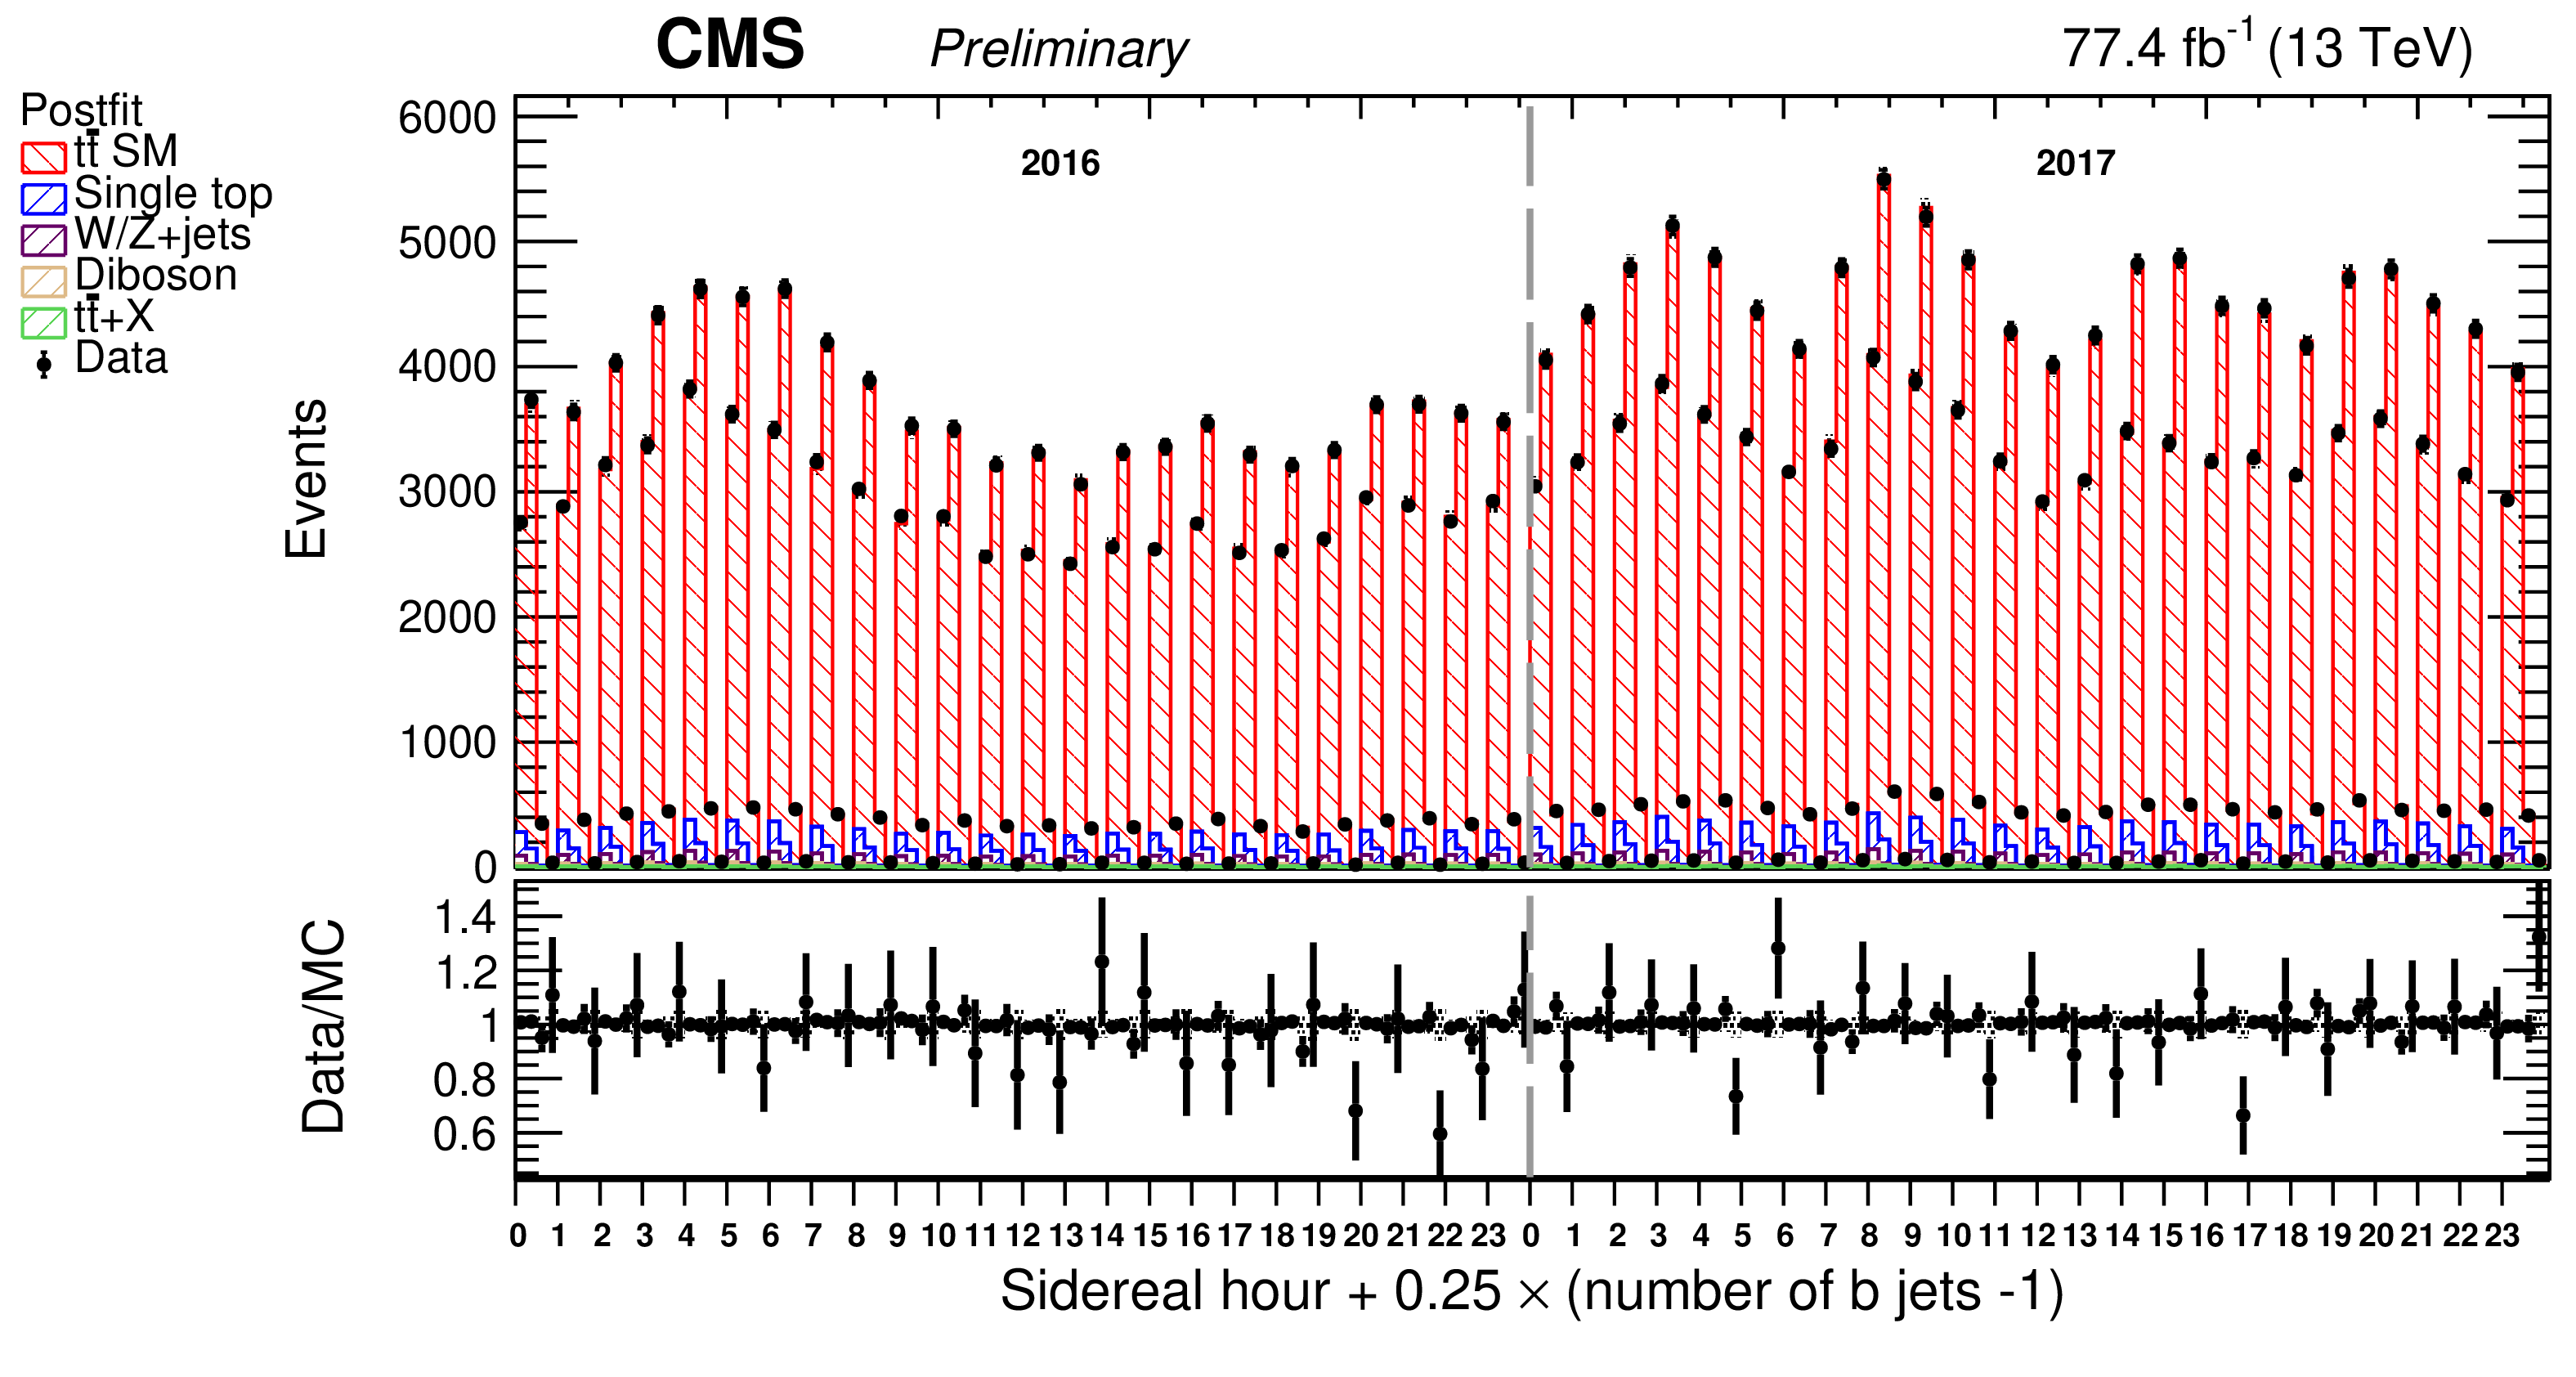
Figure 2:
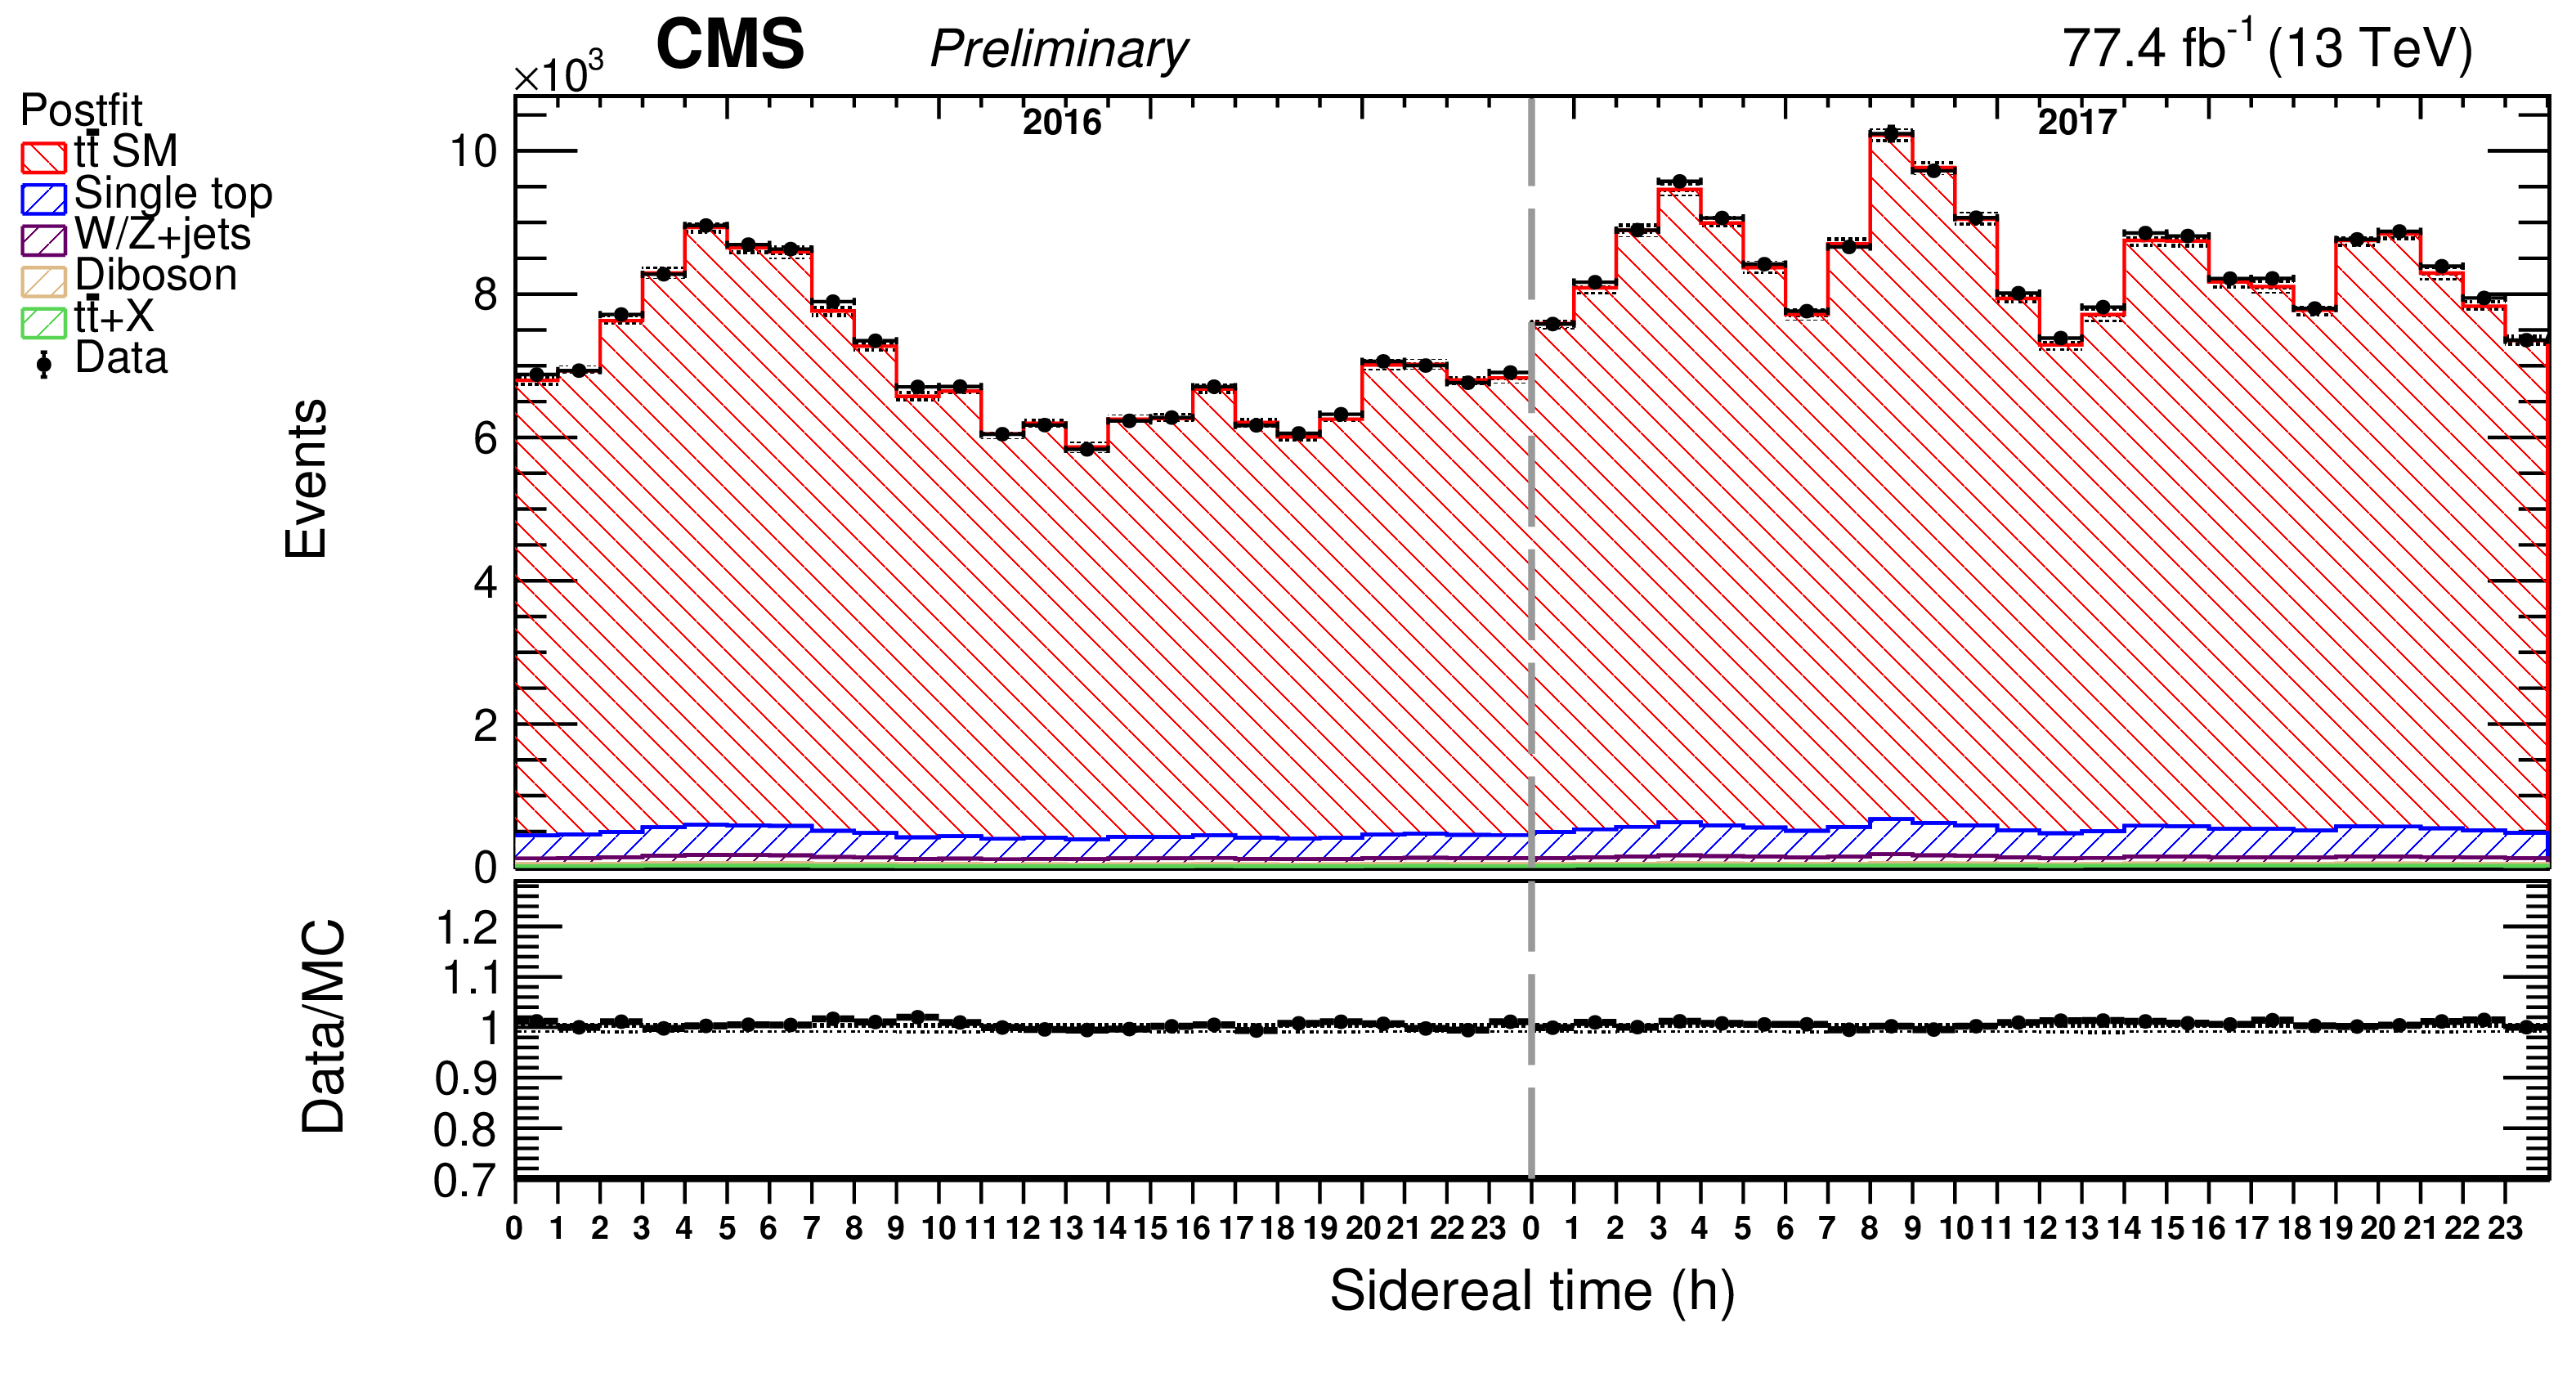
Prefit (up) and postfit (down) distributions of the number of b jets in sidereal time bins, in 2016 and 2017 data. The uncertainty band reflects the statistical and systematic uncertainty in each bin, including correlations across bins. |
png pdf |
Figure 2-a:
Prefit (up) and postfit (down) distributions of the number of b jets in sidereal time bins, in 2016 and 2017 data. The uncertainty band reflects the statistical and systematic uncertainty in each bin, including correlations across bins. |
png pdf |
Figure 2-b:
Prefit (up) and postfit (down) distributions of the number of b jets in sidereal time bins, in 2016 and 2017 data. The uncertainty band reflects the statistical and systematic uncertainty in each bin, including correlations across bins. |
png pdf |
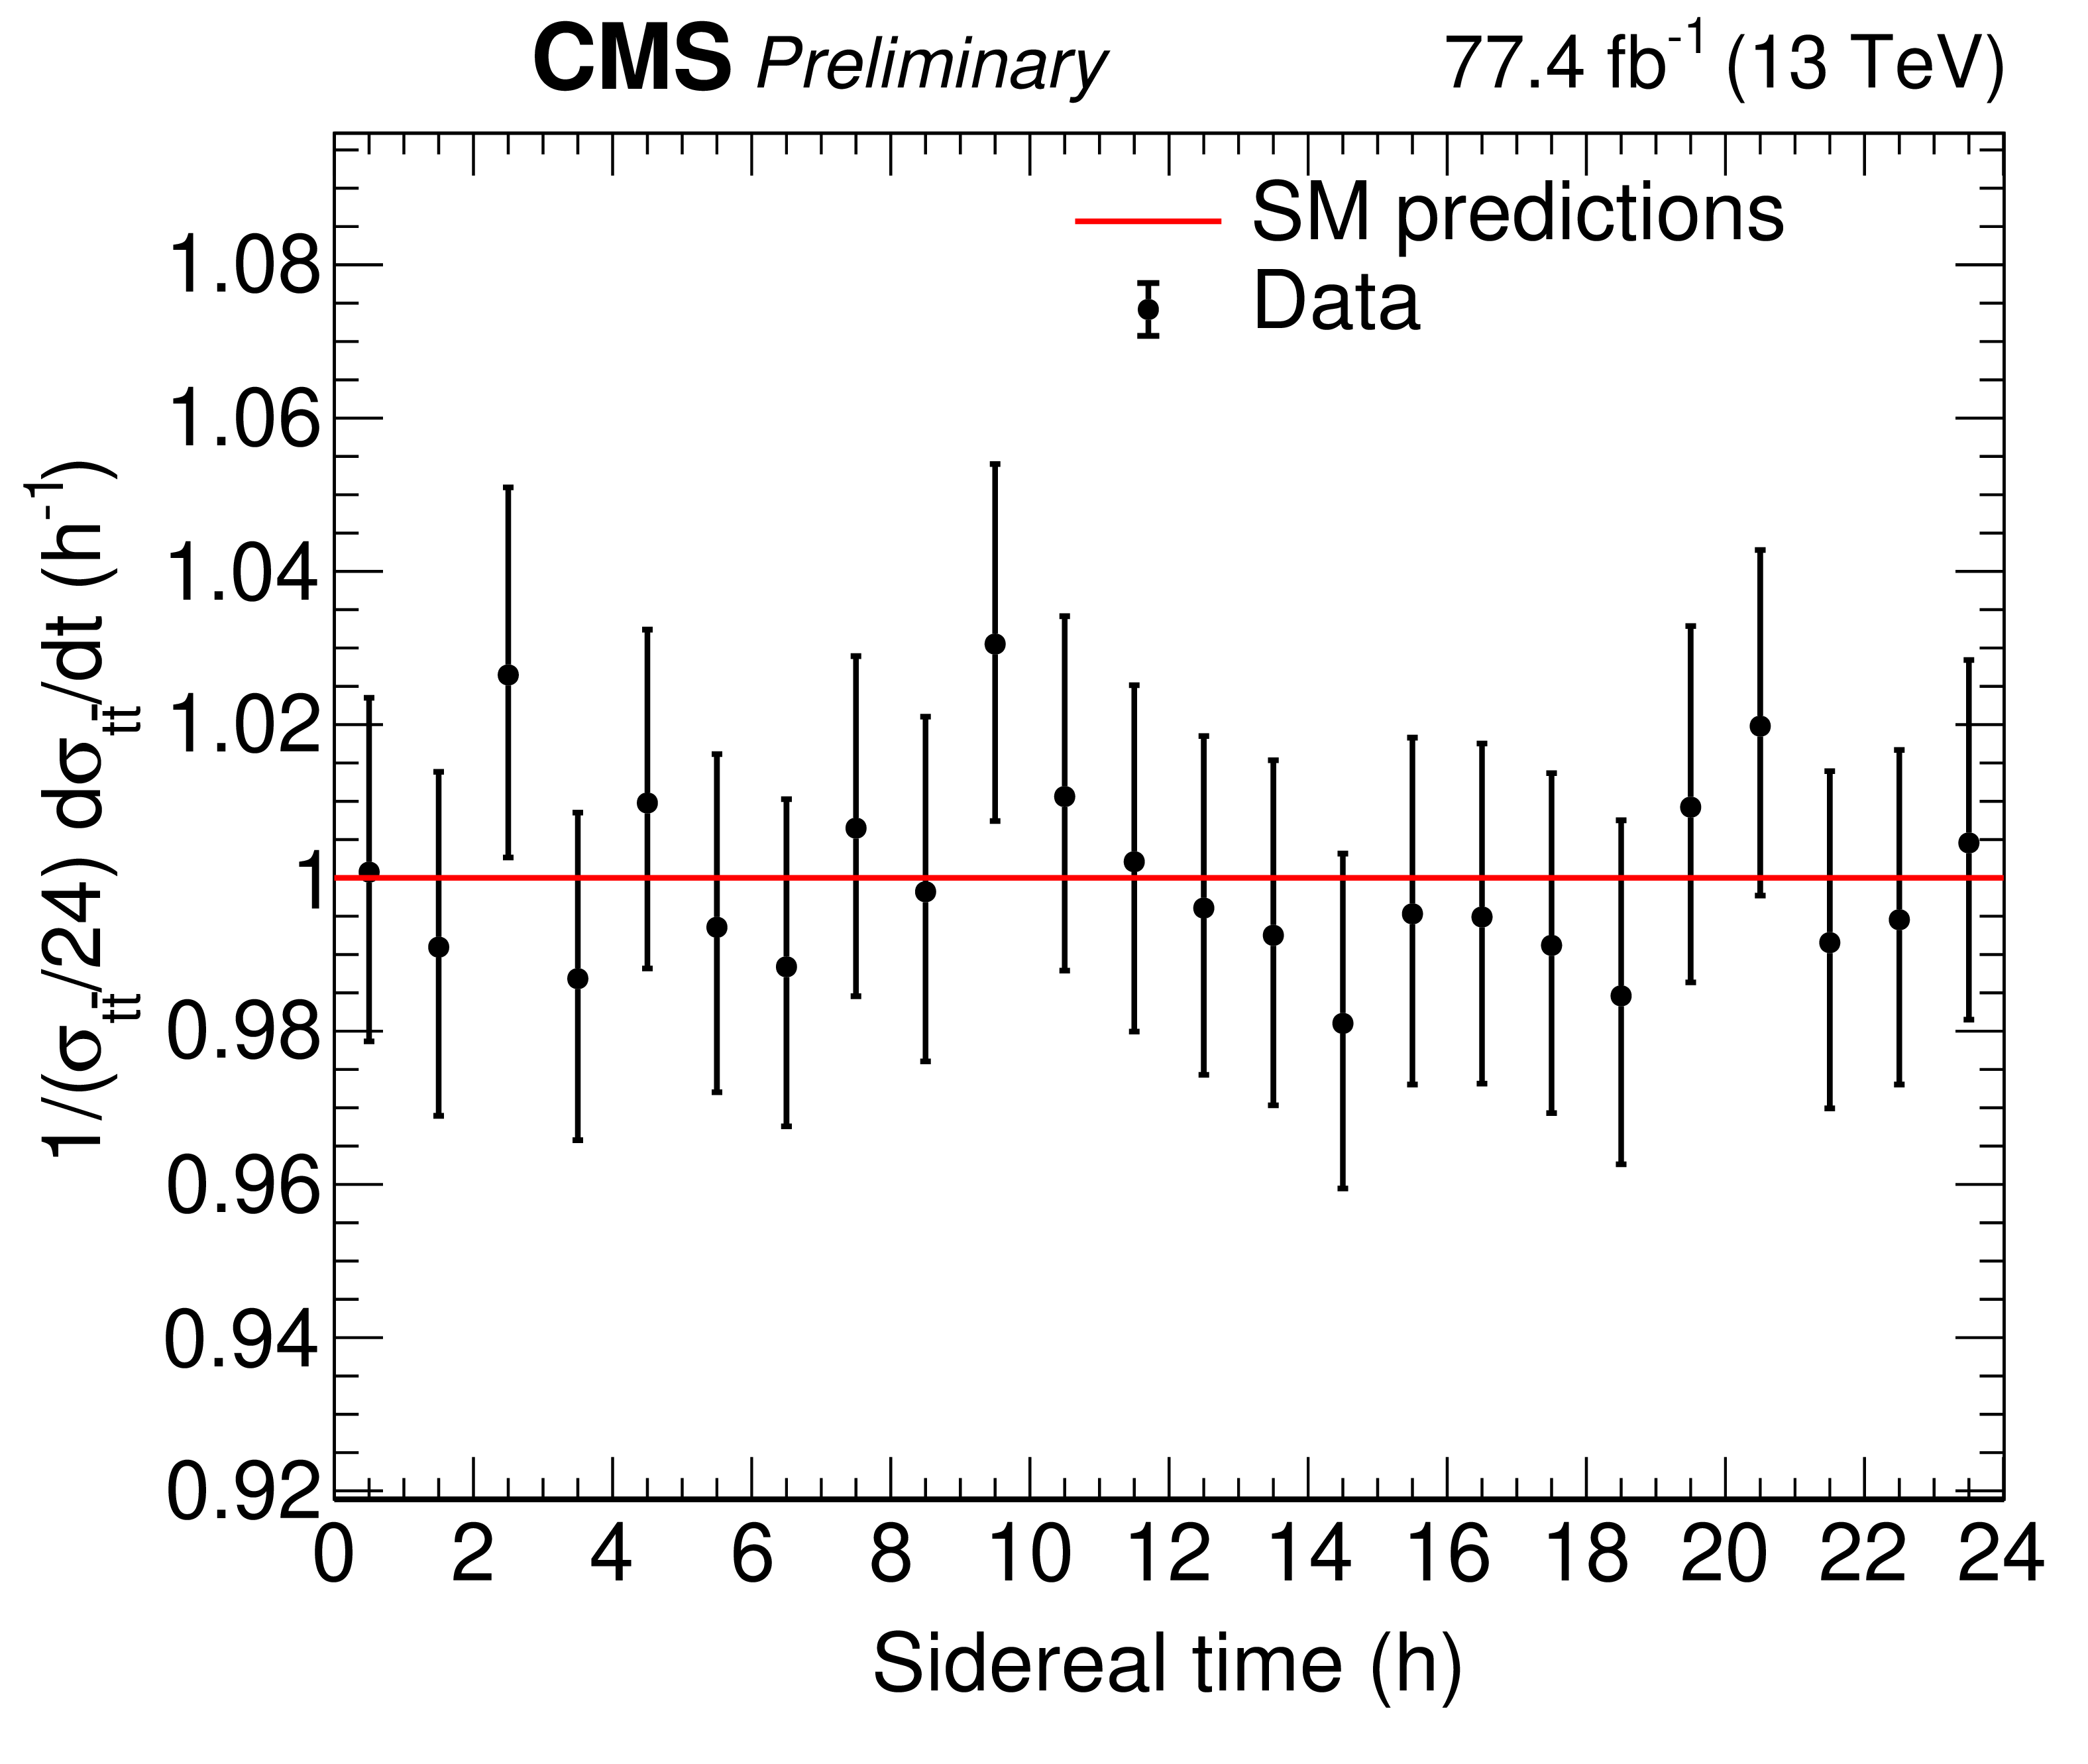
Figure 3:
The $ \mathrm{t} \bar{\mathrm{t}} $ normalized differential cross section as a function of sidereal time, using combined 2016 and 2017 data. |

png pdf |
Figure 4:
Uncertainty breakdown for the normalized differential cross section, by splitting according to the treatment of time dependence: uniform across sidereal time (flat luminosity component, background normalization, theory), correlated in sidereal time bins (trigger, luminosity stability and linearity, pileup, and MC statistics), systematics uncorrelated in sidereal time bins (other experimental systematics), and statistical uncertainty. |
png pdf |
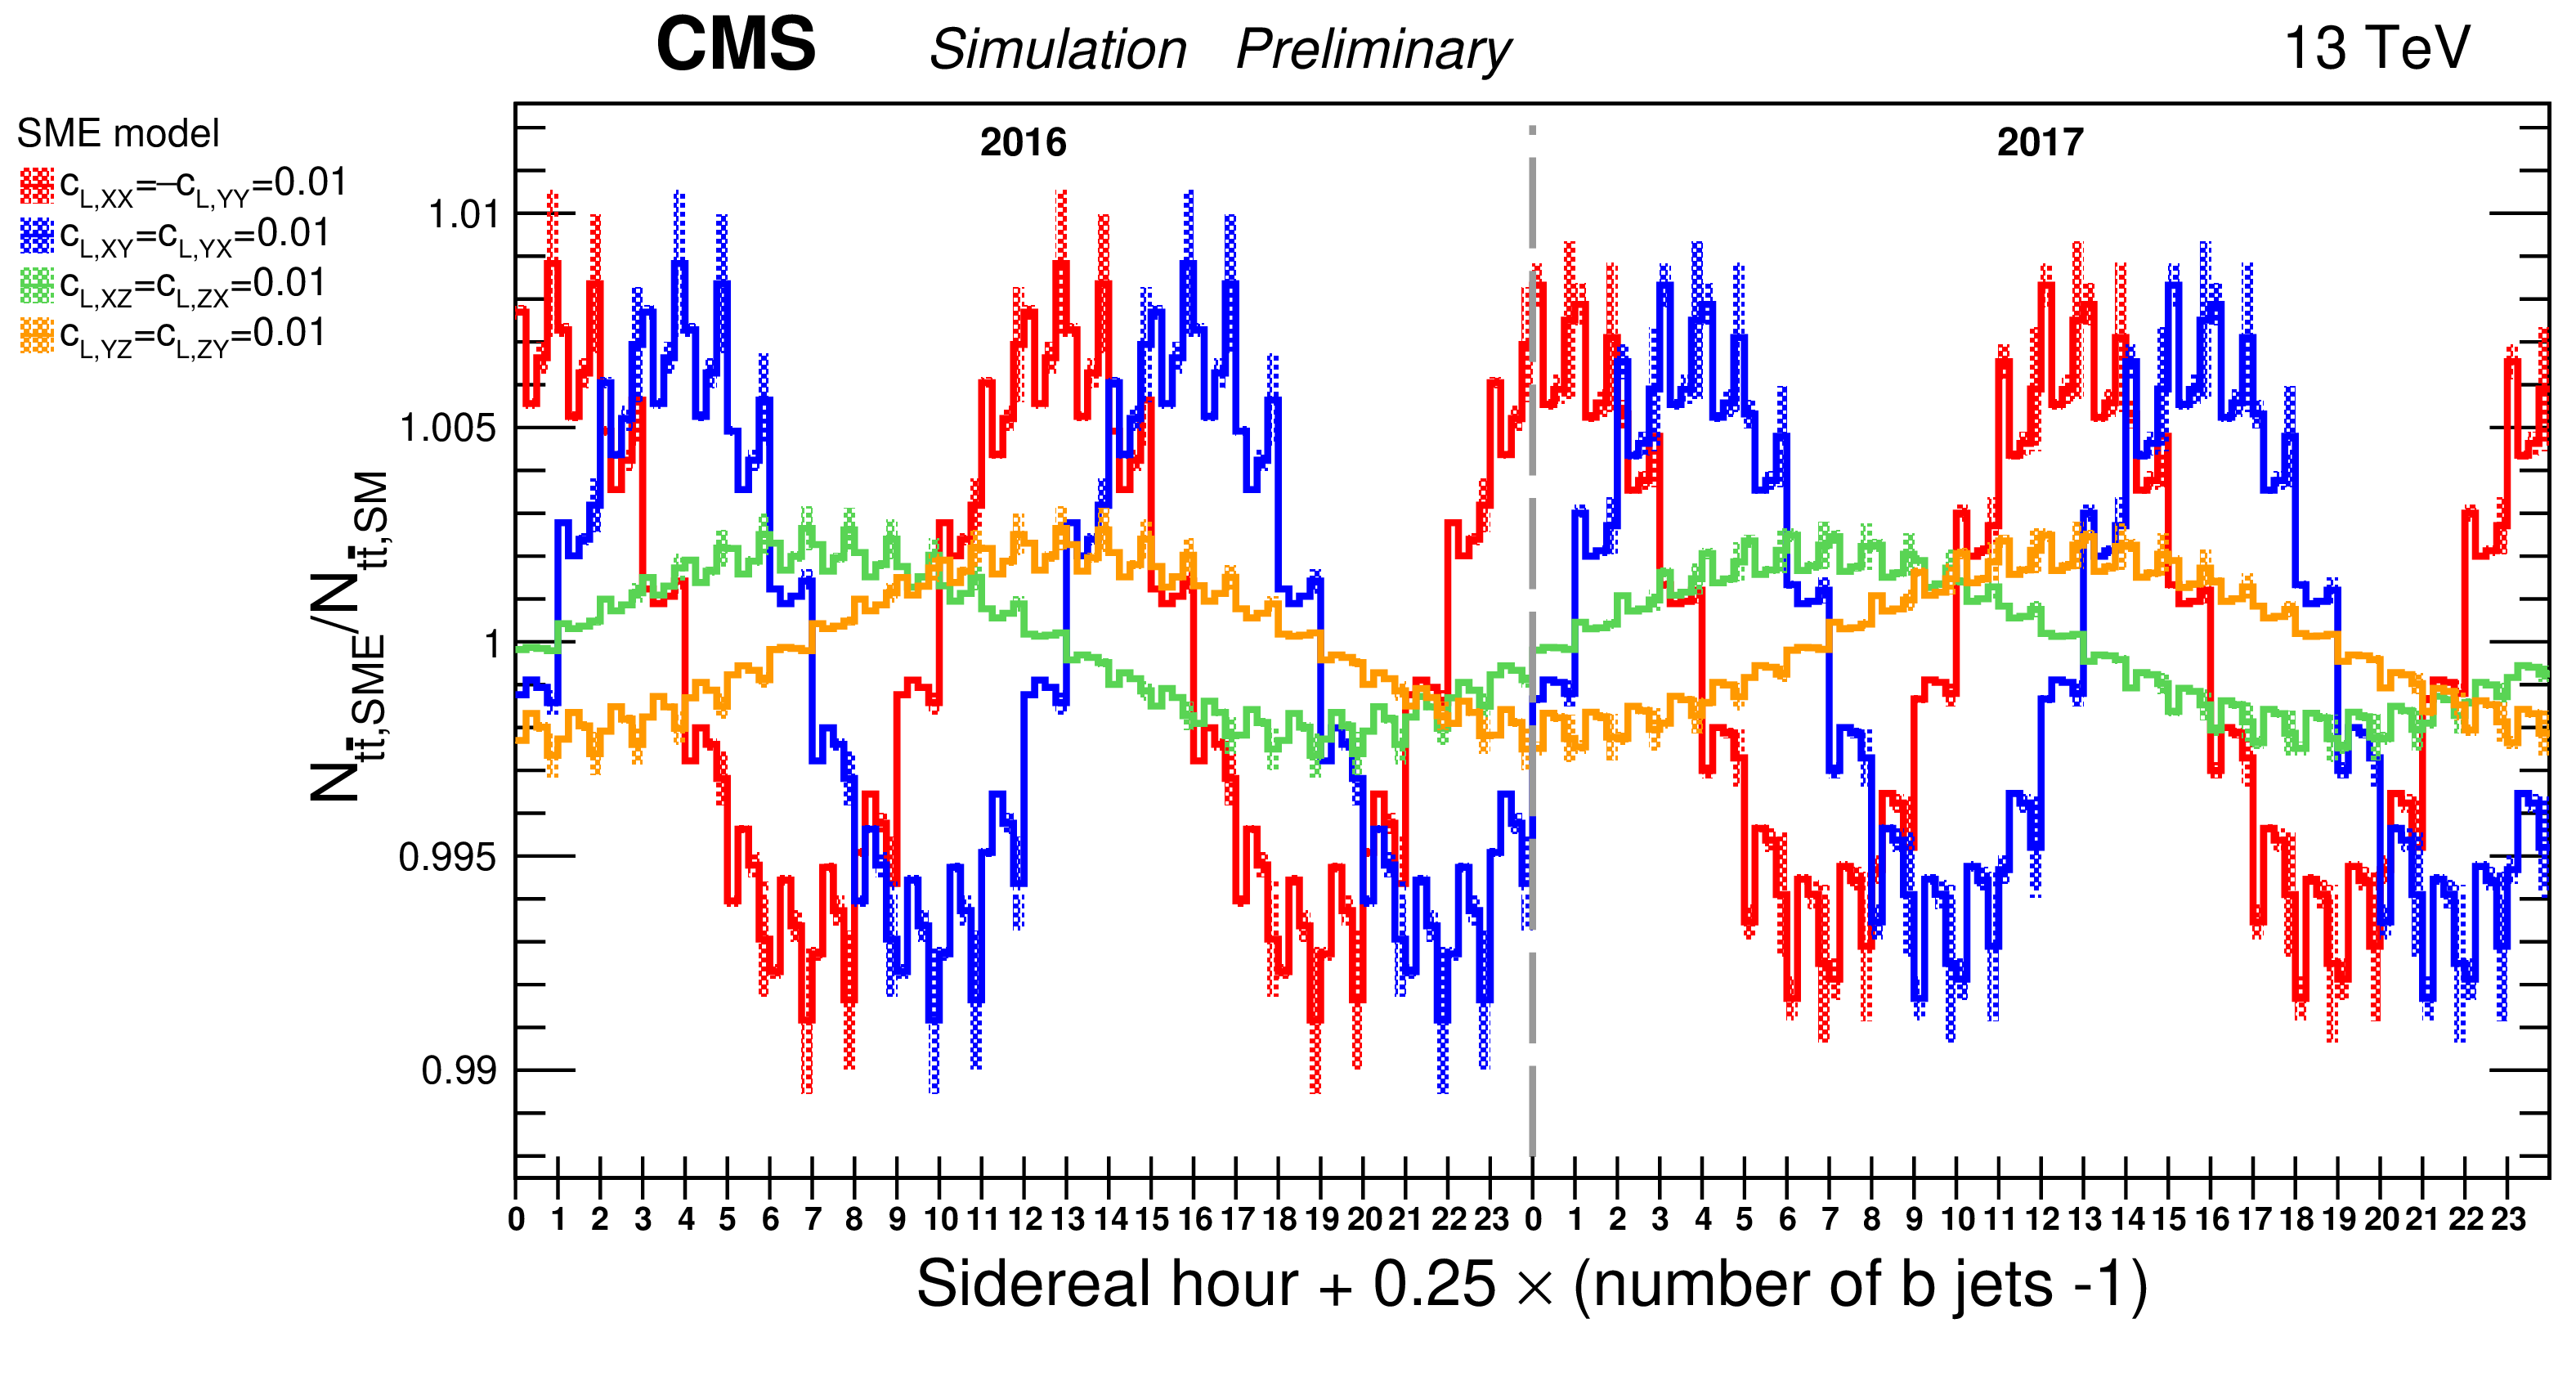
Figure 5:
Number of $ \mathrm{t} \bar{\mathrm{t}} $ events reconstructed in the SME hypothesis divided by the SM hypothesis, as a function of the number of b jets and sidereal time, here for the four directions of the $ c_L $ coefficients. The uncertainty band represents the MC statistical uncertainty in the sample used to compute the SME hypothesis. |

png pdf |
Figure 6:
Fitted SME coefficients and their uncertainties measured in fits of single coefficients while the coefficients corresponding to the three other directions are left floating, within the $ c_L $, $ c_R $, $ c $, and $ d $ families. Fitting a single coefficient, while the others are fixed to the SM value, leads to negligible changes in the results. |
png pdf |
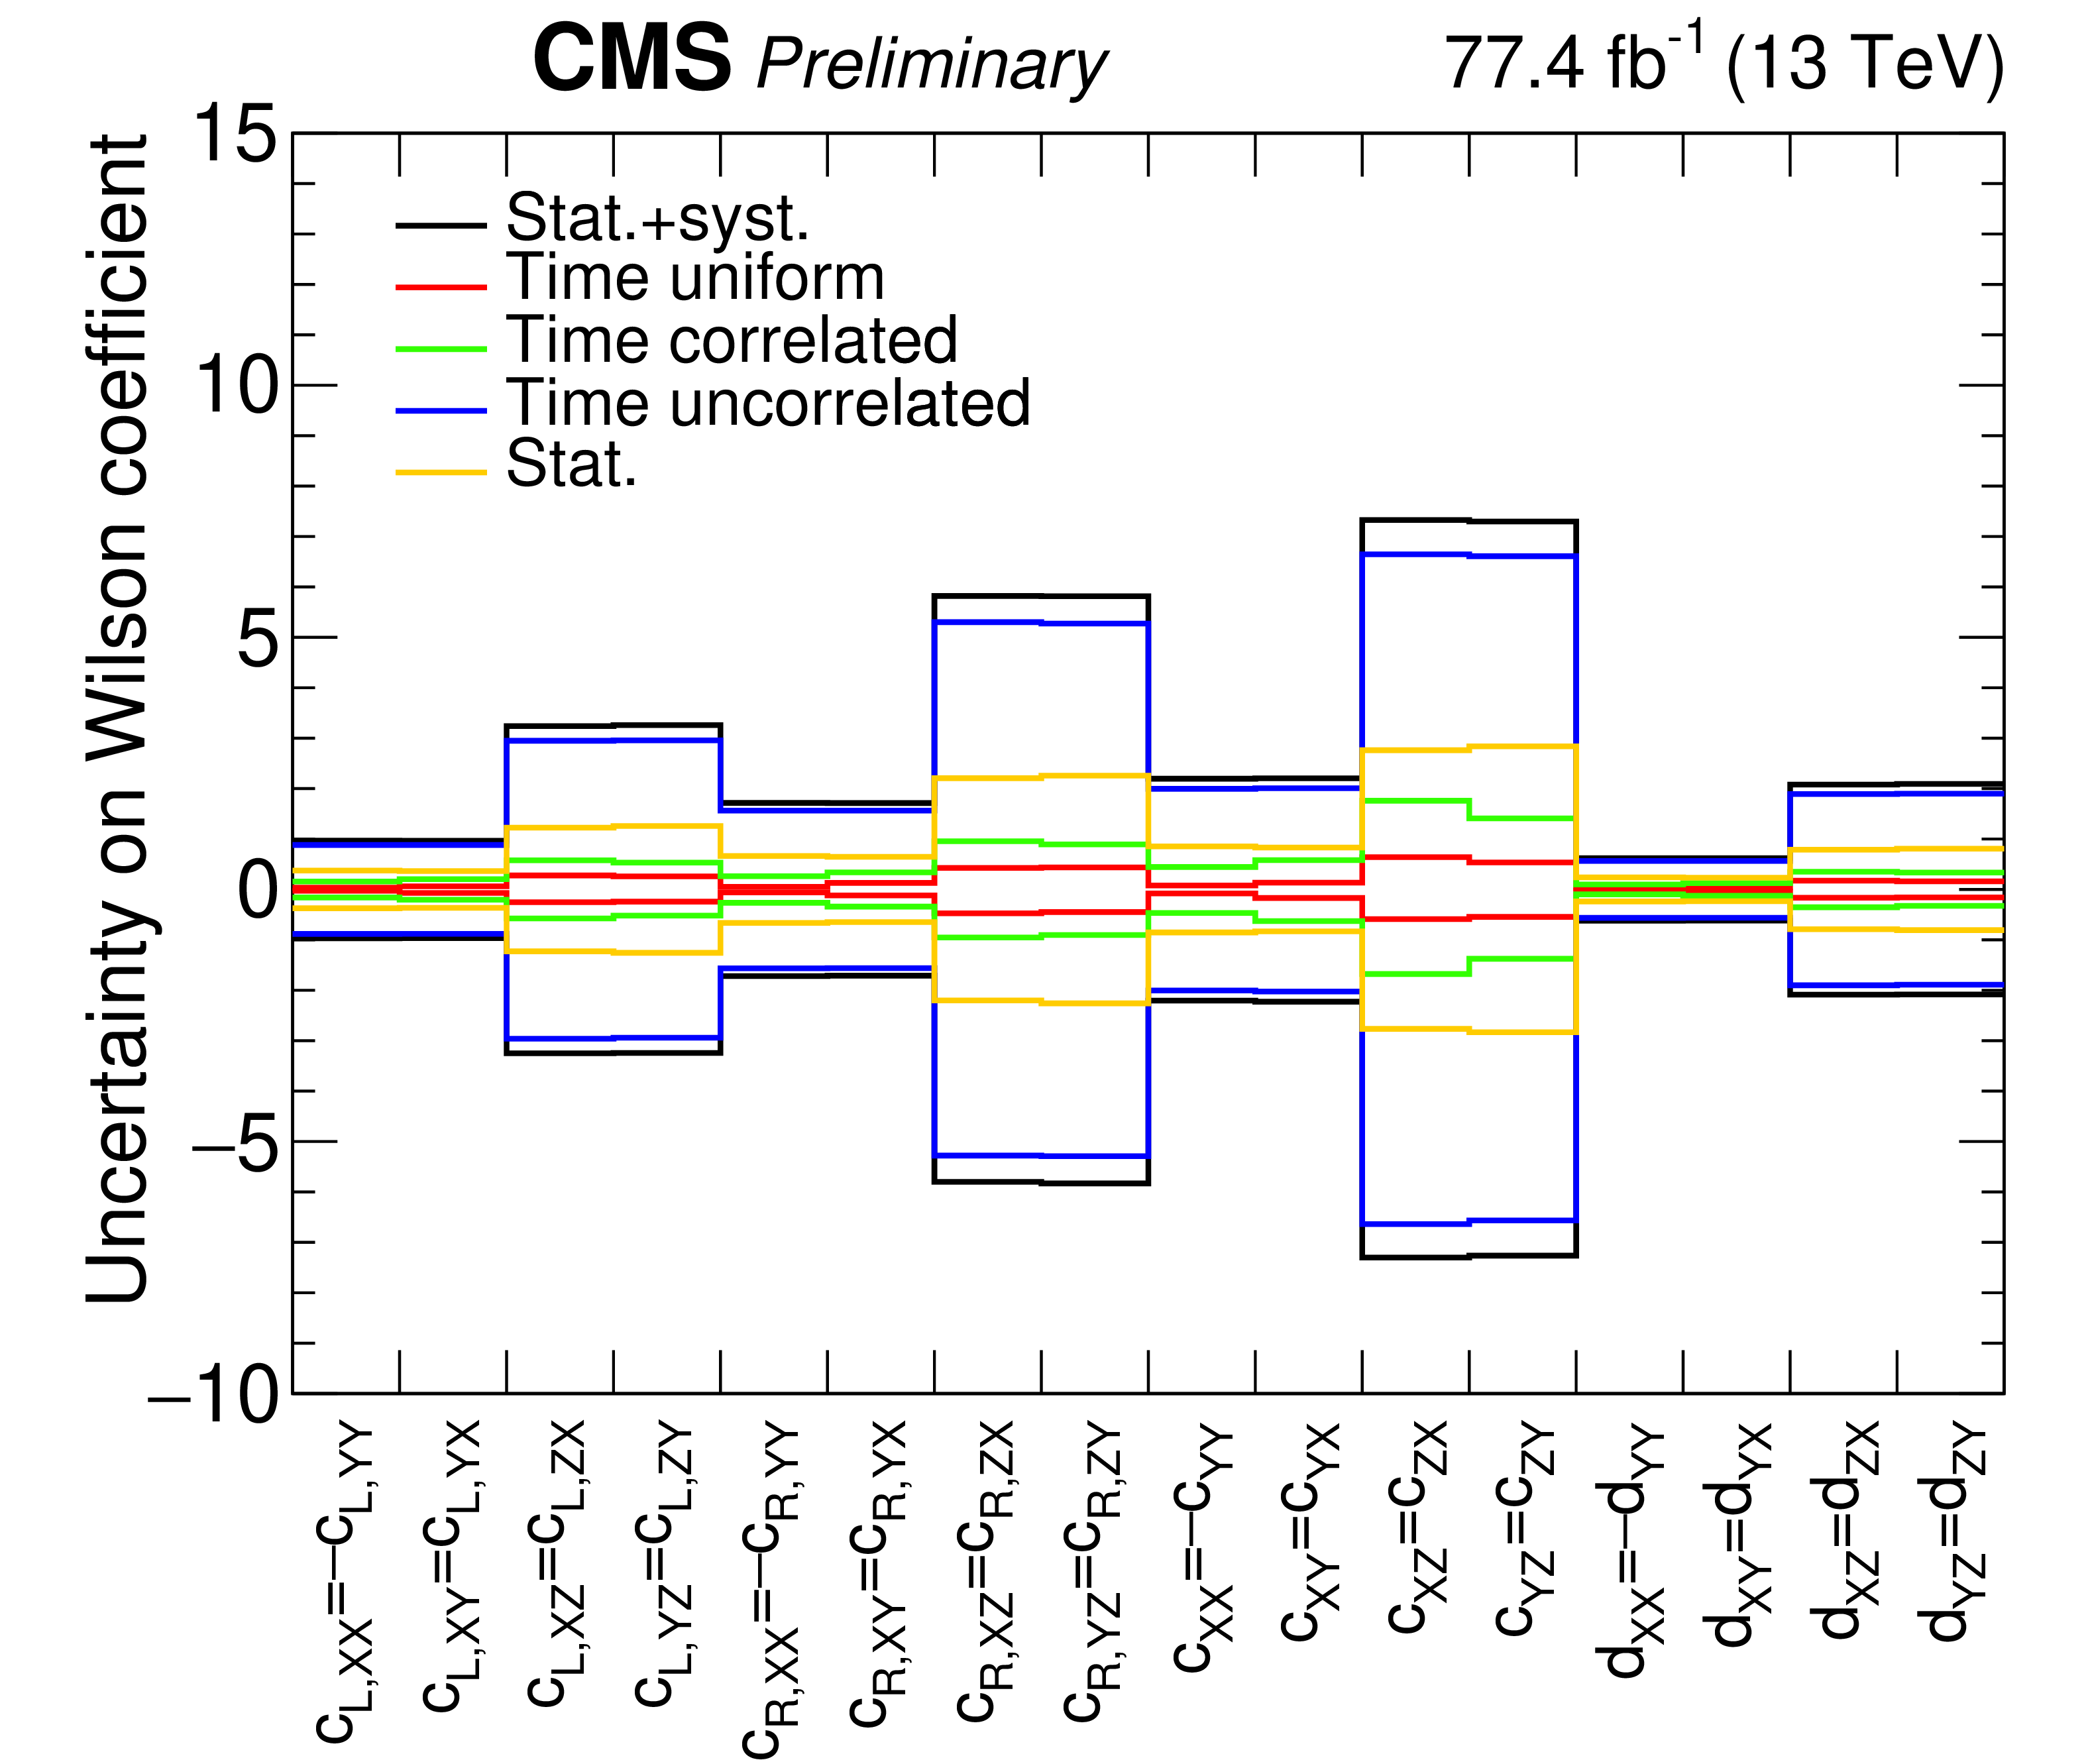
Figure 7:
Uncertainty breakdown for SME fits of single coefficients in 2016+2017 data while the coefficients corresponding to the three other directions are left floating, by splitting according to the treatment of time-dependence: flat across sidereal time (flat luminosity component, background normalization, theory), correlated in sidereal time bins (trigger, luminosity stability and linearity, pileup, MC statistics, single top decay in the SME), systematics uncorrelated in sidereal time bins (other experimental systematics) and statistical uncertainty. |
| Tables | |
png pdf |
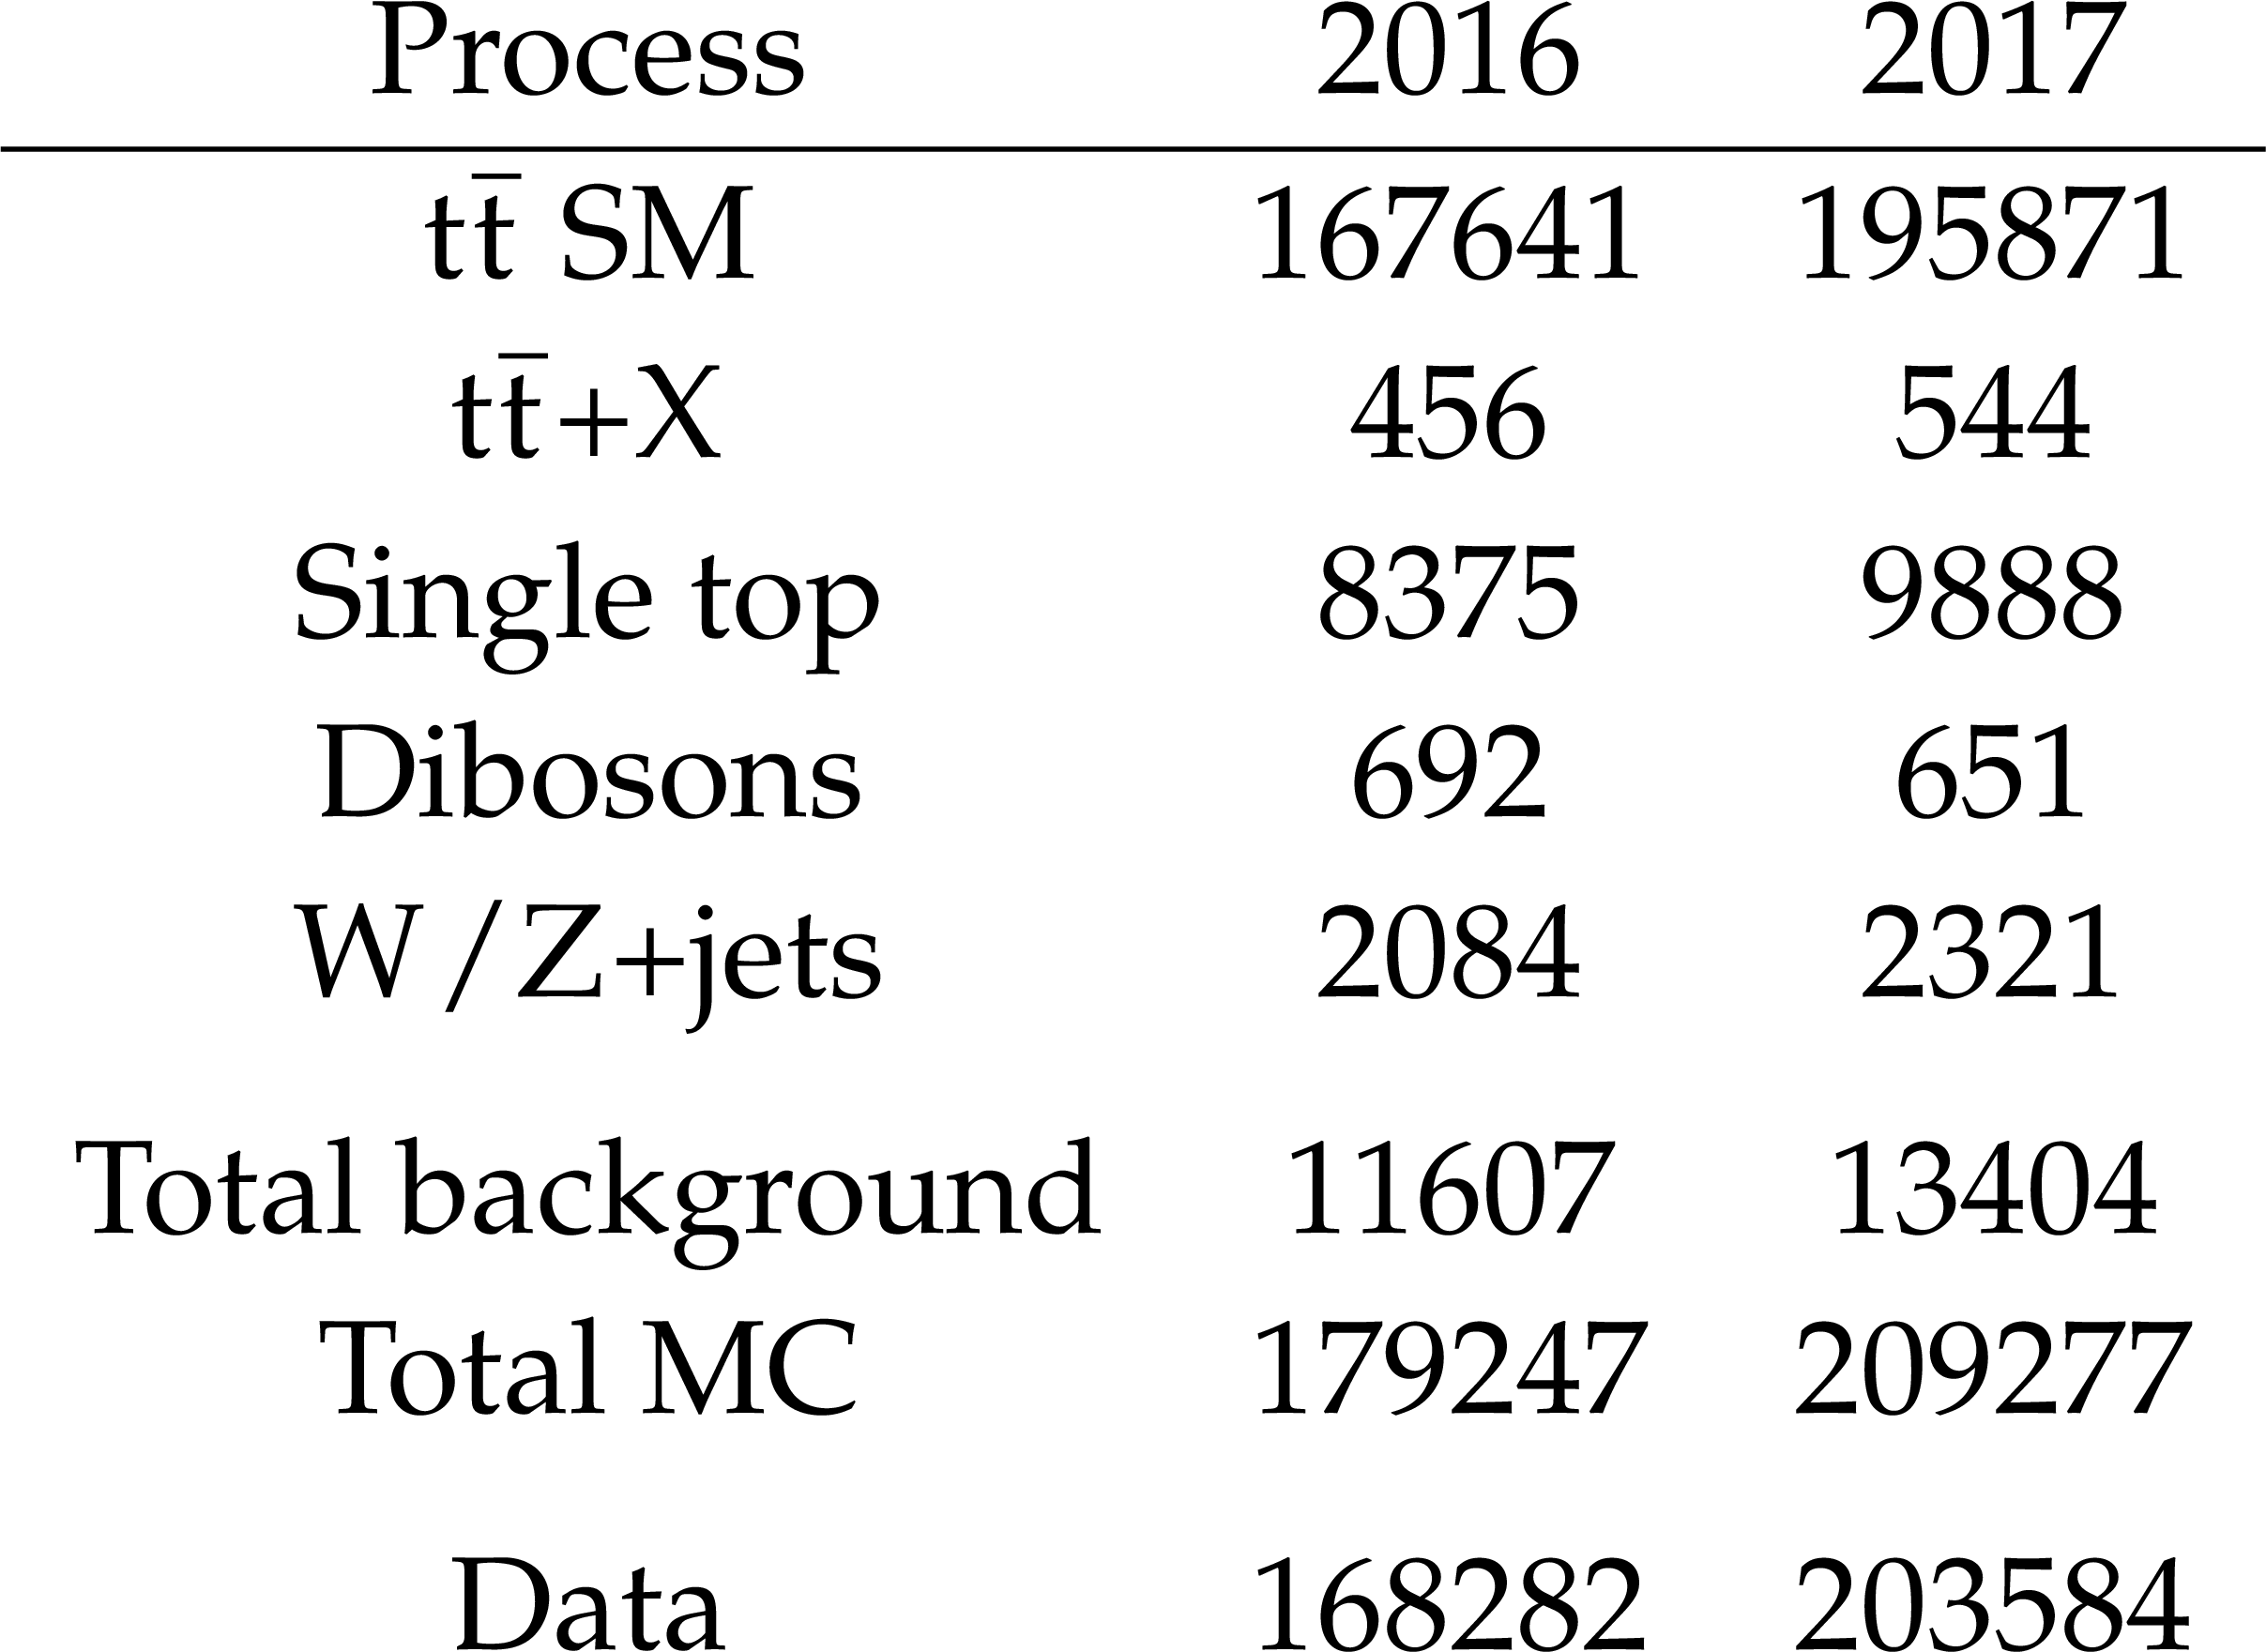
Table 1:
Event yield in data and MC simulation in 2016 and 2017, after selection. |

png pdf |
Table 2:
Summary of the systematic uncertainties and their correlation scheme between 2016 and 2017 data sets, and between sidereal time bins. Sources marked with an asterisk are only included in the SME fits. |
png pdf |
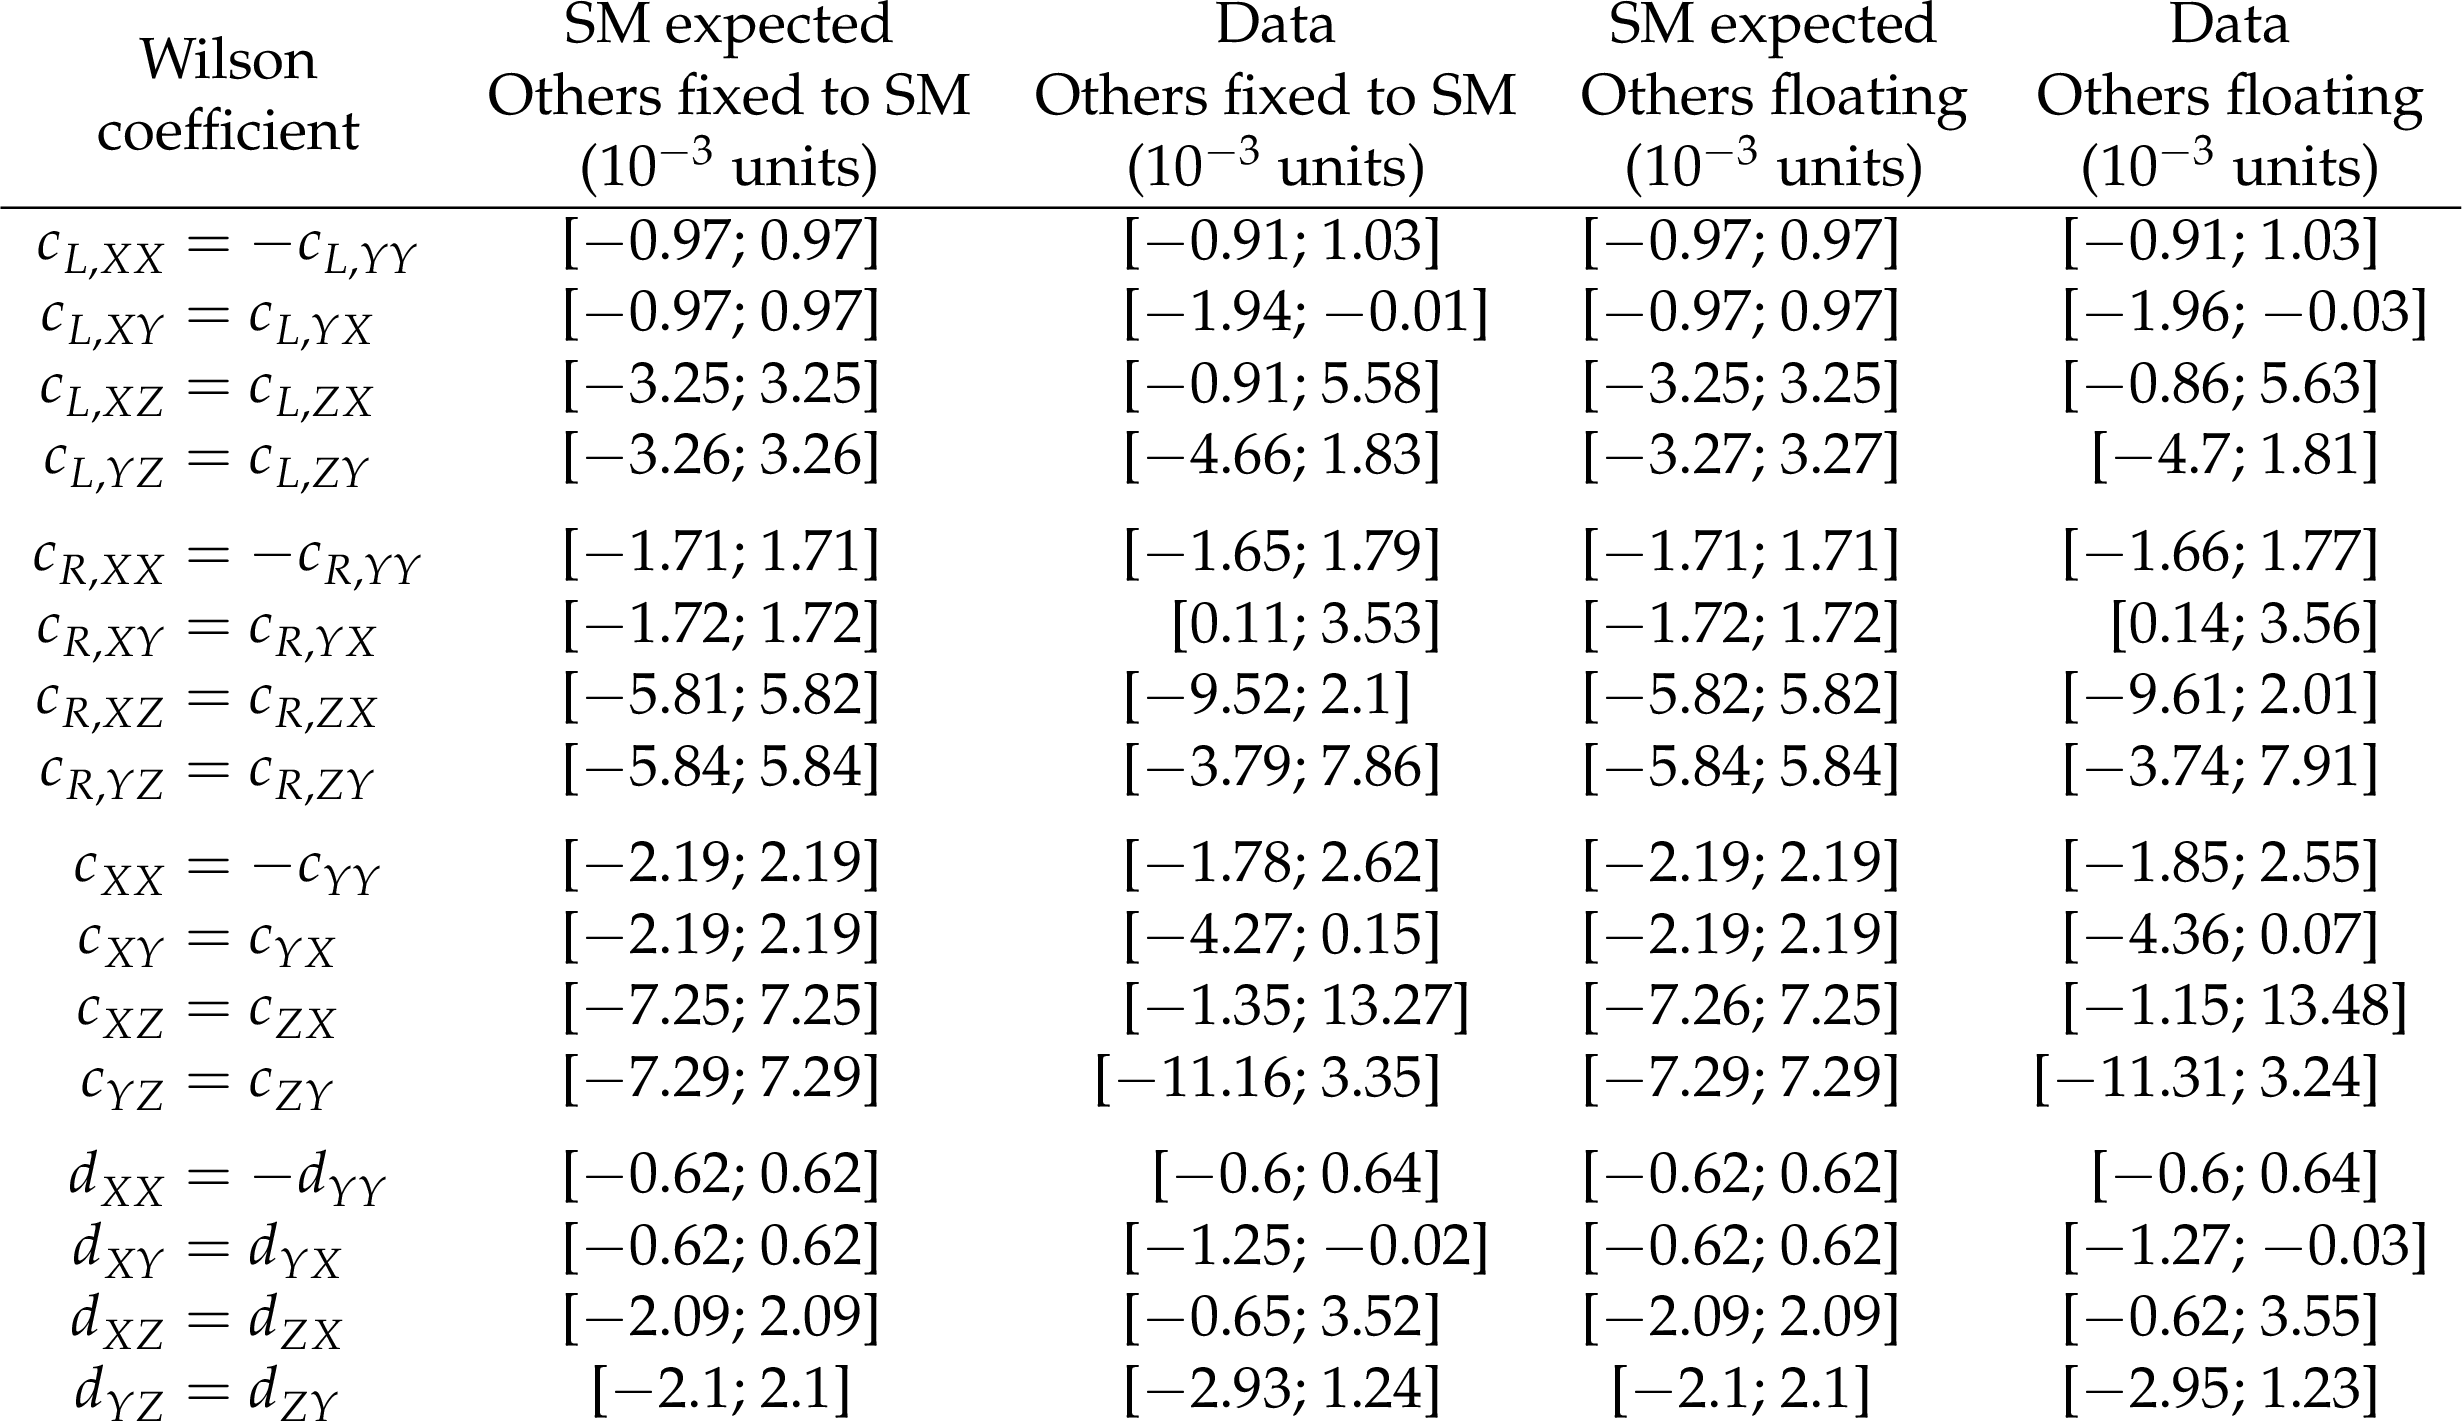
Table 3:
Expected and observed 1$ \sigma $ interval measured for the SME fits of single coefficients while the others are fixed to their SM value, and while coefficients for the three other directions are floating. |
| Summary |
| A search for violation of Lorentz invariance has been performed using top quark pairs ($ \mathrm{t} \bar{\mathrm{t}} $), requiring the presence of one muon and one electron in the events. Data collected in 2016 and 2017 at CMS is used with an integrated luminosity of 77.4 fb$ ^{-1} $. A measurement of the $ \mathrm{t} \bar{\mathrm{t}} $ yield as a function of sidereal time is performed. Lorentz invariance assumption is tested by measuring 16 sets of Wilson coefficients within the Standard Model Extension, an effective field theory predicting modulation of $ \mathrm{t} \bar{\mathrm{t}} $ cross section with sidereal time. Measurements of the Lorentz-violating couplings are found to be compatible with the SM hypothesis. The precision of the results ranges from less than 1 $ \times $ 10$^{-3} $ to 8 $ \times $ 10$^{-3} $ for the fits of the coefficients. This constitutes the most precise test of Lorentz invariance using top quarks at a hadron collider. |
| Additional Figures | |
png pdf |
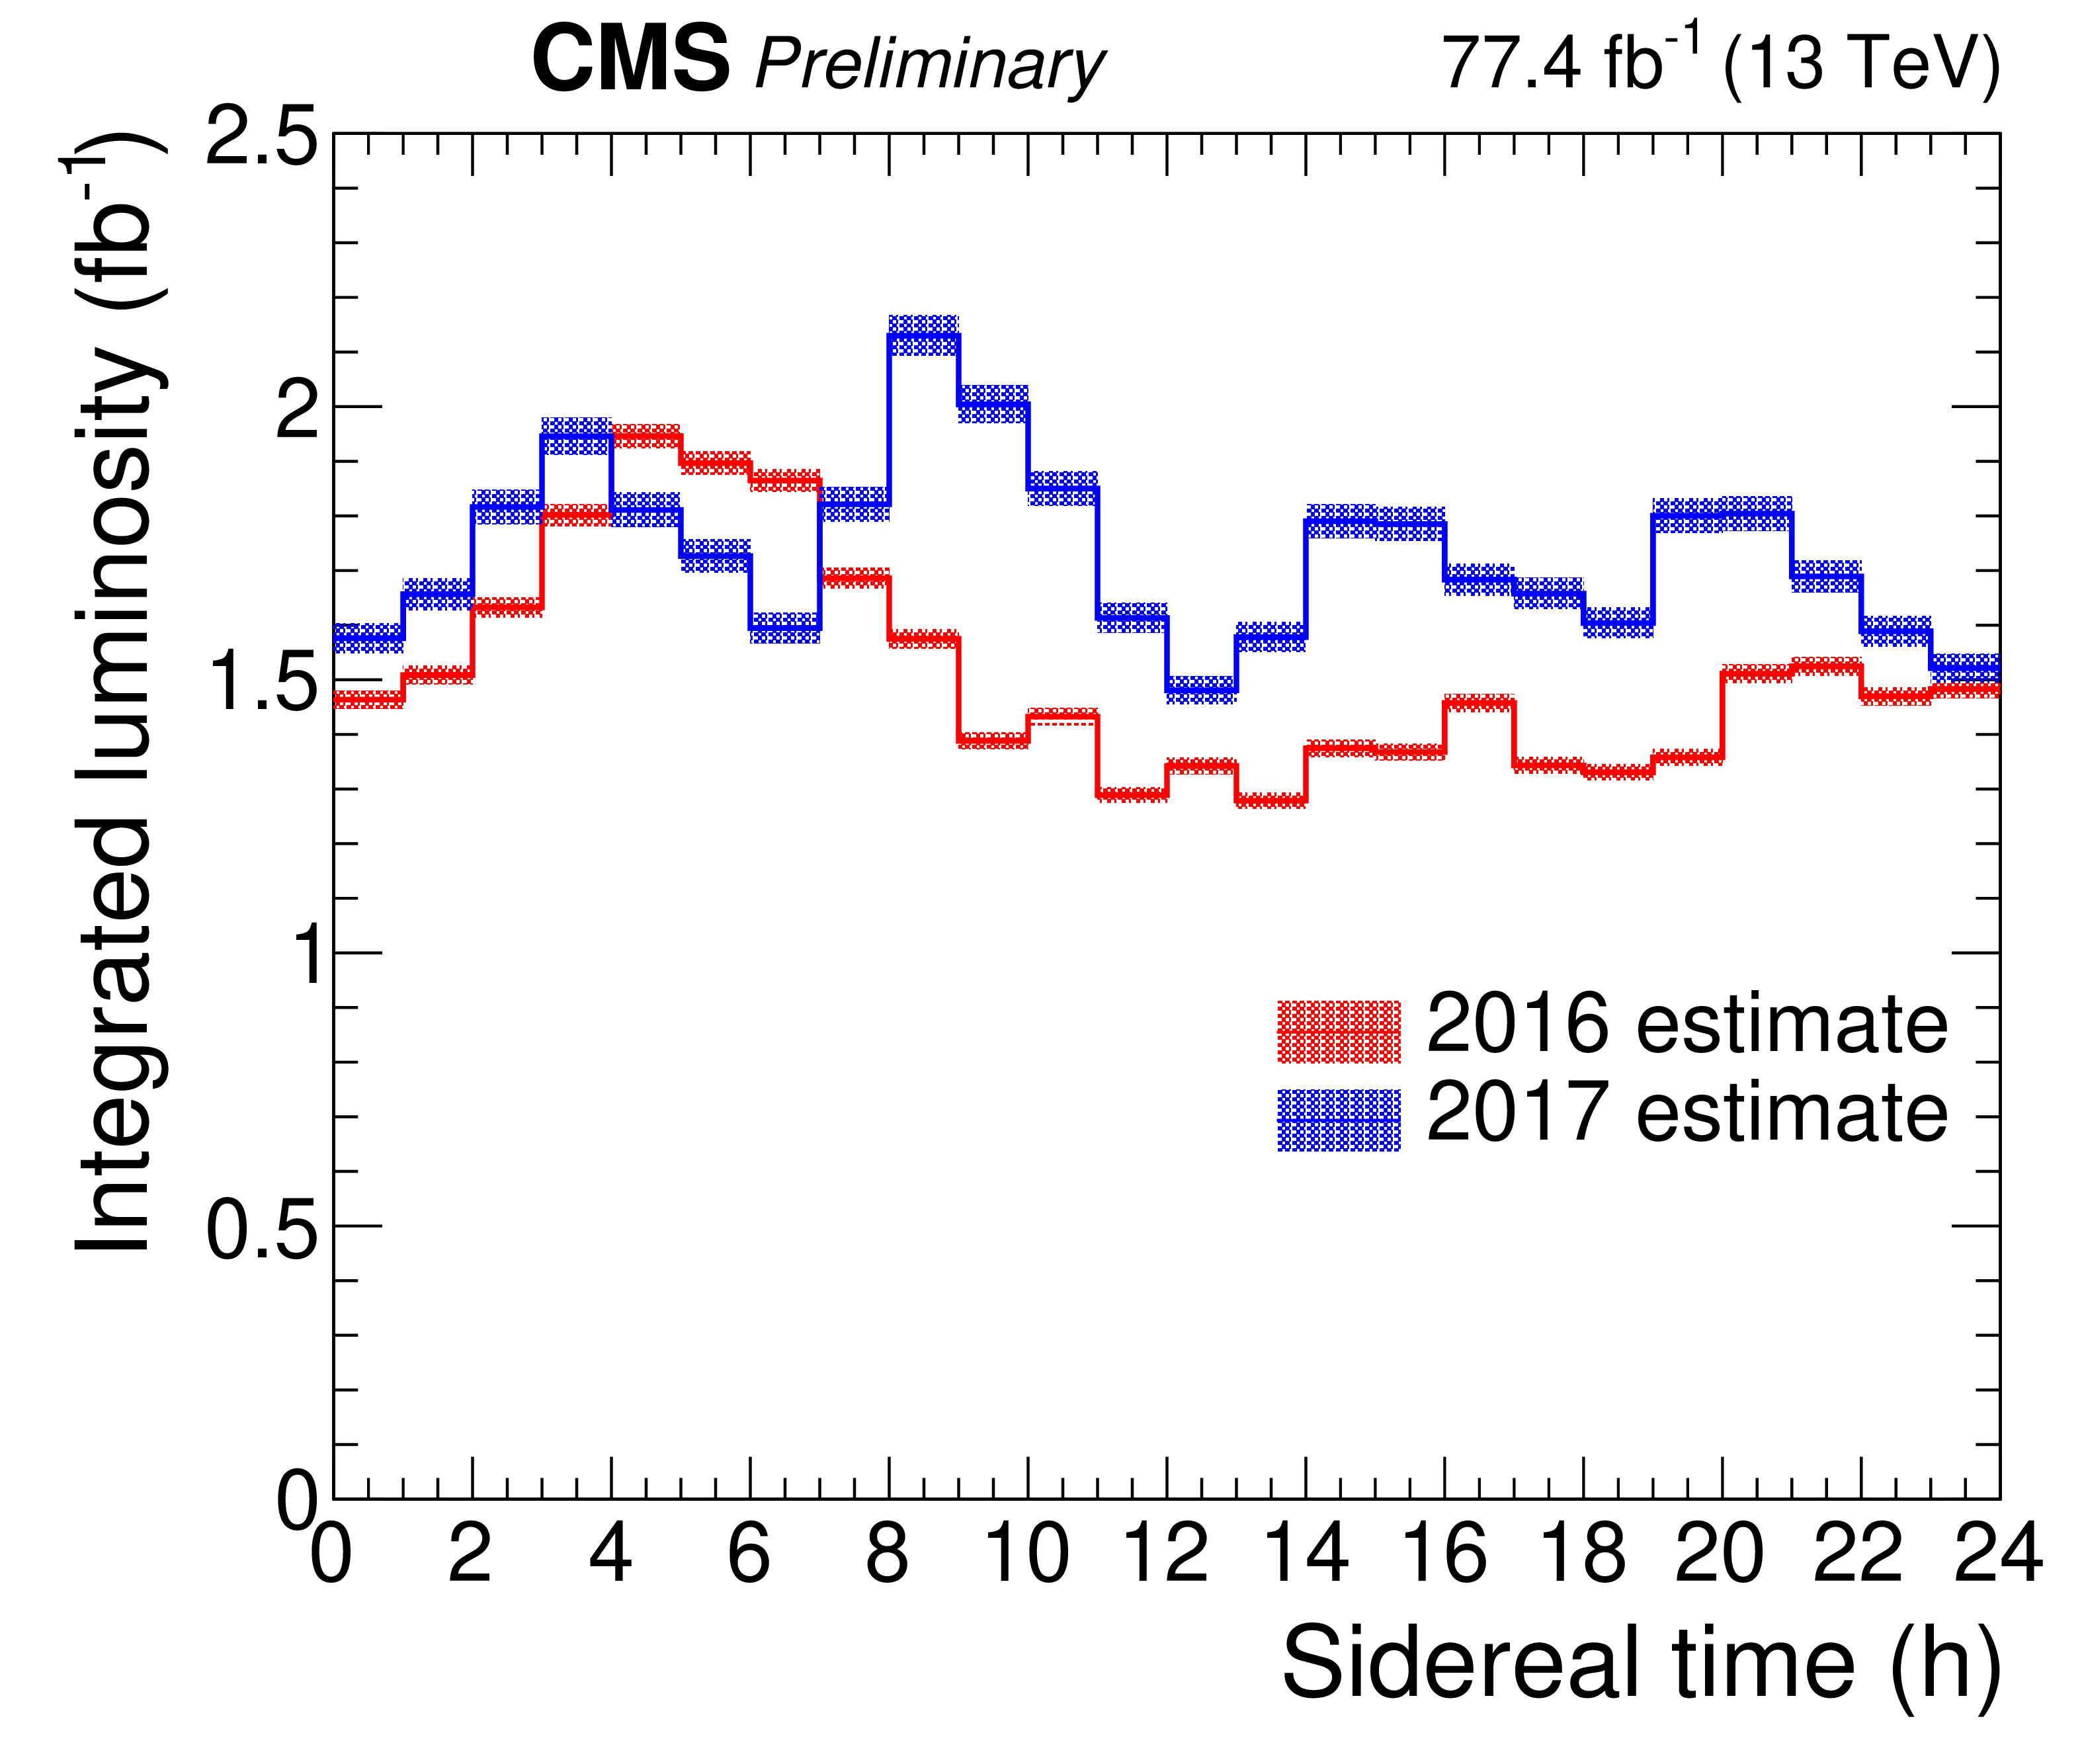
Additional Figure 1:
Integrated luminosity as a function of the sidereal hour in 2016 and 2017. The uncertainty band represents the uncertainty in the luminosity estimate. |

png pdf |
Additional Figure 2:
Uncertainties in the luminosity estimate as a function of the sidereal hour in 2016, splitted into three sources: uniform component as a function of sidereal time, cross-detector stability, and linearity of the luminometer responses. |
png pdf |
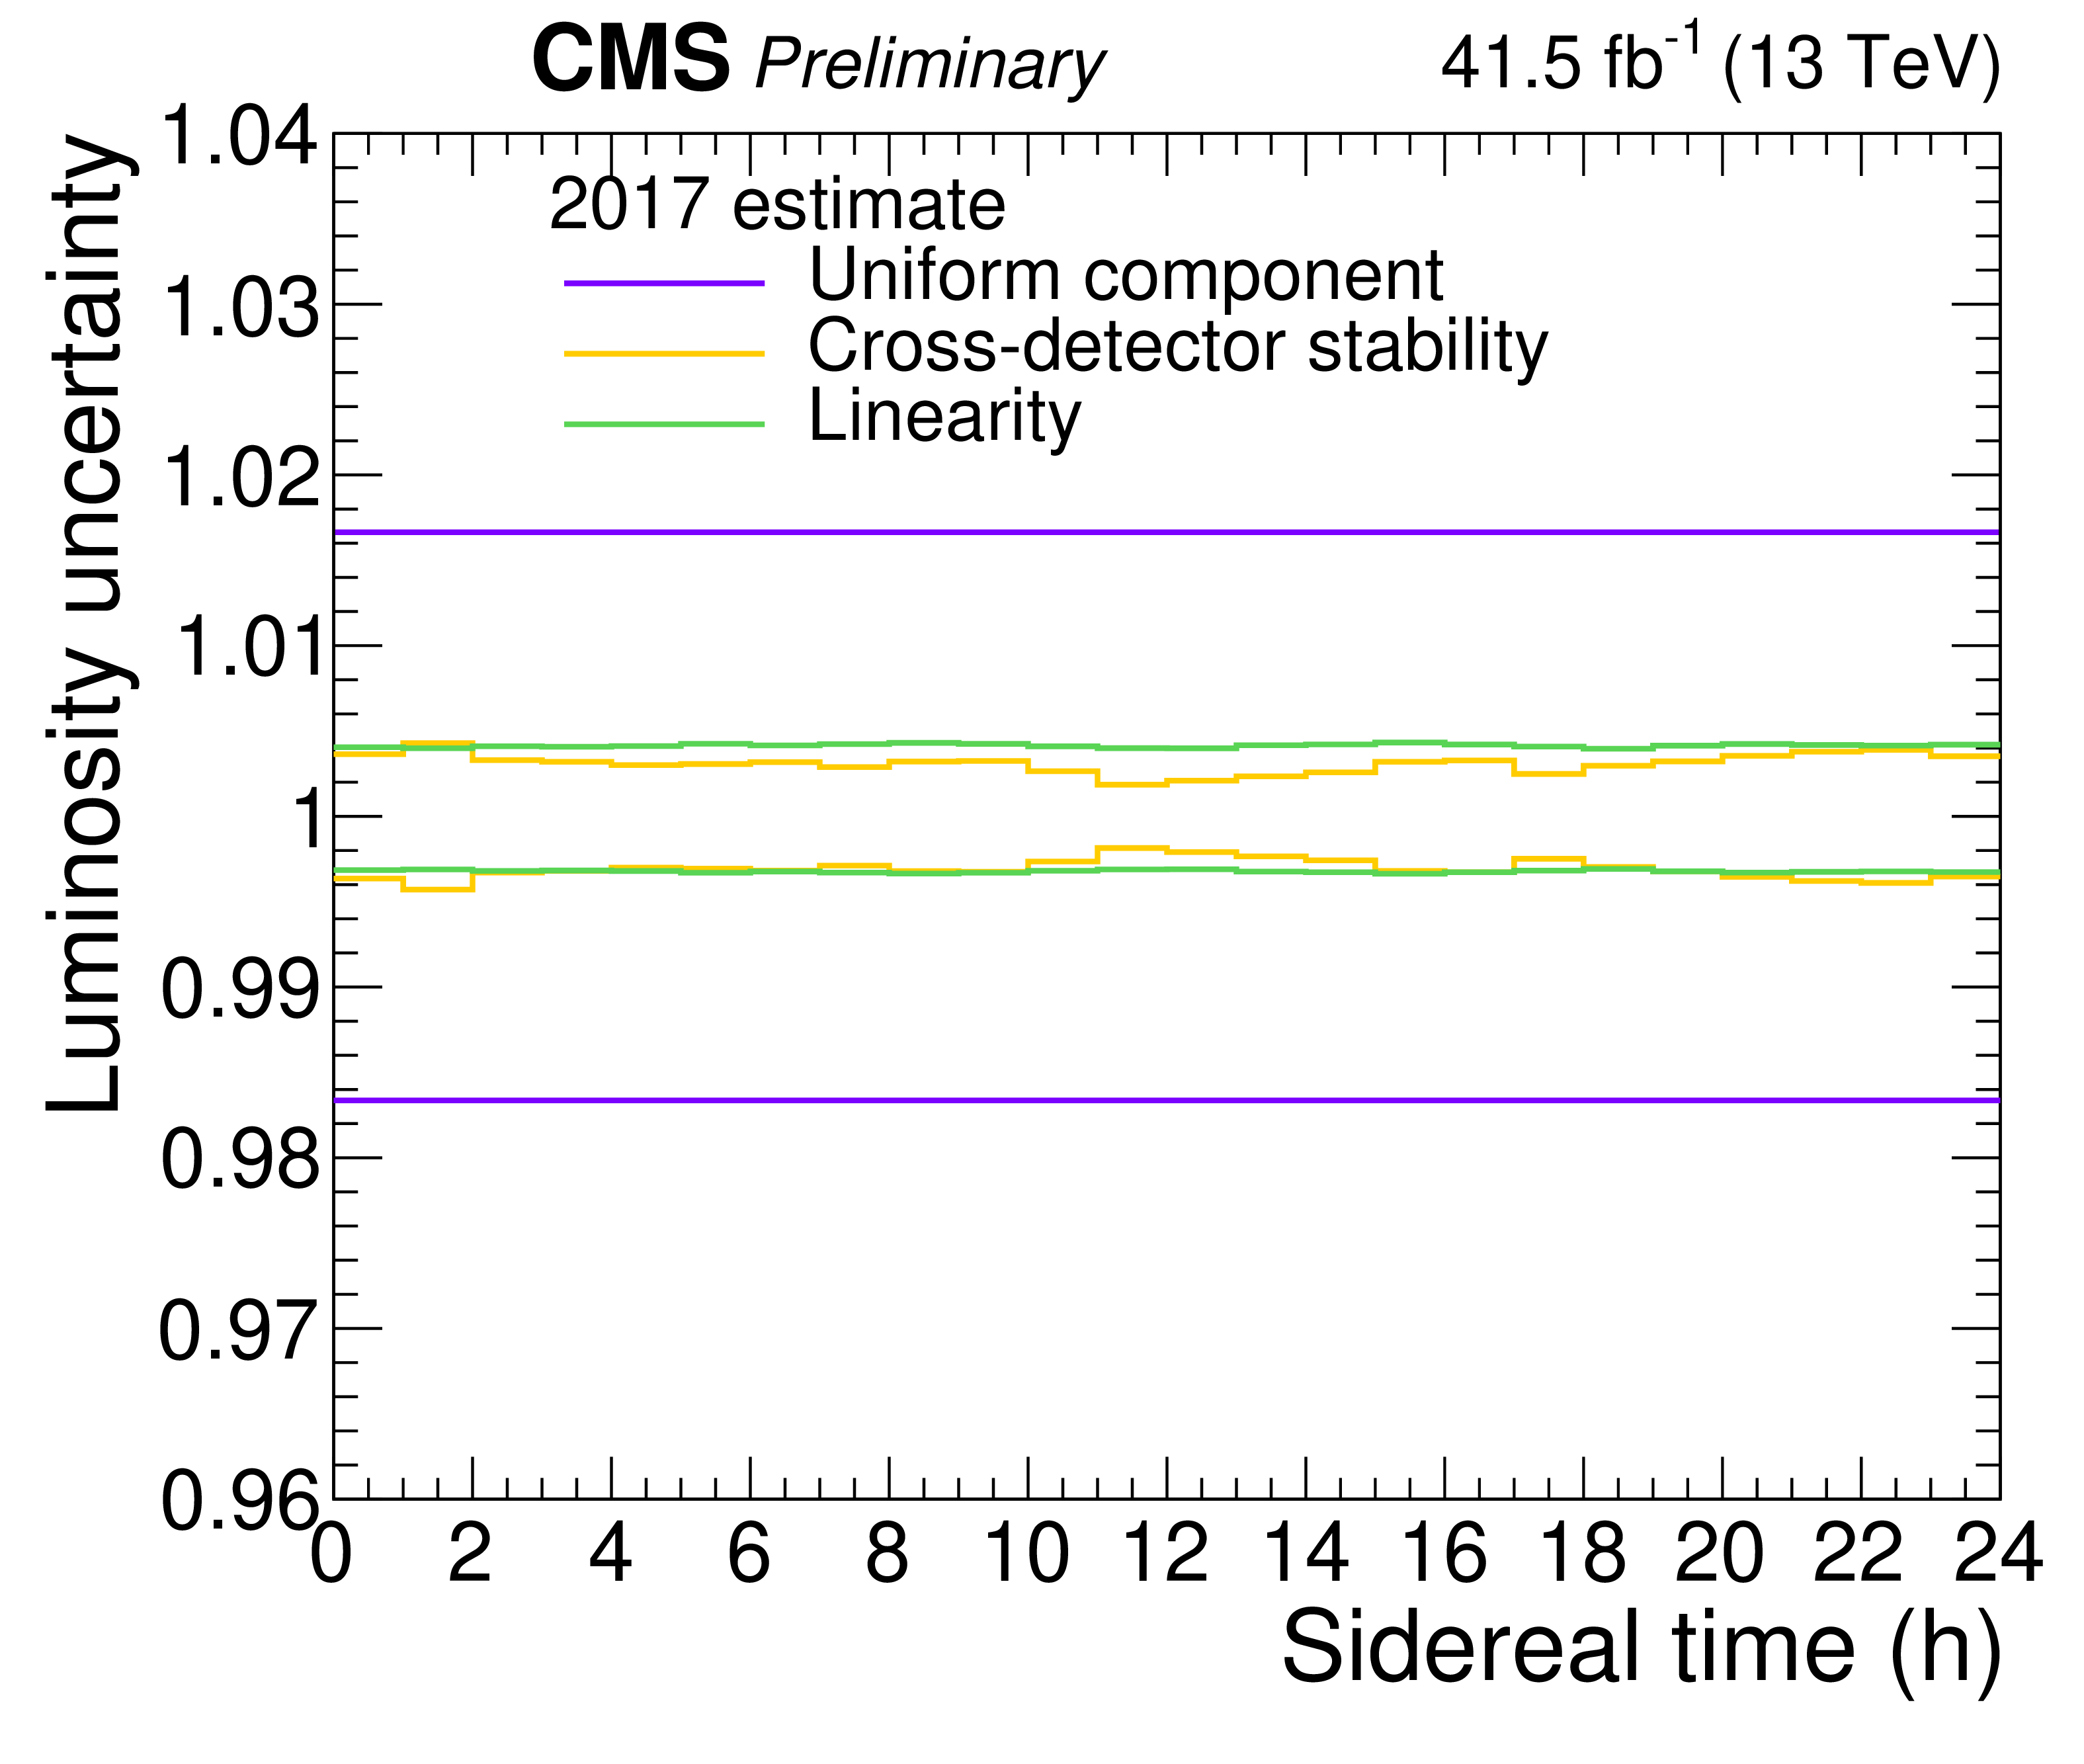
Additional Figure 3:
Uncertainties in the luminosity estimate as a function of the sidereal hour in 2017, splitted into three sources: uniform component as a function of sidereal time, cross-detector stability, and linearity of the luminometer responses. |

png pdf |
Additional Figure 4:
Nominal distribution of the number of pileup interactions with its uncertainty, and distributions of the number of pileup interactions in sidereal hour bins in 2016. |
png pdf |
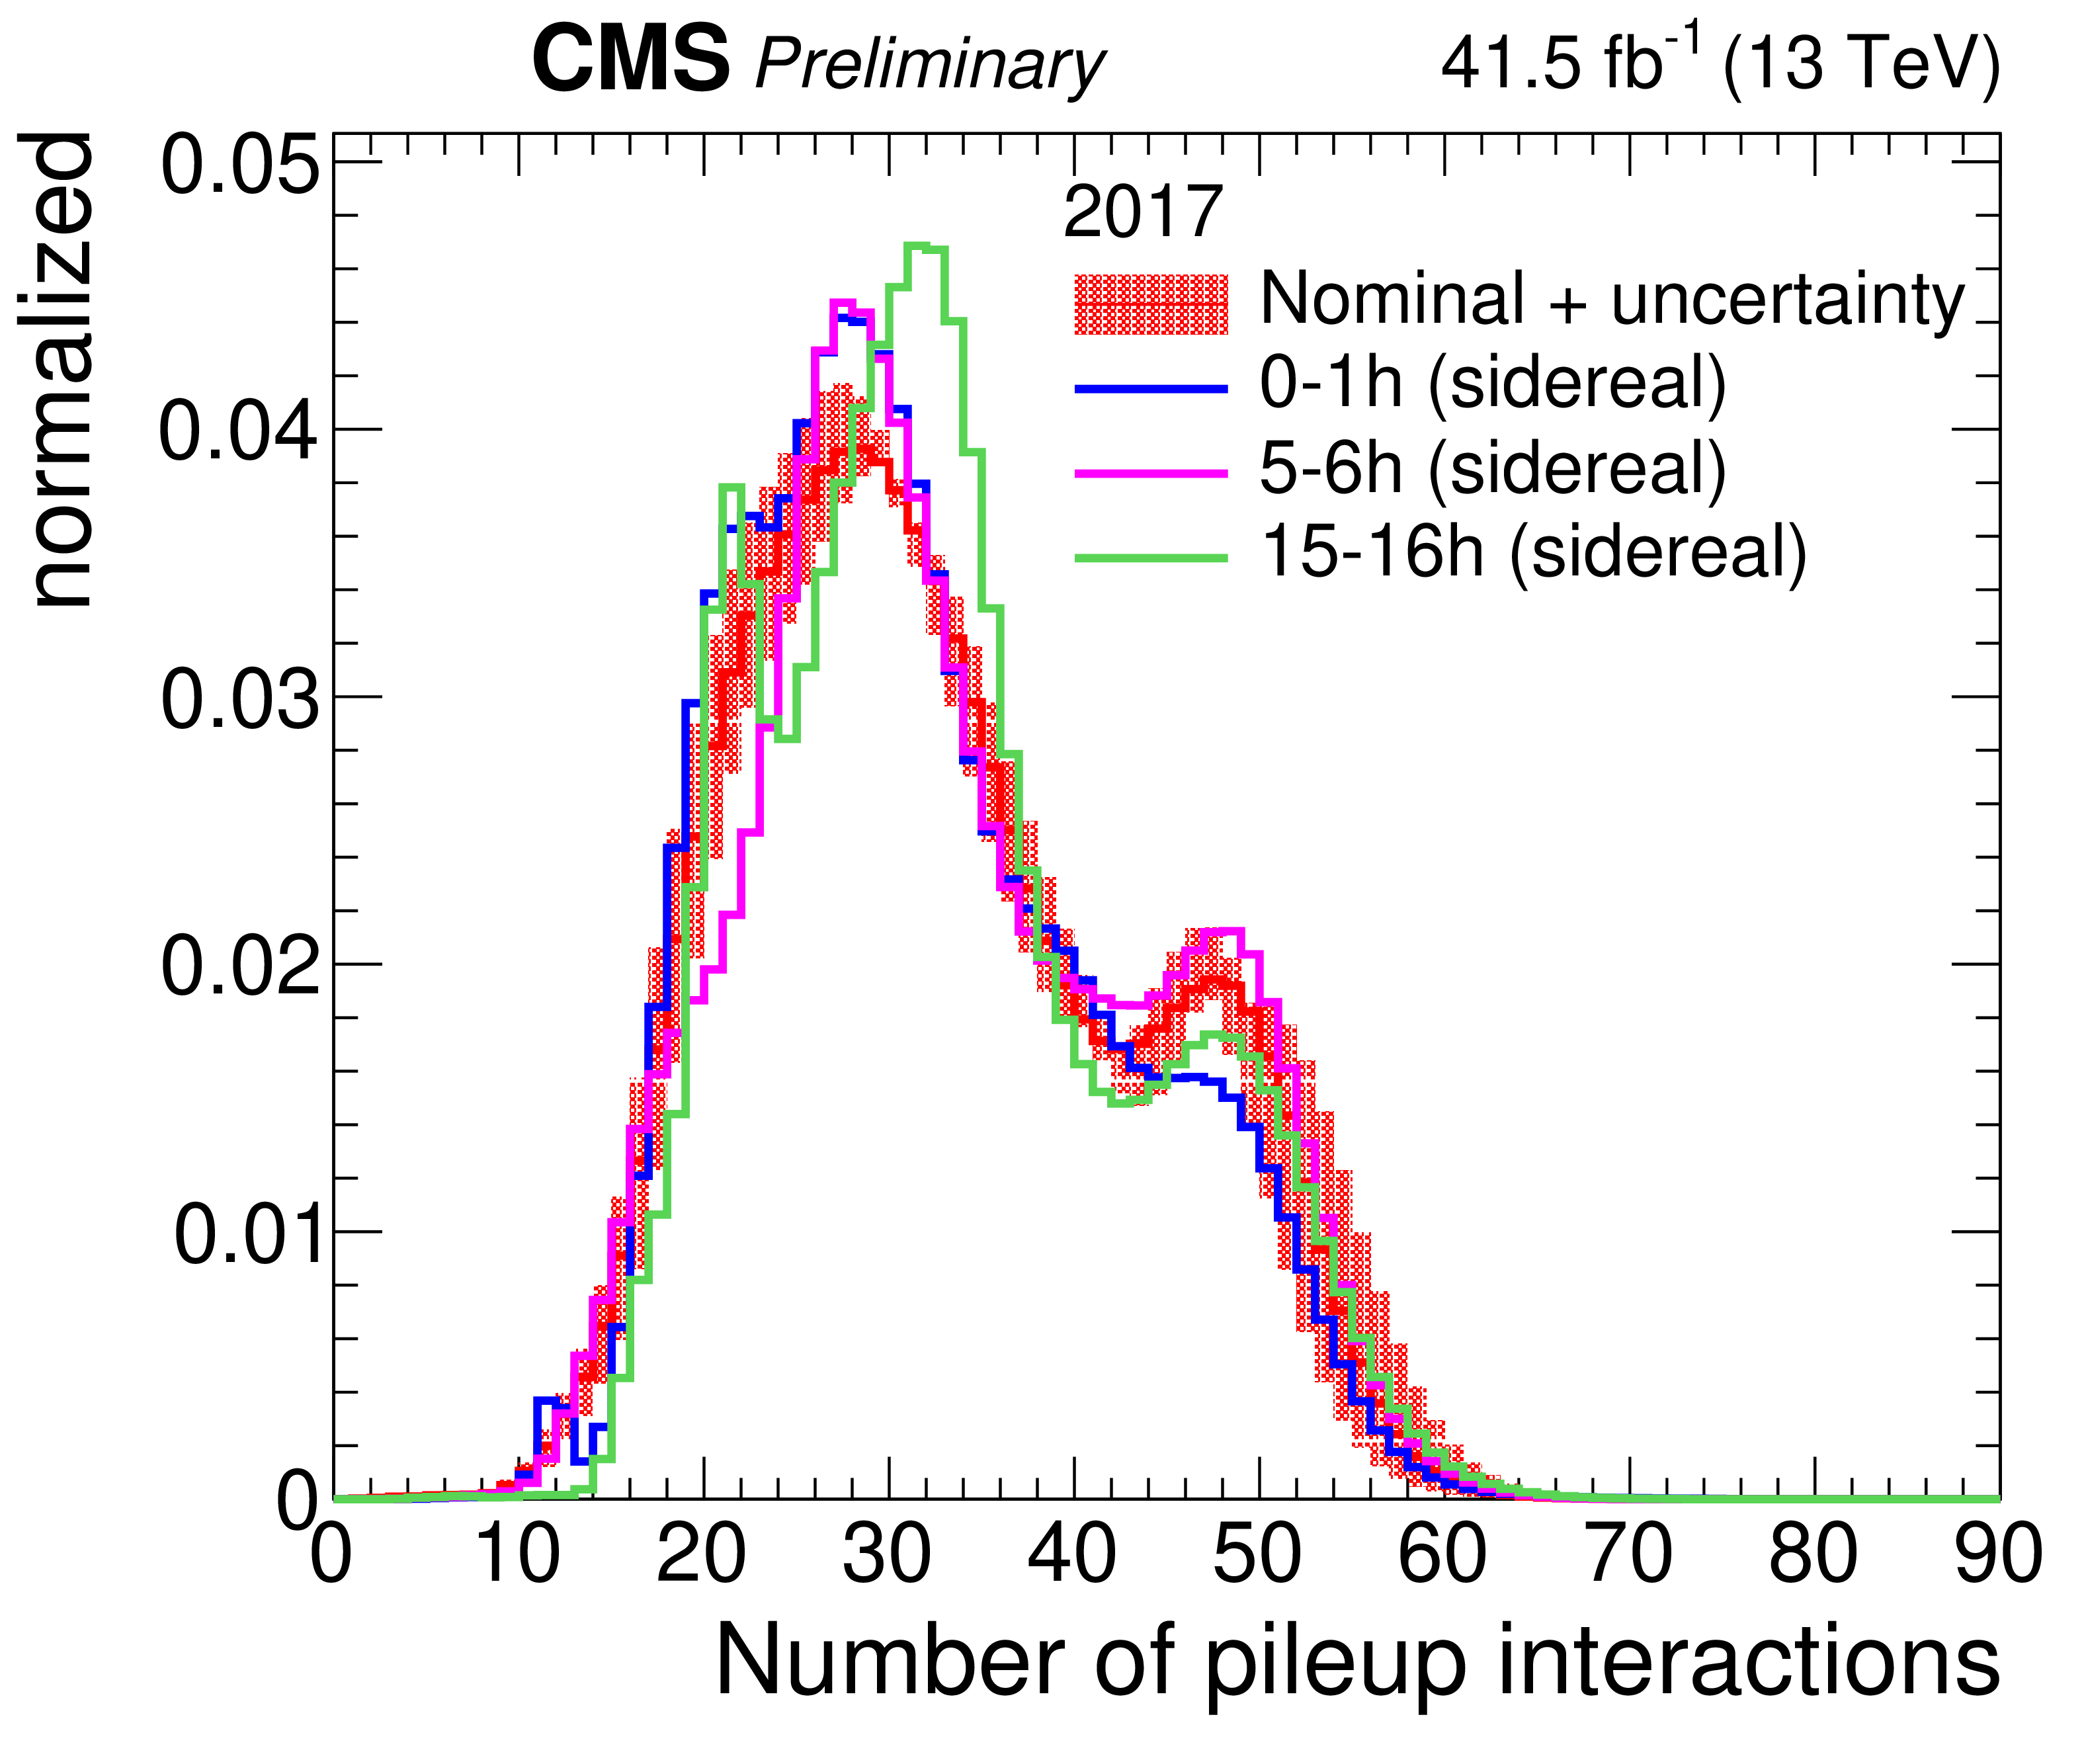
Additional Figure 5:
Nominal distribution of the number of pileup interactions with its uncertainty, and distributions of the number of pileup interactions in sidereal hour bins in 2017. |
png pdf |
Additional Figure 6:
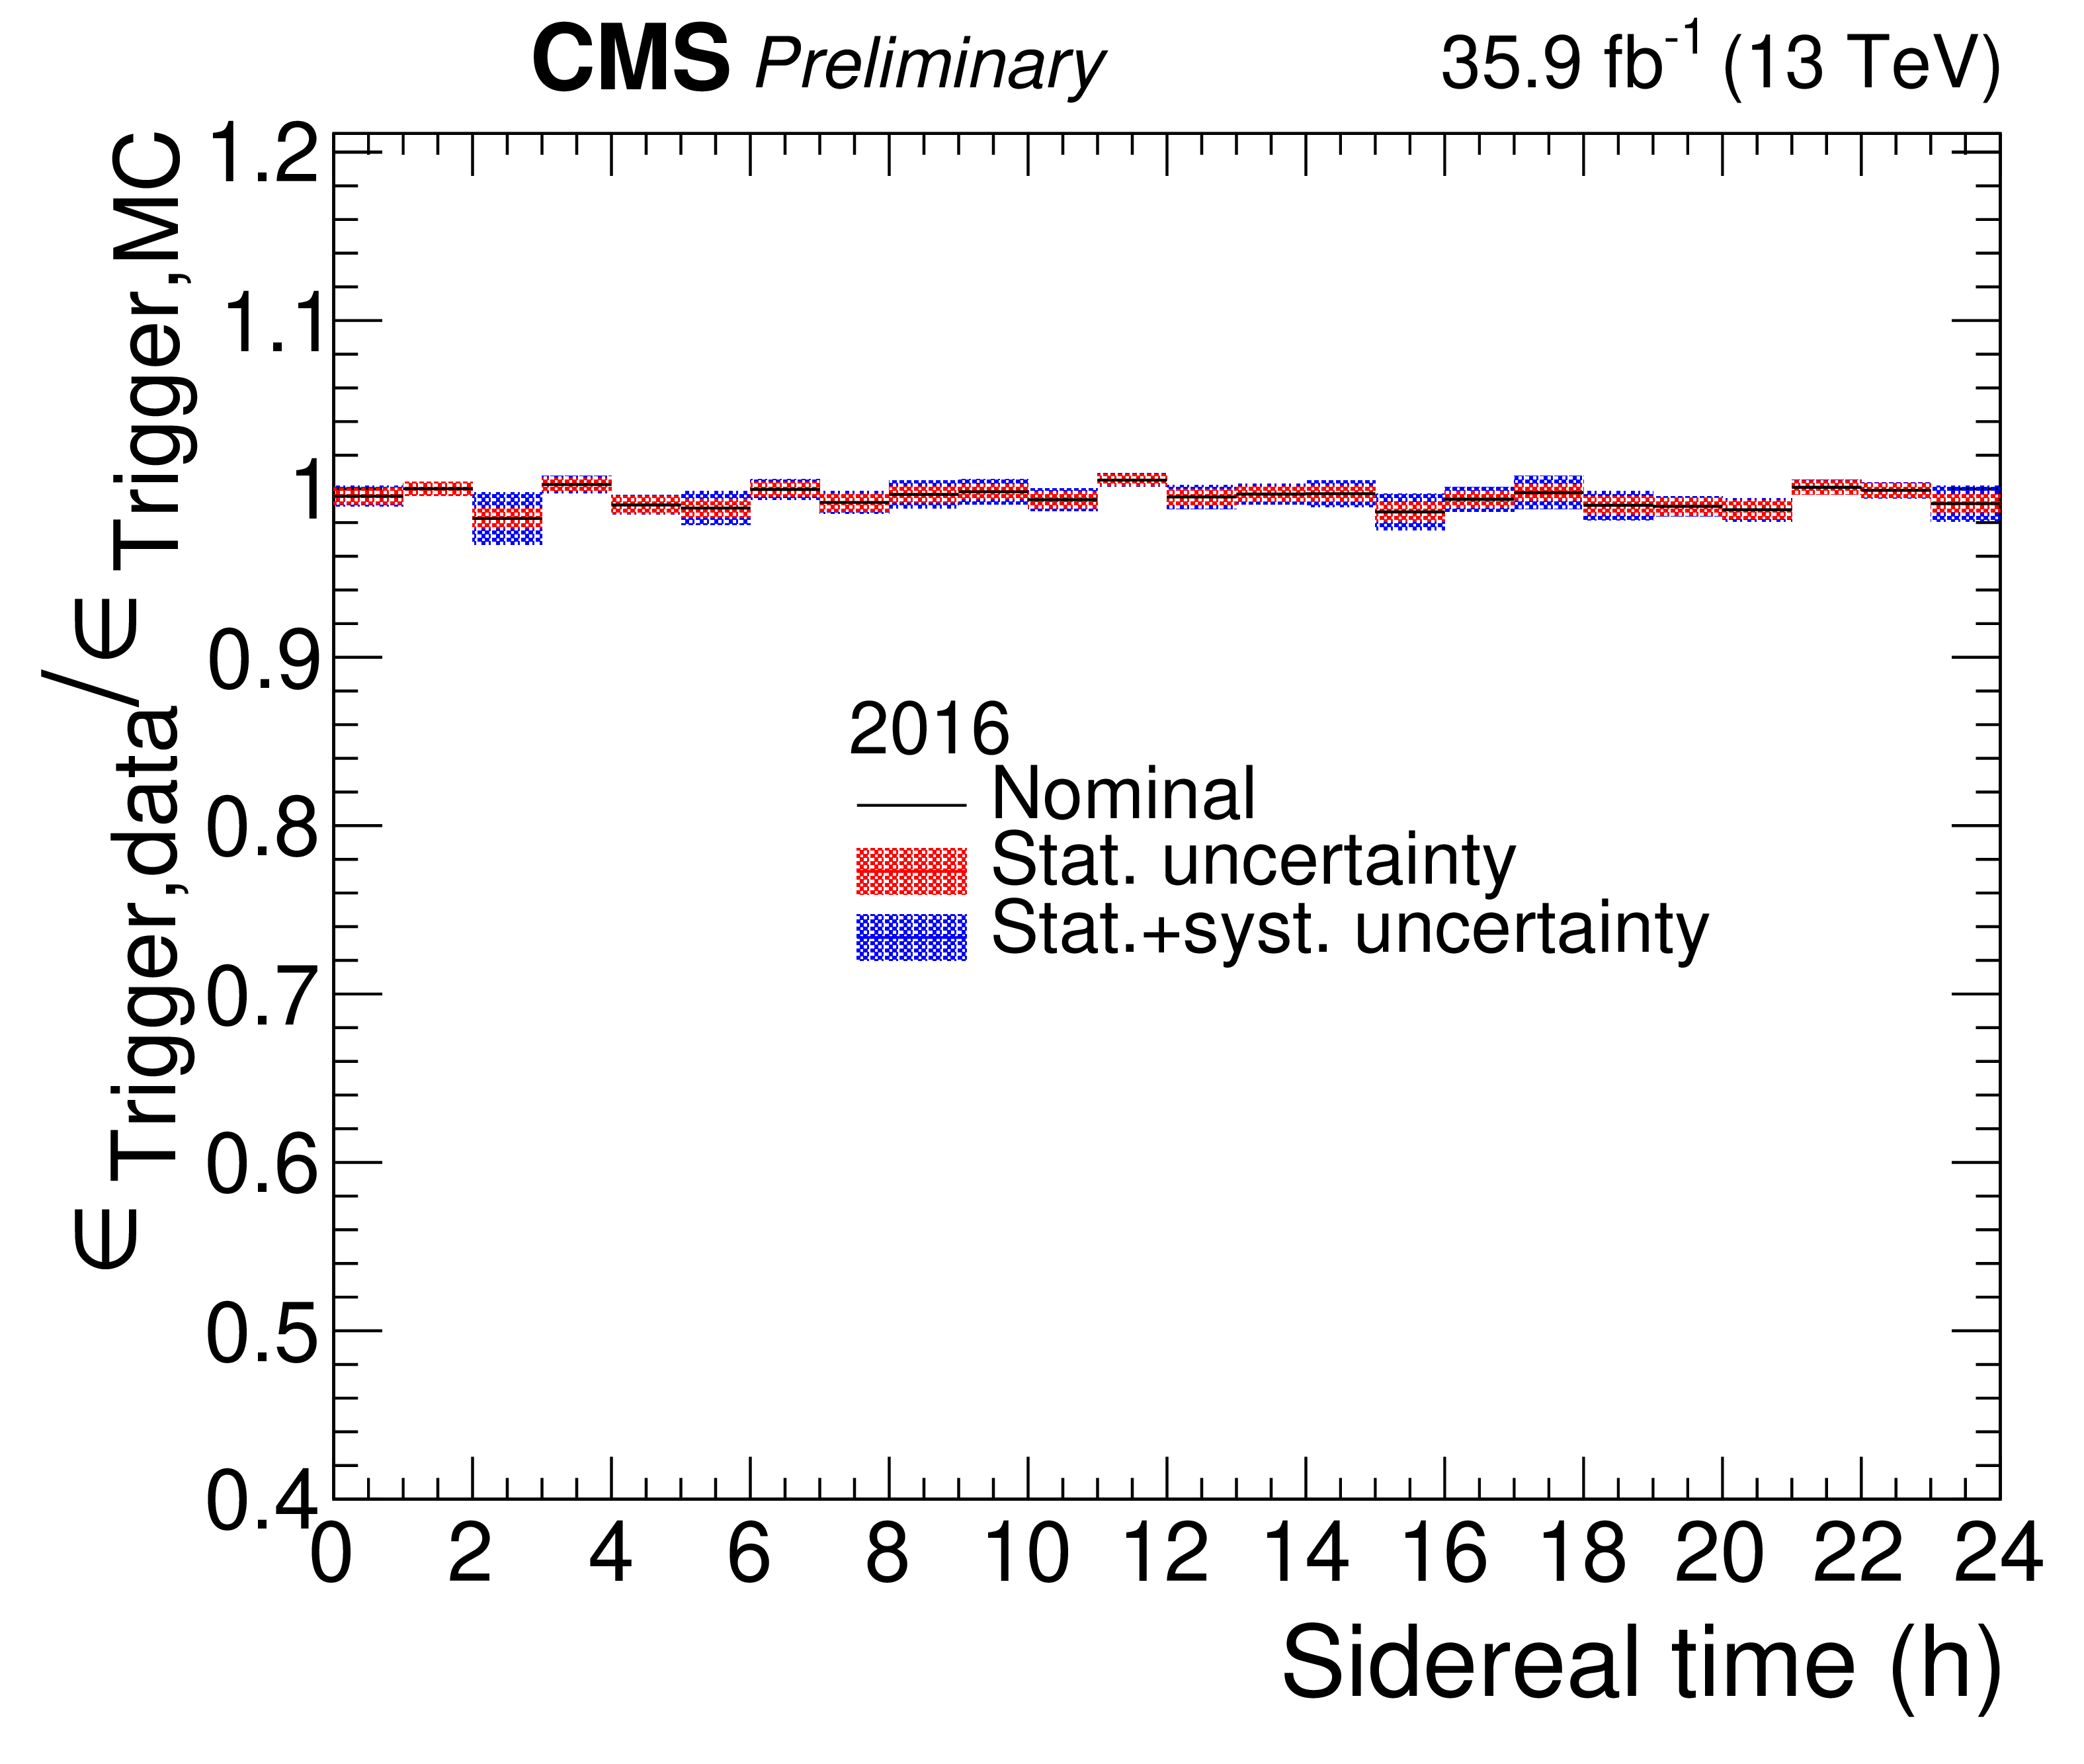
Efficiency of the dilepton trigger in data divided by the simulation as a function of the sidereal hour in 2016. The uncertainty bands represent the statistical uncertainty (red), and the statistical and stystematic uncertainties added in quadrature (blue). |

png pdf |
Additional Figure 7:
Efficiency of the dilepton trigger in data divided by the simulation as a function of the sidereal hour in 2017. The uncertainty bands represent the statistical uncertainty (red), and the statistical and stystematic uncertainties added in quadrature (blue). |

png pdf |
Additional Figure 8:
Prefit distribution integrated over the the number of b jets in sidereal time bins, in 2016 and 2017 data. The uncertainty band reflects the statistical and systematic uncertainty in each bin, including correlations across bins. |
png pdf |
Additional Figure 9:
Postfit distribution integrated over the the number of b jets in sidereal time bins, in 2016 and 2017 data. The uncertainty band reflects the statistical and systematic uncertainty in each bin, including correlations across bins. |

png pdf |
Additional Figure 10:
The $ \mathrm{t} \bar{\mathrm{t}} $ normalized differential cross section as a function of sidereal time, using 2016 data. |

png pdf |
Additional Figure 11:
The $ \mathrm{t} \bar{\mathrm{t}} $ normalized differential cross section as a function of sidereal time, using 2017 data. |

png pdf |
Additional Figure 12:
Uncertainty breakdown for the normalized differential cross section, by splitting according to the kind of uncertainties: experimental, theory, background normalization, luminosity, MC statistical uncertainty, and statistical uncertainty. |

png pdf |
Additional Figure 13:
Uncertainty breakdown for the normalized differential cross section, by splitting according to the experimental uncertainties: electron, muon, pileup, b tagging, jet energy scale, ECAL prefiring, trigger, and statistical uncertainty. |
png pdf |
Additional Figure 14:
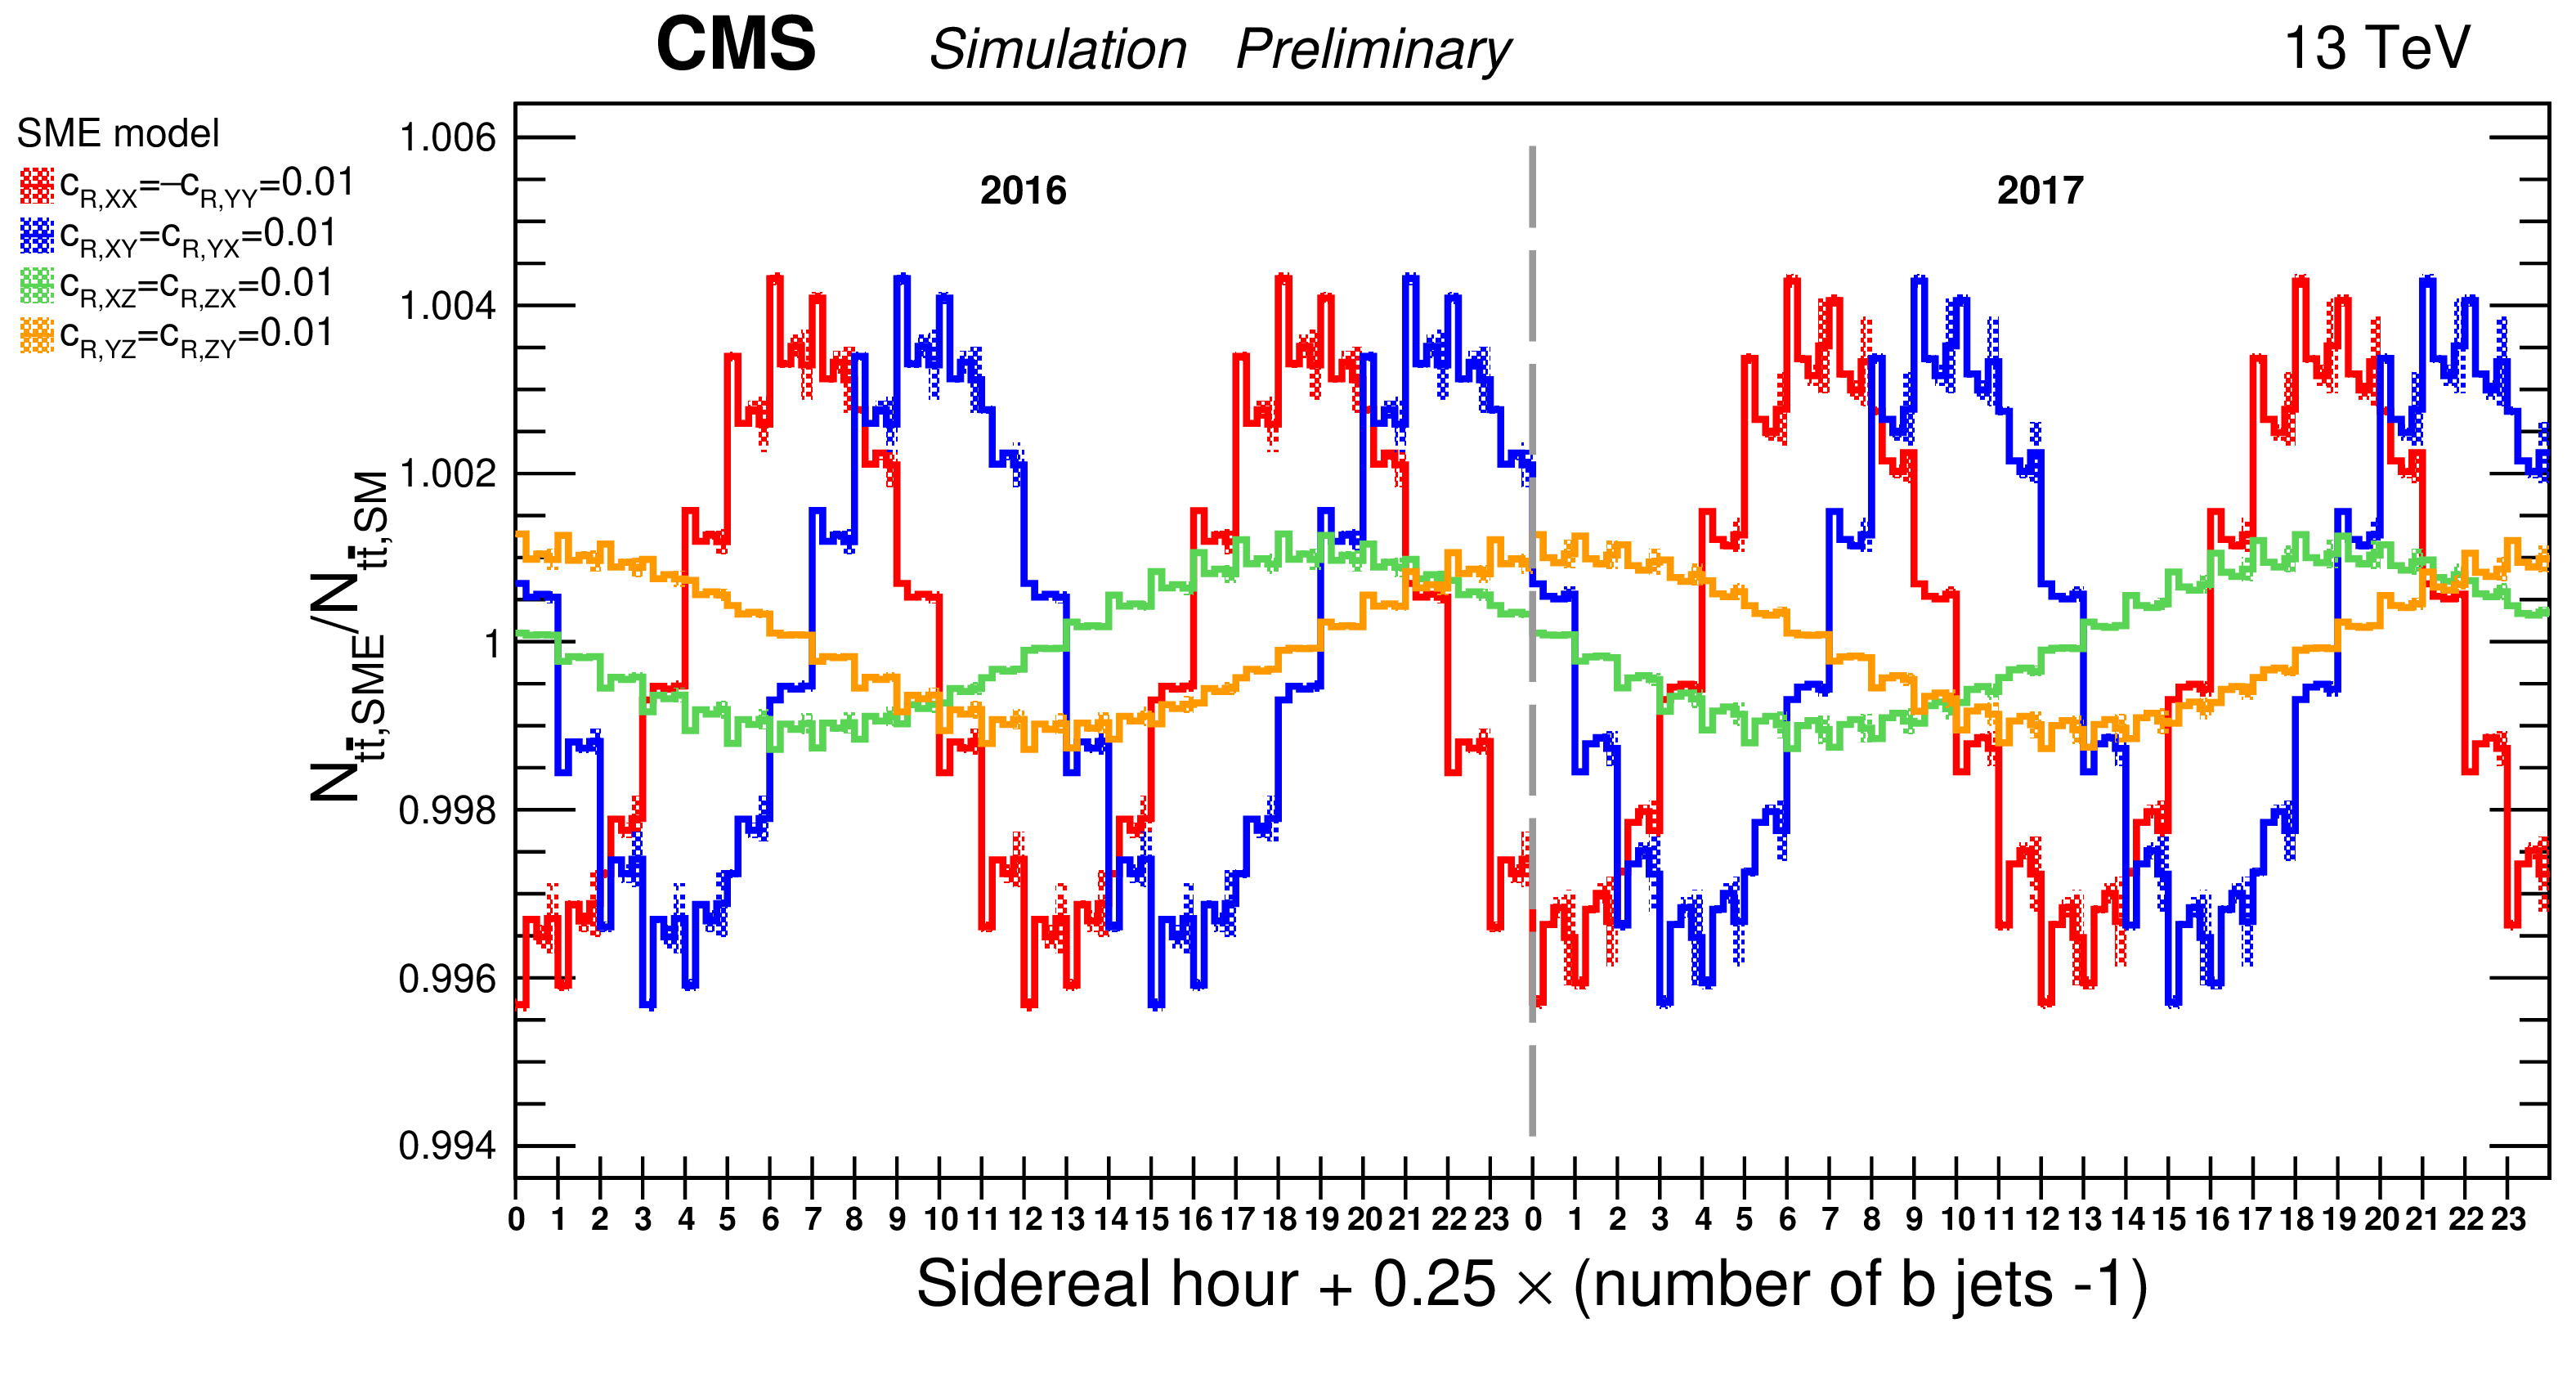
Number of $ \mathrm{t} \bar{\mathrm{t}} $ events reconstructed in the SME hypothesis divided by the SM hypothesis, as a function of the number of b jets and sidereal time, here for the four directions of the $ c_R $ coefficients. The uncertainty band represents the MC statistical uncertainty in the sample used to compute the SME hypothesis. |

png pdf |
Additional Figure 15:
Number of $ \mathrm{t} \bar{\mathrm{t}} $ events reconstructed in the SME hypothesis divided by the SM hypothesis, as a function of the number of b jets and sidereal time, here for the four directions of the $ c $ coefficients. The uncertainty band represents the MC statistical uncertainty in the sample used to compute the SME hypothesis. |

png pdf |
Additional Figure 16:
Number of $ \mathrm{t} \bar{\mathrm{t}} $ events reconstructed in the SME hypothesis divided by the SM hypothesis, as a function of the number of b jets and sidereal time, here for the four directions of the $ d $ coefficients. The uncertainty band represents the MC statistical uncertainty in the sample used to compute the SME hypothesis. |
png pdf |
Additional Figure 17:
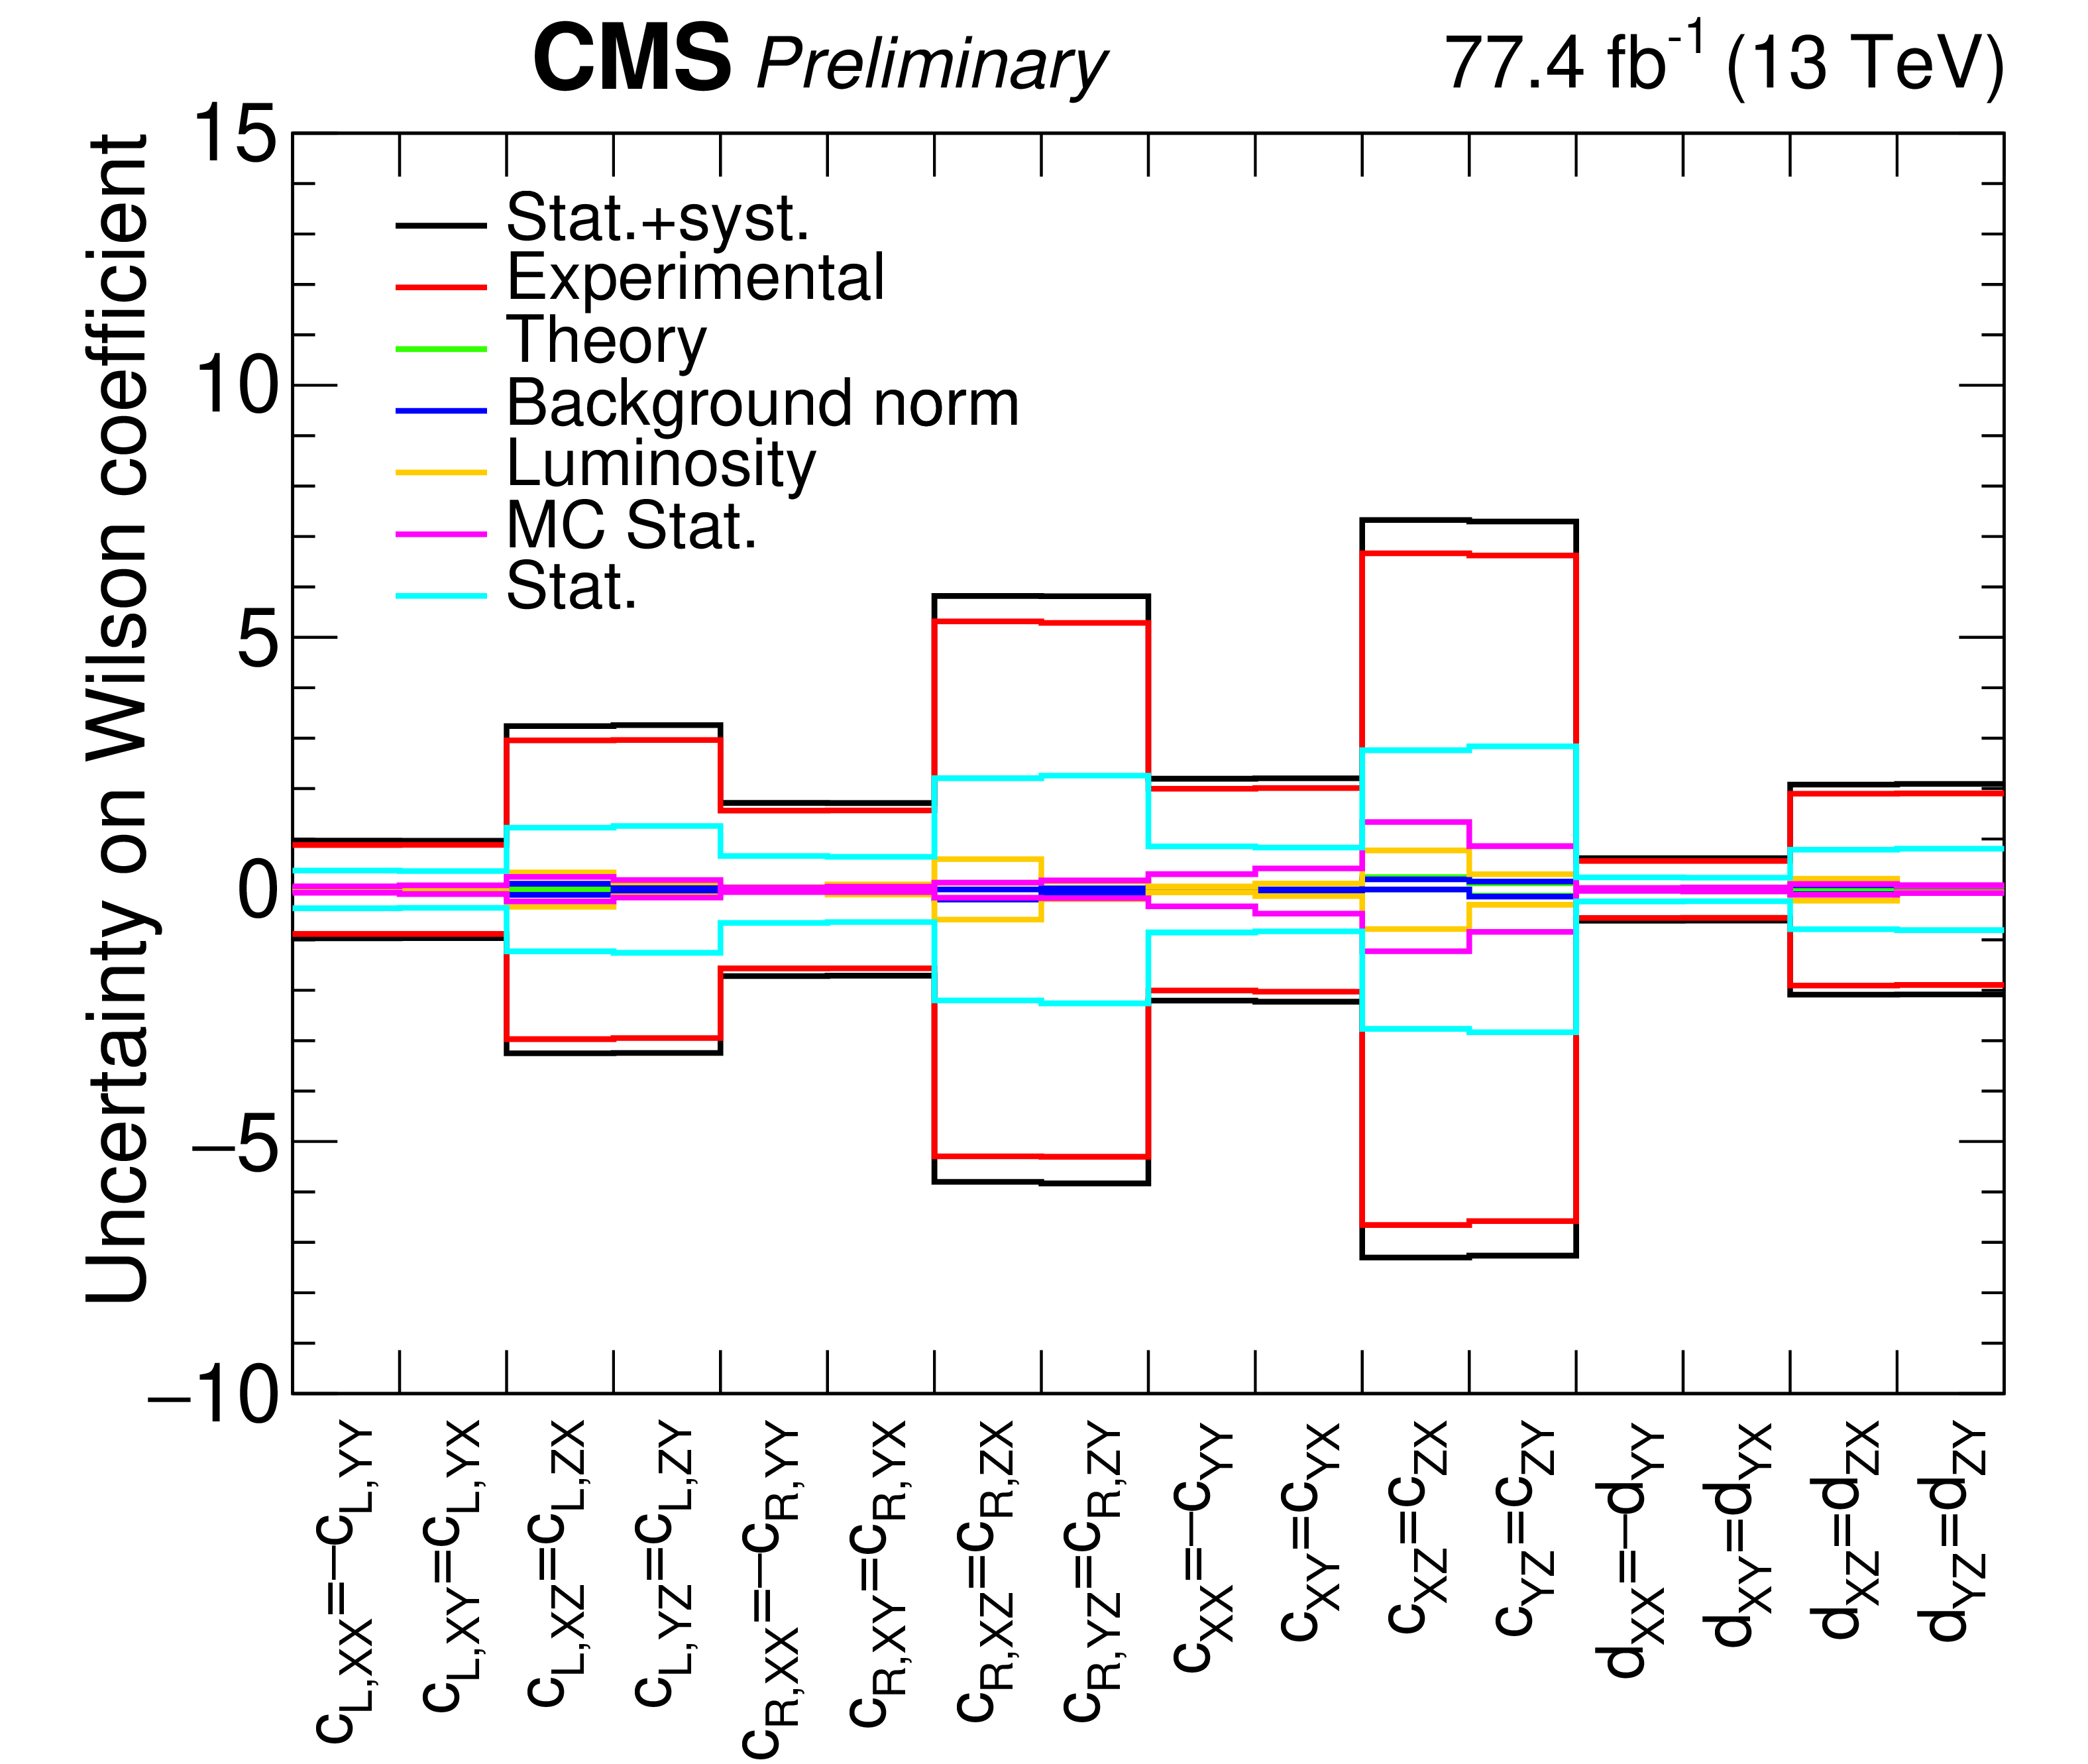
Uncertainty breakdown for SME fits of single coefficients in 2016+2017 data while the coefficients corresponding to the three other directions are left floating, by splitting according to the kind of uncertainties: experimental, theory, background normalization, luminosity, MC statistical uncertainty, and statistical uncertainty. |
png pdf |
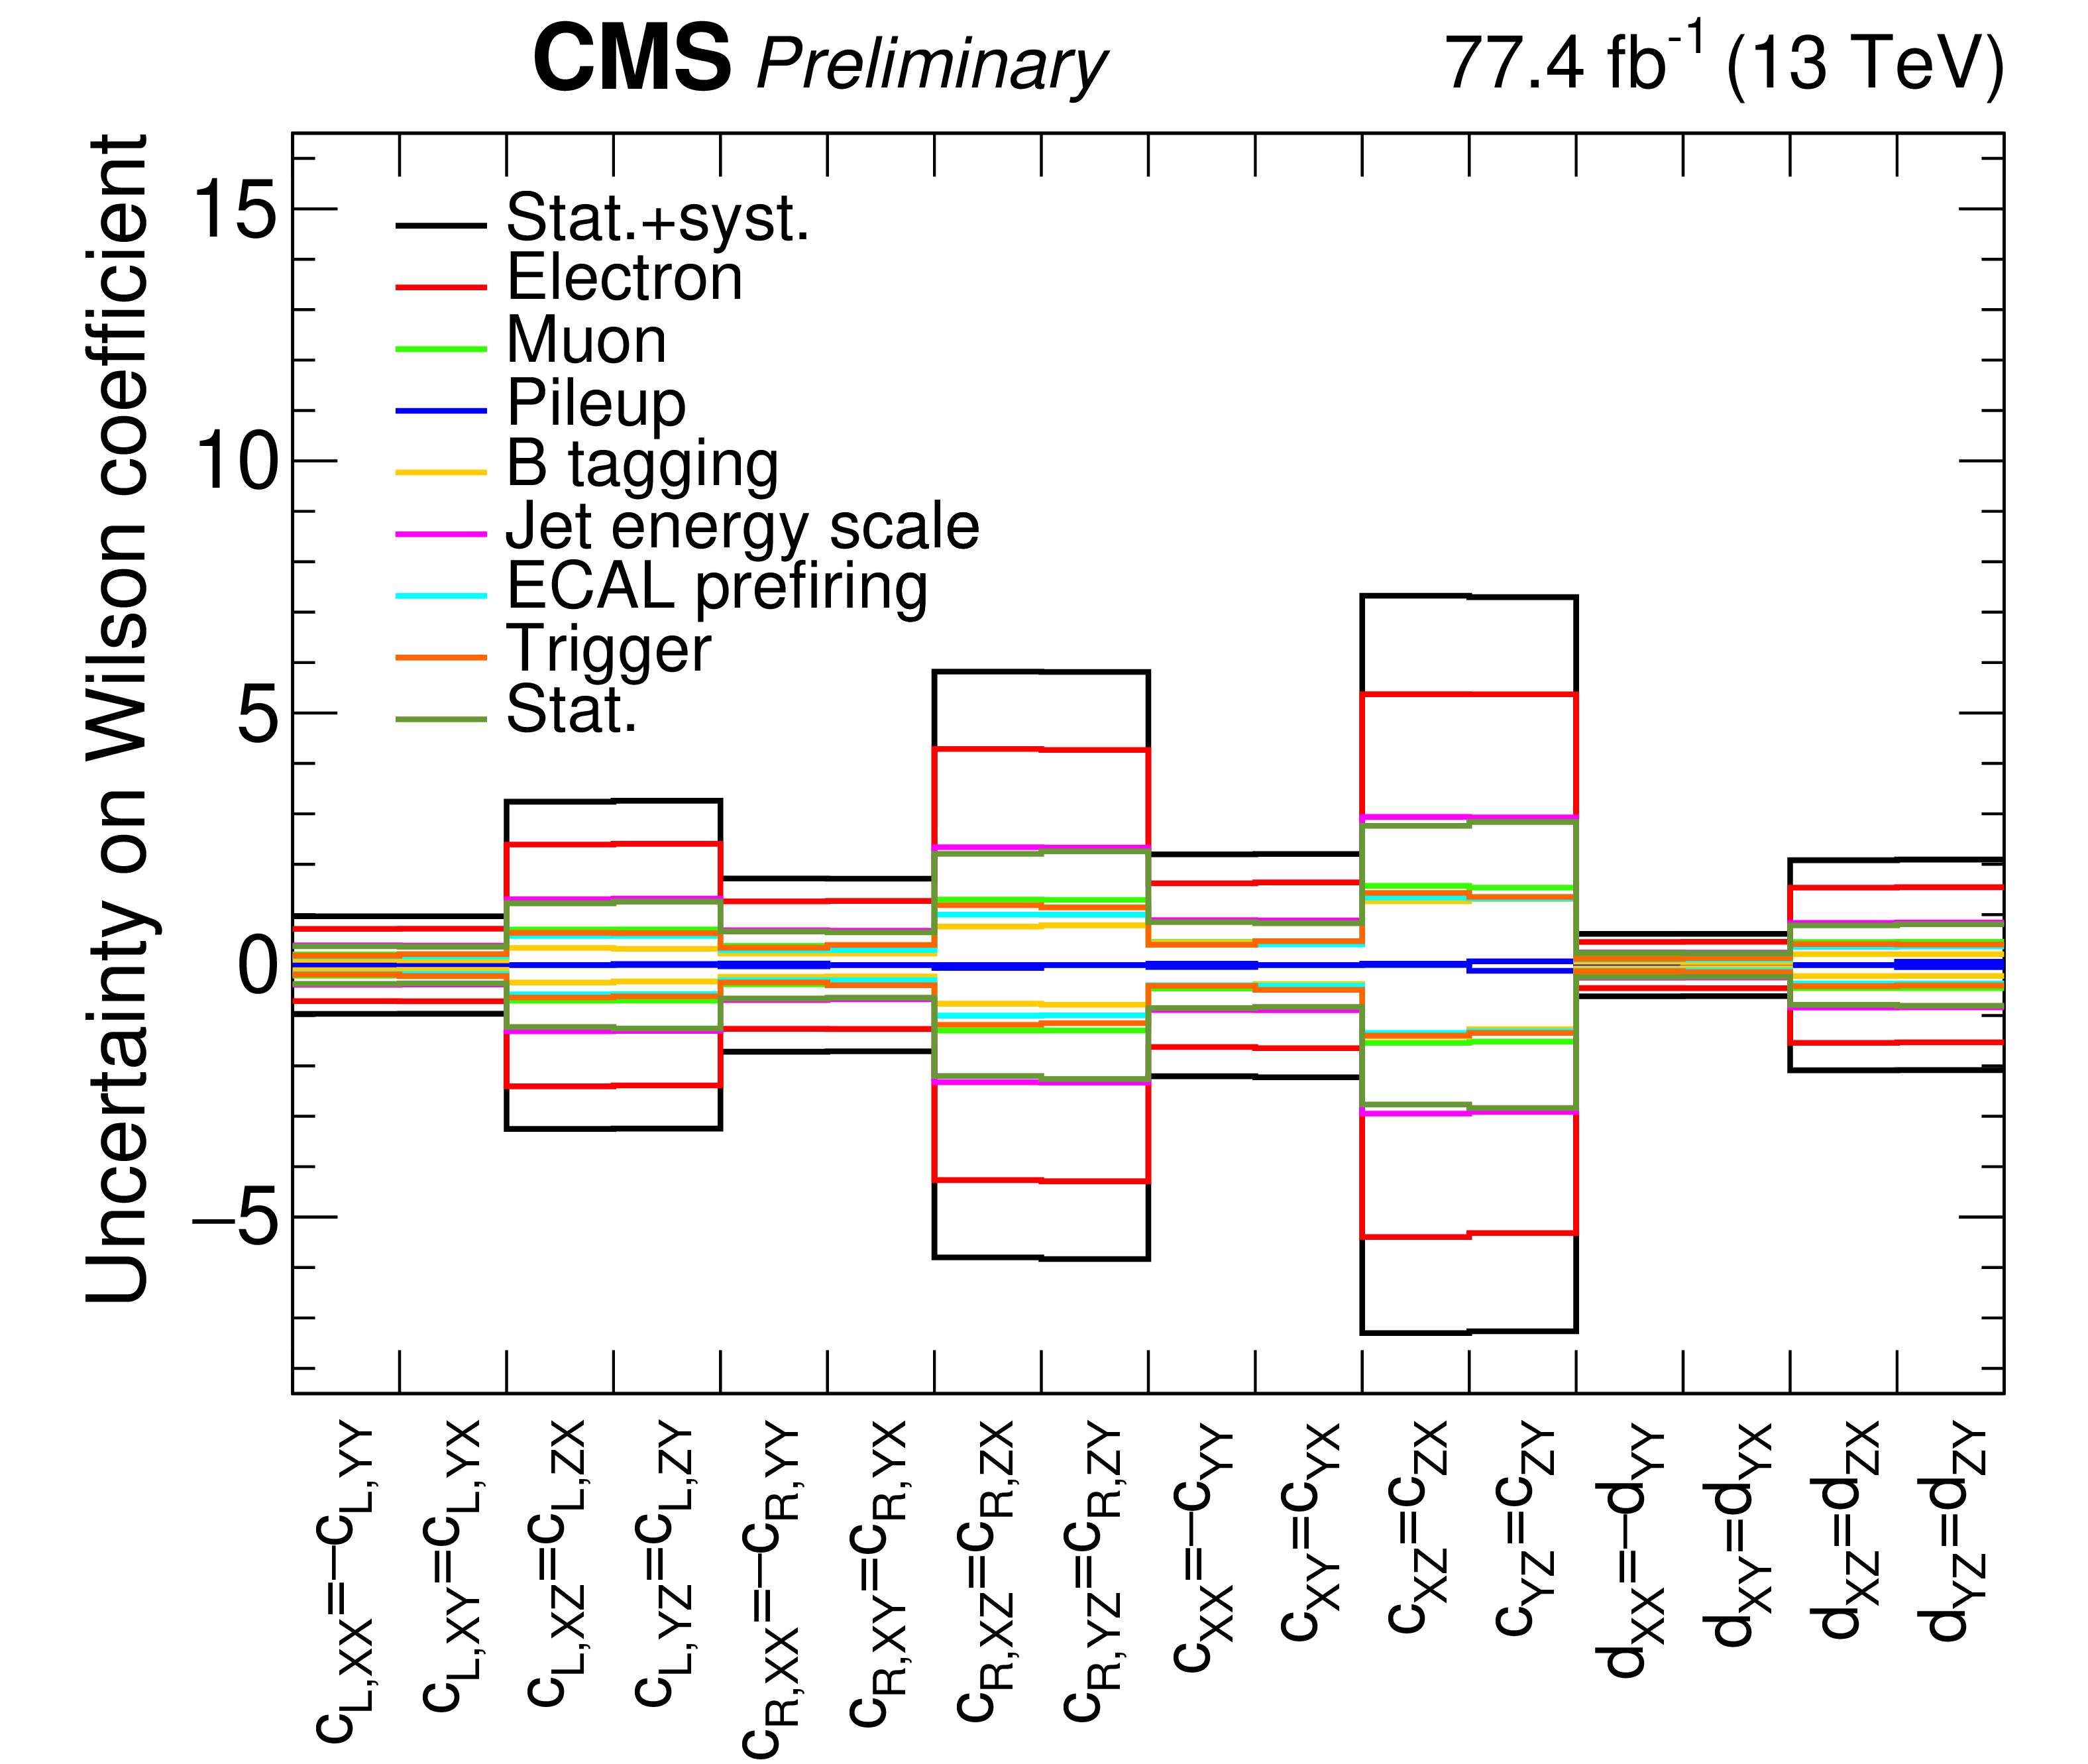
Additional Figure 18:
Uncertainty breakdown for SME fits of single coefficients in 2016+2017 data while the coefficients corresponding to the three other directions are left floating, by splitting according to the experimental uncertainties: electron, muon, pileup, b tagging, jet energy scale, ECAL prefiring, trigger, and statistical uncertainty. |

png pdf |
Additional Figure 19:
Uncertainty breakdown for SME fits of single coefficients in 2016+2017 data while the coefficients corresponding to the three other directions are left floating, by splitting according to the SME uncertainties in the single top quark process: in the XX, XY, XZ, YZ directions, and statistical uncertainty. |
| References | ||||
| 1 | V. A. Kostelecky and S. Samuel | Spontaneous breaking of Lorentz symmetry in string theory | PRD 39 (1989) 683 | |
| 2 | R. Gambini and J. Pullin | Nonstandard optics from quantum space-time | PRD 59 (1999) 124021 | gr-qc/9809038 |
| 3 | D. Colladay and V. A. Kostelecky | CPT violation and the standard model | PRD 55 (1997) 6760 | hep-ph/9703464 |
| 4 | D. Colladay and V. A. Kostelecky | Lorentz violating extension of the standard model | PRD 58 (1998) 116002 | hep-ph/9809521 |
| 5 | V. A. Kostelecky and N. Russell | Data tables for Lorentz and CPT violation | Rev. Mod. Phys. 83 (2011) 11 | 0801.0287 |
| 6 | ZEUS Collaboration | Search for effective Lorentz and CPT violation using ZEUS data | PRD 107 (2023) 092008 | 2212.12750 |
| 7 | KLOE-2 Collaboration | Test of CPT and Lorentz symmetry in entangled neutral kaons with the KLOE experiment | PLB 730 (2014) 89 | 1312.6818 |
| 8 | H. Nguyen | CPT results from KTeV | in Proc. 2nd Meeting on CPT and Lorentz Symmetry: Bloomington IN, USA, --18,, 2001 August 1 (2001) 5 |
hep-ex/0112046 |
| 9 | FOCUS Collaboration | Charm system tests of CPT and Lorentz invariance with FOCUS | PLB 556 (2003) 7 | hep-ex/0208034 |
| 10 | BaBar Collaboration | Search for CPT and Lorentz violation in $ {\mathrm{B}^0} $--$ \overline{\mathrm{B}}^{0} $ oscillations with dilepton events | PRL 100 (2008) 131802 | 0711.2713 |
| 11 | D0 Collaboration | Search for violation of CPT and Lorentz invariance in $ \mathrm{B}_{s}^{0} $ meson oscillations | PRL 115 (2015) 161601 | 1506.04123 |
| 12 | LHCb Collaboration | Search for violations of Lorentz invariance and CPT symmetry in $ {{\mathrm{B}}^0_{(\mathrm{s})}} $ mixing | PRL 116 (2016) 241601 | 1603.04804 |
| 13 | D0 Collaboration | Search for violation of Lorentz invariance in top quark pair production and decay | PRL 108 (2012) 261603 | 1203.6106 |
| 14 | A. Carle, N. Chanon, and S. Perries | Prospects for Lorentz invariance violation searches with top pair production at the LHC and future hadron colliders | EPJC 80 (2020) 128 | 1908.11256 |
| 15 | M. S. Berger, V. A. Kostelecky, and Z. Liu | Lorentz and CPT violation in top-quark production and decay | PRD 93 (2016) 036005 | 1509.08929 |
| 16 | CMS Collaboration | The CMS experiment at the CERN LHC | JINST 3 (2008) S08004 | |
| 17 | CMS Collaboration | Performance of the CMS Level-1 trigger in proton-proton collisions at $ \sqrt{s}= $ 13 TeV | JINST 15 (2020) P10017 | CMS-TRG-17-001 2006.10165 |
| 18 | CMS Collaboration | The CMS trigger system | JINST 12 (2017) P01020 | CMS-TRG-12-001 1609.02366 |
| 19 | CMS Collaboration | Electron and photon reconstruction and identification with the CMS experiment at the CERN LHC | JINST 16 (2021) P05014 | CMS-EGM-17-001 2012.06888 |
| 20 | CMS Collaboration | Performance of the CMS muon detector and muon reconstruction with proton-proton collisions at $ \sqrt{s}= $ 13 TeV | JINST 13 (2018) P06015 | CMS-MUO-16-001 1804.04528 |
| 21 | CMS Collaboration | Description and performance of track and primary-vertex reconstruction with the CMS tracker | JINST 9 (2014) P10009 | CMS-TRK-11-001 1405.6569 |
| 22 | CMS Collaboration | Particle-flow reconstruction and global event description with the CMS detector | JINST 12 (2017) P10003 | CMS-PRF-14-001 1706.04965 |
| 23 | CMS Collaboration | Performance of reconstruction and identification of $ \tau $ leptons decaying to hadrons and $ \nu_{\!\tau} $ in pp collisions at $ \sqrt{s}= $ 13 TeV | JINST 13 (2018) P10005 | CMS-TAU-16-003 1809.02816 |
| 24 | CMS Collaboration | Jet energy scale and resolution in the CMS experiment in pp collisions at 8 TeV | JINST 12 (2017) P02014 | CMS-JME-13-004 1607.03663 |
| 25 | CMS Collaboration | Performance of missing transverse momentum reconstruction in proton-proton collisions at $ \sqrt{s}= $ 13 TeV using the CMS detector | JINST 14 (2019) P07004 | CMS-JME-17-001 1903.06078 |
| 26 | M. Cacciari, G. P. Salam, and G. Soyez | FASTJET user manual | EPJC 72 (2012) 1896 | 1111.6097 |
| 27 | CMS Collaboration | Measurements of inclusive W and Z cross sections in pp collisions at $ \sqrt{s}= $ 7 TeV | JHEP 01 (2011) 080 | CMS-EWK-10-002 1012.2466 |
| 28 | M. Cacciari, G. P. Salam, and G. Soyez | The anti-$ k_{\mathrm{T}} $ jet clustering algorithm | JHEP 04 (2008) 063 | 0802.1189 |
| 29 | CMS Collaboration | Identification of heavy-flavour jets with the CMS detector in pp collisions at 13 TeV | JINST 13 (2018) P05011 | CMS-BTV-16-002 1712.07158 |
| 30 | CMS Collaboration | Performance summary of AK4 jet b tagging with data from proton-proton collisions at 13 TeV with the CMS detector | CMS Detector Performance Note CMS-DP-2023-005, 2023 CDS |
|
| 31 | S. Alioli, P. Nason, C. Oleari, and E. Re | A general framework for implementing NLO calculations in shower Monte Carlo programs: the POWHEG BOX | JHEP 06 (2010) 043 | 1002.2581 |
| 32 | T. Sjöstrand, S. Mrenna, and P. Z. Skands | A brief introduction to PYTHIA8.1 | Comput. Phys. Commun. 178 (2008) 852 | 0710.3820 |
| 33 | M. Czakon and A. Mitov | TOP++: a program for the calculation of the top-pair cross-section at hadron colliders | Comput. Phys. Commun. 185 (2014) 2930 | 1112.5675 |
| 34 | CMS Collaboration | Measurement of the differential cross section for top quark pair production in pp collisions at $ \sqrt{s} $ = 8 TeV | EPJC 75 (2015) 542 | CMS-TOP-12-028 1505.04480 |
| 35 | CMS Collaboration | Measurement of differential cross sections for top quark pair production using the lepton+jets final state in proton-proton collisions at 13 TeV | PRD 95 (2017) 092001 | CMS-TOP-16-008 1610.04191 |
| 36 | N. Kidonakis | Top quark production | in Proc. Helmholtz International Summer School on Physics of Heavy Quarks and Hadrons, Dubna, 2013 HQ 201 (2013) 3 |
1311.0283 |
| 37 | J. Alwall et al. | The automated computation of tree-level and next-to-leading order differential cross sections, and their matching to parton shower simulations | JHEP 07 (2014) 079 | 1405.0301 |
| 38 | R. Frederix and S. Frixione | Merging meets matching in MC@NLO | JHEP 12 (2012) 061 | 1209.6215 |
| 39 | P. Kant et al. | HatHor for single top-quark production: Updated predictions and uncertainty estimates for single top-quark production in hadronic collisions | Comput. Phys. Commun. 191 (2015) 74 | 1406.4403 |
| 40 | T. Gehrmann et al. | $ {\mathrm{W^+}\mathrm{W^-}} $ production at hadron colliders in next to next to leading order QCD | PRL 113 (2014) 212001 | 1408.5243 |
| 41 | J. M. Campbell, R. K. Ellis, and C. Williams | Vector boson pair production at the LHC | JHEP 07 (2011) 018 | 1105.0020 |
| 42 | J. Alwall, S. de Visscher, and F. Maltoni | QCD radiation in the production of heavy colored particles at the LHC | JHEP 02 (2009) 017 | 0810.5350 |
| 43 | R. Gavin, Y. Li, F. Petriello, and S. Quackenbush | FEWZ 2.0: A code for hadronic Z production at next-to-next-to-leading order | Comput. Phys. Commun. 182 (2011) 2388 | 1011.3540 |
| 44 | NNPDF Collaboration | Parton distributions from high-precision collider data | EPJC 77 (2017) 663 | 1706.00428 |
| 45 | CMS Collaboration | Extraction and validation of a new set of CMS PYTHIA8 tunes from underlying-event measurements | EPJC 80 (2020) 4 | CMS-GEN-17-001 1903.12179 |
| 46 | CMS Collaboration | Event generator tunes obtained from underlying event and multiparton scattering measurements | EPJC 76 (2016) 155 | CMS-GEN-14-001 1512.00815 |
| 47 | GEANT4 Collaboration | GEANT 4---a simulation toolkit | NIM A 506 (2003) 250 | |
| 48 | S. van der Meer | Calibration of the effective beam height in the ISR | ISR Report CERN-ISR-PO-68-31, 1968 | |
| 49 | P. Grafström and W. Kozanecki | Luminosity determination at proton colliders | Prog. Part. Nucl. Phys. 81 (2015) 97 | |
| 50 | CMS Collaboration | Precision luminosity measurement in proton-proton collisions at $ \sqrt{s}= $ 13 TeV in 2015 and 2016 at CMS | EPJC 81 (2021) 800 | CMS-LUM-17-003 2104.01927 |
| 51 | CMS Collaboration | CMS luminosity measurement for the 2017 data-taking period at $ \sqrt{s}= $ 13 TeV | CMS Physics Analysis Summary, 2018 CMS-PAS-LUM-17-004 |
CMS-PAS-LUM-17-004 |
| 52 | CMS BRIL Collaboration | The Pixel Luminosity Telescope: A detector for luminosity measurement at CMS using silicon pixel sensors | Accepted by EPJC, 2022 | 2206.08870 |
| 53 | CMS Collaboration | Search for charged-lepton flavor violation in top quark production and decay in pp collisions at $ \sqrt{s}= $ 13 TeV | JHEP 06 (2022) 082 | CMS-TOP-19-006 2201.07859 |
| 54 | CMS Collaboration | Measurement of the $ \mathrm{t} \overline{\mathrm{t}} $ production cross section, the top quark mass, and the strong coupling constant using dilepton events in pp collisions at $ \sqrt{s}= $ 13 TeV | EPJC 79 (2019) 368 | CMS-TOP-17-001 1812.10505 |
| 55 | CMS Collaboration | Measurement of the cross section for top quark pair production in association with a W or Z boson in proton-proton collisions at $ \sqrt{s}= $ 13 TeV | JHEP 08 (2018) 011 | CMS-TOP-17-005 1711.02547 |
| 56 | G. Cowan, K. Cranmer, E. Gross, and O. Vitells | Asymptotic formulae for likelihood-based tests of new physics | EPJC 71 (2011) 1554 | 1007.1727 |
| 57 | ATLAS and CMS Collaborations, and LHC Higgs Combination Group | Procedure for the LHC Higgs boson search combination in Summer 2011 | Technical Report CMS-NOTE-2011-005, ATL-PHYS-PUB-2011-11, 2011 | |
| 58 | M. Jones | Computation of WGS84 geodetic coordinates and azimuths at the LHC interaction points | CERN TS/SU-ACG Activity Report, 2005 EDMS Document 32274 (2005) 7 |
|
|
|
Compact Muon Solenoid LHC, CERN |
|

|

|

|

|

|