

Compact Muon Solenoid
LHC, CERN
| CMS-B2G-19-001 ; CERN-EP-2024-067 | ||
| Search for production of a single vector-like quark decaying to tH or tZ in the all-hadronic final state in pp collisions at $ \sqrt{s} = $ 13 TeV | ||
| CMS Collaboration | ||
| 8 May 2024 | ||
| Submitted to Phys. Rev. D | ||
| Abstract: A search for electroweak production of a single vector-like T quark in association with a bottom (b) quark in the all-hadronic decay channel is presented. This search uses proton-proton collision data at $ \sqrt{s} = $ 13 TeV collected by the CMS experiment at the CERN LHC during 2016-2018, corresponding to an integrated luminosity of 138 fb$ ^{-1} $. The T quark is assumed to have charge 2$ / $3 and decay to a top (t) quark and a Higgs (H) or Z boson. Event kinematics and the presence of jets containing b hadrons are used to reconstruct the hadronic decays of the t quark and H or Z boson. No significant deviation from the standard model prediction is observed in the data. The 95% confidence level upper limits on the product of the production cross section and branching fraction of a T quark produced in association with a b quark and decaying via tH or tZ range from 1260 to 68 fb for T quark masses of 600-1200 GeV. | ||
| Links: e-print arXiv:2405.05071 [hep-ex] (PDF) ; CDS record ; inSPIRE record ; CADI line (restricted) ; | ||
| Figures & Tables | Summary | Additional Figures | References | CMS Publications |
|---|
| Figures | |
png pdf |
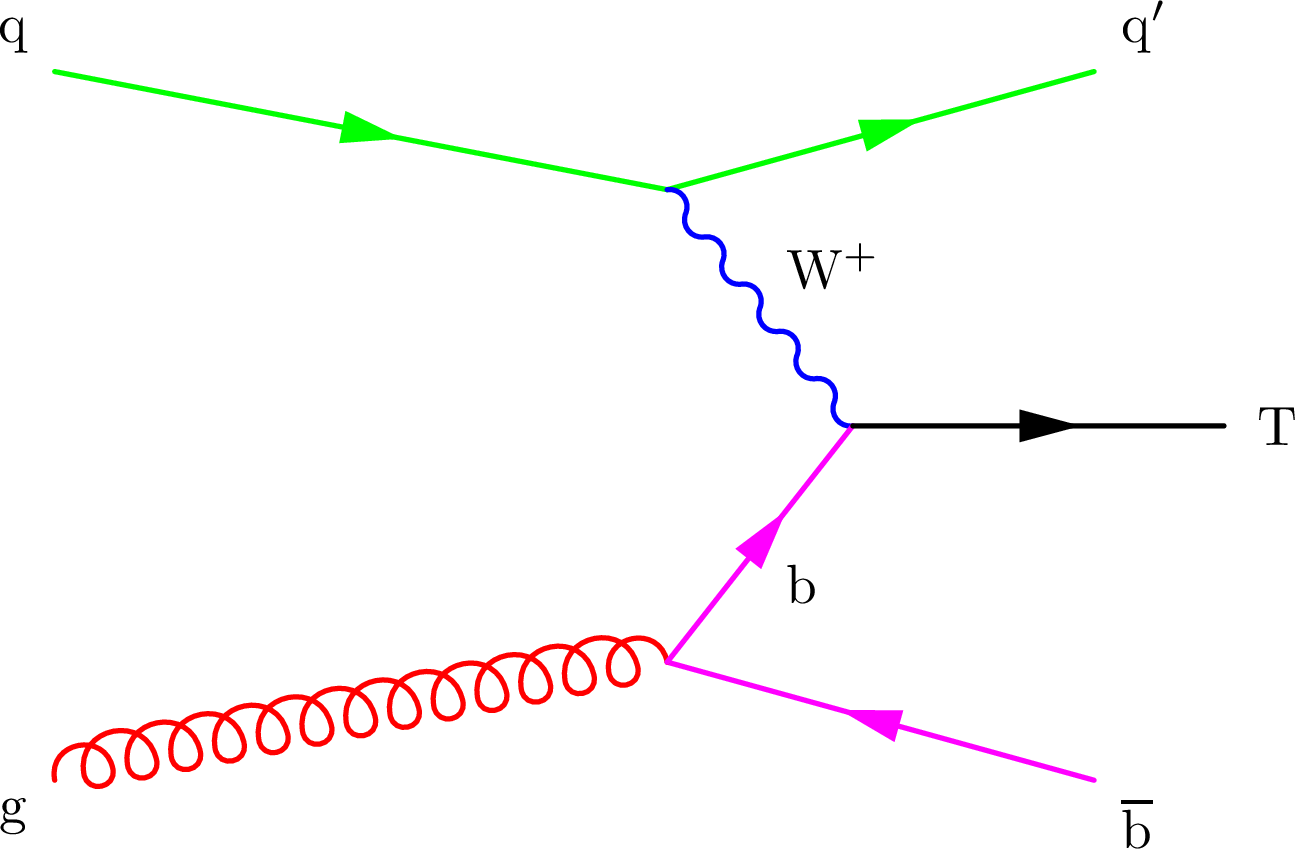
Figure 1:
Example of Feynman diagram for electroweak production of a vector-like T quark. |
png pdf |
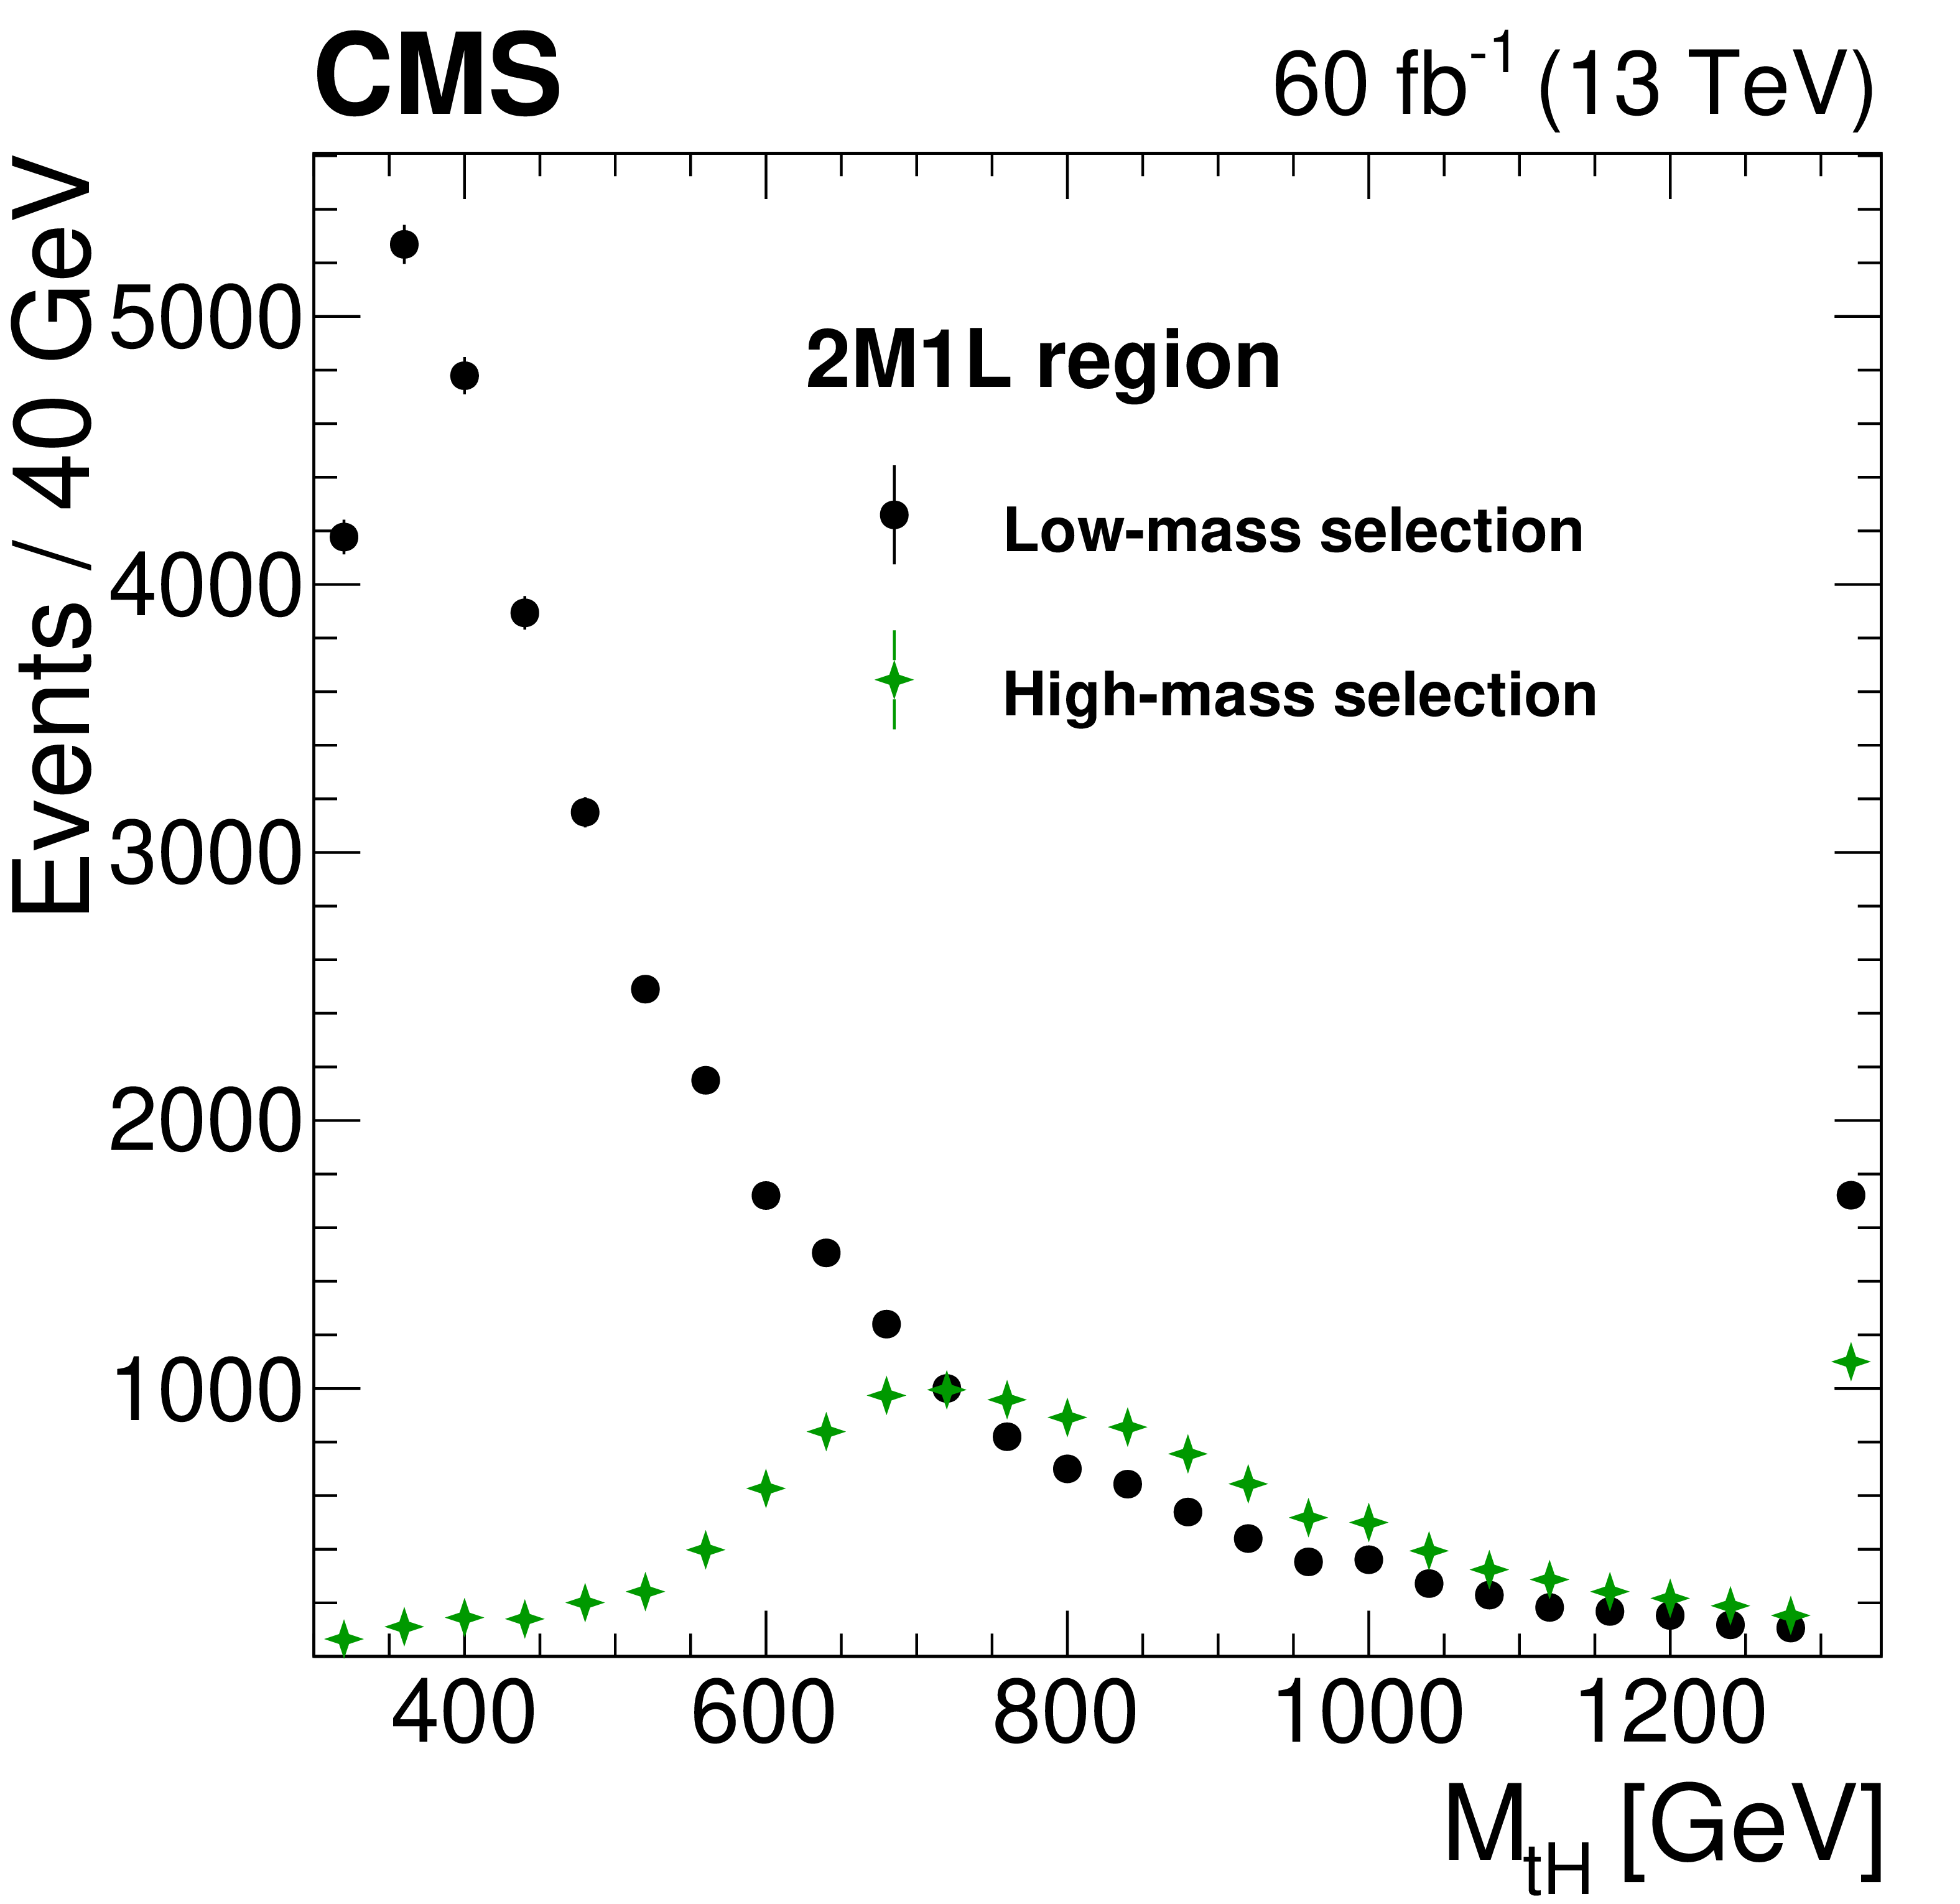
Figure 2:
The five-jet invariant mass distribution in the 2M1L region after the high-mass (green crosses) and low-mass (black circles) selections in 2018 data. The rightmost bin of the distribution is an overflow bin. The low-mass selection results in a mass distribution that is smoothly falling, unlike the high-mass selection. The high-mass selection is more efficient for T quark masses above 700 GeV by up to 25% while maintaining a similar background level, as detailed in Section 4.2.1. |

png pdf |
Figure 3:
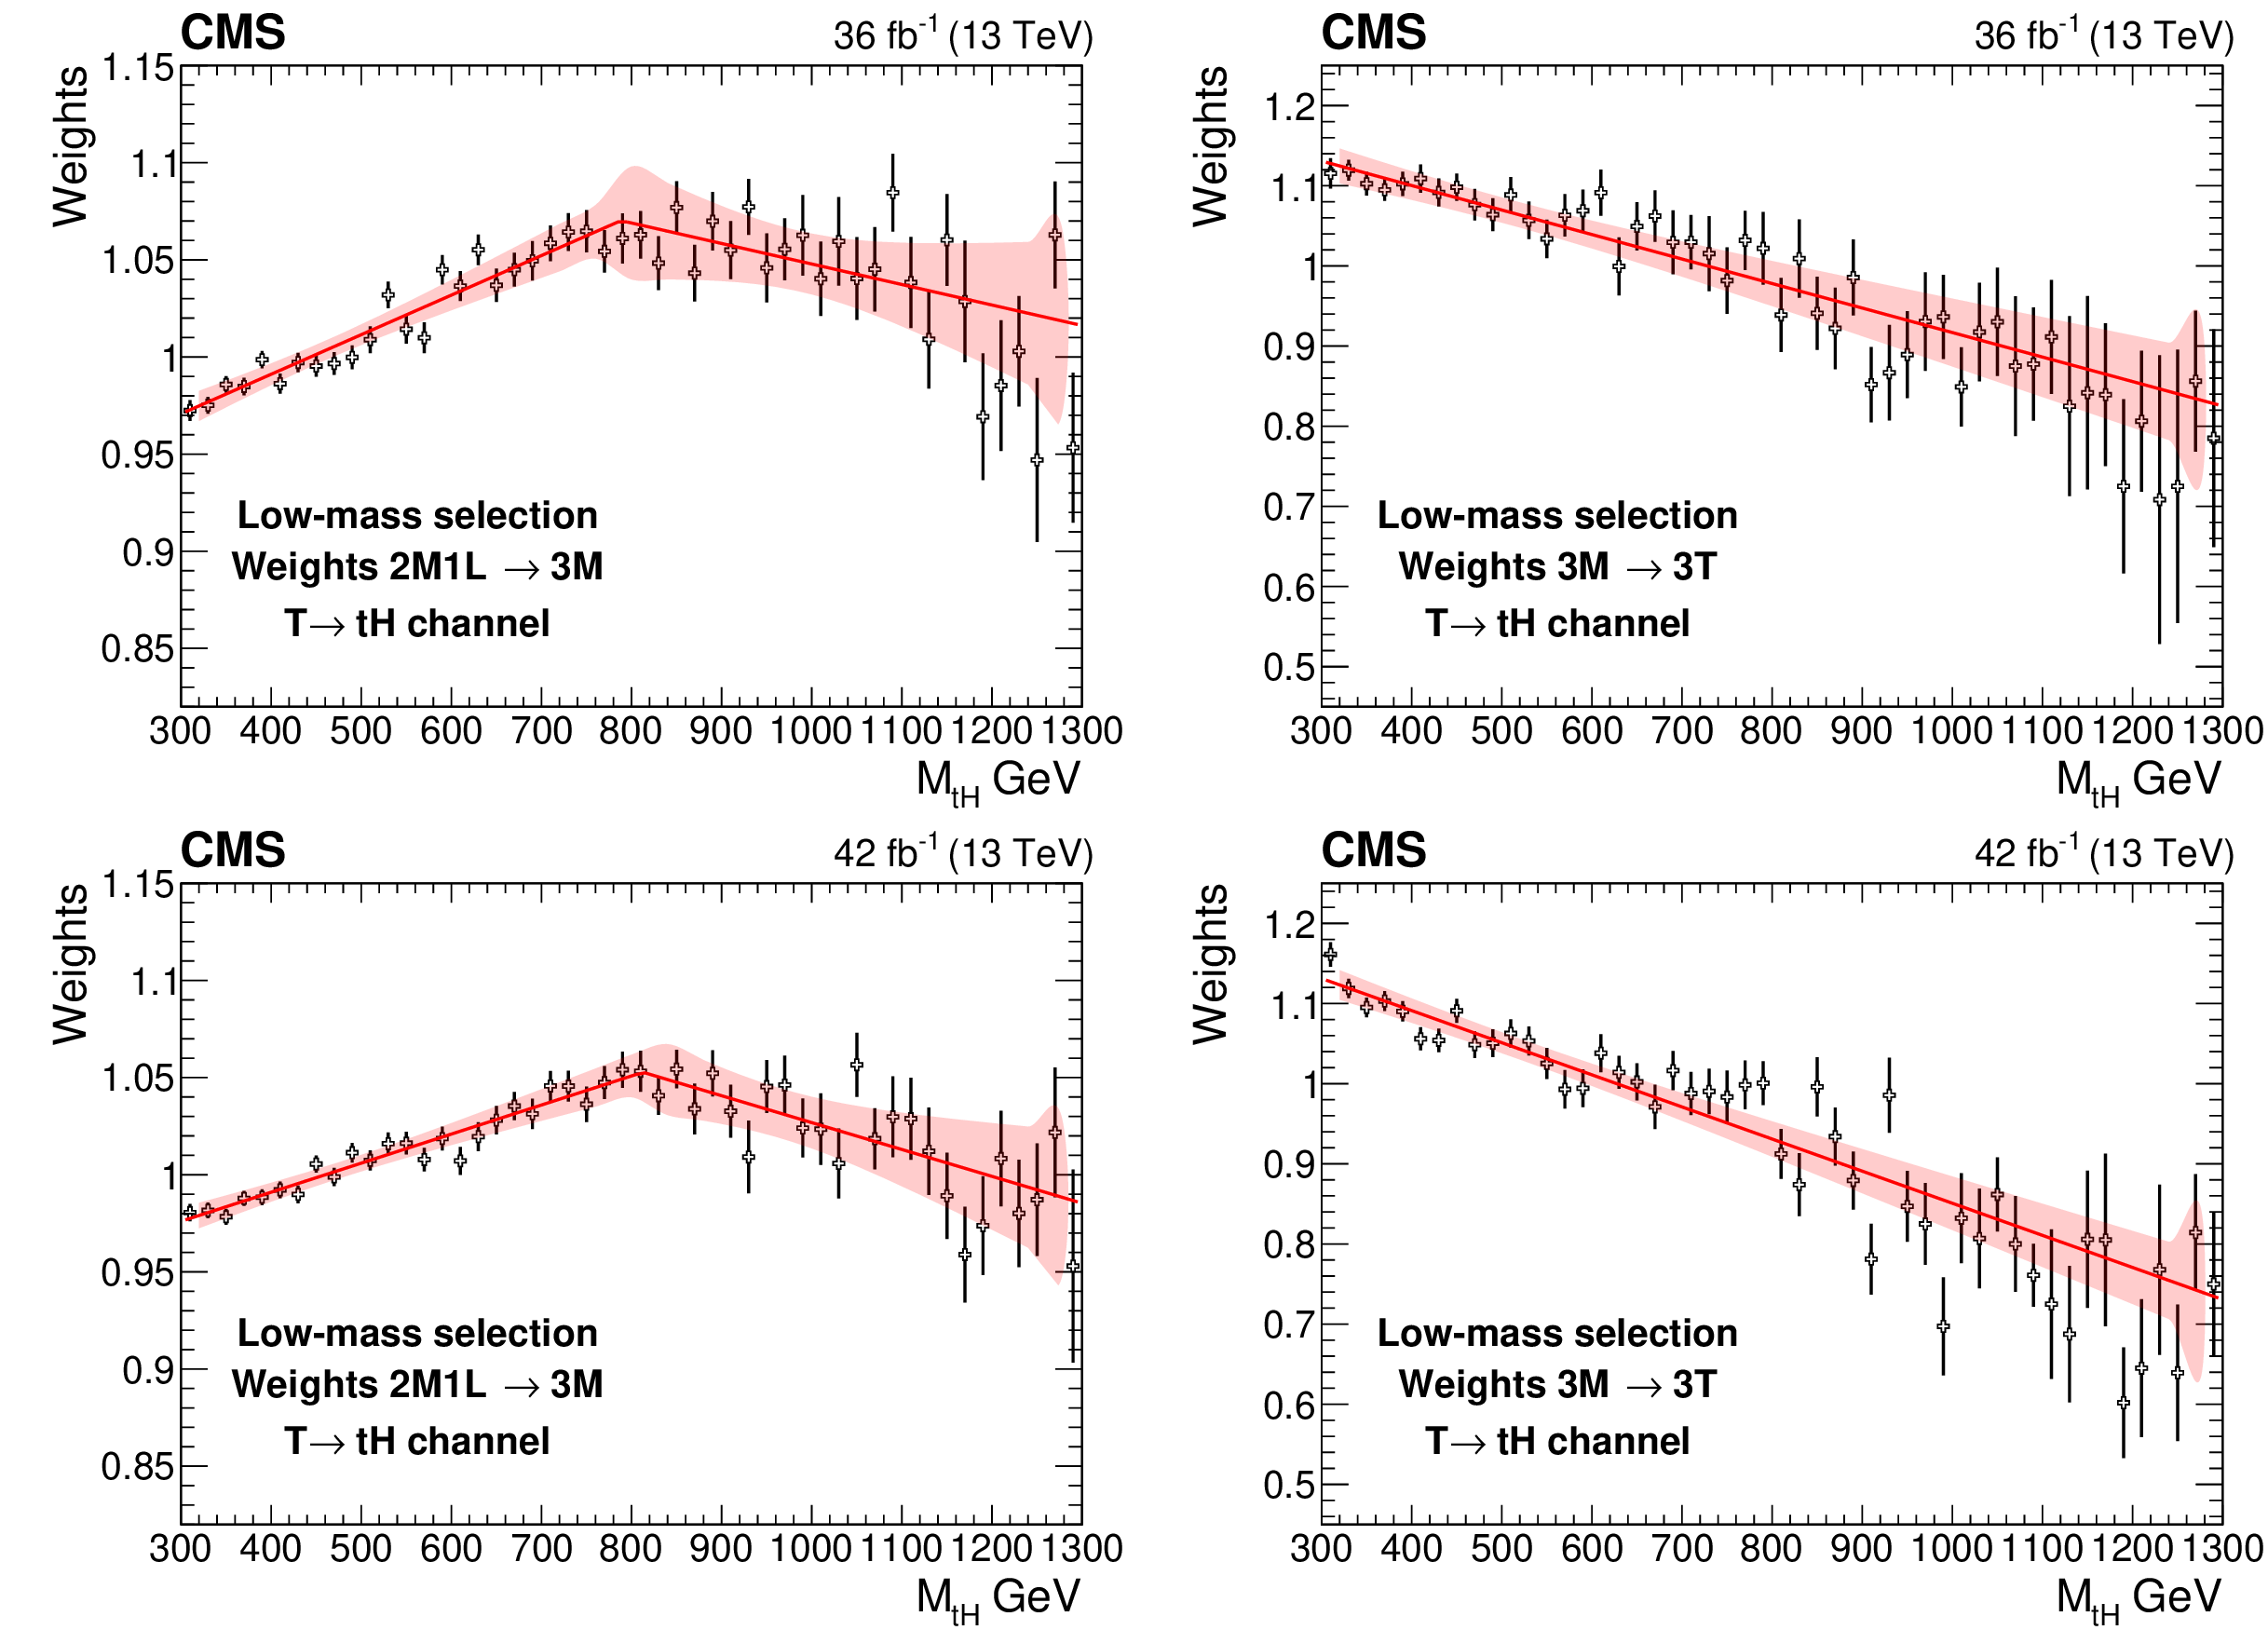
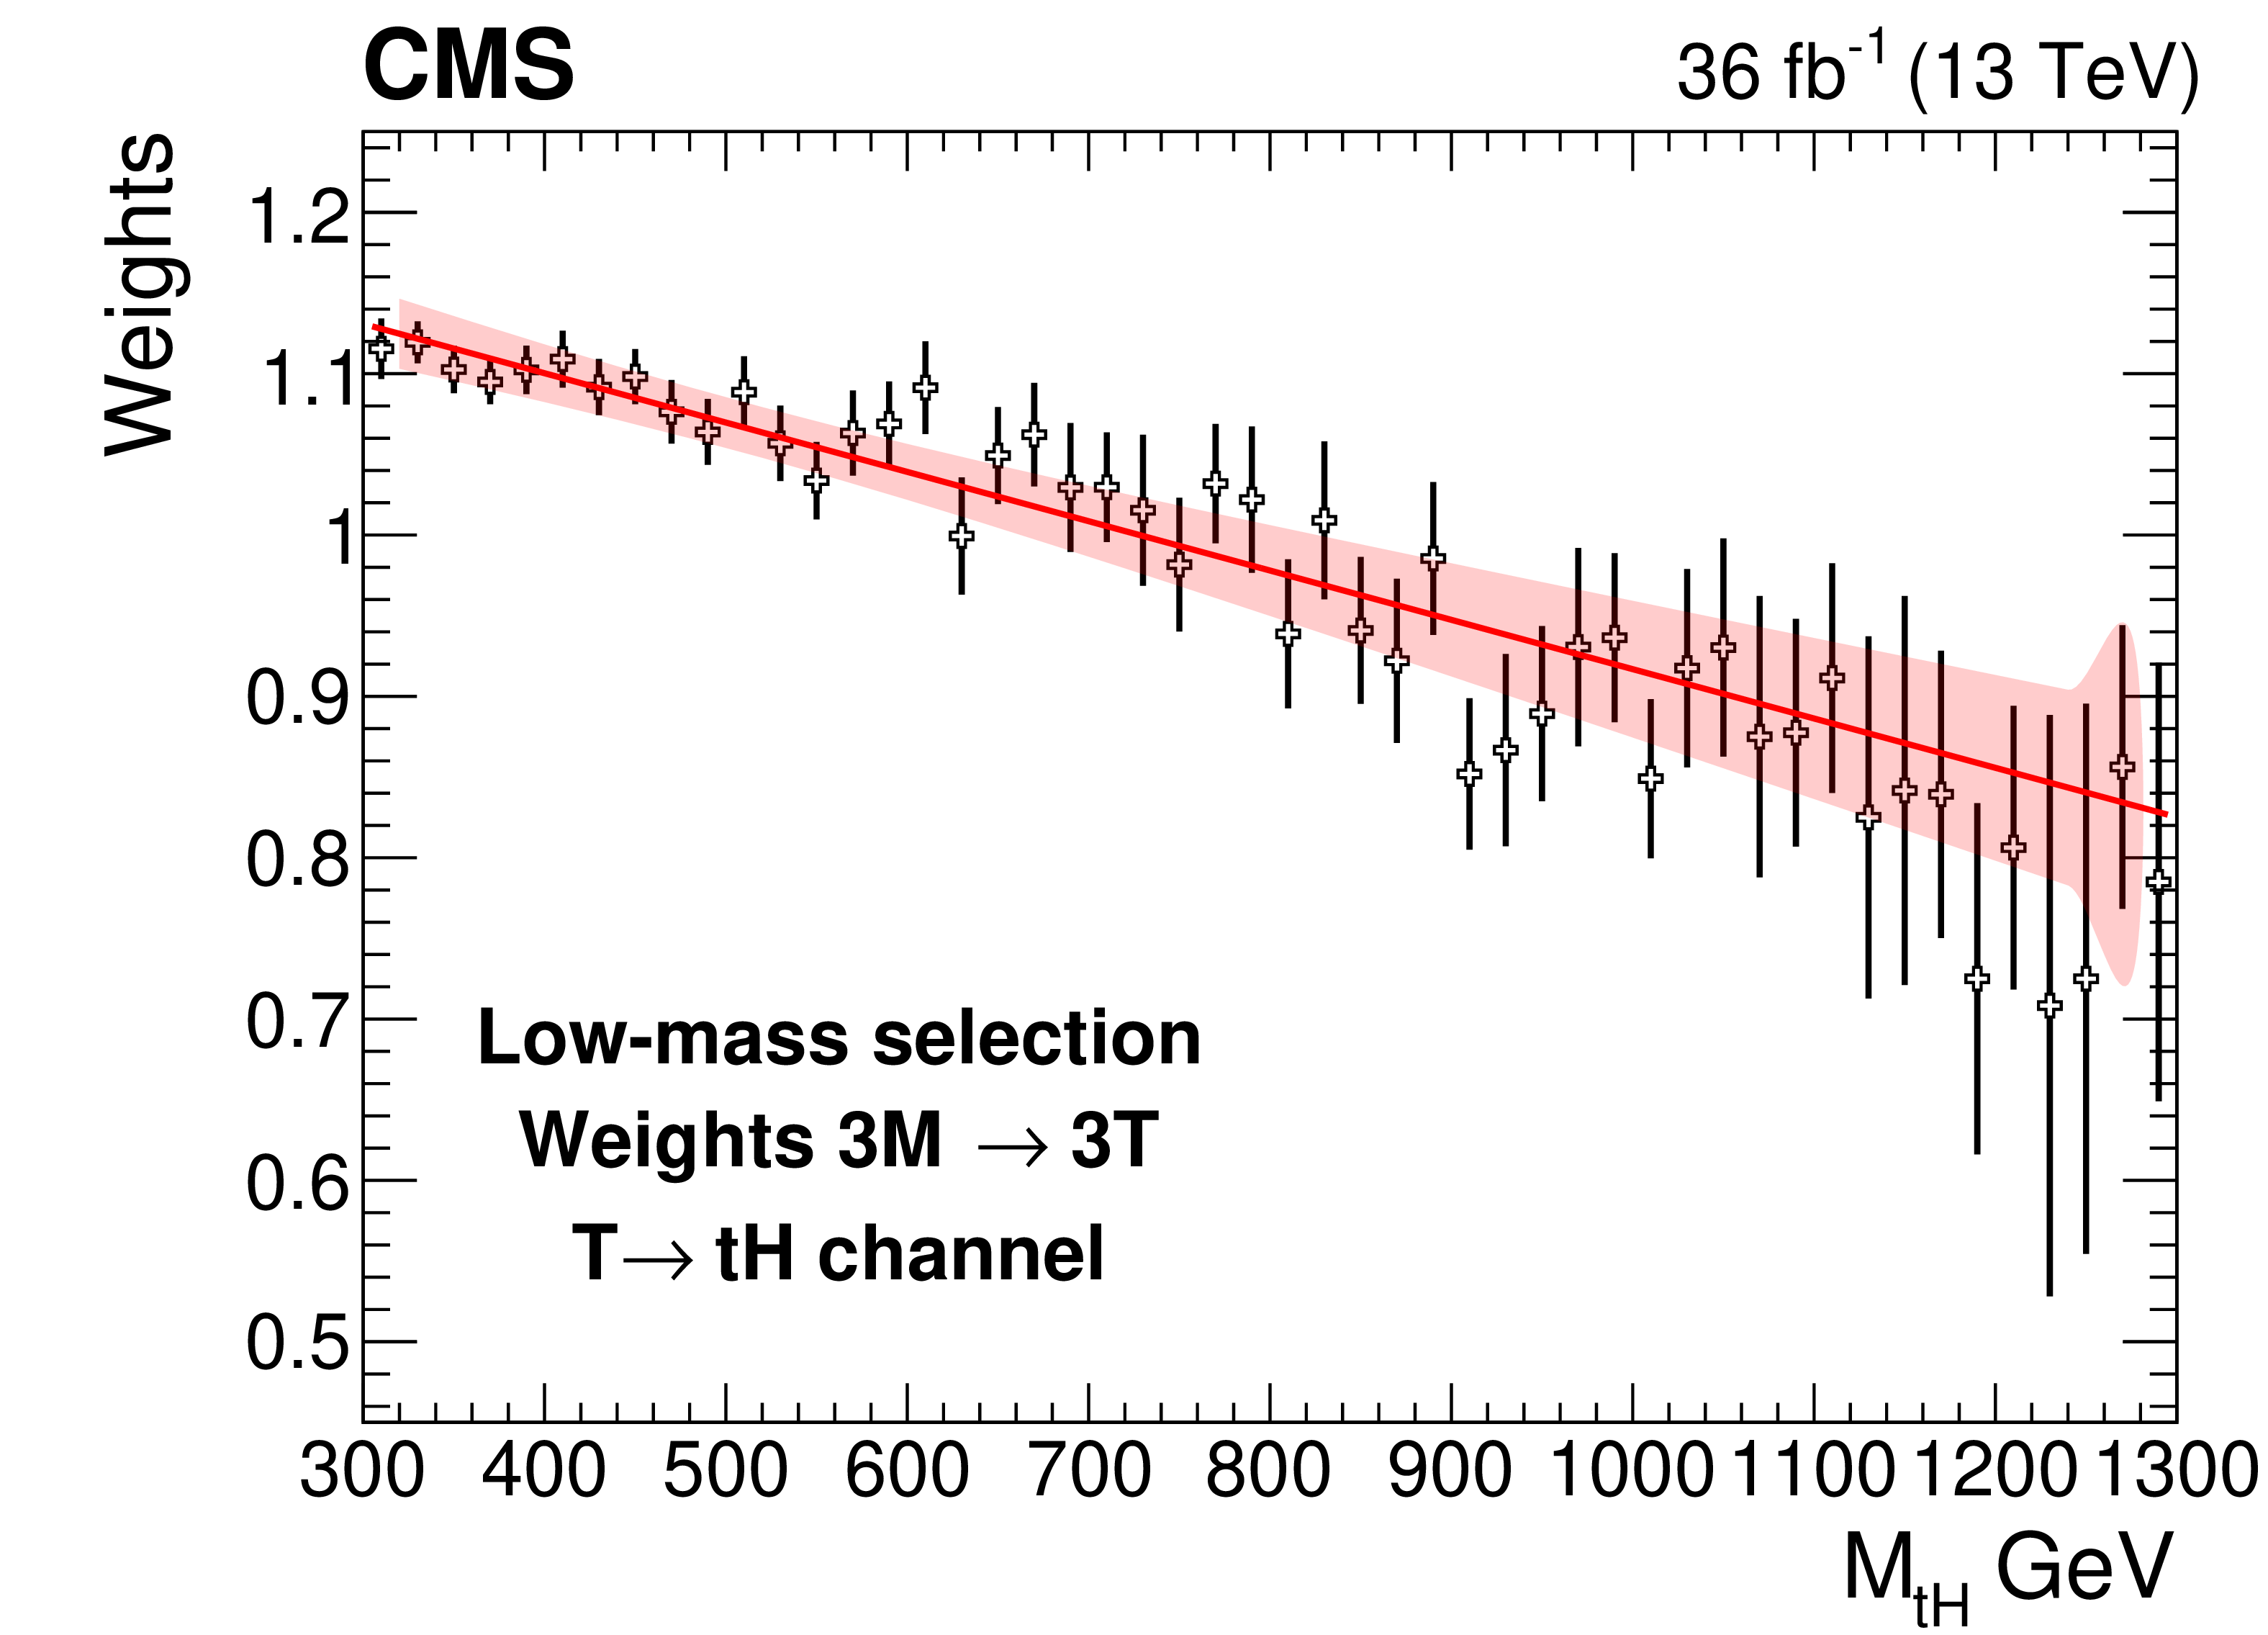
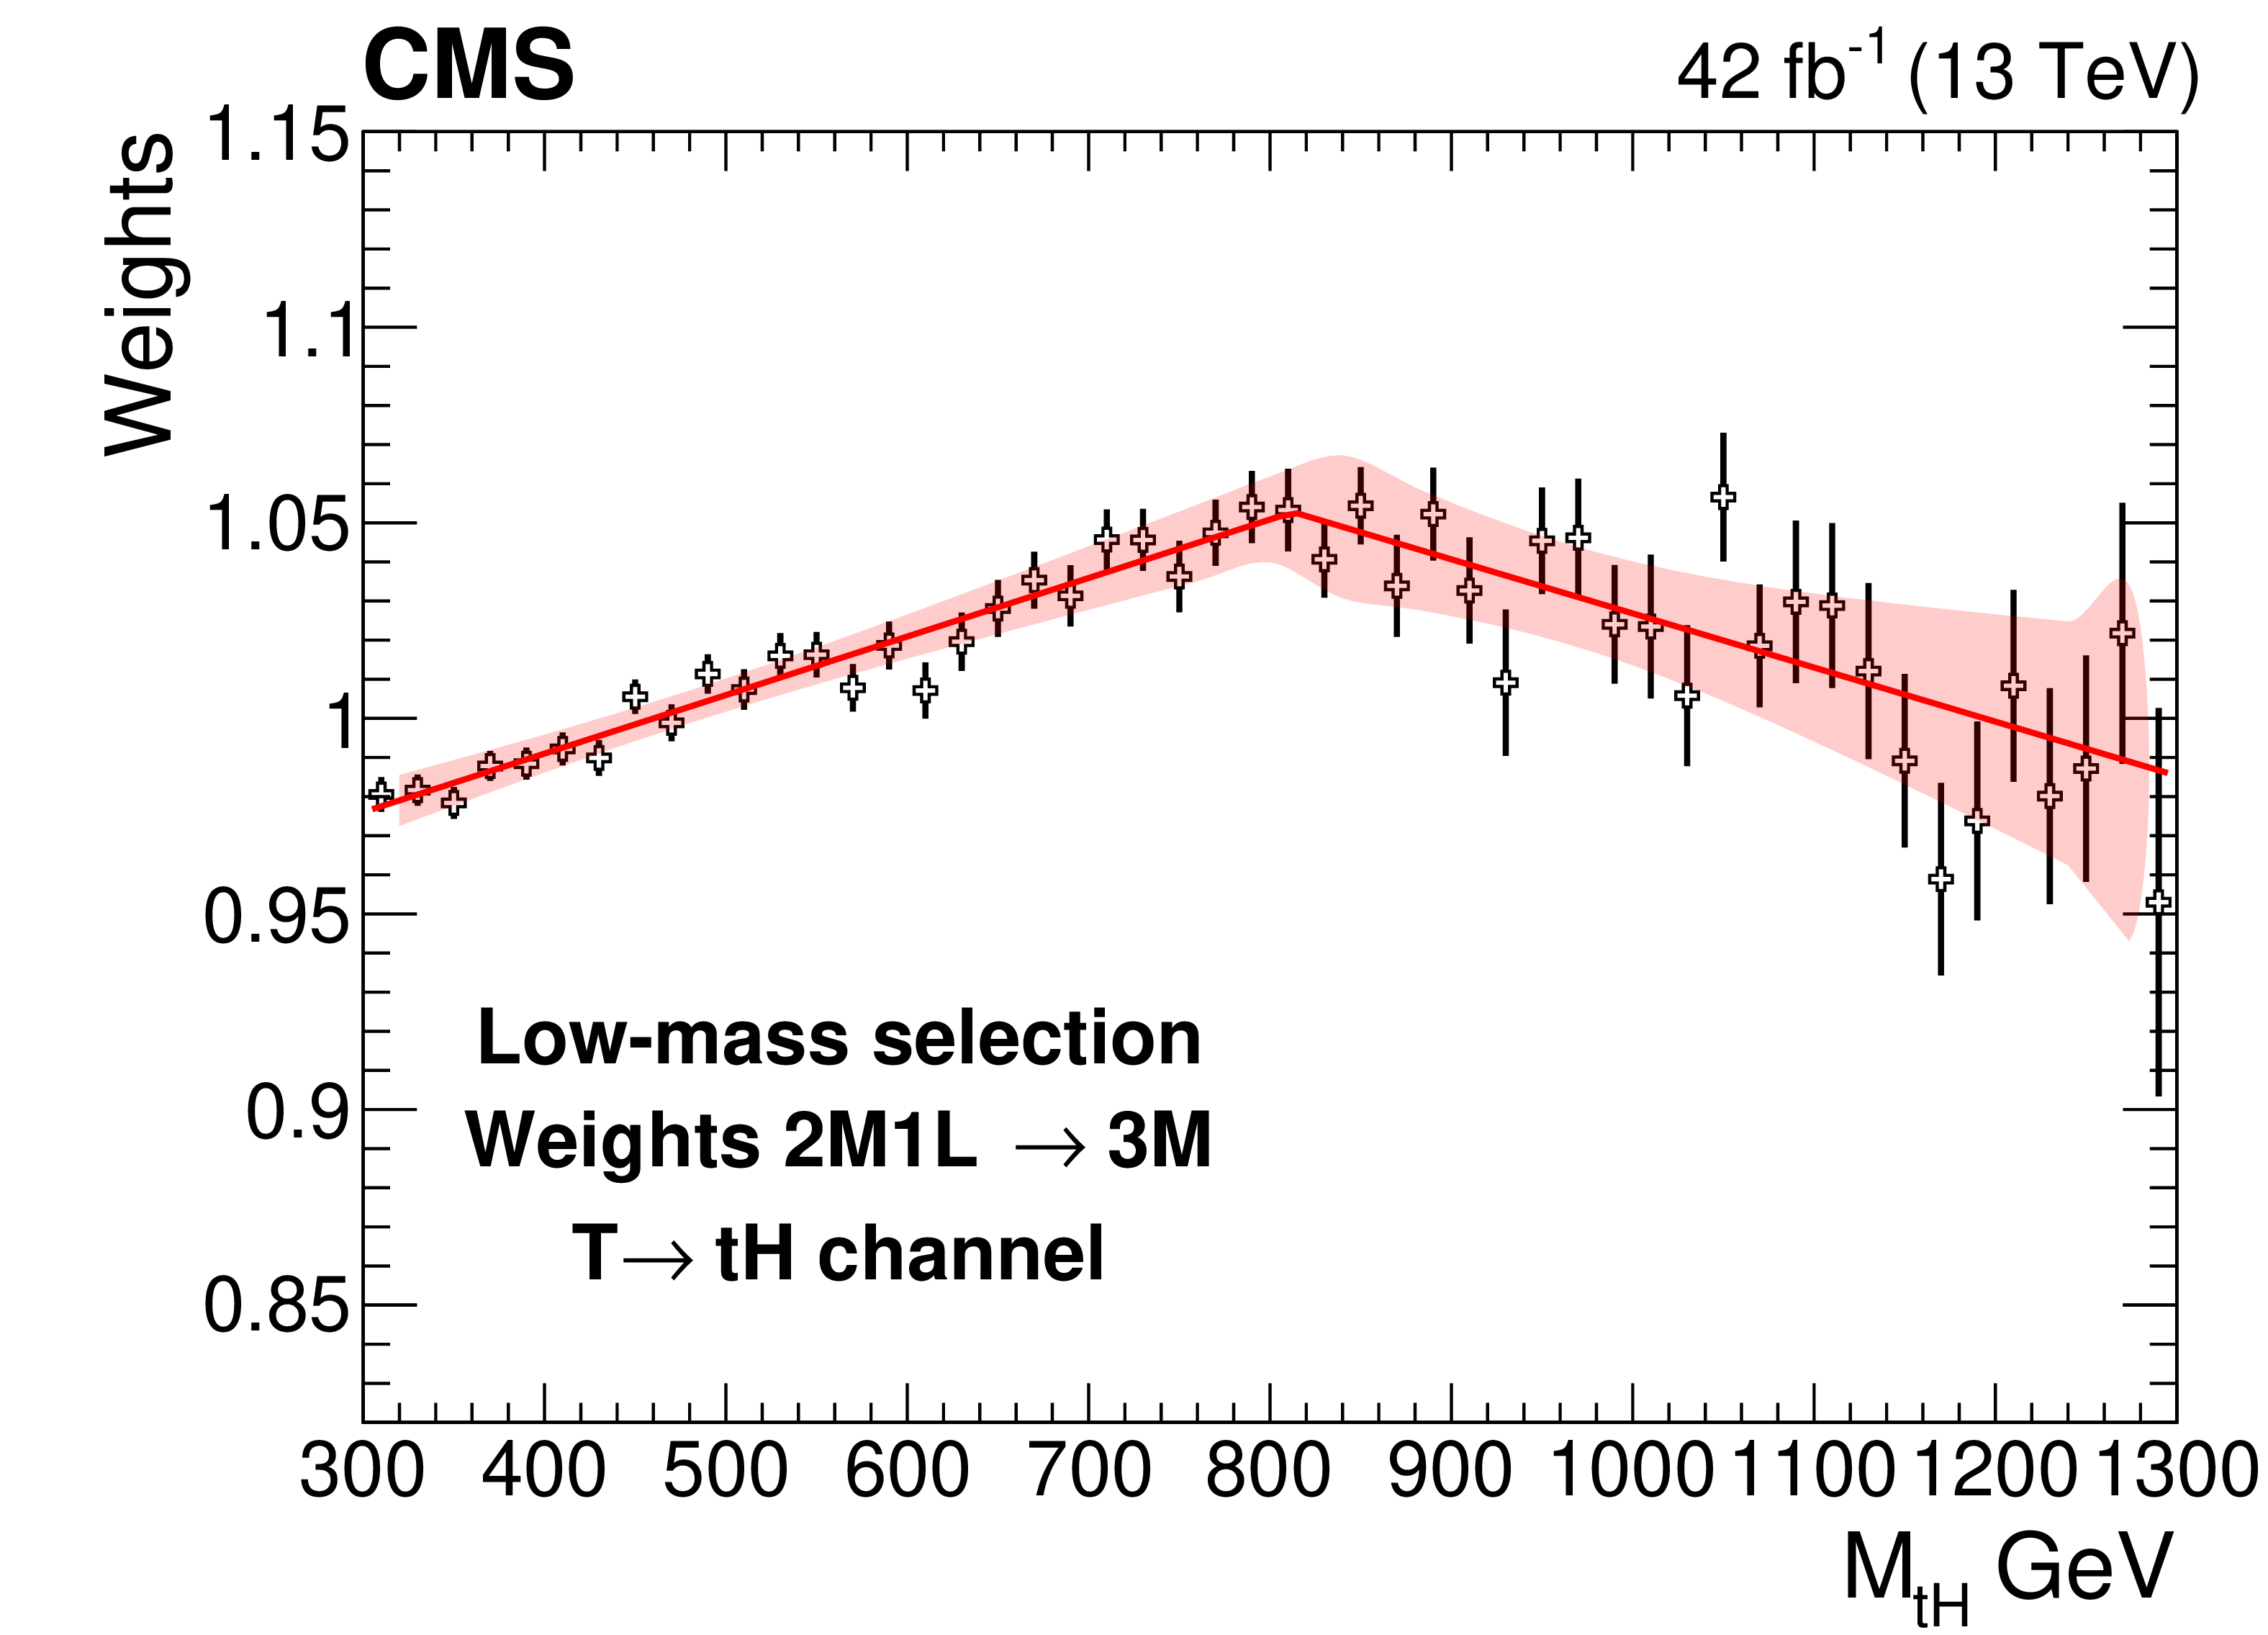
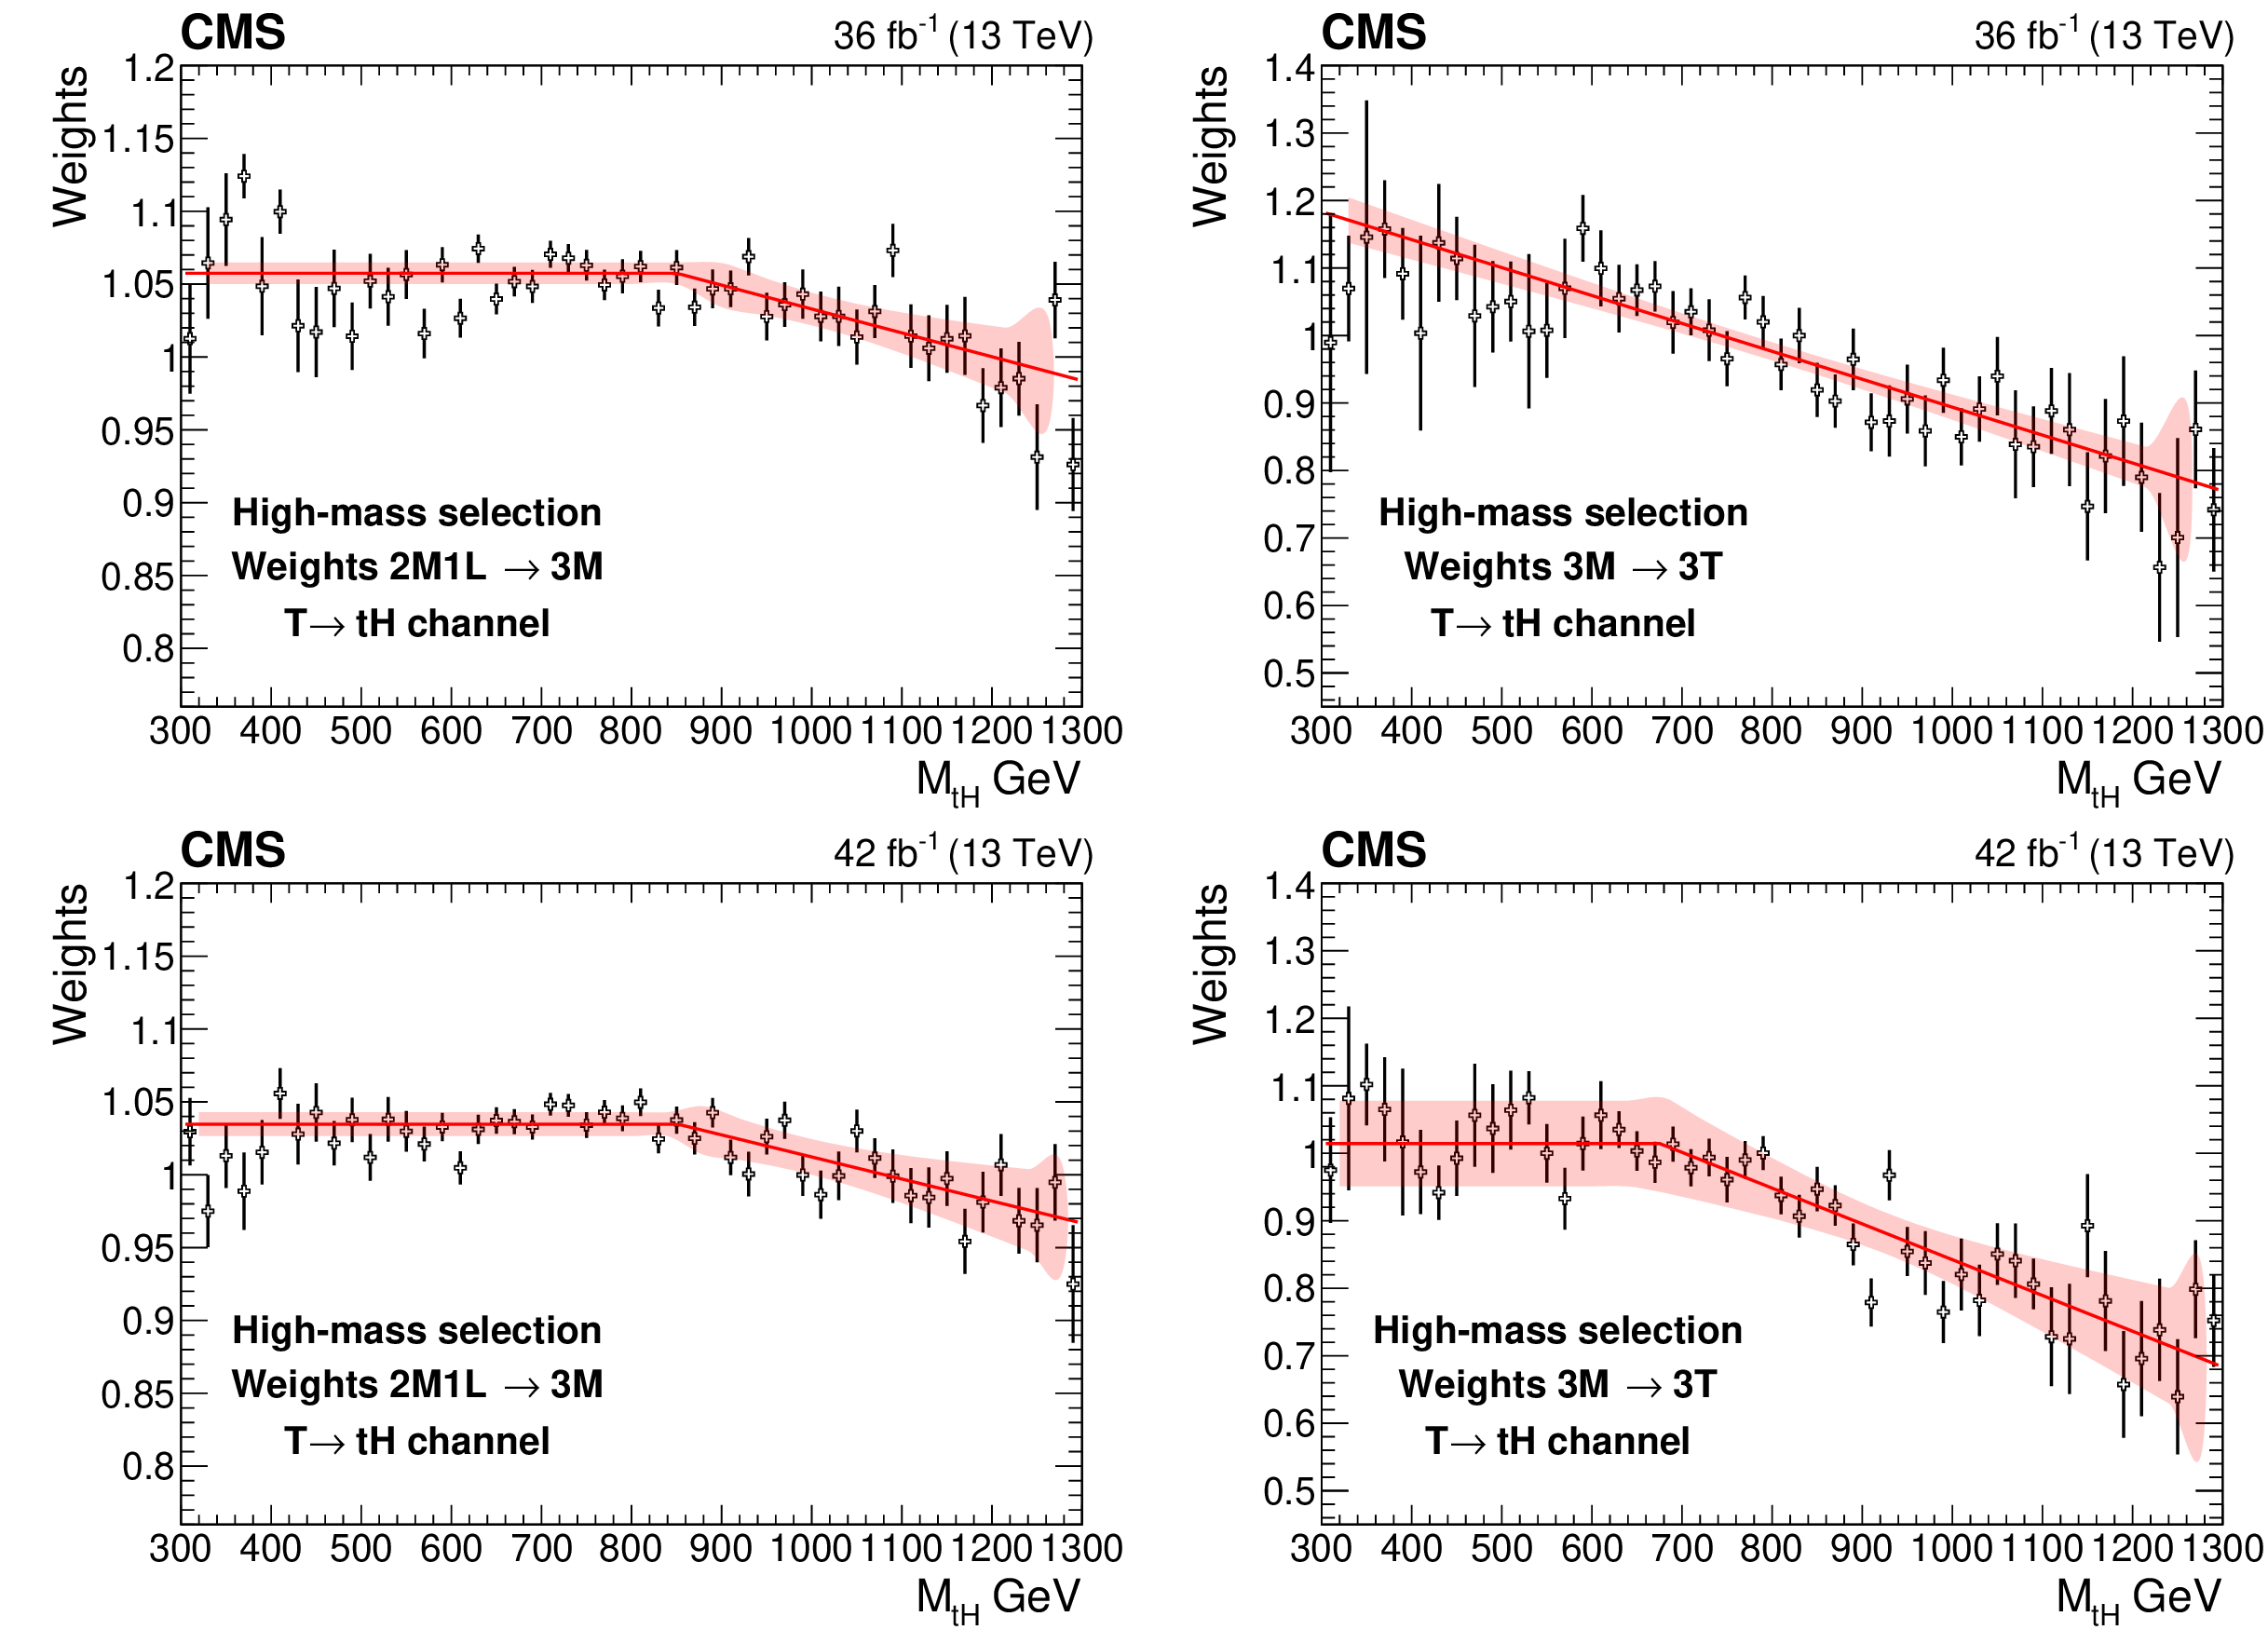
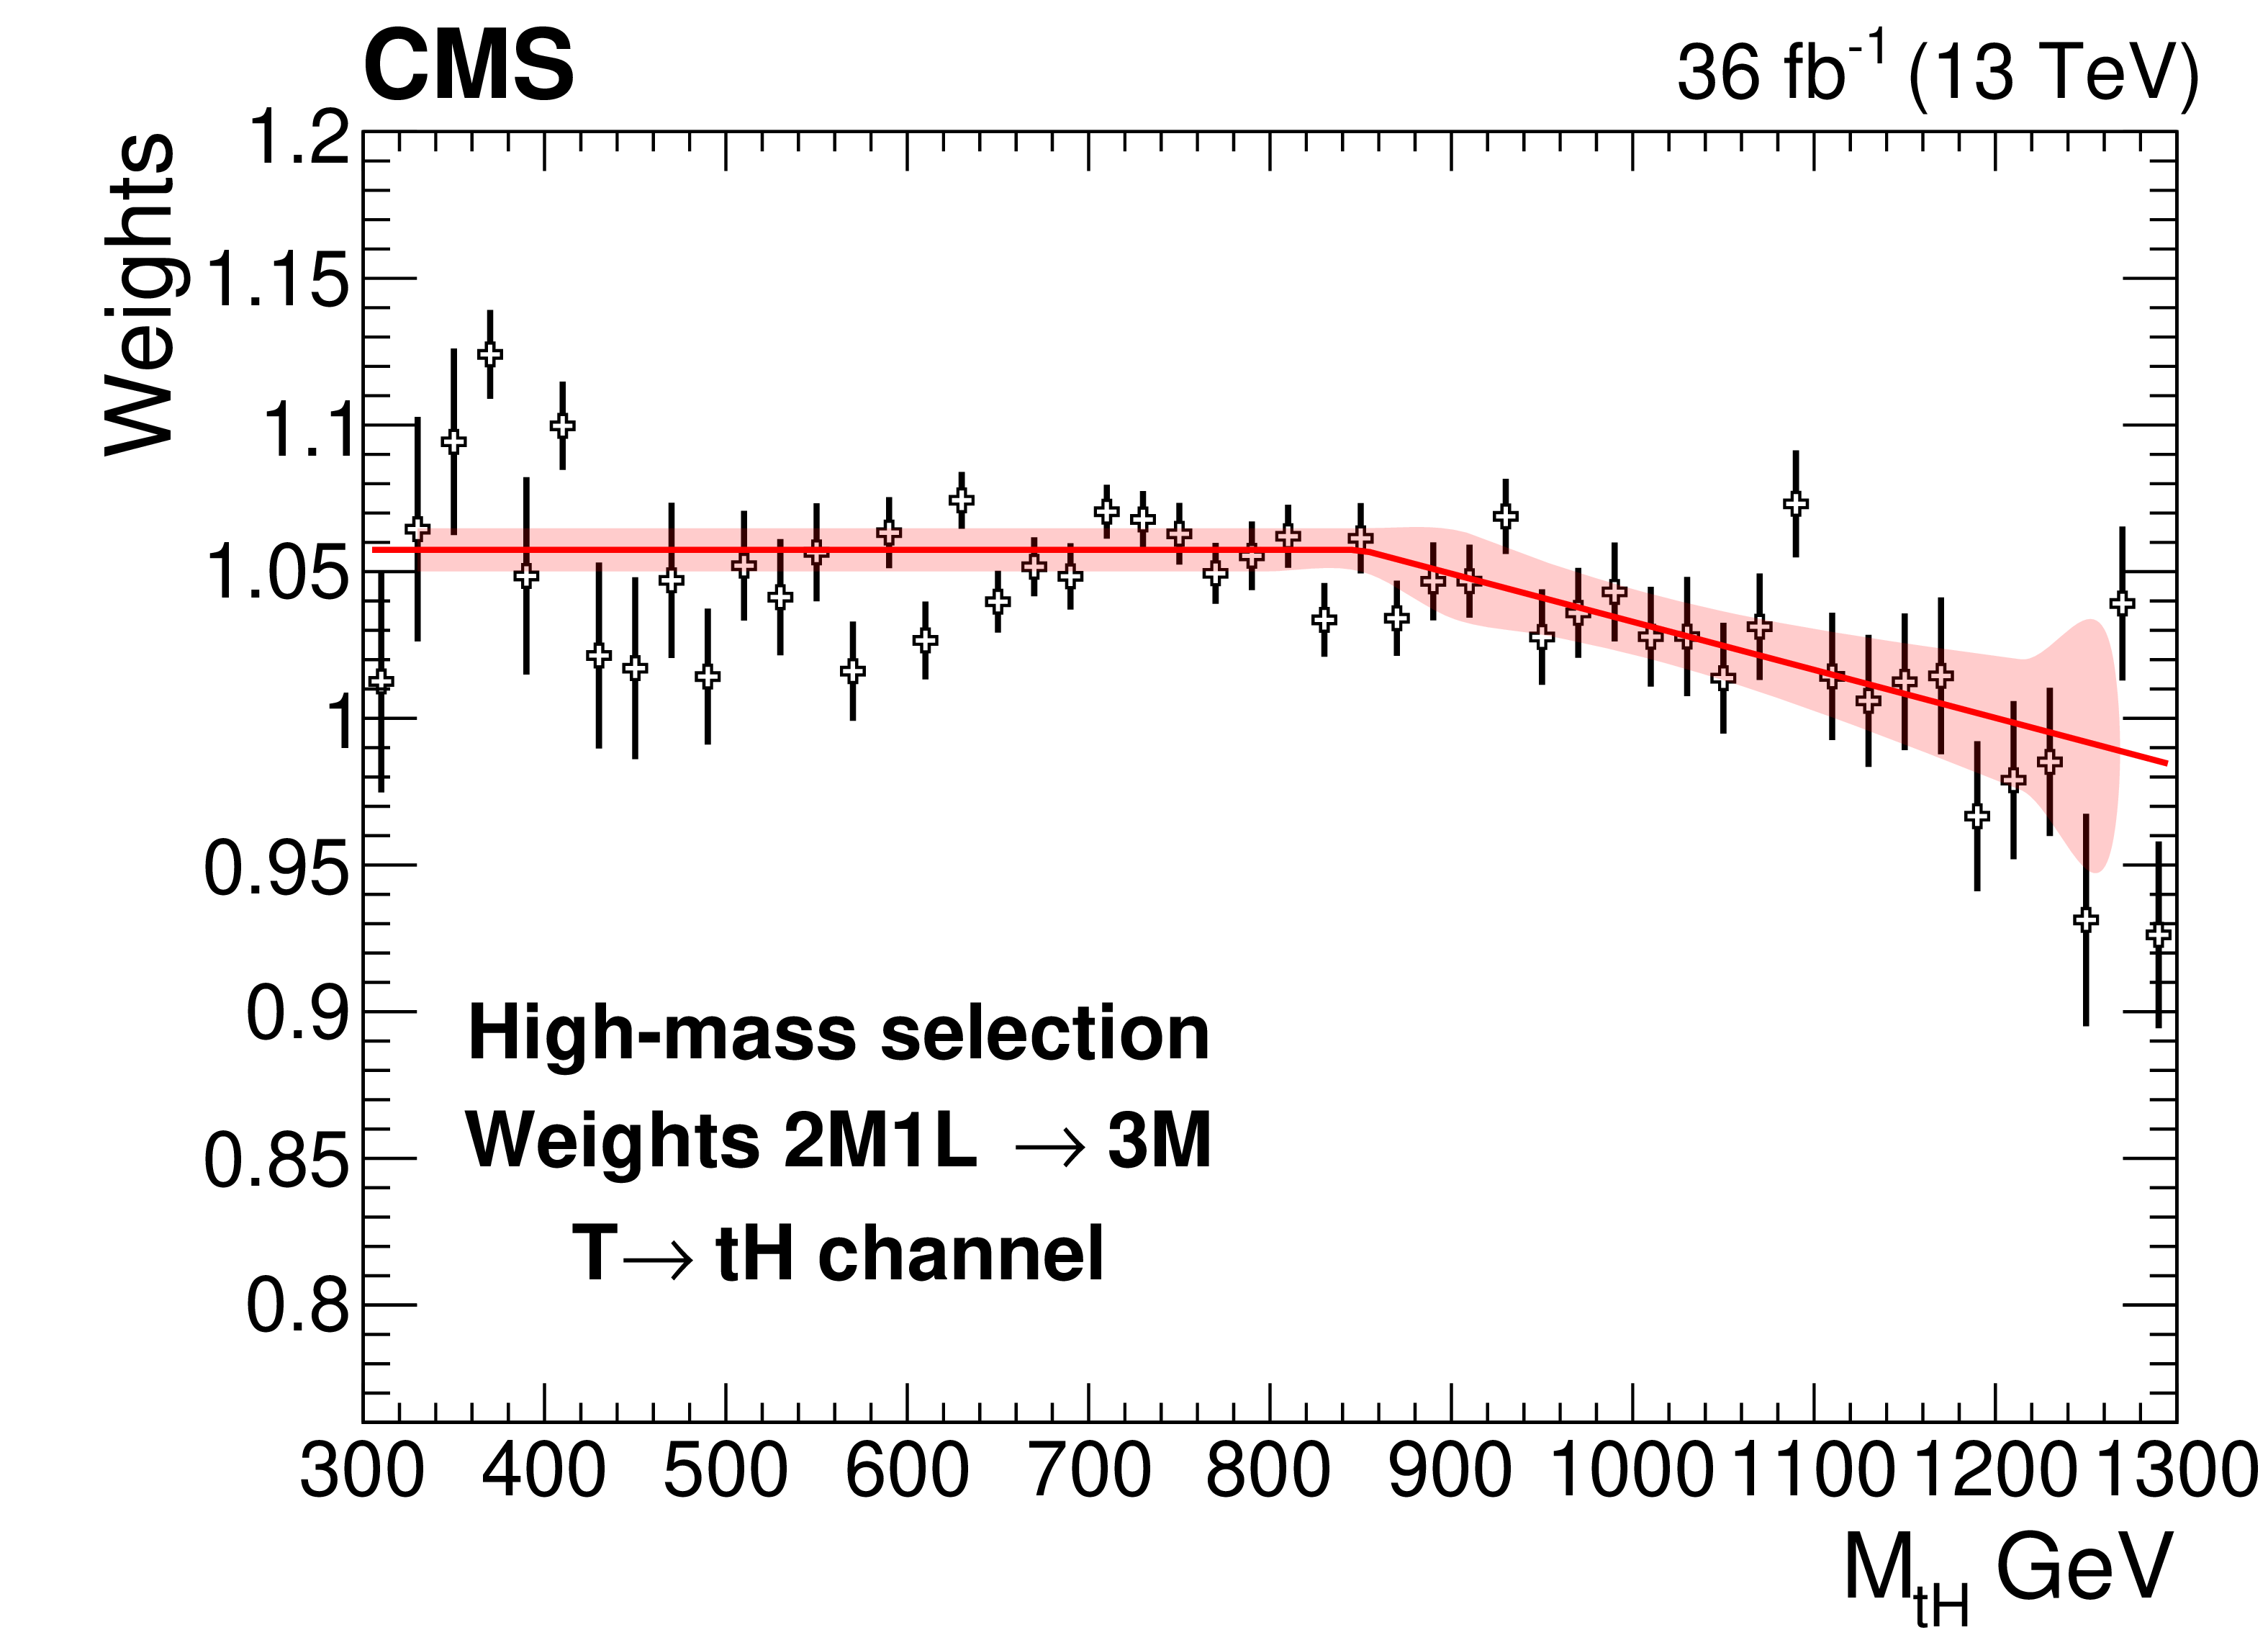
Weights from b tagging ratios (open markers) as functions of the five-jet invariant mass in 2018 data for the low-mass (upper) and high-mass (lower) selections. The left graphs show weights connecting the 2M1L and 3M regions, and the right graphs show weights connecting the 3M and 3T regions. The red line corresponds to the central value of the transfer function and the shaded area represents the 95% confidence level uncertainty band. For the low-mass (high-mass) analysis only signals with mass below (above) 800 GeV are tested, so primarily the lower (upper) part of the distribution contributes to the final result. |

png pdf |
Figure 3-a:
Weights from b tagging ratios (open markers) as functions of the five-jet invariant mass in 2018 data for the low-mass (upper) and high-mass (lower) selections. The left graphs show weights connecting the 2M1L and 3M regions, and the right graphs show weights connecting the 3M and 3T regions. The red line corresponds to the central value of the transfer function and the shaded area represents the 95% confidence level uncertainty band. For the low-mass (high-mass) analysis only signals with mass below (above) 800 GeV are tested, so primarily the lower (upper) part of the distribution contributes to the final result. |

png pdf |
Figure 3-b:
Weights from b tagging ratios (open markers) as functions of the five-jet invariant mass in 2018 data for the low-mass (upper) and high-mass (lower) selections. The left graphs show weights connecting the 2M1L and 3M regions, and the right graphs show weights connecting the 3M and 3T regions. The red line corresponds to the central value of the transfer function and the shaded area represents the 95% confidence level uncertainty band. For the low-mass (high-mass) analysis only signals with mass below (above) 800 GeV are tested, so primarily the lower (upper) part of the distribution contributes to the final result. |

png pdf |
Figure 3-c:
Weights from b tagging ratios (open markers) as functions of the five-jet invariant mass in 2018 data for the low-mass (upper) and high-mass (lower) selections. The left graphs show weights connecting the 2M1L and 3M regions, and the right graphs show weights connecting the 3M and 3T regions. The red line corresponds to the central value of the transfer function and the shaded area represents the 95% confidence level uncertainty band. For the low-mass (high-mass) analysis only signals with mass below (above) 800 GeV are tested, so primarily the lower (upper) part of the distribution contributes to the final result. |

png pdf |
Figure 3-d:
Weights from b tagging ratios (open markers) as functions of the five-jet invariant mass in 2018 data for the low-mass (upper) and high-mass (lower) selections. The left graphs show weights connecting the 2M1L and 3M regions, and the right graphs show weights connecting the 3M and 3T regions. The red line corresponds to the central value of the transfer function and the shaded area represents the 95% confidence level uncertainty band. For the low-mass (high-mass) analysis only signals with mass below (above) 800 GeV are tested, so primarily the lower (upper) part of the distribution contributes to the final result. |
png pdf |
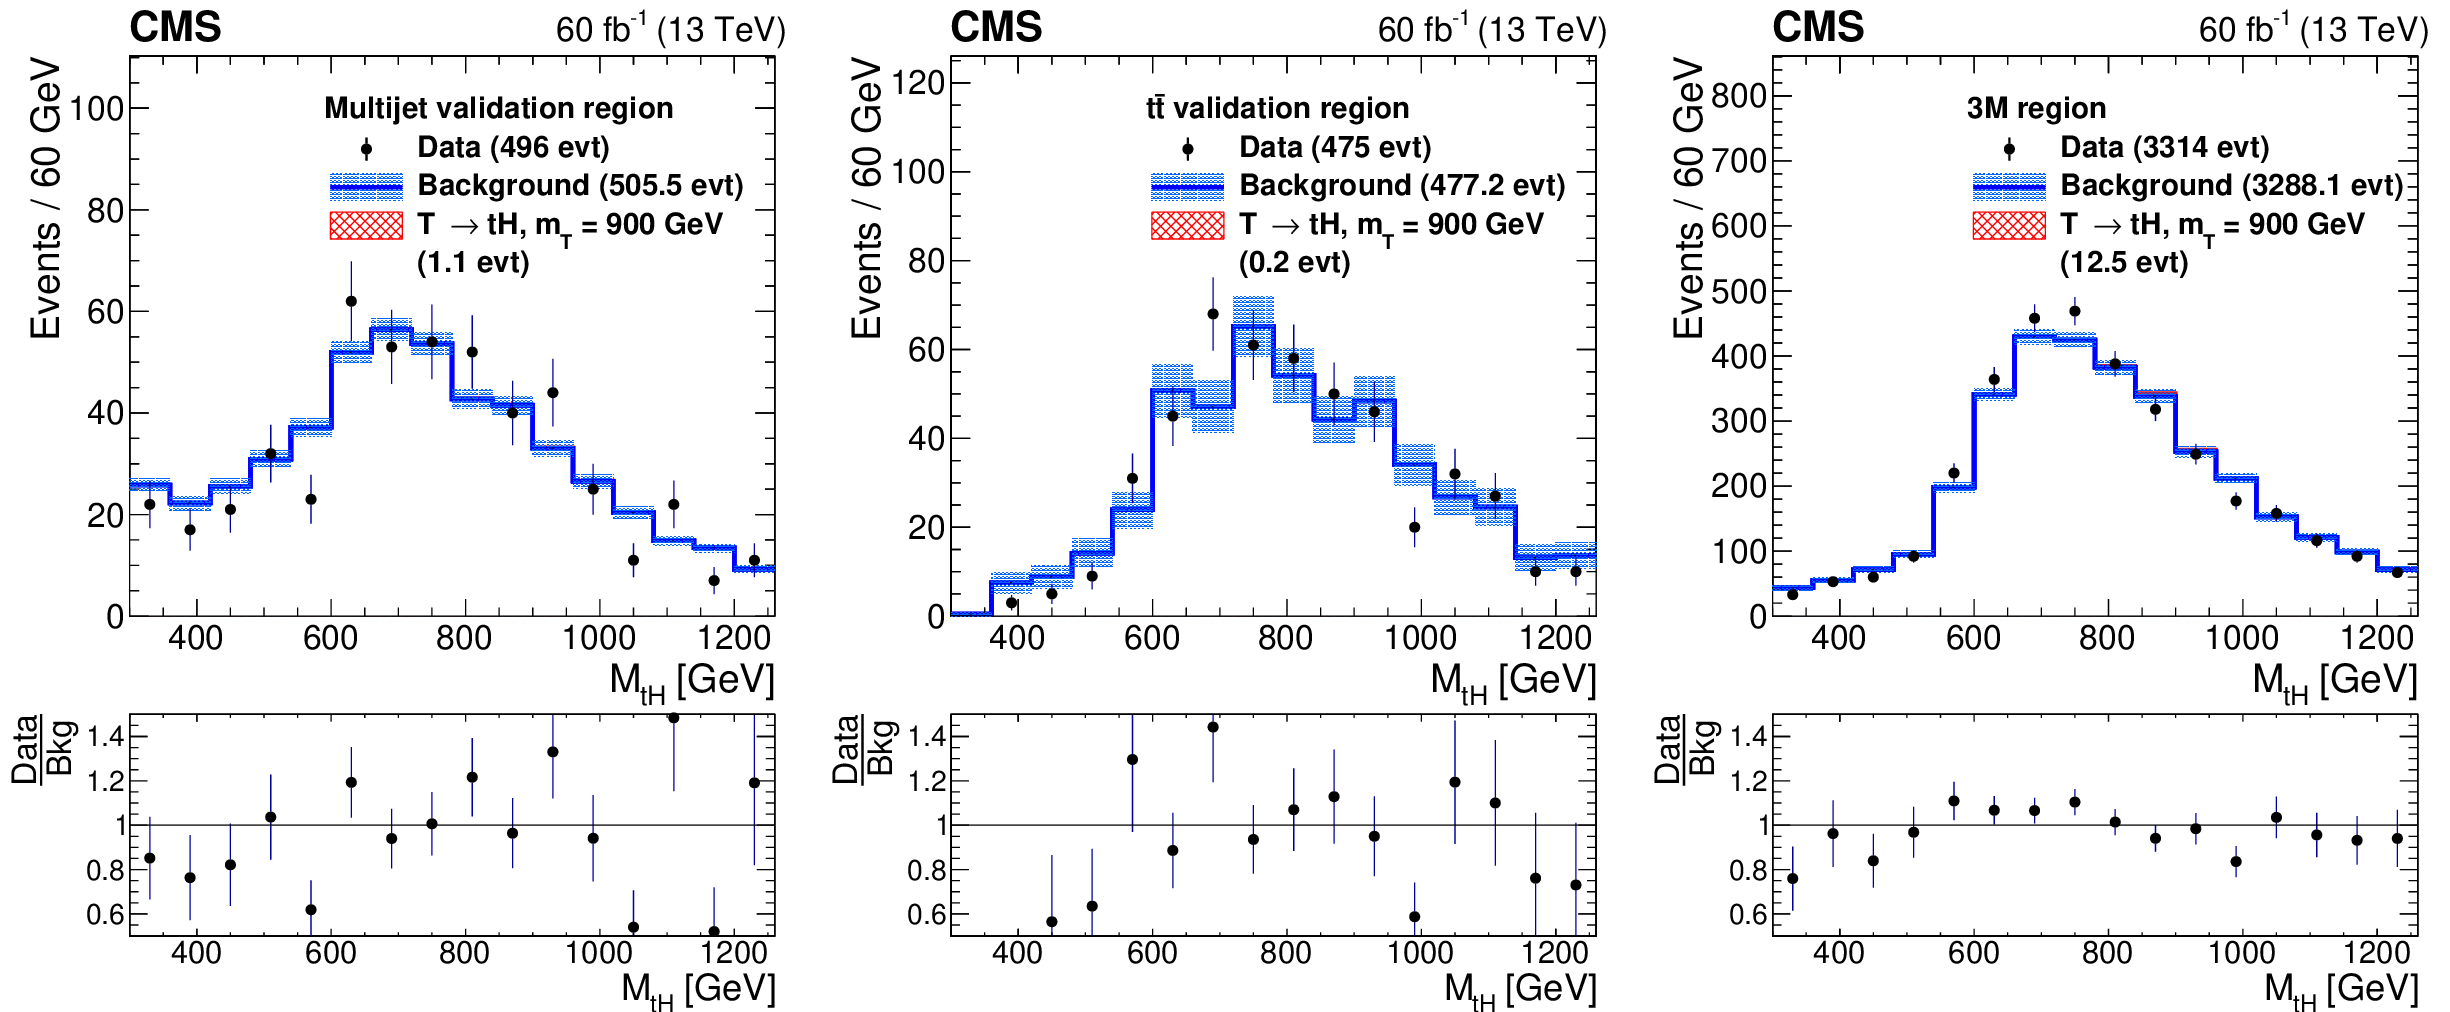
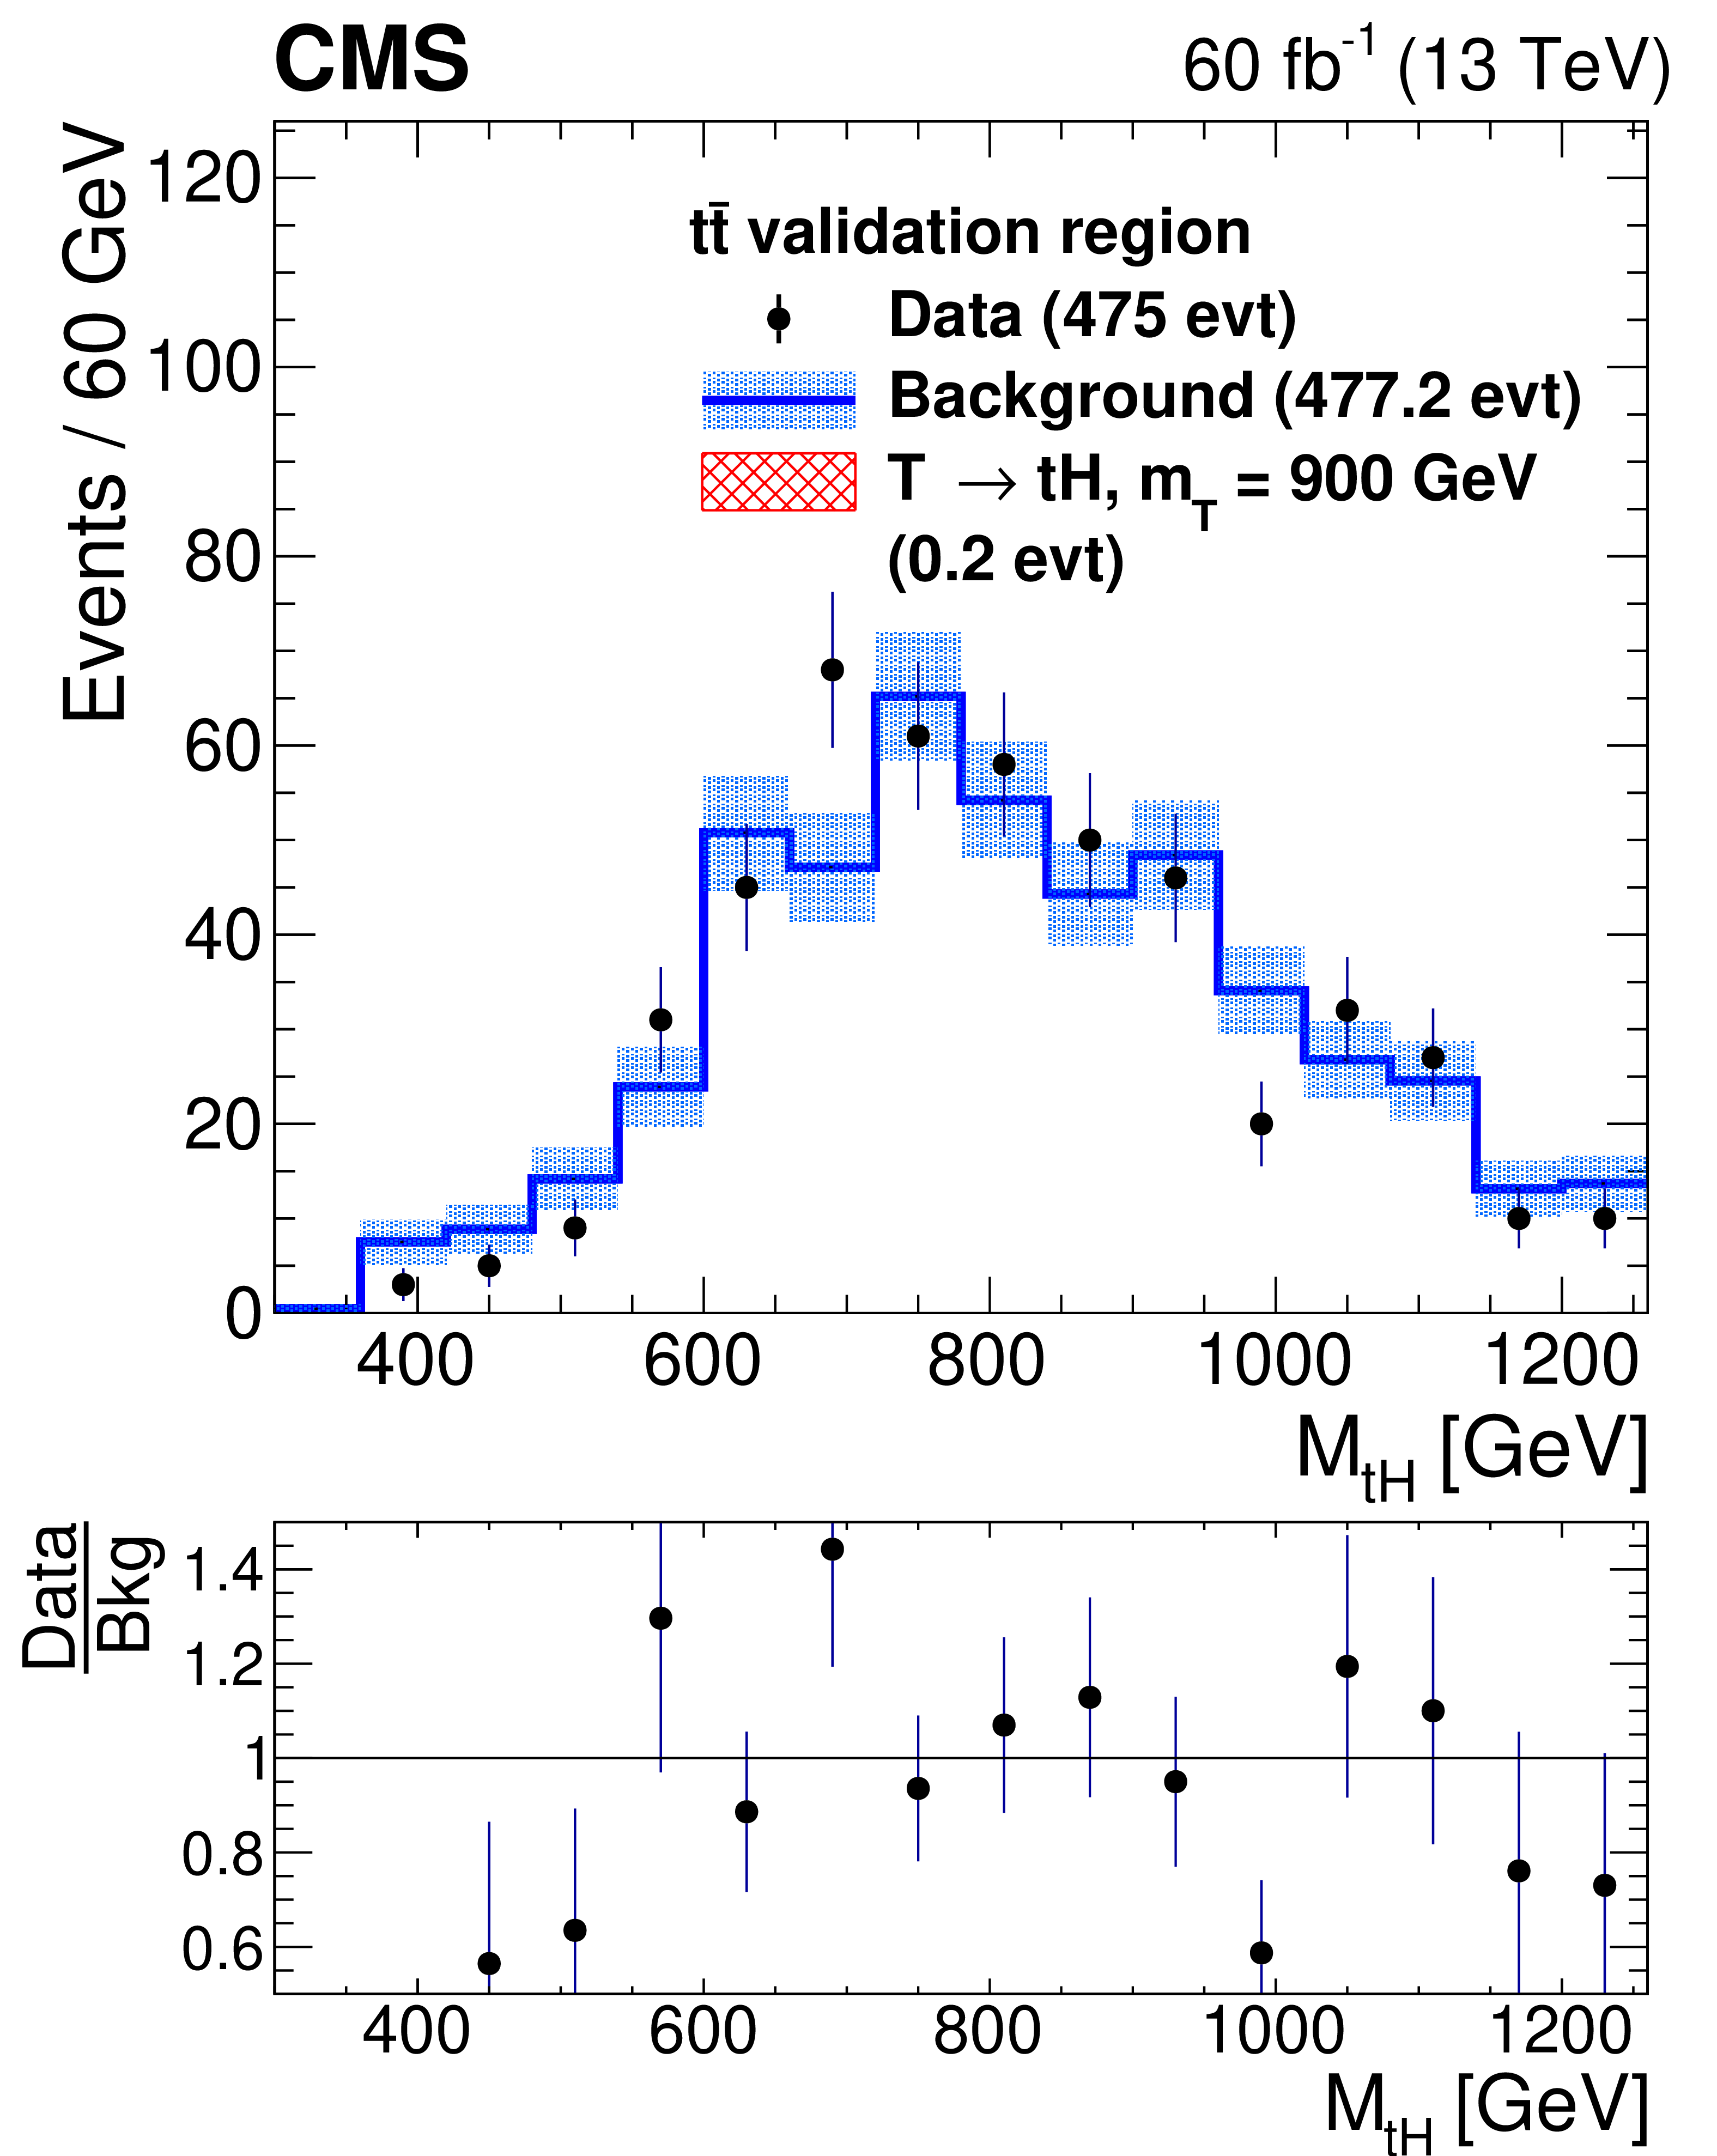
Figure 4:
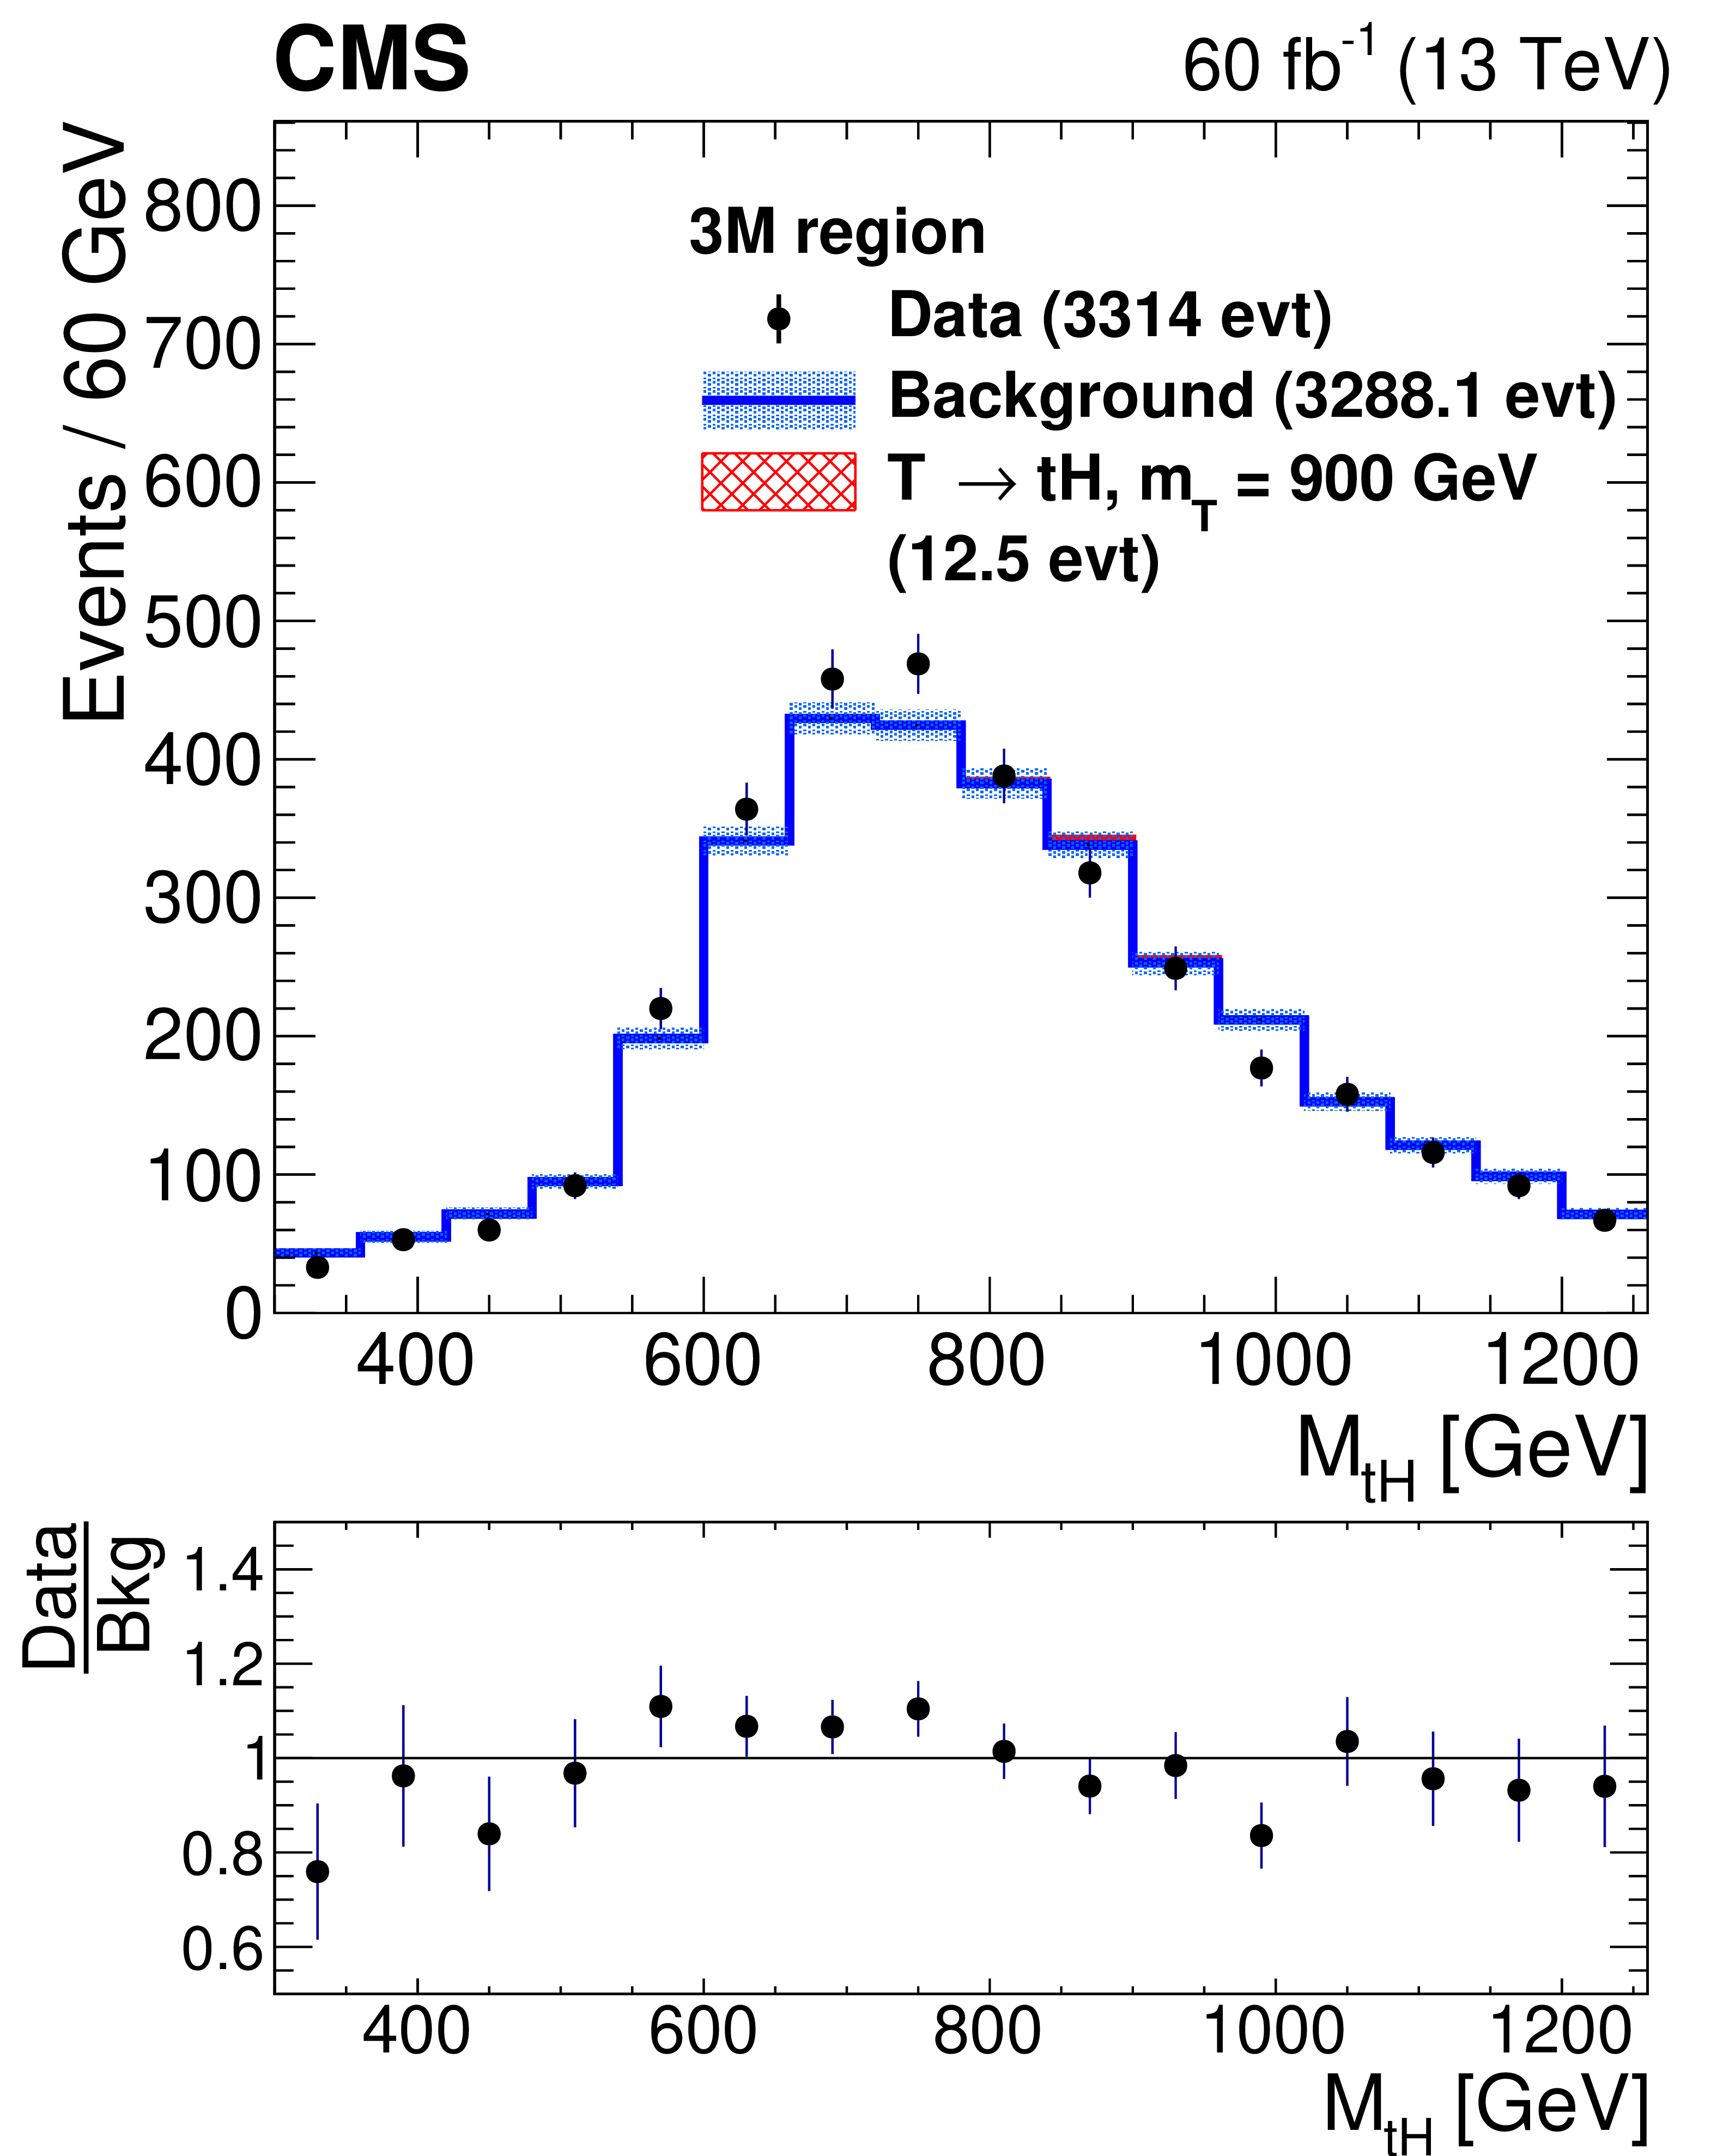
The five-jet invariant mass distribution in the tH channel (black markers) after the high-mass selection in the QCD multijet 3T control region (upper left), the $ \mathrm{t} \overline{\mathrm{t}} $ 2T1L control region (upper right), and the 3M signal region (lower) for the 2018 data. The histograms are the corresponding reweighted 2M1L distributions. The background distribution is normalized to the number of entries in the data. The shaded area corresponds to the statistical uncertainties in the 2M1L control regions. A potential 900 GeV T signal (red cross-hatched histogram) is added to the background histogram demonstrating a negligible contribution. Similar results are observed in the tZ channel, and for the other years, but with slightly larger statistical uncertainties. |

png pdf |
Figure 4-a:
The five-jet invariant mass distribution in the tH channel (black markers) after the high-mass selection in the QCD multijet 3T control region (upper left), the $ \mathrm{t} \overline{\mathrm{t}} $ 2T1L control region (upper right), and the 3M signal region (lower) for the 2018 data. The histograms are the corresponding reweighted 2M1L distributions. The background distribution is normalized to the number of entries in the data. The shaded area corresponds to the statistical uncertainties in the 2M1L control regions. A potential 900 GeV T signal (red cross-hatched histogram) is added to the background histogram demonstrating a negligible contribution. Similar results are observed in the tZ channel, and for the other years, but with slightly larger statistical uncertainties. |
png pdf |
Figure 4-b:
The five-jet invariant mass distribution in the tH channel (black markers) after the high-mass selection in the QCD multijet 3T control region (upper left), the $ \mathrm{t} \overline{\mathrm{t}} $ 2T1L control region (upper right), and the 3M signal region (lower) for the 2018 data. The histograms are the corresponding reweighted 2M1L distributions. The background distribution is normalized to the number of entries in the data. The shaded area corresponds to the statistical uncertainties in the 2M1L control regions. A potential 900 GeV T signal (red cross-hatched histogram) is added to the background histogram demonstrating a negligible contribution. Similar results are observed in the tZ channel, and for the other years, but with slightly larger statistical uncertainties. |
png pdf |
Figure 4-c:
The five-jet invariant mass distribution in the tH channel (black markers) after the high-mass selection in the QCD multijet 3T control region (upper left), the $ \mathrm{t} \overline{\mathrm{t}} $ 2T1L control region (upper right), and the 3M signal region (lower) for the 2018 data. The histograms are the corresponding reweighted 2M1L distributions. The background distribution is normalized to the number of entries in the data. The shaded area corresponds to the statistical uncertainties in the 2M1L control regions. A potential 900 GeV T signal (red cross-hatched histogram) is added to the background histogram demonstrating a negligible contribution. Similar results are observed in the tZ channel, and for the other years, but with slightly larger statistical uncertainties. |

png pdf |
Figure 5:
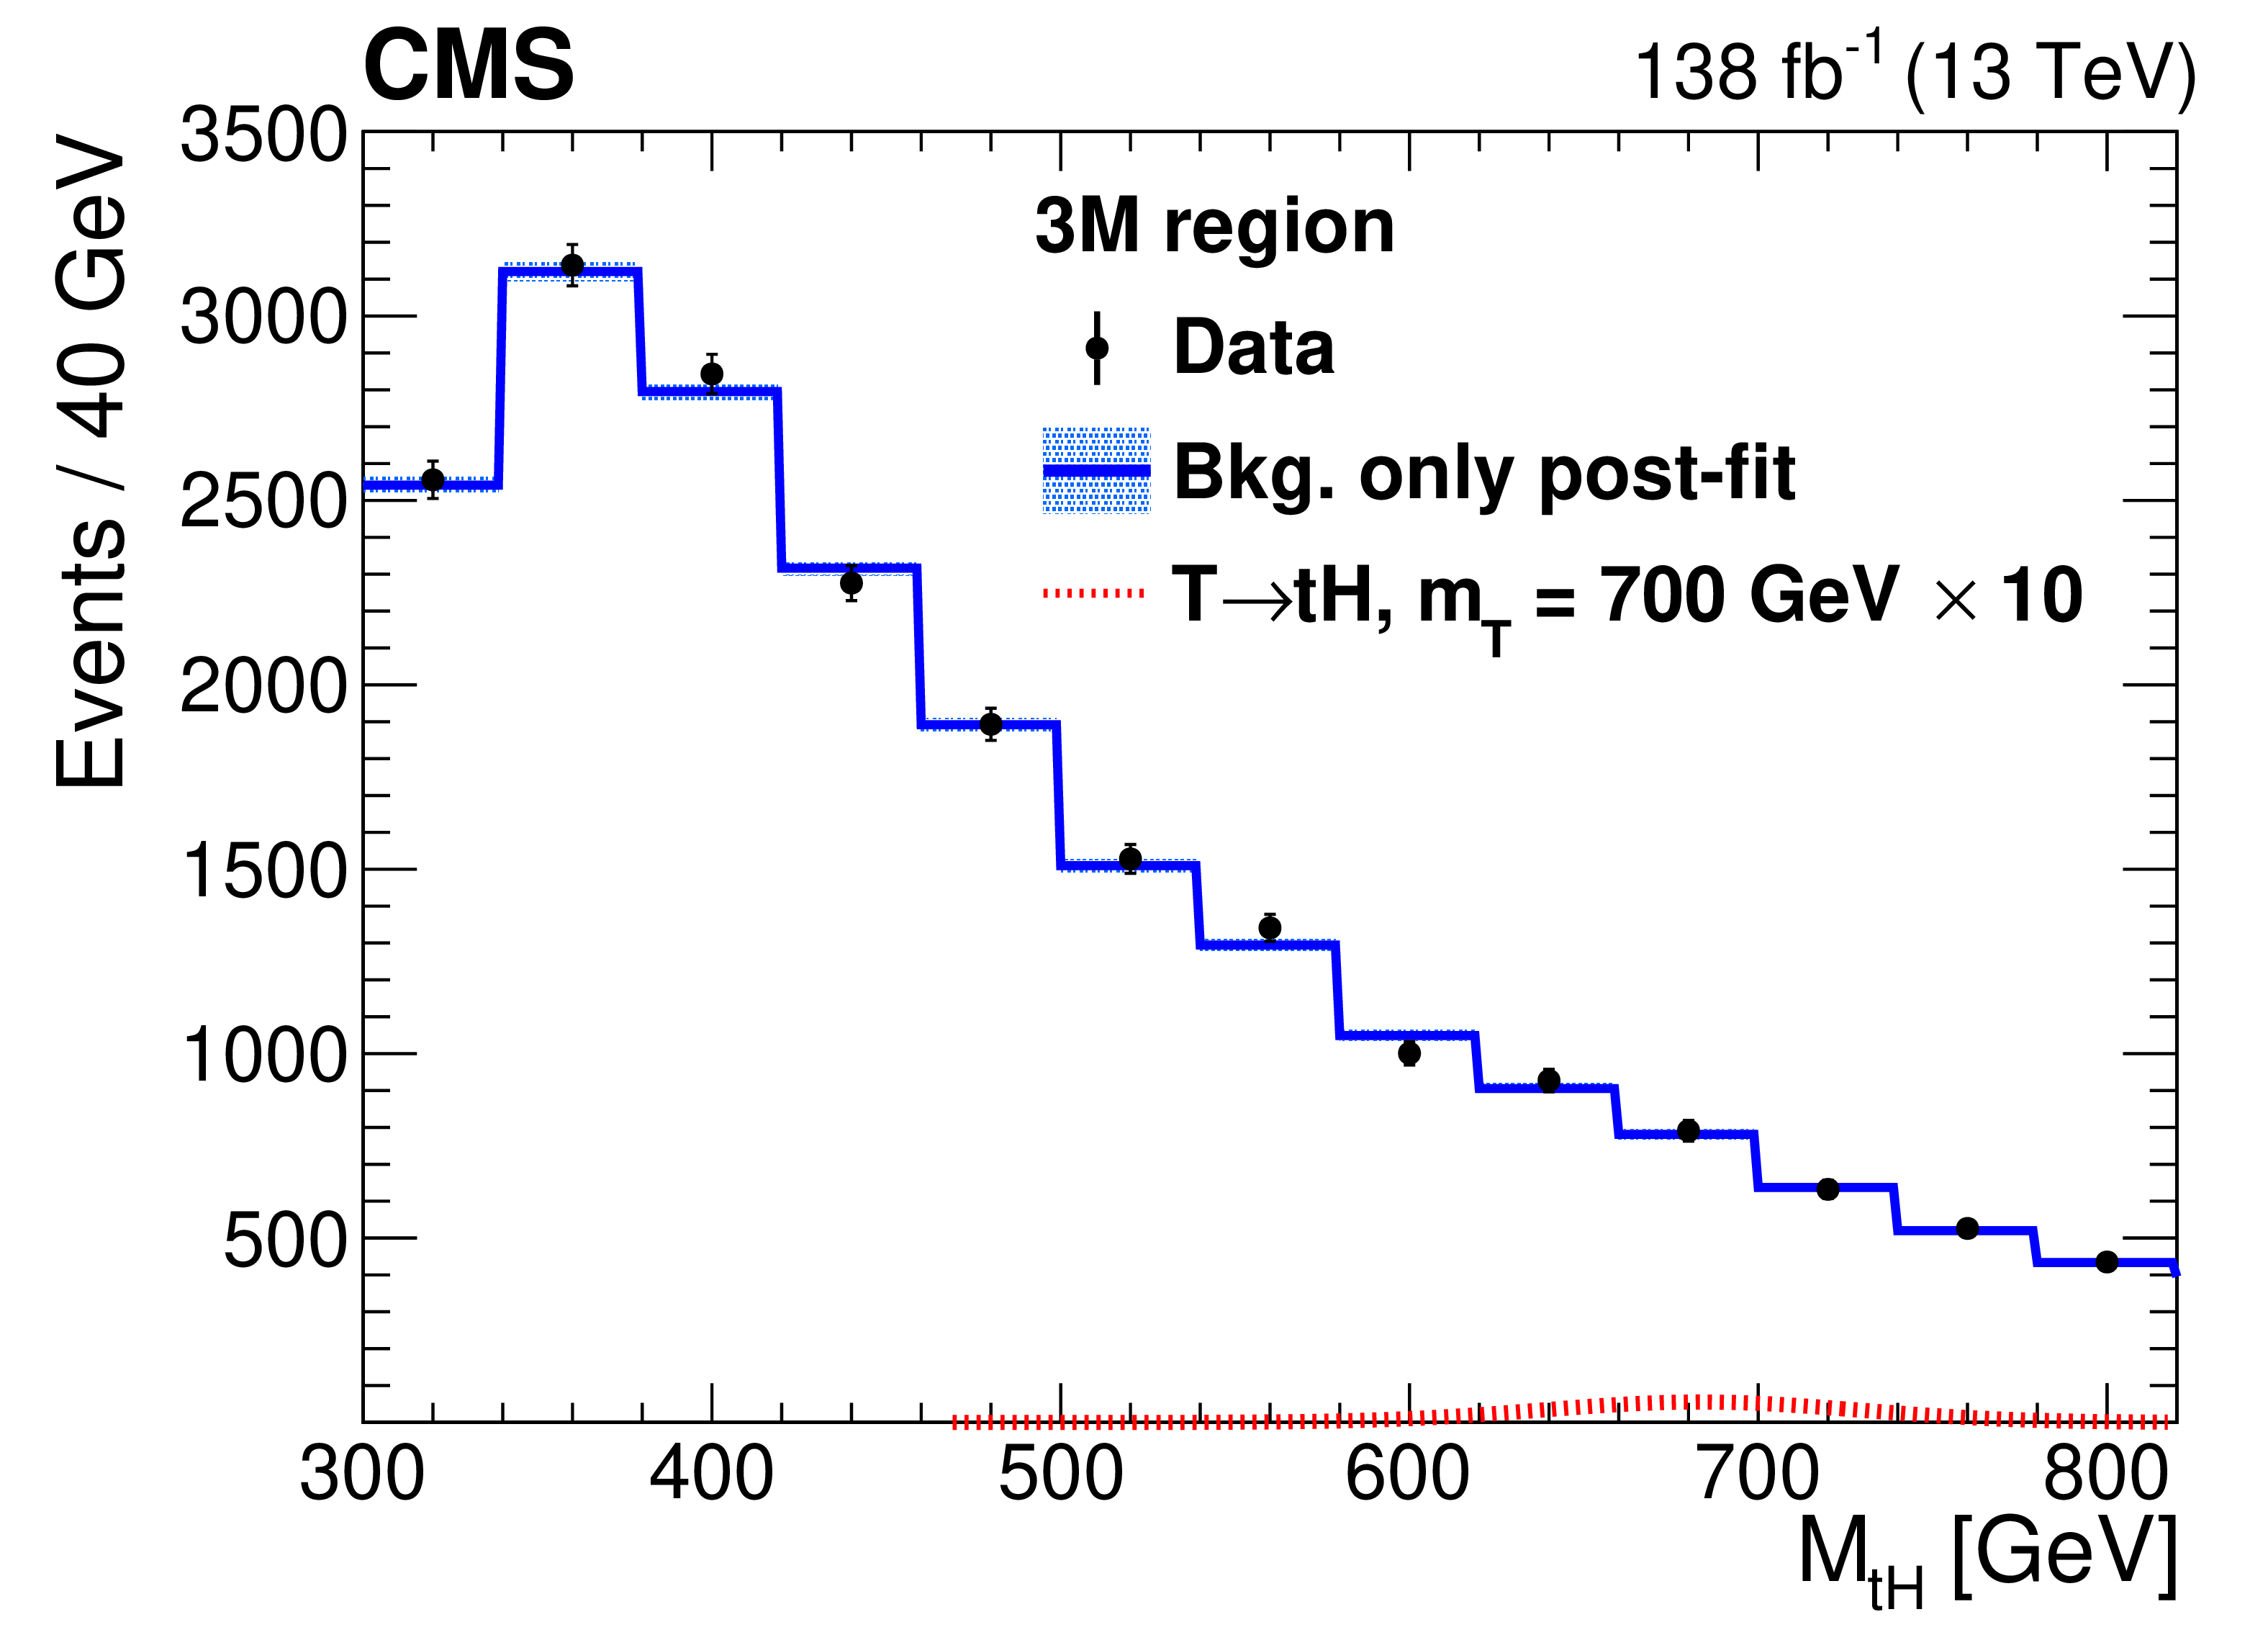
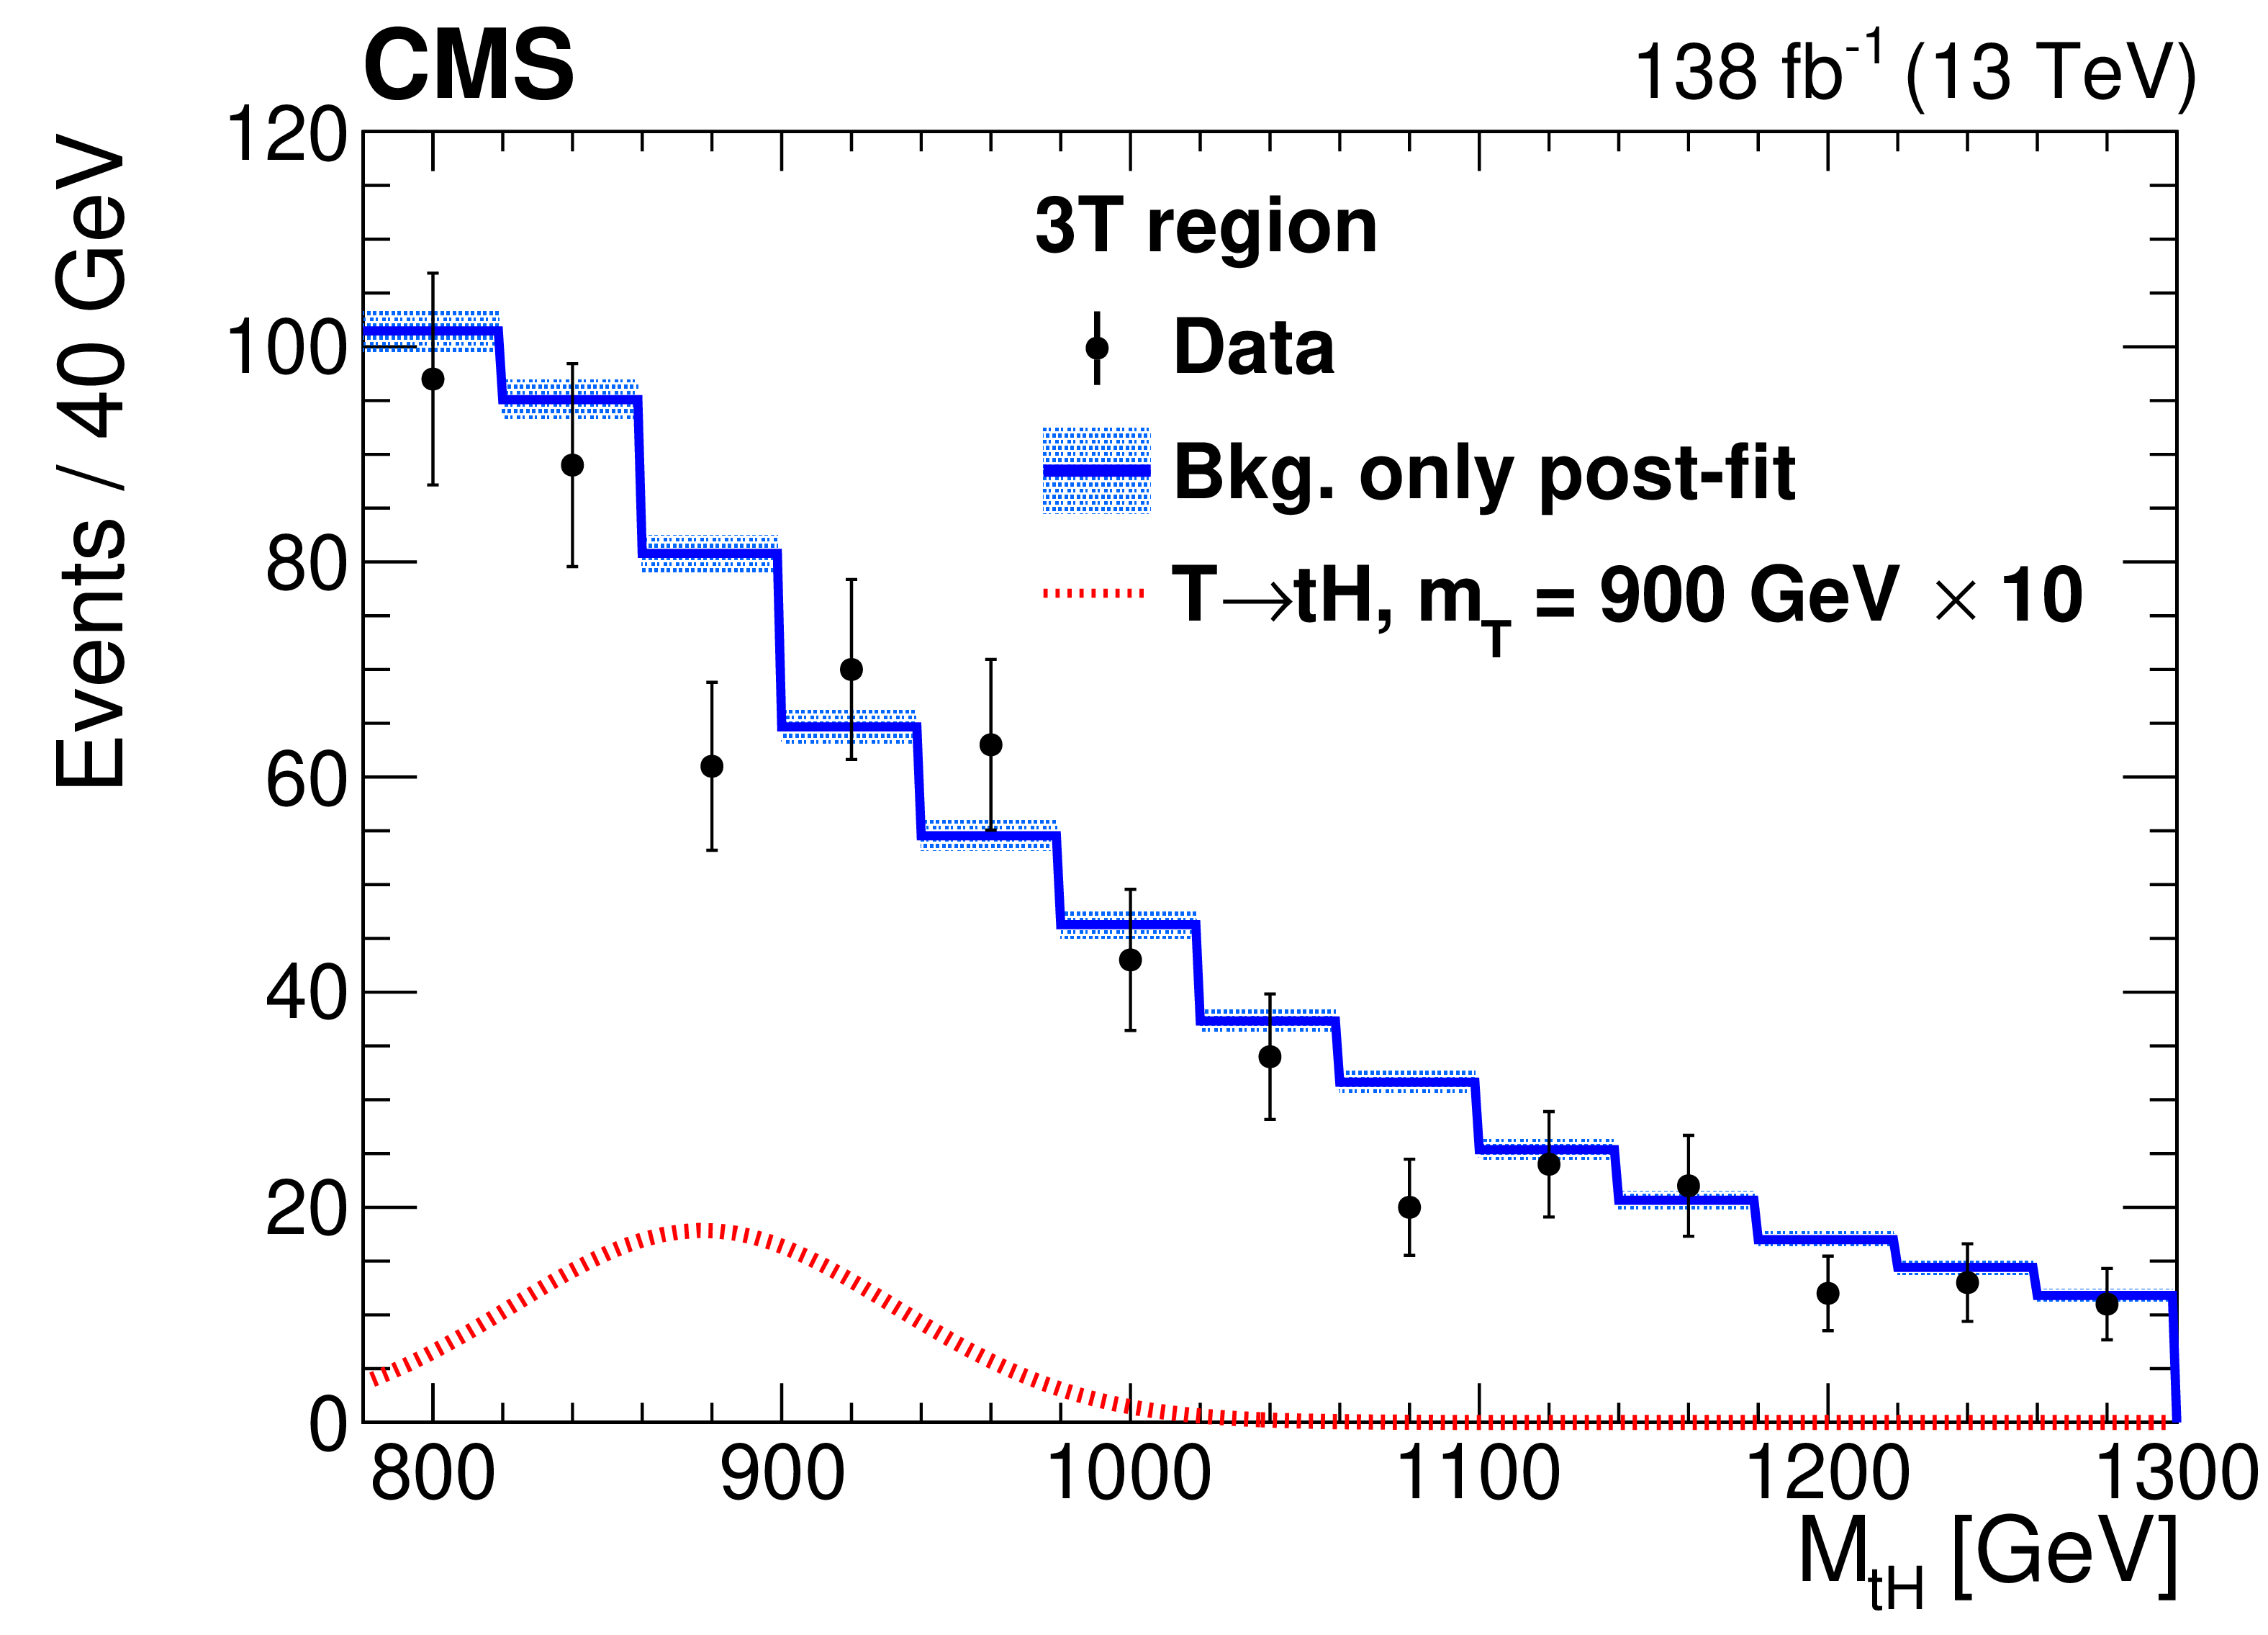
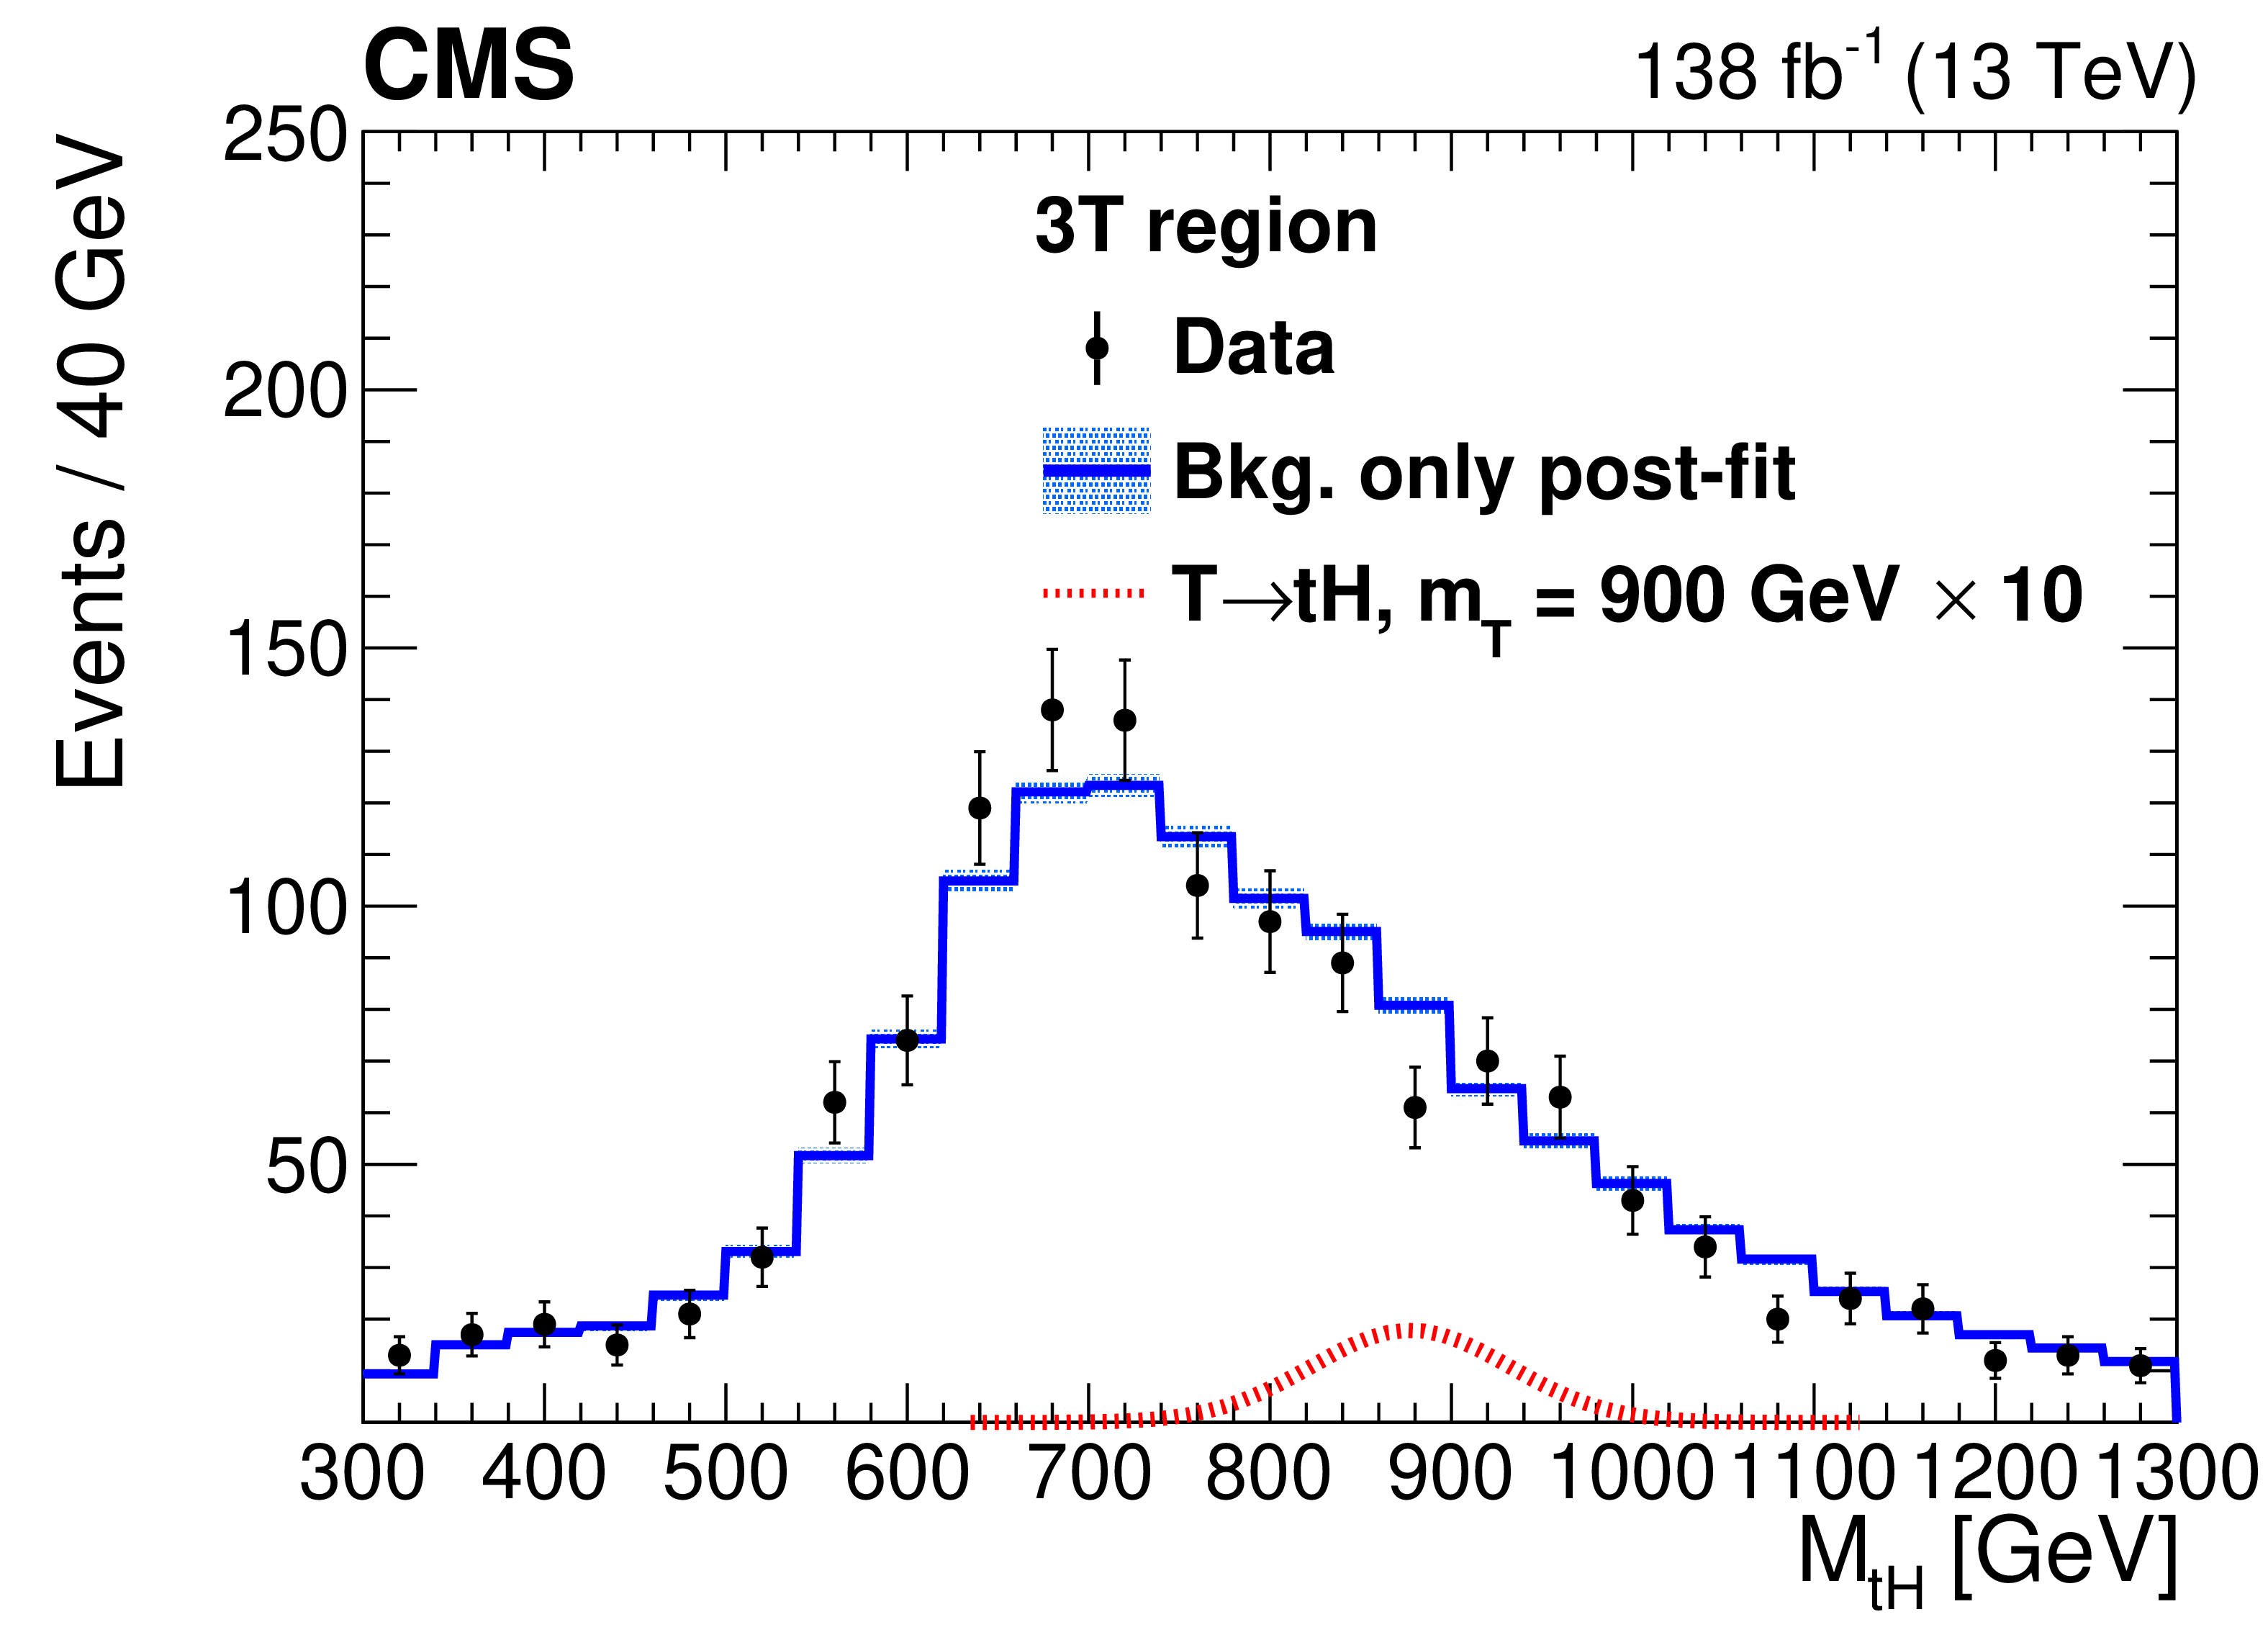
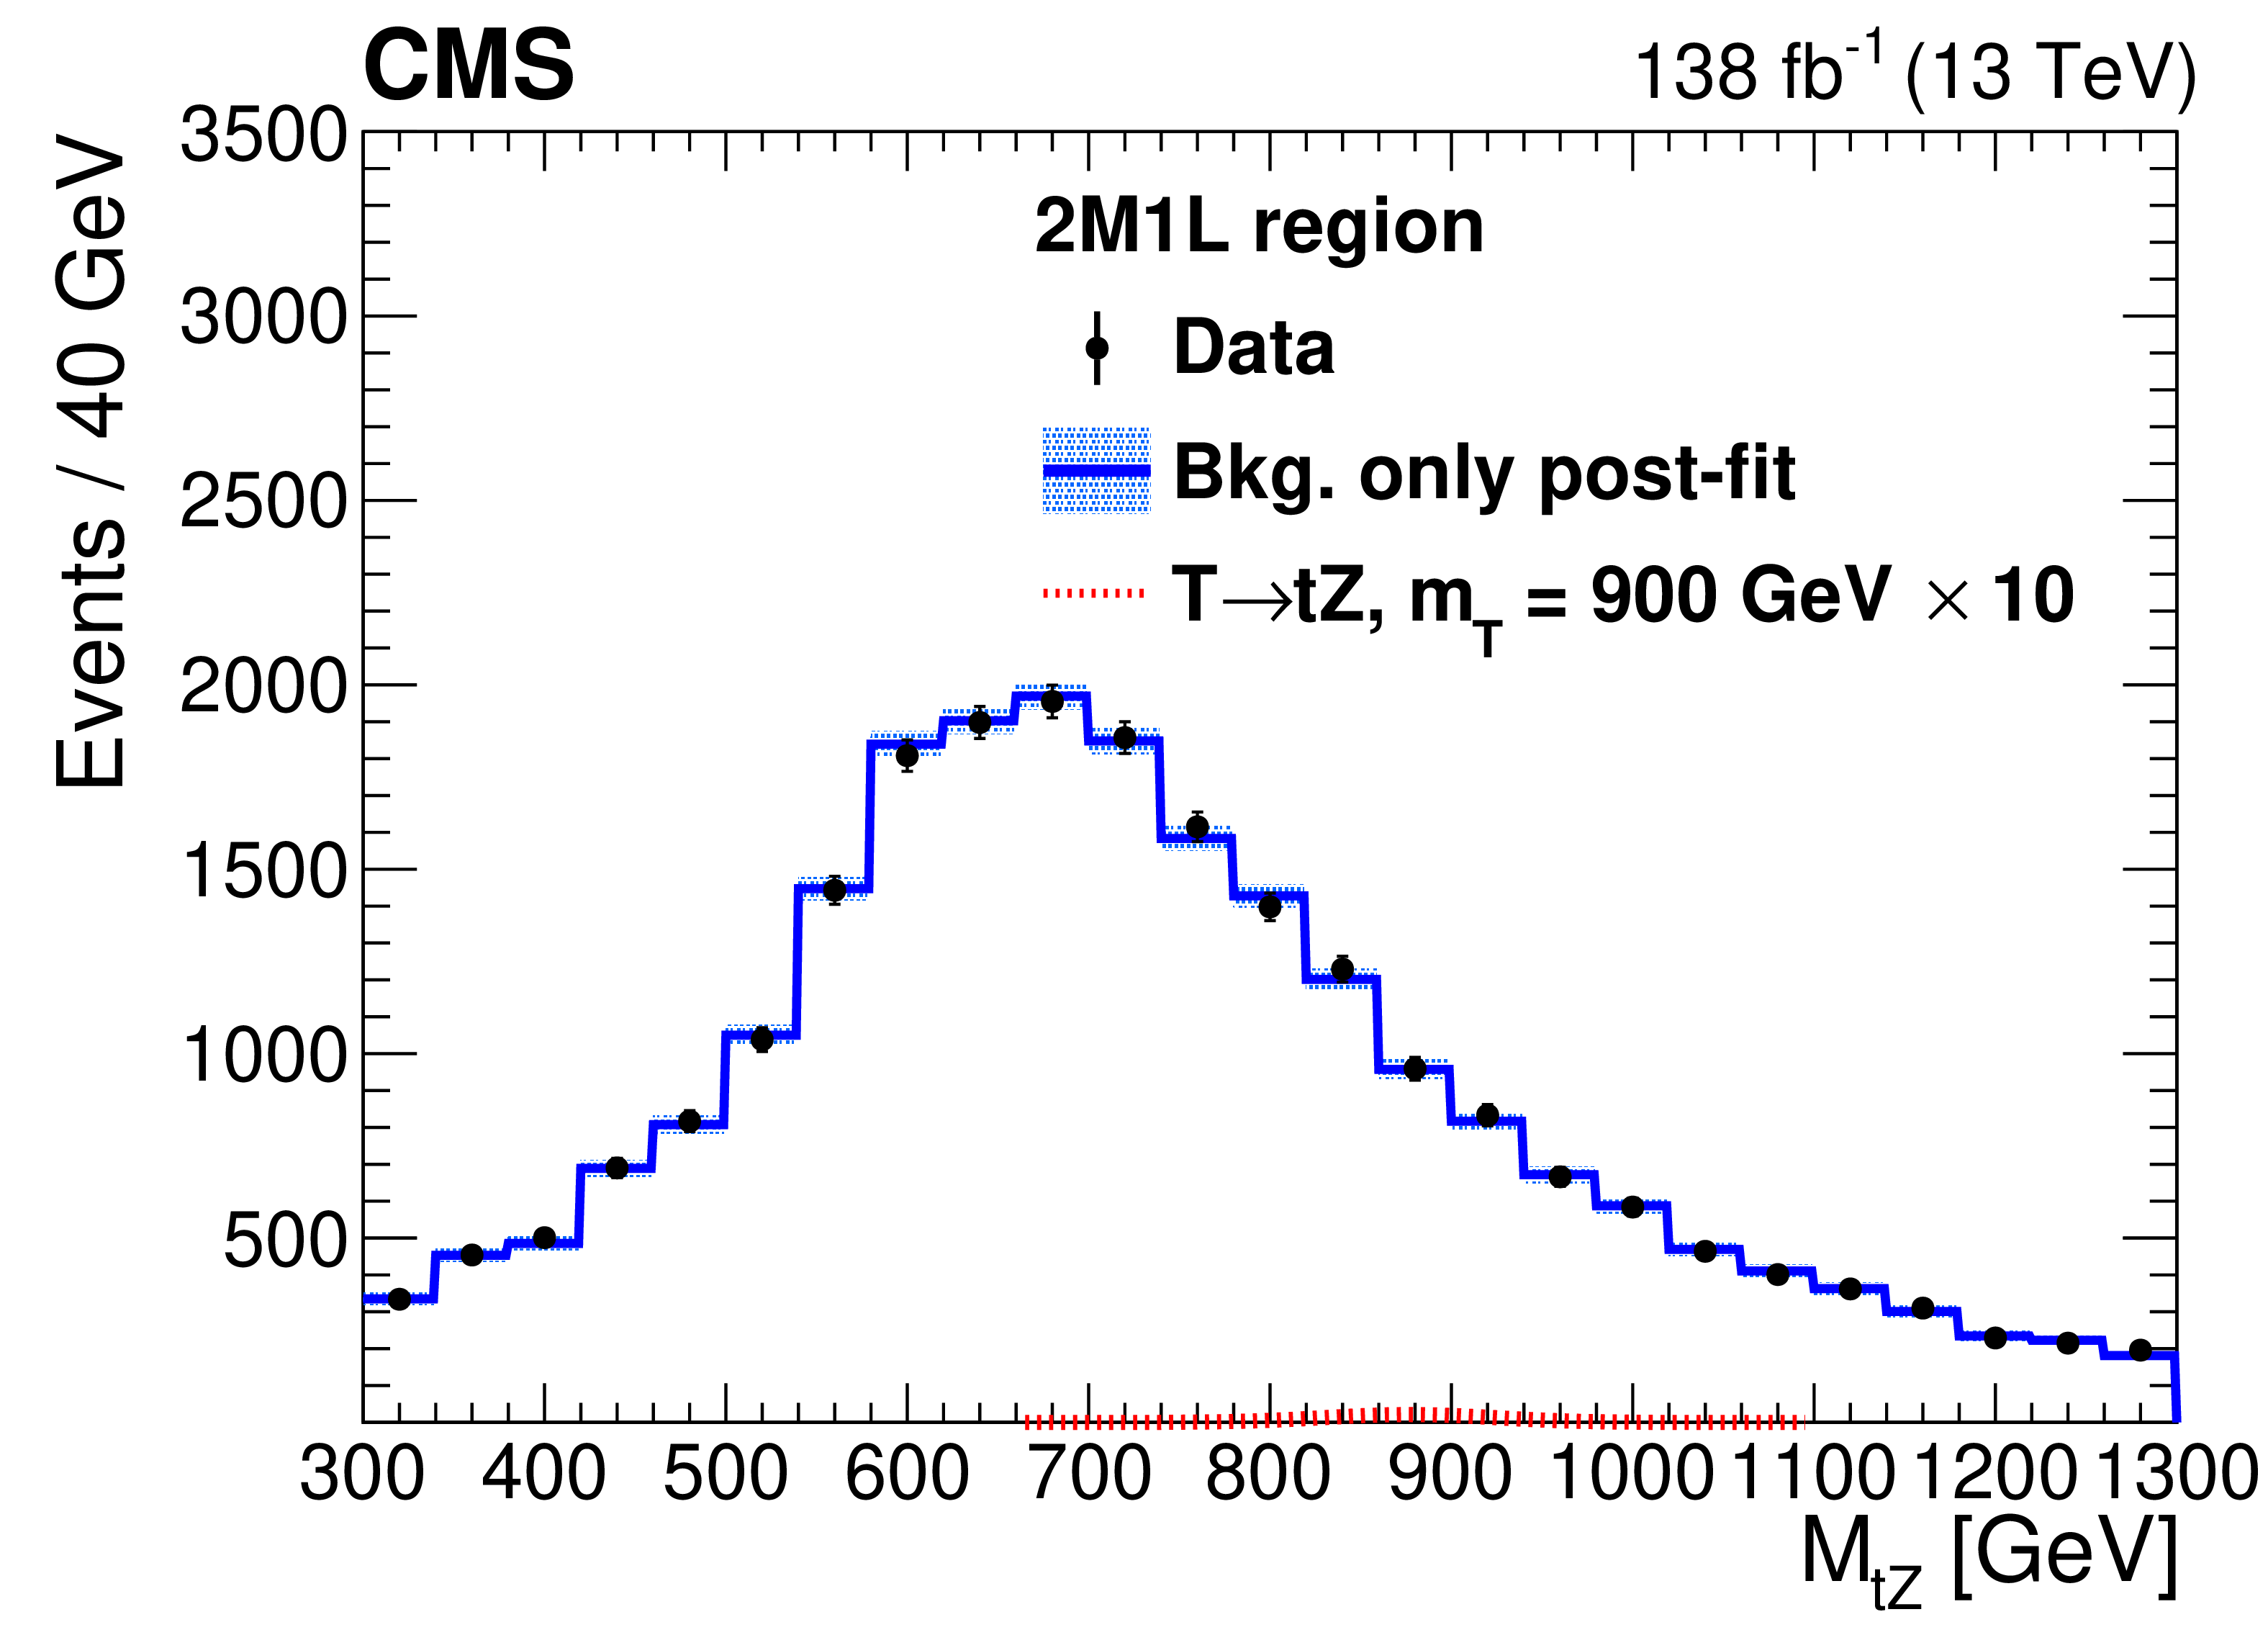
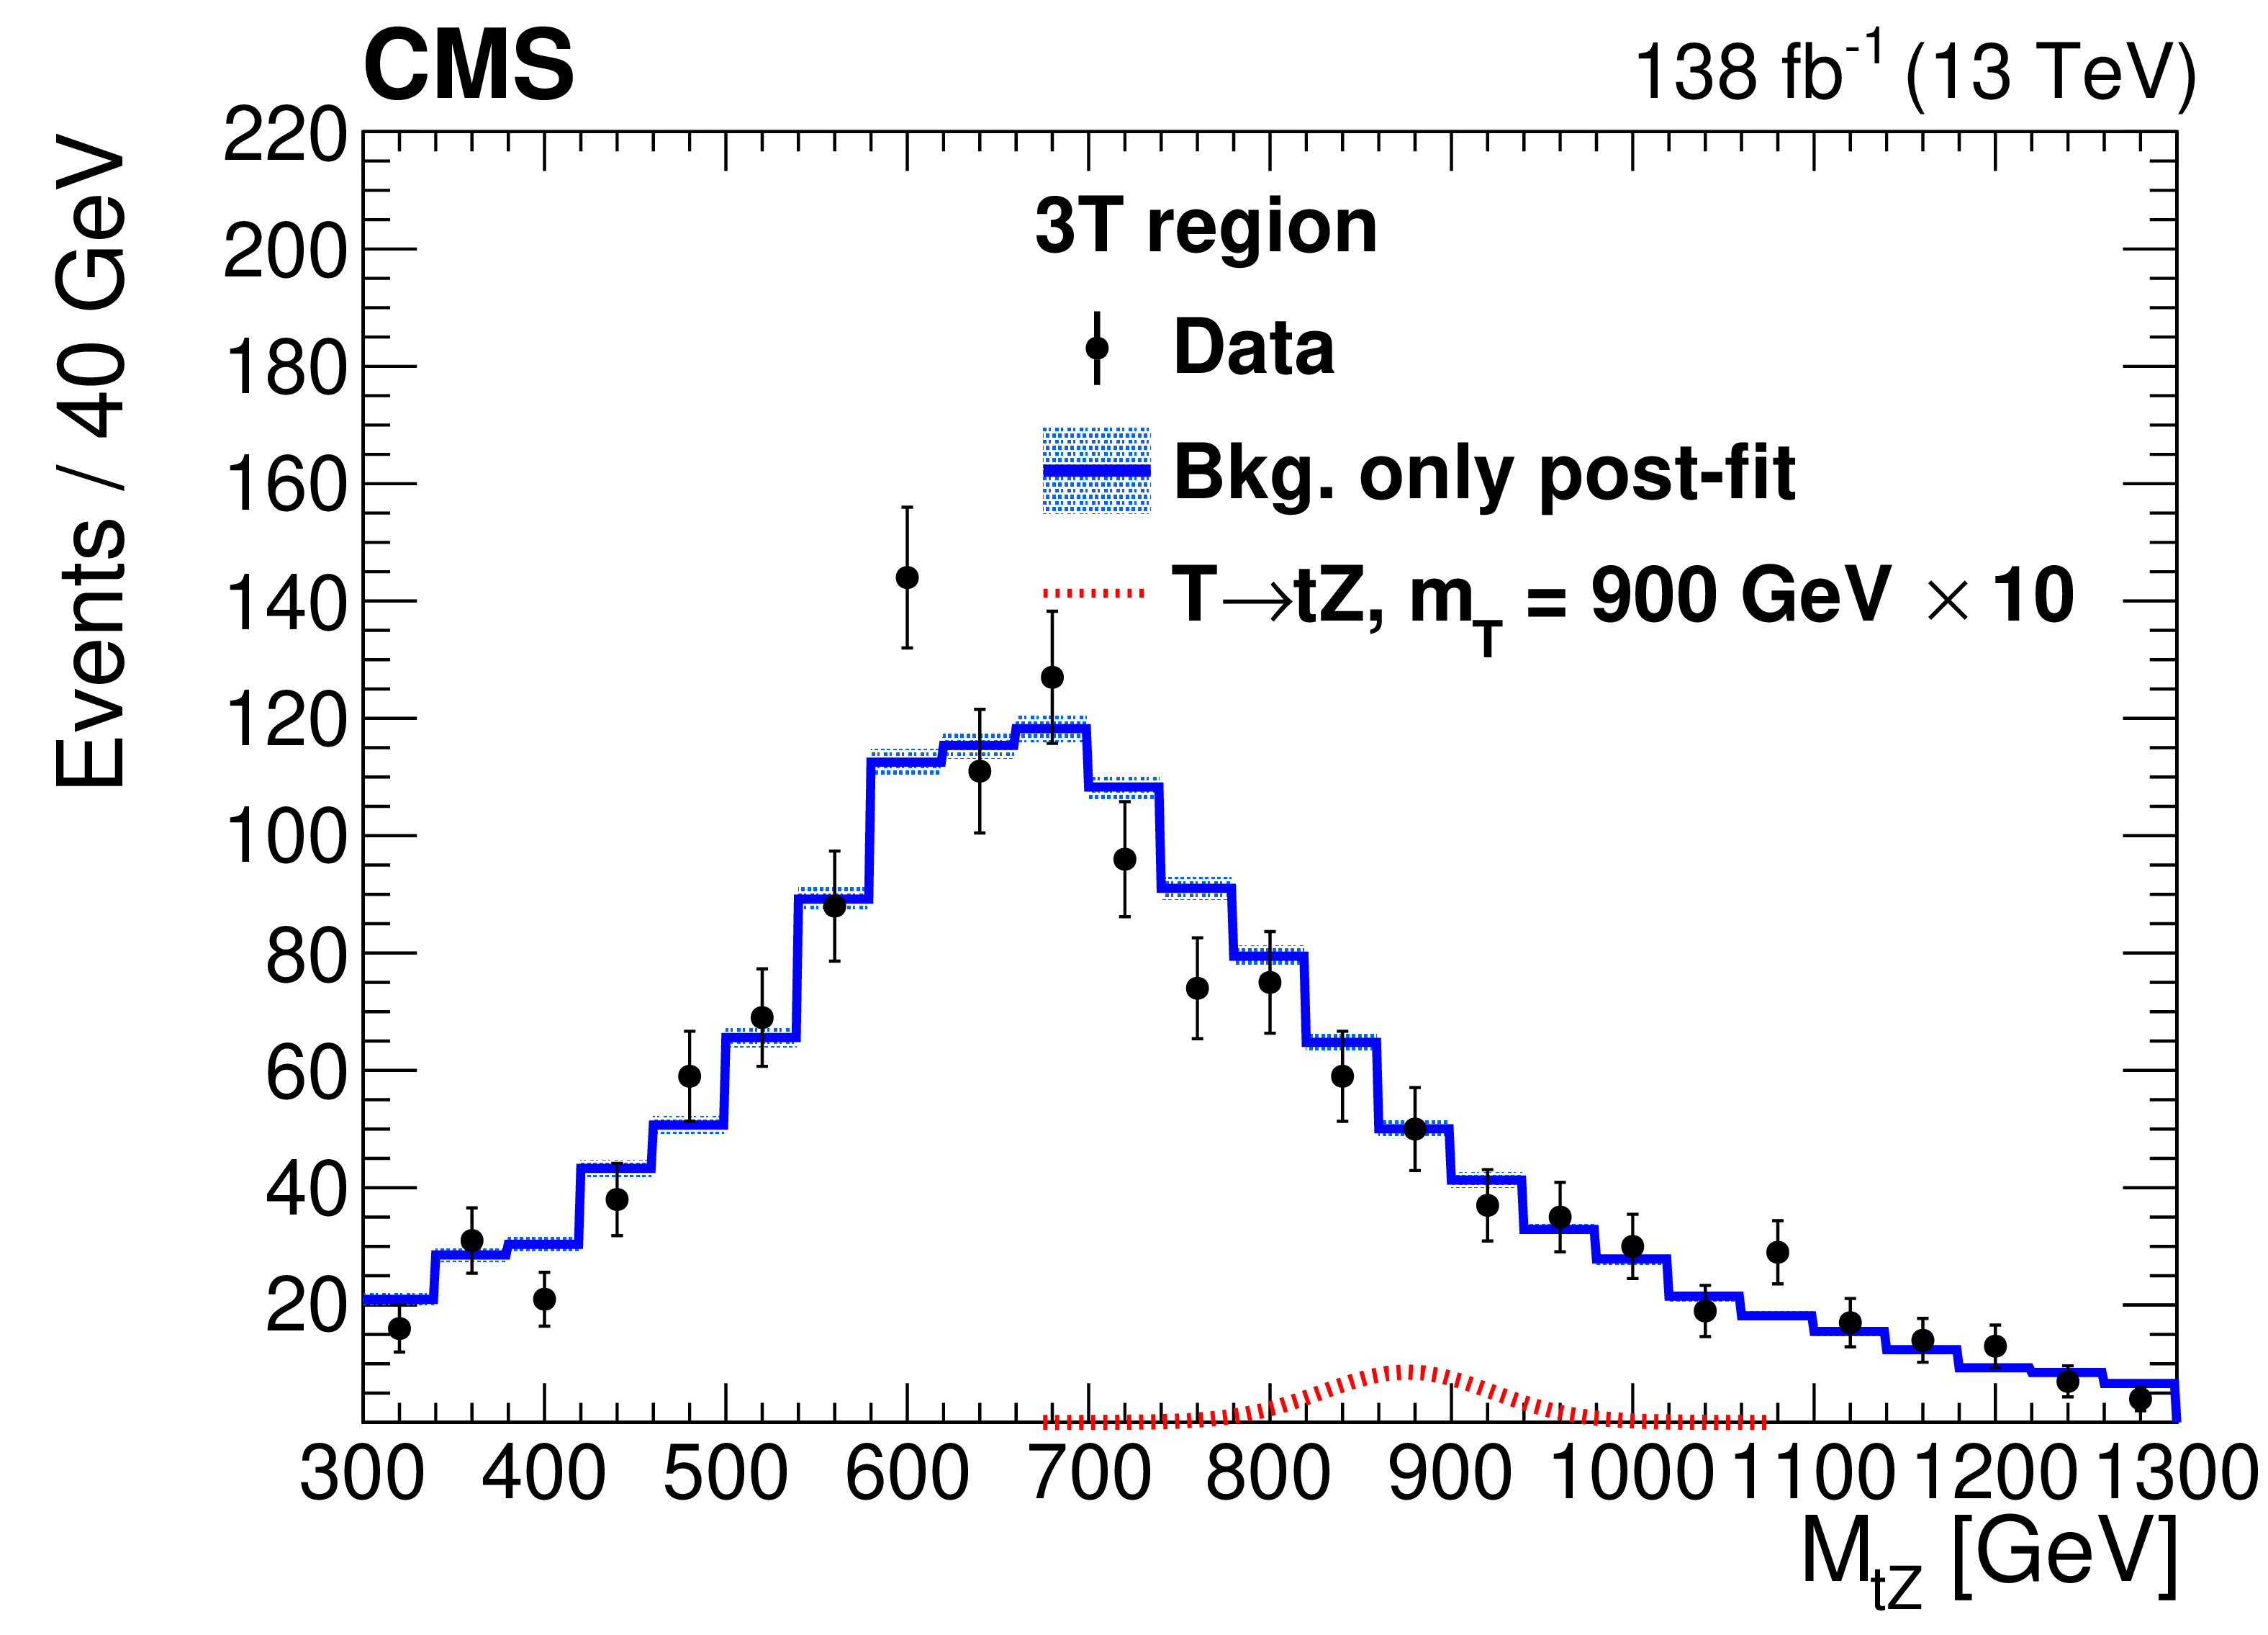
Five-jet invariant mass distributions after a background-only fit (blue histogram) to the complete dataset (black markers) in the 2M1L (upper), 3M (middle), and 3T (lower) regions for low-mass (left) and the high-mass (right) selections. The dashed blue band represents the uncertainty on the fitted background estimate, and red dashed line shows the expected signal distribution for a 700 GeV (low-mass selection) and a 900 GeV (high-mass selection) T quark. The fit is performed on the combined data from all three years in the all-tH channel. |

png pdf |
Figure 5-a:
Five-jet invariant mass distributions after a background-only fit (blue histogram) to the complete dataset (black markers) in the 2M1L (upper), 3M (middle), and 3T (lower) regions for low-mass (left) and the high-mass (right) selections. The dashed blue band represents the uncertainty on the fitted background estimate, and red dashed line shows the expected signal distribution for a 700 GeV (low-mass selection) and a 900 GeV (high-mass selection) T quark. The fit is performed on the combined data from all three years in the all-tH channel. |

png pdf |
Figure 5-b:
Five-jet invariant mass distributions after a background-only fit (blue histogram) to the complete dataset (black markers) in the 2M1L (upper), 3M (middle), and 3T (lower) regions for low-mass (left) and the high-mass (right) selections. The dashed blue band represents the uncertainty on the fitted background estimate, and red dashed line shows the expected signal distribution for a 700 GeV (low-mass selection) and a 900 GeV (high-mass selection) T quark. The fit is performed on the combined data from all three years in the all-tH channel. |
png pdf |
Figure 5-c:
Five-jet invariant mass distributions after a background-only fit (blue histogram) to the complete dataset (black markers) in the 2M1L (upper), 3M (middle), and 3T (lower) regions for low-mass (left) and the high-mass (right) selections. The dashed blue band represents the uncertainty on the fitted background estimate, and red dashed line shows the expected signal distribution for a 700 GeV (low-mass selection) and a 900 GeV (high-mass selection) T quark. The fit is performed on the combined data from all three years in the all-tH channel. |

png pdf |
Figure 5-d:
Five-jet invariant mass distributions after a background-only fit (blue histogram) to the complete dataset (black markers) in the 2M1L (upper), 3M (middle), and 3T (lower) regions for low-mass (left) and the high-mass (right) selections. The dashed blue band represents the uncertainty on the fitted background estimate, and red dashed line shows the expected signal distribution for a 700 GeV (low-mass selection) and a 900 GeV (high-mass selection) T quark. The fit is performed on the combined data from all three years in the all-tH channel. |

png pdf |
Figure 5-e:
Five-jet invariant mass distributions after a background-only fit (blue histogram) to the complete dataset (black markers) in the 2M1L (upper), 3M (middle), and 3T (lower) regions for low-mass (left) and the high-mass (right) selections. The dashed blue band represents the uncertainty on the fitted background estimate, and red dashed line shows the expected signal distribution for a 700 GeV (low-mass selection) and a 900 GeV (high-mass selection) T quark. The fit is performed on the combined data from all three years in the all-tH channel. |
png pdf |
Figure 5-f:
Five-jet invariant mass distributions after a background-only fit (blue histogram) to the complete dataset (black markers) in the 2M1L (upper), 3M (middle), and 3T (lower) regions for low-mass (left) and the high-mass (right) selections. The dashed blue band represents the uncertainty on the fitted background estimate, and red dashed line shows the expected signal distribution for a 700 GeV (low-mass selection) and a 900 GeV (high-mass selection) T quark. The fit is performed on the combined data from all three years in the all-tH channel. |

png pdf |
Figure 6:
Observed $ p $-values when considering the tH channel for each year and their combination. |

png pdf |
Figure 7:
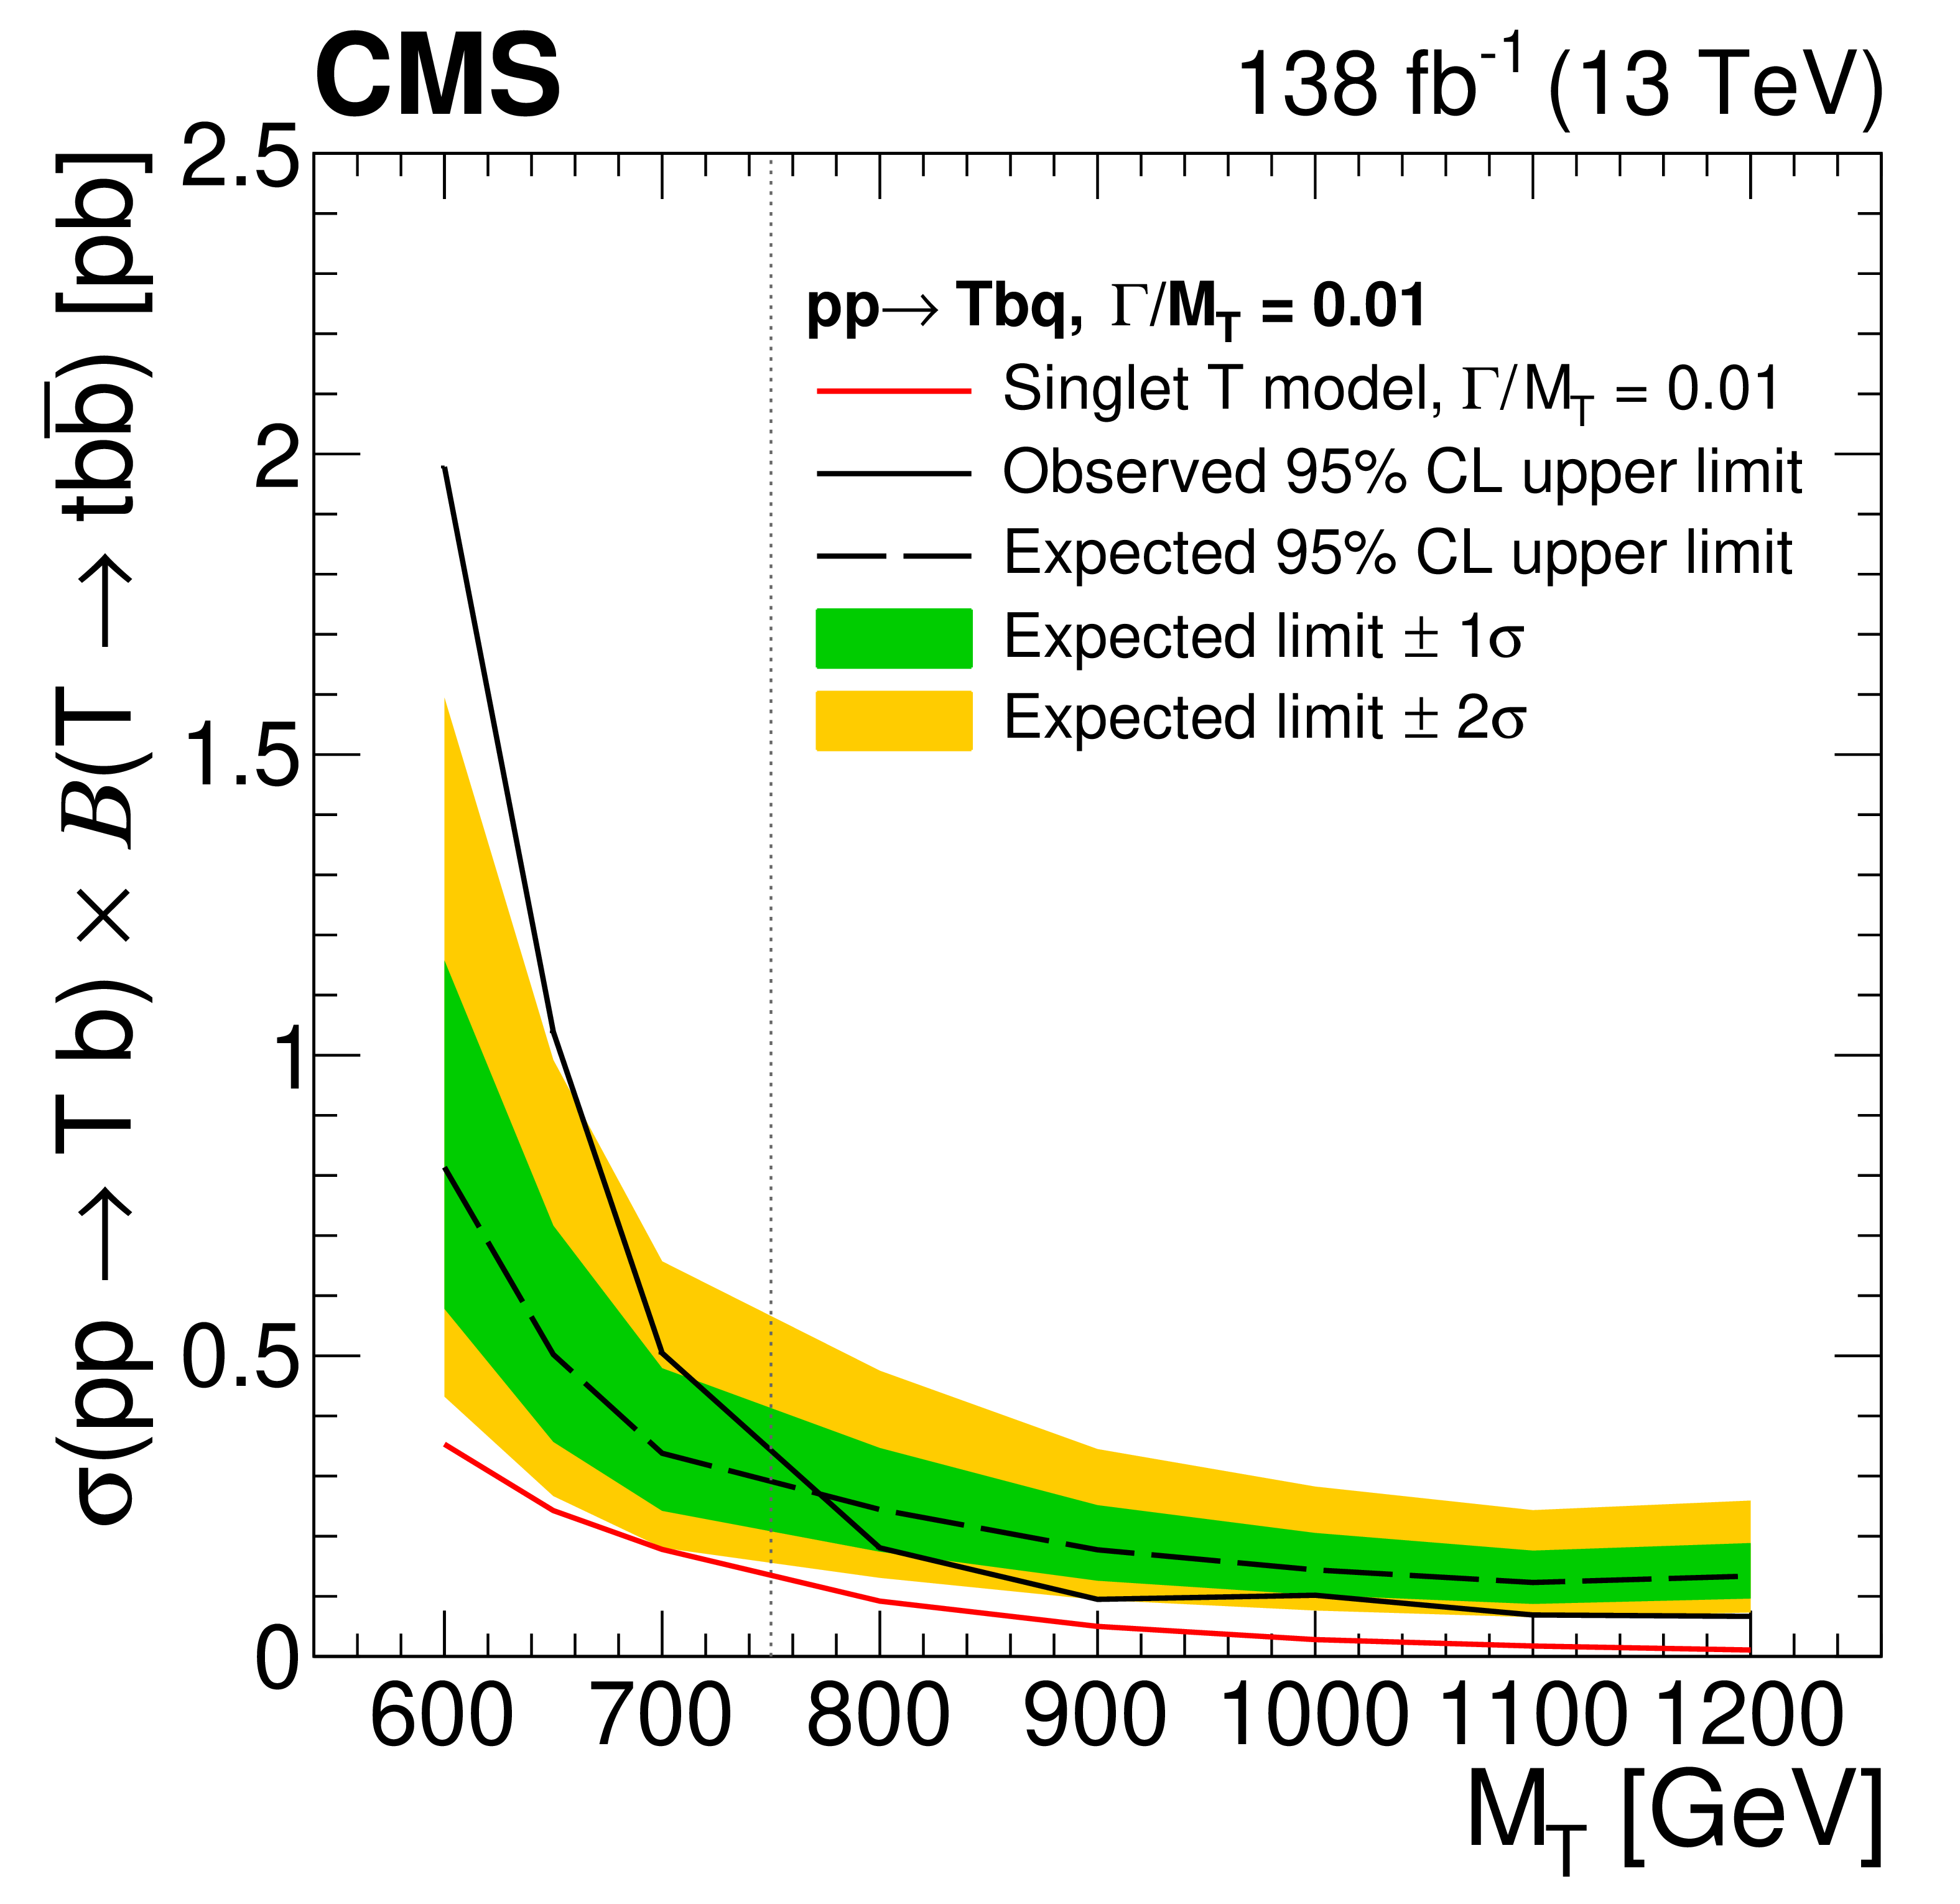
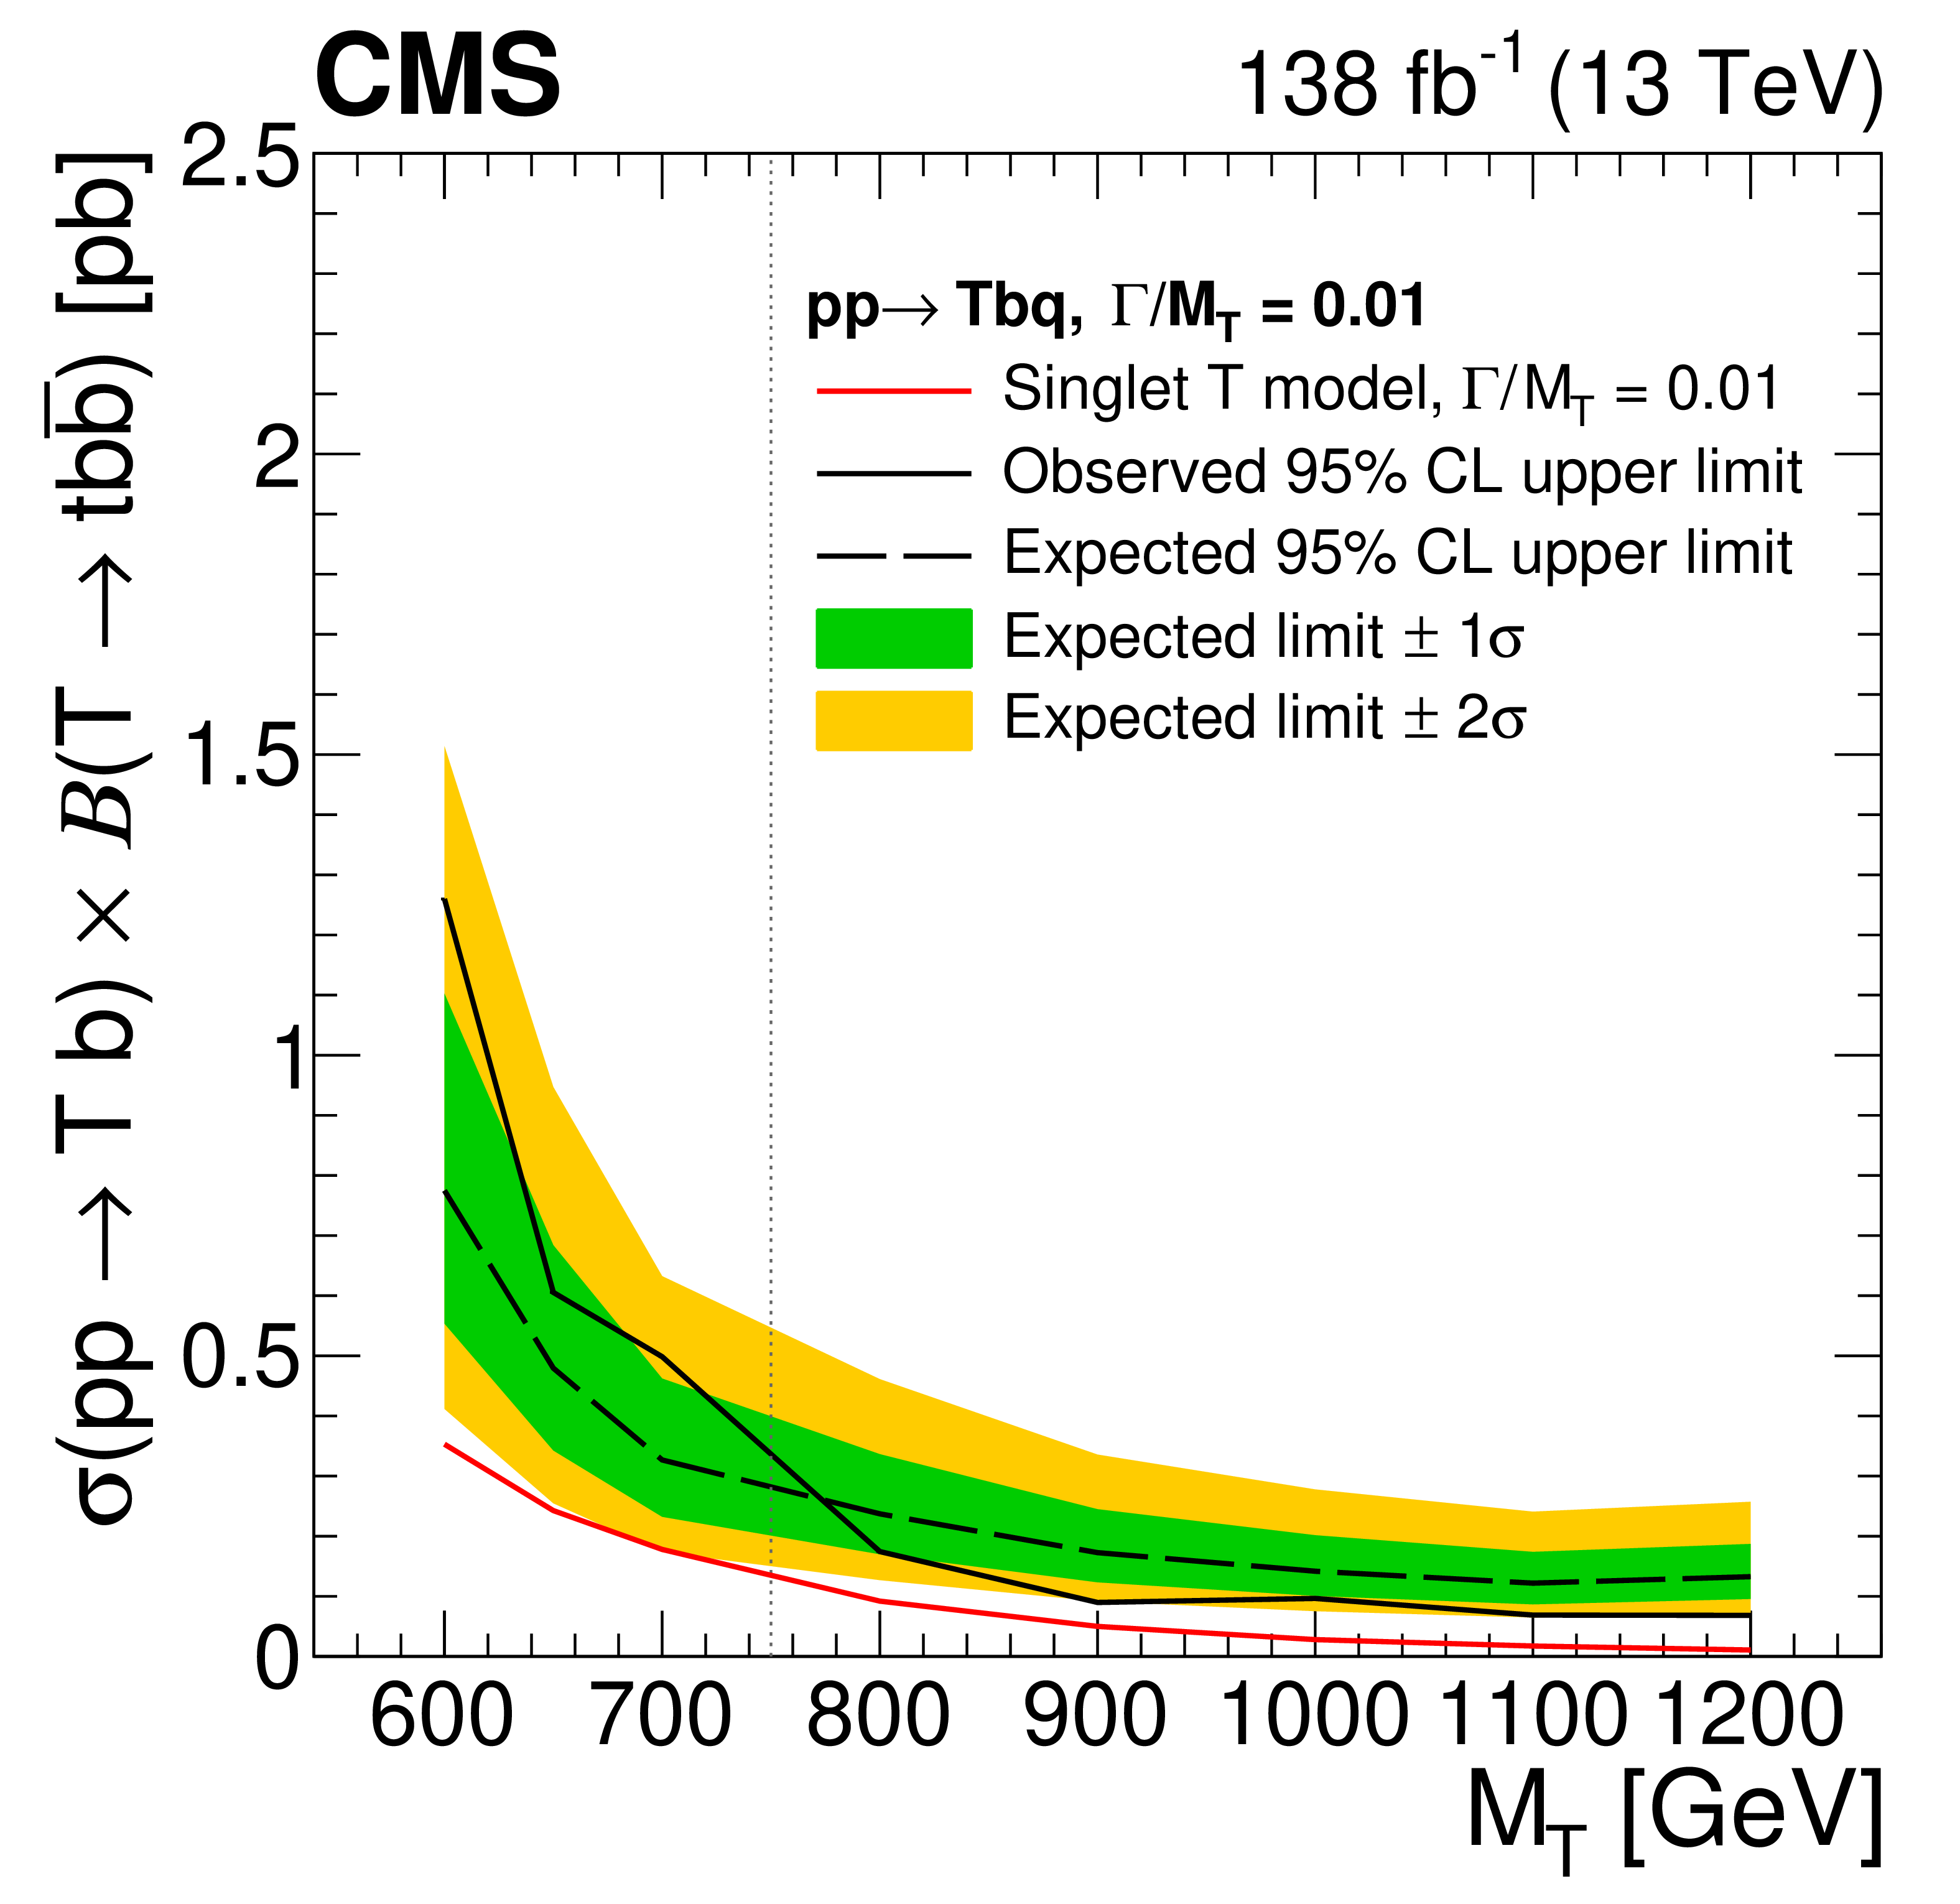
The observed and expected 95% CL limits on the cross section for associated production with a b quark for final states $ \mathrm{t}\mathrm{H}\mathrm{b}\mathrm{q} $ (upper left), $ \mathrm{t}\mathrm{Z}\mathrm{b}\mathrm{q} $ (upper right), their sum $ \mathrm{t}\mathrm{H}\mathrm{b}\mathrm{q} $+$ \mathrm{t}\mathrm{Z}\mathrm{b}\mathrm{q} $ (lower left), and $ \mathrm{t}\mathrm{H}\mathrm{b}\mathrm{q} $+$ \mathrm{t}\mathrm{Z}\mathrm{b}\mathrm{q} $ including the leakage of tH events into the tZ channel (lower right) for different assumed values of the T quark mass. The vertical dashed line represents the crossover point in sensitivity: for masses to the left, the low-mass selection is used to set limits, while for masses to the right, the high-mass selection is used to set limits. The red lines indicate the theoretical cross section for the singlet model [9]. |

png pdf |
Figure 7-a:
The observed and expected 95% CL limits on the cross section for associated production with a b quark for final states $ \mathrm{t}\mathrm{H}\mathrm{b}\mathrm{q} $ (upper left), $ \mathrm{t}\mathrm{Z}\mathrm{b}\mathrm{q} $ (upper right), their sum $ \mathrm{t}\mathrm{H}\mathrm{b}\mathrm{q} $+$ \mathrm{t}\mathrm{Z}\mathrm{b}\mathrm{q} $ (lower left), and $ \mathrm{t}\mathrm{H}\mathrm{b}\mathrm{q} $+$ \mathrm{t}\mathrm{Z}\mathrm{b}\mathrm{q} $ including the leakage of tH events into the tZ channel (lower right) for different assumed values of the T quark mass. The vertical dashed line represents the crossover point in sensitivity: for masses to the left, the low-mass selection is used to set limits, while for masses to the right, the high-mass selection is used to set limits. The red lines indicate the theoretical cross section for the singlet model [9]. |

png pdf |
Figure 7-b:
The observed and expected 95% CL limits on the cross section for associated production with a b quark for final states $ \mathrm{t}\mathrm{H}\mathrm{b}\mathrm{q} $ (upper left), $ \mathrm{t}\mathrm{Z}\mathrm{b}\mathrm{q} $ (upper right), their sum $ \mathrm{t}\mathrm{H}\mathrm{b}\mathrm{q} $+$ \mathrm{t}\mathrm{Z}\mathrm{b}\mathrm{q} $ (lower left), and $ \mathrm{t}\mathrm{H}\mathrm{b}\mathrm{q} $+$ \mathrm{t}\mathrm{Z}\mathrm{b}\mathrm{q} $ including the leakage of tH events into the tZ channel (lower right) for different assumed values of the T quark mass. The vertical dashed line represents the crossover point in sensitivity: for masses to the left, the low-mass selection is used to set limits, while for masses to the right, the high-mass selection is used to set limits. The red lines indicate the theoretical cross section for the singlet model [9]. |
png pdf |
Figure 7-c:
The observed and expected 95% CL limits on the cross section for associated production with a b quark for final states $ \mathrm{t}\mathrm{H}\mathrm{b}\mathrm{q} $ (upper left), $ \mathrm{t}\mathrm{Z}\mathrm{b}\mathrm{q} $ (upper right), their sum $ \mathrm{t}\mathrm{H}\mathrm{b}\mathrm{q} $+$ \mathrm{t}\mathrm{Z}\mathrm{b}\mathrm{q} $ (lower left), and $ \mathrm{t}\mathrm{H}\mathrm{b}\mathrm{q} $+$ \mathrm{t}\mathrm{Z}\mathrm{b}\mathrm{q} $ including the leakage of tH events into the tZ channel (lower right) for different assumed values of the T quark mass. The vertical dashed line represents the crossover point in sensitivity: for masses to the left, the low-mass selection is used to set limits, while for masses to the right, the high-mass selection is used to set limits. The red lines indicate the theoretical cross section for the singlet model [9]. |
png pdf |
Figure 7-d:
The observed and expected 95% CL limits on the cross section for associated production with a b quark for final states $ \mathrm{t}\mathrm{H}\mathrm{b}\mathrm{q} $ (upper left), $ \mathrm{t}\mathrm{Z}\mathrm{b}\mathrm{q} $ (upper right), their sum $ \mathrm{t}\mathrm{H}\mathrm{b}\mathrm{q} $+$ \mathrm{t}\mathrm{Z}\mathrm{b}\mathrm{q} $ (lower left), and $ \mathrm{t}\mathrm{H}\mathrm{b}\mathrm{q} $+$ \mathrm{t}\mathrm{Z}\mathrm{b}\mathrm{q} $ including the leakage of tH events into the tZ channel (lower right) for different assumed values of the T quark mass. The vertical dashed line represents the crossover point in sensitivity: for masses to the left, the low-mass selection is used to set limits, while for masses to the right, the high-mass selection is used to set limits. The red lines indicate the theoretical cross section for the singlet model [9]. |
| Tables | |

png pdf |
Table 1:
Mean and standard deviation values from a Gaussian fit of the H/Z/W boson and top quark mass distributions in the 700 GeV T quark sample, requiring the jet kinematic criteria described above and matching to generated particles. All quantities are in units of GeVns. The year-to-year variations are within the jet energy scale uncertainties. |

png pdf |
Table 2:
Definitions of the signal and control regions for the high-mass selection. If the same selection is applied in all SRs and CRs, this is indicated by the $ \div $ symbol in the latter. If no selection is applied, this is indicated by the $ - $ symbol. The ``3T'', ``3M'', and ``2T1L/2M1L'' represent region with three tight, three medium, and two tight/medium plus one loose b tagging requirements on the jets, respectively. |
png pdf |
Table 3:
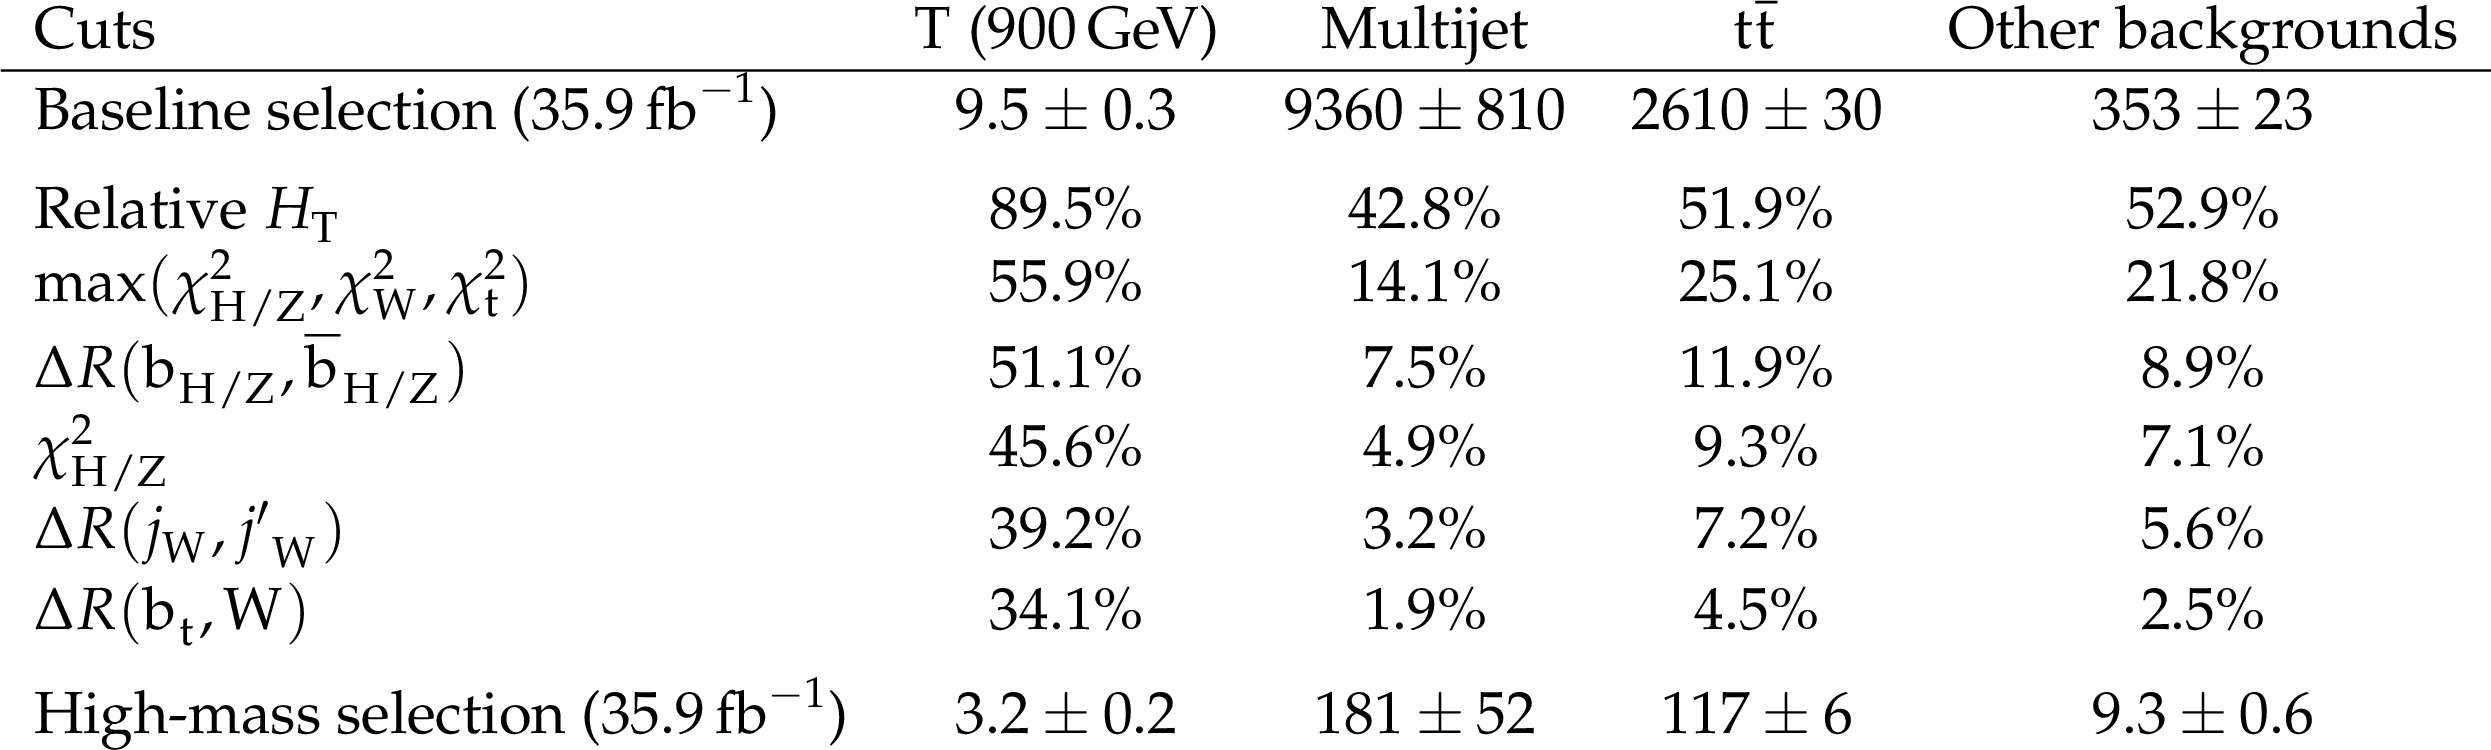
Cumulative efficiencies of the high-mass selection criteria for signal and various simulated backgrounds in 2016 data. The first and last lines indicate the expected number of events normalized to an integrated luminosity of 35.9 fb$ ^{-1} $. Only statistical uncertainties are reported. The ``Other backgrounds'' column includes W/Z+jets, single t, $ {\mathrm{t}\overline{\mathrm{t}}} \mathrm{H} $, and $ {\mathrm{t}\overline{\mathrm{t}}} \mathrm{Z} $ background processes. The $ {\mathrm{t}\overline{\mathrm{t}}} \mathrm{H} $ and $ {\mathrm{t}\overline{\mathrm{t}}} \mathrm{Z} $ processes do not form a resonance and have production rates roughly the same as the signal rate. |
| Summary |
| A search for a vector-like top quark T in the single production mode was performed using proton-proton collision events at $ \sqrt{s} = $ 13 TeV collected by the CMS experiment in 2016-2018. In this search, the T quark is assumed to couple only to standard model third-generation quarks. We consider signatures containing a top quark and a Higgs (tH) or Z (tZ) boson decaying to a bottom quark-antiquark pair. The major background processes are top quark-antiquark pair and multijet production. The feature in the tH final state found in the previous search [23] is not confirmed with a larger dataset and improved event selection. No evidence for the T quark production in the $ \mathrm{p}\mathrm{p}\to\tprime\mathrm{b}\mathrm{q} $ process is seen and 95% confidence level upper limits are set on the product of the production cross section and branching fraction to tH and tZ that range from 1260 to 68 fb for T quark masses of 600-1200 GeV. The limits are stronger than those in the previous search by at least a factor of three. |
| Additional Figures | |
png pdf |
Additional Figure 1:
Weights from b tagging efficiency ratios (open markers) as a function of the five-jet invariant mass in 2016 (upper) and 2017 (lower) data for the low-mass selection. The left graph shows weights connecting the 2M1L and 3M regions, and the right graph shows weights connecting the 3M and 3T regions. The red line corresponds to the central value of the transfer function and the shaded area represents the 95% confidence level uncertainty band. For the low-mass analysis only signals with mass below 800 GeV are tested, so primarily the lower part of the distribution contributes to the final result. In the tZ channel, similar functions are derived. |

png pdf |
Additional Figure 1-a:
Weights from b tagging efficiency ratios (open markers) as a function of the five-jet invariant mass in 2016 (upper) and 2017 (lower) data for the low-mass selection. The left graph shows weights connecting the 2M1L and 3M regions, and the right graph shows weights connecting the 3M and 3T regions. The red line corresponds to the central value of the transfer function and the shaded area represents the 95% confidence level uncertainty band. For the low-mass analysis only signals with mass below 800 GeV are tested, so primarily the lower part of the distribution contributes to the final result. In the tZ channel, similar functions are derived. |
png pdf |
Additional Figure 1-b:
Weights from b tagging efficiency ratios (open markers) as a function of the five-jet invariant mass in 2016 (upper) and 2017 (lower) data for the low-mass selection. The left graph shows weights connecting the 2M1L and 3M regions, and the right graph shows weights connecting the 3M and 3T regions. The red line corresponds to the central value of the transfer function and the shaded area represents the 95% confidence level uncertainty band. For the low-mass analysis only signals with mass below 800 GeV are tested, so primarily the lower part of the distribution contributes to the final result. In the tZ channel, similar functions are derived. |
png pdf |
Additional Figure 1-c:
Weights from b tagging efficiency ratios (open markers) as a function of the five-jet invariant mass in 2016 (upper) and 2017 (lower) data for the low-mass selection. The left graph shows weights connecting the 2M1L and 3M regions, and the right graph shows weights connecting the 3M and 3T regions. The red line corresponds to the central value of the transfer function and the shaded area represents the 95% confidence level uncertainty band. For the low-mass analysis only signals with mass below 800 GeV are tested, so primarily the lower part of the distribution contributes to the final result. In the tZ channel, similar functions are derived. |

png pdf |
Additional Figure 1-d:
Weights from b tagging efficiency ratios (open markers) as a function of the five-jet invariant mass in 2016 (upper) and 2017 (lower) data for the low-mass selection. The left graph shows weights connecting the 2M1L and 3M regions, and the right graph shows weights connecting the 3M and 3T regions. The red line corresponds to the central value of the transfer function and the shaded area represents the 95% confidence level uncertainty band. For the low-mass analysis only signals with mass below 800 GeV are tested, so primarily the lower part of the distribution contributes to the final result. In the tZ channel, similar functions are derived. |
png pdf |
Additional Figure 2:
Weights from b tagging efficiency ratios (open markers) as a function of the five-jet invariant mass in 2016 (upper) and 2017 (lower) data for the high-mass selection. The left graph shows weights connecting the 2M1L and 3M regions, and the right graph shows weights connecting the 3M and 3T regions. The red line corresponds to the central value of the transfer function and the shaded area represents the 95% confidence level uncertainty band. For the high-mass analysis only signals with mass below (above) 800 GeV are tested, so primarily the upper part of the distribution contributes to the final result. In the tZ channel, similar functions are derived. |
png pdf |
Additional Figure 2-a:
Weights from b tagging efficiency ratios (open markers) as a function of the five-jet invariant mass in 2016 (upper) and 2017 (lower) data for the high-mass selection. The left graph shows weights connecting the 2M1L and 3M regions, and the right graph shows weights connecting the 3M and 3T regions. The red line corresponds to the central value of the transfer function and the shaded area represents the 95% confidence level uncertainty band. For the high-mass analysis only signals with mass below (above) 800 GeV are tested, so primarily the upper part of the distribution contributes to the final result. In the tZ channel, similar functions are derived. |

png pdf |
Additional Figure 2-b:
Weights from b tagging efficiency ratios (open markers) as a function of the five-jet invariant mass in 2016 (upper) and 2017 (lower) data for the high-mass selection. The left graph shows weights connecting the 2M1L and 3M regions, and the right graph shows weights connecting the 3M and 3T regions. The red line corresponds to the central value of the transfer function and the shaded area represents the 95% confidence level uncertainty band. For the high-mass analysis only signals with mass below (above) 800 GeV are tested, so primarily the upper part of the distribution contributes to the final result. In the tZ channel, similar functions are derived. |

png pdf |
Additional Figure 2-c:
Weights from b tagging efficiency ratios (open markers) as a function of the five-jet invariant mass in 2016 (upper) and 2017 (lower) data for the high-mass selection. The left graph shows weights connecting the 2M1L and 3M regions, and the right graph shows weights connecting the 3M and 3T regions. The red line corresponds to the central value of the transfer function and the shaded area represents the 95% confidence level uncertainty band. For the high-mass analysis only signals with mass below (above) 800 GeV are tested, so primarily the upper part of the distribution contributes to the final result. In the tZ channel, similar functions are derived. |

png pdf |
Additional Figure 2-d:
Weights from b tagging efficiency ratios (open markers) as a function of the five-jet invariant mass in 2016 (upper) and 2017 (lower) data for the high-mass selection. The left graph shows weights connecting the 2M1L and 3M regions, and the right graph shows weights connecting the 3M and 3T regions. The red line corresponds to the central value of the transfer function and the shaded area represents the 95% confidence level uncertainty band. For the high-mass analysis only signals with mass below (above) 800 GeV are tested, so primarily the upper part of the distribution contributes to the final result. In the tZ channel, similar functions are derived. |

png pdf |
Additional Figure 3:
Five-jet invariant mass distributions after a background-only fit (blue histogram) to the complete dataset (black markers) in the 2M1L (upper), 3M (middle), and 3T (lower) regions for low-mass (left) and the high-mass (right) selections. The dashed blue band represents the uncertainty on the fitted background estimate, and red dashed line shows the expected signal distribution for a 700 GeV (low-mass selection) and a 900 GeV (high-mass selection) T. The tZ channel is shown when the fit is performed on the combined data from all three years in the tZ and tH channels. |

png pdf |
Additional Figure 3-a:
Five-jet invariant mass distributions after a background-only fit (blue histogram) to the complete dataset (black markers) in the 2M1L (upper), 3M (middle), and 3T (lower) regions for low-mass (left) and the high-mass (right) selections. The dashed blue band represents the uncertainty on the fitted background estimate, and red dashed line shows the expected signal distribution for a 700 GeV (low-mass selection) and a 900 GeV (high-mass selection) T. The tZ channel is shown when the fit is performed on the combined data from all three years in the tZ and tH channels. |

png pdf |
Additional Figure 3-b:
Five-jet invariant mass distributions after a background-only fit (blue histogram) to the complete dataset (black markers) in the 2M1L (upper), 3M (middle), and 3T (lower) regions for low-mass (left) and the high-mass (right) selections. The dashed blue band represents the uncertainty on the fitted background estimate, and red dashed line shows the expected signal distribution for a 700 GeV (low-mass selection) and a 900 GeV (high-mass selection) T. The tZ channel is shown when the fit is performed on the combined data from all three years in the tZ and tH channels. |

png pdf |
Additional Figure 3-c:
Five-jet invariant mass distributions after a background-only fit (blue histogram) to the complete dataset (black markers) in the 2M1L (upper), 3M (middle), and 3T (lower) regions for low-mass (left) and the high-mass (right) selections. The dashed blue band represents the uncertainty on the fitted background estimate, and red dashed line shows the expected signal distribution for a 700 GeV (low-mass selection) and a 900 GeV (high-mass selection) T. The tZ channel is shown when the fit is performed on the combined data from all three years in the tZ and tH channels. |

png pdf |
Additional Figure 3-d:
Five-jet invariant mass distributions after a background-only fit (blue histogram) to the complete dataset (black markers) in the 2M1L (upper), 3M (middle), and 3T (lower) regions for low-mass (left) and the high-mass (right) selections. The dashed blue band represents the uncertainty on the fitted background estimate, and red dashed line shows the expected signal distribution for a 700 GeV (low-mass selection) and a 900 GeV (high-mass selection) T. The tZ channel is shown when the fit is performed on the combined data from all three years in the tZ and tH channels. |

png pdf |
Additional Figure 3-e:
Five-jet invariant mass distributions after a background-only fit (blue histogram) to the complete dataset (black markers) in the 2M1L (upper), 3M (middle), and 3T (lower) regions for low-mass (left) and the high-mass (right) selections. The dashed blue band represents the uncertainty on the fitted background estimate, and red dashed line shows the expected signal distribution for a 700 GeV (low-mass selection) and a 900 GeV (high-mass selection) T. The tZ channel is shown when the fit is performed on the combined data from all three years in the tZ and tH channels. |

png pdf |
Additional Figure 3-f:
Five-jet invariant mass distributions after a background-only fit (blue histogram) to the complete dataset (black markers) in the 2M1L (upper), 3M (middle), and 3T (lower) regions for low-mass (left) and the high-mass (right) selections. The dashed blue band represents the uncertainty on the fitted background estimate, and red dashed line shows the expected signal distribution for a 700 GeV (low-mass selection) and a 900 GeV (high-mass selection) T. The tZ channel is shown when the fit is performed on the combined data from all three years in the tZ and tH channels. |

png pdf |
Additional Figure 4:
The observed and expected 95% CL limits on the cross section for associated production with a b quark for final states $ \mathrm{t}\mathrm{H}\mathrm{b}\mathrm{q} $ (upper left), $ \mathrm{t}\mathrm{Z}\mathrm{b}\mathrm{q} $ (upper right), their sum $ \mathrm{t}\mathrm{H}\mathrm{b}\mathrm{q} $+$ \mathrm{t}\mathrm{Z}\mathrm{b}\mathrm{q} $ (lower left), and $ \mathrm{t}\mathrm{H}\mathrm{b}\mathrm{q} $+$ \mathrm{t}\mathrm{Z}\mathrm{b}\mathrm{q} $ including the leakage of tH events into the tZ channel (bottom right) for different assumed values of the T mass in logarithmic scale. The vertical dashed line represents the crossover point in sensitivity: for masses to the left, the low-mass selection is used to set limits, while for masses to the right, the high-mass selection is used to set limits. The red lines indicate the theoretical cross section for the singlet model. |

png pdf |
Additional Figure 4-a:
The observed and expected 95% CL limits on the cross section for associated production with a b quark for final states $ \mathrm{t}\mathrm{H}\mathrm{b}\mathrm{q} $ (upper left), $ \mathrm{t}\mathrm{Z}\mathrm{b}\mathrm{q} $ (upper right), their sum $ \mathrm{t}\mathrm{H}\mathrm{b}\mathrm{q} $+$ \mathrm{t}\mathrm{Z}\mathrm{b}\mathrm{q} $ (lower left), and $ \mathrm{t}\mathrm{H}\mathrm{b}\mathrm{q} $+$ \mathrm{t}\mathrm{Z}\mathrm{b}\mathrm{q} $ including the leakage of tH events into the tZ channel (bottom right) for different assumed values of the T mass in logarithmic scale. The vertical dashed line represents the crossover point in sensitivity: for masses to the left, the low-mass selection is used to set limits, while for masses to the right, the high-mass selection is used to set limits. The red lines indicate the theoretical cross section for the singlet model. |

png pdf |
Additional Figure 4-b:
The observed and expected 95% CL limits on the cross section for associated production with a b quark for final states $ \mathrm{t}\mathrm{H}\mathrm{b}\mathrm{q} $ (upper left), $ \mathrm{t}\mathrm{Z}\mathrm{b}\mathrm{q} $ (upper right), their sum $ \mathrm{t}\mathrm{H}\mathrm{b}\mathrm{q} $+$ \mathrm{t}\mathrm{Z}\mathrm{b}\mathrm{q} $ (lower left), and $ \mathrm{t}\mathrm{H}\mathrm{b}\mathrm{q} $+$ \mathrm{t}\mathrm{Z}\mathrm{b}\mathrm{q} $ including the leakage of tH events into the tZ channel (bottom right) for different assumed values of the T mass in logarithmic scale. The vertical dashed line represents the crossover point in sensitivity: for masses to the left, the low-mass selection is used to set limits, while for masses to the right, the high-mass selection is used to set limits. The red lines indicate the theoretical cross section for the singlet model. |

png pdf |
Additional Figure 4-c:
The observed and expected 95% CL limits on the cross section for associated production with a b quark for final states $ \mathrm{t}\mathrm{H}\mathrm{b}\mathrm{q} $ (upper left), $ \mathrm{t}\mathrm{Z}\mathrm{b}\mathrm{q} $ (upper right), their sum $ \mathrm{t}\mathrm{H}\mathrm{b}\mathrm{q} $+$ \mathrm{t}\mathrm{Z}\mathrm{b}\mathrm{q} $ (lower left), and $ \mathrm{t}\mathrm{H}\mathrm{b}\mathrm{q} $+$ \mathrm{t}\mathrm{Z}\mathrm{b}\mathrm{q} $ including the leakage of tH events into the tZ channel (bottom right) for different assumed values of the T mass in logarithmic scale. The vertical dashed line represents the crossover point in sensitivity: for masses to the left, the low-mass selection is used to set limits, while for masses to the right, the high-mass selection is used to set limits. The red lines indicate the theoretical cross section for the singlet model. |

png pdf |
Additional Figure 4-d:
The observed and expected 95% CL limits on the cross section for associated production with a b quark for final states $ \mathrm{t}\mathrm{H}\mathrm{b}\mathrm{q} $ (upper left), $ \mathrm{t}\mathrm{Z}\mathrm{b}\mathrm{q} $ (upper right), their sum $ \mathrm{t}\mathrm{H}\mathrm{b}\mathrm{q} $+$ \mathrm{t}\mathrm{Z}\mathrm{b}\mathrm{q} $ (lower left), and $ \mathrm{t}\mathrm{H}\mathrm{b}\mathrm{q} $+$ \mathrm{t}\mathrm{Z}\mathrm{b}\mathrm{q} $ including the leakage of tH events into the tZ channel (bottom right) for different assumed values of the T mass in logarithmic scale. The vertical dashed line represents the crossover point in sensitivity: for masses to the left, the low-mass selection is used to set limits, while for masses to the right, the high-mass selection is used to set limits. The red lines indicate the theoretical cross section for the singlet model. |

png pdf |
Additional Figure 5:
Five-jet invariant mass distributions after a background-only fit (blue histogram) to the complete dataset (black markers) in the 2M1L (upper), 3M (middle), and 3T (lower) regions for low-mass (left) and the high-mass (right) selections. The dashed blue band represents the uncertainty on the fitted background estimate, and red dashed line shows the expected signal distribution for a 700 GeV (low-mass selection) and a 900 GeV (high-mass selection) T quark. The fit is performed on the combined data from all three years in the all-tH channel. |

png pdf |
Additional Figure 5-a:
Five-jet invariant mass distributions after a background-only fit (blue histogram) to the complete dataset (black markers) in the 2M1L (upper), 3M (middle), and 3T (lower) regions for low-mass (left) and the high-mass (right) selections. The dashed blue band represents the uncertainty on the fitted background estimate, and red dashed line shows the expected signal distribution for a 700 GeV (low-mass selection) and a 900 GeV (high-mass selection) T quark. The fit is performed on the combined data from all three years in the all-tH channel. |

png pdf |
Additional Figure 5-b:
Five-jet invariant mass distributions after a background-only fit (blue histogram) to the complete dataset (black markers) in the 2M1L (upper), 3M (middle), and 3T (lower) regions for low-mass (left) and the high-mass (right) selections. The dashed blue band represents the uncertainty on the fitted background estimate, and red dashed line shows the expected signal distribution for a 700 GeV (low-mass selection) and a 900 GeV (high-mass selection) T quark. The fit is performed on the combined data from all three years in the all-tH channel. |

png pdf |
Additional Figure 5-c:
Five-jet invariant mass distributions after a background-only fit (blue histogram) to the complete dataset (black markers) in the 2M1L (upper), 3M (middle), and 3T (lower) regions for low-mass (left) and the high-mass (right) selections. The dashed blue band represents the uncertainty on the fitted background estimate, and red dashed line shows the expected signal distribution for a 700 GeV (low-mass selection) and a 900 GeV (high-mass selection) T quark. The fit is performed on the combined data from all three years in the all-tH channel. |

png pdf |
Additional Figure 5-d:
Five-jet invariant mass distributions after a background-only fit (blue histogram) to the complete dataset (black markers) in the 2M1L (upper), 3M (middle), and 3T (lower) regions for low-mass (left) and the high-mass (right) selections. The dashed blue band represents the uncertainty on the fitted background estimate, and red dashed line shows the expected signal distribution for a 700 GeV (low-mass selection) and a 900 GeV (high-mass selection) T quark. The fit is performed on the combined data from all three years in the all-tH channel. |

png pdf |
Additional Figure 5-e:
Five-jet invariant mass distributions after a background-only fit (blue histogram) to the complete dataset (black markers) in the 2M1L (upper), 3M (middle), and 3T (lower) regions for low-mass (left) and the high-mass (right) selections. The dashed blue band represents the uncertainty on the fitted background estimate, and red dashed line shows the expected signal distribution for a 700 GeV (low-mass selection) and a 900 GeV (high-mass selection) T quark. The fit is performed on the combined data from all three years in the all-tH channel. |
png pdf |
Additional Figure 5-f:
Five-jet invariant mass distributions after a background-only fit (blue histogram) to the complete dataset (black markers) in the 2M1L (upper), 3M (middle), and 3T (lower) regions for low-mass (left) and the high-mass (right) selections. The dashed blue band represents the uncertainty on the fitted background estimate, and red dashed line shows the expected signal distribution for a 700 GeV (low-mass selection) and a 900 GeV (high-mass selection) T quark. The fit is performed on the combined data from all three years in the all-tH channel. |

png pdf |
Additional Figure 6:
Five-jet invariant mass distributions after a background-only fit (blue histogram) to the complete dataset (black markers) in the 2M1L (upper), 3M (middle), and 3T (lower) regions for low-mass (left) and the high-mass (right) selections. The dashed blue band represents the uncertainty on the fitted background estimate, and red dashed line shows the expected signal distribution for a 700 GeV (low-mass selection) and a 900 GeV (high-mass selection) T quark. The tZ channel is shown when the fit is performed on the combined data from all three years in the tZ and tH channels. |

png pdf |
Additional Figure 6-a:
Five-jet invariant mass distributions after a background-only fit (blue histogram) to the complete dataset (black markers) in the 2M1L (upper), 3M (middle), and 3T (lower) regions for low-mass (left) and the high-mass (right) selections. The dashed blue band represents the uncertainty on the fitted background estimate, and red dashed line shows the expected signal distribution for a 700 GeV (low-mass selection) and a 900 GeV (high-mass selection) T quark. The tZ channel is shown when the fit is performed on the combined data from all three years in the tZ and tH channels. |
png pdf |
Additional Figure 6-b:
Five-jet invariant mass distributions after a background-only fit (blue histogram) to the complete dataset (black markers) in the 2M1L (upper), 3M (middle), and 3T (lower) regions for low-mass (left) and the high-mass (right) selections. The dashed blue band represents the uncertainty on the fitted background estimate, and red dashed line shows the expected signal distribution for a 700 GeV (low-mass selection) and a 900 GeV (high-mass selection) T quark. The tZ channel is shown when the fit is performed on the combined data from all three years in the tZ and tH channels. |

png pdf |
Additional Figure 6-c:
Five-jet invariant mass distributions after a background-only fit (blue histogram) to the complete dataset (black markers) in the 2M1L (upper), 3M (middle), and 3T (lower) regions for low-mass (left) and the high-mass (right) selections. The dashed blue band represents the uncertainty on the fitted background estimate, and red dashed line shows the expected signal distribution for a 700 GeV (low-mass selection) and a 900 GeV (high-mass selection) T quark. The tZ channel is shown when the fit is performed on the combined data from all three years in the tZ and tH channels. |

png pdf |
Additional Figure 6-d:
Five-jet invariant mass distributions after a background-only fit (blue histogram) to the complete dataset (black markers) in the 2M1L (upper), 3M (middle), and 3T (lower) regions for low-mass (left) and the high-mass (right) selections. The dashed blue band represents the uncertainty on the fitted background estimate, and red dashed line shows the expected signal distribution for a 700 GeV (low-mass selection) and a 900 GeV (high-mass selection) T quark. The tZ channel is shown when the fit is performed on the combined data from all three years in the tZ and tH channels. |

png pdf |
Additional Figure 6-e:
Five-jet invariant mass distributions after a background-only fit (blue histogram) to the complete dataset (black markers) in the 2M1L (upper), 3M (middle), and 3T (lower) regions for low-mass (left) and the high-mass (right) selections. The dashed blue band represents the uncertainty on the fitted background estimate, and red dashed line shows the expected signal distribution for a 700 GeV (low-mass selection) and a 900 GeV (high-mass selection) T quark. The tZ channel is shown when the fit is performed on the combined data from all three years in the tZ and tH channels. |
png pdf |
Additional Figure 6-f:
Five-jet invariant mass distributions after a background-only fit (blue histogram) to the complete dataset (black markers) in the 2M1L (upper), 3M (middle), and 3T (lower) regions for low-mass (left) and the high-mass (right) selections. The dashed blue band represents the uncertainty on the fitted background estimate, and red dashed line shows the expected signal distribution for a 700 GeV (low-mass selection) and a 900 GeV (high-mass selection) T quark. The tZ channel is shown when the fit is performed on the combined data from all three years in the tZ and tH channels. |
| References | ||||
| 1 | Y. Okada and L. Panizzi | LHC signatures of vector-like quarks | Adv. High Energy Phys. 2013 (2013) 364936 | 1207.5607 |
| 2 | J. A. Aguilar-Saavedra, R. Benbrik, S. Heinemeyer, and M. P é rez-Victoria | Handbook of vectorlike quarks: Mixing and single production | PRD 88 (2013) 094010 | 1306.0572 |
| 3 | A. De Simone, O. Matsedonskyi, R. Rattazzi, and A. Wulzer | A first top partner hunter's guide | JHEP 04 (2013) 004 | 1211.5663 |
| 4 | M. Buchkremer, G. Cacciapaglia, A. Deandrea, and L. Panizzi | Model independent framework for searches of top partners | NPB 876 (2013) 376 | 1305.4172 |
| 5 | A. Djouadi and A. Lenz | Sealing the fate of a fourth generation of fermions | PLB 715 (2012) 310 | 1204.1252 |
| 6 | A. Lenz | Constraints on a fourth generation of fermions from Higgs Boson searches | Adv. High Energy Phys. 2013 (2013) 910275 | |
| 7 | CMS Collaboration | Combined search for the quarks of a sequential fourth generation | PRD 86 (2012) 112003 | CMS-EXO-11-098 1209.1062 |
| 8 | N. Vignaroli | Early discovery of top partners and test of the Higgs nature | PRD 86 (2012) 075017 | 1207.0830 |
| 9 | J. A. Aguilar-Saavedra | Identifying top partners at LHC | JHEP 11 (2009) 030 | 0907.3155 |
| 10 | CMS Collaboration | Search for pair production of vector-like quarks in the $ \mathrm{b}\mathrm{W}\overline{\mathrm{b}}\mathrm{W} $ channel from proton-proton collisions at $ \sqrt{s} = $ 13 TeV | PLB 779 (2018) 82 | 1710.01539 |
| 11 | ATLAS Collaboration | Search for pair production of heavy vector-like quarks decaying into hadronic final states in $ pp $ collisions at $ \sqrt{s} = $ 13 TeV with the ATLAS detector | PRD 98 (2018) 092005 | 1808.01771 |
| 12 | ATLAS Collaboration | Search for pair-produced vector-like top and bottom partners in events with large missing transverse momentum in pp collisions with the ATLAS detector | EPJC 83 (2023) 719 | 2212.05263 |
| 13 | CMS Collaboration | Search for pair production of vector-like quarks in leptonic final states in proton-proton collisions at $ \sqrt{s} = $ 13 TeV | JHEP 07 (2023) 020 | 2209.07327 |
| 14 | ATLAS Collaboration | Search for pair-production of vector-like quarks in pp collision events at $ \sqrt{s}= $ 13 TeV with at least one leptonically decaying Z boson and a third-generation quark with the ATLAS detector | PLB 843 (2023) 138019 | 2210.15413 |
| 15 | ATLAS Collaboration | Search for single production of vector-like quarks decaying into $ Wb $ in $ pp $ collisions at $ \sqrt{s} = $ 13 TeV with the ATLAS detector | JHEP 05 (2019) 164 | 1812.07343 |
| 16 | ATLAS Collaboration | Search for large missing transverse momentum in association with one top-quark in proton-proton collisions at $ \sqrt{s} $ = 13 TeV with the ATLAS detector | JHEP 05 (2019) 041 | 1812.09743 |
| 17 | ATLAS Collaboration | Search for single production of a vectorlike $ T $ quark decaying into a Higgs boson and top quark with fully hadronic final states using the ATLAS detector | PRD 105 (2022) 092012 | 2201.07045 |
| 18 | CMS Collaboration | Search for single production of vector-like quarks decaying into a b quark and a W boson in proton-proton collisions at $ \sqrt{s} = $ 13 TeV | PLB 772 (2017) 634 | 1701.08328 |
| 19 | CMS Collaboration | Search for single production of a vector-like \tprime quark decaying to a Z boson and a top quark in proton-proton collisions at $ \sqrt{s} = $ 13 TeV | PLB 781 (2018) 574 | 1708.01062 |
| 20 | CMS Collaboration | Search for single production of a vector-like T quark decaying to a top quark and a Z boson in the final state with jets and missing transverse momentum at $ \sqrt{s} = $ 13 TeV | JHEP 05 (2022) 093 | 2201.02227 |
| 21 | CMS Collaboration | Search for single production of a heavy vector-like \tprime quark decaying to a Higgs boson and a top quark with a lepton and jets in the final state | PLB 771 (2017) 80 | 1612.00999 |
| 22 | CMS Collaboration | Search for electroweak production of a vector-like quark decaying to a top quark and a Higgs boson using boosted topologies in fully hadronic final states | JHEP 04 (2017) 136 | 1612.05336 |
| 23 | CMS Collaboration | Search for electroweak production of a vector-like \tprime quark using fully hadronic final states | JHEP 01 (2020) 036 | 1909.04721 |
| 24 | CMS Collaboration | Description and performance of track and primary-vertex reconstruction with the CMS tracker | JINST 9 (2014) P10009 | CMS-TRK-11-001 1405.6569 |
| 25 | CMS Tracker Group Collaboration | The CMS phase-1 pixel detector upgrade | JINST 16 (2021) P02027 | 2012.14304 |
| 26 | CMS Collaboration | Track impact parameter resolution for the full pseudo rapidity coverage in the 2017 dataset with the CMS phase-1 pixel detector | CMS Detector Performance Summary CMS-DP-2020-049, 2020 CDS |
|
| 27 | CMS Collaboration | Electron and photon reconstruction and identification with the CMS experiment at the CERN LHC | JINST 16 (2021) P05014 | CMS-EGM-17-001 2012.06888 |
| 28 | CMS Collaboration | ECAL 2016 refined calibration and Run 2 summary plots | CMS Detector Performance Summary CMS-DP-2020-021, 2020 CDS |
|
| 29 | CMS Collaboration | The CMS experiment at the CERN LHC | JINST 3 (2008) S08004 | |
| 30 | CMS Collaboration | The CMS trigger system | JINST 12 (2017) P01020 | CMS-TRG-12-001 1609.02366 |
| 31 | CMS Collaboration | Technical proposal for the Phase-II upgrade of the Compact Muon Solenoid | CMS Technical Proposal CERN-LHCC-2015-010, CMS-TDR-15-02, 2015 CDS |
|
| 32 | CMS Collaboration | Particle-flow reconstruction and global event description with the CMS detector | JINST 12 (2017) P10003 | CMS-PRF-14-001 1706.04965 |
| 33 | M. Cacciari, G. P. Salam, and G. Soyez | The anti-$ k_{\mathrm{T}} $ jet clustering algorithm | JHEP 04 (2008) 063 | 0802.1189 |
| 34 | M. Cacciari, G. P. Salam, and G. Soyez | FastJet user manual | EPJC 72 (2012) 1896 | 1111.6097 |
| 35 | CMS Collaboration | Pileup mitigation at CMS in 13 TeV data | JINST 15 (2020) P09018 | CMS-JME-18-001 2003.00503 |
| 36 | CMS Collaboration | Jet energy scale and resolution in the CMS experiment in pp collisions at 8 TeV | JINST 12 (2017) P02014 | CMS-JME-13-004 1607.03663 |
| 37 | CMS Collaboration | Identification of heavy-flavour jets with the CMS detector in pp collisions at 13 TeV | JINST 13 (2018) P05011 | CMS-BTV-16-002 1712.07158 |
| 38 | J. Alwall et al. | The automated computation of tree-level and next-to-leading order differential cross sections, and their matching to parton shower simulations | JHEP 07 (2014) 079 | 1405.0301 |
| 39 | Particle Data Group Collaboration | Review of particle physics | Prog. Theor. Exp. Phys. 2022 (2022) 083C01 | |
| 40 | T. Sjöstrand et al. | An Introduction to PYTHIA8.2 | Comput. Phys. Commun. 191 (2015) 159 | 1410.3012 |
| 41 | CMS Collaboration | Event generator tunes obtained from underlying event and multiparton scattering measurements | EPJC 76 (2016) 155 | CMS-GEN-14-001 1512.00815 |
| 42 | CMS Collaboration | Extraction and validation of a new set of CMS PYTHIA8 tunes from underlying-event measurements | EPJC 80 (2020) 4 | CMS-GEN-17-001 1903.12179 |
| 43 | NNPDF Collaboration | Parton distributions for the LHC Run II | JHEP 04 (2015) 040 | 1410.8849 |
| 44 | NNPDF Collaboration | Parton distributions from high-precision collider data | EPJC 77 (2017) 663 | 1706.00428 |
| 45 | GEANT4 Collaboration | GEANT 4---a simulation toolkit | NIM A 506 (2003) 250 | |
| 46 | CMS Collaboration | Precision luminosity measurement in proton-proton collisions at $ \sqrt{s} = $ 13 TeV in 2015 and 2016 at CMS | EPJC 81 (2021) 800 | CMS-LUM-17-003 2104.01927 |
| 47 | CMS Collaboration | CMS luminosity measurements for the 2017 data taking period | Technical Report , CERN, 2017 CMS-PAS-LUM-17-004 |
CMS-PAS-LUM-17-004 |
| 48 | CMS Collaboration | CMS luminosity measurements for the 2018 data taking period | Technical Report , CERN, 2017 CMS-PAS-LUM-18-002 |
CMS-PAS-LUM-18-002 |
| 49 | P. Nason | A new method for combining NLO QCD with shower Monte Carlo algorithms | JHEP 11 (2004) 040 | hep-ph/0409146 |
| 50 | S. Frixione, P. Nason, and C. Oleari | Matching NLO QCD computations with parton shower simulations: the POWHEG method | JHEP 11 (2007) 070 | 0709.2092 |
| 51 | S. Alioli, P. Nason, C. Oleari, and E. Re | A general framework for implementing NLO calculations in shower Monte Carlo programs: the POWHEG BOX | JHEP 06 (2010) 043 | 1002.2581 |
| 52 | S. Frixione, P. Nason, and G. Ridolfi | A positive-weight next-to-leading-order Monte Carlo for heavy flavour hadroproduction | JHEP 09 (2007) 126 | 0707.3088 |
| 53 | H. B. Hartanto, B. Jager, L. Reina, and D. Wackeroth | Higgs boson production in association with top quarks in the POWHEG BOX | PRD 91 (2015) 094003 | 1501.04498 |
| 54 | G. Luisoni, P. Nason, C. Oleari, and F. Tramontano | $ \mathrm{H}\mathrm{W}^{\pm} $/HZ + 0 and 1 jet at NLO with the POWHEG BOX interfaced to GoSam and their merging within MiNLO | JHEP 10 (2013) 083 | 1306.2542 |
| 55 | A. N. Kolmogorov | Sulla determinazione empirica di una legge di distribuzione | Giornale dell', 1933 Istituto Italiano degli Attuari 4 (1933) 83 |
|
| 56 | N. Smirnov | Table for estimating the goodness of fit of empirical distributions | Ann. Math. Statist. 19 (1948) 279 | |
| 57 | F. E. James | Statistical Methods in Experimental Physics; 2nd ed. | World Scientific, Singapore, ISBN~978-981-270-527-3, 2006 link |
|
| 58 | J. Butterworth et al. | PDF4LHC recommendations for LHC Run II | JPG 43 (2016) 023001 | 1510.03865 |
| 59 | CMS Collaboration | Measurement of the inelastic proton-proton cross section at $ \sqrt{s}= $ 13 TeV | JHEP 07 (2018) 161 | CMS-FSQ-15-005 1802.02613 |
| 60 | L. Demortier | P values and nuisance parameters | in Statistical issues for LHC physics. Proc. Workshop on statistical issues for LHC physics, PHYSTAT-LHC, Geneva, Switzerland, June 27--29, 2007 link |
|
| 61 | T. Junk | Confidence level computation for combining searches with small statistics | NIM A 434 (1999) 435 | hep-ex/9902006 |
| 62 | A. L. Read | Presentation of search results: The $ \text{CL}_\text{s} $ technique | JPG 28 (2002) 2693 | |
| 63 | ATLAS and CMS Collaborations, and LHC Higgs Combination Group | Procedure for the LHC Higgs boson search combination in Summer 2011 | Technical Report CMS-NOTE-2011-005, ATL-PHYS-PUB-2011-11, 2011 | |
| 64 | G. Cowan, K. Cranmer, E. Gross, and O. Vitells | Asymptotic formulae for likelihood-based tests of new physics | EPJC 71 (2011) 1554 | 1007.1727 |
| 65 | CMS Collaboration | HEPData record for this analysis | link | |
|
|
Compact Muon Solenoid LHC, CERN |
|

|

|

|

|

|