

Compact Muon Solenoid
LHC, CERN
| CMS-EXO-13-001 ; CERN-EP-2016-187 | ||
| Search for new phenomena in events with high jet multiplicity and low missing transverse momentum in proton-proton collisions at $\sqrt{s} = $ 8 TeV | ||
| CMS Collaboration | ||
| 3 August 2016 | ||
| Phys. Lett. B 770 (2017) 257 | ||
| Abstract: A dedicated search is presented for new phenomena in inclusive eight- and ten-jet final states with low missing transverse momentum, with and without identification of jets originating from b quarks. The analysis is based on data from proton-proton collisions corresponding to an integrated luminosity of 19.6 fb$^{-1}$ collected with the CMS detector at the LHC at $\sqrt{s} =$ 8 TeV. The dominant multijet background expectations are obtained from low jet multiplicity control samples. Data agree well with the standard model background predictions, and limits are set in several benchmark models. Colorons (axigluons) with masses between 0.6 and 0.75 (up to 1.15) TeV are excluded at 95% confidence level. Similar exclusion limits for gluinos in $R$-parity violating supersymmetric scenarios are from 0.6 up to 1.1 TeV. These results comprise the first experimental probe of the coloron and axigluon models in multijet final states. | ||
| Links: e-print arXiv:1608.01224 [hep-ex] (PDF) ; CDS record ; inSPIRE record ; CADI line (restricted) ; | ||
| Figures & Tables | Summary | Additional Figures | References | CMS Publications |
|---|
| Figures | |
png pdf |
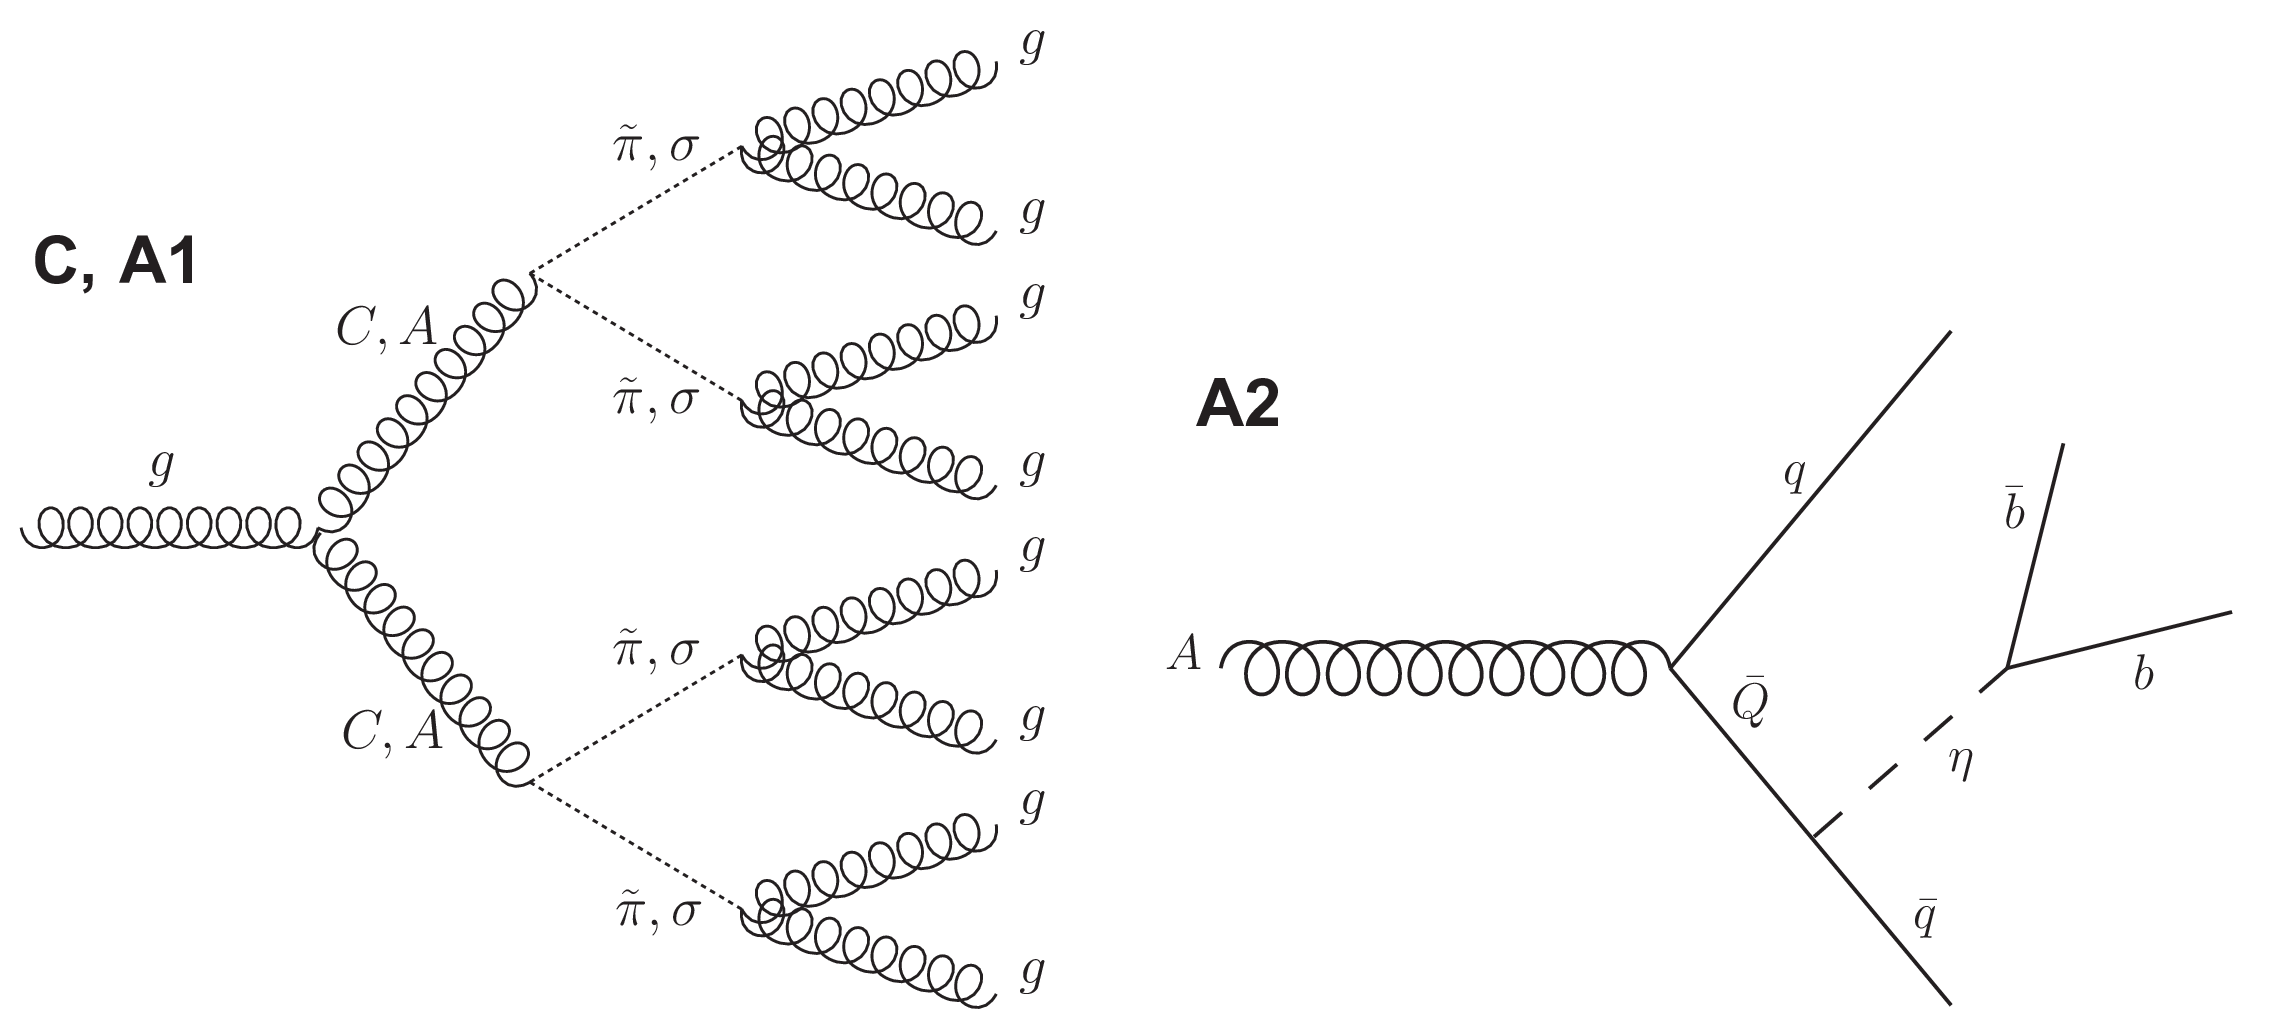
Figure 1:
Left : the dominant Feynman diagram representing the $s$-channel pair production of color-octet vector bosons, subsequently decaying into spin-0 particles and finally to gluons. The vector bosons can be colorons C or axigluons A, while the spin-0 particles can be pseudoscalar hyperpions $\tilde{\pi}$ or scalar particles $\sigma $. Right : the second decay mode of an axigluon considered in this analysis, involving a heavy quark Q and a pseudogoldstone boson $\eta $ with Higgs-like couplings. |
png pdf |
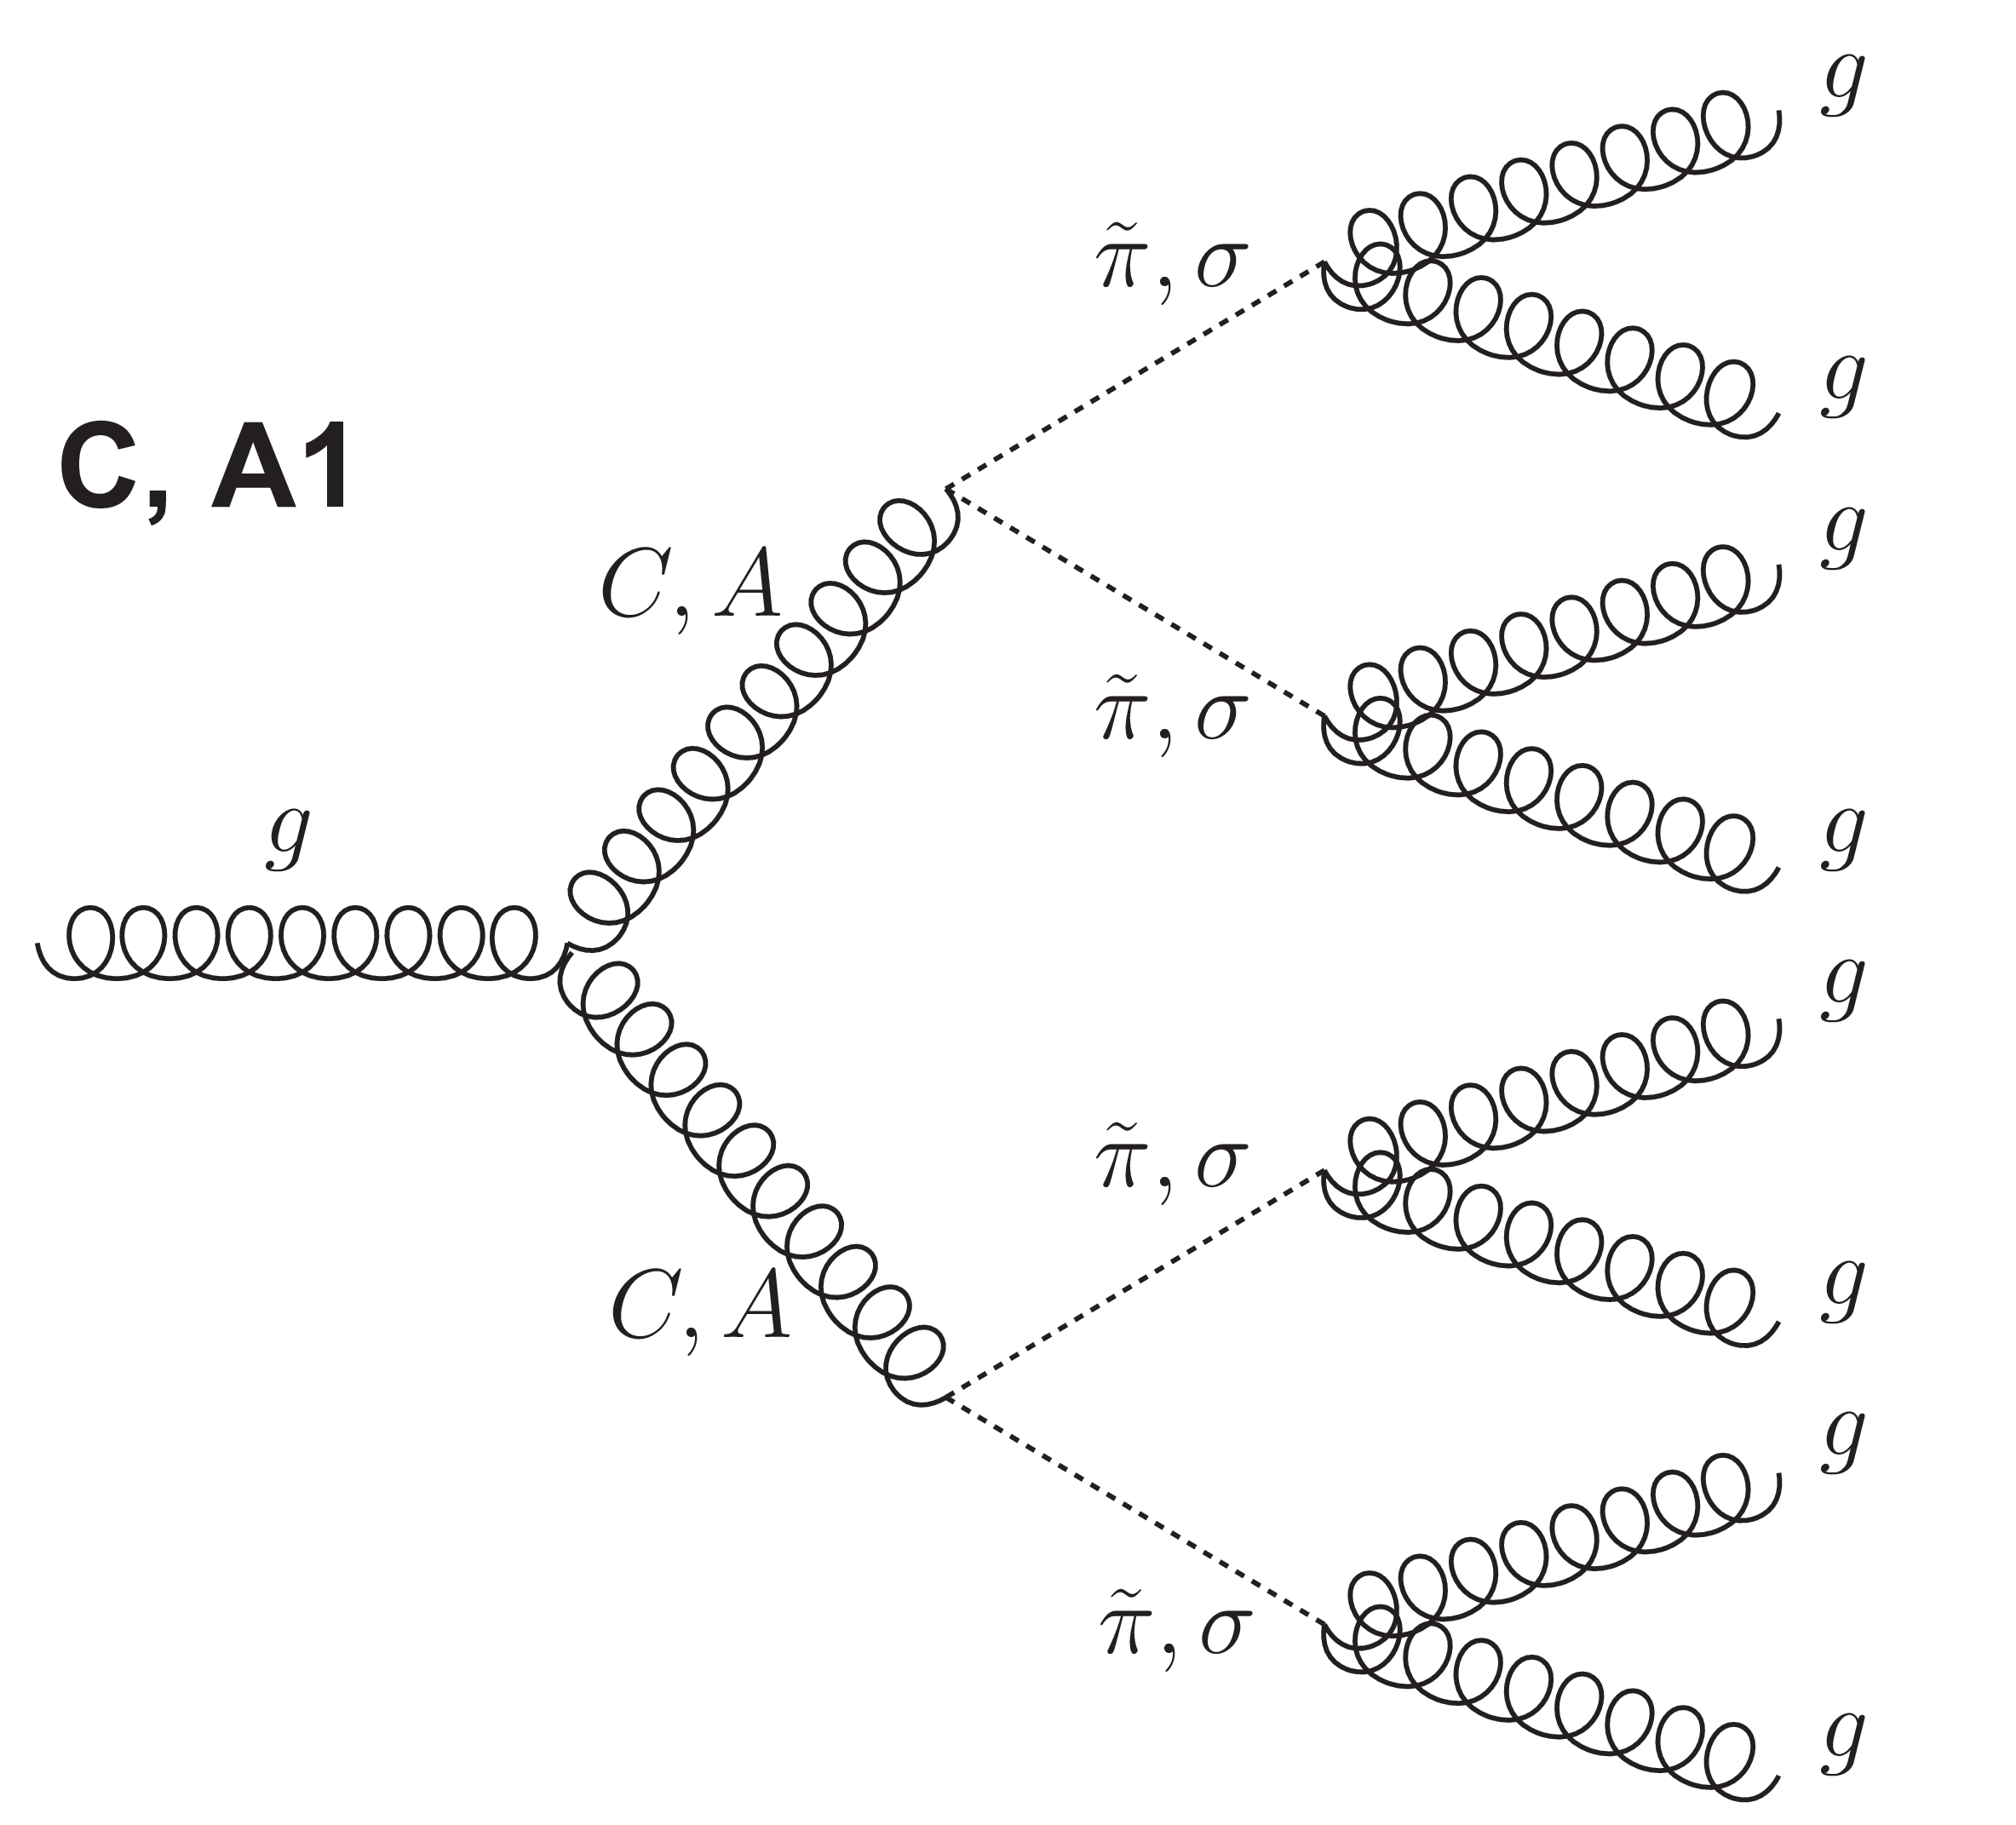
Figure 1-a:
The dominant Feynman diagram representing the $s$-channel pair production of color-octet vector bosons, subsequently decaying into spin-0 particles and finally to gluons. The vector bosons can be colorons C or axigluons A, while the spin-0 particles can be pseudoscalar hyperpions $\tilde{\pi}$ or scalar particles $\sigma $. |
png pdf |
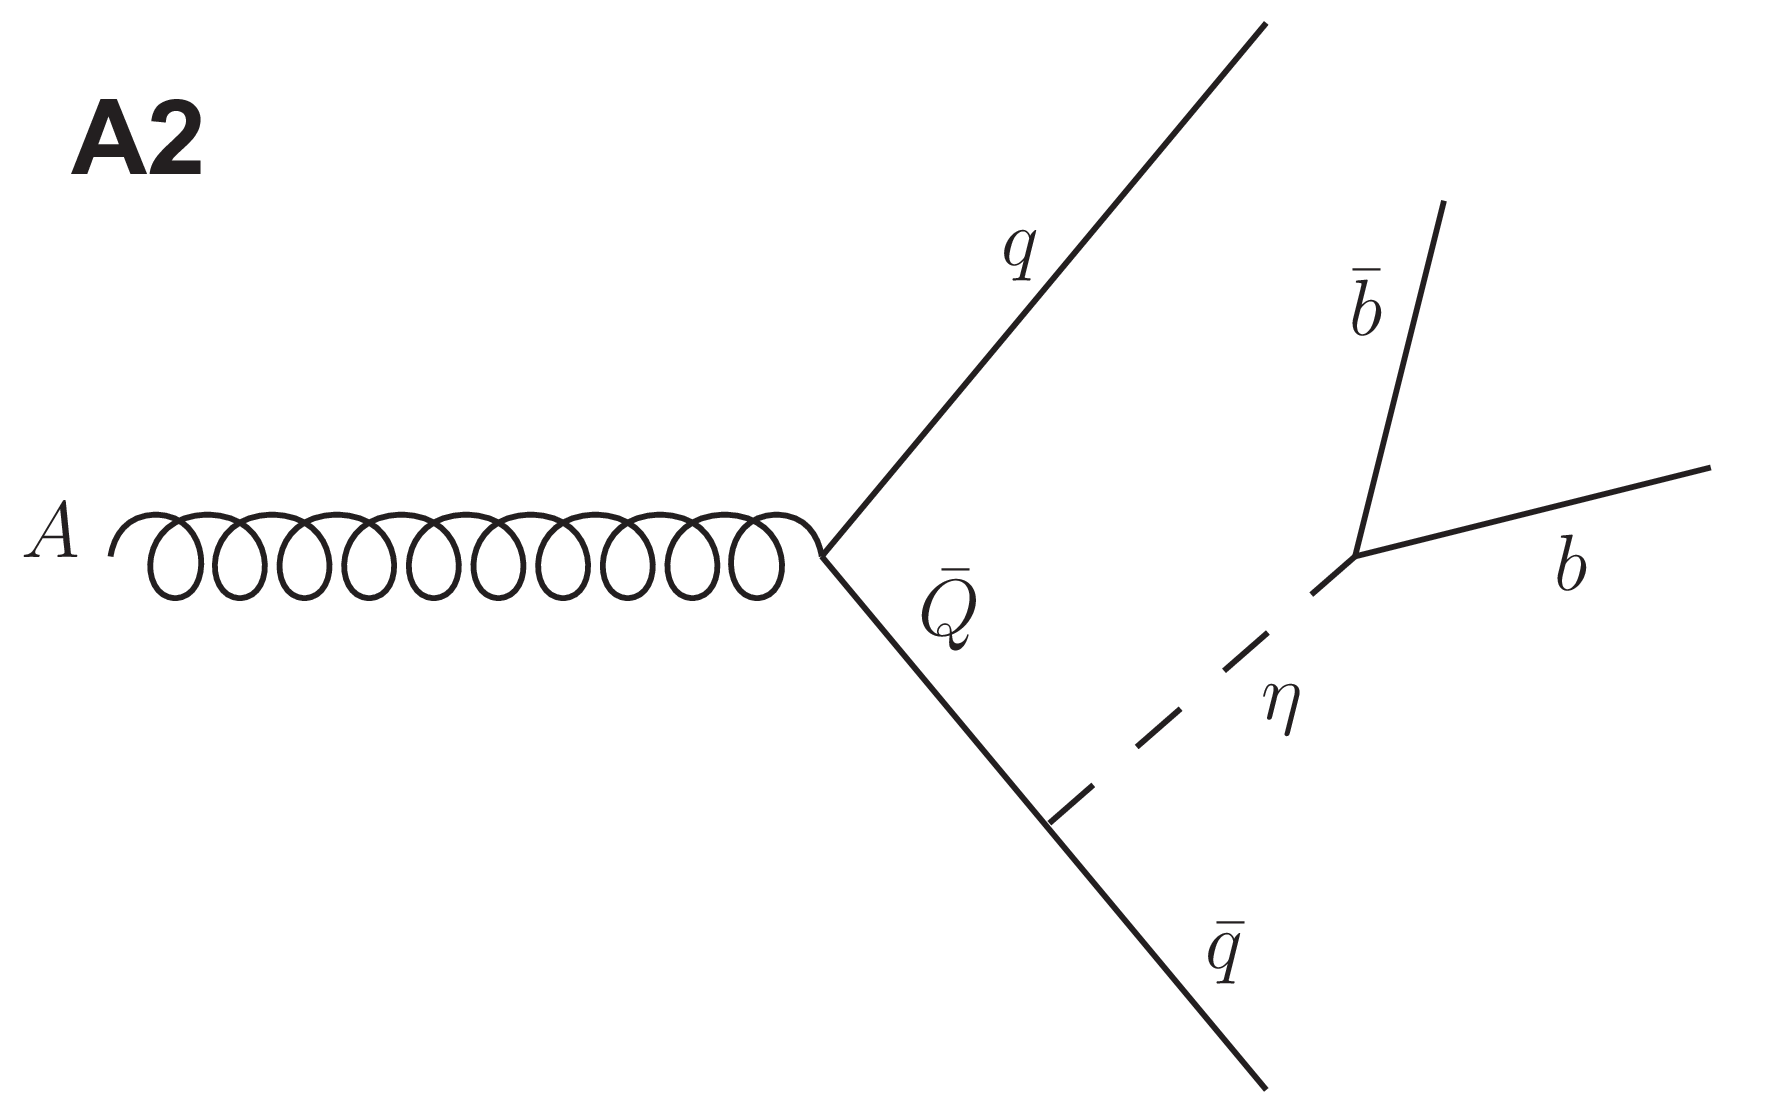
Figure 1-b:
The second decay mode of an axigluon considered in this analysis, involving a heavy quark Q and a pseudogoldstone boson $\eta $ with Higgs-like couplings. |
png pdf |
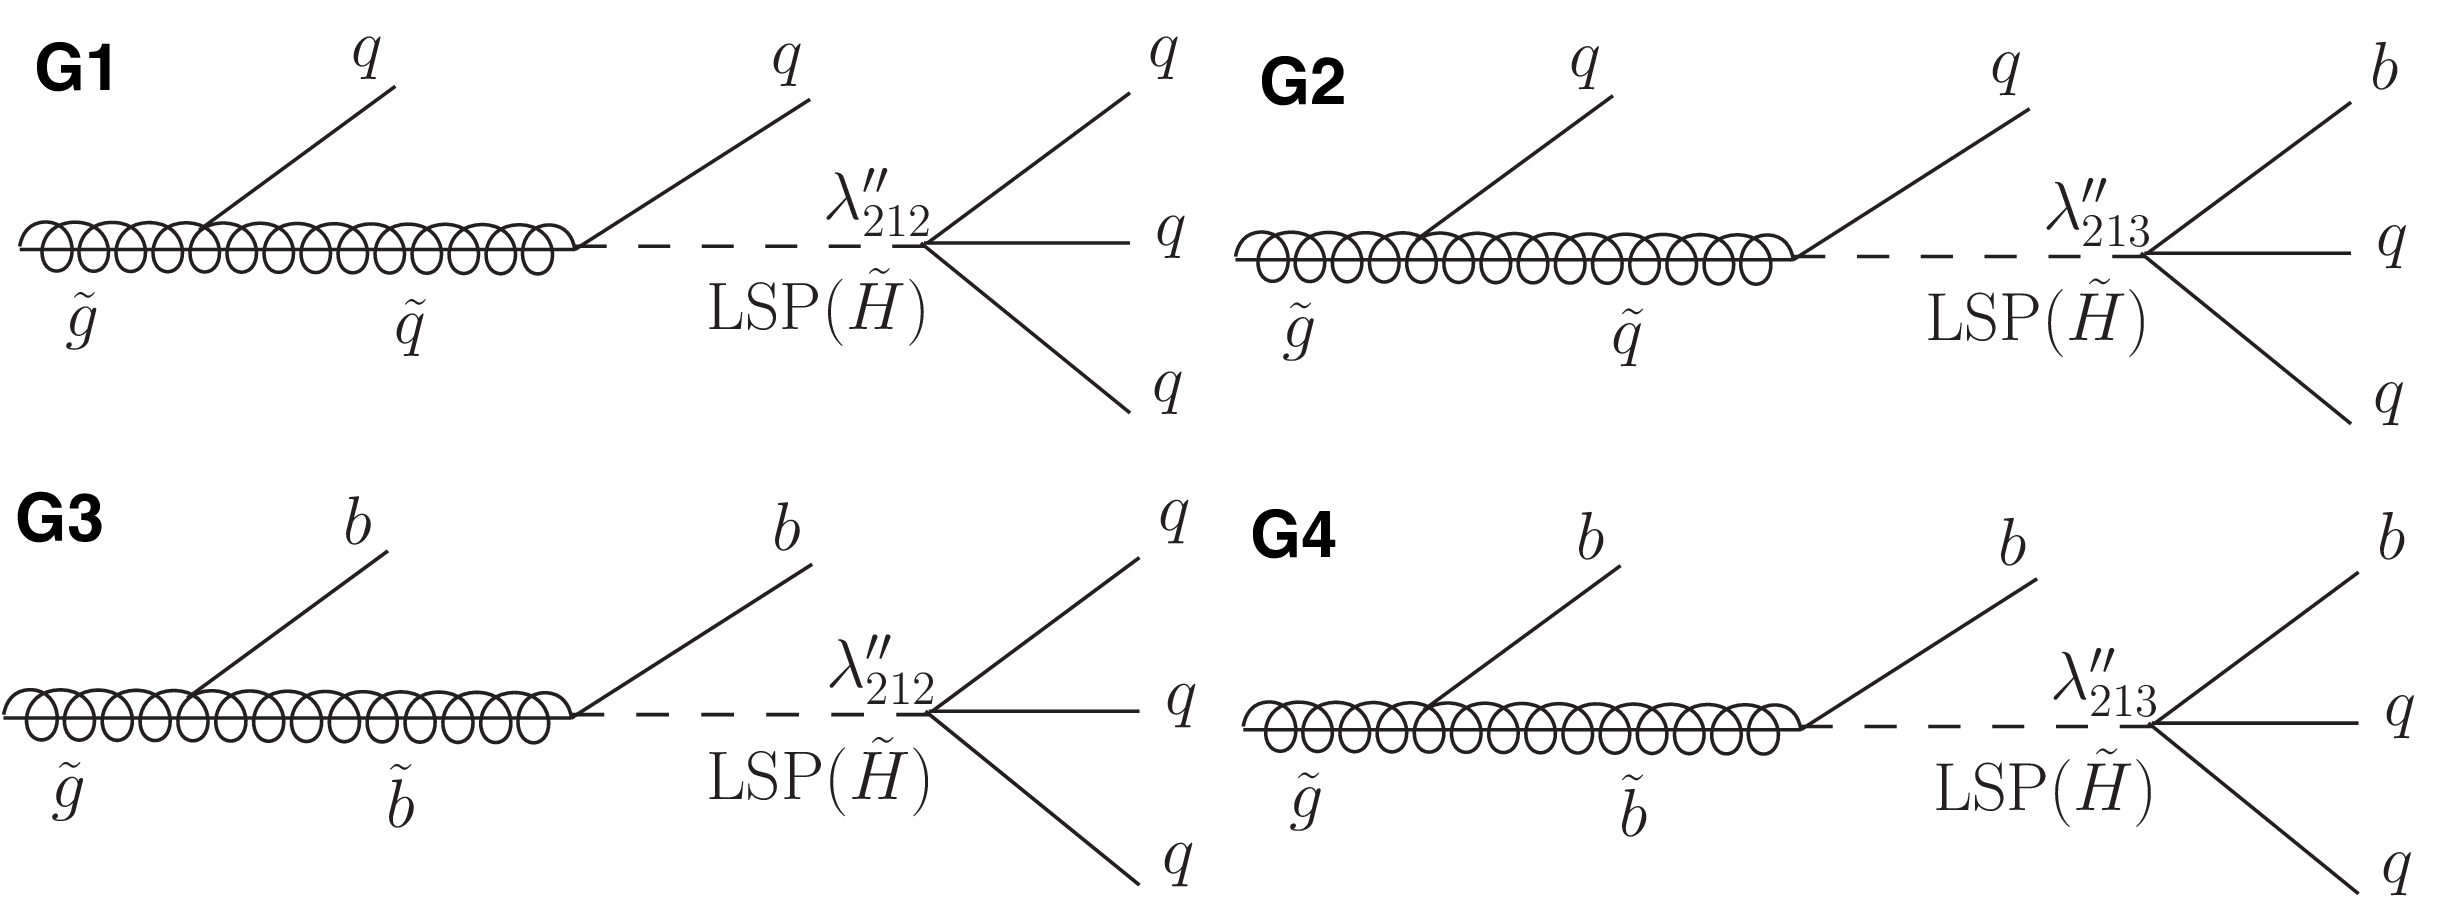
Figure 2:
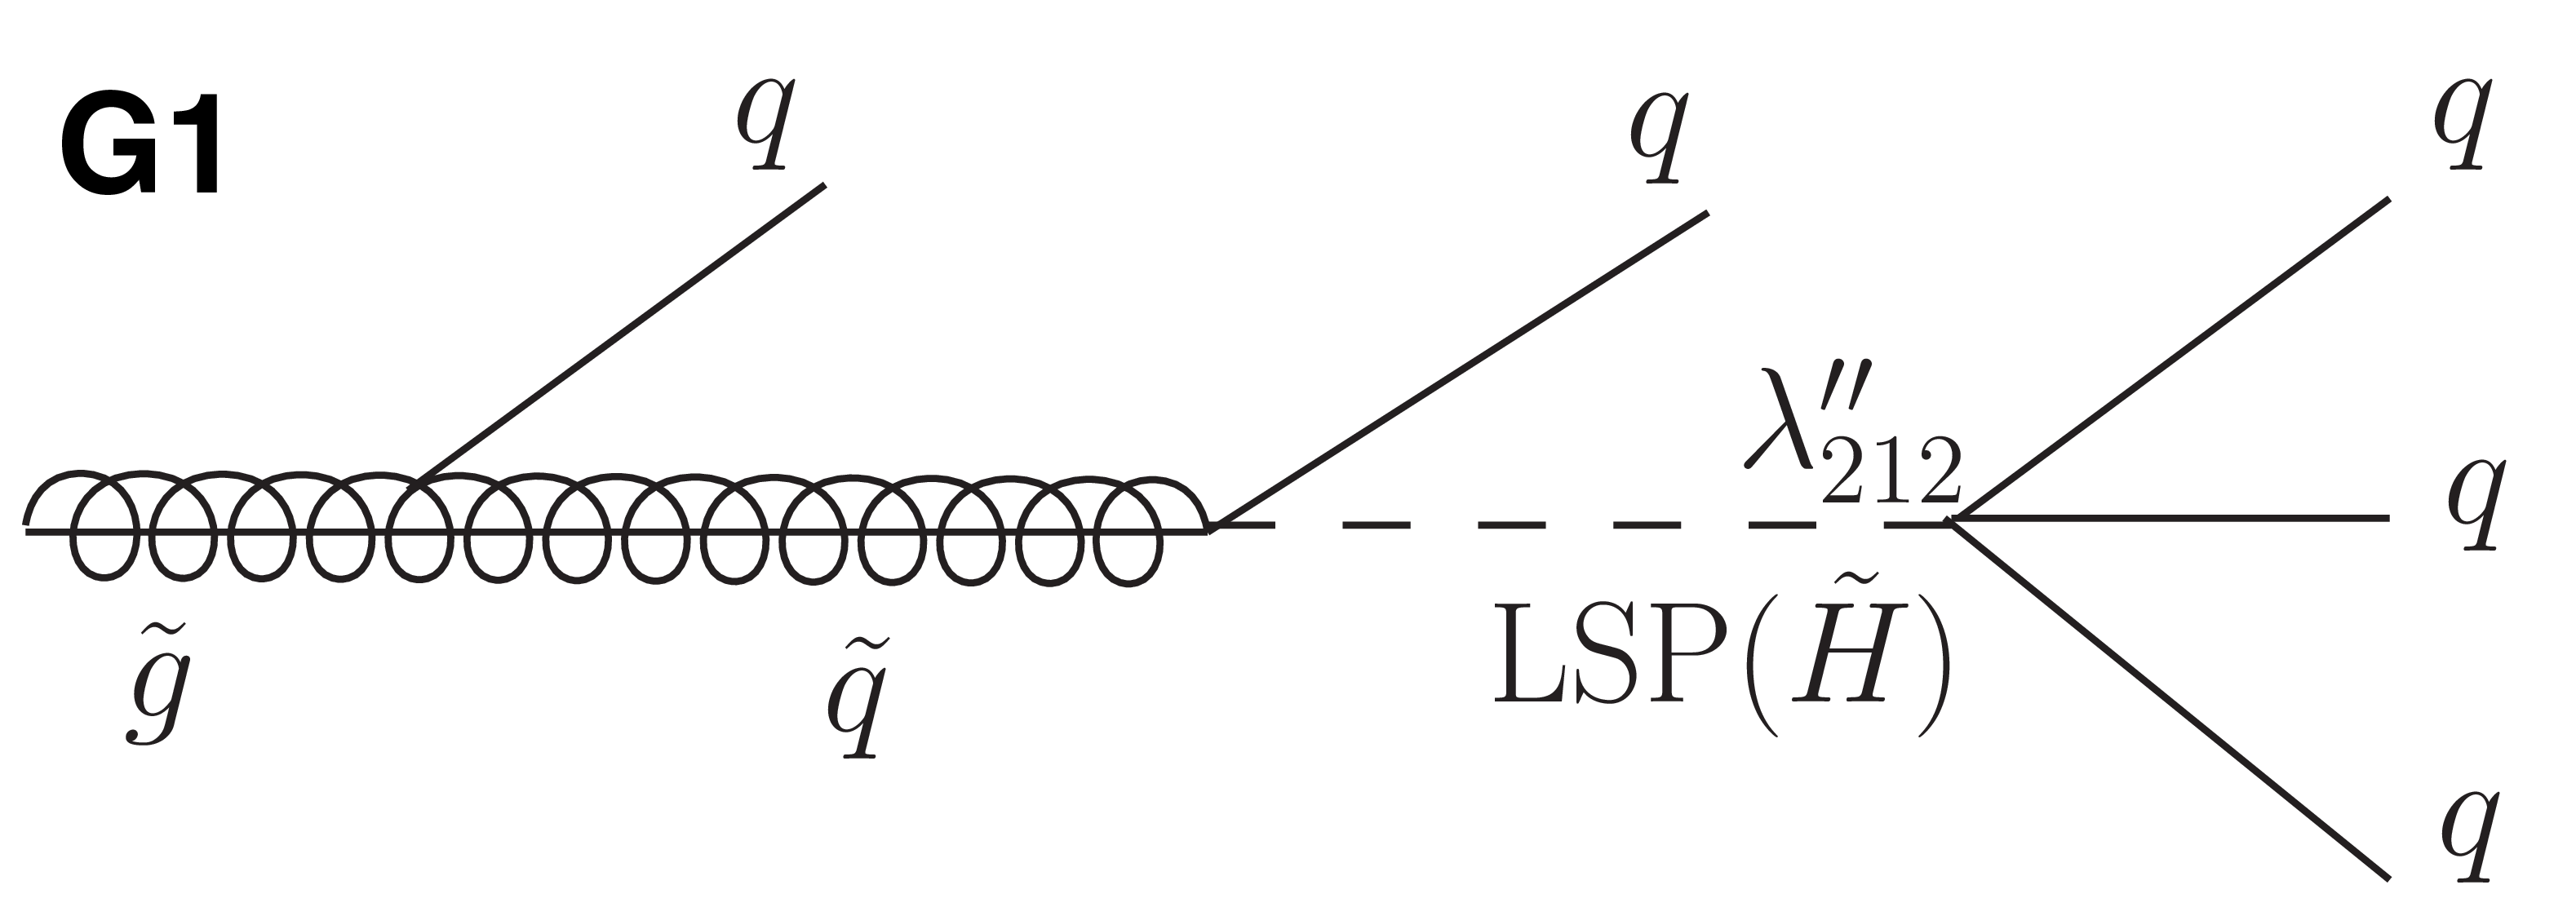
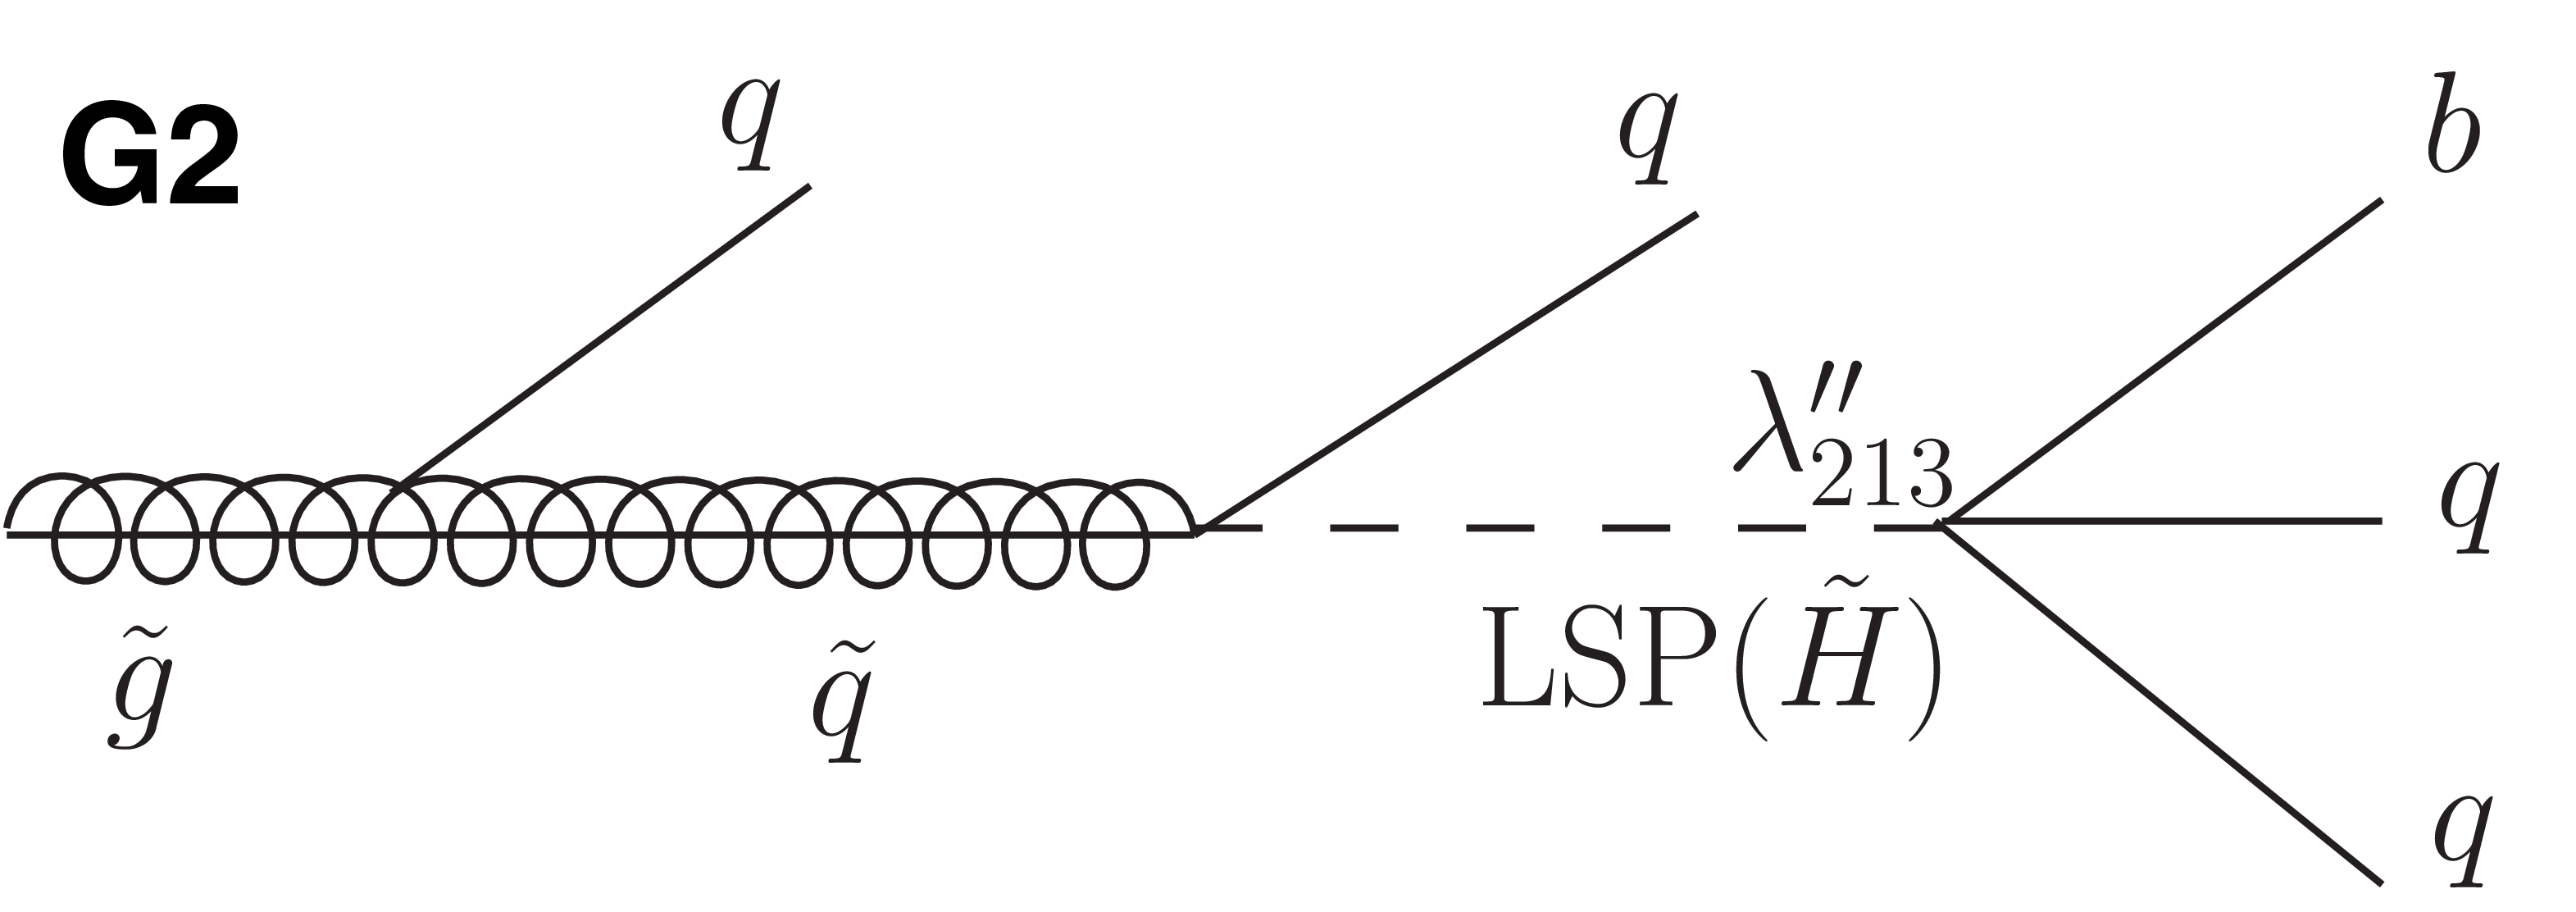
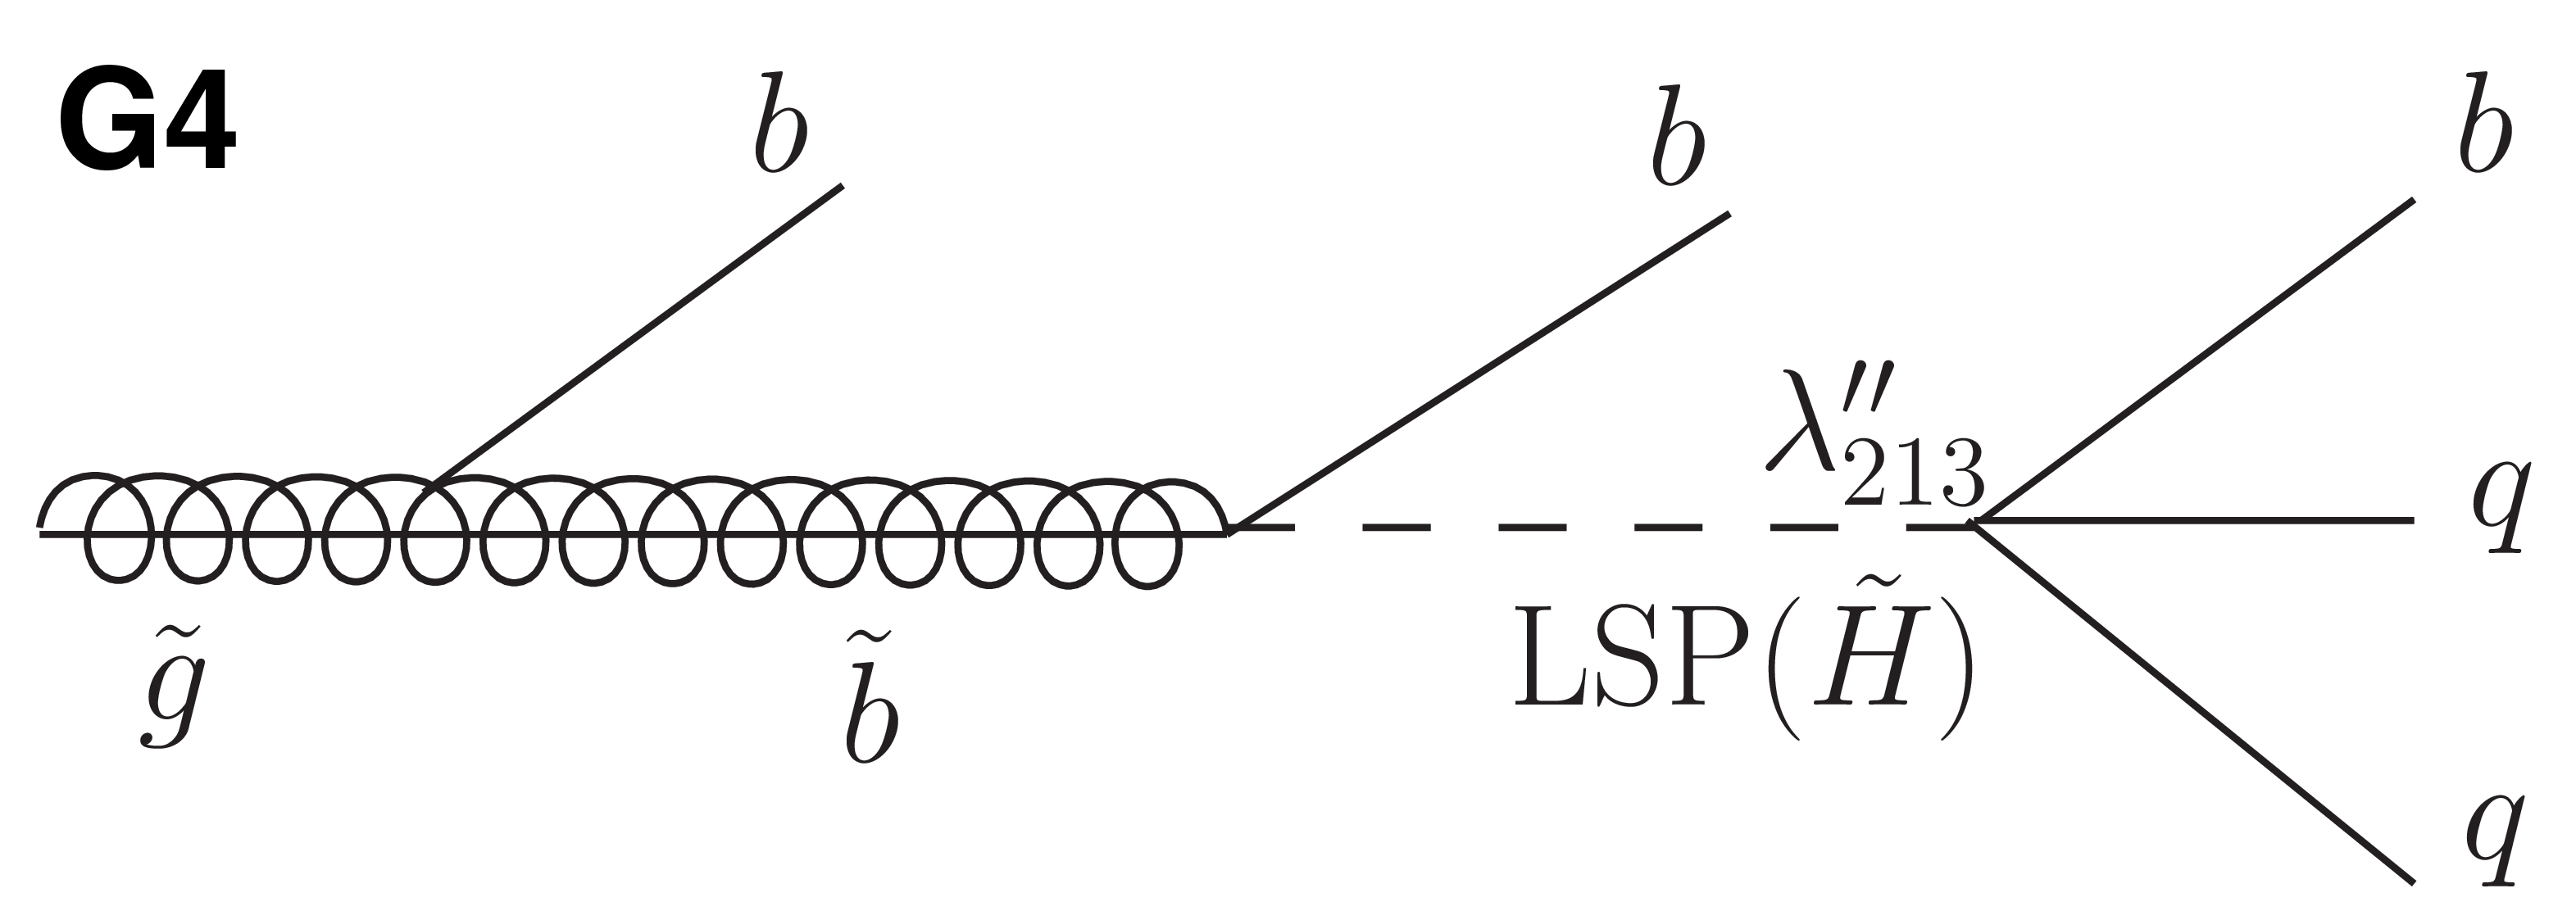
Gluino decay modes in the RPV SUSY scenario considered. Depending on the RPV coupling and the nature of the squark, zero (top left), one (top right), two (bottom left), or three (bottom right) b quarks can be present in each decay. |
png pdf |
Figure 2-a:
One gluino decay mode in the RPV SUSY scenario considered. Depending on the RPV coupling and the nature of the squark, zero b quark can be present in each decay. |
png pdf |
Figure 2-b:
One gluino decay mode in the RPV SUSY scenario considered. Depending on the RPV coupling and the nature of the squark, one b quark can be present in each decay. |

png pdf |
Figure 2-c:
One gluino decay mode in the RPV SUSY scenario considered. Depending on the RPV coupling and the nature of the squark, two b quarks can be present in each decay. |
png pdf |
Figure 2-d:
One gluino decay mode in the RPV SUSY scenario considered. Depending on the RPV coupling and the nature of the squark, three b quarks can be present in each decay. |
png pdf |
Figure 3:
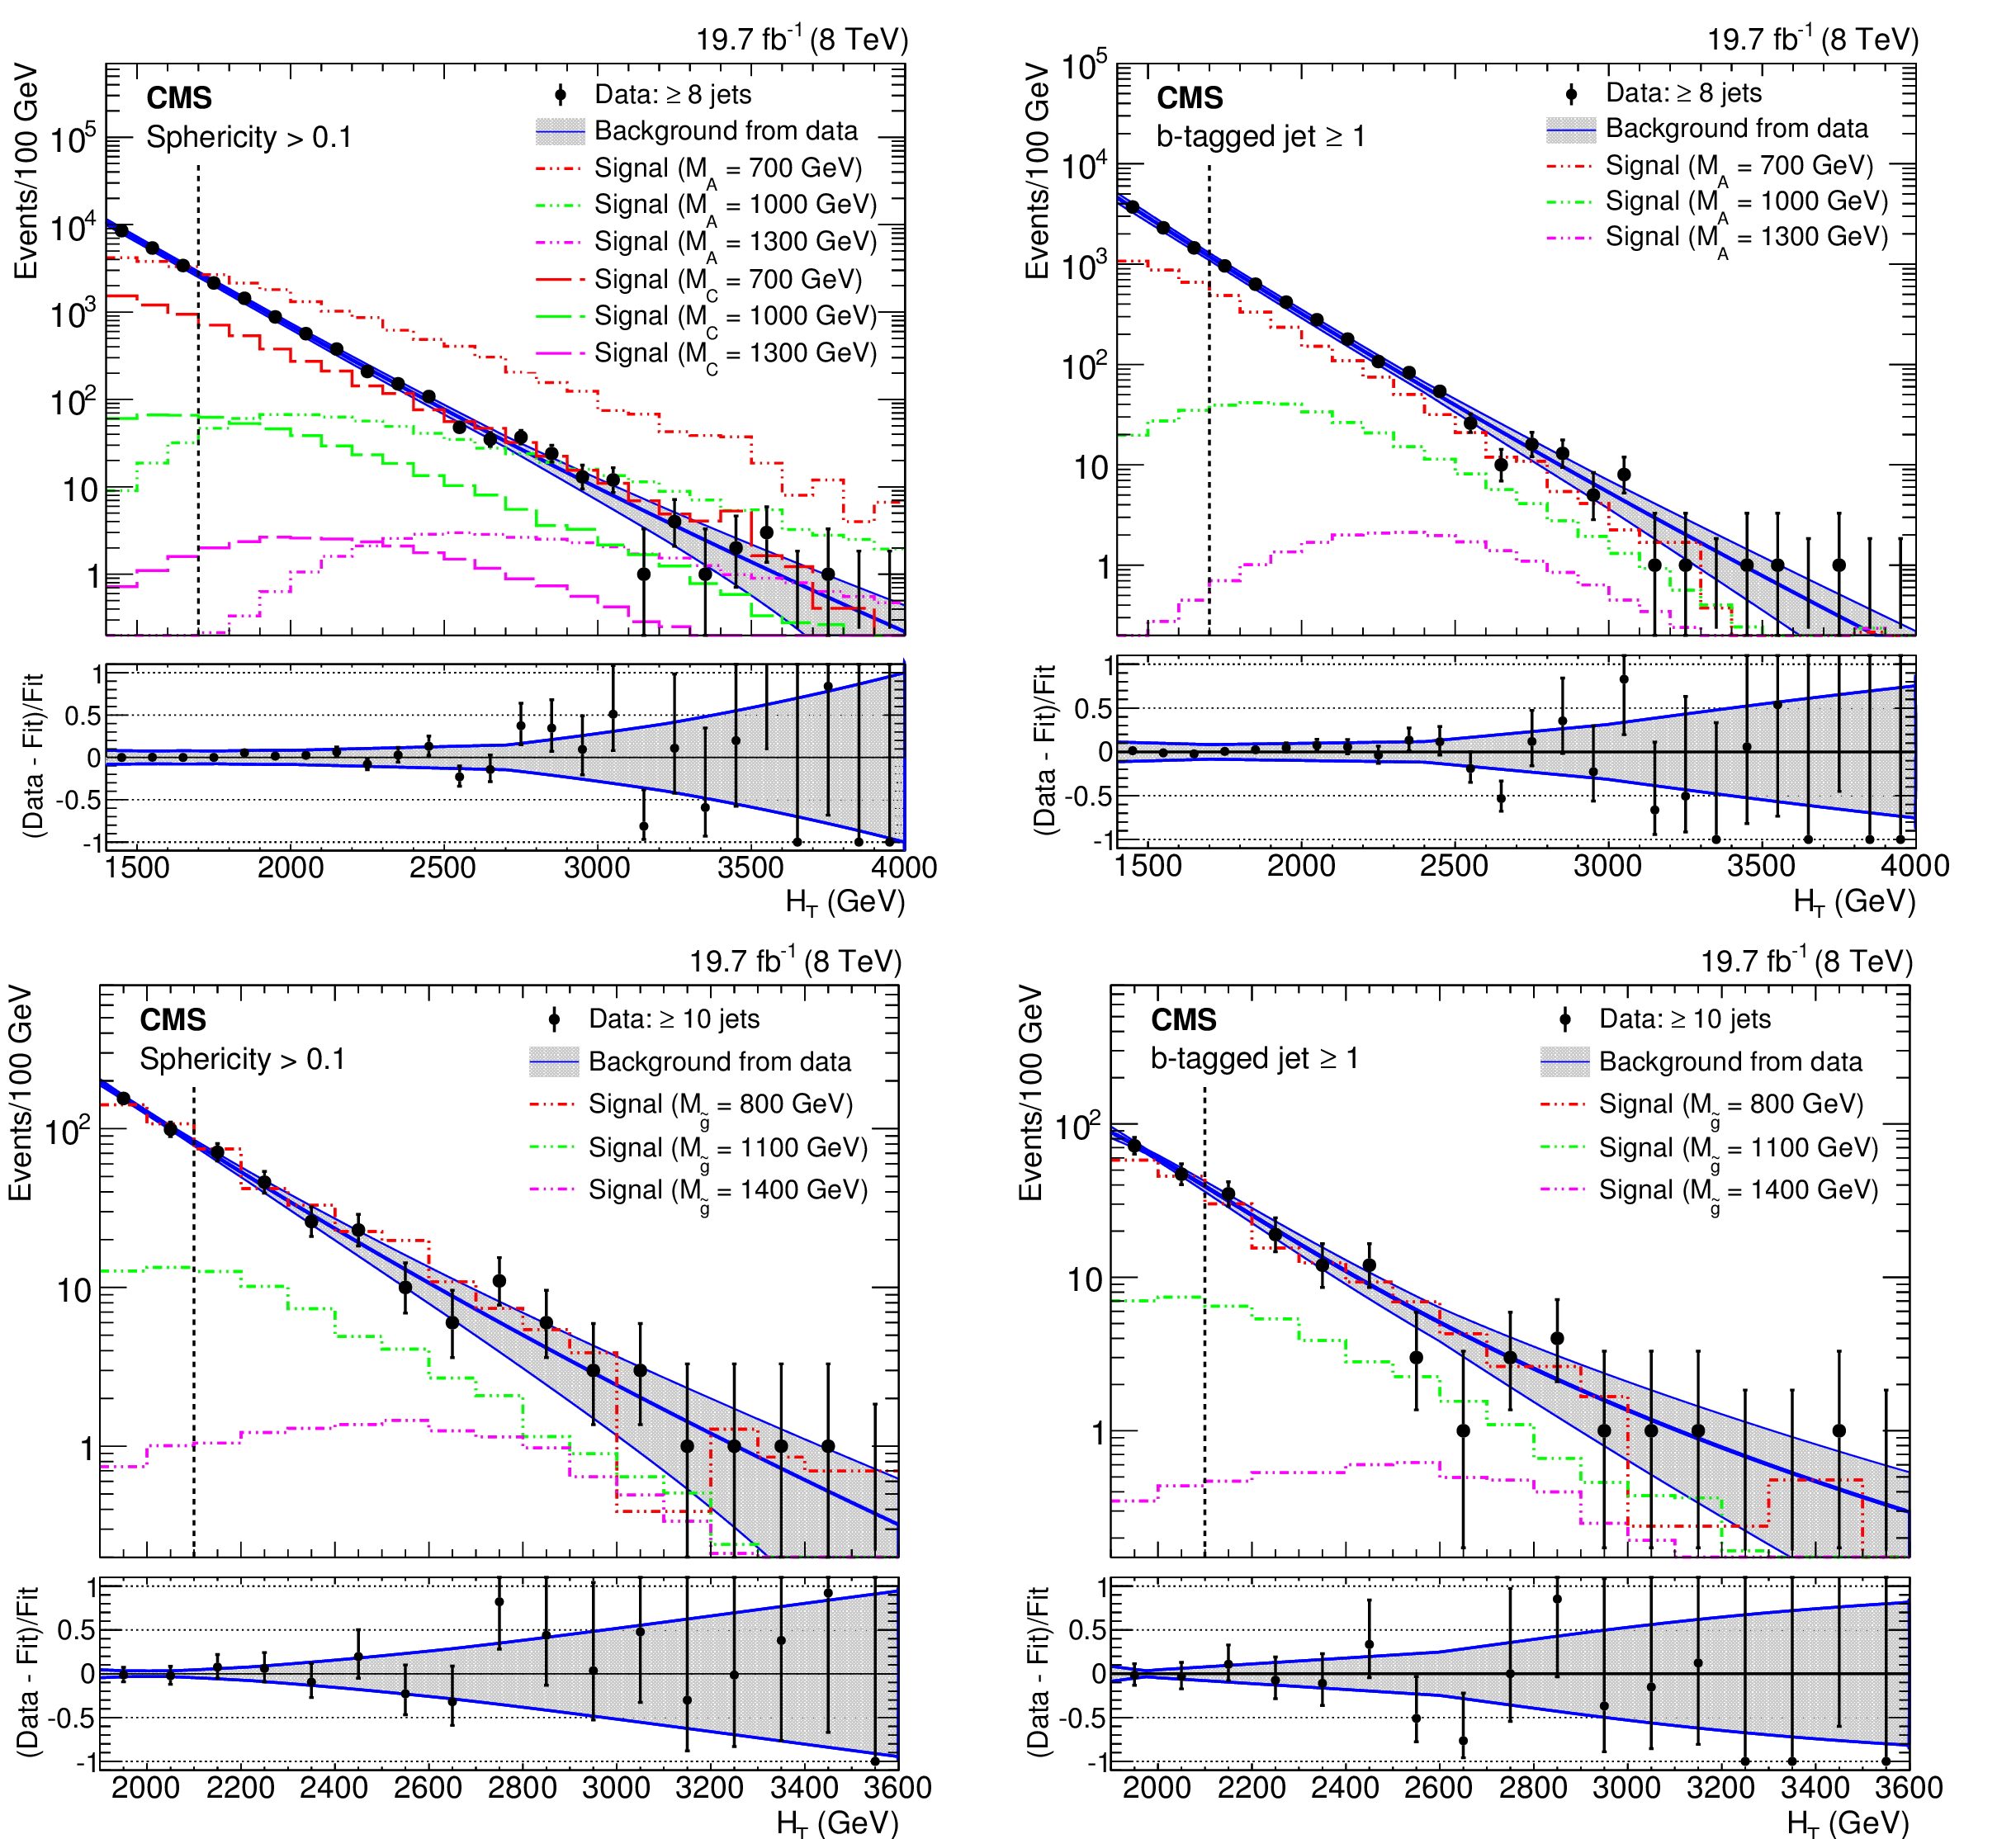
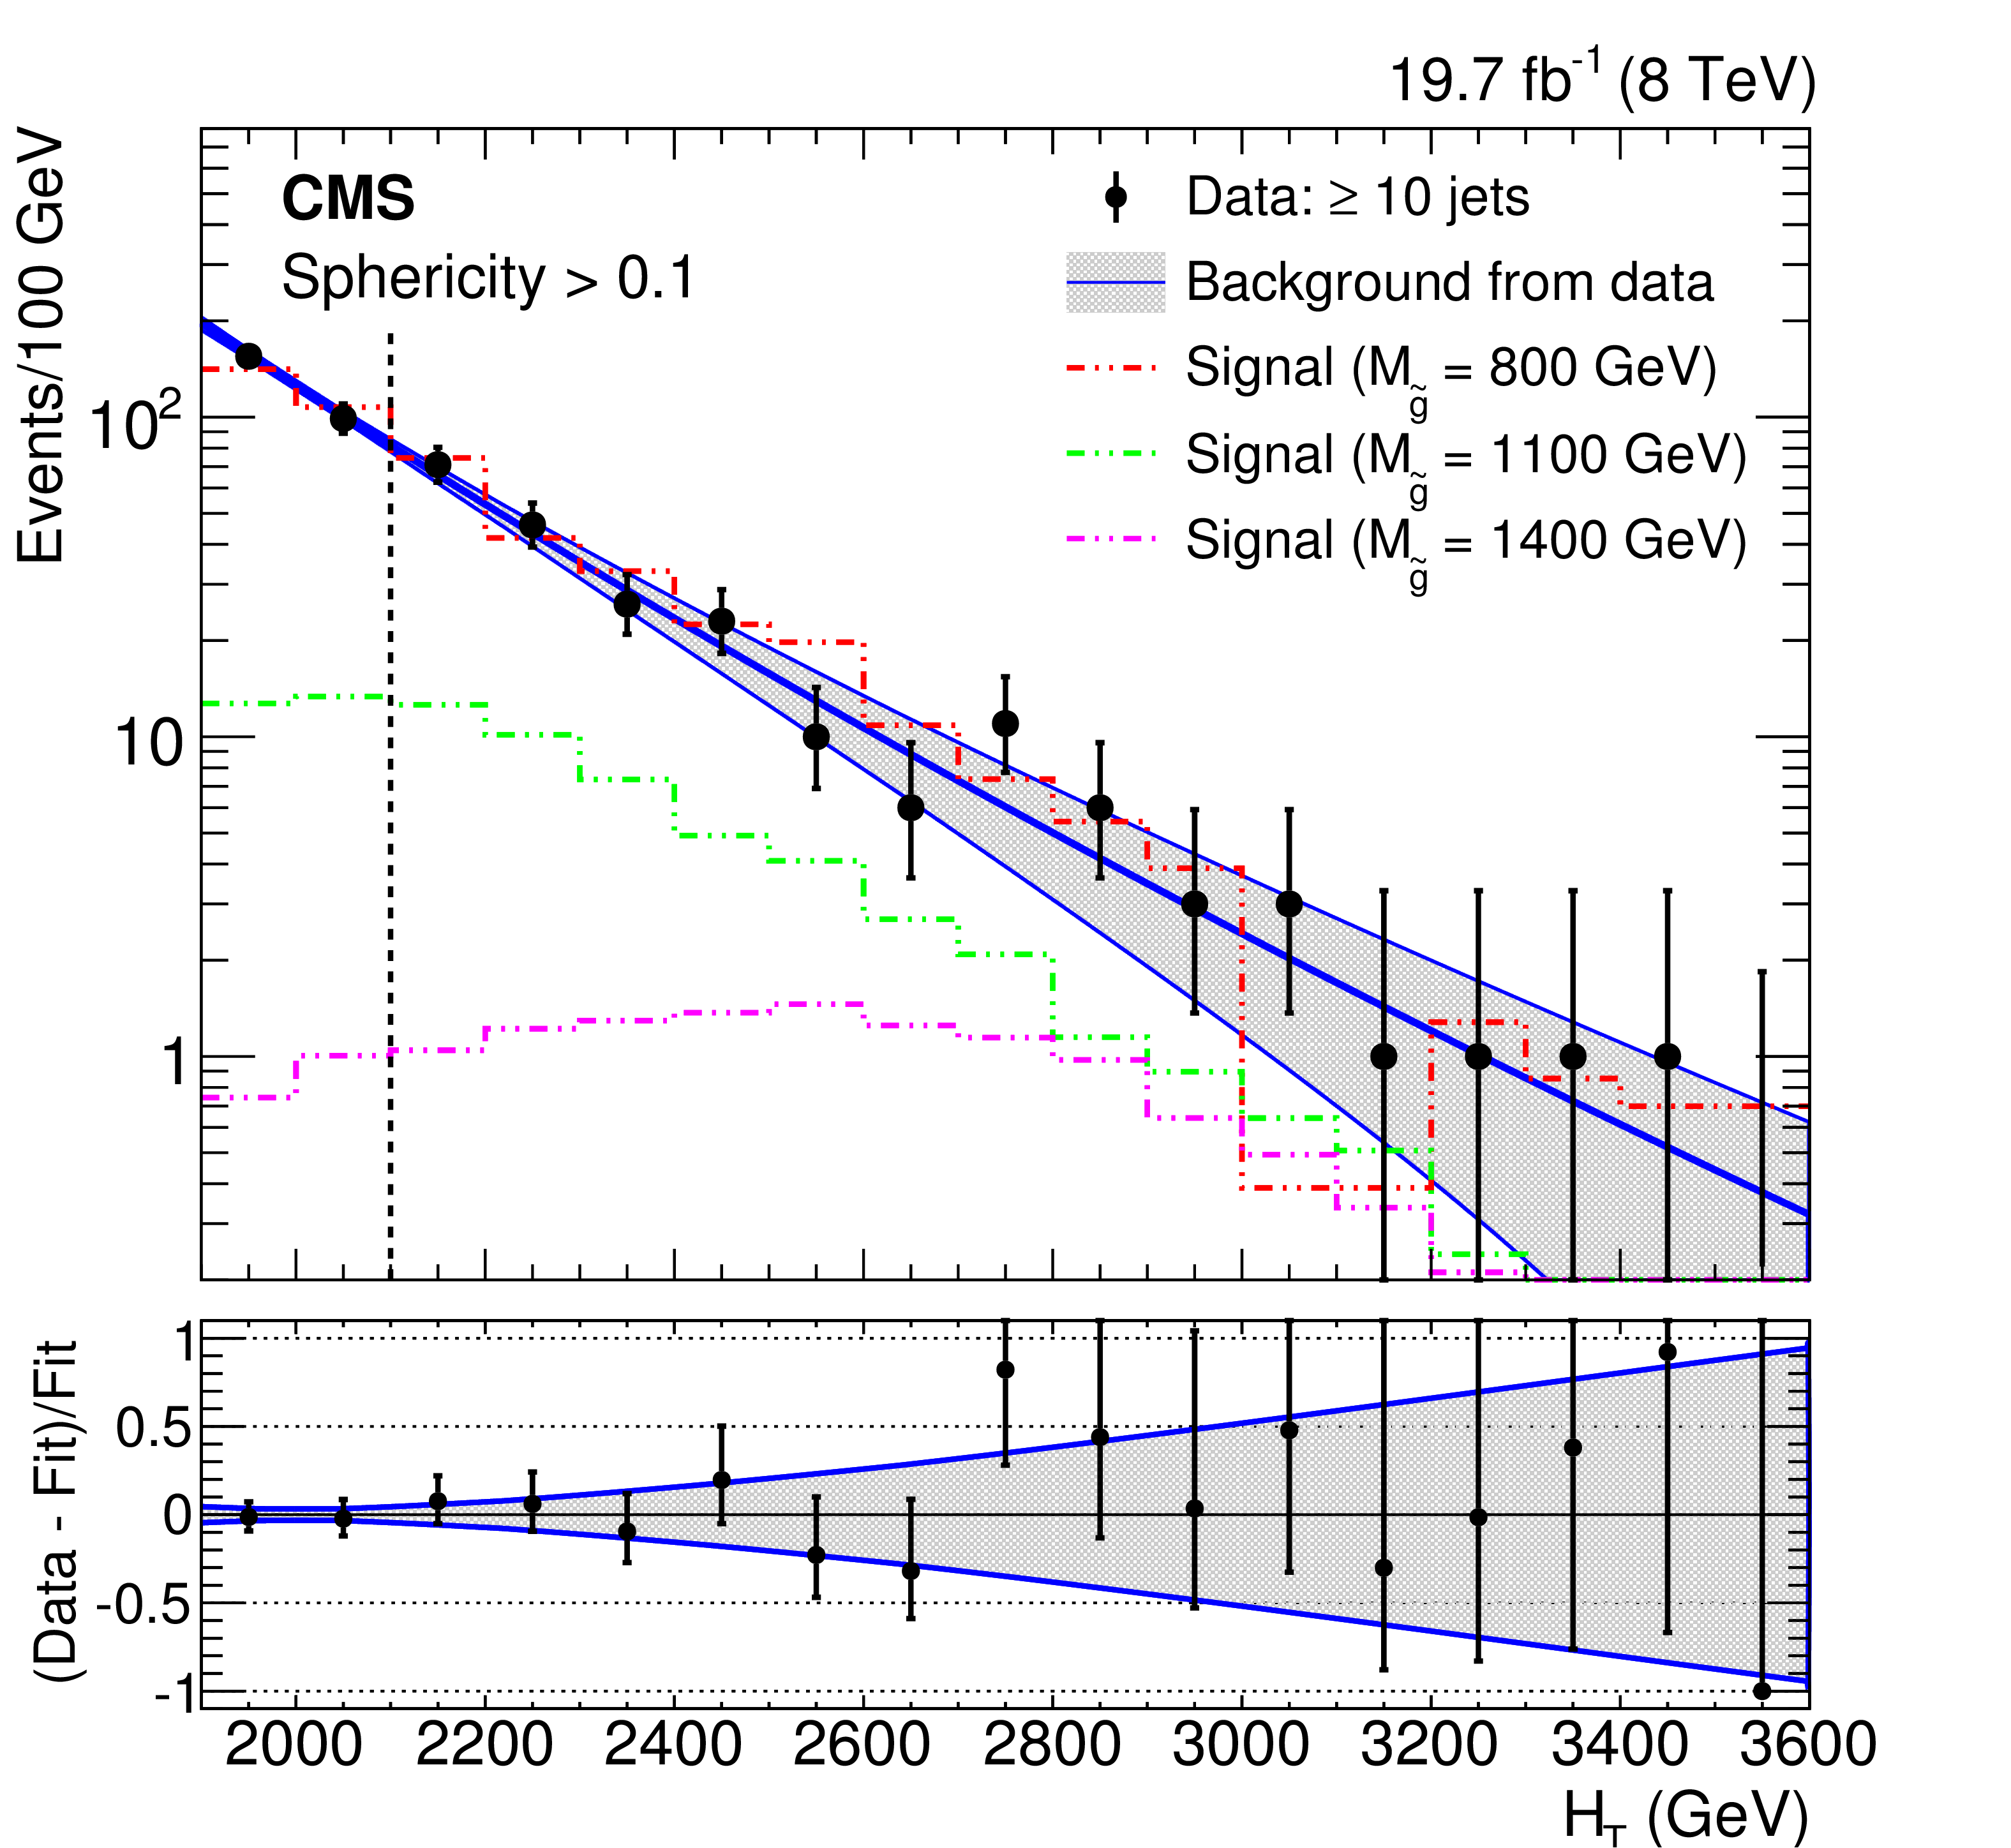
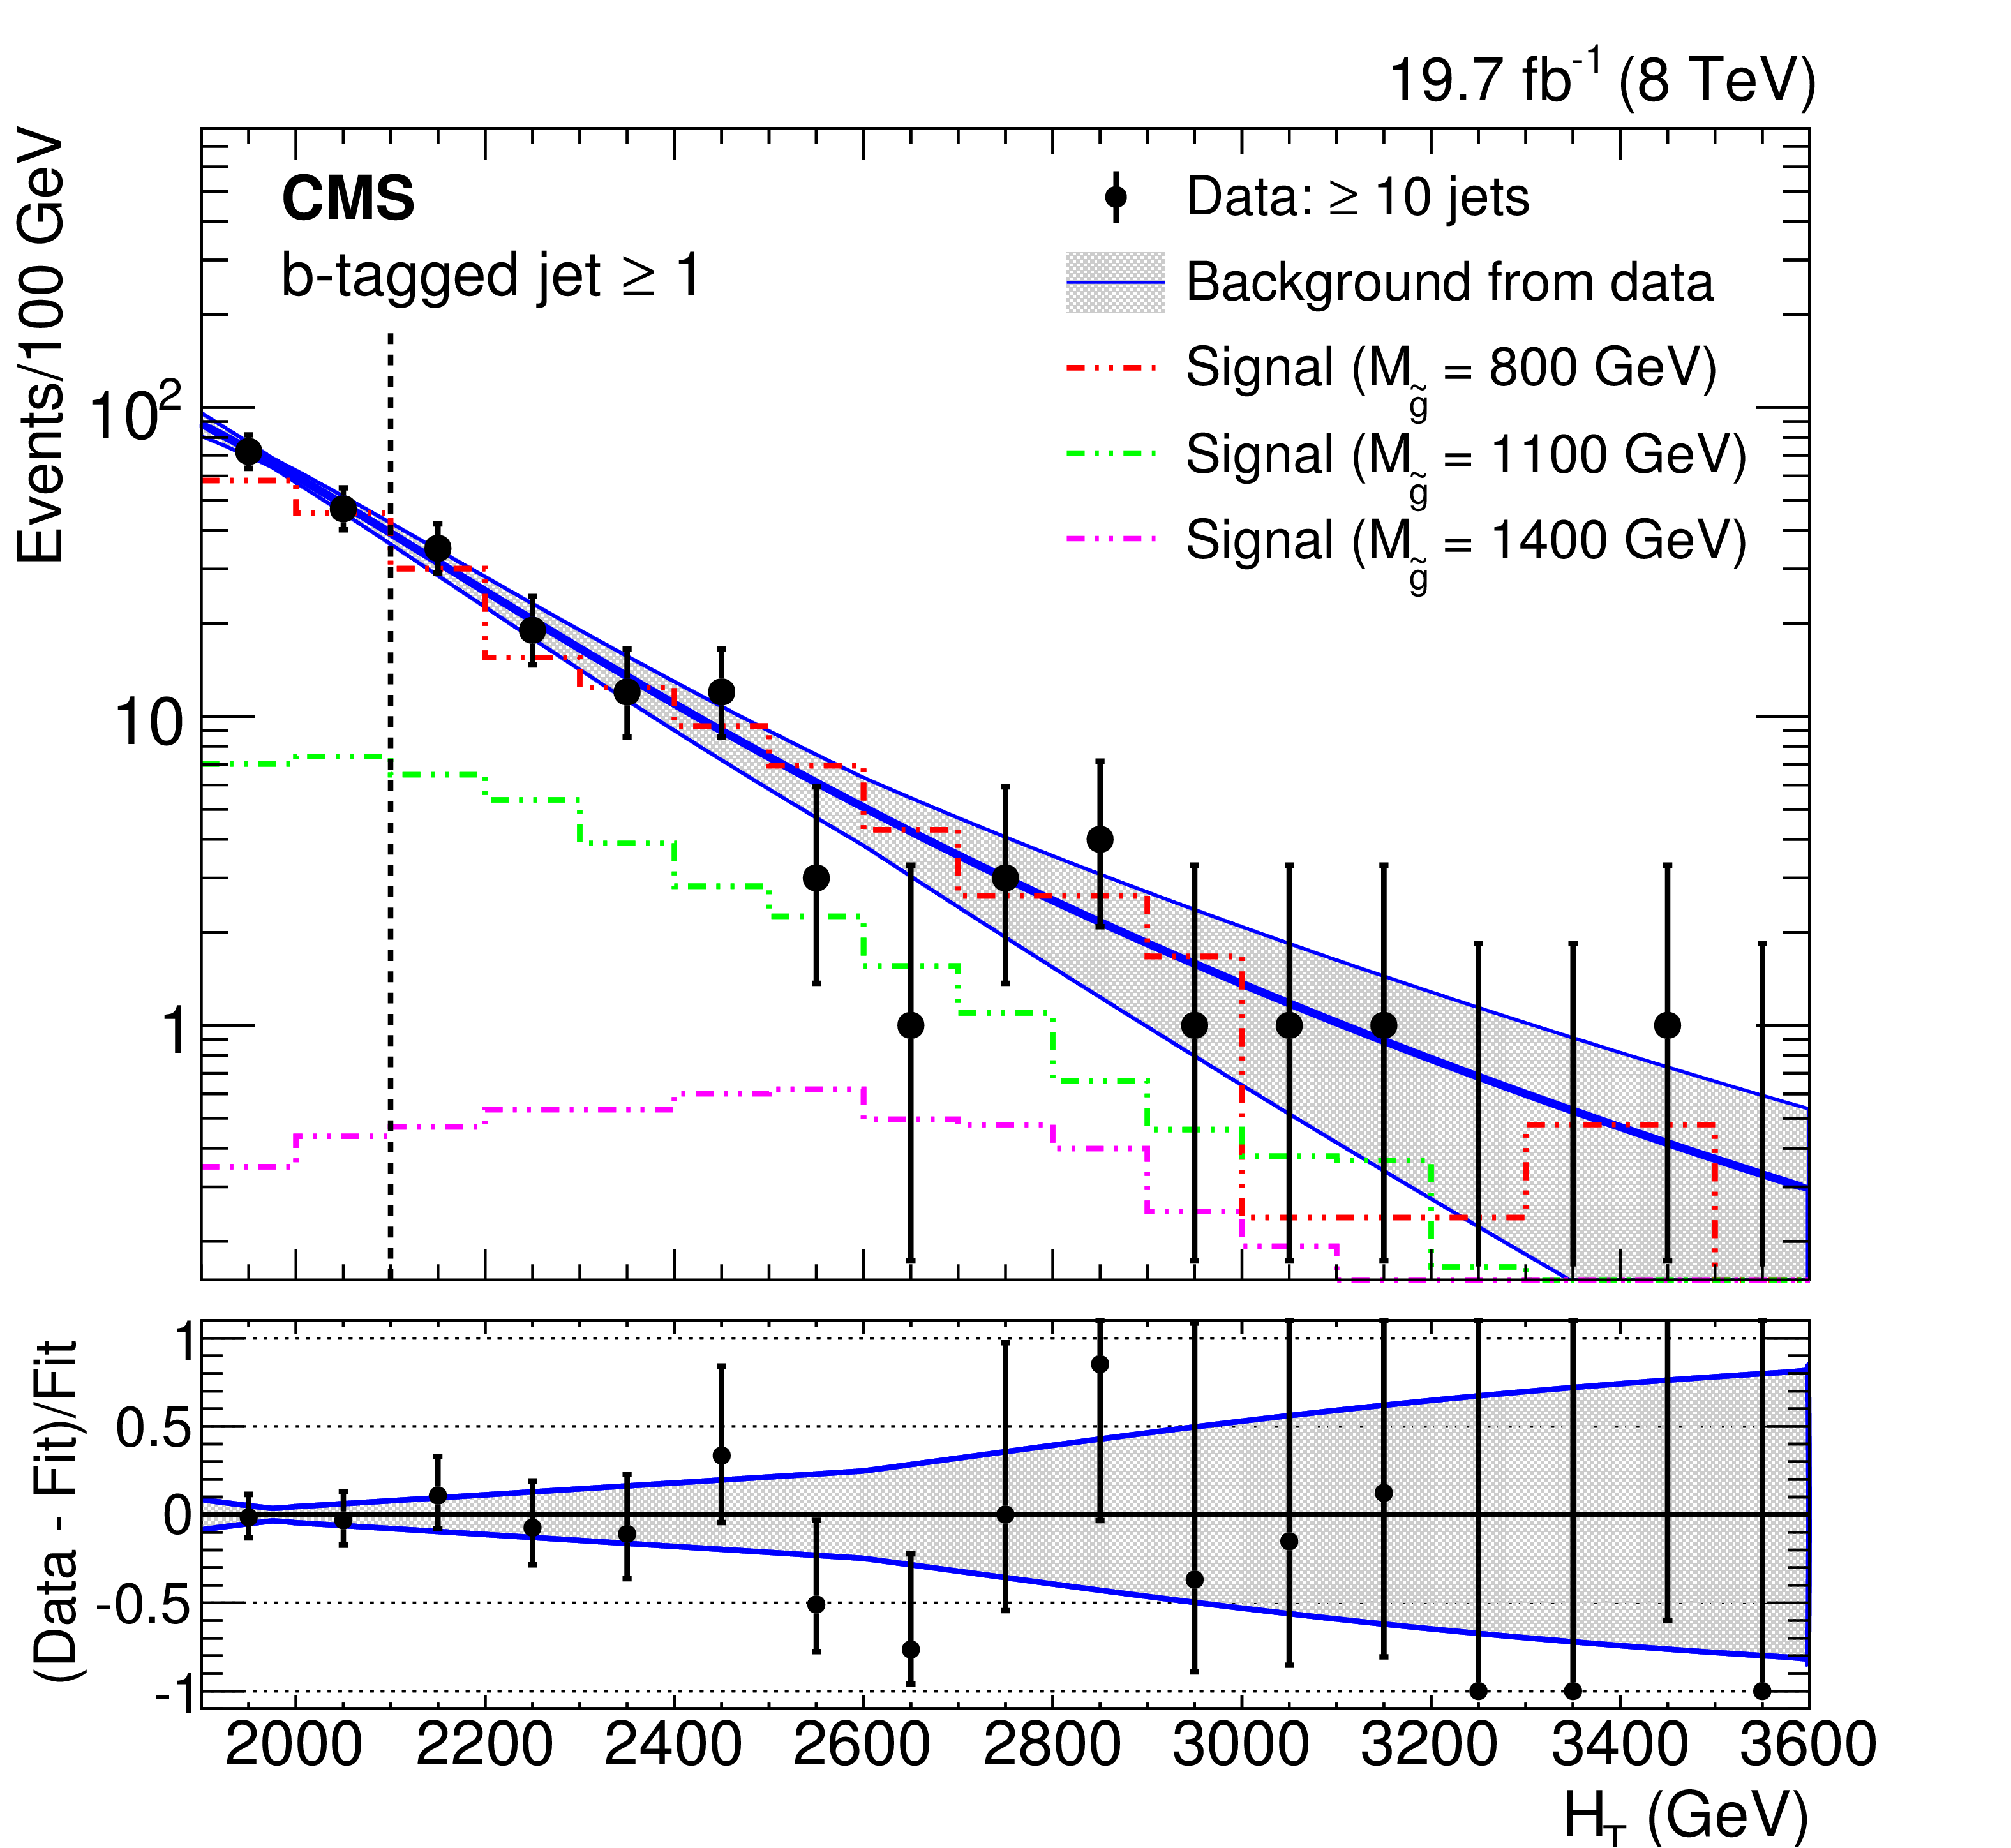
The $ {H_{\mathrm {T}}} $ distributions in data (points), background estimated from data (blue thick solid line in the upper panels) with its uncertainty (gray shaded band), and representative signal model predictions (histograms). Top left: eight or more jets, no b tagging requirement, with the coloron ($\Gamma _\mathrm {C}/M_\mathrm {C} =$ 20%, $M_{\tilde{\pi} } = M_\mathrm {C}/3$) and axigluon A1 ($\Gamma _\mathrm {A}/M_\mathrm {A} =$ 15%, $M_{\sigma /\tilde{\pi} } = M_\mathrm {A}/3$) signals overlaid. Top right: eight or more jets, one or more b-tagged jets, with the A2 ($\Gamma _\mathrm {A}/M_\mathrm {A} =$ 15%, $M_{\sigma /\tilde{\pi} } = M_\mathrm {A}/3$) axigluon signal points overlaid. Bottom left (right): ten or more jets without b tagging requirement (with one or more b-tagged jets), with RPV SUSY gluino signals overlaid. The lower panels show the distribution of the quantity (Data $-$ Fit)/Fit. The error bars on the plotted values indicate the statistical uncertainty associated with the data, and the shaded band indicates the systematic uncertainty. |

png pdf |
Figure 3-a:
The $ {H_{\mathrm {T}}} $ distribution in data (points), background estimated from data (blue thick solid line in the upper panels) with its uncertainty (gray shaded band), and representative signal model predictions (histograms) with eight or more jets, no b tagging requirement, with the coloron ($\Gamma _\mathrm {C}/M_\mathrm {C} =$ 20%, $M_{\tilde{\pi} } = M_\mathrm {C}/3$) and axigluon A1 ($\Gamma _\mathrm {A}/M_\mathrm {A} =$ 15%, $M_{\sigma /\tilde{\pi} } = M_\mathrm {A}/3$) signals overlaid. The lower panel shows the distribution of the quantity (Data $-$ Fit)/Fit. The error bars on the plotted values indicate the statistical uncertainty associated with the data, and the shaded band indicates the systematic uncertainty. |

png pdf |
Figure 3-b:
The $ {H_{\mathrm {T}}} $ distribution in data (points), background estimated from data (blue thick solid line in the upper panels) with its uncertainty (gray shaded band), and representative signal model predictions (histograms) with eight or more jets, one or more b-tagged jets, with the A2 ($\Gamma _\mathrm {A}/M_\mathrm {A} =$ 15%, $M_{\sigma /\tilde{\pi} } = M_\mathrm {A}/3$) axigluon signal points overlaid. The lower panel shows the distribution of the quantity (Data $-$ Fit)/Fit. The error bars on the plotted values indicate the statistical uncertainty associated with the data, and the shaded band indicates the systematic uncertainty. |
png pdf |
Figure 3-c:
The $ {H_{\mathrm {T}}} $ distribution in data (points), background estimated from data (blue thick solid line in the upper panels) with its uncertainty (gray shaded band), and representative signal model predictions (histograms) ten or more jets without b tagging requirement, with RPV SUSY gluino signals overlaid. The lower panel shows the distribution of the quantity (Data $-$ Fit)/Fit. The error bars on the plotted values indicate the statistical uncertainty associated with the data, and the shaded band indicates the systematic uncertainty. |
png pdf |
Figure 3-d:
The $ {H_{\mathrm {T}}} $ distribution in data (points), background estimated from data (blue thick solid line in the upper panels) with its uncertainty (gray shaded band), and representative signal model predictions (histograms) ten or more jets with one or more b-tagged jets, with RPV SUSY gluino signals overlaid. The lower panel shows the distribution of the quantity (Data $-$ Fit)/Fit. The error bars on the plotted values indicate the statistical uncertainty associated with the data, and the shaded band indicates the systematic uncertainty. |
png pdf |
Figure 4:
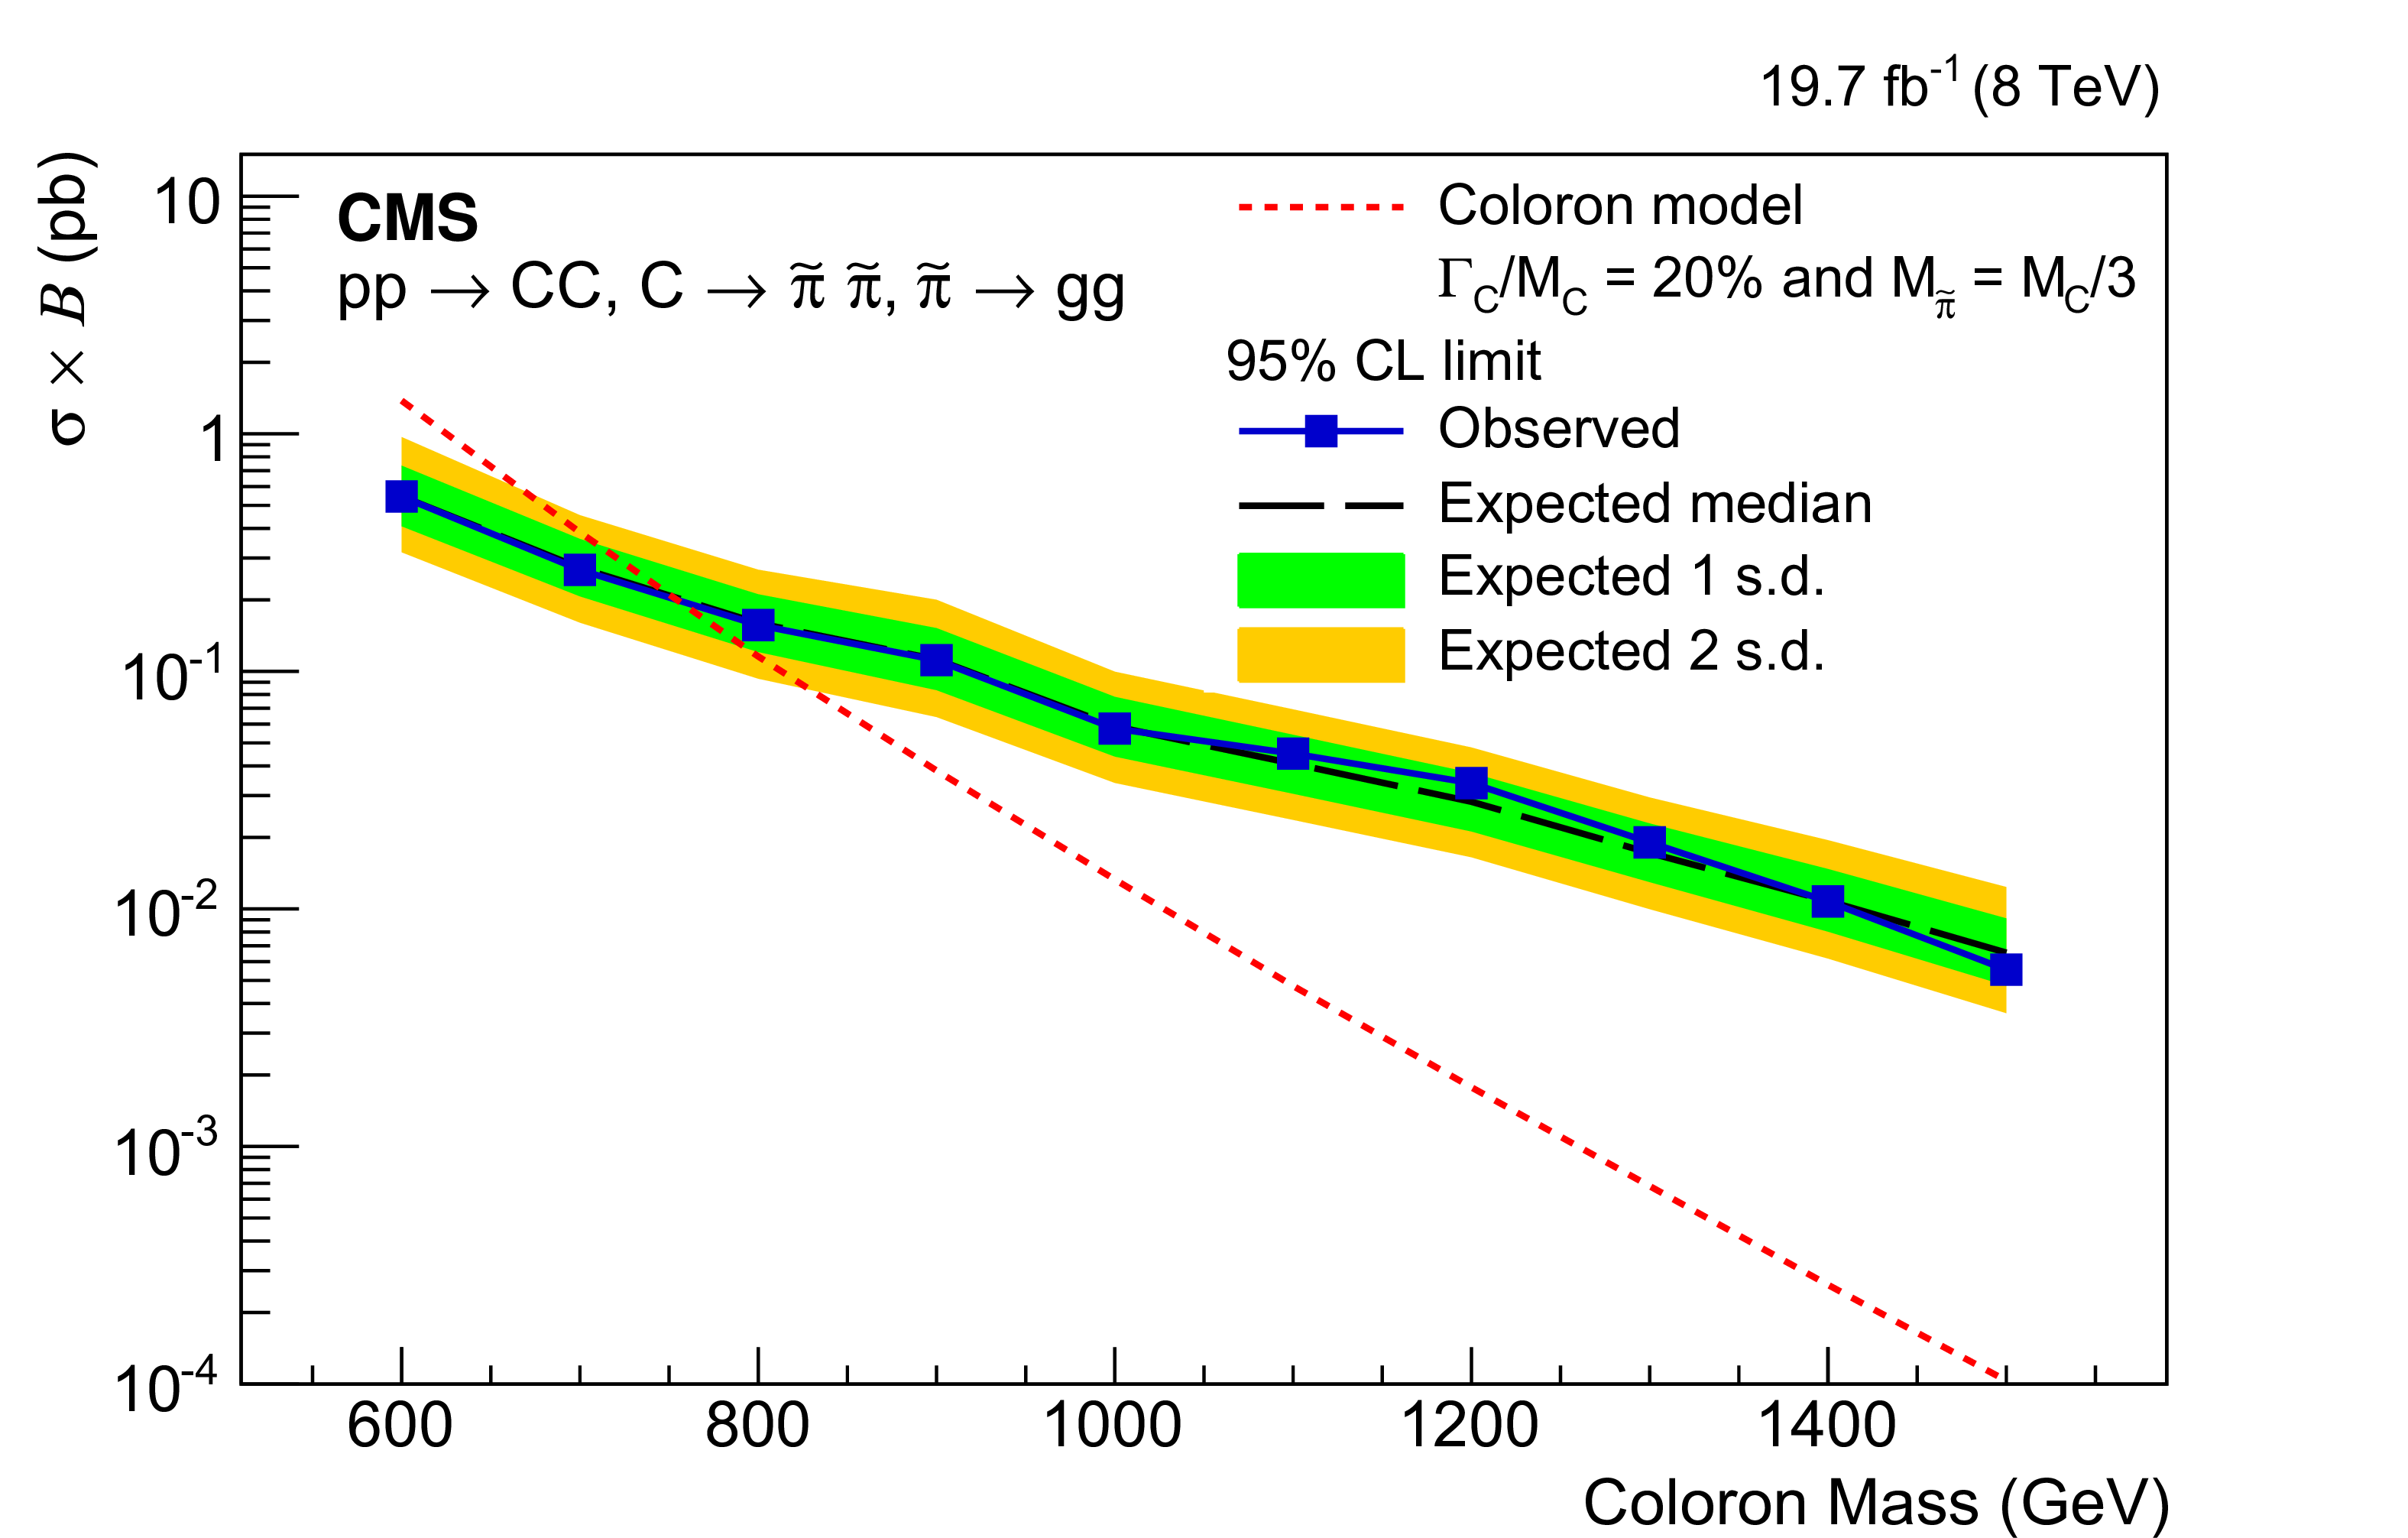
Upper limits at 95% CL on the signal cross section times branching fraction, as a function of coloron mass $M_\mathrm {C}$, assuming a width of 20% and a hyperpion mass $M_{\tilde{\pi} }$ equal to $M_\mathrm {C}/3$. The observed cross section limits (points) are compared with the expected limit (dashed line) and the one and two standard deviation uncertainty bands. The cross section for coloron pair production (dashed red line) is also shown. |
png pdf |
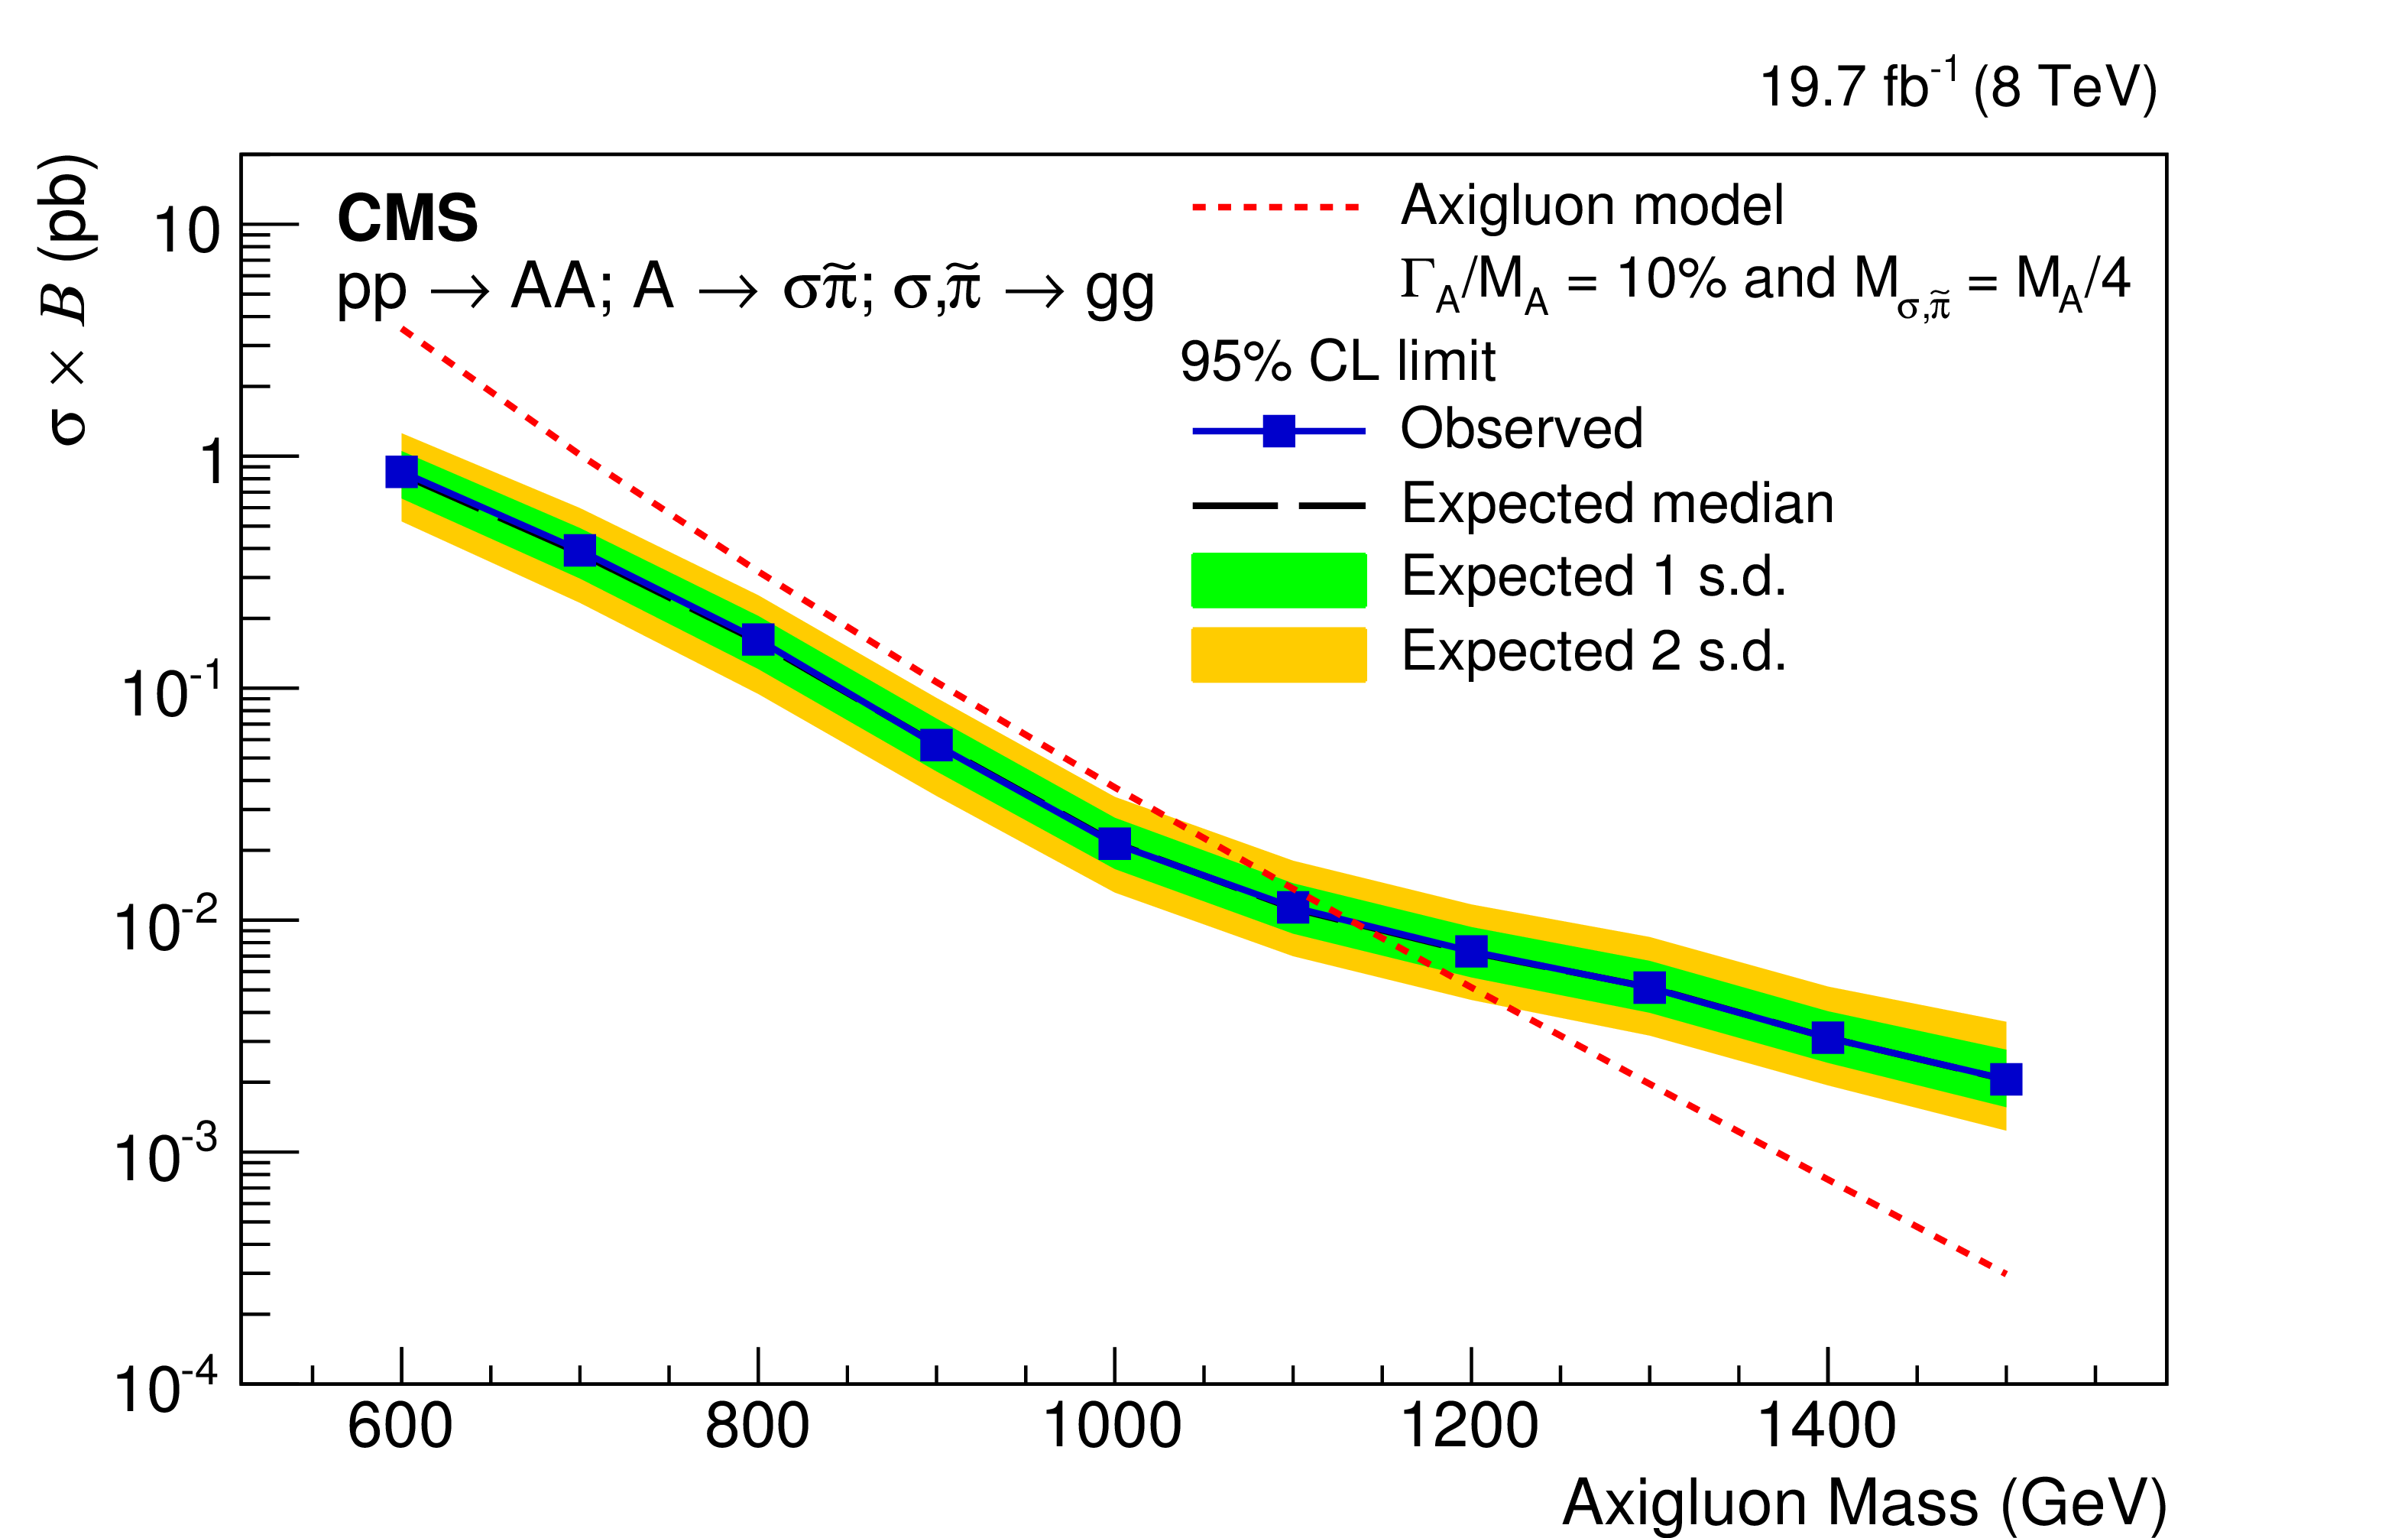
Figure 5:
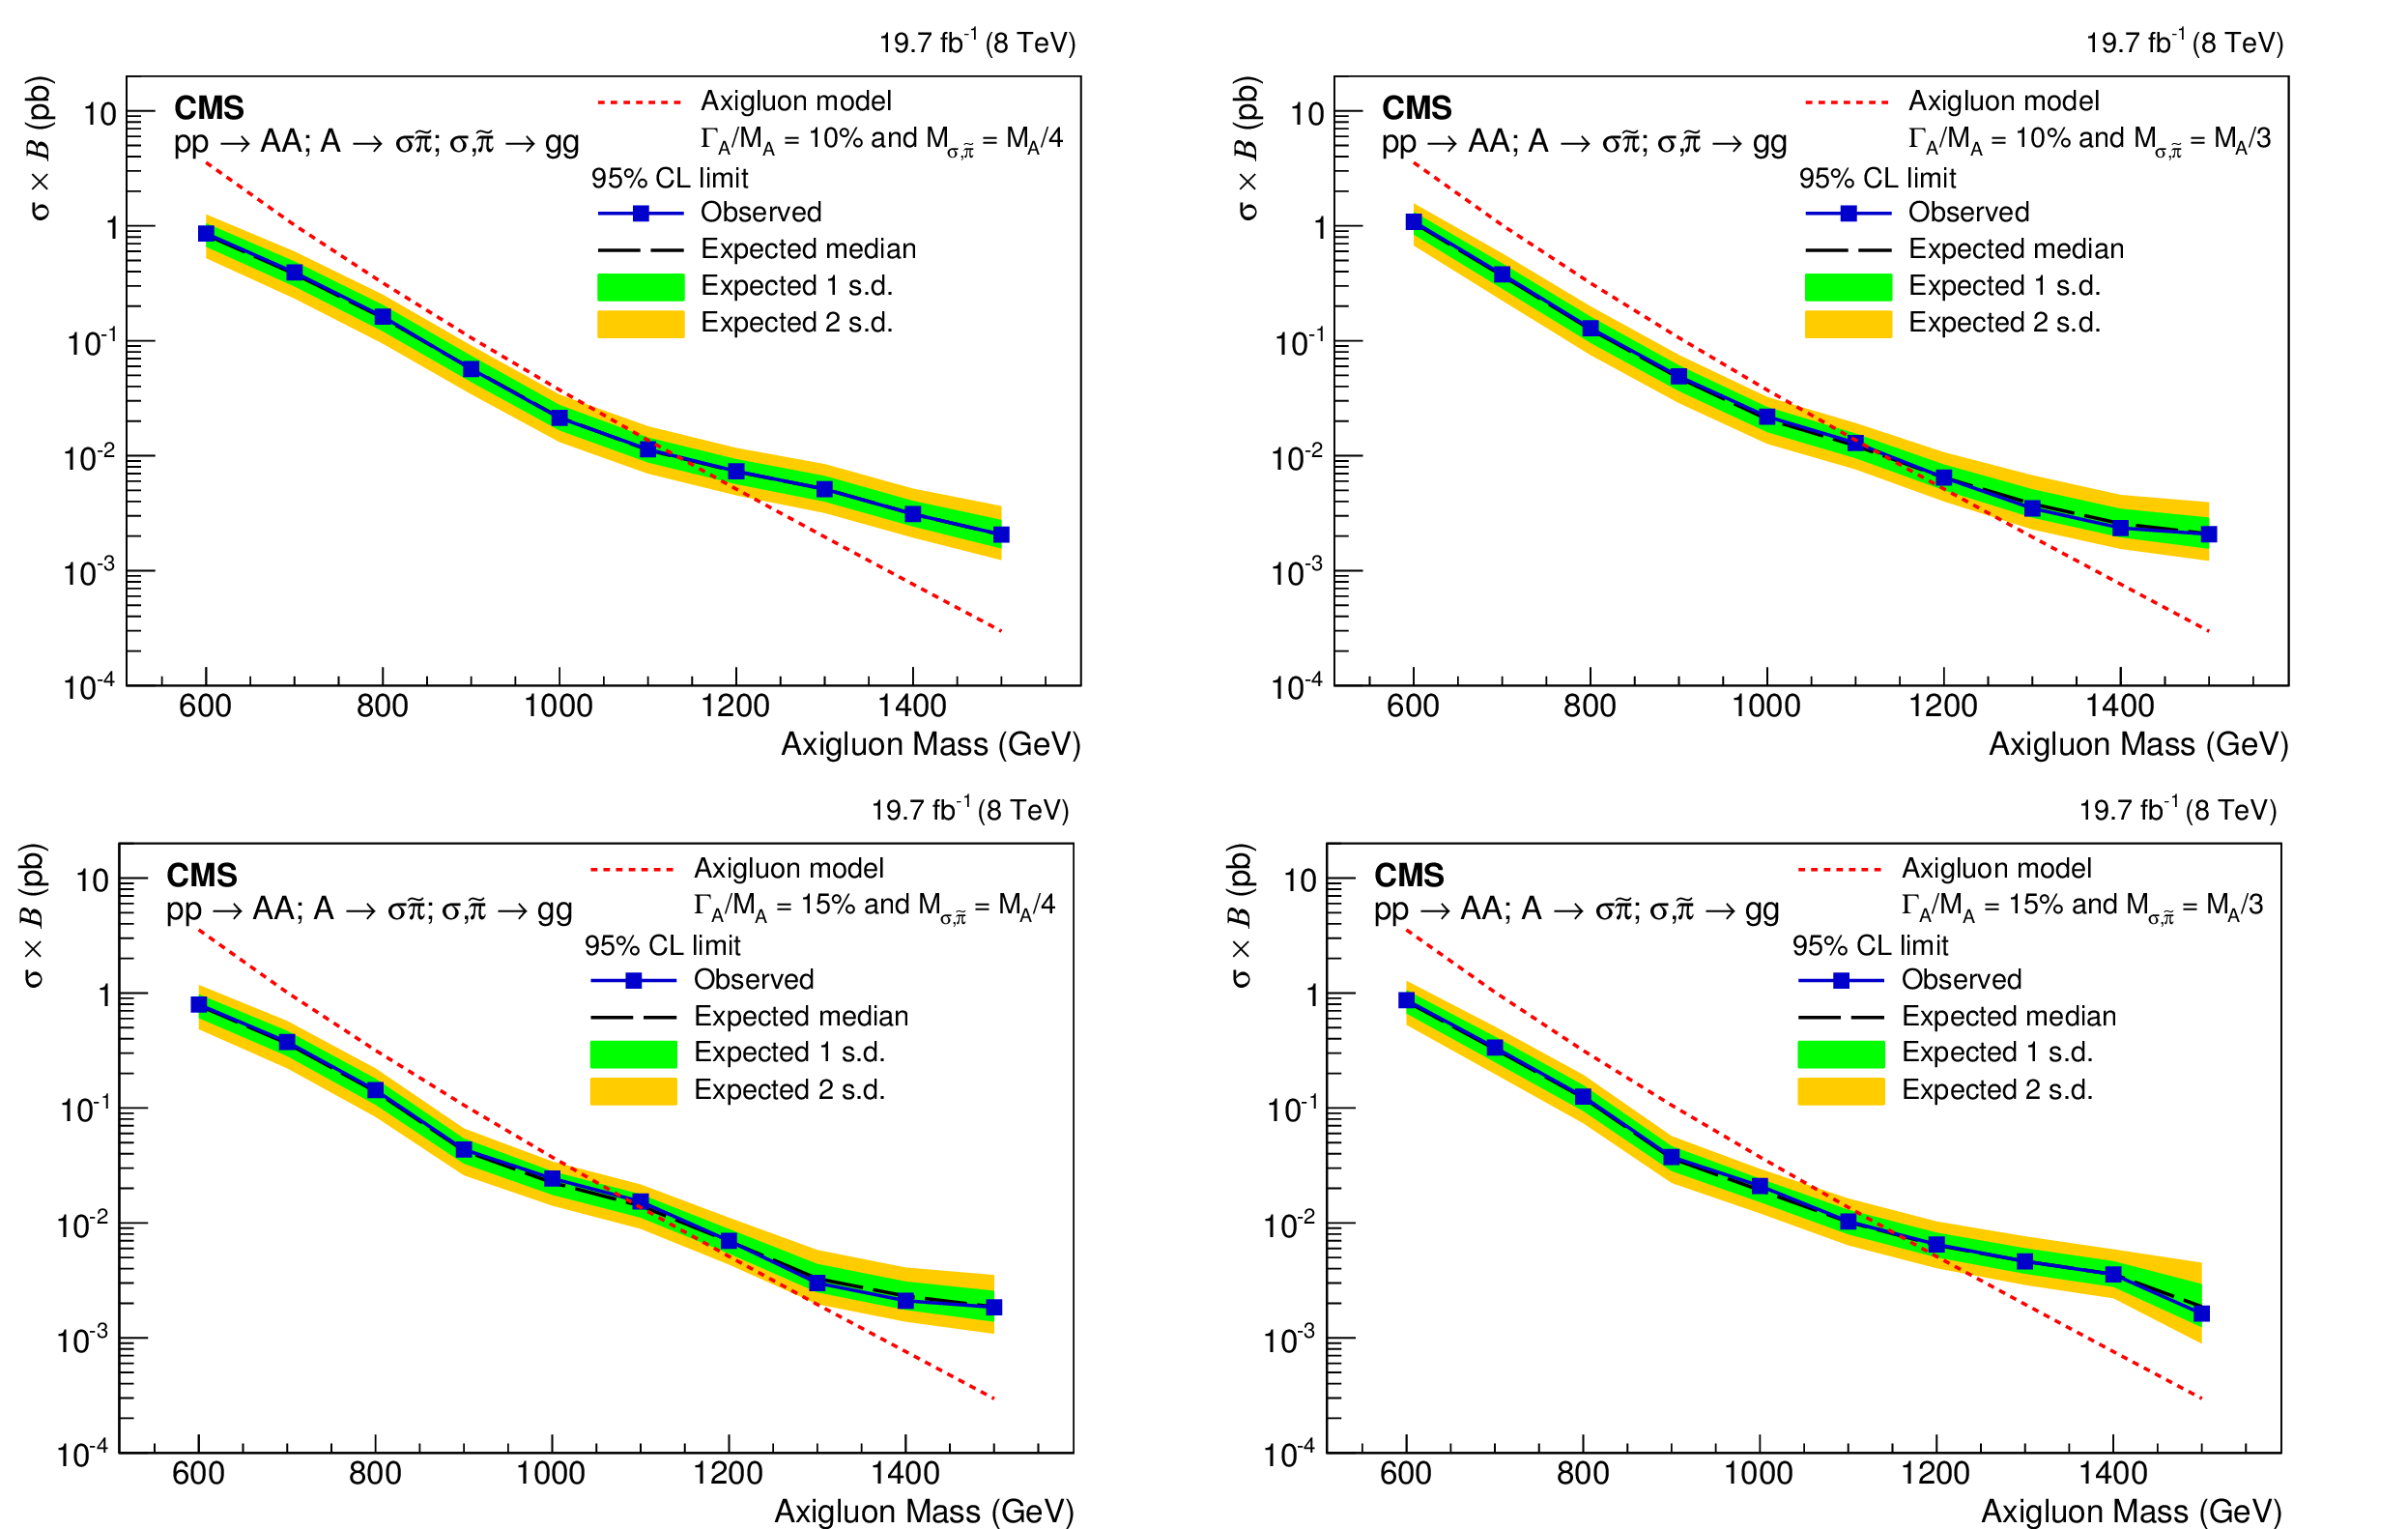
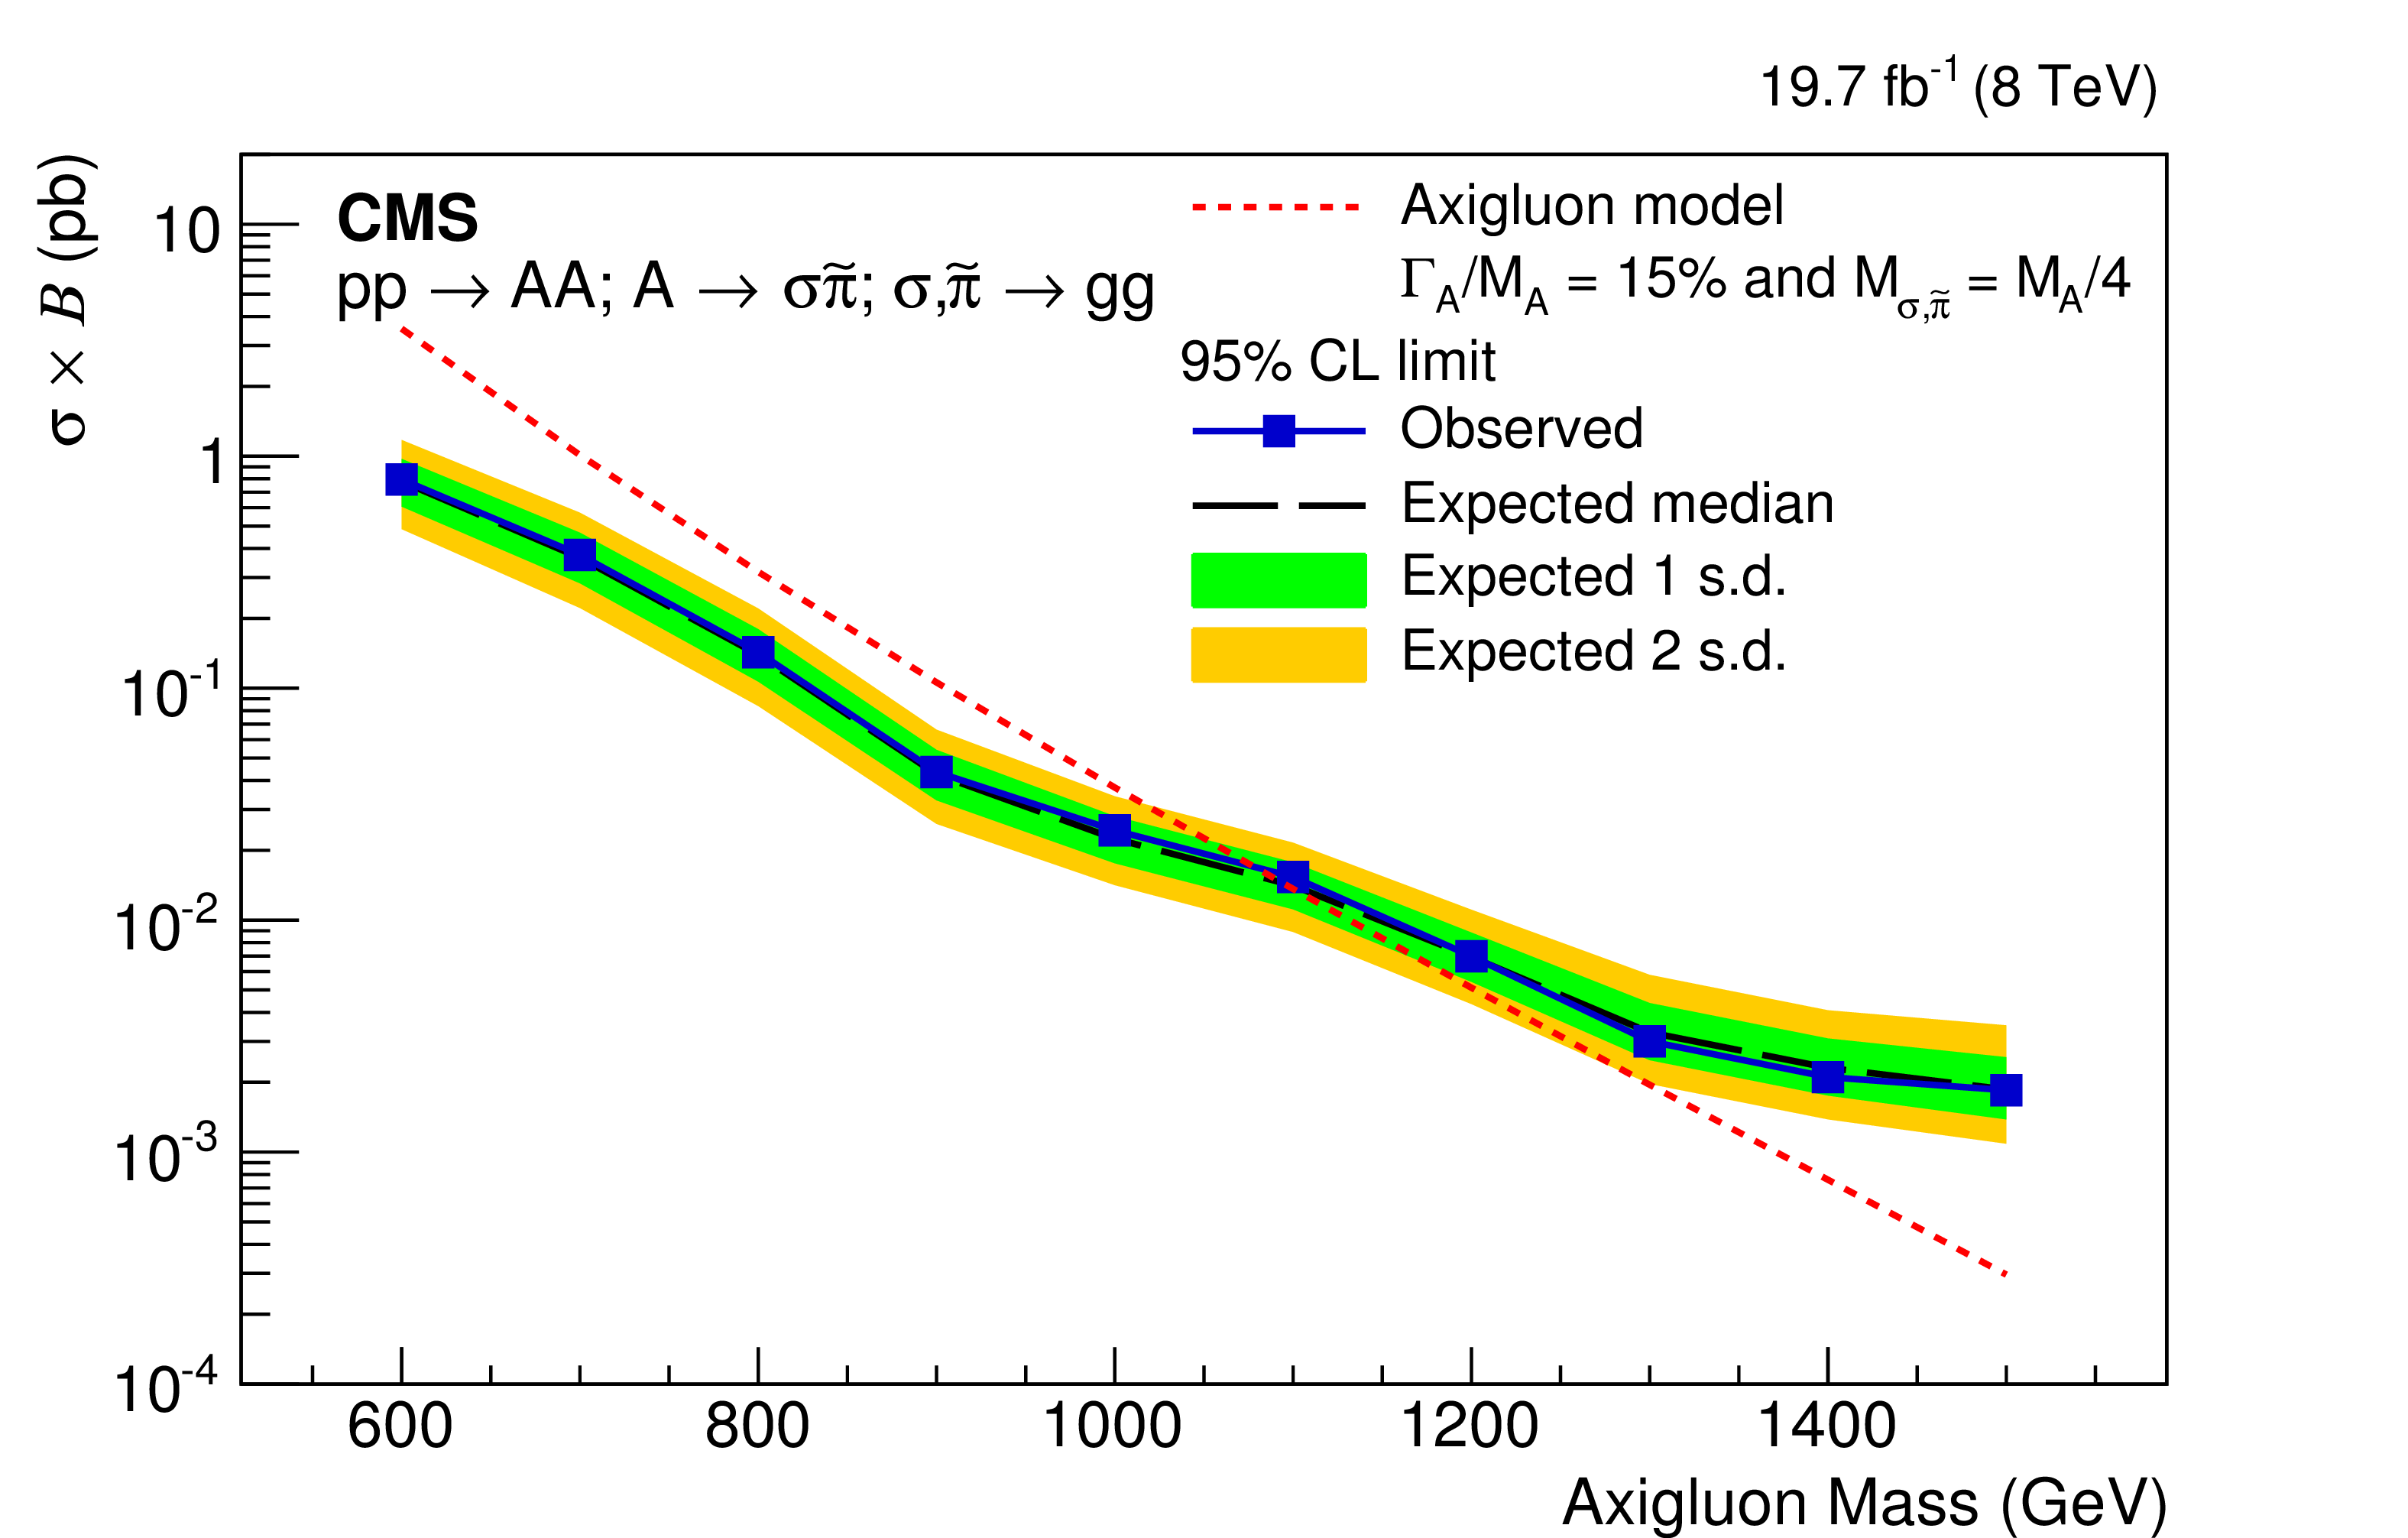
Upper limits at 95% CL on signal cross section times branching fraction, as a function of axigluon mass $M_\mathrm {A}$, assuming a width of 10% (top) or 15% (bottom) and a decay according to the A1 model. Left: for equal scalar and pseudoscalar particle masses ($M_{\sigma } = M_{\tilde{\pi} } = M_\mathrm {A}/4$); Right: for $M_{\sigma } = M_{\tilde{\pi} } = M_\mathrm {A}/3$. The observed cross section limits (points) are compared with the expected limit (dashed line) and the one and two standard deviation uncertainty bands. The cross section for axigluon pair production (dashed red line) is also shown. |
png pdf |
Figure 5-a:
Upper limits at $95%$ CL on signal cross section times branching fraction, as a function of axigluon mass $M_\mathrm {A}$, assuming a width of 10% and a decay according to the A1 model, for equal scalar and pseudoscalar particle masses ($M_{\sigma } = M_{\tilde{\pi} } = M_\mathrm {A}/4$). The observed cross section limits (points) are compared with the expected limit (dashed line) and the one and two standard deviation uncertainty bands. The cross section for axigluon pair production (dashed red line) is also shown. |

png pdf |
Figure 5-b:
Upper limits at $95%$ CL on signal cross section times branching fraction, as a function of axigluon mass $M_\mathrm {A}$, assuming a width of 10% (top) or 15% (bottom) and a decay according to the A1 model, for $M_{\sigma } = M_{\tilde{\pi} } = M_\mathrm {A}/3$. The observed cross section limits (points) are compared with the expected limit (dashed line) and the one and two standard deviation uncertainty bands. The cross section for axigluon pair production (dashed red line) is also shown. |
png pdf |
Figure 5-c:
Upper limits at $95%$ CL on signal cross section times branching fraction, as a function of axigluon mass $M_\mathrm {A}$, assuming a width of 15% and a decay according to the A1 model, for equal scalar and pseudoscalar particle masses ($M_{\sigma } = M_{\tilde{\pi} } = M_\mathrm {A}/4$). The observed cross section limits (points) are compared with the expected limit (dashed line) and the one and two standard deviation uncertainty bands. The cross section for axigluon pair production (dashed red line) is also shown. |

png pdf |
Figure 5-d:
Upper limits at $95%$ CL on signal cross section times branching fraction, as a function of axigluon mass $M_\mathrm {A}$, assuming a width of 15% (top) or 15% (bottom) and a decay according to the A1 model, for $M_{\sigma } = M_{\tilde{\pi} } = M_\mathrm {A}/3$. The observed cross section limits (points) are compared with the expected limit (dashed line) and the one and two standard deviation uncertainty bands. The cross section for axigluon pair production (dashed red line) is also shown. |
png pdf |
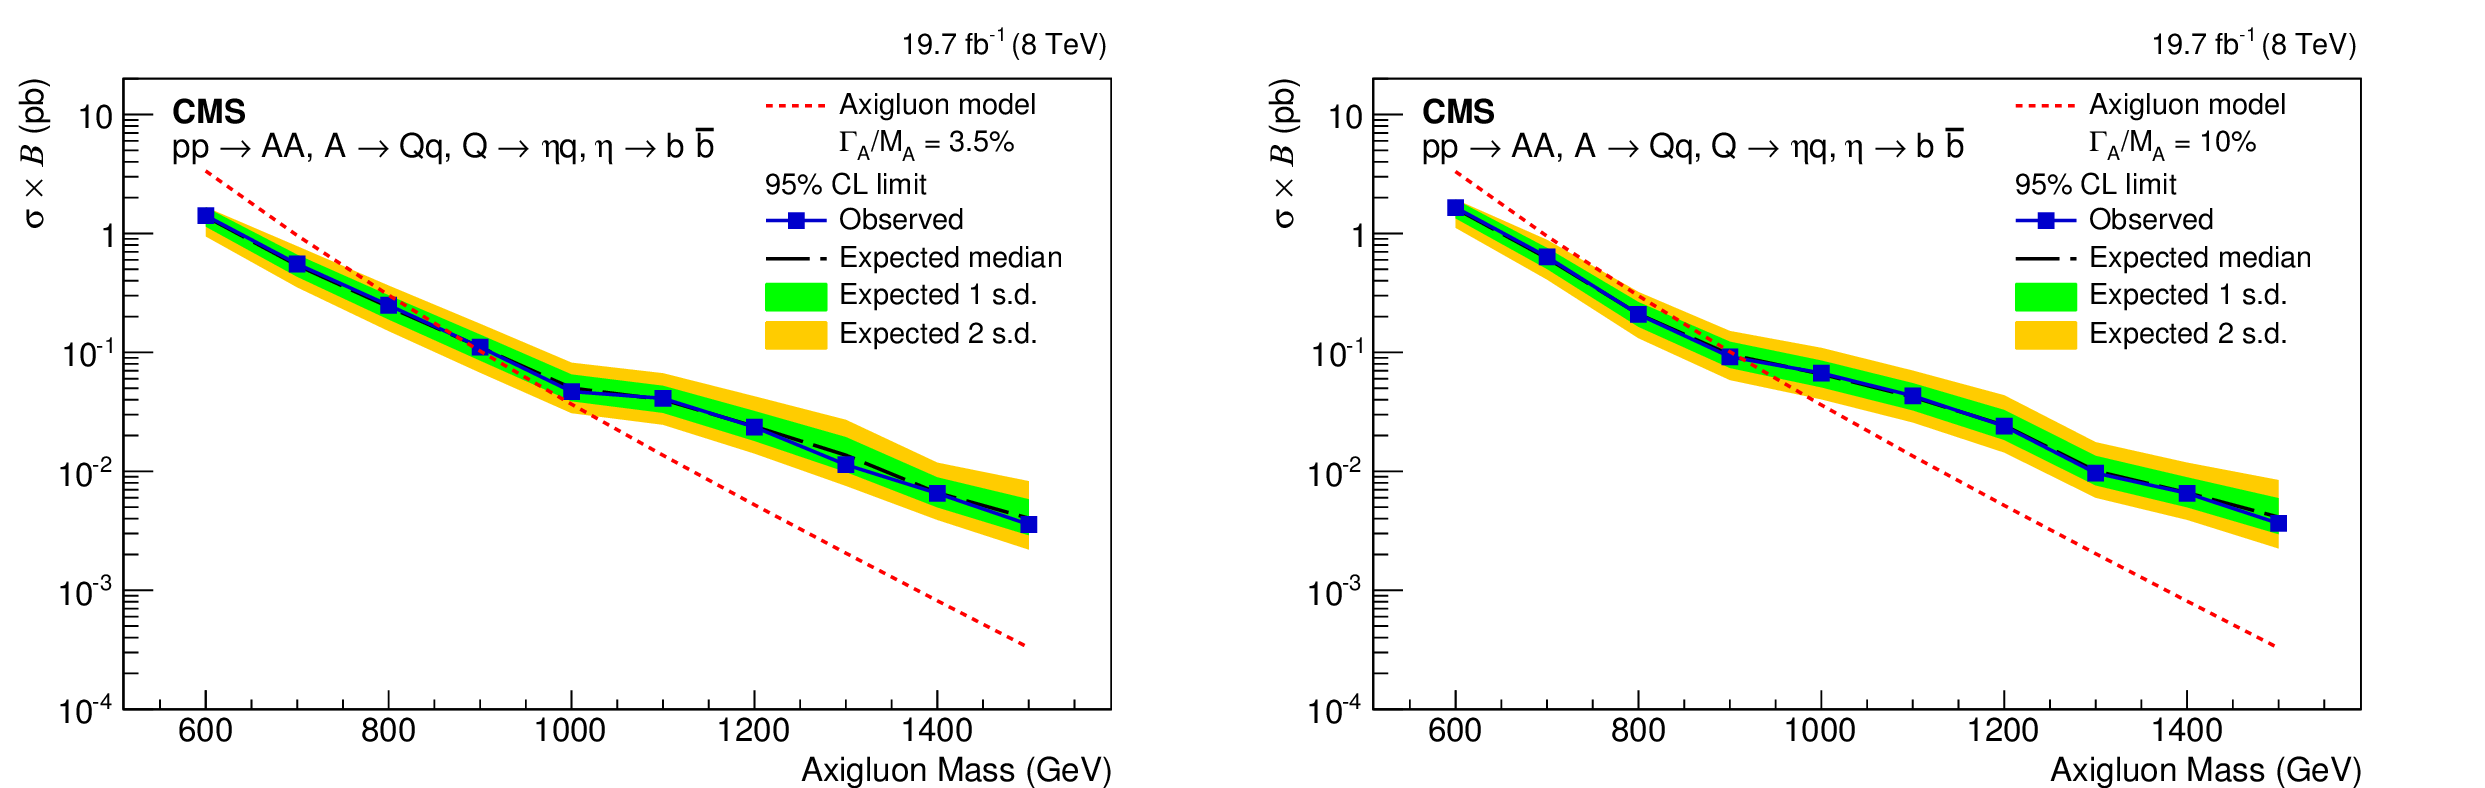
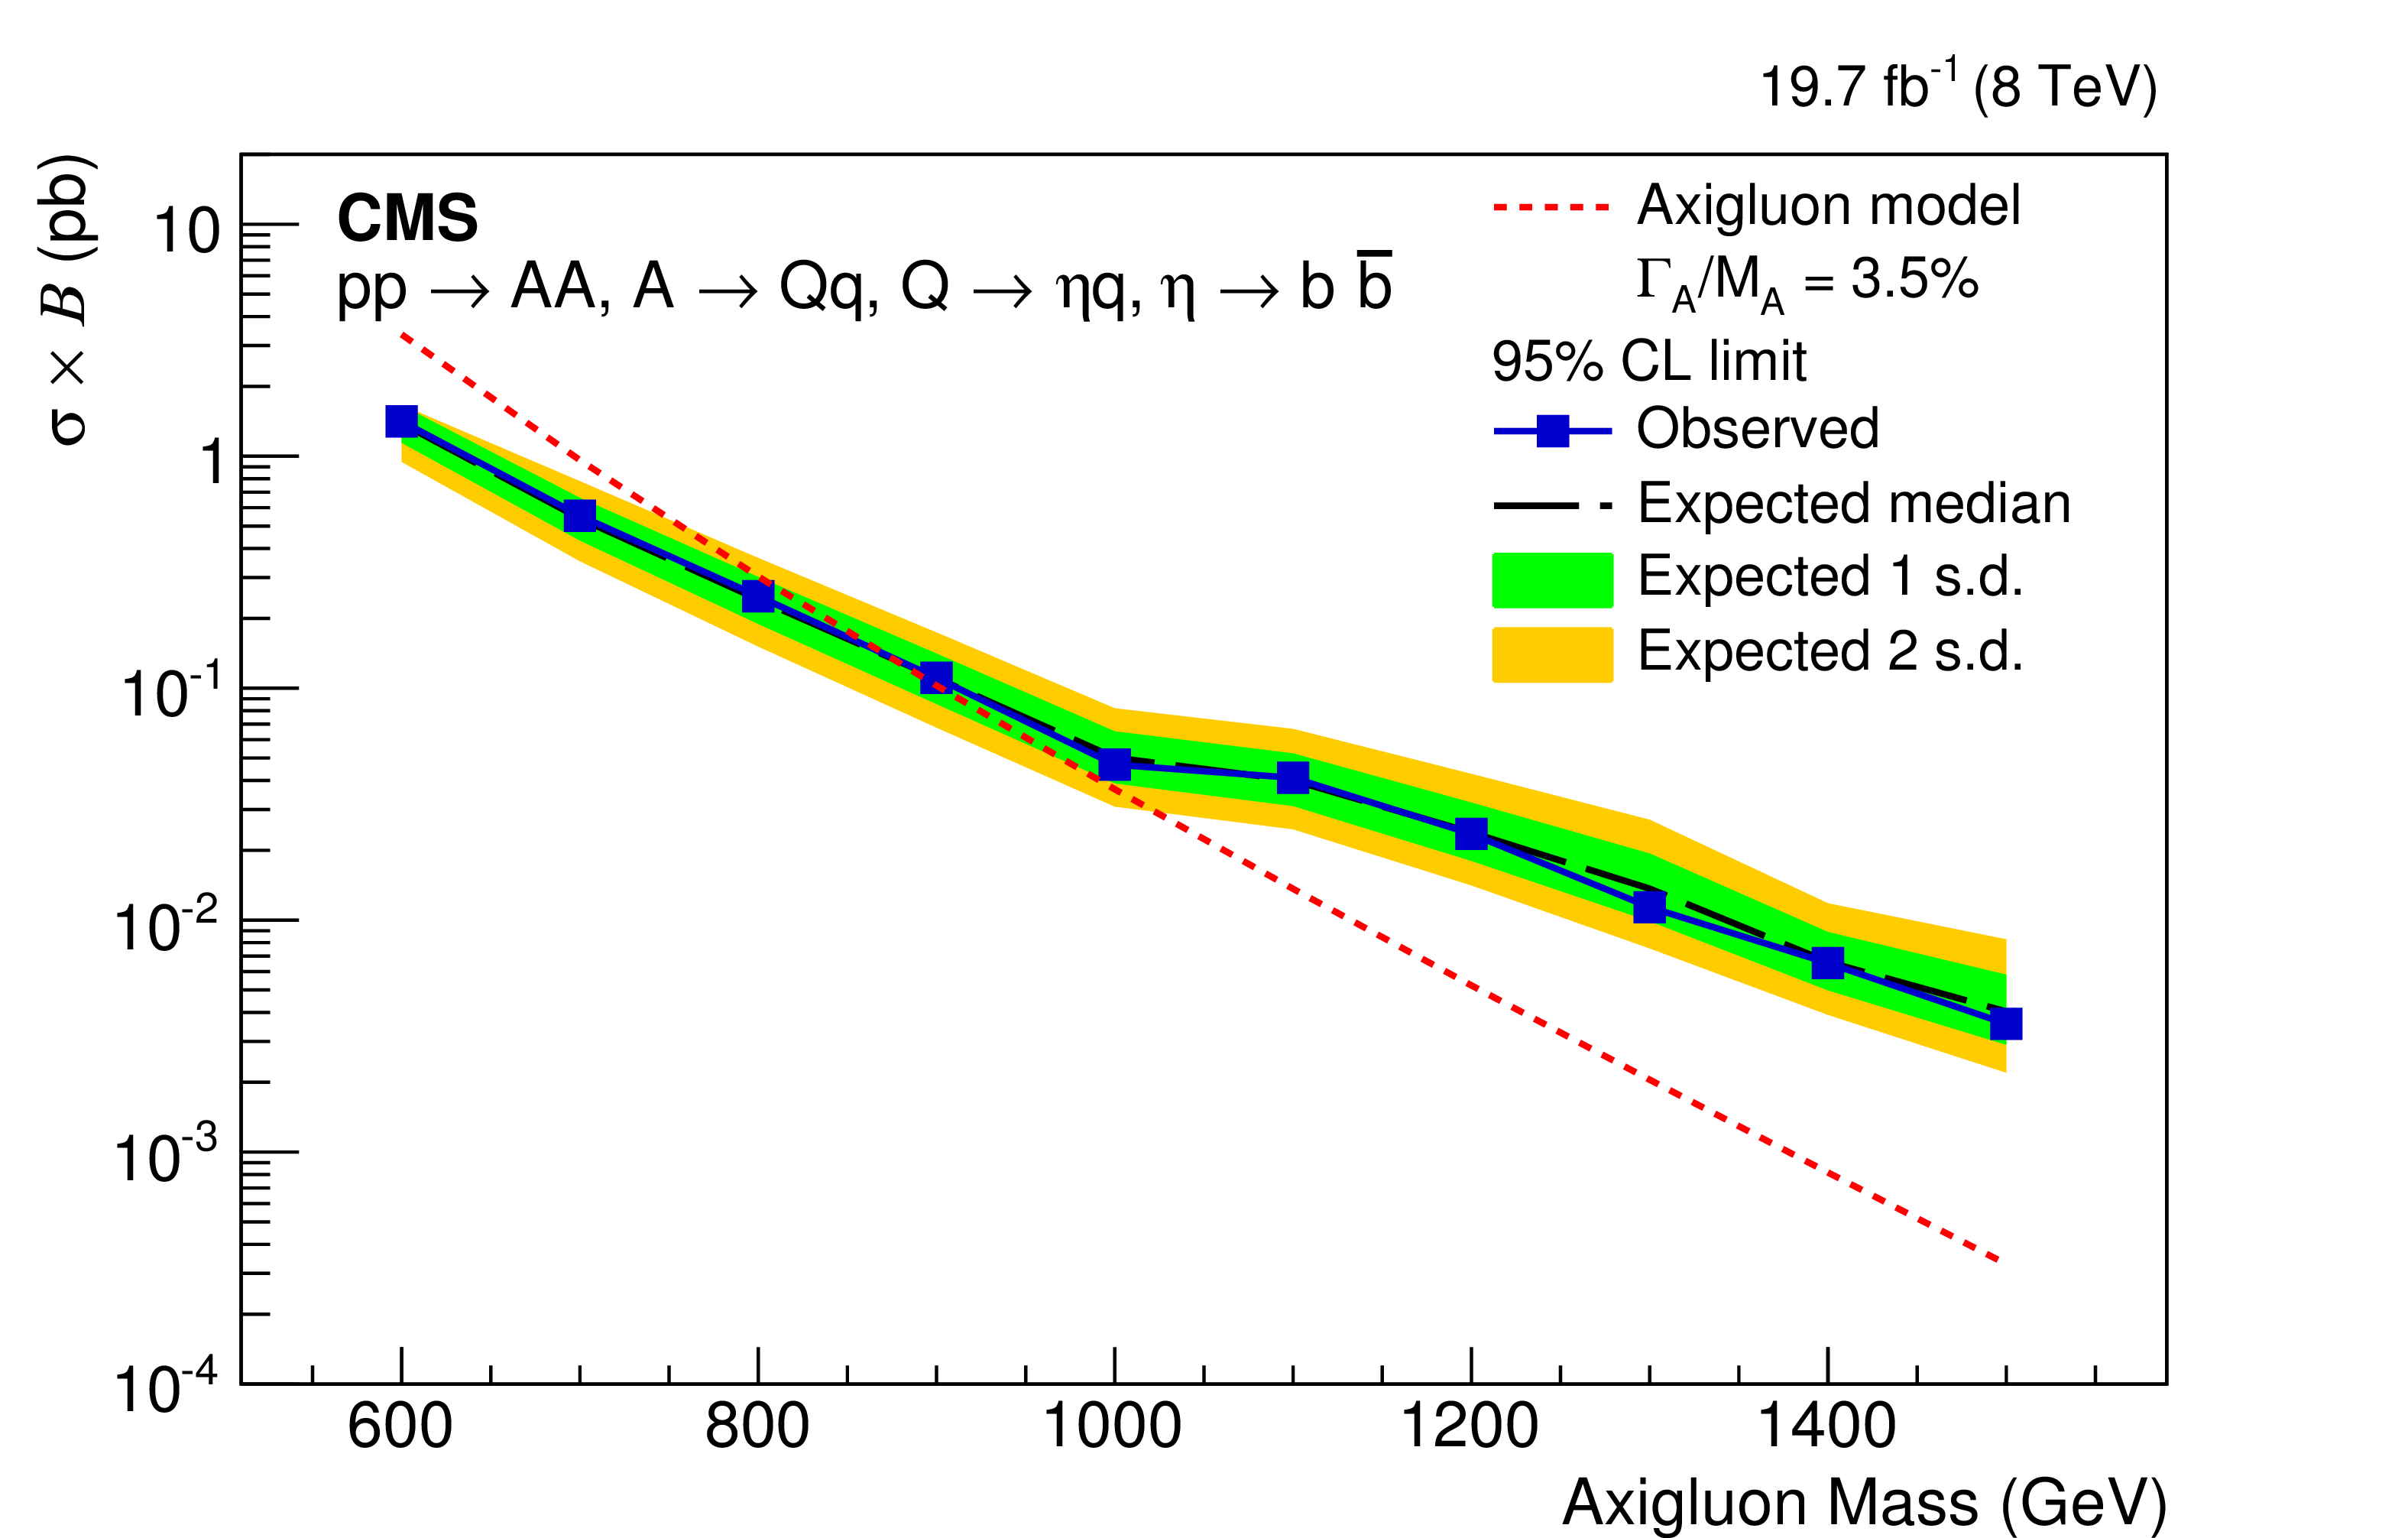
Figure 6:
Upper limits at $95%$ CL on signal cross section times branching fraction, as a function of axigluon mass $M_\mathrm {A}$, assuming a width of 3.5% (left) and 10% (right) of $M_\mathrm {A}$, and a decay according to the A2 model. The observed cross section limits (points) are compared with the expected limit (dashed line) and the one and two standard deviation uncertainty bands. The cross section for axigluon pair production (dashed red line) is also shown. |
png pdf |
Figure 6-a:
Upper limits at $95%$ CL on signal cross section times branching fraction, as a function of axigluon mass $M_\mathrm {A}$, assuming a width of 3.5% of $M_\mathrm {A}$, and a decay according to the A2 model. The observed cross section limits (points) are compared with the expected limit (dashed line) and the one and two standard deviation uncertainty bands. The cross section for axigluon pair production (dashed red line) is also shown. |
png pdf |
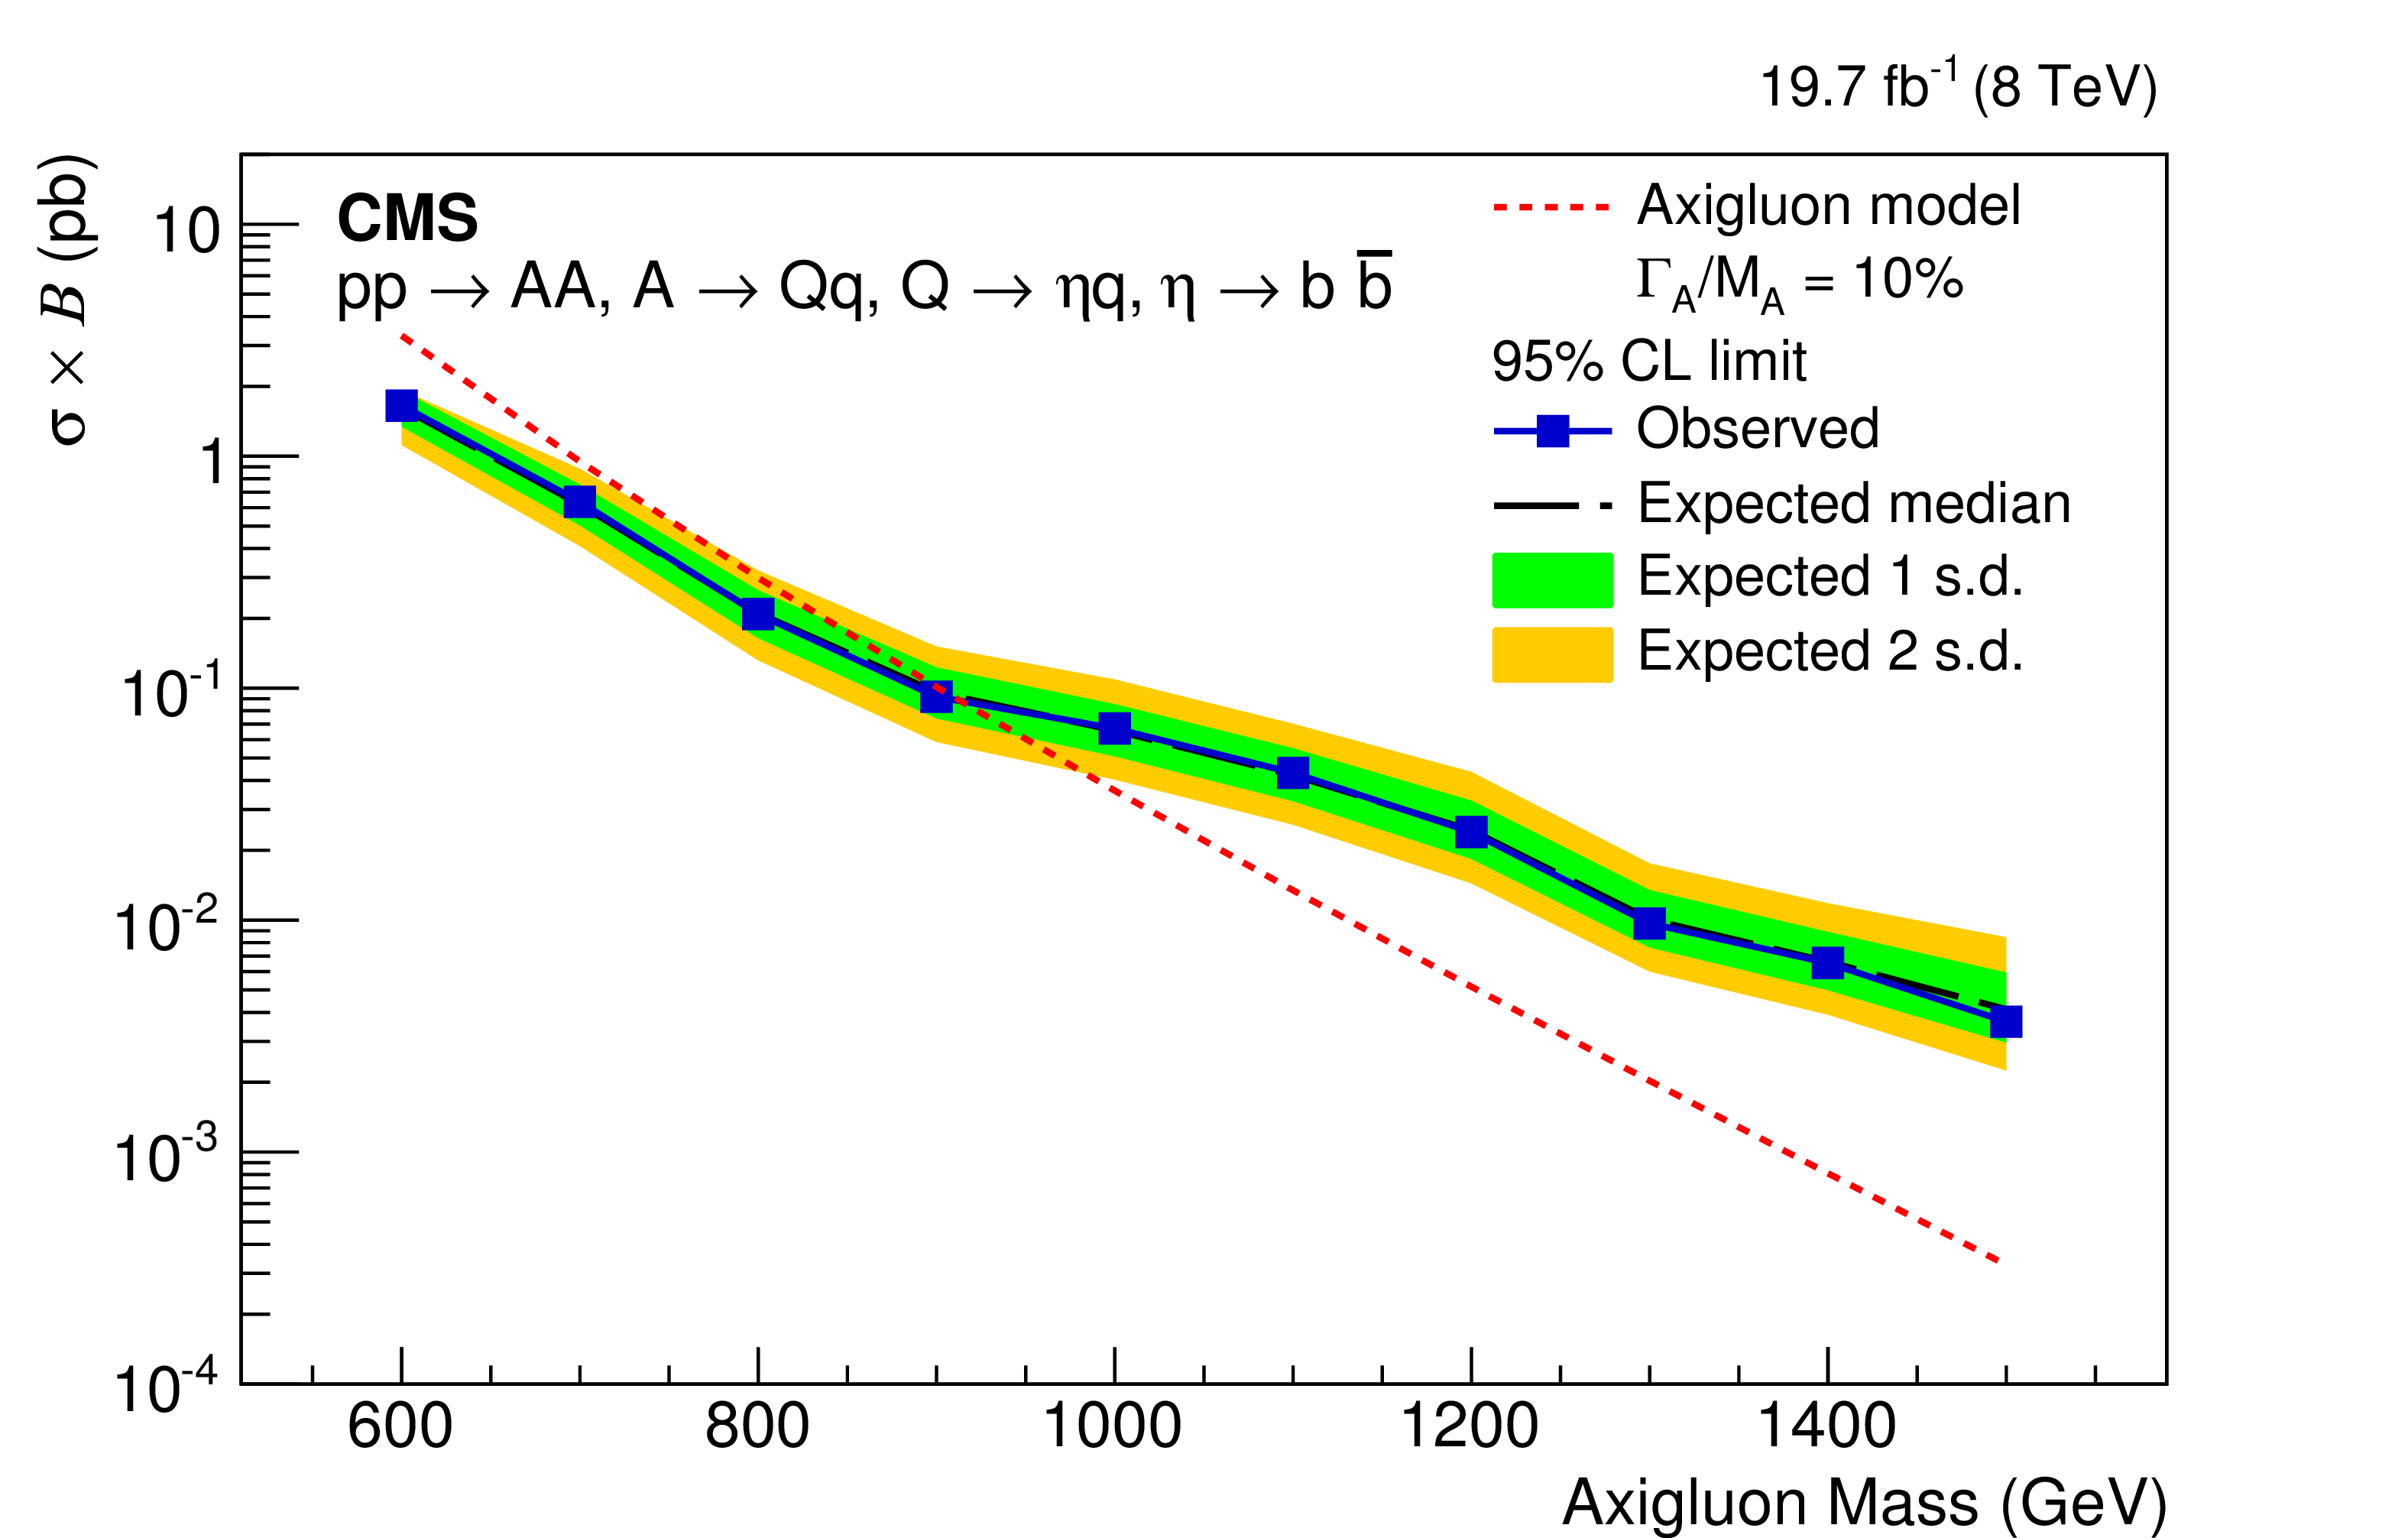
Figure 6-b:
Upper limits at $95%$ CL on signal cross section times branching fraction, as a function of axigluon mass $M_\mathrm {A}$, assuming a width of 10% of $M_\mathrm {A}$, and a decay according to the A2 model. The observed cross section limits (points) are compared with the expected limit (dashed line) and the one and two standard deviation uncertainty bands. The cross section for axigluon pair production (dashed red line) is also shown. |
png pdf |
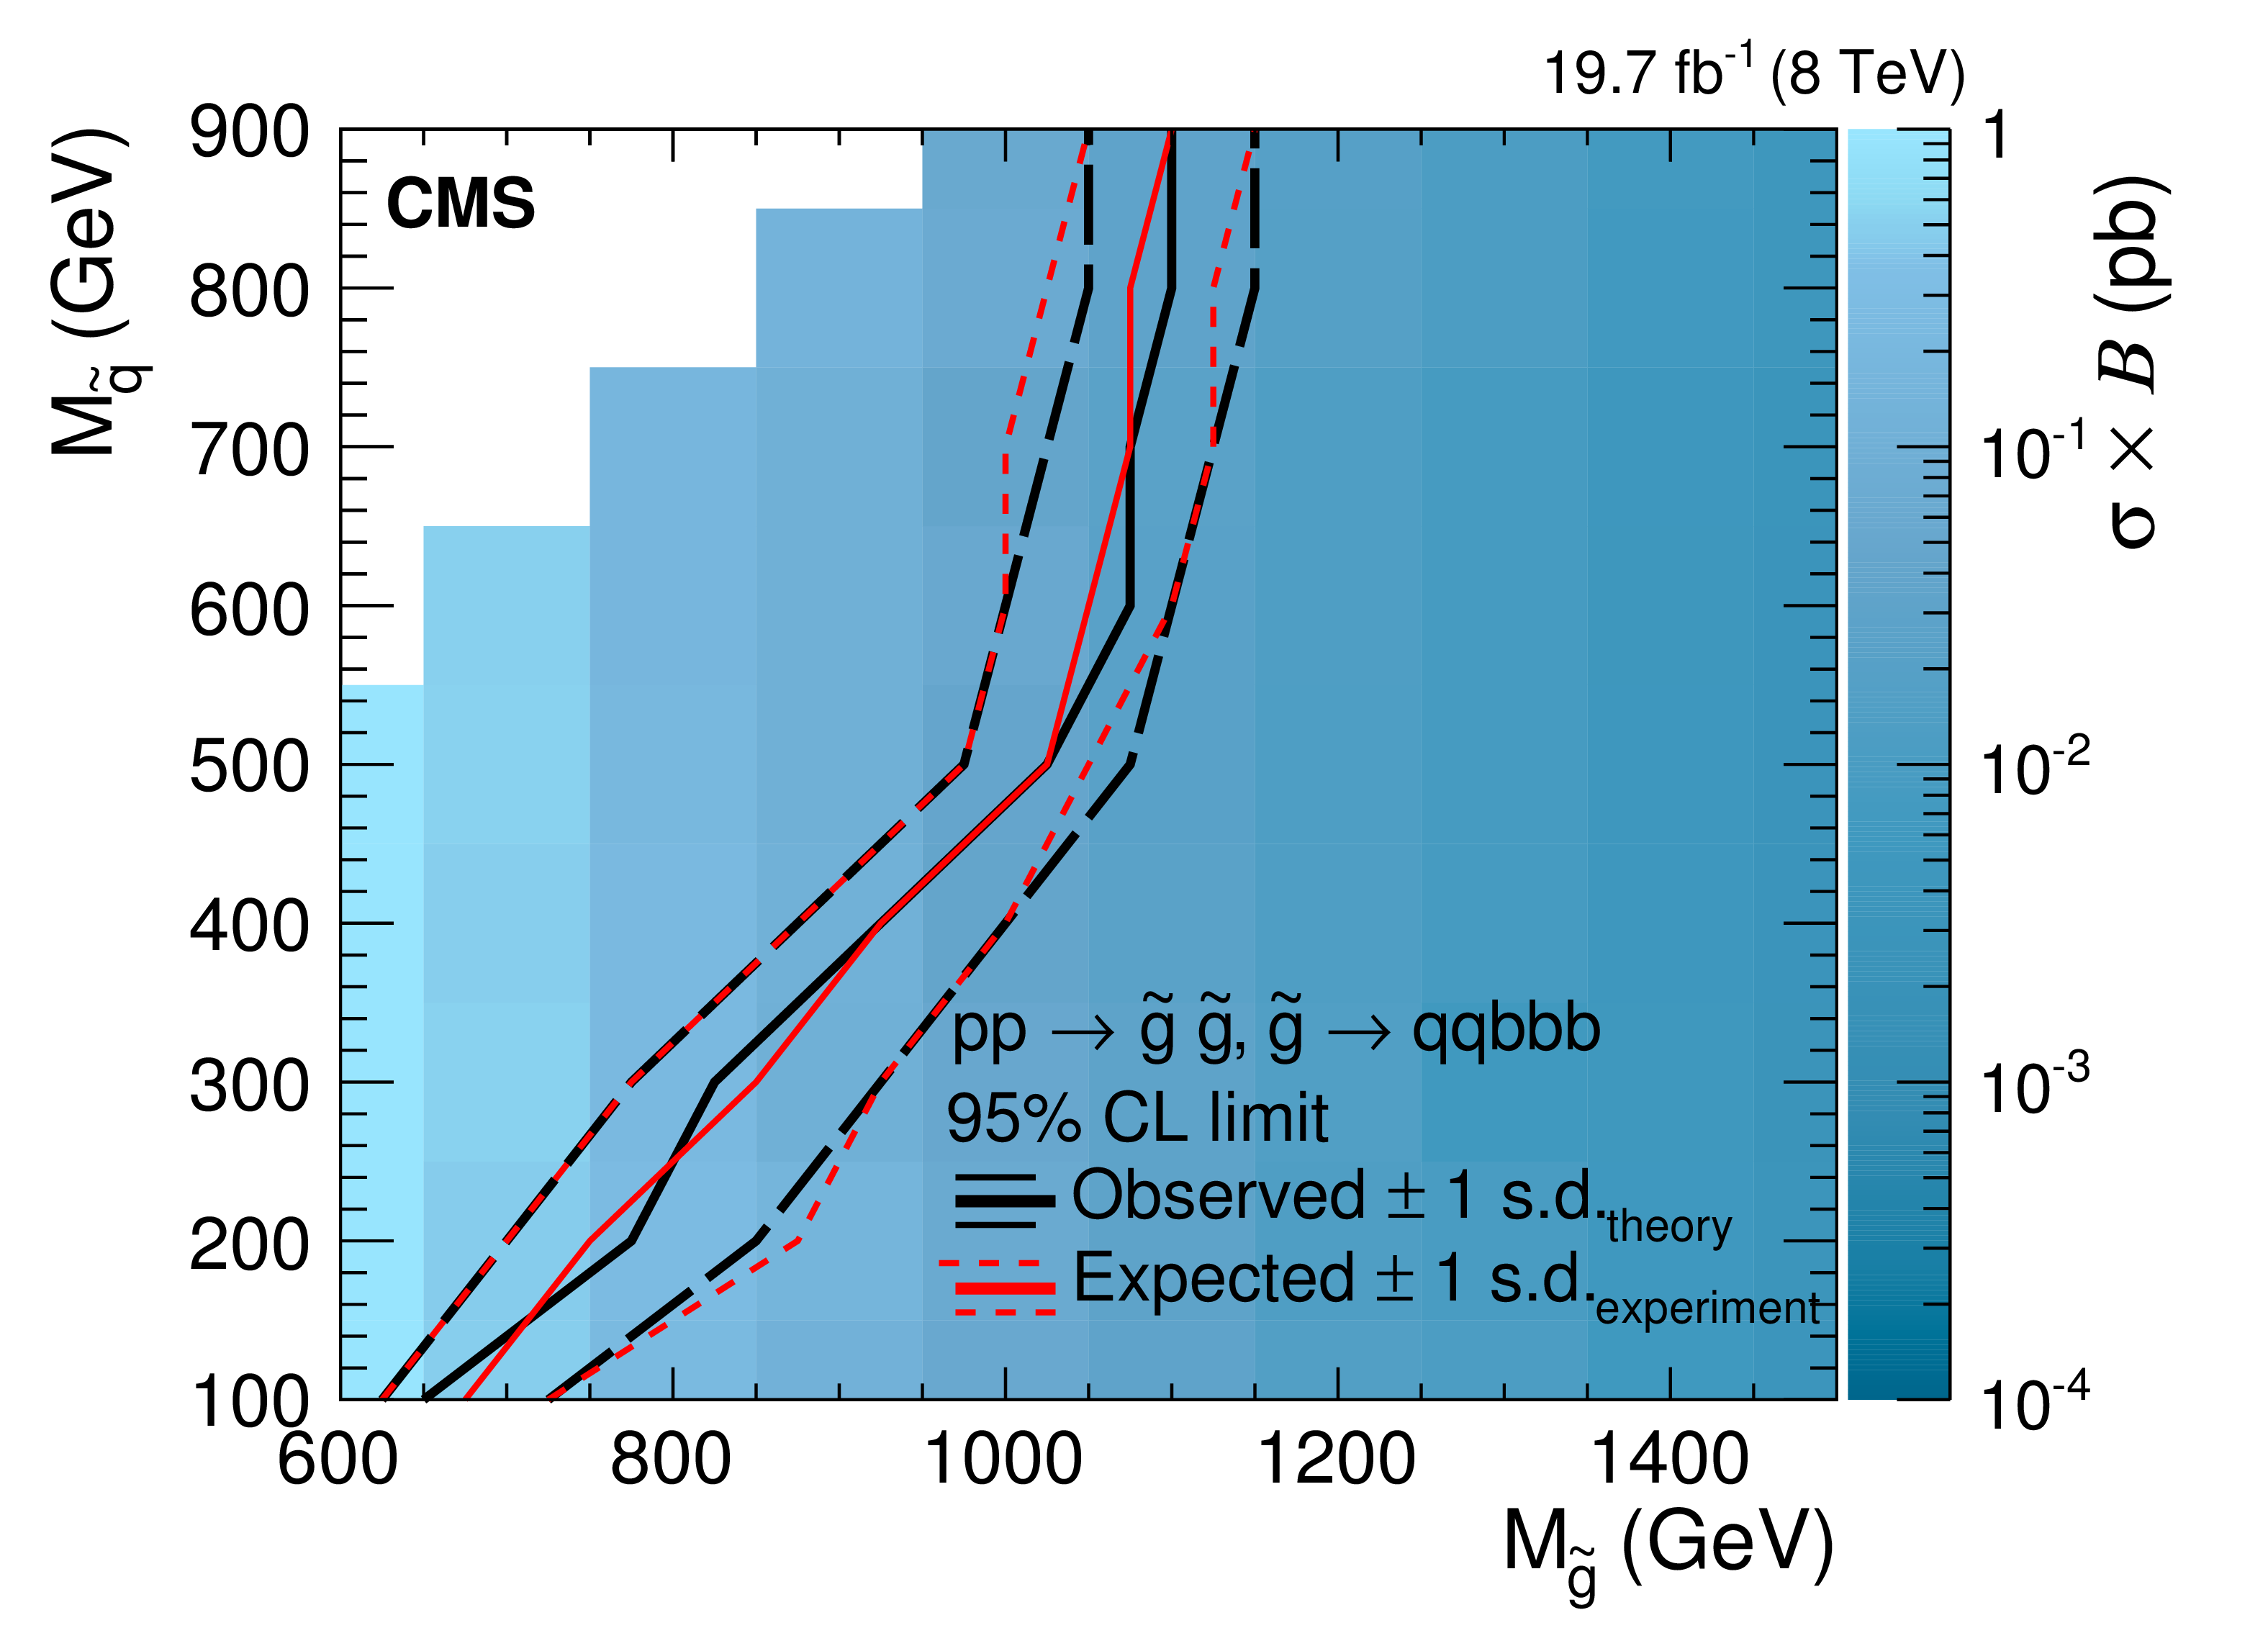
Figure 7:
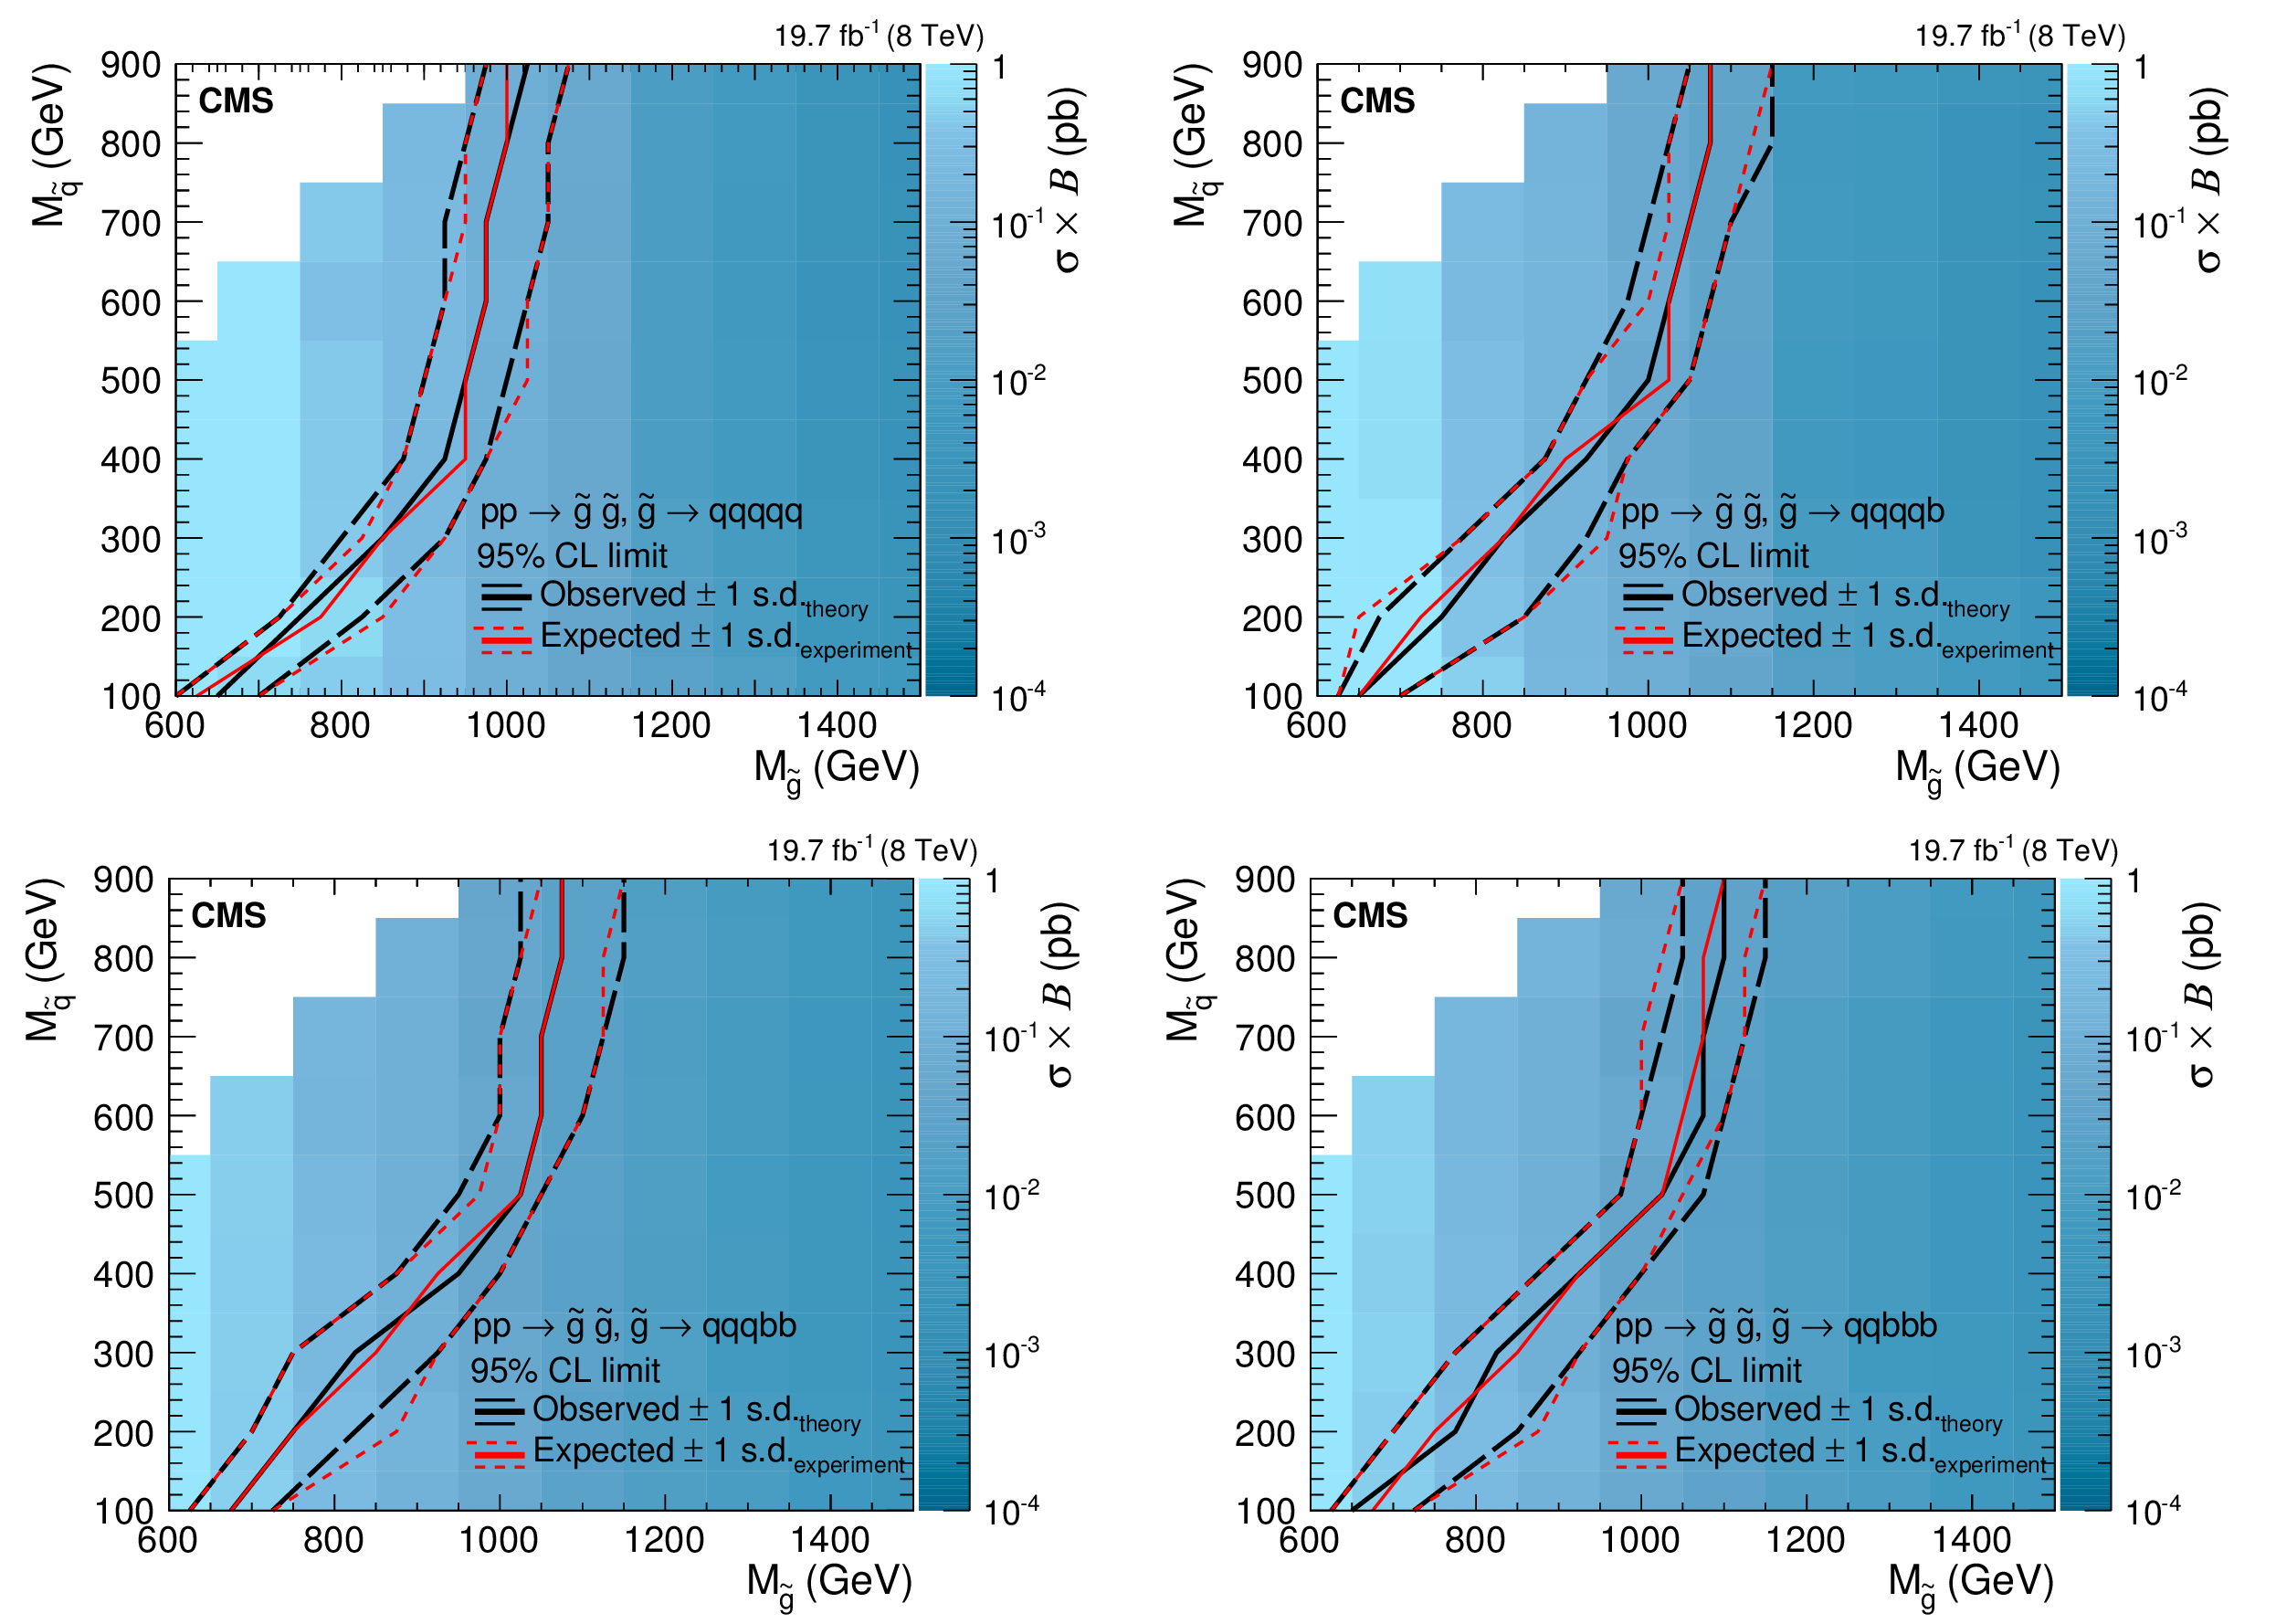
Upper limits at 95% CL on the signal cross section times branching fraction, as a function of the gluino mass $M_{ \tilde{\mathrm{g}} }$ and squark mass $M_{ \tilde{\mathrm{q}} }$ for the pair-produced gluino model with RPV decays in the final states qqqqq (G1, top left), qqqqb (G2, top right), qqqbb (G3, bottom left), and qqbbb (G4, bottom right). The observed limit (black long-dashed lines) is compared to the expected limit (red short-dashed lines) with the one standard deviation theoretical uncertainty in the observed limit (black dashed lines) and the one standard deviation statistical and systematic uncertainties combined in the expected limits (red dashed lines). The gluino pair production cross sections are shown with the color scale. |

png pdf |
Figure 7-a:
Upper limits at 95% CL on the signal cross section times branching fraction, as a function of the gluino mass $M_{ \tilde{\mathrm{g}} }$ and squark mass $M_{ \tilde{\mathrm{q}} }$ for the pair-produced gluino model with RPV decays in the final states qqqqq (G1). The observed limit (black long-dashed lines) is compared to the expected limit (red short-dashed lines) with the one standard deviation theoretical uncertainty in the observed limit (black dashed lines) and the one standard deviation statistical and systematic uncertainties combined in the expected limits (red dashed lines). The gluino pair production cross sections are shown with the color scale. |
png pdf |
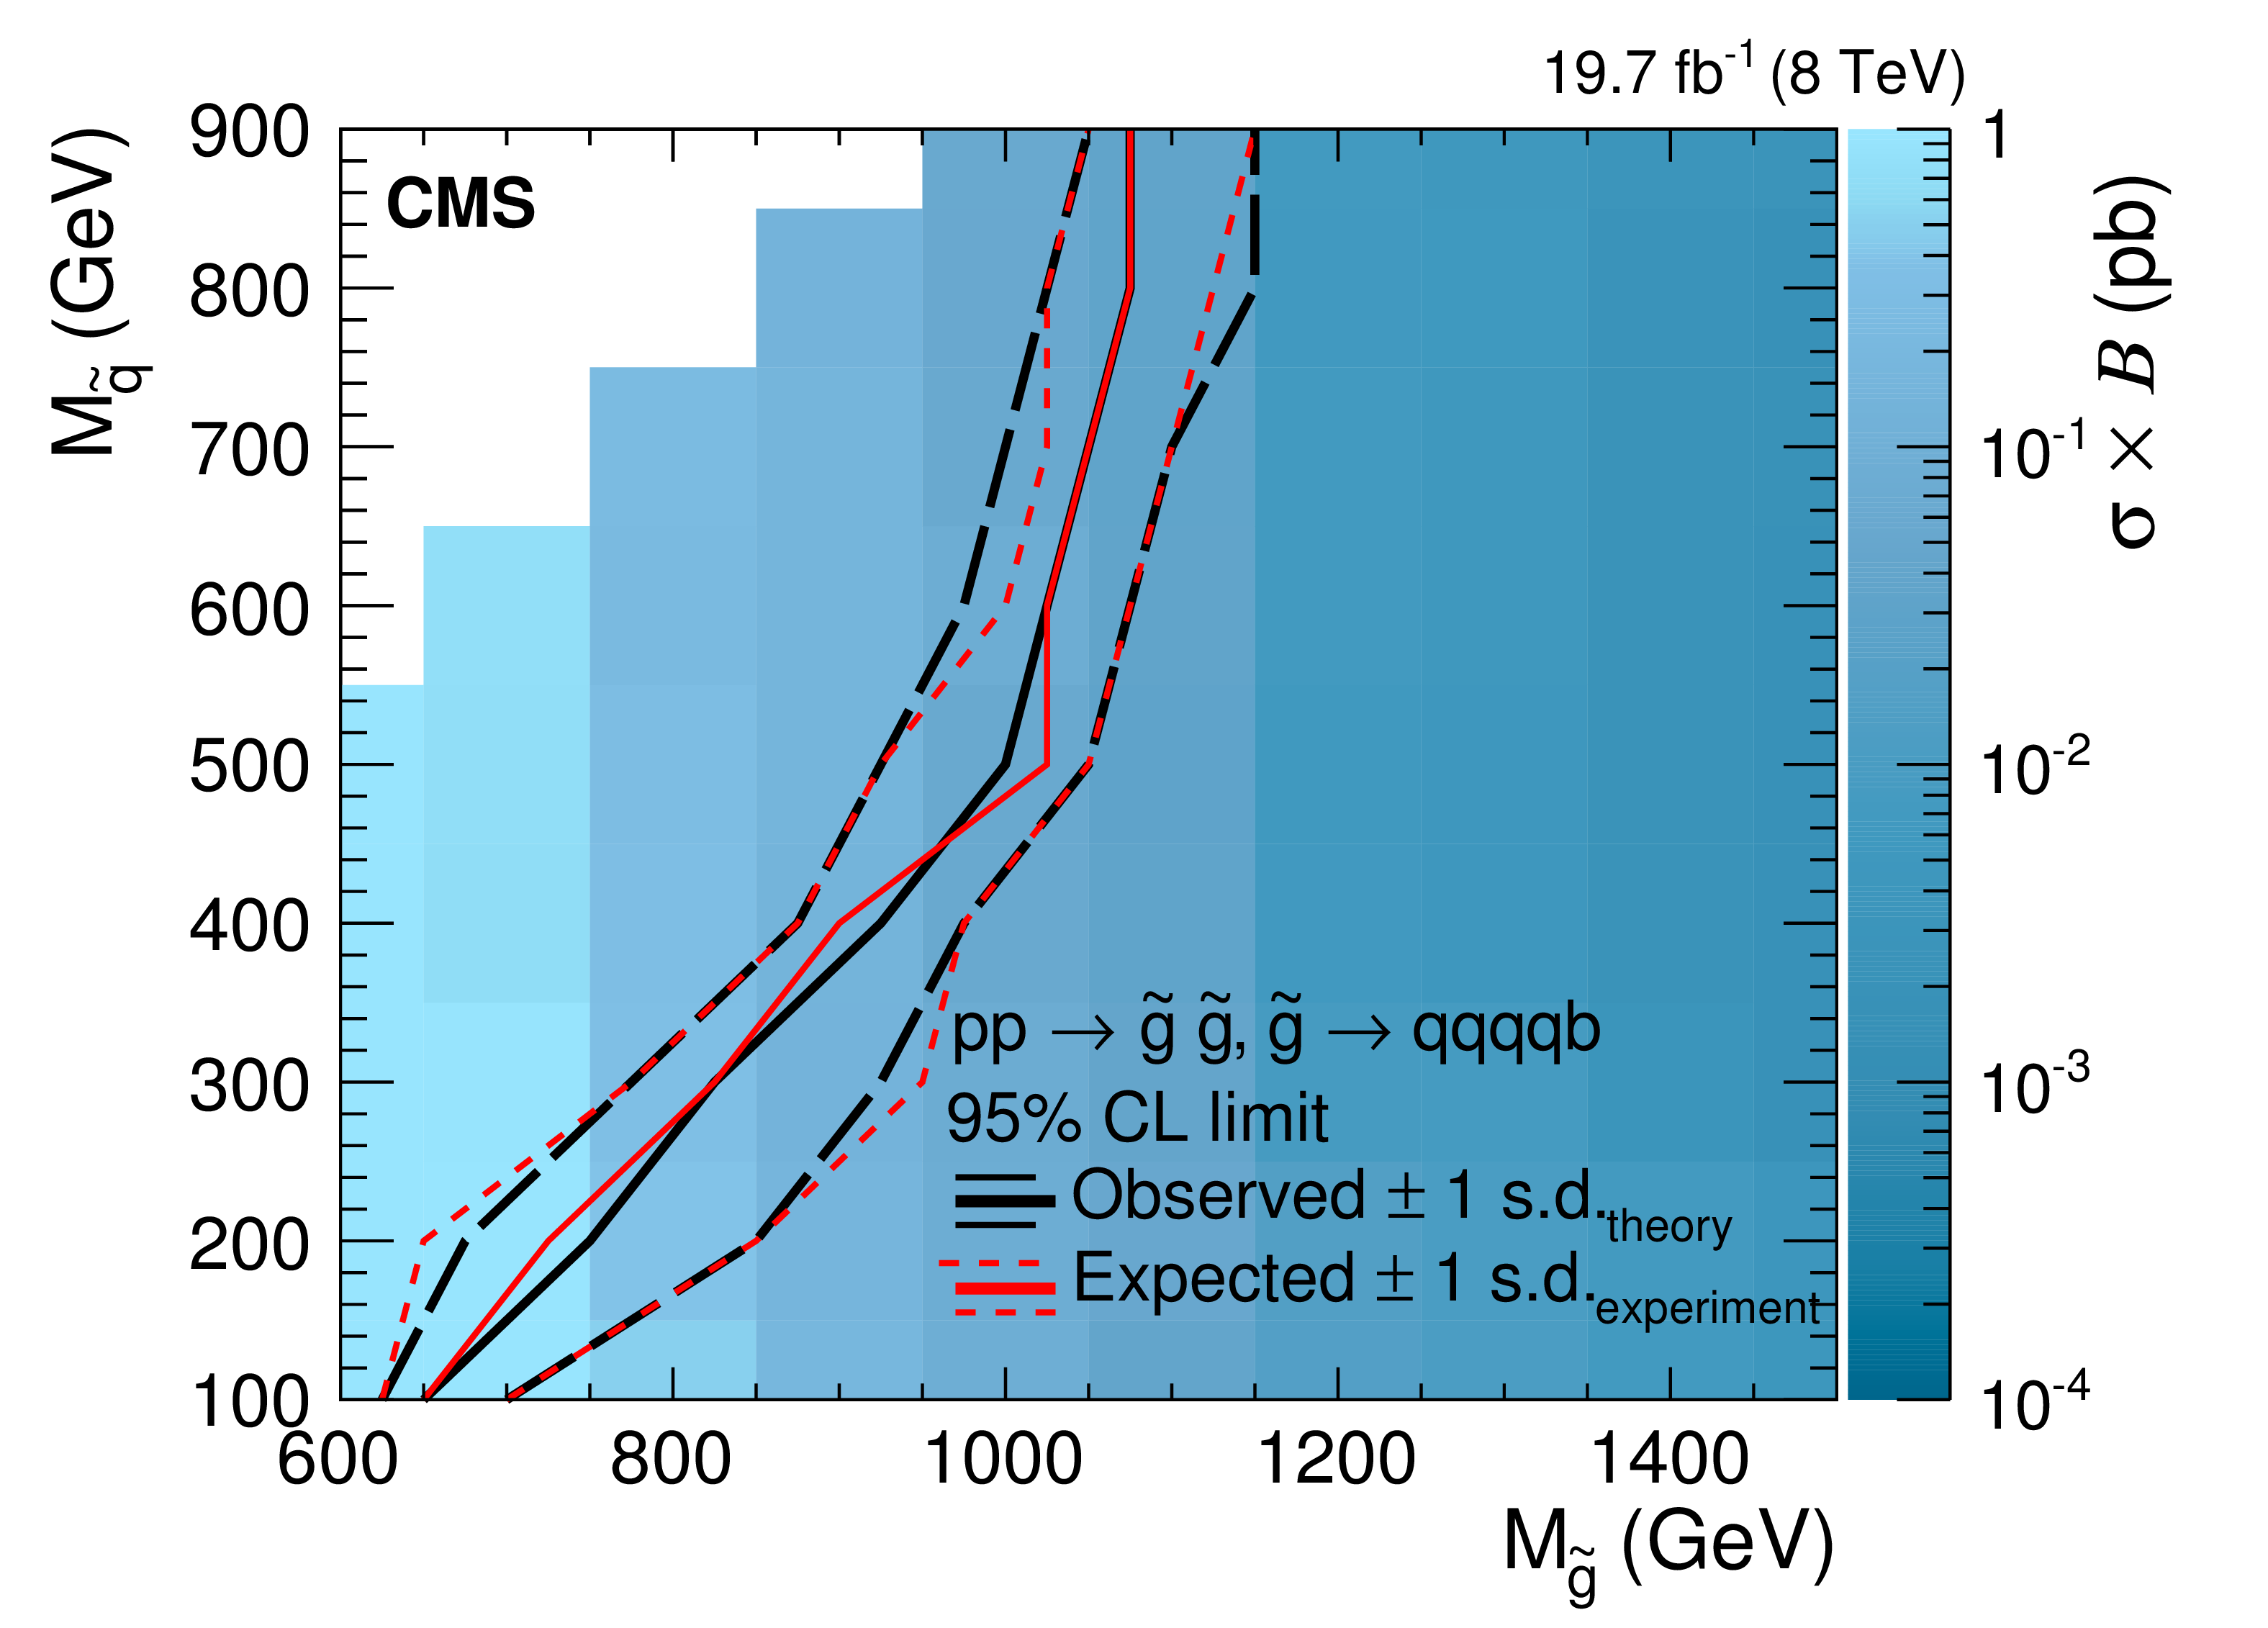
Figure 7-b:
Upper limits at 95% CL on the signal cross section times branching fraction, as a function of the gluino mass $M_{ \tilde{\mathrm{g}} }$ and squark mass $M_{ \tilde{\mathrm{q}} }$ for the pair-produced gluino model with RPV decays in the final states qqqqb (G2). The observed limit (black long-dashed lines) is compared to the expected limit (red short-dashed lines) with the one standard deviation theoretical uncertainty in the observed limit (black dashed lines) and the one standard deviation statistical and systematic uncertainties combined in the expected limits (red dashed lines). The gluino pair production cross sections are shown with the color scale. |
png pdf |
Figure 7-c:
Upper limits at 95% CL on the signal cross section times branching fraction, as a function of the gluino mass $M_{ \tilde{\mathrm{g}} }$ and squark mass $M_{ \tilde{\mathrm{q}} }$ for the pair-produced gluino model with RPV decays in the final states qqqbb (G3). The observed limit (black long-dashed lines) is compared to the expected limit (red short-dashed lines) with the one standard deviation theoretical uncertainty in the observed limit (black dashed lines) and the one standard deviation statistical and systematic uncertainties combined in the expected limits (red dashed lines). The gluino pair production cross sections are shown with the color scale. |
png pdf |
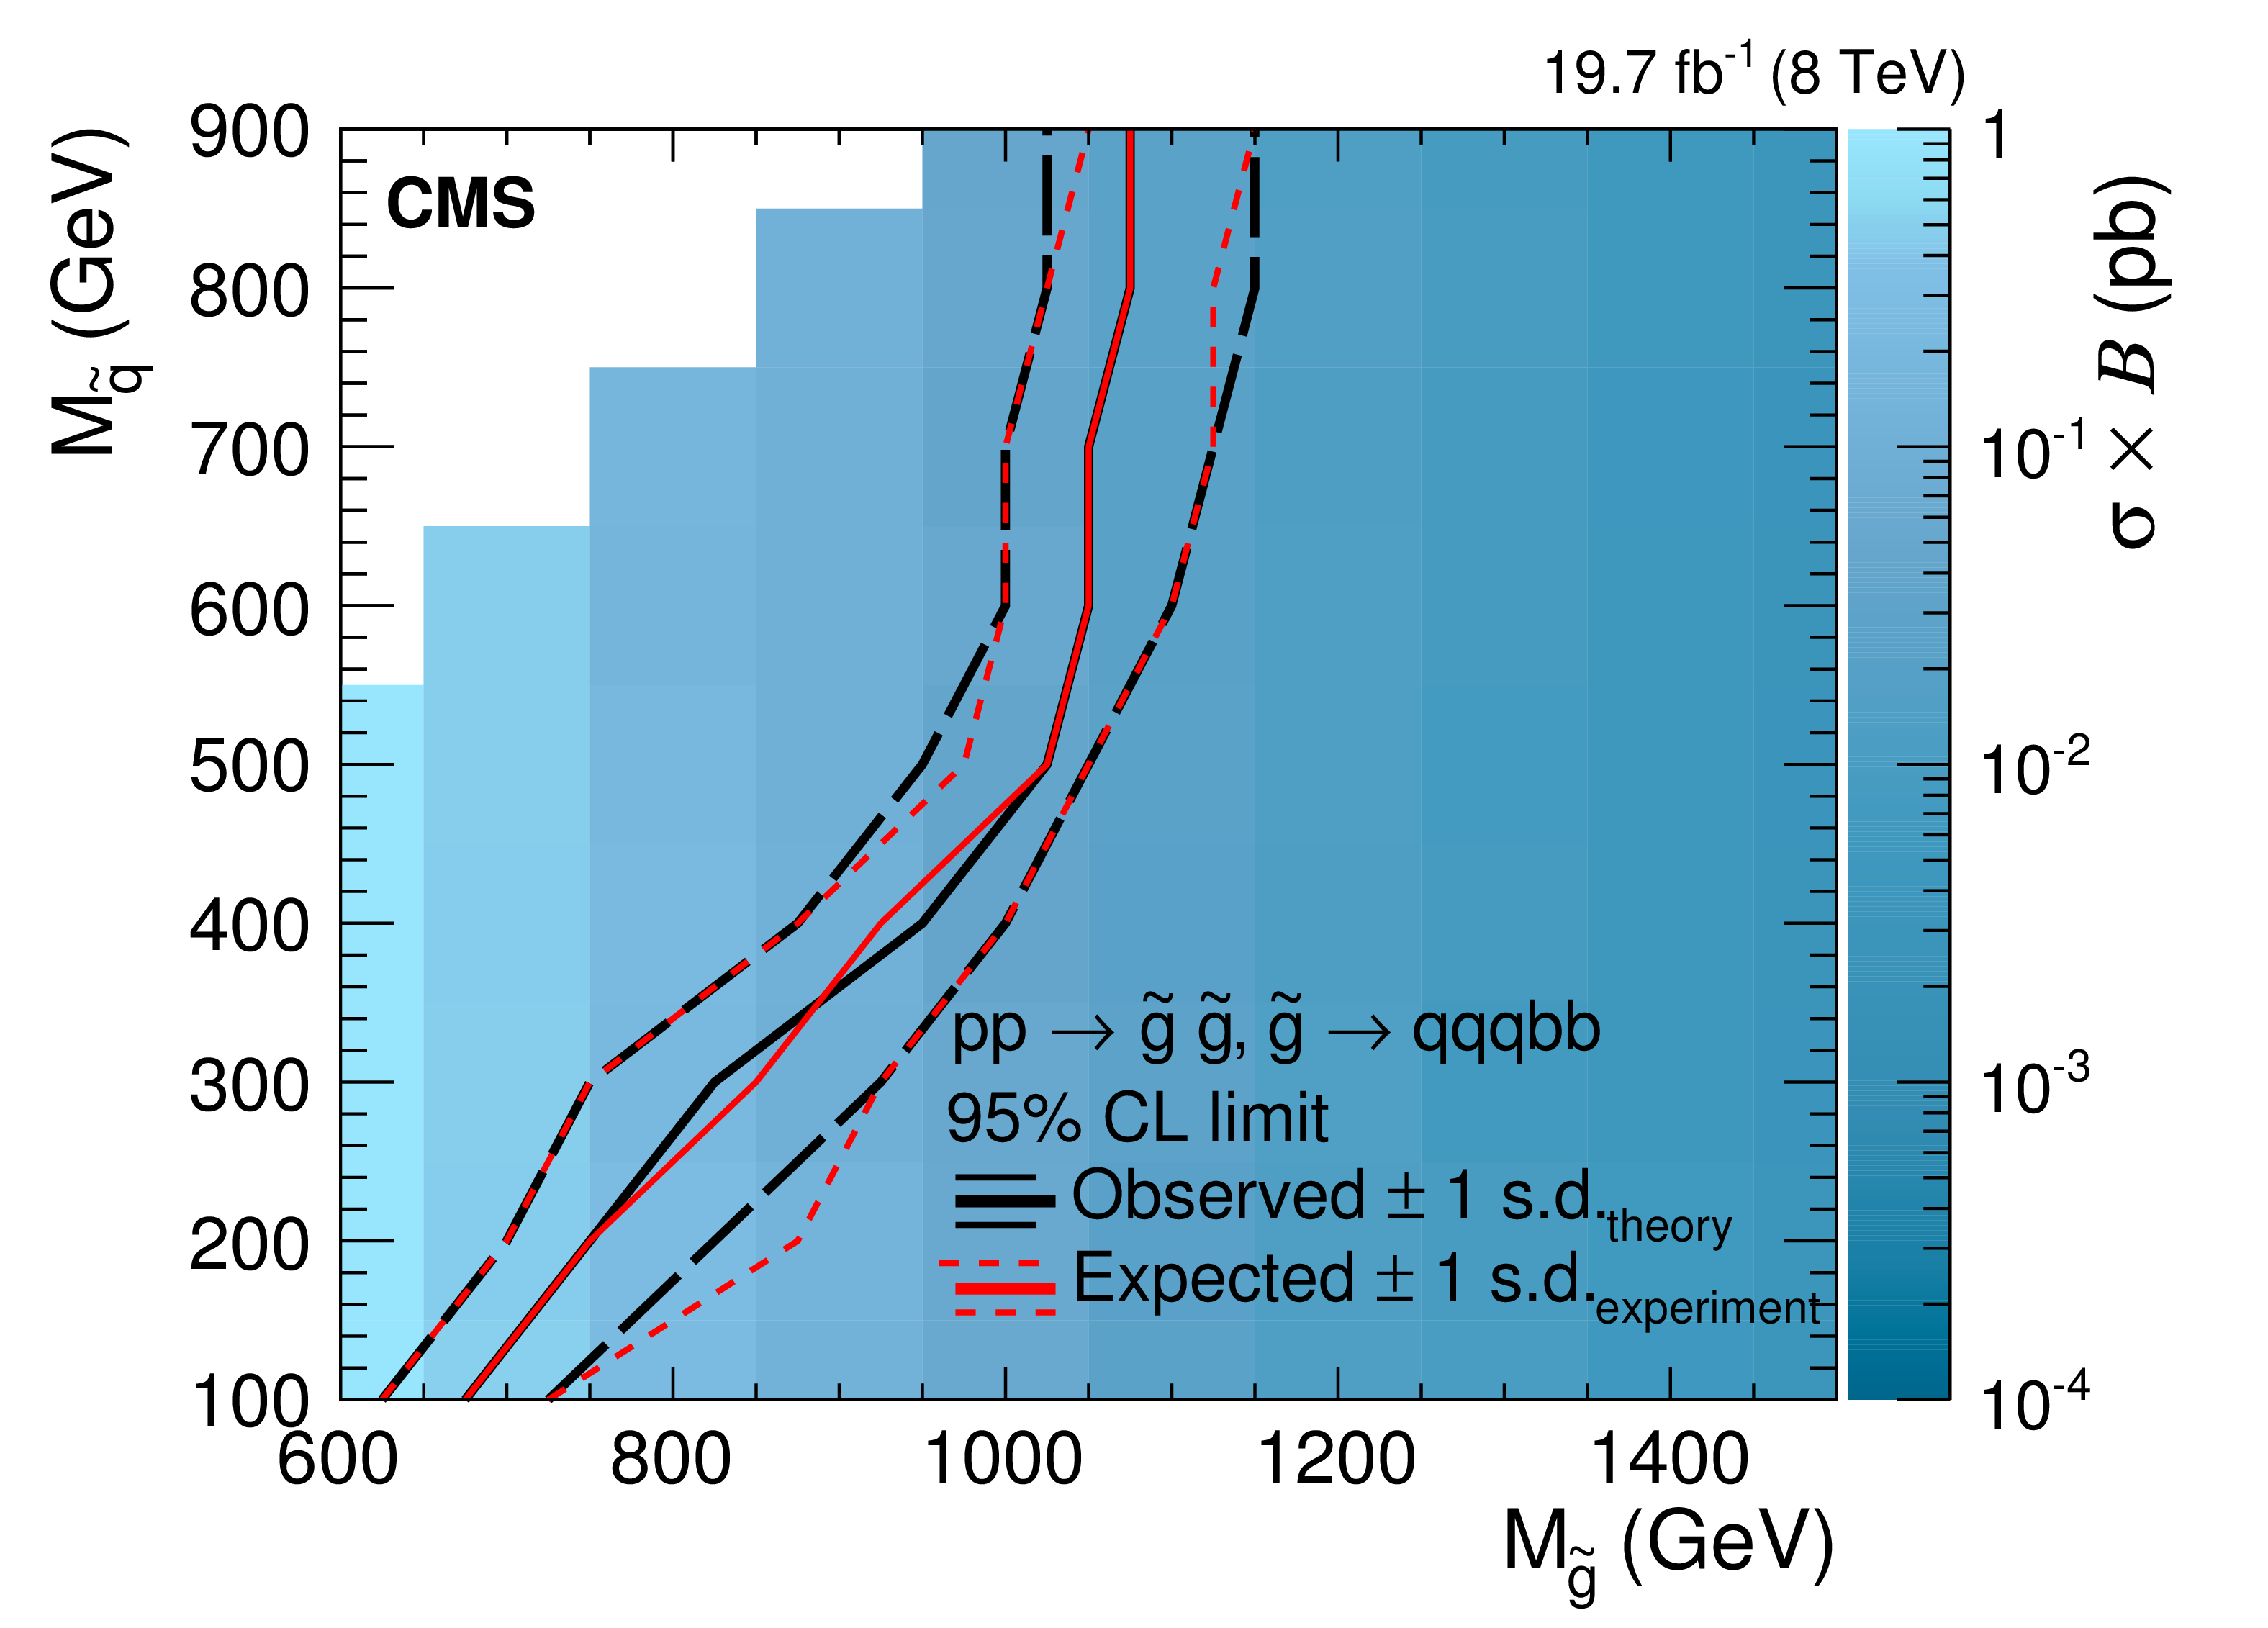
Figure 7-d:
Upper limits at 95% CL on the signal cross section times branching fraction, as a function of the gluino mass $M_{ \tilde{\mathrm{g}} }$ and squark mass $M_{ \tilde{\mathrm{q}} }$ for the pair-produced gluino model with RPV decays in the final states qqbbb (G4). The observed limit (black long-dashed lines) is compared to the expected limit (red short-dashed lines) with the one standard deviation theoretical uncertainty in the observed limit (black dashed lines) and the one standard deviation statistical and systematic uncertainties combined in the expected limits (red dashed lines). The gluino pair production cross sections are shown with the color scale. |
| Tables | |
png pdf |
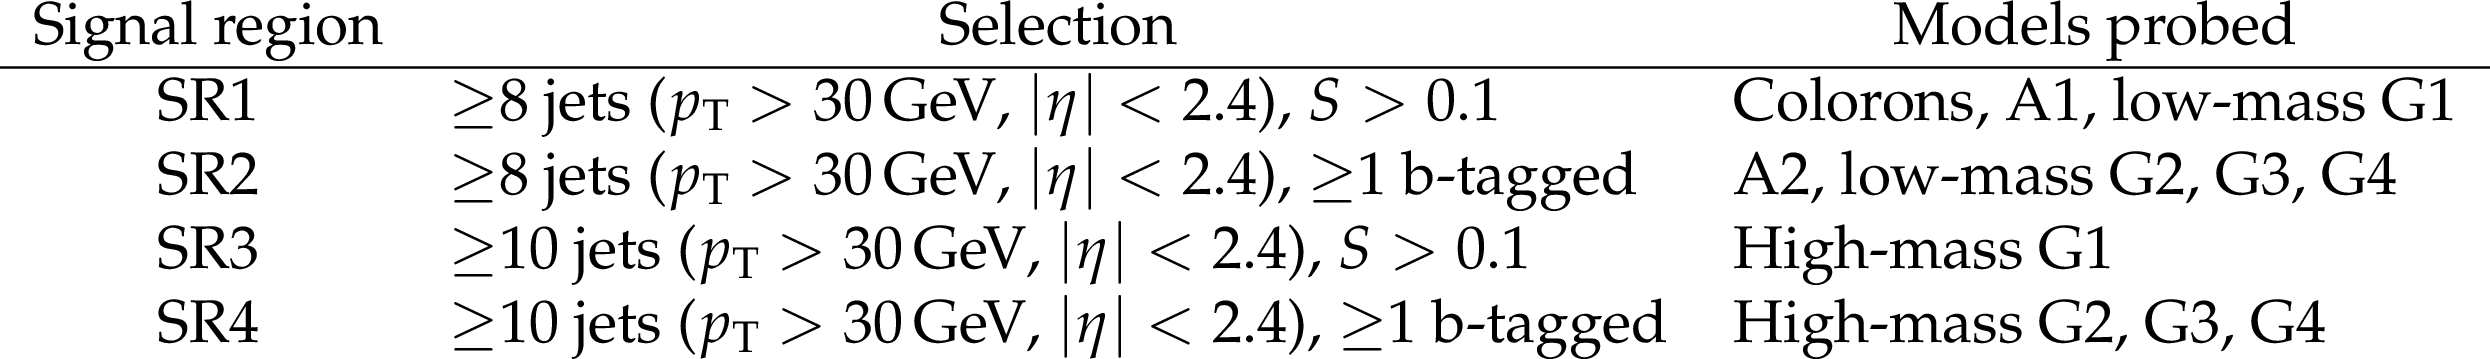
Table 1:
Definition of signal regions used in the analysis, and models probed by each signal region. |

png pdf |
Table 2:
Summary of systematic uncertainties in the signal yields and background yields. |
| Summary |
| A search has been performed for pair production of color-octet vector boson resonances and of gluinos in an RPV SUSY model, in inclusive eight- and ten-jet final states. The search is based on data from proton-proton collisions at $ \sqrt{s} = $ 8 TeV corresponding to an integrated luminosity of 19.6 fb$^{-1}$ collected by the CMS experiment at the LHC. The scalar sum of the transverse momenta of the jets is used as a discriminating variable, with additional requirements placed on event sphericity and b-tagged jet multiplicity. The dominant QCD multijet background is estimated from control samples at lower multiplicity, without any reliance on simulation. No significant deviation from the standard model background predictions has been observed. Upper limits at 95% confidence level on the cross section times branching fraction have been set for several signal scenarios. The cross section limits have been compared to specific coloron, axigluon, and gluino pair production cross sections. For the coloron and axigluon models, the lowest excluded mass is 0.6 TeV, while the highest excluded mass ranges from 0.75 to 1.15 TeV. For the RPV SUSY model, the lowest excluded mass is 0.6 TeV, while the highest excluded mass is 1.1 TeV. Models with colorons and axigluons decaying in multijet final states are probed experimentally for the first time. |
| Additional Figures | |
png pdf |
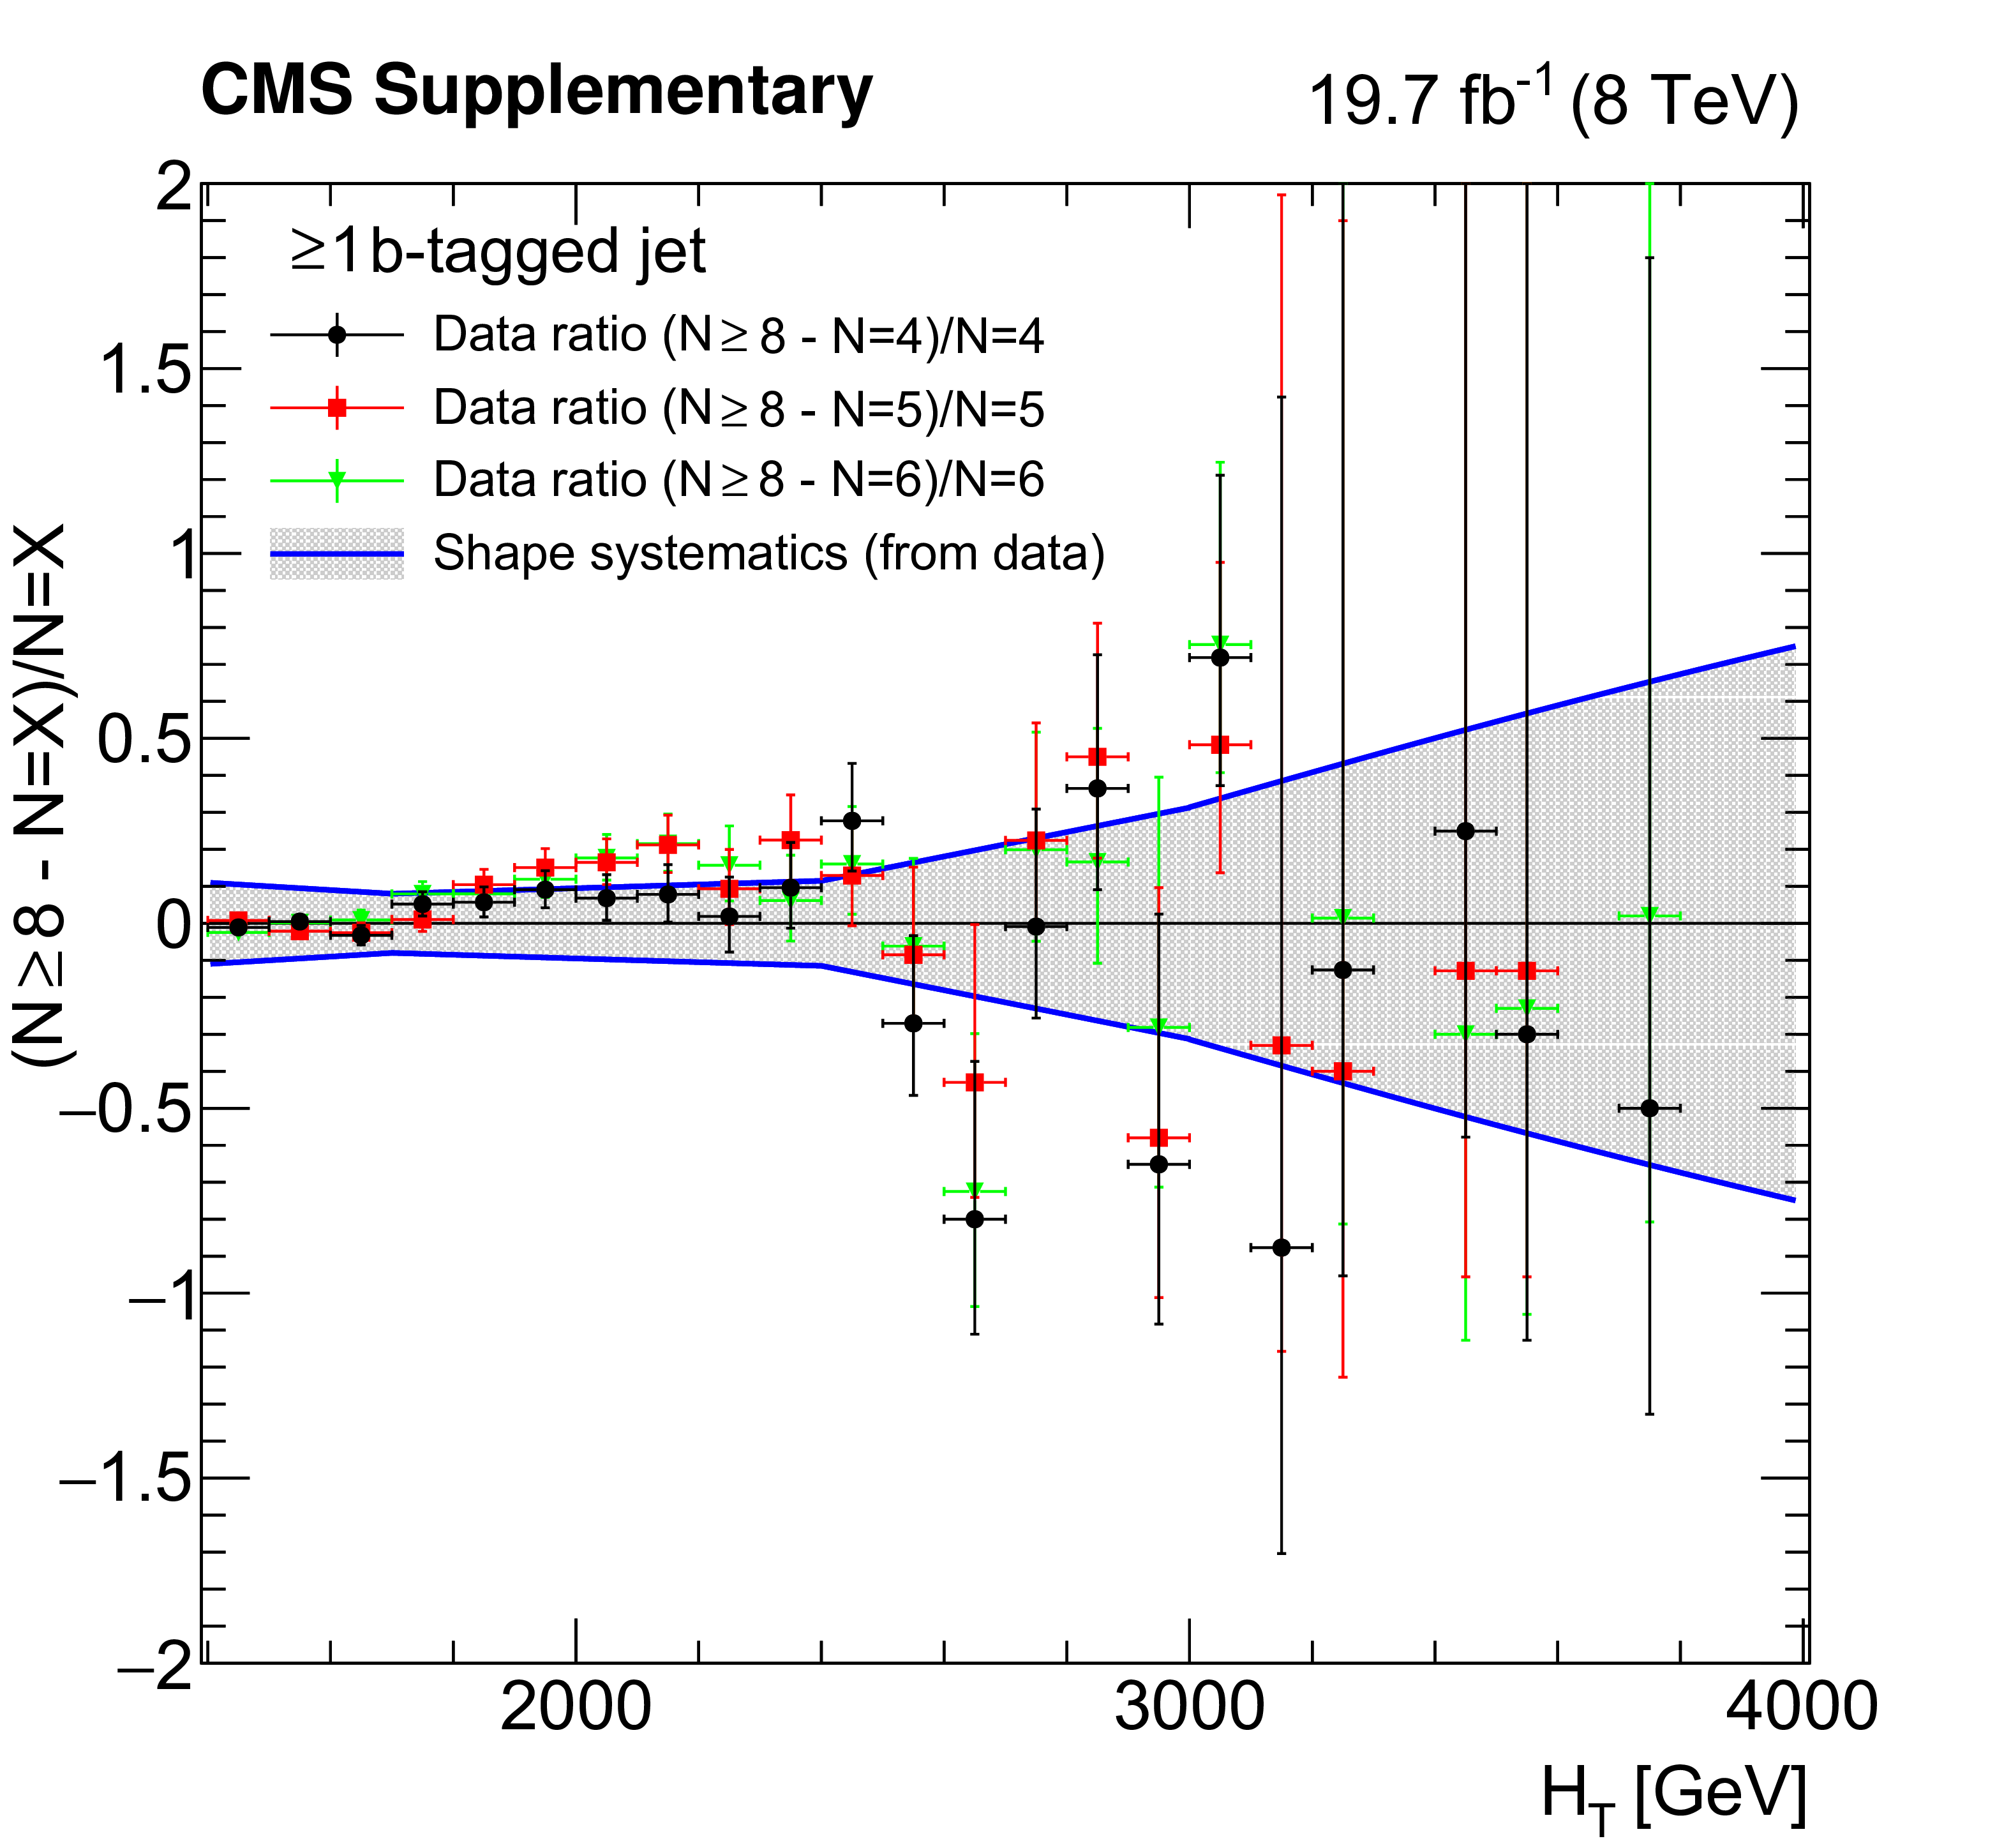
Additional Figure 1:
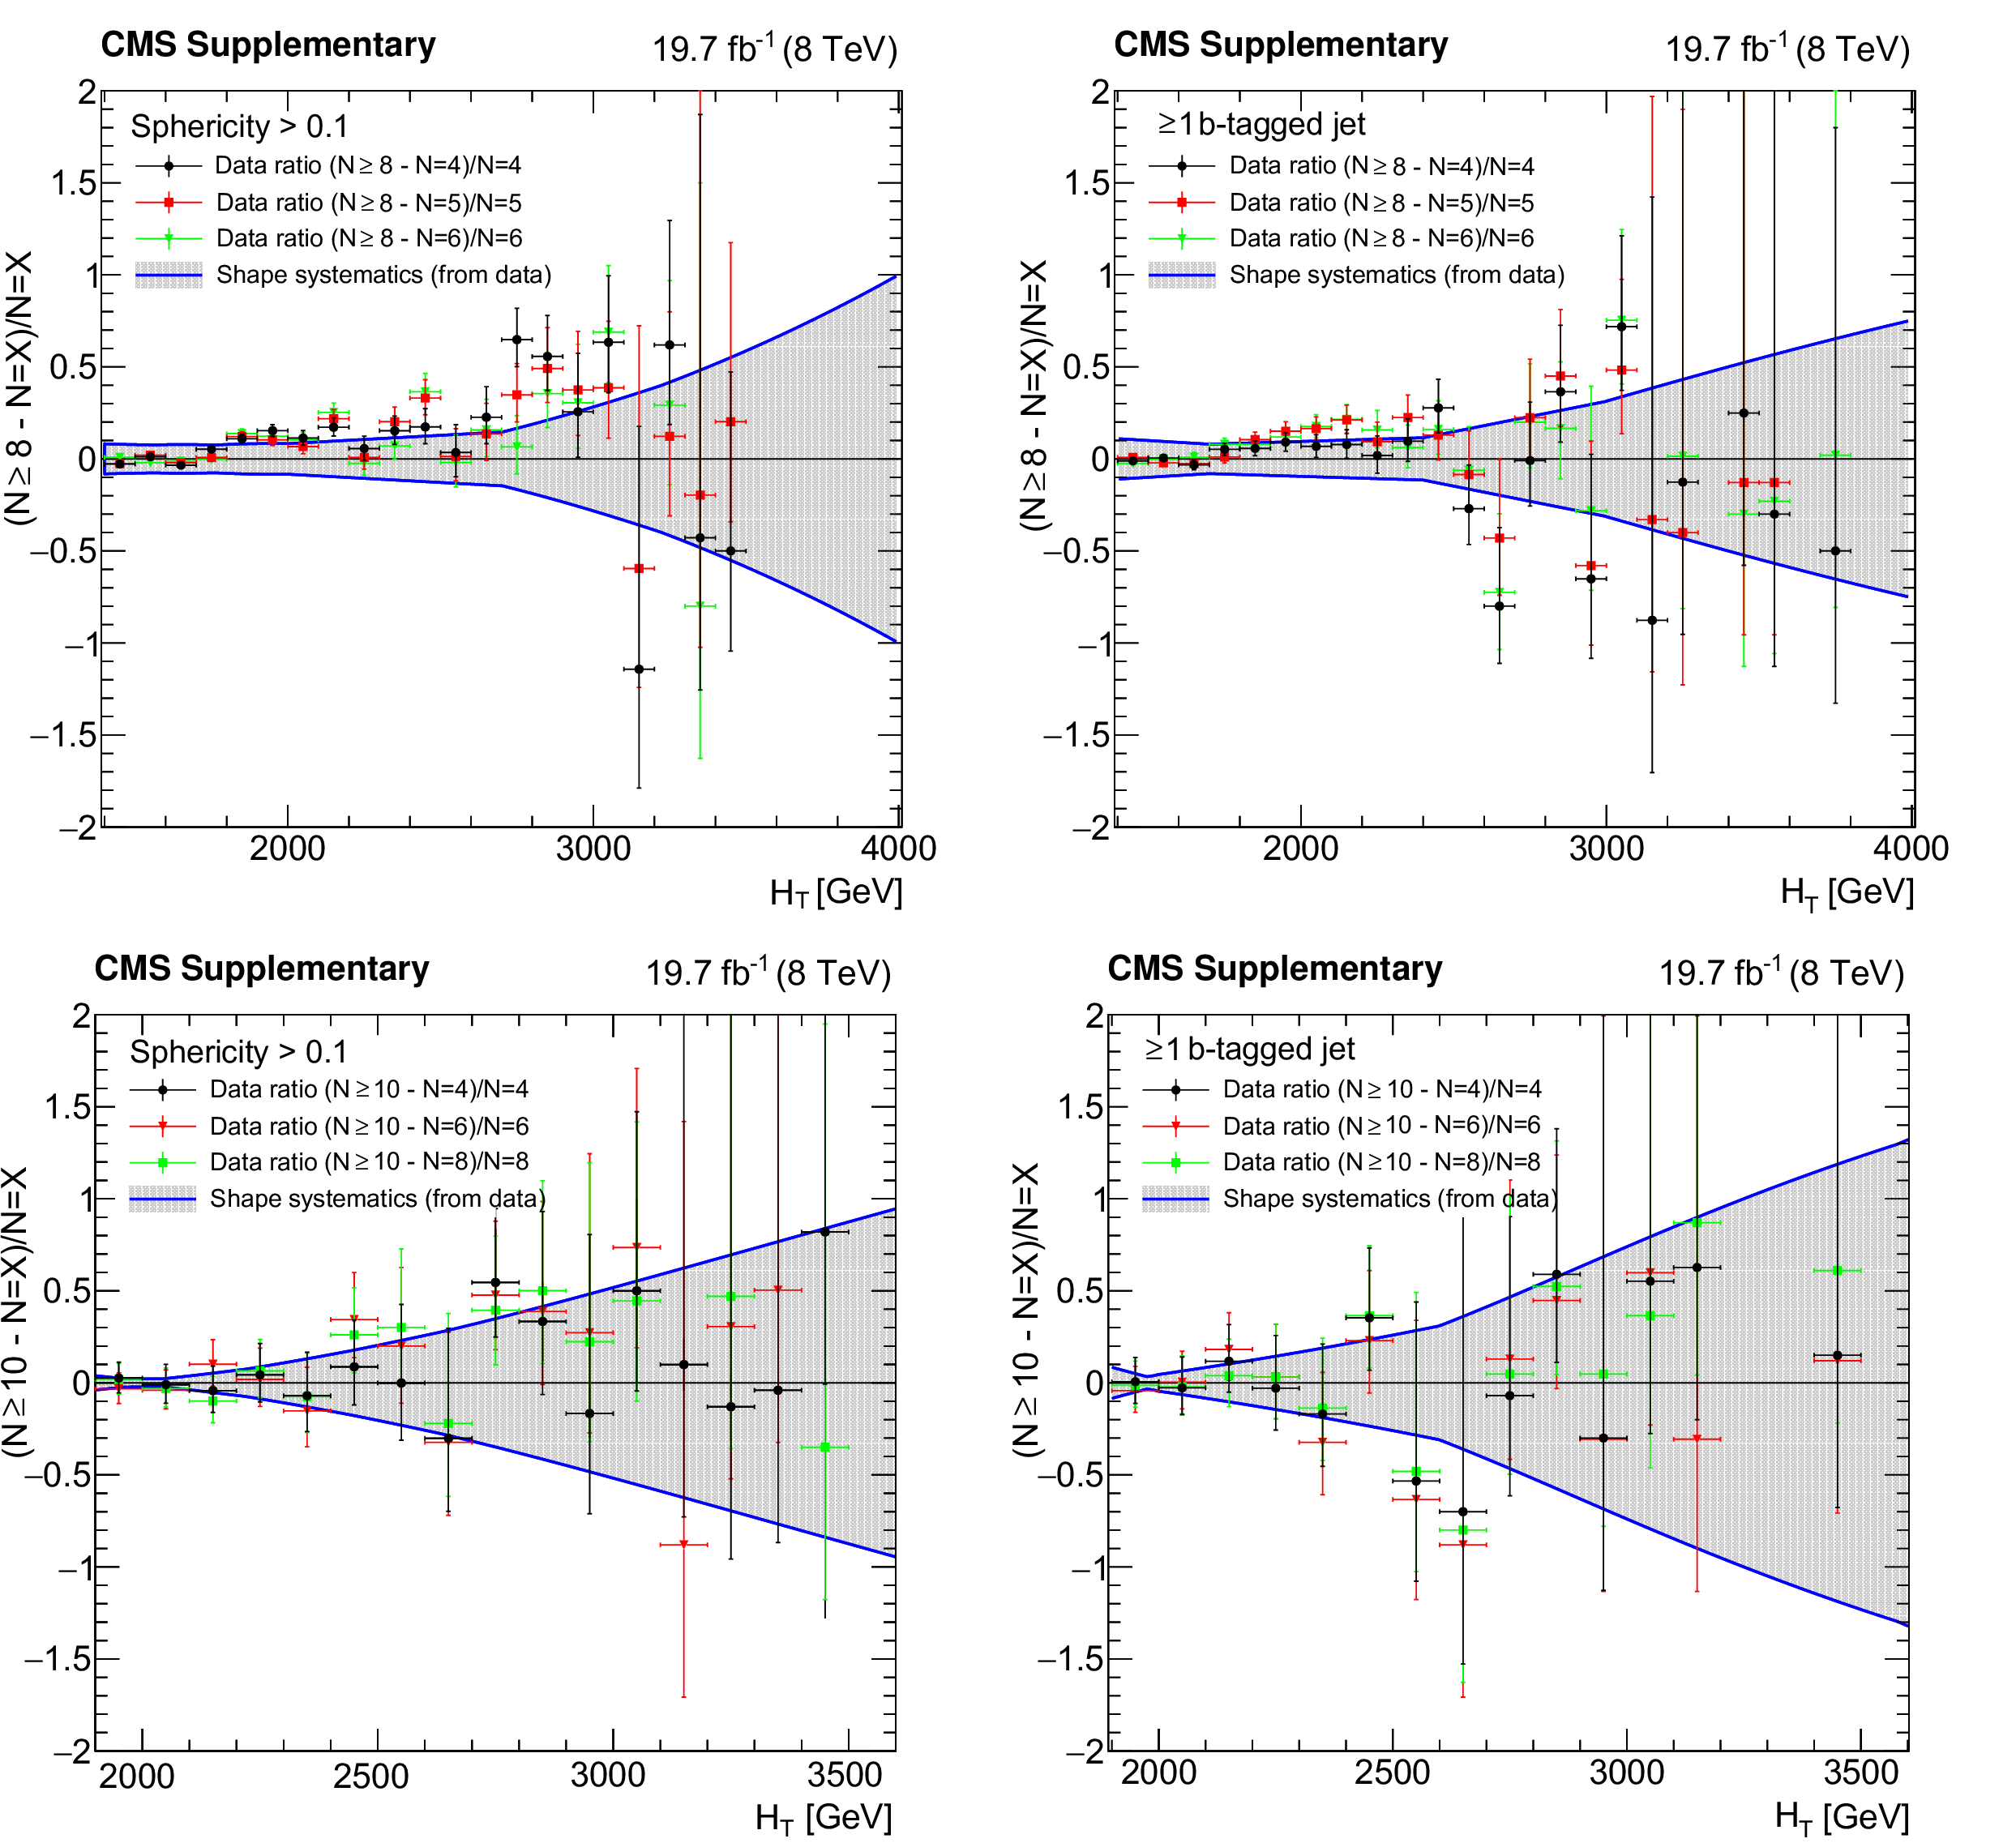
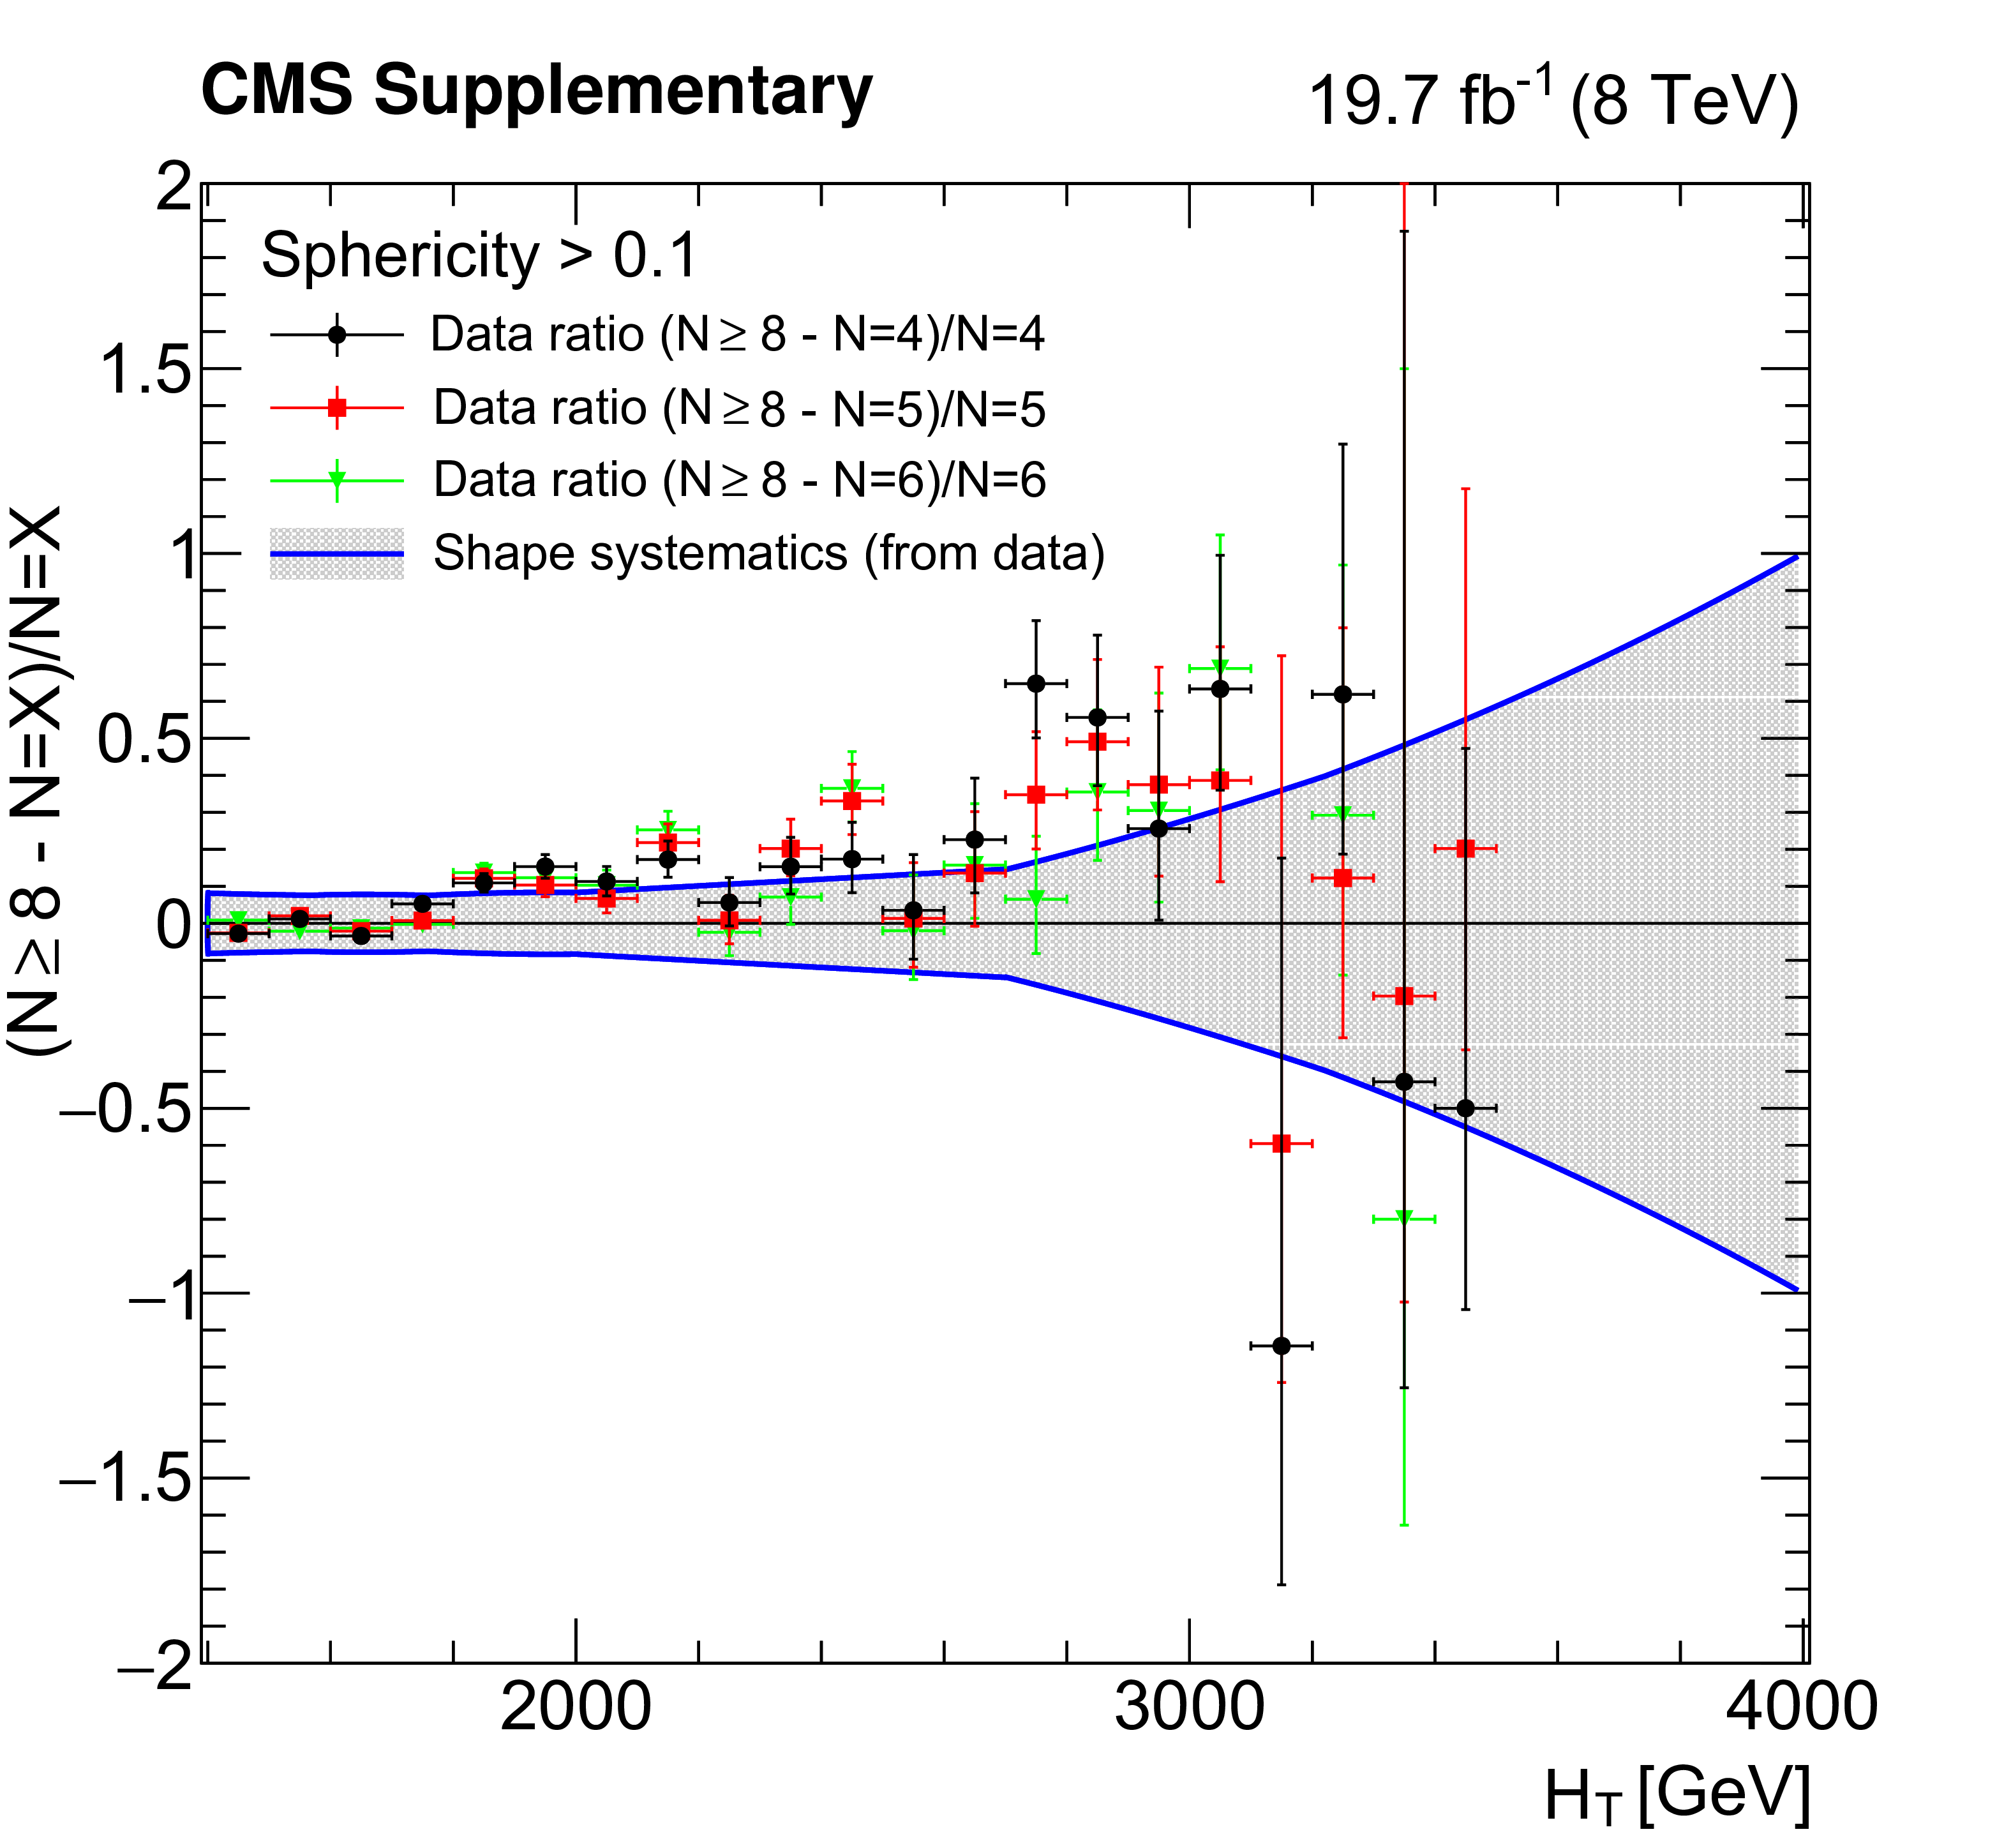
The $H_{\rm T}$ spectrum invariance after the $S > $ 0.1 or b tagging requirements. The relative difference between the observed number of events in the spectra with inclusive jet multiplicity of eight (top row) and ten (bottom row) and the observed number of events in the exclusive $N$ jet spectra for $N = $ 4, 5, and 6 (top row) or $N = $ 4, 6, and 8 (bottom row). The exclusive jet spectrum is normalized to the inclusive one in the first bin. The left (right) column corresponds to the $S > $ 0.1 requirement in the inclusive jet samples (the $\ge $1 b-tagged jet requirement in both inclusive and exclusive samples). The shaded band shows the relative systematic uncertainty in the background prediction. The error bars correspond to the statistical uncertainties in the ratio. |
png pdf |
Additional Figure 1-a:
The $H_{\rm T}$ spectrum invariance after the $S > $ 0.1 or b tagging requirements. The relative difference between the observed number of events in the spectra with inclusive jet multiplicity of eight and the observed number of events in the exclusive $N$ jet spectra for $N = $ 4, 5, and 6. The exclusive jet spectrum is normalized to the inclusive one in the first bin. The plot corresponds to the $S > $ 0.1 requirement in the inclusive jet samples. The shaded band shows the relative systematic uncertainty in the background prediction. The error bars correspond to the statistical uncertainties in the ratio. |
png pdf |
Additional Figure 1-b:
The $H_{\rm T}$ spectrum invariance after the $S > $ 0.1 or b tagging requirements. The relative difference between the observed number of events in the spectra with inclusive jet multiplicity of eight and the observed number of events in the exclusive $N$ jet spectra for $N = $ 4, 5, and 6. The exclusive jet spectrum is normalized to the inclusive one in the first bin. The plot corresponds to the $S > $ 0.1 requirement in the inclusive jet samples. The shaded band shows the relative systematic uncertainty in the background prediction. The error bars correspond to the statistical uncertainties in the ratio. |

png pdf |
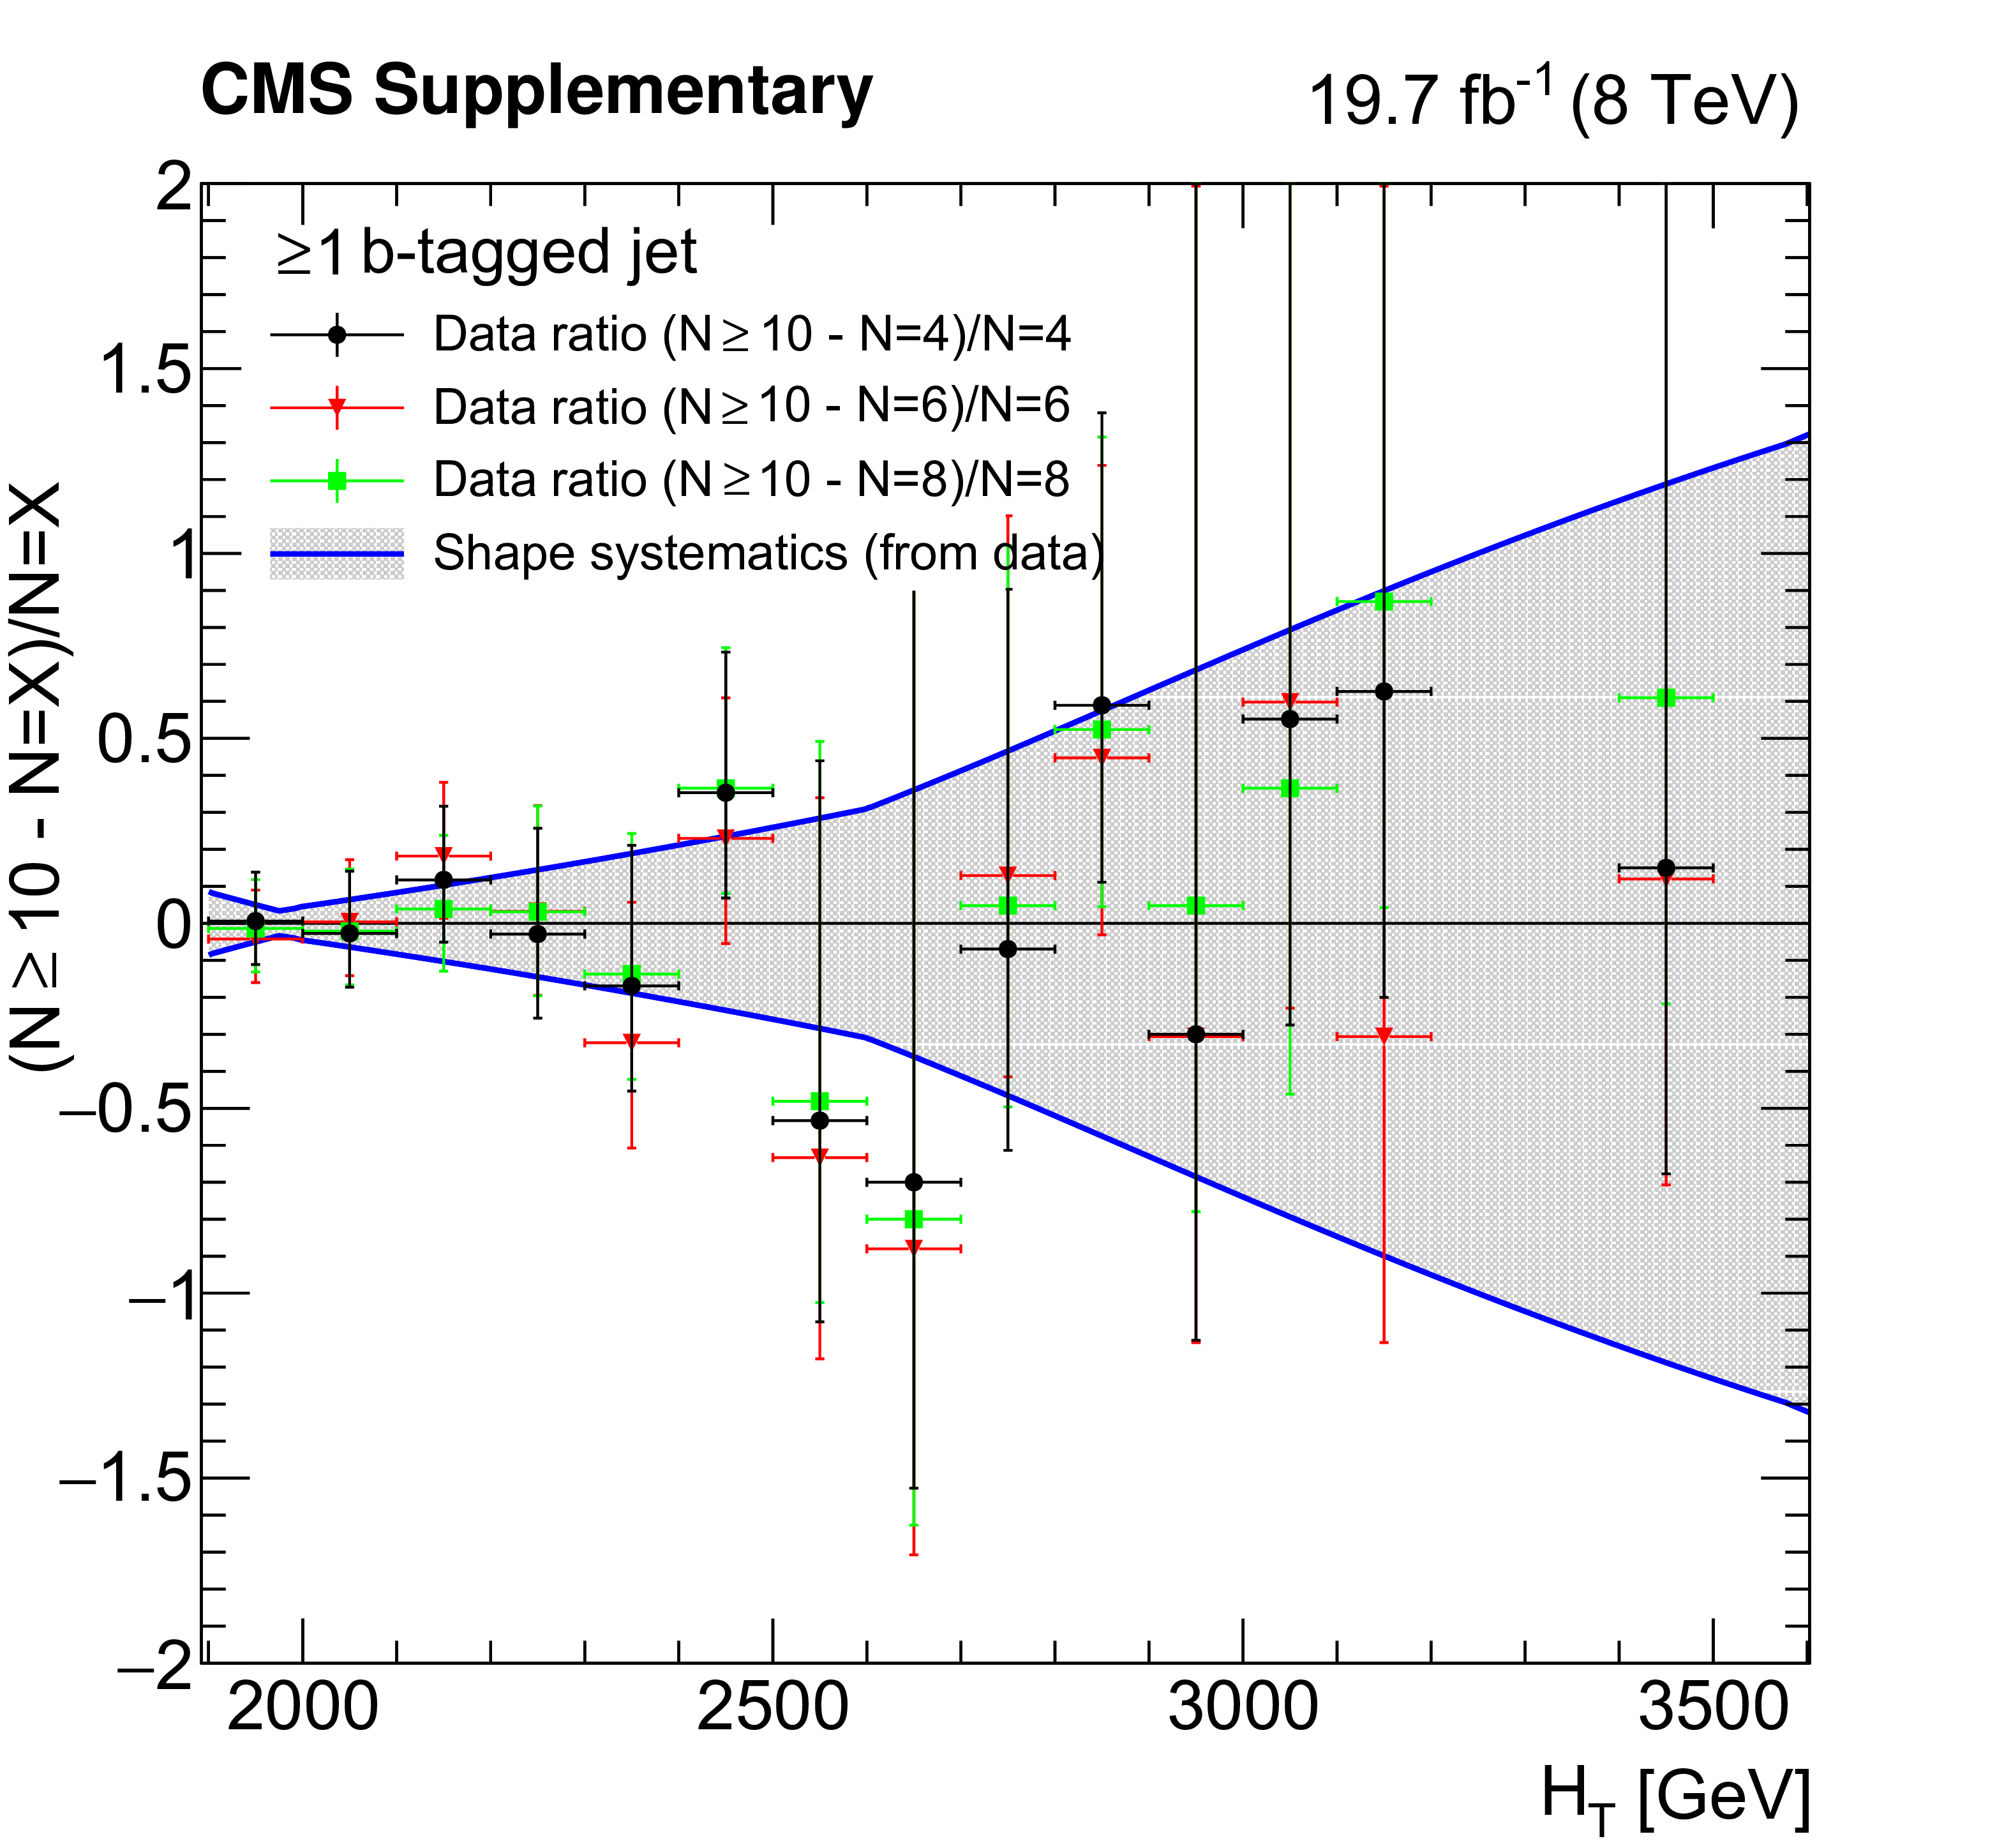
Additional Figure 1-c:
The $H_{\rm T}$ spectrum invariance after the $S > $ 0.1 or b tagging requirements. The relative difference between the observed number of events in the spectra with inclusive jet multiplicity of ten and the observed number of events in the exclusive $N$ jet spectra for $N = $ 4, 6, and 8. The exclusive jet spectrum is normalized to the inclusive one in the first bin. The plot corresponds to the $\ge $1 b-tagged jet requirement in both inclusive and exclusive samples. The shaded band shows the relative systematic uncertainty in the background prediction. The error bars correspond to the statistical uncertainties in the ratio. |
png pdf |
Additional Figure 1-d:
The $H_{\rm T}$ spectrum invariance after the $S > $ 0.1 or b tagging requirements. The relative difference between the observed number of events in the spectra with inclusive jet multiplicity of ten and the observed number of events in the exclusive $N$ jet spectra for $N = $ 4, 6, and 8. The exclusive jet spectrum is normalized to the inclusive one in the first bin. The plot corresponds to the $\ge $1 b-tagged jet requirement in both inclusive and exclusive samples. The shaded band shows the relative systematic uncertainty in the background prediction. The error bars correspond to the statistical uncertainties in the ratio. |
| References | ||||
| 1 | UA1 Collaboration | Two jet mass distributions at the CERN proton - anti-proton collider | PLB 209 (1988) 127 | |
| 2 | UA2 Collaboration | A measurement of two jet decays of the $ W $ and $ Z $ bosons at the CERN $ {\rm \bar{p} p} $ collider | Z. Phys. C 49 (1991) 17 | |
| 3 | UA2 Collaboration | A search for new intermediate vector mesons and excited quarks decaying to two jets at the CERN $ {\rm \bar{p} p} $ collider | NPB 400 (1993) 3 | |
| 4 | CDF Collaboration | The two jet invariant mass distribution at $ \sqrt{s} = $ 1.8 TeV | PRD 41 (1990) 1722(R) | |
| 5 | CDF Collaboration | Search for quark compositeness, axigluons and heavy particles using the dijet invariant mass spectrum observed in $ {\rm \bar{p} p} $ collisions | PRL 71 (1993) 2542 | |
| 6 | CDF Collaboration | Search for New Particles Decaying to Dijets in $ {\rm \bar{p} p} $ Collisions at $ \sqrt{s} = $ 1.8 TeV | PRL 74 (1995) 3538 | hep-ex/9501001 |
| 7 | CDF Collaboration | Measurement of Dijet Angular Distributions by the Collider Detector at Fermilab | PRL 77 (1996) 5336 | hep-ex/9609011 |
| 8 | CDF Collaboration | Search for new particles decaying to dijets at CDF | PRD 55 (1997) 5263(R) | hep-ex/9702004 |
| 9 | CDF Collaboration | Search for new particles decaying into dijets in proton-antiproton collisions at $ \sqrt{s} = $ 1.96 TeV | PRD 79 (2009) 112002 | 0812.4036 |
| 10 | D0 Collaboration | Measurement of Dijet Angular Distributions and Search for Quark Compositeness | PRL 80 (1998) 666 | hep-ex/9707016 |
| 11 | D0 Collaboration | The Dijet Mass Spectrum and a Search for Quark Compositeness in $ {\rm \bar{p} p} $ Collisions at $ \sqrt{s} = $ 1.8 TeV | PRL 82 (1999) 2457 | hep-ex/9807014 |
| 12 | D0 Collaboration | Search for new particles in the two-jet decay channel with the D0 detector | PRD 69 (2004) 111101(R) | hep-ex/0308033 |
| 13 | ATLAS Collaboration | Search for New Particles in Two-Jet Final States in 7 TeV Proton-Proton Collisions with the ATLAS Detector at the LHC | PRL 105 (2010) 161801 | 1008.2461 |
| 14 | ATLAS Collaboration | Search for quark contact interactions in dijet angular distributions in pp collisions at $ \sqrt{s}= $ 7 TeV measured with the ATLAS detector | PLB 694 (2011) 327 | 1009.5069 |
| 15 | ATLAS Collaboration | A search for new physics in dijet mass and angular distributions in pp collisions at $ \sqrt{s} = $ 7 TeV measured with the ATLAS Detector | New J. Phys. 13 (2011) 053044 | 1103.3864 |
| 16 | ATLAS Collaboration | Search for new physics in the dijet mass distribution using 1 fb$ ^{-1} $ of pp collision data at $ \sqrt{s}= $ 7 TeV collected by the ATLAS detector | PLB 708 (2012) 37 | 1108.6311 |
| 17 | ATLAS Collaboration | ATLAS search for new phenomena in dijet mass and angular distributions using pp collisions at $ \sqrt{s}= $ 7 TeV | JHEP 01 (2013) 029 | 1210.1718 |
| 18 | ATLAS Collaboration | Search for new phenomena in the dijet mass distribution using pp collision data at $ \sqrt{s}= $ 8 TeV with the ATLAS detector | PRD 91 (2015) 052007 | 1407.1376 |
| 19 | ATLAS Collaboration | Search for New Phenomena in Dijet Angular Distributions in Proton-Proton Collisions at $ \sqrt{s} = $ 8 TeV Measured with the ATLAS Detector | PRL 114 (2015) 221802 | 1504.00357 |
| 20 | ATLAS Collaboration | Search for new phenomena in dijet mass and angular distributions from $ pp $ collisions at $ \sqrt{s} = $ 13 TeV with the ATLAS detector | PLB 754 (2016) 302 | 1512.01530 |
| 21 | ATLAS Collaboration | Search for resonances in the mass distribution of jet pairs with one or two jets identified as $ b $-jets in proton--proton collisions at $ \sqrt{s}= $ 13 TeV with the ATLAS detector | PLB 759 (2016) 229 | 1603.08791 |
| 22 | CMS Collaboration | Search for Dijet Resonances in 7 TeV pp Collisions at CMS | PRL 105 (2010) 211801 | CMS-EXO-10-010 1010.0203 |
| 23 | CMS Collaboration | Search for Quark Compositeness with the Dijet Centrality Ratio in pp Collisions at $ \sqrt{s}= $ 7 TeV | PRL 105 (2010) 262001 | CMS-EXO-10-002 1010.4439 |
| 24 | CMS Collaboration | Measurement of Dijet Angular Distributions and Search for Quark Compositeness in pp Collisions at $ \sqrt{s} = $ 7 TeV | PRL 106 (2011) 201804 | CMS-EXO-10-009 1102.2020 |
| 25 | CMS Collaboration | Search for resonances in the dijet mass spectrum from 7 TeV pp collisions at CMS | PLB 704 (2011) 123 | CMS-EXO-11-015 1107.4771 |
| 26 | CMS Collaboration | Search for quark compositeness in dijet angular distributions from pp collisions at $ \sqrt{s}= $ 7 TeV | JHEP 05 (2012) 055 | CMS-EXO-11-017 1202.5535 |
| 27 | CMS Collaboration | Search for narrow resonances and quantum black holes in inclusive and b-tagged dijet mass spectra from pp collisions at $ \sqrt{s}= $ 7 TeV | JHEP 01 (2013) 013 | CMS-EXO-11-094 1210.2387 |
| 28 | CMS Collaboration | Search for narrow resonances using the dijet mass spectrum in pp collisions at $ \sqrt{s} = $ 8 TeV | PRD 87 (2013) 114015 | CMS-EXO-12-016 1302.4794 |
| 29 | CMS Collaboration | Search for quark contact interactions and extra spatial dimensions using dijet angular distributions in proton-proton collisions at $ \sqrt{s} = $ 8 TeV | PLB 746 (2015) 79 | CMS-EXO-12-050 1411.2646 |
| 30 | CMS Collaboration | Search for resonances and quantum black holes using dijet mass spectra in proton-proton collisions at $ \sqrt{s} = $ 8 TeV | PRD 91 (2015) 052009 | CMS-EXO-12-059 1501.04198 |
| 31 | CMS Collaboration | Search for Narrow Resonances Decaying to Dijets in Proton-Proton Collisions at $ \sqrt{s} = $ 13 TeV | PRL 116 (2016) 071801 | CMS-EXO-15-001 1512.01224 |
| 32 | CMS Collaboration | Search for narrow resonances in dijet final states at $ \sqrt{s}= $ 8 TeV with the novel CMS technique of data scouting | PRL 117 (2016) 031802 | CMS-EXO-14-005 1604.08907 |
| 33 | ATLAS Collaboration | Search for massive colored scalars in four-jet final states in $ \sqrt{s}= $ 7 TeV proton-proton collisions with the ATLAS detector | EPJC 71 (2011) 1828 | 1110.2693 |
| 34 | ATLAS Collaboration | Search for pair-produced massive coloured scalars in four-jet final states with the ATLAS detector in proton-proton collisions at $ \sqrt{s}= $ 7 TeV | EPJC 73 (2013) 2263 | 1210.4826 |
| 35 | CMS Collaboration | Search for pair-produced dijet resonances in four-jet final states in pp collisions at $ \sqrt{s} = $ 7 TeV | PRL 110 (2013) 141802 | CMS-EXO-11-016 1302.0531 |
| 36 | CMS Collaboration | Search for pair-produced resonances decaying to jet pairs in proton-proton collisions at $ \sqrt{s} = $ 8 TeV | PLB 747 (2015) 98 | CMS-EXO-12-052 1412.7706 |
| 37 | CDF Collaboration | Search for Pair Production of Strongly Interacting Particles Decaying to Pairs of Jets in $ {\rm p \bar{p}} $ Collisions at $ \sqrt{s} = $ 1.96 TeV | PRL 111 (2013) 031802 | 1303.2699 |
| 38 | CDF Collaboration | First Search for Multijet Resonances in $ \sqrt{s} = $ 1.96 TeV ${\rm p \bar{p}} $ Collisions | PRL 107 (2011) 042001 | 1105.2815 |
| 39 | CMS Collaboration | Search for Three-Jet Resonances in pp Collisions at $ \sqrt{s}= $ 7 TeV | PRL 107 (2011) 101801 | CMS-EXO-11-001 1107.3084 |
| 40 | CMS Collaboration | Search for three-jet resonances in pp collisions at $ \sqrt{s}= $ 7 TeV | PLB 718 (2012) 329 | CMS-EXO-11-060 1208.2931 |
| 41 | CMS Collaboration | Searches for light- and heavy-flavour three-jet resonances in pp collisions at $ \sqrt{s} = $ 8 TeV | PLB 730 (2014) 193 | CMS-EXO-12-049 1311.1799 |
| 42 | ATLAS Collaboration | Search for pair production of massive particles decaying into three quarks with the ATLAS detector in $ \sqrt{s}= $ 7 TeV pp collisions at the LHC | JHEP 12 (2012) 086 | 1210.4813 |
| 43 | S. Dimopoulos and G. L. Landsberg | Black Holes at the Large Hadron Collider | PRL 87 (2001) 161602 | hep-ph/0106295 |
| 44 | S. B. Giddings and S. D. Thomas | High energy colliders as black hole factories: The end of short distance physics | PRD 65 (2002) 056010 | hep-ph/0106219 |
| 45 | CMS Collaboration | Search for microscopic black hole signatures at the Large Hadron Collider | PLB 697 (2011) 434 | CMS-EXO-10-017 1012.3375 |
| 46 | CMS Collaboration | Search for microscopic black holes in pp collisions at $ \sqrt{s}= $ 7 TeV | JHEP 04 (2012) 061 | CMS-EXO-11-071 1202.6396 |
| 47 | CMS Collaboration | Search for microscopic black holes in pp collisions at $ \sqrt{s} = $ 8 TeV | JHEP 07 (2013) 178 | CMS-EXO-12-009 1303.5338 |
| 48 | ATLAS Collaboration | Search for low-scale gravity signatures in multi-jet final states with the ATLAS detector at $ \sqrt{s} = $ 8 TeV | JHEP 07 (2015) 032 | 1503.08988 |
| 49 | ATLAS Collaboration | Search for strong gravity in multijet final states produced in pp collisions at $ \sqrt{s} = $ 13 TeV using the ATLAS detector at the LHC | JHEP 03 (2016) 026 | 1512.02586 |
| 50 | ATLAS Collaboration | Search for massive supersymmetric particles decaying to many jets using the ATLAS detector in pp collisions at $ \sqrt{s} = $ 8 TeV | PRD 91 (2015) 112016 | 1502.05686 |
| 51 | G. R. Farrar and P. Fayet | Phenomenology of the production, decay, and detection of new hadronic states associated with supersymmetry | PLB 76 (1978) 575 | |
| 52 | CMS Collaboration | Search for supersymmetry in events with photons and low missing transverse energy in pp collisions at $ \sqrt{s}= $ 7 TeV | PLB 719 (2013) 42 | CMS-SUS-12-014 1210.2052 |
| 53 | C. T. Hill | Topcolor: Top quark condensation in a gauge extension of the standard model | PLB 266 (1991) 419 | |
| 54 | C. T. Hill and S. J. Parke | Top production: Sensitivity to new physics | PRD 49 (1994) 4454 | hep-ph/9312324 |
| 55 | R. S. Chivukula, A. G. Cohen, and E. H. Simmons | New strong interactions at the Tevatron? | PLB 380 (1996) 92 | hep-ph/9603311 |
| 56 | E. H. Simmons | Coloron phenomenology | PRD 55 (1997) 1678 | hep-ph/9608269 |
| 57 | P. H. Frampton and S. L. Glashow | Chiral color: An alternative to the standard model | PLB 190 (1987) 157 | |
| 58 | J. A. Evans, Y. Kats, D. Shih, and M. J. Strassler | Toward Full LHC Coverage of Natural Supersymmetry | JHEP 07 (2014) 101 | 1310.5758 |
| 59 | D. A. Dicus, C. Kao, S. Nandi, and J. Sayre | Discovering colorons at the early stage LHC | PRD 83 (2011) 091702(R) | 1012.5694 |
| 60 | J. Sayre, D. A. Dicus, C. Kao, and S. Nandi | Searching for colorons at the Large Hadron Collider | PRD 84 (2011) 015011 | 1105.3219 |
| 61 | Y. Nambu | Axial vector current conservation in weak interactions | PRL 4 (1960) 380 | |
| 62 | J. Goldstone | Field Theories with Superconductor Solutions | Nuovo Cim. 19 (1961) 154 | |
| 63 | G. Marques Tavares and M. Schmaltz | Explaining the t $ - {\rm \bar t} $ asymmetry with a light axigluon | PRD 84 (2011) 054008 | 1107.0978 |
| 64 | CMS Collaboration | Description and performance of track and primary-vertex reconstruction with the CMS tracker | JINST 9 (2014) P10009 | |
| 65 | CMS Collaboration | The CMS experiment at the CERN LHC | JINST 3 (2008) S08004 | CMS-00-001 |
| 66 | J. Alwall et al. | MadGraph/MadEvent v4: The New Web Generation | JHEP 09 (2007) 028 | 0706.2334 |
| 67 | T. Stelzer and W. F. Long | Automatic generation of tree level helicity amplitudes | CPC 81 (1994) 357 | hep-ph/9401258 |
| 68 | J. Alwall et al. | The automated computation of tree-level and next-to-leading order differential cross sections, and their matching to parton shower simulations | JHEP 07 (2014) 079 | 1405.0301 |
| 69 | T. Sjostrand, S. Mrenna, and P. Z. Skands | PYTHIA 6.4 Physics and Manual | JHEP 05 (2006) 026 | hep-ph/0603175 |
| 70 | J. Pumplin et al. | New Generation of Parton Distributions with Uncertainties from Global QCD Analysis | JHEP 07 (2002) 012 | hep-ph/0201195 |
| 71 | CMS Collaboration | Study of the underlying event at forward rapidity in pp collisions at $ \sqrt{s} = $ 0.9, 2.76, and 7 TeV | JHEP 04 (2013) 072 | CMS-FWD-11-003 1302.2394 |
| 72 | CMS Collaboration | Event generator tunes obtained from underlying event and multiparton scattering measurements | EPJC 76 (2016) 155 | CMS-GEN-14-001 1512.00815 |
| 73 | GEANT4 Collaboration | GEANT4: a simulation toolkit | NIMA 506 (2003) 250 | |
| 74 | F. Caravaglios, M. L. Mangano, M. Moretti, and R. Pittau | A new approach to multijet calculations in hadron collisions | NPB 539 (1999) 215 | hep-ph/9807570 |
| 75 | C. Kilic, S. Schumann, and M. Son | Searching for Multijet Resonances at the LHC | JHEP 04 (2009) 128 | 0810.5542 |
| 76 | CMS Collaboration | The Fast Simulation of the CMS Detector at LHC | J. Phys. Conf. Ser. 331 (2011) 032049 | |
| 77 | M. Kramer et al. | Supersymmetry production cross sections in pp collisions at $ \sqrt{s}= $ 7 TeV | 1206.2892 | |
| 78 | M. Cacciari, G. P. Salam, and G. Soyez | The Anti-$ k_{\rm t} $ jet clustering algorithm | JHEP 04 (2008) 063 | 0802.1189 |
| 79 | CMS Collaboration | Determination of jet energy calibration and transverse momentum resolution in CMS | JINST 6 (2011) P11002 | CMS-JME-10-011 1107.4277 |
| 80 | CMS Collaboration | Particle--flow event reconstruction in cms and performance for jets, taus, and $ E_{\mathrm{T}^{\text{miss}} $ | ||
| 81 | CMS Collaboration | Commissioning of the particle-flow event reconstruction with the first lhc collisions recorded in the cms detector | ||
| 82 | CMS Collaboration | Identification of b-quark jets with the CMS experiment | JINST 8 (2013) P04013 | CMS-BTV-12-001 1211.4462 |
| 83 | CMS Collaboration | Performance of b tagging at $ \sqrt{s} = $ 8 TeV in multijet, $ \mathrm{ t \bar{t} } $ and boosted topology events | CMS-PAS-BTV-13-001 | CMS-PAS-BTV-13-001 |
| 84 | J. D. Bjorken and S. J. Brodsky | Statistical Model for Electron-Positron Annihilation into Hadrons | PRD 1 (1970) 1416 | |
| 85 | R. D. Cousins, J. T. Linnemann, and J. Tucker | Evaluation of three methods for calculating statistical significance when incorporating a systematic uncertainty into a test of the background-only hypothesis for a Poisson process | NIMA 595 (2008) 480 | |
| 86 | S. Alekhin et al. | The PDF4LHC Working Group Interim Report | 1101.0536 | |
| 87 | M. Botje et al. | The PDF4LHC Working Group Interim Recommendations | 1101.0538 | |
| 88 | H.-L. Lai et al. | New parton distributions for collider physics | PRD 82 (2010) 074024 | 1007.2241 |
| 89 | A. D. Martin, W. J. Stirling, R. S. Thorne, and G. Watt | Parton distributions for the LHC | EPJC 63 (2009) 189 | 0901.0002 |
| 90 | NNPDF Collaboration | Unbiased global determination of parton distributions and their uncertainties at NNLO and at LO | NPB 855 (2012) 153 | 1107.2652 |
| 91 | CMS Collaboration | CMS Luminosity Based on Pixel Cluster Counting - Summer 2013 Update | ||
| 92 | G. Cowan, K. Cranmer, E. Gross, and O. Vitells | Asymptotic formulae for likelihood-based tests of new physics | EPJC 71 (2011) 1554 | 1007.1727 |
| 93 | T. Junk | Confidence level computation for combining searches with small statistics | NIMA 434 (1999) 435 | hep-ex/9902006 |
| 94 | A. L. Read | Presentation of search results: the $ CL_s $ technique | JPG 28 (2002) 2693 | |
|
|
Compact Muon Solenoid LHC, CERN |
|

|

|

|

|

|