

Compact Muon Solenoid
LHC, CERN
| CMS-EXO-22-022 ; CERN-EP-2024-101 | ||
| Search for new resonances decaying to pairs of merged diphotons in proton-proton collisions at $ \sqrt{s} = $ 13 TeV | ||
| CMS Collaboration | ||
| 1 May 2024 | ||
| Submitted to Phys. Rev. Lett. | ||
| Abstract: A search is presented for an extended Higgs sector with two new particles, $ \mathrm{X} $ and $ \phi $, in the process $ \mathrm{X} \to \phi\phi \to (\gamma\gamma)(\gamma\gamma) $. Novel neural networks classify events with diphotons that are merged and determine the diphoton masses. The search uses LHC proton-proton collision data at $ \sqrt{s} = $ 13 TeV collected with the CMS detector, corresponding to an integrated luminosity of 138 fb$ ^{-1} $. No evidence of such resonances is seen. Upper limits are set on the production cross section versus the resonance masses, representing the most sensitive search in this channel. | ||
| Links: e-print arXiv:2405.00834 [hep-ex] (PDF) ; CDS record ; inSPIRE record ; CADI line (restricted) ; | ||
| Figures | Summary | Additional Figures | References | CMS Publications |
|---|
| Figures | |

png pdf |
Figure 1:
Cluster mass ($ m_{\Gamma} $) distribution in data for both the passing (left) and failing (right) regions, in the energy range for which the $ \eta $ meson is expected to form a single $ \Gamma $ candidate. The signal (background) is modeled by a Gaussian (exponential) function. Blue and red dashed lines depict Gaussian fits to the data and Monte Carlo (MC) simulation, respectively. The solid blue line shows the background component of the fit. Ratios of the Gaussian fit means ($ \mu $) and widths ($ \sigma $) are displayed, where $ m_{\eta}^{\text{true}} $ is the true mass of the $ \eta $ meson. |

png pdf |
Figure 1-a:
Cluster mass ($ m_{\Gamma} $) distribution in data for both the passing (left) and failing (right) regions, in the energy range for which the $ \eta $ meson is expected to form a single $ \Gamma $ candidate. The signal (background) is modeled by a Gaussian (exponential) function. Blue and red dashed lines depict Gaussian fits to the data and Monte Carlo (MC) simulation, respectively. The solid blue line shows the background component of the fit. Ratios of the Gaussian fit means ($ \mu $) and widths ($ \sigma $) are displayed, where $ m_{\eta}^{\text{true}} $ is the true mass of the $ \eta $ meson. |

png pdf |
Figure 1-b:
Cluster mass ($ m_{\Gamma} $) distribution in data for both the passing (left) and failing (right) regions, in the energy range for which the $ \eta $ meson is expected to form a single $ \Gamma $ candidate. The signal (background) is modeled by a Gaussian (exponential) function. Blue and red dashed lines depict Gaussian fits to the data and Monte Carlo (MC) simulation, respectively. The solid blue line shows the background component of the fit. Ratios of the Gaussian fit means ($ \mu $) and widths ($ \sigma $) are displayed, where $ m_{\eta}^{\text{true}} $ is the true mass of the $ \eta $ meson. |

png pdf |
Figure 2:
Dicluster mass ($ m_{\Gamma\Gamma} $) distribution for the data (points) for one of the $ \alpha^{\text{reco}} $ bins of the search (0.44 $ < \alpha^{\text{reco}} < $ 0.49%), fitted with the diphoton function (red), one of the considered five background parametrizations. Examples of two representative predicted signals are shown (blue and pink). The lower panel shows the difference between the observed data and the background prediction divided by the statistical uncertainty of the data ($ \sigma_{\text{data}} $), the aforementioned signals divided by $ \sigma_{\text{data}} $, and the goodness of fit measure $ \chi^2/\text{NDF} $ (where NDF is the number of degrees of freedom). |

png pdf |
Figure 3:
Exclusion limits at 95% CL on $ \sigma(\mathrm{X} \to \phi\phi \to (\gamma\gamma)(\gamma\gamma)) $ displayed in the ($ m_{\phi}/m_{\mathrm{X}} $)-$ m_{\mathrm{X}} $ plane. Branching fractions ($ \mathcal{B} $) of both $ \mathrm{X} \to \phi\phi $ and $ \phi \to \gamma\gamma $ are assumed to be 100%. The black (red) lines represent the observed (expected) mass exclusions corresponding to different assumptions of $ (m_{\mathrm{X}} N)/f $. The observed upper limits on the cross section are shown on the color $ z $ axis. |
| Summary |
| In summary, a search for an extended Higgs sector with two new particles, $ \mathrm{X} $ and $ \phi $, with unknown masses $ m_{\mathrm{X}} $ and $ m_{\phi} $, has been presented for the decay sequence $ \mathrm{X} \to \phi\phi \to (\gamma\gamma)(\gamma\gamma) $. The search uses proton-proton collision data at $ \sqrt{s}= $ 13 TeV, collected with the CMS detector at the LHC in 2016-2018, corresponding to an integrated luminosity of 138 fb$ ^{-1} $. The analysis considers $ m_{\mathrm{X}} $ between 0.3 and 3 TeV, and is restricted to values of $ m_{\phi} $ for which the ratio $ m_{\phi} / m_{\mathrm{X}} $ is between 0.5 and 2.5%. As a result, the two photons from each $ \phi $ boson overlap significantly in the electromagnetic calorimeter. Convolutional neural networks trained on clusters of calorimeter energy deposits are used to classify events containing merged diphotons and to regress the mass of the diphoton system. The dicluster mass spectra, in bins of the ratio of the average cluster mass divided by the dicluster mass, are analyzed for the presence of new resonances, and are found to be consistent with the standard model expectations. Upper limits are set at 95% confidence level (CL) on the production cross section for $ \mathrm{X} \to \phi\phi \to (\gamma\gamma)(\gamma\gamma) $, as a function of the resonance masses, where both the $ \mathrm{X} \to \phi\phi $ and $ \phi \to \gamma\gamma $ branching fractions are assumed to be 100%. Observed (expected) limits range within 0.03-1.06 (0.03-0.79) fb at 95% CL for the masses considered. These results represent the most sensitive search of an extended Higgs sector with this final state. |
| Additional Figures | |

png pdf |
Additional Figure 1:
Feynman diagram of the production and decay of $ \mathrm{X} \to \phi\phi \to (\gamma \gamma)(\gamma \gamma) $. The dominant production mechanism occurs via a fermion loop as shown in the diagram. Additional partons produced by initial-state radiation may be present. |

png pdf |
Additional Figure 2:
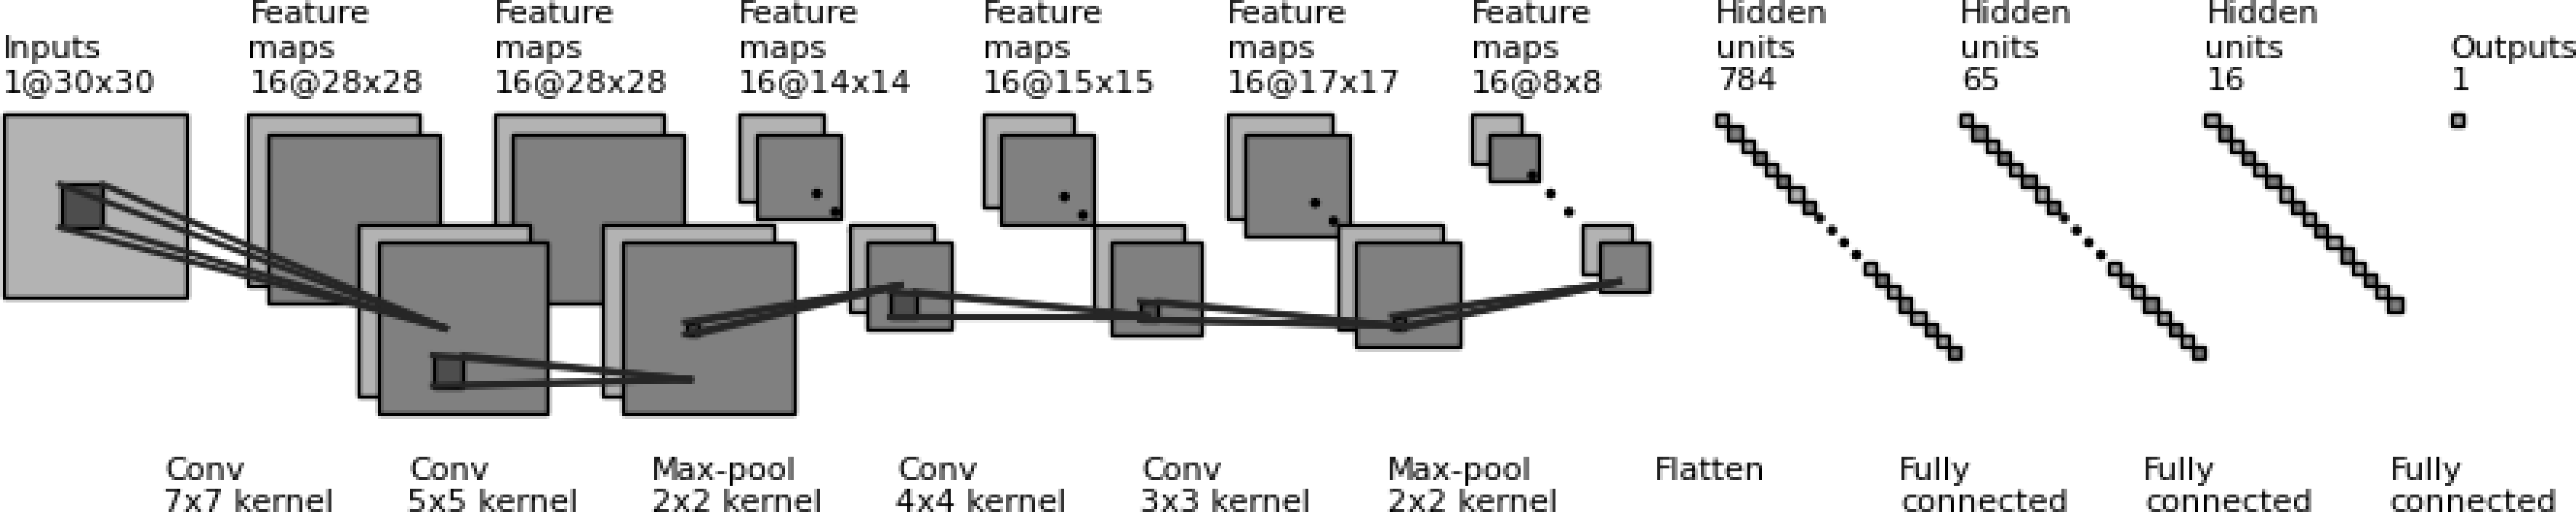
Architecture of the convolutional neural network used for classification. The network takes in a pixelated image of a candidate cluster made from ECAL energy deposits, where each pixel is exactly one ECAL crystal. The output is fed through a fully connected linear network which gives three output scores corresponding to the likelihood of the cluster being a single photon, diphoton, or hadron. |
png pdf |
Additional Figure 3:
Architecture of the convolutional neural network used for diphoton $ m/E $ regression. The network takes in a pixelated image of a diphoton cluster as selected by the classification neural network. The output is fed through three fully connected linear networks which give the final $ m/E $ of the diphoton. |

png pdf |
Additional Figure 4:
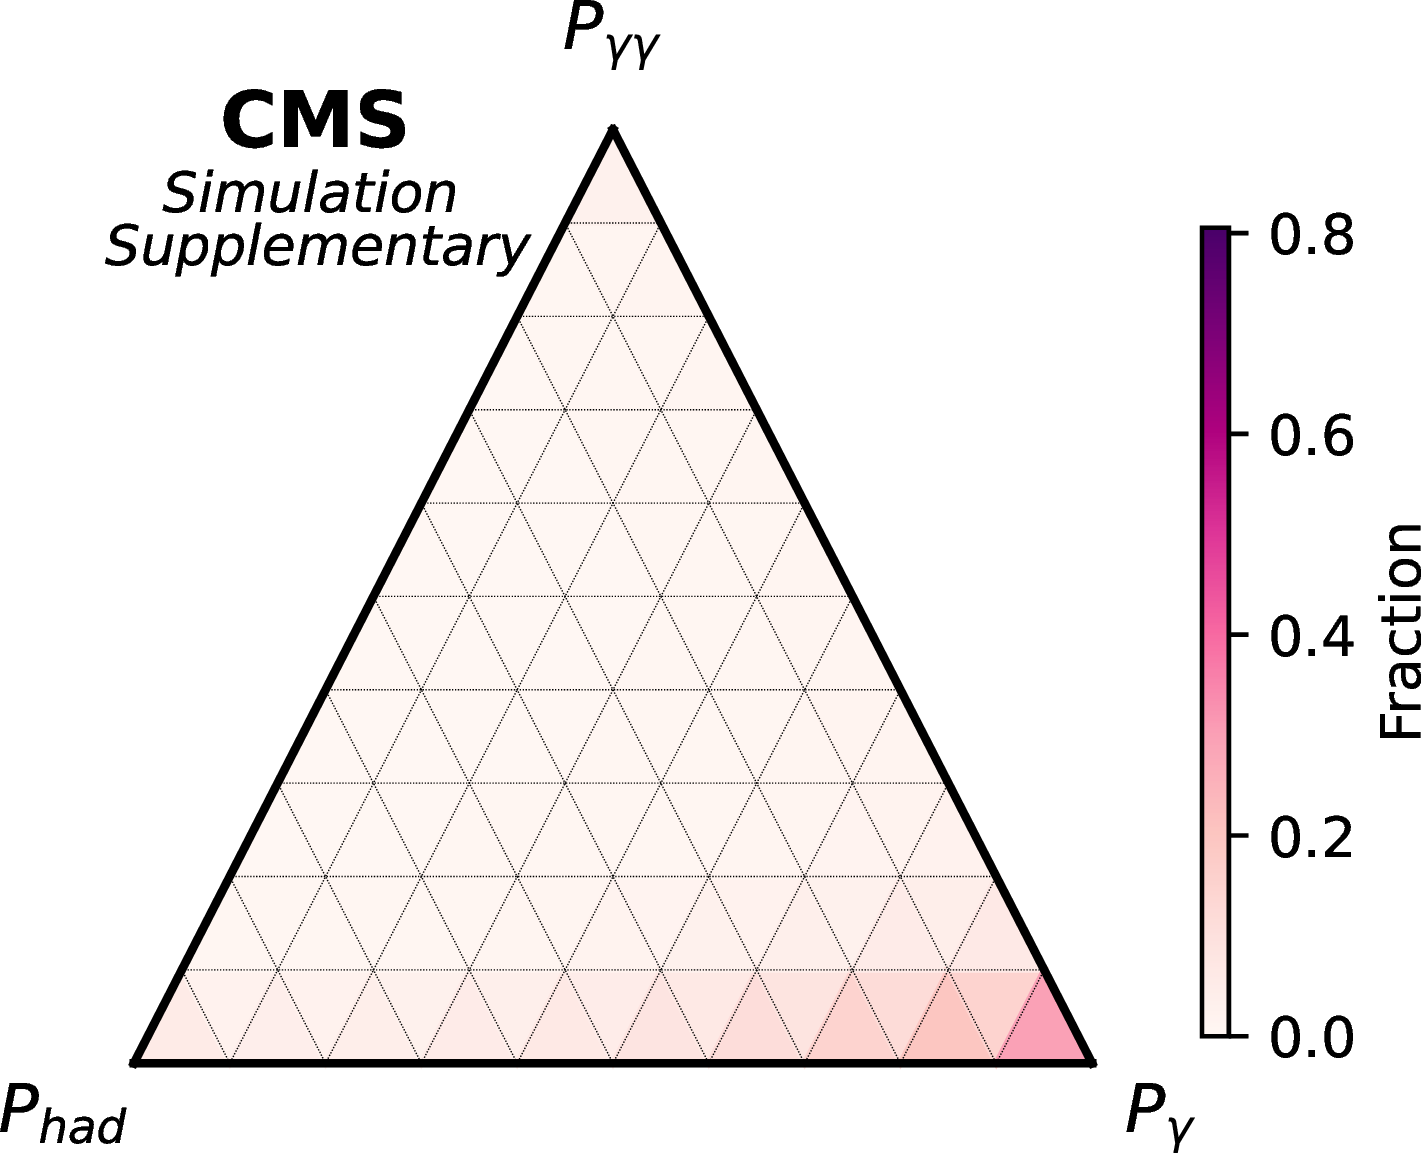
Ternary diagram showing showing the classification scores for true diphoton validation events. In this diagram each edge of the triangle is an axis depicting the associated classifier score from 0 to 1. The high-concentration of events near $ P_{\gamma\gamma} $ demonstrates the effectiveness of the classification NN. |
png pdf |
Additional Figure 5:
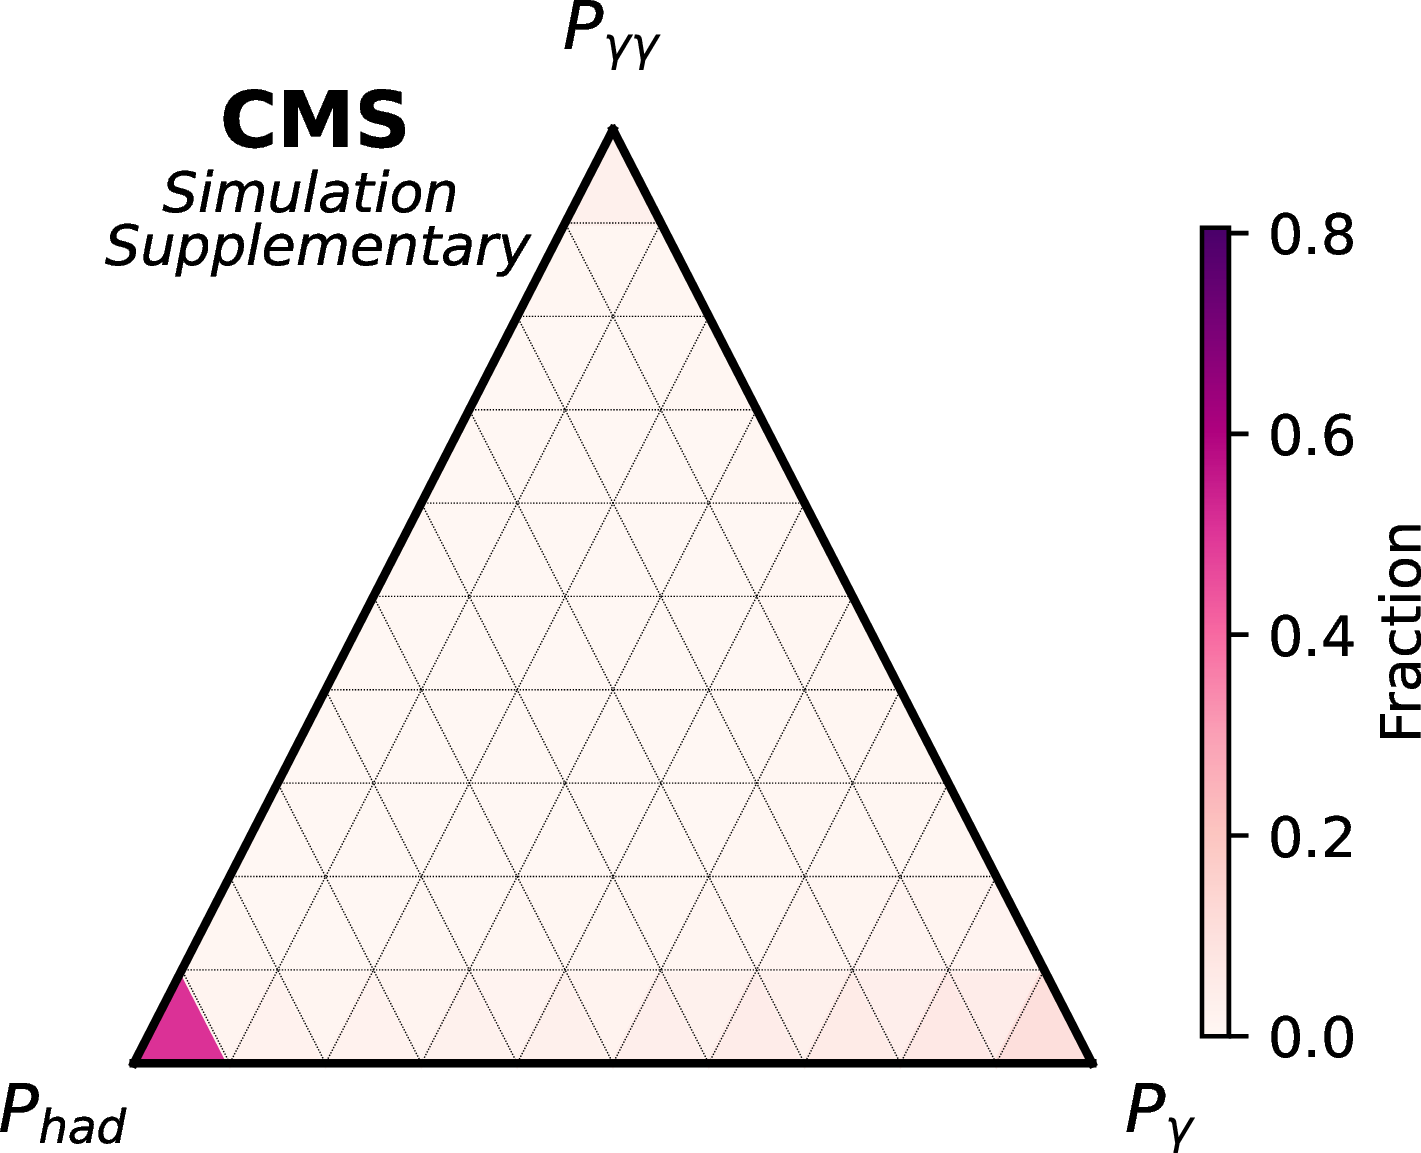
Ternary diagram showing showing the classification scores for true monophoton validation events. In this diagram each edge of the triangle is an axis depicting the associated classifier score from 0 to 1. The high-concentration of events near $ P_{\gamma} $ demonstrates the effectiveness of the classification NN. |
png pdf |
Additional Figure 6:
Ternary diagram showing showing the classification scores for true hadron validation events. In this diagram each edge of the triangle is an axis depicting the associated classifier score from 0 to 1. The high-concentration of events near $ P_{\text{had}} $ demonstrates the effectiveness of the classification NN. |
png pdf |
Additional Figure 7:
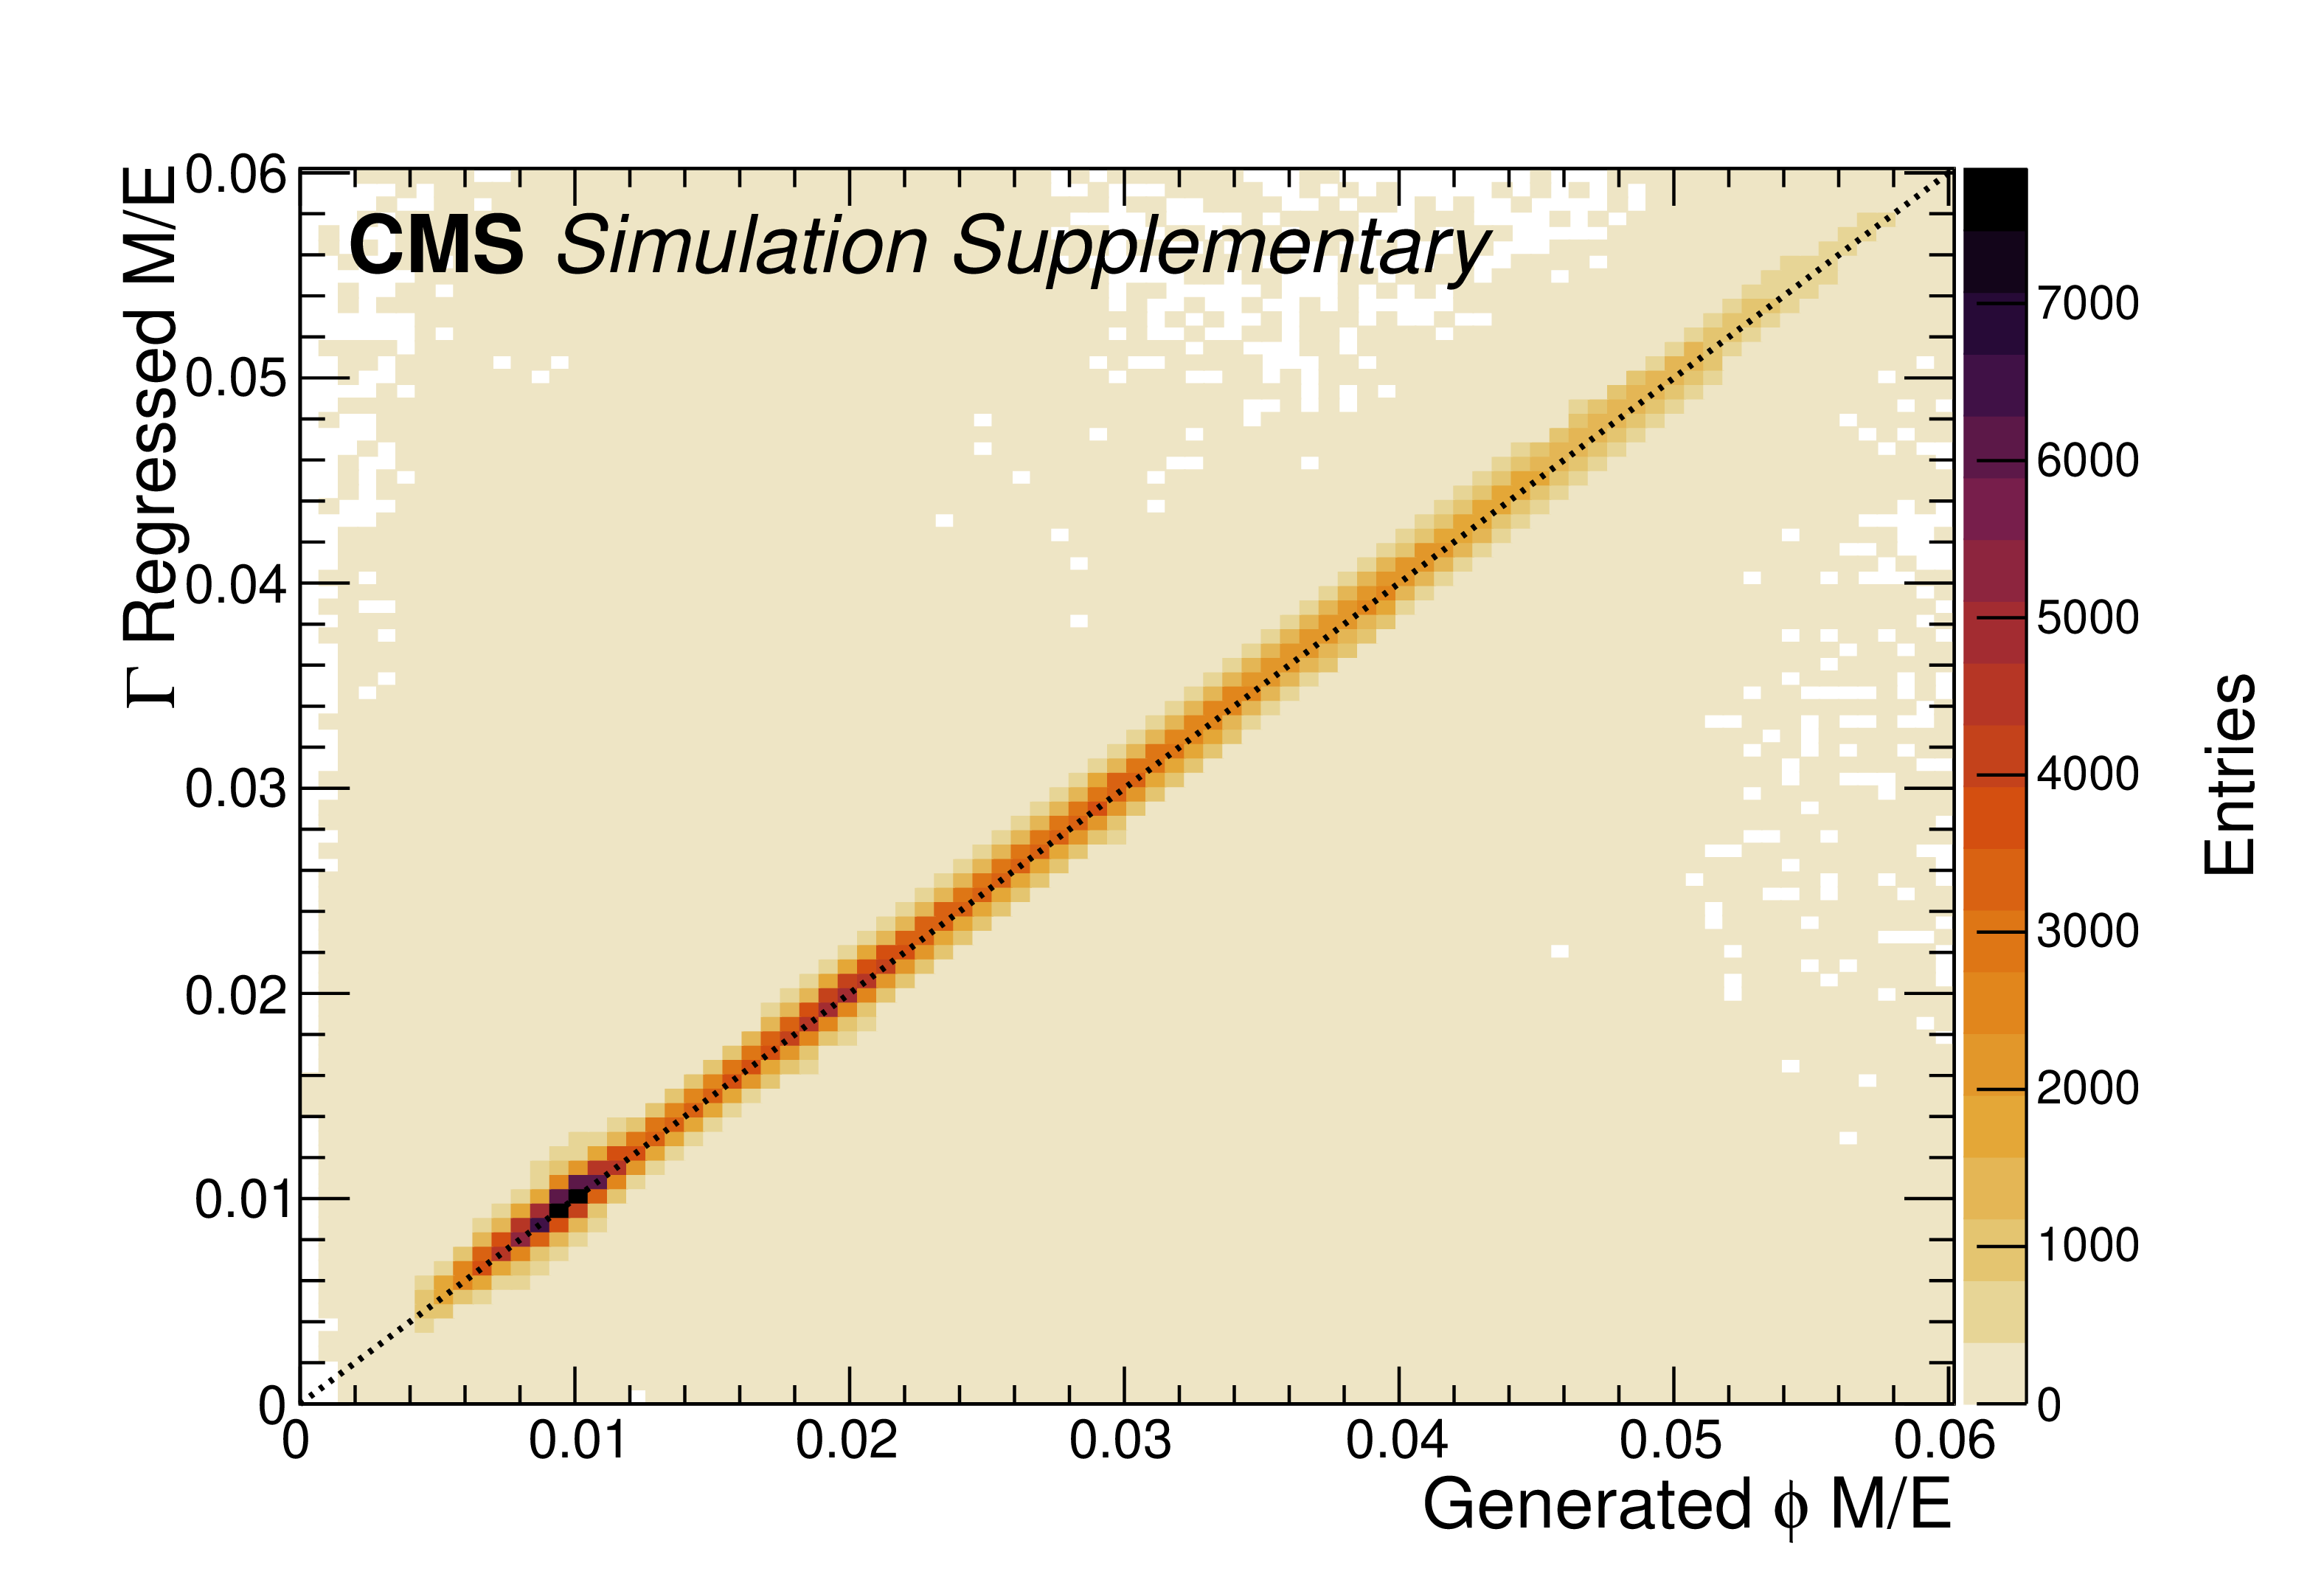
Predicted $ m/E $ from the regression NN vs. the generated $ \phi$ $m/E $ for $ \mathrm{X} \to \phi \phi \to (\gamma \gamma)(\gamma \gamma) $ signal MC. The tight clustering of events near the line $ y = x $ (black, dashed) shows the effectiveness of the regression NN. |

png pdf |
Additional Figure 8:
Cluster mass ($ m_{\Gamma} $) distribution in data for both the passing and failing (inset) regions, in the energy range for which the $ \eta $ meson is expected to form a single $ \Gamma $ candidate. The signal (background) is modeled by a Gaussian (exponential) function. Blue and red dashed lines depict Gaussian fits to the data and Monte Carlo (MC) simulation, respectively. The solid blue line shows the background component of the fit. Ratios of the Gaussian fit means ($ \mu $) and widths ($ \sigma $) are displayed, where $ m_{\eta}^{\text{true}} $ is the true mass of the $ \eta $ meson. |

png pdf |
Additional Figure 9:
Signal efficiencies in the $ {m_\phi}/{m_{\mathrm{X}}} - m_{\mathrm{X}} $ plane after applying all analysis event selection criteria to $ \mathrm{X} \to \phi \phi \to (\gamma \gamma)(\gamma \gamma) $ signal MC. Efficiencies ranges from about 10-45%. |

png pdf |
Additional Figure 10:
Dicluster mass ($ m_{\Gamma\Gamma} $) distribution (black points) from a signal with $ m_{\mathrm{X}} = $ 600 GeV and $ m_{\phi} = $ 6 GeV ($ \alpha = $ 0.1%). A double-sided Crystal Ball function fit is also shown (red line). |
png pdf |
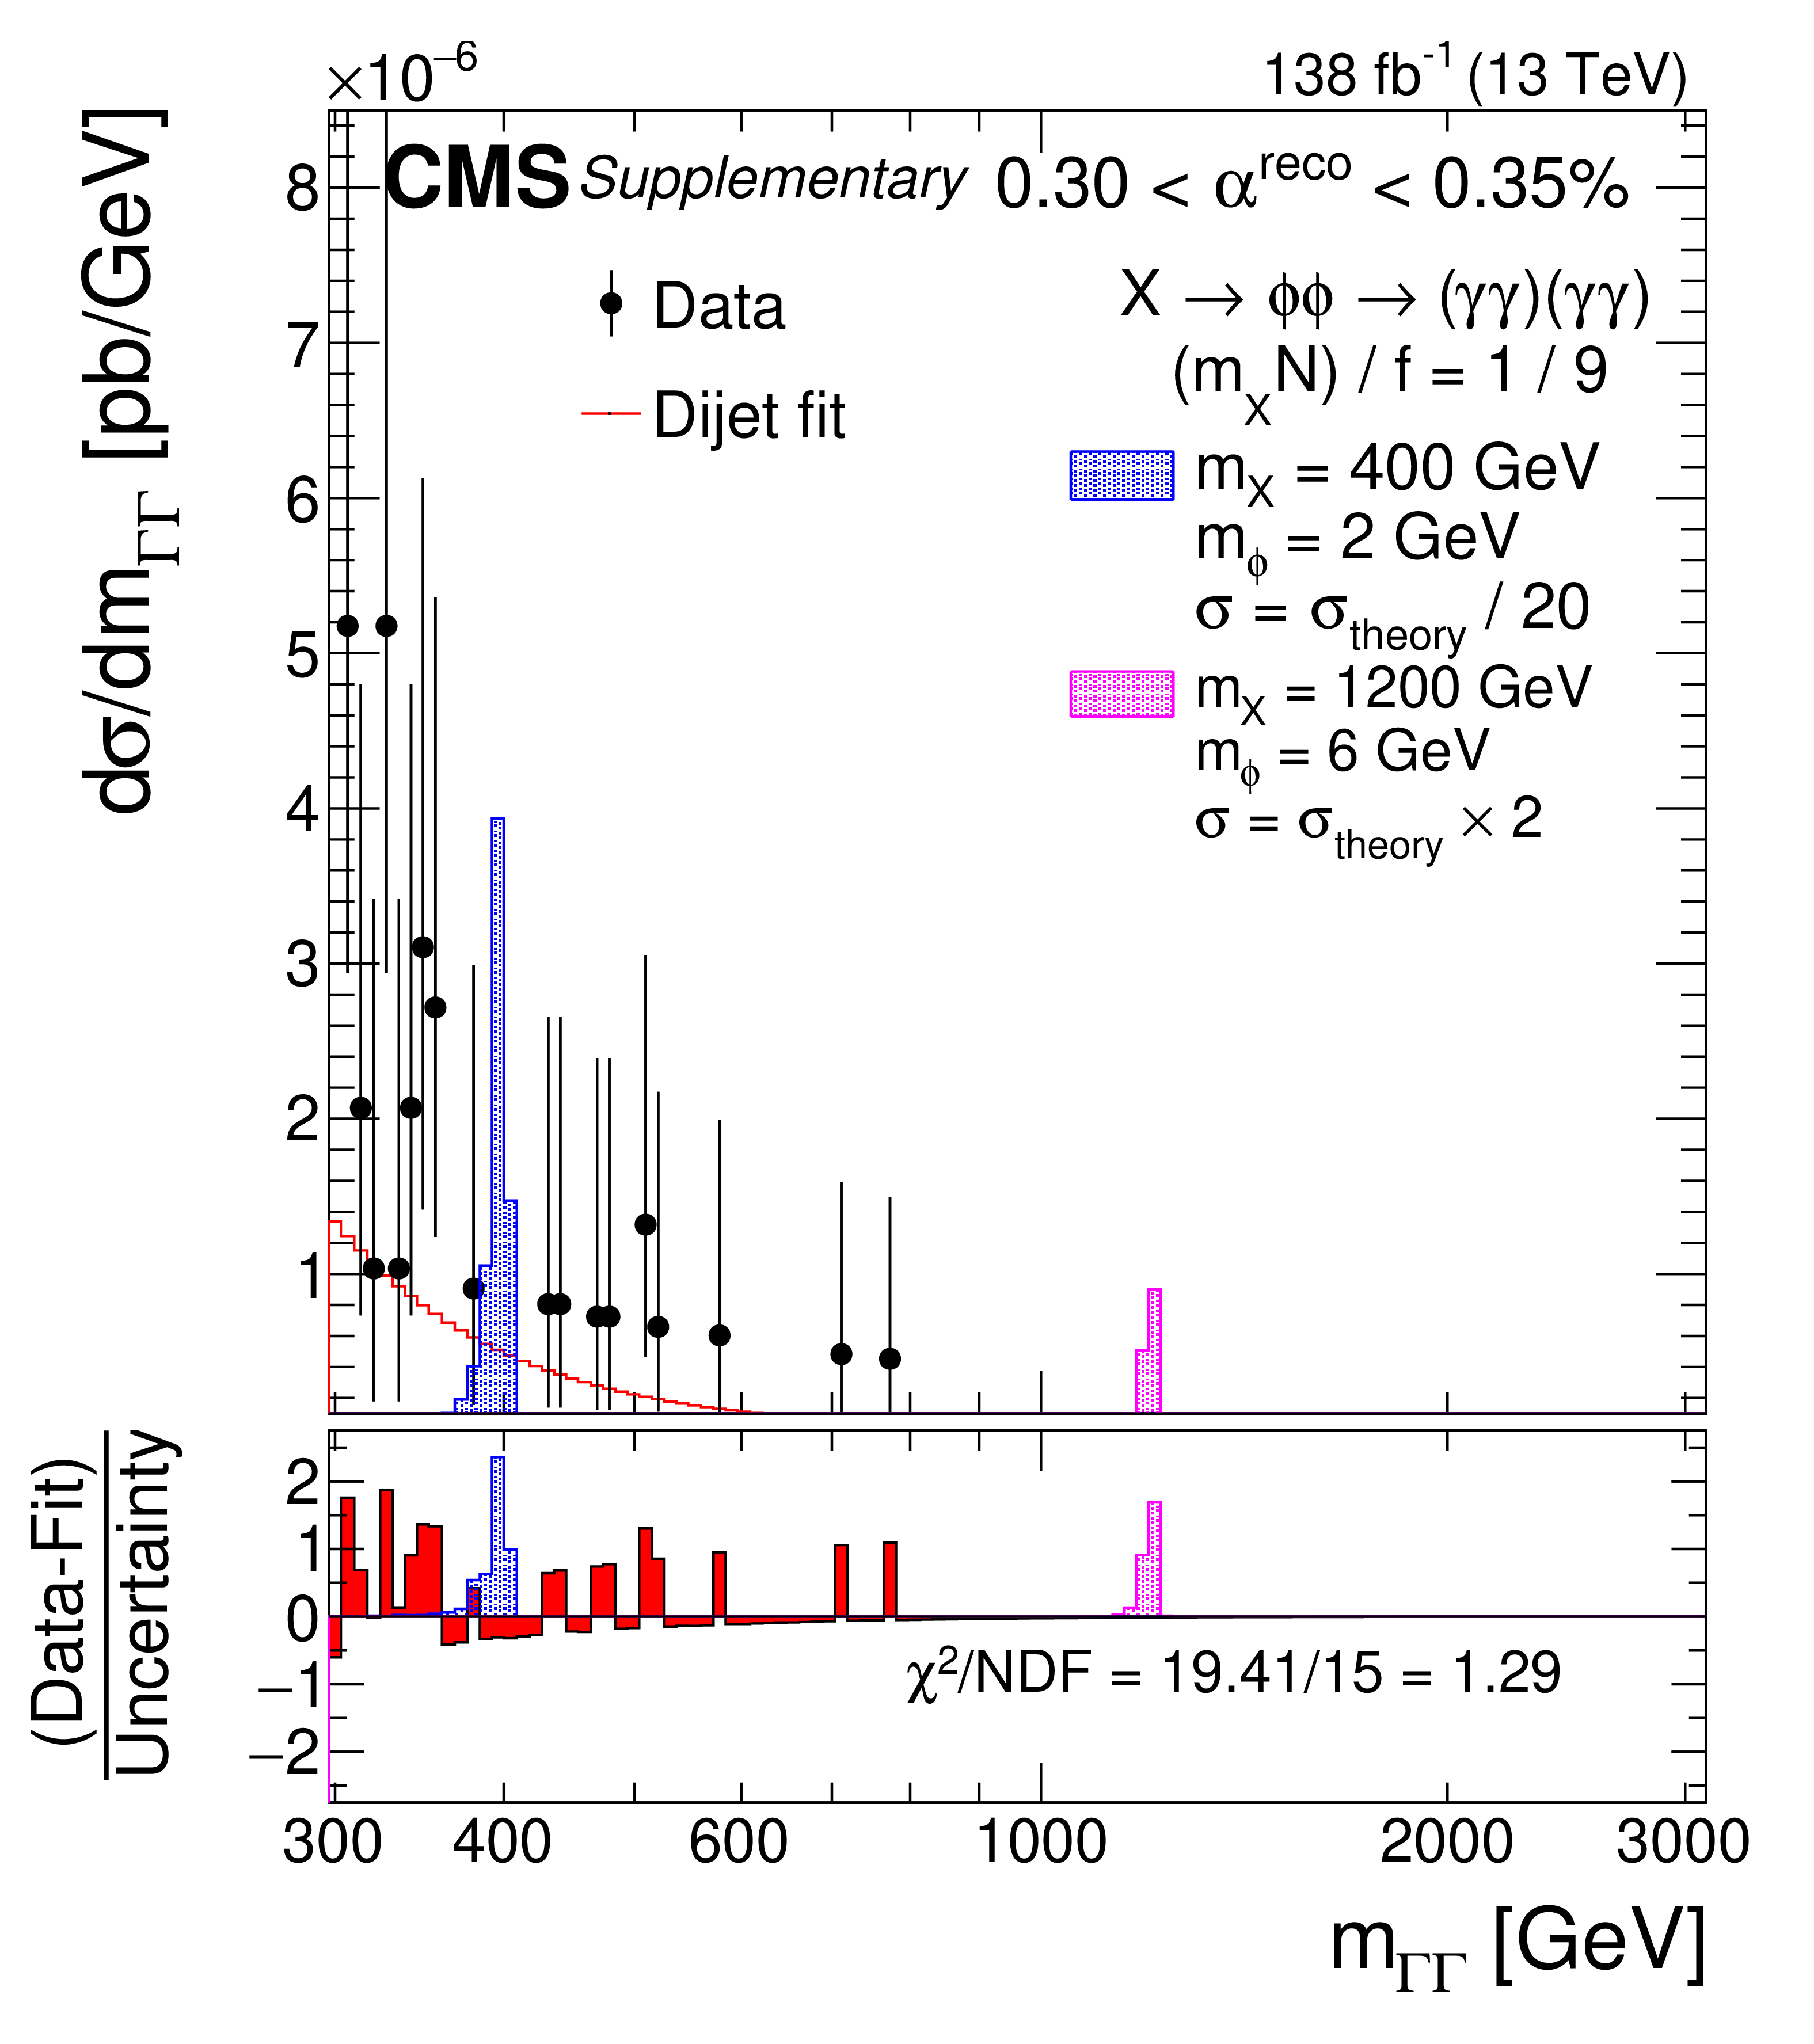
Additional Figure 11:
Dicluster mass ($ m_{\Gamma\Gamma} $) distribution for the data (points) for one of the nine $ \alpha^{\text{reco}} $ bins of the search (0.30 $ \leq \alpha^{\text{reco}} < $ 0.35%), fitted with one of the considered five functions, the dijet function (red). Examples of two representative predicted signals are shown (blue and pink). The lower panels show the pulls from the fit of the dijet function to the data calculated using the statistical uncertainty of the data, the aforementioned signals, and the goodness of fit measure $ \chi^2/ $NDF. |

png pdf |
Additional Figure 12:
Dicluster mass ($ m_{\Gamma\Gamma} $) distribution for the data (points) for one of the nine $ \alpha^{\text{reco}} $ bins of the search (0.35 $ \leq \alpha^{\text{reco}} < $ 0.40%), fitted with one of the considered five functions, the dijet function (red). Examples of two representative predicted signals are shown (blue and pink). The lower panels show the pulls from the fit of the dijet function to the data calculated using the statistical uncertainty of the data, the aforementioned signals, and the goodness of fit measure $ \chi^2/ $NDF. |
png pdf |
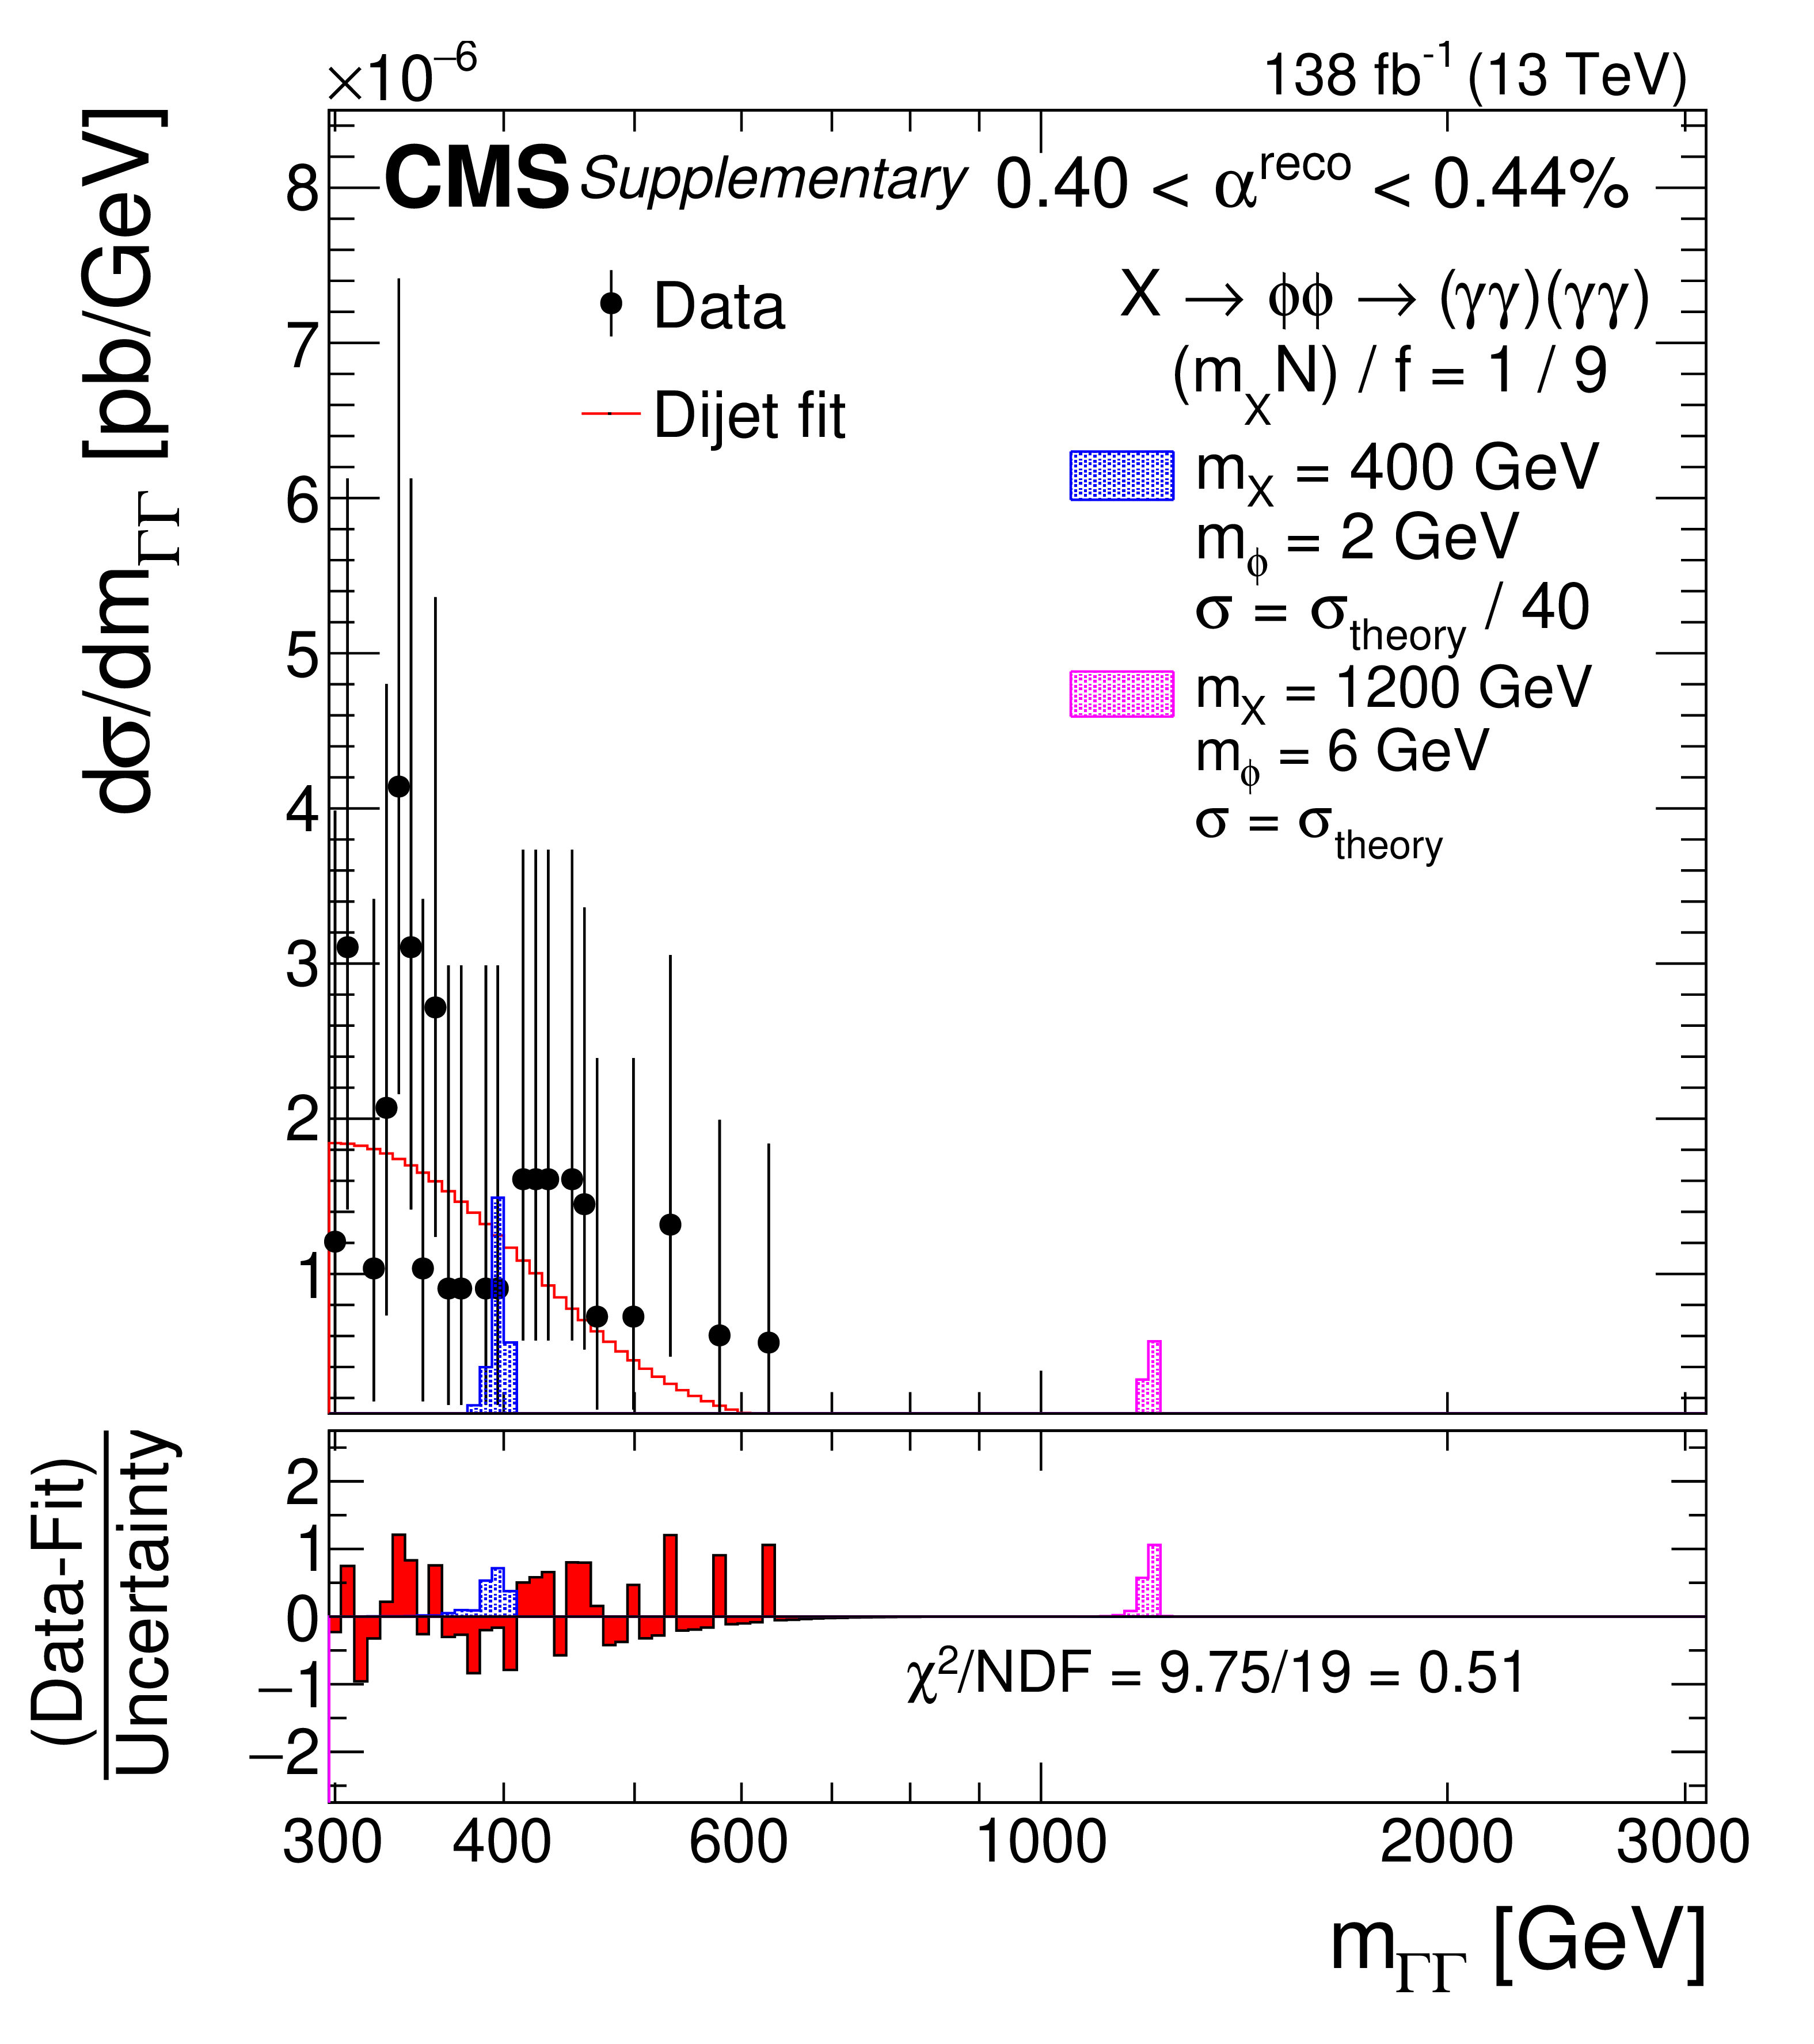
Additional Figure 13:
Dicluster mass ($ m_{\Gamma\Gamma} $) distribution for the data (points) for one of the nine $ \alpha^{\text{reco}} $ bins of the search (0.40 $ \leq \alpha^{\text{reco}} < $ 0.44%), fitted with one of the considered five functions, the dijet function (red). Examples of two representative predicted signals are shown (blue and pink). The lower panels show the pulls from the fit of the dijet function to the data calculated using the statistical uncertainty of the data, the aforementioned signals, and the goodness of fit measure $ \chi^2/ $NDF. |

png pdf |
Additional Figure 14:
Dicluster mass ($ m_{\Gamma\Gamma} $) distribution for the data (points) for one of the nine $ \alpha^{\text{reco}} $ bins of the search (0.49 $ \leq \alpha^{\text{reco}} < $ 0.55%), fitted with one of the considered five functions, the dijet function (red). Examples of two representative predicted signals are shown (blue and pink). The lower panels show the pulls from the fit of the dijet function to the data calculated using the statistical uncertainty of the data, the aforementioned signals, and the goodness of fit measure $ \chi^2/ $NDF. |

png pdf |
Additional Figure 15:
Dicluster mass ($ m_{\Gamma\Gamma} $) distribution for the data (points) for one of the nine $ \alpha^{\text{reco}} $ bins of the search (0.55 $ \leq \alpha^{\text{reco}} < $ 0.60%), fitted with one of the considered five functions, the dijet function (red). Examples of two representative predicted signals are shown (blue and pink). The lower panels show the pulls from the fit of the dijet function to the data calculated using the statistical uncertainty of the data, the aforementioned signals, and the goodness of fit measure $ \chi^2/ $NDF. |
png pdf |
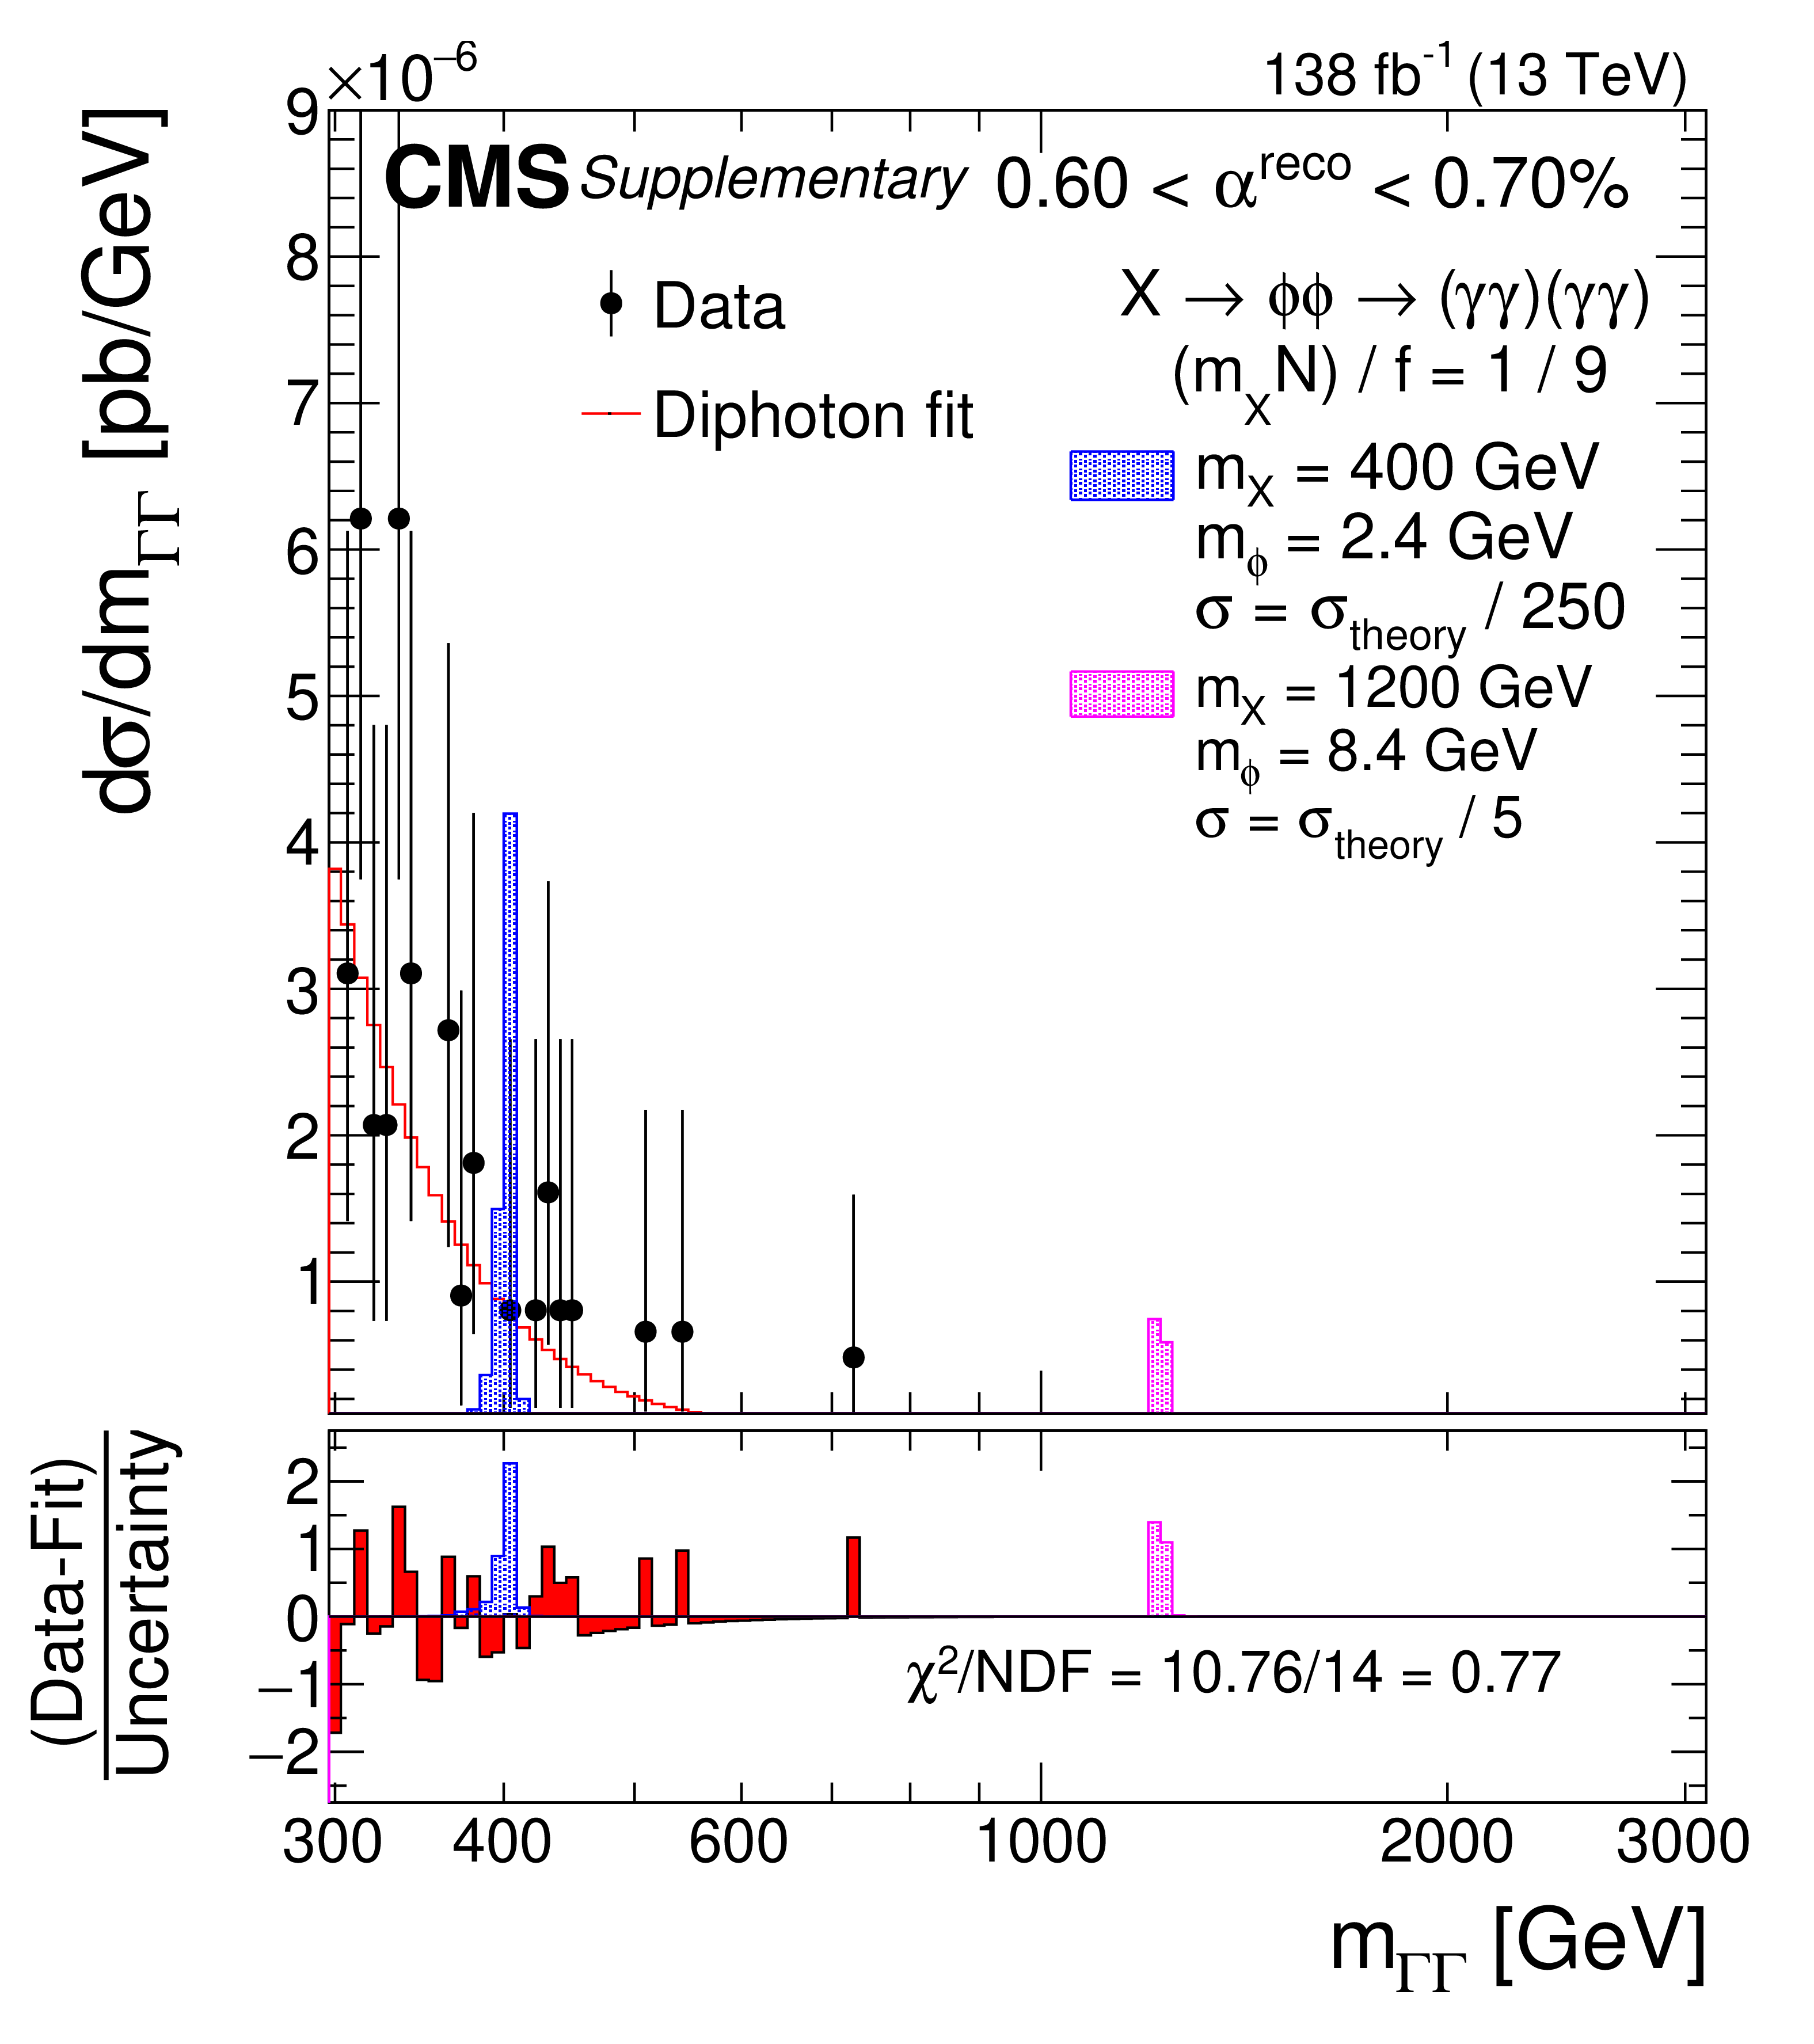
Additional Figure 16:
Dicluster mass ($ m_{\Gamma\Gamma} $) distribution for the data (points) for one of the nine $ \alpha^{\text{reco}} $ bins of the search (0.60 $ \leq \alpha^{\text{reco}} < $ 0.70%), fitted with one of the considered five functions, the diphoton function (red). Examples of two representative predicted signals are shown (blue and pink). The lower panels show the pulls from the fit of the diphoton function to the data calculated using the statistical uncertainty of the data, the aforementioned signals, and the goodness of fit measure $ \chi^2/ $NDF. |
png pdf |
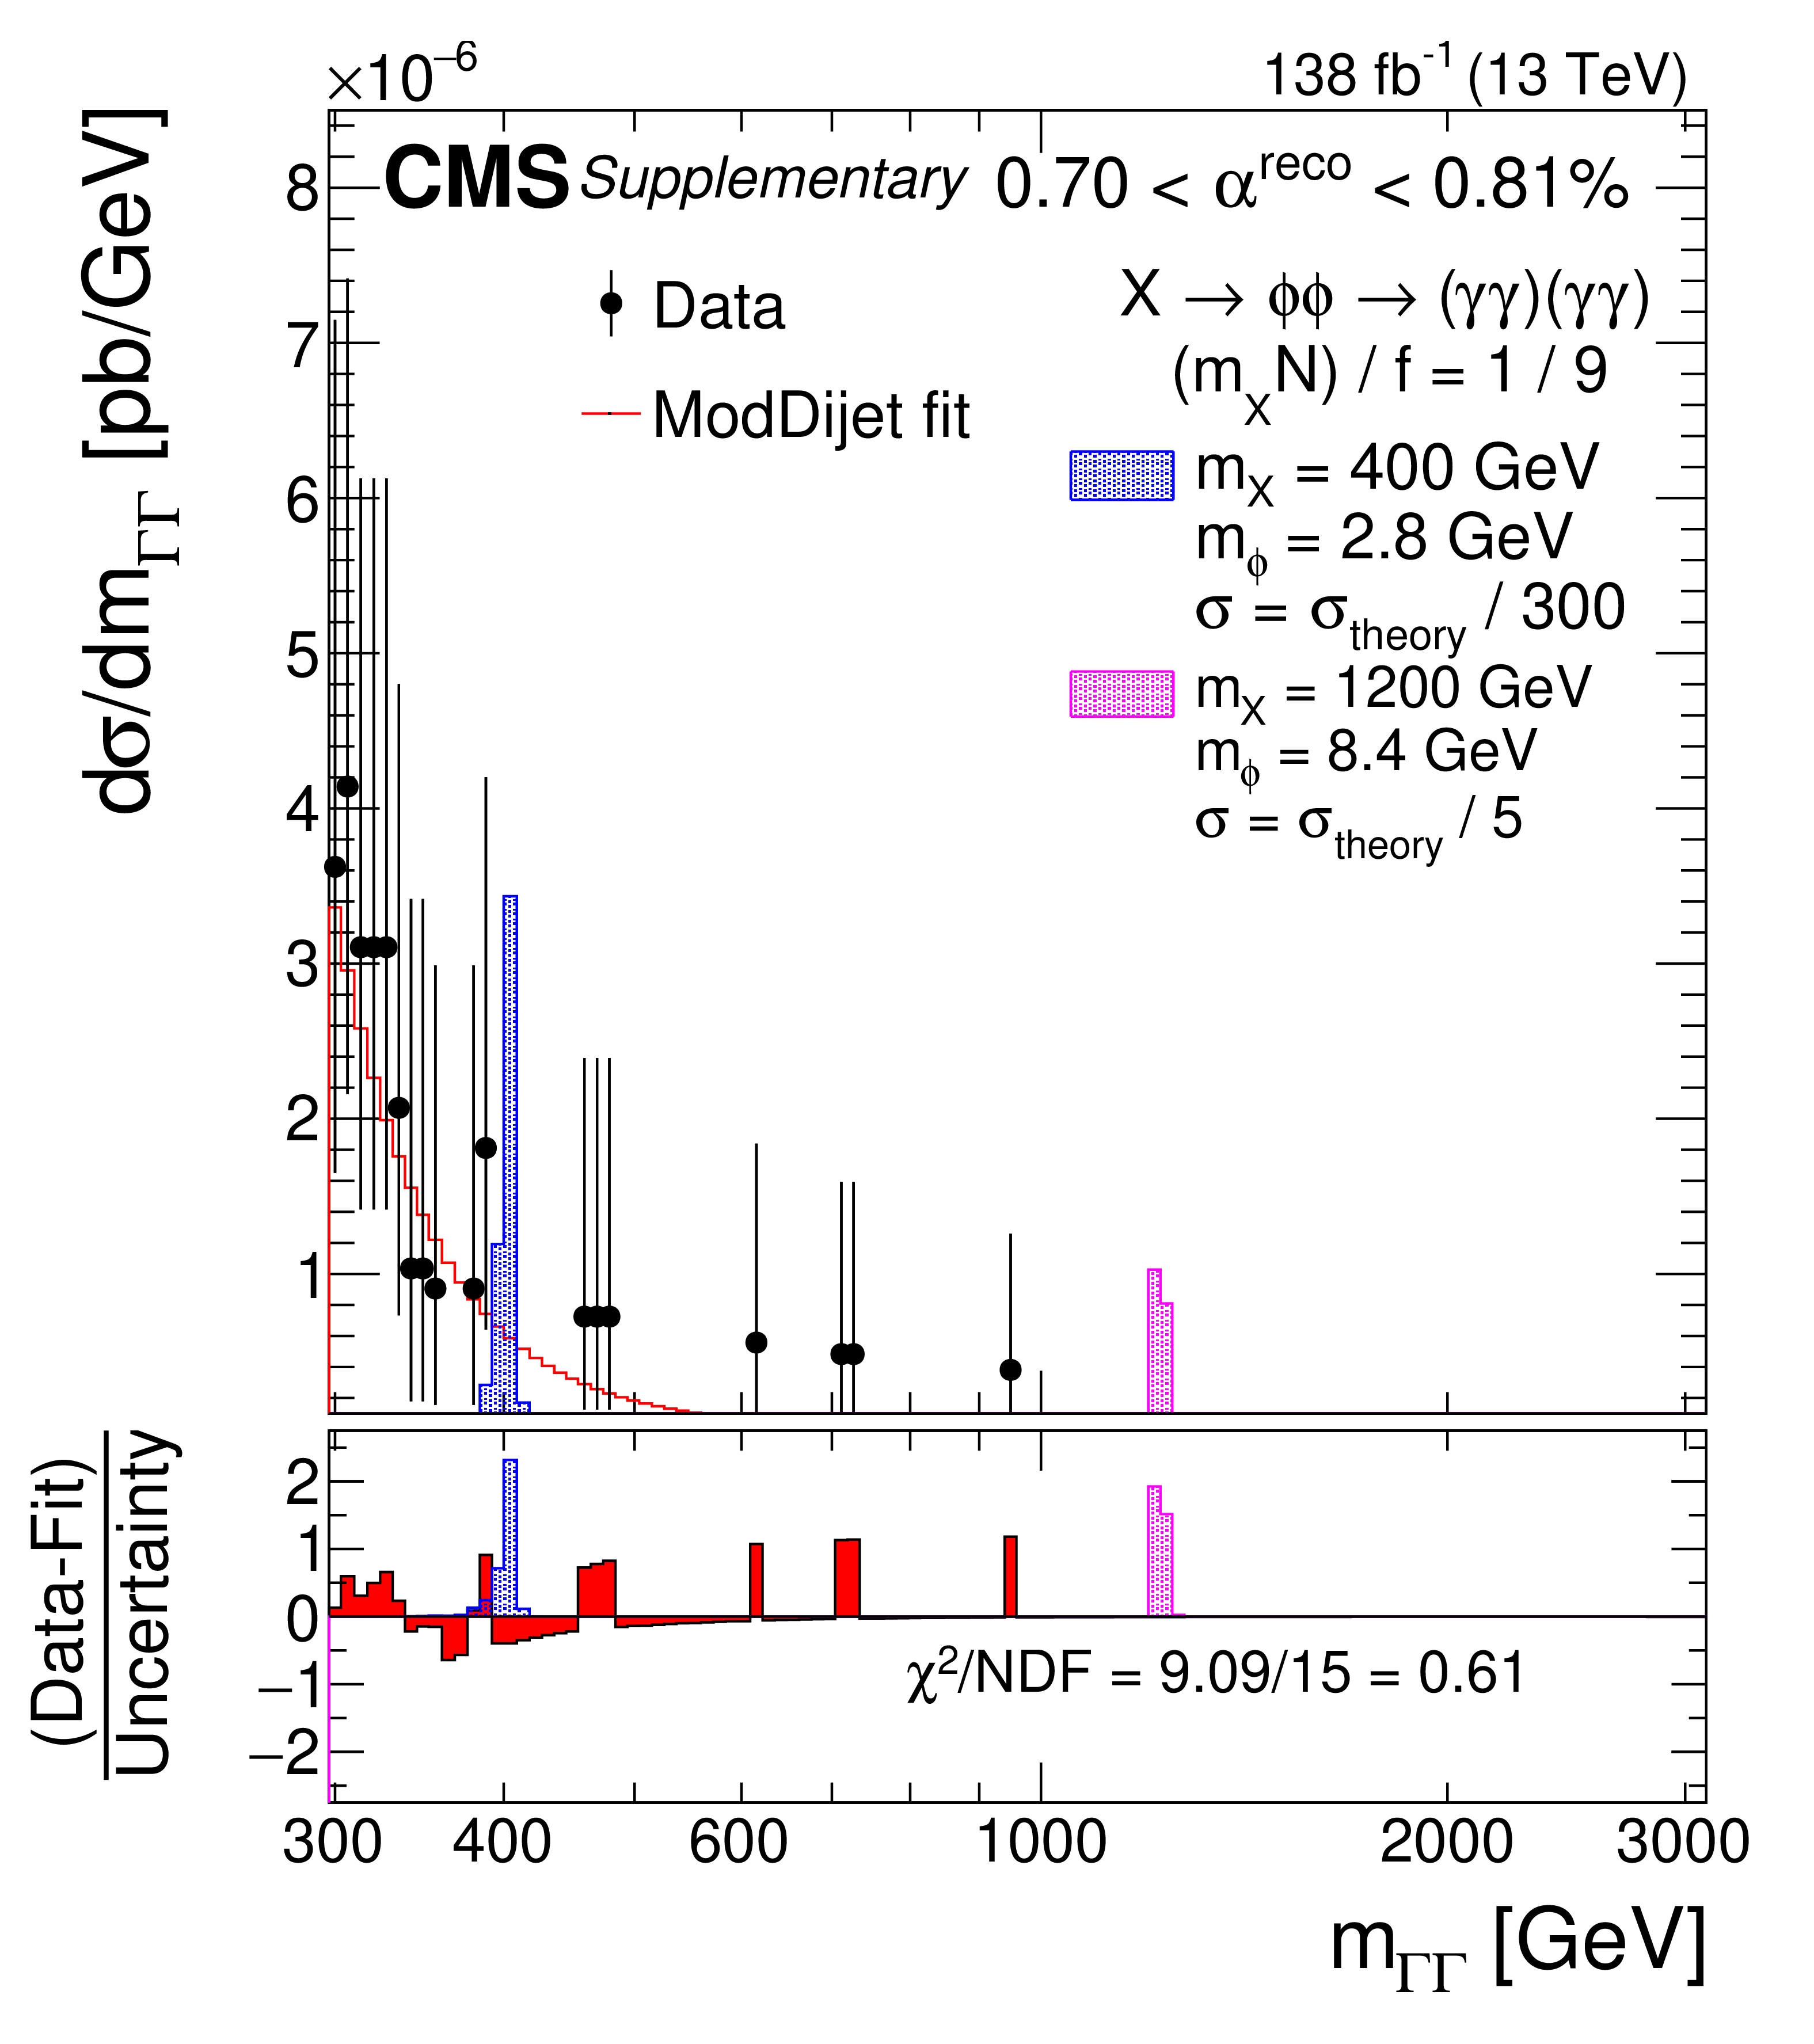
Additional Figure 17:
Dicluster mass ($ m_{\Gamma\Gamma} $) distribution for the data (points) for one of the nine $ \alpha^{\text{reco}} $ bins of the search (0.70 $ \leq \alpha^{\text{reco}} < $ 0.81%), fitted with one of the considered five functions, the modified dijet function (red). Examples of two representative predicted signals are shown (blue and pink). The lower panels show the pulls from the fit of the modified dijet function to the data calculated using the statistical uncertainty of the data, the aforementioned signals, and the goodness of fit measure $ \chi^2/ $NDF. |

png pdf |
Additional Figure 18:
Dicluster mass ($ m_{\Gamma\Gamma} $) distribution for the data (points) for one of the nine $ \alpha^{\text{reco}} $ bins of the search (0.81 $ \leq \alpha^{\text{reco}} < $ 3.00%), fitted with one of the considered five functions, the dijet function (red). Examples of two representative predicted signals are shown (blue and pink). The lower panels show the pulls from the fit of the dijet function to the data calculated using the statistical uncertainty of the data, the aforementioned signals, and the goodness of fit measure $ \chi^2/ $NDF. |

png pdf |
Additional Figure 19:
Upper limits at 95% CL on the production cross section for the process $ \mathrm{X} \to \phi \phi \to (\gamma \gamma)(\gamma \gamma) $ as a function of $ m_{\mathrm{X}} $. Each subpanel shows the limits for a fixed value of $ \alpha $. The branching fractions $ \mathrm{X} \to \phi \phi $ and $ \phi \to \gamma \gamma $ are both assumed to be 100%. The observed limits are shown as solid black lines with markers; the expected limits are shown as dashed lines. The green (inner) and yellow (outer) bands represent one and two standard deviation intervals. In the considered model, the coupling of the $ \mathrm{X} $ to gluons is evaluated by integrating over $ N $ flavors of quarks that receive all their mass from the $ \mathrm{X} $ vacuum expectation value $ f $, such that the cross section depends only on the quantity $ (m_\mathrm{X} N)/f $. Different values of this parameter are shown with the dashed and dash-dotted curves. |

png pdf |
Additional Figure 20:
Expected cross section upper limits at 95% CL for the production of $ \mathrm{X} \to \phi \phi \to (\gamma \gamma)(\gamma \gamma) $ displayed in the $ ({m_\phi}/{m_{\mathrm{X}}}) - m_{\mathrm{X}} $ plane. The branching fractions $ \mathrm{X} \to \phi \phi $ and $ \phi \to \gamma \gamma $ are both assumed to be 100%. |

png pdf |
Additional Figure 21:
Local significance in units of standard deviations ($ \sigma $) in the $ {m_\phi}/{m_{\mathrm{X}}} - m_{\mathrm{X}} $ plane. The largest excess corresponds to about $ m_{\mathrm{X}} = $ 720 GeV and $ m_\phi = $ 5.04 GeV with a local significance of 3.57 $ \sigma $. This significance becomes 1.07 $ \sigma $ when accounting for the look-elsewhere effect. |
png pdf |
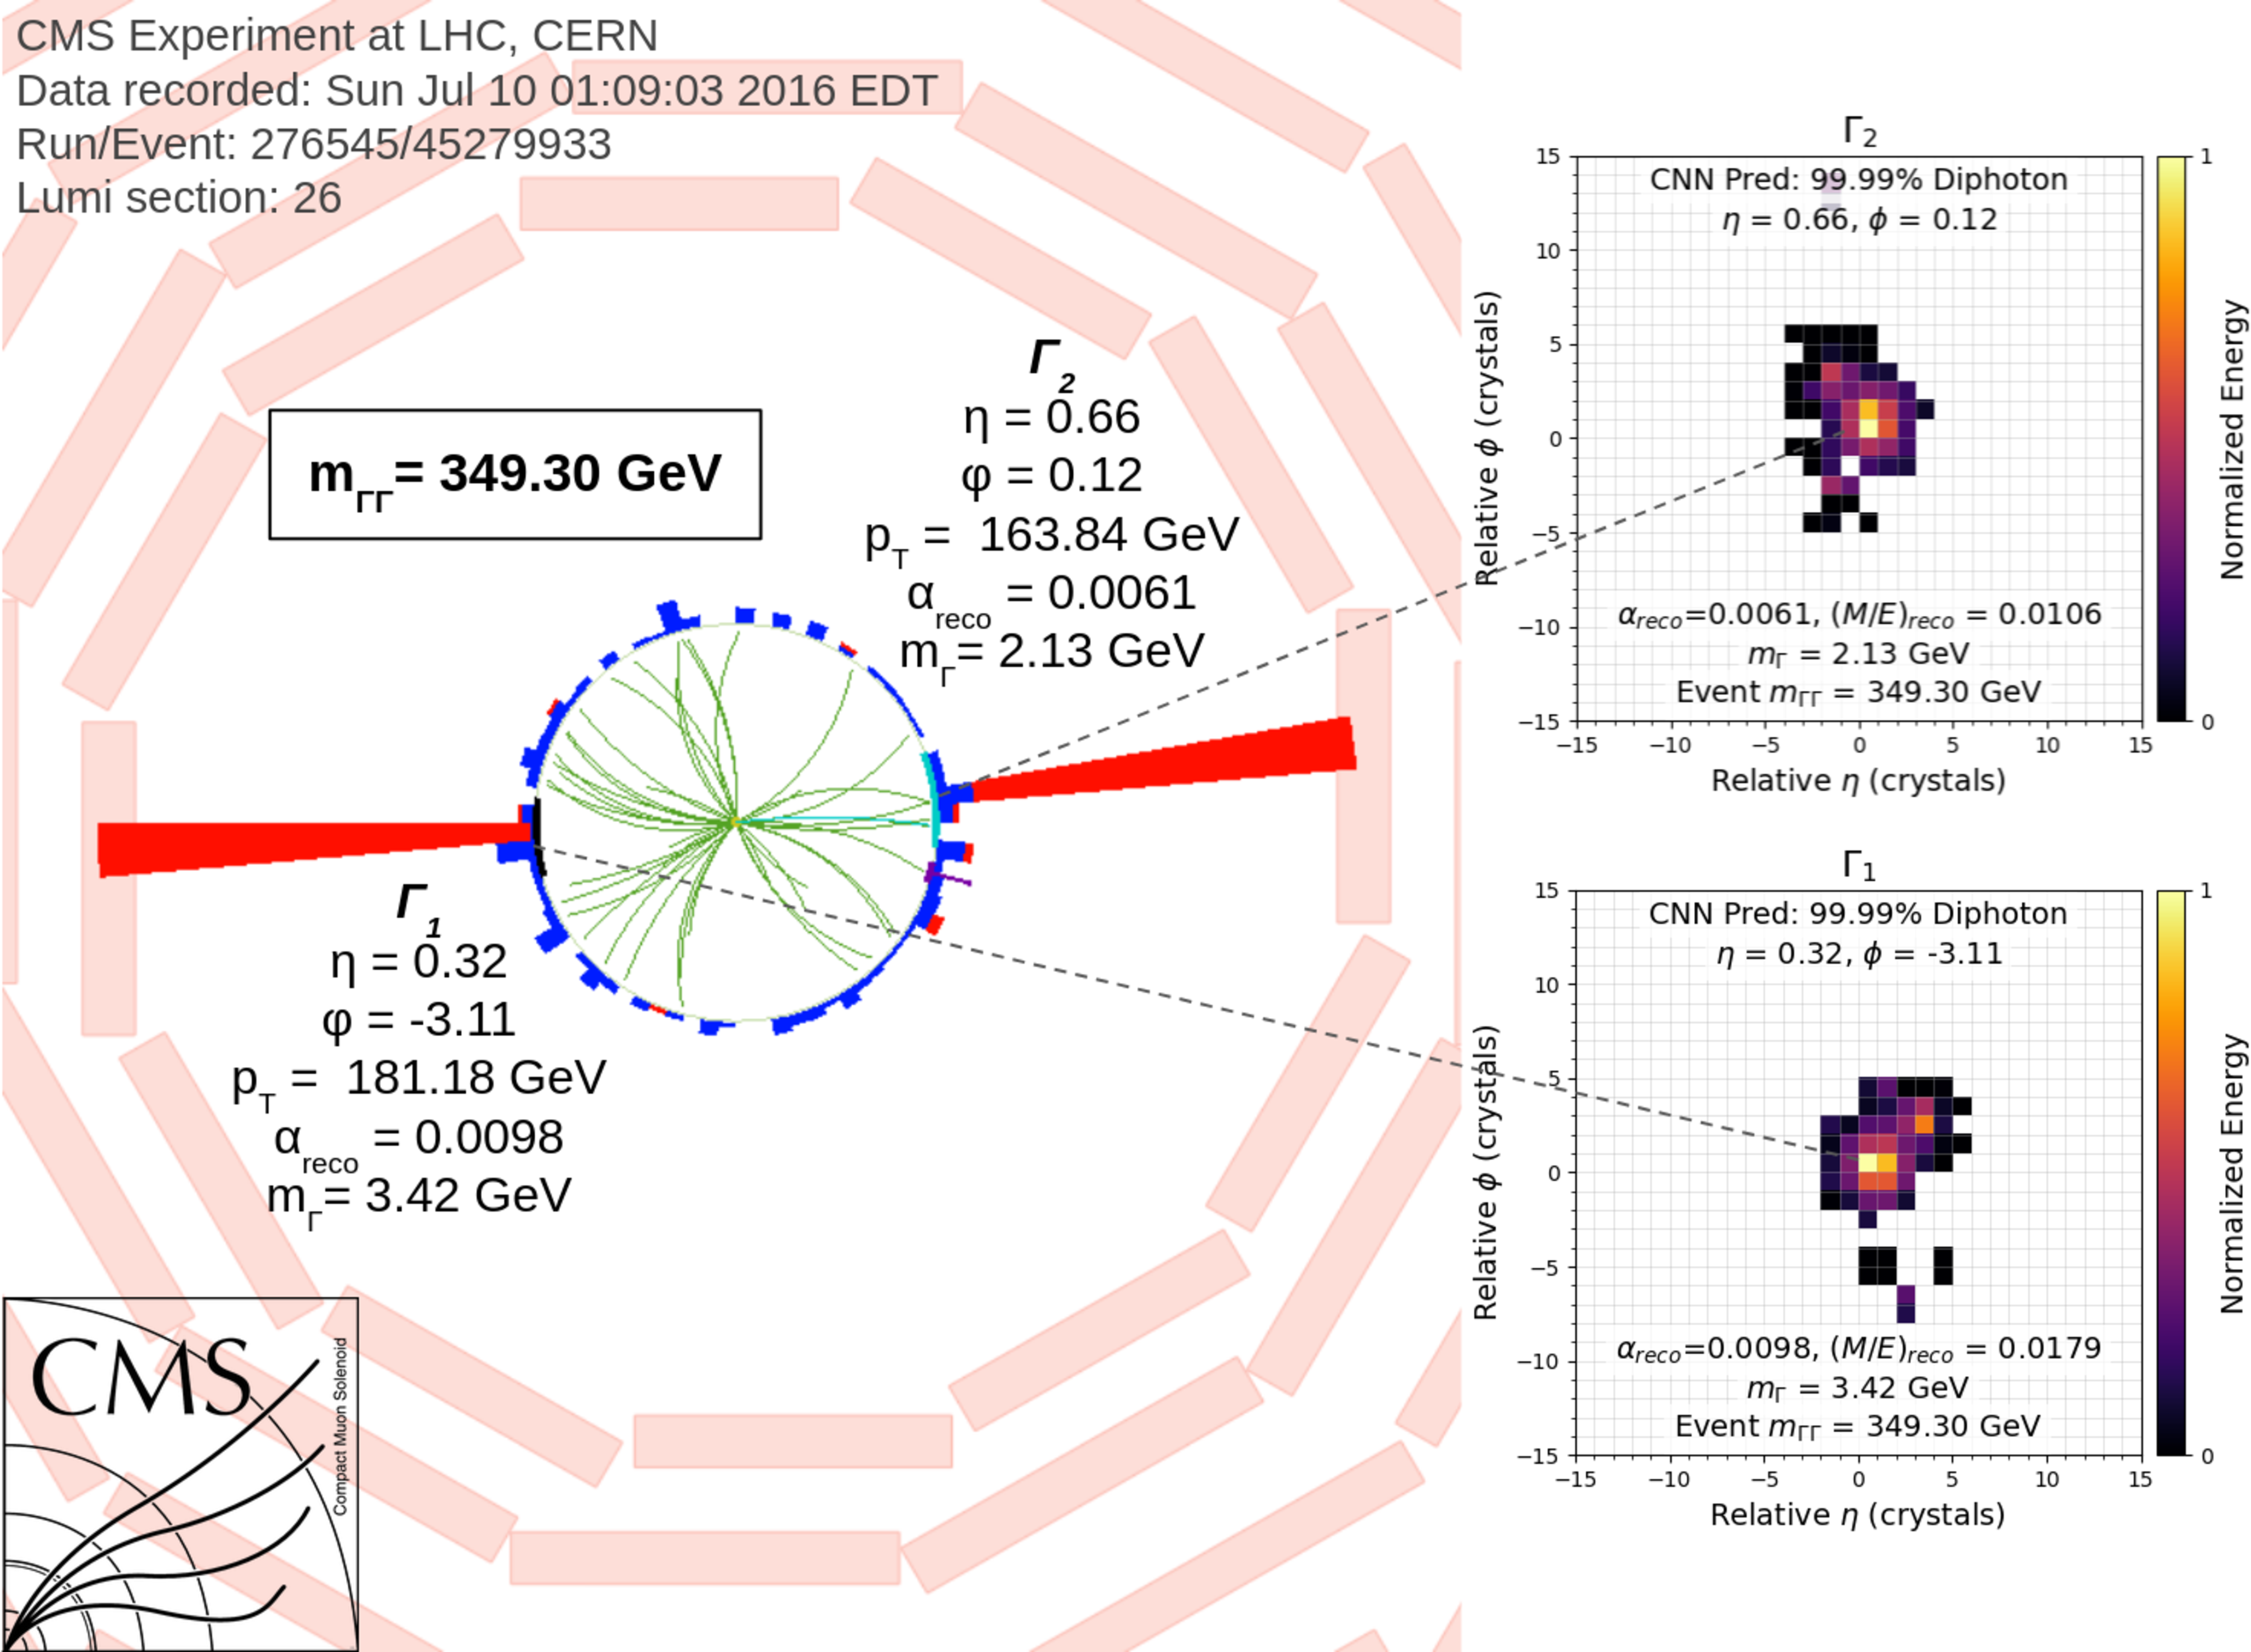
Additional Figure 22:
CMS event display in the $ \rho-\phi $ plane for an event with $ m_{\Gamma\Gamma} = $ 349 GeV. Images showing the clusters in the $ \eta-\phi $ plane and are matched to the corresponding deposits in the ECAL. The cluster images are designed to include two merged photons in a single image. Each pixel in the images is equal to one crystal in the ECAL and the pixel color value is the energy deposited in the crystal. Images are then normalized to $ E_{\text{total}}= $ 1 and are centered on the most energetic crystal. |

png pdf |
Additional Figure 23:
CMS event display in the $ \rho-\phi $ plane for an event with $ m_{\Gamma\Gamma} = $ 377 GeV. Images showing the clusters in the $ \eta-\phi $ plane and are matched to the corresponding deposits in the ECAL. The cluster images are designed to include two merged photons in a single image. Each pixel in the images is equal to one crystal in the ECAL and the pixel color value is the energy deposited in the crystal. Images are then normalized to $ E_{\text{total}}= $ 1 and are centered on the most energetic crystal. |

png pdf |
Additional Figure 24:
CMS event display in the $ \rho-\phi $ plane for an event with $ m_{\Gamma\Gamma} = $ 718 GeV. This event is near the largest excess observed in this analysis. Images showing the clusters in the $ \eta-\phi $ plane and are matched to the corresponding deposits in the ECAL. The cluster images are designed to include two merged photons in a single image. Each pixel in the images is equal to one crystal in the ECAL and the pixel color value is the energy deposited in the crystal. Images are then normalized to $ E_{\text{total}}= $ 1 and are centered on the most energetic crystal. |
png pdf |
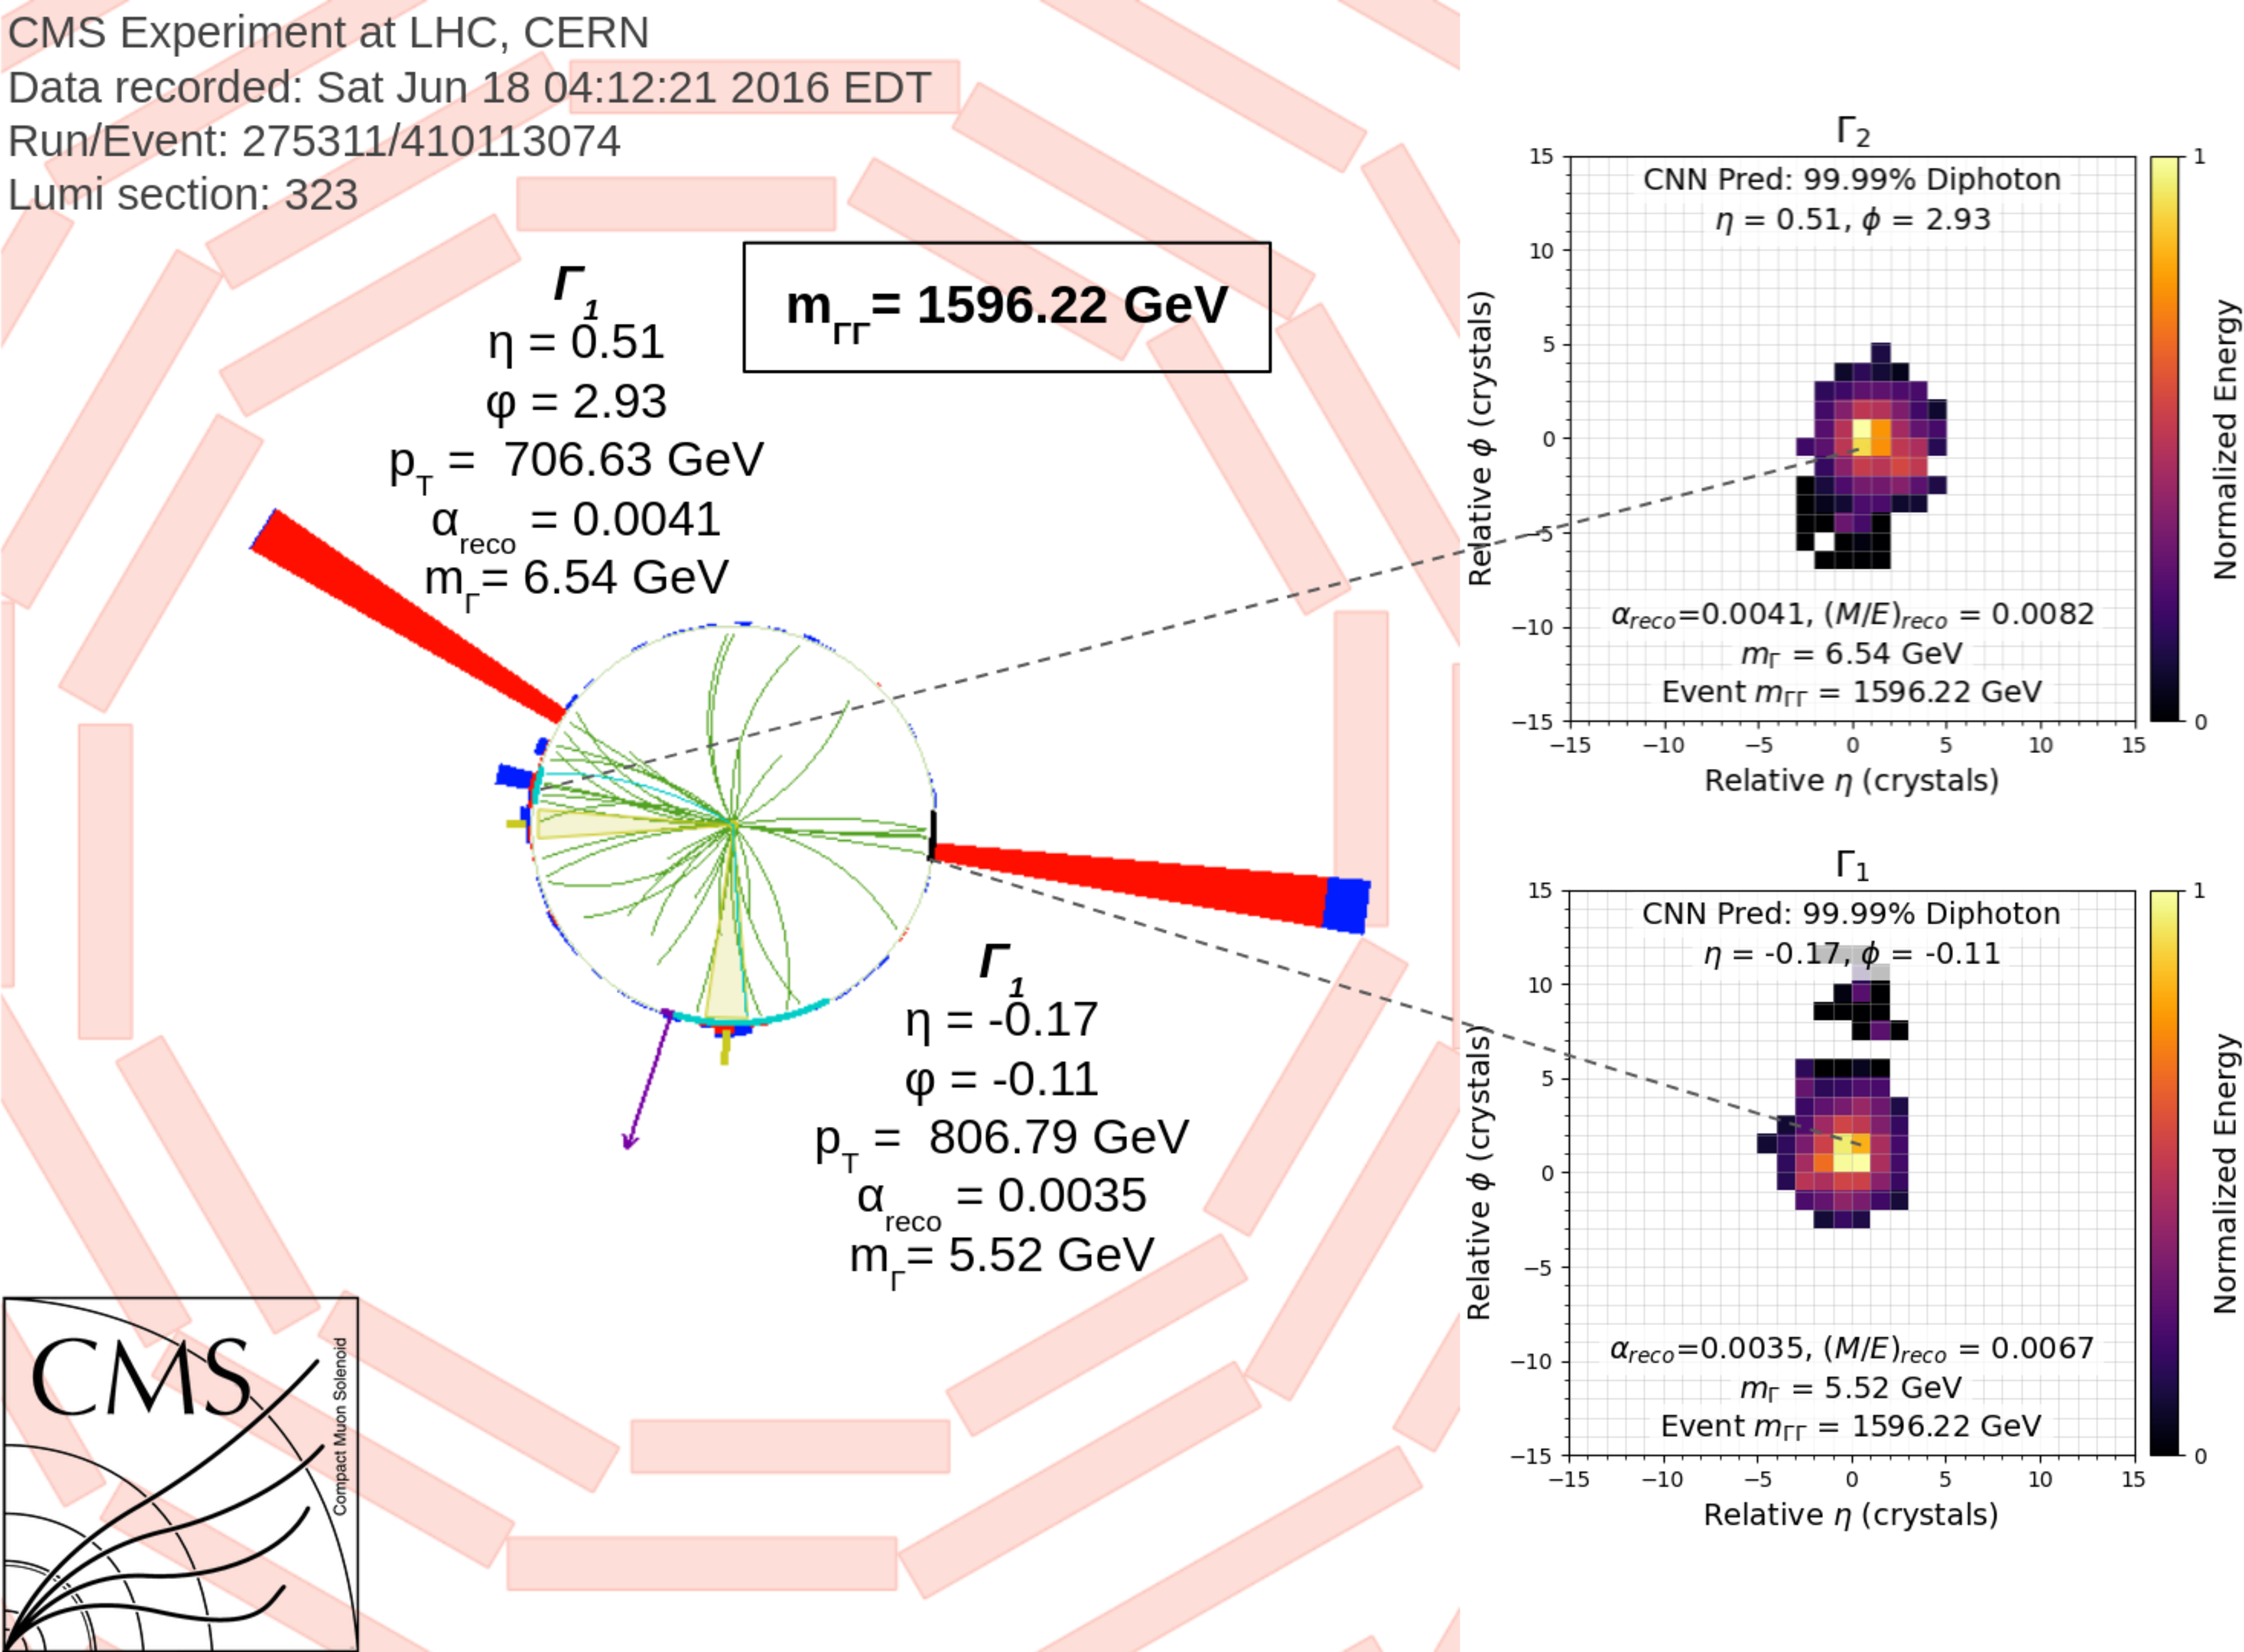
Additional Figure 25:
CMS event display in the $ \rho-\phi $ plane for an event with $ m_{\Gamma\Gamma} = $ 1596 GeV. This event has the highest observed $ m_{\Gamma\Gamma} $ in this analysis. Images showing the clusters in the $ \eta-\phi $ plane and are matched to the corresponding deposits in the ECAL. The cluster images are designed to include two merged photons in a single image. Each pixel in the images is equal to one crystal in the ECAL and the pixel color value is the energy deposited in the crystal. Images are then normalized to $ E_{\text{total}}= $ 1 and are centered on the most energetic crystal. |
| References | ||||
| 1 | G. C. Dorsch, S. J. Huber, K. Mimasu, and J. M. No | Hierarchical versus degenerate 2HDM: the LHC Run 1 legacy at the onset of Run 2 | PRD 93 (2016) 115033 | 1601.04545 |
| 2 | D. Barducci, G. Bélanger, C. Hugonie, and A. Pukhov | Status and prospects of the nMSSM after LHC Run-1 | JHEP 01 (2016) 050 | 1510.00246 |
| 3 | F. Kling, J. M. No, and S. Su | Anatomy of exotic Higgs decays in 2HDM | JHEP 09 (2016) 093 | 1604.01406 |
| 4 | U. Ellwanger and M. Rodríguez-Vazquez | Simultaneous search for extra light and heavy Higgs bosons via cascade decays | JHEP 11 (2017) 008 | 1707.08522 |
| 5 | S. Baum and N. R. Shah | Two Higgs doublets and a complex singlet: disentangling the decay topologies and associated phenomenology | JHEP 12 (2018) 044 | 1808.02667 |
| 6 | S. Baum, N. R. Shah, and K. Freese | The NMSSM is within reach of the LHC: mass correlations \& decay signatures | JHEP 04 (2019) 011 | 1901.02332 |
| 7 | T. Robens, T. Stefaniak, and J. Wittbrodt | Two-real-scalar-singlet extension of the SM: LHC phenomenology and benchmark scenarios | EPJC 80 (2020) 151 | 1908.08554 |
| 8 | CMS Collaboration | Search for new particles in an extended Higgs sector with four b quarks in the final state at $ \sqrt{s}= $ 13 TeV | PLB 835 (2022) 137566 | 2203.00480 |
| 9 | B. A. Dobrescu, G. L. Landsberg, and K. T. Matchev | Higgs boson decays to CP odd scalars at the Tevatron and beyond | PRD 63 (2001) 075003 | hep-ph/0005308 |
| 10 | ATLAS Collaboration | Search for new phenomena in events with at least three photons collected in $ pp $ collisions at $ \sqrt{s} = $ 8 TeV with the ATLAS detector | EPJC 76 (2016) 210 | 1509.05051 |
| 11 | ATLAS Collaboration | A search for pairs of highly collimated photon-jets in $ pp $ collisions at $ \sqrt{s} = $ 13 TeV with the ATLAS detector | PRD 99 (2019) 012008 | 1808.10515 |
| 12 | ATLAS Collaboration | Search for short- and long-lived axion-like particles in $ H\rightarrow a a \rightarrow 4\gamma $ decays with the ATLAS experiment at the LHC | Submitted to EPJC, 2023 | 2312.03306 |
| 13 | CMS Collaboration | Search for the exotic decay of the Higgs boson into two light pseudoscalars with four photons in the final state in proton-proton collisions at $ \sqrt{s} = $ 13 TeV | JHEP 07 (2023) 148 | CMS-HIG-21-003 2208.01469 |
| 14 | CMS Collaboration | Search for exotic Higgs boson decays H $ \to \mathcal{A}\mathcal{A} \to 4\gamma $ with events containing two merged diphotons in proton-proton collisions at $ \sqrt{s} = $ 13 TeV | PRL 131 (2023) 101801 | CMS-HIG-21-016 2209.06197 |
| 15 | CMS Collaboration | Performance of photon reconstruction and identification with the CMS detector in proton-proton collisions at $ \sqrt{s} = $ 8 TeV | JINST 10 (2015) P08010 | CMS-EGM-14-001 1502.02702 |
| 16 | CMS Collaboration | Reconstruction of decays to merged photons using end-to-end deep learning with domain continuation in the CMS detector | PRD 108 (2023) 052002 | CMS-EGM-20-001 2204.12313 |
| 17 | CMS Collaboration | The CMS experiment at the CERN LHC | JINST 3 (2008) S08004 | |
| 18 | CMS Collaboration | Performance of the CMS Level-1 trigger in proton-proton collisions at $ \sqrt{s} = $ 13 TeV | JINST 15 (2020) P10017 | CMS-TRG-17-001 2006.10165 |
| 19 | CMS Collaboration | The CMS trigger system | JINST 12 (2017) P01020 | CMS-TRG-12-001 1609.02366 |
| 20 | CMS Collaboration | Electron and photon reconstruction and identification with the CMS experiment at the CERN LHC | JINST 16 (2021) P05014 | CMS-EGM-17-001 2012.06888 |
| 21 | CMS Collaboration | Performance of the CMS muon detector and muon reconstruction with proton-proton collisions at $ \sqrt{s}= $ 13 TeV | JINST 13 (2018) P06015 | CMS-MUO-16-001 1804.04528 |
| 22 | CMS Collaboration | Description and performance of track and primary-vertex reconstruction with the CMS tracker | JINST 9 (2014) P10009 | CMS-TRK-11-001 1405.6569 |
| 23 | CMS Collaboration | Particle-flow reconstruction and global event description with the CMS detector | JINST 12 (2017) P10003 | CMS-PRF-14-001 1706.04965 |
| 24 | CMS Collaboration | Performance of reconstruction and identification of $ \tau $ leptons decaying to hadrons and $ \nu_\tau $ in pp collisions at $ \sqrt{s}= $ 13 TeV | JINST 13 (2018) P10005 | CMS-TAU-16-003 1809.02816 |
| 25 | CMS Collaboration | Jet energy scale and resolution in the CMS experiment in pp collisions at 8 TeV | JINST 12 (2017) P02014 | CMS-JME-13-004 1607.03663 |
| 26 | CMS Collaboration | Performance of missing transverse momentum reconstruction in proton-proton collisions at $ \sqrt{s} = $ 13 TeV using the CMS detector | JINST 14 (2019) P07004 | CMS-JME-17-001 1903.06078 |
| 27 | CMS Collaboration | HEPData record for this analysis | link | |
| 28 | J. Alwall et al. | The automated computation of tree-level and next-to-leading order differential cross sections, and their matching to parton shower simulations | JHEP 07 (2014) 079 | 1405.0301 |
| 29 | G. Bozzi, S. Catani, D. de Florian, and M. Grazzini | The $ q_T $ spectrum of the Higgs boson at the LHC in QCD perturbation theory | PLB 564 (2003) 65 | hep-ph/0302104 |
| 30 | G. Bozzi, S. Catani, D. de Florian, and M. Grazzini | Transverse-momentum resummation and the spectrum of the Higgs boson at the LHC | NPB 737 (2006) 73 | hep-ph/0508068 |
| 31 | D. de Florian, G. Ferrera, M. Grazzini, and D. Tommasini | Transverse-momentum resummation: Higgs boson production at the Tevatron and the LHC | JHEP 11 (2011) 064 | 1109.2109 |
| 32 | T. Sjöstrand et al. | An introduction to PYTHIA 8.2 | Comput. Phys. Commun. 191 (2015) 159 | 1410.3012 |
| 33 | J. Alwall et al. | Comparative study of various algorithms for the merging of parton showers and matrix elements in hadronic collisions | EPJC 53 (2008) 473 | 0706.2569 |
| 34 | T. Sjöstrand, S. Mrenna, and P. Z. Skands | A brief introduction to PYTHIA 8.1 | Comput. Phys. Commun. 178 (2008) 852 | 0710.3820 |
| 35 | CMS Collaboration | Event generator tunes obtained from underlying event and multiparton scattering measurements | EPJC 76 (2016) 155 | CMS-GEN-14-001 1512.00815 |
| 36 | CMS Collaboration | Extraction and validation of a new set of CMS PYTHIA8 tunes from underlying-event measurements | EPJC 80 (2020) 4 | CMS-GEN-17-001 1903.12179 |
| 37 | NNPDF Collaboration | Parton distributions for the LHC Run II | JHEP 04 (2015) 040 | 1410.8849 |
| 38 | GEANT4 Collaboration | GEANT 4---a simulation toolkit | NIM A 506 (2003) 250 | |
| 39 | Y. L. Dokshitzer, G. D. Leder, S. Moretti, and B. R. Webber | Better jet clustering algorithms | JHEP 08 (1997) 001 | hep-ph/9707323 |
| 40 | S. Macaluso and D. Shih | Pulling out all the tops with computer vision and deep learning | JHEP 10 (2018) 121 | 1803.00107 |
| 41 | M. Cacciari, G. P. Salam, and G. Soyez | The anti-$ k_{\mathrm{T}} $ clustering algorithm | JHEP 04 (2008) 063 | 0802.1189 |
| 42 | M. Cacciari, G. P. Salam, and G. Soyez | FastJet user manual | EPJC 72 (2012) 1896 | 1111.6097 |
| 43 | CMS Collaboration | Search for narrow and broad dijet resonances in proton-proton collisions at $ \sqrt{s}= $ 13 TeV and constraints on dark matter mediators and other new particles | JHEP 08 (2018) 130 | CMS-EXO-16-056 1806.00843 |
| 44 | CMS Collaboration | Search for dijet resonances in proton-proton collisions at $ \sqrt{s} = $ 13 TeV and constraints on dark matter and other models | PLB 769 (2017) 520 | CMS-EXO-16-032 1611.03568 |
| 45 | CMS Collaboration | Search for narrow resonances decaying to dijets in proton-proton collisions at $ \sqrt{s} = $ 13 TeV | PRL 116 (2016) 071801 | CMS-EXO-15-001 1512.01224 |
| 46 | ATLAS Collaboration | Search for new phenomena in dijet mass and angular distributions from pp collisions at $ \sqrt{s}= $ 13 TeV with the ATLAS detector | PLB 754 (2016) 302 | 1512.01530 |
| 47 | R. A. Fisher | On the interpretation of $ \chi^{2} $ from contingency tables, and the calculation of P | J. R. Stat. Soc. 85 (1922) 87 | |
| 48 | M. J. Oreglia | A study of the reactions $ \psi^\prime \to \gamma \gamma \psi $ | PhD thesis, Stanford University, SLAC Report SLAC-R-236, 1980 link |
|
| 49 | P. D. Dauncey, M. Kenzie, N. Wardle, and G. J. Davies | Handling uncertainties in background shapes: the discrete profiling method | JINST 10 (2015) P04015 | 1408.6865 |
| 50 | CMS Collaboration | Precision luminosity measurement in proton-proton collisions at $ \sqrt{s}= $ 13 TeV in 2015 and 2016 at CMS | EPJC 81 (2021) 800 | CMS-LUM-17-003 2104.01927 |
| 51 | CMS Collaboration | CMS luminosity measurement for the 2017 data-taking period at $ \sqrt{s}= $ 13 TeV | CMS Physics Analysis Summary, 2018 CMS-PAS-LUM-17-004 |
CMS-PAS-LUM-17-004 |
| 52 | CMS Collaboration | CMS luminosity measurement for the 2018 data-taking period at $ \sqrt{s}= $ 13 TeV | CMS Physics Analysis Summary, 2019 CMS-PAS-LUM-18-002 |
CMS-PAS-LUM-18-002 |
| 53 | E. Gross and O. Vitells | Trial factors for the look elsewhere effect in high energy physics | EPJC 70 (2010) 525 | 1005.1891 |
| 54 | T. Junk | Confidence level computation for combining searches with small statistics | NIM A 434 (1999) 435 | hep-ex/9902006 |
| 55 | A. L. Read | Presentation of search results: the CL$ _s $ technique | JPG 28 (2002) 2693 | |
| 56 | CMS Collaboration | The CMS statistical analysis and combination tool: Combine | Submitted to Comput. Softw. Big Sci, 2024 | CMS-CAT-23-001 2404.06614 |
| 57 | G. Cowan, K. Cranmer, E. Gross, and O. Vitells | Asymptotic formulae for likelihood-based tests of new physics | EPJC 71 (2011) 1554 | 1007.1727 |
|
|
Compact Muon Solenoid LHC, CERN |
|

|

|

|

|

|