☰
◀ Previous △ Index Next ▶
Geometry Plot
With the Geometry Plot you can create 2D projections of the
geometry, overlaying as color plot regions, materials, lattices,
biasing and magnetic field maps. The header and the footer are
common like in all other plots except the range that is dynamically
calculated depending on the projection.
 Each projection is defined by the position of the Center point, the
projection axes called "Basis" and the extends of the plot.
Flair using this information will generate a temporary FLUKA input
file including only the relevant information (geometry, materials,
fields, USR[IG]CALL cards. At the end it will append a PLOTGEOM card
with the information supplied in this frame. It will execute FLUKA
and if everything is Ok will process the PLOTGEOM output file and
plot the result. In case of failure an dialog will be shown with all
files produced by FLUKA for inspection.
Fields and Buttons
~~~~~~~~~~~~~~~~~~
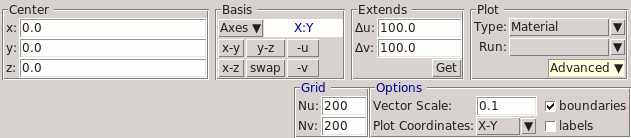
Center The center group allows the user to enter the 3D
~~~~~~ coordinates of the center position of the plot.
x The r=(x,y,z) center position coordinates
y
z
Basis The basis group defines the projection plane to be
~~~~~ used. The projection plane is defined by two
vectors the
u for the x-projection
v for the y-projection
u Define the u vector of the projection
v Define the v vector of the projection
x-y Set u=x-axes and v=y-axes
x-z Set u=x-axes and v=z-axes
y-z Set u=y-axes and v=z-axes
swap Swap the values of u and v
-u Negate the value of u
-v Negate the value of v
Extends The extends group defines half-range of the plot.
~~~~~~~ Total range is twice the value of Du and Dv
Du half range (or from center to max/min) in the u
axis
Dv half range (or from center to max/min) in the v
axis
Get Get the range and Center position from gnuplot.
You can zoom in gnuplot by right-clicking the
mouse and selecting a region of interest. Then
click the "Get" button to get the coordinates of
gnuplot back to this frame
Plot Provides two combo boxes for selecting the type of
~~~~~ plot as well the plotting axes
Type Gives the choice to the user of the type of the
plot, between
Geometry purely 2D line plot
Region Display regions with random color
Material Display materials with colors
defined in the "Palette"
Lattice Display lattice with different
colors
Field Intensity Display Magnetic field
intensity with color plot
Field Vector Display Magnetic field vectors
and intensity with color plot
Run Select the appropriate run from the drop down
listbox
Grid The grid group defines scanning grid to be used
~~~~ in FLUKA when plotting of region, materials,...
is requested.
Each projection is defined by the position of the Center point, the
projection axes called "Basis" and the extends of the plot.
Flair using this information will generate a temporary FLUKA input
file including only the relevant information (geometry, materials,
fields, USR[IG]CALL cards. At the end it will append a PLOTGEOM card
with the information supplied in this frame. It will execute FLUKA
and if everything is Ok will process the PLOTGEOM output file and
plot the result. In case of failure an dialog will be shown with all
files produced by FLUKA for inspection.
Fields and Buttons
~~~~~~~~~~~~~~~~~~
Center The center group allows the user to enter the 3D
~~~~~~ coordinates of the center position of the plot.
x The r=(x,y,z) center position coordinates
y
z
Basis The basis group defines the projection plane to be
~~~~~ used. The projection plane is defined by two
vectors the
u for the x-projection
v for the y-projection
u Define the u vector of the projection
v Define the v vector of the projection
x-y Set u=x-axes and v=y-axes
x-z Set u=x-axes and v=z-axes
y-z Set u=y-axes and v=z-axes
swap Swap the values of u and v
-u Negate the value of u
-v Negate the value of v
Extends The extends group defines half-range of the plot.
~~~~~~~ Total range is twice the value of Du and Dv
Du half range (or from center to max/min) in the u
axis
Dv half range (or from center to max/min) in the v
axis
Get Get the range and Center position from gnuplot.
You can zoom in gnuplot by right-clicking the
mouse and selecting a region of interest. Then
click the "Get" button to get the coordinates of
gnuplot back to this frame
Plot Provides two combo boxes for selecting the type of
~~~~~ plot as well the plotting axes
Type Gives the choice to the user of the type of the
plot, between
Geometry purely 2D line plot
Region Display regions with random color
Material Display materials with colors
defined in the "Palette"
Lattice Display lattice with different
colors
Field Intensity Display Magnetic field
intensity with color plot
Field Vector Display Magnetic field vectors
and intensity with color plot
Run Select the appropriate run from the drop down
listbox
Grid The grid group defines scanning grid to be used
~~~~ in FLUKA when plotting of region, materials,...
is requested.
Note:
That the processing of the plot is done by
flair and since python is an interpreter language,
big values on the scanning grid could result in
slow performance
Nu Number of bins in the u axis
Nv Number of bins in the v axis
Options Various options
~~~~~~~
Vector scale Multiply the value of the magnetic field with the
Vector scale value when displayed on screen
Coordinates This field is automatically set when the basis
buttons are set. The user can further select on of
the following values to plot
U-V, V-U, X-Y, X-Z, Y-Z, Y-X, Z-X, Z-Y
boundaries Display all boundaries even between regions with
the same material
labels Display labels of regions, materials
Note:
gnuplot 4.2 or higher is required for that
◀ Previous △ Index Next ▶
 flair
flair