graphics: LAYOUT
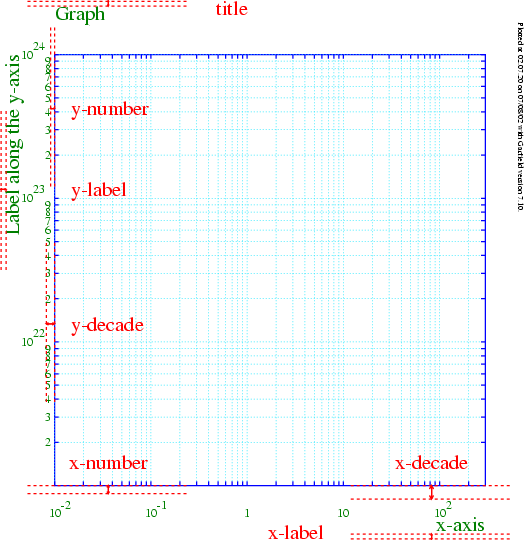
In red the adjustable parameters:

The diagram has been made with a viewport covering the entire NDC
space and using the following layout settings:
!layout x-number = 0.015, x-decade = 0.025, ...
        y-number = 0.007, y-decade = 0.015, ...
        x-label  = 0.010, y-label  = 0.010, ...
        title    = 0.010
|
Margin between the x-axis and the upper edge of the
numbers shown along the x-axis.
The numbers are plotted centred horizontally at the
coordinate they represent.
The size of the numbers can be controlled with the
NUMBERS
representation.
[Initial setting: 0.007]
Margin between the y-axis and the right edge of the
numbers shown along the y-axis.
The numbers are plotted centred vertically at the
coordinate they represent.
The size of the numbers can be controlled with the
NUMBERS
representation.
[Initial setting: 0.007]
In plots with a logarithmic x-axis, the margin between
upper edge of the exponents of 10 and the x-axis.
The "10" or "1" is plotted centred horizontally at the
coordinate it represents, the exponent is plotted such
that its lower left edge coincides with the upper right
edge of the "10".
The size of the numbers, both the "10" or "1" and the
exponent, can be controlled with the
NUMBERS
representation.
[Initial setting: 0.015]
In plots with a logarithmic y-axis, the margin between
right edge of the exponents of 10 and the y-axis.
The "10" or "1" is plotted centred vertically at the
coordinate it represents, the exponent is plotted such
that its lower left edge coincides with the upper right
edge of the "10".
The size of the numbers, both the "10" or "1" and the
exponent, can be controlled with the
NUMBERS
representation.
[Initial setting: 0.015]
Margin between the lower edge of the viewport and the label
plotted along the x-axis.
The label is plotted right-aligned with the coordinate
frame.
The size of the characters can be controlled with the
LABELS
representation.
[Initial setting: 0.01]
Margin between the left edge of the viewport and the label
plotted along the y-axis.
The label is plotted right-aligned with the coordinate
frame.
The size of the characters can be controlled with the
LABELS
representation.
[Initial setting: 0.01]
Margin between the top edge of the viewport and the title.
The title is plotted left-aligned with the coordinate
frame.
The size of the characters can be controlled with the
TITLE
representation.
[Initial setting: 0.01]
Go to the top level,
to graphics,
to LAYOUT,
to the topic index,
to the table of contents, or to the full text.
Formatted on 21/01/18 at 16:55.
