graphics: REPRESENTATION: item
Polymarker item: can be used as marker type argument to the
PLOT_MARKERS procedure.
Is initialised to be an asterisk, of which you can change the
size and colour.
Polymarker item: Marks the location of an attaching interaction between
an electron and a gas molecule, as a result of which the electron will
as a rule be lost.
This representation is used by the
DRIFT_MICROSCOPIC_ELECTRON procedure.
Polyline and polymarker item: Auger electrons result from
the return of an excited atom to a lower energy state by the
emission of an electron rather than a photon - an mechanism
known as Auger effect. The electron that is emitted may have
enough energy to ionise further gas molecules, in which case
these electrons look like \δ-electrons.
If an Auger electron generates secondary electrons, then a
line is drawn showing its trajectory. Otherwise a marker
indicates the point where it was produced.
Fill area item: used to plot the 1st bar chart in a frame.
Fill area item: used to plot the 2nd bar chart in a frame.
Fill area item: used to plot the 3rd bar chart in a frame.
Fill area item: used to plot the 4th bar chart in a frame.
Fill area item: used to plot the 5th bar chart in a frame.
Fill area item: used to plot the 6th bar chart in a frame.
Fill area item: used to plot the 7th bar chart in a frame.
Polyline and fill area item: the polyline item corresponds to
the coordinate axes, the fill area item is used in
3D diagrams for the 3 backmost panels
of the box.
The fill area item should in principle have an interior style
of SOLID
and a light colour. The colour will not be used as such - rather,
various shades will be used depending on the exposition of the panel
with respect to the light source.
Polymarker item: can be used as marker type argument to the
PLOT_MARKERS procedure.
Is initialised to be a circle, of which you can change the
size and colour.
Polyline and text item: the polyline representation is used to
clarify the graphs made by the
DRIFT command by drawing a vertical separation
line between sections of the graph with different drift-line
status.
The text item is used for
- indicating the drift-line status in the above graphs;
- the description of the viewing plane in
CUT plots provided the viewing
plane is not z=0;
- the 4 information areas underneath the title of every plot.
The latter 4 areas are used for:
- the cell and gas identifiers as set of the
CELL-IDENTIFIER and GAS-IDENTIFIER;
- statistical information when plotting histograms;
- other information concerning the plot such as particle being
drifted, isochron intervals, electrode description,
fit quality etc.
The PLOT_COMMENT procedure enables you to place labels
of your own in the 4 area.
Fill area item: conductors in the chamber as entered with the
SOLIDS statement, but also the wires when asking
for a 3D plot of a chamber in which the
field is computed from wire locations rather than a field map.
This representation is used as such if the chamber is shown
as a CUT view.
For 3D impressions, the interior style
should in principle be set to
SOLID.
The colour is not used as such, rather various shades of it will
be used depending on the exposition of the various surface panels
with respect to the light source. The
shades can be seen with the SHADING-MAP
graphics command.
The elements of the field map are shown with a separate set
of representations:
MATERIAL-1,
MATERIAL-2,
MATERIAL-3,
MATERIAL-4 and
MATERIAL-5.
Fill area item: conductors in the chamber as entered with the
SOLIDS statement and for which a representation
with this type was explicitly requested.
This representation is used as such if the chamber is shown
as a CUT view.
For 3D impressions, the interior style
should in principle be set to
SOLID.
The colour is not used as such, rather various shades of it will
be used depending on the exposition of the various surface panels
with respect to the light source. The
shades can be seen with the SHADING-MAP
graphics command.
The elements of the field map are shown with a separate set
of representations:
MATERIAL-1,
MATERIAL-2,
MATERIAL-3,
MATERIAL-4 and
MATERIAL-5.
Polyline item: the highlighted contours as made by the
PLOT-FIELD commands in the field, drift and signal sections.
Text item: the function values shown on the contours plotted
by PLOT-FIELD commands, if contour labelling has been requested.
Polyline item: the normal contours as made by the
PLOT-FIELD commands in the field, drift and signal sections.
Polymarker item: can be used as marker type argument to the
PLOT_MARKERS procedure.
Is initialised to be a cross, of which you can change the
size and colour.
Polymarker item: the wires of label C
are plotted using this representation provided the
WIRE-MARKERS option is in effect.
If this option is not active, then the wires will be shown
with WIRES.
Polyline item: can be used as argument in procedures such as
PLOT_LINE and PLOT_ARROW whenever
a polyline representation is needed.
The representation is not used by normal Garfield commands.
Polyline item: can be used as argument in procedures such as
PLOT_LINE and PLOT_ARROW whenever
a polyline representation is needed.
The representation is not used by normal Garfield commands.
Polyline and polymarker item: \δ-electrons resemble
grass along the track. They result from particularly large
energy transfers of the particle to an electron of a gas
molecule. The electrons thus liberated from the molecule
have sufficient energy to ionise further gas molecules before
drifting towards the anodes.
If the \δ-electron generates several further electrons,
then it will be drawn as a line, otherwise as a marker.
Fill area item: the dielectric media in the chamber as entered
with the SOLIDS statement.
This representation is used as such if the chamber is shown
as a CUT view.
For 3D impressions, the interior style
should in principle be set to
SOLID.
The colour is not used as such, rather various shades of it will
be used depending on the exposition of the various surface panels
with respect to the light source. The
shades can be seen with the SHADING-MAP
graphics command.
The elements of the field map are shown with a separate set
of representations:
MATERIAL-1,
MATERIAL-2,
MATERIAL-3,
MATERIAL-4 and
MATERIAL-5.
Fill area item: the dielectric media in the chamber as entered
with the SOLIDS statement and for which this
representation was explicitly requested.
This representation is used as such if the chamber is shown
as a CUT view.
For 3D impressions, the interior style
should in principle be set to
SOLID.
The colour is not used as such, rather various shades of it will
be used depending on the exposition of the various surface panels
with respect to the light source. The
shades can be seen with the SHADING-MAP
graphics command.
The elements of the field map are shown with a separate set
of representations:
MATERIAL-1,
MATERIAL-2,
MATERIAL-3,
MATERIAL-4 and
MATERIAL-5.
Polymarker item: can be used as marker type argument to the
PLOT_MARKERS procedure.
Is initialised to be a dot, of which you can change the
representation.
Polyline item: can be used as argument in procedures such as
PLOT_LINE and PLOT_ARROW whenever
a polyline representation is needed.
The representation is not used by normal Garfield commands.
Polyline item: Electron drift-lines.
Polymarker item: Marks the location of an elastic interaction between
an electron and a gas molecule. During such interactions, electrons
neither lose nor gain energy, they are not lost and they do not produce
additional electrons.
This representation is used by the
DRIFT_MICROSCOPIC_ELECTRON procedure.
Polyline and fill area: Error bands plotted with the
PLOT_ERROR_BAND procedure call.
Polyline and fill area: Error bars plotted with the PLOT_ERROR_BAR
and PLOT_OBLIQUE_ERROR_BAR procedure calls. Although usually
called by the user, these procedures are also used by the fitting routines
when making graphs.
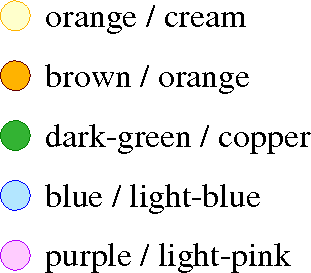
Colour combinations offering good contrast include:
Polymarker item: Marks the location of an inelastic interaction between
an electron and a gas molecule which leave the gas molecule in an excited
state. The electrons lose energy in such interactions, but they do not
produce additional electrons and they are not lost either.
Inelastic interactions that do not lead to an excited state are plotted with the
INELASTIC representation.
This representation is used by the
DRIFT_MICROSCOPIC_ELECTRON procedure.
Polyline, polymarker, text and fill area item:
The polyline and polymarker items are used for the primary graph in
almost every graph that Garfield makes.
The text and fill area items are not used by Garfield, and are mainly
provided for use with user procedure calls. Usually, all items are set
to share the same colour so as to make it clear that they belong together.
This representation is commonly used in scripts.
Polyline, polymarker, text and fill area item:
The polyline and polymarker types are used for the secondary graph in a plot,
for instance the integrated diffusion in the x(t) plot or the transverse
diffusion in the gas plots.
The text and fill area items are not used by Garfield, and are mainly
provided for use with user procedure calls. Usually, all items are set
to share the same colour so as to make it clear that they belong together.
This representation is commonly used in scripts.
Polyline, polymarker, text and fill area item:
The polyline and polymarker types are used in a few plots where one needs
3 graphs in the same plot, such as the drift velocity graphs.
The text and fill area items are not used by Garfield, and are mainly
provided for use with user procedure calls. Usually, all items are set
to share the same colour so as to make it clear that they belong together.
This representation is commonly used in scripts.
Polyline, polymarker, text and fill area item:
The polyline type is used for the cross section and energy distribution
plots of Magboltz. The other types are not used by Garfield.
This representation is commonly used in scripts.
Polyline, polymarker, text and fill area item: not yet used by Garfield,
can be used for user plots.
Polyline, polymarker, text and fill area item: not yet used by Garfield,
can be used for user plots.
Polyline, polymarker, text and fill area item: not yet used by Garfield,
can be used for user plots.
Text item: intended for user applications, the font of the
representation is set to Gothic.
Not all graphics systems will recognise this representation.
Text item: intended for user applications, the font of the
representation is set to Gothic italics.
Not all graphics systems will recognise this representation.
Text item: intended for user applications, the font of the
representation is set to Greek characters.
Not all graphics systems will recognise this representation.
Polyline used to draw the coordinate grid on the plots.
The grid is shown only if the
GRID graphics option is
in effect.
Polyline item: used to plot the 1st histogram in a frame.
Polyline item: used to plot the 2nd histogram in a frame.
Polyline item: used to plot the 3rd histogram in a frame.
Polyline item: used to plot the 4th histogram in a frame.
Polyline item: used to plot the 5th histogram in a frame.
Polyline item: used to plot the 6th histogram in a frame.
Polyline item: used to plot the 7th histogram in a frame.
Polymarker item: Marks the location of an inelastic interaction between
an electron and a gas molecule. Electrons lose energy in such interactions,
but they do not produce additional electrons and they are not lost either.
Inelastic interactions that lead to an excited state are plotted with the
EXCITATION representation.
This representation is used by the
DRIFT_MICROSCOPIC_ELECTRON procedure.
Polymarker item: Marks the location of an ionising interaction between
an electron and a gas molecule as a result of which in general one or
more additional electrons are created.
This representation is used by the
DRIFT_MICROSCOPIC_ELECTRON procedure.
Polyline item: used for ion drift-lines.
Polyline and polymarker item: the isochrons in a drift
line plot.
With the initial default settings, i.e. when the
DRAW-ISOCHRONS option
is on, an attempt is made to link the points on an isochron
with lines.
When a point on an isochron can not be linked to another
point of the same contour, and also when the
MARK-ISOCHRONS
option is on, a marker is plotted on the drift-line.
Text item: the labels along the axes. This item is also used for
the '10\<SUP\>n\</SUP\>' part of the scaling factor, the exponent is plotted
with the item NUMBERS.
The location of the labels can be adjusted using the
LAYOUT command.
All graphs produced with normal commands have labels along their
axes. Usually, you have no influence on the text shown there.
However, you can make these labels invisible by setting the text
colour to BACKGROUND and put other labels in place with the
help of the PLOT_X_LABEL and
PLOT_Y_LABEL procedures.
Fill area item: used with field maps to draw the area covered
by the material with the lowest dielectric constant.
The materials are only shown when
PLOT-MAP has been requested in
the FIELD-MAP command.
Solids are shown with a separate set of representations:
DIELECTRICA-1,
DIELECTRICA-2,
DIELECTRICA-3,
CONDUCTORS-1,
CONDUCTORS-2 and
CONDUCTORS-3.
Fill area item: used with field maps to draw the area covered
by the material with the 2nd lowest dielectric constant.
The materials are only shown when
PLOT-MAP has been requested in
the FIELD-MAP command.
Solids are shown with a separate set of representations:
DIELECTRICA-1,
DIELECTRICA-2,
DIELECTRICA-3,
CONDUCTORS-1,
CONDUCTORS-2 and
CONDUCTORS-3.
Fill area item: used with field maps to draw the area covered
by the material with the 3rd lowest dielectric constant.
The materials are only shown when
PLOT-MAP has been requested in
the FIELD-MAP command.
Solids are shown with a separate set of representations:
DIELECTRICA-1,
DIELECTRICA-2,
DIELECTRICA-3,
CONDUCTORS-1,
CONDUCTORS-2 and
CONDUCTORS-3.
Fill area item: used with field maps to draw the area covered
by the material with the 4th lowest dielectric constant.
The materials are only shown when
PLOT-MAP has been requested in
the FIELD-MAP command.
Solids are shown with a separate set of representations:
DIELECTRICA-1,
DIELECTRICA-2,
DIELECTRICA-3,
CONDUCTORS-1,
CONDUCTORS-2 and
CONDUCTORS-3.
Fill area item: used with field maps to draw the area covered
by the material with other dielectric constants.
The materials are only shown when
PLOT-MAP has been requested in
the FIELD-MAP command.
Solids are shown with a separate set of representations:
DIELECTRICA-1,
DIELECTRICA-2,
DIELECTRICA-3,
CONDUCTORS-1,
CONDUCTORS-2 and
CONDUCTORS-3.
Text item: used for graphics messages. The most common examples
are:
- The line asking you to hit return to signal to the program
that it can continue. This line is shown only when using
certain graphics systems, provided the
WAIT-AFTER-PLOT graphics option
is active.
- The time STAMP, which is shown when the
TIME-STAMP graphics option
is active.
Text item: the numbers along the coordinate axes. This item
also covers the exponent if the scale is more than 1 decade.
Polymarker item: the wires with label
other than S, P and C are plotted using this representation
if the WIRE-MARKERS option is in
effect.
If this option is not active, then the wires will be shown
with WIRES.
Polyline item: the outer limits of the solids as shown in
3D and CUT type
plots if the OUTLINE option is in
effect.
Fill area item: used for areas in CUT
type layout plots which are not part of the area
box.
Polyline and polymarker item: When a particle ionises a gas
molecule, the molecule can return to its ground state by
emitting a photon, which can be absorbed further on by another
gas molecule.
Polyline and fill area item: the planes as entered in the cell
section with the PLANE statement. The fill area
item is used in 3D layouts, the polyline
item is used for other projections and the outlines.
Strips on the planes, if defined, are shown using the
STRIPS representation.
The fill area representation should in principle be set to
SOLID.
The colour is not used as such, rather various shades of it will
be used depending on the exposition of the various surface panels
with respect to the light source. The
shades can be examined with the SHADING-MAP
graphics command.
Polymarker item: can be used as marker type argument to the
PLOT_MARKERS procedure.
Is initialised to be a plus sign, of which you can change
the size and colour.
Text item: intended for user applications, the font of the
representation is set to Prestige Elite.
Not all graphics systems will recognise this representation.
Polymarker item: the wires of label P
are plotted using this representation provided the
WIRE-MARKERS option is in effect.
If this option is not active, then the wires will be shown
with WIRES.
Polyline item: can be used as argument in procedures such as
PLOT_LINE and PLOT_ARROW whenever
a polyline representation is needed.
The representation is not used by normal Garfield commands,
but serves as default for several procedures.
Polyline and fill area item: the strips of the planes and the
tubes as entered in the cell section with the PLANE
and TUBE statements. The fill area item is used
in 3D layouts, the polyline item is
used for other projections and the outlines.
The planes themselves and the tube are shown using the
PLANES and
TUBE representation.
The fill area representation should in principle be set to
SOLID.
The colour is not used as such, rather various shades of it will
be used depending on the exposition of the various surface panels
with respect to the light source. The
shades can be examined with the SHADING-MAP
graphics command.
Polymarker item: Marks the location of a super-elastic interaction
between an electron and a gas molecule. These are interactions in
which the electron gains energy.
This representation is used by the
DRIFT_MICROSCOPIC_ELECTRON procedure.
Polymarker item: the wires with label S
are plotted using this representation provided the
WIRE-MARKERS option is in effect.
If this option is not active, then the wires will be shown
with WIRES.
Text item: intended for user applications, the font of the
representation is set to Times italics.
Not all graphics systems will recognise this representation.
Text item: intended for user applications, the font of the
representation is set to Times roman.
Not all graphics systems will recognise this representation.
Text item: the global title of the plot.
All graphs produced with normal commands have a title at the
top. Usually, you have no influence on the text shown there.
However, you can make the title invisible by setting the text
colour to BACKGROUND and put another title in place with the
help of the PLOT_TITLE procedure.
The location of the title can be adjusted using the
LAYOUT command.
Polyline and polymarker item: This can be either of 2 things:
- the straight line segment that you have entered via
TRACK
- the series of interaction points with the gas of the particle
that passes through the chamber
The two kinds of tracks coincide unless
- the particle has too little energy to reach the end-point of
the specified line segment
- the particle undergoes multiple scattering and deviates from
its original trajectory
In both cases, the track can be a point in some circumstances.
In that event, a marker is used rather than a line.
Polyline item: the tube enclosing the wires. The tube is
entered in the cell section with the TUBE statement.
The fill area item is used in 3D layouts,
the polyline item is used for other projections and the outlines.
Strips on the tube, if defined, are shown using the
STRIPS representation.
The fill area representation should in principle be set to
SOLID.
The colour is not used as such, rather various shades of it will
be used depending on the exposition of the various surface panels
with respect to the light source. The
shades can be examined with the SHADING-MAP
graphics command.
Fill area item: Wires are, unless the
WIRE-MARKERS option is active,
plotted as areas to allow them to be picked in the
GRAPHICS-INPUT instruction.
Note that, by default, the wires are plotted as hollow
circles. This might give the false impression that this
is a polyline item.
If the WIRE-MARKERS option is active, then wires are shown
using C-WIRES,
OTHER-WIRES,
P-WIRES or
S-WIRES as
appropriate.
Go to the top level,
to graphics,
to REPRESENTATION,
to item,
to the topic index,
to the table of contents, or to the full text.
Formatted on 21/01/18 at 16:55.