Determination of the branching fractions of $B_{s}^{0} \to D_{s}^{\mp} K^{\pm}$ and $B^{0} \to D_{s}^{-} K^{+}$
[to restricted-access page]Information
LHCb-PAPER-2014-064
CERN-PH-EP-2014-297
arXiv:1412.7654 [PDF]
(Submitted on 24 Dec 2014)
JHEP 05 (2015) 019
Inspire 1335499
Tools
Abstract
Measurements are presented of the branching fractions of the decays $B_{s}^{0} \to D_{s}^{\mp} K^{\pm}$ and $B^{0} \to D_{s}^{-} K^{+}$ relative to the decays $B_{s}^{0} \to D_{s}^{-} \pi^{+}$ and $B^{0} \to D^{-} \pi^{+}$, respectively. The data used correspond to an integrated luminosity of 3.0 fb$^{-1}$ of proton-proton collisions. The ratios of branching fractions are $\dfrac{\mathcal{B}(B_{s}^{0} \to D_{s}^{\mp} K^{\pm})}{\mathcal{B}(B_{s}^{0} \to D_{s}^{-} \pi^{+})} = 0.0752 \pm 0.0015 \pm 0.0019$ and $\dfrac{\mathcal{B}(B^{0} \to D_{s}^{-} K^{+})}{\mathcal{B}(B^{0} \to D^{-} \pi^{+})} = 0.0129 \pm 0.0005 \pm 0.0008,$ where the uncertainties are statistical and systematic, respectively.
Figures and captions
|
Feynman diagrams of the processes under study. The upper diagrams represent the two tree topologies in which a $ B ^0_ s $ meson decays into the $ D ^{\mp}_ s K ^\pm $ final state, and the lower diagrams show the tree diagram of $ B ^0_ s \rightarrow D ^-_ s \pi ^+ $ and the $ W $ -exchange topology of $ B ^0_{(s)}\rightarrow D ^-_ s K ^+ $. |
Fig1a.pdf [183 KiB] HiDef png [51 KiB] Thumbnail [26 KiB] |

|
|
Fig1b.pdf [183 KiB] HiDef png [51 KiB] Thumbnail [26 KiB] |

|
|
|
Fig1c.pdf [183 KiB] HiDef png [49 KiB] Thumbnail [24 KiB] |

|
|
|
Fig1d.pdf [183 KiB] HiDef png [66 KiB] Thumbnail [31 KiB] |

|
|
|
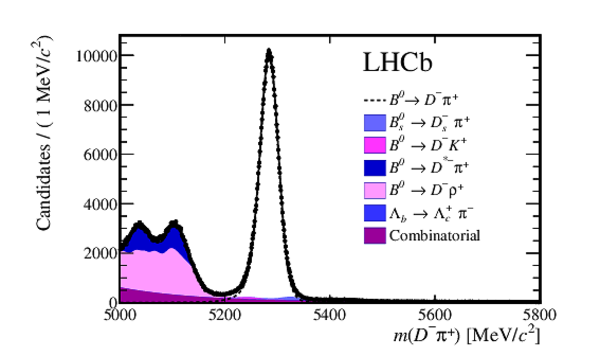
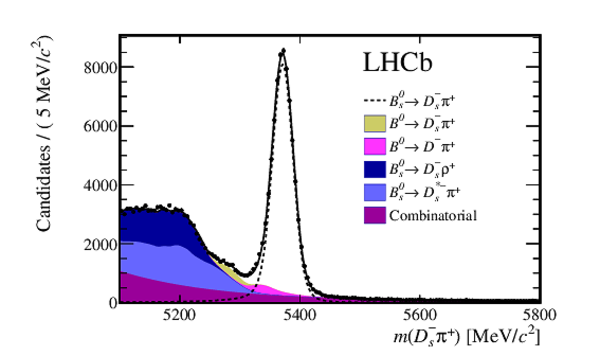
Results of the fits to the invariant mass distributions of the final states (a) $ D ^- \pi ^+ $ and (b) $ D ^-_ s \pi ^+ $. |
Fig2a.pdf [161 KiB] HiDef png [174 KiB] Thumbnail [142 KiB] |
|
|
Fig2b.pdf [41 KiB] HiDef png [187 KiB] Thumbnail [143 KiB] |
|
|
|
Result of the fit to the invariant mass distribution of the final state $ D ^{\mp}_ s K ^\pm $. |
Fig3.pdf [45 KiB] HiDef png [254 KiB] Thumbnail [181 KiB] |

|
|
Animated gif made out of all figures. |
PAPER-2014-064.gif Thumbnail |

|
![HiDef png [51 KiB]](Directory_LHCb-PAPER-2014-064/hidef_Fig1a.png)
![HiDef png [51 KiB]](Directory_LHCb-PAPER-2014-064/hidef_Fig1b.png)
![HiDef png [49 KiB]](Directory_LHCb-PAPER-2014-064/hidef_Fig1c.png)
![HiDef png [66 KiB]](Directory_LHCb-PAPER-2014-064/hidef_Fig1d.png)
![HiDef png [174 KiB]](Directory_LHCb-PAPER-2014-064/hidef_Fig2a.png)
![HiDef png [187 KiB]](Directory_LHCb-PAPER-2014-064/hidef_Fig2b.png)
![HiDef png [254 KiB]](Directory_LHCb-PAPER-2014-064/hidef_Fig3.png)
Tables and captions
|
Kinematic and PID selection efficiencies for each signal decay, as determined from simulated events and data, respectively. The kinematic efficiencies represent weighted averages determined from events simulated at $\sqrt{s} = 7\mathrm{ Te V} $ ($34\%$) and $\sqrt{s} = 8\mathrm{ Te V} $ ($66\%$). The binomial uncertainties result from the size of the simulated samples. |
Table_1.pdf [53 KiB] HiDef png [53 KiB] Thumbnail [27 KiB] tex code |

|
|
Yields for the four signal decay types, as obtained from the fits. |
Table_2.pdf [49 KiB] HiDef png [84 KiB] Thumbnail [36 KiB] tex code |

|
|
Systematic uncertainties on the ratios of branching fractions, in $\%$, obtained as described in the text. The total uncertainty is obtained by adding the separate contributions in quadrature. |
Table_3.pdf [53 KiB] HiDef png [52 KiB] Thumbnail [25 KiB] tex code |

|
![HiDef png [53 KiB]](Directory_LHCb-PAPER-2014-064/hidef_Table_1.png)
![HiDef png [84 KiB]](Directory_LHCb-PAPER-2014-064/hidef_Table_2.png)
![HiDef png [52 KiB]](Directory_LHCb-PAPER-2014-064/hidef_Table_3.png)
Supplementary Material [file]
| Supplementary material full pdf |
supple[..].pdf [139 KiB] |
|
|
This ZIP file contains supplemetary material for the publication LHCb-PAPER-2014-064. The files are: Supplementary.pdf : An overview of the extra figures *.pdf, *.png, *.eps : The figures in variuous formats |
Fig1-S.pdf [14 KiB] HiDef png [575 KiB] Thumbnail [342 KiB] *C file |
|
|
Fig2-S.pdf [13 KiB] HiDef png [58 KiB] Thumbnail [30 KiB] *C file |
|
![HiDef png [575 KiB]](Directory_LHCb-PAPER-2014-064/supplementary/hidef_Fig1-S.png)
![HiDef png [58 KiB]](Directory_LHCb-PAPER-2014-064/supplementary/hidef_Fig2-S.png)
Created on 02 May 2024.