Measurement of the $\Upsilon$ polarizations in $pp$ collisions at $\sqrt{s}$=7 and 8TeV
[to restricted-access page]Information
LHCb-PAPER-2017-028
CERN-EP-2017-210
arXiv:1709.01301 [PDF]
(Submitted on 05 Sep 2017)
JHEP 12 (2017) 110
Inspire 1621596
Tools
Abstract
The polarization of the $\Upsilon(1S)$, $\Upsilon(2S)$ and $\Upsilon(3S) $mesons, produced in $pp$ collisions at centre-of-mass energies $\sqrt{s}$=7 and 8TeV, is measured using data samples collected by the LHCb experiment, corresponding to integrated luminosities of 1 and 2fb$^{-1}$, respectively. The measurements are performed in three polarization frames, using $\Upsilon\to\mu^+\mu^-$ decays in the kinematic region of the transverse momentum $p_{T}(\Upsilon)<30GeV/c$, and rapidity $2.2<y(\Upsilon)<4.5$. No large polarization is observed.
Figures and captions
|
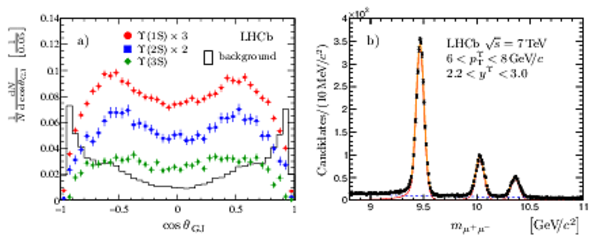
(a) Distributions of $\cos\theta_{\mathrm{GJ}}$ for $\Upsilon(1\mathrm{S})$ (red circles), $\Upsilon(2\mathrm{S})$ (blue squares) and $\Upsilon(3\mathrm{S})$ (green diamonds) signal candidates and the background component (histogram) in the region $6< p^{\Upsilon}_{\mathrm{T}} <8 {\mathrm{ Ge V /}c} $, $2.2< y^{\Upsilon} <3.0$ for data accumulated at $\sqrt{s}=7 \mathrm{TeV}$. To improve visibility, the distributions for the $\Upsilon(1\mathrm{S})$ and $\Upsilon(2\mathrm{S})$ signals are scaled by factors of 3 and 2, respectively. (b) Dimuon mass distribution in the region $6< p^{\Upsilon}_{\mathrm{T}} <8 {\mathrm{ Ge V /}c} $, $2.2< y^{\Upsilon} <3.0$ for data accumulated at $\sqrt{s}=7 \mathrm{TeV}$. The thick dark yellow solid curve shows the result of the fit, as described in the text. The three peaks, shown with thin red solid lines, correspond to the $\Upsilon(1\mathrm{S})$ , $\Upsilon(2\mathrm{S})$ and $\Upsilon(3\mathrm{S})$ signals (left to right). The background component is indicated with a dashed blue line. |
Fig_1.pdf [185 KiB] HiDef png [232 KiB] Thumbnail [197 KiB] *.C file tex code |
|
|
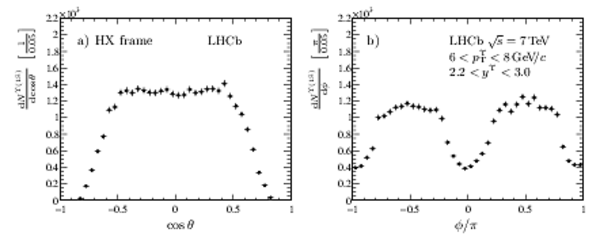
Background-subtracted distributions of (a) $\cos\theta$ and (b) $\phi$ for the $\Upsilon(1\mathrm{S})$ signal candidates in the HX frame, measured in the kinematic region $6< p^{\Upsilon}_{\mathrm{T}} <8 {\mathrm{ Ge V /}c} $ and $2.2< y^{\Upsilon} <3.0$, for data accumulated at $\sqrt{s}=7 \mathrm{TeV}$. |
Fig_2.pdf [126 KiB] HiDef png [99 KiB] Thumbnail [60 KiB] *.C file tex code |
|
|
The polarization parameters (top) $\uplambda_{\theta}$, (middle) $\uplambda_{\theta\phi}$ and (bottom) $\uplambda_{\phi}$, measured in the HX frame for the $\Upsilon(1\mathrm{S})$ state in different bins of $ p^{\Upsilon}_{\mathrm{T}}$ and three rapidity ranges, for data collected at (left) $\sqrt{s} =7 \mathrm{TeV}$ and (right) $\sqrt{s} =8 \mathrm{TeV}$. The results for the rapidity ranges $2.2< y^{\Upsilon} <3.0$, $3.0< y^{\Upsilon} <3.5$ and $3.5< y^{\Upsilon} <4.5$ are shown with red circles, blue squares and green diamonds, respectively. The vertical inner error bars indicate the statistical uncertainty, whilst the outer error bars indicate the sum of the statistical and systematic uncertainties added in quadrature. The horizontal error bars indicate the bin width. Some data points are displaced from the bin centers to improve visibility. |
Fig_3.pdf [139 KiB] HiDef png [462 KiB] Thumbnail [437 KiB] *.C file tex code |

|
|
The polarization parameters (top) $\uplambda_{\theta}$, (middle) $\uplambda_{\theta\phi}$ and (bottom) $\uplambda_{\phi}$, measured in the CS frame for the $\Upsilon(1\mathrm{S})$ state in different bins of $ p^{\Upsilon}_{\mathrm{T}}$ and three rapidity ranges, for data collected at (left) $\sqrt{s} =7 \mathrm{TeV}$ and (right) $\sqrt{s} =8 \mathrm{TeV}$. The results for the rapidity ranges $2.2< y^{\Upsilon} <3.0$, $3.0< y^{\Upsilon} <3.5$ and $3.5< y^{\Upsilon} <4.5$ are shown with red circles, blue squares and green diamonds, respectively. The vertical inner error bars indicate the statistical uncertainty, whilst the outer error bars indicate the sum of the statistical and systematic uncertainties added in quadrature. The horizontal error bars indicate the bin width. Some data points are displaced from the bin centers to improve visibility. |
Fig_4.pdf [138 KiB] HiDef png [435 KiB] Thumbnail [421 KiB] *.C file tex code |

|
|
The polarization parameters (top) $\uplambda_{\theta}$, (middle) $\uplambda_{\theta\phi}$ and (bottom) $\uplambda_{\phi}$, measured in the GJ frame for the $\Upsilon(1\mathrm{S})$ state in different bins of $ p^{\Upsilon}_{\mathrm{T}}$ and three rapidity ranges, for data collected at (left) $\sqrt{s} =7 \mathrm{TeV}$ and (right) $\sqrt{s} =8 \mathrm{TeV}$. The results for the rapidity ranges $2.2< y^{\Upsilon} <3.0$, $3.0< y^{\Upsilon} <3.5$ and $3.5< y^{\Upsilon} <4.5$ are shown with red circles, blue squares and green diamonds, respectively. The vertical inner error bars indicate the statistical uncertainty, whilst the outer error bars indicate the sum of the statistical and systematic uncertainties added in quadrature. The horizontal error bars indicate the bin width. Some data points are displaced from the bin centers to improve visibility. |
Fig_5.pdf [139 KiB] HiDef png [452 KiB] Thumbnail [431 KiB] *.C file tex code |

|
|
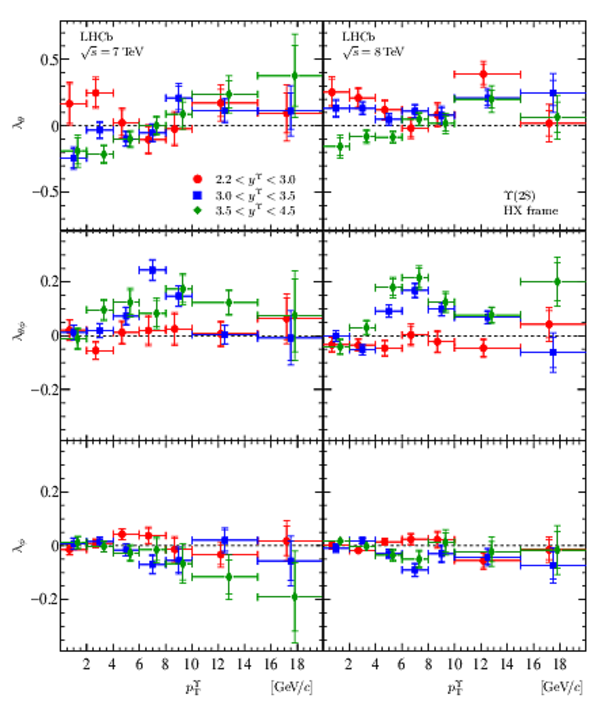
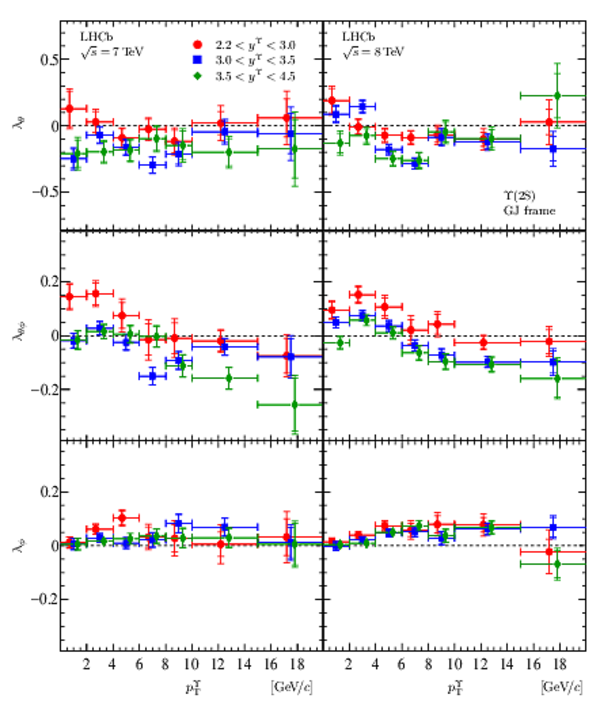
The polarization parameters (top) $\uplambda_{\theta}$, (middle) $\uplambda_{\theta\phi}$ and (bottom) $\uplambda_{\phi}$, measured in the HX frame for the $\Upsilon(2\mathrm{S})$ state in different bins of $ p^{\Upsilon}_{\mathrm{T}}$ and three rapidity ranges, for data collected at (left) $\sqrt{s} =7 \mathrm{TeV}$ and (right) $\sqrt{s} =8 \mathrm{TeV}$. The results for the rapidity ranges $2.2< y^{\Upsilon} <3.0$, $3.0< y^{\Upsilon} <3.5$ and $3.5< y^{\Upsilon} <4.5$ are shown with red circles, blue squares and green diamonds, respectively. The vertical inner error bars indicate the statistical uncertainty, whilst the outer error bars indicate the sum of the statistical and systematic uncertainties added in quadrature. The horizontal error bars indicate the bin width. Some data points are displaced from the bin centers to improve visibility. |
Fig_6.pdf [138 KiB] HiDef png [461 KiB] Thumbnail [419 KiB] *.C file tex code |
|
|
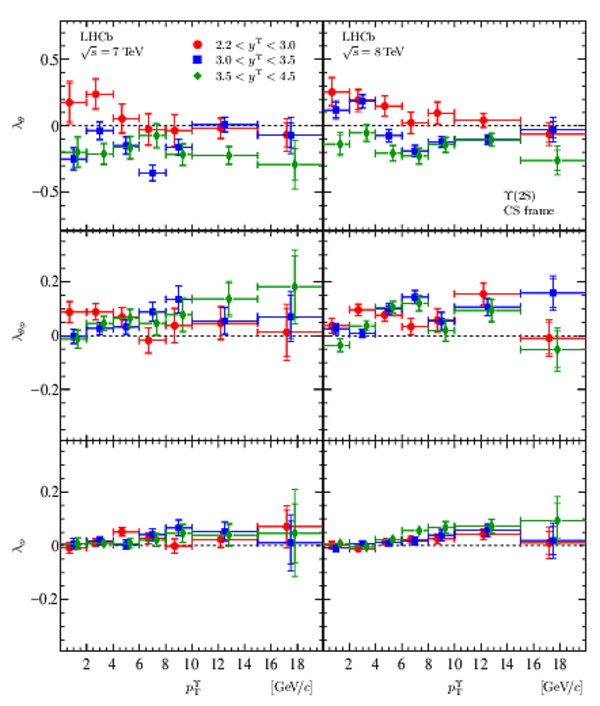
The polarization parameters (top) $\uplambda_{\theta}$, (middle) $\uplambda_{\theta\phi}$ and (bottom) $\uplambda_{\phi}$, measured in the CS frame for the $\Upsilon(2\mathrm{S})$ state in different bins of $ p^{\Upsilon}_{\mathrm{T}}$ and three rapidity ranges, for data collected at (left) $\sqrt{s} =7 \mathrm{TeV}$ and (right) $\sqrt{s} =8 \mathrm{TeV}$. The results for the rapidity ranges $2.2< y^{\Upsilon} <3.0$, $3.0< y^{\Upsilon} <3.5$ and $3.5< y^{\Upsilon} <4.5$ are shown with red circles, blue squares and green diamonds, respectively. The vertical inner error bars indicate the statistical uncertainty, whilst the outer error bars indicate the sum of the statistical and systematic uncertainties added in quadrature. The horizontal error bars indicate the bin width. Some data points are displaced from the bin centers to improve visibility. |
Fig_7.pdf [138 KiB] HiDef png [433 KiB] Thumbnail [399 KiB] *.C file tex code |
|
|
The polarization parameters (top) $\uplambda_{\theta}$, (middle) $\uplambda_{\theta\phi}$ and (bottom) $\uplambda_{\phi}$, measured in the GJ frame for the $\Upsilon(2\mathrm{S})$ state in different bins of $ p^{\Upsilon}_{\mathrm{T}}$ and three rapidity ranges, for data collected at (left) $\sqrt{s} =7 \mathrm{TeV}$ and (right) $\sqrt{s} =8 \mathrm{TeV}$. The results for the rapidity ranges $2.2< y^{\Upsilon} <3.0$, $3.0< y^{\Upsilon} <3.5$ and $3.5< y^{\Upsilon} <4.5$ are shown with red circles, blue squares and green diamonds, respectively. The vertical inner error bars indicate the statistical uncertainty, whilst the outer error bars indicate the sum of the statistical and systematic uncertainties added in quadrature. The horizontal error bars indicate the bin width. Some data points are displaced from the bin centers to improve visibility. |
Fig_8.pdf [138 KiB] HiDef png [446 KiB] Thumbnail [406 KiB] *.C file tex code |
|
|
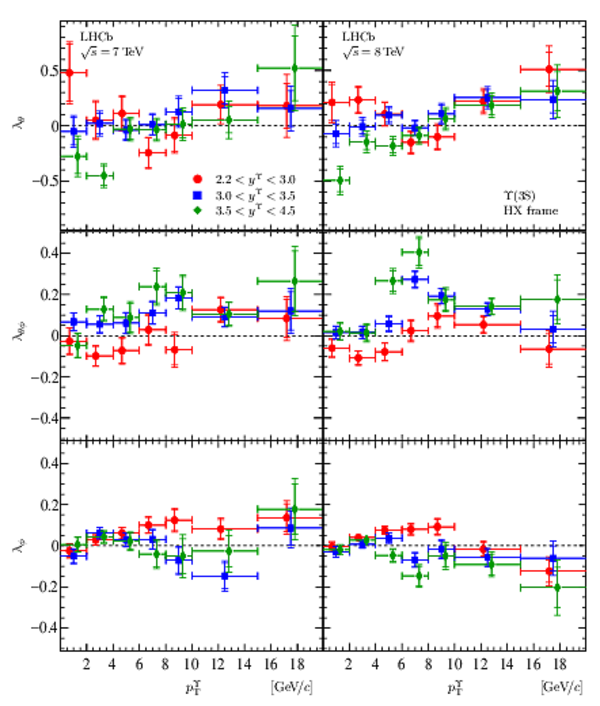
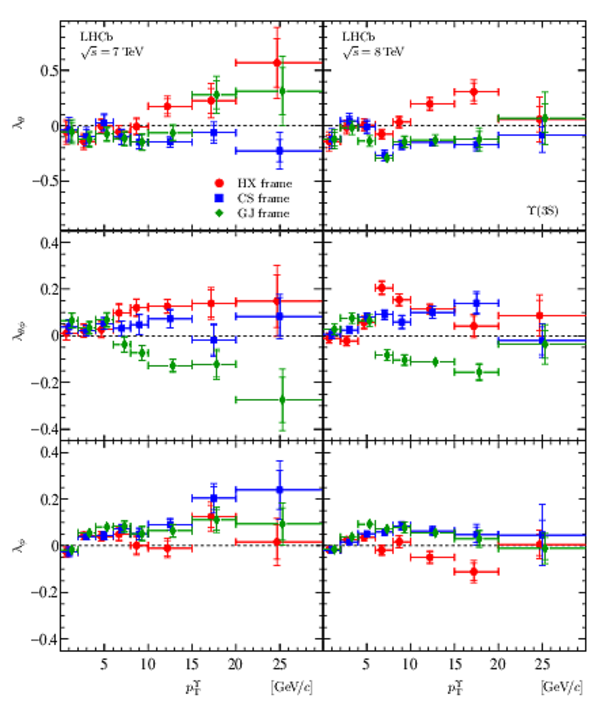
The polarization parameters (top) $\uplambda_{\theta}$, (middle) $\uplambda_{\theta\phi}$ and (bottom) $\uplambda_{\phi}$, measured in the HX frame for the $\Upsilon(3\mathrm{S})$ state in different bins of $ p^{\Upsilon}_{\mathrm{T}}$ and three rapidity ranges, for data collected at (left) $\sqrt{s} =7 \mathrm{TeV}$ and (right) $\sqrt{s} =8 \mathrm{TeV}$. The results for the rapidity ranges $2.2< y^{\Upsilon} <3.0$, $3.0< y^{\Upsilon} <3.5$ and $3.5< y^{\Upsilon} <4.5$ are shown with red circles, blue squares and green diamonds, respectively. The vertical inner error bars indicate the statistical uncertainty, whilst the outer error bars indicate the sum of the statistical and systematic uncertainties added in quadrature. The horizontal error bars indicate the bin width. Some data points are displaced from the bin centers to improve visibility. |
Fig_9.pdf [139 KiB] HiDef png [485 KiB] Thumbnail [444 KiB] *.C file tex code |
|
|
The polarization parameters $\uplambda_{\theta}$ (top), $\uplambda_{\theta\phi}$ (middle) and $\uplambda_{\phi}$ (bottom), measured in the CS frame for the $\Upsilon(3\mathrm{S})$ state in different bins of $ p^{\Upsilon}_{\mathrm{T}}$ and three rapidity ranges, for data collected at $\sqrt{s} =7 \mathrm{TeV}$ (left) and $\sqrt{s} =8 \mathrm{TeV}$ (right). The results for the rapidity ranges $2.2< y^{\Upsilon} <3.0$, $3.0< y^{\Upsilon} <3.5$ and $3.5< y^{\Upsilon} <4.5$ are shown with red circles, blue squares and green diamonds, respectively. The vertical inner error bars indicate the statistical uncertainty, whilst the outer error bars indicate the sum of the statistical and systematic uncertainties added in quadrature. The horizontal error bars indicate the bin width. Some data points are displaced from the bin centers to improve visibility. |
Fig_10.pdf [139 KiB] HiDef png [448 KiB] Thumbnail [416 KiB] *.C file tex code |

|
|
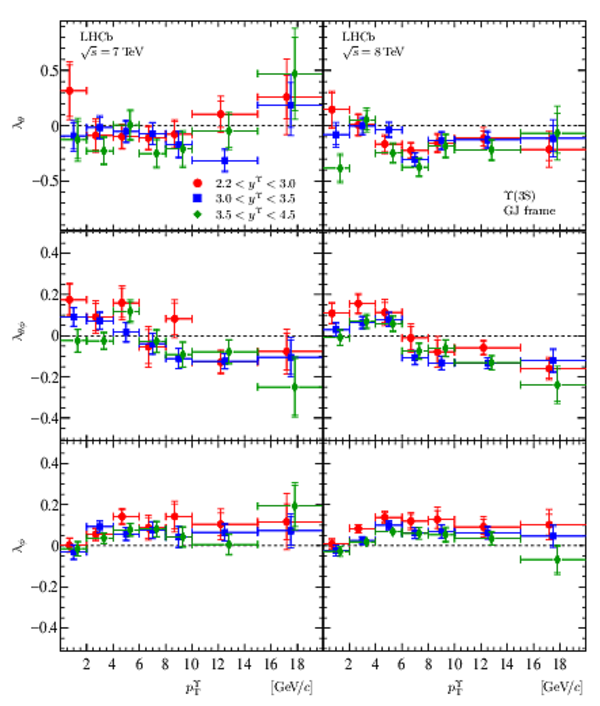
The polarization parameters $\uplambda_{\theta}$ (top), $\uplambda_{\theta\phi}$ (middle) and $\uplambda_{\phi}$ (bottom), measured in the GJ frame for the $\Upsilon(3\mathrm{S})$ state in different bins of $ p^{\Upsilon}_{\mathrm{T}}$ and three rapidity ranges, for data collected at $\sqrt{s} =7 \mathrm{TeV}$ (left) and $\sqrt{s} =8 \mathrm{TeV}$ (right). The results for the rapidity ranges $2.2< y^{\Upsilon} <3.0$, $3.0< y^{\Upsilon} <3.5$ and $3.5< y^{\Upsilon} <4.5$ are shown with red circles, blue squares and green diamonds, respectively. The vertical inner error bars indicate the statistical uncertainty, whilst the outer error bars indicate the sum of the statistical and systematic uncertainties added in quadrature. The horizontal error bars indicate the bin width. Some data points are displaced from the bin centers to improve visibility. |
Fig_11.pdf [139 KiB] HiDef png [469 KiB] Thumbnail [431 KiB] *.C file tex code |
|
|
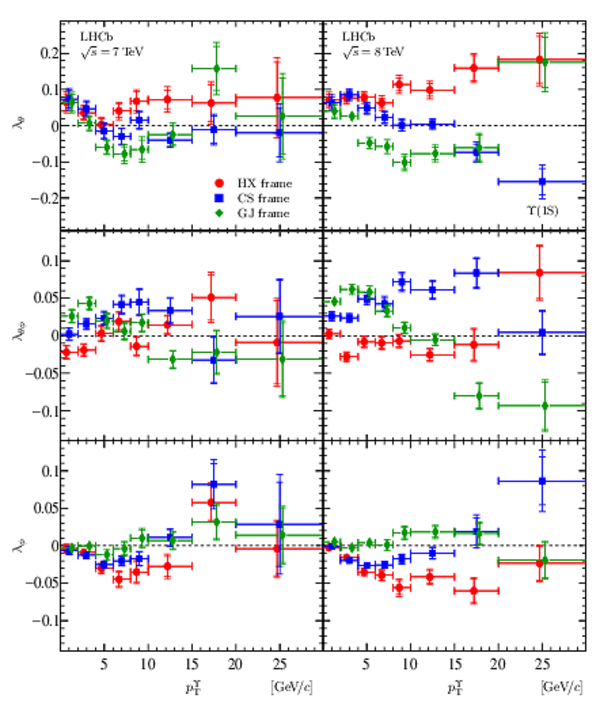
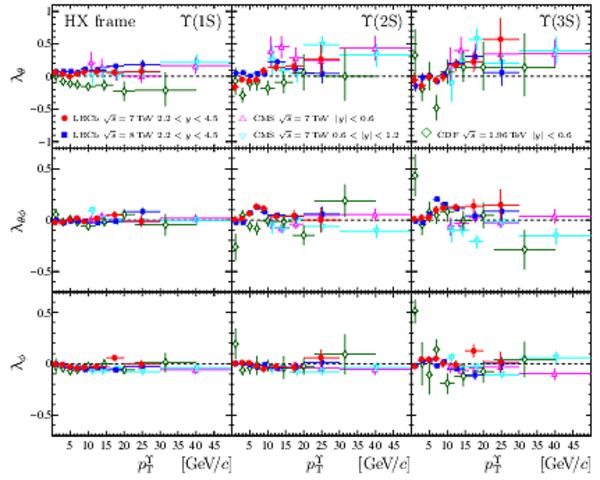
The polarization parameters (top) $\uplambda_{\theta}$, (middle) $\uplambda_{\theta\phi}$ and (bottom) $\uplambda_{\phi}$, for $\Upsilon(1\mathrm{S})$ mesons as a function of $ p^{\Upsilon}_{\mathrm{T}}$ , for the rapidity range $2.2< y^{\Upsilon} <4.5$, for data collected at (left) $\sqrt{s} =7 \mathrm{TeV}$ and (right) $\sqrt{s} =8 \mathrm{TeV}$. The results for the HX, CS and GJ frames are shown with red circles, blue squares and green diamonds, respectively. The inner error bars indicate the statistical uncertainty, whilst the outer error bars indicate the sum of the statistical and systematic uncertainties added in quadrature. Some data points are displaced from the bin centers to improve visibility. |
Fig_12.pdf [132 KiB] HiDef png [486 KiB] Thumbnail [442 KiB] *.C file tex code |
|
|
The polarization parameters (top) $\uplambda_{\theta}$, (middle) $\uplambda_{\theta\phi}$ and (bottom) $\uplambda_{\phi}$, for $\Upsilon(2\mathrm{S})$ mesons as a function of $ p^{\Upsilon}_{\mathrm{T}}$ , for the rapidity range $2.2< y^{\Upsilon} <4.5$, for data collected at (left) $\sqrt{s} =7 \mathrm{TeV}$ and (right) $\sqrt{s} =8 \mathrm{TeV}$. The results for the HX, CS and GJ frames are shown with red circles, blue squares and green diamonds, respectively. The inner error bars indicate the statistical uncertainty, whilst the outer error bars indicate the sum of the statistical and systematic uncertainties added in quadrature. Some data points are displaced from the bin centers to improve visibility. |
Fig_13.pdf [131 KiB] HiDef png [444 KiB] Thumbnail [391 KiB] *.C file tex code |

|
|
The polarization parameters (top) $\uplambda_{\theta}$, (middle) $\uplambda_{\theta\phi}$ and (bottom) $\uplambda_{\phi}$, for $\Upsilon(3\mathrm{S})$ mesons as a function of $ p^{\Upsilon}_{\mathrm{T}}$ , for the rapidity range $2.2< y^{\Upsilon} <4.5$, for data collected at (left) $\sqrt{s} =7 \mathrm{TeV}$ and (right) $\sqrt{s} =8 \mathrm{TeV}$. The results for the HX, CS and GJ frames are shown with red circles, blue squares and green diamonds, respectively. The inner error bars indicate the statistical uncertainty, whilst the outer error bars indicate the sum of the statistical and systematic uncertainties added in quadrature. Some data points are displaced from the bin centers to improve visibility. |
Fig_14.pdf [131 KiB] HiDef png [435 KiB] Thumbnail [387 KiB] *.C file tex code |
|
|
The polarization parameter $\tilde\uplambda$ for (top) $\Upsilon(1\mathrm{S})$ mesons, (middle) $\Upsilon(2\mathrm{S})$ mesons and (bottom) $\Upsilon(3\mathrm{S})$ mesons as a function of $ p^{\Upsilon}_{\mathrm{T}}$ , for the rapidity range $2.2< y^{\Upsilon} <4.5$, for data collected at (left) $\sqrt{s} =7 \mathrm{TeV}$ and (right) $\sqrt{s} =8 \mathrm{TeV}$. The results for the HX, CS and GJ frames are shown with red circles, blue squares and green diamonds, respectively. The inner error bars indicate the statistical uncertainty, whilst the outer error bars indicate the sum of the statistical and systematic uncertainties added in quadrature. Some data points are displaced from the bin centers to improve visibility. |
Fig_15.pdf [126 KiB] HiDef png [415 KiB] Thumbnail [346 KiB] *.C file tex code |

|
|
Animated gif made out of all figures. |
PAPER-2017-028.gif Thumbnail |

|
Tables and captions
|
Ranges of the absolute systematic uncertainties of the parameters $\pmb{\uplambda}$ and $\tilde{\uplambda}$. The ranges indicate variations depending on the $\left( p^{\Upsilon}_{\mathrm{T}} , y^{\Upsilon} \right)$ bin and frame. |
Table_1.pdf [100 KiB] HiDef png [153 KiB] Thumbnail [67 KiB] tex code |

|
|
Values of $\uplambda_{\theta}$, $\uplambda_{\theta\phi}$, $\uplambda_{\phi}$ and $\tilde \uplambda$ measured in the HX frame for the $\Upsilon(1\mathrm{S})$ produced at $\sqrt{s}=7 {\mathrm{TeV}}$. The first uncertainty is statistical and the second systematic. |
Table_2.pdf [58 KiB] HiDef png [302 KiB] Thumbnail [141 KiB] tex code |

|
|
Values of $\uplambda_{\theta}$, $\uplambda_{\theta\phi}$, $\uplambda_{\phi}$ and $\tilde \uplambda$ measured in the HX frame for the $\Upsilon(1\mathrm{S})$ produced at $\sqrt{s}=8 {\mathrm{TeV}}$. The first uncertainty is statistical and the second systematic. |
Table_3.pdf [58 KiB] HiDef png [300 KiB] Thumbnail [140 KiB] tex code |

|
|
Values of $\uplambda_{\theta}$, $\uplambda_{\theta\phi}$, $\uplambda_{\phi}$ and $\tilde \uplambda$ measured in the CS frame for the $\Upsilon(1\mathrm{S})$ produced at $\sqrt{s}=7 {\mathrm{TeV}}$. The first uncertainty is statistical and the second systematic. |
Table_4.pdf [58 KiB] HiDef png [303 KiB] Thumbnail [141 KiB] tex code |

|
|
Values of $\uplambda_{\theta}$, $\uplambda_{\theta\phi}$, $\uplambda_{\phi}$ and $\tilde \uplambda$ measured in the CS frame for the $\Upsilon(1\mathrm{S})$ produced at $\sqrt{s}=8 {\mathrm{TeV}}$. The first uncertainty is statistical and the second systematic. |
Table_5.pdf [58 KiB] HiDef png [301 KiB] Thumbnail [140 KiB] tex code |

|
|
Values of $\uplambda_{\theta}$, $\uplambda_{\theta\phi}$, $\uplambda_{\phi}$ and $\tilde \uplambda$ measured in the GJ frame for the $\Upsilon(1\mathrm{S})$ produced at $\sqrt{s}=7 {\mathrm{TeV}}$. The first uncertainty is statistical and the second systematic. |
Table_6.pdf [58 KiB] HiDef png [301 KiB] Thumbnail [140 KiB] tex code |

|
|
Values of $\uplambda_{\theta}$, $\uplambda_{\theta\phi}$, $\uplambda_{\phi}$ and $\tilde \uplambda$ measured in the GJ frame for the $\Upsilon(1\mathrm{S})$ produced at $\sqrt{s}=8 {\mathrm{TeV}}$. The first uncertainty is statistical and the second systematic. |
Table_7.pdf [58 KiB] HiDef png [300 KiB] Thumbnail [140 KiB] tex code |

|
|
Values of $\uplambda_{\theta}$, $\uplambda_{\theta\phi}$ and $\uplambda_{\phi}$ measured in the HX, CS and GJ frames for the $\Upsilon(1\mathrm{S})$ produced at $\sqrt{s}=7 {\mathrm{TeV}}$ in the rapidity range $2.2< y^{\Upsilon} <4.5$. The first uncertainty is statistical and the second systematic. |
Table_8.pdf [58 KiB] HiDef png [252 KiB] Thumbnail [118 KiB] tex code |

|
|
Values of $\uplambda_{\theta}$, $\uplambda_{\theta\phi}$ and $\uplambda_{\phi}$ measured in the HX, CS and GJ frames for the $\Upsilon(1\mathrm{S})$ produced at $\sqrt{s}=8 {\mathrm{TeV}}$ in the rapidity range $2.2< y^{\Upsilon} <4.5$. The first uncertainty is statistical and the second systematic. |
Table_9.pdf [58 KiB] HiDef png [252 KiB] Thumbnail [118 KiB] tex code |

|
|
Values of $\tilde \uplambda$ measured in the HX, CS and GJ frames for the $\Upsilon(1\mathrm{S})$ produced at $\sqrt{s}=7$ and $8 {\mathrm{TeV}}$ in the rapidity range $2.2< y^{\Upsilon} <4.5$. The first uncertainty is statistical and the second systematic. |
Table_10.pdf [52 KiB] HiDef png [212 KiB] Thumbnail [98 KiB] tex code |

|
|
Values of $\uplambda_{\theta}$, $\uplambda_{\theta\phi}$, $\uplambda_{\phi}$ and $\tilde \uplambda$ measured in the HX frame for the $\Upsilon(2\mathrm{S})$ produced at $\sqrt{s}=7 {\mathrm{TeV}}$. The first uncertainty is statistical and the second systematic. |
Table_11.pdf [58 KiB] HiDef png [298 KiB] Thumbnail [140 KiB] tex code |

|
|
Values of $\uplambda_{\theta}$, $\uplambda_{\theta\phi}$, $\uplambda_{\phi}$ and $\tilde \uplambda$ measured in the HX frame for the $\Upsilon(2\mathrm{S})$ produced at $\sqrt{s}=8 {\mathrm{TeV}}$. The first uncertainty is statistical and the second systematic. |
Table_12.pdf [58 KiB] HiDef png [301 KiB] Thumbnail [141 KiB] tex code |

|
|
Values of $\uplambda_{\theta}$, $\uplambda_{\theta\phi}$, $\uplambda_{\phi}$ and $\tilde \uplambda$ measured in the CS frame for the $\Upsilon(2\mathrm{S})$ produced at $\sqrt{s}=7 {\mathrm{TeV}}$. The first uncertainty is statistical and the second systematic. |
Table_13.pdf [58 KiB] HiDef png [300 KiB] Thumbnail [140 KiB] tex code |

|
|
Values of $\uplambda_{\theta}$, $\uplambda_{\theta\phi}$, $\uplambda_{\phi}$ and $\tilde \uplambda$ measured in the CS frame for the $\Upsilon(2\mathrm{S})$ produced at $\sqrt{s}=8 {\mathrm{TeV}}$. The first uncertainty is statistical and the second systematic. |
Table_14.pdf [58 KiB] HiDef png [300 KiB] Thumbnail [140 KiB] tex code |

|
|
Values of $\uplambda_{\theta}$, $\uplambda_{\theta\phi}$, $\uplambda_{\phi}$ and $\tilde \uplambda$ measured in the GJ frame for the $\Upsilon(2\mathrm{S})$ produced at $\sqrt{s}=7 {\mathrm{TeV}}$. The first uncertainty is statistical and the second systematic. |
Table_15.pdf [58 KiB] HiDef png [299 KiB] Thumbnail [141 KiB] tex code |

|
|
Values of $\uplambda_{\theta}$, $\uplambda_{\theta\phi}$, $\uplambda_{\phi}$ and $\tilde \uplambda$ measured in the GJ frame for the $\Upsilon(2\mathrm{S})$ produced at $\sqrt{s}=8 {\mathrm{TeV}}$. The first uncertainty is statistical and the second systematic. |
Table_16.pdf [58 KiB] HiDef png [301 KiB] Thumbnail [141 KiB] tex code |

|
|
Values of $\uplambda_{\theta}$, $\uplambda_{\theta\phi}$ and $\uplambda_{\phi}$ measured in the HX, CS and GJ frames for the $\Upsilon(2\mathrm{S})$ produced at $\sqrt{s}=7 {\mathrm{TeV}}$ in the rapidity range $2.2< y^{\Upsilon} <4.5$. The first uncertainty is statistical and the second systematic. |
Table_17.pdf [58 KiB] HiDef png [251 KiB] Thumbnail [119 KiB] tex code |

|
|
Values of $\uplambda_{\theta}$, $\uplambda_{\theta\phi}$ and $\uplambda_{\phi}$ measured in the HX, CS and GJ frames for the $\Upsilon(2\mathrm{S})$ produced at $\sqrt{s}=8 {\mathrm{TeV}}$ in the rapidity range $2.2< y^{\Upsilon} <4.5$. The first uncertainty is statistical and the second systematic. |
Table_18.pdf [58 KiB] HiDef png [252 KiB] Thumbnail [119 KiB] tex code |

|
|
Values of $\tilde \uplambda$ measured in the HX, CS and GJ frames for the $\Upsilon(2\mathrm{S})$ produced at $\sqrt{s}=7$ and $8 {\mathrm{TeV}}$ in the rapidity range $2.2< y^{\Upsilon} <4.5$. The first uncertainty is statistical and the second systematic. |
Table_19.pdf [52 KiB] HiDef png [216 KiB] Thumbnail [99 KiB] tex code |

|
|
Values of $\uplambda_{\theta}$, $\uplambda_{\theta\phi}$, $\uplambda_{\phi}$ and $\tilde \uplambda$ measured in the HX frame for the $\Upsilon(3\mathrm{S})$ produced at $\sqrt{s}=7 {\mathrm{TeV}}$. The first uncertainty is statistical and the second systematic. |
Table_20.pdf [58 KiB] HiDef png [298 KiB] Thumbnail [140 KiB] tex code |

|
|
Values of $\uplambda_{\theta}$, $\uplambda_{\theta\phi}$, $\uplambda_{\phi}$ and $\tilde \uplambda$ measured in the HX frame for the $\Upsilon(3\mathrm{S})$ produced at $\sqrt{s}=8 {\mathrm{TeV}}$. The first uncertainty is statistical and the second systematic. |
Table_21.pdf [58 KiB] HiDef png [300 KiB] Thumbnail [141 KiB] tex code |

|
|
Values of $\uplambda_{\theta}$, $\uplambda_{\theta\phi}$, $\uplambda_{\phi}$ and $\tilde \uplambda$ measured in the CS frame for the $\Upsilon(3\mathrm{S})$ produced at $\sqrt{s}=7 {\mathrm{TeV}}$. The first uncertainty is statistical and the second systematic. |
Table_22.pdf [58 KiB] HiDef png [296 KiB] Thumbnail [140 KiB] tex code |

|
|
Values of $\uplambda_{\theta}$, $\uplambda_{\theta\phi}$, $\uplambda_{\phi}$ and $\tilde \uplambda$ measured in the CS frame for the $\Upsilon(3\mathrm{S})$ produced at $\sqrt{s}=8 {\mathrm{TeV}}$. The first uncertainty is statistical and the second systematic. |
Table_23.pdf [58 KiB] HiDef png [298 KiB] Thumbnail [140 KiB] tex code |

|
|
Values of $\uplambda_{\theta}$, $\uplambda_{\theta\phi}$, $\uplambda_{\phi}$ and $\tilde \uplambda$ measured in the GJ frame for the $\Upsilon(3\mathrm{S})$ produced at $\sqrt{s}=7 {\mathrm{TeV}}$. The first uncertainty is statistical and the second systematic. |
Table_24.pdf [58 KiB] HiDef png [296 KiB] Thumbnail [140 KiB] tex code |

|
|
Values of $\uplambda_{\theta}$, $\uplambda_{\theta\phi}$, $\uplambda_{\phi}$ and $\tilde \uplambda$ measured in the GJ frame for the $\Upsilon(3\mathrm{S})$ produced at $\sqrt{s}=8 {\mathrm{TeV}}$. The first uncertainty is statistical and the second systematic. |
Table_25.pdf [58 KiB] HiDef png [297 KiB] Thumbnail [140 KiB] tex code |

|
|
Values of $\uplambda_{\theta}$, $\uplambda_{\theta\phi}$ and $\uplambda_{\phi}$ measured in the HX, CS and GJ frames for the $\Upsilon(3\mathrm{S})$ produced at $\sqrt{s}=7 {\mathrm{TeV}}$ in the rapidity range $2.2< y^{\Upsilon} <4.5$. The first uncertainty is statistical and the second systematic. |
Table_26.pdf [58 KiB] HiDef png [253 KiB] Thumbnail [119 KiB] tex code |

|
|
Values of $\uplambda_{\theta}$, $\uplambda_{\theta\phi}$ and $\uplambda_{\phi}$ measured in the HX, CS and GJ frames for the $\Upsilon(3\mathrm{S})$ produced at $\sqrt{s}=8 {\mathrm{TeV}}$ in the rapidity range $2.2< y^{\Upsilon} <4.5$. The first uncertainty is statistical and the second systematic. |
Table_27.pdf [58 KiB] HiDef png [248 KiB] Thumbnail [119 KiB] tex code |

|
|
Values of $\tilde \uplambda$ measured in the HX, CS and GJ frames for the $\Upsilon(3\mathrm{S})$ produced at $\sqrt{s}=7$ and $8 {\mathrm{TeV}}$ in the rapidity range $2.2< y^{\Upsilon} <4.5$. The first uncertainty is statistical and the second systematic. |
Table_28.pdf [52 KiB] HiDef png [212 KiB] Thumbnail [99 KiB] tex code |

|
Supplementary Material [file]


![HiDef png [232 KiB]](Directory_LHCb-PAPER-2017-028/hidef_Fig_1.png)
![HiDef png [99 KiB]](Directory_LHCb-PAPER-2017-028/hidef_Fig_2.png)
![HiDef png [462 KiB]](Directory_LHCb-PAPER-2017-028/hidef_Fig_3.png)
![HiDef png [435 KiB]](Directory_LHCb-PAPER-2017-028/hidef_Fig_4.png)
![HiDef png [452 KiB]](Directory_LHCb-PAPER-2017-028/hidef_Fig_5.png)
![HiDef png [461 KiB]](Directory_LHCb-PAPER-2017-028/hidef_Fig_6.png)
![HiDef png [433 KiB]](Directory_LHCb-PAPER-2017-028/hidef_Fig_7.png)
![HiDef png [446 KiB]](Directory_LHCb-PAPER-2017-028/hidef_Fig_8.png)
![HiDef png [485 KiB]](Directory_LHCb-PAPER-2017-028/hidef_Fig_9.png)
![HiDef png [448 KiB]](Directory_LHCb-PAPER-2017-028/hidef_Fig_10.png)
![HiDef png [469 KiB]](Directory_LHCb-PAPER-2017-028/hidef_Fig_11.png)
![HiDef png [486 KiB]](Directory_LHCb-PAPER-2017-028/hidef_Fig_12.png)
![HiDef png [444 KiB]](Directory_LHCb-PAPER-2017-028/hidef_Fig_13.png)
![HiDef png [435 KiB]](Directory_LHCb-PAPER-2017-028/hidef_Fig_14.png)
![HiDef png [415 KiB]](Directory_LHCb-PAPER-2017-028/hidef_Fig_15.png)
![HiDef png [153 KiB]](Directory_LHCb-PAPER-2017-028/hidef_Table_1.png)
![HiDef png [302 KiB]](Directory_LHCb-PAPER-2017-028/hidef_Table_2.png)
![HiDef png [300 KiB]](Directory_LHCb-PAPER-2017-028/hidef_Table_3.png)
![HiDef png [303 KiB]](Directory_LHCb-PAPER-2017-028/hidef_Table_4.png)
![HiDef png [301 KiB]](Directory_LHCb-PAPER-2017-028/hidef_Table_5.png)
![HiDef png [301 KiB]](Directory_LHCb-PAPER-2017-028/hidef_Table_6.png)
![HiDef png [300 KiB]](Directory_LHCb-PAPER-2017-028/hidef_Table_7.png)
![HiDef png [252 KiB]](Directory_LHCb-PAPER-2017-028/hidef_Table_8.png)
![HiDef png [252 KiB]](Directory_LHCb-PAPER-2017-028/hidef_Table_9.png)
![HiDef png [212 KiB]](Directory_LHCb-PAPER-2017-028/hidef_Table_10.png)
![HiDef png [298 KiB]](Directory_LHCb-PAPER-2017-028/hidef_Table_11.png)
![HiDef png [301 KiB]](Directory_LHCb-PAPER-2017-028/hidef_Table_12.png)
![HiDef png [300 KiB]](Directory_LHCb-PAPER-2017-028/hidef_Table_13.png)
![HiDef png [300 KiB]](Directory_LHCb-PAPER-2017-028/hidef_Table_14.png)
![HiDef png [299 KiB]](Directory_LHCb-PAPER-2017-028/hidef_Table_15.png)
![HiDef png [301 KiB]](Directory_LHCb-PAPER-2017-028/hidef_Table_16.png)
![HiDef png [251 KiB]](Directory_LHCb-PAPER-2017-028/hidef_Table_17.png)
![HiDef png [252 KiB]](Directory_LHCb-PAPER-2017-028/hidef_Table_18.png)
![HiDef png [216 KiB]](Directory_LHCb-PAPER-2017-028/hidef_Table_19.png)
![HiDef png [298 KiB]](Directory_LHCb-PAPER-2017-028/hidef_Table_20.png)
![HiDef png [300 KiB]](Directory_LHCb-PAPER-2017-028/hidef_Table_21.png)
![HiDef png [296 KiB]](Directory_LHCb-PAPER-2017-028/hidef_Table_22.png)
![HiDef png [298 KiB]](Directory_LHCb-PAPER-2017-028/hidef_Table_23.png)
![HiDef png [296 KiB]](Directory_LHCb-PAPER-2017-028/hidef_Table_24.png)
![HiDef png [297 KiB]](Directory_LHCb-PAPER-2017-028/hidef_Table_25.png)
![HiDef png [253 KiB]](Directory_LHCb-PAPER-2017-028/hidef_Table_26.png)
![HiDef png [248 KiB]](Directory_LHCb-PAPER-2017-028/hidef_Table_27.png)
![HiDef png [212 KiB]](Directory_LHCb-PAPER-2017-028/hidef_Table_28.png)
![HiDef png [493 KiB]](Directory_LHCb-PAPER-2017-028/supplementary/hidef_Fig1_supp.png)
![HiDef png [381 KiB]](Directory_LHCb-PAPER-2017-028/supplementary/hidef_Fig2_supp.png)
![HiDef png [379 KiB]](Directory_LHCb-PAPER-2017-028/supplementary/hidef_Fig3_supp.png)
![HiDef png [165 KiB]](Directory_LHCb-PAPER-2017-028/supplementary/hidef_Fig4a_supp.png)
![HiDef png [179 KiB]](Directory_LHCb-PAPER-2017-028/supplementary/hidef_Fig4b_supp.png)
![HiDef png [251 KiB]](Directory_LHCb-PAPER-2017-028/supplementary/hidef_Fig4c_supp.png)
![HiDef png [519 KiB]](Directory_LHCb-PAPER-2017-028/supplementary/hidef_Figure1_supp.png)
![HiDef png [474 KiB]](Directory_LHCb-PAPER-2017-028/supplementary/hidef_Figure2_supp.png)
![HiDef png [471 KiB]](Directory_LHCb-PAPER-2017-028/supplementary/hidef_Figure3_supp.png)
![HiDef png [315 KiB]](Directory_LHCb-PAPER-2017-028/supplementary/hidef_Figure4_supp.png)
Created on 26 April 2024.