First measurement of the $C P$-violating phase in ${{B} ^0_{s}} \rightarrow {{J /\psi }} (\rightarrow e ^+e ^-$)$\phi $ decays
[to restricted-access page]Information
LHCb-PAPER-2020-042
CERN-EP-2021-064
arXiv:2105.14738 [PDF]
(Submitted on 31 May 2021)
Eur. Phys. J. C81 (2021) 1026
Inspire 1866123
Tools
Abstract
A flavour-tagged time-dependent angular analysis of $B^0_s\to J/\psi\phi$ decays is presented where the $J/\psi$ meson is reconstructed through its decay to an $e^+e^-$ pair. The analysis uses a sample of $pp$ collision data recorded with the LHCb experiment at centre-of-mass energies of 7 and 8 TeV, corresponding to an integrated luminosity of 3 fb$^{-1}$. The $CP$-violating phase and lifetime parameters of the $B^0_s$ system are measured to be $\phi_s=0.00\pm0.28\pm0.07$ rad, $\Delta\Gamma_s=0.115\pm0.045\pm0.011$ ps$^{-1}$ and $\Gamma_s=0.608\pm0.018\pm0.012$ ps$^{-1}$ where the first uncertainty is statistical and the second systematic. This is the first time that $CP$-violating parameters are measured in the $B^0_s\to J/\psi\phi$ decay with an $e^+e^-$ pair in the final state. The results are consistent with previous measurements in other channels and with the Standard Model predictions.
Figures and captions
|
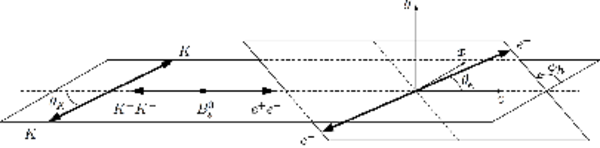
Definition of the angles in the helicity basis. The polar angle $\theta_K$ $(\theta_e)$ is the angle between the $ K ^+$ ( $ e ^+$ ) momentum and the direction opposite to the $ B ^0_ s $ momentum in the $ K ^+$ $ K ^-$ ( $ e ^+ e ^-$ ) centre-of-mass system, and the $\phi_h$ is the azimuthal angle between the $ K ^+$ $ K ^-$ and $ e ^+ e ^-$ decay planes. |
Fig1.pdf [151 KiB] HiDef png [81 KiB] Thumbnail [63 KiB] *.C file |
|
|
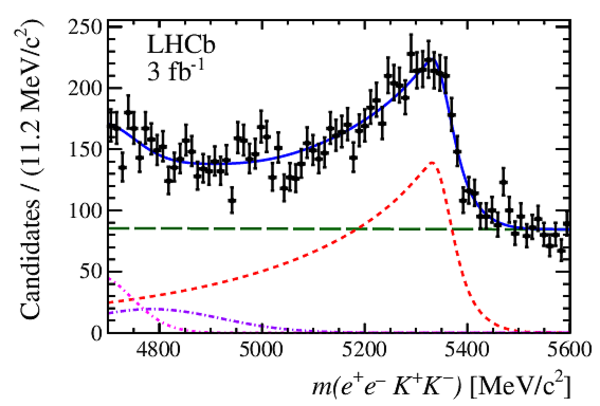
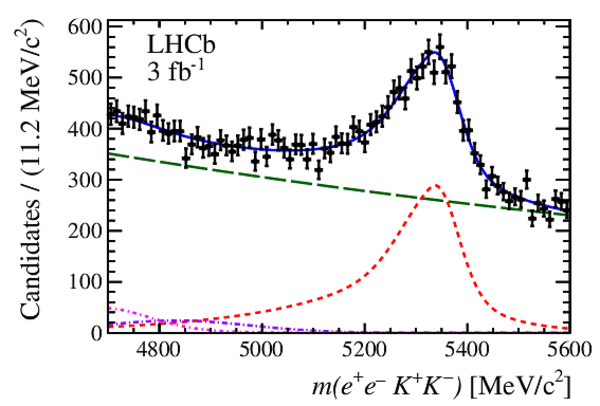
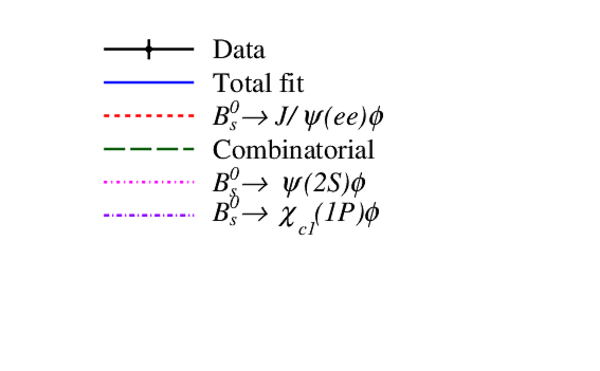
Distribution of $m( e ^+ e ^- K ^+ K ^- )$ for selected $ B ^0_ s \rightarrow { J \mskip -3mu/\mskip -2mu\psi } \phi $ candidates divided into three categories: (a) zero, (b) one and (c) both electrons with bremsstrahlung correction. The blue solid line shows the total fit which is composed of (red short-dashed line) the signal and the background contributions. The combinatorial background is indicated by the green long-dashed line while the partially reconstructed background from the $ B ^0_ s \rightarrow \psi {(2S)} \phi $ and $ B ^0_ s \rightarrow \chi _{ c 1} (1P)\phi $ decays are indicated by pink and purple dash-dotted lines, respectively. |
Fig2a.pdf [26 KiB] HiDef png [244 KiB] Thumbnail [221 KiB] *.C file |
|
|
Fig2b.pdf [27 KiB] HiDef png [263 KiB] Thumbnail [224 KiB] *.C file |
|
|
|
Fig2c.pdf [27 KiB] HiDef png [266 KiB] Thumbnail [233 KiB] *.C file |

|
|
|
Fig2d.pdf [9 KiB] HiDef png [82 KiB] Thumbnail [72 KiB] *.C file |
|
|
|
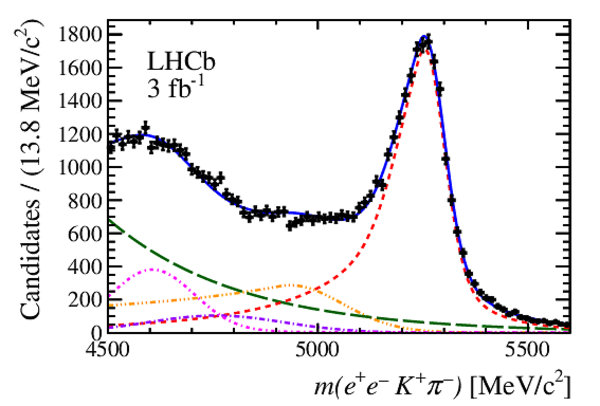
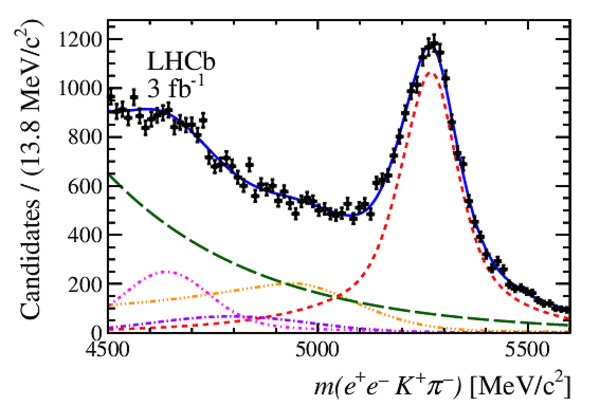
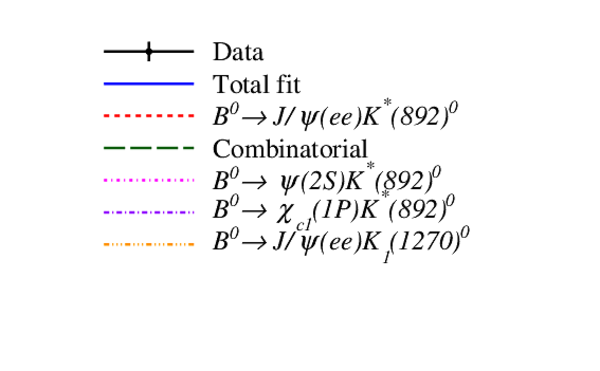
Distribution of $m( e ^+ e ^- K ^+ \pi ^- )$ for selected $ B ^0 \rightarrow { J \mskip -3mu/\mskip -2mu\psi } K ^* (892)^0$ candidates divided into three categories: (a) zero, (b) one and (c) both electrons with bremsstrahlung correction. The blue solid line shows the total fit which is composed of (red short-dashed line) the signal and the background contributions. The combinatorial background is indicated by the green long-dashed line while the partially reconstructed background from the $ B ^0 \rightarrow \psi {(2S)} K ^* (892)^0$ , $ B ^0 \rightarrow \chi _{ c 1} (1P) K ^* (892)^0$ and $ B ^0 \rightarrow { J \mskip -3mu/\mskip -2mu\psi } K_1(1270)^0$ decays are indicated by pink, purple and yellow dash-dotted lines, respectively. |
Fig3a.pdf [29 KiB] HiDef png [255 KiB] Thumbnail [203 KiB] *.C file |

|
|
Fig3b.pdf [29 KiB] HiDef png [279 KiB] Thumbnail [217 KiB] *.C file |
|
|
|
Fig3c.pdf [28 KiB] HiDef png [280 KiB] Thumbnail [219 KiB] *.C file |
|
|
|
Fig3d.pdf [9 KiB] HiDef png [122 KiB] Thumbnail [108 KiB] *.C file |
|
|
|
Signal efficiency as a function of the decay time, $\varepsilon ^{ B ^0_ s }_{\mathrm{data}}(t)$, scaled by the average efficiency. |
Fig4update.pdf [16 KiB] HiDef png [84 KiB] Thumbnail [51 KiB] *.C file |

|
|
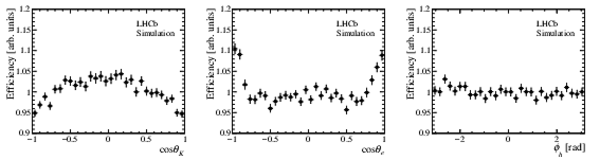
Efficiency projected onto (left) $\cos\theta_K$, (middle) $\cos\theta_e$ and (right) $\phi_h$ obtained from a simulated $ B ^0_ s \rightarrow { J \mskip -3mu/\mskip -2mu\psi } \phi $ sample, scaled by the average efficiency. |
Fig5update.pdf [22 KiB] HiDef png [99 KiB] Thumbnail [34 KiB] *.C file |
|
|
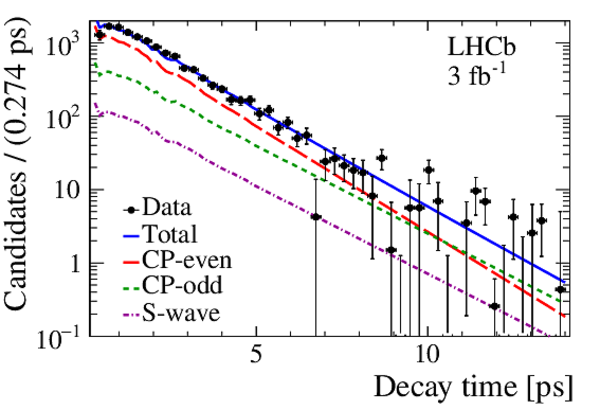
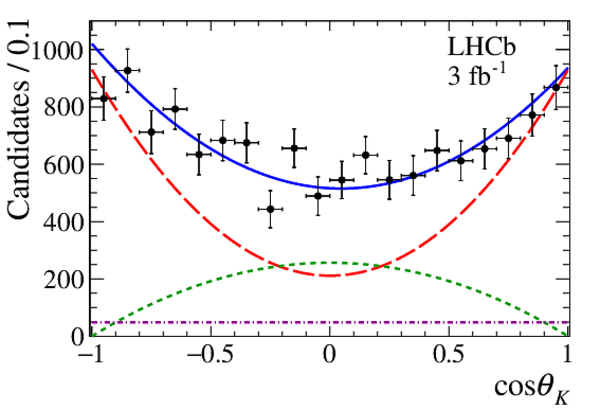
Decay time and helicity-angle distributions for (data points) $ B ^0_ s \rightarrow { J \mskip -3mu/\mskip -2mu\psi } ($ { $ e ^+ e ^-$ ) $\phi $ } decays with the one-dimensional projections of the PDF extracted in the maximum-likelihood fit. The solid blue line shows the total signal contribution, which is composed of (long-dashed red) $ C P$ -even, (short-dashed green) $ C P$ -odd and (dash-dotted purple) S-wave contributions. |
Fig6a.pdf [22 KiB] HiDef png [267 KiB] Thumbnail [215 KiB] *.C file |
|
|
Fig6b.pdf [18 KiB] HiDef png [209 KiB] Thumbnail [169 KiB] *.C file |

|
|
|
Fig6c.pdf [18 KiB] HiDef png [211 KiB] Thumbnail [173 KiB] *.C file |
|
|
|
Fig6d.pdf [13 KiB] HiDef png [195 KiB] Thumbnail [166 KiB] *.C file |

|
|
|
Animated gif made out of all figures. |
PAPER-2020-042.gif Thumbnail |

|
![HiDef png [81 KiB]](Directory_LHCb-PAPER-2020-042/hidef_Fig1.png)
![HiDef png [244 KiB]](Directory_LHCb-PAPER-2020-042/hidef_Fig2a.png)
![HiDef png [263 KiB]](Directory_LHCb-PAPER-2020-042/hidef_Fig2b.png)
![HiDef png [266 KiB]](Directory_LHCb-PAPER-2020-042/hidef_Fig2c.png)
![HiDef png [82 KiB]](Directory_LHCb-PAPER-2020-042/hidef_Fig2d.png)
![HiDef png [255 KiB]](Directory_LHCb-PAPER-2020-042/hidef_Fig3a.png)
![HiDef png [279 KiB]](Directory_LHCb-PAPER-2020-042/hidef_Fig3b.png)
![HiDef png [280 KiB]](Directory_LHCb-PAPER-2020-042/hidef_Fig3c.png)
![HiDef png [122 KiB]](Directory_LHCb-PAPER-2020-042/hidef_Fig3d.png)
![HiDef png [84 KiB]](Directory_LHCb-PAPER-2020-042/hidef_Fig4update.png)
![HiDef png [99 KiB]](Directory_LHCb-PAPER-2020-042/hidef_Fig5update.png)
![HiDef png [267 KiB]](Directory_LHCb-PAPER-2020-042/hidef_Fig6a.png)
![HiDef png [209 KiB]](Directory_LHCb-PAPER-2020-042/hidef_Fig6b.png)
![HiDef png [211 KiB]](Directory_LHCb-PAPER-2020-042/hidef_Fig6c.png)
![HiDef png [195 KiB]](Directory_LHCb-PAPER-2020-042/hidef_Fig6d.png)
Tables and captions
|
Definition of angular and time-dependent functions for $ B ^0_ s $ and $\overline{ B } {}^0_ s $ mesons. |
Table_1.pdf [71 KiB] HiDef png [81 KiB] Thumbnail [35 KiB] tex code |

|
|
Angular acceptance integrals for the simulated sample. The $I_k$ integrals are normalised with respect to the $I_0$ integral. |
Table_2.pdf [57 KiB] HiDef png [189 KiB] Thumbnail [83 KiB] tex code |

|
|
Results of the maximum-likelihood fit, described in Sec. 6, to the $ B ^0_ s \rightarrow { J \mskip -3mu/\mskip -2mu\psi } ($ { $ e ^+ e ^-$ ) $\phi $ } decays including all acceptance and resolution effects. The first uncertainty is statistical and the second is systematic. |
Table_3.pdf [71 KiB] HiDef png [140 KiB] Thumbnail [69 KiB] tex code |

|
|
Statistical and systematic uncertainties. A dash corresponds to systematic uncertainties that are negligible. Systematic uncertainties from different sources are added in quadrature. |
Table_4.pdf [75 KiB] HiDef png [111 KiB] Thumbnail [44 KiB] tex code |

|
|
Correlation matrix of statistical uncertainties. |
Table_5.pdf [64 KiB] HiDef png [56 KiB] Thumbnail [25 KiB] tex code |

|
|
Results of the maximum-likelihood fit described in Section 6 to the $ B ^0_ s \rightarrow { J \mskip -3mu/\mskip -2mu\psi } ($ { $ e ^+ e ^-$ ) $\phi $ } decays including all acceptance and resolution effects and with the mixing frequency fixed to the PDG value, $\Delta m_{ s } =17.757\text{ ps} ^{-1} $ [15]. The first uncertainty is statistical and the second is systematic, which is discussed in Section 7. |
Table_6.pdf [71 KiB] HiDef png [140 KiB] Thumbnail [69 KiB] tex code |

|
|
Correlation matrix of statistical uncertainties for a fit with fixed $\Delta m_{ s }$ . |
Table_7.pdf [64 KiB] HiDef png [55 KiB] Thumbnail [25 KiB] tex code |

|
![HiDef png [81 KiB]](Directory_LHCb-PAPER-2020-042/hidef_Table_1.png)
![HiDef png [189 KiB]](Directory_LHCb-PAPER-2020-042/hidef_Table_2.png)
![HiDef png [140 KiB]](Directory_LHCb-PAPER-2020-042/hidef_Table_3.png)
![HiDef png [111 KiB]](Directory_LHCb-PAPER-2020-042/hidef_Table_4.png)
![HiDef png [56 KiB]](Directory_LHCb-PAPER-2020-042/hidef_Table_5.png)
![HiDef png [140 KiB]](Directory_LHCb-PAPER-2020-042/hidef_Table_6.png)
![HiDef png [55 KiB]](Directory_LHCb-PAPER-2020-042/hidef_Table_7.png)
Supplementary Material [file]
| Supplementary material full pdf |
supple[..].pdf [167 KiB] |
|
|
Fig1-S.pdf [19 KiB] HiDef png [322 KiB] Thumbnail [233 KiB] *C file |

|
|
|
Fig2-S.pdf [29 KiB] HiDef png [2 MiB] Thumbnail [785 KiB] *C file |
|
![HiDef png [322 KiB]](Directory_LHCb-PAPER-2020-042/supplementary/hidef_Fig1-S.png)
![HiDef png [2 MiB]](Directory_LHCb-PAPER-2020-042/supplementary/hidef_Fig2-S.png)
Created on 27 April 2024.