

Compact Muon Solenoid
LHC, CERN
| CMS-EXO-14-004 ; CERN-EP-2016-025 | ||
| Search for dark matter particles in proton-proton collisions at $\sqrt{s} =$ 8 TeV using the razor variables | ||
| CMS Collaboration | ||
| 29 March 2016 | ||
| JHEP 12 (2016) 088 | ||
| Abstract: A search for dark matter particles directly produced in proton-proton collisions recorded by the CMS experiment at the LHC is presented. The data correspond to an integrated luminosity of 18.8 fb$^{-1}$, at a center-of-mass energy of 8 TeV. The event selection requires at least two jets and no isolated leptons. The razor variables are used to quantify the transverse momentum balance in the jet momenta. The study is performed separately for events with and without jets originating from b quarks. The observed yields are consistent with the expected backgrounds and, depending on the nature of the production mechanism, dark matter production at the LHC is excluded at 90% confidence level for a mediator mass scale $\Lambda$ below 1 TeV. The use of razor variables yields results that complement those previously published. | ||
| Links: e-print arXiv:1603.08914 [hep-ex] (PDF) ; CDS record ; inSPIRE record ; CADI line (restricted) ; | ||
| Figures | |
png pdf |
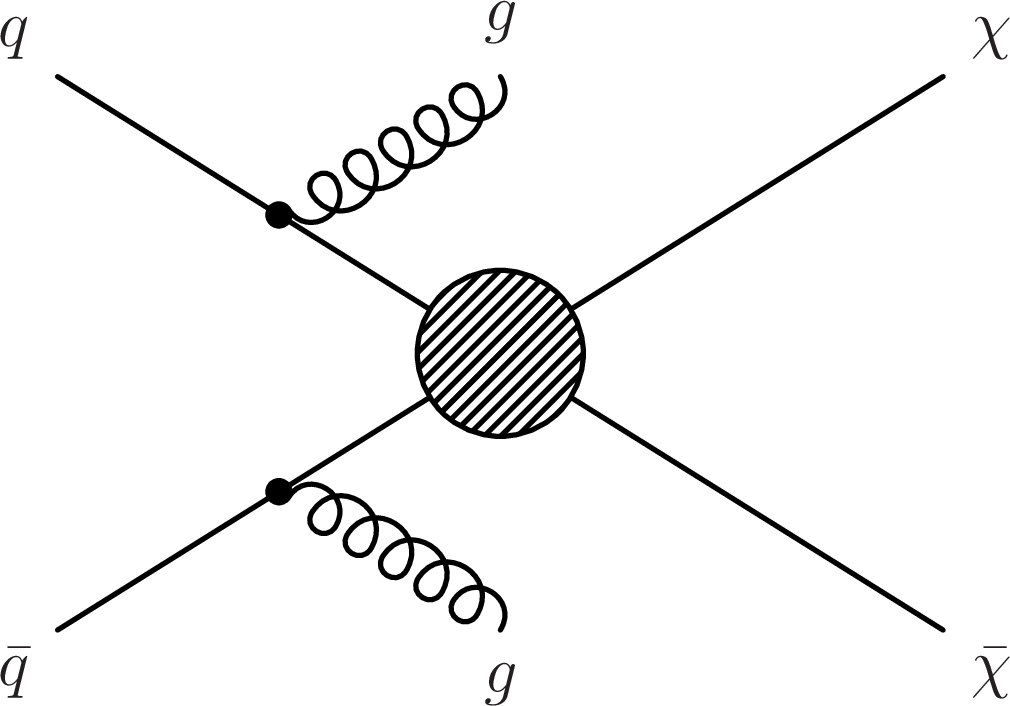
Figure 1-a:
Feynman diagrams for the pair production of DM particles corresponding to an effective field theory using a vector or axial-vector operator. |

png pdf |
Figure 1-b:
Feynman diagrams for the pair production of DM particles corresponding to an effective field theory using a scalar operator. |

png pdf |
Figure 2:
Comparison of observed yields in the 1$\mu $ control region and the data-driven background estimate derived from on the 2$\mu $ control region data in the four $ {M_R} $ categories: VL (top left), L (top right), H (bottom left), and VH (bottom right). The bottom panel in each plot shows the ratio between the two distributions. The observed bin-by-bin deviation from unity is interpreted as an estimate of the systematic uncertainty associated to the background estimation methodology for the 0$\mu $ search region. The dark and light bands represent the statistical and the total uncertainties in the estimates, respectively. The horizontal bars indicate the variable bin widths. |

png pdf |
Figure 2-a:
Comparison of observed yields in the 1$\mu $ control region and the data-driven background estimate derived from on the 2$\mu $ control region data in the four $ {M_R} $ categories: VL (top left), L (top right), H (bottom left), and VH (bottom right). The bottom panel in each plot shows the ratio between the two distributions. The observed bin-by-bin deviation from unity is interpreted as an estimate of the systematic uncertainty associated to the background estimation methodology for the 0$\mu $ search region. The dark and light bands represent the statistical and the total uncertainties in the estimates, respectively. The horizontal bars indicate the variable bin widths. |

png pdf |
Figure 2-b:
Comparison of observed yields in the 1$\mu $ control region and the data-driven background estimate derived from on the 2$\mu $ control region data in the four $ {M_R} $ categories: VL (top left), L (top right), H (bottom left), and VH (bottom right). The bottom panel in each plot shows the ratio between the two distributions. The observed bin-by-bin deviation from unity is interpreted as an estimate of the systematic uncertainty associated to the background estimation methodology for the 0$\mu $ search region. The dark and light bands represent the statistical and the total uncertainties in the estimates, respectively. The horizontal bars indicate the variable bin widths. |

png pdf |
Figure 2-c:
Comparison of observed yields in the 1$\mu $ control region and the data-driven background estimate derived from on the 2$\mu $ control region data in the four $ {M_R} $ categories: VL (top left), L (top right), H (bottom left), and VH (bottom right). The bottom panel in each plot shows the ratio between the two distributions. The observed bin-by-bin deviation from unity is interpreted as an estimate of the systematic uncertainty associated to the background estimation methodology for the 0$\mu $ search region. The dark and light bands represent the statistical and the total uncertainties in the estimates, respectively. The horizontal bars indicate the variable bin widths. |

png pdf |
Figure 2-d:
Comparison of observed yields in the 1$\mu $ control region and the data-driven background estimate derived from on the 2$\mu $ control region data in the four $ {M_R} $ categories: VL (top left), L (top right), H (bottom left), and VH (bottom right). The bottom panel in each plot shows the ratio between the two distributions. The observed bin-by-bin deviation from unity is interpreted as an estimate of the systematic uncertainty associated to the background estimation methodology for the 0$\mu $ search region. The dark and light bands represent the statistical and the total uncertainties in the estimates, respectively. The horizontal bars indicate the variable bin widths. |

png pdf |
Figure 3:
Comparison of the observed yield and the prediction from simulation as a function of $ {R} ^2$ in the 2$\mu $b control region. The uncertainties in the data and the simulated sample are represented by the vertical bars and the shaded bands, respectively. The horizontal bars indicate the variable bin widths. |

png pdf |
Figure 4:
Comparison of the observed yield in the zero b-tag control region and the background estimates in the four $ {M_R} $ categories: VL (top left), L (top right), H (bottom left), and VH (bottom right). The contribution of individual background processes is shown by the filled histograms. The bottom panels show the ratio between the observed yields and the total background estimate. The systematic uncertainty in the ratio includes the systematic uncertainty in the background estimate. For reference, the distributions from two benchmark signal models are also shown, corresponding to the pair production of DM particles of mass 1 GeV in the EFT approach with vector coupling to u or d quarks. The horizontal bars indicate the variable bin widths. |

png pdf |
Figure 4-a:
Comparison of the observed yield in the zero b-tag control region and the background estimates in the four $ {M_R} $ categories: VL (top left), L (top right), H (bottom left), and VH (bottom right). The contribution of individual background processes is shown by the filled histograms. The bottom panels show the ratio between the observed yields and the total background estimate. The systematic uncertainty in the ratio includes the systematic uncertainty in the background estimate. For reference, the distributions from two benchmark signal models are also shown, corresponding to the pair production of DM particles of mass 1 GeV in the EFT approach with vector coupling to u or d quarks. The horizontal bars indicate the variable bin widths. |

png pdf |
Figure 4-b:
Comparison of the observed yield in the zero b-tag control region and the background estimates in the four $ {M_R} $ categories: VL (top left), L (top right), H (bottom left), and VH (bottom right). The contribution of individual background processes is shown by the filled histograms. The bottom panels show the ratio between the observed yields and the total background estimate. The systematic uncertainty in the ratio includes the systematic uncertainty in the background estimate. For reference, the distributions from two benchmark signal models are also shown, corresponding to the pair production of DM particles of mass 1 GeV in the EFT approach with vector coupling to u or d quarks. The horizontal bars indicate the variable bin widths. |

png pdf |
Figure 4-c:
Comparison of the observed yield in the zero b-tag control region and the background estimates in the four $ {M_R} $ categories: VL (top left), L (top right), H (bottom left), and VH (bottom right). The contribution of individual background processes is shown by the filled histograms. The bottom panels show the ratio between the observed yields and the total background estimate. The systematic uncertainty in the ratio includes the systematic uncertainty in the background estimate. For reference, the distributions from two benchmark signal models are also shown, corresponding to the pair production of DM particles of mass 1 GeV in the EFT approach with vector coupling to u or d quarks. The horizontal bars indicate the variable bin widths. |

png pdf |
Figure 4-d:
Comparison of the observed yield in the zero b-tag control region and the background estimates in the four $ {M_R} $ categories: VL (top left), L (top right), H (bottom left), and VH (bottom right). The contribution of individual background processes is shown by the filled histograms. The bottom panels show the ratio between the observed yields and the total background estimate. The systematic uncertainty in the ratio includes the systematic uncertainty in the background estimate. For reference, the distributions from two benchmark signal models are also shown, corresponding to the pair production of DM particles of mass 1 GeV in the EFT approach with vector coupling to u or d quarks. The horizontal bars indicate the variable bin widths. |

png pdf |
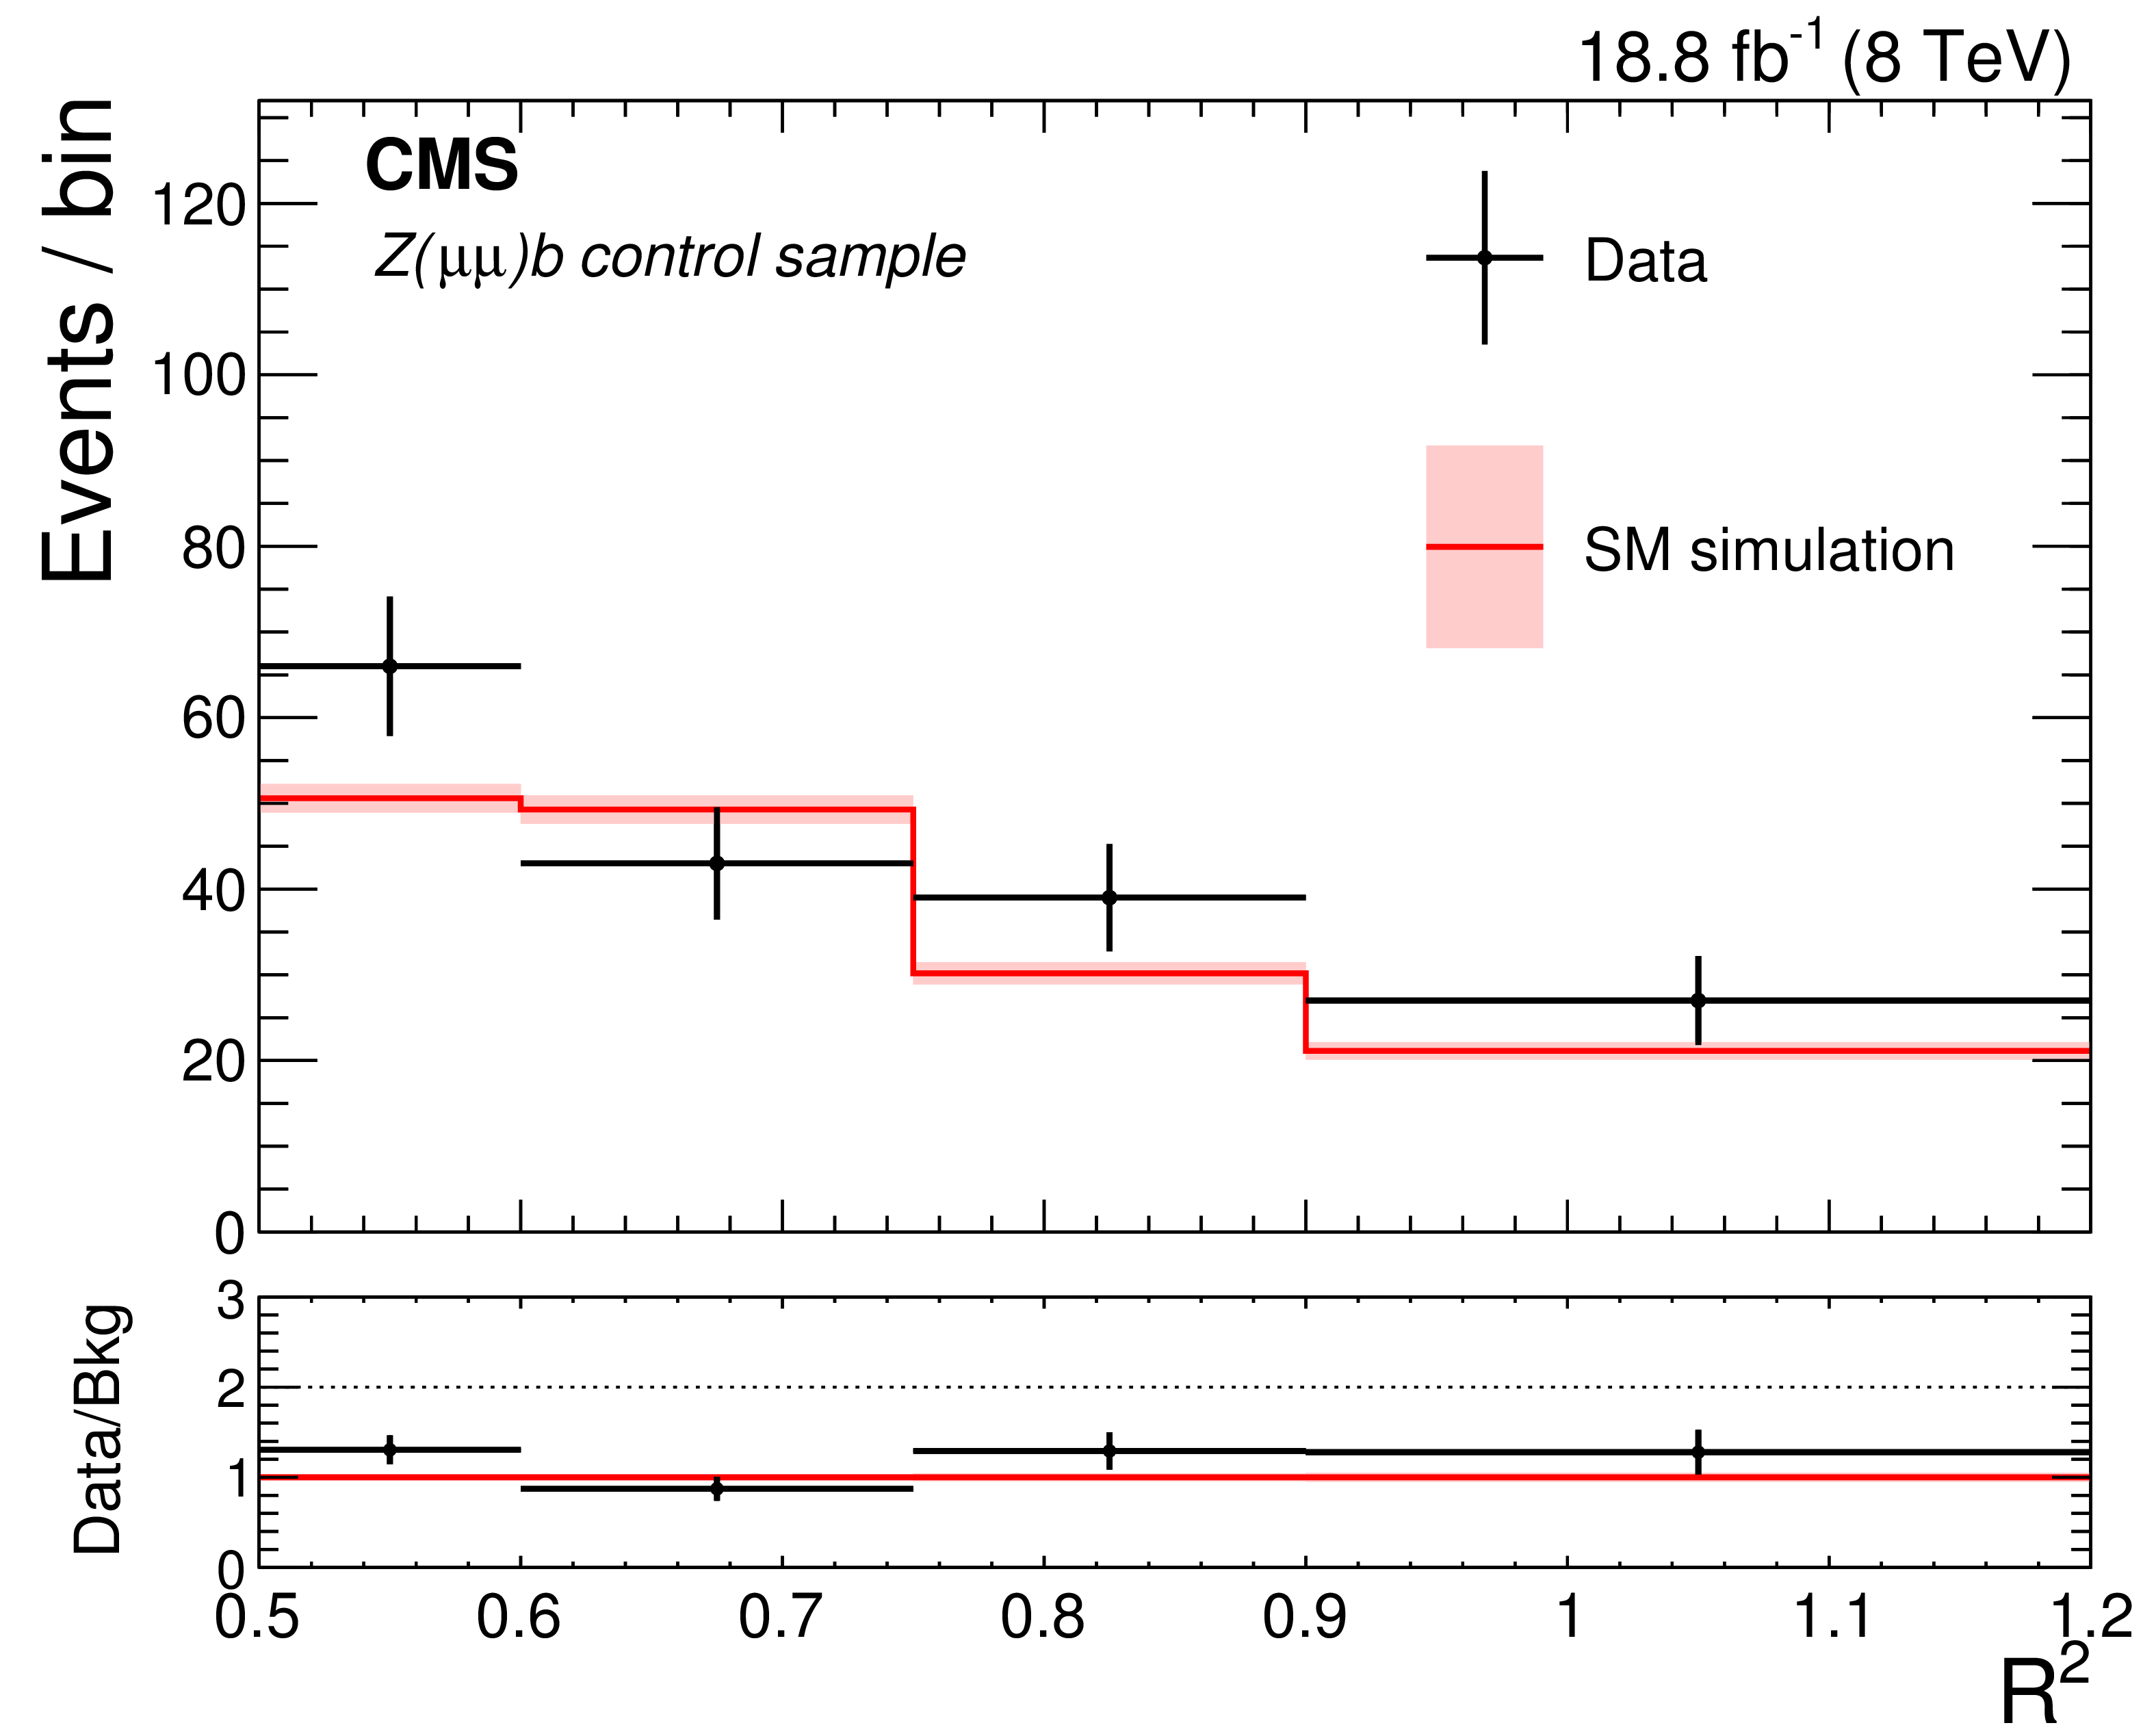
Figure 5:
Comparison of the observed yield and the prediction from simulation in the $\mathrm{ Z } (\mu \mu )$b control sample (left) and of the observed yield in the $1\mu $b control sample and the background estimates from the 2$\mu $b and $\mathrm{ Z } (\mu \mu )$b control samples (right), shown as a function of $ {R} ^2$. The bottom panel of each figure shows the ratio between the data and the estimates. The shaded bands represent the statistical uncertainty in the left plot, and the total uncertainty in the right plot. The horizontal bars indicate the variable bin widths. |
png pdf |
Figure 5-a:
Comparison of the observed yield and the prediction from simulation in the $\mathrm{ Z } (\mu \mu )$b control sample (left) and of the observed yield in the $1\mu $b control sample and the background estimates from the 2$\mu $b and $\mathrm{ Z } (\mu \mu )$b control samples (right), shown as a function of $ {R} ^2$. The bottom panel of each figure shows the ratio between the data and the estimates. The shaded bands represent the statistical uncertainty in the left plot, and the total uncertainty in the right plot. The horizontal bars indicate the variable bin widths. |

png pdf |
Figure 5-b:
Comparison of the observed yield and the prediction from simulation in the $\mathrm{ Z } (\mu \mu )$b control sample (left) and of the observed yield in the $1\mu $b control sample and the background estimates from the 2$\mu $b and $\mathrm{ Z } (\mu \mu )$b control samples (right), shown as a function of $ {R} ^2$. The bottom panel of each figure shows the ratio between the data and the estimates. The shaded bands represent the statistical uncertainty in the left plot, and the total uncertainty in the right plot. The horizontal bars indicate the variable bin widths. |

png pdf |
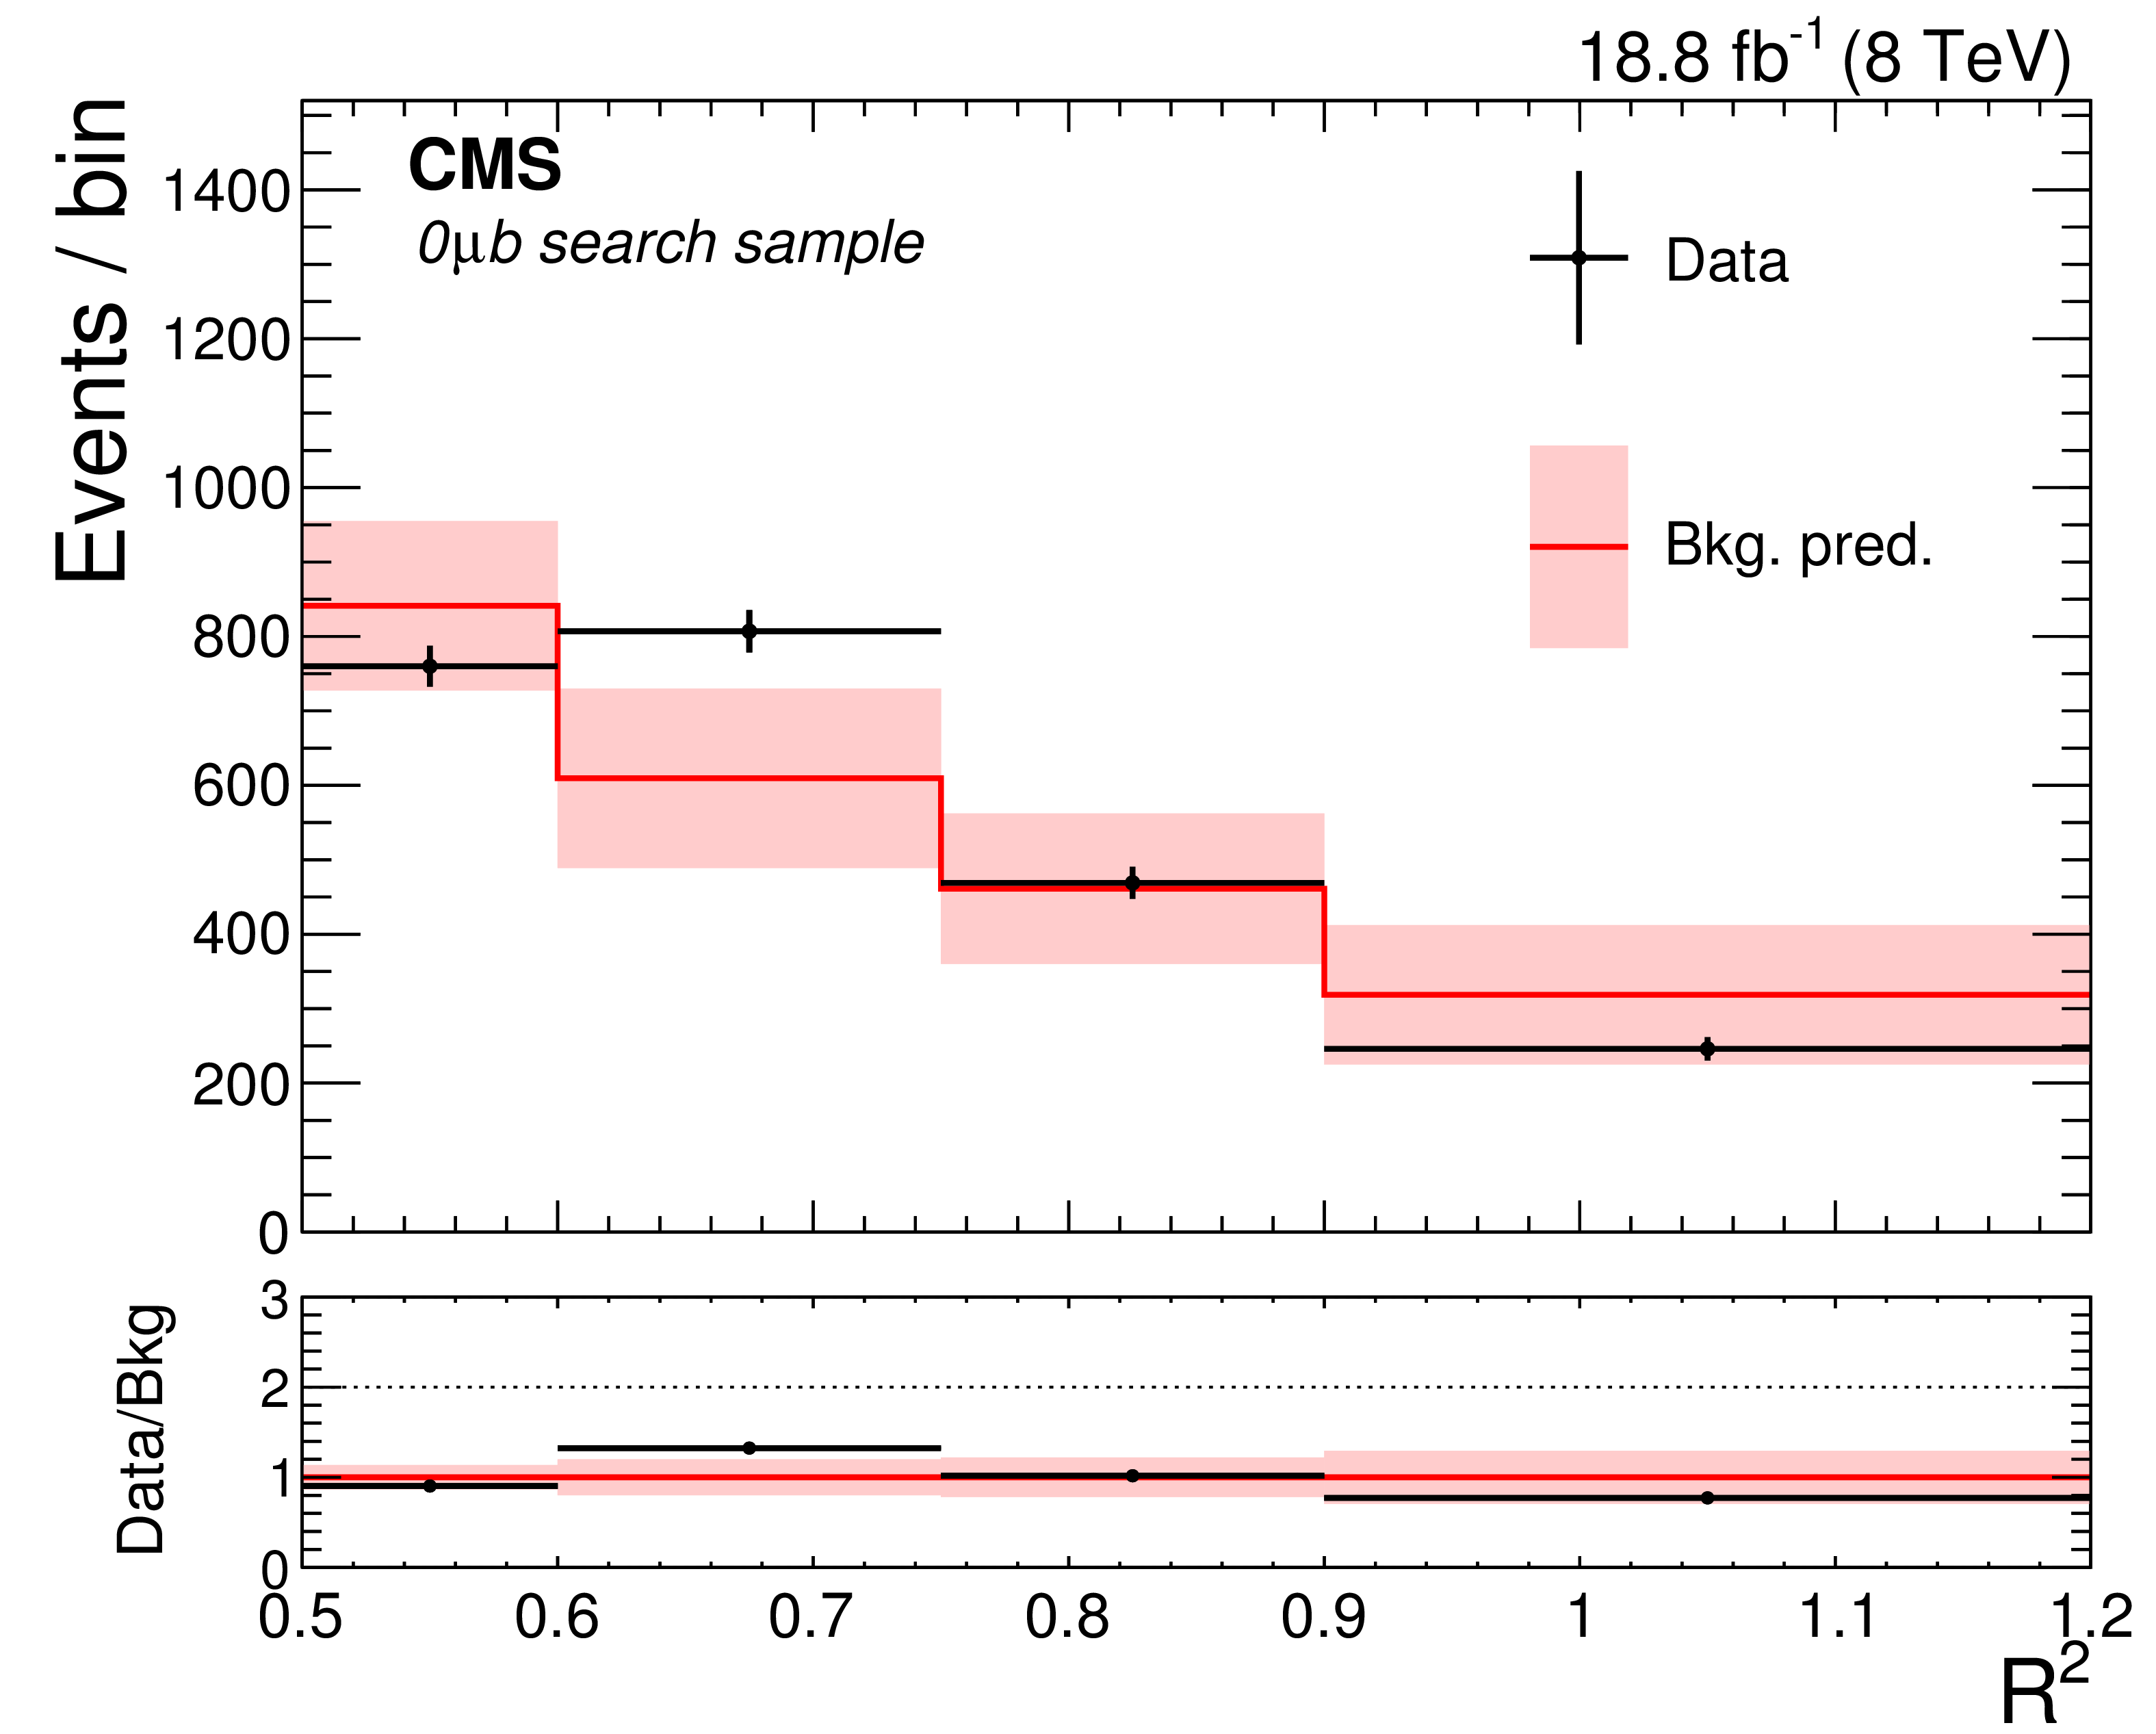
Figure 6:
Comparison of observed event yields and background estimates as a function of $ {R} ^2$, for the one (left) and two (right) b-tag search regions. The shaded bands represent the total uncertainty in the estimate. The horizontal bars indicate the variable bin widths. |

png pdf |
Figure 6-a:
Comparison of observed event yields and background estimates as a function of $ {R} ^2$, for the one (left) and two (right) b-tag search regions. The shaded bands represent the total uncertainty in the estimate. The horizontal bars indicate the variable bin widths. |
png pdf |
Figure 6-b:
Comparison of observed event yields and background estimates as a function of $ {R} ^2$, for the one (left) and two (right) b-tag search regions. The shaded bands represent the total uncertainty in the estimate. The horizontal bars indicate the variable bin widths. |
png pdf |
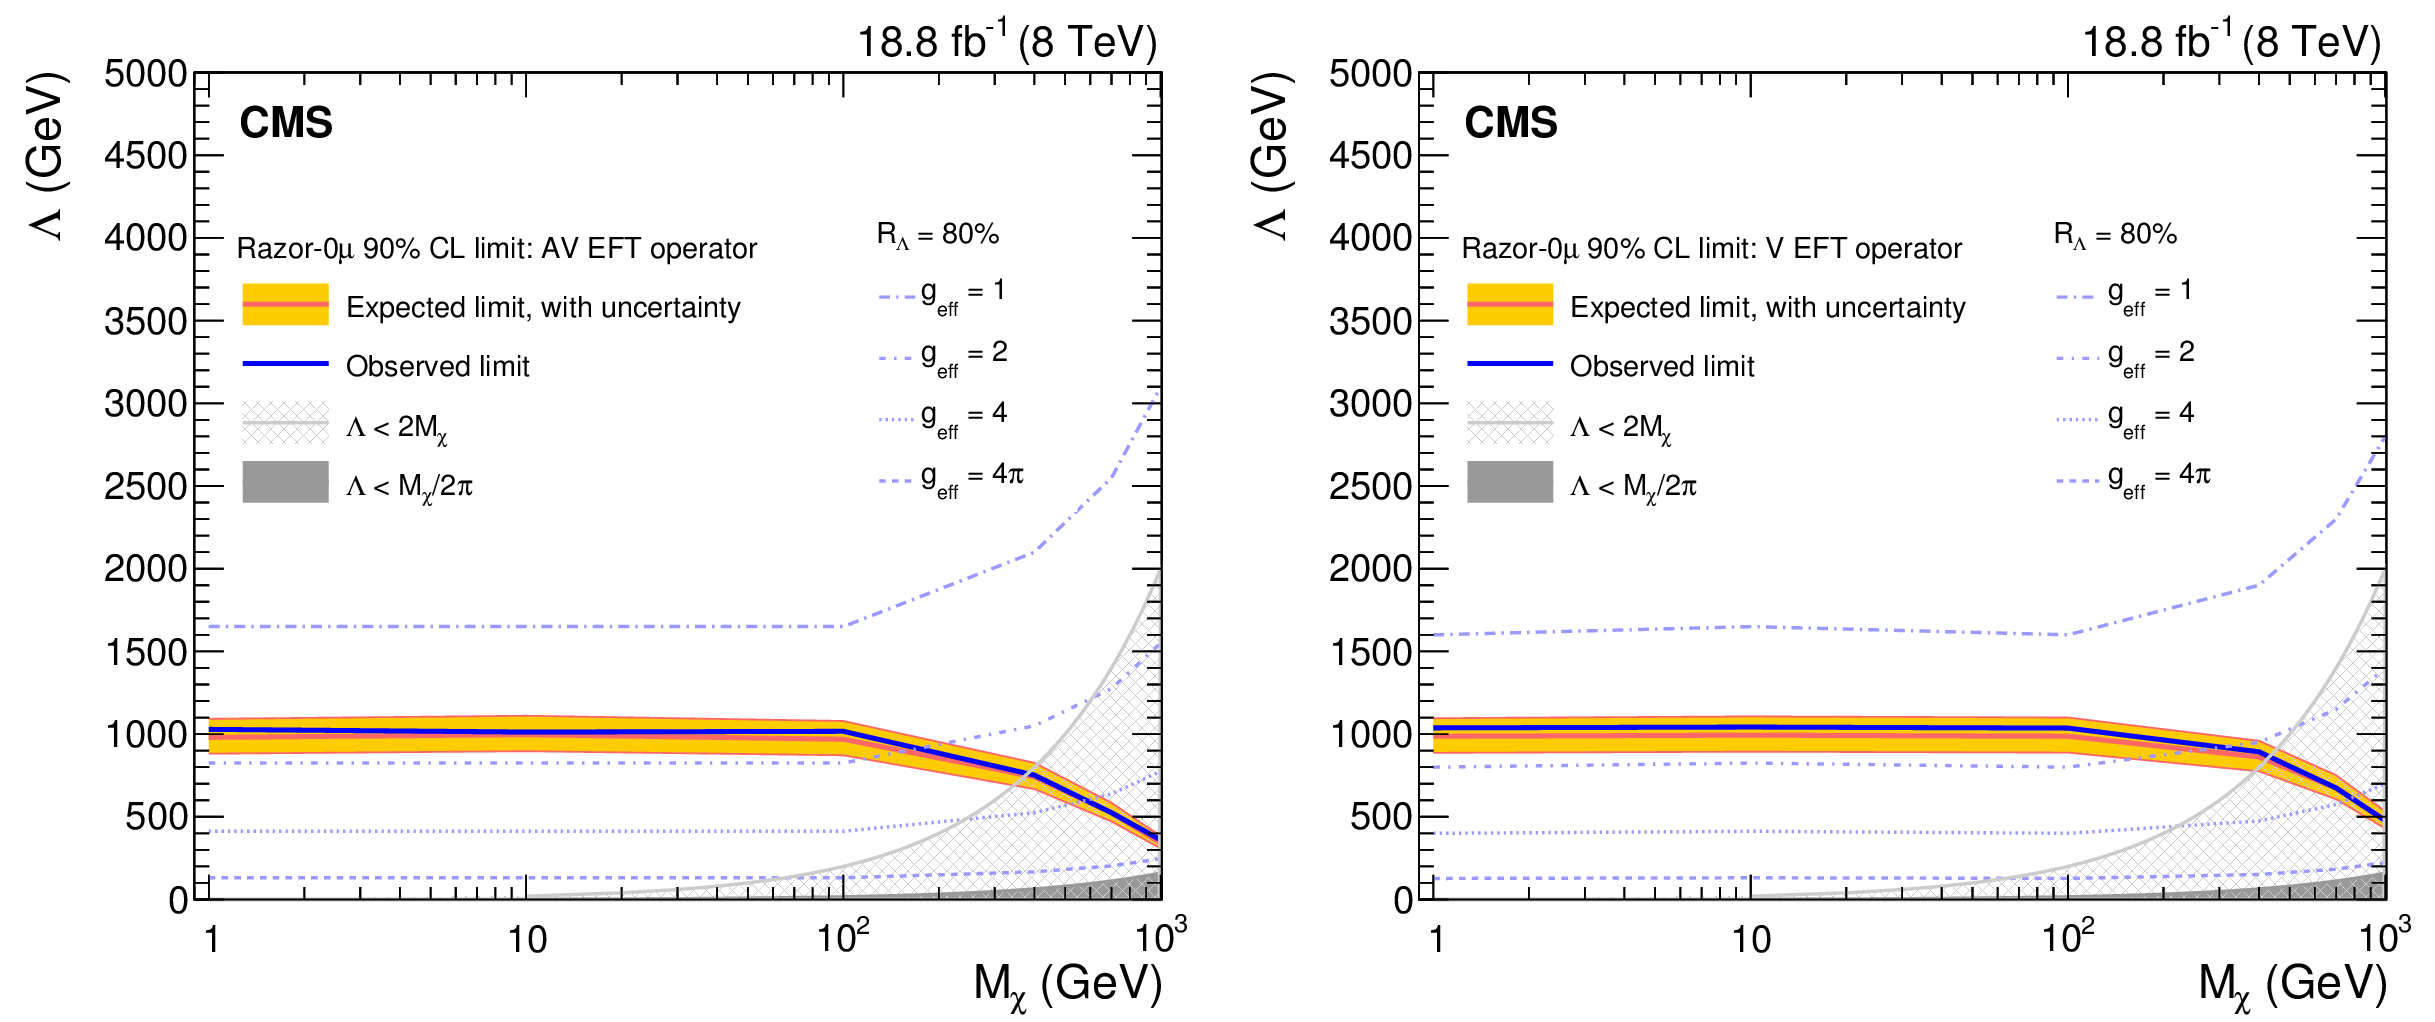
Figure 7:
Lower limit at 90% CL on the cutoff scale $\Lambda $ as a function of the DM mass $M_\chi $ in the case of axial-vector (left) and vector (right) currents. The validity of the EFT is quantified by $R_\Lambda = $ 80% contours, corresponding to different values of the effective coupling $g_\text {eff}$. For completeness, regions forbidden by the EFT validity condition $\Lambda > 2M_\chi /g_\text {eff}$ are shown for two choices of the effective coupling: $g_\text {eff} = $ 1 (light gray) and $g_\text {eff}= 4\pi $ (dark gray). |

png pdf |
Figure 7-a:
Lower limit at 90% CL on the cutoff scale $\Lambda $ as a function of the DM mass $M_\chi $ in the case of axial-vector (left) and vector (right) currents. The validity of the EFT is quantified by $R_\Lambda = $ 80% contours, corresponding to different values of the effective coupling $g_\text {eff}$. For completeness, regions forbidden by the EFT validity condition $\Lambda > 2M_\chi /g_\text {eff}$ are shown for two choices of the effective coupling: $g_\text {eff} = $ 1 (light gray) and $g_\text {eff}= 4\pi $ (dark gray). |

png pdf |
Figure 7-b:
Lower limit at 90% CL on the cutoff scale $\Lambda $ as a function of the DM mass $M_\chi $ in the case of axial-vector (left) and vector (right) currents. The validity of the EFT is quantified by $R_\Lambda = $ 80% contours, corresponding to different values of the effective coupling $g_\text {eff}$. For completeness, regions forbidden by the EFT validity condition $\Lambda > 2M_\chi /g_\text {eff}$ are shown for two choices of the effective coupling: $g_\text {eff} = $ 1 (light gray) and $g_\text {eff}= 4\pi $ (dark gray). |

png pdf |
Figure 8:
Upper limit at 90% CL on the DM-nucleon scattering cross section $\sigma _{N\chi }$ as a function of the DM mass $M_\chi $ in the case of spin-dependent axial-vector (left) and spin-independent vector (right) currents. A selection of representative direct detection experimental bounds are also shown. |

png pdf |
Figure 8-a:
Upper limit at 90% CL on the DM-nucleon scattering cross section $\sigma _{N\chi }$ as a function of the DM mass $M_\chi $ in the case of spin-dependent axial-vector (left) and spin-independent vector (right) currents. A selection of representative direct detection experimental bounds are also shown. |

png pdf |
Figure 8-b:
Upper limit at 90% CL on the DM-nucleon scattering cross section $\sigma _{N\chi }$ as a function of the DM mass $M_\chi $ in the case of spin-dependent axial-vector (left) and spin-independent vector (right) currents. A selection of representative direct detection experimental bounds are also shown. |
png pdf |
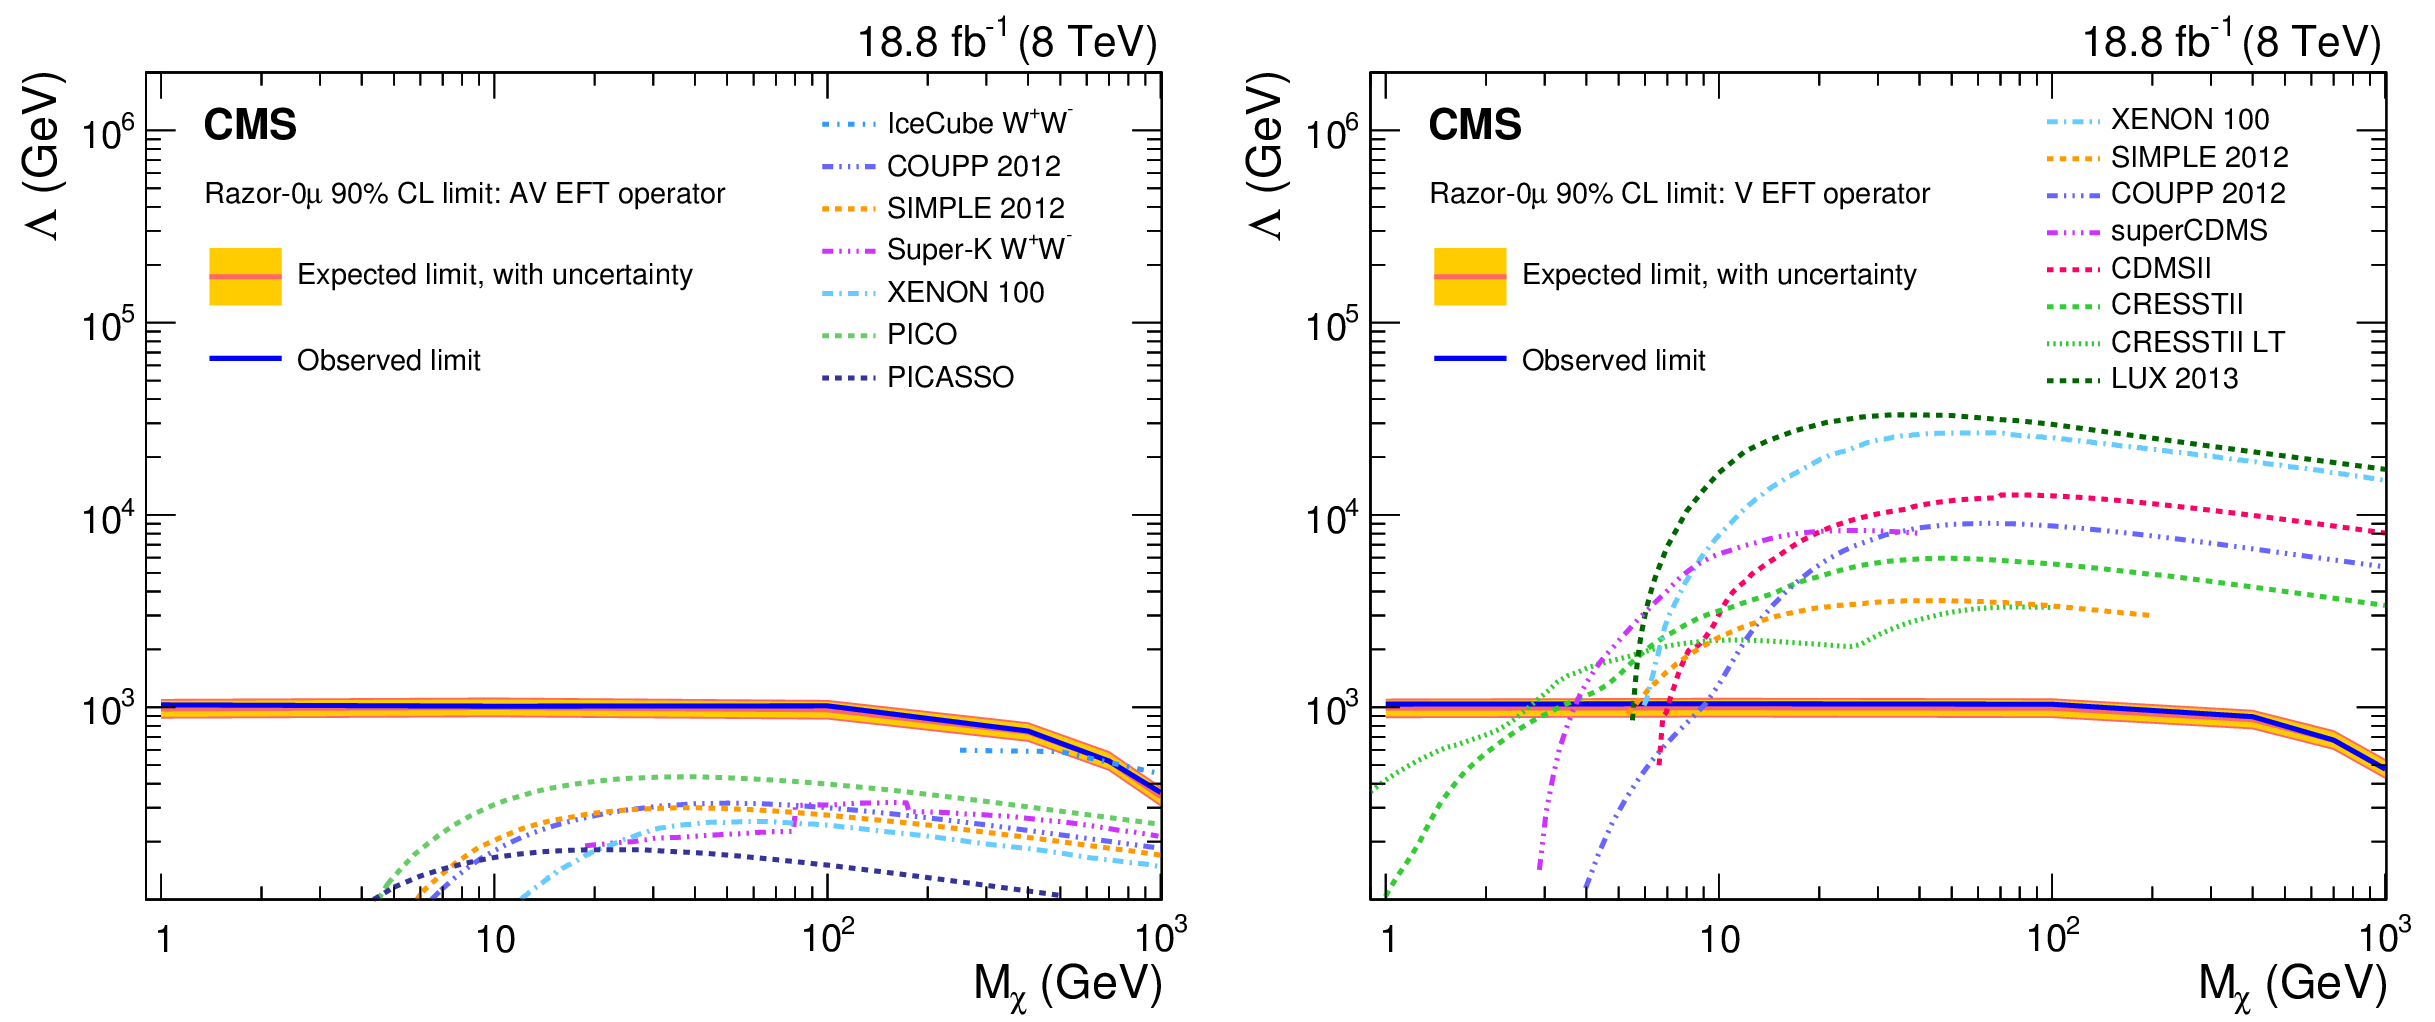
Figure 9:
Lower limit at 90% CL on the cutoff scale $\Lambda $ as a function of the DM mass $M_\chi $ in the case of axial-vector (left) and vector (right) currents. A selection of direct detection experimental bounds are also shown. |

png pdf |
Figure 9-a:
Lower limit at 90% CL on the cutoff scale $\Lambda $ as a function of the DM mass $M_\chi $ in the case of axial-vector (left) and vector (right) currents. A selection of direct detection experimental bounds are also shown. |

png pdf |
Figure 9-b:
Lower limit at 90% CL on the cutoff scale $\Lambda $ as a function of the DM mass $M_\chi $ in the case of axial-vector (left) and vector (right) currents. A selection of direct detection experimental bounds are also shown. |

png pdf |
Figure 10:
Lower limit at 90% CL on the cutoff scale $\Lambda $ for the scalar operator $\hat{\mathcal {O}}_{S}$ as a function of the DM mass $M_{\chi }$. The validity of the EFT is quantified by $R_\Lambda = $ 80% (left) and $R_\Lambda = $ 25% (right) contours, corresponding to different values of the effective coupling $g_\text {eff}$. For completeness, regions forbidden by the EFT validity condition $\Lambda > 2M_\chi /g_\text {eff}$ are shown for two choices of the effective coupling: $g_\text {eff} = $ 1 (light gray) and $g_\text {eff}= 4\pi $ (dark gray). |

png pdf |
Figure 10-a:
Lower limit at 90% CL on the cutoff scale $\Lambda $ for the scalar operator $\hat{\mathcal {O}}_{S}$ as a function of the DM mass $M_{\chi }$. The validity of the EFT is quantified by $R_\Lambda = $ 80% (left) and $R_\Lambda = $ 25% (right) contours, corresponding to different values of the effective coupling $g_\text {eff}$. For completeness, regions forbidden by the EFT validity condition $\Lambda > 2M_\chi /g_\text {eff}$ are shown for two choices of the effective coupling: $g_\text {eff} = $ 1 (light gray) and $g_\text {eff}= 4\pi $ (dark gray). |

png pdf |
Figure 10-b:
Lower limit at 90% CL on the cutoff scale $\Lambda $ for the scalar operator $\hat{\mathcal {O}}_{S}$ as a function of the DM mass $M_{\chi }$. The validity of the EFT is quantified by $R_\Lambda = $ 80% (left) and $R_\Lambda = $ 25% (right) contours, corresponding to different values of the effective coupling $g_\text {eff}$. For completeness, regions forbidden by the EFT validity condition $\Lambda > 2M_\chi /g_\text {eff}$ are shown for two choices of the effective coupling: $g_\text {eff} = $ 1 (light gray) and $g_\text {eff}= 4\pi $ (dark gray). |
| Tables | |

png pdf |
Table 1:
Measured trigger efficiency for different $ {M_R} $ regions. The selection $ {R} ^2 > $ 0.35 is applied. The uncertainty shown represents the statistical uncertainty in the measured efficiency. |
png pdf |
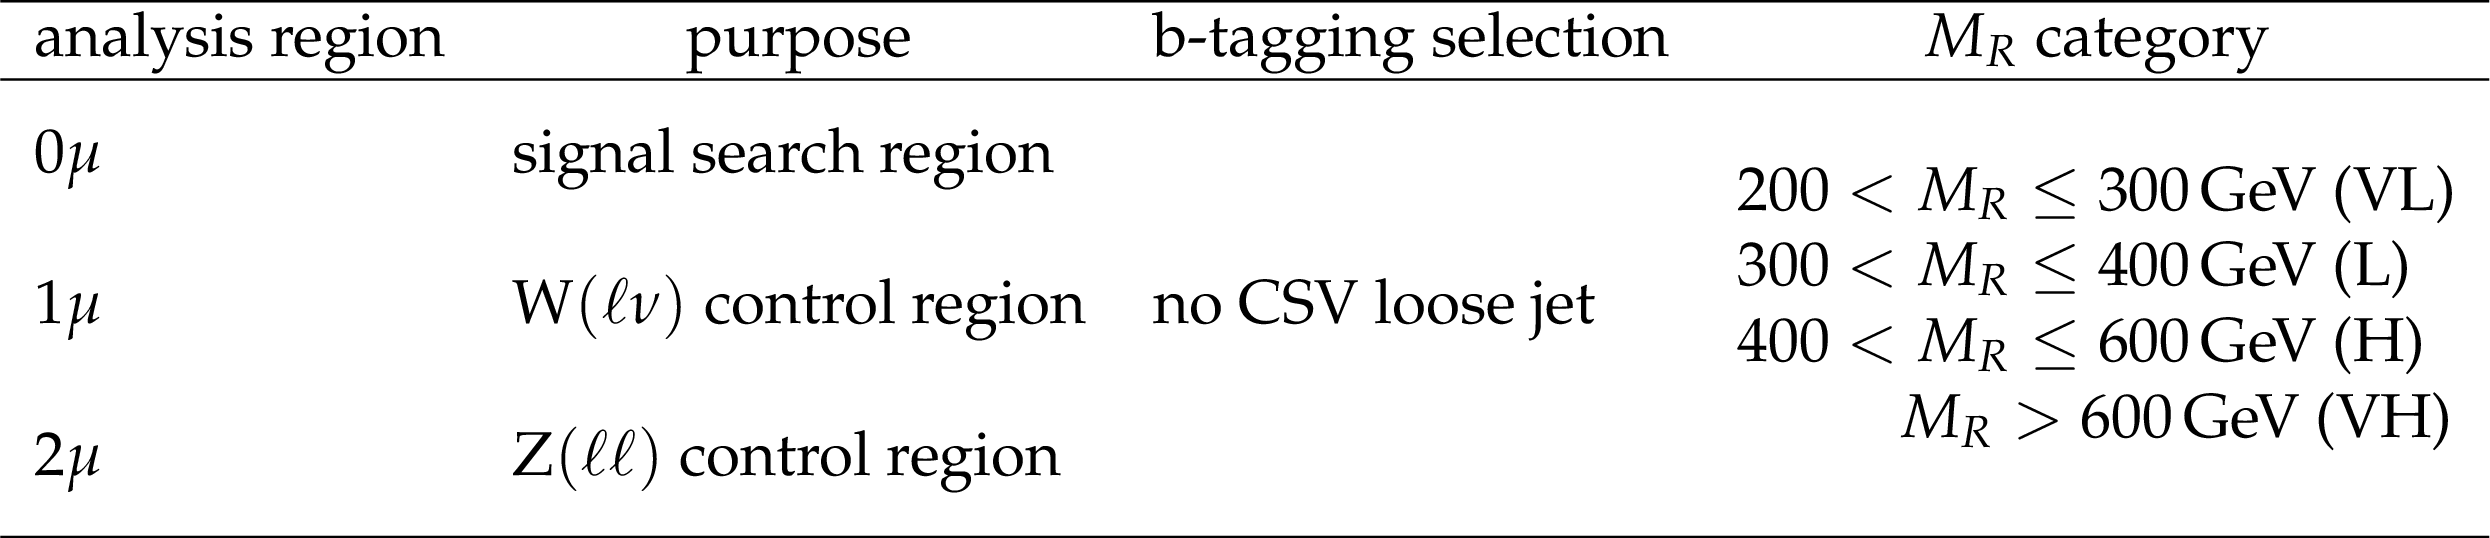
Table 2:
Analysis regions for events with zero identified b-tagged jets. The definition of these regions is based on the muon multiplicity, the output of the CSV b-tagging algorithm, and the value of $ {M_R} $. For all the regions, $ {R} ^2> $ 0.5 is required. |
png pdf |
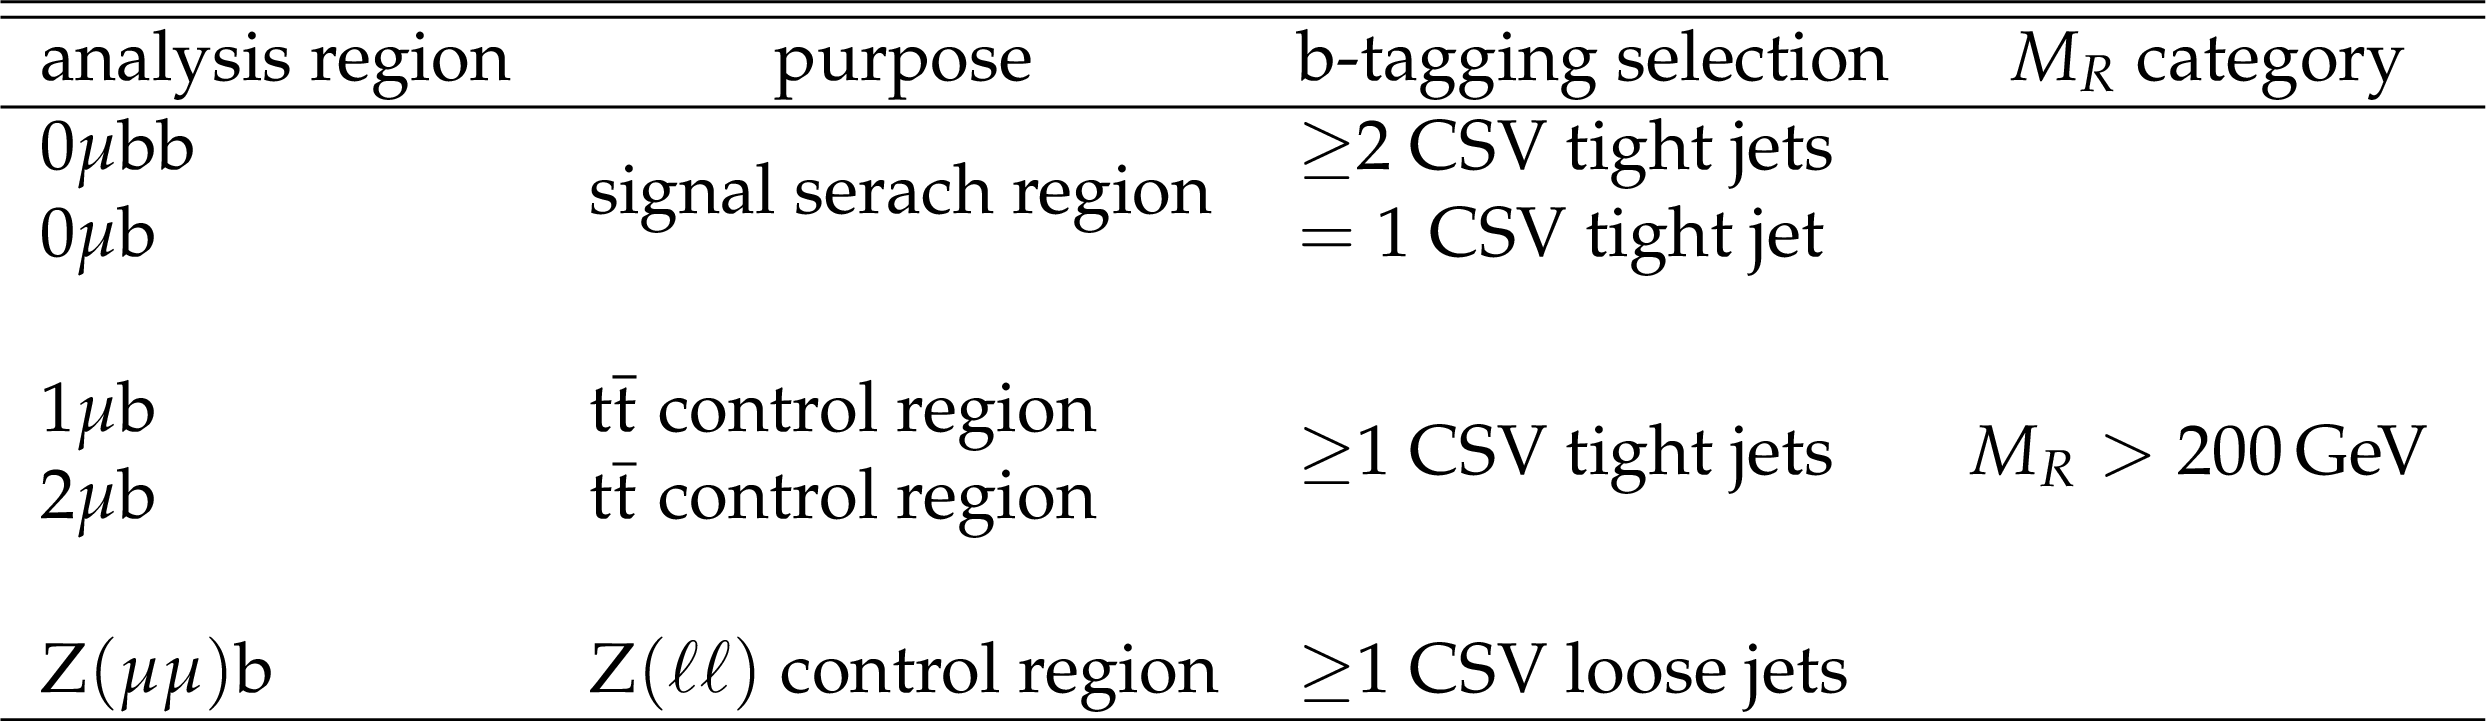
Table 3:
Analysis regions for events with identified b-tagged jets. The definition of these regions is based on the muon multiplicity, the output of the CSV b-tagging algorithm, and the value of $ {M_R} $. For all the regions, $ {R} ^2> $ 0.5 is required. |

png pdf |
Table 4:
Comparison of the observed yield in the 1$\mu $ control region in each $ {M_R} $ category and the corresponding data-driven background estimate obtained by extrapolating from the 2$\mu $ control region. The uncertainty in the estimates takes into account both the statistical and systematic components. The contribution of each individual background process is also shown, as estimated from simulated samples, as well as the total MC predicted yield. |

png pdf |
Table 5:
Comparison of the observed yield for the 2$\mu $ control region in each $ {M_R} $ category and the corresponding prediction from background simulation. The quoted uncertainty in the prediction reflects only the size of the simulated sample. The contribution of each individual background process is also shown, as estimated from simulated samples. |

png pdf |
Table 6:
Observed yield and predicted background from simulated samples in the 2$\mu $b control region. The quoted uncertainty in the prediction only reflects the size of the simulated sample. The contribution of each individual background process is also shown, as estimated from simulated samples. |

png pdf |
Table 7:
Comparison of the observed yields for for the zero b-tag search region in each $ {M_R} $ category and the corresponding background estimates. The uncertainty in the background estimate takes into account both the statistical and systematic components. The contribution of each individual background process is also shown, as estimated from simulated samples, as well as the total MC predicted yield. |

png pdf |
Table 8:
Comparison of the observed yields in the $\mathrm{ Z } (\mu \mu )$b and $1\mu $b samples, the corresponding predictions from background simulation, and (for $1\mu $b only) the cross-check background estimate. The contribution of each individual background process is also shown, as estimated from simulated samples. |

png pdf |
Table 9:
Comparison of the observed yield for events in the one and two b-tag search regions and the corresponding background estimates. The uncertainty in the estimates takes into account both the statistical and systematic components. The contribution of each individual background process is also shown, as estimated from simulated samples, as well as the total MC predicted yield. |

png pdf |
Table 10:
Systematic uncertainties associated with the description of the DM signal. The values indicated represent the typical size. The dependence of these systematic uncertainties on the $ {R} ^2$ and $ {M_R} $ values is taken into account in the determination of the results. |
png pdf |
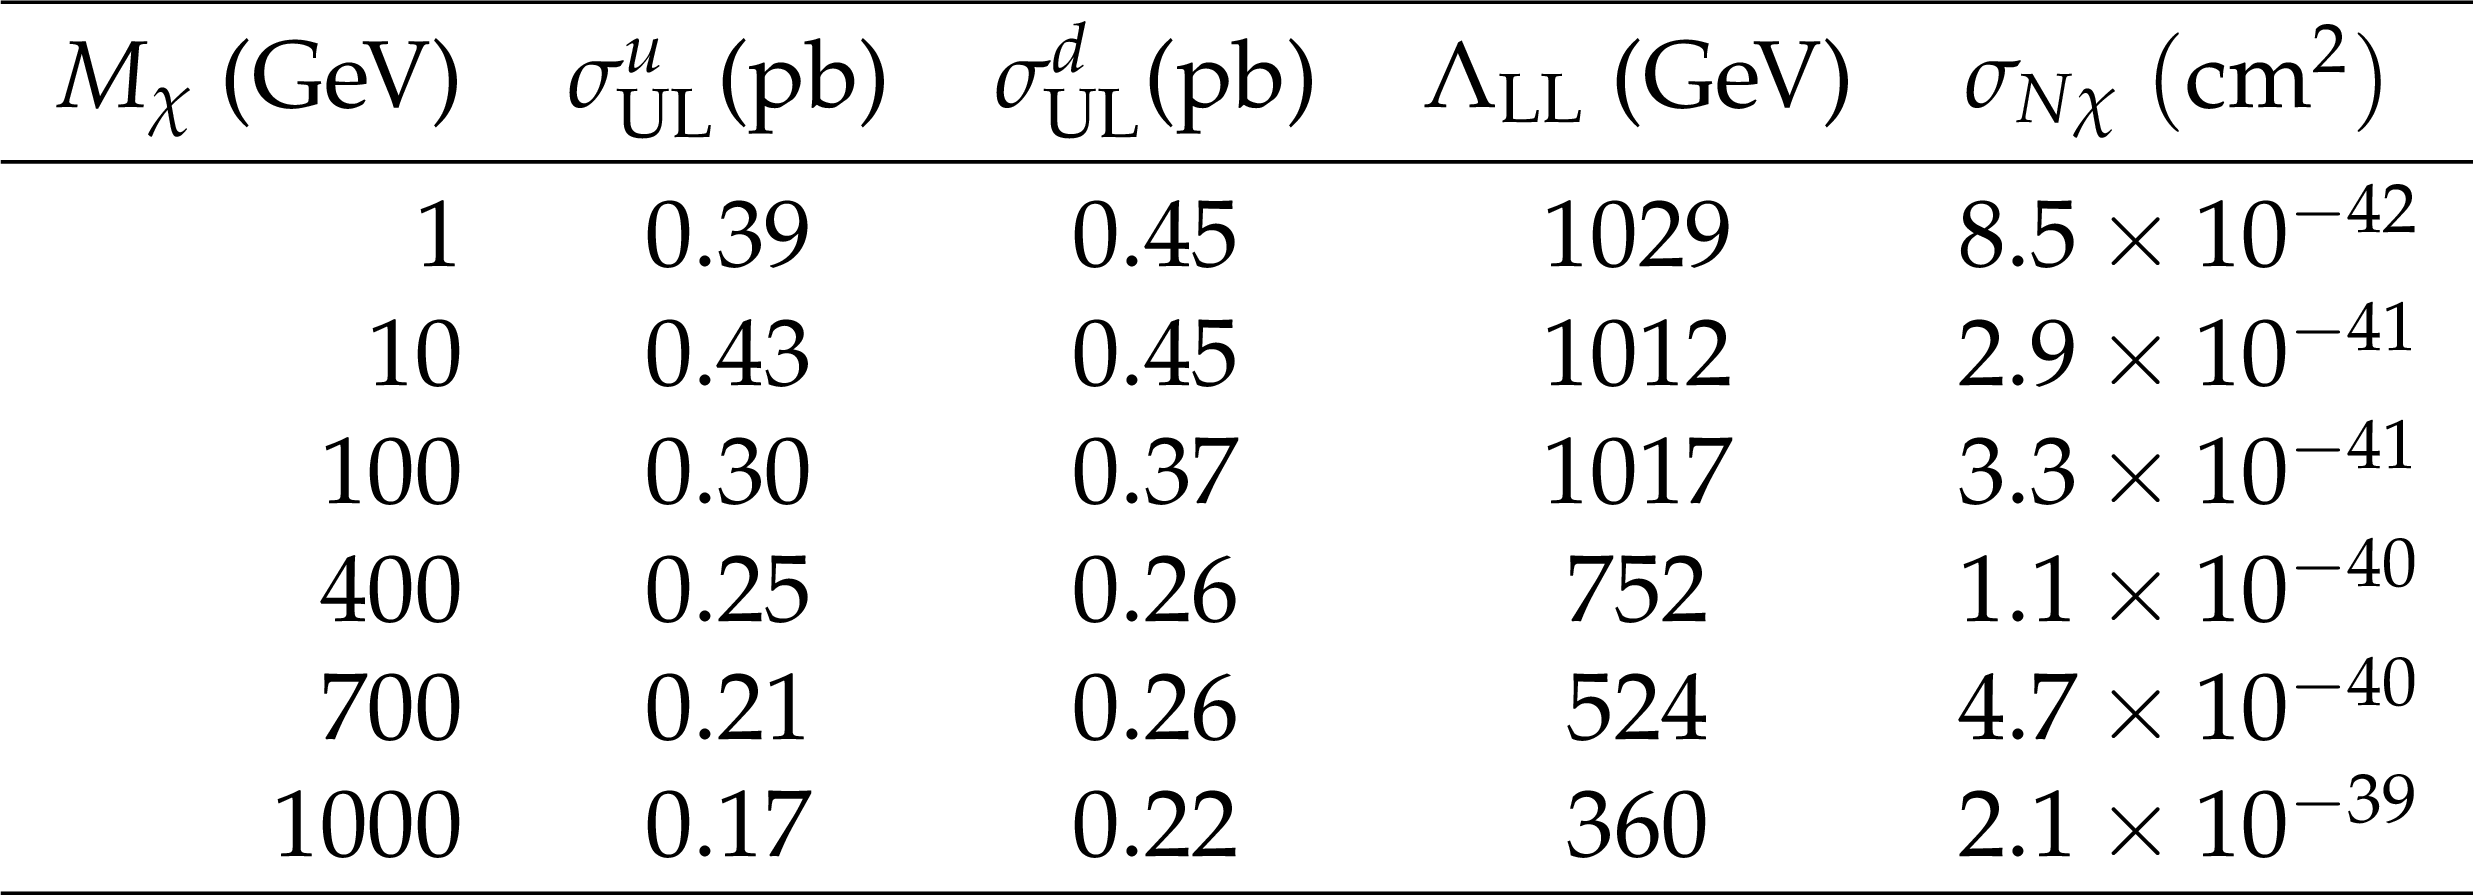
Table 11:
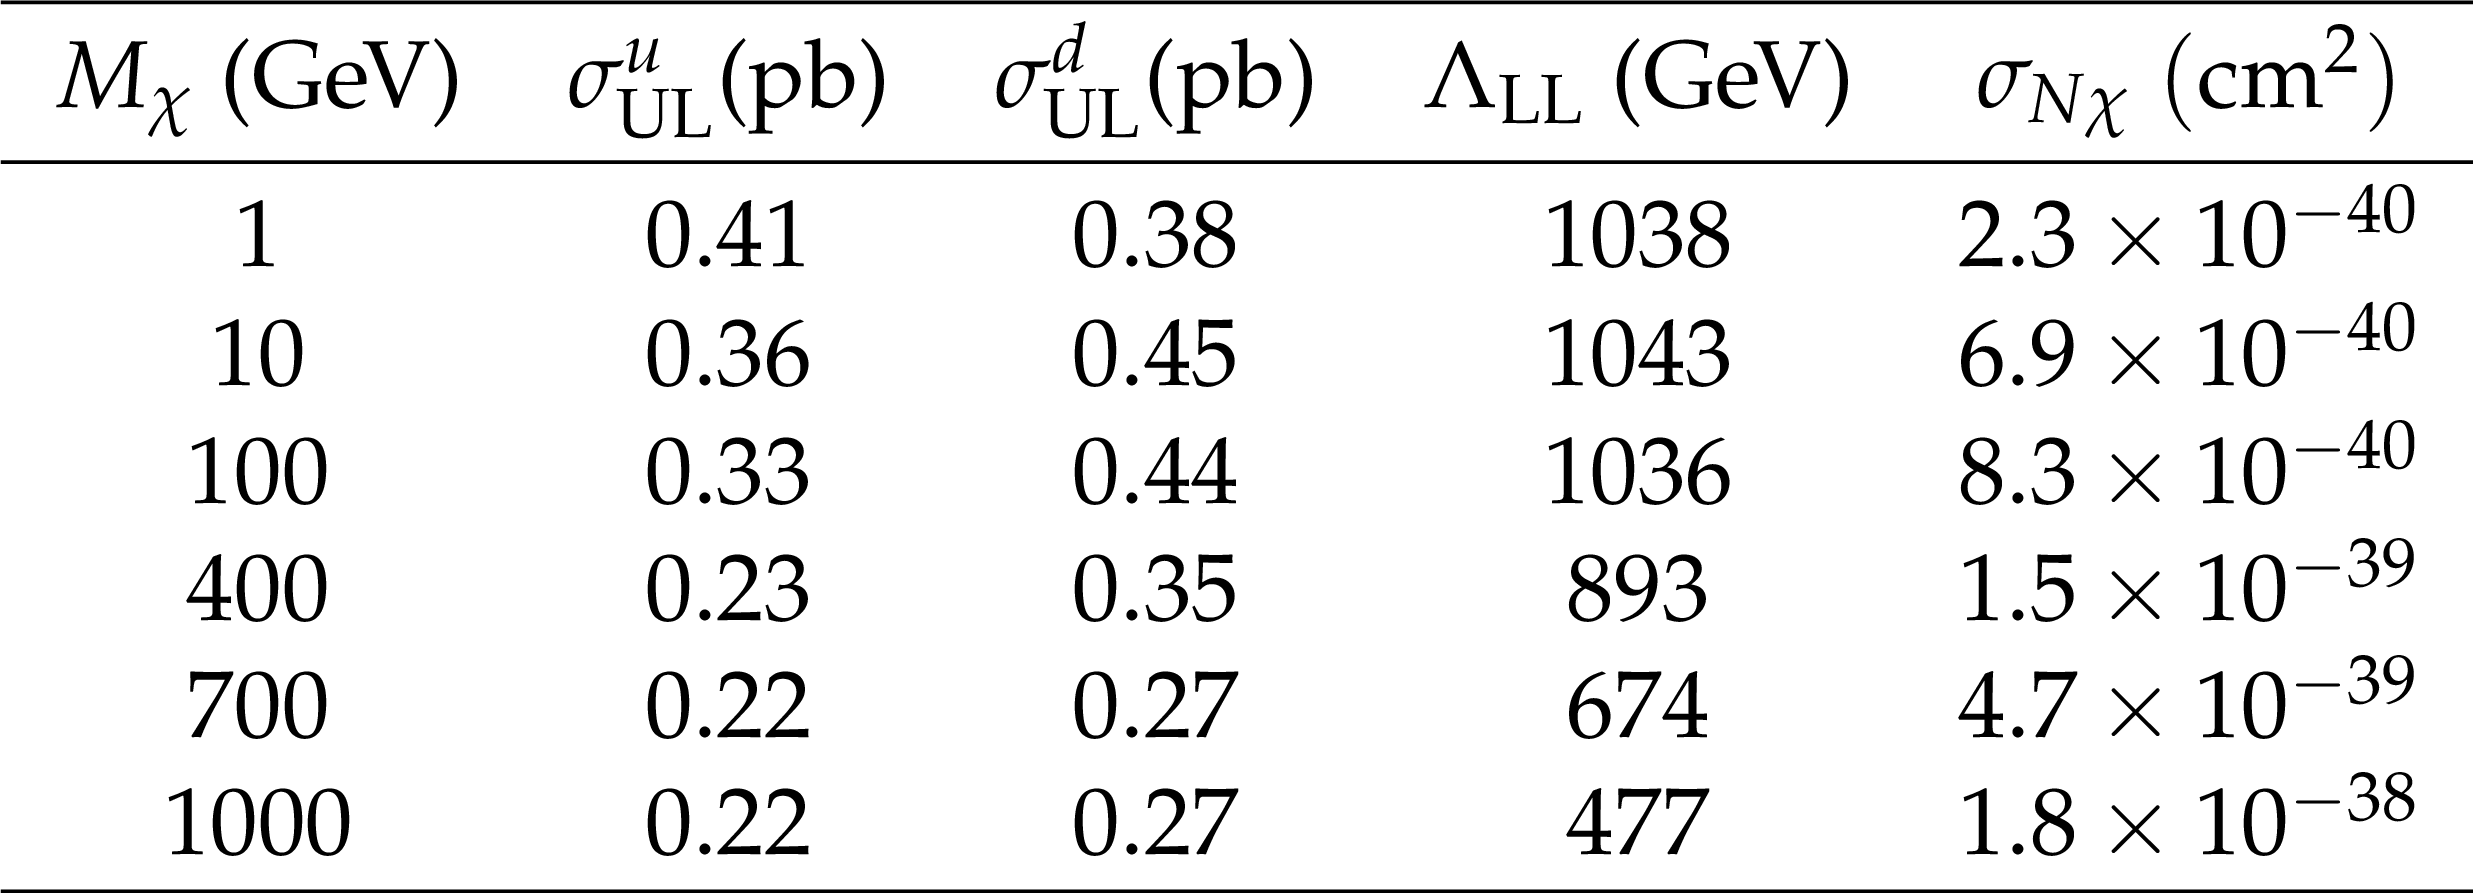
The 90% CL limits on DM production in the case of axial-vector couplings. Here, $\sigma ^{u}_\mathrm {UL}$ and $\sigma ^{d}_\mathrm {UL}$ are the observed upper limits on the production cross section for u and d quarks, respectively; $\Lambda _\mathrm {LL}$ is the observed cutoff energy scale lower limit; and $\sigma _{N\chi }$ is the observed DM-nucleon scattering cross section upper limit. |
png pdf |
Table 12:
The 90% CL limits on DM production in the case of vector couplings. Here, $\sigma ^{u}_\mathrm {UL}$ and $\sigma ^{d}_\mathrm {UL}$ are the observed upper limits on the production cross section for u and d quarks, respectively; $\Lambda _\mathrm {LL}$ is the observed cutoff energy scale lower limit; and $\sigma _{N\chi }$ is the observed DM-nucleon scattering cross section upper limit. |

png pdf |
Table 13:
The 90% CL limits on DM production in the case of scalar couplings. Here, $\sigma ^\text {obs}_\mathrm {UL}$ is the observed upper limit on the production cross section, $\Lambda ^\text {obs}_\mathrm {LL}$ and $\Lambda ^\text {exp}_\mathrm {LL}$ are the observed and expected cutoff energy scale lower limit, respectively. |

png pdf |
Table 14:
Background estimates and observed yield for each $ {R} ^2$ bin in the VL $ {M_R} $ category. |

png pdf |
Table 15:
Background estimates and observed yield for each $ {R} ^2$ bin in the L $ {M_R} $ category. |

png pdf |
Table 16:
Background estimates and observed yield for each $ {R} ^2$ bin in the H $ {M_R} $ category. |

png pdf |
Table 17:
Background estimates and observed yield for each $ {R} ^2$ bin in the VH $ {M_R} $ category. |

png pdf |
Table 18:
Background estimates and observed yield for each bin in the 0$\mu $b signal region. |

png pdf |
Table 19:
Background estimates and observed yield for each bin in the 0$\mu $bb signal region. |
| Summary |
|
A search for dark matter has been performed studying proton-proton collisions collected with the CMS detector at the LHC at a center-of-mass energy of 8 TeV. The data correspond to an integrated luminosity of 18.8 fb$^{-1}$, collected with a dedicated high-rate trigger in 2012, made possible by the creation of parked data, and processed during the LHC shutdown in 2013. Events with at least two jets are analyzed by studying the distribution in the ($M_R$, $R^2$) plane, in an event topology complementary to that of monojet searches. Events with one or two muons are used in conjunction with simulated samples, to predict the expected background from standard model processes, mainly Z+jets and W+jets. The analysis is performed on events both with and without b-tagged jets, originating from the hadronization of a bottom quark, where in the latter case the dominant background comes from $\mathrm{ t \bar{t} } $. No significant excess is observed. The results are presented as exclusion limits on dark matter production at 90% confidence level for models based on effective operators and for different assumptions on the interaction between the dark matter particles and the colliding partons. Dark matter production at the LHC is excluded for a mediator mass scale $\Lambda$ below 1 TeV in the case of a vector or axial vector operator. While the sensitivity achieved is similar to those of previously published searches, this analysis complements those results since the use of razor variables provides more inclusive selection criteria and since the exploitation of parked data allows events with small values of $M_R$ to be included. |
| References | ||||
| 1 | F. Zwicky | On the Masses of Nebulae and of Clusters of Nebulae | Astrophys. J. 86 (1937) 217 | |
| 2 | H. C. van de Hulst, E. Raimond, and H. van Woerden | Rotation and Density Distribution of the Andromeda Nebula Derived from Observations of the 21-cm line | Bull. Astr. Inst. Netherlands 14 (1957) 1 | |
| 3 | V. C. Rubin, N. Thonnard, and W. K. Ford Jr. | Rotational properties of 21 SC galaxies with a large range of luminosities and radii, from NGC 4605/R = 4 kpc to UGC 2885/R = 122 kpc | Astrophys. J. 238 (1980) 471 | |
| 4 | S. D. M. White, C. S. Frenk, M. Davis, and G. Efstathiou | Clusters, filaments, and voids in a universe dominated by cold dark matter | Astrophys. J. 313 (1987) 505 | |
| 5 | R. G. Carlberg and H. M. P. Couchman | Mergers and bias in a cold dark matter cosmology | Astrophys. J. 340 (1989) 47 | |
| 6 | V. Springel et al. | Simulating the joint evolution of quasars, galaxes and their large-scale distribution | Nature 435 (2005) 629 | astro-ph/0504097 |
| 7 | G. F. Smoot et al. | Structure in the COBE differential microwave radiometer first year maps | Astrophys. J. 396 (1992) L1 | |
| 8 | Boomerang Collaboration | A flat Universe from high resolution maps of the cosmic microwave background radiation | Nature 404 (2000) 955 | astro-ph/0004404 |
| 9 | WMAP Collaboration | Wilkinson Microwave Anisotropy Probe (WMAP) three year results: implications for cosmology | Astrophys. J. Suppl. 170 (2007) 377 | astro-ph/0603449 |
| 10 | Planck Collaboration | Planck 2013 results. XVI. Cosmological parameters | Astron. Astrophys. 571 (2014) A16 | 1303.5076 |
| 11 | J. M. Bardeen, J. R. Bond, N. Kaiser, and A. S. Szalay | The statistics of peaks of Gaussian random fields | Astrophys. J. 304 (1986) 15 | |
| 12 | R. Cen | Decaying cold dark matter model and small-scale power | Astrophys. J. 546 (2001) L77 | astro-ph/0005206 |
| 13 | D. Clowe et al. | A direct empirical proof of the existence of dark matter | Astrophys. J. 648 (2006) L109 | astro-ph/0608407 |
| 14 | P. Ramond | Dual theory for free fermions | PRD 3 (1971) 2415 | |
| 15 | Y. A. Golfand and E. P. Likhtman | Extension of the algebra of Poincare group generators and violation of p invariance | JEPTL 13 (1971) 323 | |
| 16 | D. V. Volkov and V. P. Akulov | Possible universal neutrino interaction | JEPTL 16 (1972) 438 | |
| 17 | J. Wess and B. Zumino | Supergauge transformations in four-dimensions | NPB 70 (1974) 39 | |
| 18 | P. Fayet | Supergauge Invariant Extension of the Higgs Mechanism and a Model for the Electron and its Neutrino | NPB 90 (1975) 104 | |
| 19 | ATLAS Collaboration | Search for new phenomena with the monojet and missing transverse momentum signature using the ATLAS detector in $ \sqrt{s}= $ 7 TeV proton-proton collisions | PLB 705 (2011) 294 | 1106.5327 |
| 20 | CMS Collaboration | Search for dark matter and large extra dimensions in monojet events in pp collisions at $ \sqrt{s} = $ 7 TeV | JHEP 09 (2012) 094 | CMS-EXO-11-059 1206.5663 |
| 21 | CMS Collaboration | Search for new phenomena in monophoton final states in proton-proton collisions at $ \sqrt{s} = $ 8 ~TeV | CMS-EXO-12-047 1410.8812 |
|
| 22 | ATLAS Collaboration | Search for new phenomena in events with a photon and missing transverse momentum in pp collisions at $ \sqrt{s}= $ 8 TeV with the ATLAS detector | PRD 91 (2015) 012008 | 1411.1559 |
| 23 | ATLAS Collaboration | Search for dark matter in events with a hadronically decaying W or Z boson and missing transverse momentum in pp collisions at $ \sqrt{s}= $ 8 TeV with the ATLAS detector | PRL 112 (2014) 041802 | 1309.4017 |
| 24 | ATLAS Collaboration | Search for dark matter in events with a Z boson and missing transverse momentum in pp collisions at $ \sqrt{s} = $ 8 TeV with the ATLAS detector | PRD 90 (2014) 012004 | 1404.0051 |
| 25 | ATLAS Collaboration | Search for dark matter produced in association with a Higgs boson decaying to two bottom quarks in pp collisions at $ \sqrt{s} = $ 8 TeV with the ATLAS detector | 1510.06218 | |
| 26 | ATLAS Collaboration | Search for Dark Matter in Events with Missing Transverse Momentum and a Higgs Boson Decaying to Two Photons in pp Collisions at $ \sqrt{s}= $ 8 TeV with the ATLAS Detector | PRL 115 (2015) 131801 | 1506.01081 |
| 27 | ATLAS Collaboration | Search for dark matter in events with heavy quarks and missing transverse momentum in pp collisions with the ATLAS detector | EPJC 75 (2015) 92 | 1410.4031 |
| 28 | CMS Collaboration | Search for monotop signatures in proton-proton collisions at $ \sqrt{s} = 8\text{ }\text{ }\mathrm{TeV} $ | PRL 114 (2015) 101801 | CMS-B2G-12-022 1410.1149 |
| 29 | CMS Collaboration | Search for the production of dark matter in association with top-quark pairs in the single-lepton final state in proton-proton collisions at $ \sqrt{s} = $ 8 tev | JHEP 06 (2015) 121 | 1402.2285 |
| 30 | ATLAS Collaboration | Search for new particles in events with one lepton and missing transverse momentum in pp collisions at $ \sqrt{s}= $ 8 TeV with the ATLAS detector | JHEP 09 (2014) 037 | 1407.7494 |
| 31 | CMS Collaboration | Search for physics beyond the standard model in final states with a lepton and missing transverse energy in proton-proton collisions at sqrt(s) = 8 TeV | PRD 91 (2015) 092005 | CMS-EXO-12-060 1408.2745 |
| 32 | C. Rogan | Kinematics for new dynamics at the lhc | CALT-68-2790 | 1006.2727 |
| 33 | CMS Collaboration | Inclusive search for squarks and gluinos in pp collisions at $ \sqrt{s} = $ 7 TeV | PRD 85 (2012) 012004 | CMS-SUS-10-009 1107.1279 |
| 34 | CMS Collaboration | Search for supersymmetry with razor variables in pp collisions at $ \sqrt{s}= $ 7 ~TeV | PRD 90 (2014) 112001 | CMS-SUS-12-005 1405.3961 |
| 35 | CMS Collaboration | Search for supersymmetry using razor variables in events with $ b $-tagged jets in $ pp $ collisions at $ \sqrt{s} = 8\text{ }\text{ }\mathrm{TeV} $ | PRD 91 (2015) 052018 | |
| 36 | P. J. Fox, R. Harnik, R. Primulando, and C.-T. Yu | Taking a razor to dark matter parameter space at the LHC | PRD 86 (2012) 015010 | 1203.1662 |
| 37 | M. Papucci, A. Vichi, and K. M. Zurek | Monojet versus the rest of the world I: $ t $-channel models | JHEP 11 (2014) 024 | 1402.2285 |
| 38 | P. Agrawal, B. Batell, D. Hooper, and T. Lin | Flavored Dark Matter and the Galactic Center Gamma-Ray Excess | PRD 90 (2014) 063512 | 1404.1373 |
| 39 | D. Hooper and L. Goodenough | Dark Matter Annihilation in The Galactic Center As Seen by the Fermi Gamma Ray Space Telescope | PLB 697 (2011) 412 | 1010.2752 |
| 40 | CMS Collaboration | Data Parking and Data Scouting at the CMS Experiment | CDS | |
| 41 | CMS Collaboration | Energy calibration and resolution of the CMS electromagnetic calorimeter in pp collisions at $ \sqrt{s}= $ 7 TeV | JINST 8 (2013) P09009 | CMS-EGM-11-001 1306.2016 |
| 42 | CMS Collaboration | The CMS experiment at the CERN LHC | JINST 3 (2008) S08004 | CMS-00-001 |
| 43 | M. Cacciari, G. P. Salam, and G. Soyez | Fastjet user manual | EPJC 72 (2012) 1896 | 1111.6097 |
| 44 | M. Cacciari, G. P. Salam, and G. Soyez | The anti-k$ _{\mathrm T} $ jet clustering algorithm | JHEP 04 (2008) 063 | 0802.1189 |
| 45 | J. Alwall et al. | MadGraph5: going beyond | JHEP 06 (2011) 128 | 1106.0522 |
| 46 | J. Alwall et al. | The automated computation of tree-level and next-to-leading order differential cross sections, and their matching to parton shower simulations | JHEP 07 (2014) 079 | 1405.0301 |
| 47 | J. Pumplin et al. | New generation of parton distributions with uncertainties from global QCD analysis | JHEP 07 (2002) 012 | hep-ph/0201195 |
| 48 | T. Sjostrand, S. Mrenna, and P. Skands | PYTHIA 6.4 physics and manual | JHEP 05 (2006) 026 | hep-ph/0603175 |
| 49 | R. Field | Early LHC underlying event data - findings and surprises | in 22nd Hadron Collider Physics Symposium (HCP 2010), W. Trischuk, ed Toronto | 1010.3558 |
| 50 | S. Hoche et al. | Matching parton showers and matrix elements | hep-ph/0602031 | |
| 51 | GEANT4 Collaboration | GEANT4---a simulation toolkit | NIMA 506 (2003) 250 | |
| 52 | R. Gavin, Y. Li, F. Petriello, and S. Quackenbush | W physics at the LHC with FEWZ 2.1 | 1201.5896 | |
| 53 | R. Gavin, Y. Li, F. Petriello, and S. Quackenbush | FEWZ 2.0: A code for hadronic Z production at next-to-next-to-leading order | 1011.3540 | |
| 54 | M. Czakon and A. Mitov | Top++: a program for the calculation of the top-pair cross-section at hadron colliders | Comp. Phys. Commun. 185 (2014) 2930 | 1112.5675 |
| 55 | CMS Collaboration | Performance of the cms missing transverse momentum reconstruction in pp data at $ \sqrt{s} = $ 8 tev | JINST 10 (2015) 2006 | CMS-JME-13-003 1411.0511 |
| 56 | CMS Collaboration | Particle--flow event reconstruction in CMS and performance for jets, taus, and $ E_{\mathrm{T}}^{\text{miss}} $ | CDS | |
| 57 | CMS Collaboration | Commissioning of the Particle-flow Event Reconstruction with the first LHC collisions recorded in the CMS detector | CMS-PAS-PFT-10-001 | |
| 58 | CMS Collaboration | Performance of electron reconstruction and selection with the CMS detector in proton-proton collisions at $ \sqrt{s} = $ 8 TeV | JINST 10 (2015) P06005 | CMS-EGM-13-001 1502.02701 |
| 59 | CMS Collaboration | Performance of b tagging at $ \sqrt{s} = $ 8 TeV in multijet, $ \mathrm{ t \bar{t} } $ and boosted topology events | CMS-PAS-BTV-13-001 | CMS-PAS-BTV-13-001 |
| 60 | CMS Collaboration | Identification of b-quark jets with the CMS experiment | JINST 8 (2013) 4013 | CMS-BTV-12-001 1211.4462 |
| 61 | CMS Collaboration | Search for dark matter, extra dimensions, and unparticles in monojet events in proton-proton collisions $ \sqrt{s} = $ 8 tev | Euro. Phys. J. C 75 (2015) 235 | CMS-EXO-12-048 1408.3583 |
| 62 | D. Bourilkov, R. C. Group, and M. R. Whalley | LHAPDF: PDF use from the Tevatron to the LHC | in TeV4LHC Workshop - 4th meeting Batavia, Illinois, October 20-22, 2005 2006 | hep-ph/0605240 |
| 63 | S. Alekhin et al. | The PDF4LHC Working Group Interim Report | 1101.0536 | |
| 64 | M. Botje et al. | The PDF4LHC Working Group Interim Recommendations | 1101.0538 | |
| 65 | P. M. Nadolsky et al. | Implications of CTEQ global analysis for collider observables | PRD 78 (2008) 013004 | 0802.0007 |
| 66 | A. D. Martin, W. J. Stirling, R. S. Thorne, and G. Watt | Update of parton distributions at NNLO | PLB 652 (2007) 292 | 0706.0459 |
| 67 | M. Beltr\'an et al. | Maverick dark matter at colliders | JHEP 09 (2010) 037 | 1002.4137 |
| 68 | Y. Bai, P. J. Fox, and R. Harnik | The Tevatron at the Frontier of Dark Matter Direct Detection | JHEP 12 (2010) 048 | 1005.3797 |
| 69 | P. J. Fox, R. Harnik, J. Kopp, and Y. Tsai | Missing energy signatures of dark matter at the lhc | PRD 85 (2012) 056011 | 1109.4398 |
| 70 | ATLAS Collaboration | Procedure for the LHC Higgs boson search combination in summer 2011 | ATL-PHYS-PUB-2011-011 | |
| 71 | CMS Collaboration | Procedure for the LHC Higgs boson search combination in Summer 2011 | CDS | |
| 72 | J. Goodman et al. | Constraints on dark matter from colliders | PRD 82 (2010) 116010 | 1008.1783 |
| 73 | A. Friedland, M. L. Graesser, I. M. Shoemaker, and L. Vecchi | Probing Nonstandard Standard Model Backgrounds with LHC Monojets | PLB 714 (2012) 267 | 1111.5331 |
| 74 | O. Buchmueller, M. J. Dolan, and C. McCabe | Beyond Effective Field Theory for Dark Matter Searches at the LHC | JHEP 01 (2014) 025 | 1308.6799 |
| 75 | G. Busoni, A. De Simone, E. Morgante, and A. Riotto | On the Validity of the Effective Field Theory for Dark Matter Searches at the LHC | PLB 728 (2014) 412 | 1307.2253 |
| 76 | G. Busoni et al. | On the Validity of the Effective Field Theory for Dark Matter Searches at the LHC, Part II: Complete Analysis for the $ s $-channel | JCAP 06 (2014) 060 | 1402.1275 |
| 77 | G. Busoni et al. | On the Validity of the Effective Field Theory for Dark Matter Searches at the LHC Part III: Analysis for the $ t $-channel | JCAP 09 (2014) 022 | 1405.3101 |
| 78 | Super-Kamiokande Collaboration | An indirect search for weakly interacting massive particles in the sun using 3109.6 days of upward-going muons in Super-Kamiokande | Astrophys. J. 742 (2011) 78 | 1108.3384 |
| 79 | IceCube Collaboration | Multiyear search for dark matter annihilations in the Sun with the AMANDA-II and IceCube detectors | PRD 85 (2012) 042002 | 1112.1840 |
| 80 | COUPP Collaboration | First dark matter search results from a 4-kg $ {\mathrm{cf}}_{3}\mathbf{I} $ bubble chamber operated in a deep underground site | PRD 86 (2012) 052001 | 1204.3094 |
| 81 | SIMPLE Collaboration | Final analysis and results of the phase ii simple dark matter search | PRL 108 (2012) 201302 | 1106.3014 |
| 82 | PICO Collaboration | Dark Matter Search Results from the PICO-2L C$ _3 $F$ _8 $ Bubble Chamber | PRL 114 (2015) 231302 | 1503.00008 |
| 83 | PICASSO Collaboration | Constraints on Low-Mass WIMP Interactions on $ ^{19}F $ from PICASSO | PLB 711 (2012) 153 | 1202.1240 |
| 84 | XENON100 Collaboration | Limits on spin-dependent WIMP-nucleon cross sections from 225 live days of XENON100 data | PRL 111 (2013) 021301 | 1301.6620 |
| 85 | CDMS-II Collaboration | Dark matter search results from the CDMS II experiment | Science 327 (2010) 1619 | |
| 86 | SuperCDMS Collaboration | Search for low-mass weakly interacting massive particles using voltage-assisted calorimetric ionization detection in the supercdms experiment | PRL 112 (2014) 041302 | 1309.3259 |
| 87 | XENON100 Collaboration | Dark matter results from 100 live days of XENON100 data | PRL 107 (2011) 131302 | 1104.2549 |
| 88 | LUX Collaboration | First results from the lux dark matter experiment at the sanford underground research facility | PRL 112 (2014) 091303 | 1310.8214 |
| 89 | CRESST-II Collaboration | Results on low mass WIMPs using an upgraded CRESST-II detector | EPJC 74 (2014) 3184 | 1407.3146 |
| 90 | CRESST Collaboration | Results on light dark matter particles with a low-threshold CRESST-II detector | 1509.01515 | |
| 91 | T. Lin, E. W. Kolb, and L.-T. Wang | Probing dark matter couplings to top and bottom quarks at the LHC | PRD 88 (2013) 063510 | 1303.6638 |
|
|
Compact Muon Solenoid LHC, CERN |
|

|

|

|

|

|