

Compact Muon Solenoid
LHC, CERN
| CMS-EXO-14-008 ; CERN-PH-EP-2015-063 | ||
| Search for third-generation scalar leptoquarks in the t$\tau$ channel in proton-proton collisions at $\sqrt{s}= $ 8 TeV | ||
| CMS Collaboration | ||
| 31 March 2015 | ||
| J. High Energy Phys. 07 (2015) 042 [Erratum] | ||
| Abstract: A search for pair production of third-generation scalar leptoquarks decaying to top quark and $\tau$ lepton pairs is presented using proton-proton collision data at a center-of-mass energy of $\sqrt{s}=$ 8 TeV collected with the CMS detector at the LHC and corresponding to an integrated luminosity of 19.7 fb$^{-1}$. The search is performed using events that contain an electron or a muon, a hadronically decaying $\tau$ lepton, and two or more jets. The observations are found to be consistent with the standard model predictions. Assuming that all leptoquarks decay to a top quark and a $\tau$ lepton, the existence of pair produced, charge $-1/3$, third-generation leptoquarks up to a mass of 685 GeV is excluded at 95% confidence level. This result constitutes the first direct limit for leptoquarks decaying into a top quark and a $\tau$ lepton, and may also be applied directly to the pair production of bottom squarks decaying predominantly via the R-parity violating coupling $\lambda^{\prime}_{333}$. | ||
| Links: e-print arXiv:1503.09049 [hep-ex] (PDF) ; CDS record ; inSPIRE record ; Public twiki page ; CADI line (restricted) ; | ||
| Figures | |
png pdf |
Figure 1:
One of the $ {\mathrm {LQ}_3} {\overline {\mathrm {LQ}}_3} $ decay chains with both same-sign and opposite-sign $\ell {\tau _\mathrm {h}} $ pairs. Labels u and d denote up and down type quarks, and $\ell $ denotes an electron or a muon. |
png pdf |
Figure 2:
Comparison between data and simulation in the $| \eta | $ (left) and $ {S_\mathrm {T}} $ (right) distributions using the signal-depleted selection of events in category A with a same-sign $\mu {\tau _\mathrm {h}} $ pair. Other backgrounds refer to contributions predominantly from processes such as diboson and single top quark production, as well as QCD multijet and other rare SM processes detailed in Section {DataMCsamples}. The hatched regions in the distributions and the shaded bands in the Data/MC ratio plots represent the statistical uncertainties in the expectations. The data-simulation agreement is observed to be within 20%, and is assigned as the normalization systematic uncertainty for the ${\mathrm{ t } {}\mathrm{ \bar{t} } } $+jets, DY+jets and diboson contributions in the signal region. |
png pdf |
Figure 2-a:
Comparison between data and simulation in the $| \eta | $ (left) and $ {S_\mathrm {T}} $ (right) distributions using the signal-depleted selection of events in category A with a same-sign $\mu {\tau _\mathrm {h}} $ pair. Other backgrounds refer to contributions predominantly from processes such as diboson and single top quark production, as well as QCD multijet and other rare SM processes detailed in Section {DataMCsamples}. The hatched regions in the distributions and the shaded bands in the Data/MC ratio plots represent the statistical uncertainties in the expectations. The data-simulation agreement is observed to be within 20%, and is assigned as the normalization systematic uncertainty for the ${\mathrm{ t } {}\mathrm{ \bar{t} } } $+jets, DY+jets and diboson contributions in the signal region. |

png pdf |
Figure 2-b:
Comparison between data and simulation in the $| \eta | $ (left) and $ {S_\mathrm {T}} $ (right) distributions using the signal-depleted selection of events in category A with a same-sign $\mu {\tau _\mathrm {h}} $ pair. Other backgrounds refer to contributions predominantly from processes such as diboson and single top quark production, as well as QCD multijet and other rare SM processes detailed in Section {DataMCsamples}. The hatched regions in the distributions and the shaded bands in the Data/MC ratio plots represent the statistical uncertainties in the expectations. The data-simulation agreement is observed to be within 20%, and is assigned as the normalization systematic uncertainty for the ${\mathrm{ t } {}\mathrm{ \bar{t} } } $+jets, DY+jets and diboson contributions in the signal region. |
png pdf |
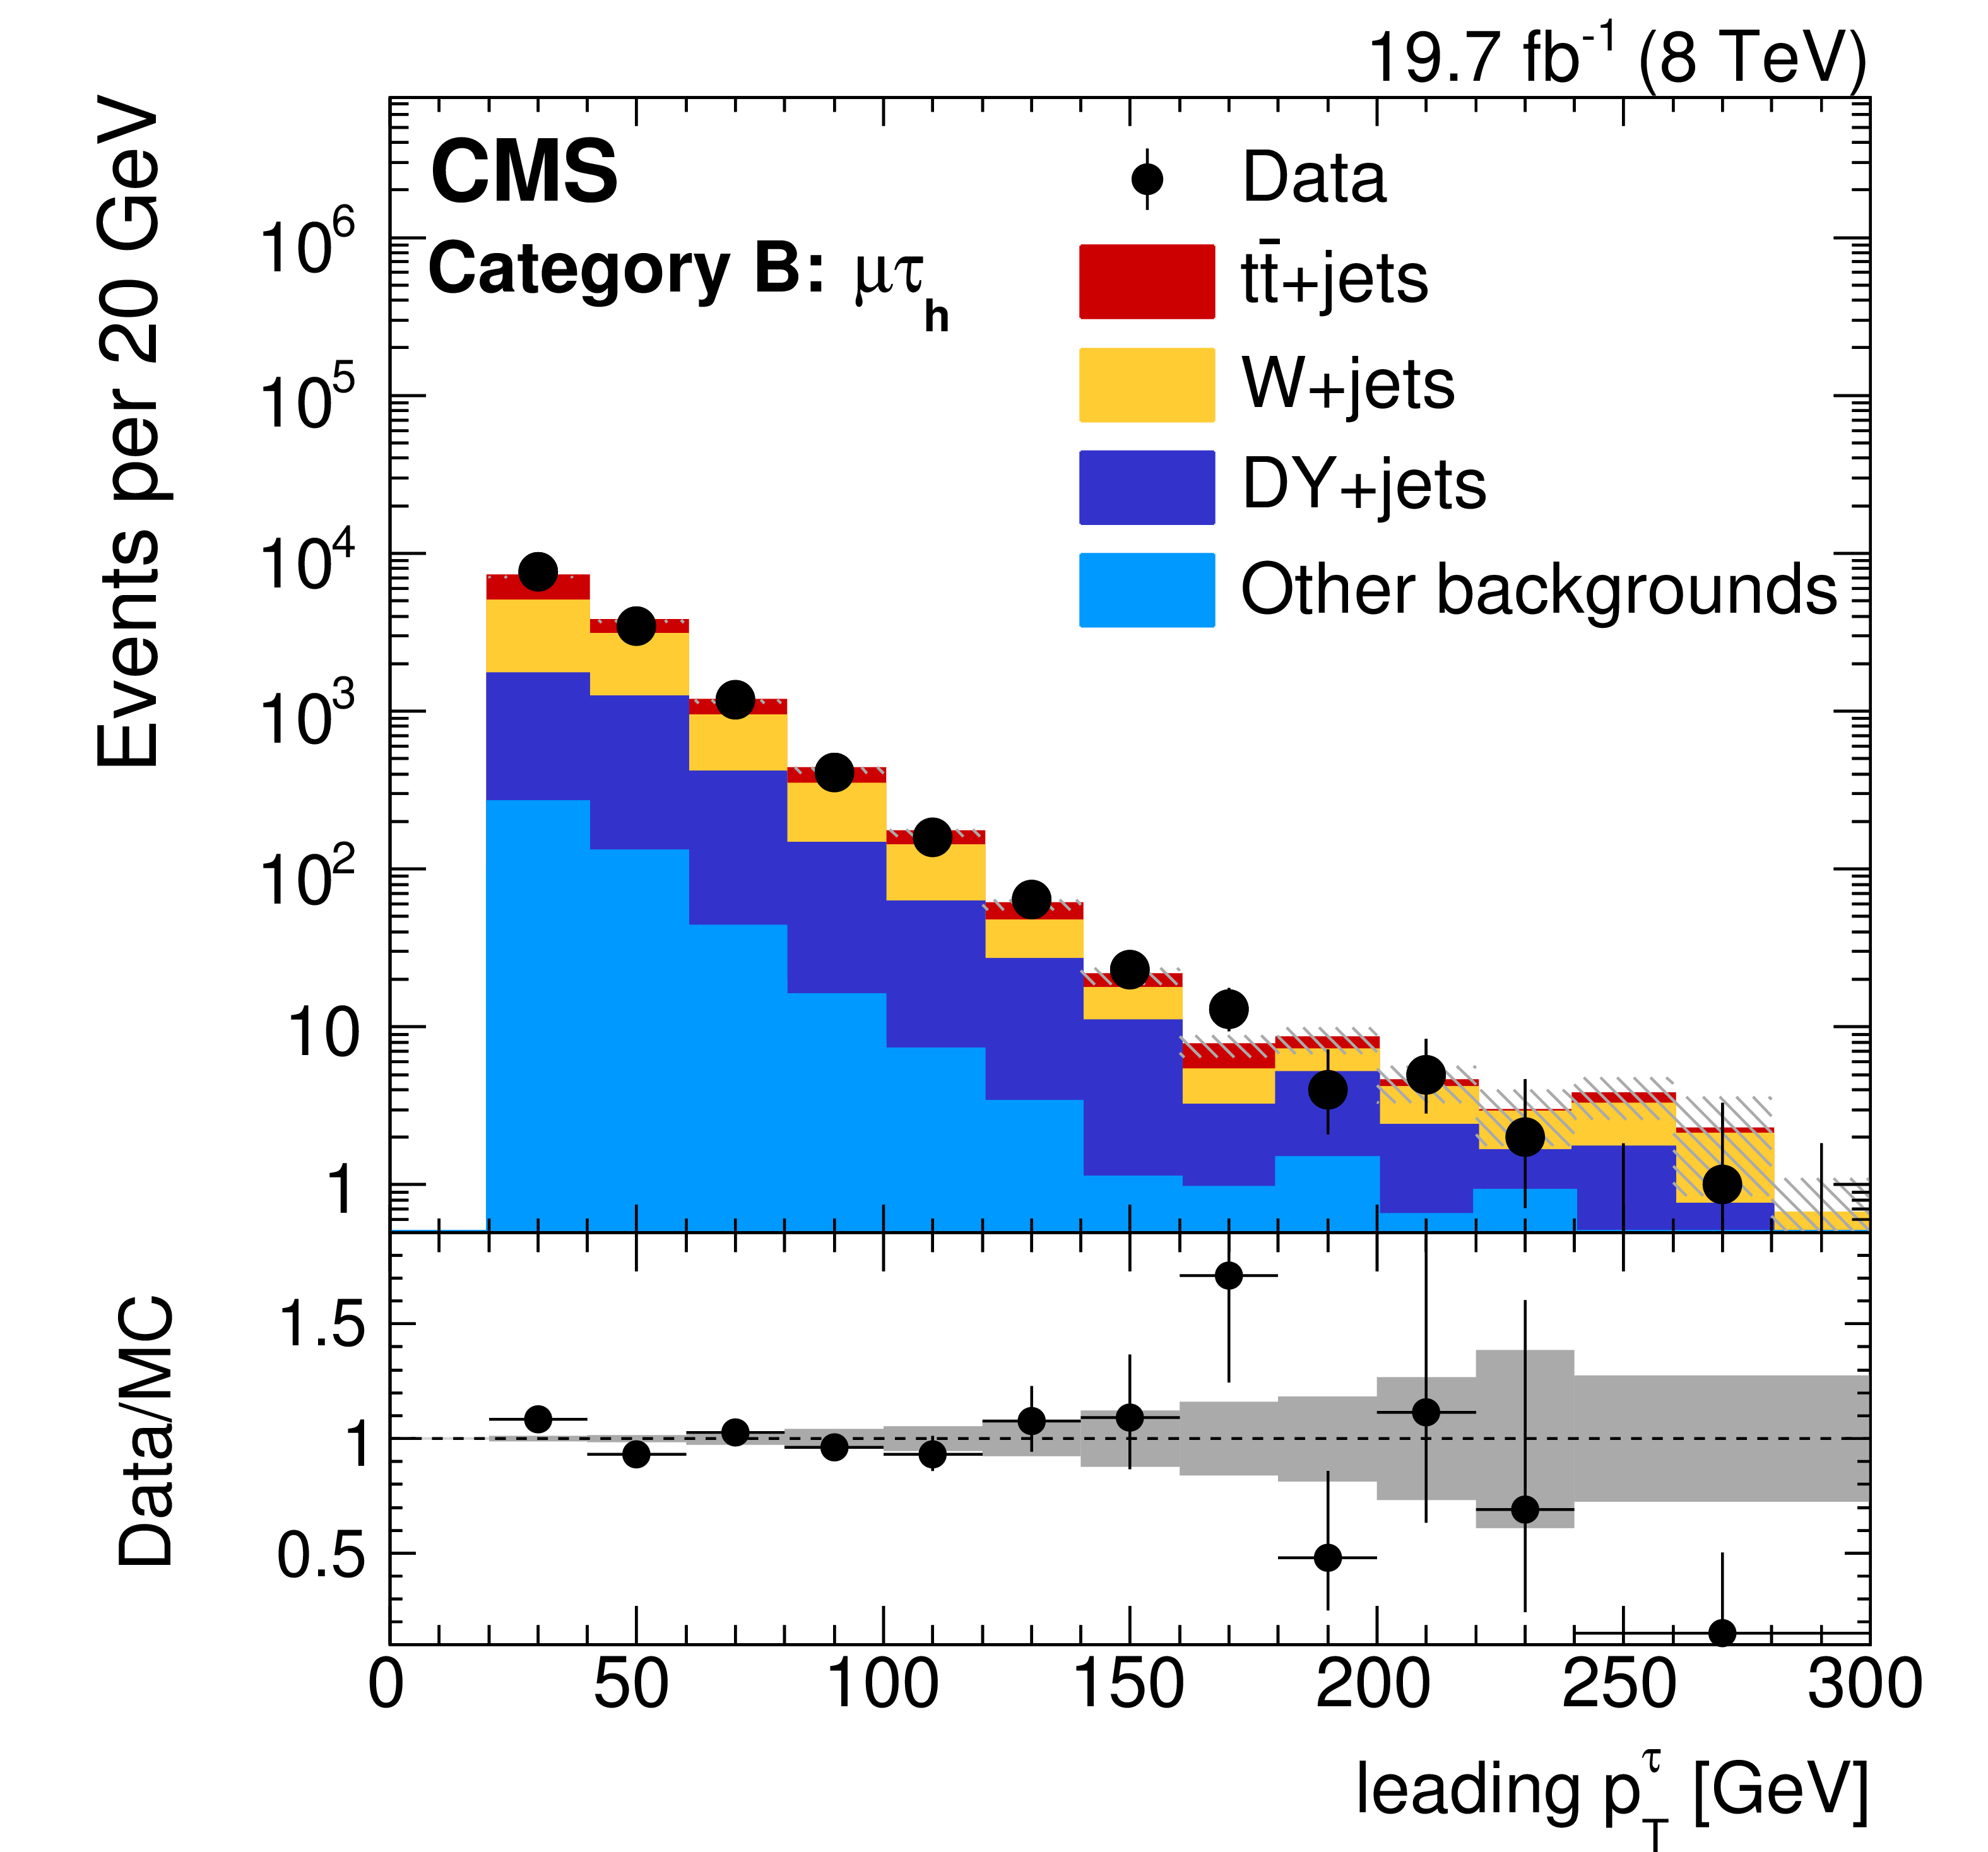
Figure 3:
Comparison between data and simulation in the leading $\tau $ lepton $ {p_{\mathrm {T}}} $ distributions using the signal-depleted selection of events in category B in the $\mu {\tau _\mathrm {h}} $ channel (left) and in the $\mathrm{ e } {\tau _\mathrm {h}} $ channel (right). Other backgrounds refer to contributions predominantly from processes such as diboson and single top quark production, but also include QCD multijet and rare SM processes detailed in the text. The hatched regions in the distributions and the shaded bands in the Data/MC ratio plots represent the statistical uncertainties in the expectations. |
png pdf |
Figure 3-a:
Comparison between data and simulation in the leading $\tau $ lepton $ {p_{\mathrm {T}}} $ distributions using the signal-depleted selection of events in category B in the $\mu {\tau _\mathrm {h}} $ channel (left) and in the $\mathrm{ e } {\tau _\mathrm {h}} $ channel (right). Other backgrounds refer to contributions predominantly from processes such as diboson and single top quark production, but also include QCD multijet and rare SM processes detailed in the text. The hatched regions in the distributions and the shaded bands in the Data/MC ratio plots represent the statistical uncertainties in the expectations. |

png pdf |
Figure 3-b:
Comparison between data and simulation in the leading $\tau $ lepton $ {p_{\mathrm {T}}} $ distributions using the signal-depleted selection of events in category B in the $\mu {\tau _\mathrm {h}} $ channel (left) and in the $\mathrm{ e } {\tau _\mathrm {h}} $ channel (right). Other backgrounds refer to contributions predominantly from processes such as diboson and single top quark production, but also include QCD multijet and rare SM processes detailed in the text. The hatched regions in the distributions and the shaded bands in the Data/MC ratio plots represent the statistical uncertainties in the expectations. |
png pdf |
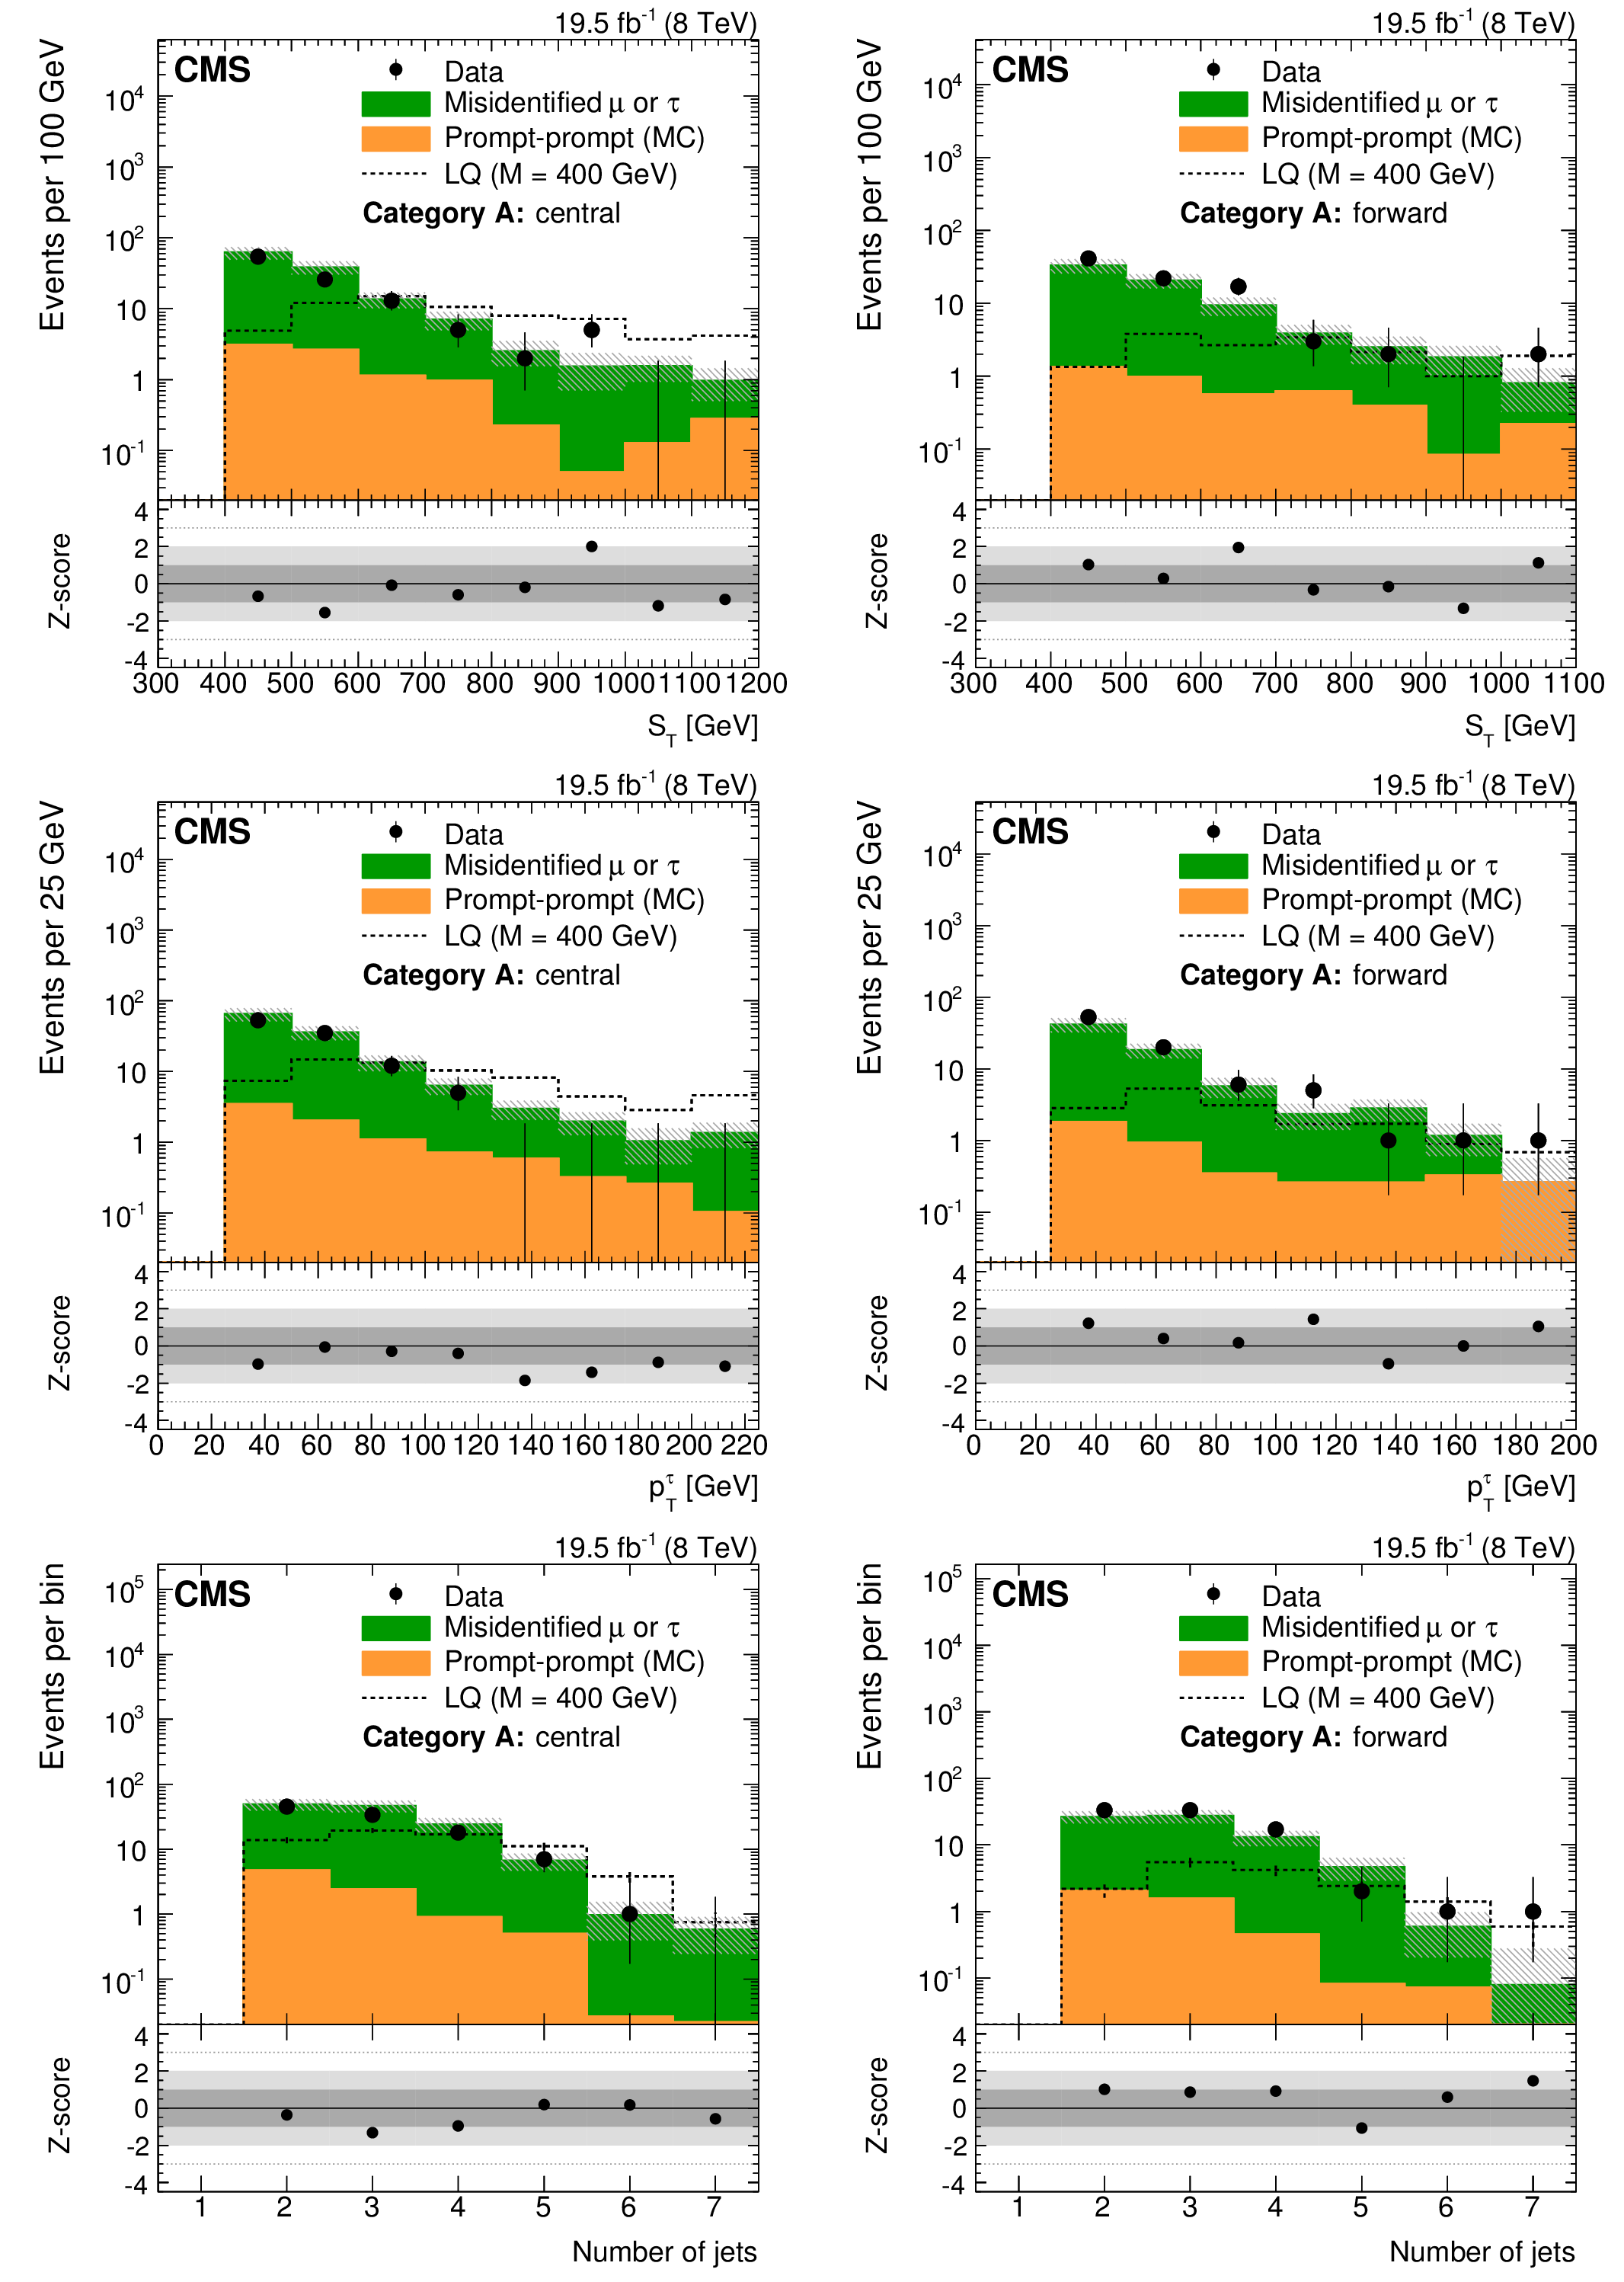
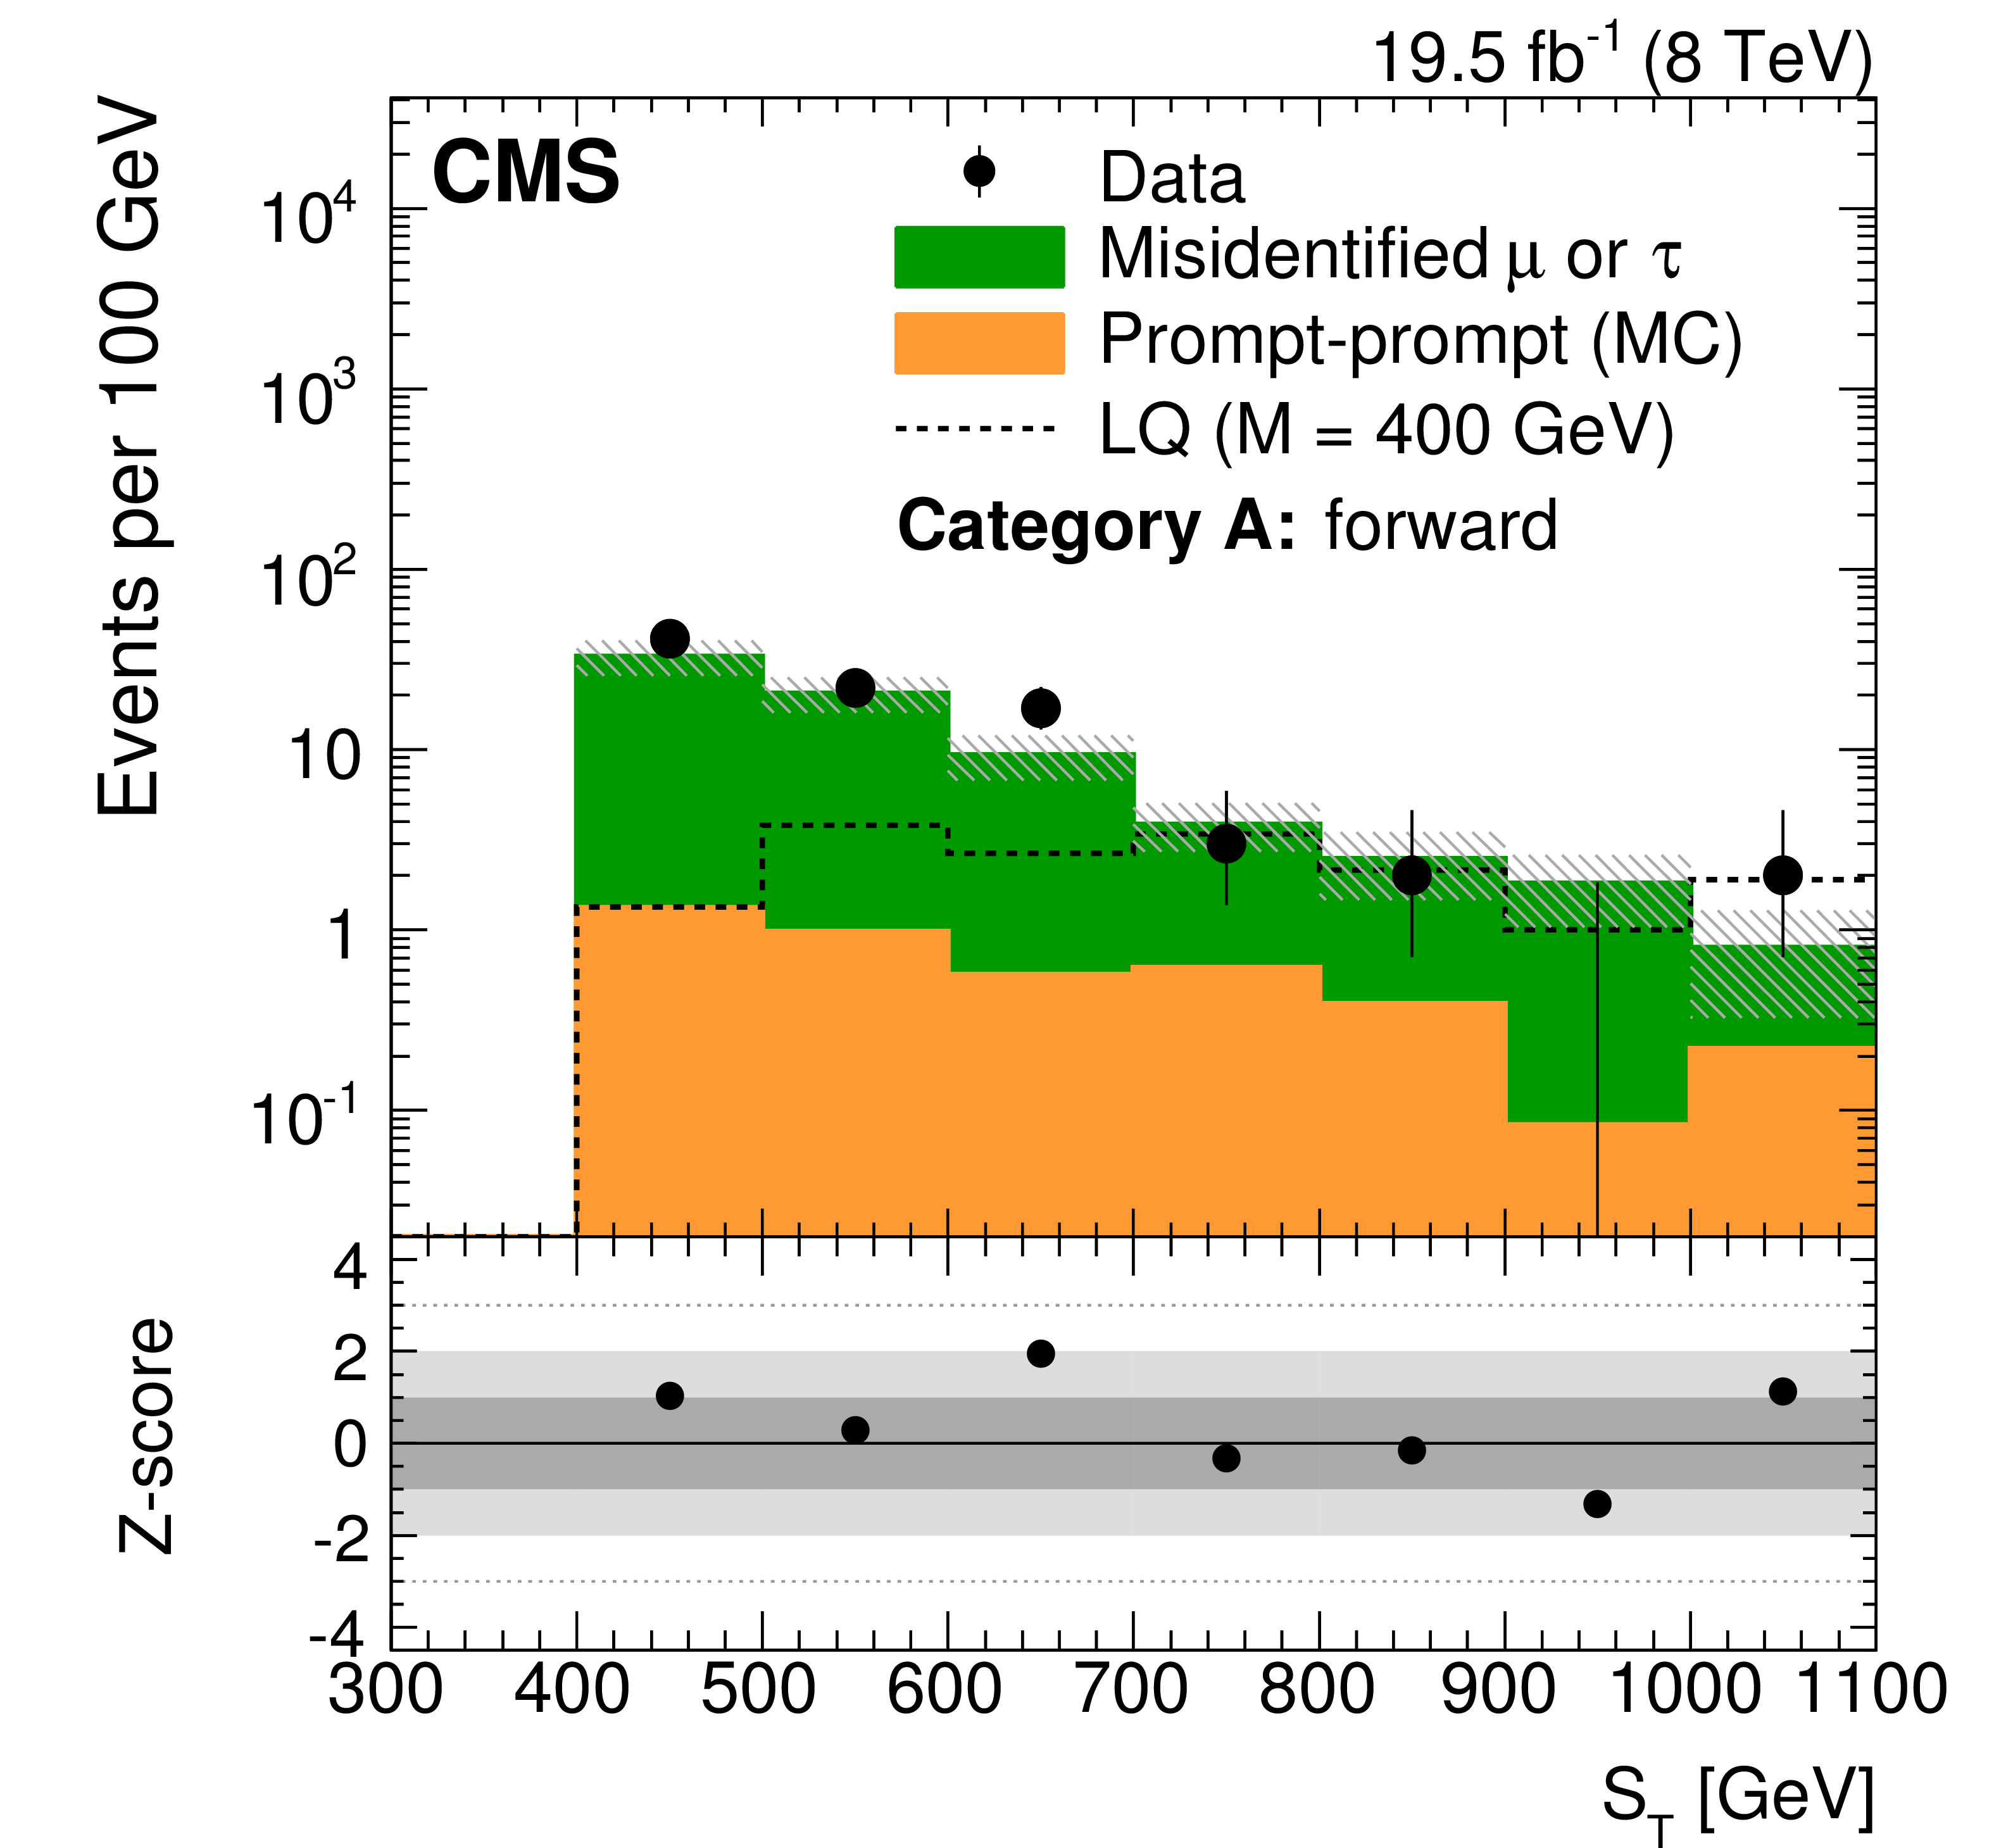
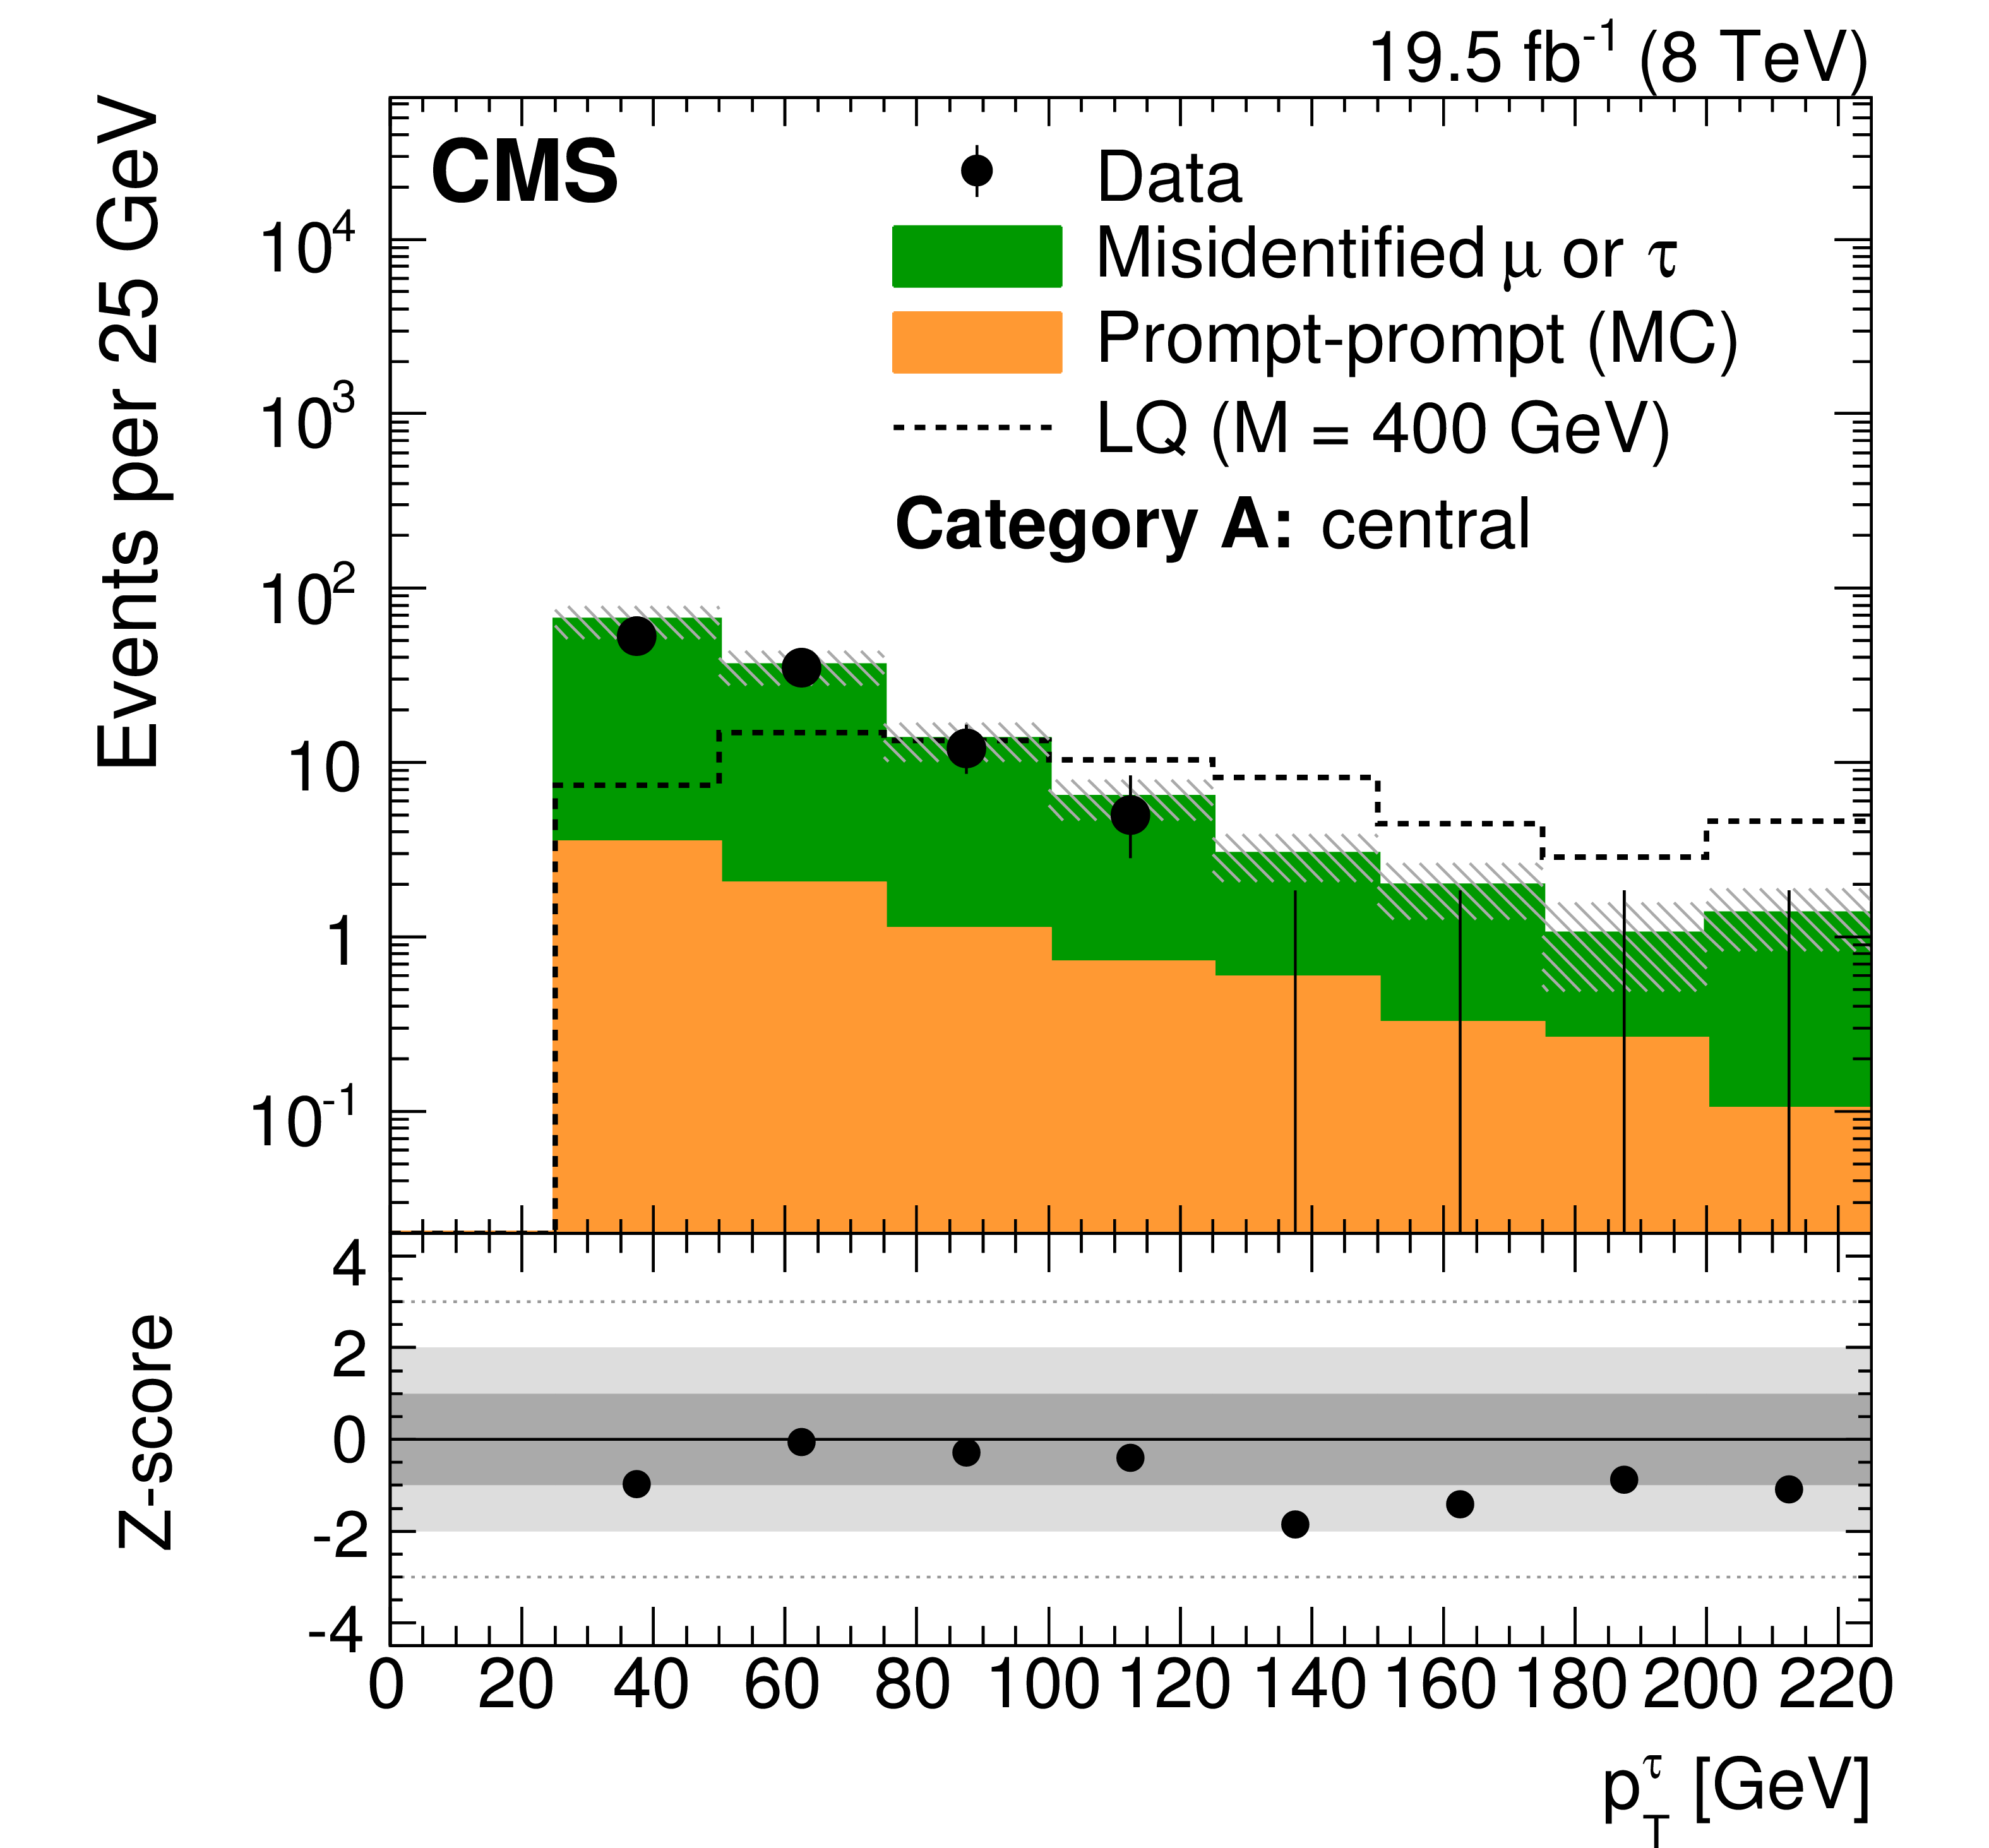
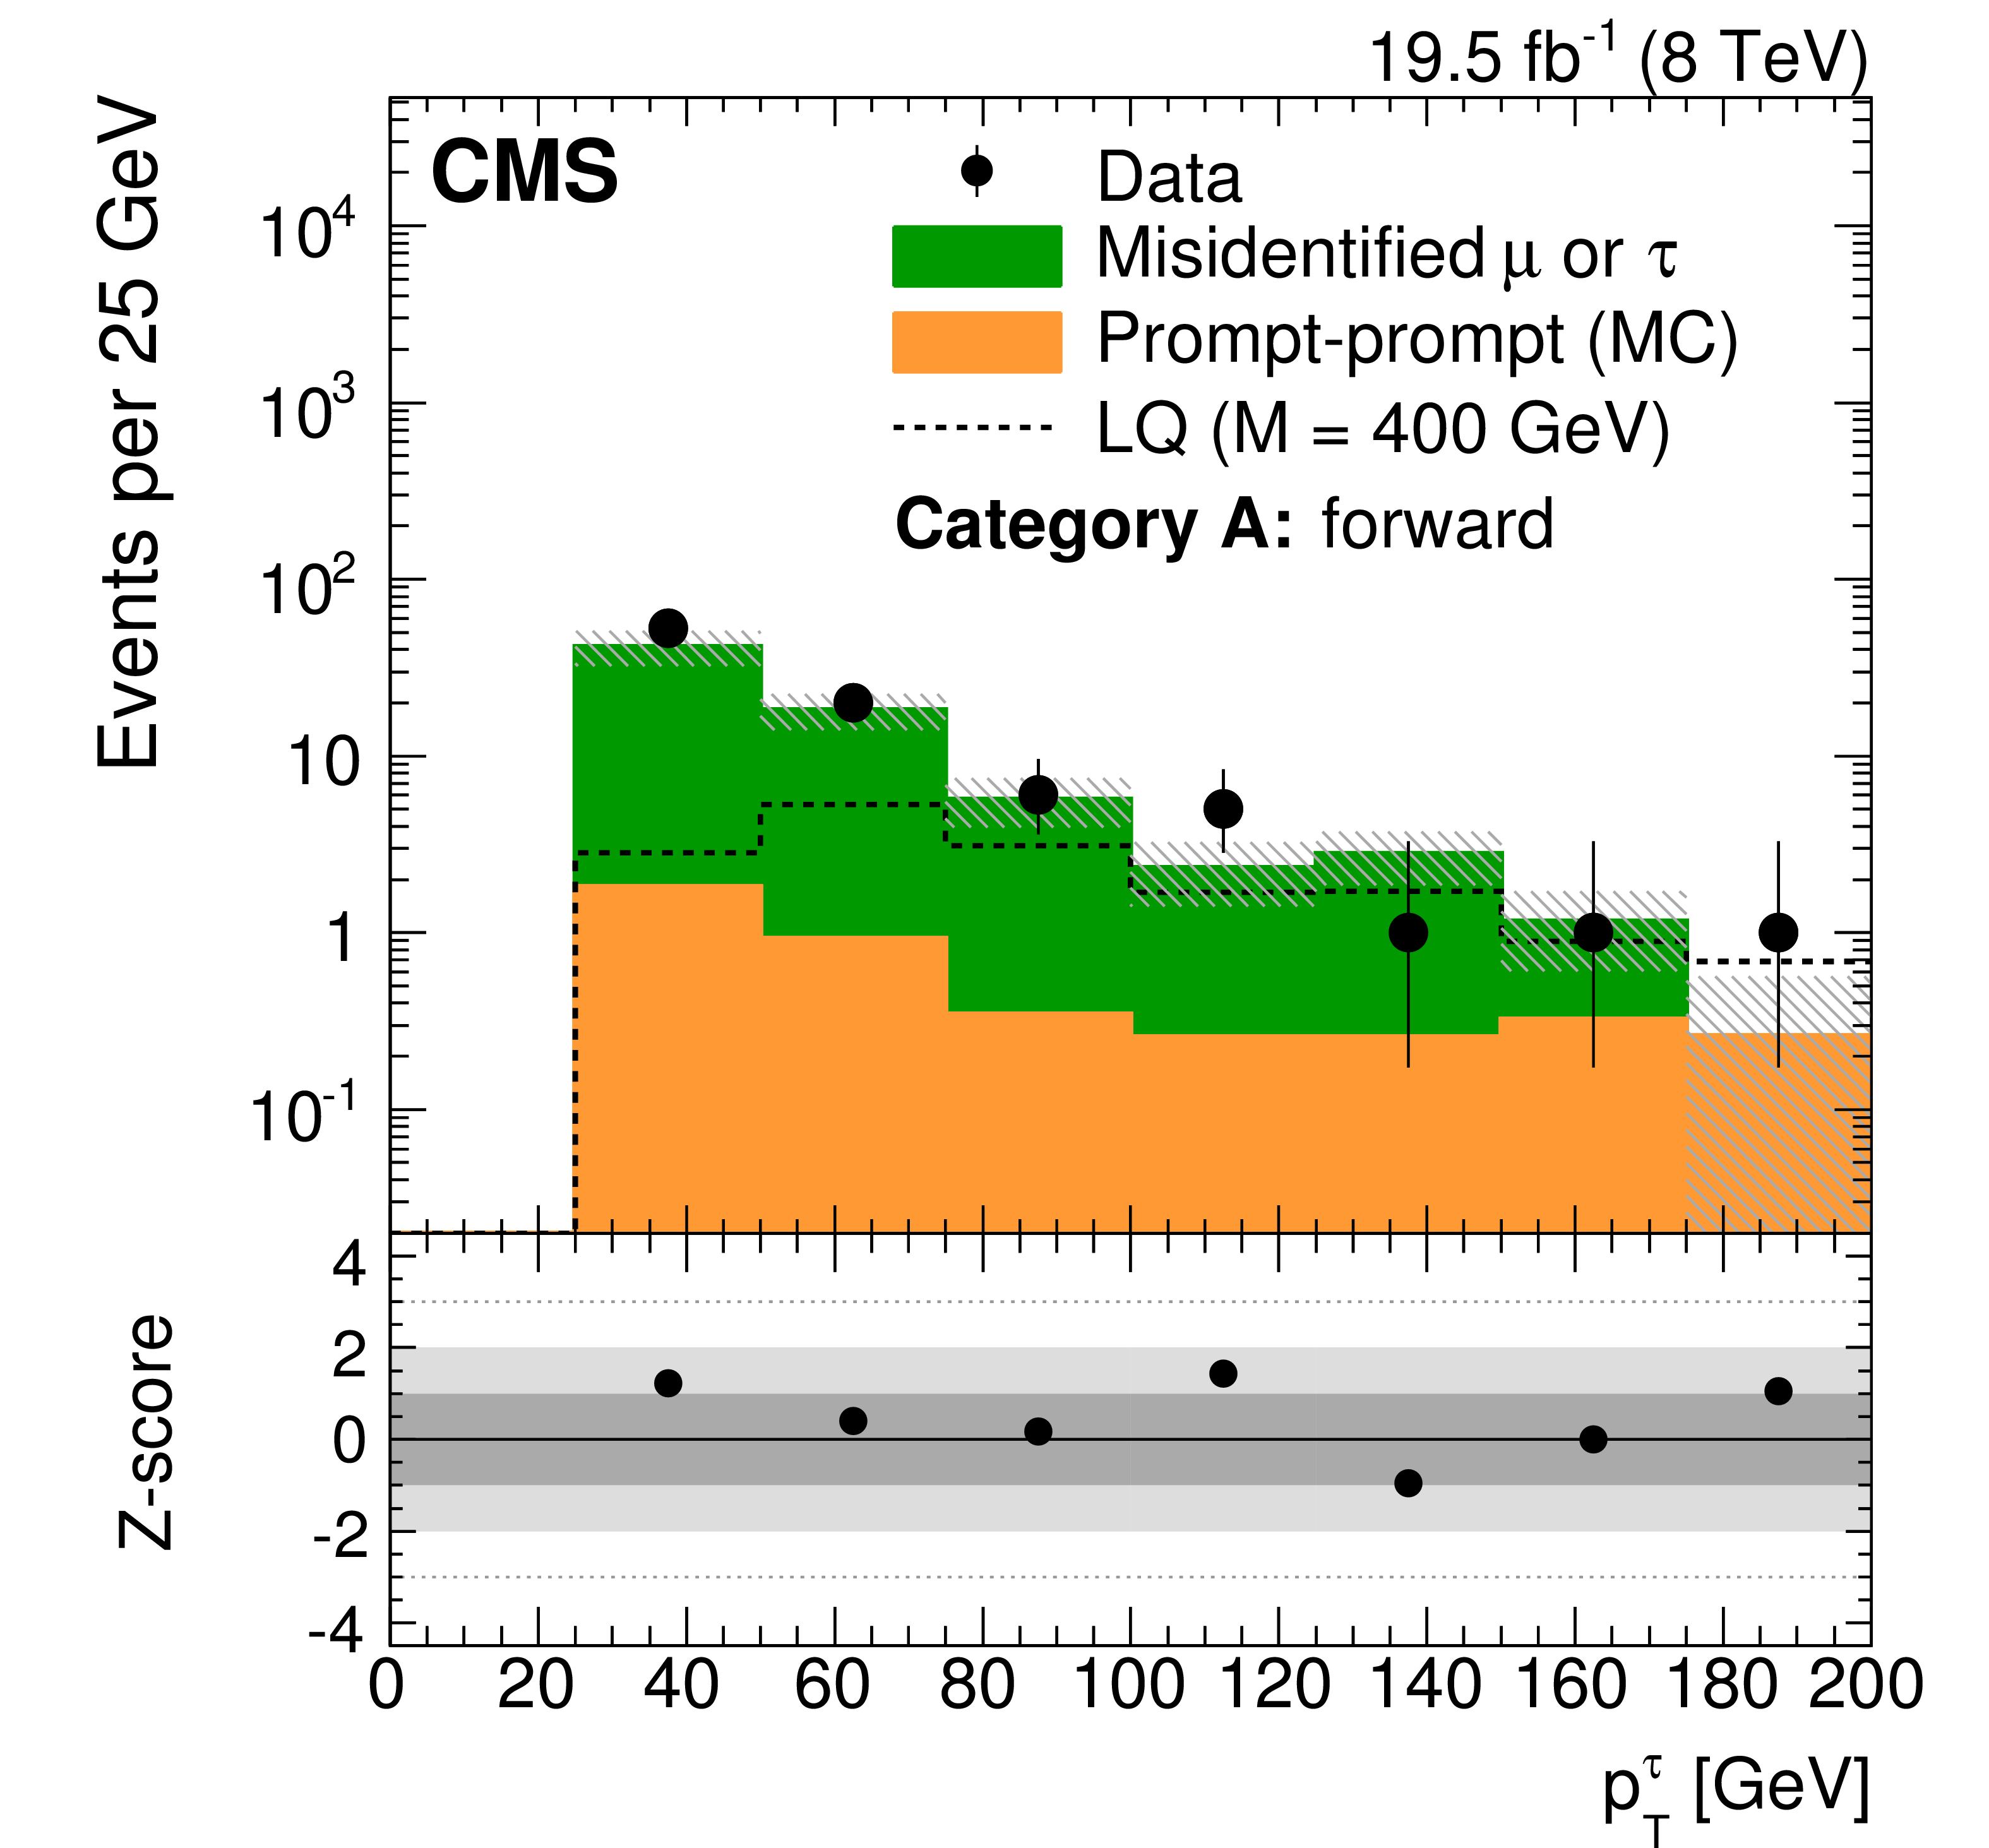
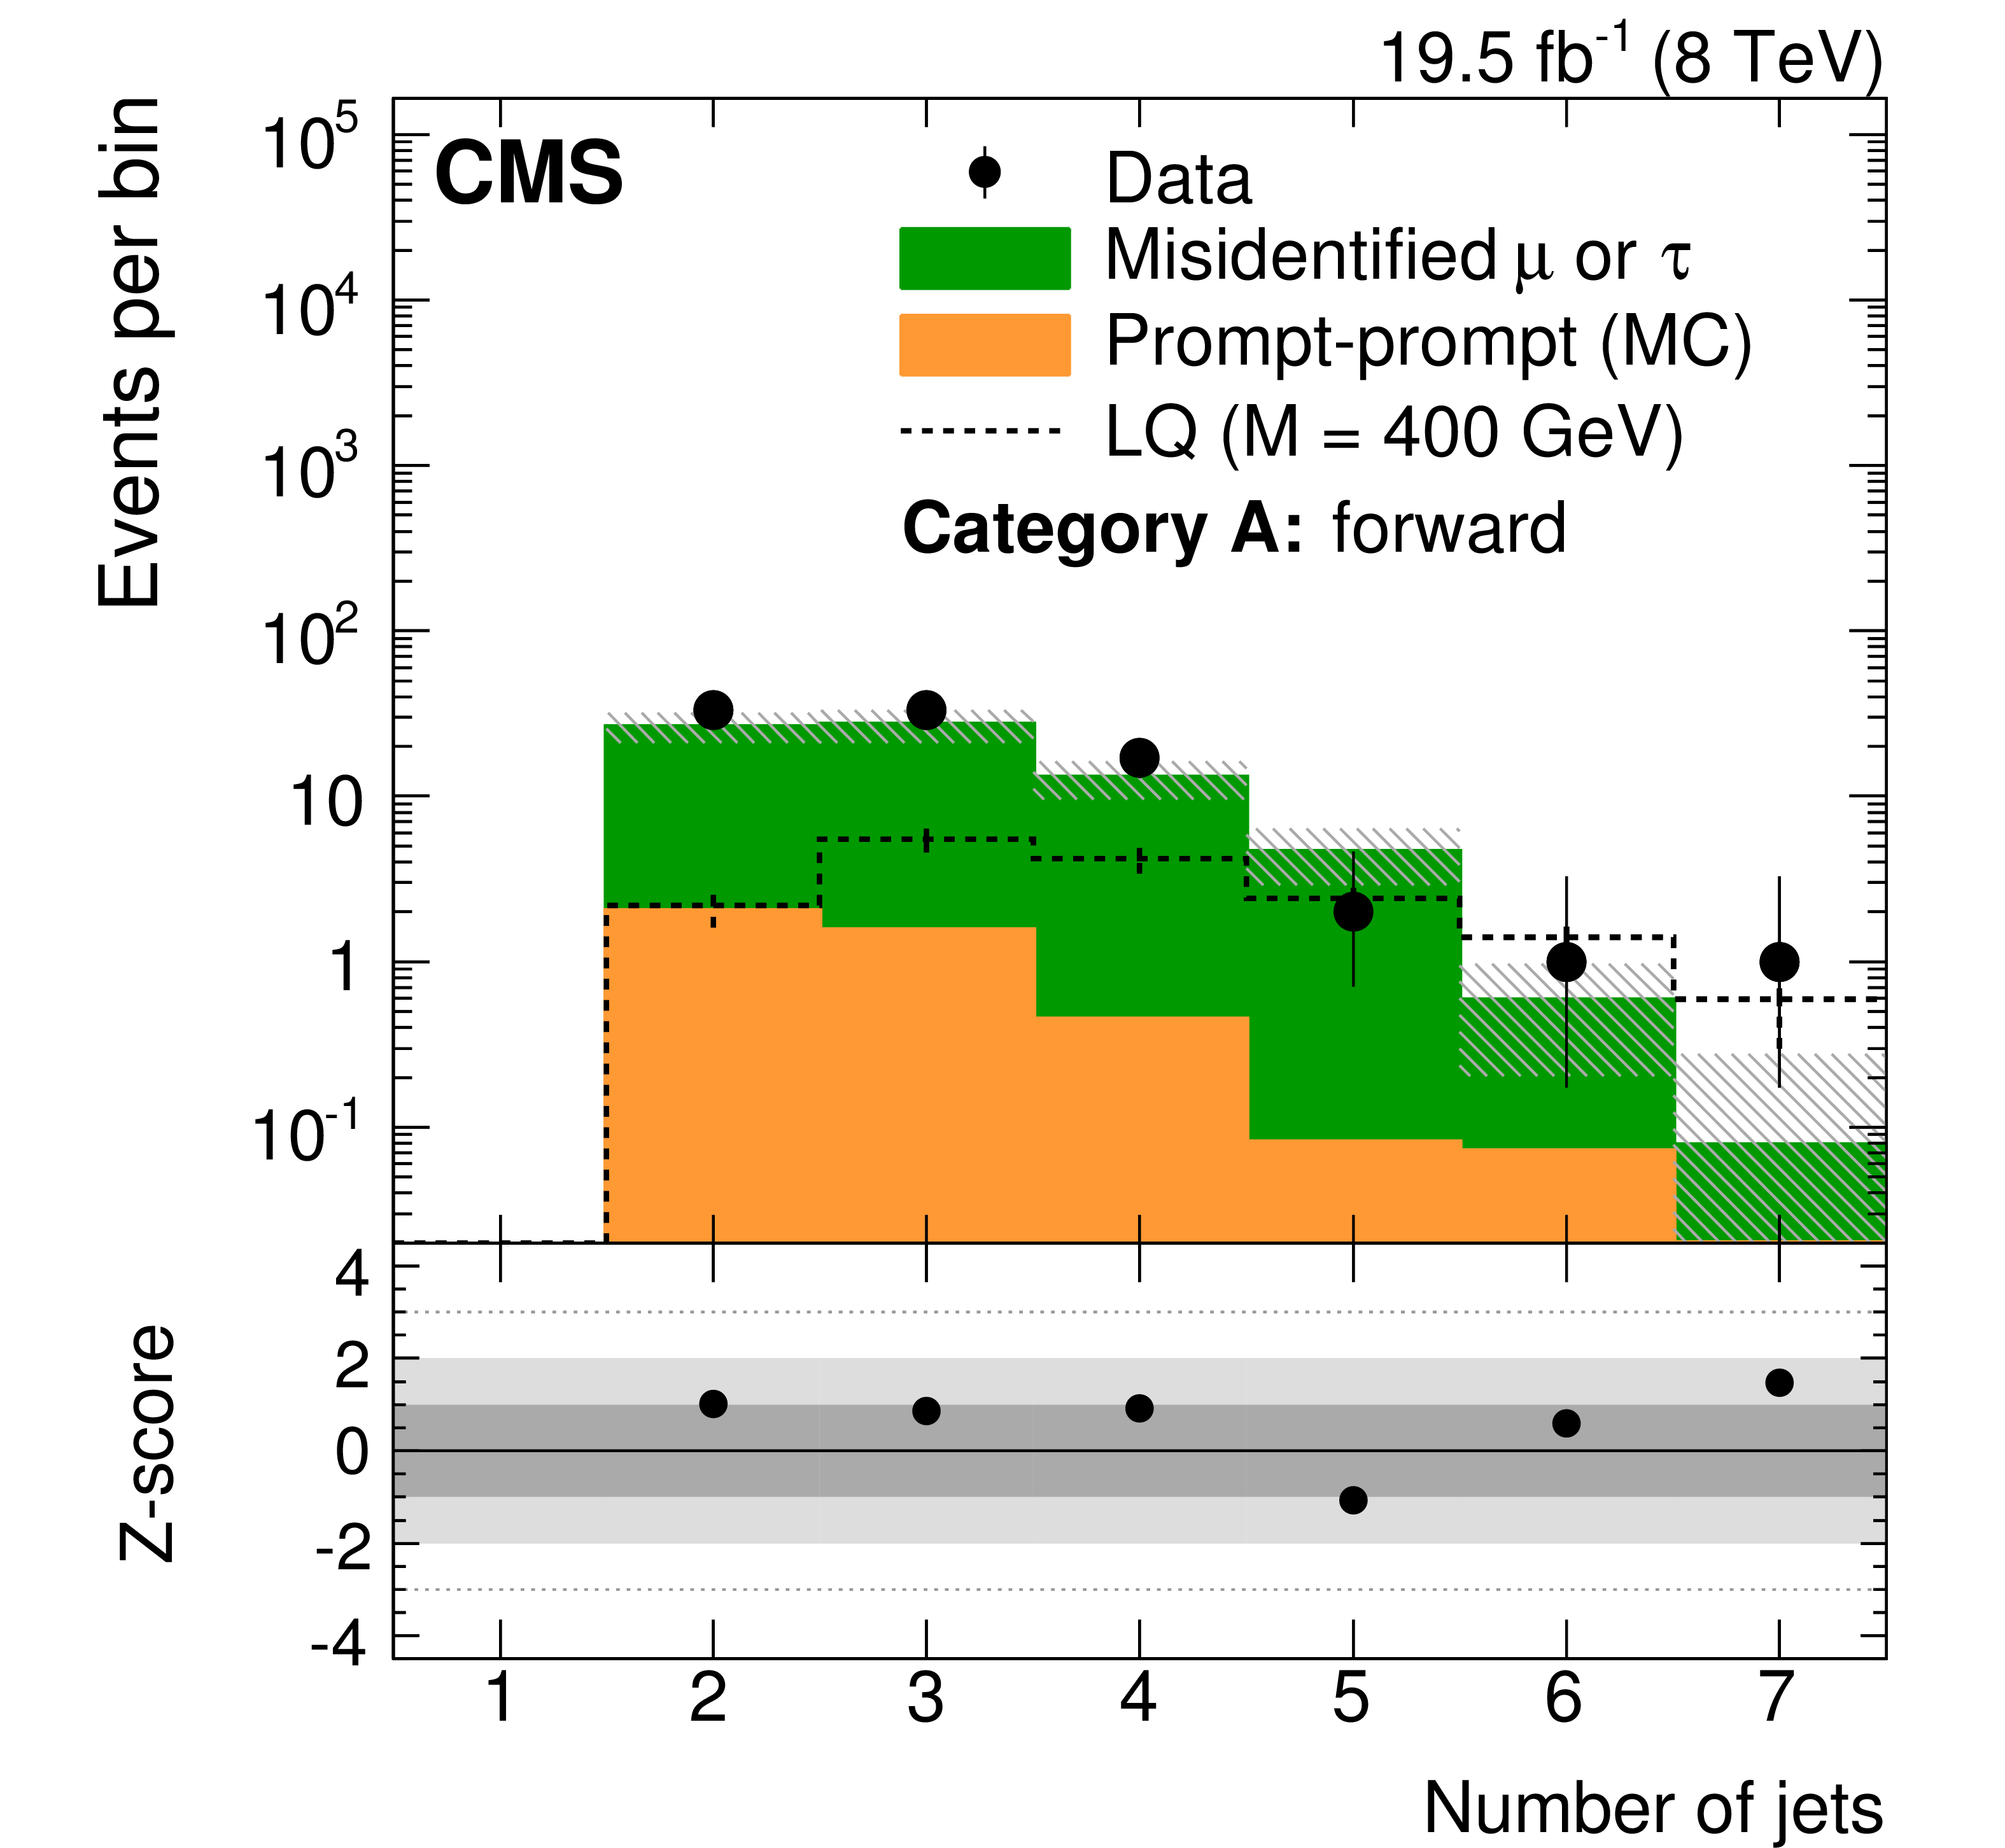
Figure 4:
The $ {S_\mathrm {T}} $, $\tau $ lepton $ {p_{\mathrm {T}}} $, and jet multiplicity distributions in the signal region of category A for central (left column) and forward (right column) channels, using the optimized selection for $M_{ {\mathrm {LQ}_3} }= $ 200 GeV (all other optimized selection criteria yield events that are a subset of this selection). The rightmost bin of each distribution includes overflow and no statistically significant excess is observed in the suppressed bins. The systematic uncertainty for each bin of these distributions is determined independently. Shaded regions in the histograms represent the total statistical and systematic uncertainty in the background expectation. The Z-score distribution is provided at the bottom of each plot. |

png pdf |
Figure 4-a:
The $ {S_\mathrm {T}} $, $\tau $ lepton $ {p_{\mathrm {T}}} $, and jet multiplicity distributions in the signal region of category A for central (left column) and forward (right column) channels, using the optimized selection for $M_{ {\mathrm {LQ}_3} }= $ 200 GeV (all other optimized selection criteria yield events that are a subset of this selection). The rightmost bin of each distribution includes overflow and no statistically significant excess is observed in the suppressed bins. The systematic uncertainty for each bin of these distributions is determined independently. Shaded regions in the histograms represent the total statistical and systematic uncertainty in the background expectation. The Z-score distribution is provided at the bottom of each plot. |
png pdf |
Figure 4-b:
The $ {S_\mathrm {T}} $, $\tau $ lepton $ {p_{\mathrm {T}}} $, and jet multiplicity distributions in the signal region of category A for central (left column) and forward (right column) channels, using the optimized selection for $M_{ {\mathrm {LQ}_3} }= $ 200 GeV (all other optimized selection criteria yield events that are a subset of this selection). The rightmost bin of each distribution includes overflow and no statistically significant excess is observed in the suppressed bins. The systematic uncertainty for each bin of these distributions is determined independently. Shaded regions in the histograms represent the total statistical and systematic uncertainty in the background expectation. The Z-score distribution is provided at the bottom of each plot. |
png pdf |
Figure 4-c:
The $ {S_\mathrm {T}} $, $\tau $ lepton $ {p_{\mathrm {T}}} $, and jet multiplicity distributions in the signal region of category A for central (left column) and forward (right column) channels, using the optimized selection for $M_{ {\mathrm {LQ}_3} }= $ 200 GeV (all other optimized selection criteria yield events that are a subset of this selection). The rightmost bin of each distribution includes overflow and no statistically significant excess is observed in the suppressed bins. The systematic uncertainty for each bin of these distributions is determined independently. Shaded regions in the histograms represent the total statistical and systematic uncertainty in the background expectation. The Z-score distribution is provided at the bottom of each plot. |
png pdf |
Figure 4-d:
The $ {S_\mathrm {T}} $, $\tau $ lepton $ {p_{\mathrm {T}}} $, and jet multiplicity distributions in the signal region of category A for central (left column) and forward (right column) channels, using the optimized selection for $M_{ {\mathrm {LQ}_3} }= $ 200 GeV (all other optimized selection criteria yield events that are a subset of this selection). The rightmost bin of each distribution includes overflow and no statistically significant excess is observed in the suppressed bins. The systematic uncertainty for each bin of these distributions is determined independently. Shaded regions in the histograms represent the total statistical and systematic uncertainty in the background expectation. The Z-score distribution is provided at the bottom of each plot. |

png pdf |
Figure 4-e:
The $ {S_\mathrm {T}} $, $\tau $ lepton $ {p_{\mathrm {T}}} $, and jet multiplicity distributions in the signal region of category A for central (left column) and forward (right column) channels, using the optimized selection for $M_{ {\mathrm {LQ}_3} }= $ 200 GeV (all other optimized selection criteria yield events that are a subset of this selection). The rightmost bin of each distribution includes overflow and no statistically significant excess is observed in the suppressed bins. The systematic uncertainty for each bin of these distributions is determined independently. Shaded regions in the histograms represent the total statistical and systematic uncertainty in the background expectation. The Z-score distribution is provided at the bottom of each plot. |
png pdf |
Figure 4-f:
The $ {S_\mathrm {T}} $, $\tau $ lepton $ {p_{\mathrm {T}}} $, and jet multiplicity distributions in the signal region of category A for central (left column) and forward (right column) channels, using the optimized selection for $M_{ {\mathrm {LQ}_3} }= $ 200 GeV (all other optimized selection criteria yield events that are a subset of this selection). The rightmost bin of each distribution includes overflow and no statistically significant excess is observed in the suppressed bins. The systematic uncertainty for each bin of these distributions is determined independently. Shaded regions in the histograms represent the total statistical and systematic uncertainty in the background expectation. The Z-score distribution is provided at the bottom of each plot. |
png pdf |
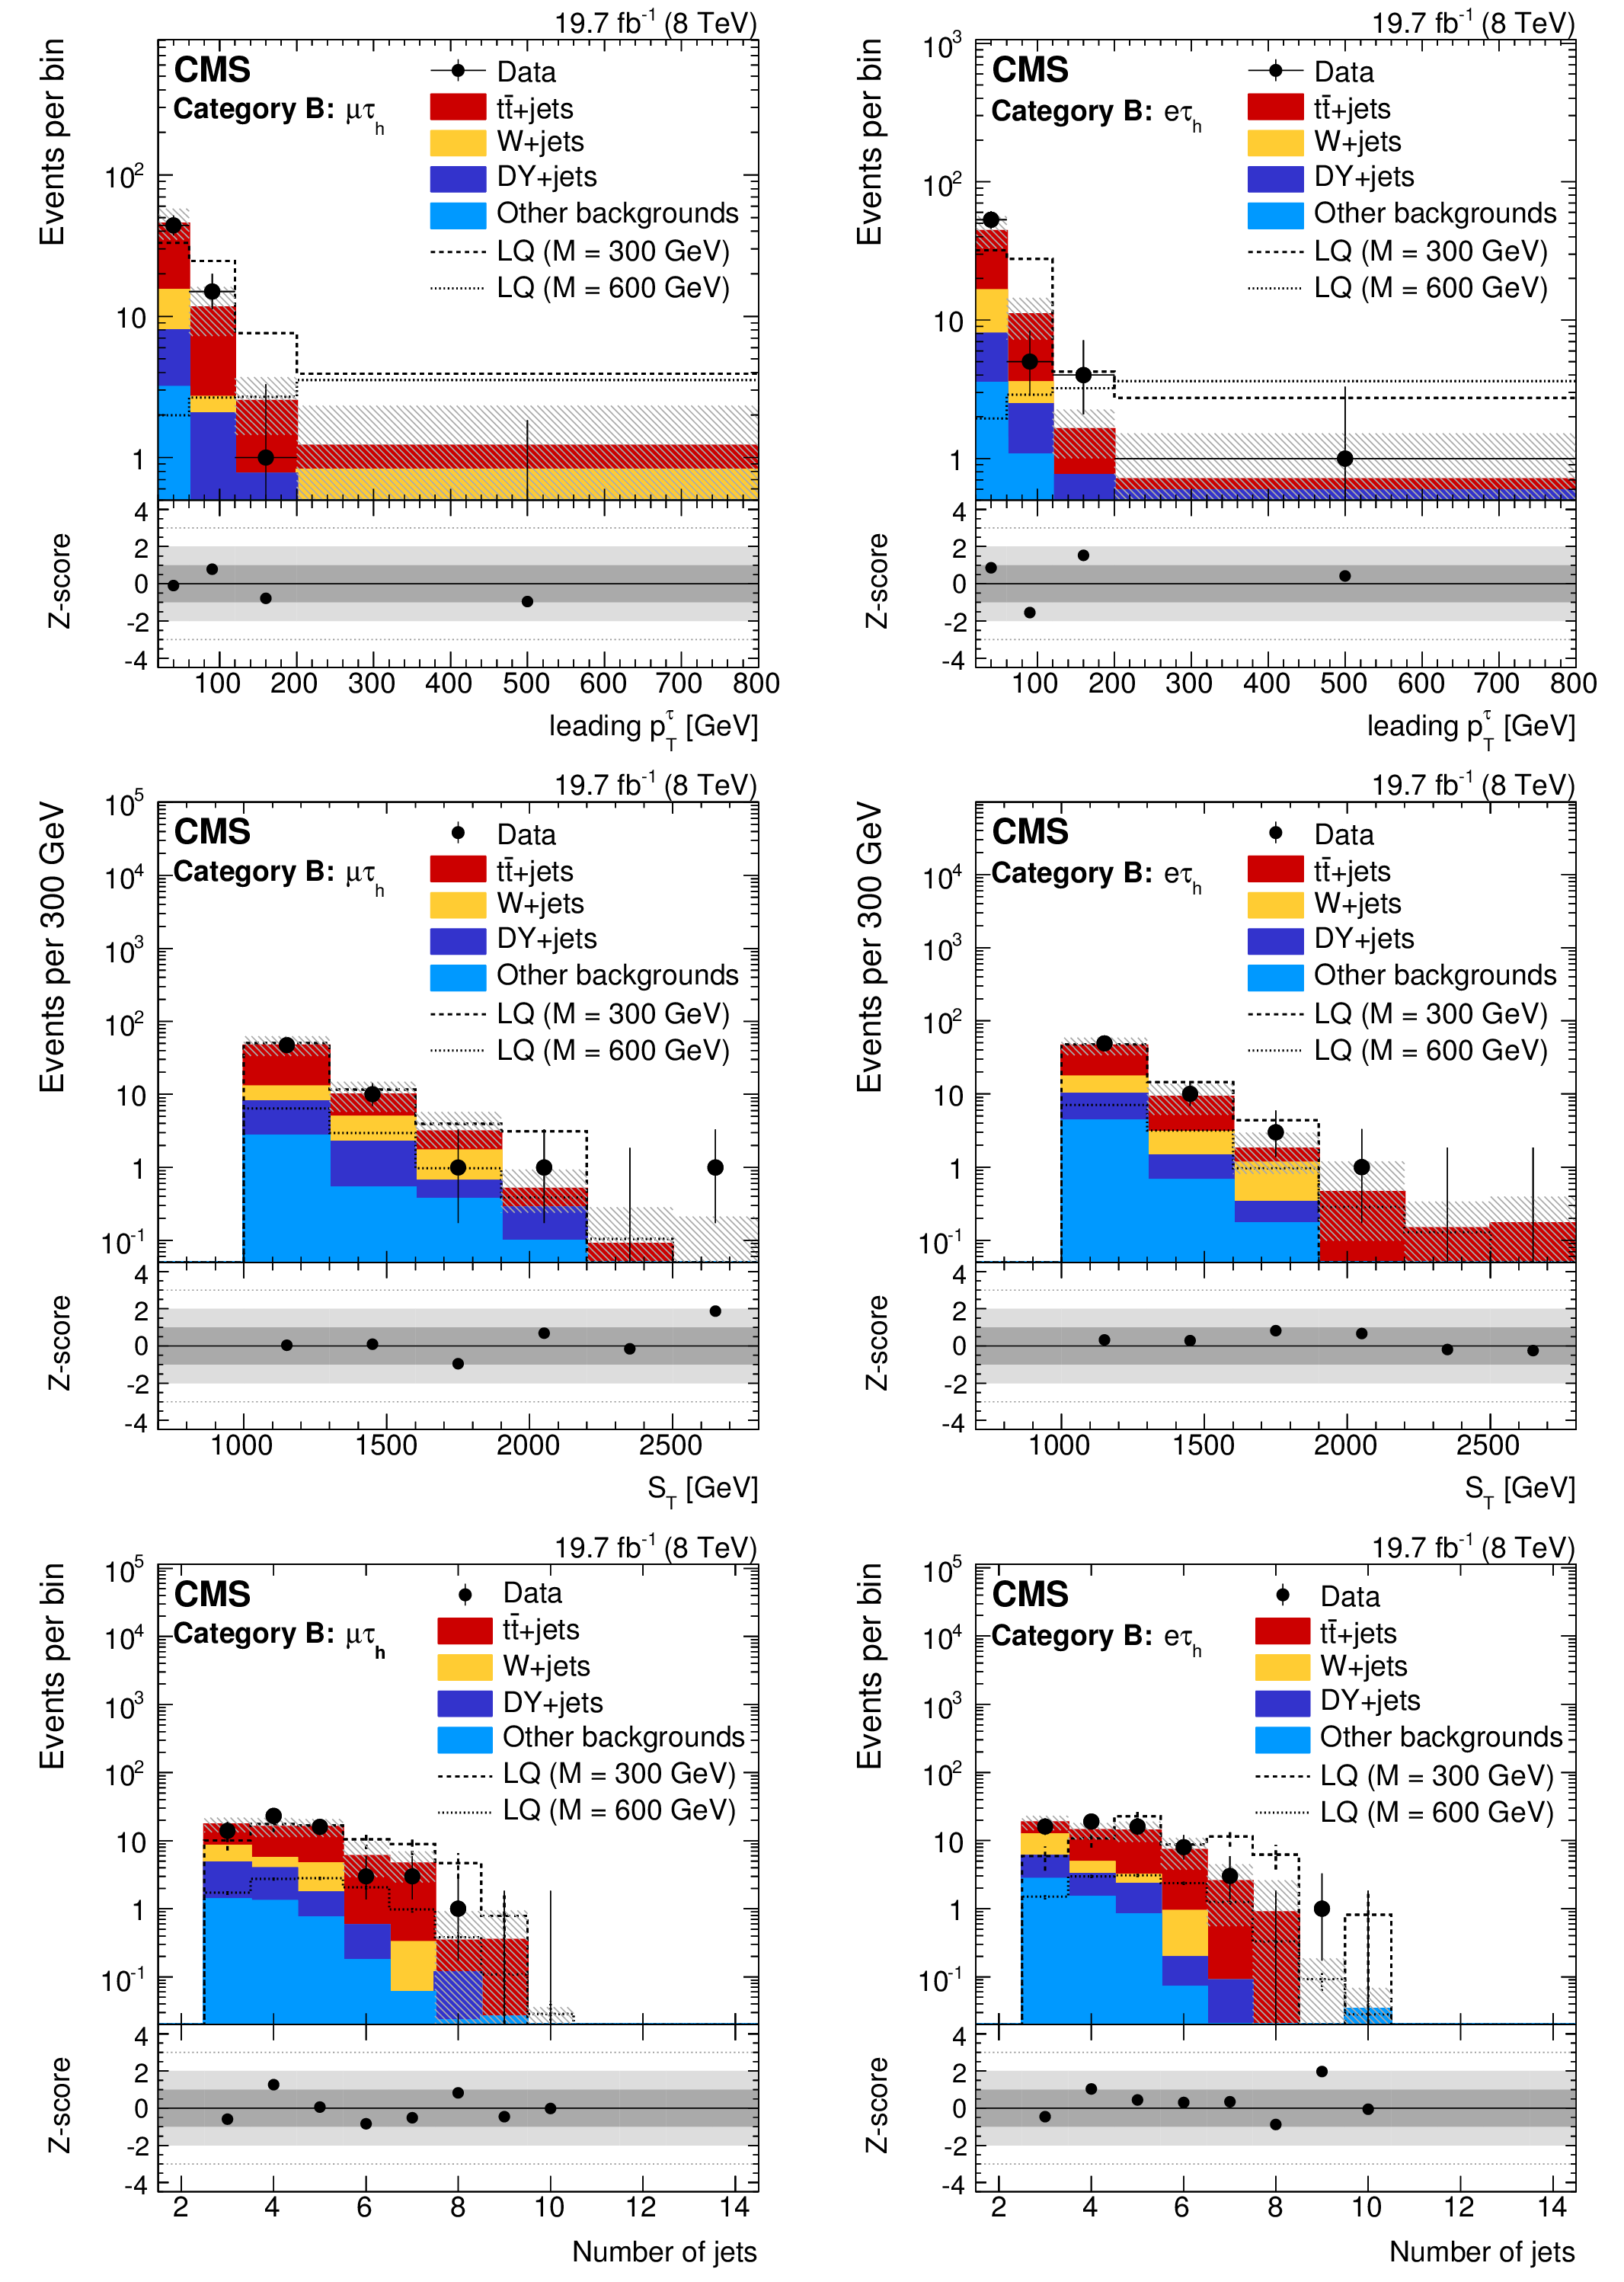
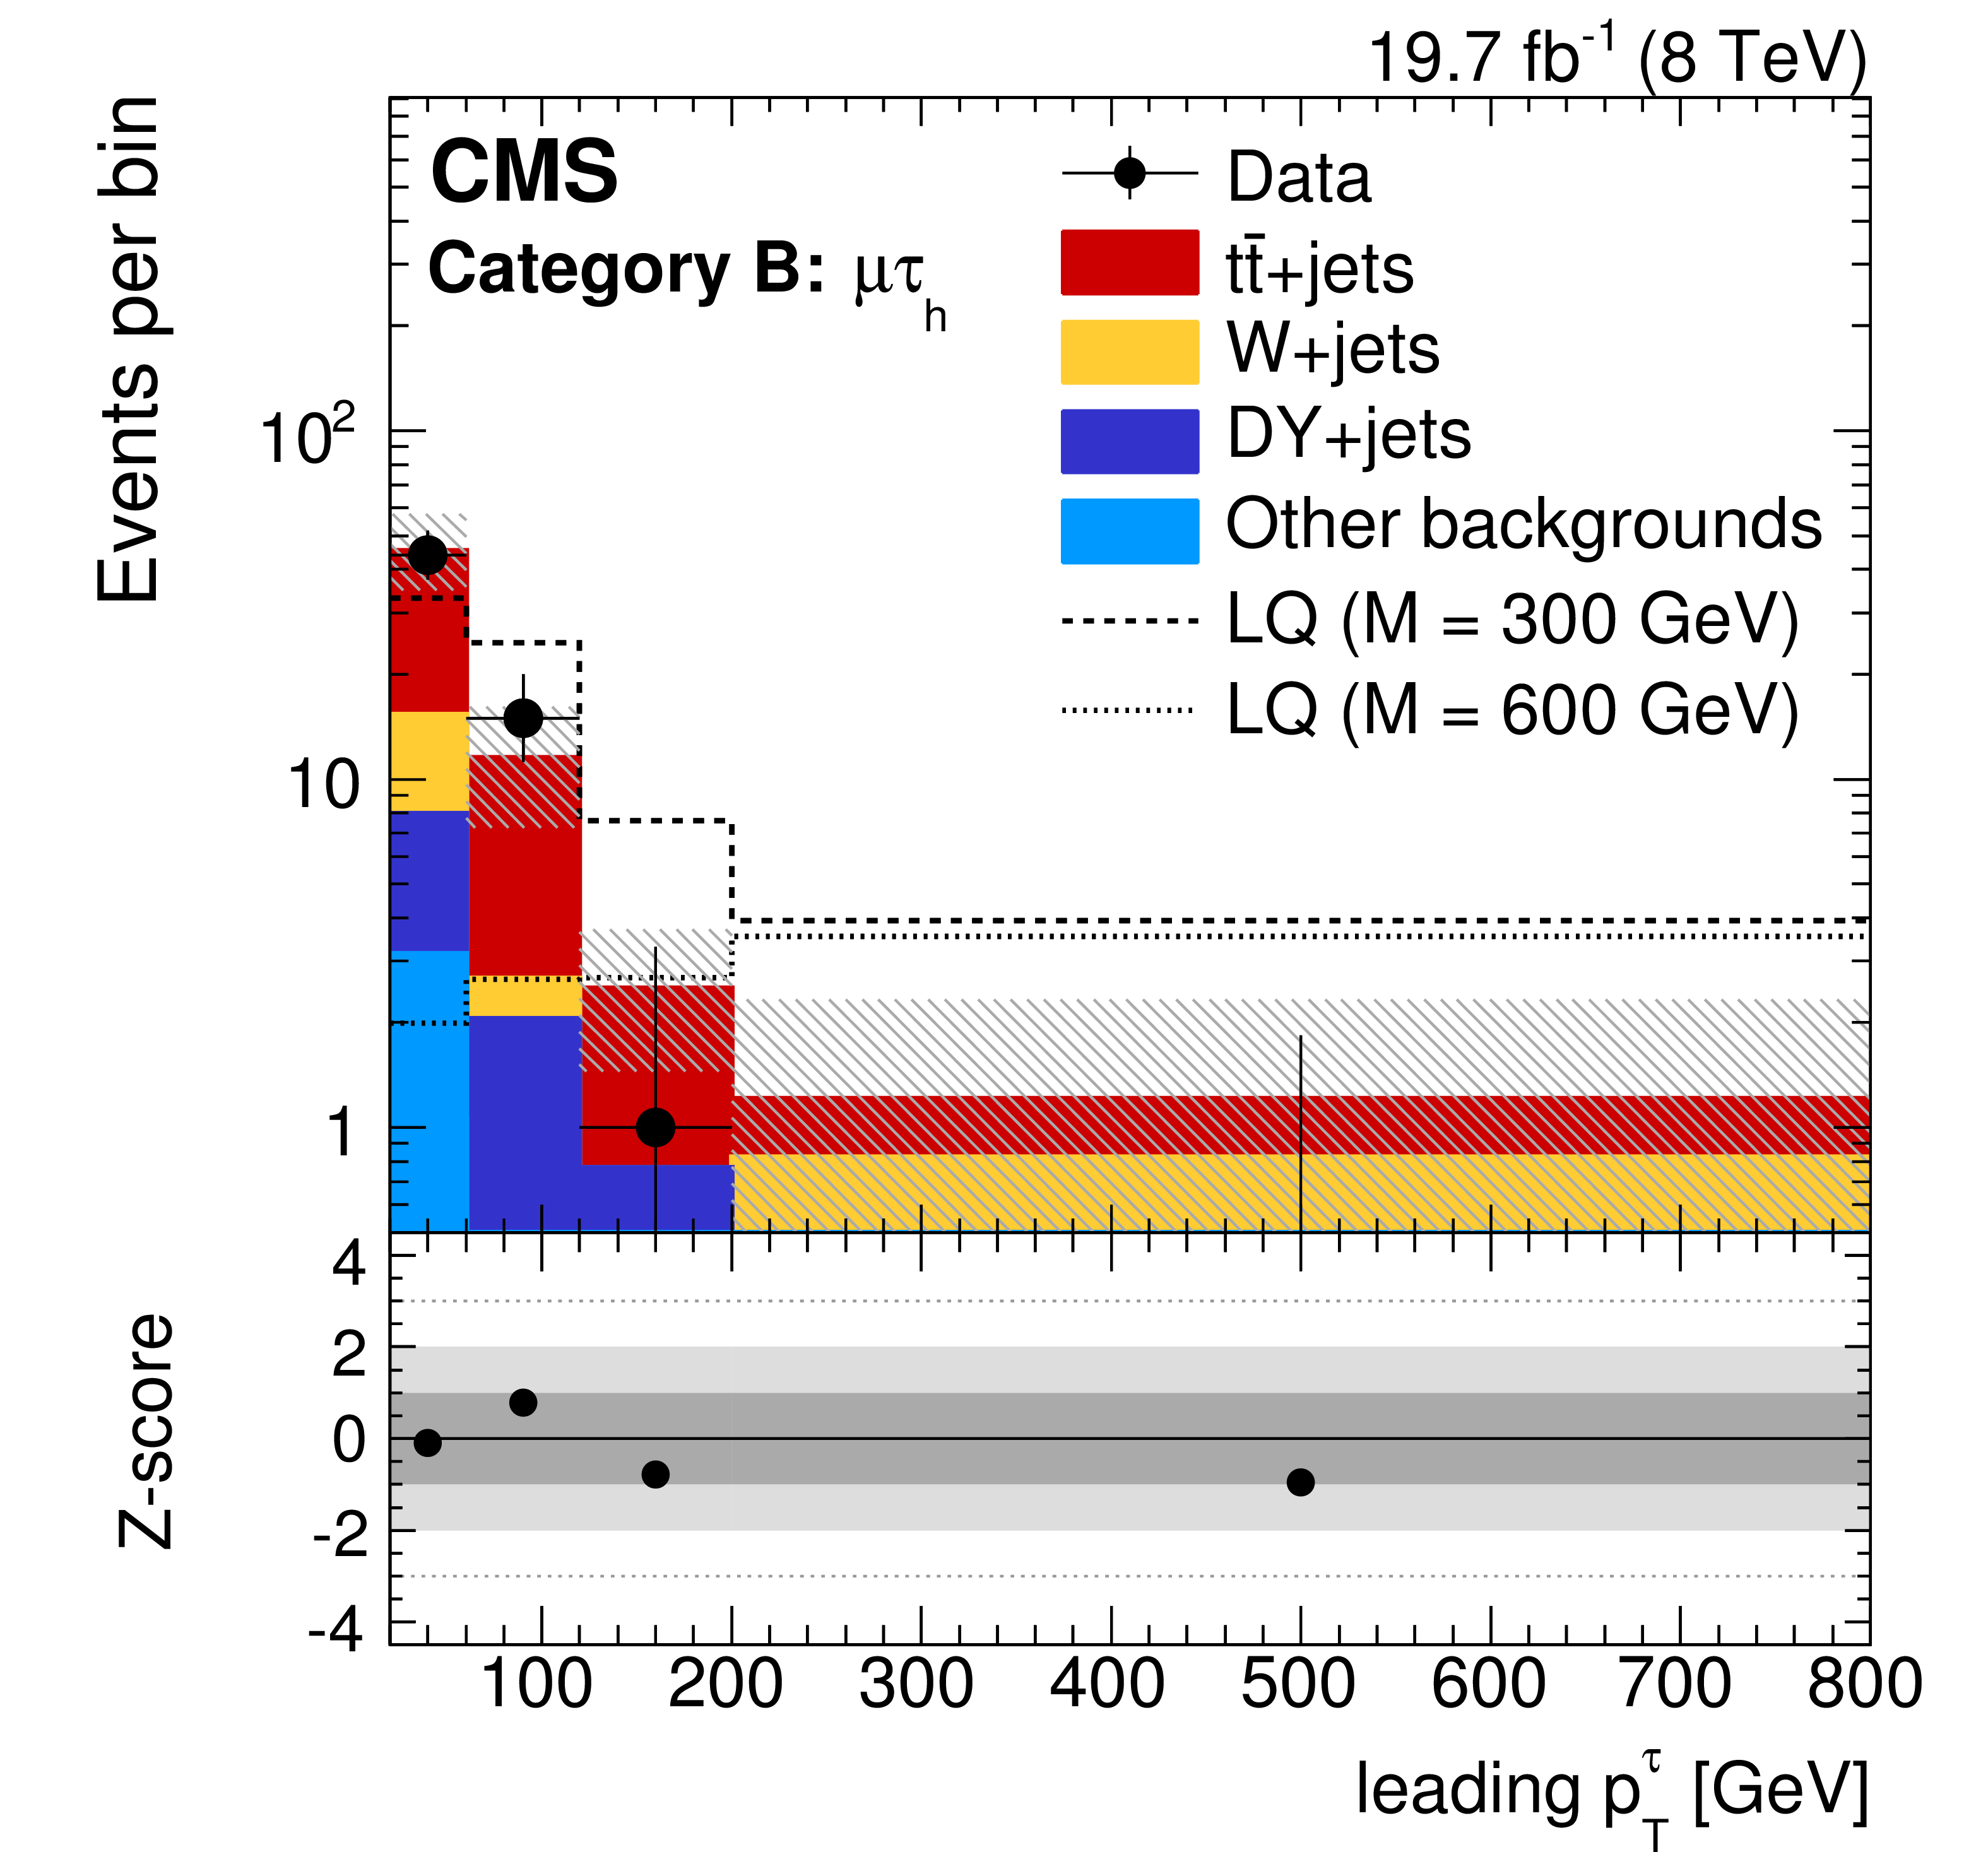
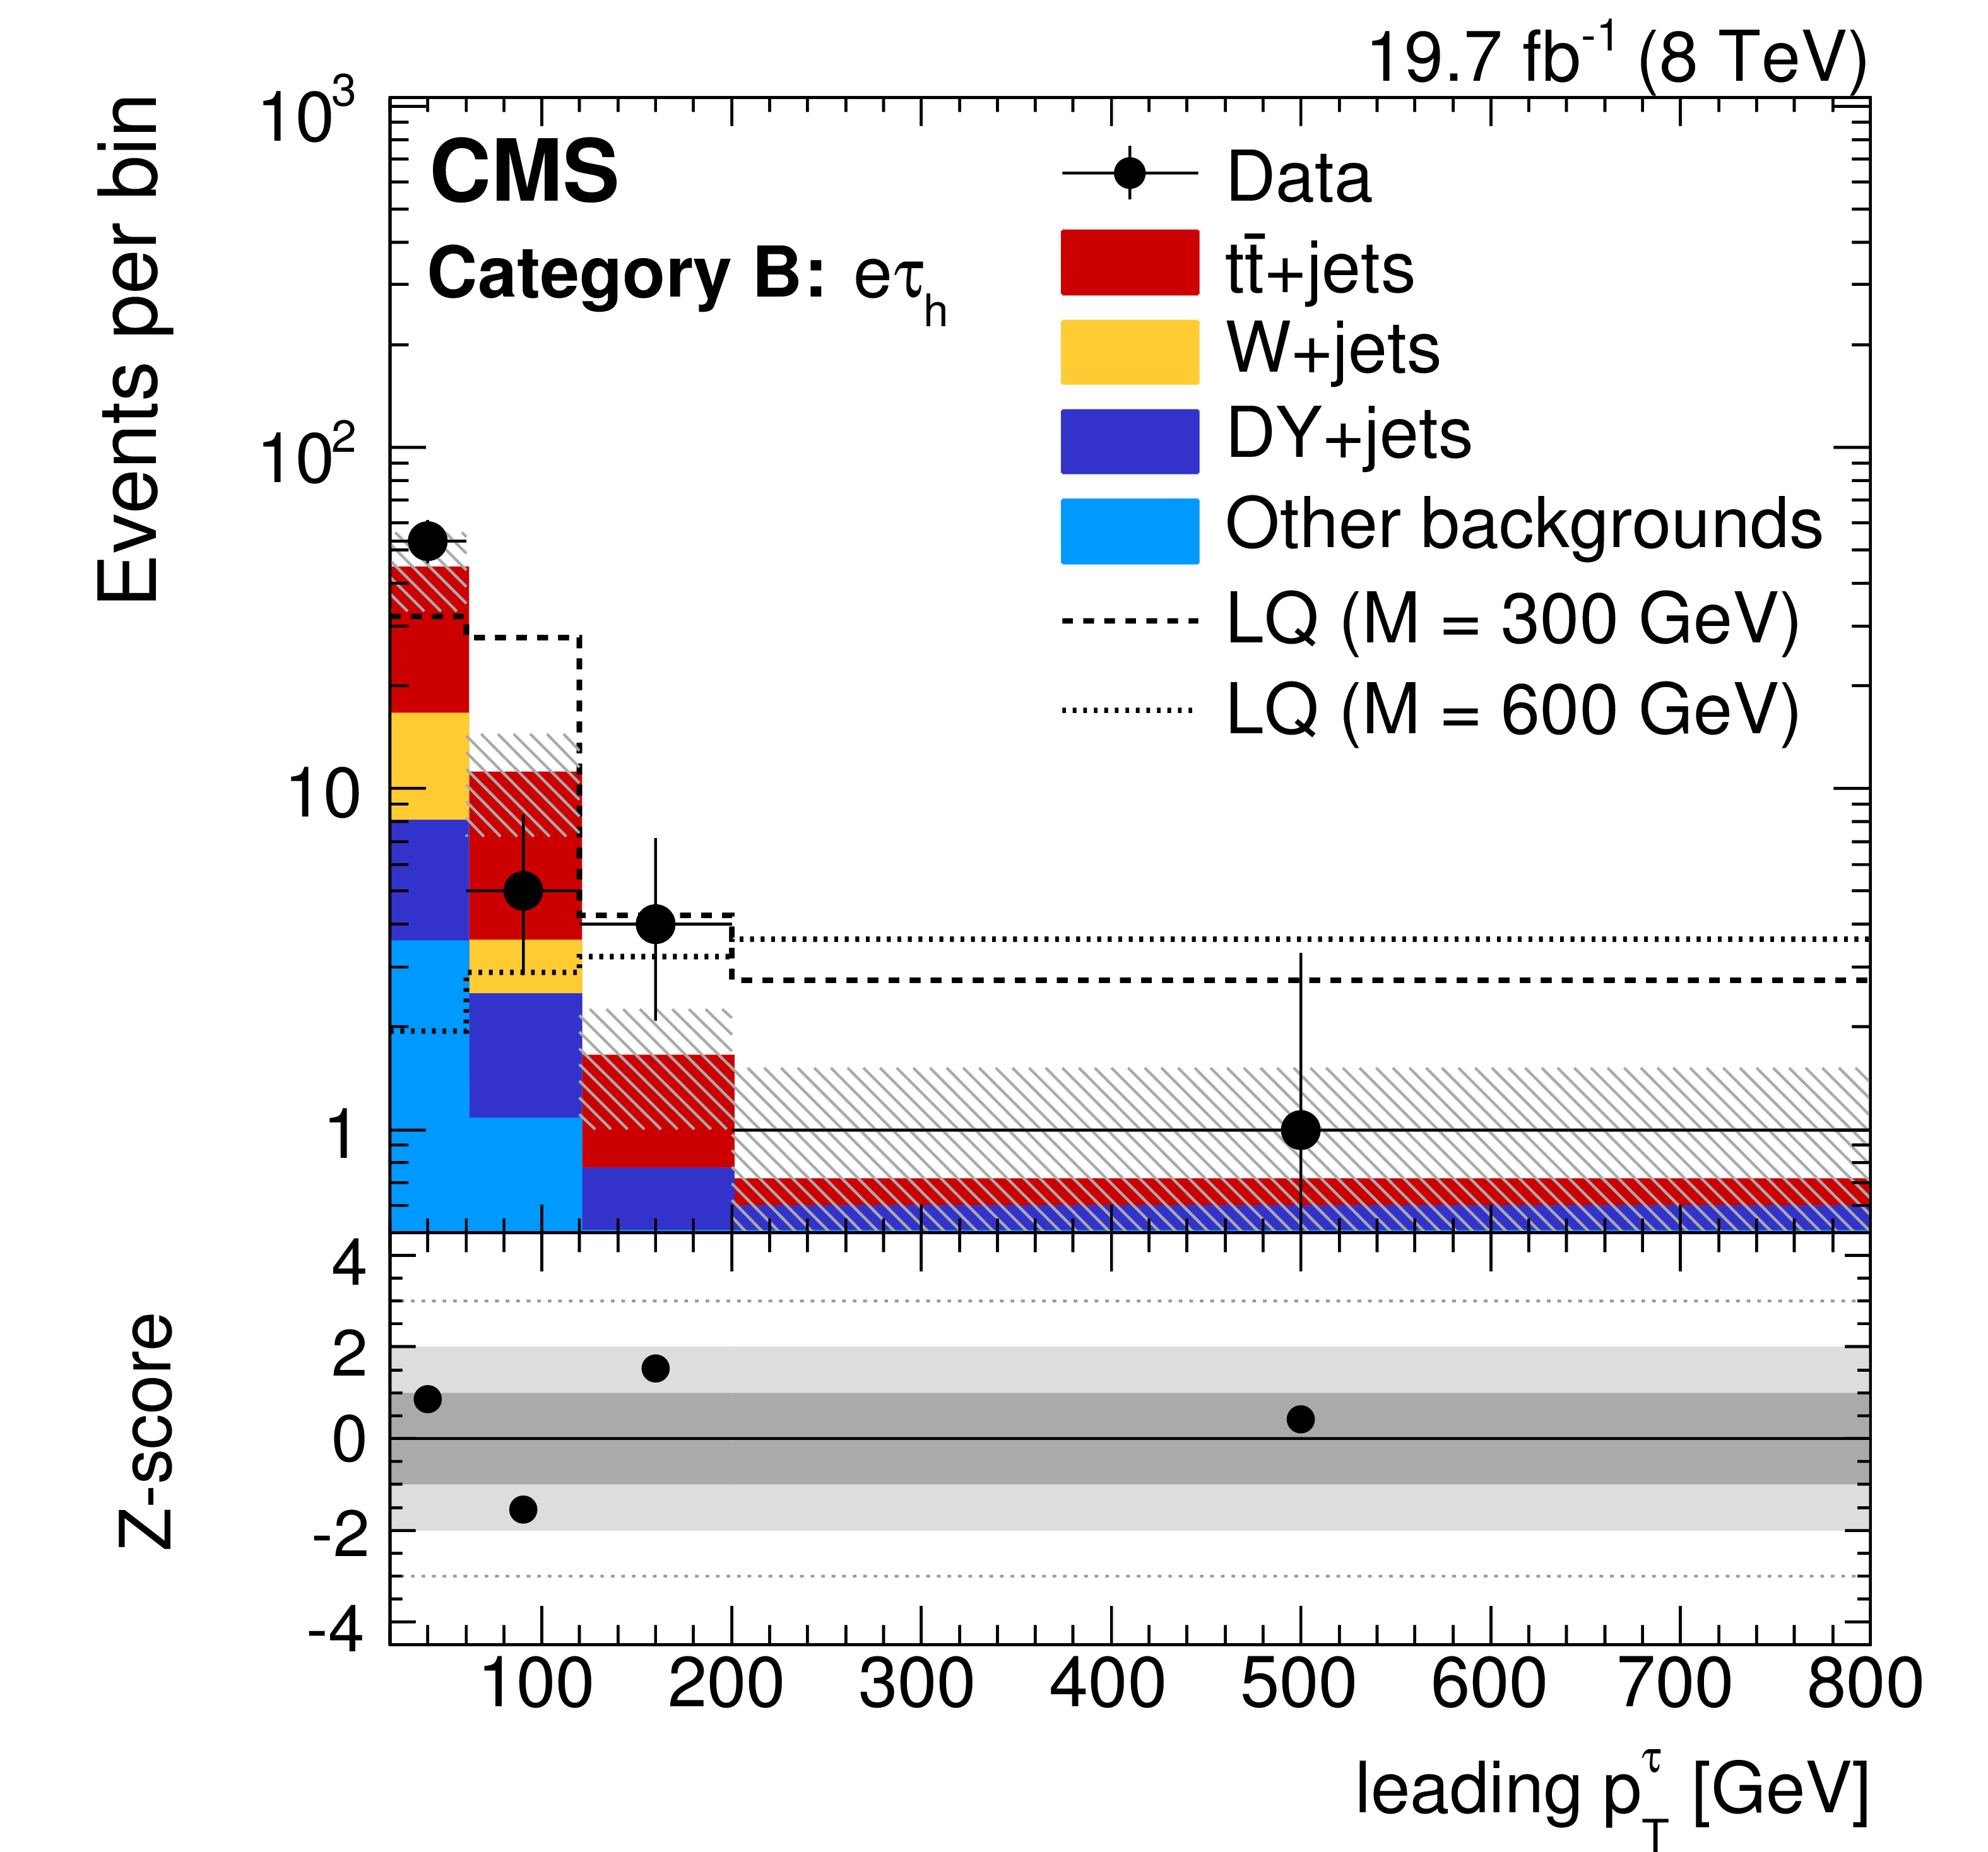
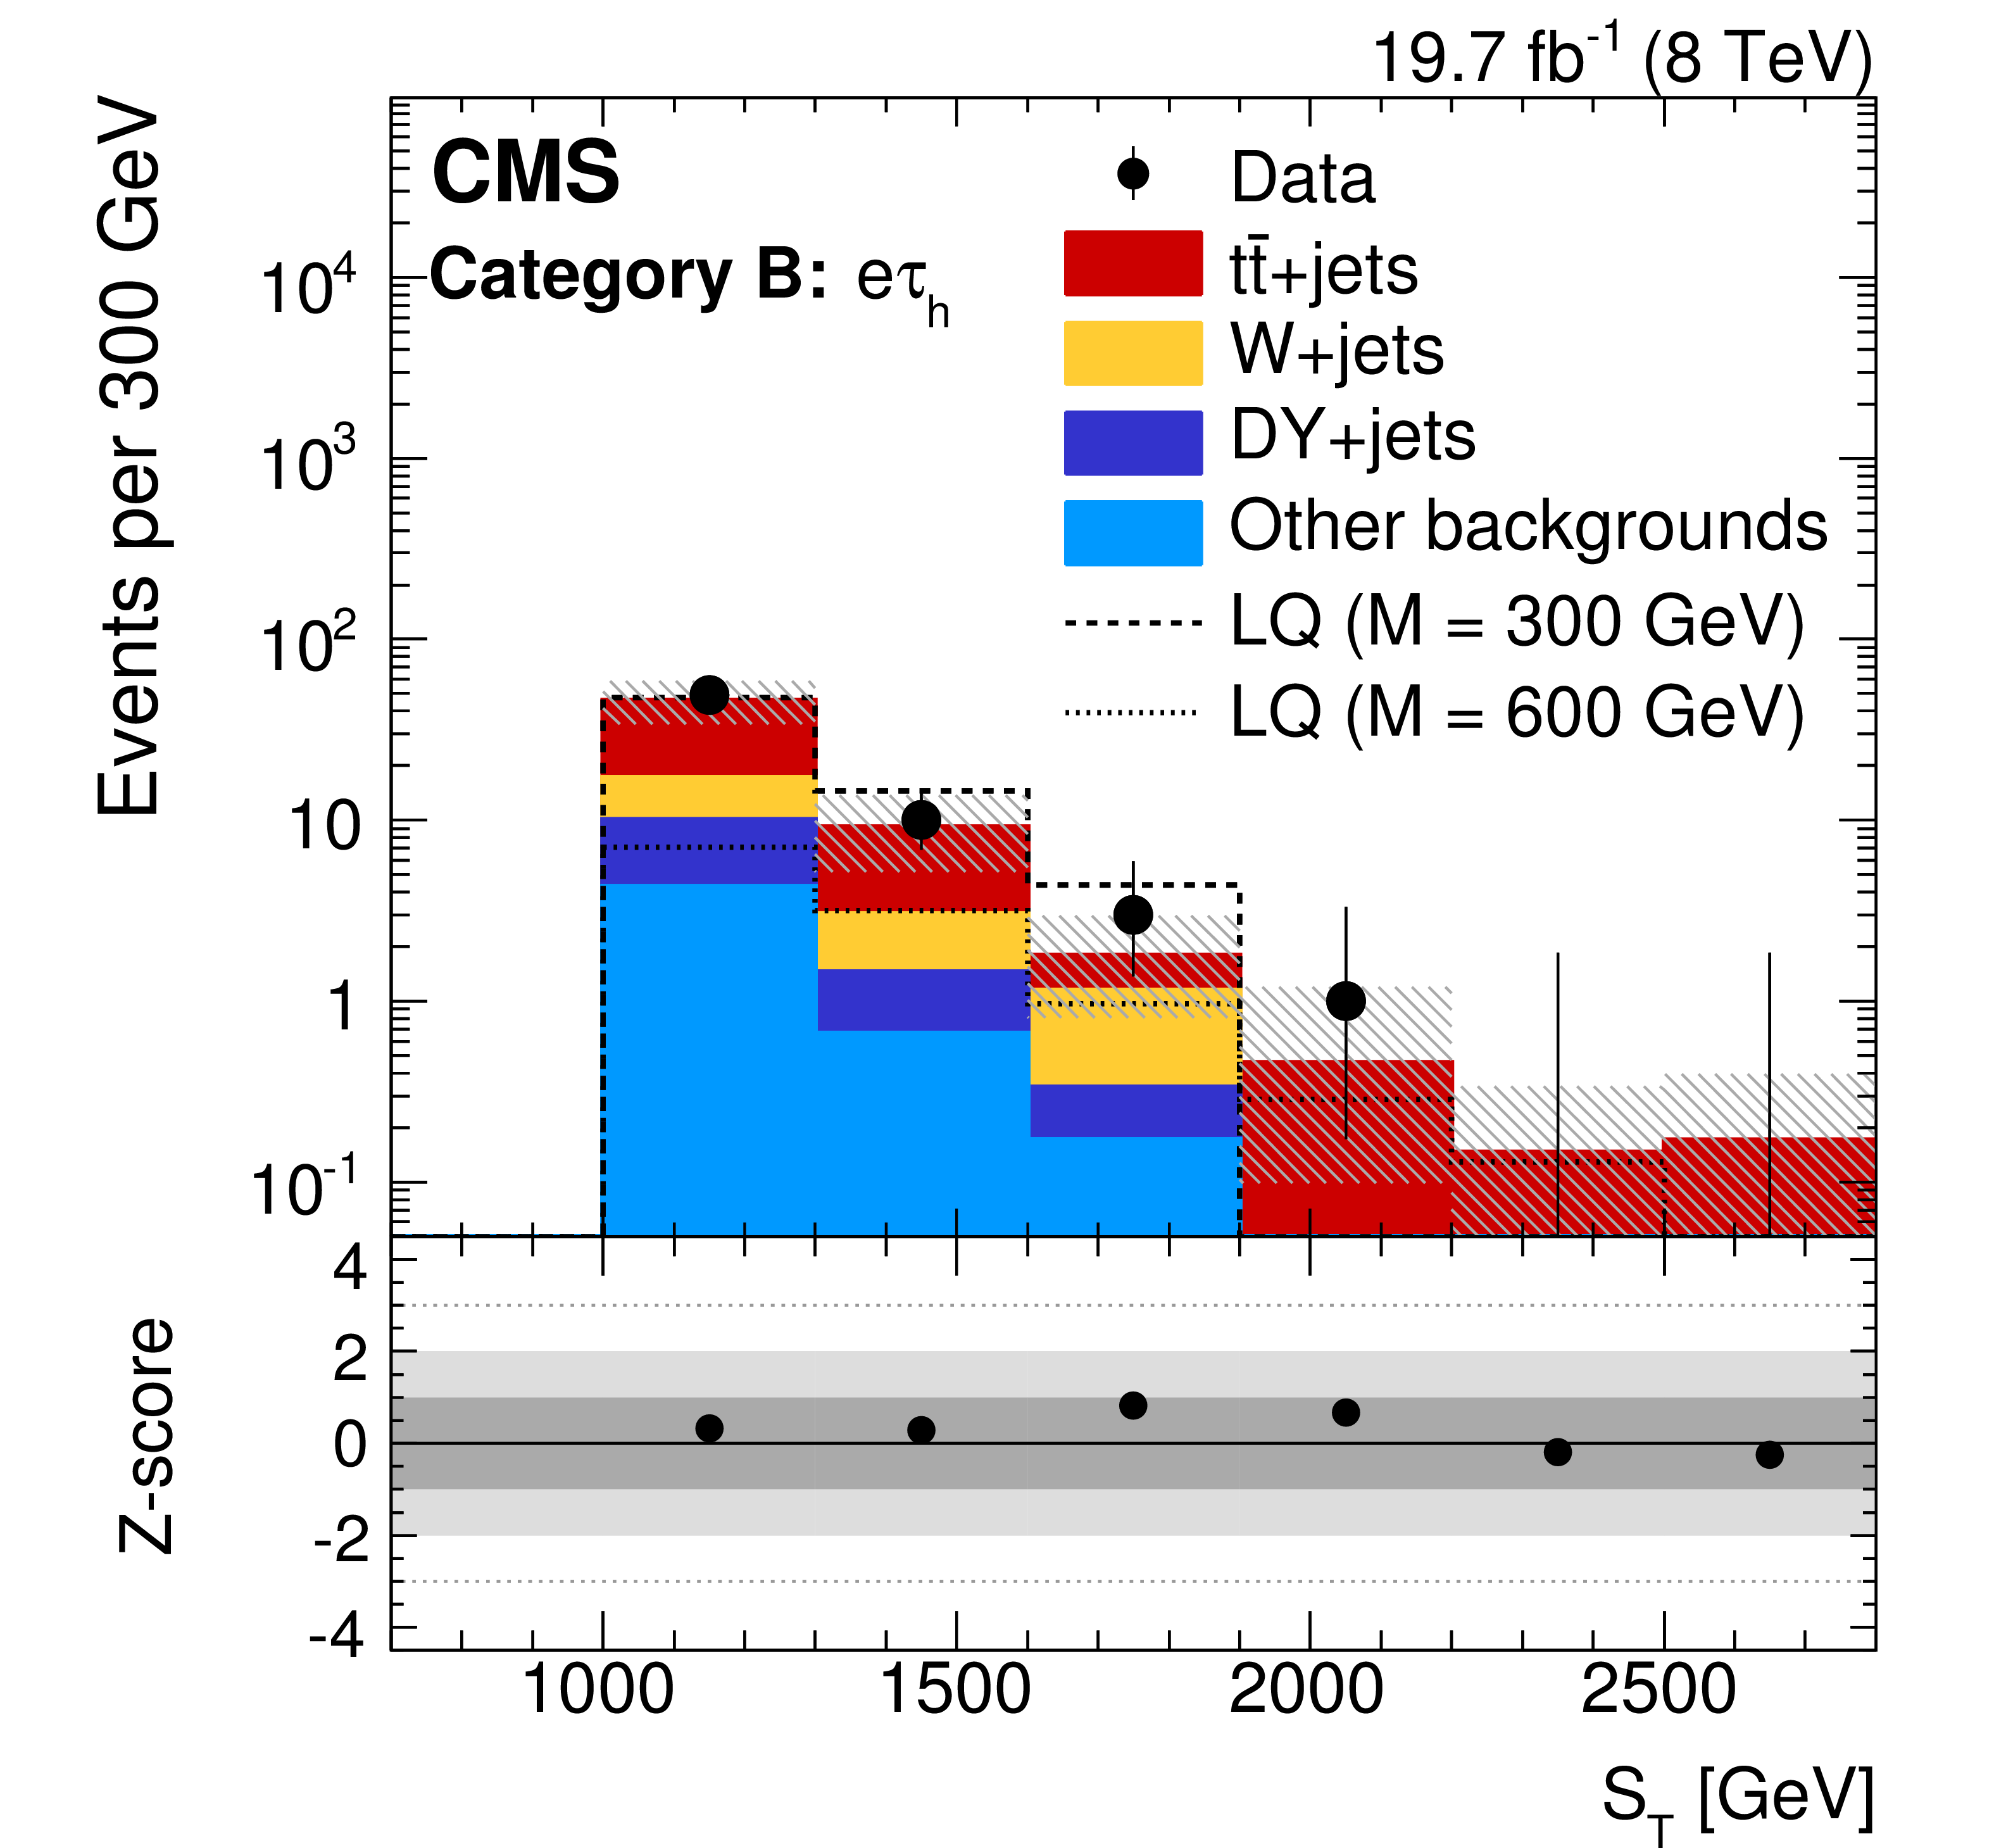
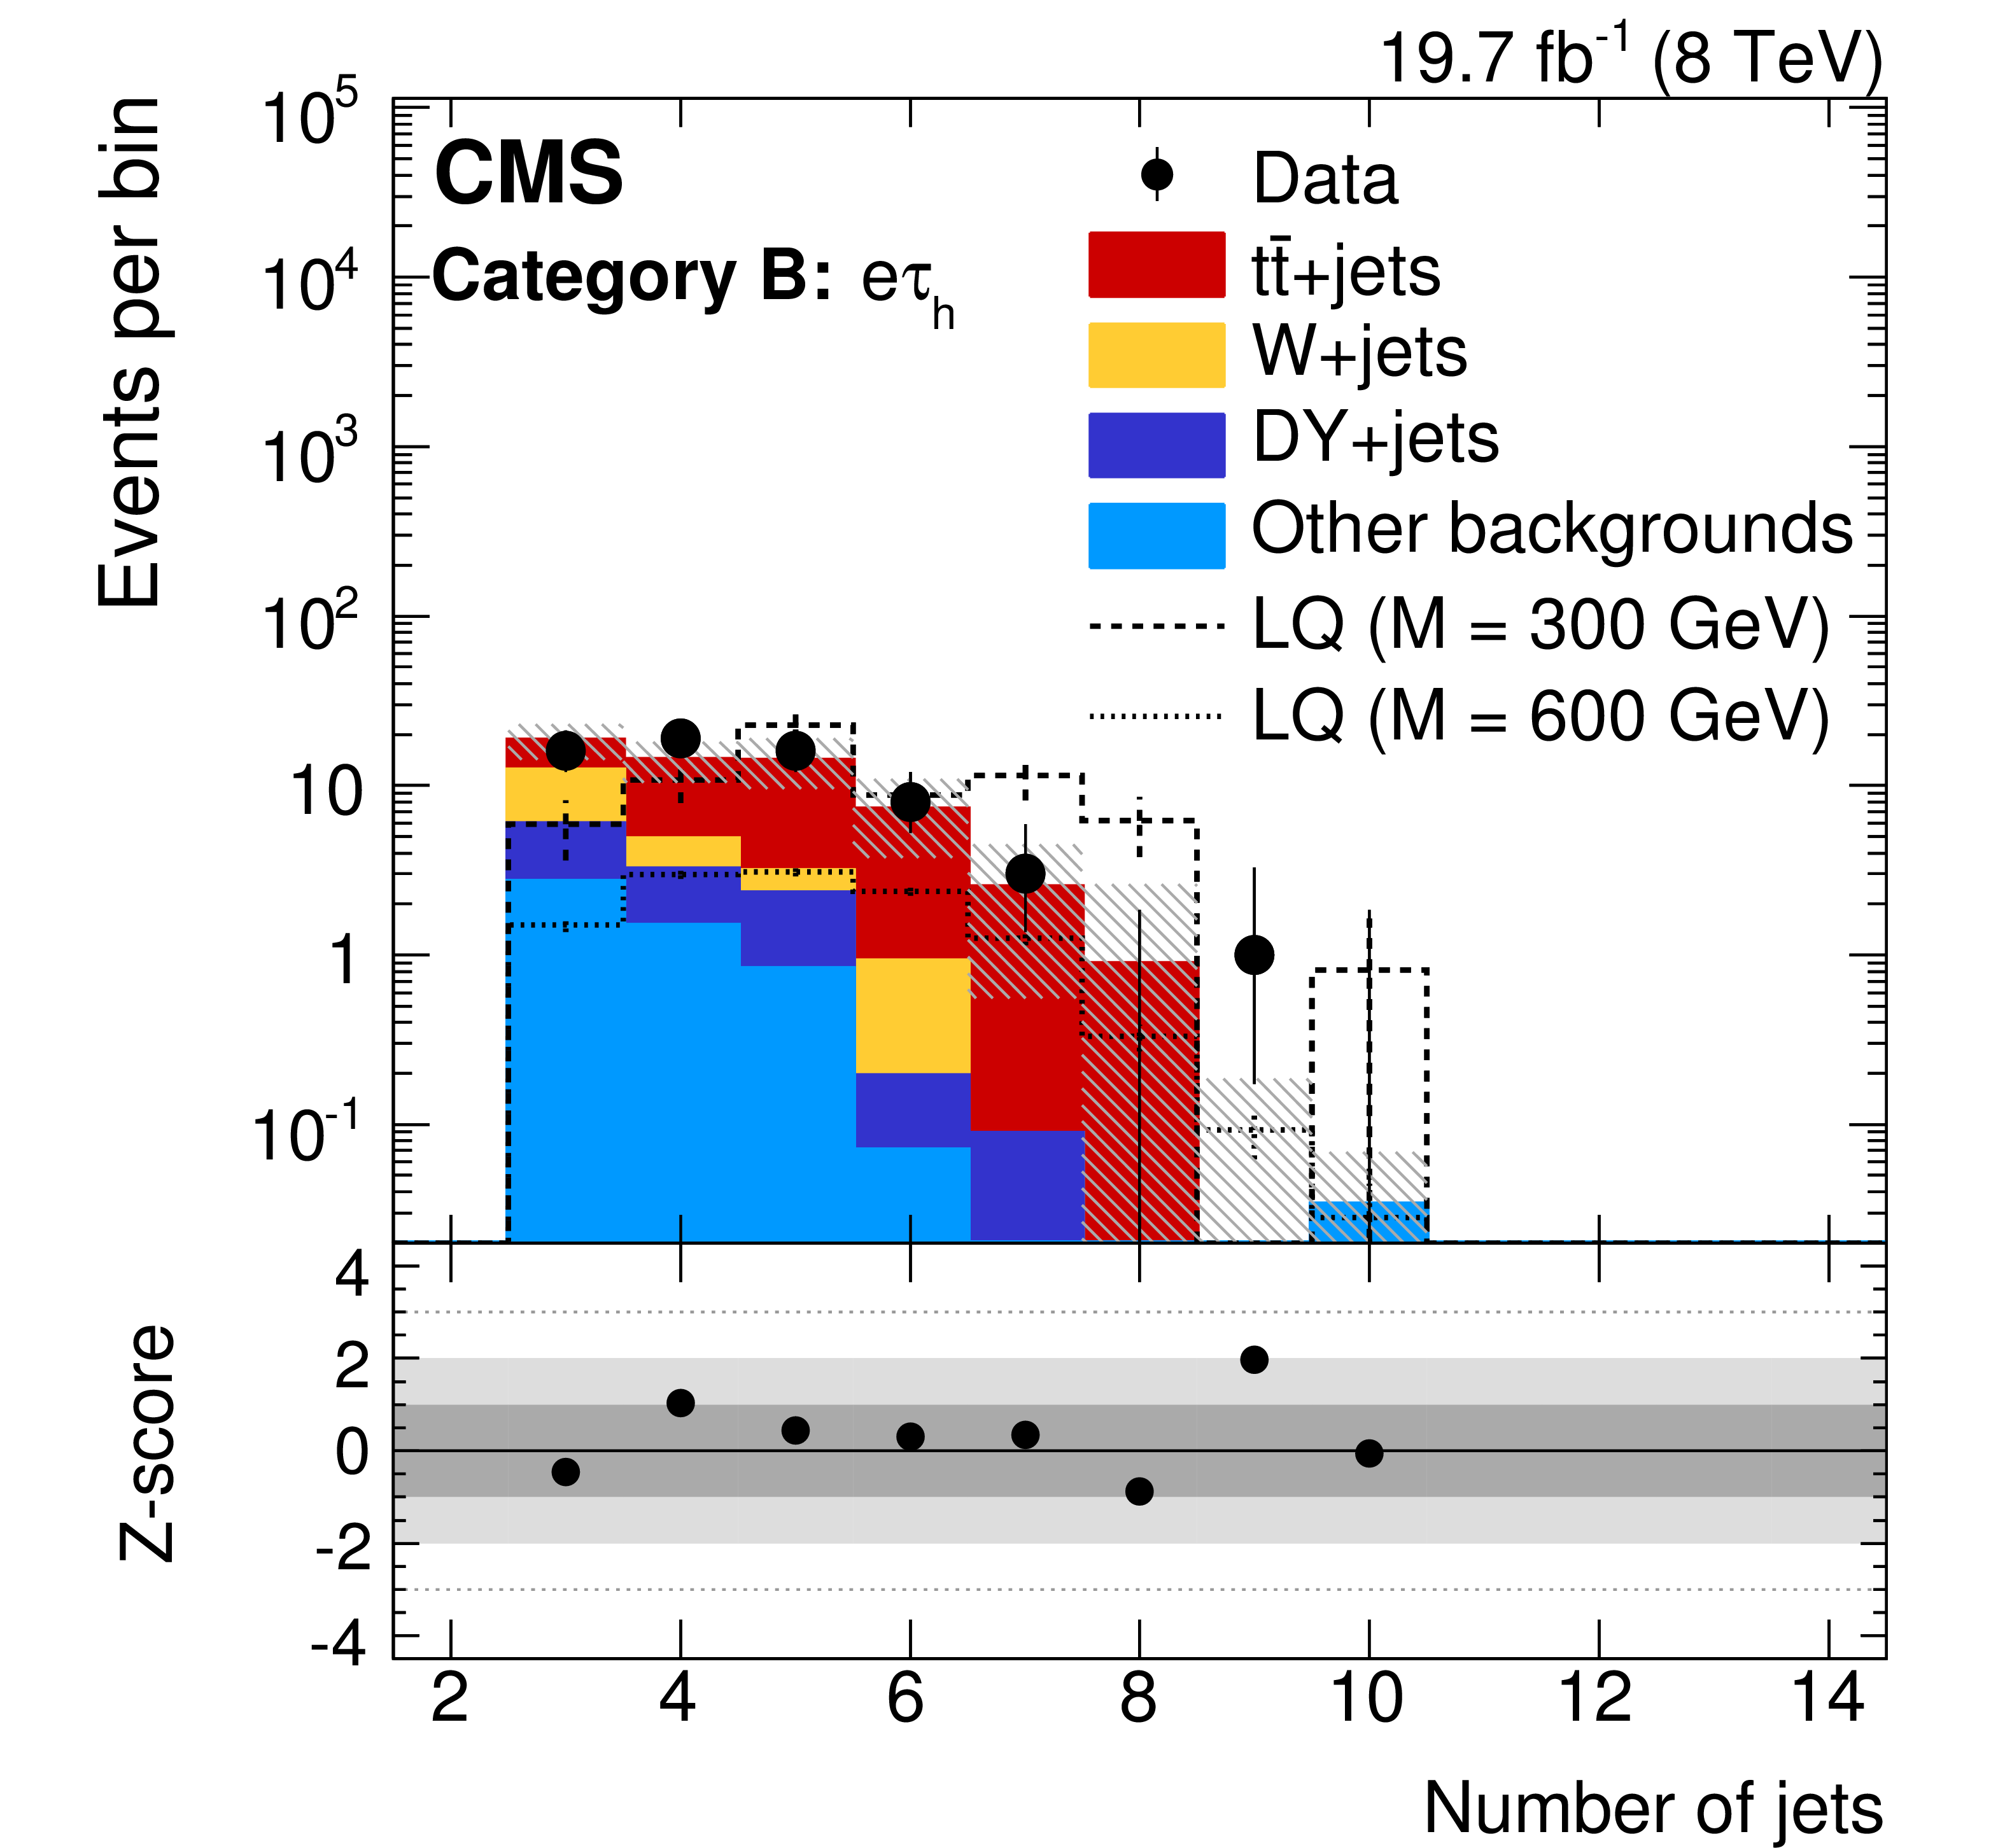
Figure 5:
The leading $\tau $ lepton $ {p_{\mathrm {T}}} $, $ {S_\mathrm {T}} $, and jet multiplicity distributions in the signal region of category B for $\mu {\tau _\mathrm {h}} $ (left column) and $\mathrm{ e } {\tau _\mathrm {h}} $ (right column) channels. The rightmost bin of each distribution includes overflow and no statistically significant excess is observed in the suppressed bins. Shaded regions in the histograms represent the total statistical and systematic uncertainty in the background expectation. The Z-score distribution is provided at the bottom of each plot. The four regions of the $\tau $ lepton $ {p_{\mathrm {T}}} $ correspond to the four search regions. |
png pdf |
Figure 5-a:
The leading $\tau $ lepton $ {p_{\mathrm {T}}} $, $ {S_\mathrm {T}} $, and jet multiplicity distributions in the signal region of category B for $\mu {\tau _\mathrm {h}} $ (left column) and $\mathrm{ e } {\tau _\mathrm {h}} $ (right column) channels. The rightmost bin of each distribution includes overflow and no statistically significant excess is observed in the suppressed bins. Shaded regions in the histograms represent the total statistical and systematic uncertainty in the background expectation. The Z-score distribution is provided at the bottom of each plot. The four regions of the $\tau $ lepton $ {p_{\mathrm {T}}} $ correspond to the four search regions. |
png pdf |
Figure 5-b:
The leading $\tau $ lepton $ {p_{\mathrm {T}}} $, $ {S_\mathrm {T}} $, and jet multiplicity distributions in the signal region of category B for $\mu {\tau _\mathrm {h}} $ (left column) and $\mathrm{ e } {\tau _\mathrm {h}} $ (right column) channels. The rightmost bin of each distribution includes overflow and no statistically significant excess is observed in the suppressed bins. Shaded regions in the histograms represent the total statistical and systematic uncertainty in the background expectation. The Z-score distribution is provided at the bottom of each plot. The four regions of the $\tau $ lepton $ {p_{\mathrm {T}}} $ correspond to the four search regions. |

png pdf |
Figure 5-c:
The leading $\tau $ lepton $ {p_{\mathrm {T}}} $, $ {S_\mathrm {T}} $, and jet multiplicity distributions in the signal region of category B for $\mu {\tau _\mathrm {h}} $ (left column) and $\mathrm{ e } {\tau _\mathrm {h}} $ (right column) channels. The rightmost bin of each distribution includes overflow and no statistically significant excess is observed in the suppressed bins. Shaded regions in the histograms represent the total statistical and systematic uncertainty in the background expectation. The Z-score distribution is provided at the bottom of each plot. The four regions of the $\tau $ lepton $ {p_{\mathrm {T}}} $ correspond to the four search regions. |
png pdf |
Figure 5-d:
The leading $\tau $ lepton $ {p_{\mathrm {T}}} $, $ {S_\mathrm {T}} $, and jet multiplicity distributions in the signal region of category B for $\mu {\tau _\mathrm {h}} $ (left column) and $\mathrm{ e } {\tau _\mathrm {h}} $ (right column) channels. The rightmost bin of each distribution includes overflow and no statistically significant excess is observed in the suppressed bins. Shaded regions in the histograms represent the total statistical and systematic uncertainty in the background expectation. The Z-score distribution is provided at the bottom of each plot. The four regions of the $\tau $ lepton $ {p_{\mathrm {T}}} $ correspond to the four search regions. |

png pdf |
Figure 5-e:
The leading $\tau $ lepton $ {p_{\mathrm {T}}} $, $ {S_\mathrm {T}} $, and jet multiplicity distributions in the signal region of category B for $\mu {\tau _\mathrm {h}} $ (left column) and $\mathrm{ e } {\tau _\mathrm {h}} $ (right column) channels. The rightmost bin of each distribution includes overflow and no statistically significant excess is observed in the suppressed bins. Shaded regions in the histograms represent the total statistical and systematic uncertainty in the background expectation. The Z-score distribution is provided at the bottom of each plot. The four regions of the $\tau $ lepton $ {p_{\mathrm {T}}} $ correspond to the four search regions. |
png pdf |
Figure 5-f:
The leading $\tau $ lepton $ {p_{\mathrm {T}}} $, $ {S_\mathrm {T}} $, and jet multiplicity distributions in the signal region of category B for $\mu {\tau _\mathrm {h}} $ (left column) and $\mathrm{ e } {\tau _\mathrm {h}} $ (right column) channels. The rightmost bin of each distribution includes overflow and no statistically significant excess is observed in the suppressed bins. Shaded regions in the histograms represent the total statistical and systematic uncertainty in the background expectation. The Z-score distribution is provided at the bottom of each plot. The four regions of the $\tau $ lepton $ {p_{\mathrm {T}}} $ correspond to the four search regions. |
png pdf |
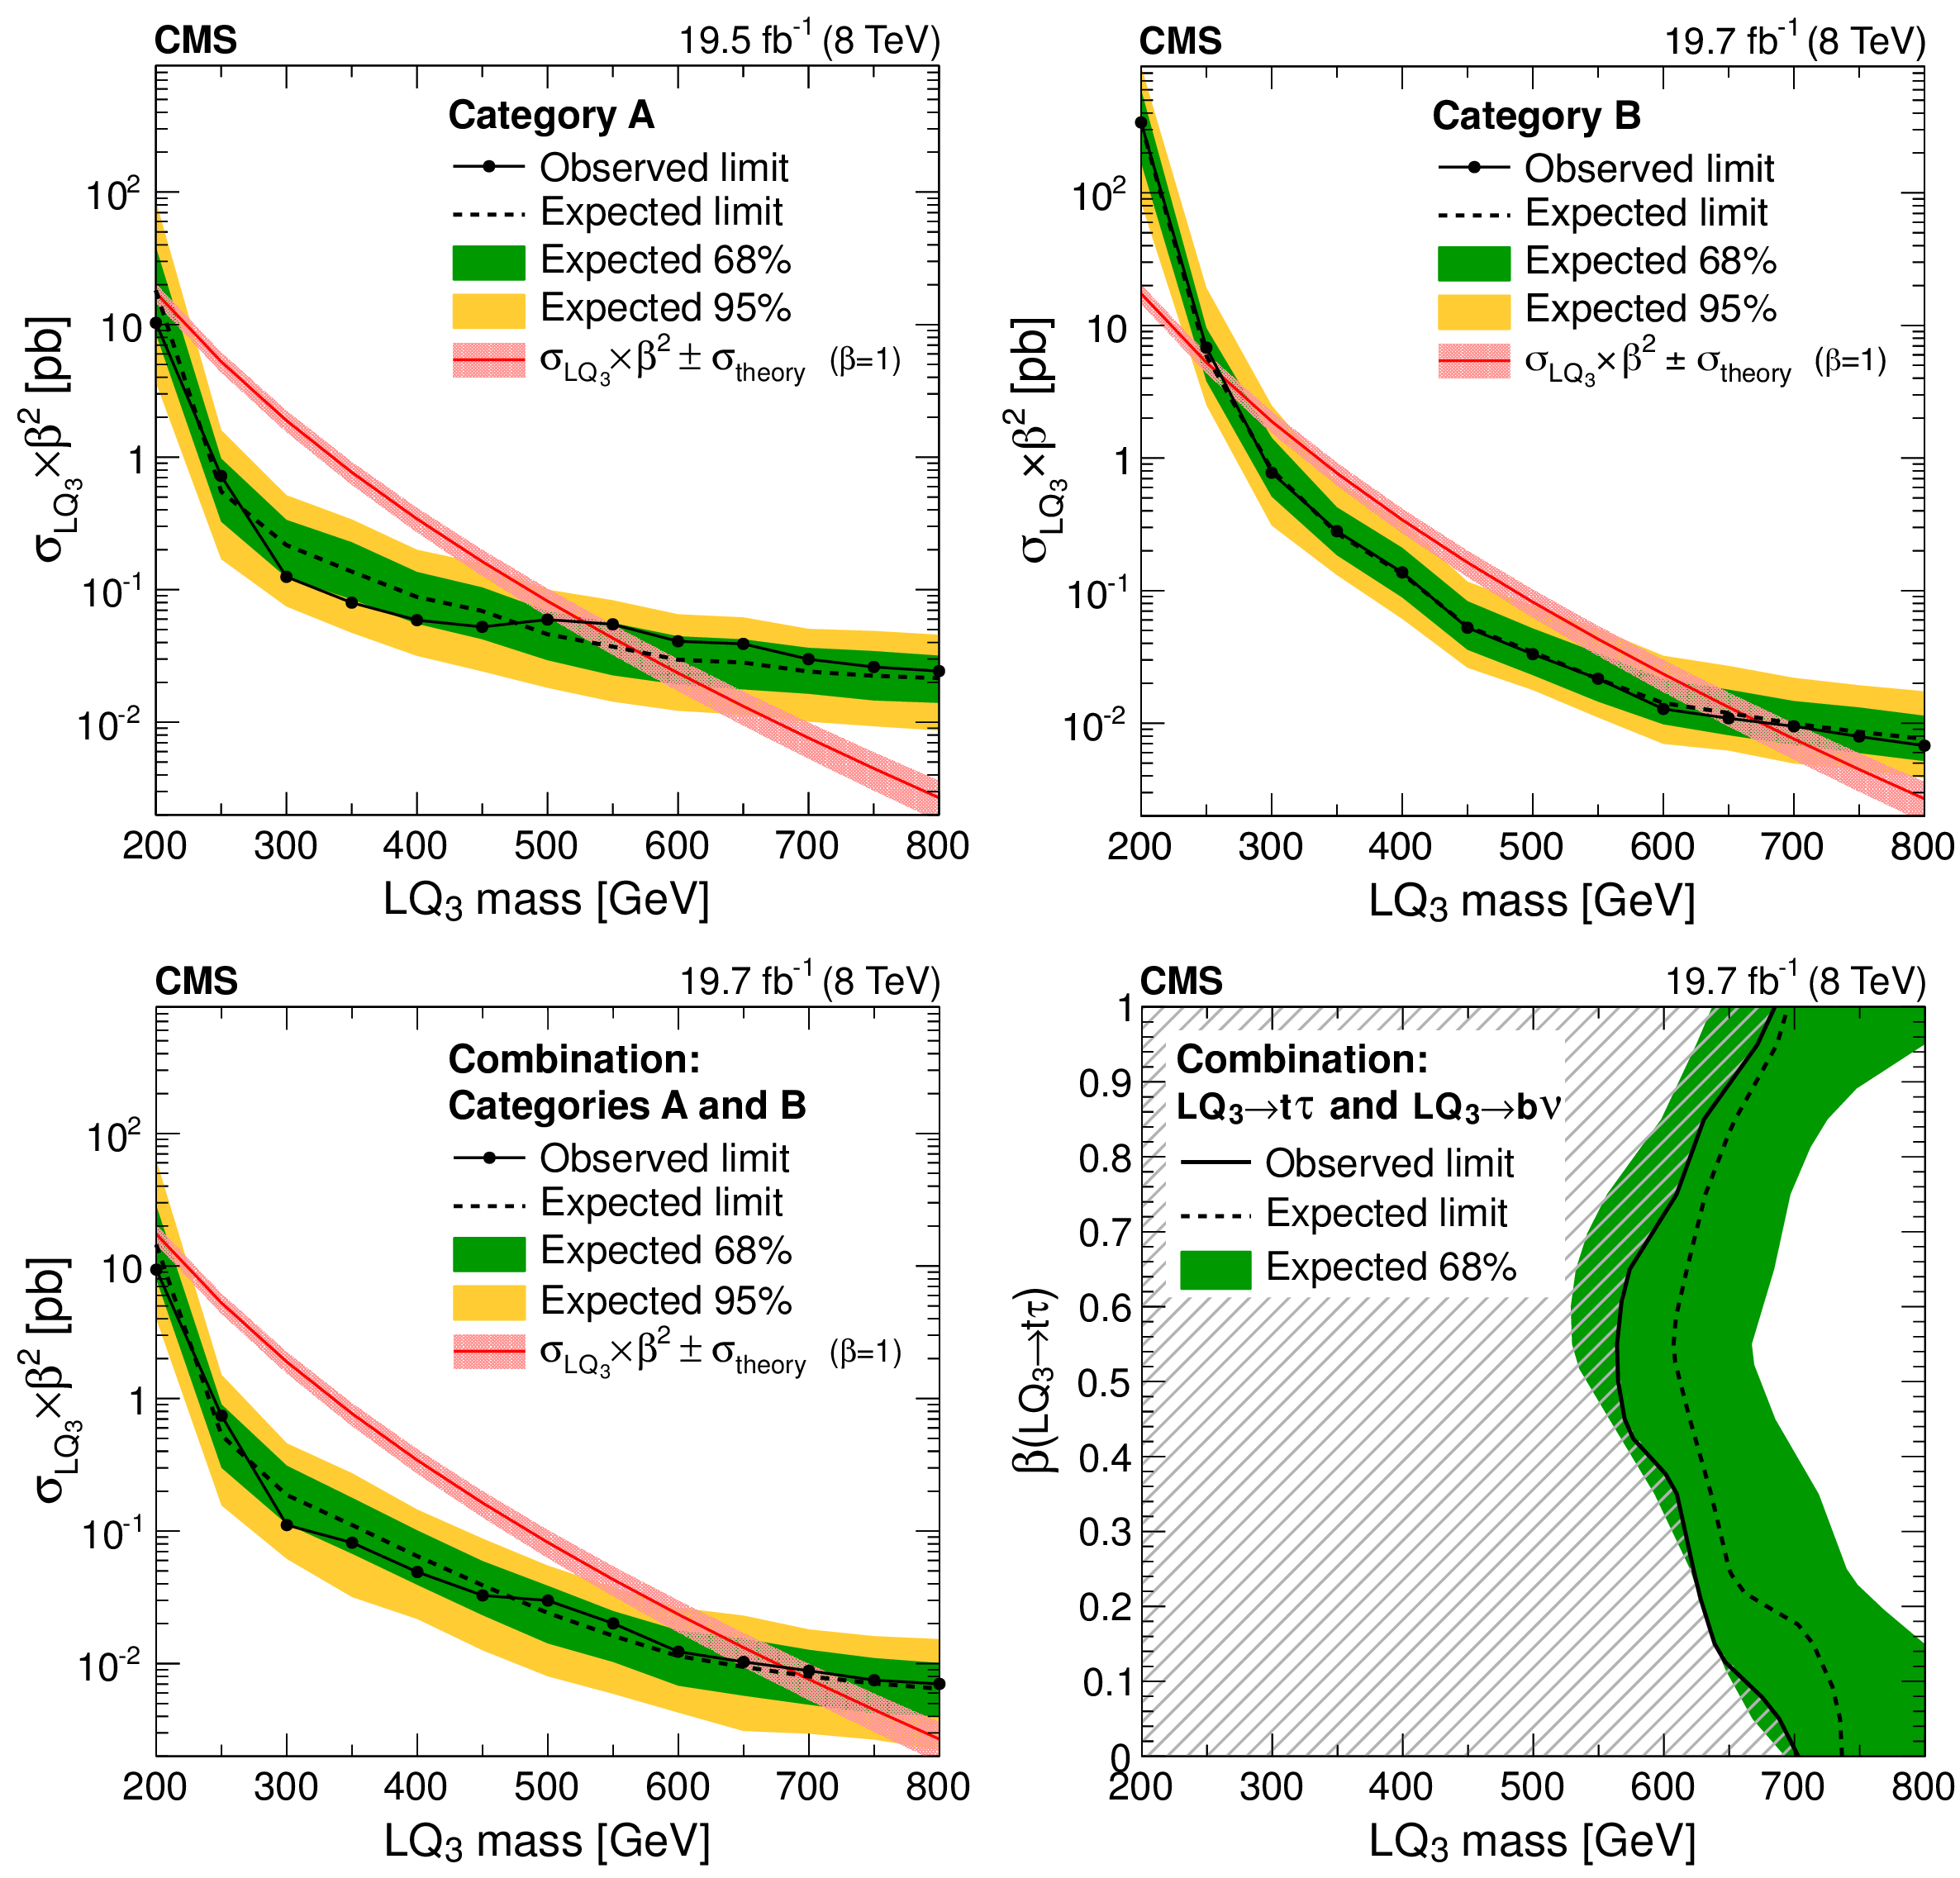
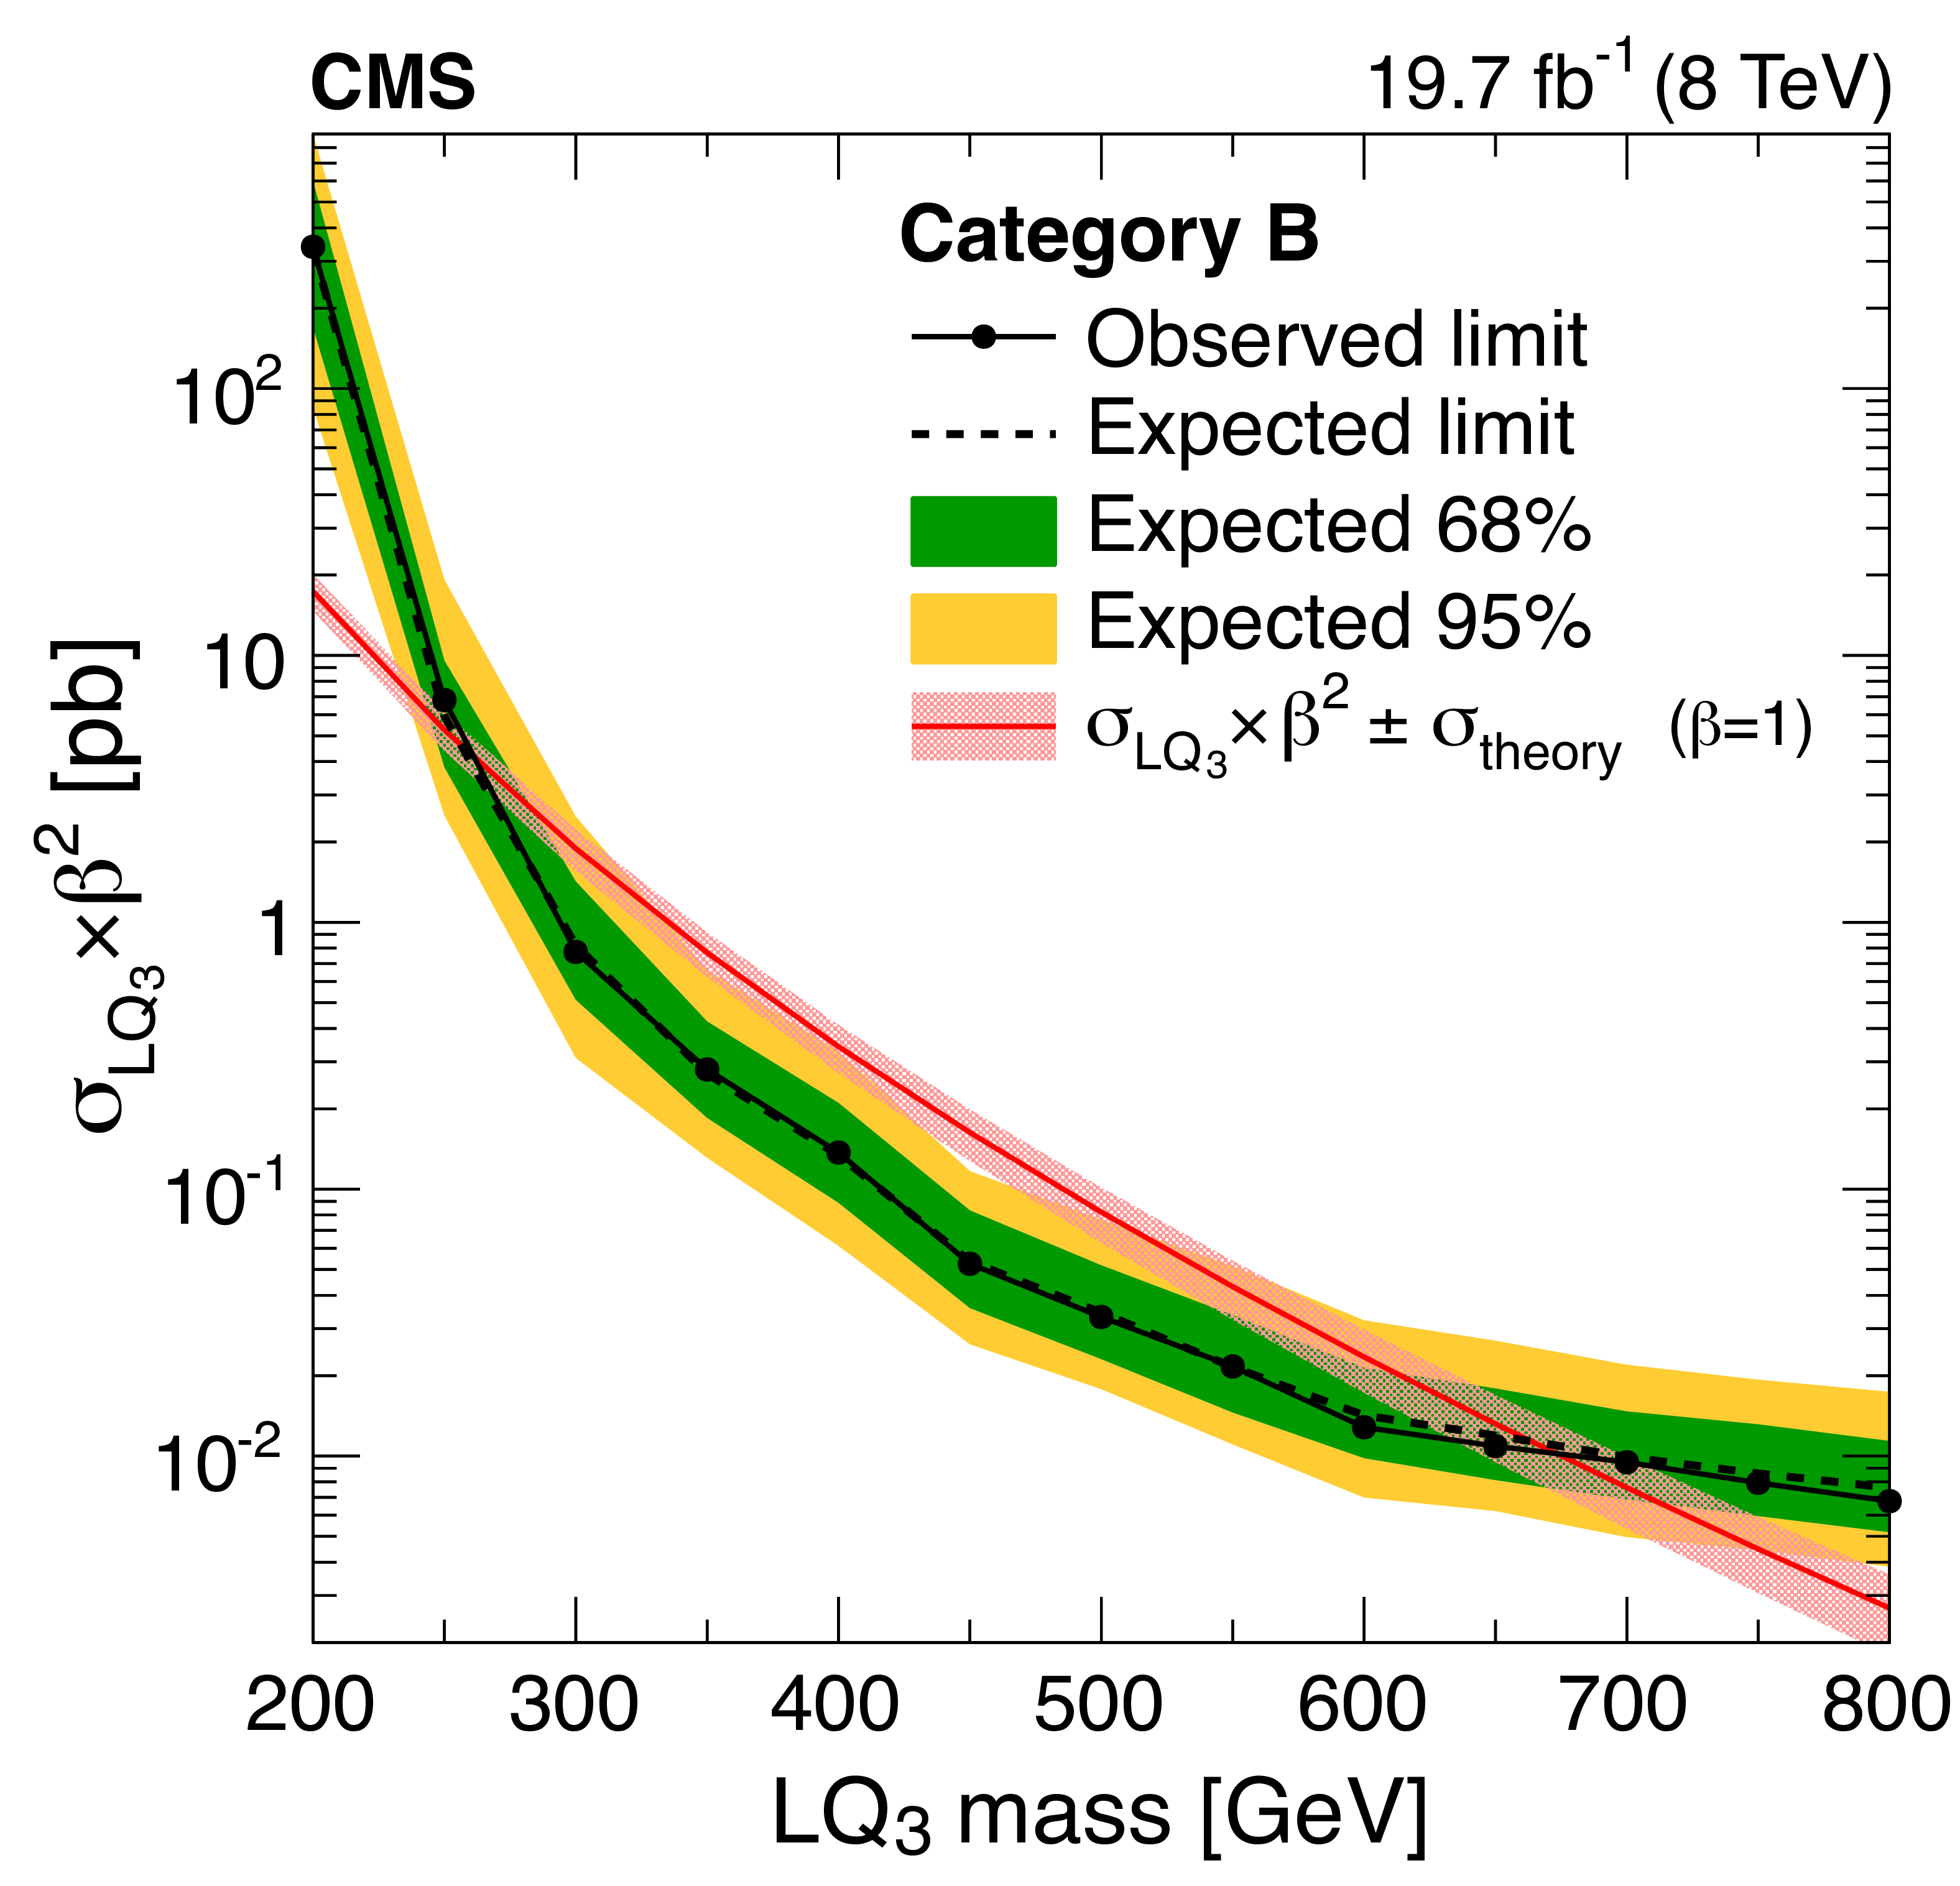
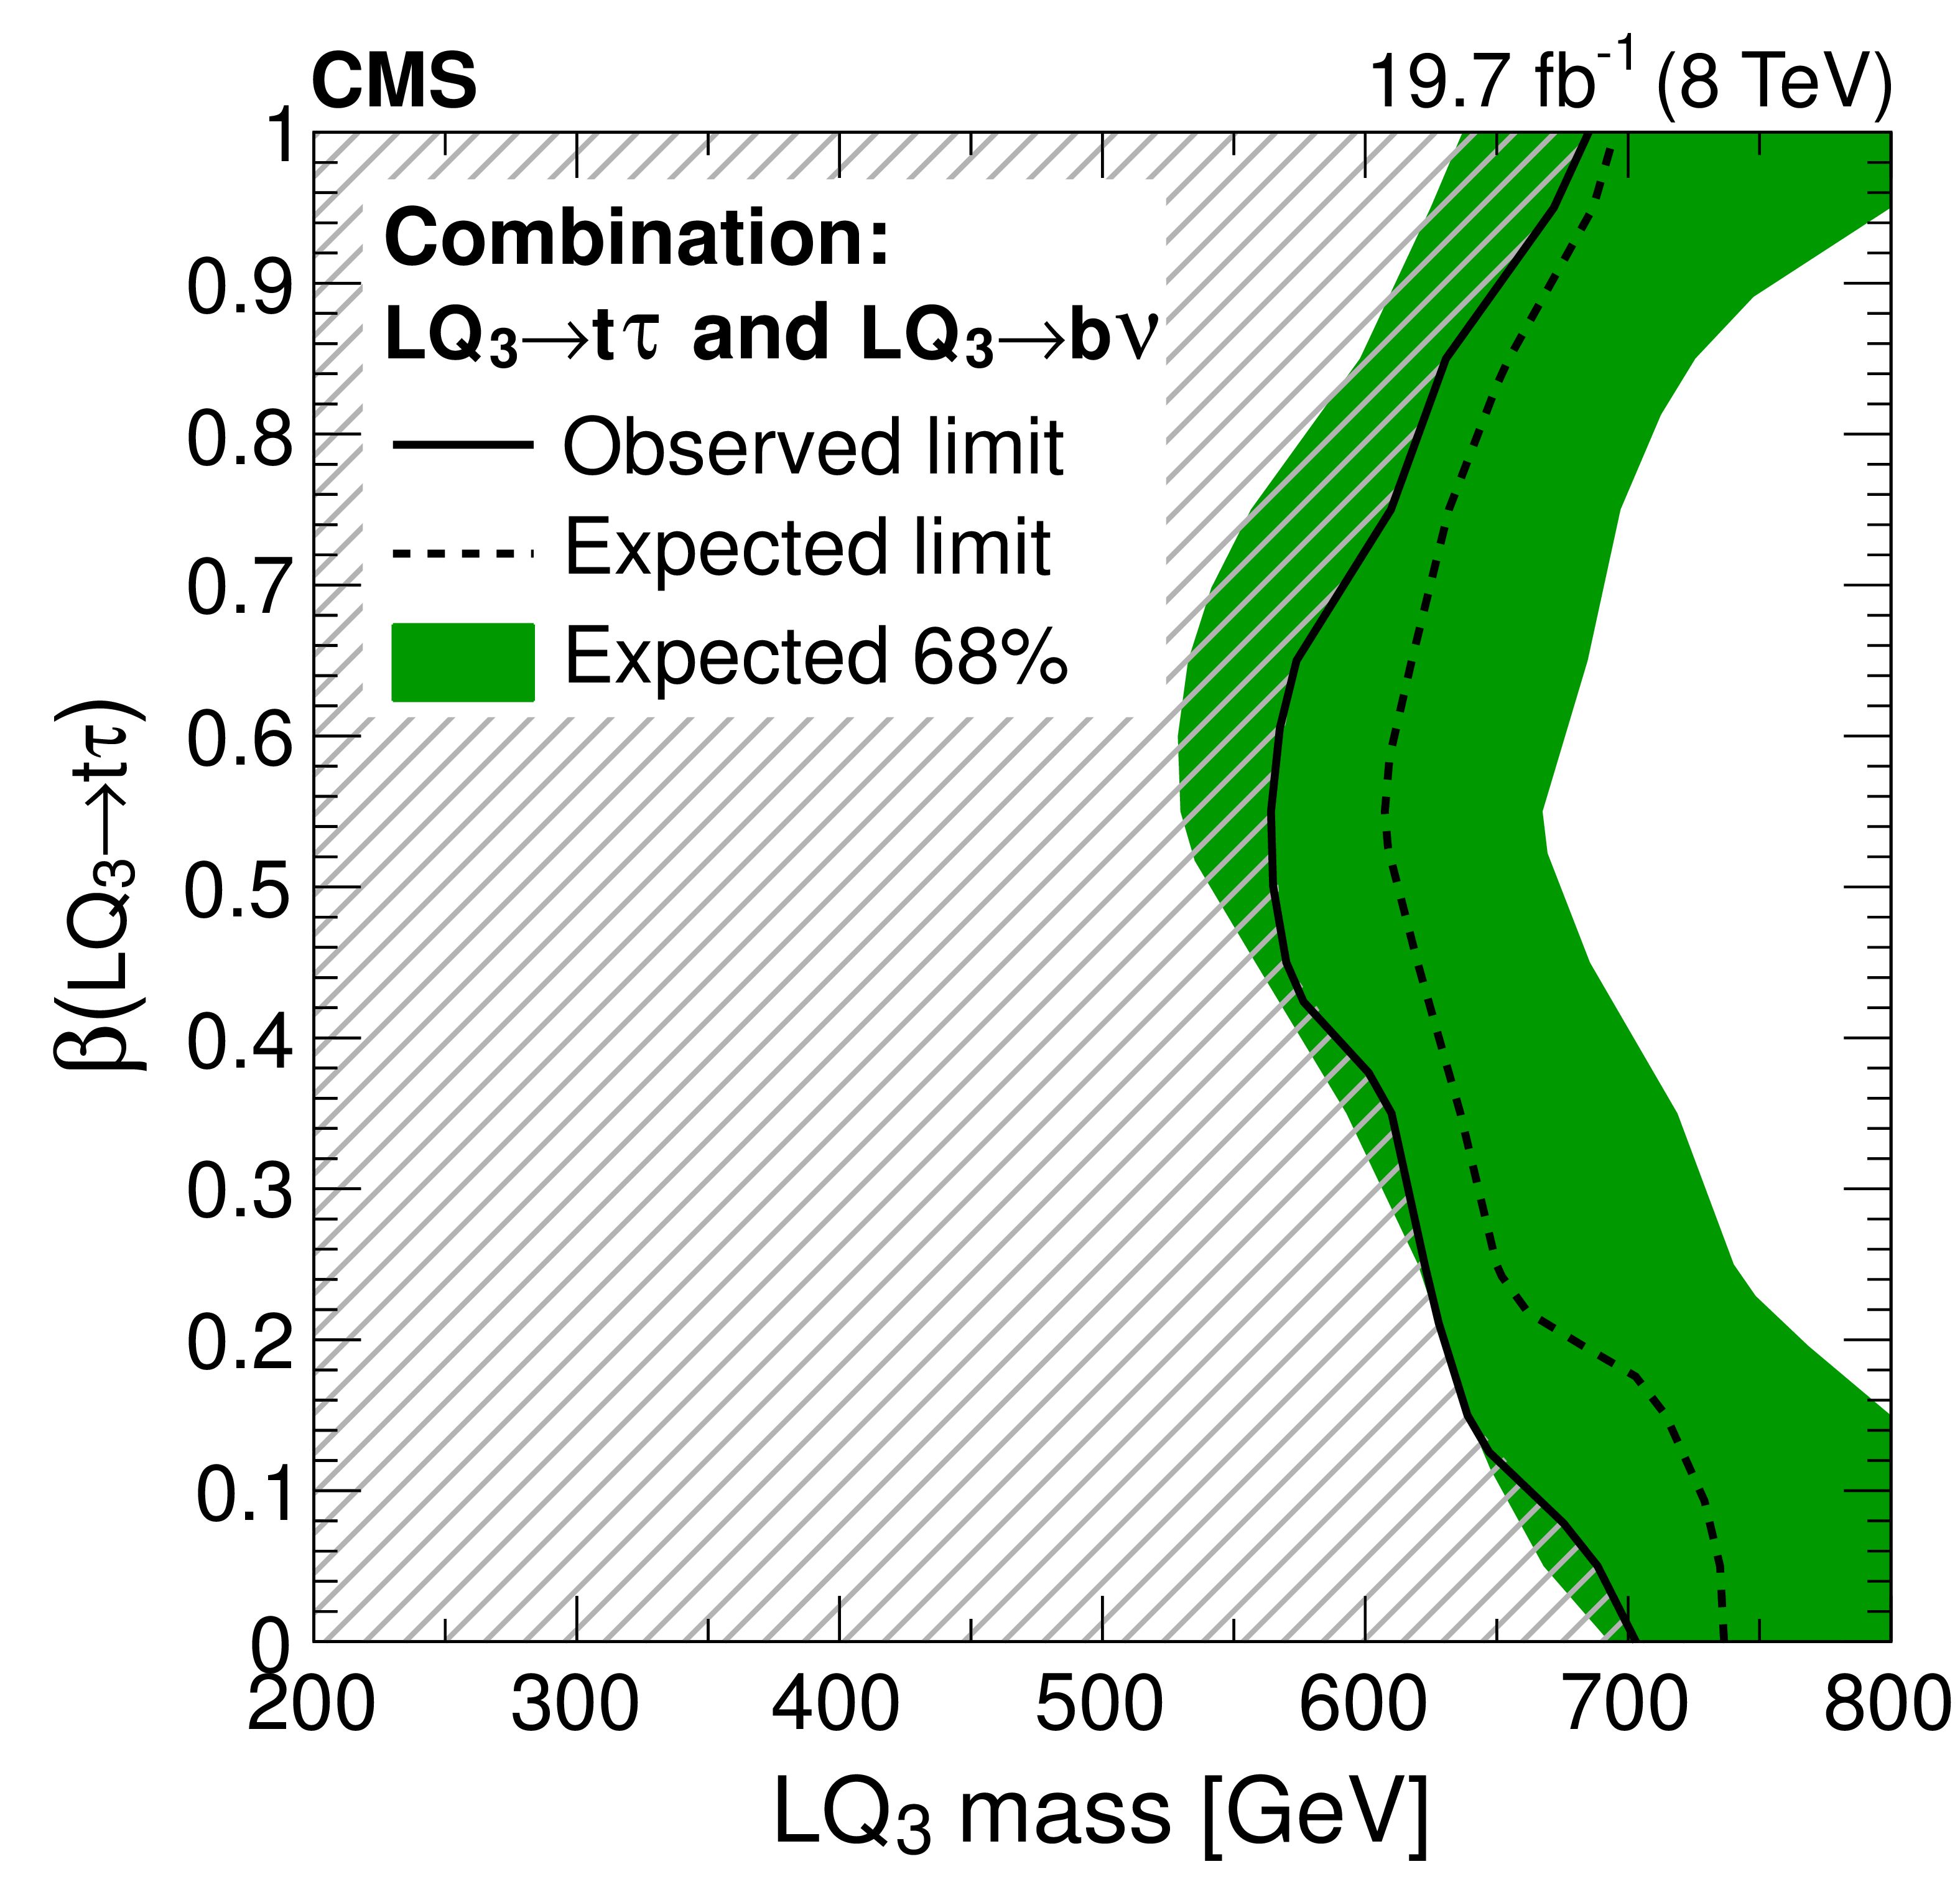
Figure 6:
The expected and observed exclusion limits at 95% CL on the $ {\mathrm {LQ}_3} $ pair production cross section times $\beta ^{2}$ in category A (upper left), category B (upper right) and the combination of the two categories (lower left). The theoretical uncertainty in the LQ pair production cross section includes the PDF and renormalization/factorization scale uncertainties as prescribed in Ref. [19]. The expected and observed limits on the LQ branching fraction $\beta $ as a function of the LQ mass (lower right). The total excluded region (shaded) is obtained by including the results in Ref. [17], reinterpreted for the $ {\mathrm {LQ}_3} \to \mathrm{ b } \nu $ scenario. |

png pdf |
Figure 6-a:
The expected and observed exclusion limits at 95% CL on the $ {\mathrm {LQ}_3} $ pair production cross section times $\beta ^{2}$ in category A (upper left), category B (upper right) and the combination of the two categories (lower left). The theoretical uncertainty in the LQ pair production cross section includes the PDF and renormalization/factorization scale uncertainties as prescribed in Ref. [19]. The expected and observed limits on the LQ branching fraction $\beta $ as a function of the LQ mass (lower right). The total excluded region (shaded) is obtained by including the results in Ref. [17], reinterpreted for the $ {\mathrm {LQ}_3} \to \mathrm{ b } \nu $ scenario. |
png pdf |
Figure 6-b:
The expected and observed exclusion limits at 95% CL on the $ {\mathrm {LQ}_3} $ pair production cross section times $\beta ^{2}$ in category A (upper left), category B (upper right) and the combination of the two categories (lower left). The theoretical uncertainty in the LQ pair production cross section includes the PDF and renormalization/factorization scale uncertainties as prescribed in Ref. [19]. The expected and observed limits on the LQ branching fraction $\beta $ as a function of the LQ mass (lower right). The total excluded region (shaded) is obtained by including the results in Ref. [17], reinterpreted for the $ {\mathrm {LQ}_3} \to \mathrm{ b } \nu $ scenario. |

png pdf |
Figure 6-c:
The expected and observed exclusion limits at 95% CL on the $ {\mathrm {LQ}_3} $ pair production cross section times $\beta ^{2}$ in category A (upper left), category B (upper right) and the combination of the two categories (lower left). The theoretical uncertainty in the LQ pair production cross section includes the PDF and renormalization/factorization scale uncertainties as prescribed in Ref. [19]. The expected and observed limits on the LQ branching fraction $\beta $ as a function of the LQ mass (lower right). The total excluded region (shaded) is obtained by including the results in Ref. [17], reinterpreted for the $ {\mathrm {LQ}_3} \to \mathrm{ b } \nu $ scenario. |
png pdf |
Figure 6-d:
The expected and observed exclusion limits at 95% CL on the $ {\mathrm {LQ}_3} $ pair production cross section times $\beta ^{2}$ in category A (upper left), category B (upper right) and the combination of the two categories (lower left). The theoretical uncertainty in the LQ pair production cross section includes the PDF and renormalization/factorization scale uncertainties as prescribed in Ref. [19]. The expected and observed limits on the LQ branching fraction $\beta $ as a function of the LQ mass (lower right). The total excluded region (shaded) is obtained by including the results in Ref. [17], reinterpreted for the $ {\mathrm {LQ}_3} \to \mathrm{ b } \nu $ scenario. |
| Tables | |
png pdf |
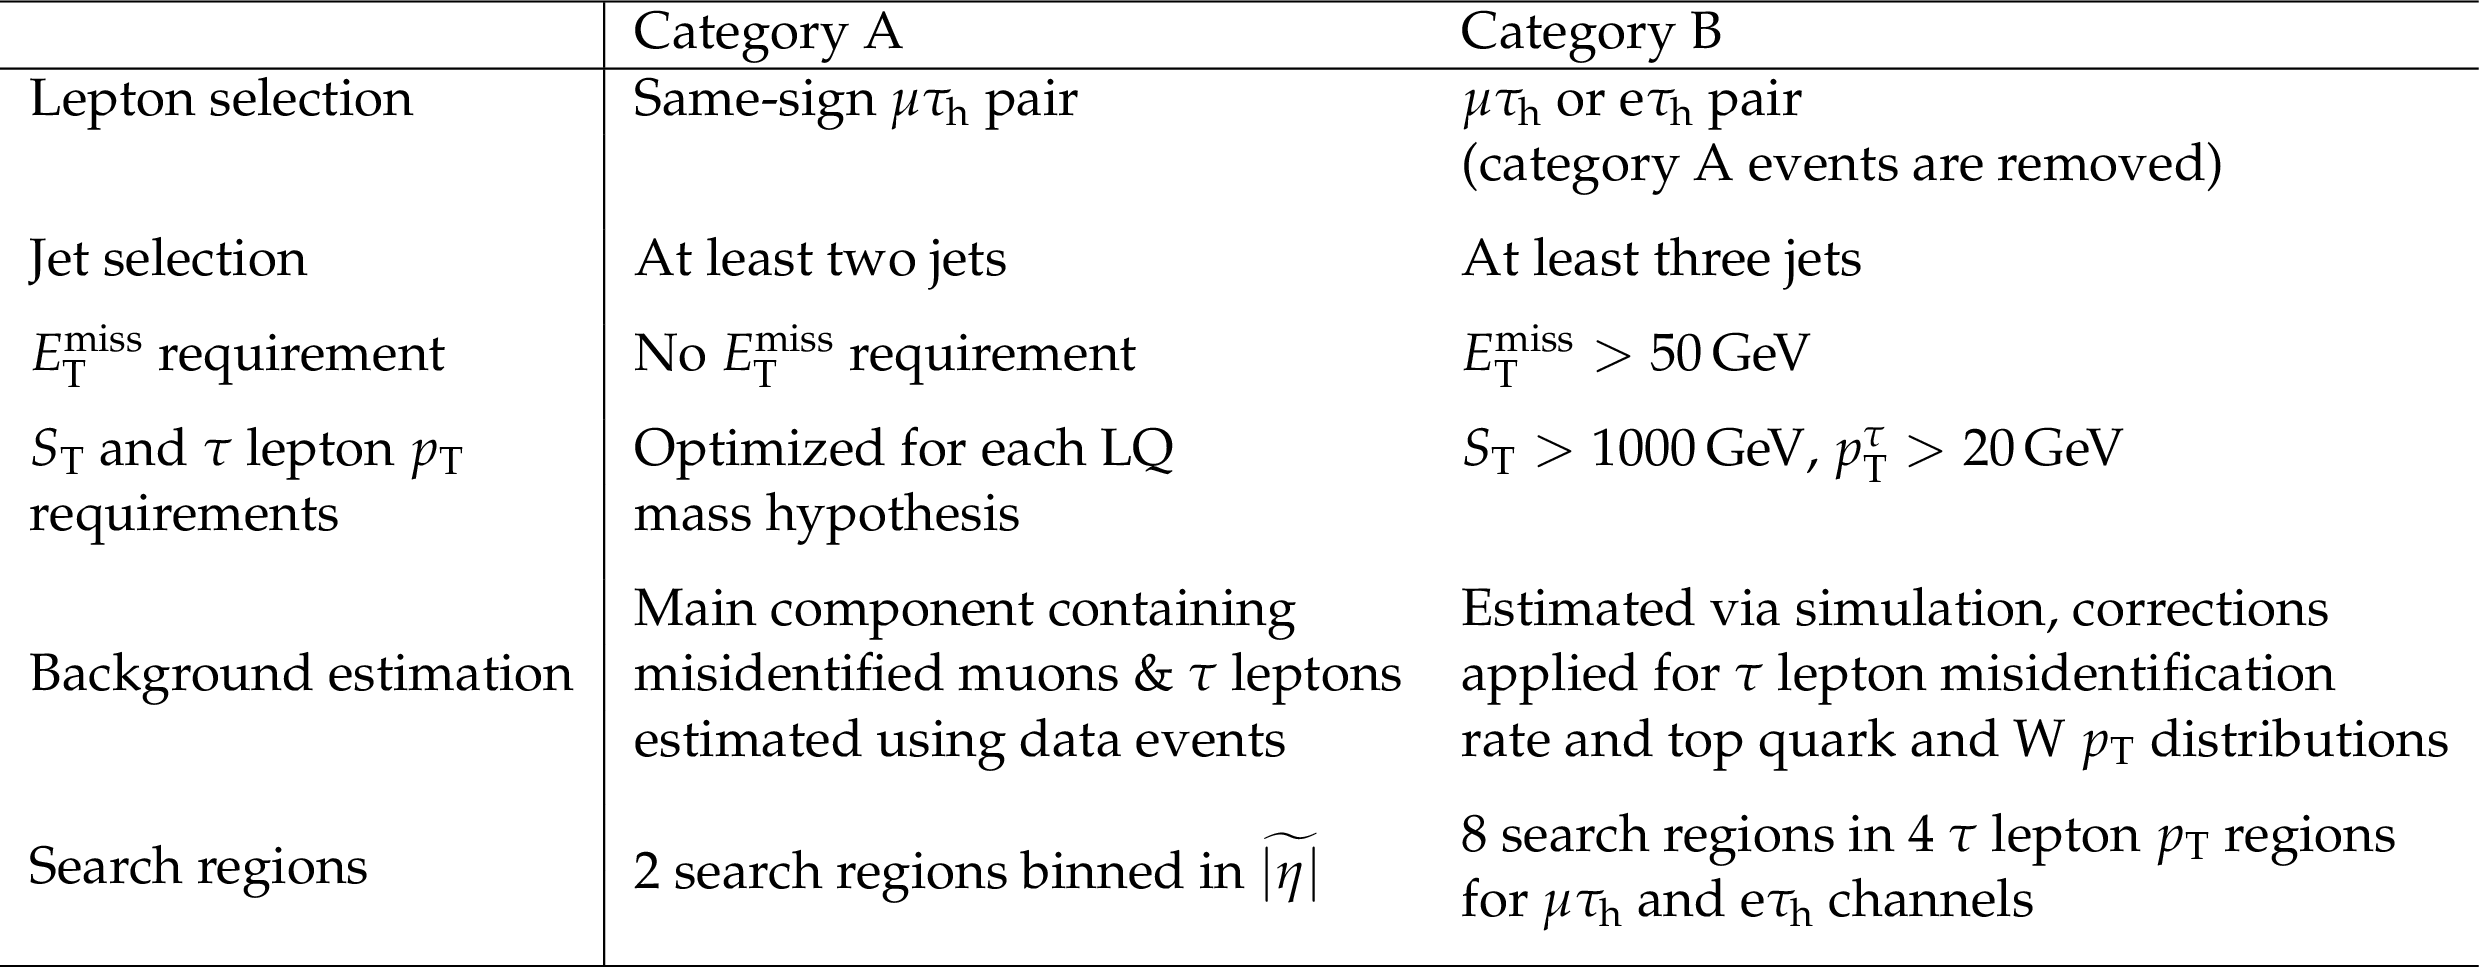
Table 1:
Summary of the search strategies in event categories A and B. |
png pdf |
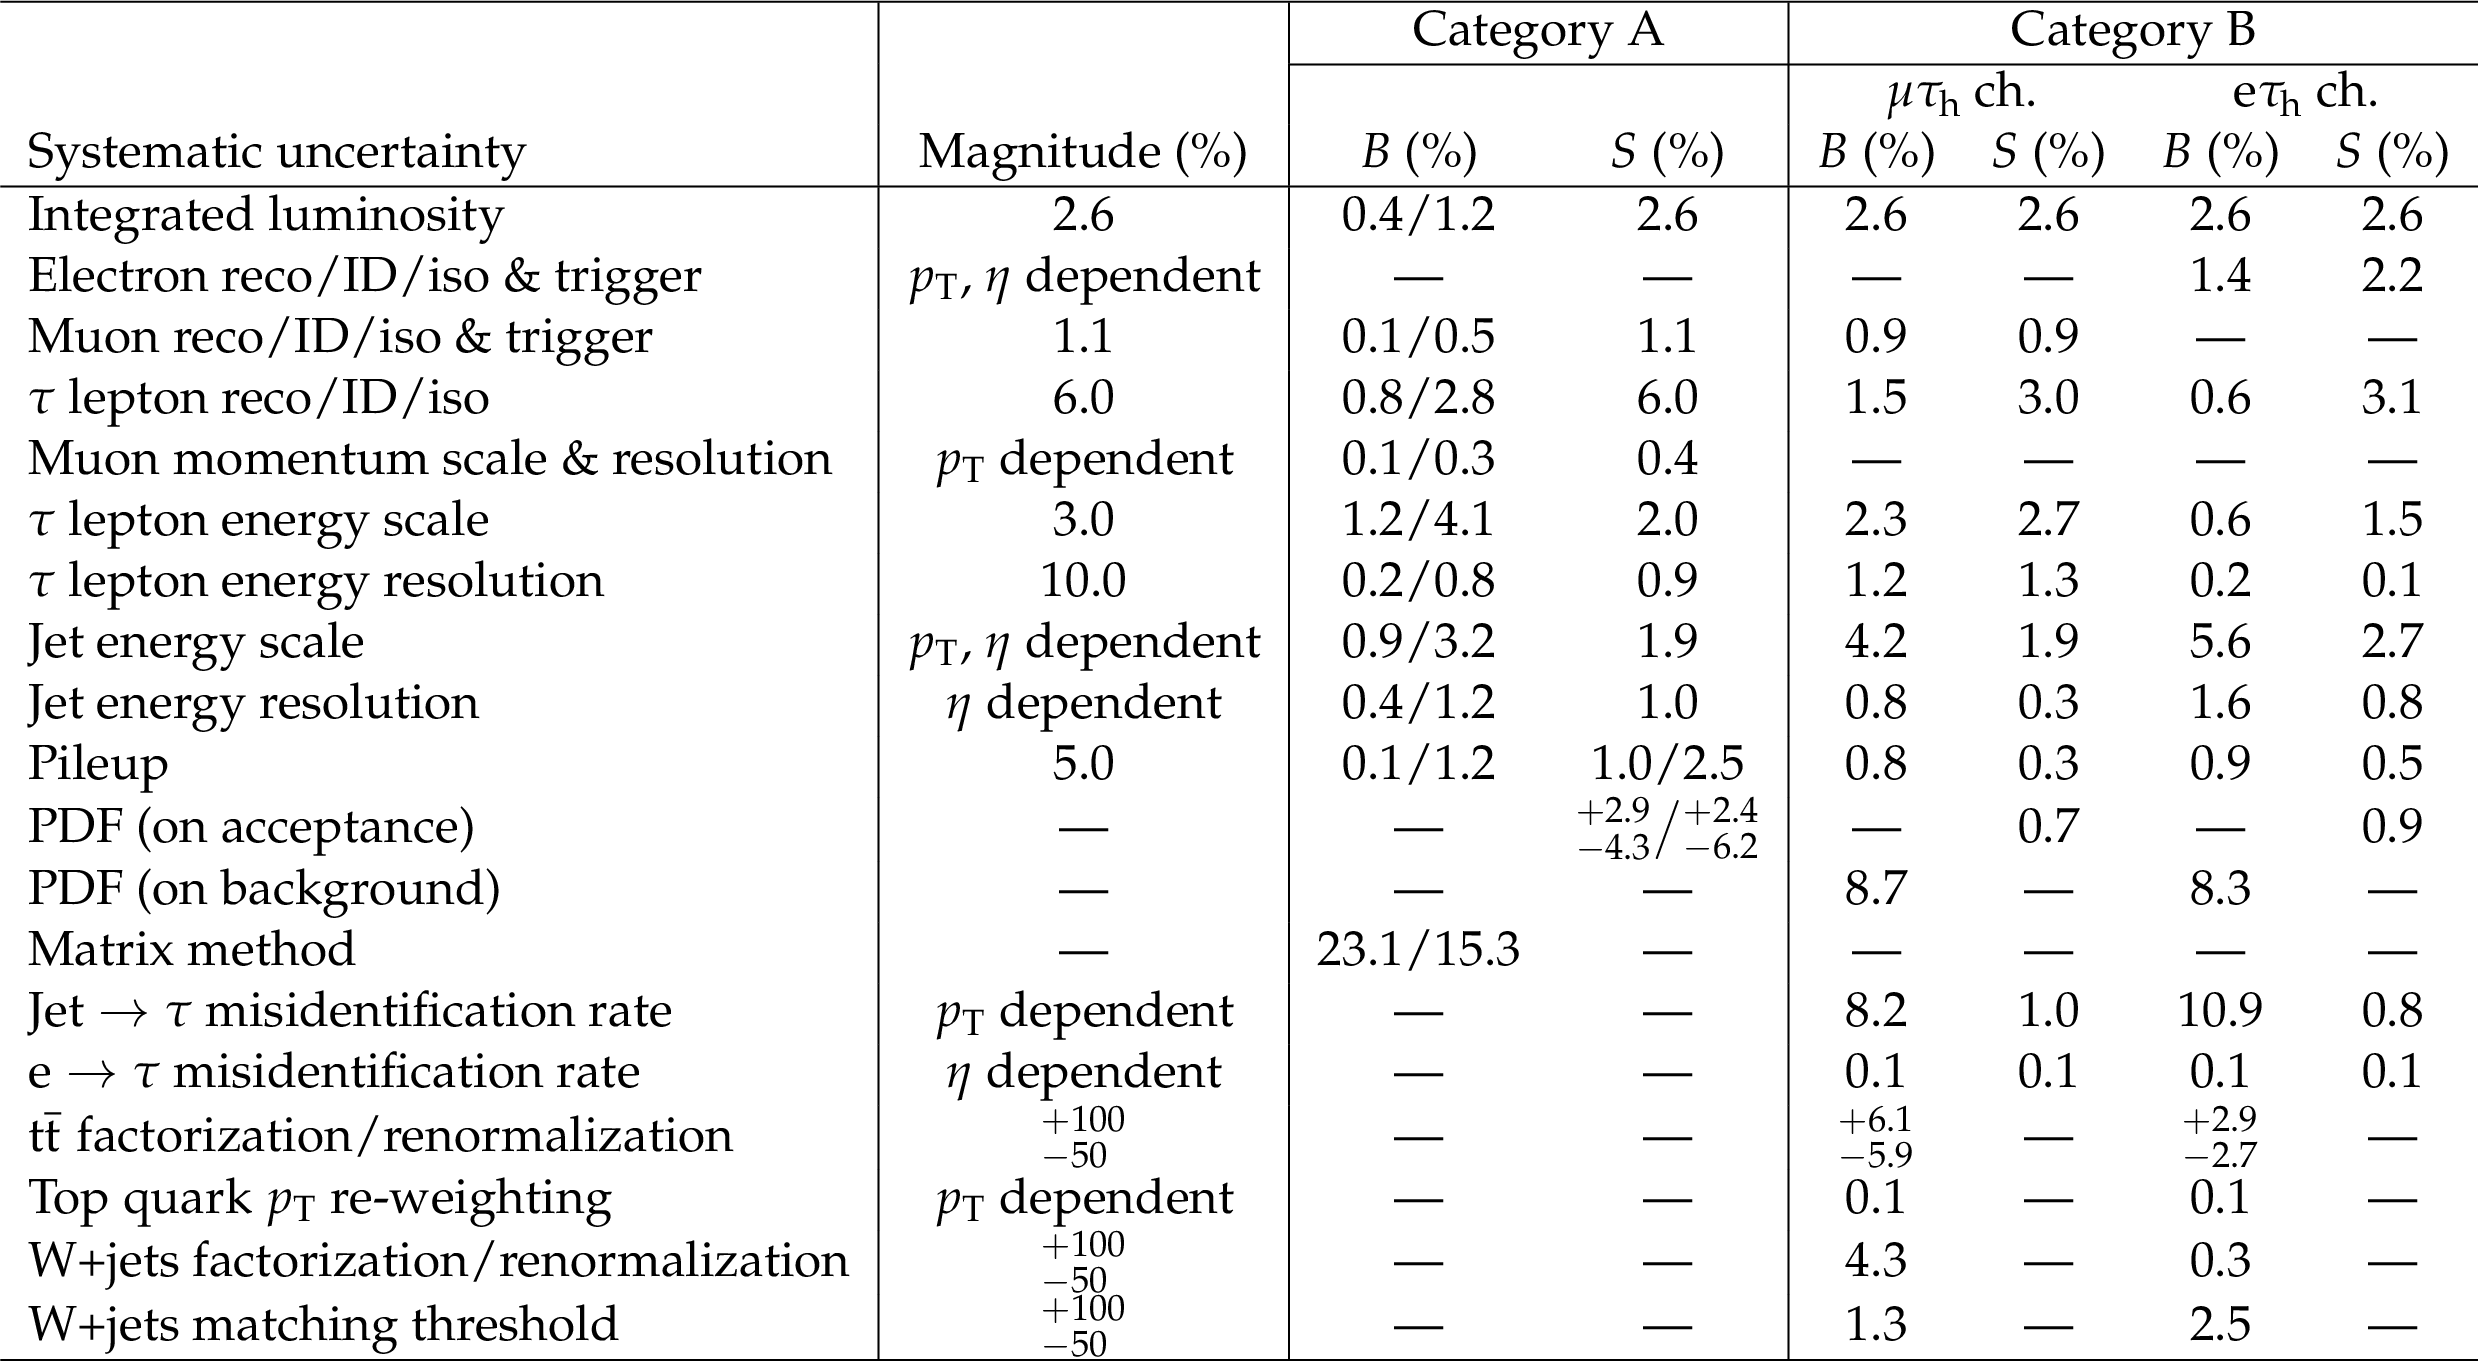
Table 2:
Systematic uncertainty sources and their effects on background ($B$) and signal ($S$) estimates. Uncertainties affecting the signal yields in both categories and the background yields in category A are calculated using the selection criteria for the $M_{ {\mathrm {LQ}_3} }= $ 550 GeV hypothesis. In category A, the uncertainties are reported for central/forward channels separately, where appropriate. In category B, all uncertainties are averaged over the four $ {p_{\mathrm {T}}} ^\tau $ search bins. All values are symmetric except for the PDF uncertainty in the signal acceptance in category A, and the ${\mathrm{ t } {}\mathrm{ \bar{t} } } $ factorization and normalization scale uncertainty in category B. The $\tau $ misidentification rate uncertainties considered in category B are included in the matrix method uncertainty in category A. All uncertainties in the background estimates are scaled according to their relative contributions to the total expected background. |

png pdf |
Table 3:
Category A search results in the signal region for several $ {\mathrm {LQ}_3} $ mass hypotheses. The $\tau $ lepton $ {p_{\mathrm {T}}} $ and $ {S_\mathrm {T}} $ columns represent the optimized thresholds defined in the text. The corresponding expected number of prompt-prompt and total background events, as well as the observed number of data events are listed as $N_{\text {Bkg}}^{\mathrm {PP}}$, total $N_{\text {Bkg}}^{\text {Exp}}$, and $N^{\text {Obs}}$. The statistical and systematic uncertainties quoted in the expected number of background events are combinations of misidentified lepton and prompt-prompt components. The $\epsilon _{ {\mathrm {LQ}_3} }$ is the expected signal efficiency at a given $ {\mathrm {LQ}_3} $ mass with respect to the total number of expected $ {\mathrm {LQ}_3} $ signal events at $\sqrt {s}=$ 8 TeV with a $\mu {\tau _\mathrm {h}} $ pair of any charge combination. No expected signal efficiency for $M_{ {\mathrm {LQ}_3} }=$ 200 GeV is reported in the forward channel since the associated yield in the signal sample was measured to be zero. |
png pdf |
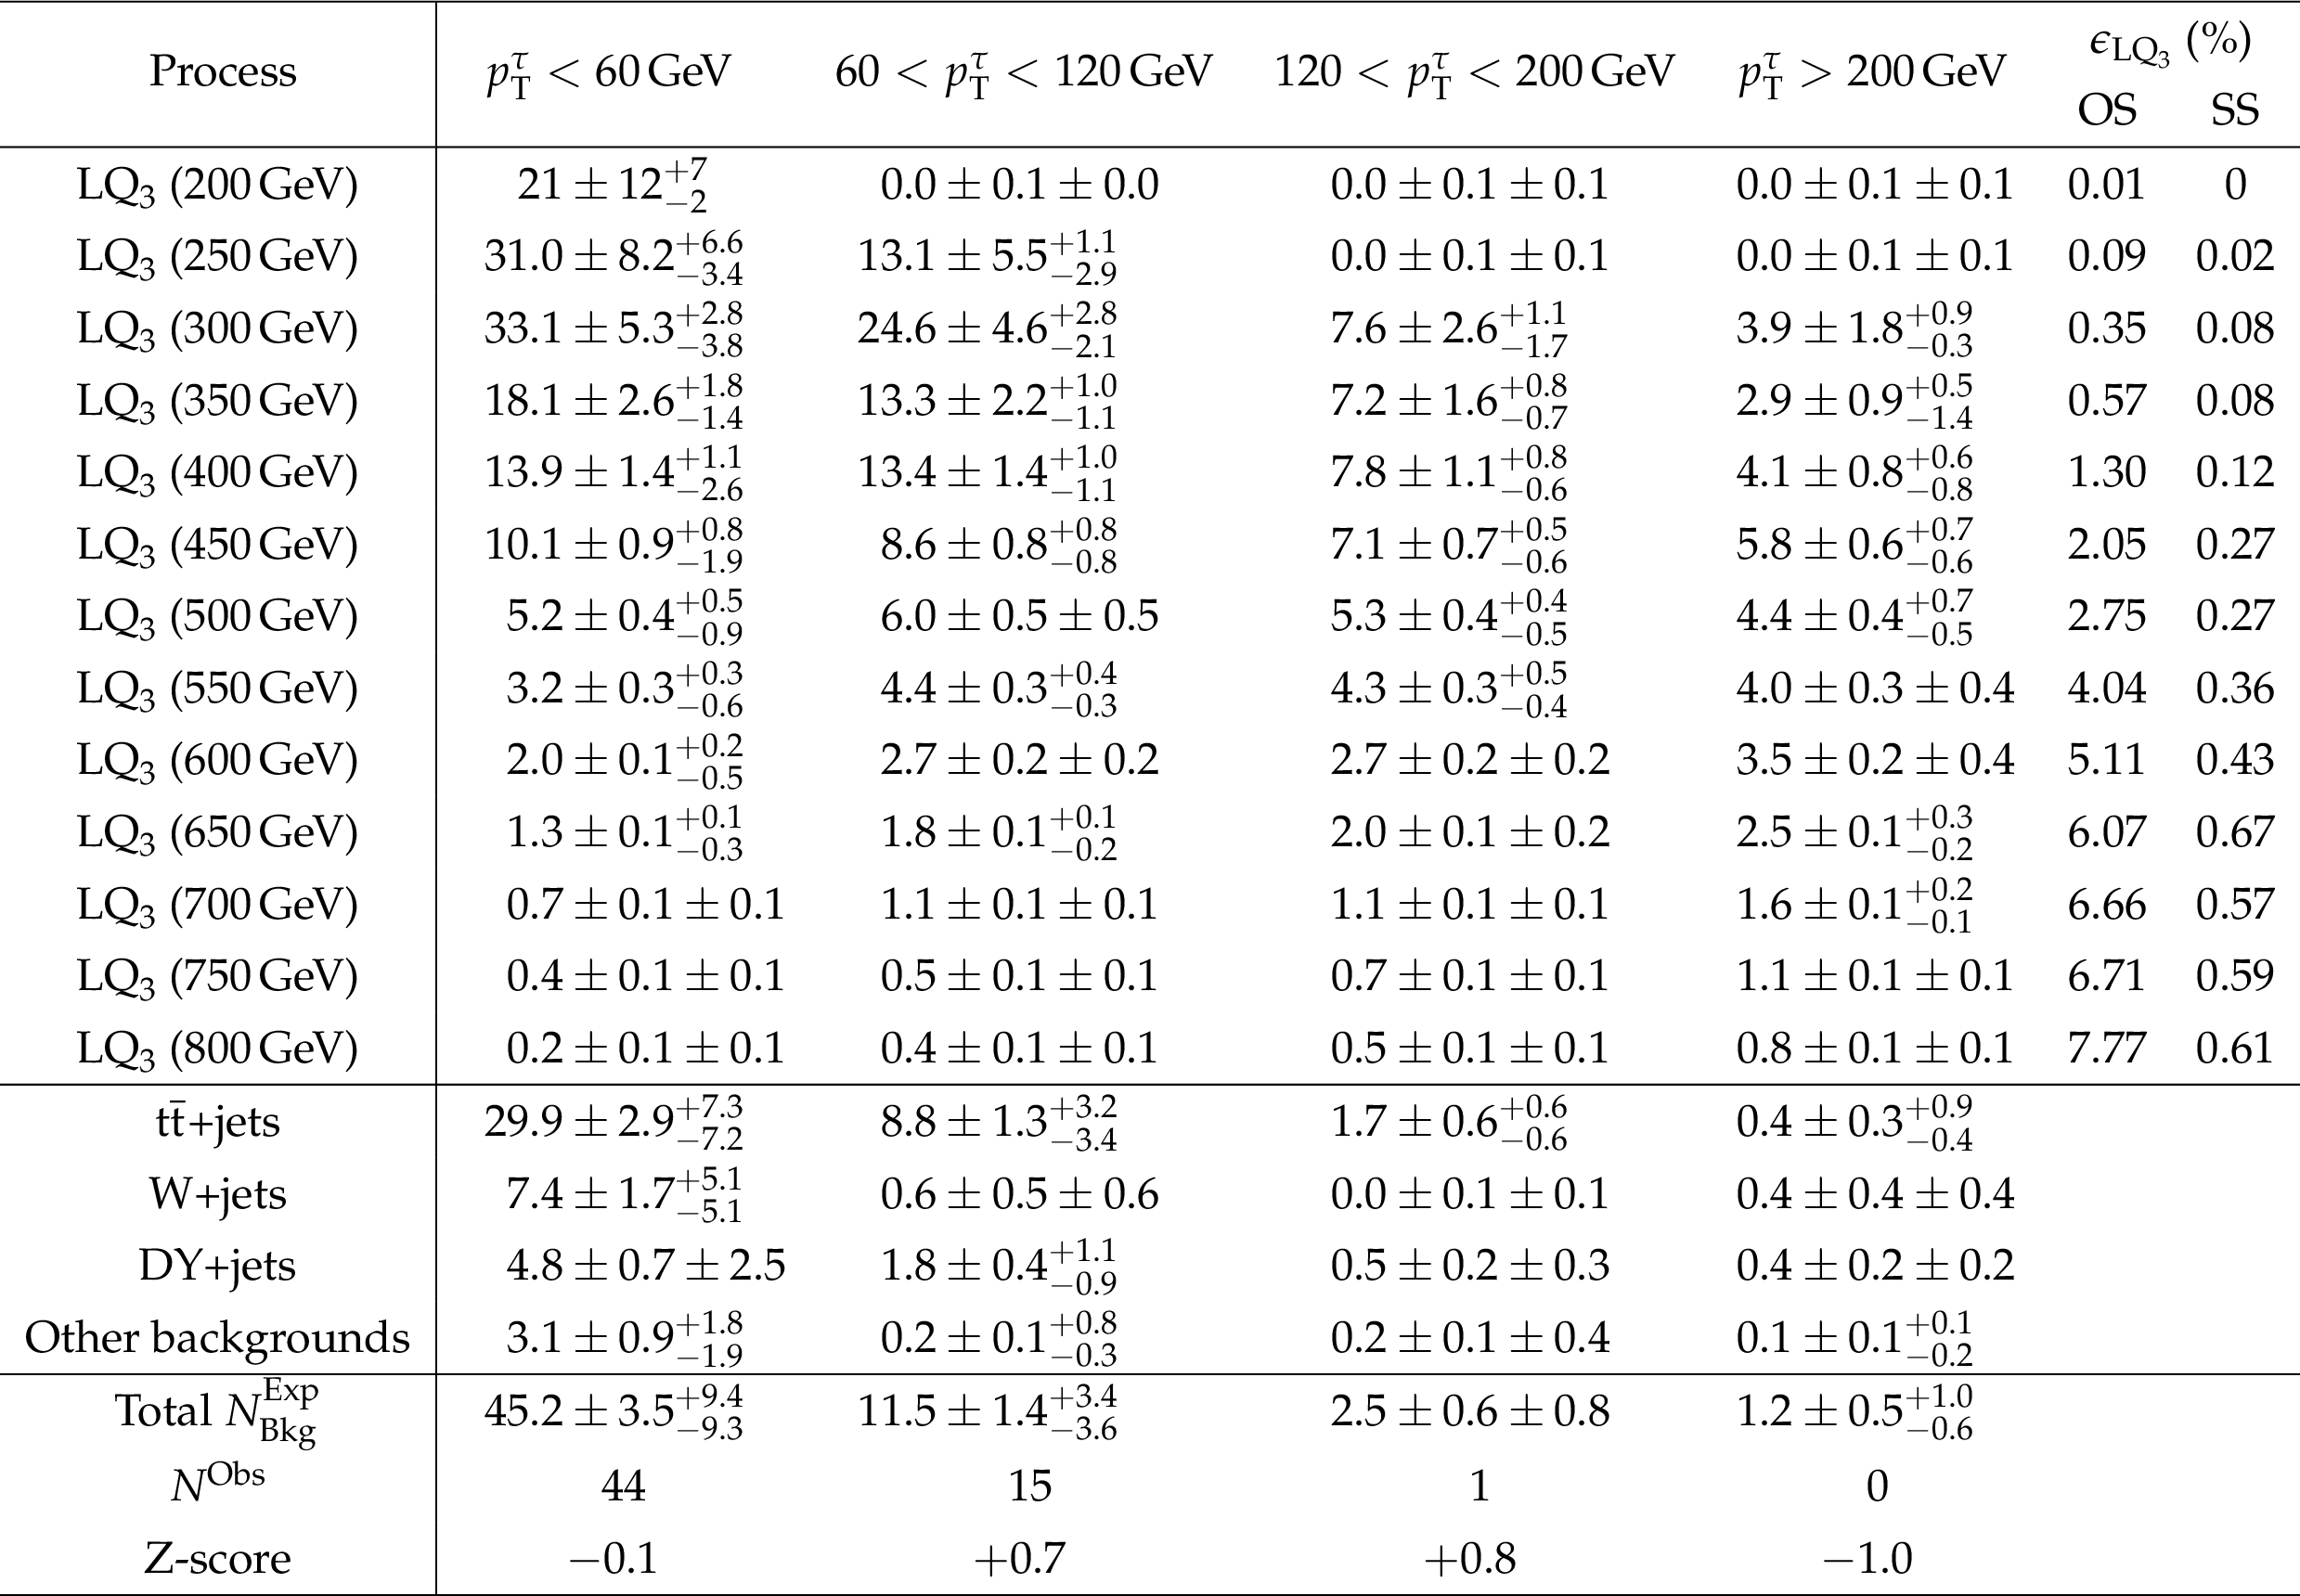
Table 4:
Category B search results for the four $ {p_{\mathrm {T}}} ^\tau $ search regions of the $\mu {\tau _\mathrm {h}} $ channel. All expected values for background and signal processes ($ {\mathrm {LQ}_3} $ masses indicated in parentheses) are reported with the corresponding statistical and systematic uncertainties. The expected signal efficiency $\epsilon _{ {\mathrm {LQ}_3} }$ at a given $ {\mathrm {LQ}_3} $ mass is determined with respect to the total number of expected $ {\mathrm {LQ}_3} $ signal events at $\sqrt {s}=8$ TeV with a $\mu {\tau _\mathrm {h}} $ pair of any charge combination, and $\epsilon _{ {\mathrm {LQ}_3} }$ is reported separately for opposite-sign (OS) and same-sign (SS) $\mu {\tau _\mathrm {h}} $ events. |
png pdf |
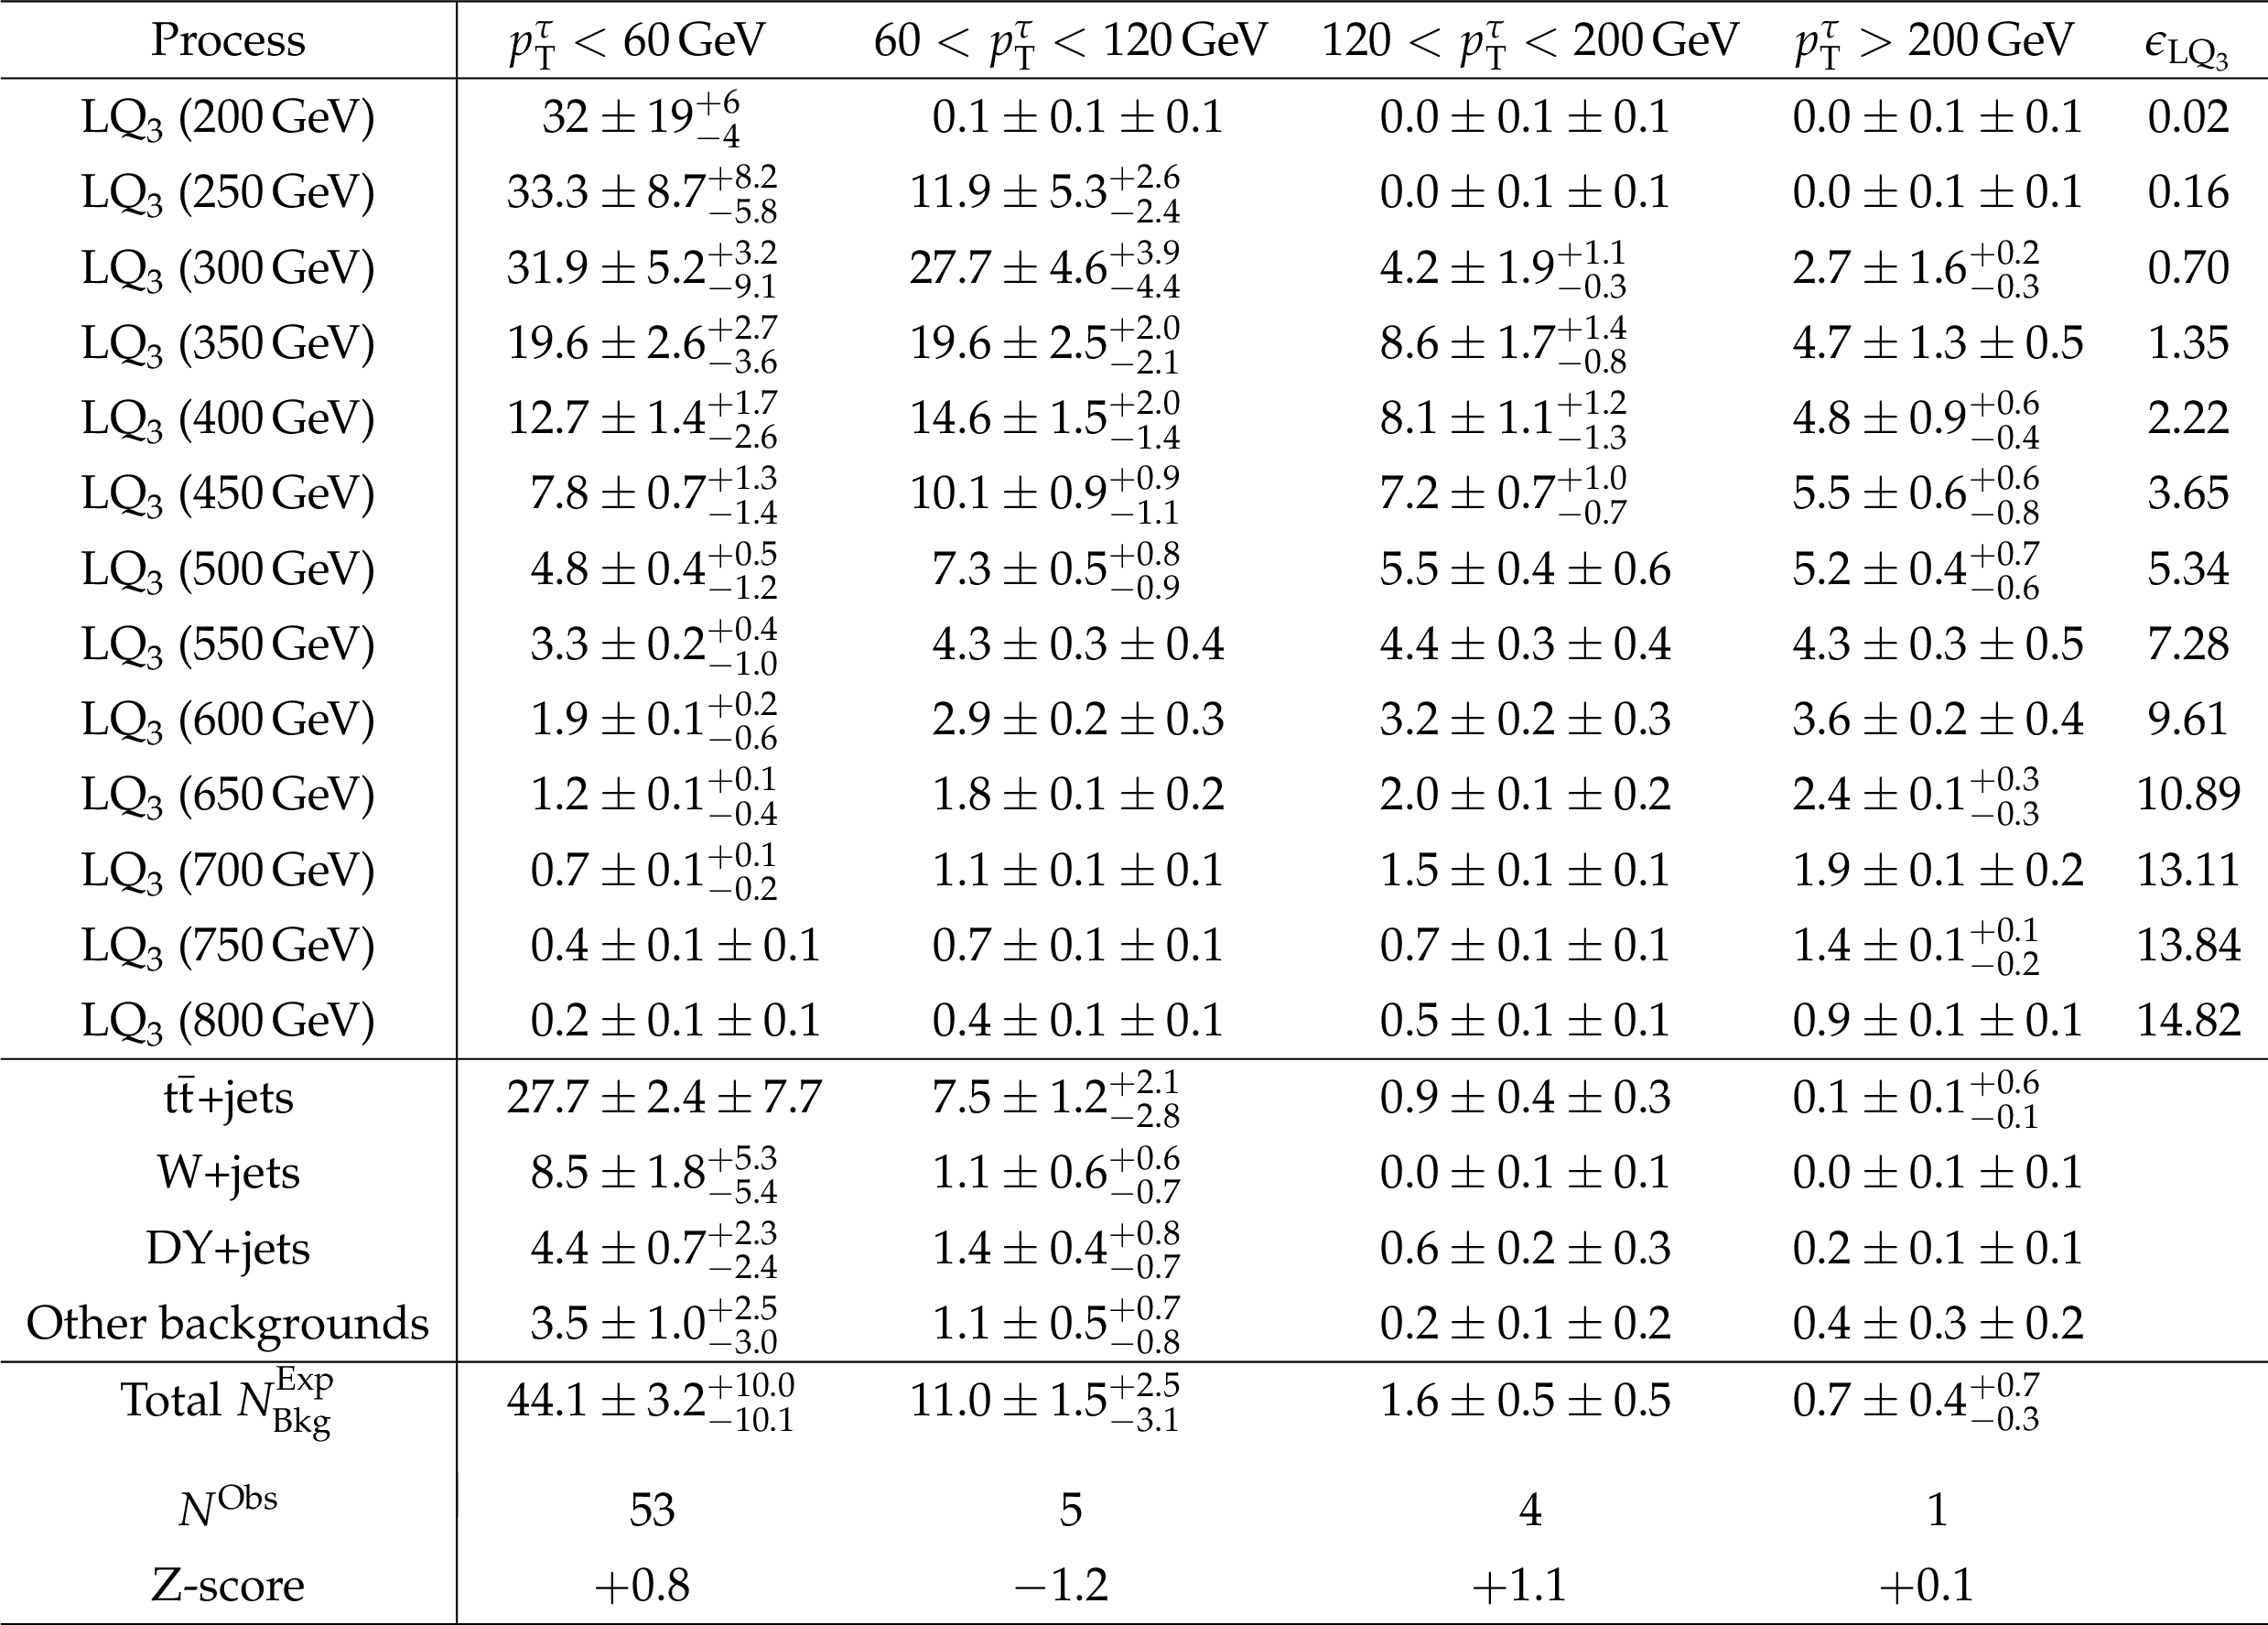
Table 5:
Category B search results for the four $ {p_{\mathrm {T}}} ^\tau $ search regions of the $\mathrm{ e } {\tau _\mathrm {h}} $ channel. All expected values for background and signal processes ($ {\mathrm {LQ}_3} $ masses indicated in parentheses) are reported with the corresponding statistical and systematic uncertainties. The expected signal efficiency $\epsilon _{ {\mathrm {LQ}_3} }$ at a given $ {\mathrm {LQ}_3} $ mass is determined with respect to the total number of expected $ {\mathrm {LQ}_3} $ signal events at $\sqrt {s}=8$ TeV with an $\mathrm{ e } {\tau _\mathrm {h}} $ pair of any charge combination. |
| Summary |
| A search for pair produced, charge $-1/3$, third-generation scalar leptoquarks decaying to top quark and $\tau$ lepton pairs has been conducted in the $\ell\tau_{\mathrm{h}}$ channel with two or more jets, using a proton-proton collisions data sample collected with the CMS detector at $\sqrt{s}=8$ TeV corresponding to an integrated luminosity of 19.7 fb$^{-1}$. No statistically significant excess is observed over the SM background expectations. Assuming that all leptoquarks decay to a top quark and a $\tau$ lepton, the pair production of charge $-1/3$, third-generation scalar leptoquarks is excluded at 95% CL for masses up to 685 GeV (695 GeV expected). This constitutes the first direct result for leptoquarks decaying in this channel, and the mass limit is also directly applicable to pair produced bottom squarks decaying via the RPV coupling $\lambda_{333}^{\prime}$. |
| References | ||||
| 1 | J. C. Pati and A. Salam | Lepton number as the fourth ``color" | PRD 10 (1974) 275, . [Erratum: \DOI10.1103/PhysRevD.11.703.2] | |
| 2 | H. Georgi and S. L. Glashow | Unity of All Elementary Particle Forces | PRL 32 (1974) 438 | |
| 3 | S. Chakdar, T. Li, S. Nandi, and S. K. Rai | Unity of elementary particles and forces for the third family | PLB 718 (2012) 121 | 1206.0409 |
| 4 | E. Farhi and L. Susskind | Technicolor | PR 74 (1981) 277 | |
| 5 | B. Schrempp and F. Schrempp | Light leptoquarks | PLB 153 (1985) 101 | |
| 6 | B. Gripaios | Composite leptoquarks at the LHC | JHEP 02 (2010) 045 | 0910.1789 |
| 7 | W. Buchm\"uller, R. R\"uckl, and D. Wyler | Leptoquarks in lepton-quark collisions | PLB 191 (1987) 442, . [Erratum: \DOI10.1016/S0370-2693(99)00014-3] | |
| 8 | D. E. Acosta and S. K. Blessing | Leptoquark Searches at HERA and the Tevatron | Ann. Rev. Nucl. Part. Sci. 49 (1999) 389 | |
| 9 | ATLAS Collaboration | Search for first generation scalar leptoquarks in pp collisions at $ \sqrt{s}=7 $ TeV with the ATLAS detector | PLB 709 (2012) 158, , [Erratum: \DOI10.1016/j.physletb.2012.03.023] | 1112.4828 |
| 10 | ATLAS Collaboration | Search for second generation scalar leptoquarks in pp collisions at $ \sqrt{s}=7 $ TeV with the ATLAS detector | EPJC 72 (2012) 2151 | 1203.3172 |
| 11 | CMS Collaboration | Search for pair production of first- and second-generation scalar leptoquarks in pp collisions at $ \sqrt{s}= 7 $ TeV | PRD 86 (2012) 052013 | CMS-EXO-11-028 1207.5406 |
| 12 | D0 Collaboration | Search for Third-Generation Scalar Leptoquarks in $ \rm{p}\overline{\rm{p}} $ Collisions at $ \sqrt{s}=1.96 $$ \,TeV $ | PRL 99 (2007) 061801 | 0705.0812 |
| 13 | CDF Collaboration | Search for third generation vector leptoquarks in $ \rm{p}\overline{\rm{p}} $ collisions at $ \sqrt{s}=1.96\text{\,}\text{\,}\mathrm{TeV} $ | PRD 77 (2008) 091105 | 0706.2832 |
| 14 | ATLAS Collaboration | Search for third generation scalar leptoquarks in pp collisions at $ \sqrt{s} $ = 7 TeV with the ATLAS detector | JHEP 06 (2013) 033 | 1303.0526 |
| 15 | CMS Collaboration | Search for third-generation leptoquarks and scalar bottom quarks in pp collisions at $ \sqrt{s}=7 $ TeV | JHEP 12 (2012) 055 | CMS-EXO-11-030 1210.5627 |
| 16 | CMS Collaboration | Search for pair production of third-generation scalar leptoquarks and top squarks in proton-proton collisions at $ \sqrt{s} $ = 8 TeV | PLB 739 (2014) 229 | CMS-EXO-12-032 1408.0806 |
| 17 | CMS Collaboration | Searches for third generation squark production in fully hadronic final states in proton-proton collisions at $ \sqrt{s}=8 $ TeV | Submitted to JHEP | CMS-SUS-14-001 1503.08037 |
| 18 | R. Barbier et al. | $ R $-Parity-violating supersymmetry | PR 420 (2005) 1 | hep-ph/0406039 |
| 19 | M. Kr\"amer, T. Plehn, M. Spira, and P. M. Zerwas | Pair production of scalar leptoquarks at the CERN LHC | PRD 71 (2005) 057503 | hep-ph/0411038 |
| 20 | CMS Collaboration | The CMS experiment at the CERN LHC | JINST 3 (2008) S08004 | CMS-00-001 |
| 21 | CMS Collaboration | Particle-Flow Event Reconstruction in CMS and Performance for Jets, Taus, and $ \ETmiss $ | CDS | |
| 22 | CMS Collaboration | Commissioning of the Particle-flow Event Reconstruction with the first LHC collisions recorded in the CMS detector | CDS | |
| 23 | CMS Collaboration | Performance of CMS muon reconstruction in pp collision events at $ \sqrt{s}=7 $ TeV | JINST 7 (2012) P10002 | CMS-MUO-10-004 1206.4071 |
| 24 | CMS Collaboration | Performance of tau-lepton reconstruction and identification in CMS | JINST 7 (2012) P01001 | CMS-TAU-11-001 1109.6034 |
| 25 | CMS Collaboration | Performance of electron reconstruction and selection with the CMS detector in proton-proton collisions at $ \sqrt{s}=8 $ TeV | Submitted to JINST | CMS-EGM-13-001 1502.02701 |
| 26 | M. Cacciari, G. P. Salam, and G. Soyez | The anti-$ k_t $ jet clustering algorithm | JHEP 04 (2008) 063 | |
| 27 | CMS Collaboration | Determination of jet energy calibration and transverse momentum resolution in CMS | JINST 6 (2011) P11002 | |
| 28 | CMS Collaboration | Performance of Missing Transverse Momentum Reconstruction Algorithms in Proton-Proton Collisions at $ \sqrt{s}=8 $ TeV with the CMS Detector | CMS-PAS-JME-12-002 | CMS-PAS-JME-12-002 |
| 29 | CMS Collaboration | The CMS high level trigger | EPJC 46 (2006) 605 | hep-ex/0512077 |
| 30 | T. Sj\"ostrand, S. Mrenna, and P. Skands | PYTHIA 6.4 physics and manual | JHEP 05 (2006) 026 | hep-ph/0603175 |
| 31 | S. Alioli, P. Nason, C. Oleari, and E. Re | A general framework for implementing NLO calculations in shower Monte Carlo programs: the POWHEG BOX | JHEP 06 (2010) 043 | 1002.2581 |
| 32 | S. Alioli, P. Nason, C. Oleari, and E. Re | NLO single-top production matched with shower in POWHEG: $ s $- and $ t $-channel contributions | JHEP 09 (2009) 111, , [Erratum: \DOI10.1007/JHEP02(2010)011] | 0907.4076 |
| 33 | E. Re | Single-top Wt-channel production matched with parton showers using the POWHEG method | EPJC 71 (2011) 1547 | 1009.2450 |
| 34 | S. Frixione, P. Nason, and G. Ridolfi | A Positive-weight next-to-leading-order Monte Carlo for heavy flavour hadroproduction | JHEP 09 (2007) 126 | 0707.3088 |
| 35 | J. Alwall et al. | MadGraph 5: going beyond | JHEP 06 (2011) 128 | 1106.0522 |
| 36 | J. Alwall et al. | Comparative study of various algorithms for the merging of parton showers and matrix elements in hadronic collisions | EPJC 53 (2008) 473 | 0706.2569 |
| 37 | Z. W\cas | TAUOLA the library for tau lepton decay, and KKMC/KORALB/KORALZ/... status report | Nucl. Phys. B, Proc. Suppl. 98 (2001) 96 | |
| 38 | GEANT4 Collaboration | GEANT4---a simulation toolkit | NIMA 506 (2003) 250 | |
| 39 | H.-L. Lai et al. | New parton distributions for collider physics | PRD 82 (2010) 074024 | 1007.2241 |
| 40 | J. Pumplin et al. | New generation of parton distributions with uncertainties from global QCD analysis | JHEP 07 (2002) 012 | hep-ph/0201195 |
| 41 | Y. Li and F. Petriello | Combining QCD and electroweak corrections to dilepton production in FEWZ | PRD 86 (2012) 094034 | 1208.5967 |
| 42 | M. Czakon, P. Fiedler, and A. Mitov | Total Top-Quark Pair-Production Cross Section at Hadron Colliders Through $ O(\alpha^4_S) $ | PRL 110 (2013) 252004 | 1303.6254 |
| 43 | O. Brein, R. V. Harlander, and T. J. E. Zirke | vh@nnlo---Higgs Strahlung at hadron colliders | CPC 184 (2013) 998 | 1210.5347 |
| 44 | N. Kidonakis and R. Vogt | Theoretical top quark cross section at the Tevatron and the LHC | PRD 78 (2008) 074005 | 0805.3844 |
| 45 | J. M. Campbell, R. K. Ellis, and C. Williams | Vector boson pair production at the LHC | JHEP 07 (2011) 018 | 1105.0020 |
| 46 | M. V. Garzelli, A. Kardos, C. G. Papadopoulos, and Z. Tr\'ocs\'anyi | t$ {\rm \bar{t}} $$ {\rm W}^{\pm} $ and t$ {\rm \bar{t}} $Z hadroproduction at NLO accuracy in QCD with Parton Shower and Hadronization effects | JHEP 11 (2012) 056 | 1208.2665 |
| 47 | J. M. Campbell and R. K. Ellis | $ {\rm t \bar{t} W^{\pm}} $ production and decay at NLO | JHEP 07 (2012) 052 | 1204.5678 |
| 48 | R. Frederix et al. | Scalar and pseudoscalar Higgs production in association with a top-antitop pair | PLB 701 (2011) 427 | 1104.5613 |
| 49 | M. V. Garzelli, A. Kardos, C. G. Papadopoulos, and Z. Tr\'ocs\'anyi | Standard Model Higgs boson production in association with a top anti-top pair at NLO with parton showering | Europhys. Lett. 96 (2011) 11001 | 1108.0387 |
| 50 | J. Alwall et al. | The automated computation of tree-level and next-to-leading order differential cross sections, and their matching to parton shower simulations | JHEP 07 (2014) 079 | 1405.0301 |
| 51 | CMS Collaboration | Measurement of differential top-quark pair production cross sections in pp colisions at $ \sqrt{s}=7 $ TeV | EPJC 73 (2013) 2339 | CMS-TOP-11-013 1211.2220 |
| 52 | CMS Collaboration | Differential cross section measurements for the production of a W boson in association with jets in proton-proton collisions at $ \sqrt s=7 $ TeV | PLB 741 (2015) 12 | CMS-SMP-12-023 1406.7533 |
| 53 | G. Punzi | Sensitivity of searches for new signals and its optimization | in Statistical problems in particle physics, astrophysics, and cosmology (PHYSTAT2003), L. Lyons, R. P. Mount, and R. Reitmeyer, eds 2003 | physics/0308063 |
| 54 | CMS Collaboration | Measurement of the t$ \bar{\rm t} $ production cross section in the dilepton channel in pp collisions at $ \sqrt{s}=7 $ TeV | JHEP 11 (2012) 067 | CMS-TOP-11-005 1208.2671 |
| 55 | CMS Collaboration | Measurement of the $ {\rm t \bar{t}} $ production cross section in the dilepton channel in pp collisions at $ \sqrt{s} $ = 8 TeV | JHEP 02 (2014) 024 | CMS-TOP-12-007 1312.7582 |
| 56 | CMS Collaboration | CMS Luminosity Based on Pixel Cluster Counting - Summer 2013 Update | CMS-PAS-LUM-13-001 | CMS-PAS-LUM-13-001 |
| 57 | CMS Collaboration | Measurement of the inclusive W and Z production cross sections in pp collisions at $ \sqrt{s}=7 $ TeV | JHEP 10 (2011) 132 | CMS-EWK-10-005 1107.4789 |
| 58 | CMS Collaboration | Measurement of the inelastic proton-proton cross section at $ \sqrt{s}=7 $ TeV | PLB 722 (2013) 5 | CMS-FWD-11-001 1210.6718 |
| 59 | S. Alekhin et al. | The PDF4LHC Working Group Interim Report | 1101.0536 | |
| 60 | M. Botje et al. | The PDF4LHC Working Group Interim Recommendations | 1101.0538 | |
| 61 | D. Bourilkov, R. C. Group, and M. R. Whalley | LHAPDF: PDF use from the Tevatron to the LHC | hep-ph/0605240 | |
|
|
Compact Muon Solenoid LHC, CERN |
|

|

|

|

|

|