

Compact Muon Solenoid
LHC, CERN
| CMS-EXO-16-016 ; CERN-EP-2016-286 | ||
| Search for heavy neutrinos or third-generation leptoquarks in final states with two hadronically decaying $\tau$ leptons and two jets in proton-proton collisions at $ \sqrt{s} = $ 13 TeV | ||
| CMS Collaboration | ||
| 5 December 2016 | ||
| JHEP 03 (2017) 077 | ||
| Abstract: A search for new particles has been conducted using events with two high transverse momentum ($p_{\mathrm{T}}$) $\tau$ leptons that decay hadronically, at least two high-$p_{\mathrm{T}}$ jets, and missing transverse energy from the $\tau$ lepton decays. The analysis is performed using data from proton-proton collisions, collected by the CMS experiment in 2015 at $\sqrt{s} = $ 13 TeV, corresponding to an integrated luminosity of 2.1 fb$^{-1}$. The results are interpreted in two physics models. The first model involves heavy right-handed neutrinos, $\mathrm{N}_{\ell}$ ($\ell = \mathrm{ e }$, $\mu$, $\tau$), and right-handed charged bosons, $\mathrm{ W }_\mathrm{R}$, arising in a left-right symmetric extension of the standard model. Masses of the $\mathrm{ W }_\mathrm{R}$ boson below 2.35 (1.63) TeV are excluded at 95% confidence level, assuming the $\mathrm{N}_{\tau}$ mass is 0.8 (0.2) times the mass of the $\mathrm{ W }_\mathrm{R}$ boson and that only the $\mathrm{N}_{\tau}$ flavor contributes to the $\mathrm{ W }_\mathrm{R}$ decay width. In the second model, pair production of third-generation scalar leptoquarks that decay into $\tau\tau\mathrm{ b }\mathrm{ b }$ is considered. Third-generation scalar leptoquarks with masses below 740 GeV are excluded, assuming a 100% branching fraction for the leptoquark decay to a $\tau$ lepton and a bottom quark. This is the first search at hadron colliders for the third-generation Majorana neutrino, as well as the first search for third-generation leptoquarks in the final state with a pair of hadronically decaying $\tau$ leptons and jets. | ||
| Links: e-print arXiv:1612.01190 [hep-ex] (PDF) ; CDS record ; inSPIRE record ; CADI line (restricted) ; | ||
| Figures | |

png pdf |
Figure 1:
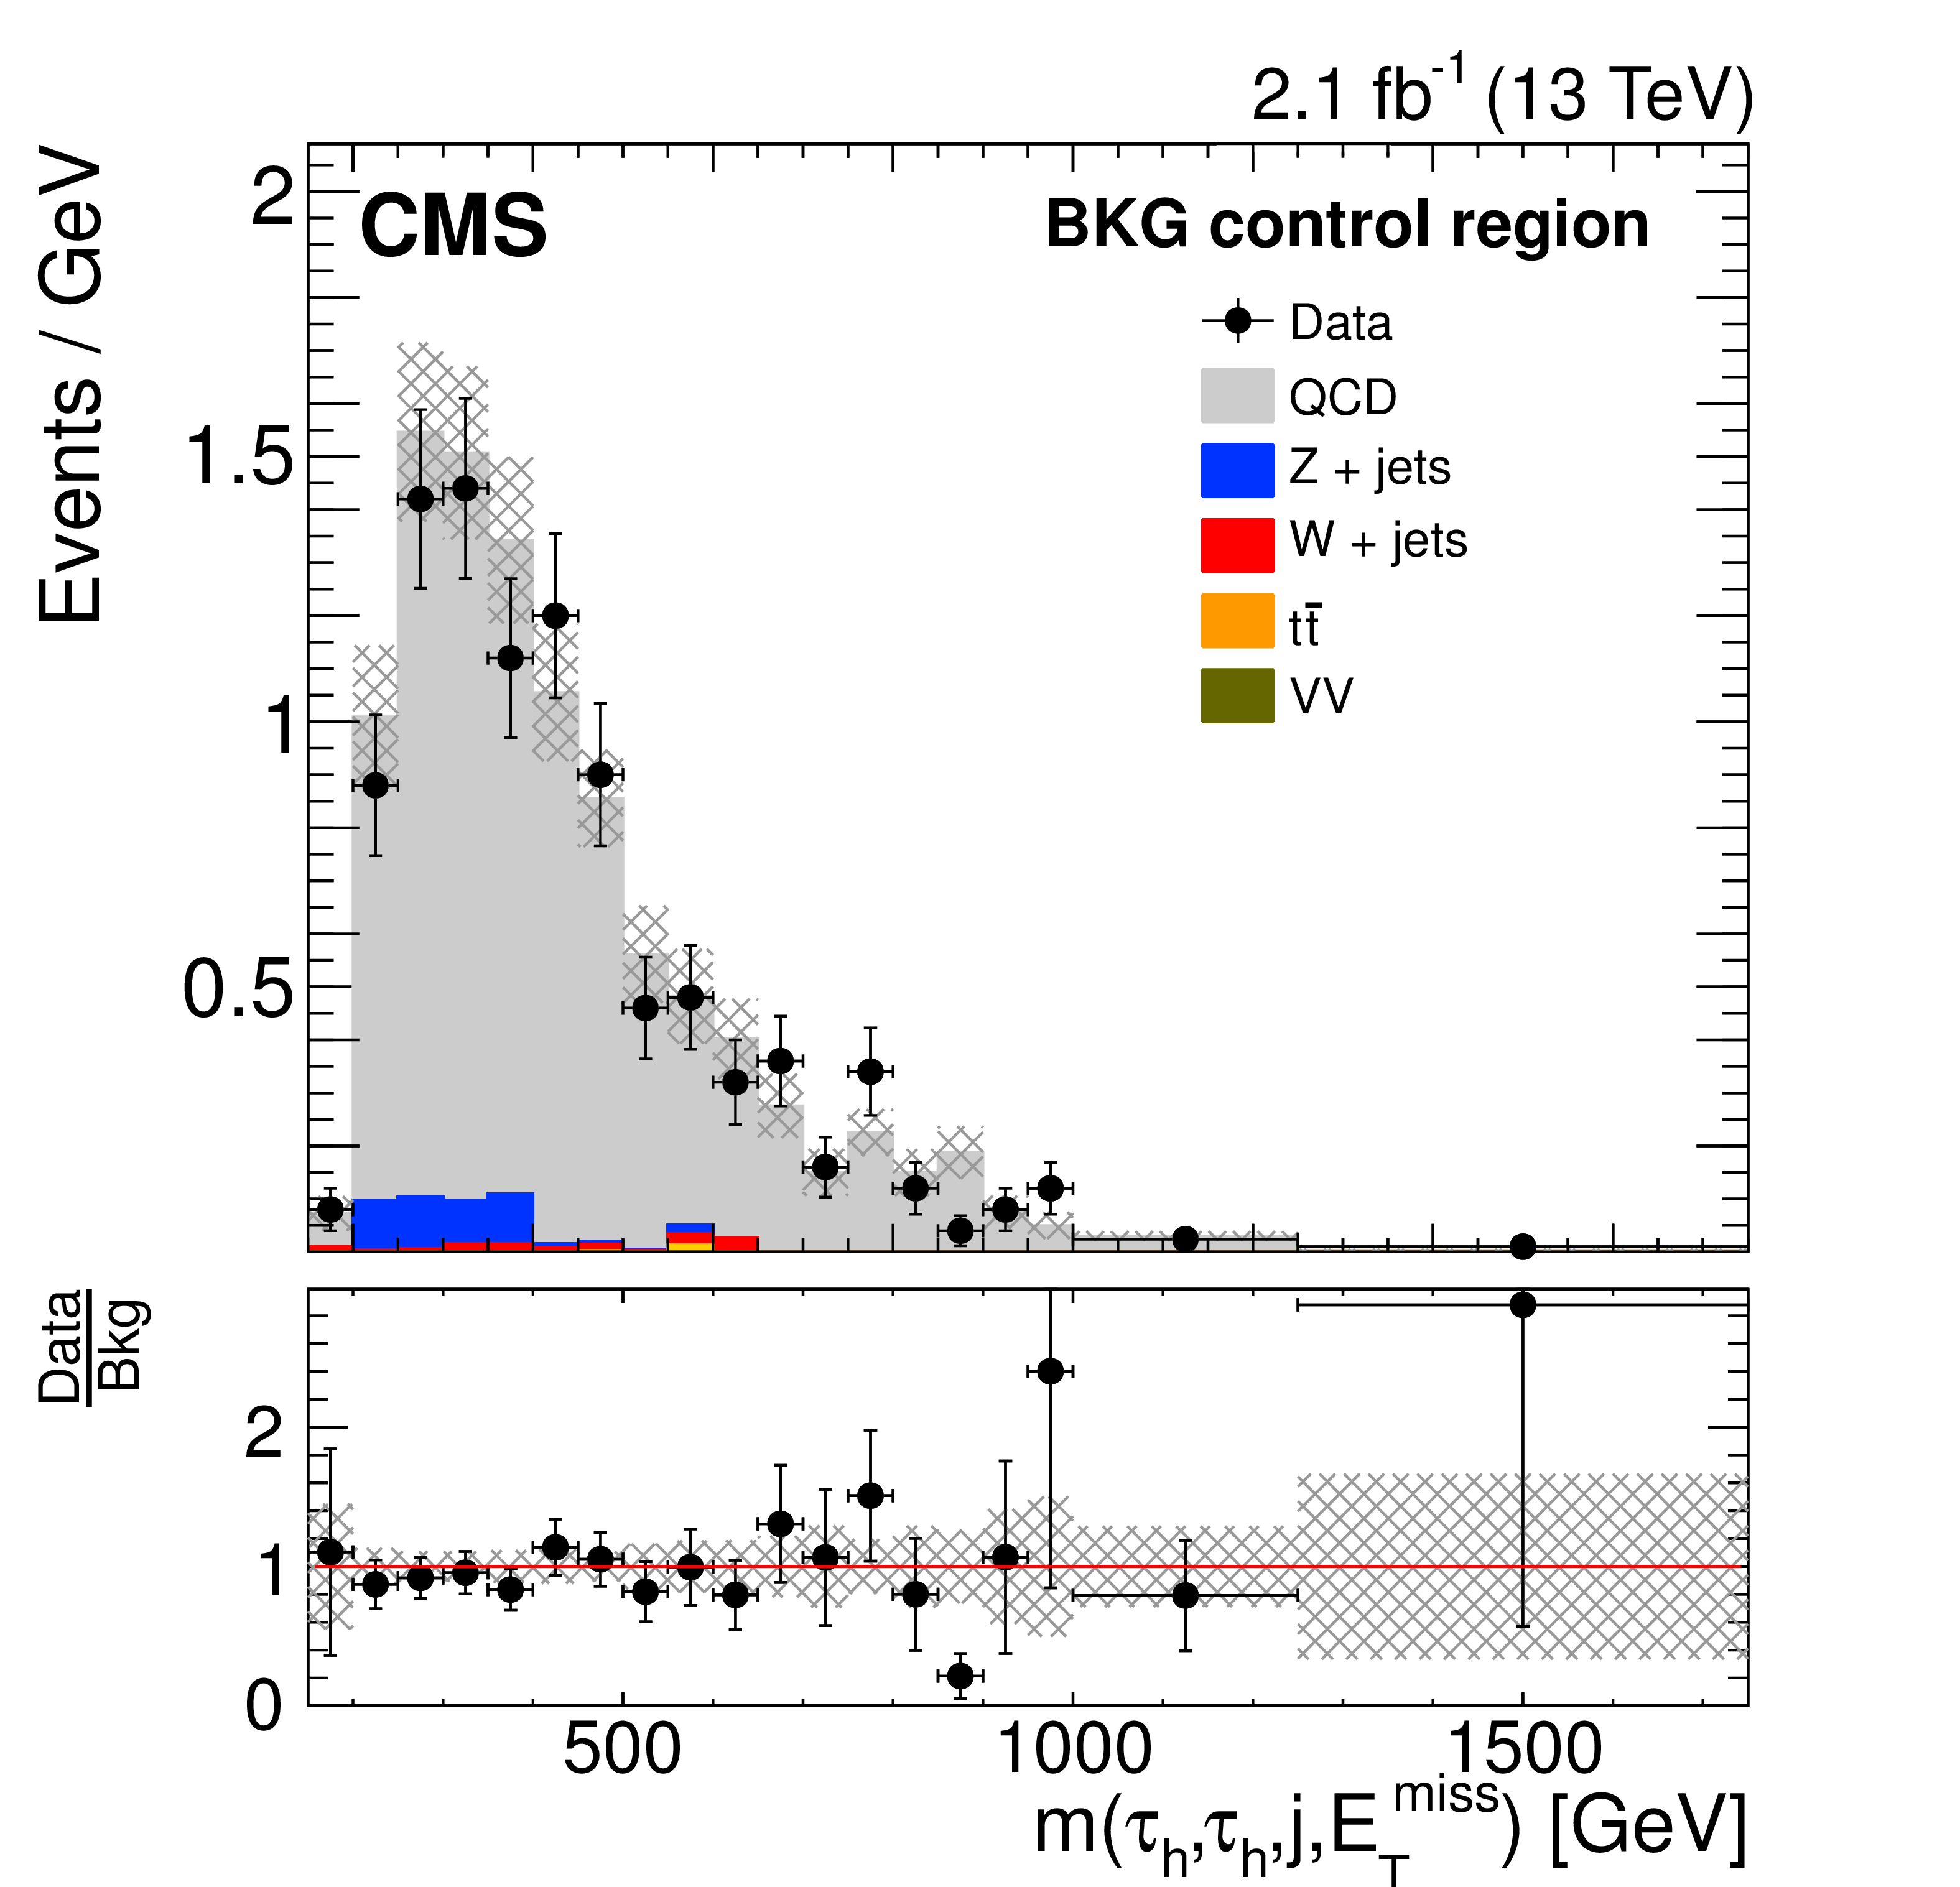
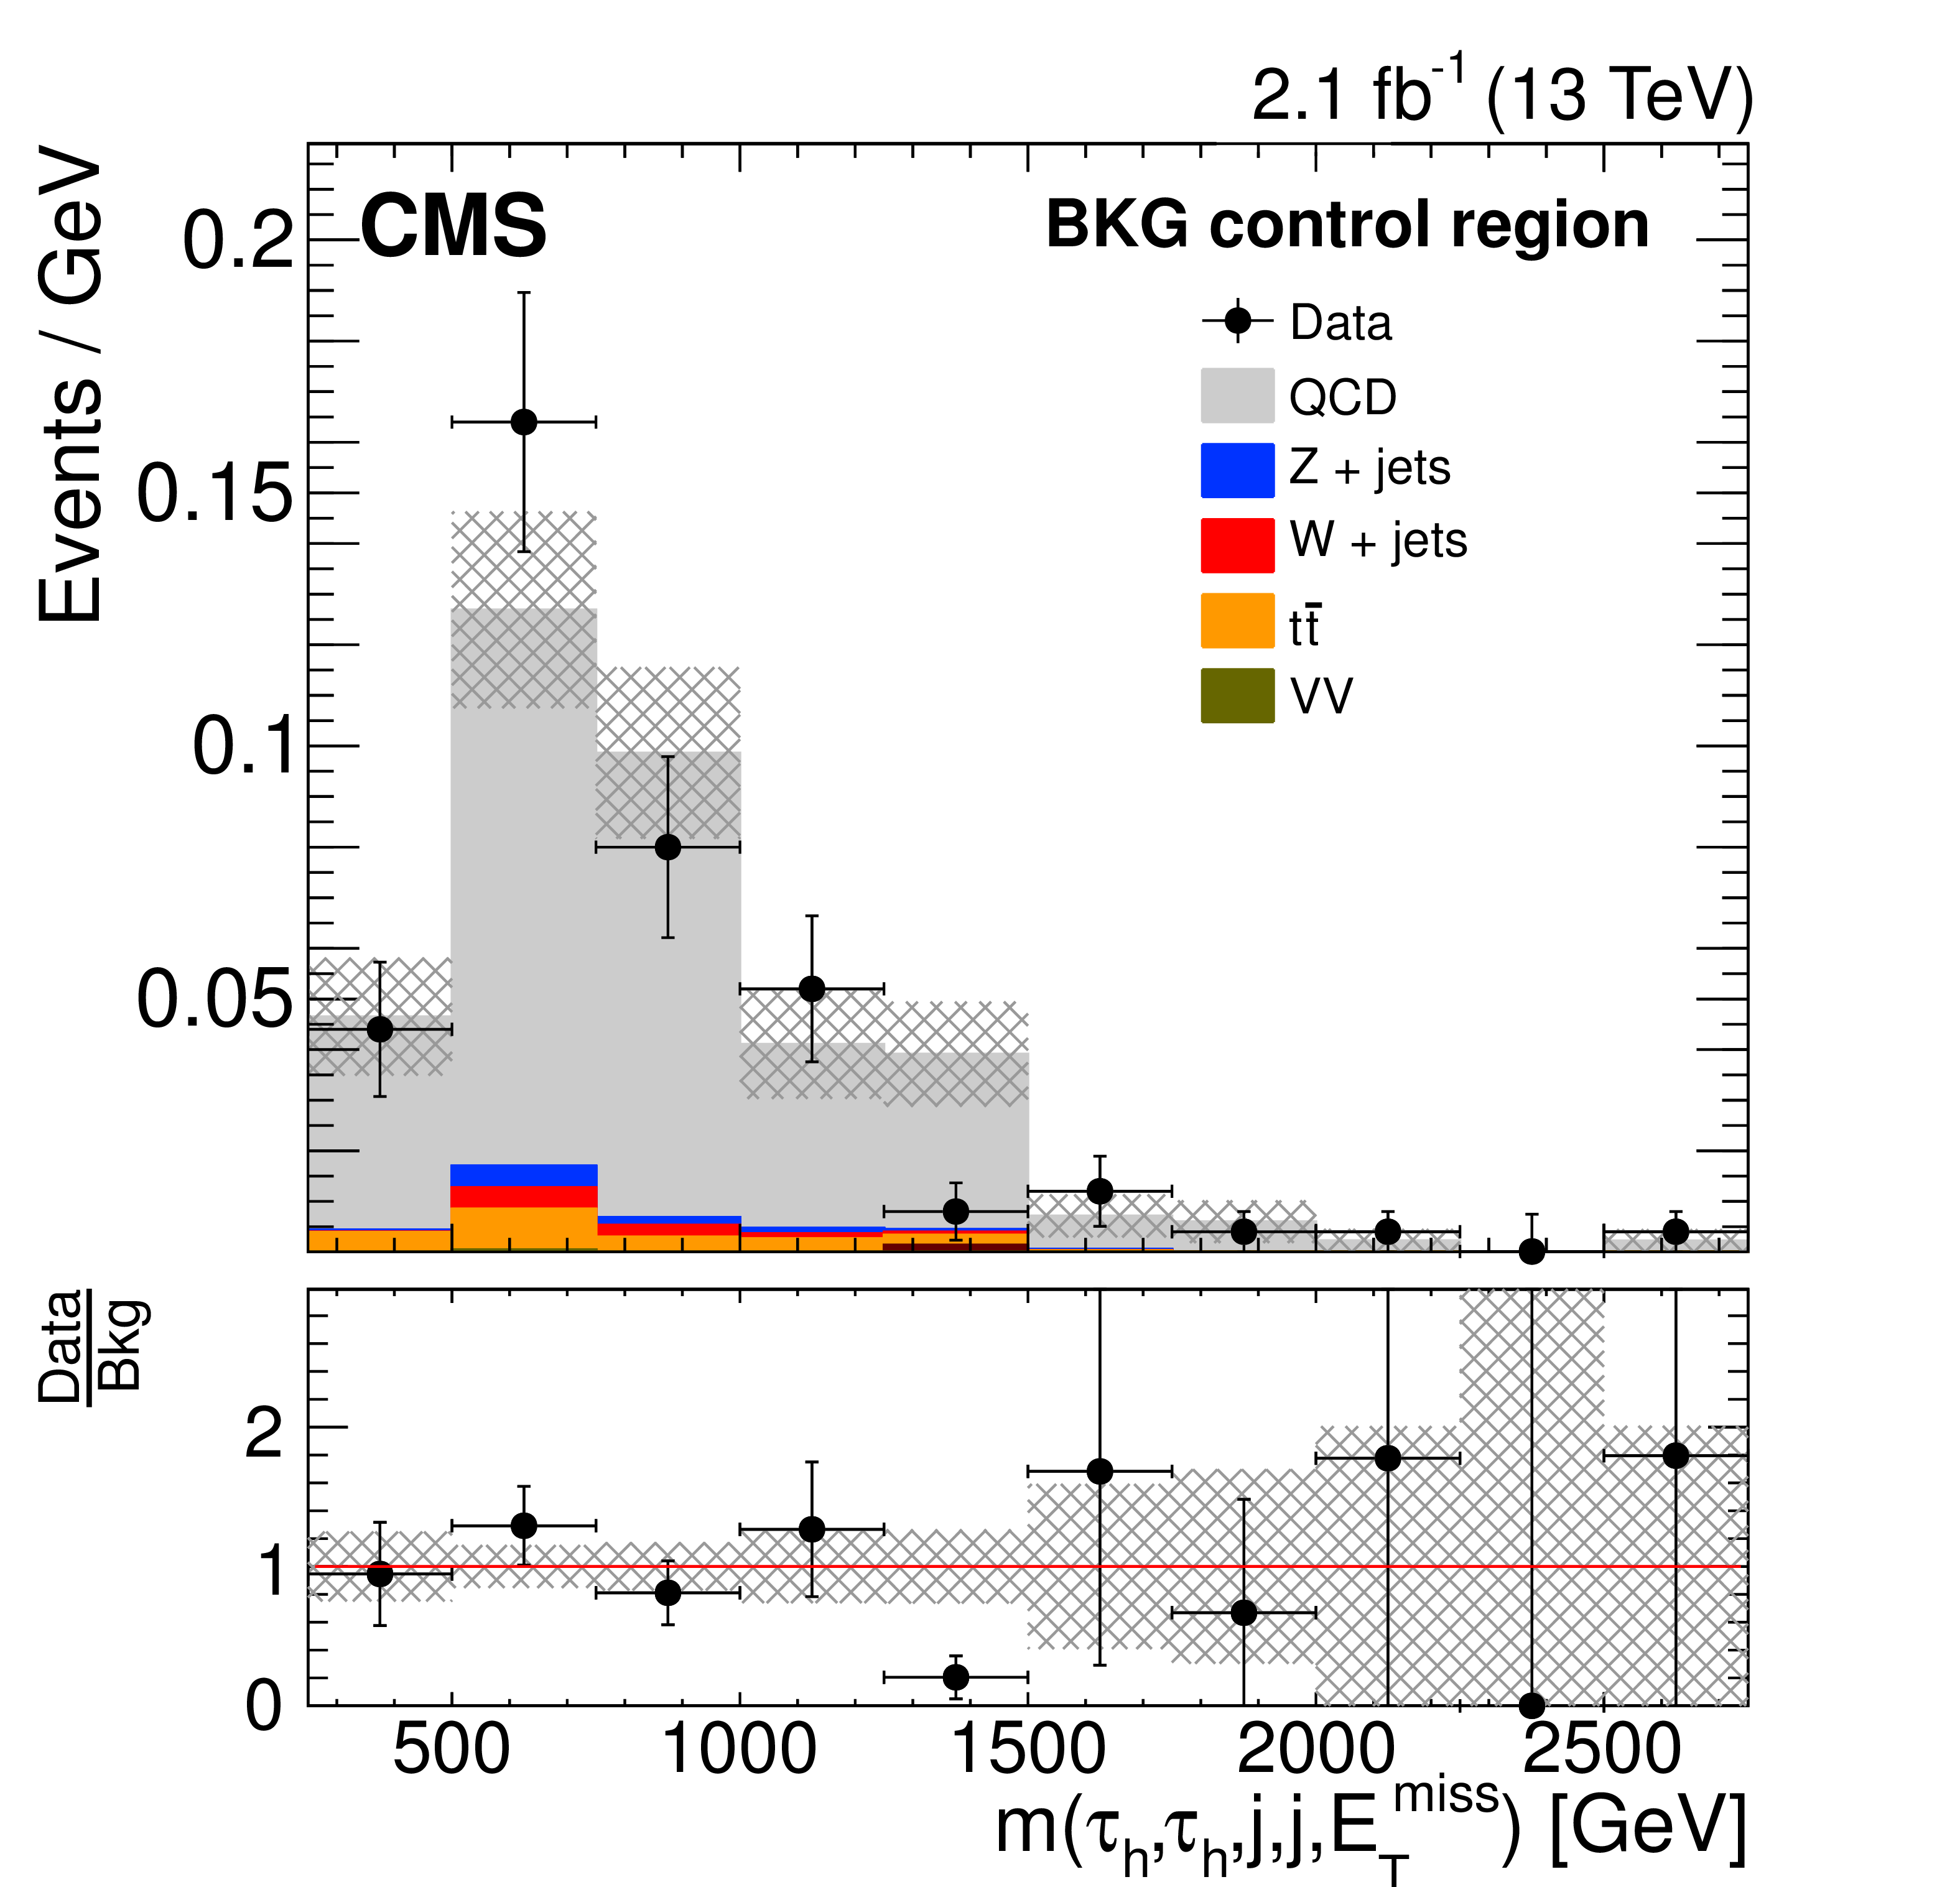
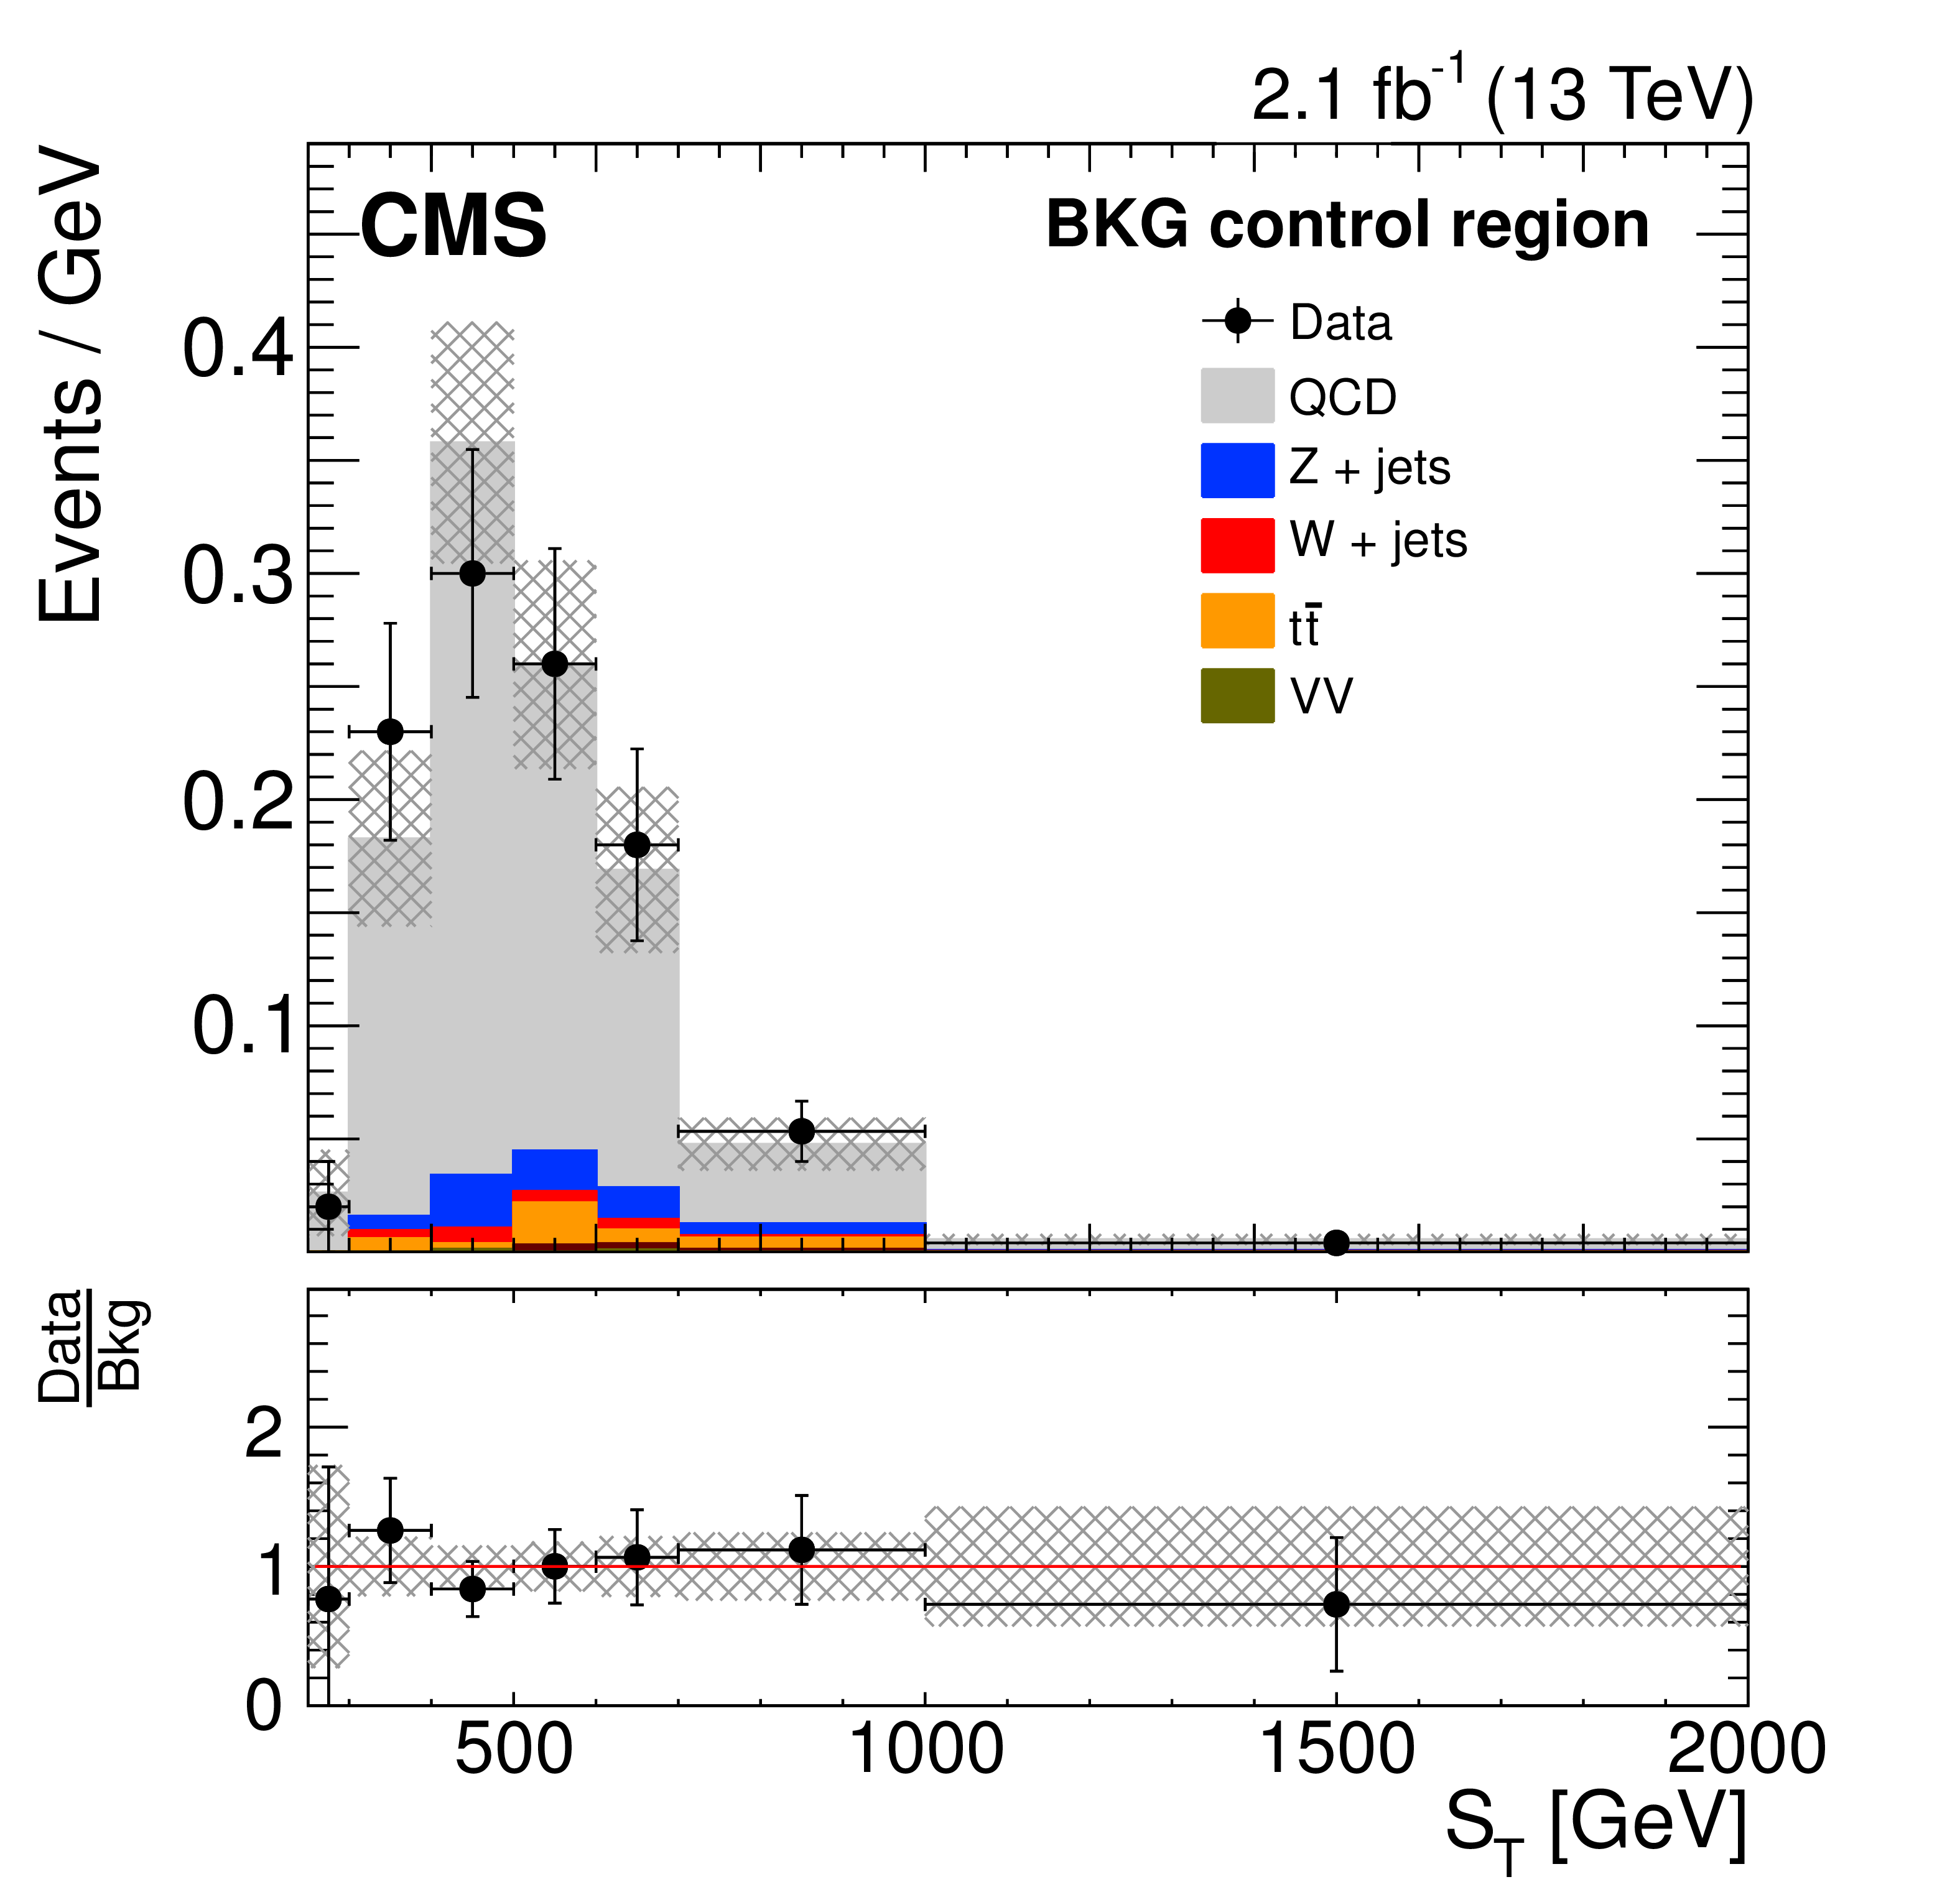
Upper left: QCD multijet background shape validation test for $N_{ {\mathrm {j}} }<$ 2, showing that the $m(\tau_{\mathrm{h}}\tau_{\mathrm{h}}, {\mathrm {j}} , {E_{\mathrm {T}}^{\text {miss}}} )$ distribution in the nonisolated $\tau_{\mathrm{h}}\tau_{\mathrm{h}}$ control sample (``QCD" in the legend) correctly models the shape in the isolated region (``Data"). Upper right: QCD multijet background validation test of the $ABCD$ method applied to $ \tau_{\mathrm{h}} \tau_{\mathrm{h}} $ data, showing that there is a good agreement in the $S_\mathrm {T}$ distribution between the observed yield and shape and the predicted yield and shape. Lower left: QCD multijet background validation test for $N_{ {\mathrm {j}} } \geq $ 2 data with $ {E_{\mathrm {T}}^{\text {miss}}} < $ 50 GeV , showing that the $m(\tau_{\mathrm{h}}\tau_{\mathrm{h}}, {\mathrm {j}} , {\mathrm {j}} , {E_{\mathrm {T}}^{\text {miss}}} )$ distribution in the nonisolated $ \tau_{\mathrm{h}} \tau_{\mathrm{h}} $ control sample correctly models the shape in the isolated region. Lower right: QCD multijet background validation test for $N_{ {\mathrm {j}} } \geq 2$ data, showing that the ${S_\mathrm {T}}$ distribution in the nonisolated $\tau_{\mathrm{h}}\tau_{\mathrm{h}}$ control sample correctly models the shape in the isolated region. The hatched band in the upper panel of each distribution represents the total statistical uncertainty in the background. The lower panel shows the ratio between the observed data and the background estimation. The shaded band in the lower panel represents the statistical uncertainty in the background prediction. The diboson (``VV" in the legend) contributions are negligible. |
png pdf |
Figure 1-a:
QCD multijet background shape validation test for $N_{ {\mathrm {j}} }<$ 2, showing that the $m(\tau_{\mathrm{h}}\tau_{\mathrm{h}}, {\mathrm {j}} , {E_{\mathrm {T}}^{\text {miss}}} )$ distribution in the nonisolated $\tau_{\mathrm{h}}\tau_{\mathrm{h}}$ control sample (``QCD" in the legend) correctly models the shape in the isolated region (``Data"). The hatched band in the upper panel of the distribution represents the total statistical uncertainty in the background. The lower panel shows the ratio between the observed data and the background estimation. The shaded band in the lower panel represents the statistical uncertainty in the background prediction. The diboson (``VV" in the legend) contributions are negligible. |

png pdf |
Figure 1-b:
QCD multijet background validation test of the $ABCD$ method applied to $ \tau_{\mathrm{h}} \tau_{\mathrm{h}} $ data, showing that there is a good agreement in the $S_\mathrm {T}$ distribution between the observed yield and shape and the predicted yield and shape. The hatched band in the upper panel of the distribution represents the total statistical uncertainty in the background. The lower panel shows the ratio between the observed data and the background estimation. The shaded band in the lower panel represents the statistical uncertainty in the background prediction. The diboson (``VV" in the legend) contributions are negligible. |
png pdf |
Figure 1-c:
QCD multijet background validation test for $N_{ {\mathrm {j}} } \geq $ 2 data with $ {E_{\mathrm {T}}^{\text {miss}}} < $ 50 GeV , showing that the $m(\tau_{\mathrm{h}}\tau_{\mathrm{h}}, {\mathrm {j}} , {\mathrm {j}} , {E_{\mathrm {T}}^{\text {miss}}} )$ distribution in the nonisolated $ \tau_{\mathrm{h}} \tau_{\mathrm{h}} $ control sample correctly models the shape in the isolated region. The hatched band in the upper panel of the distribution represents the total statistical uncertainty in the background. The lower panel shows the ratio between the observed data and the background estimation. The shaded band in the lower panel represents the statistical uncertainty in the background prediction. The diboson (``VV" in the legend) contributions are negligible. |
png pdf |
Figure 1-d:
QCD multijet background validation test for $N_{ {\mathrm {j}} } \geq 2$ data, showing that the ${S_\mathrm {T}}$ distribution in the nonisolated $\tau_{\mathrm{h}}\tau_{\mathrm{h}}$ control sample correctly models the shape in the isolated region. The hatched band in the upper panel of the distribution represents the total statistical uncertainty in the background. The lower panel shows the ratio between the observed data and the background estimation. The shaded band in the lower panel represents the statistical uncertainty in the background prediction. The diboson (``VV" in the legend) contributions are negligible. |
png pdf |
Figure 2:
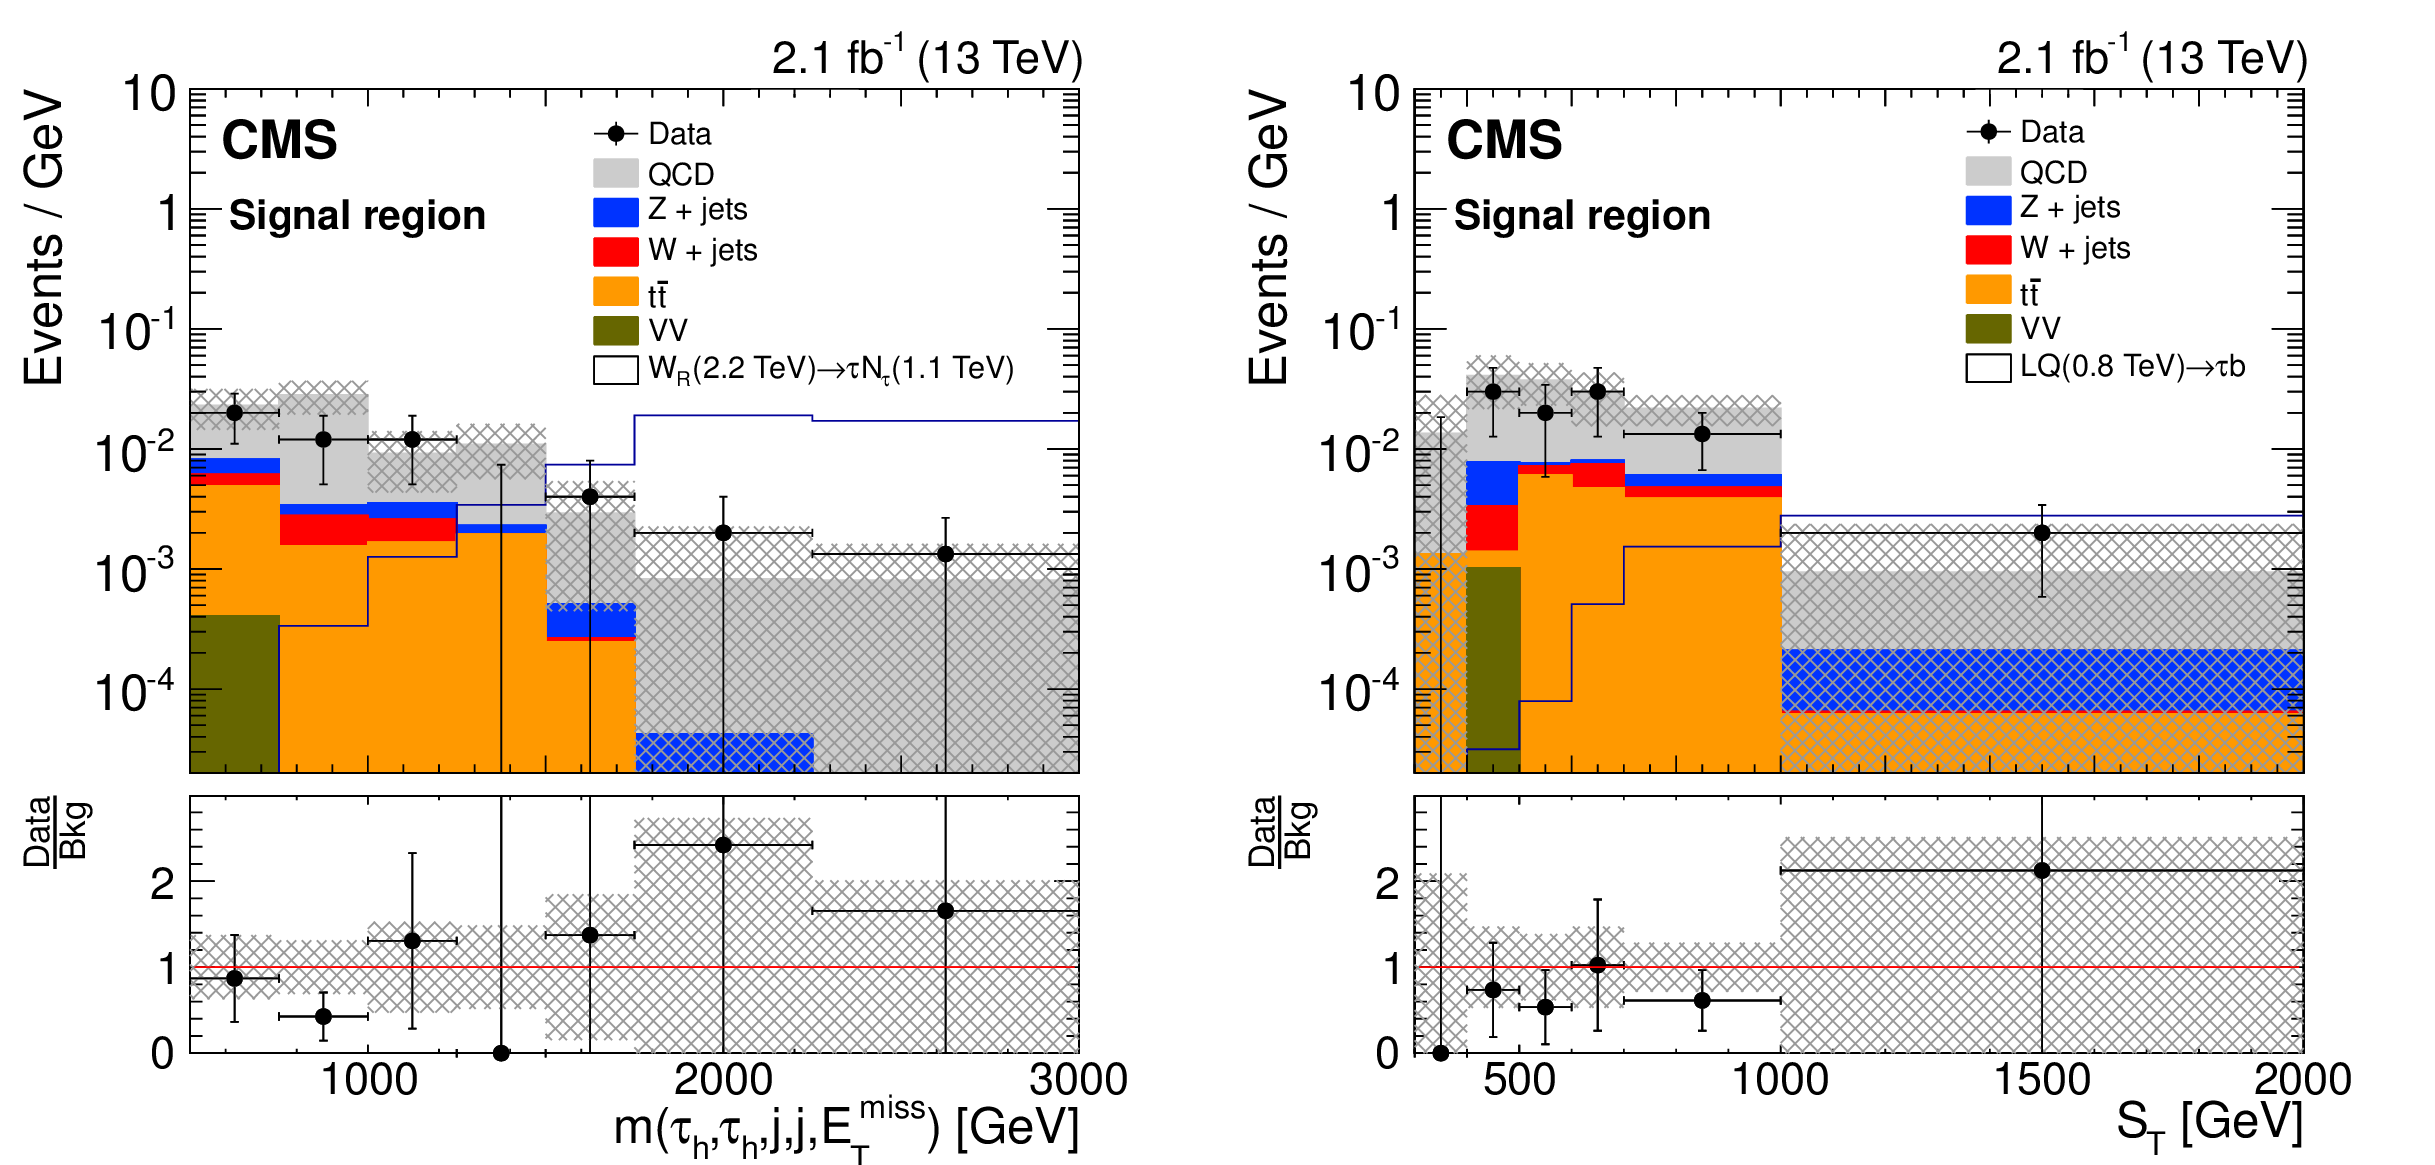
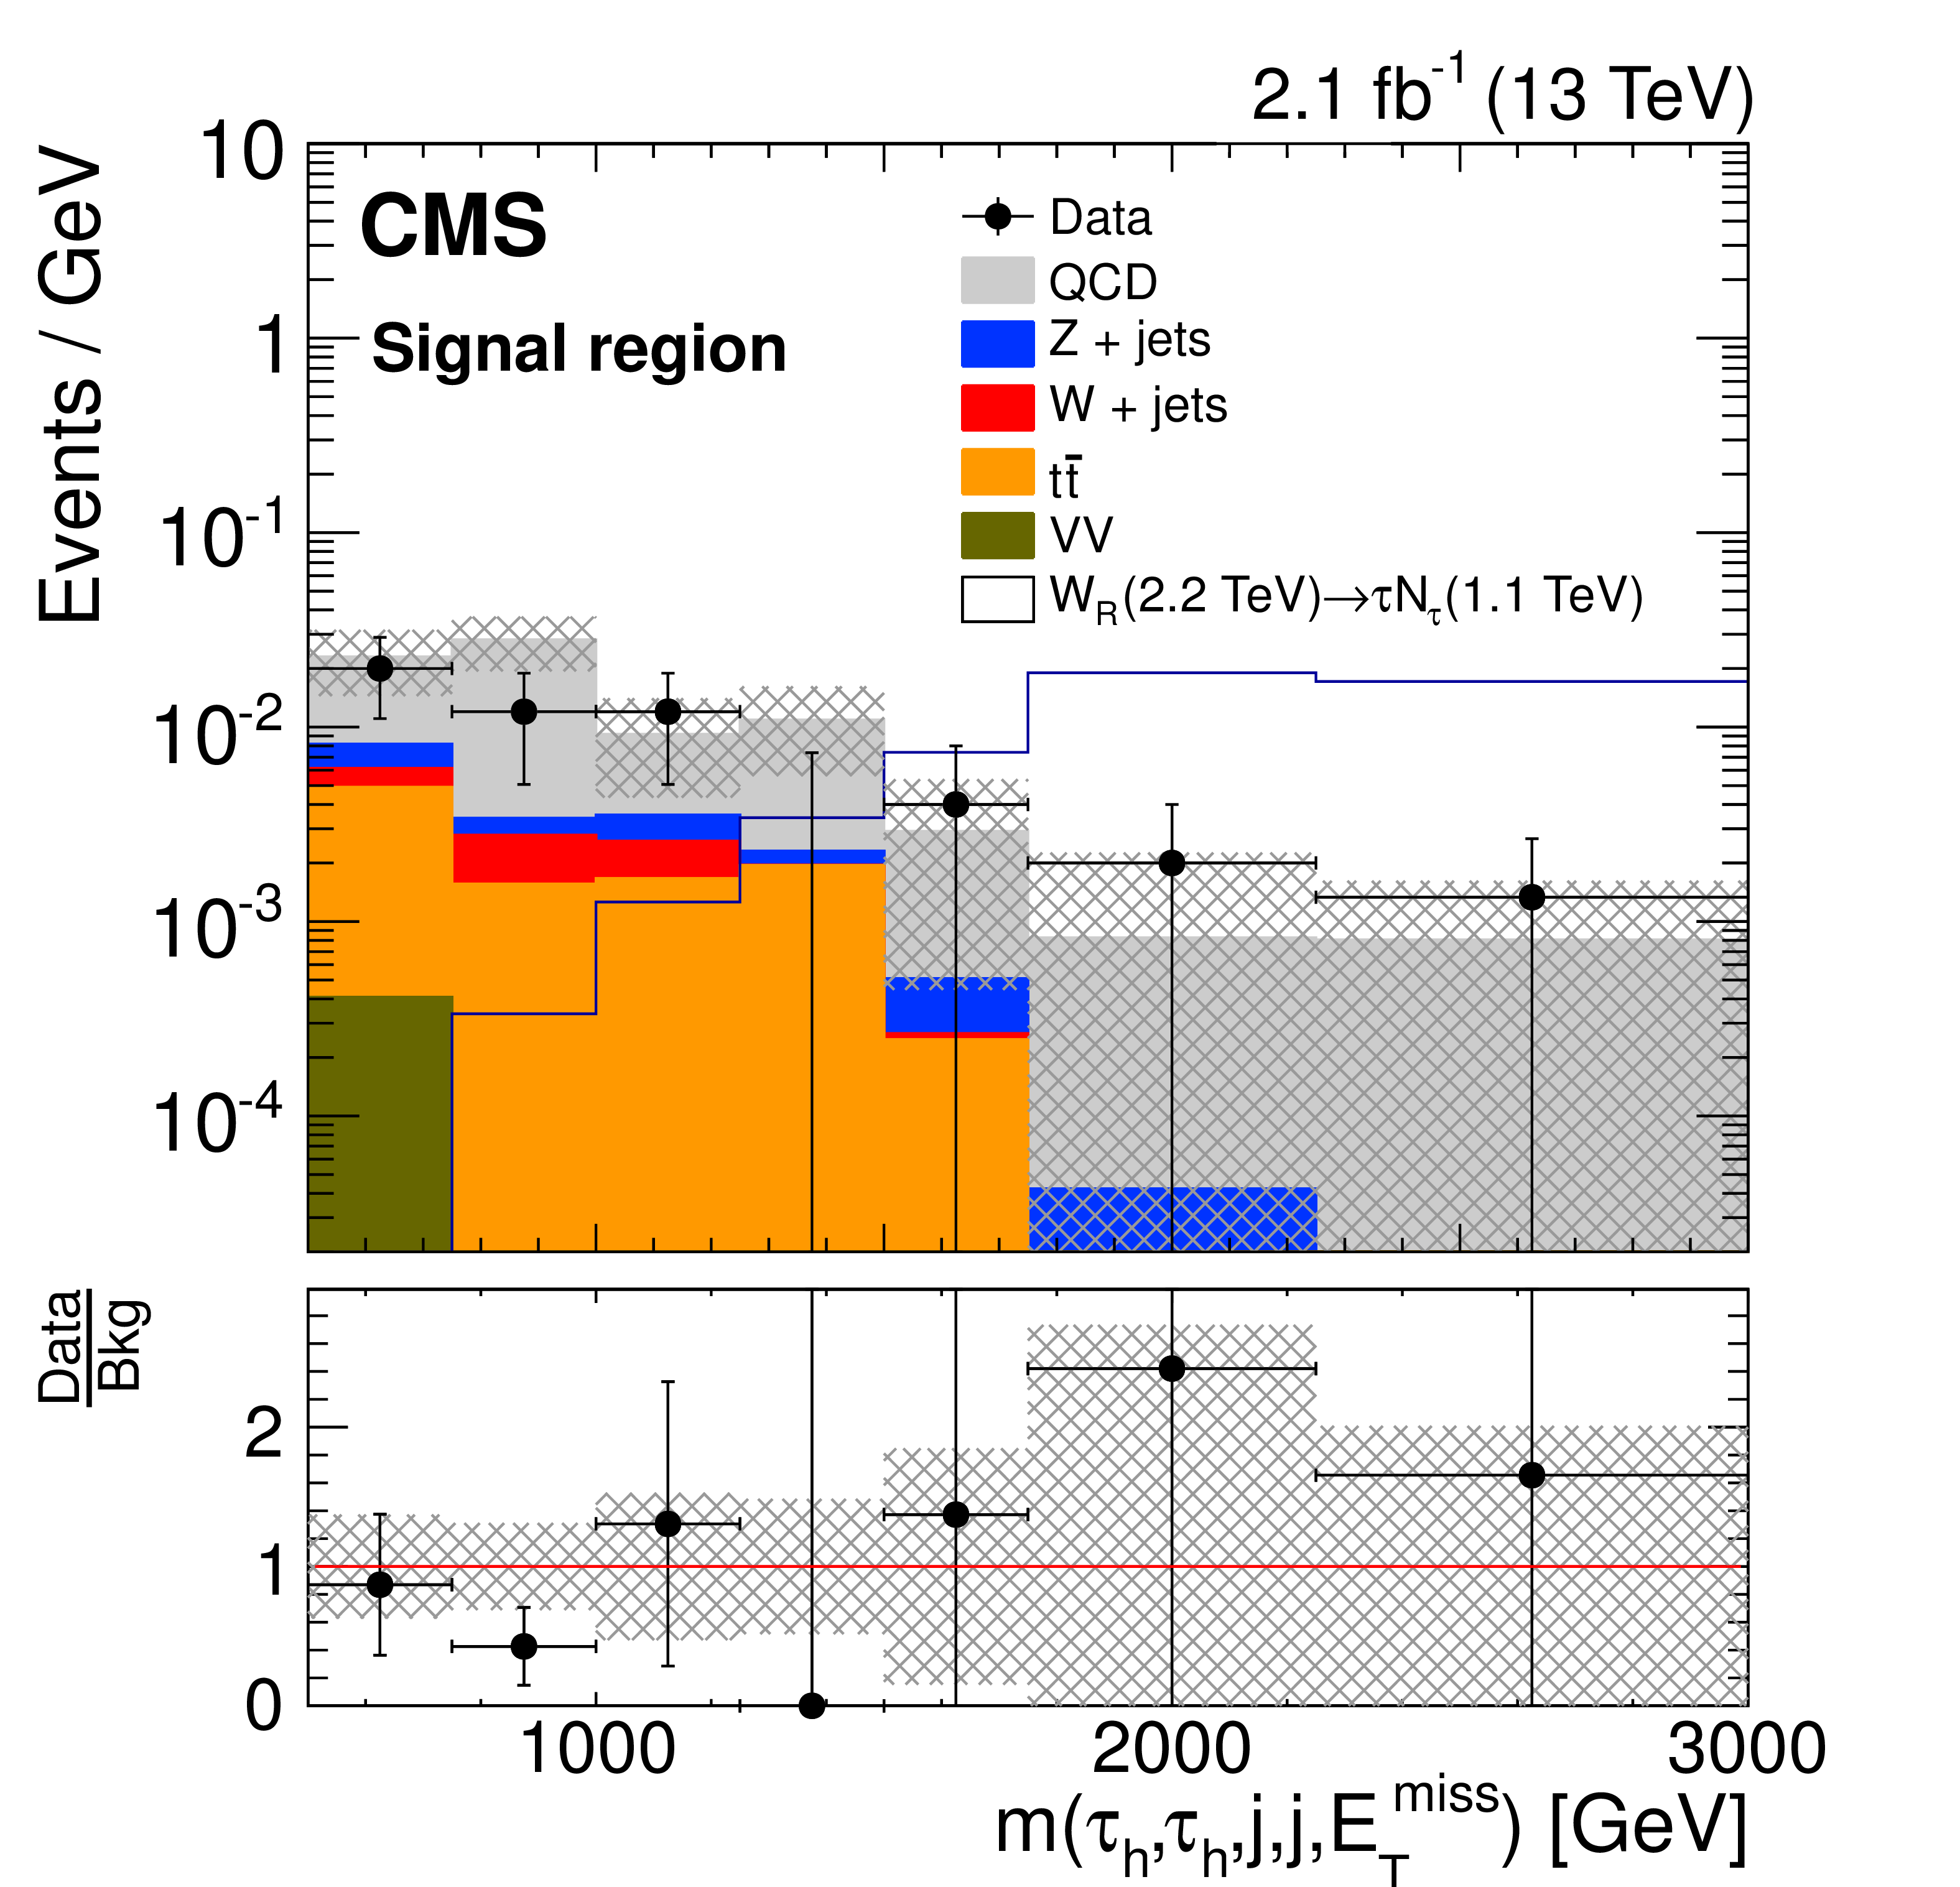
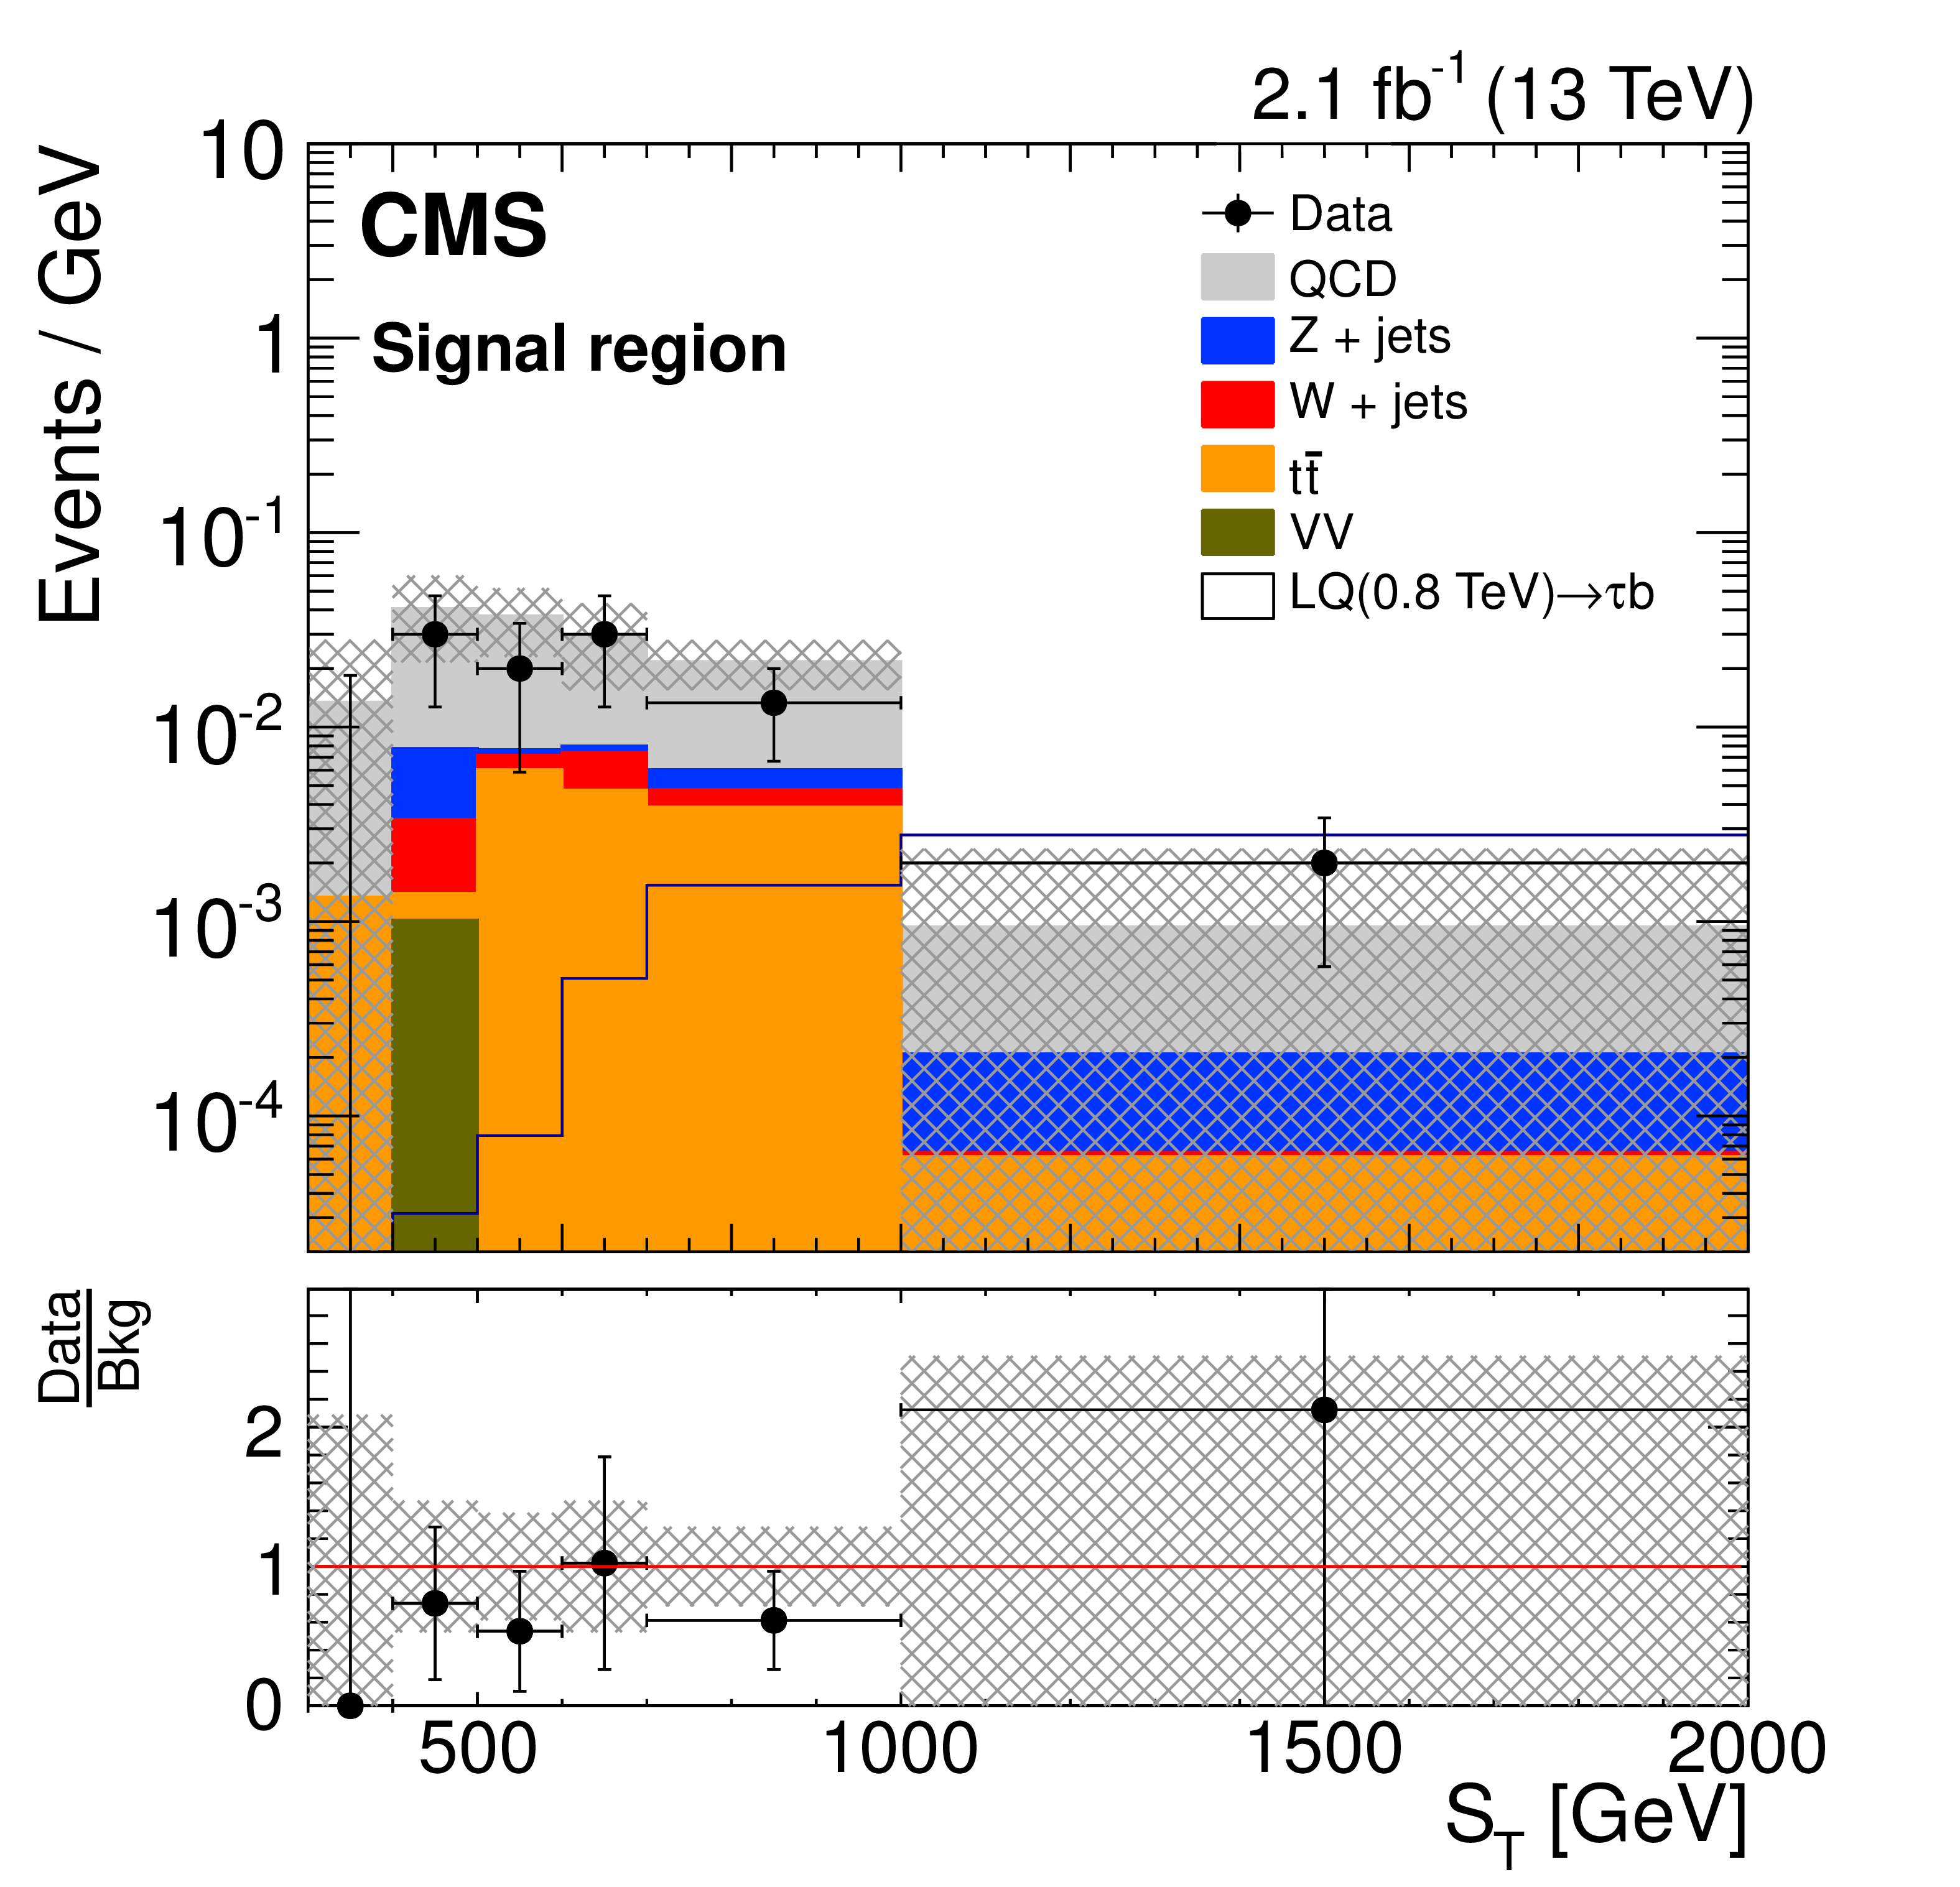
Left: $m(\tau_{\mathrm{h}},\tau_{\mathrm{h}}, {\mathrm {j}} , {\mathrm {j}} , {E_{\mathrm {T}}^{\text {miss}}} )$ distribution in the signal region. Right: $ {S_\mathrm {T}} $ distribution in the signal region. The estimated backgrounds are stacked while the data and simulated signal are overlaid. The hatched band in the upper panel of each distribution represents the total statistical uncertainty in the background. The lower panel shows the ratio between the observed data and the background estimation. The shaded band across the lower panel, represents the total statistical and systematic uncertainty. |
png pdf |
Figure 2-a:
$m(\tau_{\mathrm{h}},\tau_{\mathrm{h}}, {\mathrm {j}} , {\mathrm {j}} , {E_{\mathrm {T}}^{\text {miss}}} )$ distribution in the signal region. The estimated backgrounds are stacked while the data and simulated signal are overlaid. The hatched band in the upper panel of the distribution represents the total statistical uncertainty in the background. The lower panel shows the ratio between the observed data and the background estimation. The shaded band across the lower panel, represents the total statistical and systematic uncertainty. |
png pdf |
Figure 2-b:
$ {S_\mathrm {T}} $ distribution in the signal region. The estimated backgrounds are stacked while the data and simulated signal are overlaid. The hatched band in the upper panel of the distribution represents the total statistical uncertainty in the background. The lower panel shows the ratio between the observed data and the background estimation. The shaded band across the lower panel, represents the total statistical and systematic uncertainty. |
png pdf |
Figure 3:
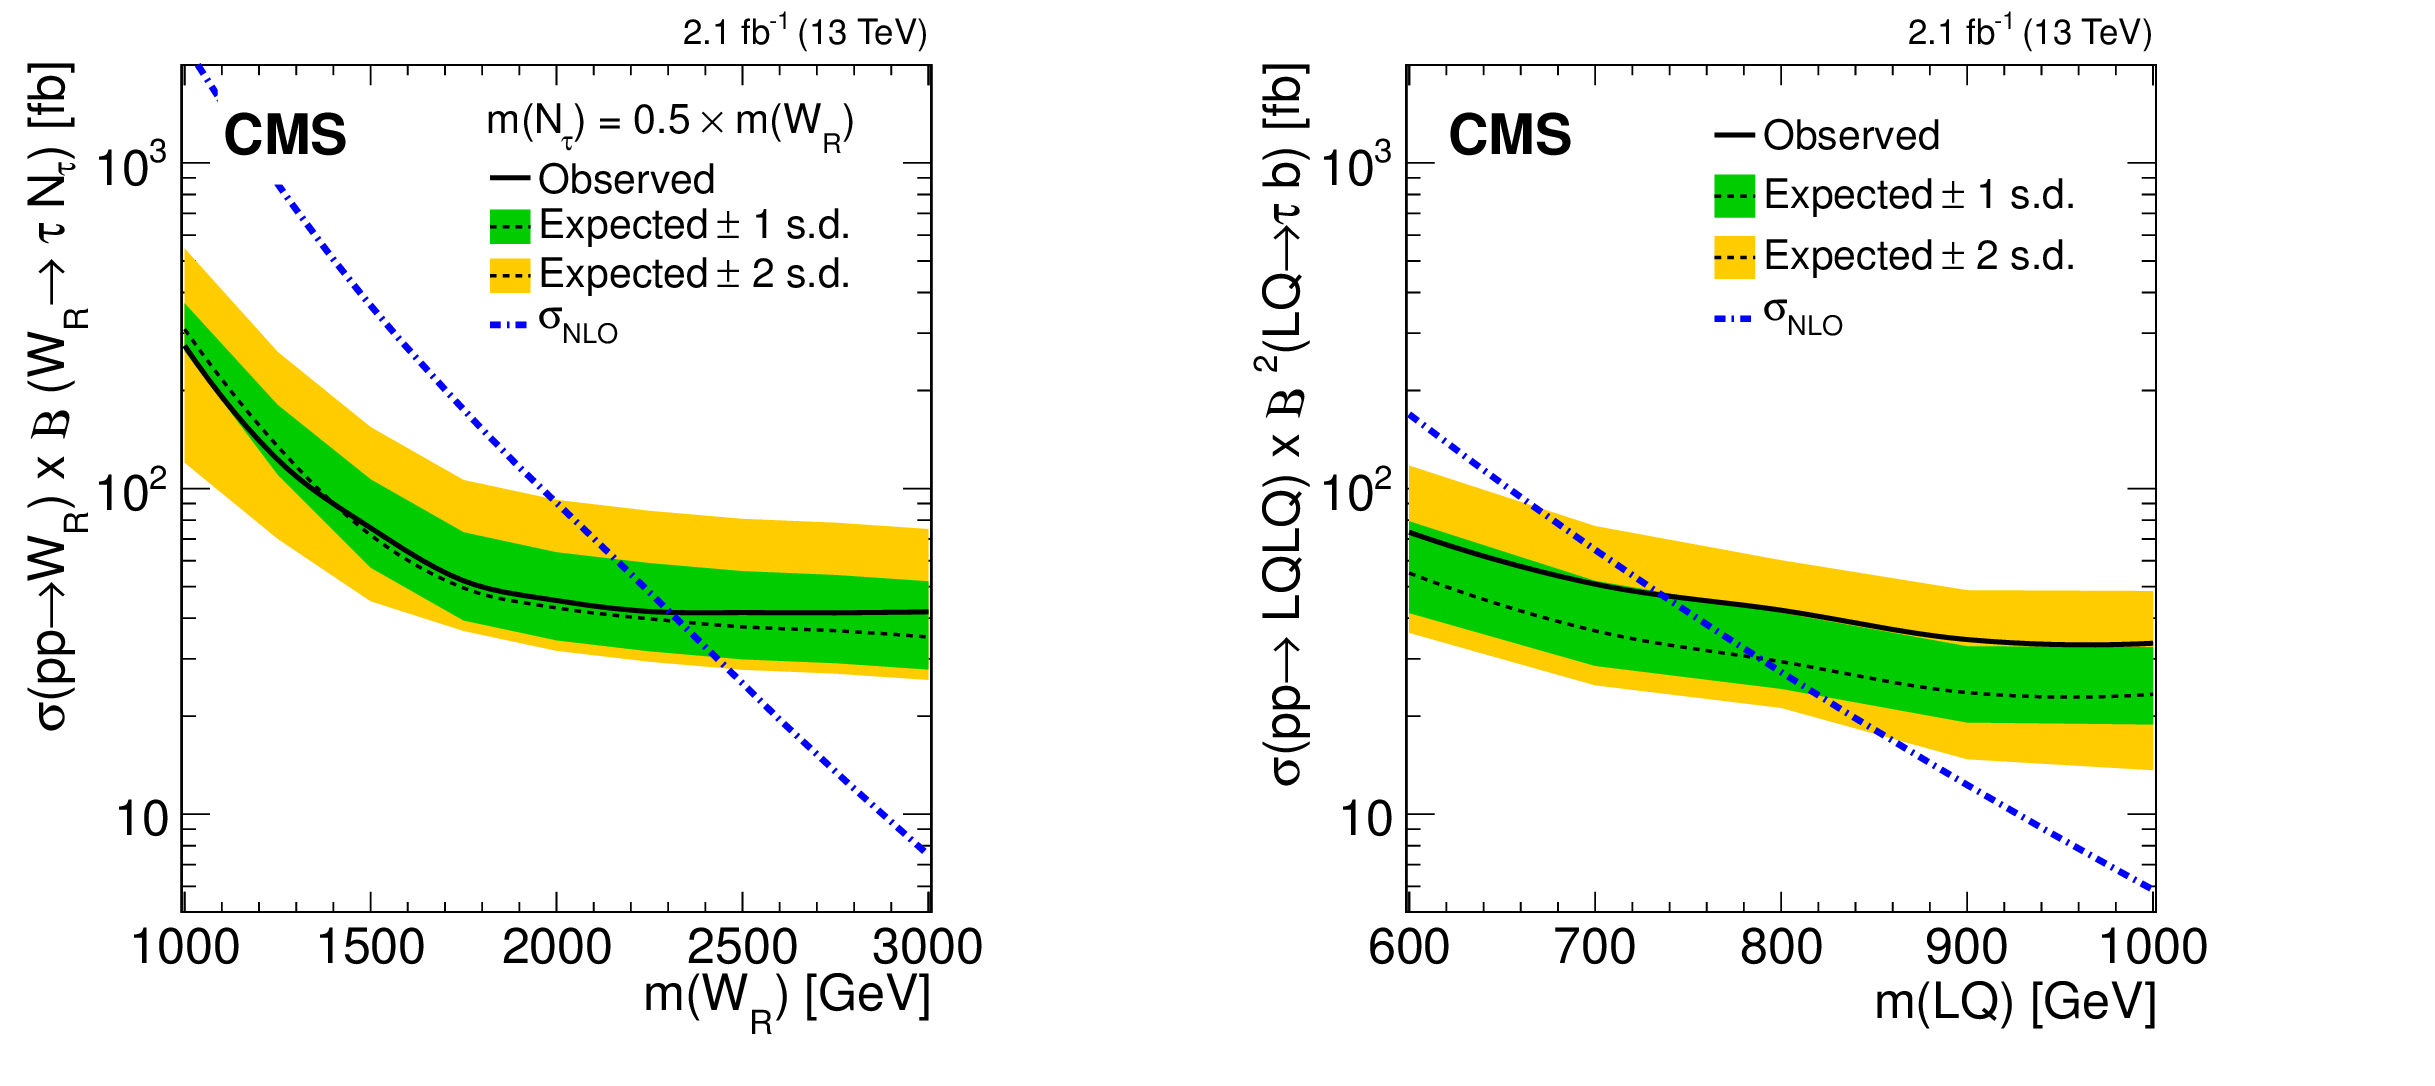
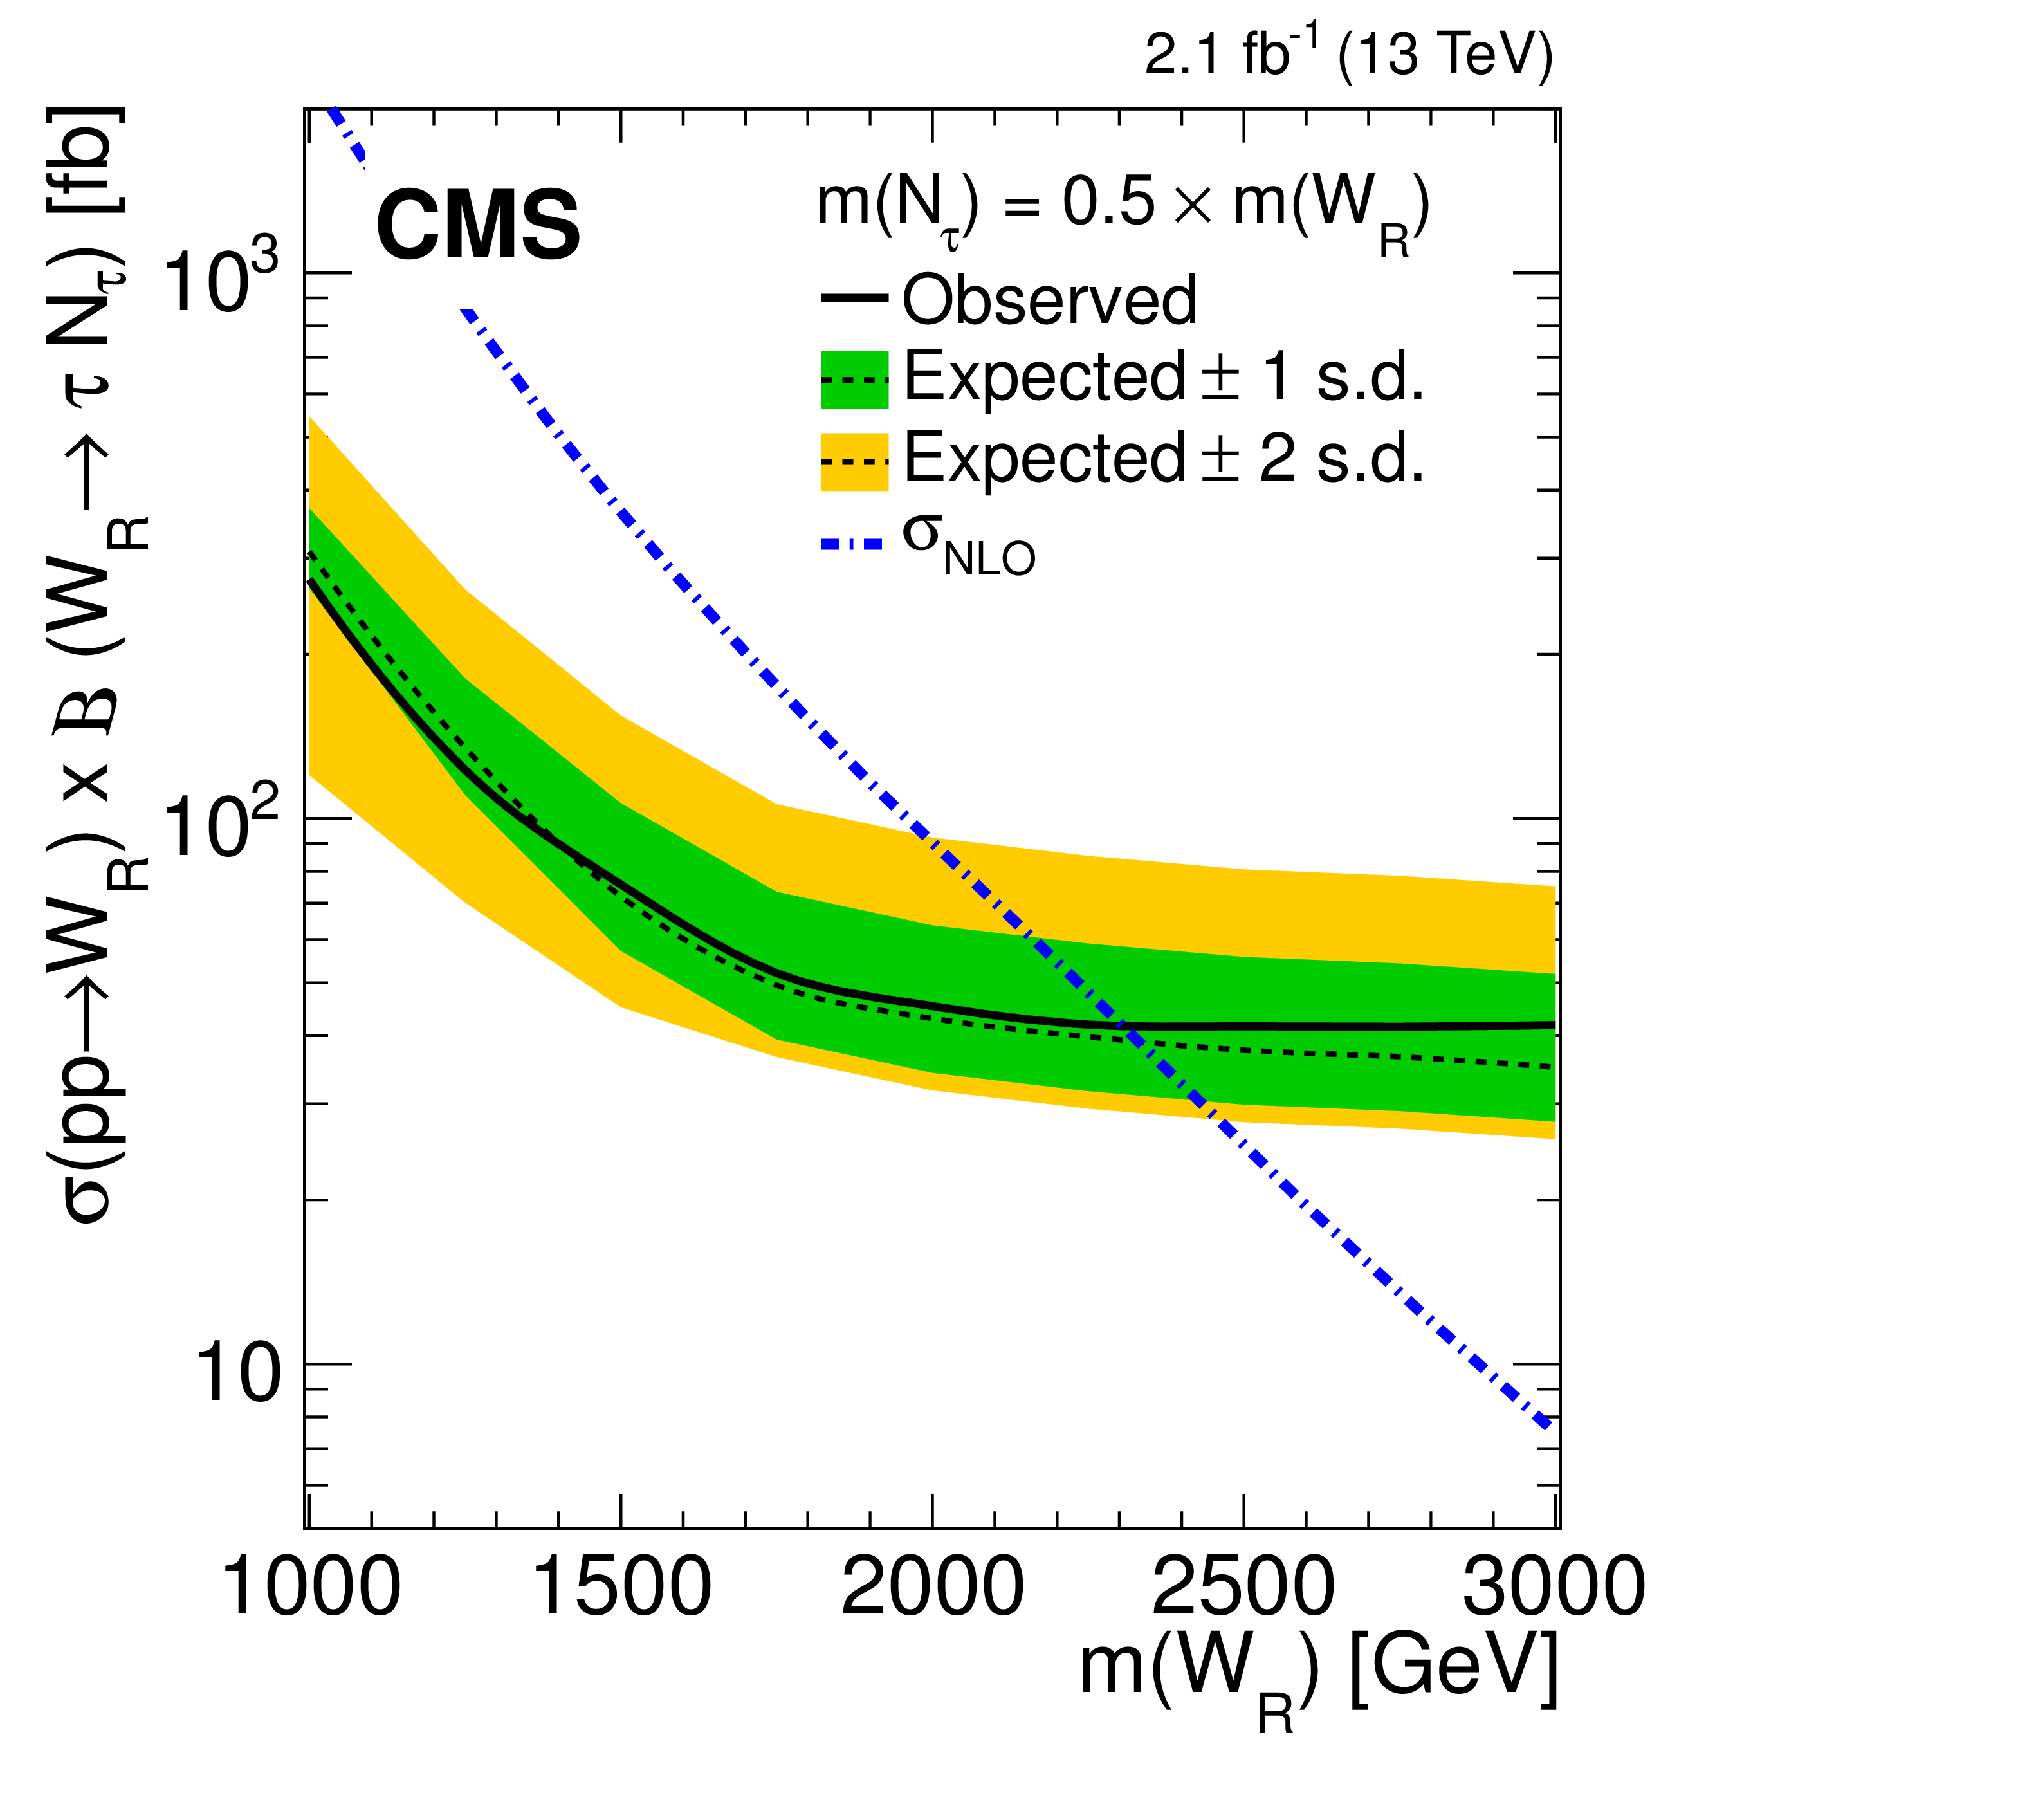
Left: Expected and observed limits at 95% CL on the product of $ {\mathrm {W}} _\mathrm {R}$ boson production cross section and branching fraction of the $ {\mathrm {W}} _\mathrm {R} \to \tau {\mathrm {N}} _{\tau }$ decay for $m( {\mathrm {N}} _{\tau }) = m( {\mathrm {W}} _\mathrm {R})/2$, as functions of $m( {\mathrm {W}} _\mathrm {R})$ mass. Right: Expected and observed limits, at 95% CL, on the product of the LQ pair production cross section and the branching fraction squared of the $\mathrm {LQ} \to \tau \mathrm{ b } $ decay, as functions of LQ mass. The bands around the expected limits represent the one and two standard deviation uncertainties obtained using a large sample of pseudo-experiments based on the background-only hypothesis, for each bin of the mass and $ {S_\mathrm {T}} $ distributions. The dot-dashed blue line corresponds to the theoretical signal cross section at NLO, which assumes only $ {\mathrm {N}} _{\tau }$ flavor contributes to the $ {\mathrm {W}} _\mathrm {R}$ boson decay width. |
png pdf |
Figure 3-a:
Expected and observed limits at 95% CL on the product of $ {\mathrm {W}} _\mathrm {R}$ boson production cross section and branching fraction of the $ {\mathrm {W}} _\mathrm {R} \to \tau {\mathrm {N}} _{\tau }$ decay for $m( {\mathrm {N}} _{\tau }) = m( {\mathrm {W}} _\mathrm {R})/2$, as functions of $m( {\mathrm {W}} _\mathrm {R})$ mass. The bands around the expected limits represent the one and two standard deviation uncertainties obtained using a large sample of pseudo-experiments based on the background-only hypothesis, for each bin of the mass and $ {S_\mathrm {T}} $ distributions. The dot-dashed blue line corresponds to the theoretical signal cross section at NLO, which assumes only $ {\mathrm {N}} _{\tau }$ flavor contributes to the $ {\mathrm {W}} _\mathrm {R}$ boson decay width. |

png pdf |
Figure 3-b:
Expected and observed limits, at 95% CL, on the product of the LQ pair production cross section and the branching fraction squared of the $\mathrm {LQ} \to \tau \mathrm{ b } $ decay, as functions of LQ mass. The bands around the expected limits represent the one and two standard deviation uncertainties obtained using a large sample of pseudo-experiments based on the background-only hypothesis, for each bin of the mass and $ {S_\mathrm {T}} $ distributions. The dot-dashed blue line corresponds to the theoretical signal cross section at NLO, which assumes only $ {\mathrm {N}} _{\tau }$ flavor contributes to the $ {\mathrm {W}} _\mathrm {R}$ boson decay width. |

png pdf |
Figure 4:
Exclusion bounds at 95% CL as a function of $x = m( {\mathrm {N}} _{\tau }) / m( {\mathrm {W}} _\mathrm {R})$ and $m( {\mathrm {W}} _\mathrm {R})$. The color axis corresponds to the observed upper limit on the product of the cross section $\sigma (\mathrm{ p } \mathrm{ p } \to {\mathrm {W}} _\mathrm {R})$ and the branching fraction $\mathcal {B}( {\mathrm {W}} _\mathrm {R} \to \tau {\mathrm {N}} _{\tau })$. The curves indicate observed and expected exclusion (left of the curve) for a model that assumes that the gauge couplings associated with the right and left SU(2) groups are equal. |
| Tables | |

png pdf |
Table 1:
Numbers of observed events in data and estimated background and signal rates in the signal region. The expected numbers of events for the $ {\mathrm {W}} _\mathrm {R}$ signal samples assume $m( {\mathrm {N}} _{\tau }) = m( {\mathrm {W}} _\mathrm {R})/2$. |
| Summary |
| A search is performed for physics beyond the standard model in events with two energetic $\tau$ leptons, two energetic jets, and large transverse momentum imbalance, using a data sample corresponding to an integrated luminosity of 2.1 fb$^{-1}$ collected with the CMS detector in proton-proton collisions at $\sqrt{s}=$ 13 TeV. The search focuses on two models: (1) production of heavy right-handed third-generation neutrinos, $\mathrm{N}_{\tau_{\mathrm{h}}}$, and right-handed $\mathrm{ W }_\mathrm{R}$ bosons that arise in the left-right symmetric extensions of the standard model, where the $\mathrm{ W }_\mathrm{R}$ decay chain results in a pair of high-$p_{\mathrm{T}}$ $\tau$ leptons; (2) pair production of third-generation scalar leptoquarks in the $\tau\tau\mathrm{ b }\mathrm{ b }$ channel. The observed $m(\tau_{\mathrm{h}},\tau_{\mathrm{h}},\mathrm{j},\mathrm{j},E_{\mathrm{T}}^{\text{miss}})$ and $ S_{\mathrm{T}} $ distributions do not reveal any evidence of signals compatible with these scenarios. Assuming that only the $\mathrm{N}_{\tau}$ flavor contributes significantly to the $\mathrm{ W }_\mathrm{R}$ decay width, $\mathrm{ W }_\mathrm{R}$ masses below 2.35\,(1.63) TeV are excluded at 95% confidence level, assuming the $\mathrm{N}_{\tau}$ mass is 0.8 (0.2) times the mass of $\mathrm{ W }_\mathrm{R}$ boson. This analysis represents the first search for $N_{\tau}$ at the LHC and is also the first to focus on pair production of third-generation scalar leptoquarks using the $\tau_{\mathrm{h}}\tau_{\mathrm{h}}\mathrm{ b }\mathrm{ b }$ final state. Leptoquarks with a mass less than 740 GeV are excluded at 95% confidence level, to be compared with an expected mass limit of 790 GeV. This result equals the most stringent previous limit obtained in the $\tau_{l}\tau_{\mathrm{h}}\mathrm{ b }\mathrm{ b }$ final state, set by CMS using 19.5 fb$^{-1}$ of data recorded at 8 TeV [14]. This is the first search for third-generation leptoquarks in the $\tau_{\mathrm{h}}\tau_{\mathrm{h}}\mathrm{ b }\mathrm{ b }$ channel. |
| References | ||||
| 1 | M. Lindner, T. Ohlsson, and G. Seidl | Seesaw mechanisms for Dirac and Majorana neutrino masses | PRD 65 (2002) 053014 | hep-ph/0109264 |
| 2 | P. Minkowski | $ \mu \to $ e$ \gamma $ at a rate of one out of $ 10^{9} $ muon decays? | PLB 67 (1977) 421 | |
| 3 | R. N. Mohapatra and G. Senjanovic | Neutrino Mass and Spontaneous Parity Nonconservation | PRL 44 (1980) 912 | |
| 4 | H. Georgi and S. L. Glashow | Unity of all elementary-particle forces | PRL 32 (1974) 438 | |
| 5 | J. C. Pati and A. Salam | Lepton number as the fourth `color' | PRD 10 (1974) 275 | |
| 6 | J. C. Pati and A. Salam | Erratum: Lepton number as the fourth `color' | PRD 11 (1975) 703 | |
| 7 | B. Gripaios | Composite leptoquarks at the LHC | JHEP 02 (2010) 045 | 0910.1789 |
| 8 | W. Buchmuller, R. Ruckl, and D. Wyler | Leptoquarks in lepton-quark collisions | PLB 191 (1987) 442 | |
| 9 | DELPHI Collaboration | Search for neutral heavy leptons produced in Z decays | Z. Phys. C 74 (1997) 57, . [Erratum: Z. Phys. C 75 (1997) 580] | |
| 10 | L3 Collaboration | Search for isosinglet neutral heavy leptons in Z$ ^0 $ decays | PLB 295 (1992) 371 | |
| 11 | ATLAS Collaboration | Search for heavy neutrinos and right-handed $ W $ bosons in events with two leptons and jets in $ pp $ collisions at $ \sqrt{s}= $ 7 TeV with the ATLAS detector | EPJC 72 (2012) 2056 | 1203.5420 |
| 12 | CMS Collaboration | Search for heavy neutrinos and $ \mathrm {W} $ bosons with right-handed couplings in proton-proton collisions at $ \sqrt{s} = $ 8 TeV | EPJC 74 (2014) 3149 | CMS-EXO-13-008 1407.3683 |
| 13 | ATLAS Collaboration | Search for third generation scalar leptoquarks in $ pp $ collisions at $ \sqrt{s} = $ 7 TeV with the ATLAS detector | JHEP 06 (2013) 033 | |
| 14 | CMS Collaboration | Search for pair production of third-generation scalar leptoquarks and top squarks in proton-proton collisions at $ \sqrt{s} = $ 8 tev | PLB 739 (2014) 229 | |
| 15 | CMS Collaboration | The CMS experiment at the CERN LHC | JINST 3 (2008) S08004 | CMS-00-001 |
| 16 | CMS Collaboration | Commissioning of the Particle-flow Event Reconstruction with the first LHC collisions recorded in the CMS detector | CMS-PAS-PFT-10-001 | |
| 17 | Matteo Cacciari, Gavin P. Salam, Gregory Soyez | The anti-$ k_t $ jet clustering algorithm | JHEP 04 (2008) 063 | 0802.1189 |
| 18 | CMS Collaboration | Pileup jet identification | CMS-PAS-JME-13-005 | CMS-PAS-JME-13-005 |
| 19 | CMS Collaboration | Determination of jet energy calibration and transverse momentum resolution in CMS | JINST 6 (2011) 11002 | CMS-JME-10-011 1107.4277 |
| 20 | CMS Collaboration | Identification of b-quark jets with the CMS experiment | JINST 8 (2013) P04013 | CMS-BTV-12-001 1211.4462 |
| 21 | CMS Collaboration | Identification of b-quark jets at the CMS experiment in the LHC Run2 startup | CMS-PAS-BTV-15-001 | CMS-PAS-BTV-15-001 |
| 22 | CMS Collaboration | Performance of CMS muon reconstruction in pp collision events at $ \sqrt{s}= $ 7 TeV | JINST 7 (2012) P10002 | CMS-MUO-10-004 1206.4071 |
| 23 | CMS Collaboration | Muon reconstruction and identification improvements for run-2 and first results with 2015 run data | CDS | |
| 24 | CMS Collaboration | Performance of $ \tau $-lepton reconstruction and identification in CMS | JINST 7 (2012) P01001 | |
| 25 | J. Alwall et al. | MadGraph 5: going beyond | JHEP 06 (2011) 128 | 1106.0522 |
| 26 | T. Sjostrand et al. | An introduction to PYTHIA 8.2 | CPC 191 (2015) 159 | 1410.3012 |
| 27 | GEANT4 Collaboration | Geant4 --- a simulation toolkit | NIMA 506 (2003) 250 | |
| 28 | M. Kramer, T. Plehn, M. Spira, and P. M. Zerwas | Pair production of scalar leptoquarks at the CERN LHC | PRD 71 (2005) 057503 | hep-ph/0411038 |
| 29 | S. Hoche, Y. Li, and S. Prestel | Drell-Yan lepton pair production at NNLO QCD with parton showers | PRD 91 (2015) 074015 | 1405.3607 |
| 30 | R. Boughezal, C. Focke, X. Liu, and F. Petriello | $ W $-boson production in association with a jet at next-to-next-to-leading order in perturbative QCD | PRL 115 (2015) 062002 | |
| 31 | M. Czakon and A. Mitov | NNLO corrections to top-pair production at hadron colliders: the all-fermionic scattering channels | JHEP 12 (2012) 054 | 1207.0236 |
| 32 | CMS Collaboration | Measurement of the inclusive Z cross section via decays to tau pairs in pp collisions at $ \sqrt{s}= $ 7 TeV | JHEP 08 (2011) 117 | CMS-EWK-10-013 1104.1617 |
| 33 | CMS Collaboration | CMS luminosity measurement for the 2015 data taking period | CDS | |
| 34 | J. Butterworth et al. | PDF4LHC recommendations for LHC Run II | JPG 43 (2016) 023001 | 1510.03865 |
| 35 | G. Nanava and Z. W\cas | How to use SANC to improve the PHOTOS Monte Carlo simulation of bremsstrahlung in leptonic w-boson decays | Acta Phys. Polon. B 34 (2003) 4561 | hep-ph/0303260 |
| 36 | G. Miu and T. Sjostrand | $ W $ production in an improved parton shower approach | PLB 449 (1999) 313 | hep-ph/9812455 |
| 37 | T. Junk | Confidence level computation for combining searches with small statistics | NIMA 434 (1999) 435 | hep-ex/9902006 |
| 38 | A. L. Read | Presentation of search results: the $ CL_s $ technique | JPG 28 (2002) 2693 | |
| 39 | E. Akhmedov et al. | Improving electro-weak fits with TeV-scale sterile neutrinos | JHEP 05 (2013) 081 | 1302.1872 |
|
|
Compact Muon Solenoid LHC, CERN |
|

|

|

|

|

|