

Compact Muon Solenoid
LHC, CERN
| CMS-FSQ-12-004 ; CERN-EP-2016-261 | ||
| Exclusive and semi-exclusive $\pi^{+}\pi^{-}$ production in proton-proton collisions at $\sqrt{s} = $ 7 TeV | ||
| CMS Collaboration | ||
| 25 June 2017 | ||
| Superseded by FSQ-16-006 | ||
| Abstract: A measurement is presented of the exclusive and semi-exclusive production of charged pion pairs in proton-proton collisions, $\mathrm{ p p }\to\mathrm{ p }({\mathrm{p}^*})+ \pi^{+}\pi^{-}+ \mathrm{ p } ({\mathrm{p}^*})$, where the $\pi^{+} \pi^{-}$ pair is emitted at central rapidities, and the scattered protons stay intact ($\mathrm{p}$) or diffractively dissociate (${\mathrm{p}^*} $) without detection. The measurement is performed with the CMS detector at the LHC, using a data sample corresponding to an integrated luminosity of 450 $\mu$b$^{-1}$ collected at a center-of-mass energy of 7 TeV. The dipion cross section, measured for single-pion transverse momentum $p_{\mathrm{T}} > $ 0.2 GeV/$c$ and rapidity $|{y}| < $ 2, is 26.5 $\pm$ 0.3 (stat) $\pm$ 5.0 (syst) $\pm$ 1.1 (lumi) $\mu$b. The differential cross sections measured as a function of the invariant mass, $p_{\mathrm{T}}$, and $y$ of the pion pair, and as a function of single-pion $p_{\mathrm{T}}$, are compared to phenomenological predictions. | ||
| Links: e-print arXiv:1706.08310 [hep-ex] (PDF) ; CDS record ; inSPIRE record ; CADI line (restricted) ; | ||
| Figures | |

png pdf |
Figure 1:
Representative diagrams for (semi)exclusive central $\pi^{+} \pi^{-} $ production in proton-proton collisions. (left) Double pomeron exchange continuum, and (right) photon-pomeron interaction with production of a $\rho^+(770)$ meson that subsequently decays into a pair of pions. |

png pdf |
Figure 1-a:
Representative diagram for (semi)exclusive central $\pi^{+} \pi^{-} $ production in proton-proton collisions: double pomeron exchange continuum. |

png pdf |
Figure 1-b:
Representative diagram for (semi)exclusive central $\pi^{+} \pi^{-} $ production in proton-proton collisions: photon-pomeron interaction with production of a $\rho^+(770)$ meson that subsequently decays into a pair of pions. |

png pdf |
Figure 2:
Distribution of the multiplicities of ECAL+HCAL+HF towers above noise thresholds, $N_\text {extra}$, in events with two opposite-sign (solid circles) and same-sign (open circles) tracks. The negative binomial distributions used to reproduce the backgrounds in OS (solid curve) and SS (dashed curve) events are shown in their fitting range (thick lines), as well as their extrapolation below that range (thinner lines). |

png pdf |
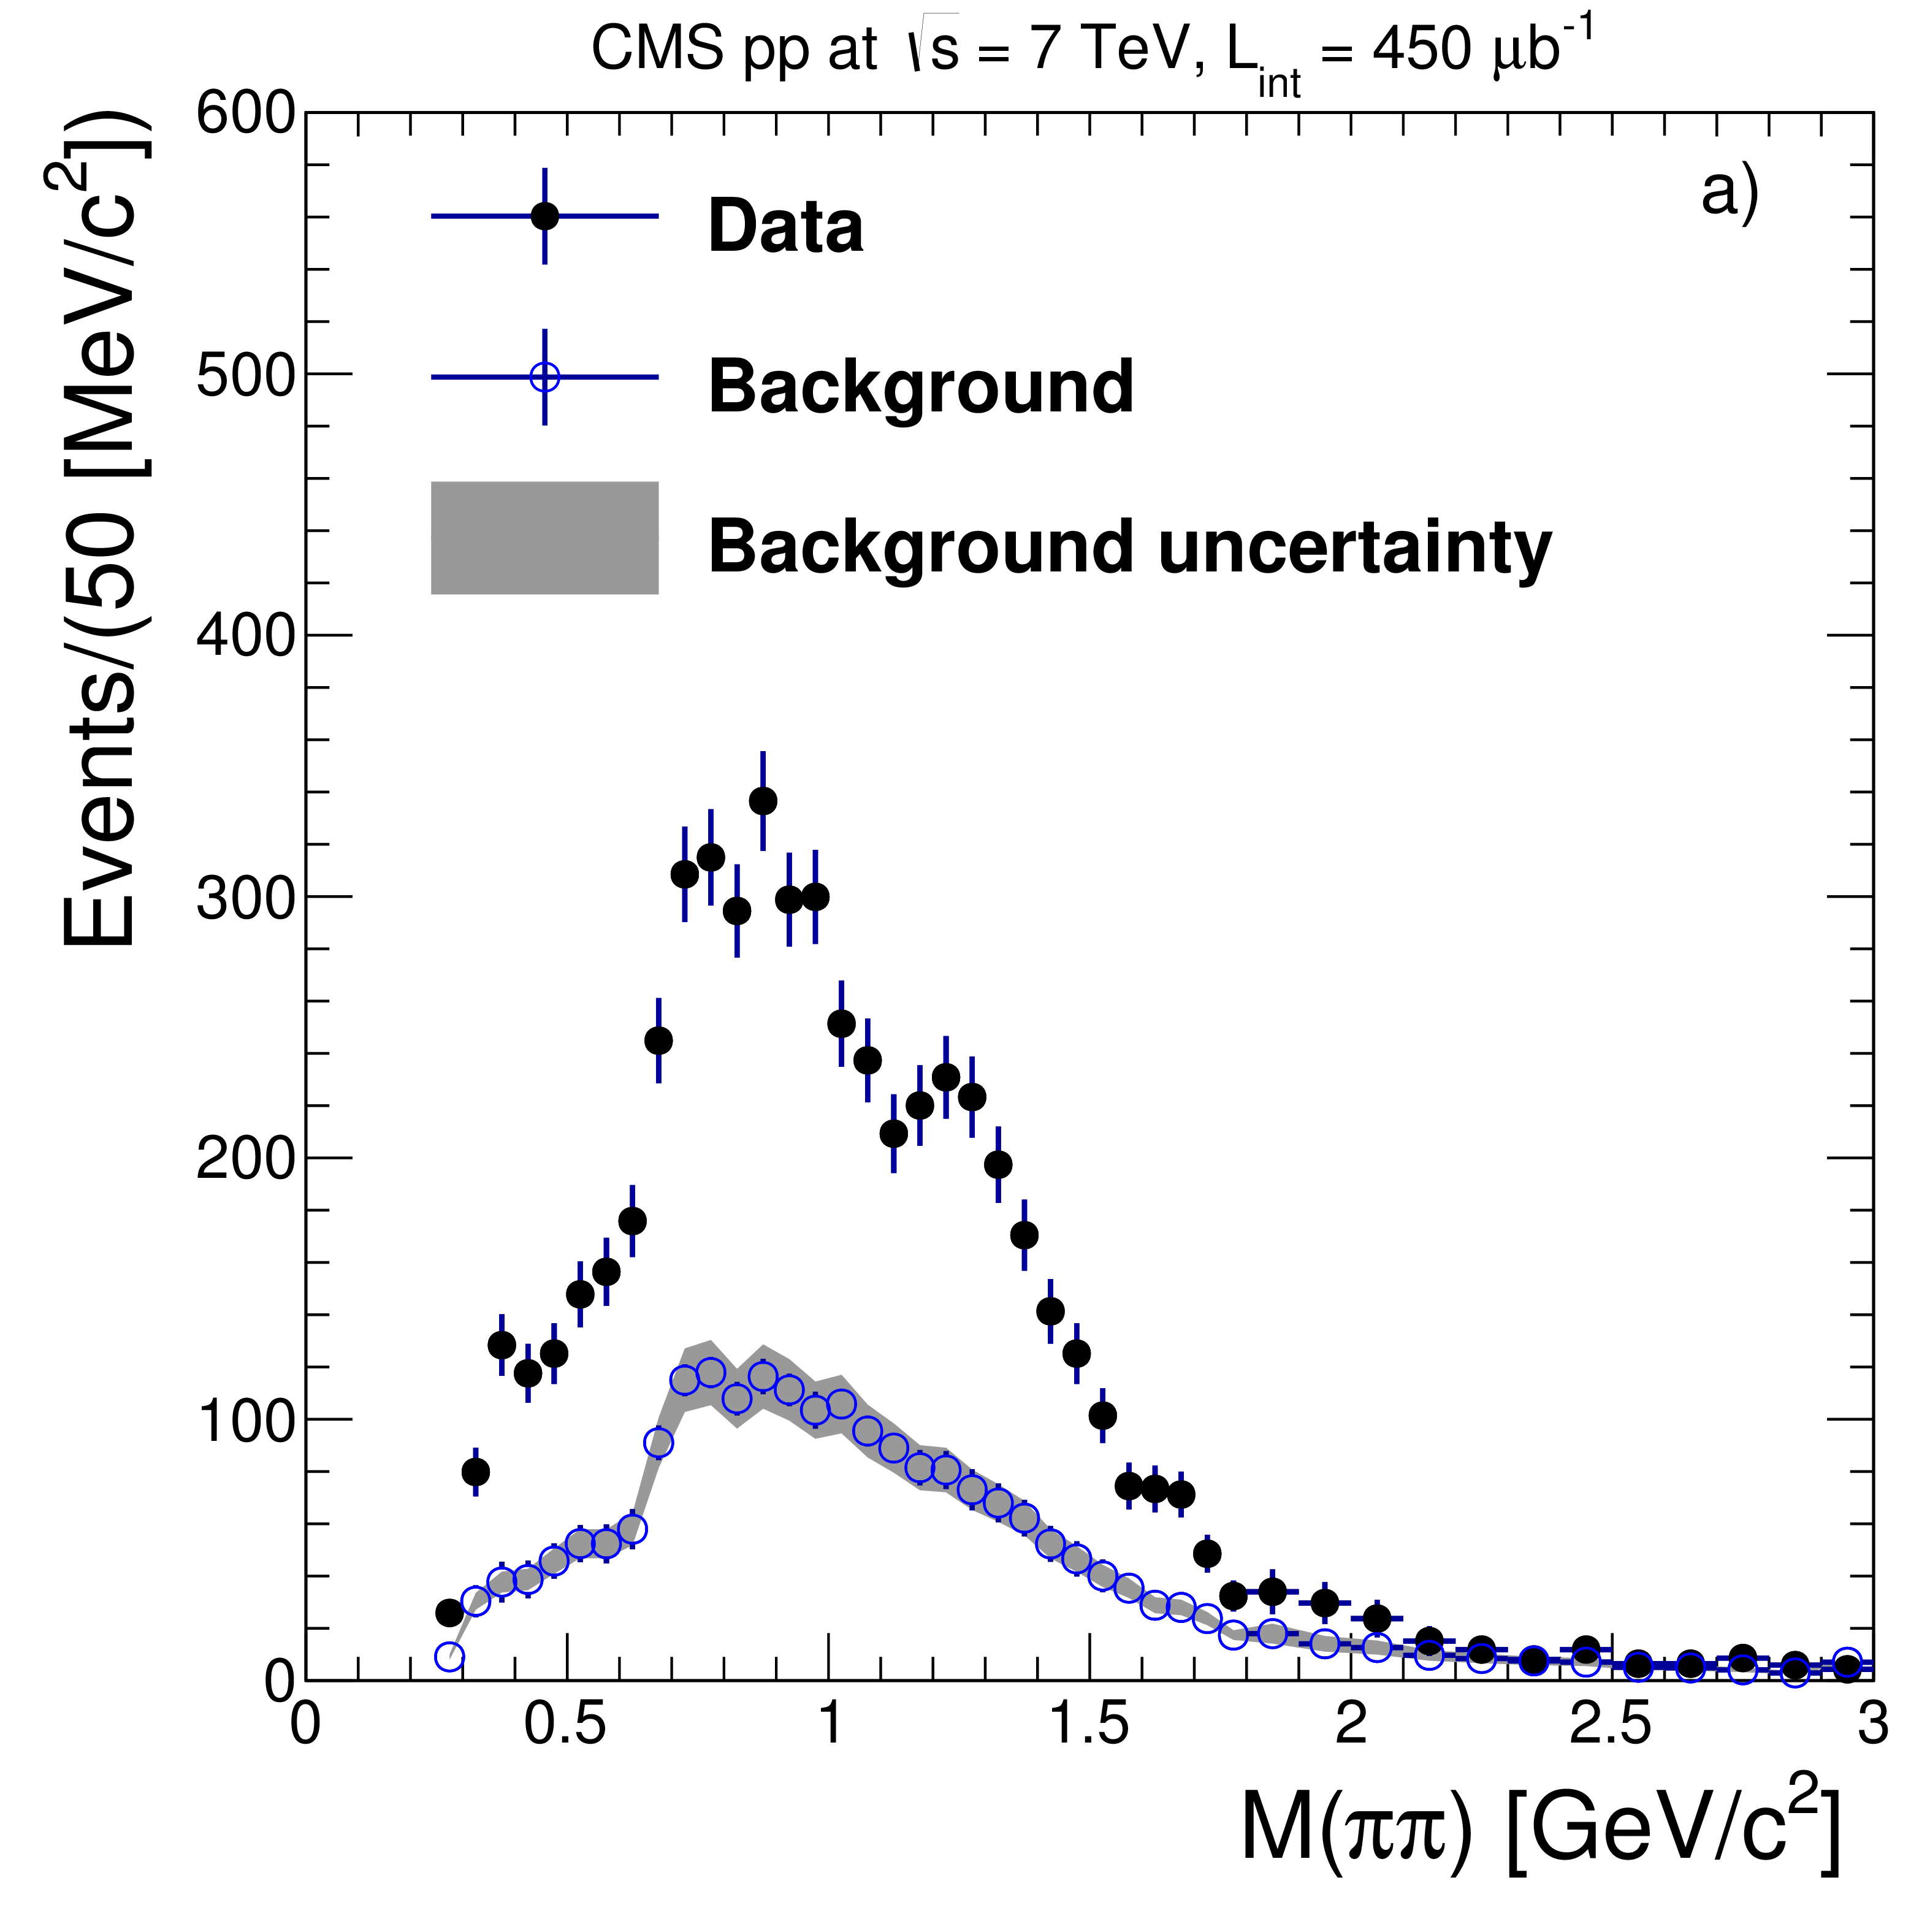
Figure 3:
Detector-level distributions for the 5402 signal events with $N_\text {extra} = $ 0 (filled circles), compared with the background estimated from control regions in data (open circles), as explained in the text. The pion pair a) invariant mass, b) ${p_{\mathrm {T}}} $, c) rapidity, and d) single-pion ${p_{\mathrm {T}}}$ distributions are shown. The vertical error bars indicate the statistical uncertainty and the shaded band indicates the uncertainty in the estimate of the background when the size of the control region is changed. |
png pdf |
Figure 3-a:
The pion pair invariant mass distribution at detector level for the 5402 signal events with $N_\text {extra} = $ 0 (filled circles), compared with the background estimated from control regions in data (open circles), as explained in the text. The vertical error bars indicate the statistical uncertainty and the shaded band indicates the uncertainty in the estimate of the background when the size of the control region is changed. |

png pdf |
Figure 3-b:
The pion pair ${p_{\mathrm {T}}} $ distribution at detector level for the 5402 signal events with $N_\text {extra} = $ 0 (filled circles), compared with the background estimated from control regions in data (open circles), as explained in the text. The vertical error bars indicate the statistical uncertainty and the shaded band indicates the uncertainty in the estimate of the background when the size of the control region is changed. |

png pdf |
Figure 3-c:
The pion pair rapidity distribution at detector level for the 5402 signal events with $N_\text {extra} = $ 0 (filled circles), compared with the background estimated from control regions in data (open circles), as explained in the text. The vertical error bars indicate the statistical uncertainty and the shaded band indicates the uncertainty in the estimate of the background when the size of the control region is changed. |

png pdf |
Figure 3-d:
The single-pion ${p_{\mathrm {T}}}$ distribution at detector level for the 5402 signal events with $N_\text {extra} = $ 0 (filled circles), compared with the background estimated from control regions in data (open circles), as explained in the text. The vertical error bars indicate the statistical uncertainty and the shaded band indicates the uncertainty in the estimate of the background when the size of the control region is changed. |

png pdf |
Figure 4:
Shape comparison of the detector-level mass distribution for opposite-sign pairs with $N_\text {extra}= $ 1 for the estimated signal (hatched histogram) and background (shaded histogram) contributions. The background is estimated from events with 2 $ \leq N_\text {extra} \leq $ 10, as explained in the text. The signal shape is extracted from the distribution measured in events with $N_\text {extra}= $ 0. Both distributions are scaled to their predicted normalization according to Fig. 2. |

png pdf |
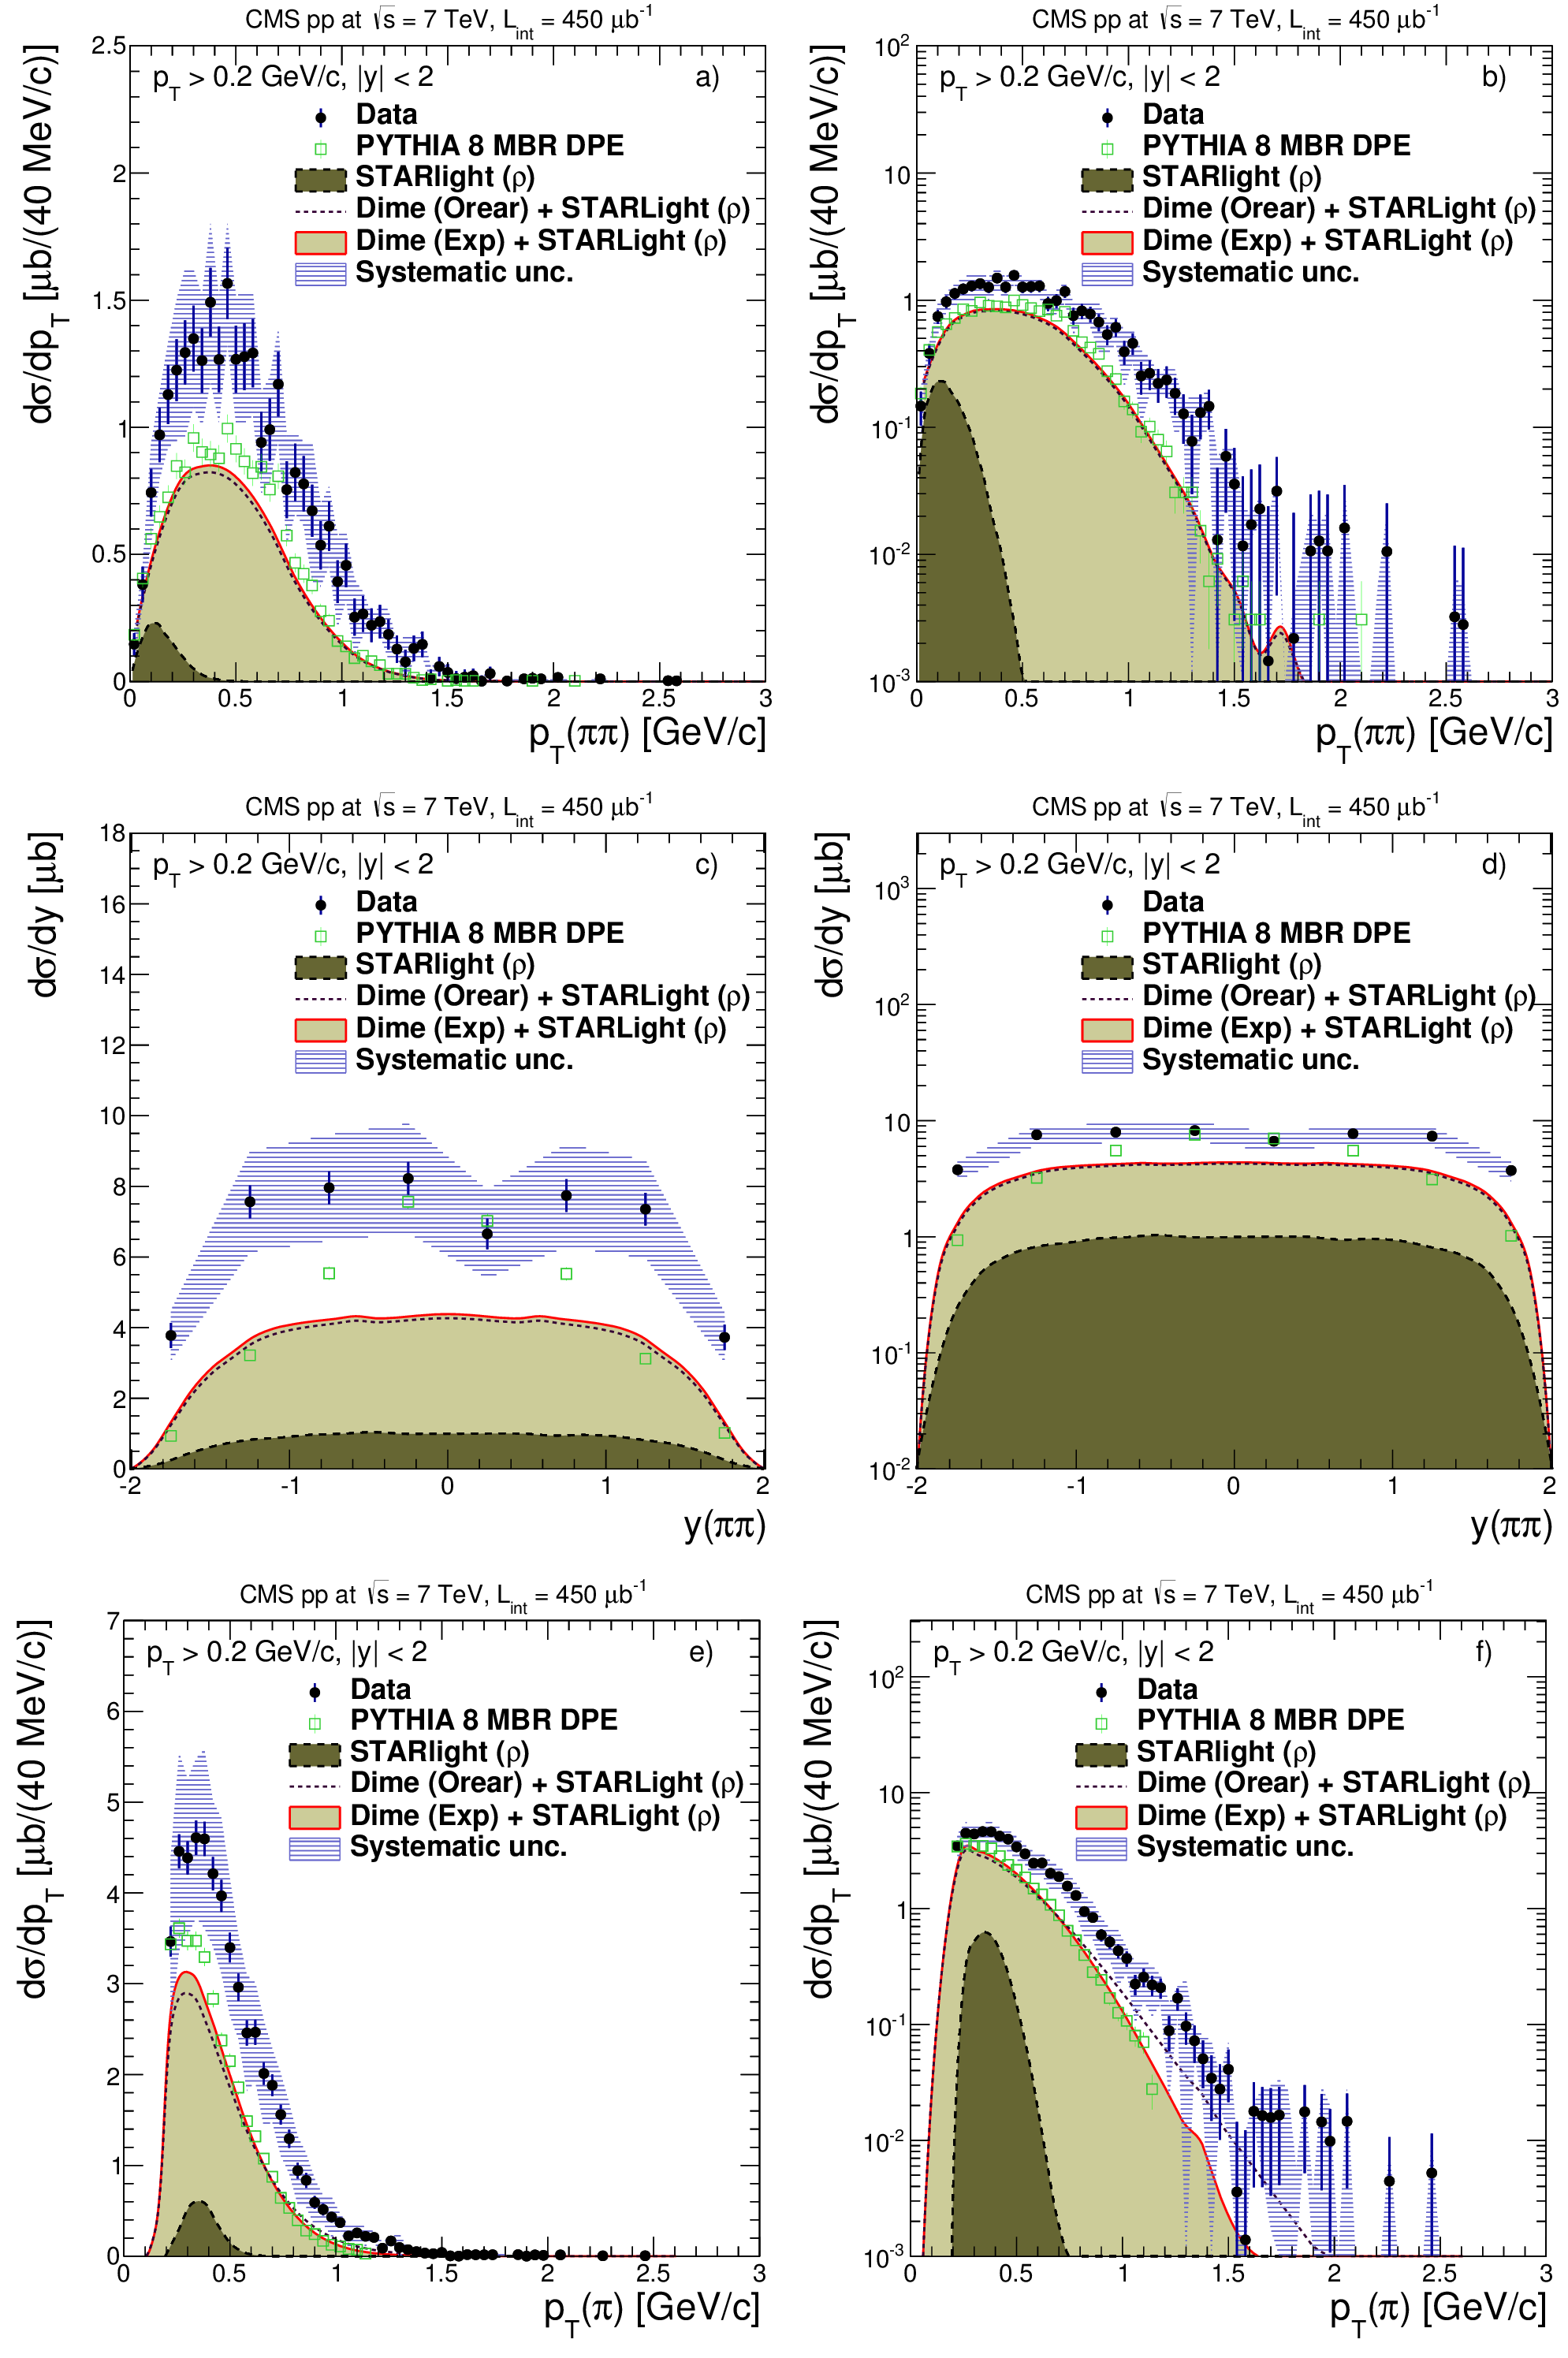
Figure 5:
Differential cross sections for ${\mathrm{ p } \mathrm{ p } \to {\mathrm{ p } }({ {\mathrm {p}^*} }) } + (\pi^{+} \pi^{-}) + {\mathrm{ p } }({ {\mathrm {p}^*} })$ as a function of the pion pair invariant mass, compared to the predictions from dime (solid and dashed curves), added to $\rho $ photoproduction from STARlight (long dashed curve). The results are also compared to PYTHIA 8 MBR (open squares). The shaded band shows the overall systematic uncertainty, and the vertical error bars indicate the statistical uncertainty. The results are plotted on (a) linear and (b) logarithmic scales. |

png pdf |
Figure 5-a:
Differential cross sections for ${\mathrm{ p } \mathrm{ p } \to {\mathrm{ p } }({ {\mathrm {p}^*} }) } + (\pi^{+} \pi^{-}) + {\mathrm{ p } }({ {\mathrm {p}^*} })$ as a function of the pion pair invariant mass, compared to the predictions from dime (solid and dashed curves), added to $\rho $ photoproduction from STARlight (long dashed curve). The results are also compared to PYTHIA 8 MBR (open squares). The shaded band shows the overall systematic uncertainty, and the vertical error bars indicate the statistical uncertainty. The results are plotted on linear scale. |

png pdf |
Figure 5-b:
Differential cross sections for ${\mathrm{ p } \mathrm{ p } \to {\mathrm{ p } }({ {\mathrm {p}^*} }) } + (\pi^{+} \pi^{-}) + {\mathrm{ p } }({ {\mathrm {p}^*} })$ as a function of the pion pair invariant mass, compared to the predictions from dime (solid and dashed curves), added to $\rho $ photoproduction from STARlight (long dashed curve). The results are also compared to PYTHIA 8 MBR (open squares). The shaded band shows the overall systematic uncertainty, and the vertical error bars indicate the statistical uncertainty. The results are plotted on logarithmic scale. |
png pdf |
Figure 6:
Differential cross sections for ${\mathrm{ p } \mathrm{ p } \to {\mathrm{ p } }({ {\mathrm {p}^*} }) }+ \pi^{+} \pi^{-} + {\mathrm{ p } }({ {\mathrm {p}^*} })$, compared to the predictions of DPE production from dime (solid and dashed curves), added to $\rho $ photoproduction from STARlight (long dashed curve), and of PYTHIA 8 MBR (open squares). Shown are the pion pair ${p_{\mathrm {T}}}$ (a, b) and rapidity (c, d), and single-pion ${p_{\mathrm {T}}}$ (e, f). The data are also compared to the PYTHIA 8 MBR (open squares). The shaded band shows the overall systematic uncertainty, and the error bar indicates the statistical uncertainties. The results are plotted on a linear (left) and a logarithmic (right) scale. |

png pdf |
Figure 6-a:
Differential cross sections for ${\mathrm{ p } \mathrm{ p } \to {\mathrm{ p } }({ {\mathrm {p}^*} }) }+ \pi^{+} \pi^{-} + {\mathrm{ p } }({ {\mathrm {p}^*} })$, compared to the predictions of DPE production from dime (solid and dashed curves), added to $\rho $ photoproduction from STARlight (long dashed curve), and of PYTHIA 8 MBR (open squares). Shown is the pion pair ${p_{\mathrm {T}}}$. The data are also compared to the PYTHIA 8 MBR (open squares). The shaded band shows the overall systematic uncertainty, and the error bar indicates the statistical uncertainties. The results are plotted on a linear scale. |

png pdf |
Figure 6-b:
Differential cross sections for ${\mathrm{ p } \mathrm{ p } \to {\mathrm{ p } }({ {\mathrm {p}^*} }) }+ \pi^{+} \pi^{-} + {\mathrm{ p } }({ {\mathrm {p}^*} })$, compared to the predictions of DPE production from dime (solid and dashed curves), added to $\rho $ photoproduction from STARlight (long dashed curve), and of PYTHIA 8 MBR (open squares). Shown is the pion pair ${p_{\mathrm {T}}}$. The data are also compared to the PYTHIA 8 MBR (open squares). The shaded band shows the overall systematic uncertainty, and the error bar indicates the statistical uncertainties. The results are plotted on a logarithmic scale. |

png pdf |
Figure 6-c:
Differential cross sections for ${\mathrm{ p } \mathrm{ p } \to {\mathrm{ p } }({ {\mathrm {p}^*} }) }+ \pi^{+} \pi^{-} + {\mathrm{ p } }({ {\mathrm {p}^*} })$, compared to the predictions of DPE production from dime (solid and dashed curves), added to $\rho $ photoproduction from STARlight (long dashed curve), and of PYTHIA 8 MBR (open squares). Shown is the pion pair rapidity. The data are also compared to the PYTHIA 8 MBR (open squares). The shaded band shows the overall systematic uncertainty, and the error bar indicates the statistical uncertainties. The results are plotted on a linear scale. |

png pdf |
Figure 6-d:
Differential cross sections for ${\mathrm{ p } \mathrm{ p } \to {\mathrm{ p } }({ {\mathrm {p}^*} }) }+ \pi^{+} \pi^{-} + {\mathrm{ p } }({ {\mathrm {p}^*} })$, compared to the predictions of DPE production from dime (solid and dashed curves), added to $\rho $ photoproduction from STARlight (long dashed curve), and of PYTHIA 8 MBR (open squares). Shown is the pion pair rapidity. The data are also compared to the PYTHIA 8 MBR (open squares). The shaded band shows the overall systematic uncertainty, and the error bar indicates the statistical uncertainties. The results are plotted on a logarithmic scale. |

png pdf |
Figure 6-e:
Differential cross sections for ${\mathrm{ p } \mathrm{ p } \to {\mathrm{ p } }({ {\mathrm {p}^*} }) }+ \pi^{+} \pi^{-} + {\mathrm{ p } }({ {\mathrm {p}^*} })$, compared to the predictions of DPE production from dime (solid and dashed curves), added to $\rho $ photoproduction from STARlight (long dashed curve), and of PYTHIA 8 MBR (open squares). Shown is the single-pion ${p_{\mathrm {T}}}$. The data are also compared to the PYTHIA 8 MBR (open squares). The shaded band shows the overall systematic uncertainty, and the error bar indicates the statistical uncertainties. The results are plotted on a linear scale. |

png pdf |
Figure 6-f:
Differential cross sections for ${\mathrm{ p } \mathrm{ p } \to {\mathrm{ p } }({ {\mathrm {p}^*} }) }+ \pi^{+} \pi^{-} + {\mathrm{ p } }({ {\mathrm {p}^*} })$, compared to the predictions of DPE production from dime (solid and dashed curves), added to $\rho $ photoproduction from STARlight (long dashed curve), and of PYTHIA 8 MBR (open squares). Shown is the single-pion ${p_{\mathrm {T}}}$. The data are also compared to the PYTHIA 8 MBR (open squares). The shaded band shows the overall systematic uncertainty, and the error bar indicates the statistical uncertainties. The results are plotted on a logarithmic scale. |
| Tables | |
png pdf |
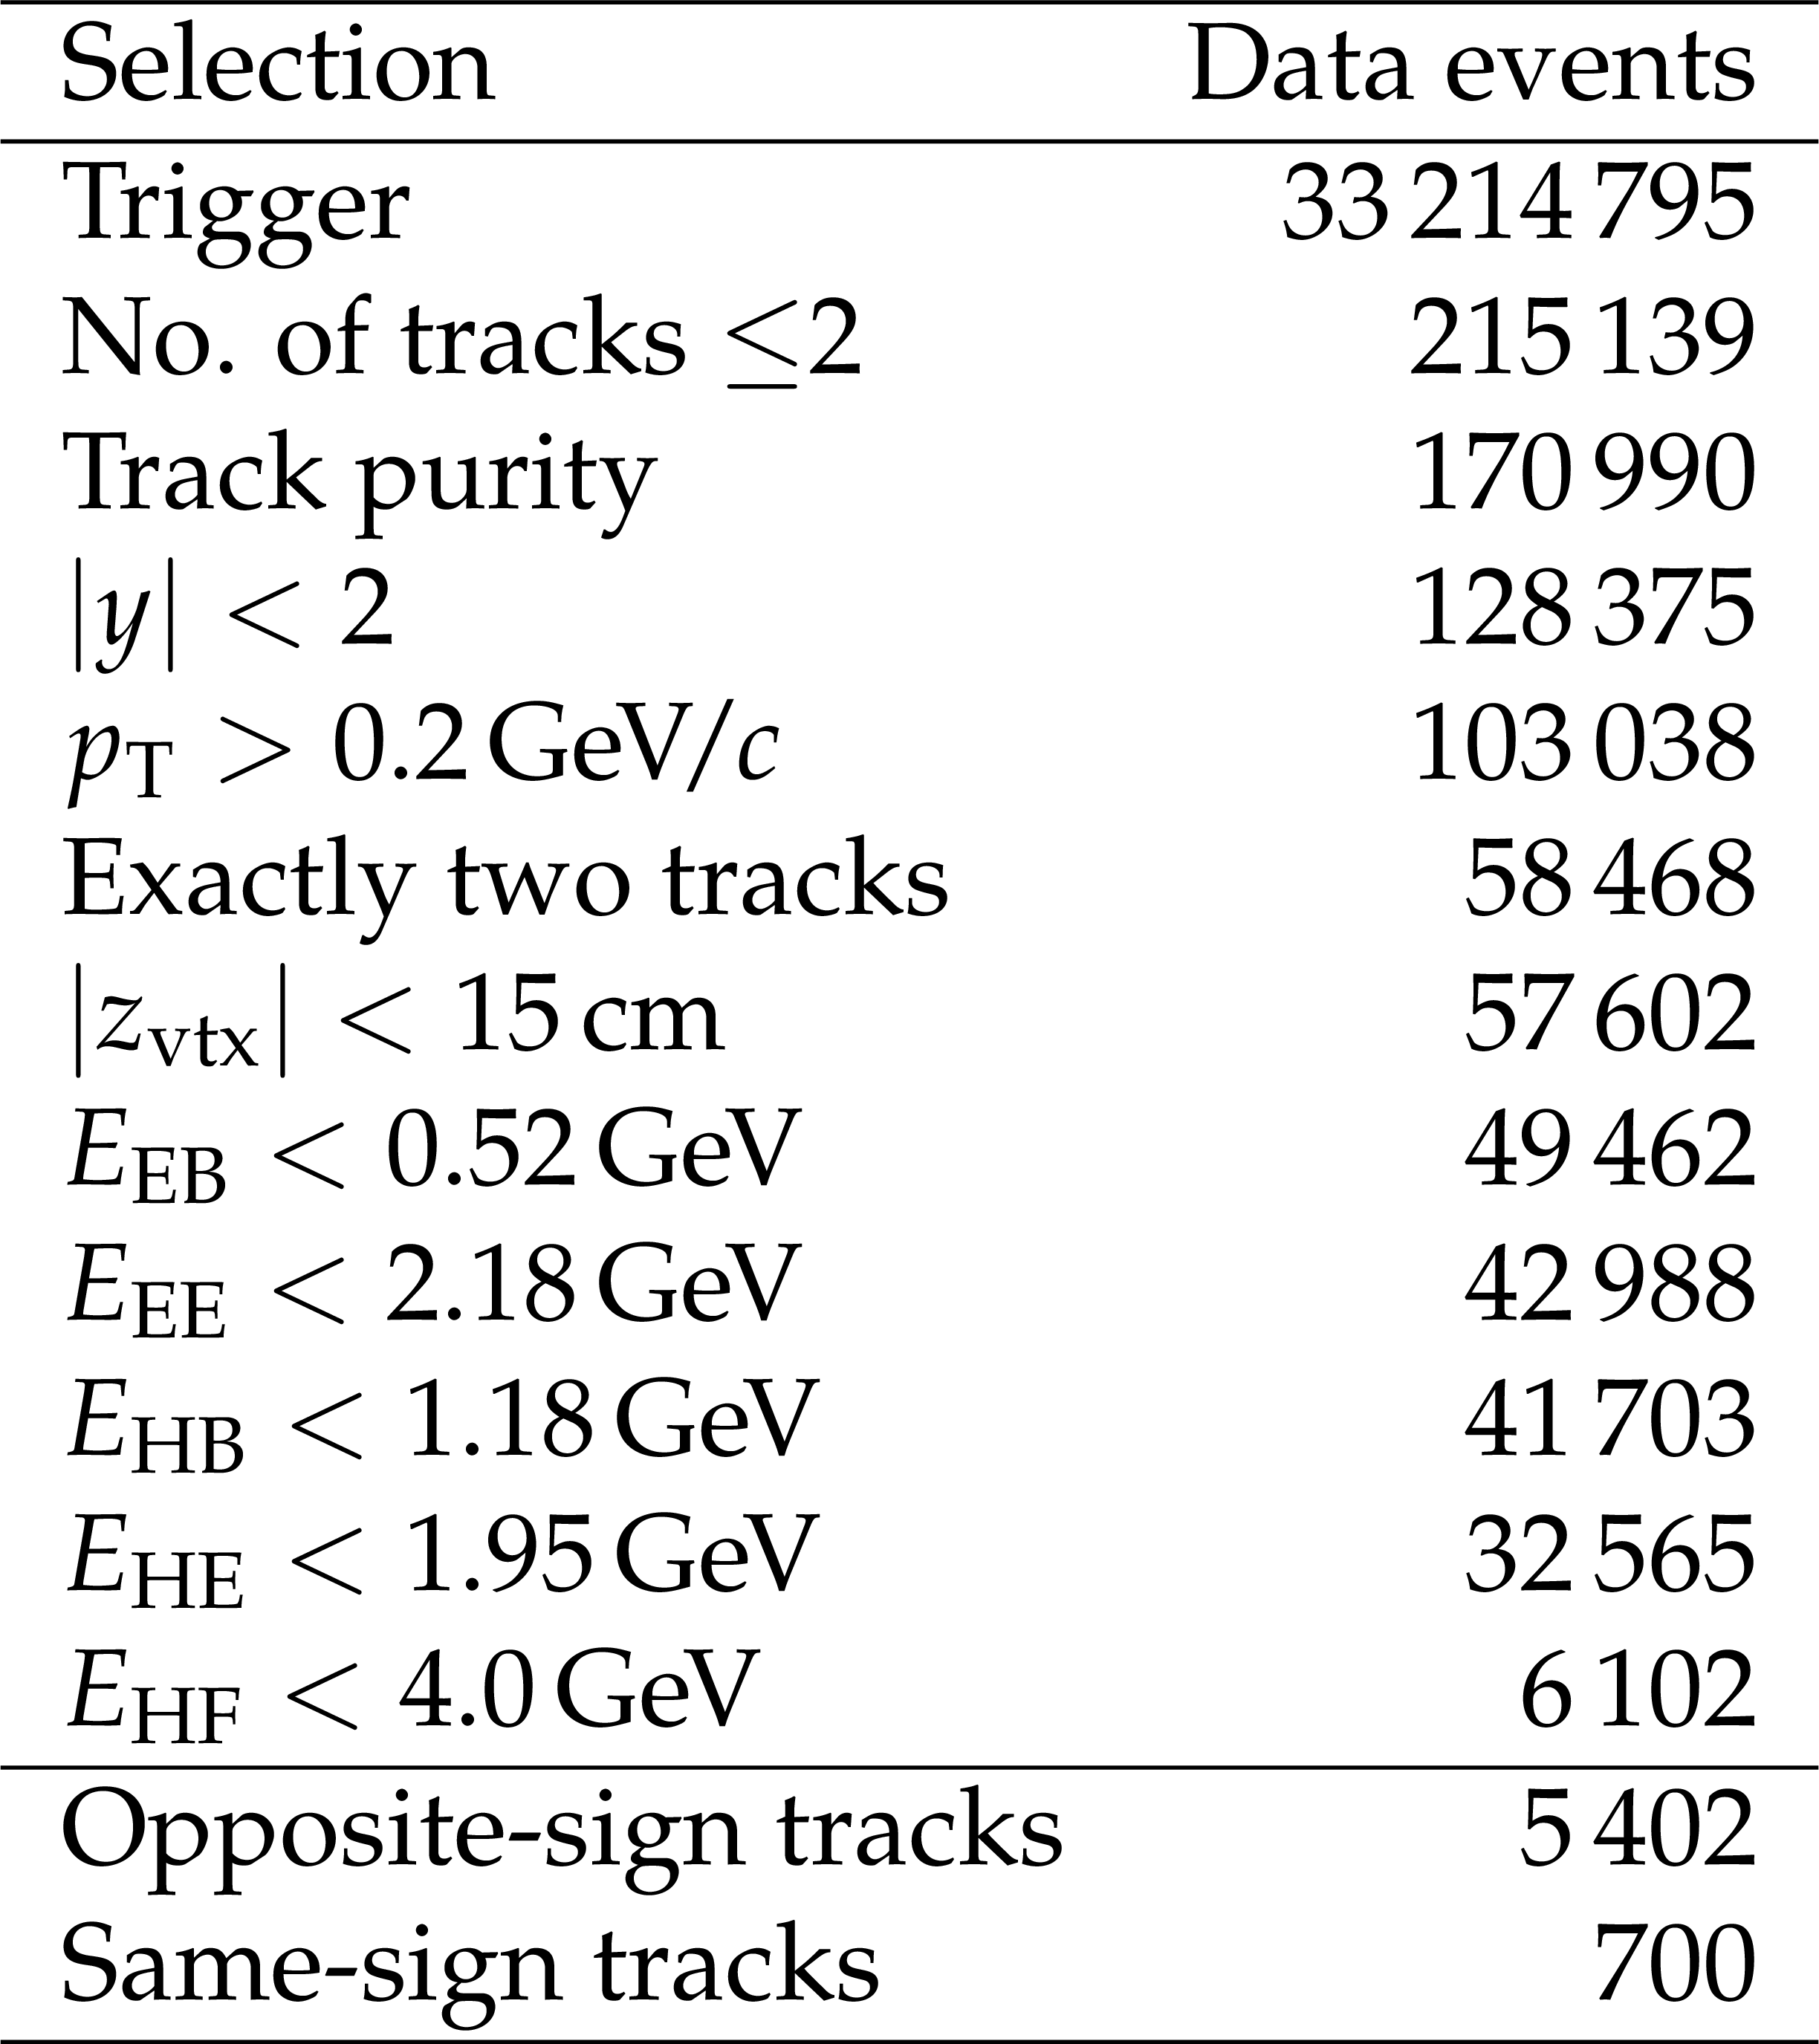
Table 1:
Number of events remaining after each step of the analysis. |

png pdf |
Table 2:
Predictions for the DPE and $\rho $-photoproduction cross sections from Monte Carlo simulations. Results are given for the full cross section and for the fiducial cross section defined by exactly two oppositely charged pions with $ {p_{\mathrm {T}}} > $ 0.2 GeV/$c$ and $ {| y | }< $ 2. |

png pdf |
Table 3:
Summary of systematic uncertainties in the exclusive dipion cross sections (for a single-pion phase space defined by $ {p_{\mathrm {T}}} > $ 0.2 GeV/$c$ and $ {| y | } < $ 2). |
| Summary |
|
Cross sections for pion pair production in the reaction ${\mathrm{ p }\mathrm{ p } \to {\mathrm{ p }}({{\mathrm{p}^*} }) }+ \pi^{+}\pi^{-}+ {\mathrm{ p }}({{\mathrm{p}^*} })$, where the undetected protons stay intact (exclusive production) or dissociate into low-mass states (semi-exclusive production), have been measured in proton-proton collisions at $\sqrt{s} = $ 7 TeV with the CMS detector using data corresponding to an integrated luminosity of 450$\mu$b$^{-1}$. By selecting events with exactly two oppositely-charged central particles, the multiplicity distribution of additional calorimeter towers $N_\text{extra}$ shows an excess for 0 or 1 towers relative to a negative binomial distribution that reproduces the inclusive dipion production with $N_\text{extra} > $ 1. This excess is attributed to exclusive and semi-exclusive production of $\pi^{+}\pi^{-}$. The results are compared to phenomenological predictions for (semi)exclusive dipion cross sections from double pomeron exchange (as modeled in PYTHIA8 and DIME) and from $ \rho $-meson photoproduction (as modeled in STARlight). The exclusive and semi-exclusive dipion cross section, for individual pions with $p_{\mathrm{T}}> $ 0.2 GeV/$c$ and $|{y} | < $ 2 and no additional particles produced within $|{\eta} < $ 4.9, is 26.5 $\pm$ 0.3 (stat) $\pm$ 5.0 (syst) $\pm$ 1.1 (lumi) $\mu$b, which is 50% larger than that predicted by the PYTHIA8 (MBR and 4C tune) and DIME models. Such a result is expected as none of the models include the contributions from low-mass proton dissociation, nor the production of specific dipion resonances, which would increase the visible cross section. The $\pi^{+}\pi^{-}$ differential cross sections as a function of the pion pair invariant mass, $p_{\mathrm{T}}$, and $y$ have also been compared to model predictions. The measured $p_{\mathrm{T}}(\pi\pi)$ distribution shows a larger average $p_{\mathrm{T}}$ and a higher tail above $p_{\mathrm{T}}> $ 0.5 GeV/$c$ than predicted by the models, suggesting the presence in the data of a significant contribution from semi-exclusive $\pi^{+}\pi^{-}$ production with proton dissociation. The invariant mass spectrum for dipions shows various resonant peaks (including a possible contribution from $ \rho $ mesons produced in $\gamma$p photoproduction processes) and dips, similar to those observed in lower-energy ${\mathrm{ p }}\mathrm{ \bar{p} }$ and $\mathrm{pp}$ collisions. This is the first measurement at the LHC of exclusive and semi-exclusive production of pion pairs from the nonresonant continuum, and from possible decays of various low-mass meson resonances. The understanding of the data requires the improvement of phenomenological double pomeron exchange models to consistently include continuum and resonant processes, and their interference, as well as similar contributions with proton dissociation. |
| References | ||||
| 1 | M. G. Albrow, T. D. Coughlin, and J. R. Forshaw | Central exclusive particle production at high energy hadron colliders | Prog. Part. Nucl. Phys. 65 (2010) 149 | 1006.1289 |
| 2 | M. Albrow | Central exclusive production issue: Introduction | Int. J. Mod. Phys. A 29 (2014) 1402006, and references therein | |
| 3 | D. d'Enterria, M. Klasen, and K. Piotrzkowski, eds. | Proceedings of the International Workshop on High-Energy Photon Collisions at the LHC, PHOTON-LHC-2008 | NPB Proc. Suppl., 179 (2008) | |
| 4 | V. A. Khoze, A. D. Martin, and M. G. Ryskin | Prospects for new physics observations in diffractive processes at the LHC and Tevatron | EPJC 23 (2002) 311 | hep-ph/0111078 |
| 5 | R. Waldi, K. R. Schubert, and K. Winter | Search for glue balls in a pomeron pomeron scattering experiment | Z. Phys. C 18 (1983) 301 | |
| 6 | Axial Field Spectrometer Collaboration | A search for glueballs and a study of double pomeron exchange at the CERN intersecting storage rings | Nucl. Phys. B 264 (1986) 154 | |
| 7 | ABCDHW Collaboration | The reaction Pomeron-Pomeron $ \rightarrow \pi^{+}\pi^{-} $ and an unusual production mechanism for the $ \rm {f_2} $(1270) | Z. Phys. C 48 (1990) 569 | |
| 8 | CDF Collaboration | Measurement of central exclusive $ \pi^{+}\pi^{-} $ production in $ {\rm p}\bar{\rm p} $ collisions at $ \sqrt{s} = $ 0.9 and 1.96 TeV at CDF | PRD 91 (2015) 091101 | 1502.01391 |
| 9 | L. A. Harland-Lang, V. A. Khoze, and M. G. Ryskin | Modelling exclusive meson pair production at hadron colliders | EPJC 74 (2014), no. 4 | |
| 10 | G. Gutierrez and M. A. Reyes | Fixed target experiments at the Fermilab Tevatron | Int. J. Mod. Phys. A 29 (2014) 1446008 | |
| 11 | CMS Collaboration | The CMS experiment at the CERN LHC | JINST 3 (2008) S08004 | CMS-00-001 |
| 12 | CMS Collaboration | Description and performance of track and primary-vertex reconstruction with the CMS tracker | JINST 9 (2014) P10009 | CMS-TRK-11-001 1405.6569 |
| 13 | T. Sjostrand, S. Mrenna, and P. Skands | A brief introduction to PYTHIA 8.1 | Comp. Phys. Comm. 178 (2008) 852 | 0710.3820 |
| 14 | R. Ciesielski and K. Goulianos | MBR Monte Carlo Simulation in PYTHIA8 | in Proceedings, 36th International Conference on High Energy Physics (ICHEP2012) Melbourne, 2012 PoS(ICHEP2012)301 | 1205.1446 |
| 15 | R. Corke and T. Sjostrand | Interleaved parton showers and tuning prospects | JHEP 03 (2011) 032 | 1011.1759 |
| 16 | S. R. Klein et al. | STARlight: A Monte Carlo simulation program for ultra-peripheral collisions of relativistic ions | CPC 212 (2017) 258 | 1607.03838 |
| 17 | L. A. Harland-Lang, V. A. Khoze, M. G. Ryskin, and W. J. Stirling | The phenomenology of central exclusive production at hadron colliders | EPJC 72 (2012) 2110 | 1204.4803 |
| 18 | J. Orear | Transverse momentum distribution of protons in p-p elastic scattering | PRL 12 (1964) 112 | |
| 19 | GEANT4 Collaboration | GEANT4---a simulation toolkit | NIMA 506 (2003) 250 | |
| 20 | T. Aumeyr | Beam phase and intensity monitoring for the Compact Muon Solenoid Experiment | Master's thesis, Vienna University of Technology, Vienna Austria | |
| 21 | CMS Collaboration | Search for exclusive or semi-exclusive $ \gamma\gamma $ production and observation of exclusive and semi-exclusive ee production in pp collisions at $ \sqrt{s} = $ 7 TeV | JHEP 11 (2012) 080 | |
| 22 | CMS Collaboration | CMS tracking performance results from early LHC operation | EPJC 70 (2010) 1165 | |
| 23 | CMS Collaboration | Study of the inclusive production of charged pions, kaons, and protons in $ pp $ collisions at $ \sqrt{s}= $ 0.9, 2.76, and 7 TeV | EPJC 72 (2012) 2164 | CMS-FSQ-12-014 1207.4724 |
| 24 | G. D'Agostini | A multidimensional unfolding method based on Bayes' theorem | NIMA 362 (1995) 487 | |
| 25 | T. Adye | Unfolding algorithms and tests using RooUnfold | Proceedings, PHYSTAT 2011 Workshop on Statistical Issues Related to Discovery Claims in Search Experiments and Unfolding (2011) 313, CERN, Geneva | 1105.1160 |
| 26 | R. Engel and J. Ranft | Hadronic photon-photon interactions at high energies | PRD 54 (1996) 4244 | hep-ph/9509373 |
| 27 | CDF Collaboration | Observation of exclusive electron-positron production in hadron-hadron collisions | PRL 98 (2007) 112001 | hep-ex/0611040 |
| 28 | CMS Collaboration | Measurement of tracking efficiency | CDS | |
| 29 | CMS Collaboration | Measurement of CMS luminosity | CDS | |
| 30 | P. Lebiedowicz, O. Nachtmann, and A. Szczurek | Central exclusive diffractive production of the $ \pi^{+}\pi^{-} $ continuum, scalar, and tensor resonances in $ pp $ and $ p \bar{p} $ scattering within the tensor pomeron approach | PRD 93 (2016) 054015 | 1601.04537 |
|
|
Compact Muon Solenoid LHC, CERN |
|

|

|

|

|

|