

Compact Muon Solenoid
LHC, CERN
| CMS-FSQ-12-028 ; CERN-PH-EP-2013-224 | ||
| Study of double parton scattering using W + 2-jet events in proton-proton collisions at $\sqrt{s} = $ 7 TeV | ||
| CMS Collaboration | ||
| 19 December 2013 | ||
| J. High Energy Phys. 03 (2014) 032 | ||
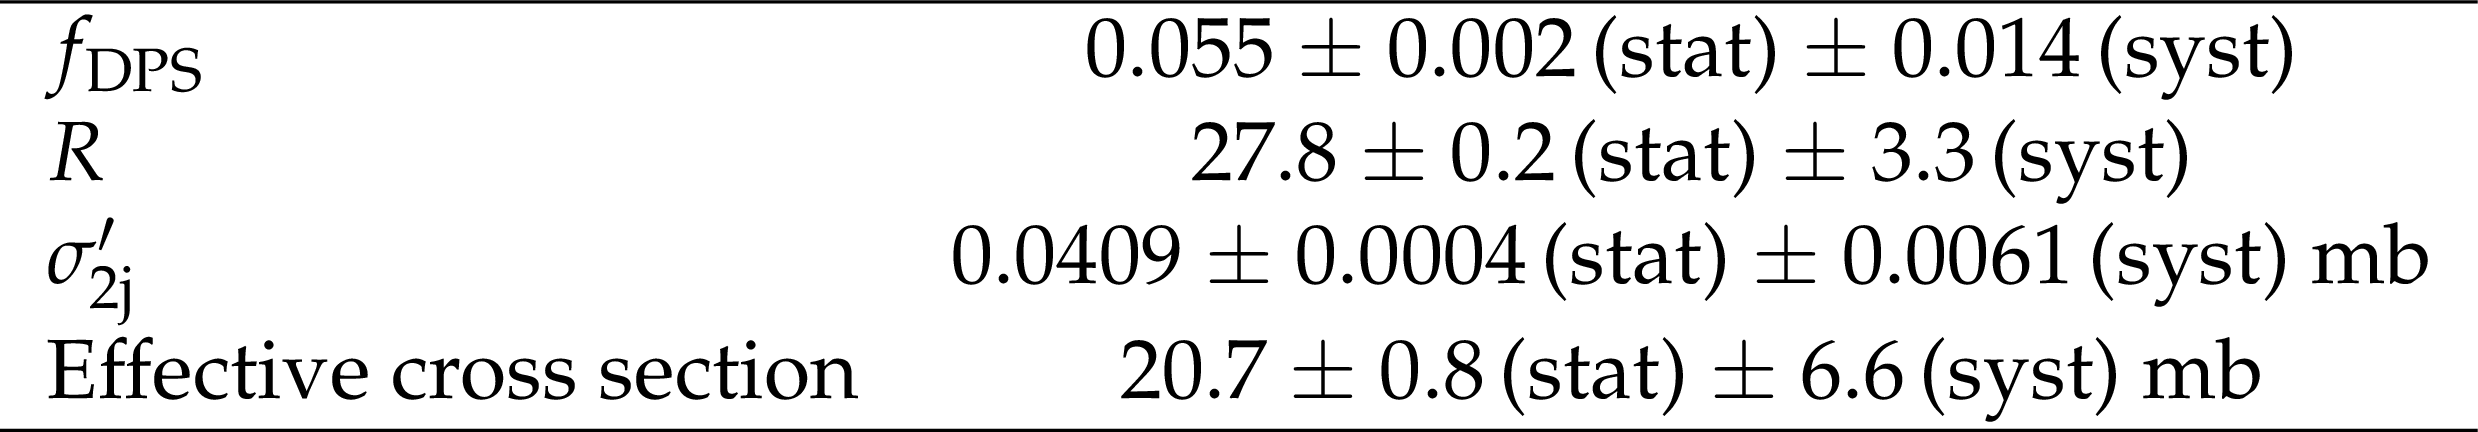
| Abstract: Double parton scattering is investigated in proton-proton collisions at $\sqrt{s} = $ 7 TeV where the final state includes a W boson, which decays into a muon and a neutrino, and two jets. The data sample corresponds to an integrated luminosity of 5 fb$^{-1}$, collected with the CMS detector at the LHC. Observables sensitive to double parton scattering are investigated after being corrected for detector effects and selection efficiencies. The fraction of W + 2-jet events due to double parton scattering is measured to be 0.055 $\pm$ 0.002 (stat) $\pm$ 0.014 (syst). The effective cross section, $\sigma_\text{eff}$, characterizing the effective transverse area of hard partonic interactions in collisions between protons is measured to be 20.7 $\pm$ 0.8 (stat) $\pm$ 6.6 (syst) mb. | ||
| Links: e-print arXiv:1312.5729 [hep-ex] (PDF) ; CDS record ; inSPIRE record ; Public twiki page ; HepData record ; CADI line (restricted) ; | ||
| Figures | |
png pdf |
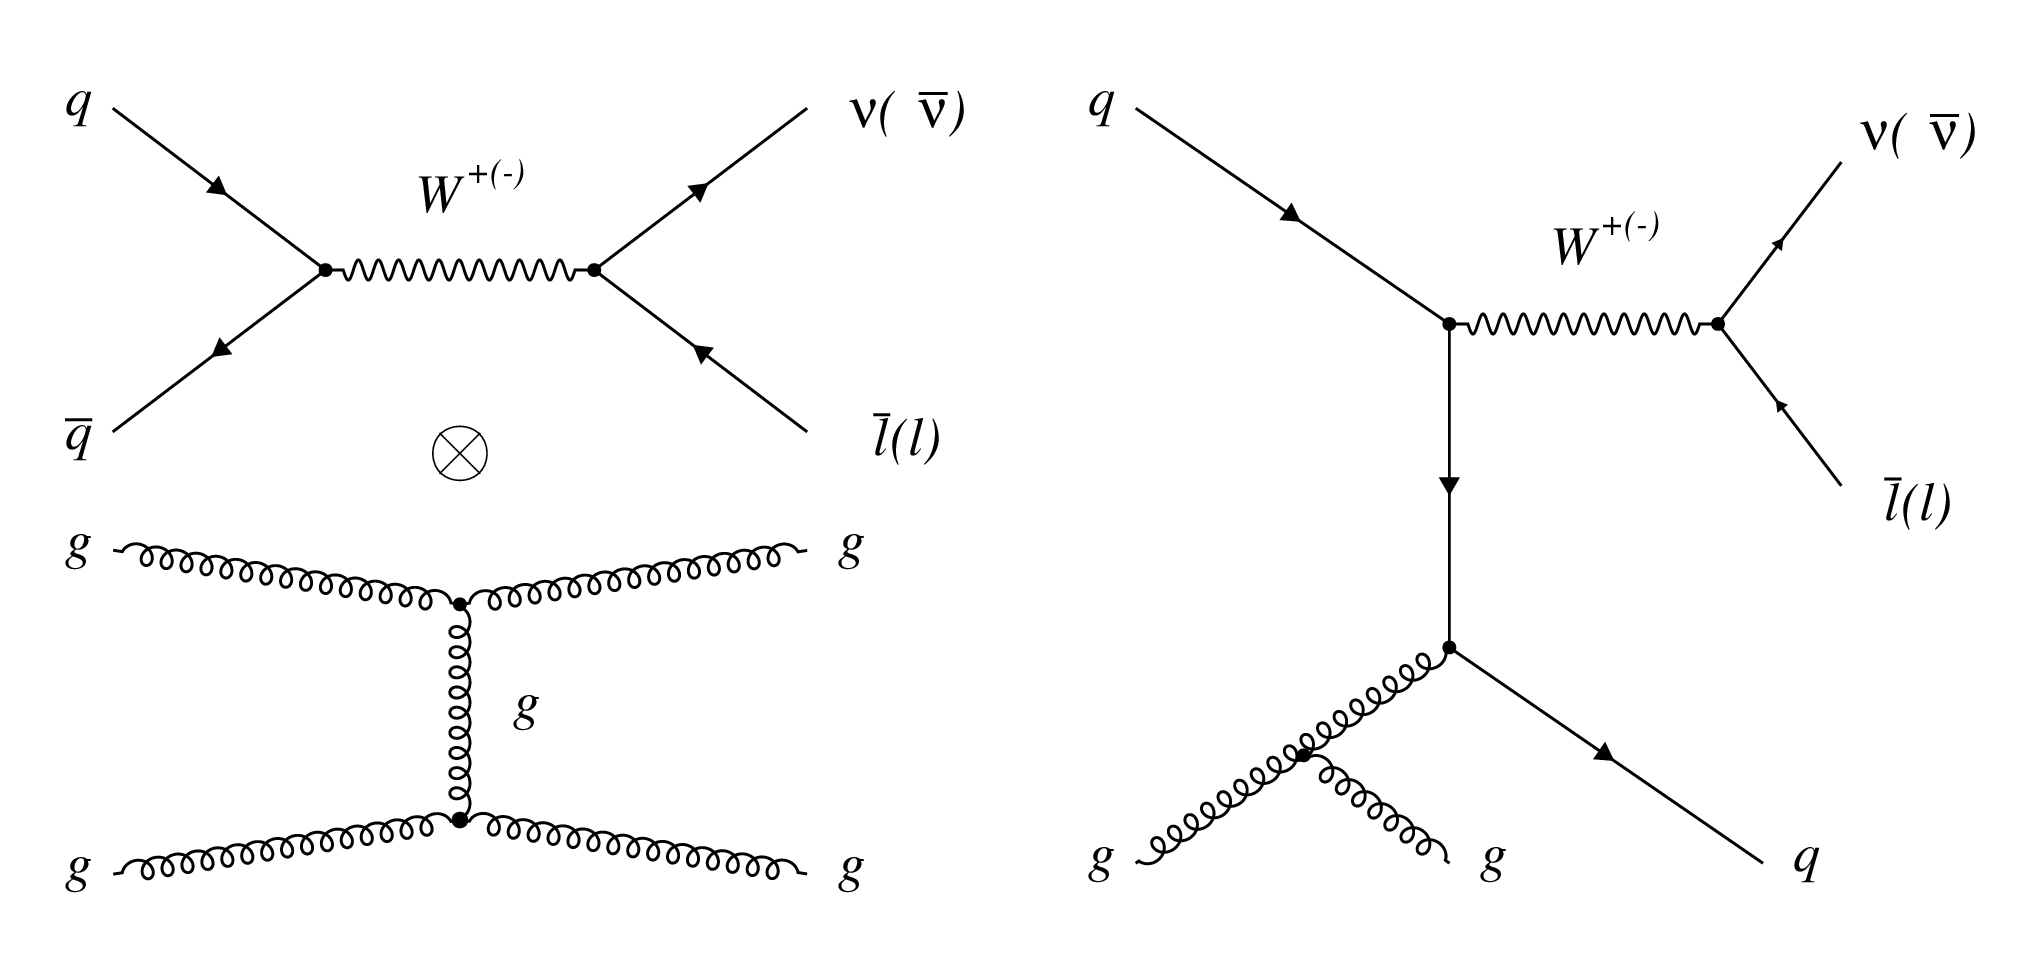
Figure 1:
Feynman diagrams for W + 2-jet production from (left) double parton scattering and (right) single parton scattering. |
png pdf |
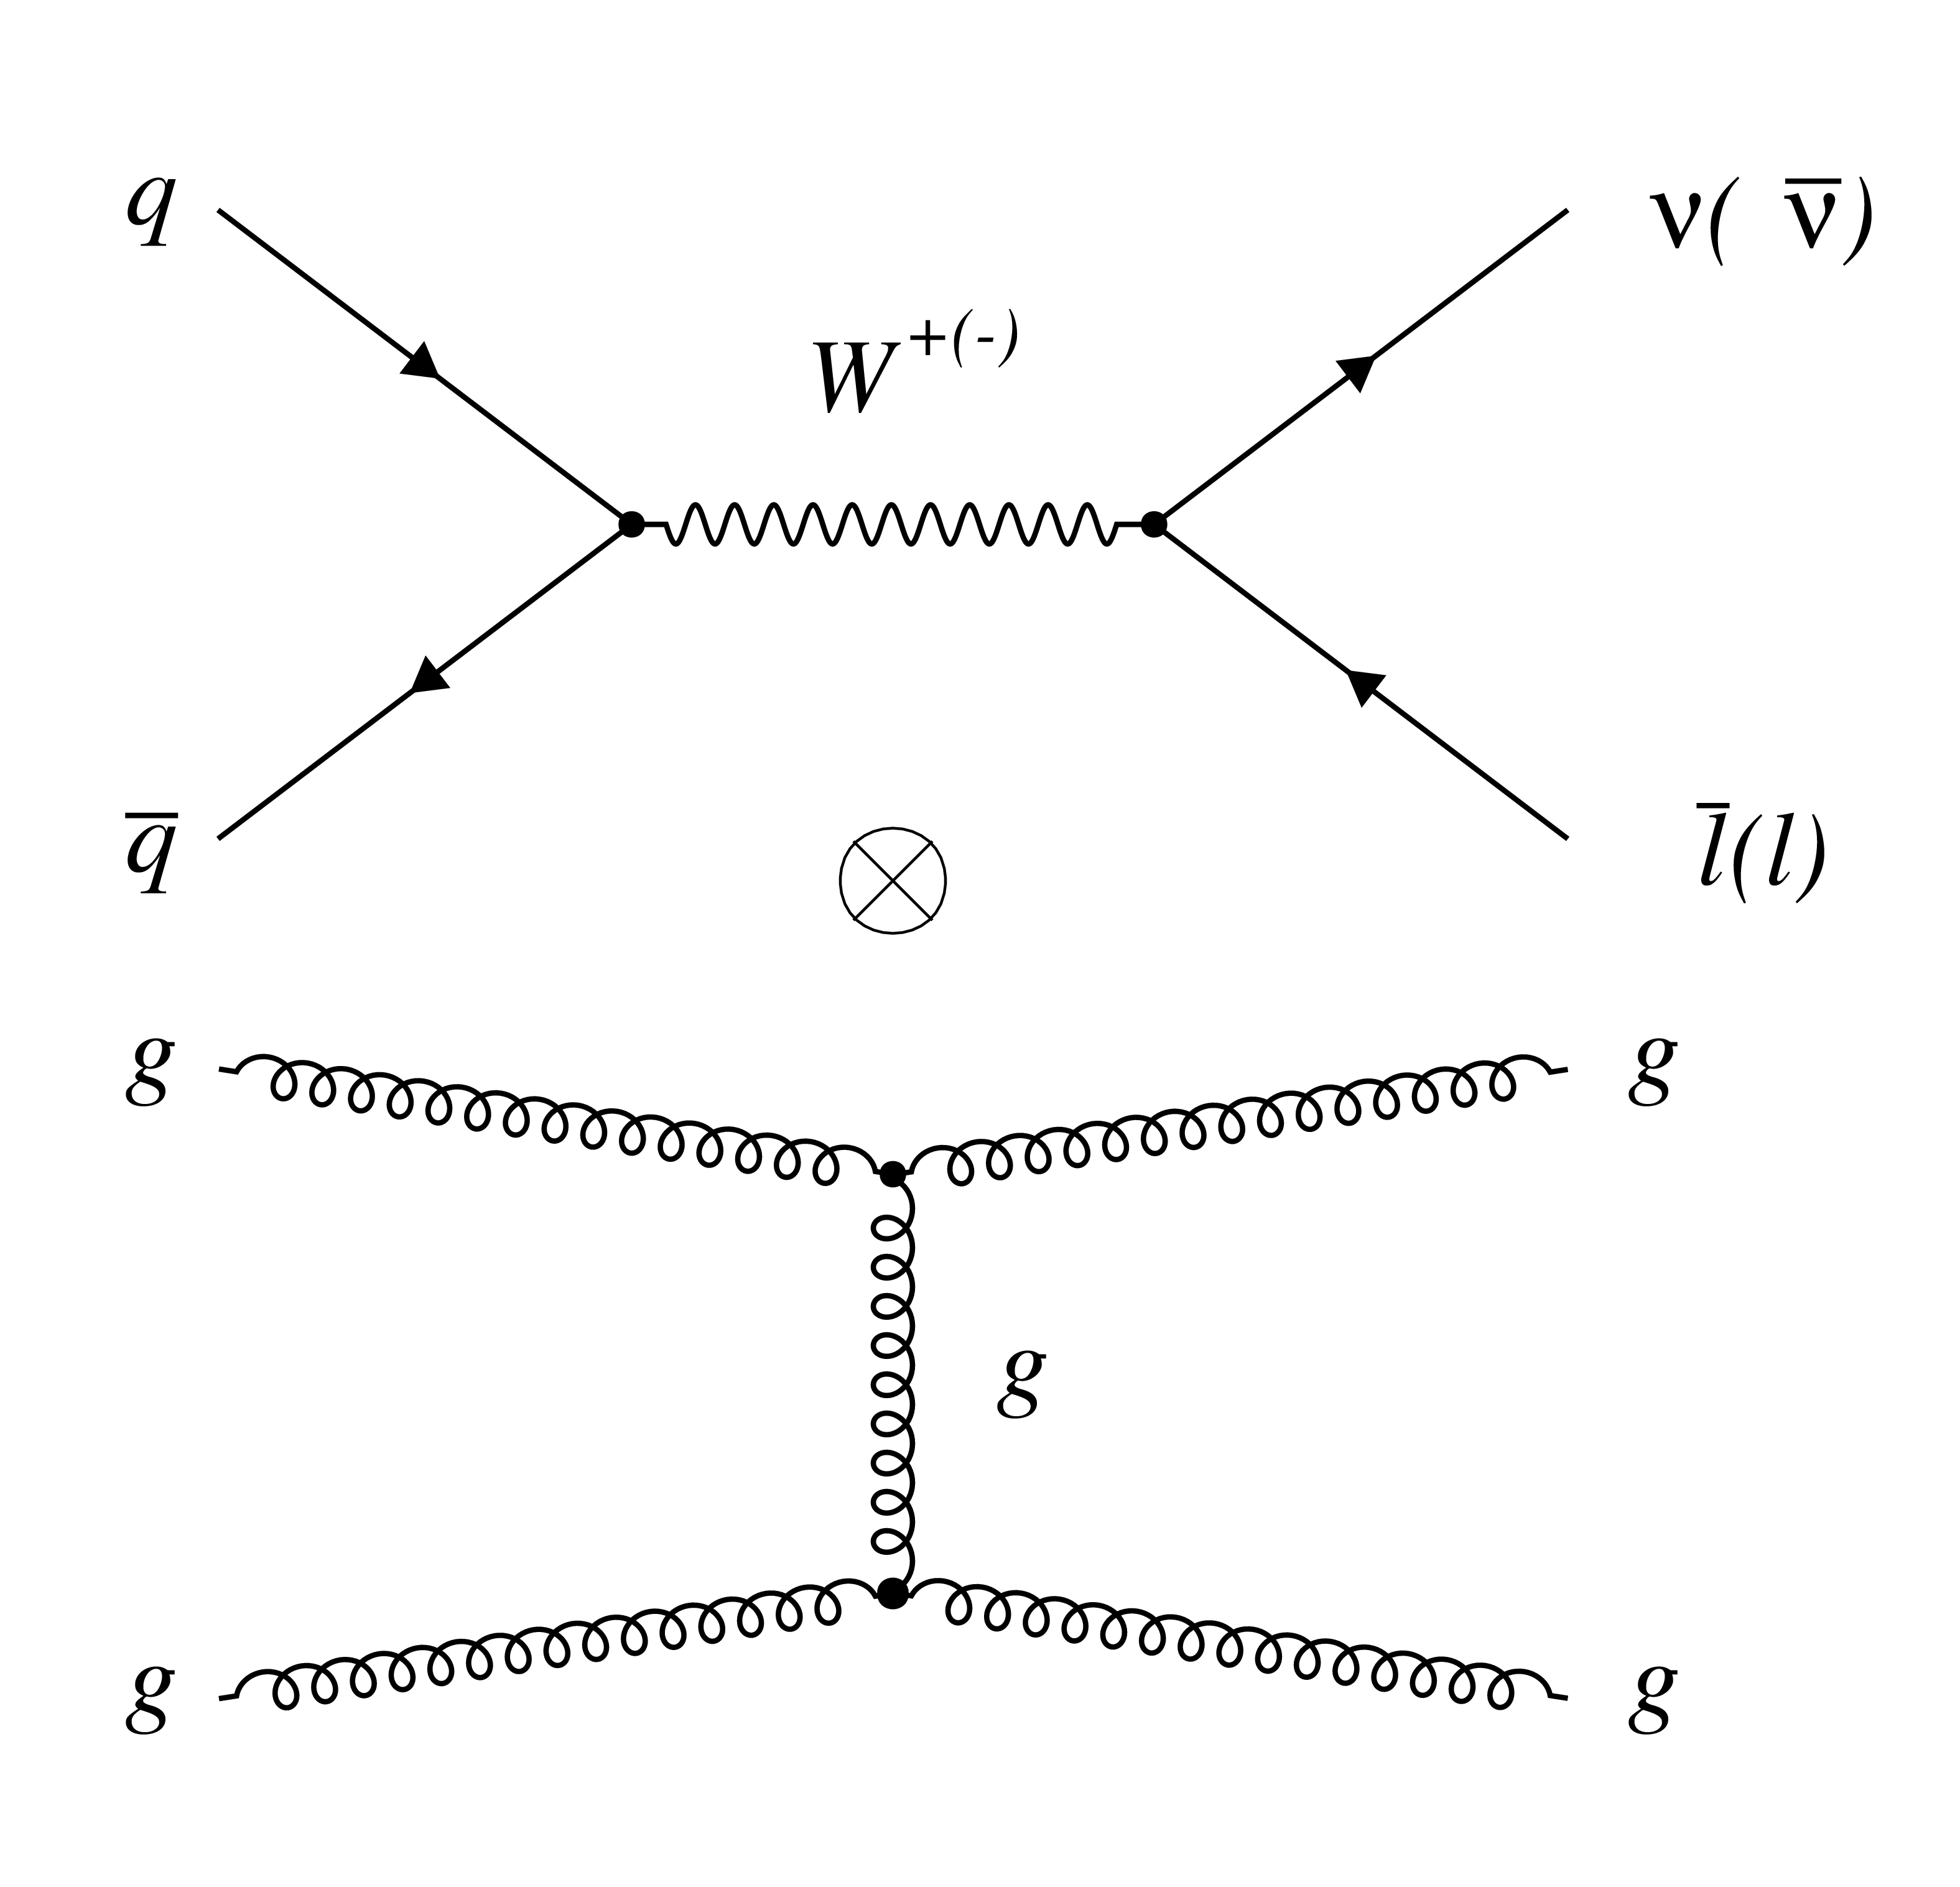
Figure 1-a:
Feynman diagrams for W + 2-jet production from (left) double parton scattering and (right) single parton scattering. |
png pdf |
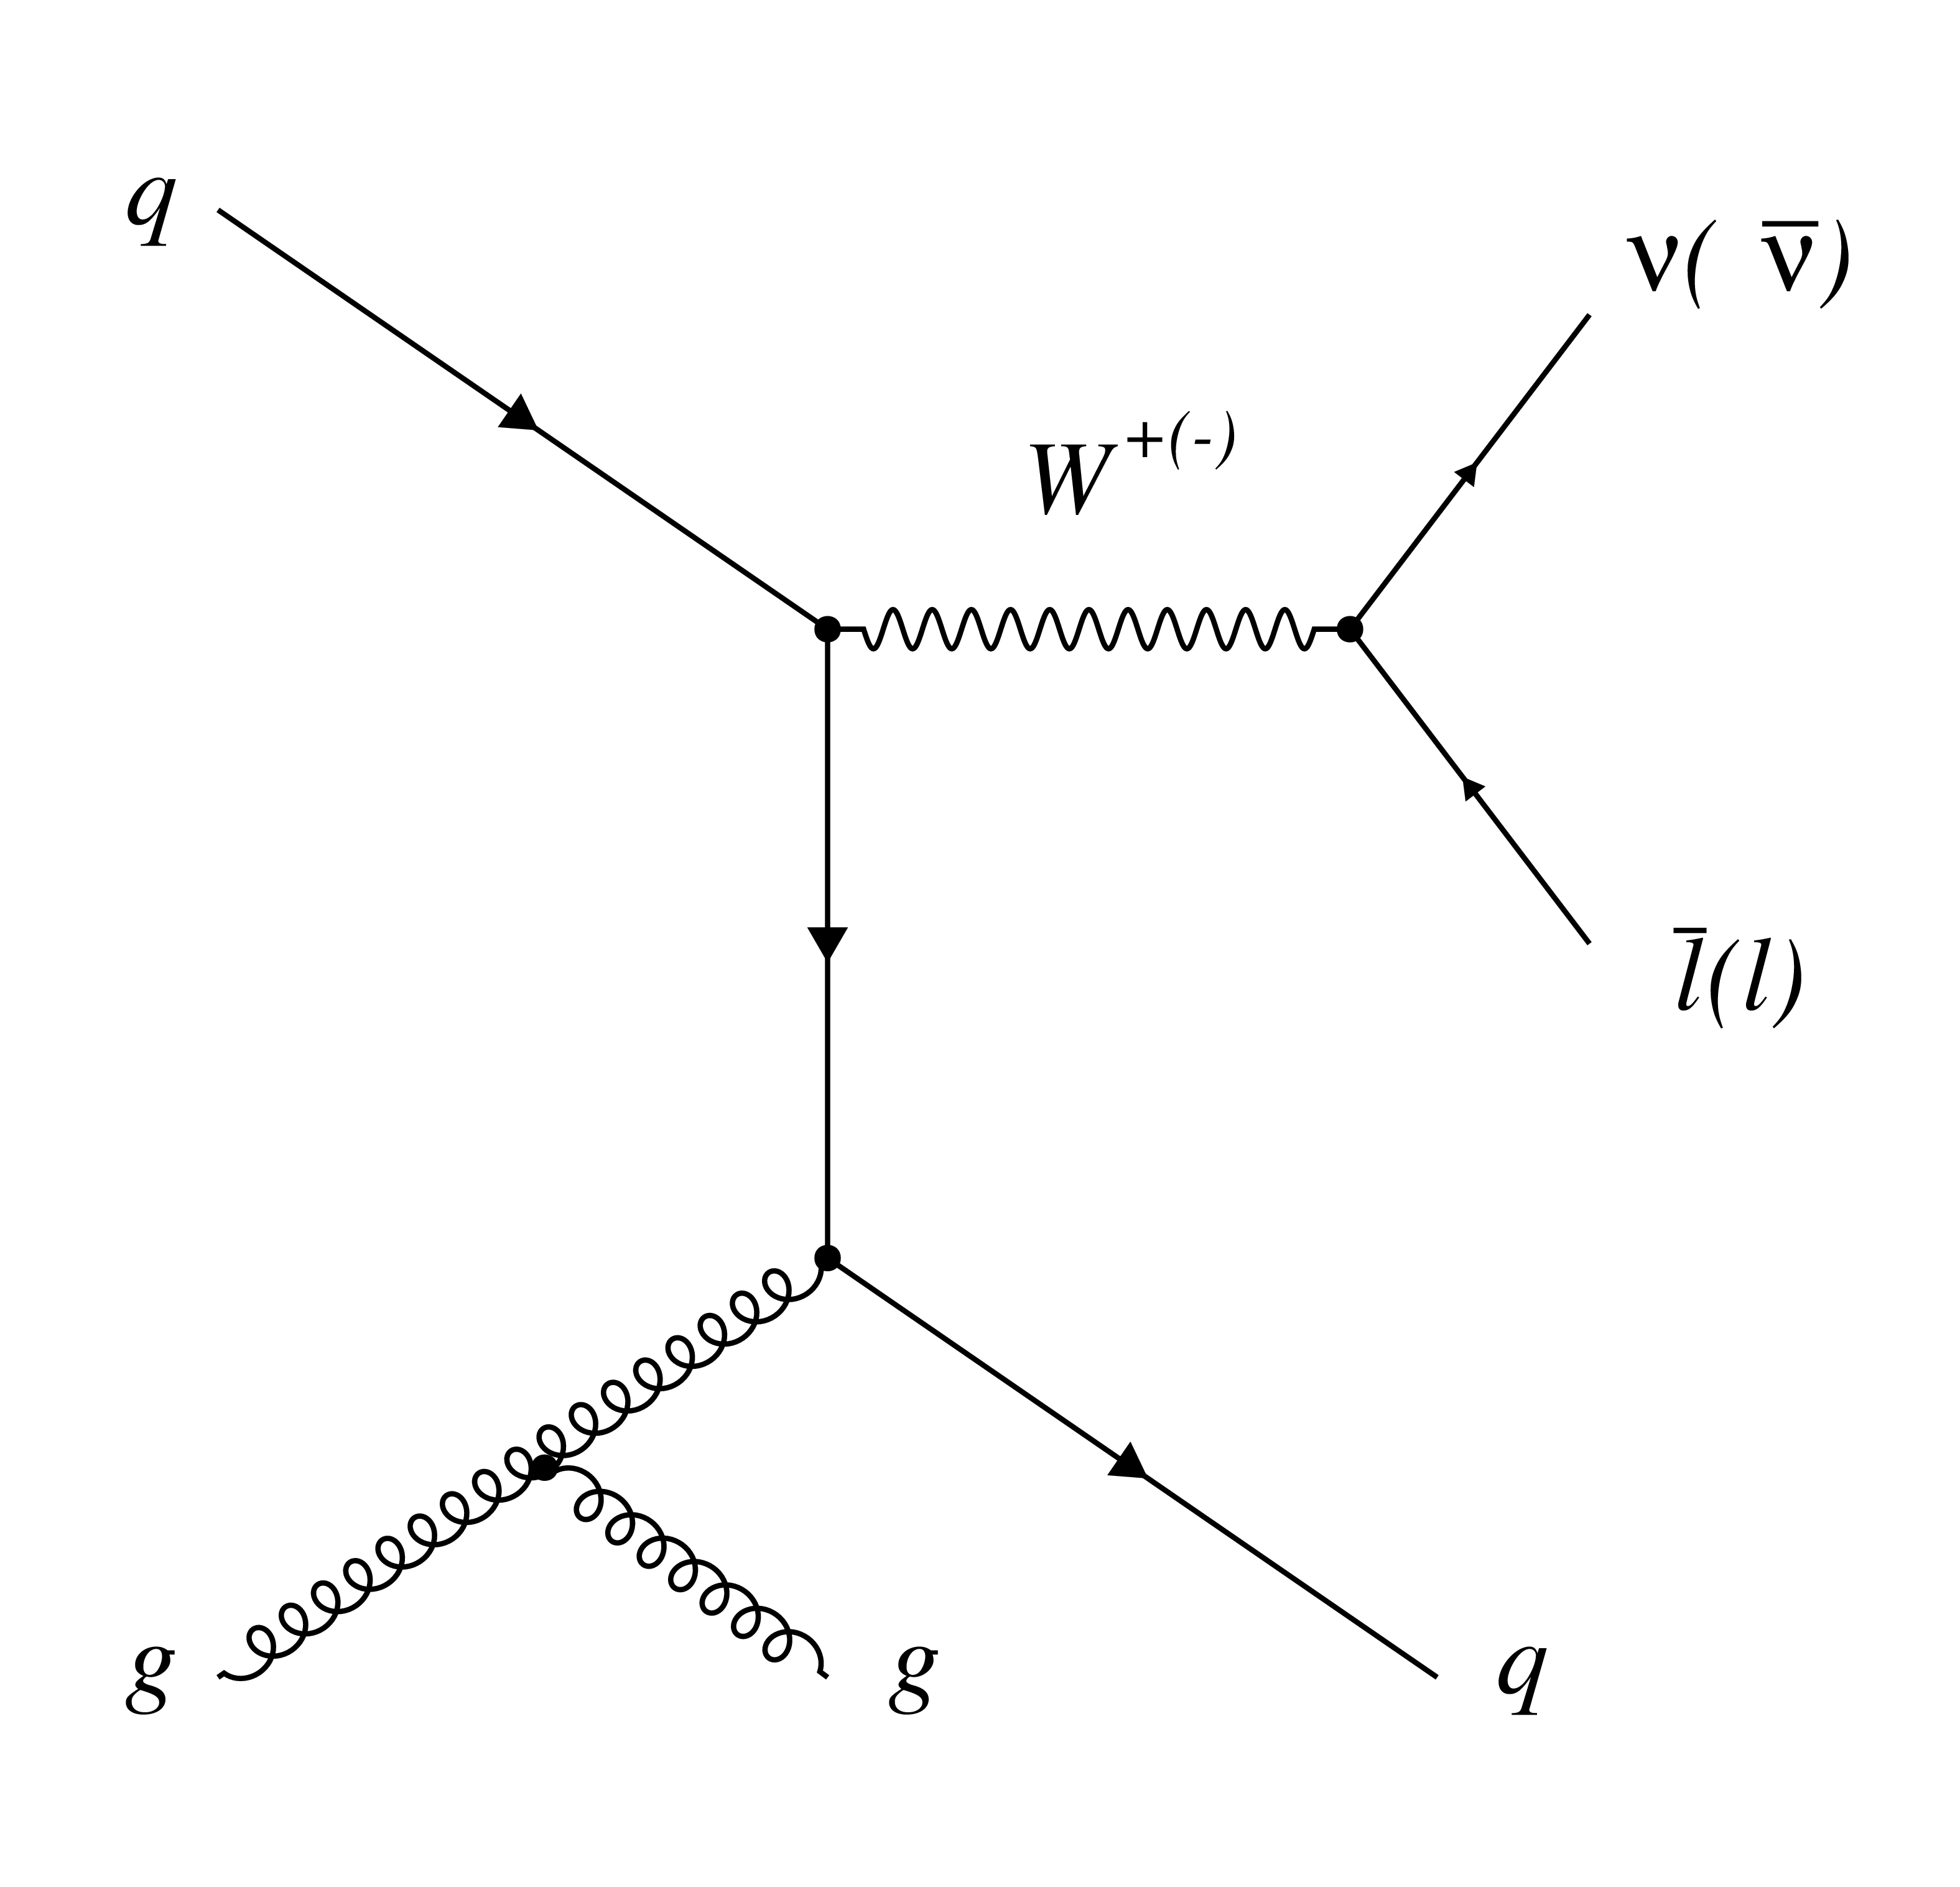
Figure 1-b:
Feynman diagrams for W + 2-jet production from (left) double parton scattering and (right) single parton scattering. |

png pdf |
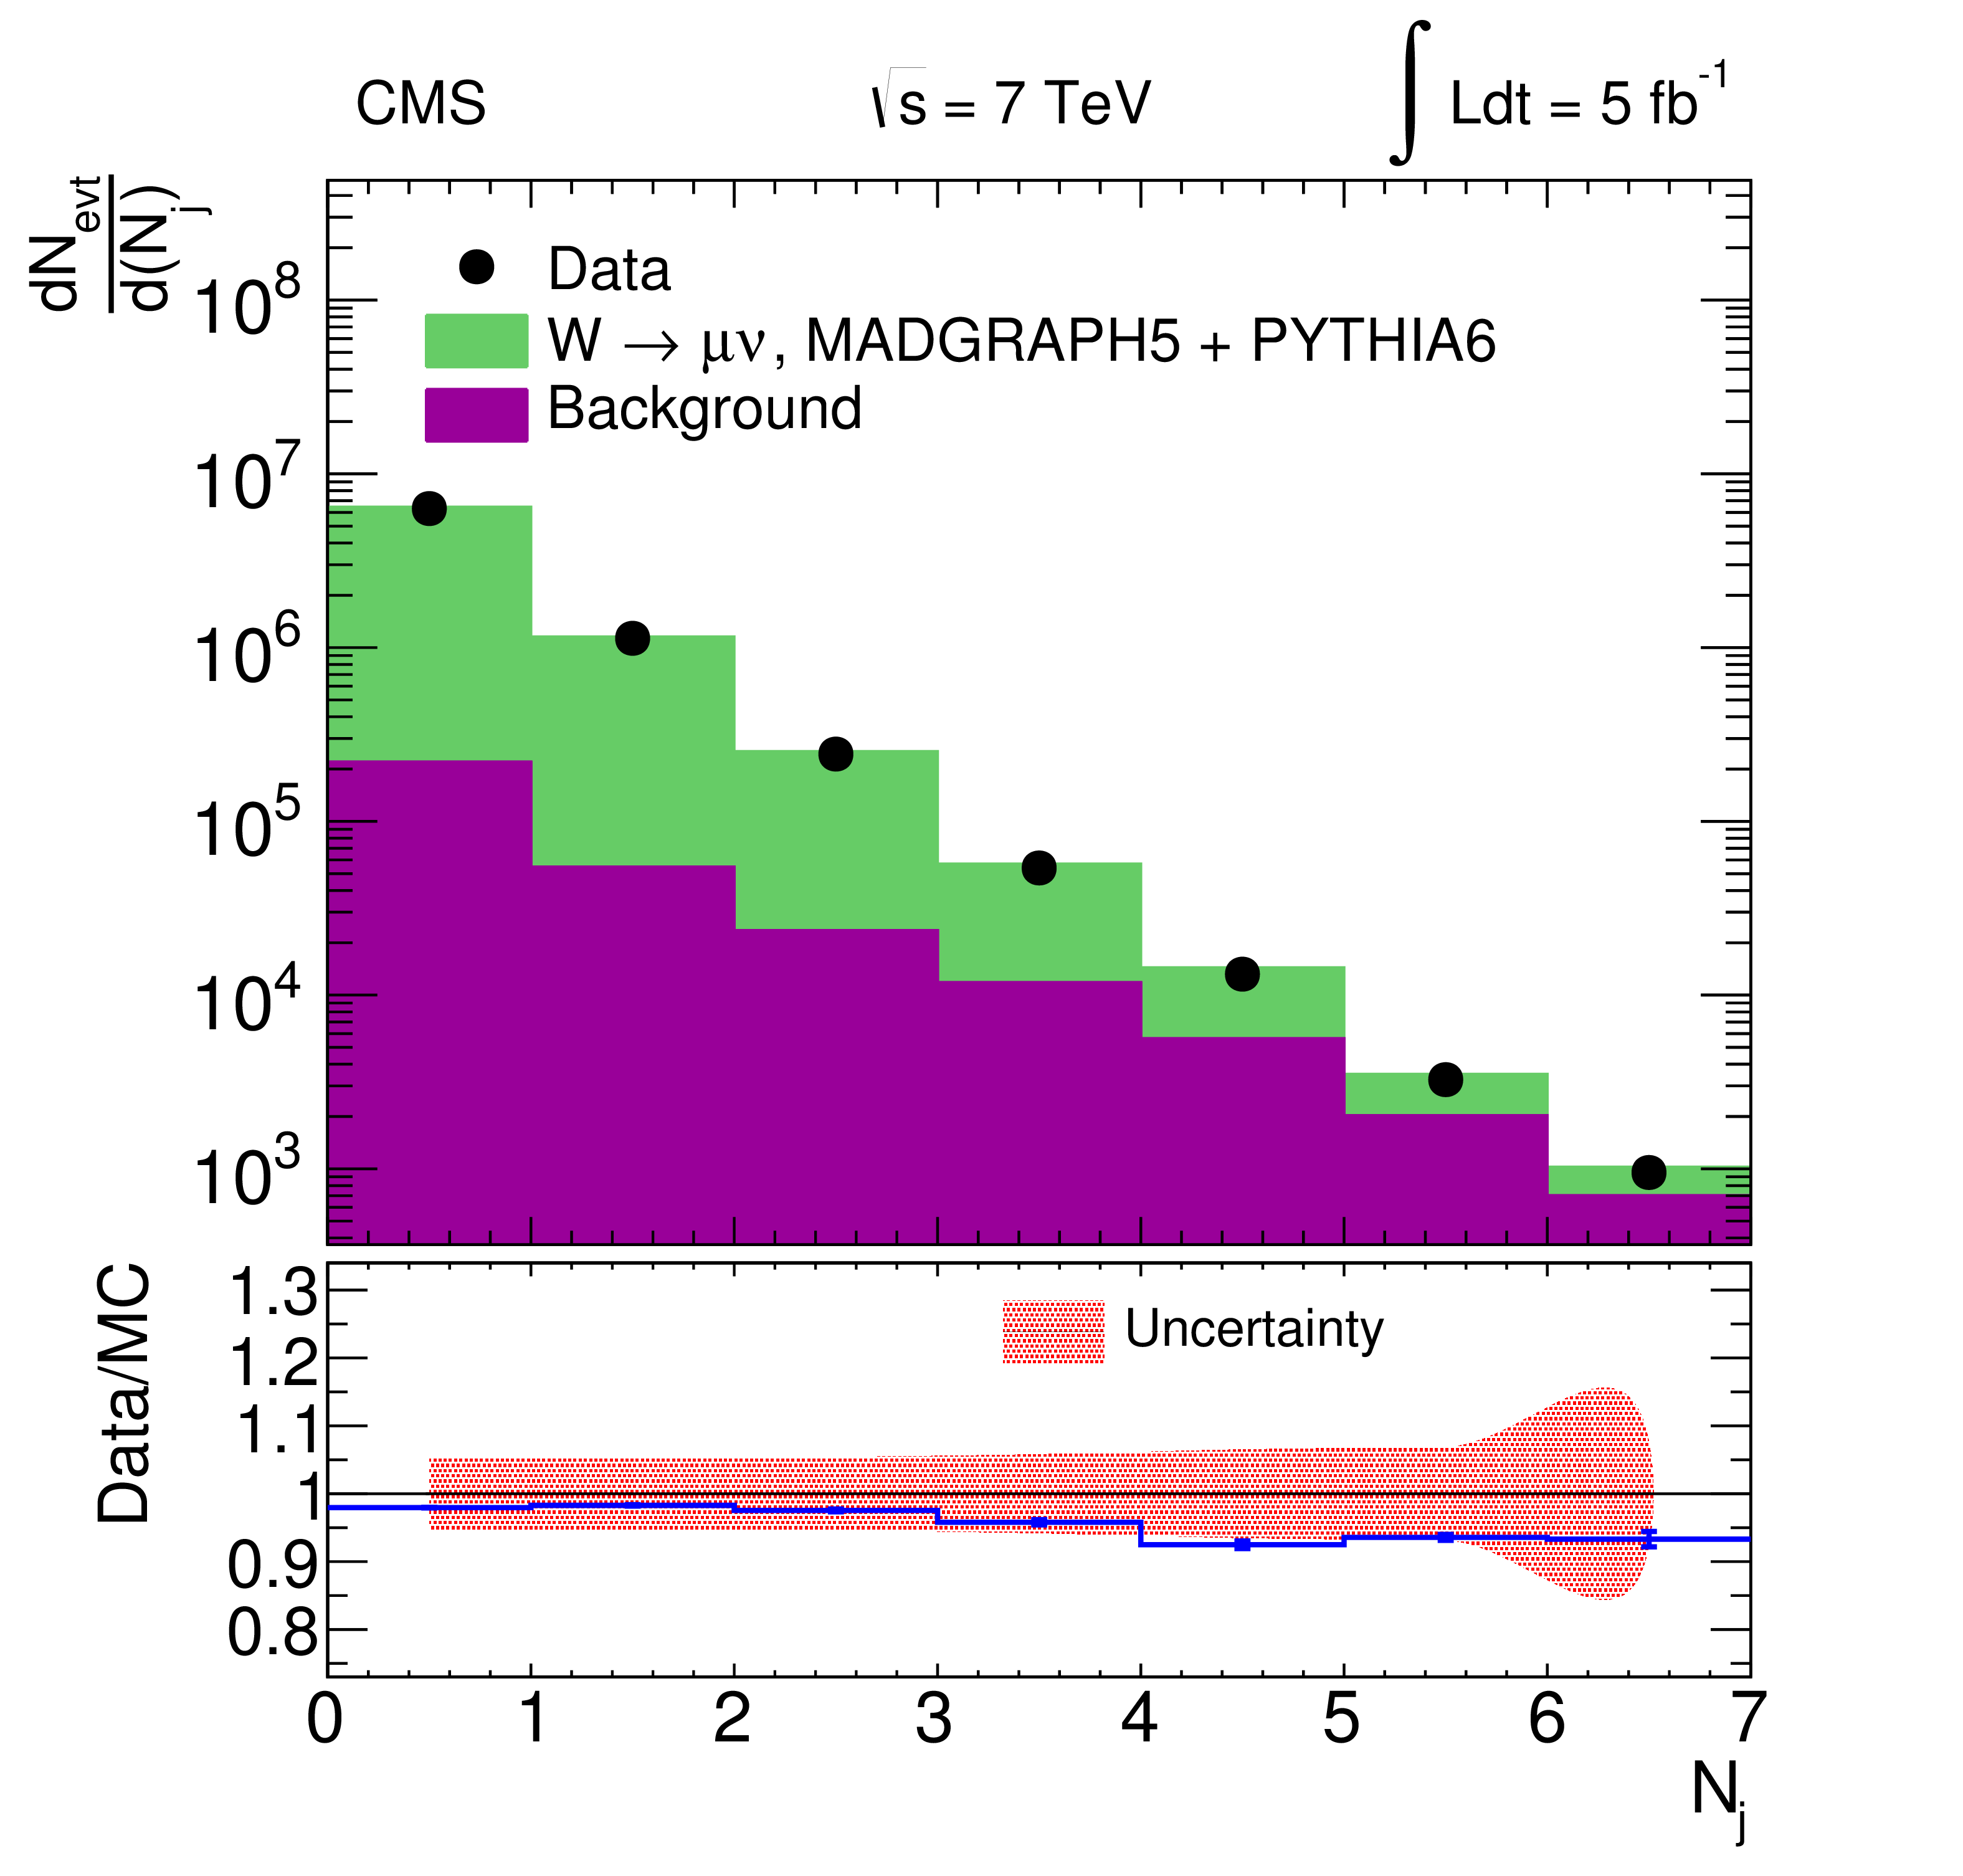
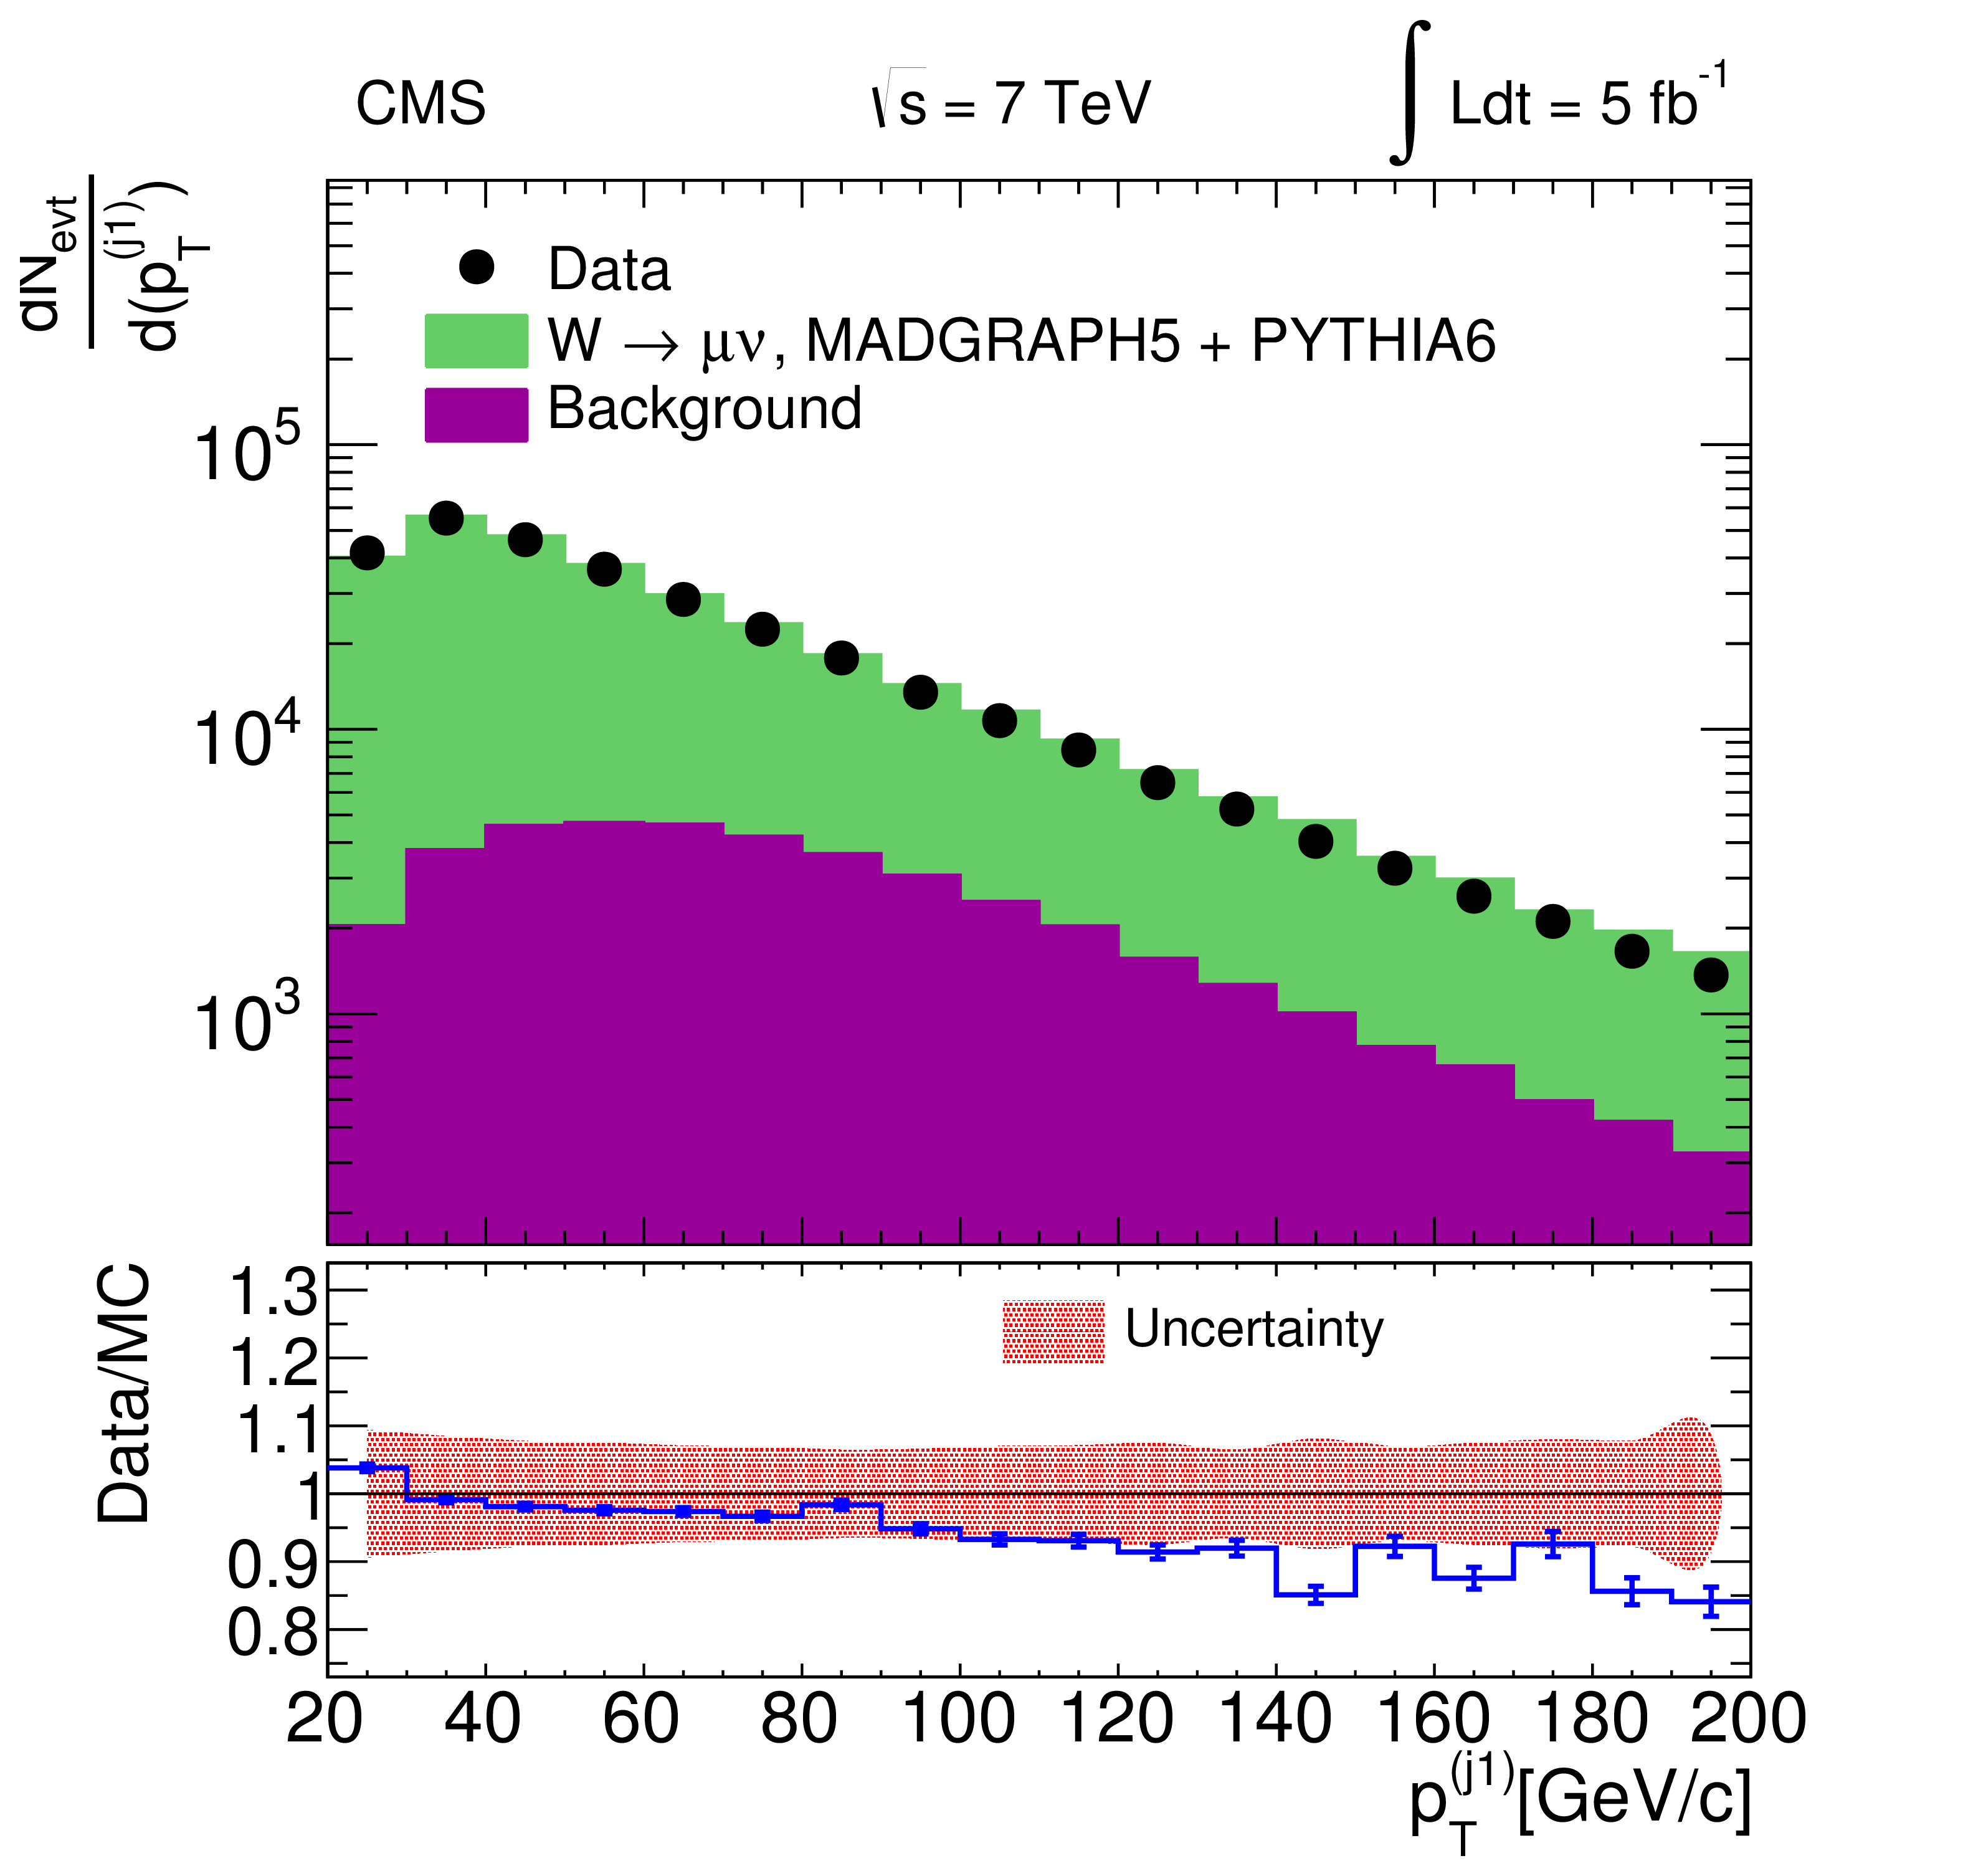
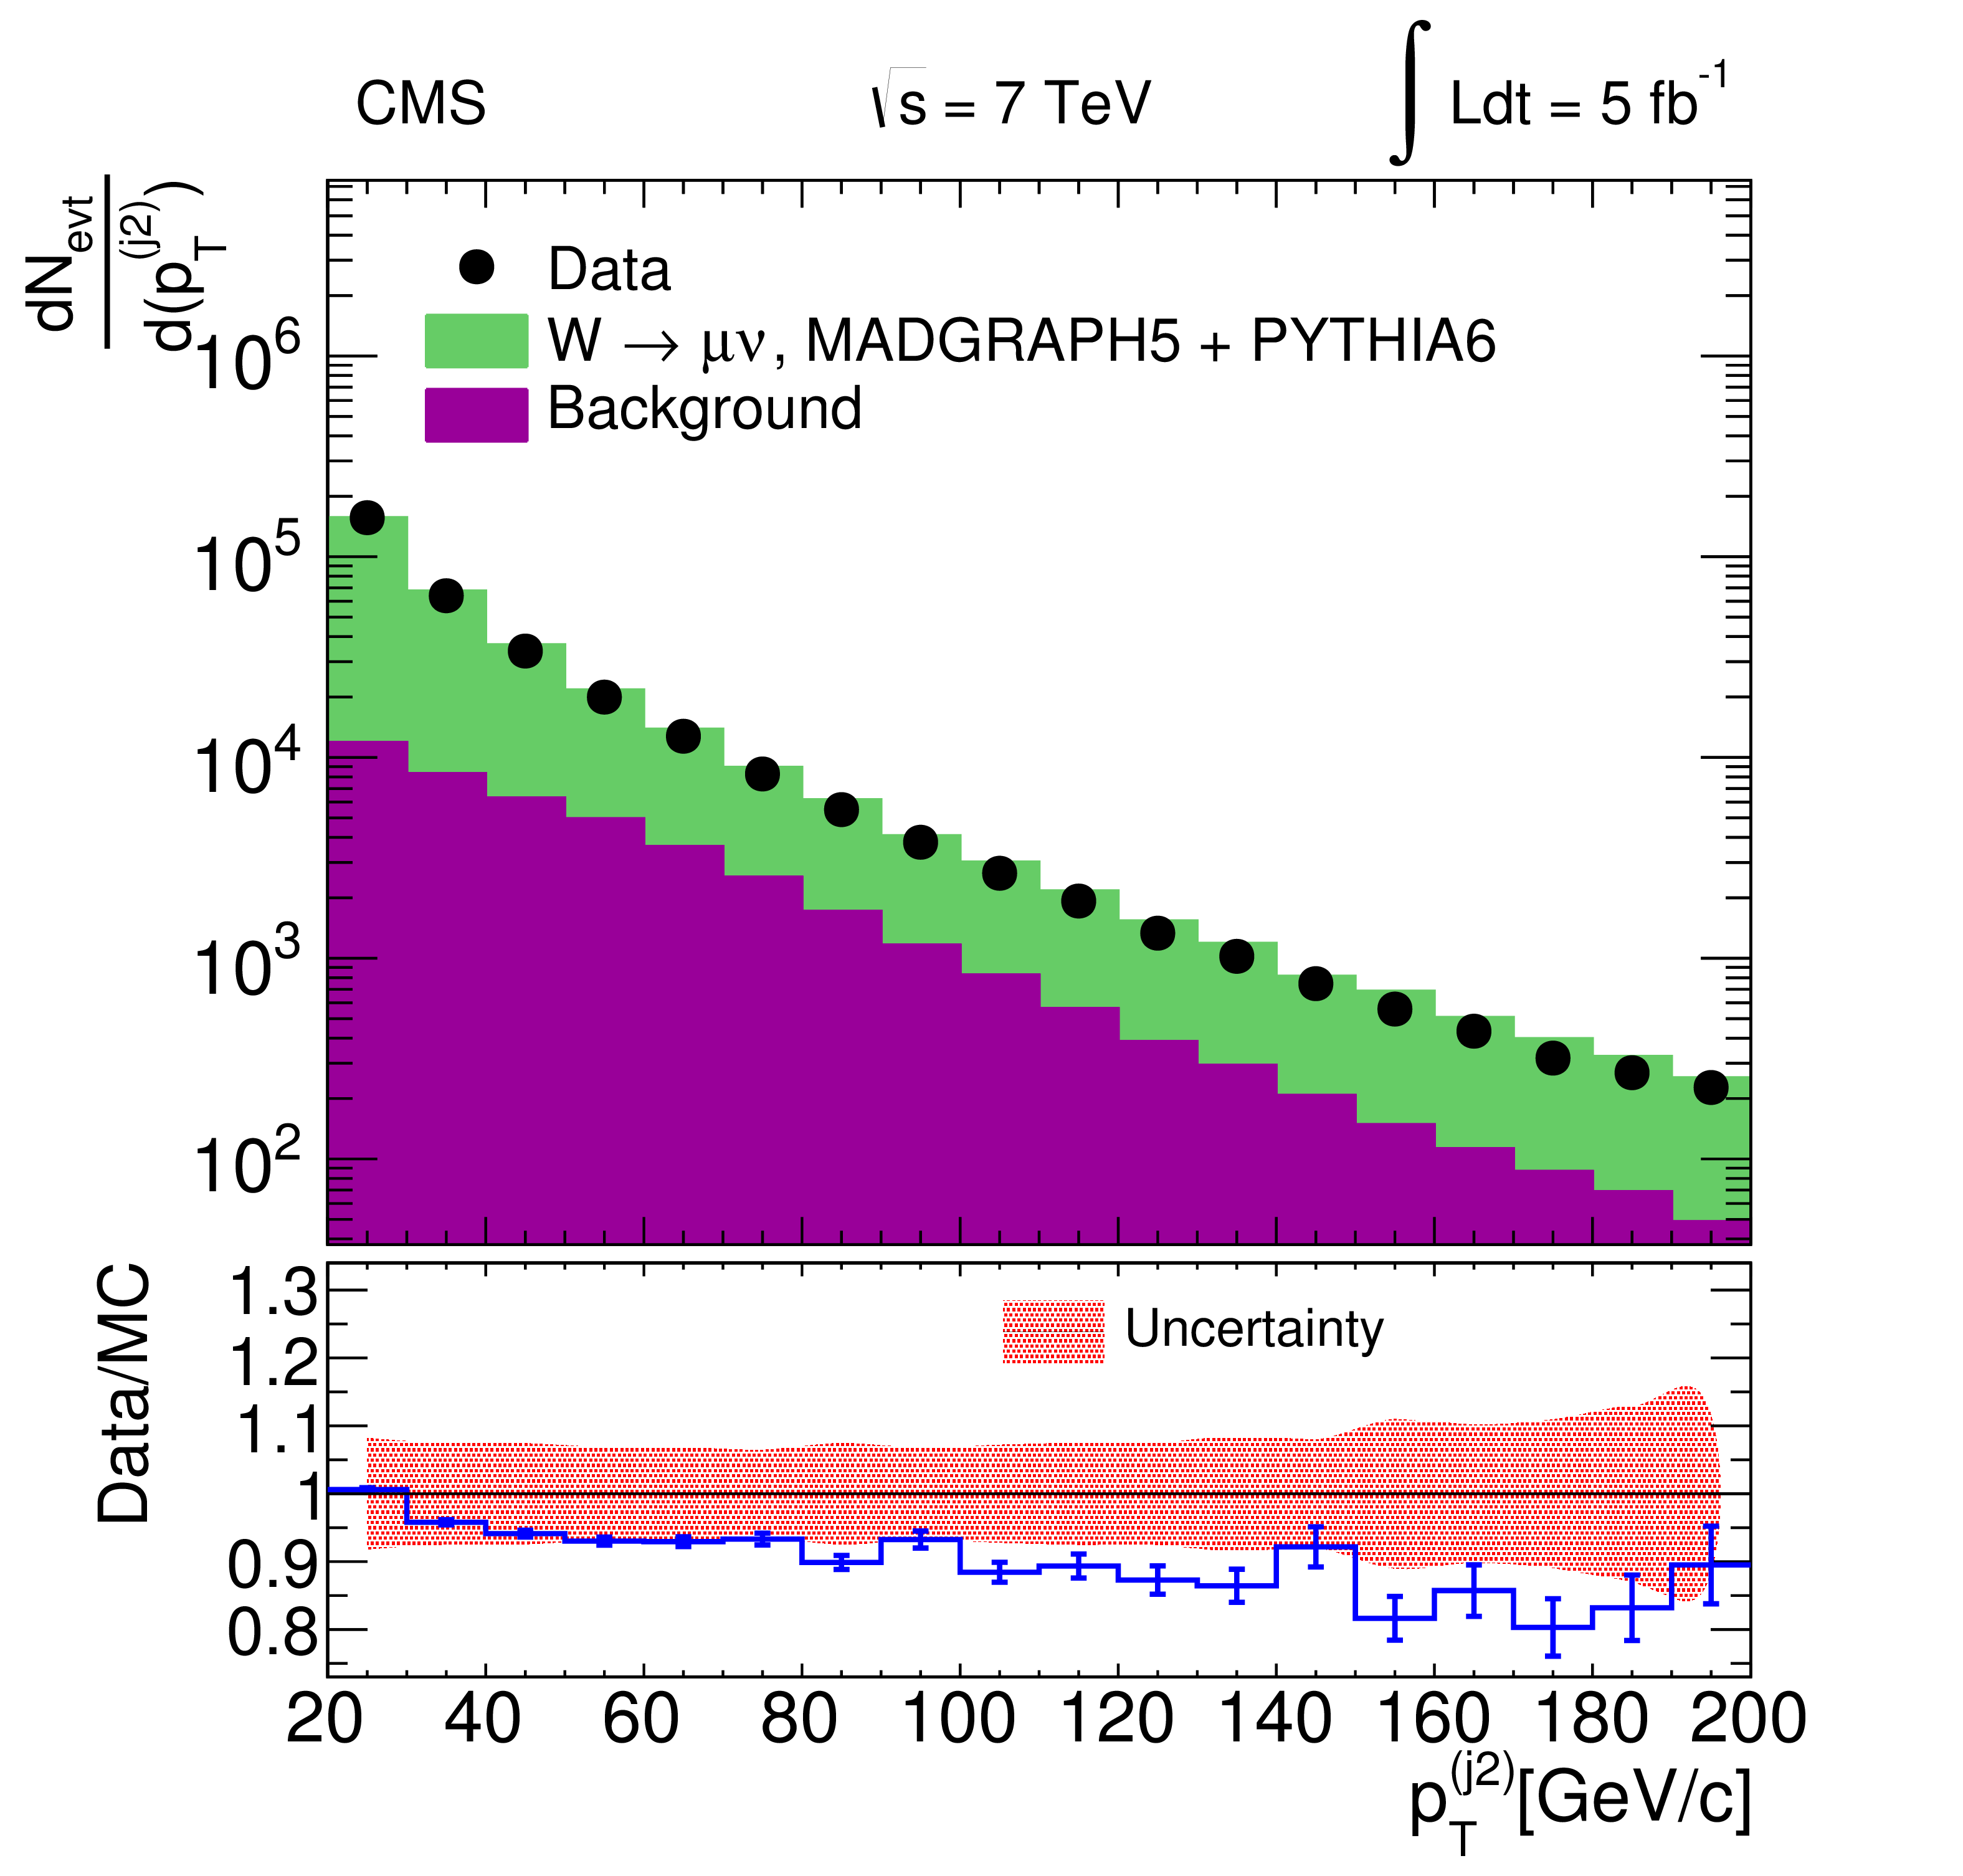
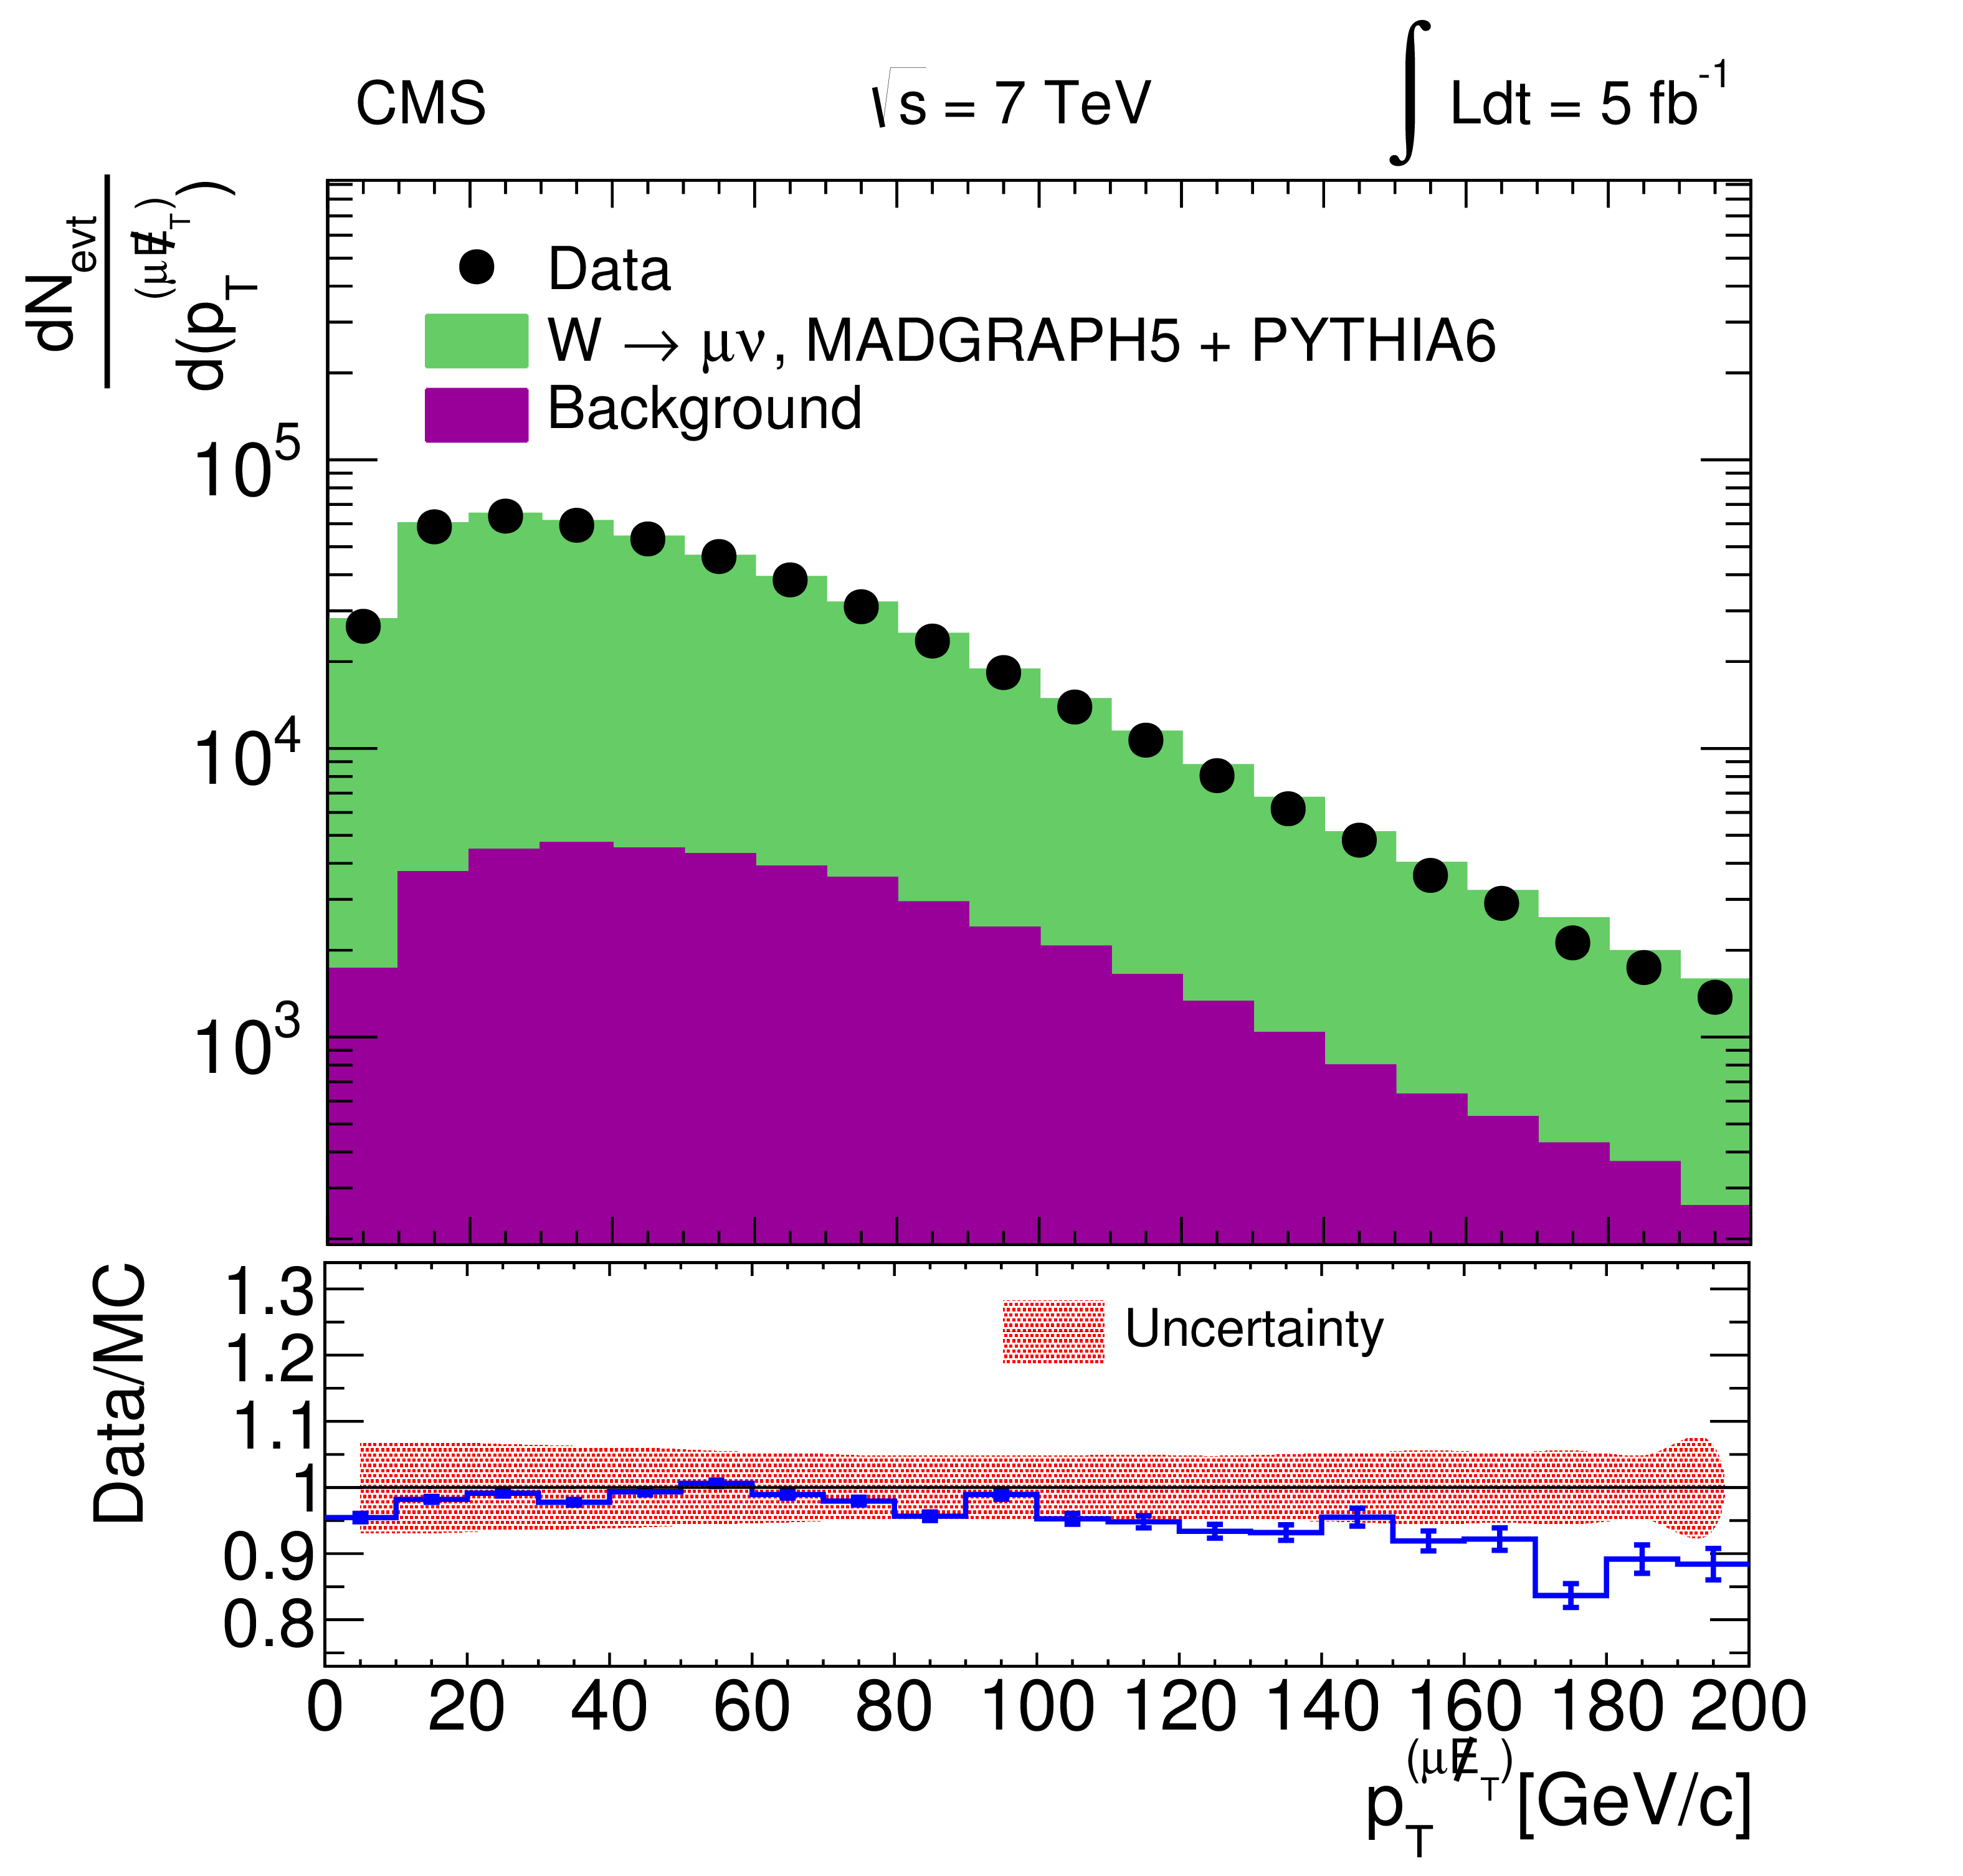
Figure 2:
Detector-level comparison of data with MC simulations for the multiplicity (top left) of jets (N$_{ {\mathrm {j}} }$) with ${ {p_{\mathrm {T}}} } > $ 20 GeV/$c$ and $ {| \eta | } < $ 2.0. Data and simulations for the sample with exactly two jets are plotted as a function of the $ {p_{\mathrm {T}}} $ of the leading (top right) and subleading (lower left) jets, as well as of the magnitude of the vector sum of the muon $ {p_{\mathrm {T}}} $ and ${E_{\mathrm {T}}}$ (lower right). The background distribution represents the sum of the contributions of Drell-Yan, $\mathrm{ W } \rightarrow \tau \nu $, diboson, multijet, $\mathrm{ t \bar{t} } $, and single-top-quark processes. The bottom panels show the ratio of the data and simulated distributions. The band shows the total uncertainty, with the contributions of the jet energy scale uncertainty and the statistical uncertainties of the MC samples added in quadrature. The error bars on the ratio histogram represent the statistical uncertainty of the data and the simulated samples added in quadrature. |
png pdf |
Figure 2-a:
Detector-level comparison of data with MC simulations for the multiplicity (top left) of jets (N$_{ {\mathrm {j}} }$) with ${ {p_{\mathrm {T}}} } > $ 20 GeV/$c$ and $ {| \eta | } < $ 2.0. Data and simulations for the sample with exactly two jets are plotted as a function of the $ {p_{\mathrm {T}}} $ of the leading (top right) and subleading (lower left) jets, as well as of the magnitude of the vector sum of the muon $ {p_{\mathrm {T}}} $ and ${E_{\mathrm {T}}}$ (lower right). The background distribution represents the sum of the contributions of Drell-Yan, $\mathrm{ W } \rightarrow \tau \nu $, diboson, multijet, $\mathrm{ t \bar{t} } $, and single-top-quark processes. The bottom panels show the ratio of the data and simulated distributions. The band shows the total uncertainty, with the contributions of the jet energy scale uncertainty and the statistical uncertainties of the MC samples added in quadrature. The error bars on the ratio histogram represent the statistical uncertainty of the data and the simulated samples added in quadrature. |
png pdf |
Figure 2-b:
Detector-level comparison of data with MC simulations for the multiplicity (top left) of jets (N$_{ {\mathrm {j}} }$) with ${ {p_{\mathrm {T}}} } > $ 20 GeV/$c$ and $ {| \eta | } < $ 2.0. Data and simulations for the sample with exactly two jets are plotted as a function of the $ {p_{\mathrm {T}}} $ of the leading (top right) and subleading (lower left) jets, as well as of the magnitude of the vector sum of the muon $ {p_{\mathrm {T}}} $ and ${E_{\mathrm {T}}}$ (lower right). The background distribution represents the sum of the contributions of Drell-Yan, $\mathrm{ W } \rightarrow \tau \nu $, diboson, multijet, $\mathrm{ t \bar{t} } $, and single-top-quark processes. The bottom panels show the ratio of the data and simulated distributions. The band shows the total uncertainty, with the contributions of the jet energy scale uncertainty and the statistical uncertainties of the MC samples added in quadrature. The error bars on the ratio histogram represent the statistical uncertainty of the data and the simulated samples added in quadrature. |
png pdf |
Figure 2-c:
Detector-level comparison of data with MC simulations for the multiplicity (top left) of jets (N$_{ {\mathrm {j}} }$) with ${ {p_{\mathrm {T}}} } > $ 20 GeV/$c$ and $ {| \eta | } < $ 2.0. Data and simulations for the sample with exactly two jets are plotted as a function of the $ {p_{\mathrm {T}}} $ of the leading (top right) and subleading (lower left) jets, as well as of the magnitude of the vector sum of the muon $ {p_{\mathrm {T}}} $ and ${E_{\mathrm {T}}}$ (lower right). The background distribution represents the sum of the contributions of Drell-Yan, $\mathrm{ W } \rightarrow \tau \nu $, diboson, multijet, $\mathrm{ t \bar{t} } $, and single-top-quark processes. The bottom panels show the ratio of the data and simulated distributions. The band shows the total uncertainty, with the contributions of the jet energy scale uncertainty and the statistical uncertainties of the MC samples added in quadrature. The error bars on the ratio histogram represent the statistical uncertainty of the data and the simulated samples added in quadrature. |
png pdf |
Figure 2-d:
Detector-level comparison of data with MC simulations for the multiplicity (top left) of jets (N$_{ {\mathrm {j}} }$) with ${ {p_{\mathrm {T}}} } > $ 20 GeV/$c$ and $ {| \eta | } < $ 2.0. Data and simulations for the sample with exactly two jets are plotted as a function of the $ {p_{\mathrm {T}}} $ of the leading (top right) and subleading (lower left) jets, as well as of the magnitude of the vector sum of the muon $ {p_{\mathrm {T}}} $ and ${E_{\mathrm {T}}}$ (lower right). The background distribution represents the sum of the contributions of Drell-Yan, $\mathrm{ W } \rightarrow \tau \nu $, diboson, multijet, $\mathrm{ t \bar{t} } $, and single-top-quark processes. The bottom panels show the ratio of the data and simulated distributions. The band shows the total uncertainty, with the contributions of the jet energy scale uncertainty and the statistical uncertainties of the MC samples added in quadrature. The error bars on the ratio histogram represent the statistical uncertainty of the data and the simulated samples added in quadrature. |

png pdf |
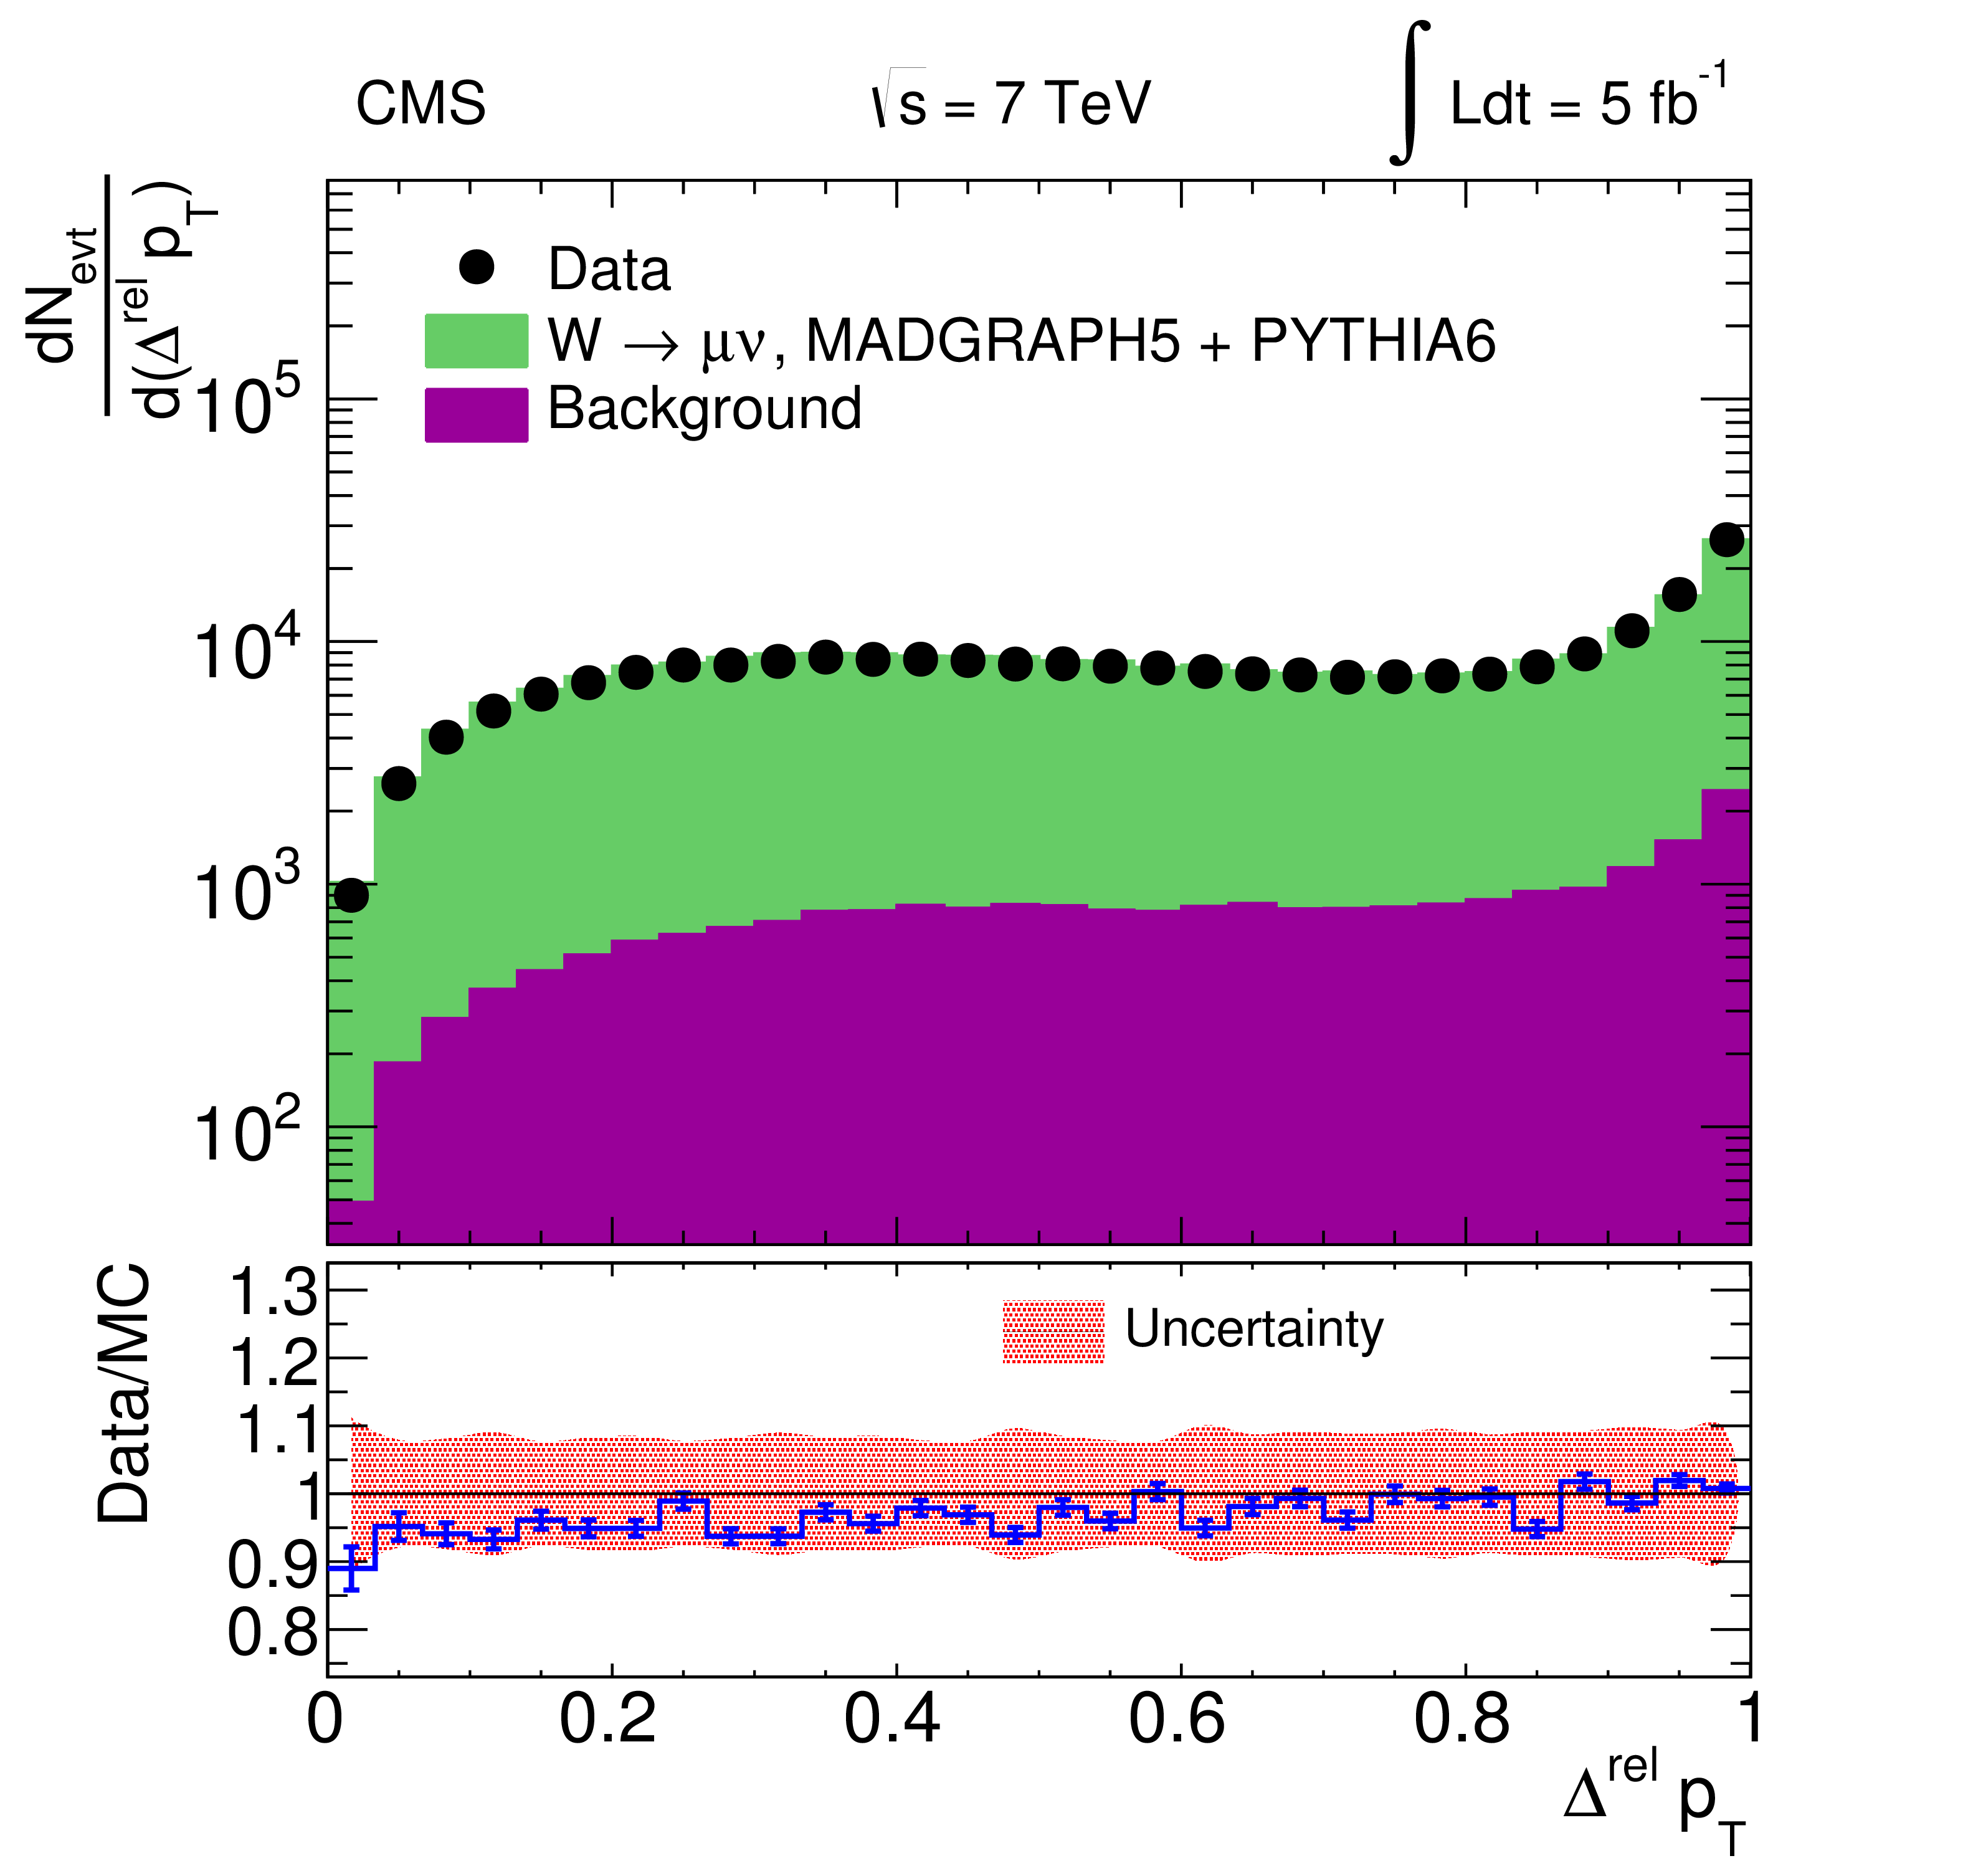
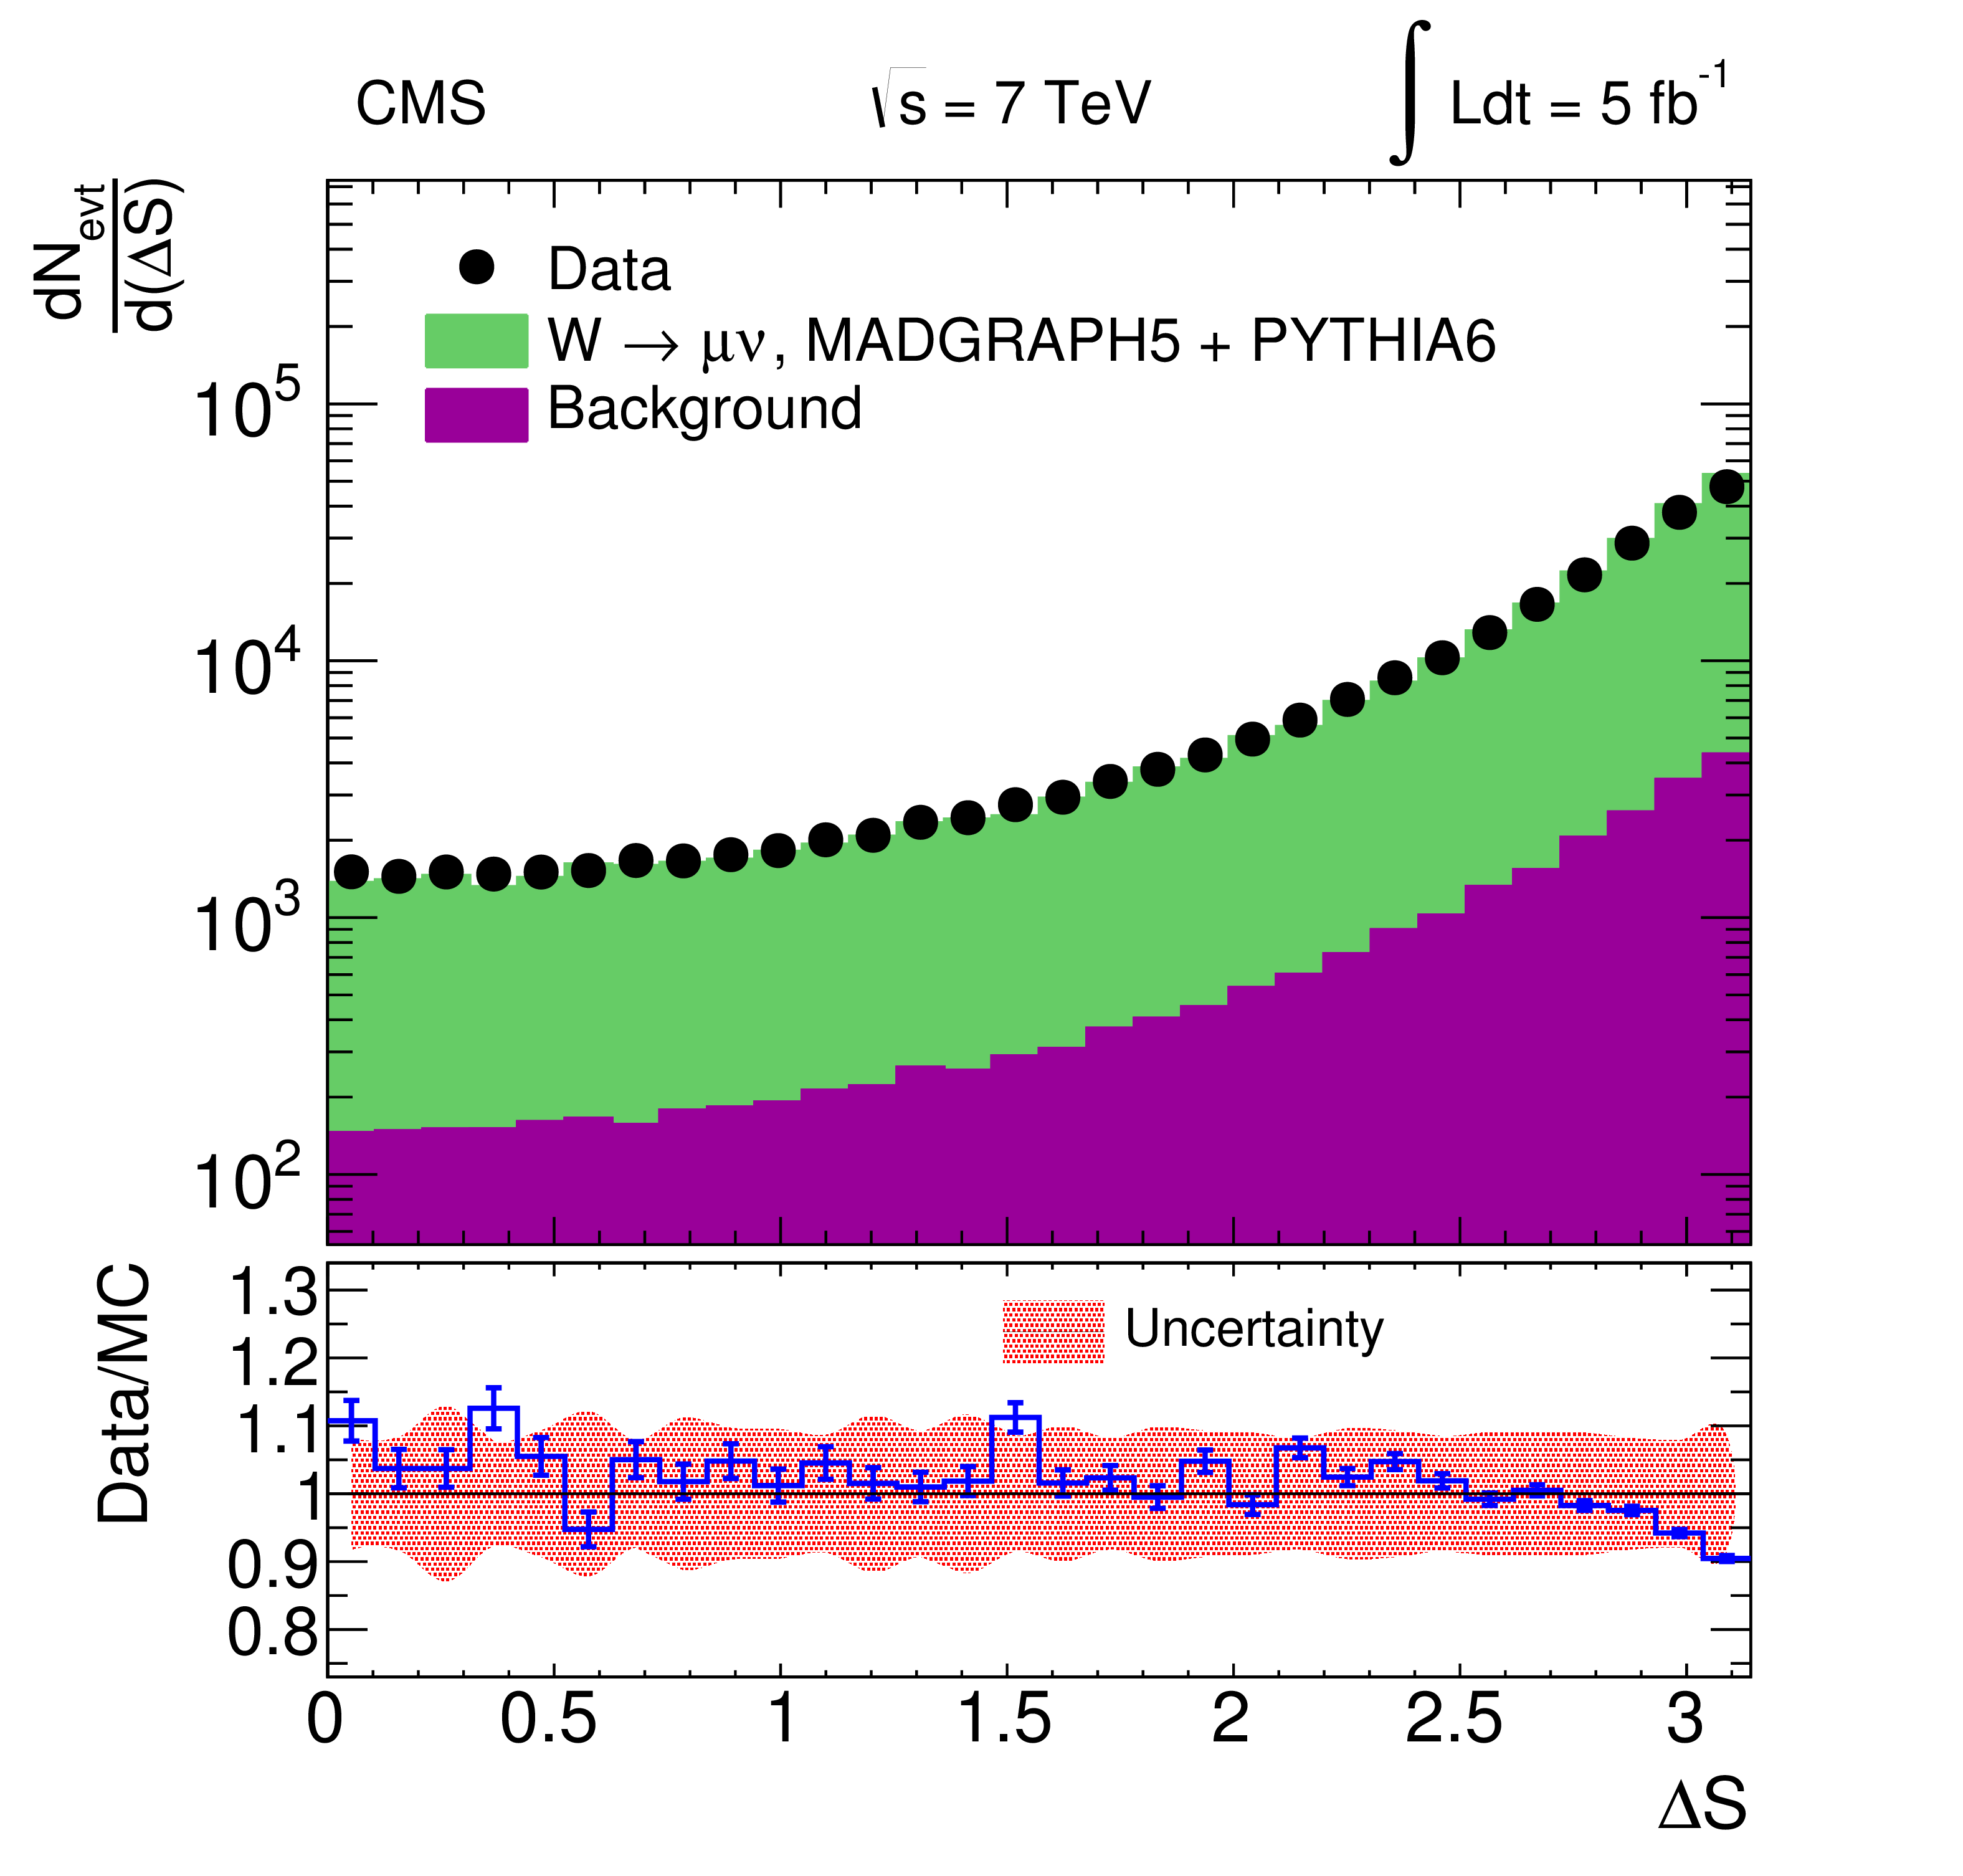
Figure 3:
Comparison of data with MC simulations at detector level for the DPS-sensitive observables $\Delta ^\text {rel} {p_{\mathrm {T}}} $ (left), and $ {\Delta \mathrm {S}} $ (right). The background distribution represents the sum of the contributions of Drell-Yan, W $\rightarrow \tau \nu $, diboson, multijet, $\mathrm{ t \bar{t} } $, and single-top-quark processes. The bottom panels show the ratio of the data and simulated distributions. The band shows the total uncertainty, with the contributions of the jet energy scale uncertainty and the statistical uncertainties of the MC samples added in quadrature. The error bars on the ratio histogram represent the statistical uncertainty of the data and the simulated samples added in quadrature. |
png pdf |
Figure 3-a:
Comparison of data with MC simulations at detector level for the DPS-sensitive observables $\Delta ^\text {rel} {p_{\mathrm {T}}} $ (left), and $ {\Delta \mathrm {S}} $ (right). The background distribution represents the sum of the contributions of Drell-Yan, W $\rightarrow \tau \nu $, diboson, multijet, $\mathrm{ t \bar{t} } $, and single-top-quark processes. The bottom panels show the ratio of the data and simulated distributions. The band shows the total uncertainty, with the contributions of the jet energy scale uncertainty and the statistical uncertainties of the MC samples added in quadrature. The error bars on the ratio histogram represent the statistical uncertainty of the data and the simulated samples added in quadrature. |
png pdf |
Figure 3-b:
Comparison of data with MC simulations at detector level for the DPS-sensitive observables $\Delta ^\text {rel} {p_{\mathrm {T}}} $ (left), and $ {\Delta \mathrm {S}} $ (right). The background distribution represents the sum of the contributions of Drell-Yan, W $\rightarrow \tau \nu $, diboson, multijet, $\mathrm{ t \bar{t} } $, and single-top-quark processes. The bottom panels show the ratio of the data and simulated distributions. The band shows the total uncertainty, with the contributions of the jet energy scale uncertainty and the statistical uncertainties of the MC samples added in quadrature. The error bars on the ratio histogram represent the statistical uncertainty of the data and the simulated samples added in quadrature. |
png pdf |
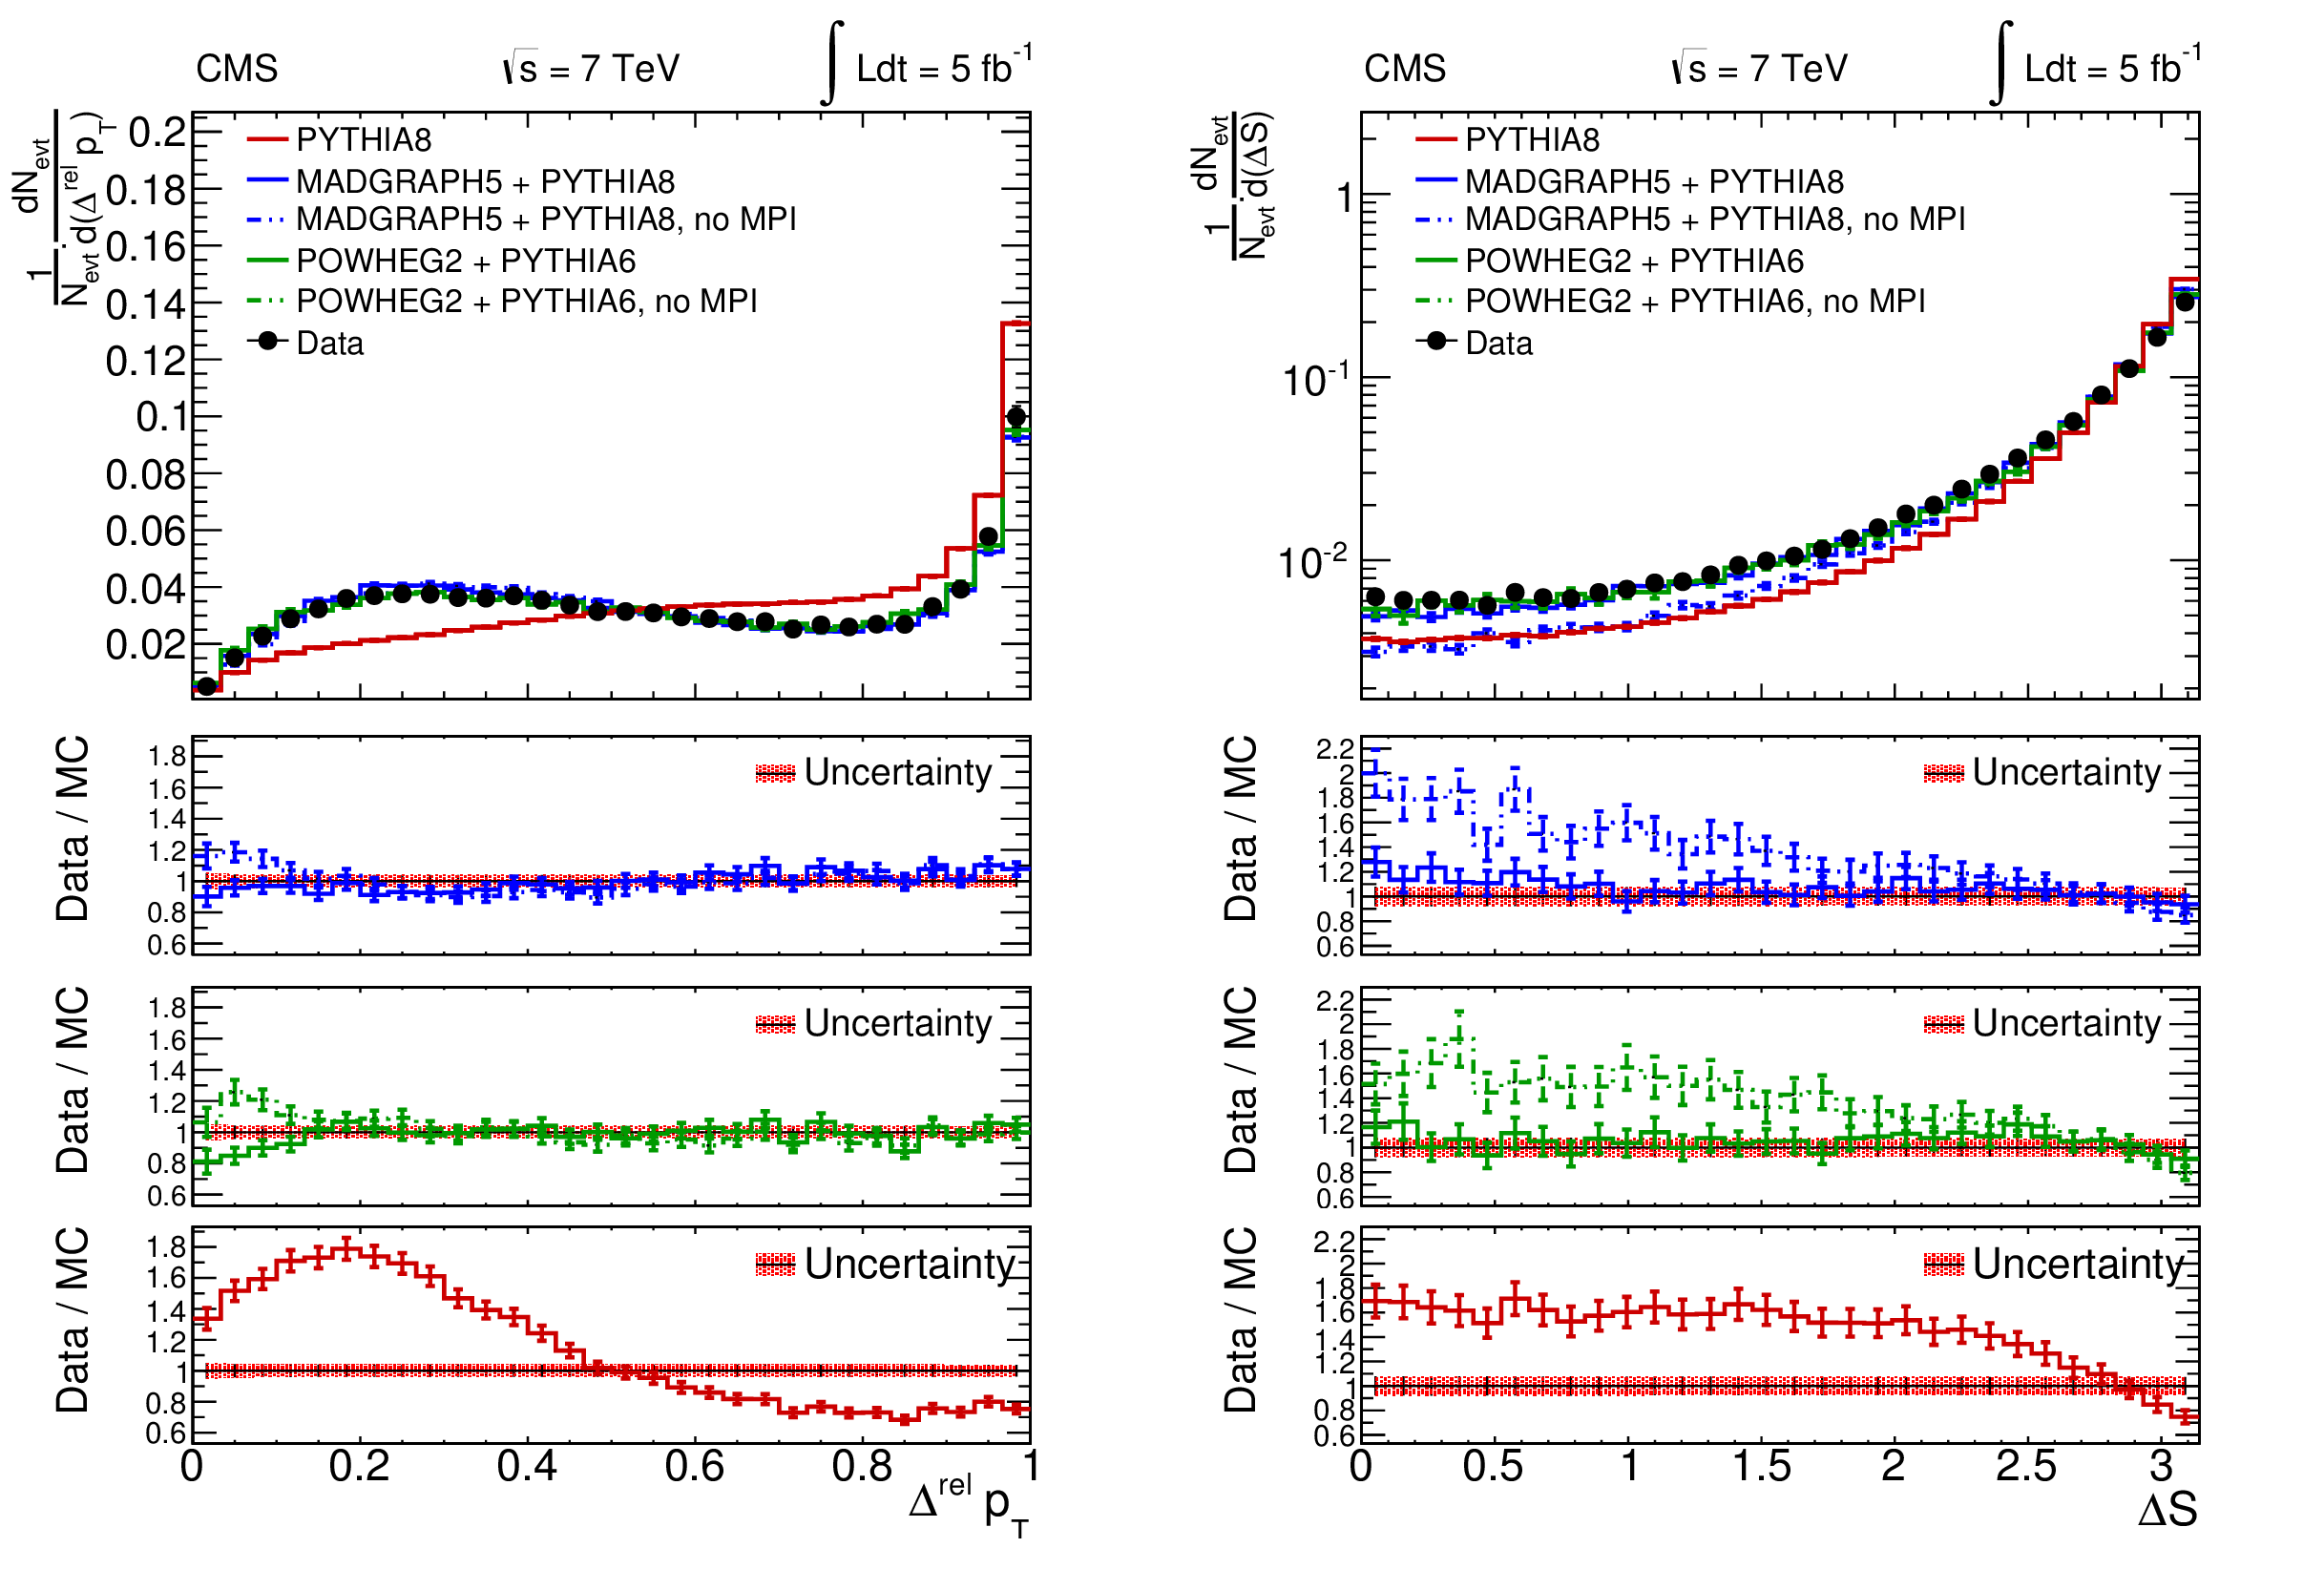
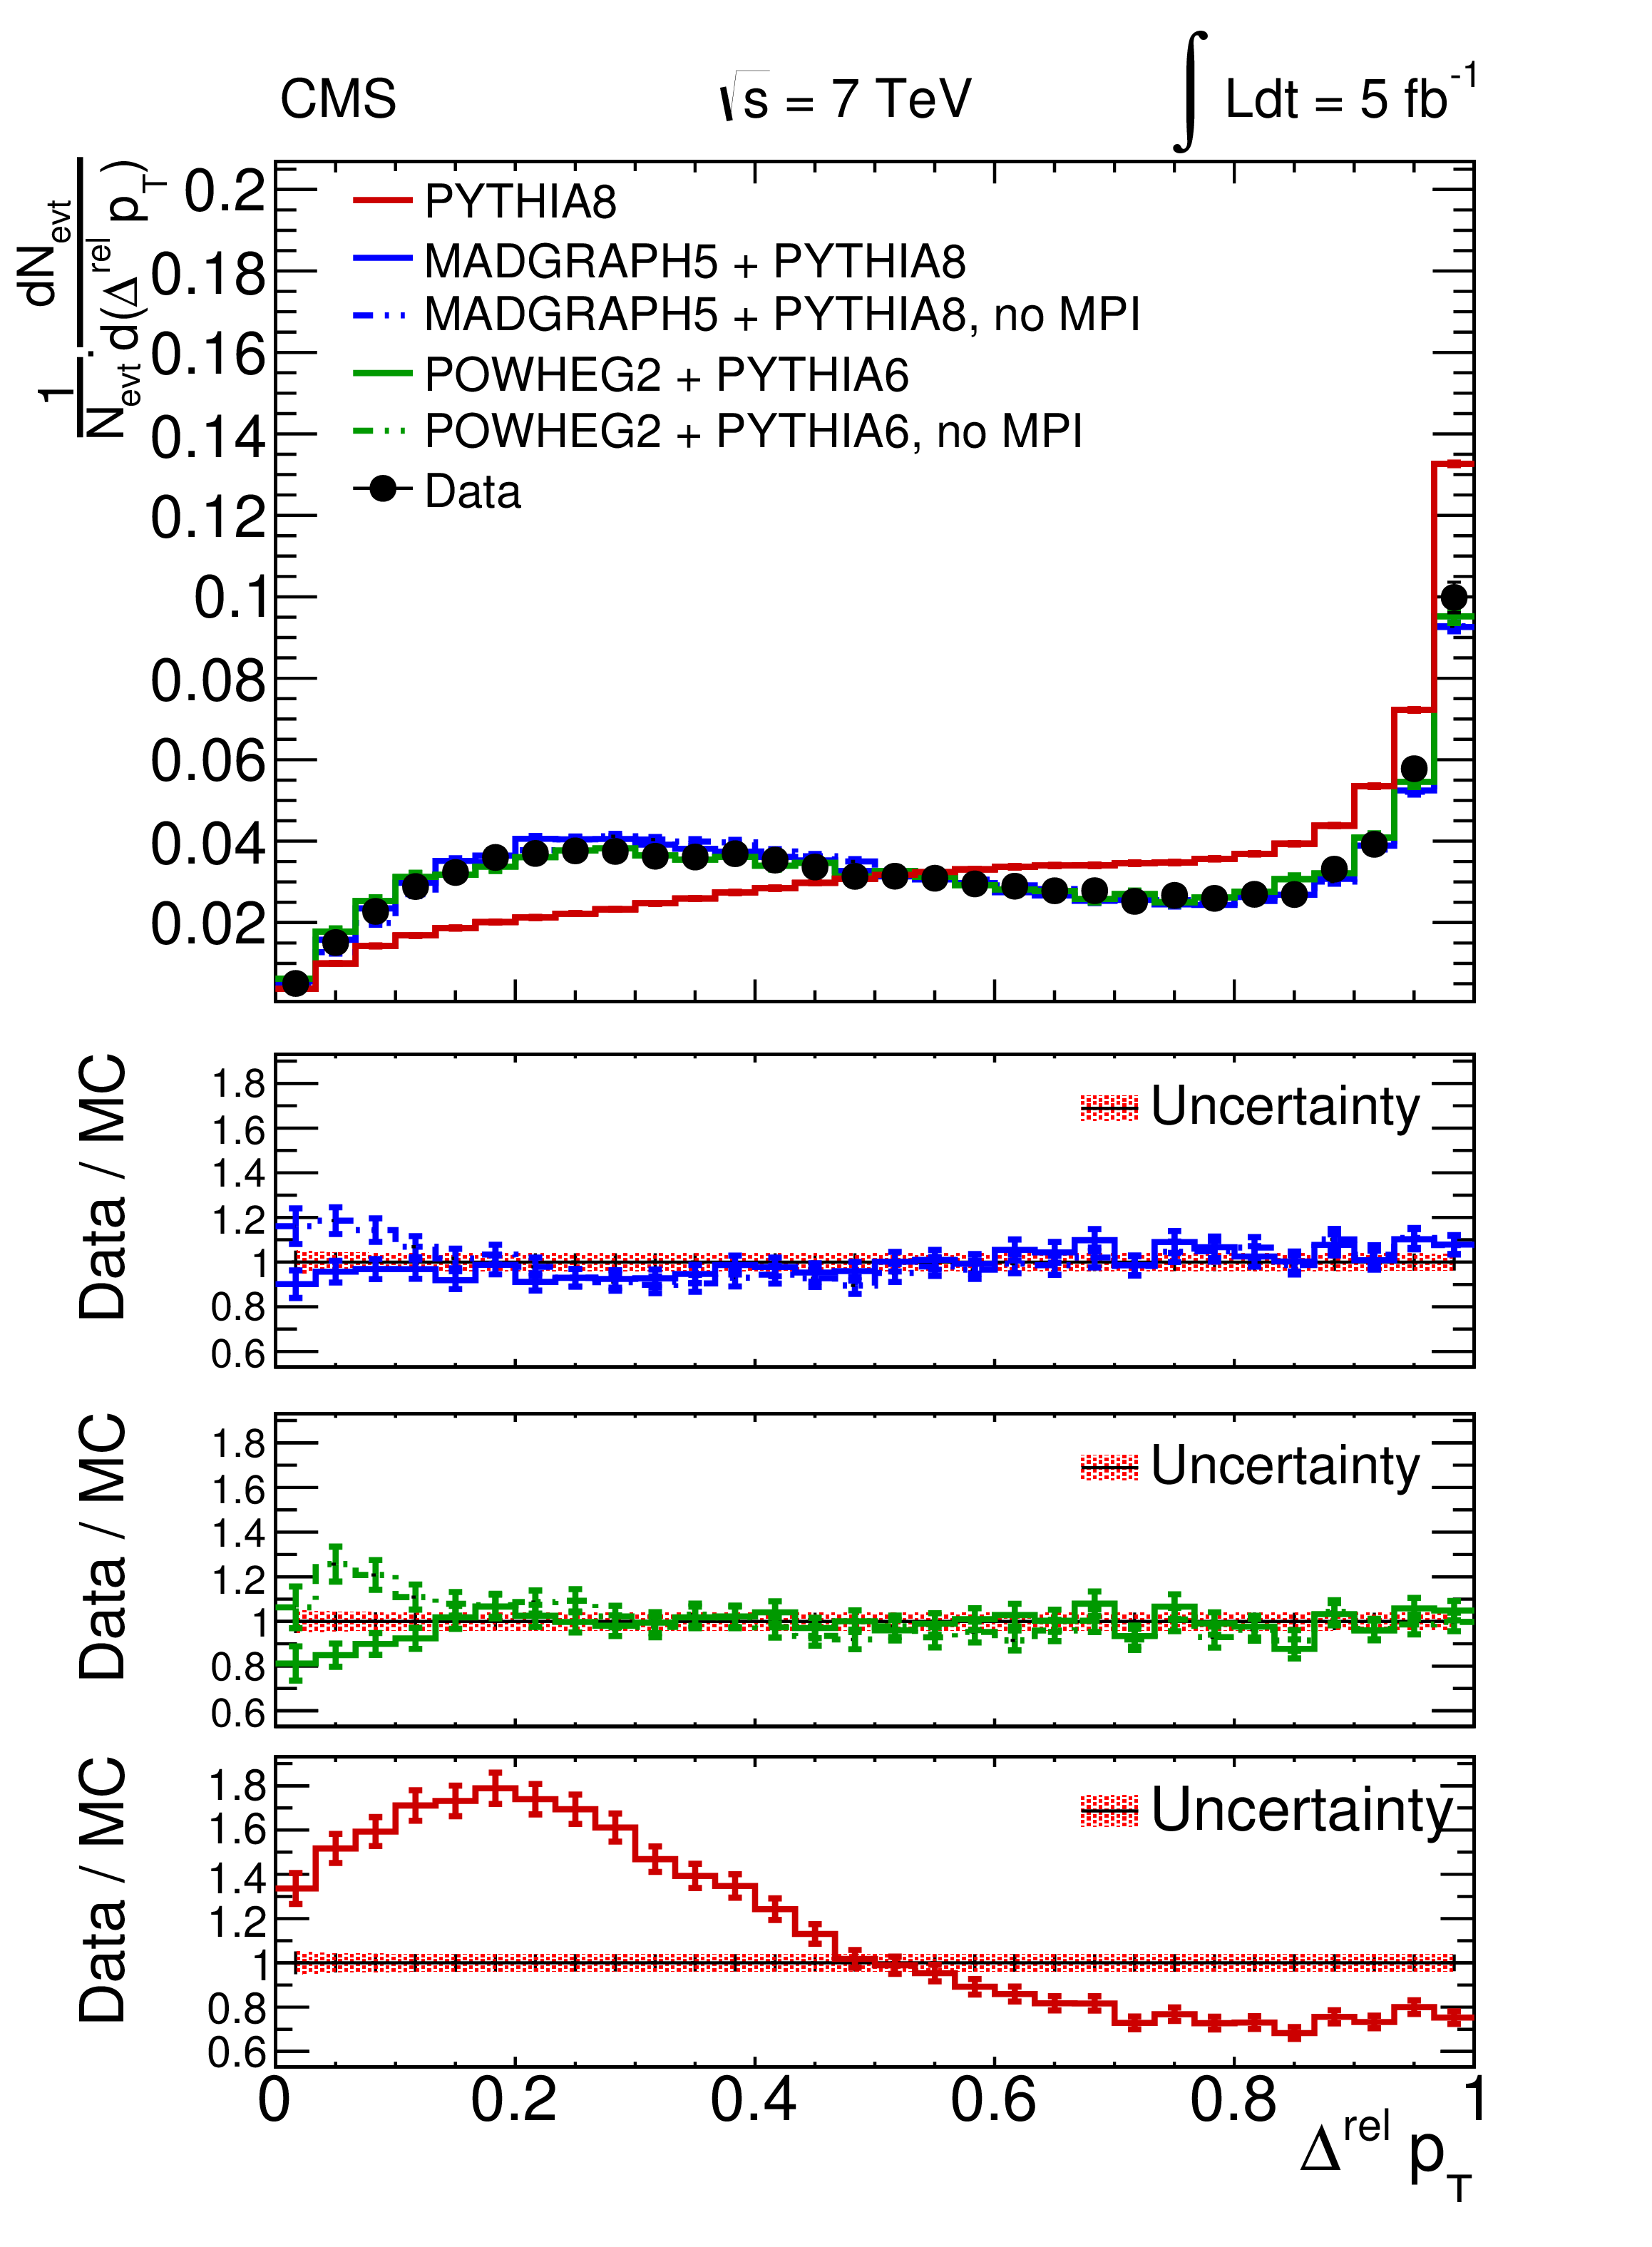
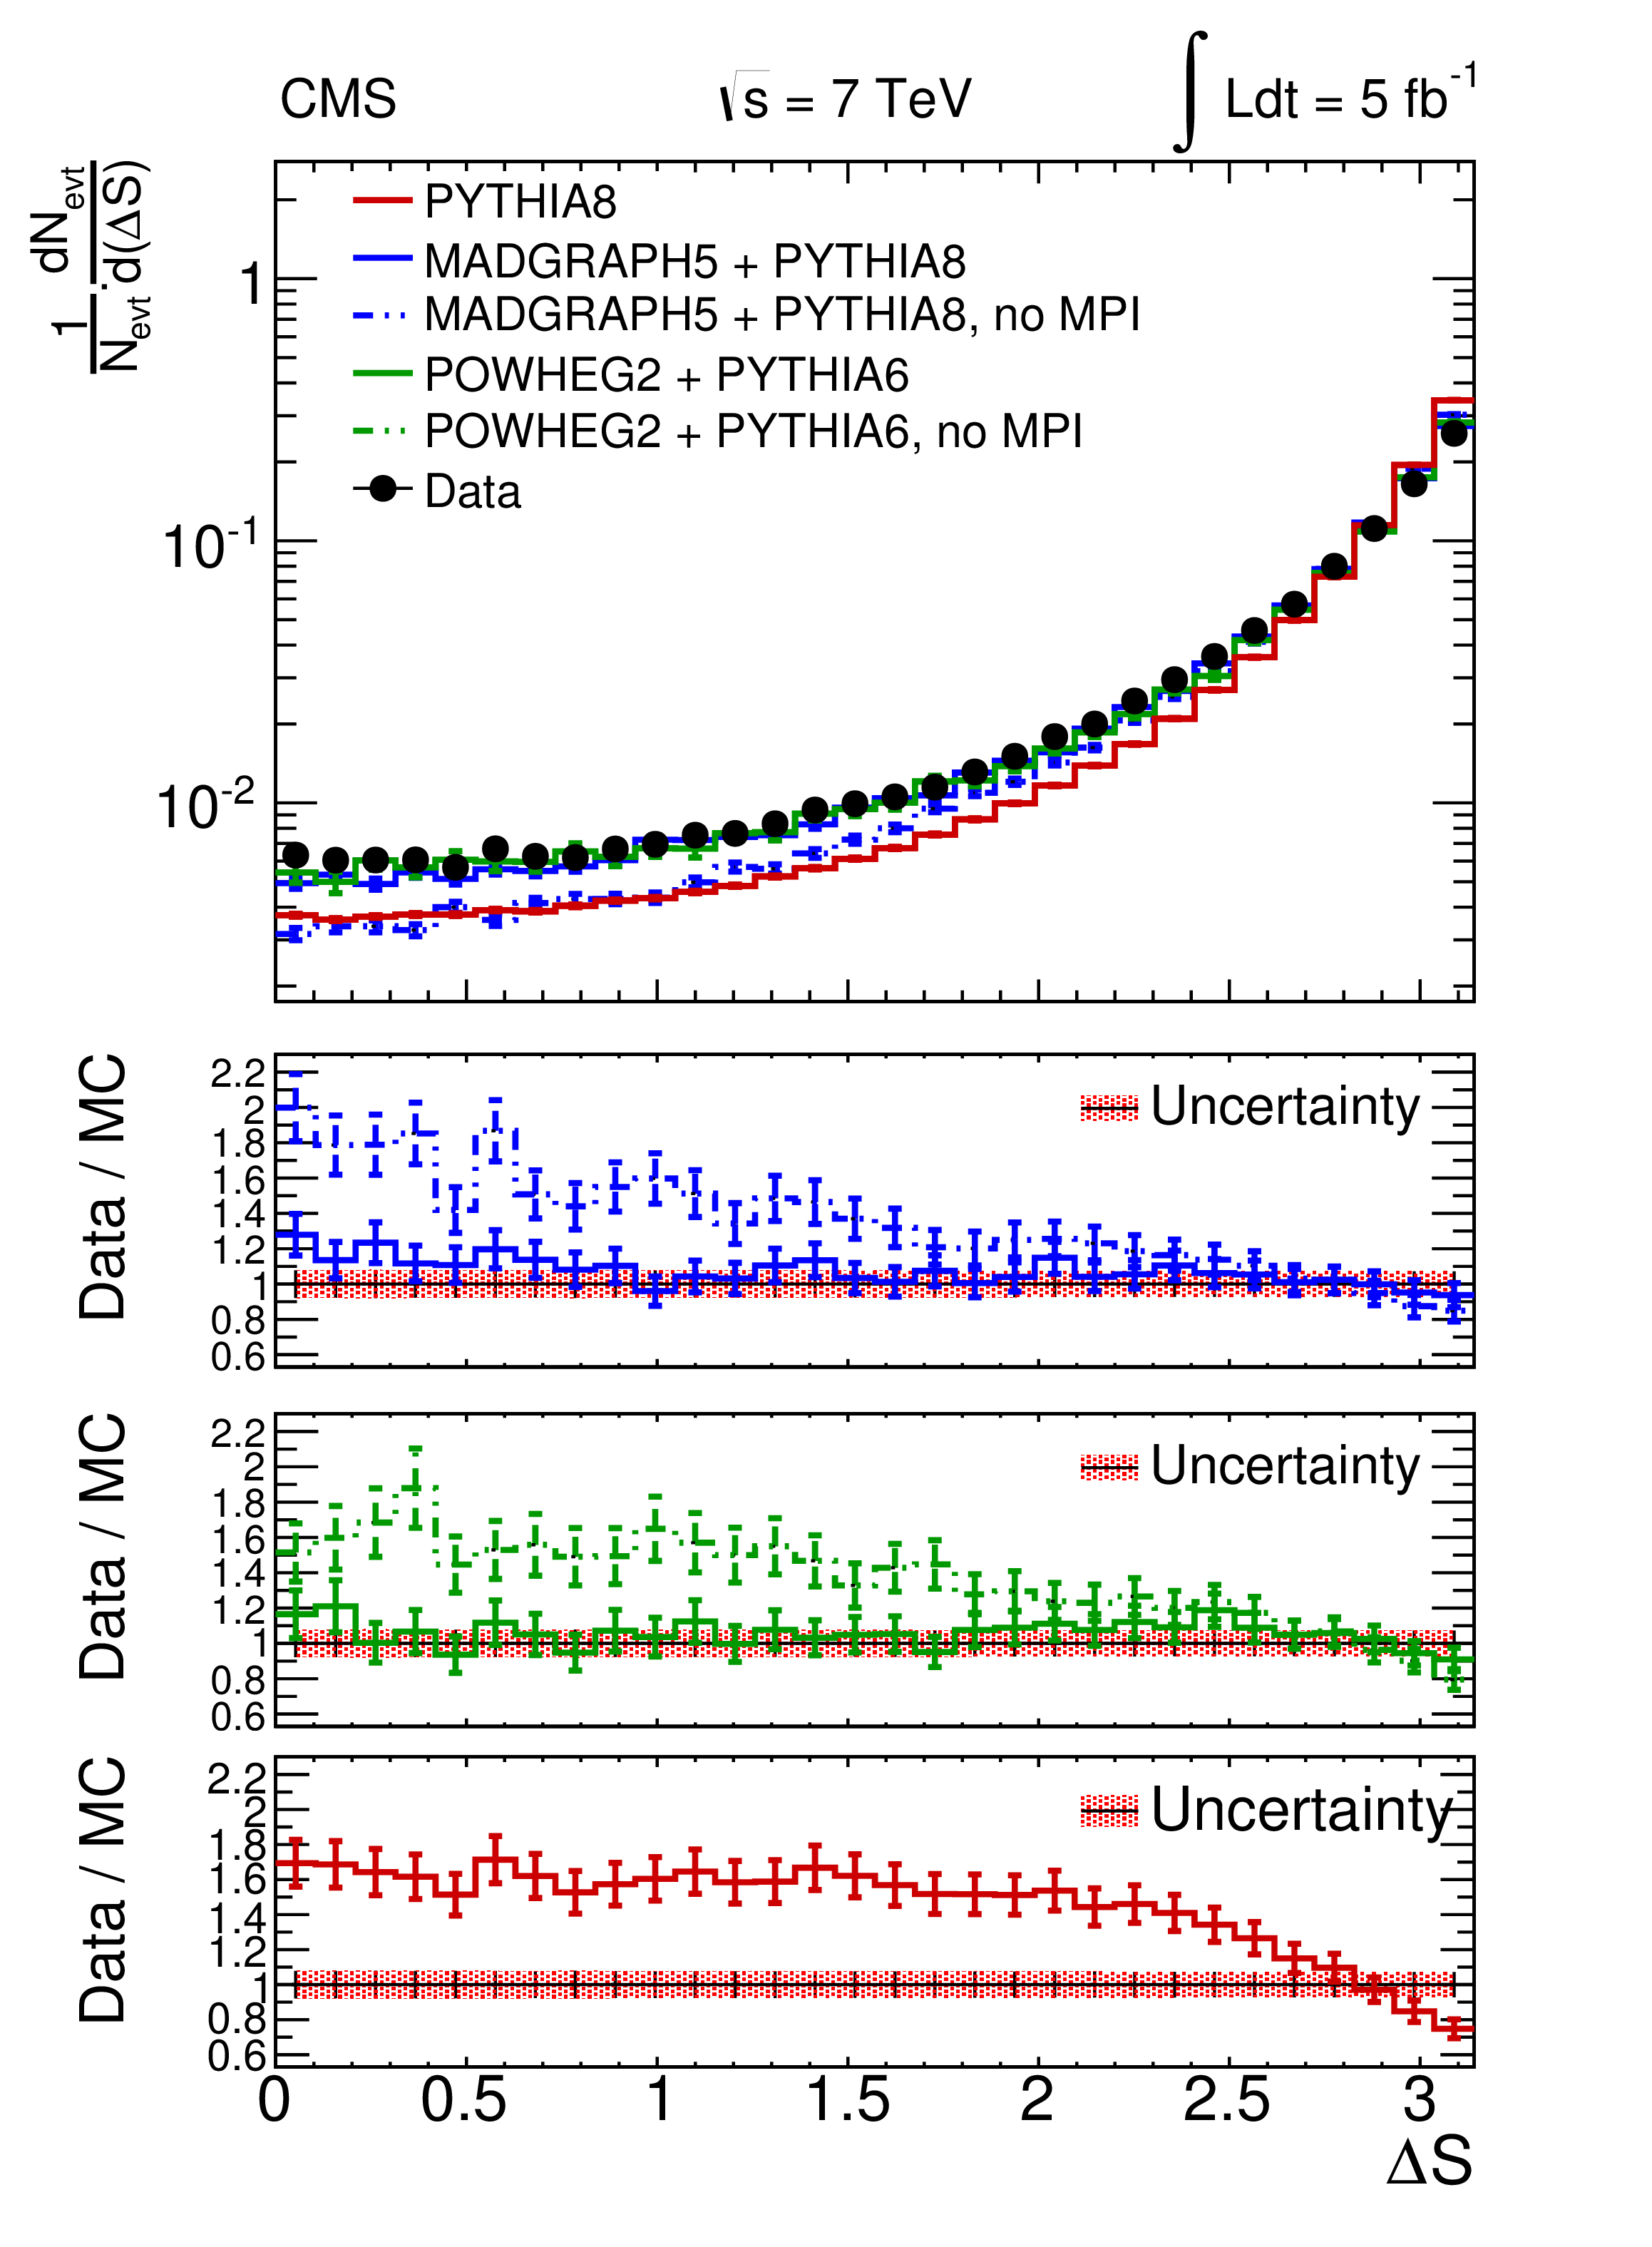
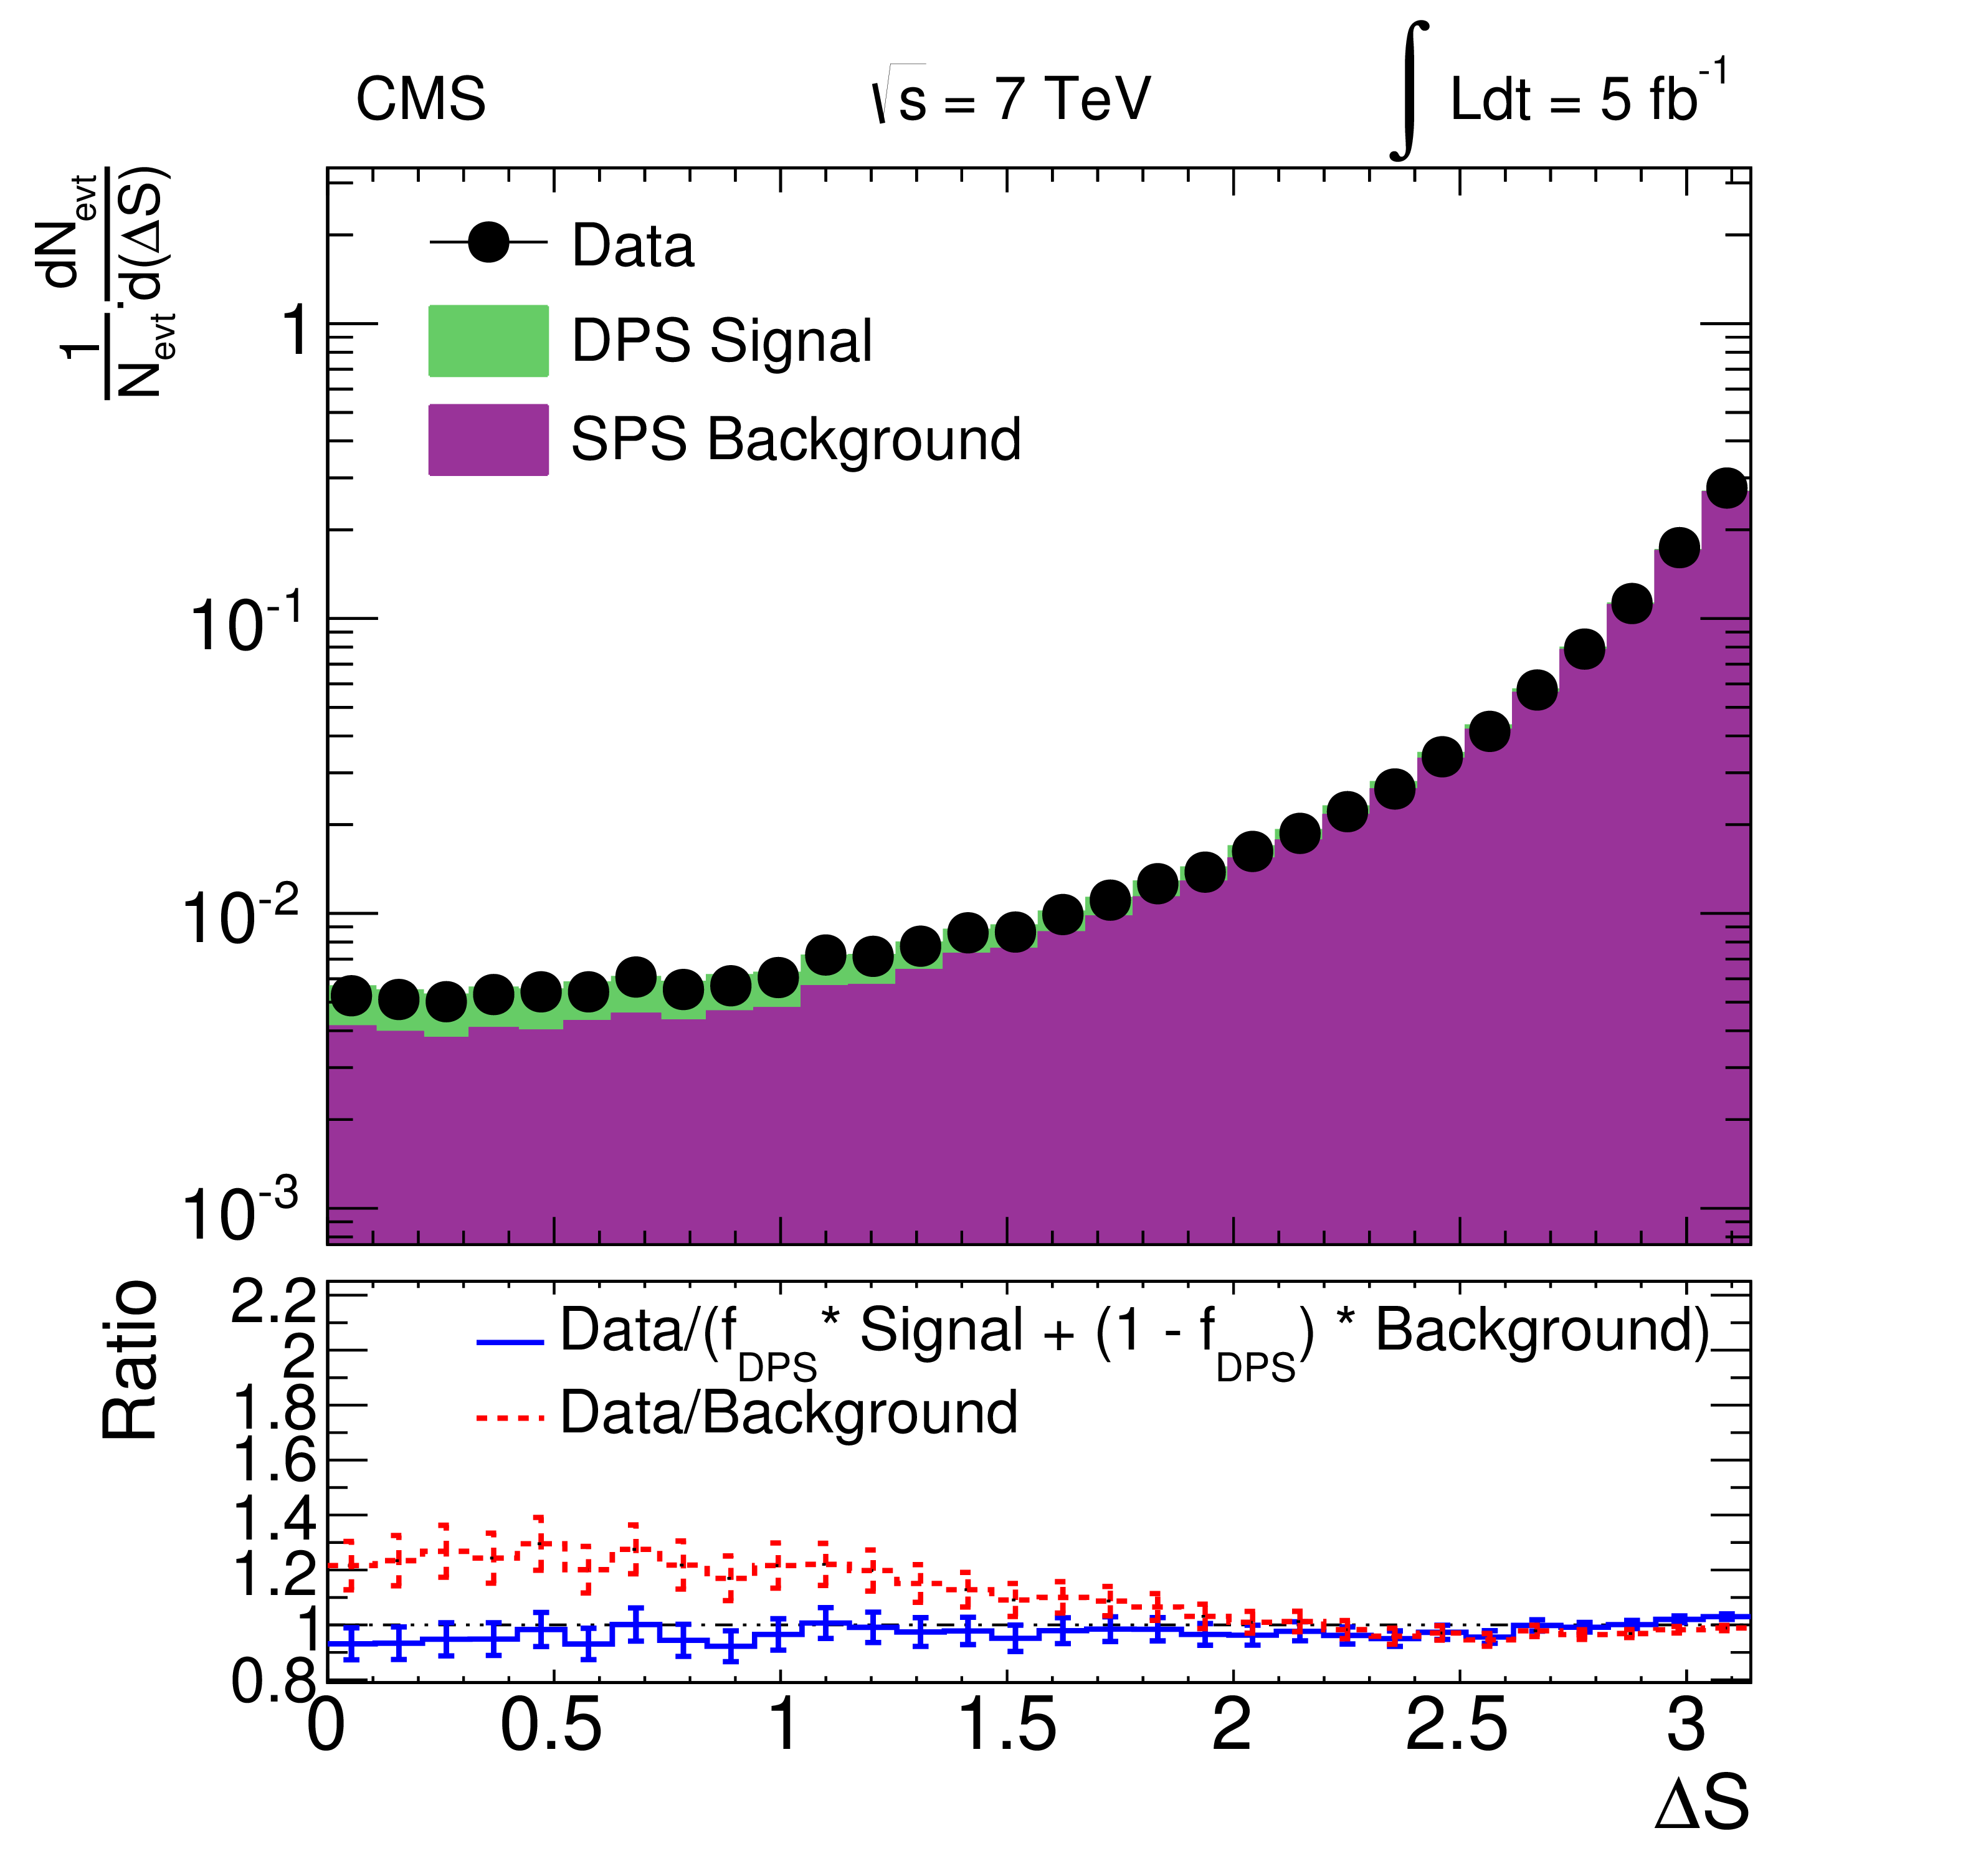
Figure 4:
Fully corrected data distributions, normalized to unity, for the DPS-sensitive observables $\Delta ^\text {rel} {p_{\mathrm {T}}} $ (left) and $ {\Delta \mathrm {S}} $ (right). The second panel in both plots shows the ratio of data over MadGraph 5 + PYTHIA 8 with and without MPI, whereas in the third panel the ratio with POWHEG 2 + PYTHIA 6 is shown. The ratio of the data and PYTHIA 8 is shown in the fourth panel of both plots. The band represents the total uncertainty of the data (cf. Table 5). |
png pdf |
Figure 4-a:
Fully corrected data distributions, normalized to unity, for the DPS-sensitive observables $\Delta ^\text {rel} {p_{\mathrm {T}}} $ (left) and $ {\Delta \mathrm {S}} $ (right). The second panel in both plots shows the ratio of data over MadGraph 5 + PYTHIA 8 with and without MPI, whereas in the third panel the ratio with POWHEG 2 + PYTHIA 6 is shown. The ratio of the data and PYTHIA 8 is shown in the fourth panel of both plots. The band represents the total uncertainty of the data (cf. Table 5). |
png pdf |
Figure 4-b:
Fully corrected data distributions, normalized to unity, for the DPS-sensitive observables $\Delta ^\text {rel} {p_{\mathrm {T}}} $ (left) and $ {\Delta \mathrm {S}} $ (right). The second panel in both plots shows the ratio of data over MadGraph 5 + PYTHIA 8 with and without MPI, whereas in the third panel the ratio with POWHEG 2 + PYTHIA 6 is shown. The ratio of the data and PYTHIA 8 is shown in the fourth panel of both plots. The band represents the total uncertainty of the data (cf. Table 5). |
png pdf |
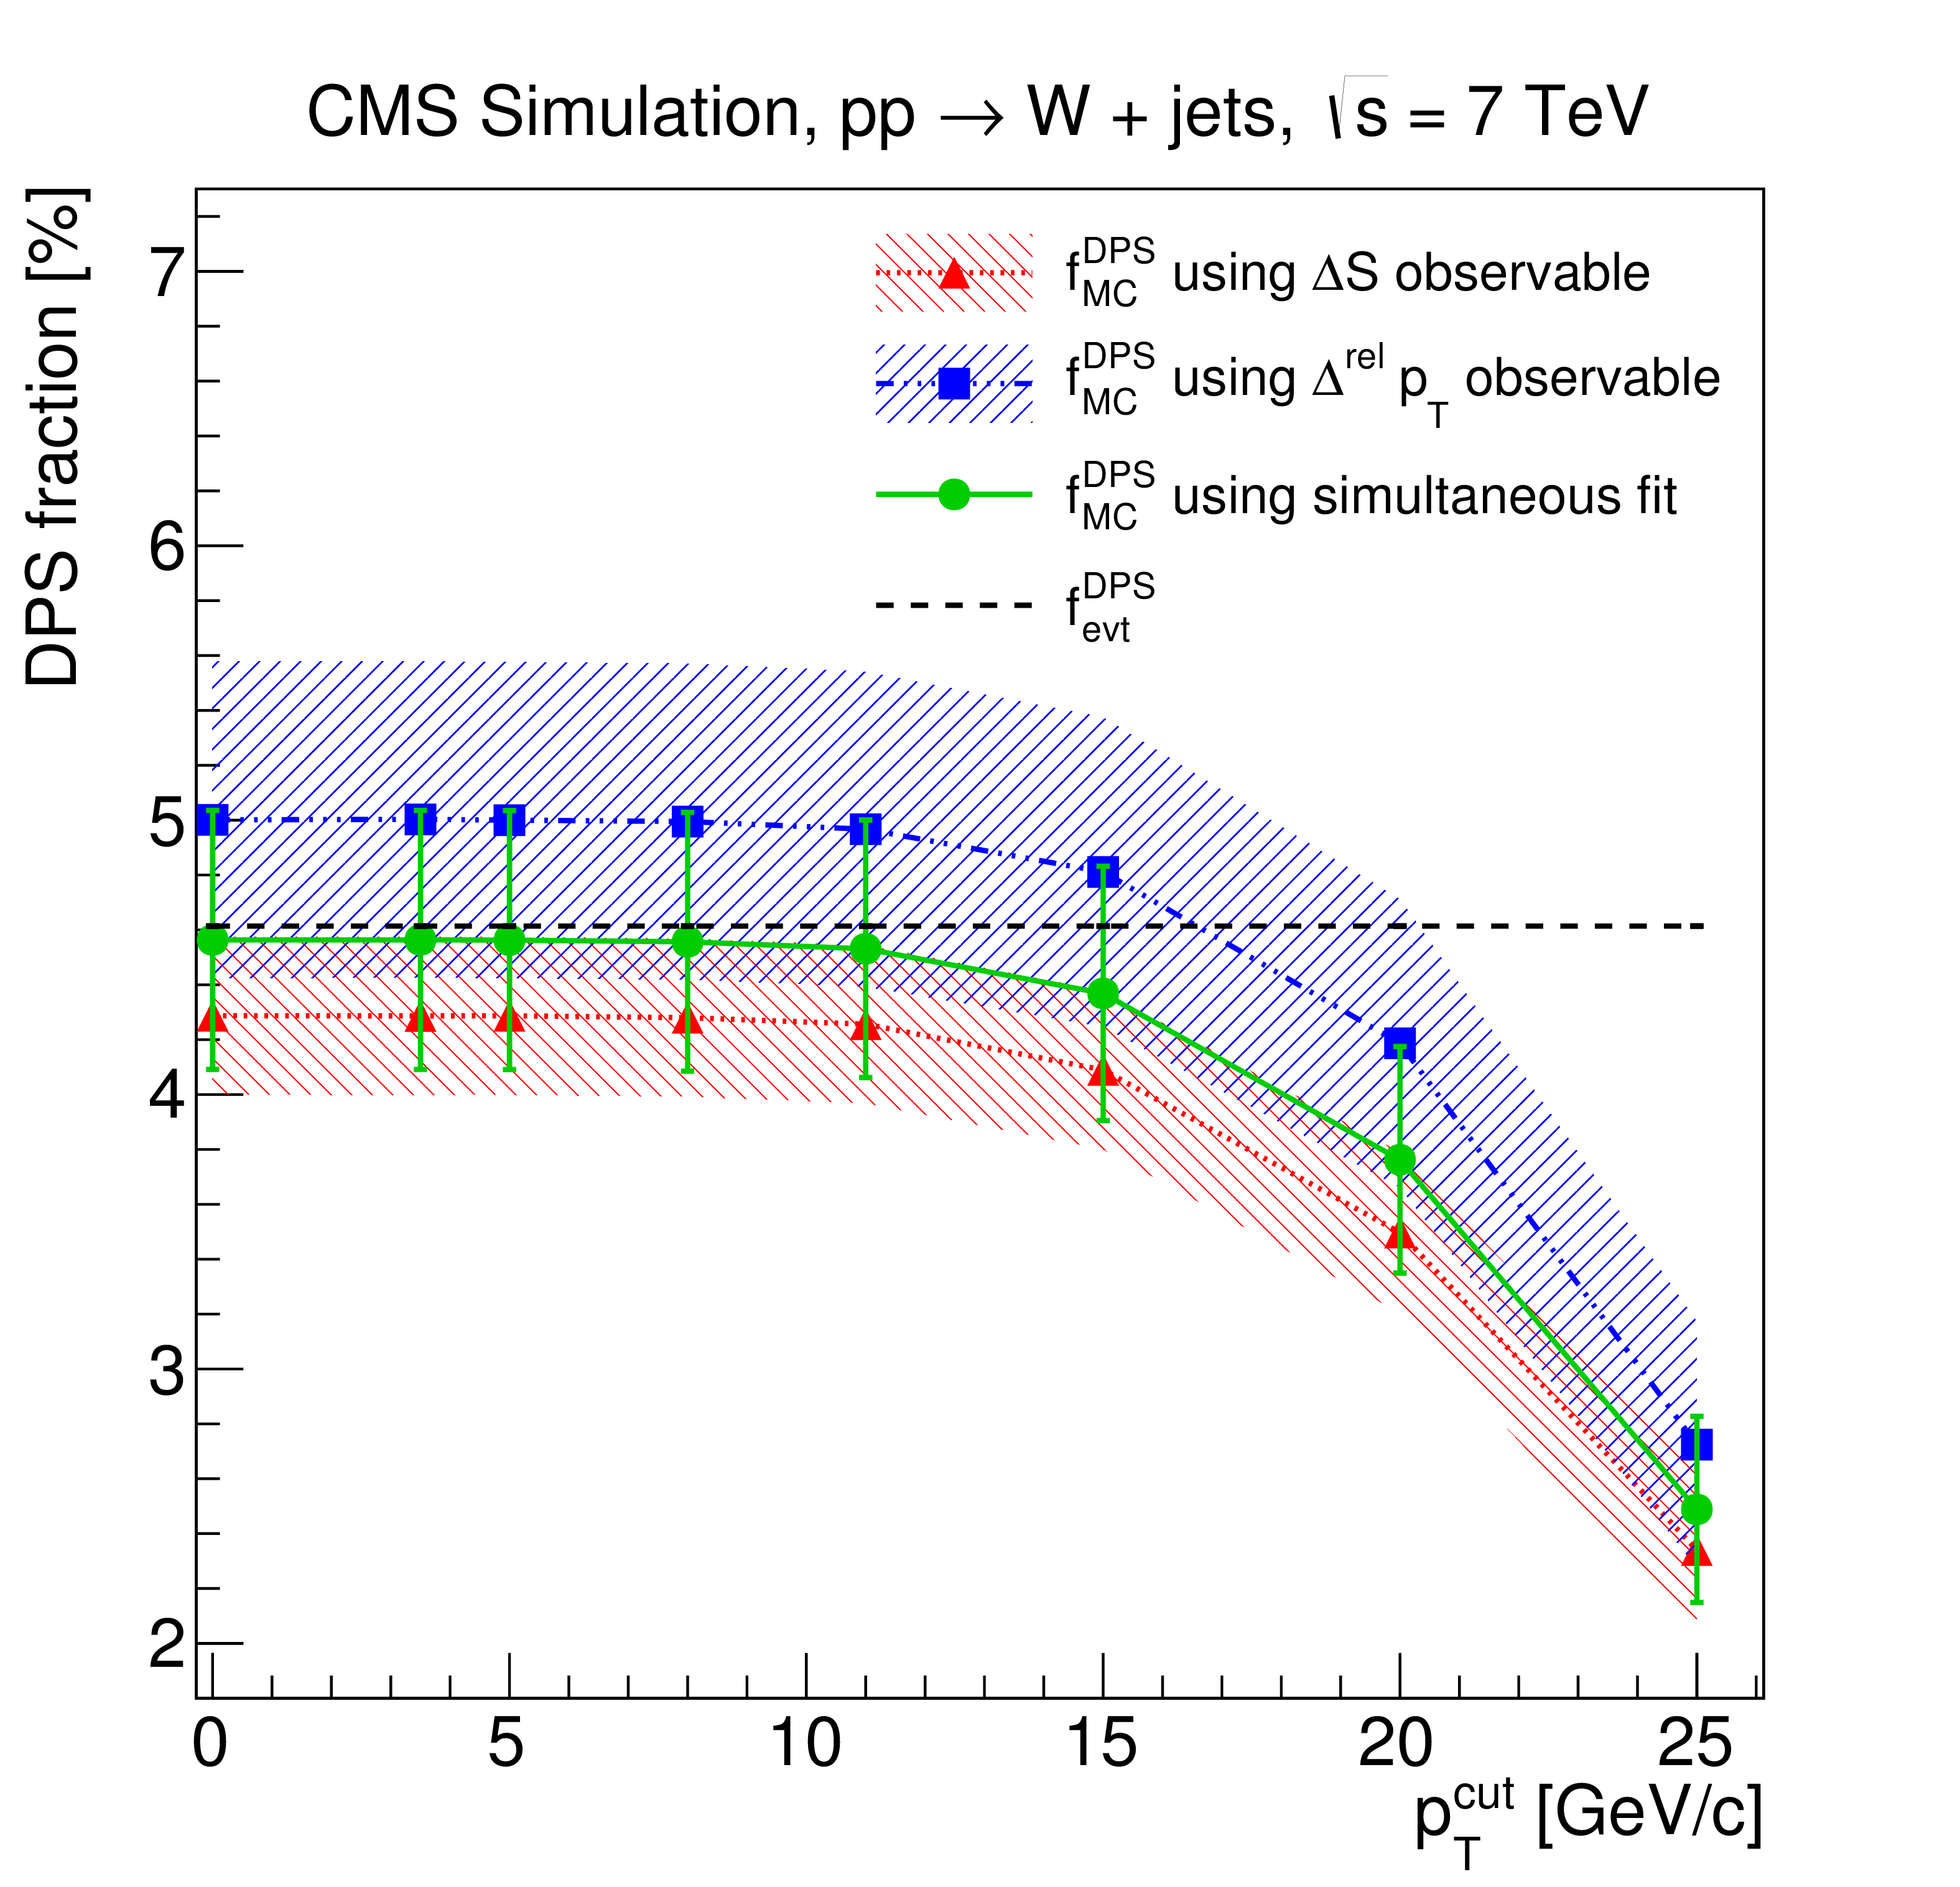
Figure 5:
The extracted value of the DPS fraction in W + jets events, simulated with MadGraph 5 + PYTHIA 8, using different background templates obtained by varying the transverse momentum cutoff (${ {p_{\mathrm {T}}} ^\text {cut}}$) for the second hard interaction. The DPS fractions obtained by performing both simultaneous and individual fits to the $\Delta ^\text {rel}{ {p_{\mathrm {T}}} }$ and $ {\Delta \mathrm {S}} $ observables are shown. The DPS fraction, ${f_\mathrm {DPS}^\text {evt}}$, for the simulated W + jets events is shown by a dashed black line. The error bars/bands represent the statistical uncertainty added in quadrature to the systematic uncertainty of the DPS template (as discussed in the text). |

png pdf |
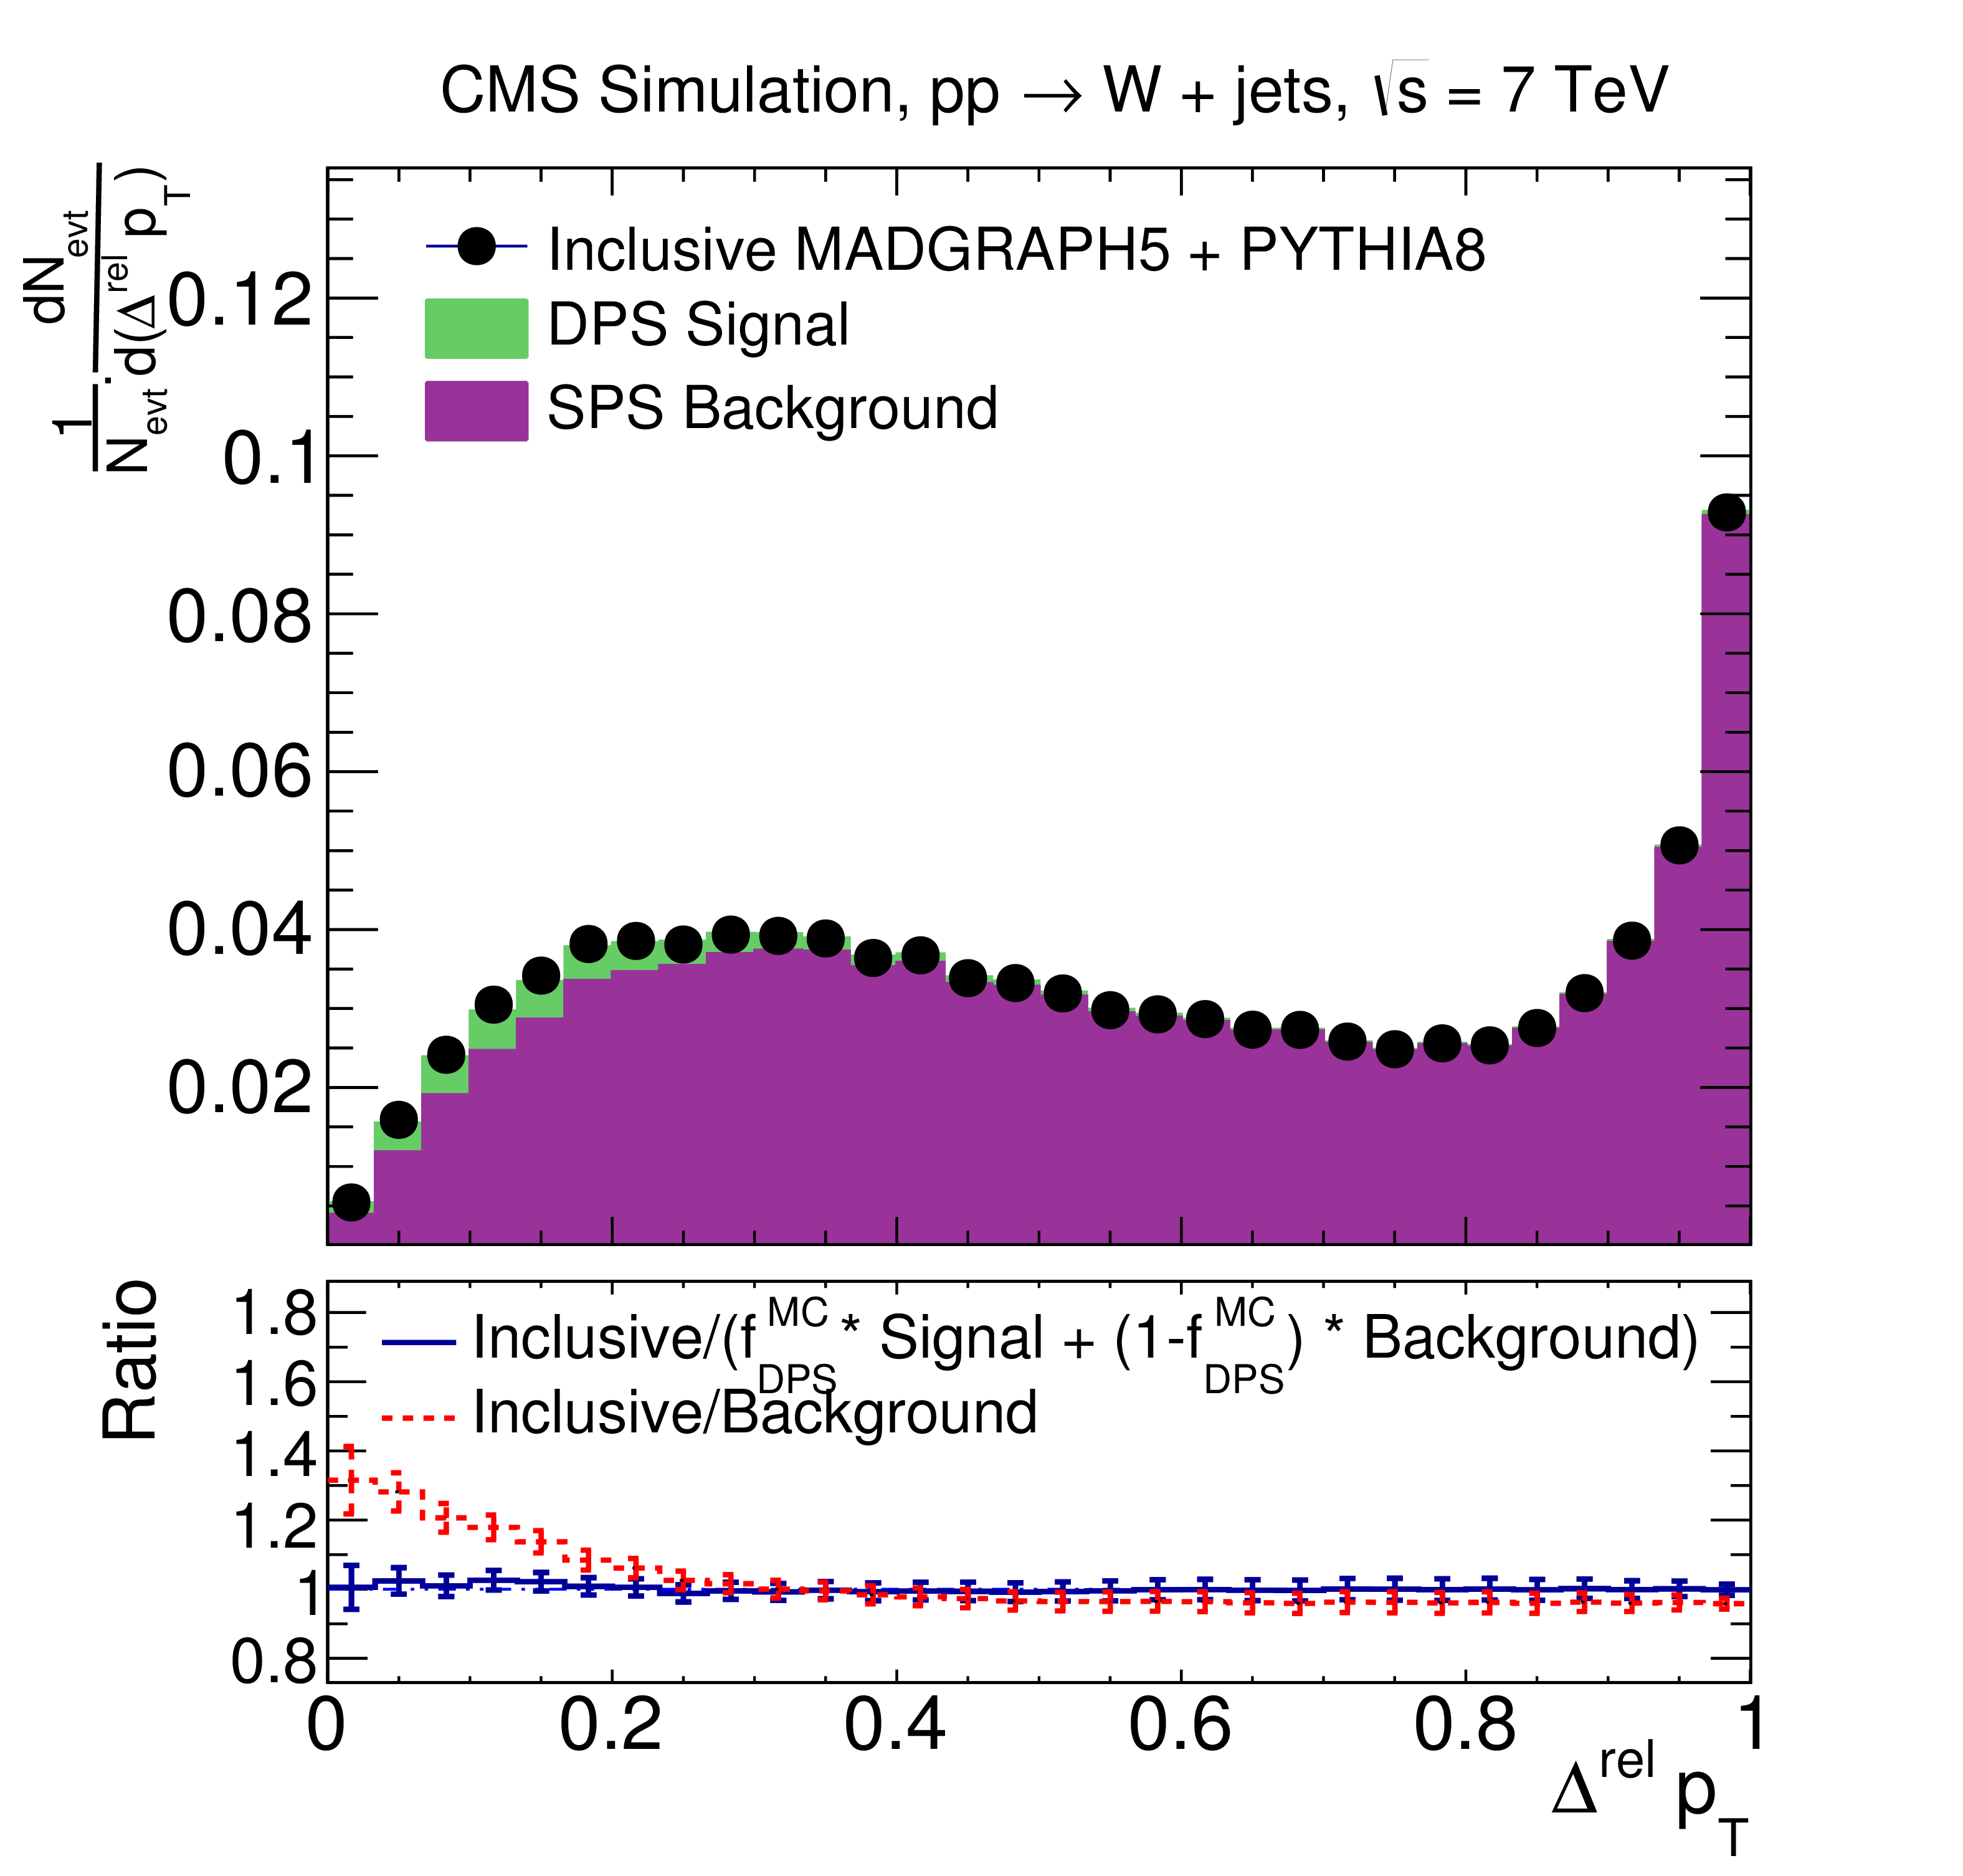
Figure 6:
Fit results for the DPS-sensitive observables $\Delta ^\text {rel}{ {p_{\mathrm {T}}} }$ (left) and $ {\Delta \mathrm {S}} $ (right) using signal and background templates. The distributions of the simulated W + 2-jet events are fitted with signal and background templates. The bottom panels show the ratio of the distributions to the fit results. Here, the term ``inclusive'' means the simulation also includes the DPS contribution. |
png pdf |
Figure 6-a:
Fit results for the DPS-sensitive observables $\Delta ^\text {rel}{ {p_{\mathrm {T}}} }$ (left) and $ {\Delta \mathrm {S}} $ (right) using signal and background templates. The distributions of the simulated W + 2-jet events are fitted with signal and background templates. The bottom panels show the ratio of the distributions to the fit results. Here, the term ``inclusive'' means the simulation also includes the DPS contribution. |

png pdf |
Figure 6-b:
Fit results for the DPS-sensitive observables $\Delta ^\text {rel}{ {p_{\mathrm {T}}} }$ (left) and $ {\Delta \mathrm {S}} $ (right) using signal and background templates. The distributions of the simulated W + 2-jet events are fitted with signal and background templates. The bottom panels show the ratio of the distributions to the fit results. Here, the term ``inclusive'' means the simulation also includes the DPS contribution. |
png pdf |
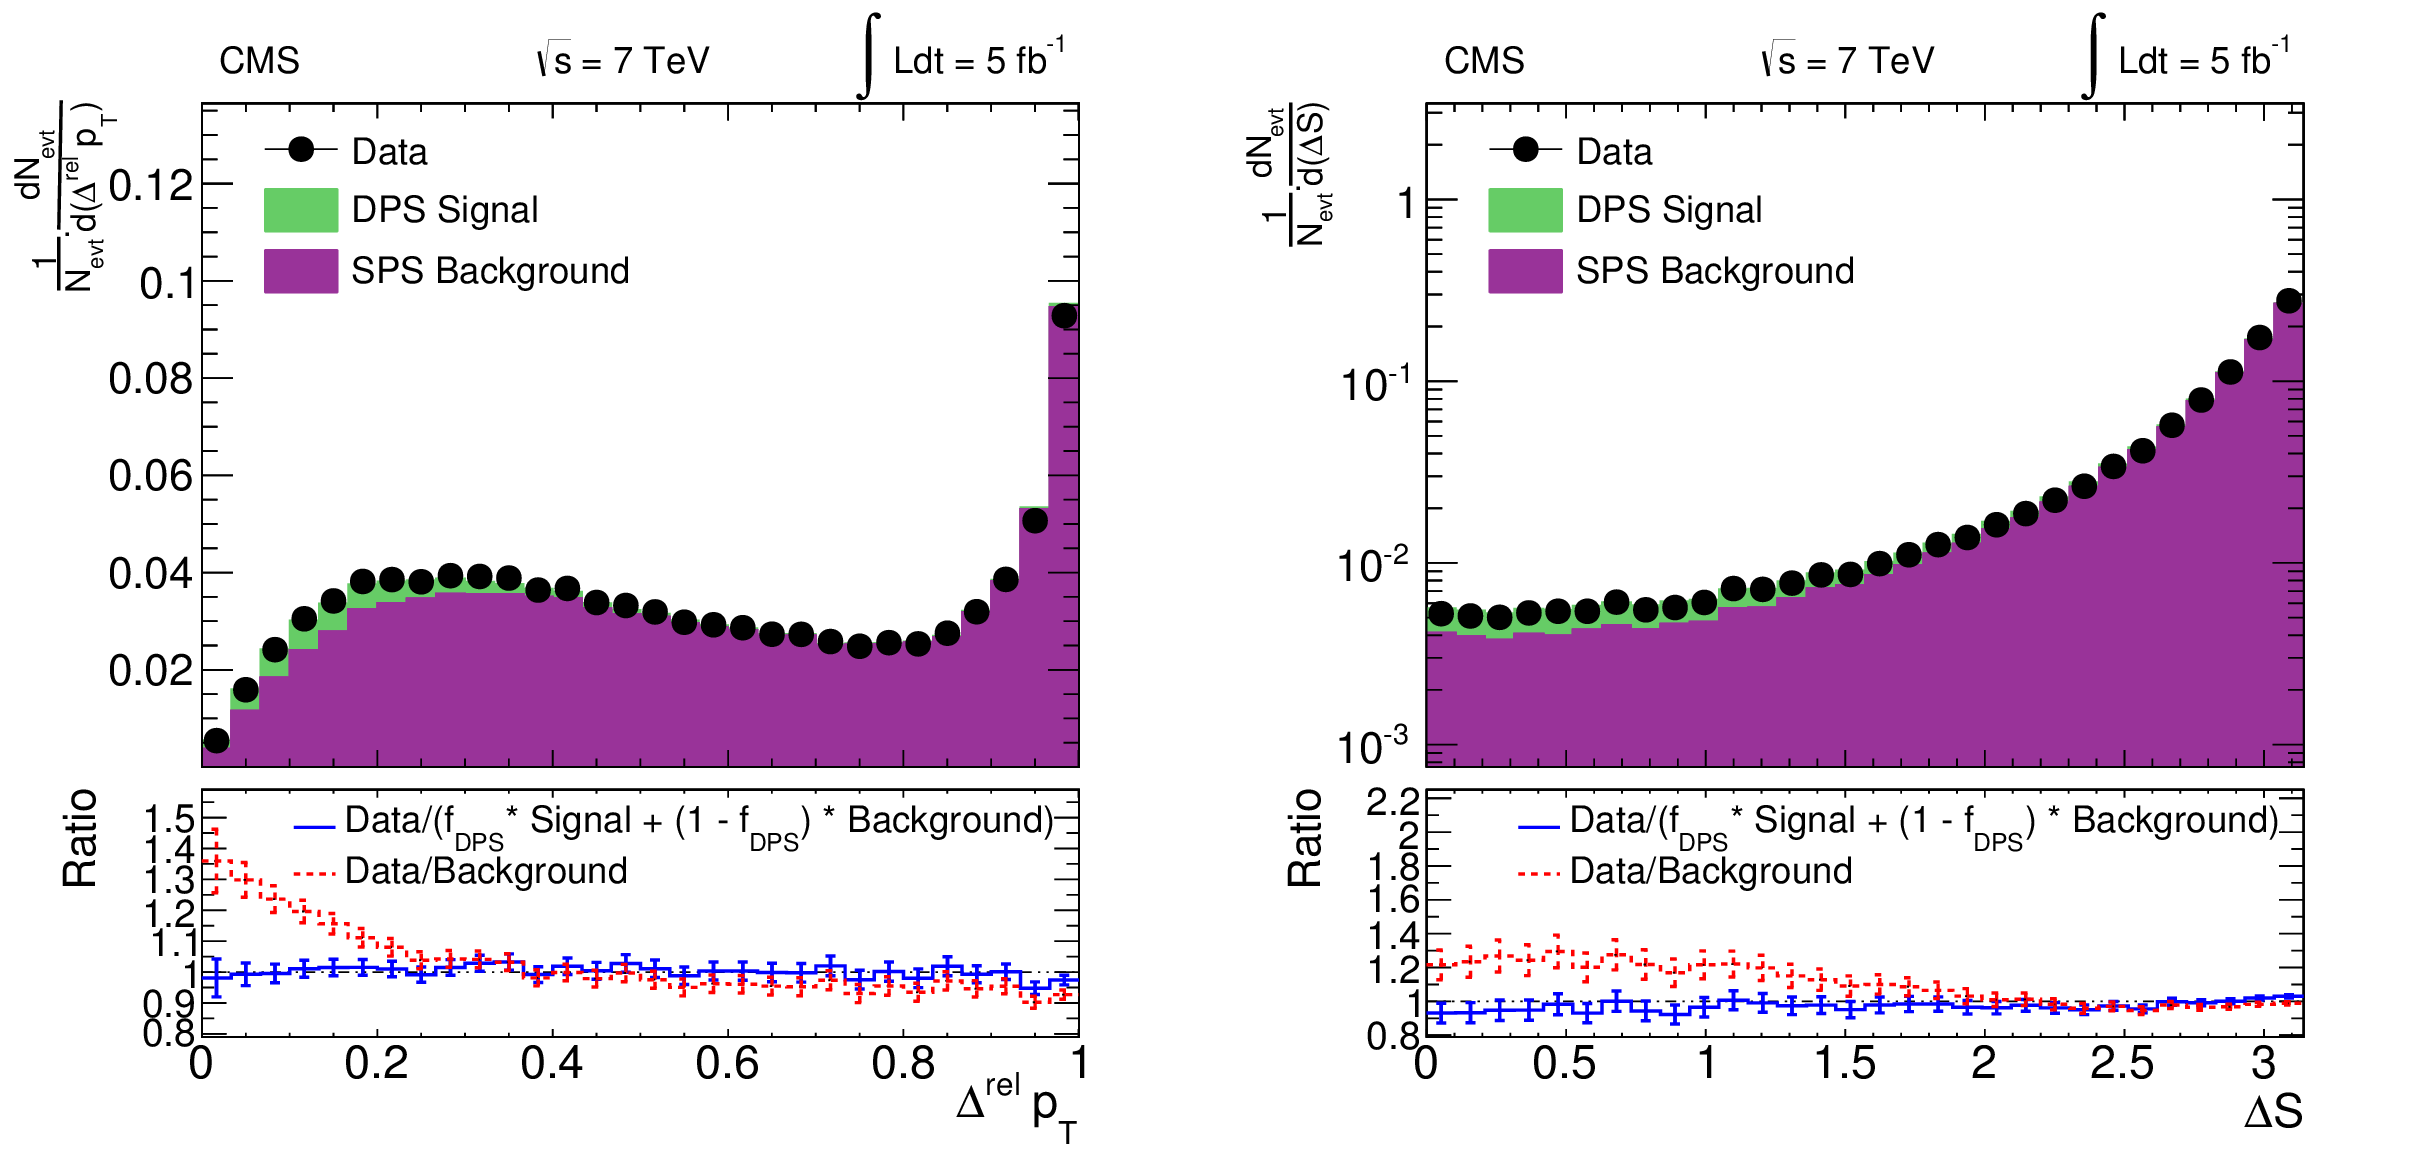
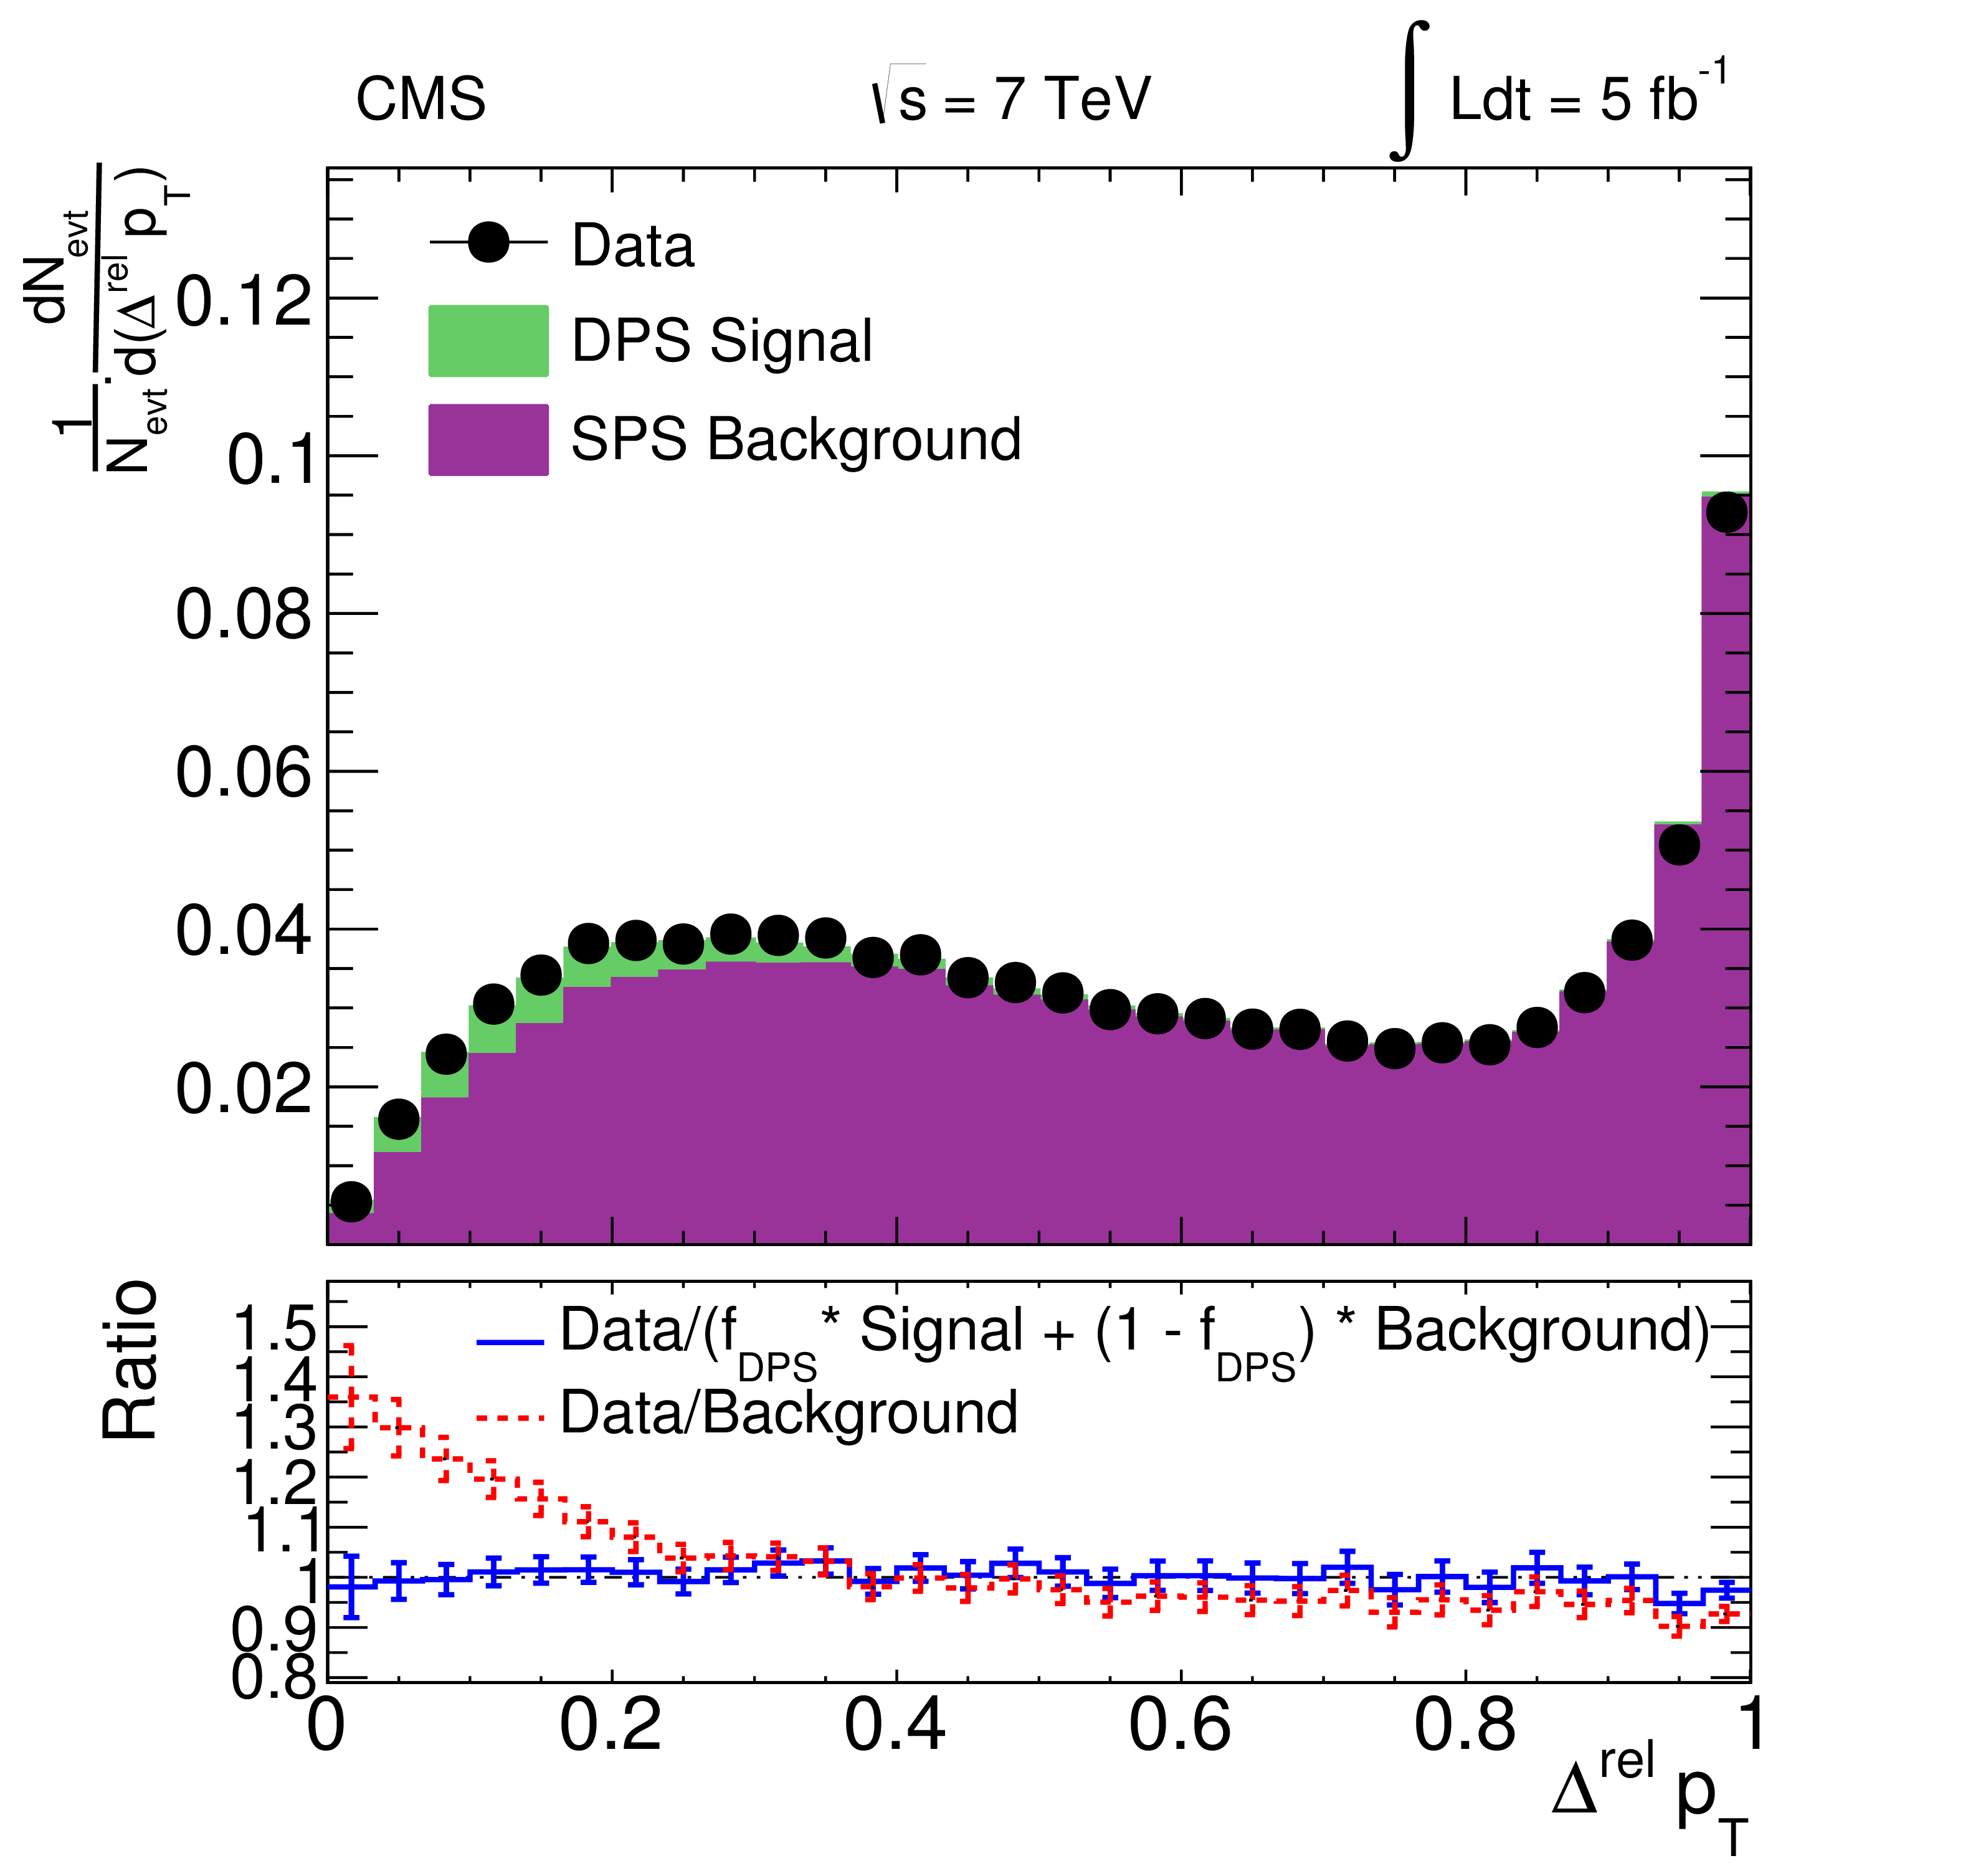
Figure 7:
Fit results for the DPS-sensitive observables $\Delta ^\text {rel}{ {p_{\mathrm {T}}} }$ (left) and $ {\Delta \mathrm {S}} $ (right). Corrected data distributions are fitted with signal and background templates (as discussed in the text). |
png pdf |
Figure 7-a:
Fit results for the DPS-sensitive observables $\Delta ^\text {rel}{ {p_{\mathrm {T}}} }$ (left) and $ {\Delta \mathrm {S}} $ (right). Corrected data distributions are fitted with signal and background templates (as discussed in the text). |
png pdf |
Figure 7-b:
Fit results for the DPS-sensitive observables $\Delta ^\text {rel}{ {p_{\mathrm {T}}} }$ (left) and $ {\Delta \mathrm {S}} $ (right). Corrected data distributions are fitted with signal and background templates (as discussed in the text). |
png pdf |
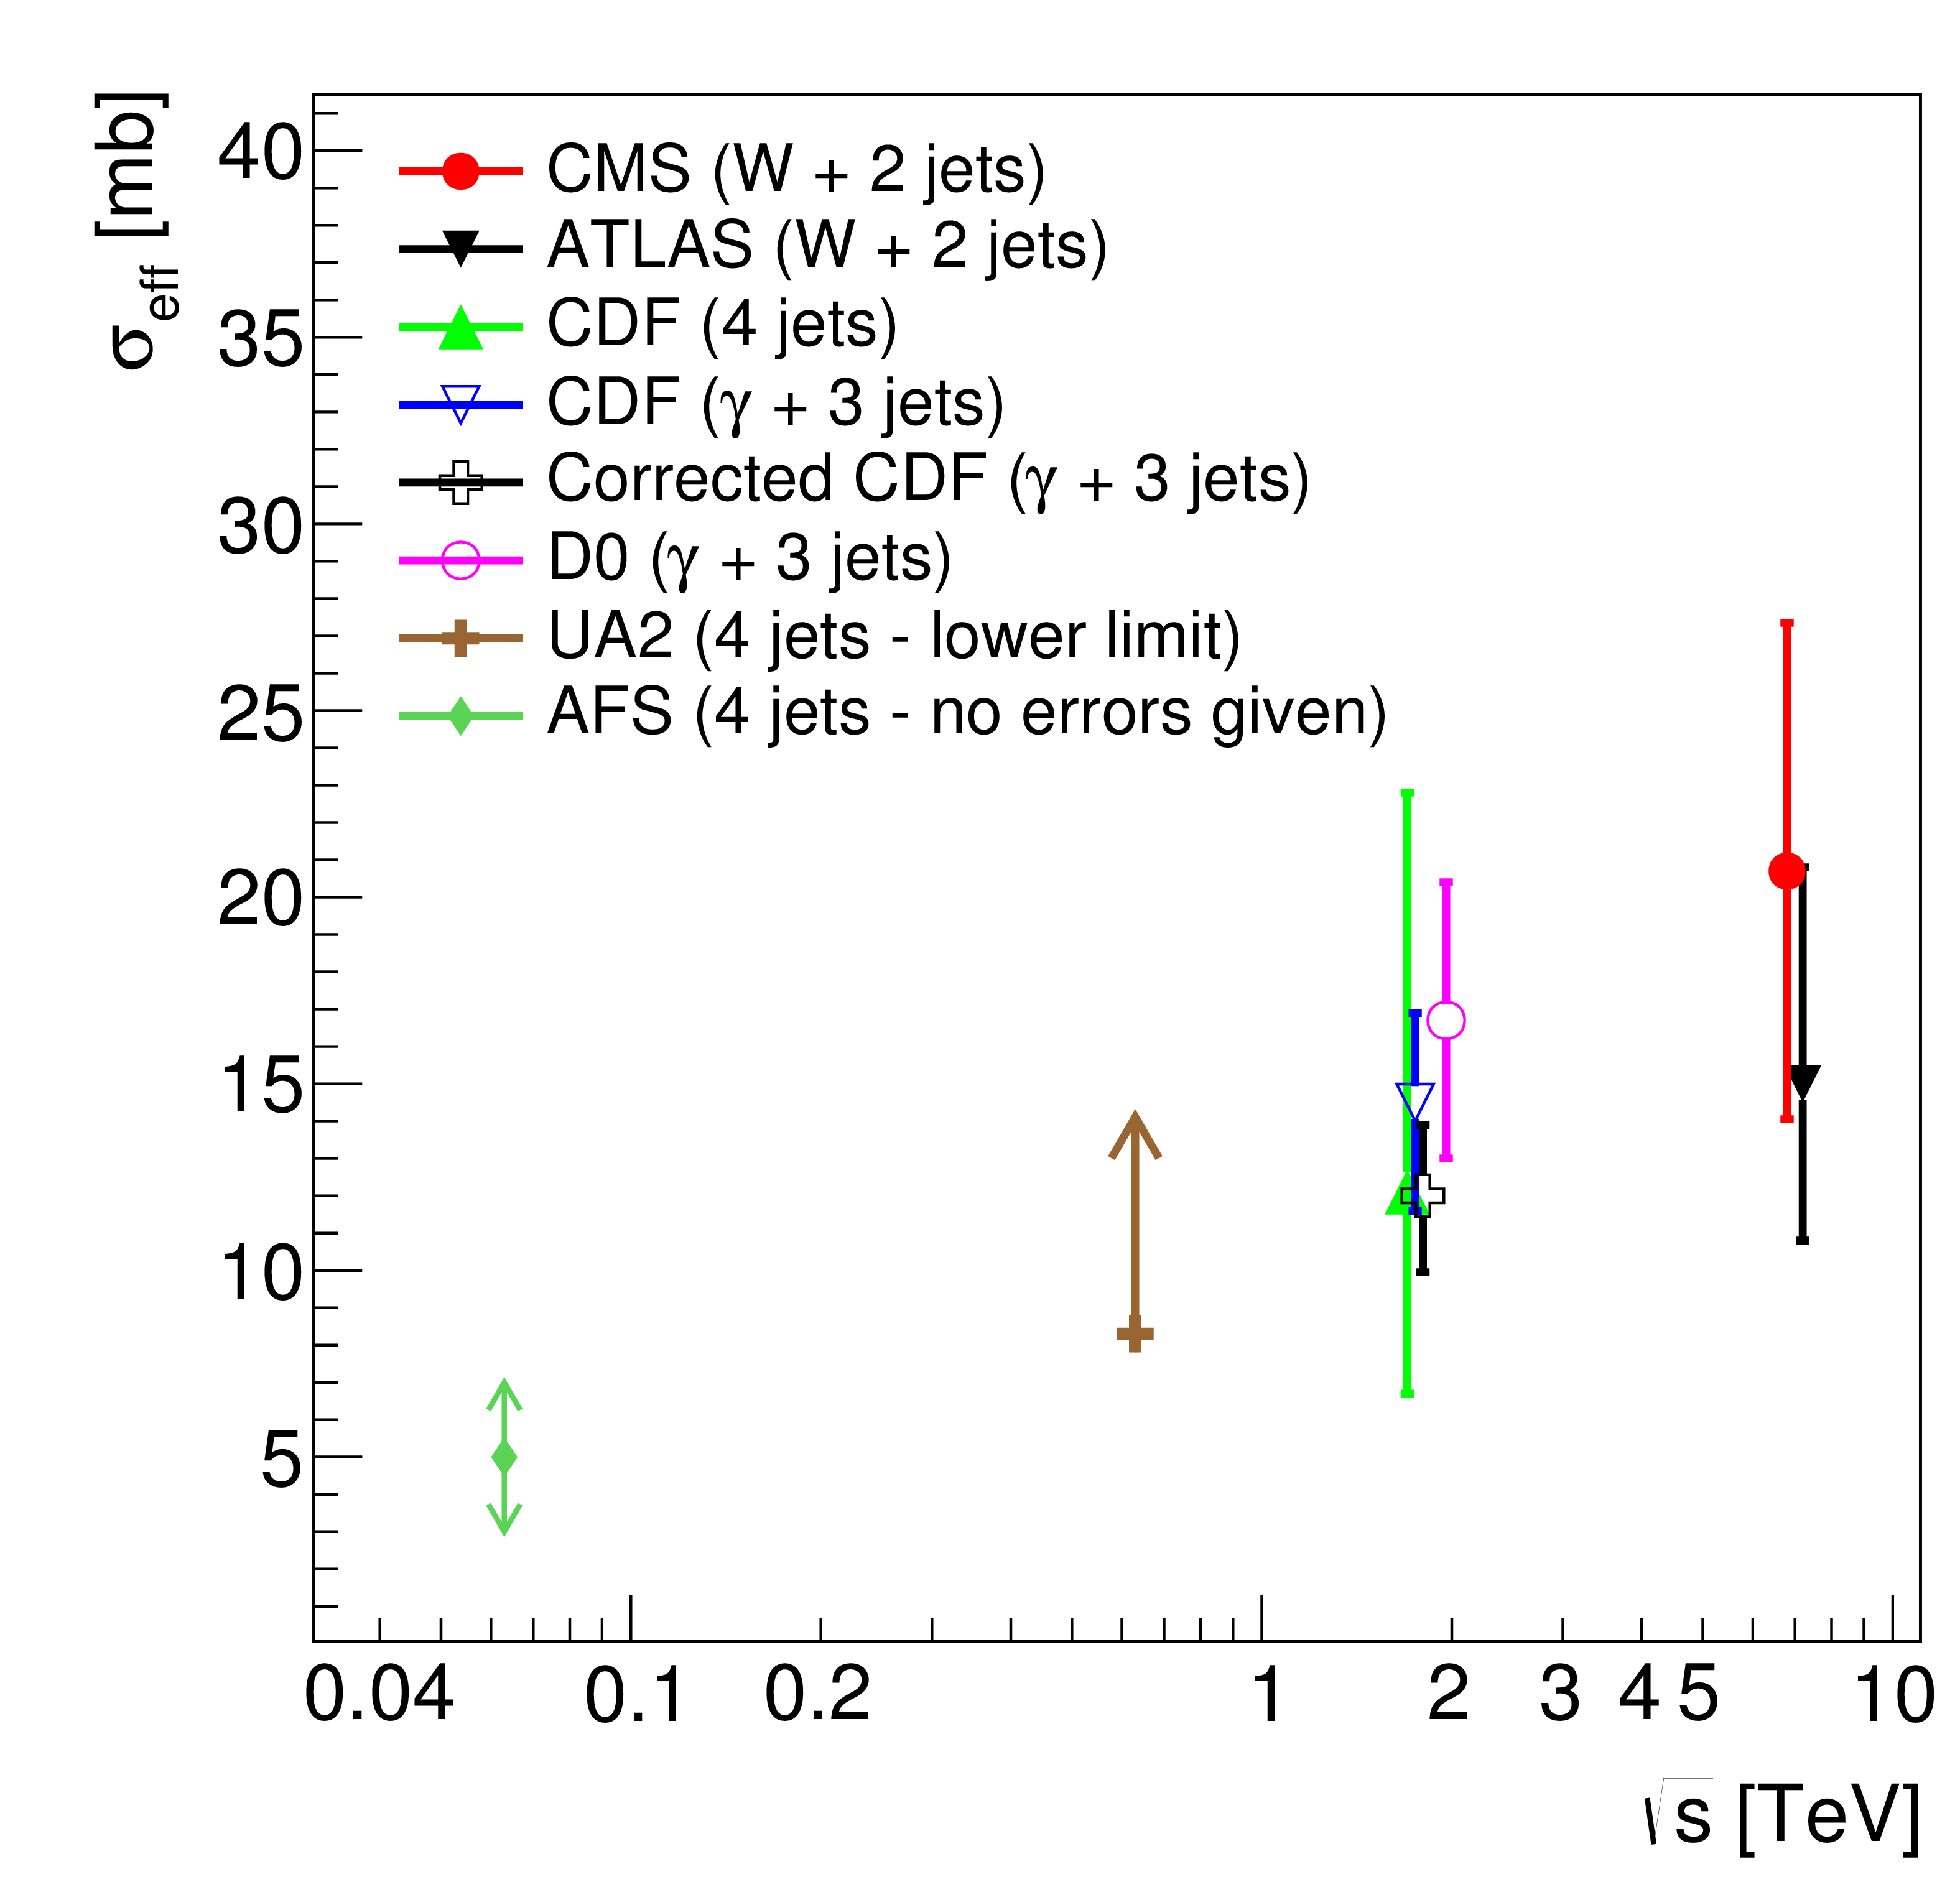
Figure 8:
Centre-of-mass energy dependence of $\sigma _\text {eff}$ measured by different experiments using different processes [8,9,10,11,12,21]. These measurements used different approaches for extraction of the DPS fraction and $\sigma _\text {eff}$. The ``Corrected CDF'' data point indicates the $\sigma _\text {eff}$ value corrected for the exclusive event selection [23]. |
| Tables | |
png pdf |
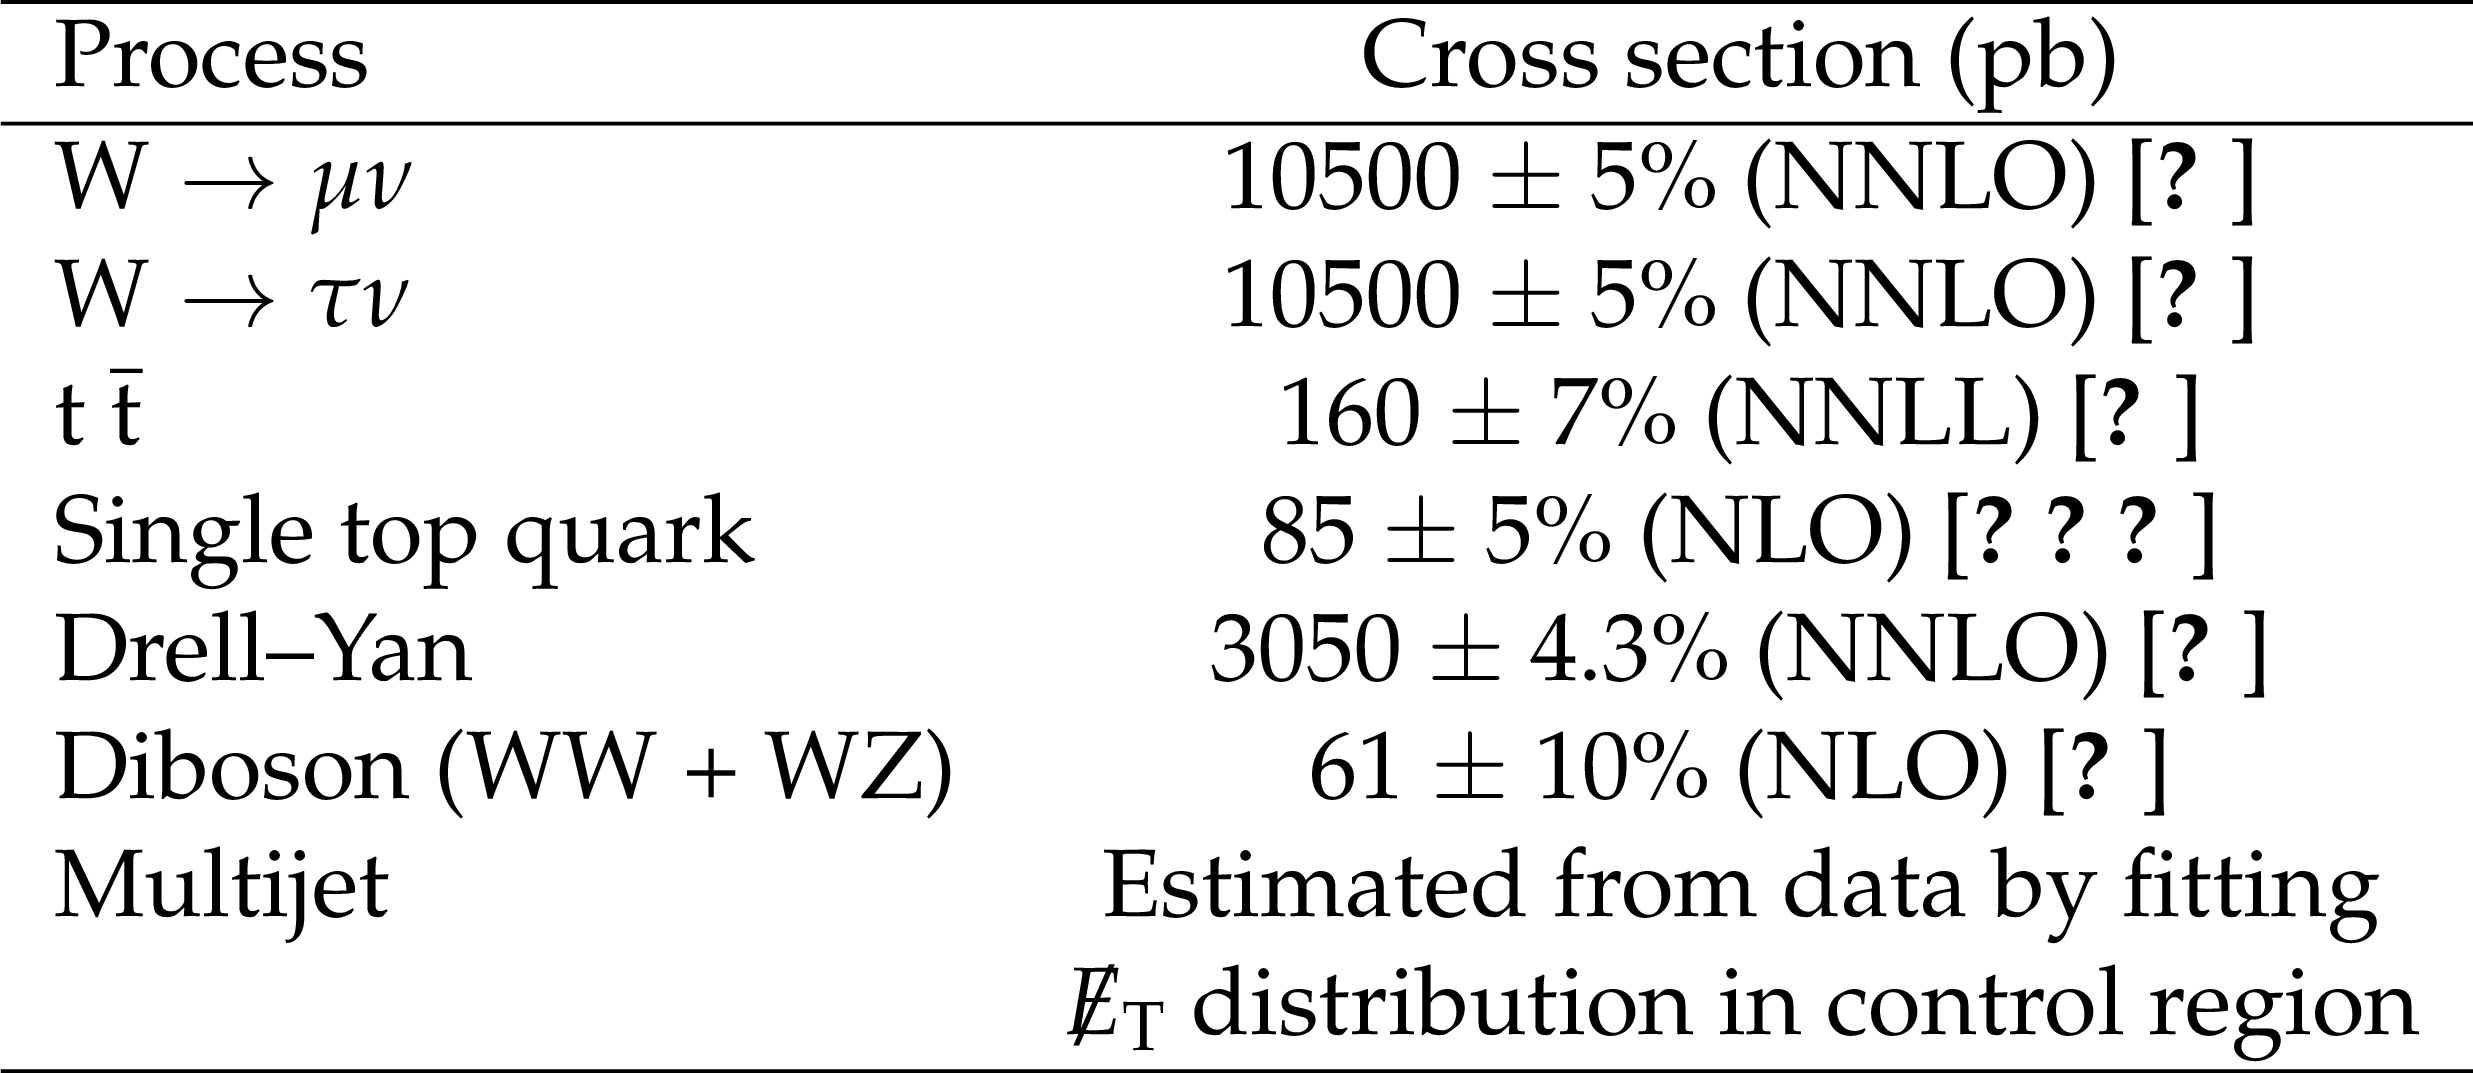
Table 1:
Cross sections of the various processes and their uncertainties. |

png pdf |
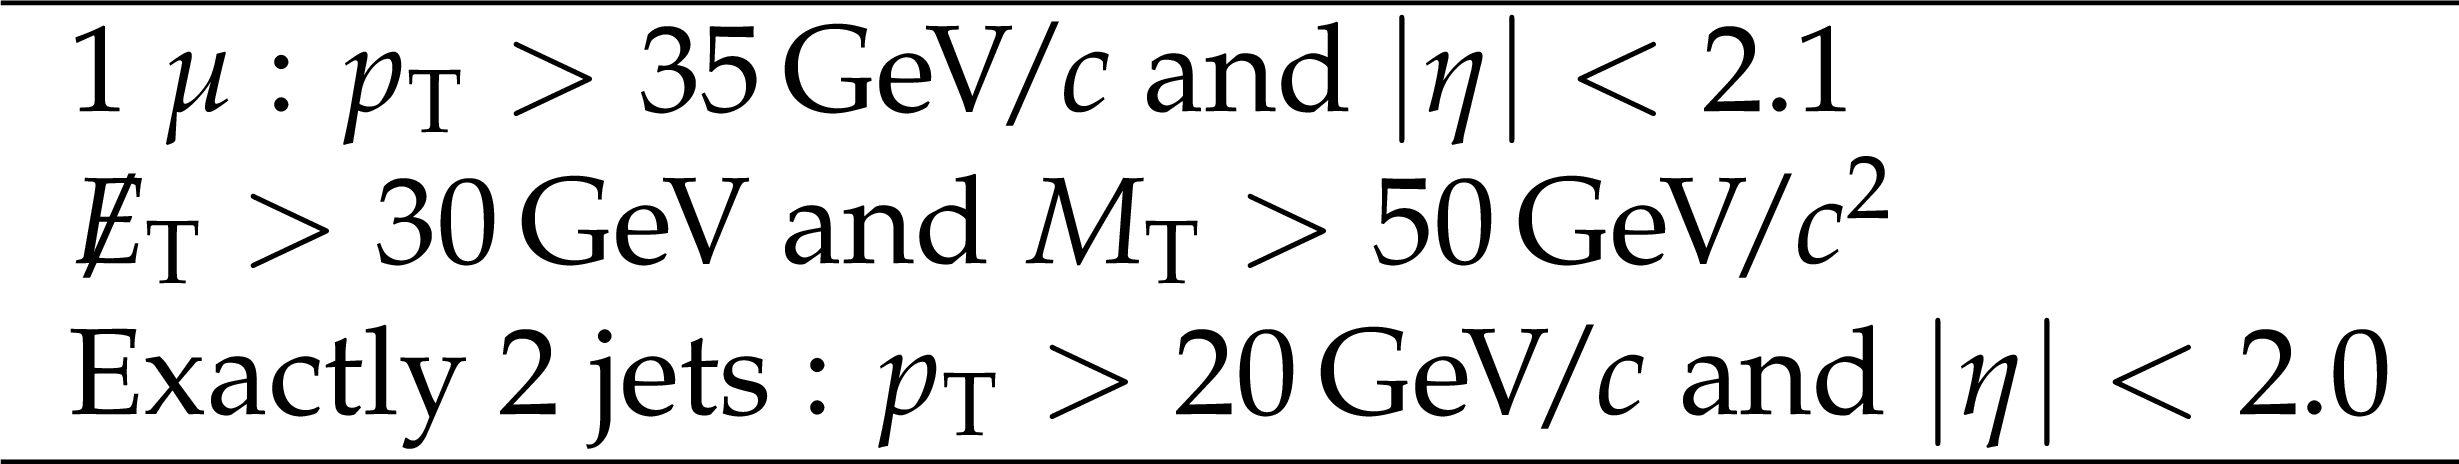
Table 2:
Summary of the W + 2-jet event selection and reconstruction criteria at the detector level. |

png pdf |
Table 3:
Expected yields for various processes for 5 fb$^{-1}$ and observed number of events in the data. The top production background is the sum of the single-top-quark and $\mathrm{ t \bar{t} } $ processes. The estimated event yields from the simulated samples include uncertainties in the respective cross sections. |
png pdf |
Table 4:
Phase space definition for the visible cross section at the particle level. |
png pdf |
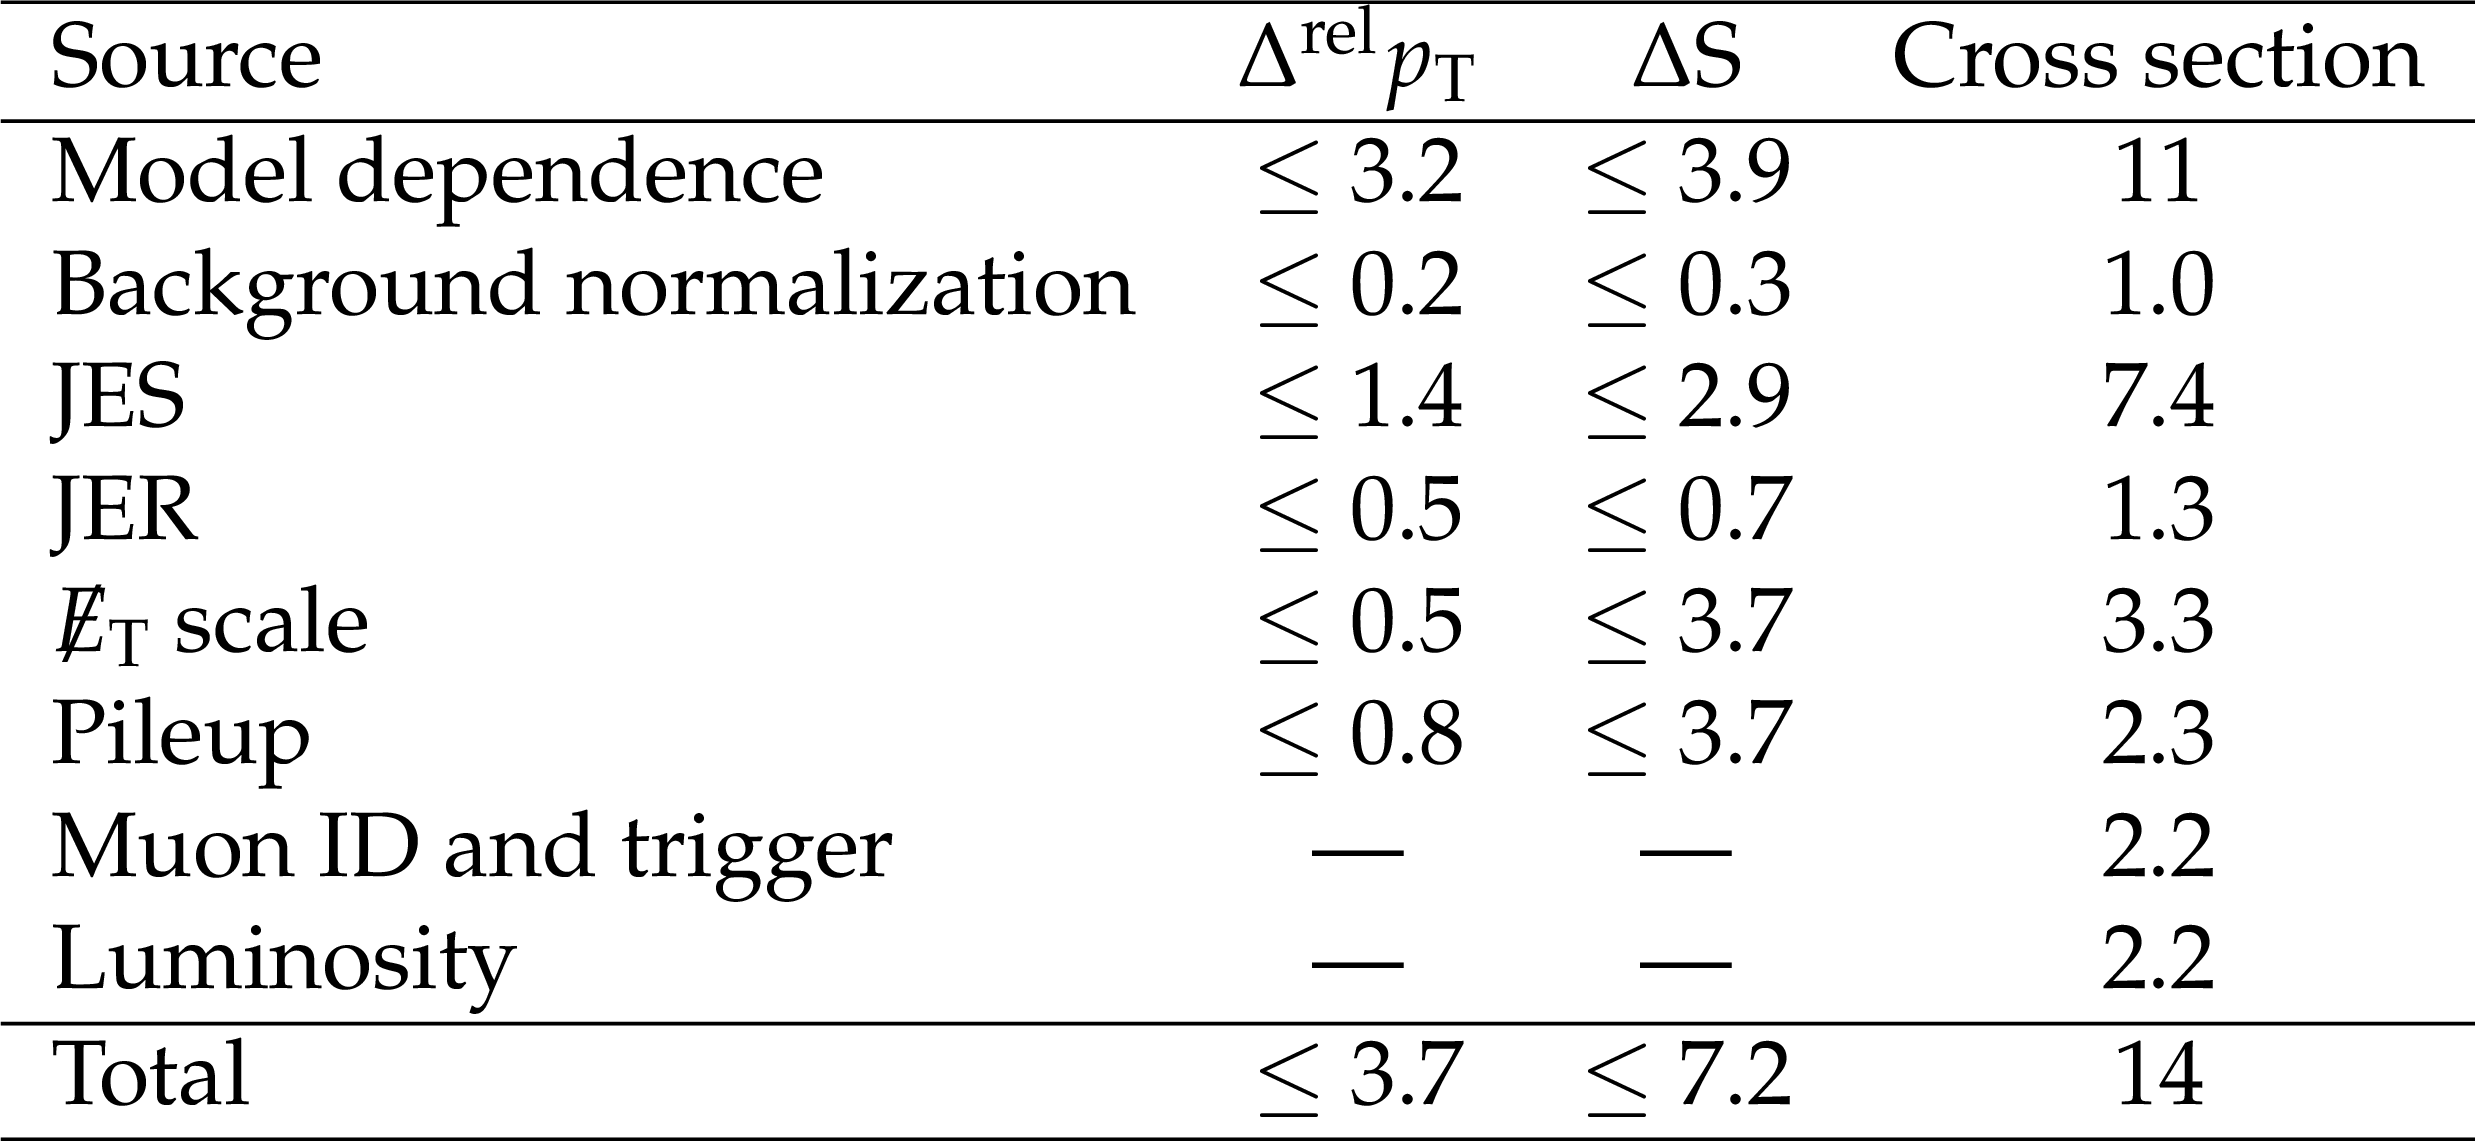
Table 5:
Summary of the systematic uncertainties (in %) for different observables. Uncertainties in integrated luminosity, muon identification (ID), and trigger efficiency only affect the W + 2-jet cross section measurement. |
png pdf |
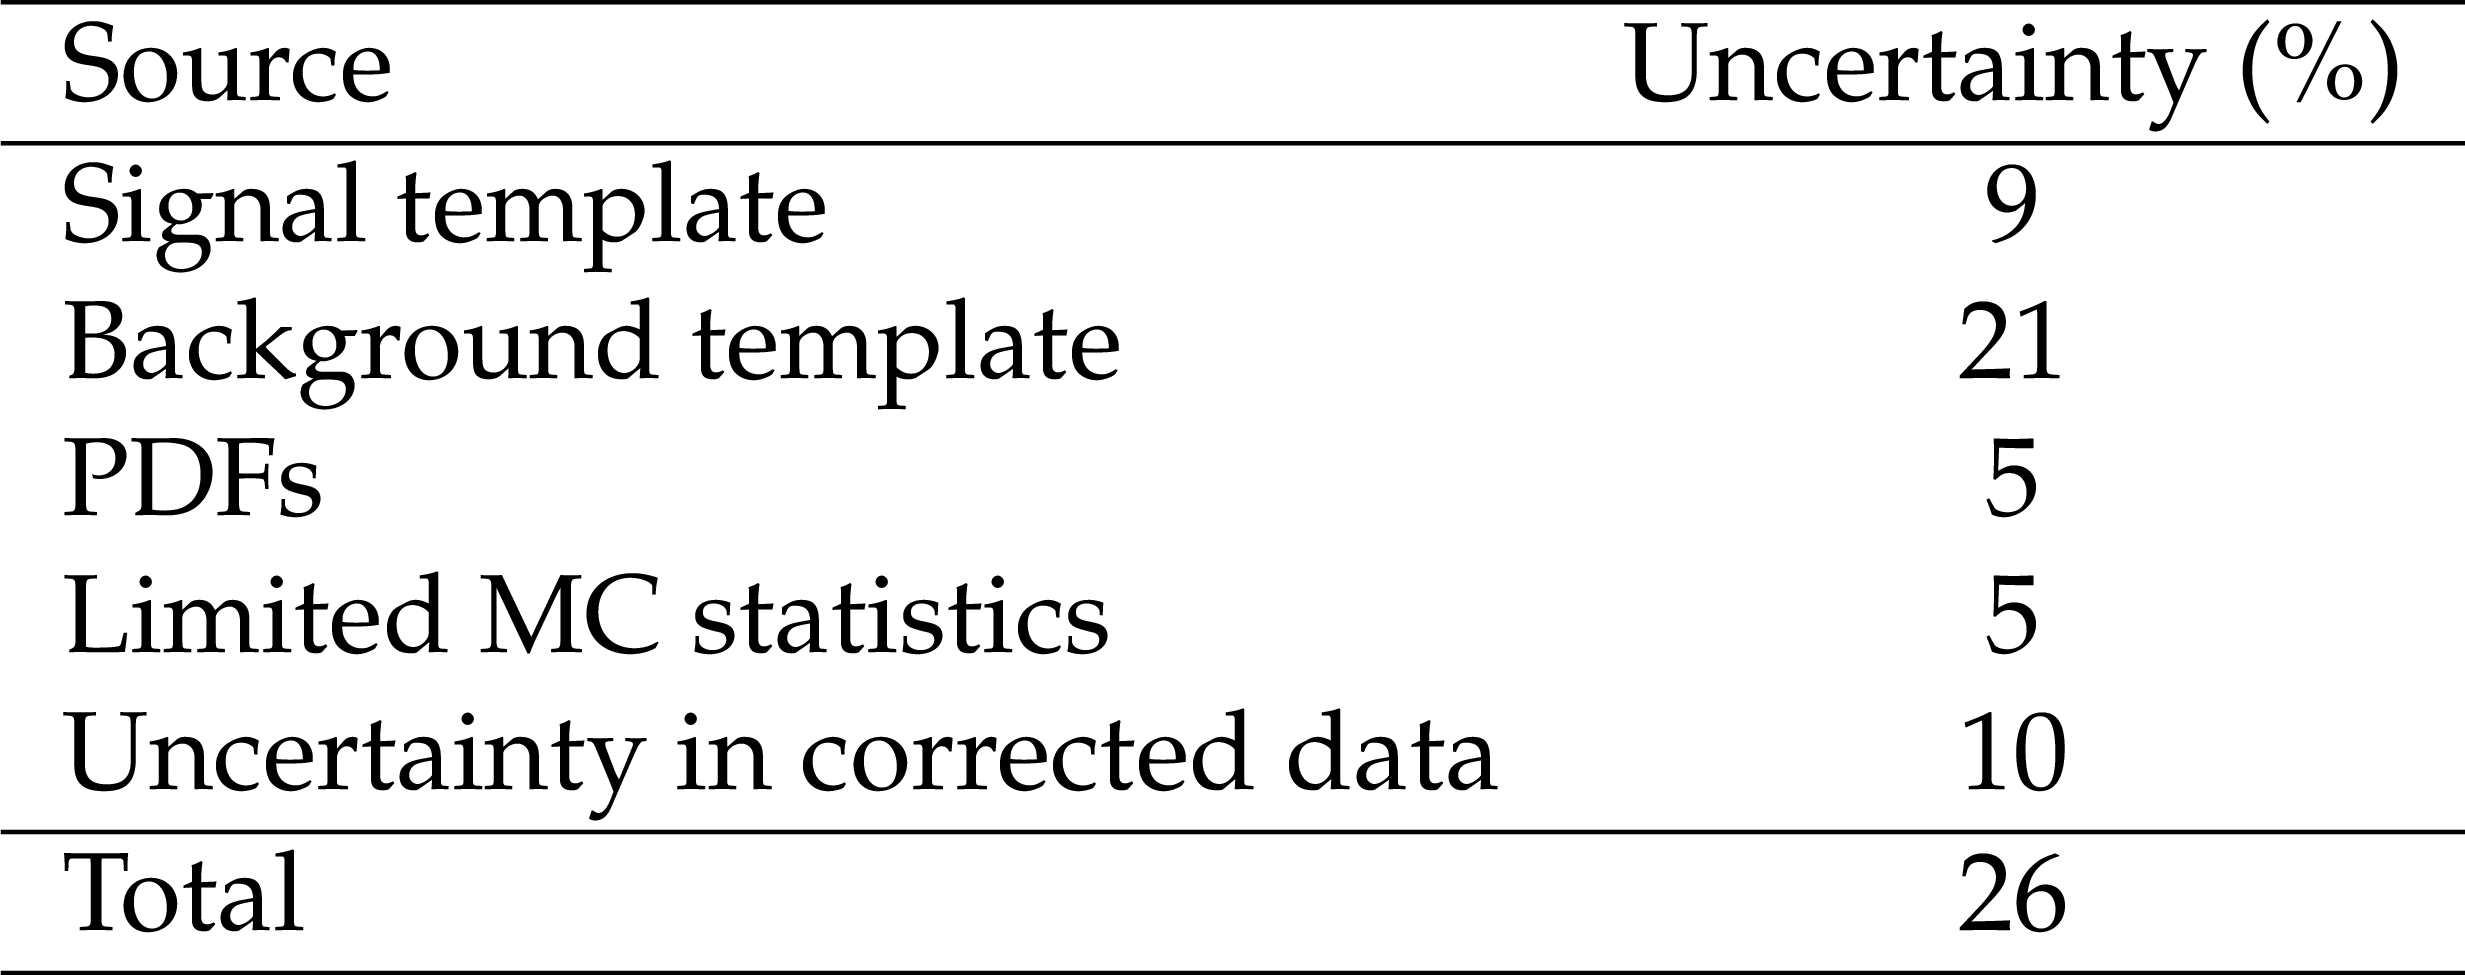
Table 6:
Systematic uncertainties in the DPS fraction determination. |
png pdf |
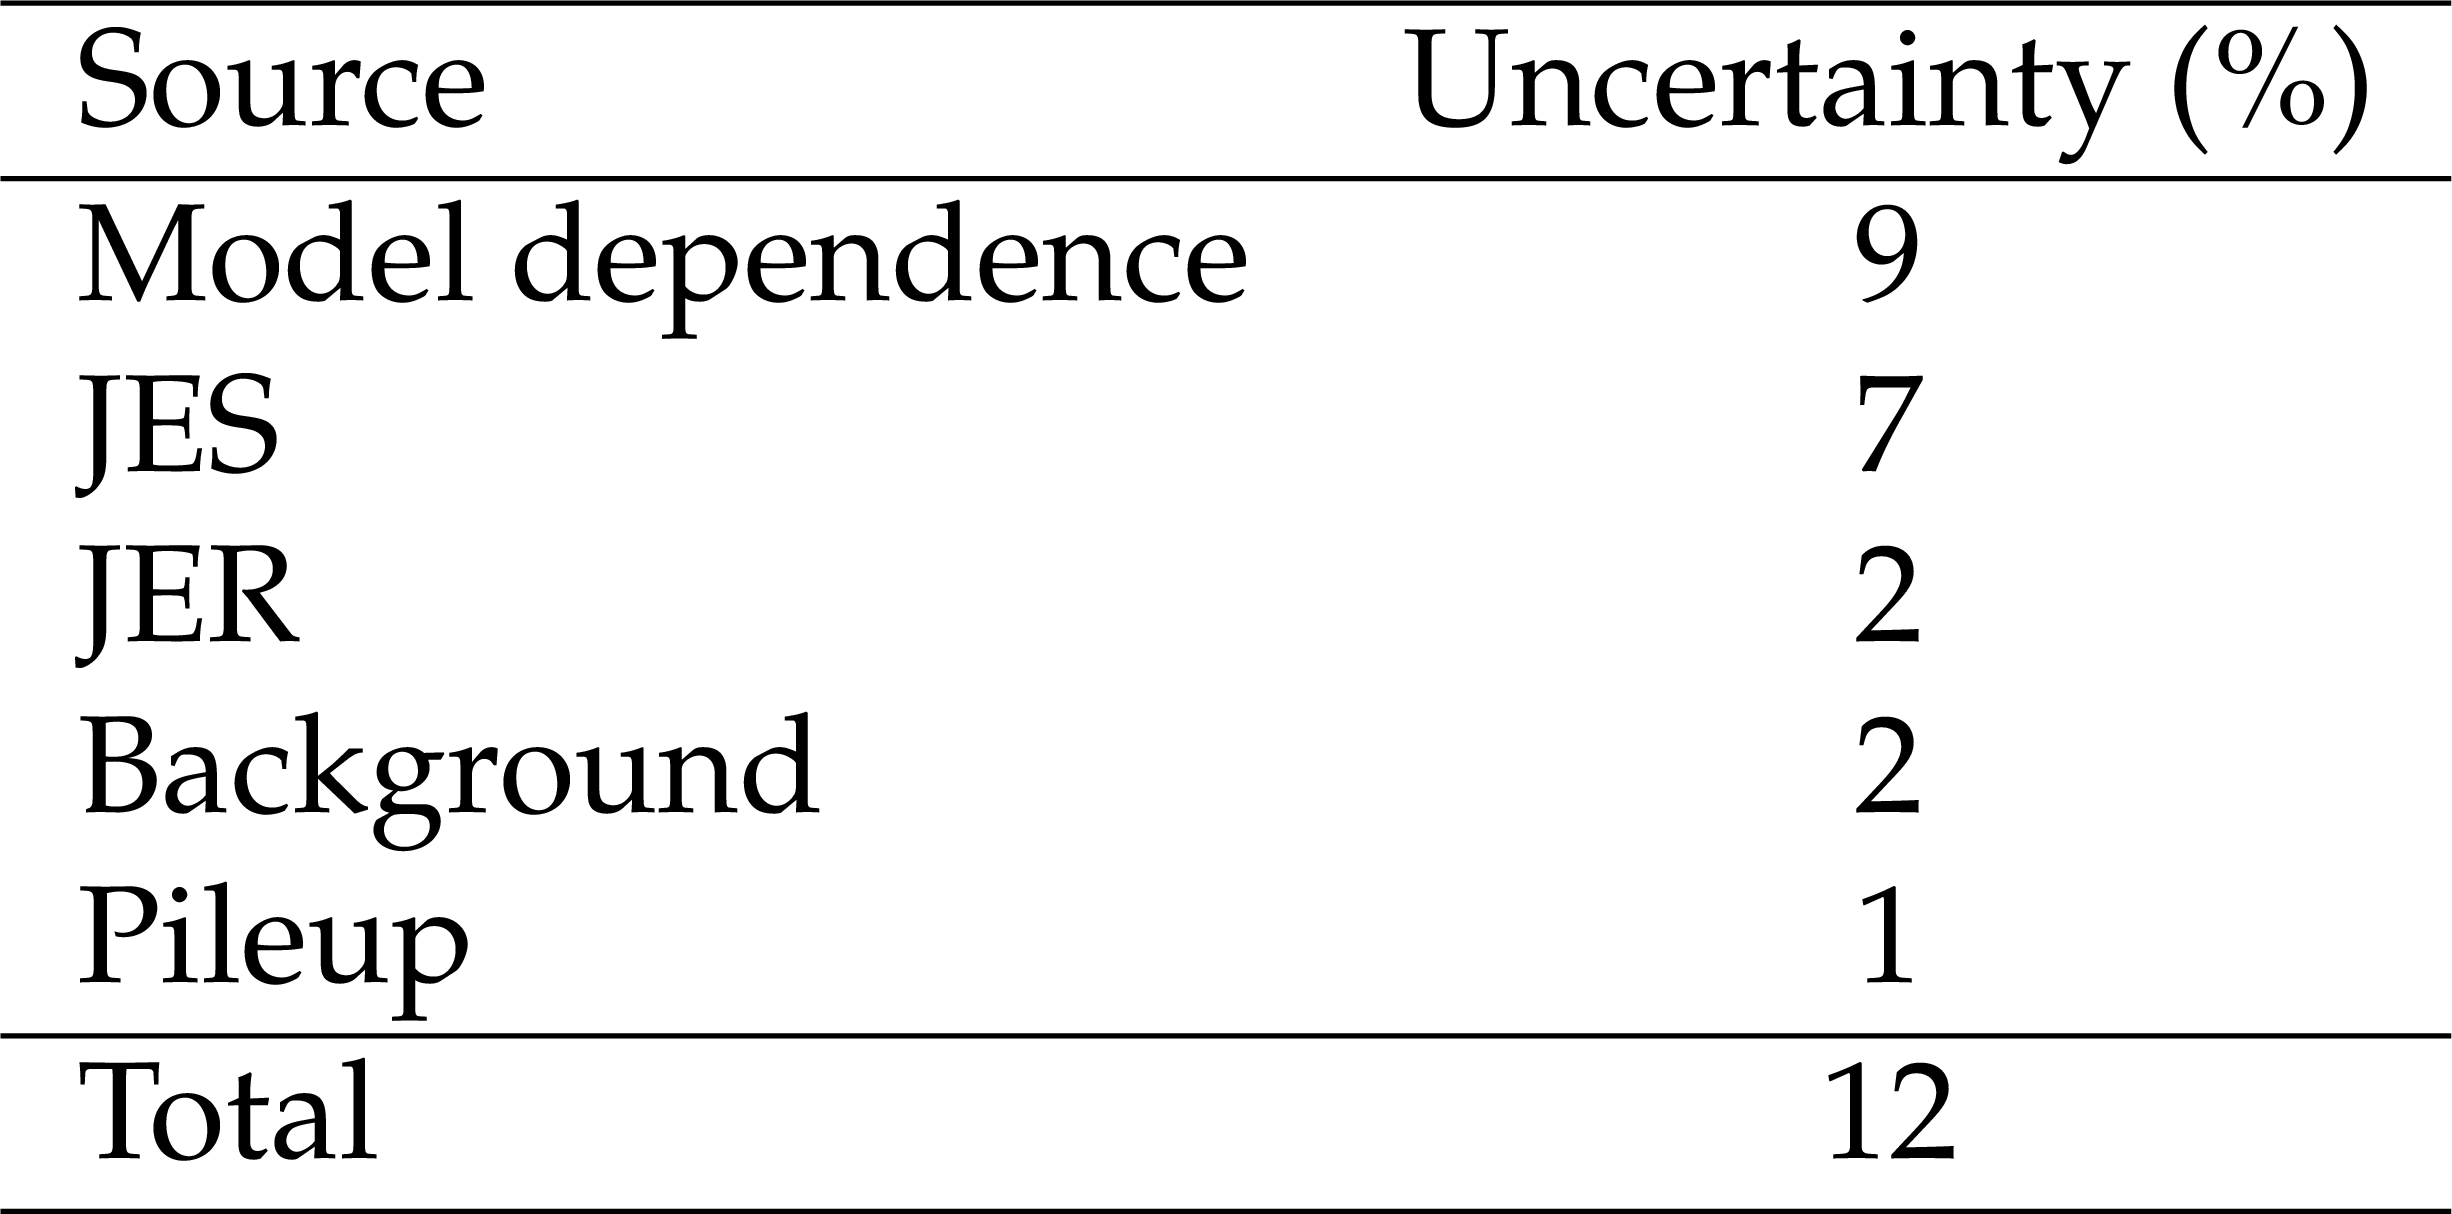
Table 7:
Systematic uncertainties in the measurement of $R$. |
png pdf |
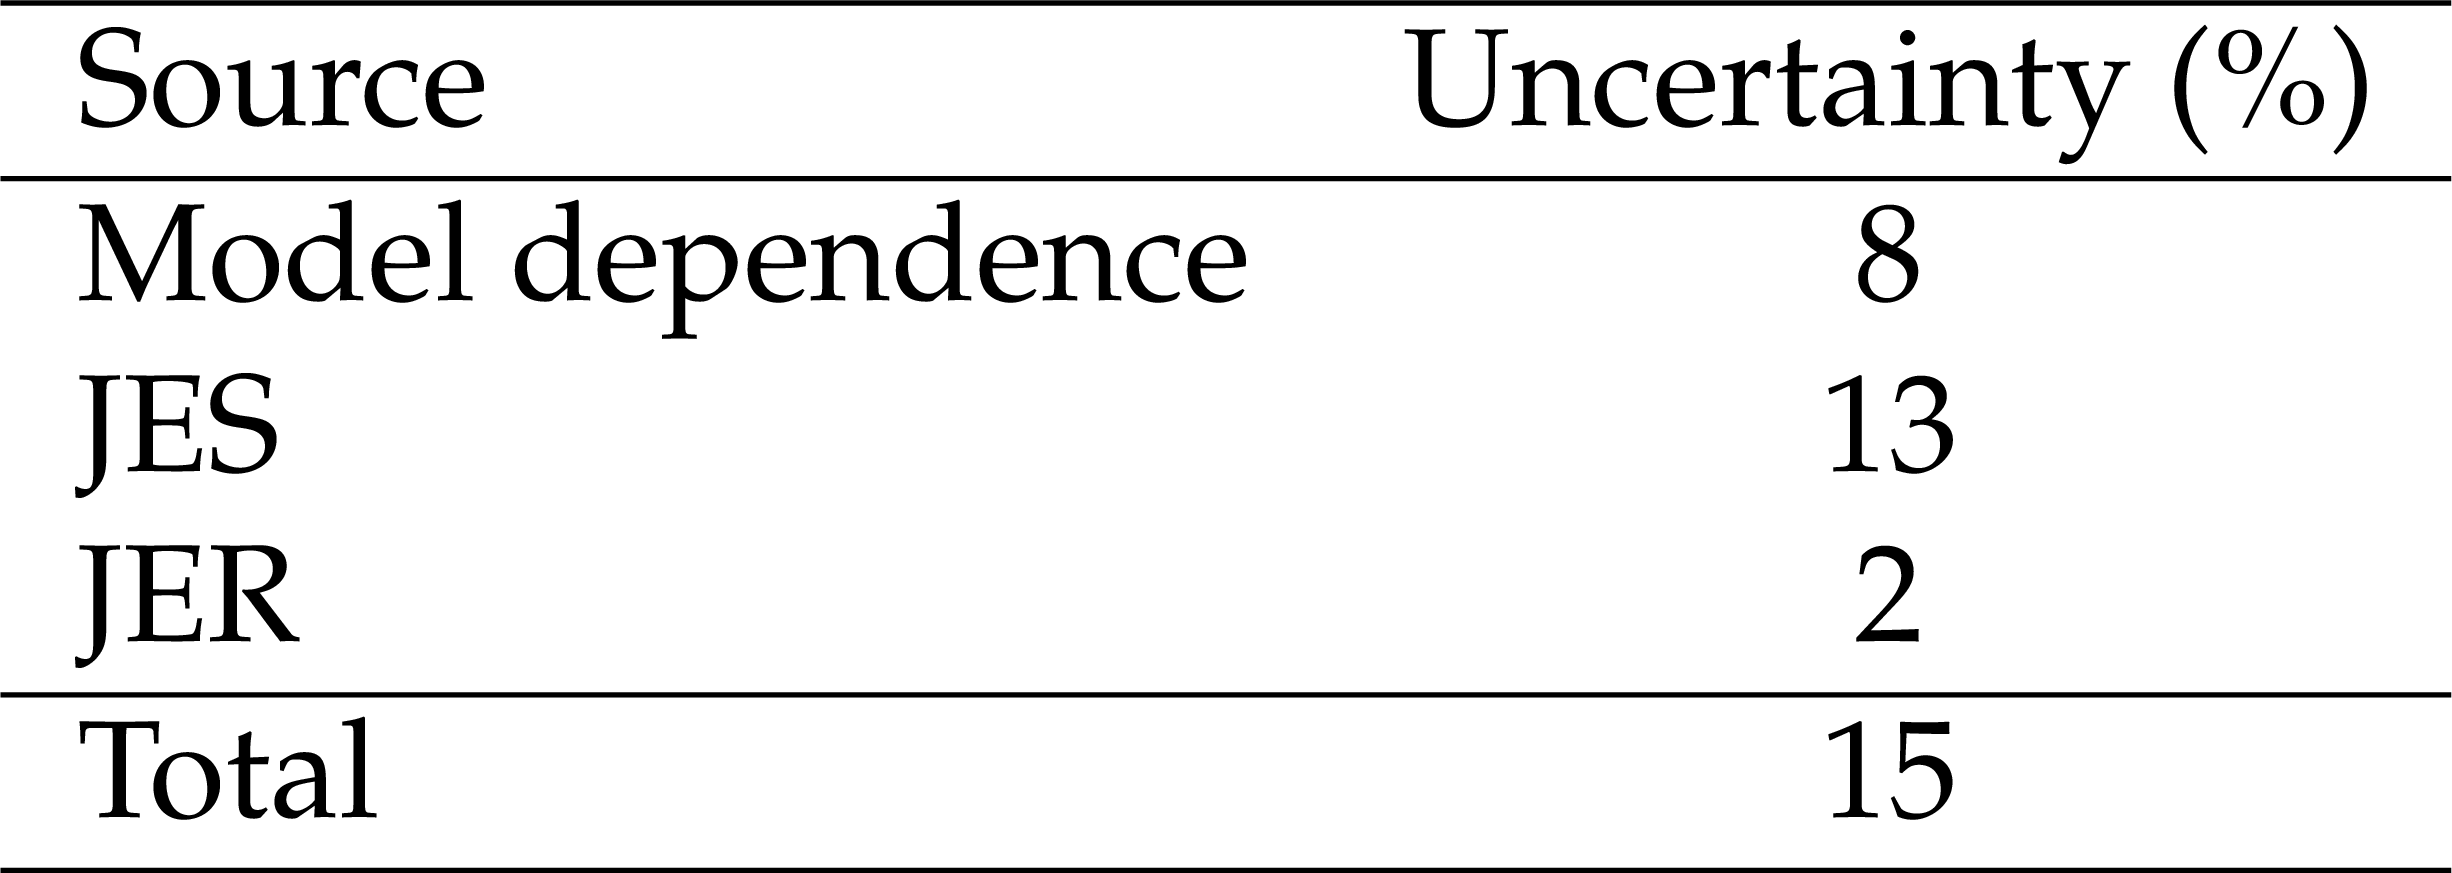
Table 8:
Uncertainties in the measured value of the dijet cross section. |
png pdf |
Table 9:
Measured value of ${f_\mathrm {DPS}}$, R, $\sigma '_{2 {\mathrm {j}} }$, and the effective cross section. |
| Summary |
| A study of double parton scattering in W + 2-jet events in pp collisions is presented. The data correspond to an integrated luminosity of 5 fb$^{-1}$ collected in pp collisions at a centre-of-mass energy of 7 TeV. Events with a W boson, reconstructed from the muon and $E_\mathrm{T}^{\text{miss}}$ information, are required to have exactly two jets with ${p_{\mathrm{T}}} > $ 20 GeV/$c$ and $ | {\eta} | < $ 2.0. The DPS-sensitive observables $\Delta ^\text{rel} {p_{\mathrm{T}}}$ and $\Delta S$ are corrected for detector effects and selection efficiencies. Simulations of W + jets events with MadGraph5 + PYTHIA8 (or PYTHIA6) and NLO predictions of POWHEG2 + PYTHIA6 (or HERWIG6) provide a good description of the observables and describe the data only if multiple parton interactions are included. The fraction of DPS in W + 2-jet events is extracted with a DPS + SPS template fit to the distribution of the $\Delta ^\text{rel} {p_{\mathrm{T}}}$ and ${\Delta\mathrm{S}} $ observables. |
| References | ||||
| 1 | T. Sj\"ostrand and M. Van Zijl | A Multiple Interaction Model for the Event Structure in Hadron Collisions | PRD 36 (1987) 2019 | |
| 2 | P. Bartalini and L. Fan\'o, eds. | 1003.4220 | ||
| 3 | M. Diehl, D. Ostermeier, and A. Sch\"afer | Elements of a theory for multiparton interactions in QCD | JHEP 03 (2012) 89 | 1111.0910 |
| 4 | G. Calucci and D. Treleani | Disentangling correlations in Multiple Parton Interactions | PRD 83 (2011) 016012 | 1009.5881 |
| 5 | A. D. Fabbro and D. Treleani | A double parton scattering background to Higgs boson production at the LHC | PRD 61 (2000) 077502 | hep-ph/9911358 |
| 6 | M. Y. Hussein | A double parton scattering background to associate WH and ZH production at the LHC | NPPS 174 (2007) 55 | hep-ph/0610207 |
| 7 | D. Bandurin, G. Golovanov, and N. Skachkov | Double parton interactions as a background to associated HW production at the Tevatron | JHEP 04 (2011) 054 | 1011.2186 |
| 8 | UA2 Collaboration | A study of multi-jet events at the CERN $ {\rm \bar{p}p} $ collider and a search for double parton scattering | PLB 268 (1991) 145 | |
| 9 | AFS Collaboration | Double parton scattering in pp collisions at $ \sqrt{s} $ = 63 GeV | Z. Phys. C 34 (1987) 163 | |
| 10 | CDF Collaboration | Study of four jet events and evidence for double parton interactions in $ {\rm p\bar{p}} $ collisions at $ \sqrt{s} $ = 1.8 TeV | PRD 47 (1993) 4857 | |
| 11 | CDF Collaboration | Double parton scattering in $ {\rm p\bar{p}} $ collisions at $ \sqrt{s} $ = 1.8 TeV | PRD 56 (1997) 3811 | |
| 12 | D0 Collaboration | Double parton interactions in photon + 3 jet events $ {\rm p\bar{p}} $ collisions at $ \sqrt{s} $ = 1.96 TeV | PRD 81 (2010) 052012 | hep-ex/0912.5104 |
| 13 | C. Goebel, F. Halzen, and D. M. Scott | Double Drell--Yan annihilations in hadron collisions: novel tests of the constituent picture | PRD 22 (1980) 2789 | |
| 14 | M. Mekhfi | Multiparton processes: an application to double Drell--Yan | PRD 32 (1985) 2371 | |
| 15 | B. Humpert and R. Odorico | Multiparton scattering and QCD radiation as sources of four jet events | PLB 154 (1985) 211 | |
| 16 | L. Ametller, N. Paver, and D. Treleani | Possible signature of multiple parton interactions in collider four jet events | PLB 169 (1986) 289 | |
| 17 | E. L. Berger, C. B. Jackson, and G. Shaughnessy | Characteristics and Estimates of Double Parton Scattering at the Large Hadron Collider | PRD 81 (2010) 014014 | 0911.5348 |
| 18 | R. M. Godbole, S. Gupta, and J. Lindfors | Double parton scattering contribution to W + Jets | Z. Phys. C 47 (1990) 69 | |
| 19 | E. L. Berger, C. B. Jackson, S. Quackenbush, and G. Shaughnessy | Calculation of W b bbar Production via Double Parton Scattering at the LHC | PRD 84 (2011) 074021 | 1107.3150 |
| 20 | J. R. Gaunt, C.-H. Kom, A. ulesza, and W. J. Stirling | Same-sign W pair production as a probe of double-parton scattering at the LHC | EPJC 69 (2010) 53 | hep-ph/1003.3953 |
| 21 | ATLAS Collaboration | Measurement of hard double-parton interactions in W($ \rightarrow $lv) + 2-jet events at $ \sqrt{s} $ = 7 TeV with the ATLAS detector | New J. Phys. 15 (2013) 033038 | 1301.6872 |
| 22 | D. Treleani | Double parton scattering, diffraction and effective cross section | PRD 76 (2007) 076006 | 0708.2603 |
| 23 | M. B\"ahr, M. Myska, M. H. Seymour, and A. Siodmok | Extracting $ \sigma_{\rm eff} $ from the CDF $ \gamma $ + 3 jets measurement | JHEP 03 (2013) 129 | 1302.4325 |
| 24 | M. H. Seymour and A. Siodmok | Extracting $ \sigma_{\rm eff} $ from the LHCb double-charm measurement | 1308.6749 | |
| 25 | J. Alwall et al. | MadGraph 5: going beyond | JHEP 06 (2011) 128 | 1106.0522 |
| 26 | F. Maltoni and T. Stelzer | MadEvent: Automatic event generation with MadGraph | JHEP 02 (2003) 027 | hep-ph/0208156 |
| 27 | R. Corke and T. Sj\"ostrand | Interleaved parton showers and tuning prospects | JHEP 03 (2011) 032 | 1011.1759 |
| 28 | T. Sj\"ostrand, S. Mrenna, and P. Z. Skands | A brief introduction to PYTHIA 8.1 | CPC 178 (2008) 852 | 0710.3820 |
| 29 | CMS Collaboration | The CMS experiment at the CERN LHC | JINST 3 (2008) S08004 | CMS-00-001 |
| 30 | R. Field | Early LHC Underlying Event Data - Findings and Surprises | 1010.3558 | |
| 31 | T. Sj\"ostrand, S. Mrenna, and P. Z. Skands | PYTHIA 6.4 physics and manual | JHEP 05 (2006) 026 | hep-ph/0603175 |
| 32 | K. Hamilton and P. Nason | Improving NLO-parton shower matched simulations with higher order matrix elements | JHEP 06 (2010) 039 | 1004.1764 |
| 33 | K. Melnikov and F. Petriello | Electroweak gauge boson production at hadron colliders through $ O(\alpha_s^{2}) $ | PRD 74 (2006) 114017 | hep-ph/0609070 |
| 34 | N. Kidonakis | Next-to-next-to-leading soft-gluon corrections for top quark cross section and transverse momentum distribution | PRD 82 (2010) 114030 | 1009.4935 |
| 35 | N. Kidonakis | NNLL resummation for $ s $-channel single top quark production | PRD 81 (2010) 054028 | 1001.5034 |
| 36 | N. Kidonakis | Next-to-next-to-leading-order collinear and soft gluon corrections for t-channel single top quark production | PRD 83 (2011) 091503 | 1103.2792 |
| 37 | N. Kidonakis | Two-loop soft anomalous dimensions for single top quark associated production with a $ {\rm W^{-}} $ or $ {\rm H^{-}} $ | PRD 82 (2010) 054018 | 1005.4451 |
| 38 | J. M. Campbell, R. K. Ellis, and C. Williams | Vector boson pair production at the LHC | JHEP 07 (2011) 018 | |
| 39 | GEANT4 Collaboration | GEANT4---a simulation toolkit | NIMA 506 (2003) 250 | |
| 40 | CMS Collaboration | Study of the underlying event at forward rapidity in pp collisions at $ \sqrt{s} $ = 0.9, 2.76, and 7 TeV | JHEP 04 (2013) 072 | CMS-FWD-11-003 1302.2394 |
| 41 | K. Hamilton, P. Nason, and G. Zanderighi | MINLO: multi-scale improved NLO | JHEP 10 (2012) 155 | 1206.3572 |
| 42 | J. M. Campbell, R. K. Ellis, P. Nason, and G. Zanderighi | W and Z bosons in association with two jets using the POWHEG method | JHEP 08 (2013) 005 | 1303.5447 |
| 43 | G. Marchesini et al. | HERWIG: A Monte Carlo event generator for simulating hadron emission reactions with interfering gluons. Version 5.1 - April 1991 | CPC 67 (1992) 465 | |
| 44 | G. Corcella et al. | HERWIG 6: an event generator for hadron emission reactions with interfering gluons (including supersymmetric processes) | JHEP 01 (2001) 10 | hep-ph/0011363 |
| 45 | J. Pumplin et al. | New generation of parton distributions with uncertainties from global QCD analysis | JHEP 07 (2002) 012 | hep-ph/0201195 |
| 46 | CMS Collaboration | Measurement of the inclusive W and Z production cross sections in pp collisions at $ \sqrt{s} $ = 7 TeV with the CMS experiment | JHEP 10 (2011) 132 | CMS-EWK-10-005 1107.4789 |
| 47 | CMS Collaboration | Measurement of the underlying event in the Drell-Yan process in proton-proton collisions at $ \sqrt{s} $ = 7 TeV | EPJC 72 (2012) 2080 | CMS-QCD-11-012 1204.1411 |
| 48 | CMS Collaboration | Particle-Flow Event Reconstruction in CMS and Performance for Jets, Taus, and MET | CDS | |
| 49 | M. Cacciari, G. P. Salam, and G. Soyez | The anti-$ k_{T} $ jet clustering algorithm | JHEP 04 (2008) 063 | 0802.1189 |
| 50 | M. Cacciari, G. P. Salam, and G. Soyez | FastJet user manual | EPJC 72 (2012) 1896 | 1111.6097 |
| 51 | M. Cacciari and G. P. Salam | Dispelling the $ N^{3} $ myth for the $ k_T $ jet-finder | PLB 641 (2006) 57 | hep-ph/0512210 |
| 52 | CMS Collaboration | Identification and filtering of uncharacteristic noise in the CMS hadron calorimeter | JINST 5 (2010) T03014 | CMS-CFT-09-019 0911.4881 |
| 53 | CMS Collaboration | Determination of jet energy calibration and transverse momentum resolution in CMS | JINST 6 (2011) P11002 | CMS-JME-10-011 1107.4277 |
| 54 | M. Cacciari and G. P. Salam | Pileup subtraction using jet areas | PLB 659 (2008) 119 | 0707.1378 |
| 55 | CMS Collaboration | Missing transverse energy performance of the CMS detector | JINST 6 (2011) P09001 | CMS-JME-10-009 1106.5048 |
| 56 | G. D'Agostini | A Multidimensional unfolding method based on Bayes' theorem | NIMA 362 (1995) 487 | |
| 57 | A. H\"ocker and V. Kartvelishvili | SVD approach to data unfolding | NIMA 372 (1996) 469 | hep-ph/9509307 |
| 58 | CMS Collaboration | Absolute Calibration of the Luminosity Measurement at CMS: Winter 2012 Update | CDS | |
| 59 | M. B\"ahr et al. | Herwig++ physics and manual | EPJC 58 (2008) 639 | 0803.0883 |
| 60 | PDF4LHC Working Group | The PDF4LHC Working Group Interim Recommendations | 1101.0536 | |
| 61 | CMS Collaboration | Measurement of the Inclusive Jet Cross Section in pp Collisions at $ \sqrt{s} $ = 7 TeV | PRL 107 (2011) 132001 | CMS-QCD-10-011 1106.0208 |
| 62 | M. H. Seymour and A. Siodmok | Constraining MPI models using $ \sigma_{\rm eff} $ and recent Tevatron and LHC underlying event data | JHEP 10 (2013) 113 | 1307.5015 |
|
|
Compact Muon Solenoid LHC, CERN |
|

|

|

|

|

|