

Compact Muon Solenoid
LHC, CERN
| CMS-FSQ-16-004 ; CERN-EP-2017-091 | ||
| Measurement of charged pion, kaon, and proton production in proton-proton collisions at $\sqrt{s} = $ 13 TeV | ||
| CMS Collaboration | ||
| 30 June 2017 | ||
| Phys. Rev. D 96 (2017) 112003 | ||
| Abstract: Transverse momentum spectra of charged pions, kaons, and protons are measured in proton-proton collisions at $\sqrt{s} = $ 13 TeV with the CMS detector at the LHC. The particles, identified via their energy loss in the silicon tracker, are measured in the transverse momentum range of $p_{\mathrm{T}} \approx $ 0.1-1.7 GeV/$c$ and rapidities $| y | < $ 1. The $ p_{\mathrm{T}} $ spectra and integrated yields are compared to previous results at smaller $\sqrt{s}$ and to predictions of Monte Carlo event generators. The average $ p_{\mathrm{T}} $ increases with particle mass and charged particle multiplicity of the event. Comparisons with previous CMS results at $\sqrt{s} = $ 0.9, 2.76, and 7 TeV show that the average $ p_{\mathrm{T}} $ and the ratios of hadron yields feature very similar dependences on the particle multiplicity in the event, independently of the center-of-mass energy of the pp collision. | ||
| Links: e-print arXiv:1706.10194 [hep-ex] (PDF) ; CDS record ; inSPIRE record ; HepData record ; CADI line (restricted) ; | ||
| Figures & Tables | Summary | Additional Figures | References | CMS Publications |
|---|
| Figures | |
png pdf |
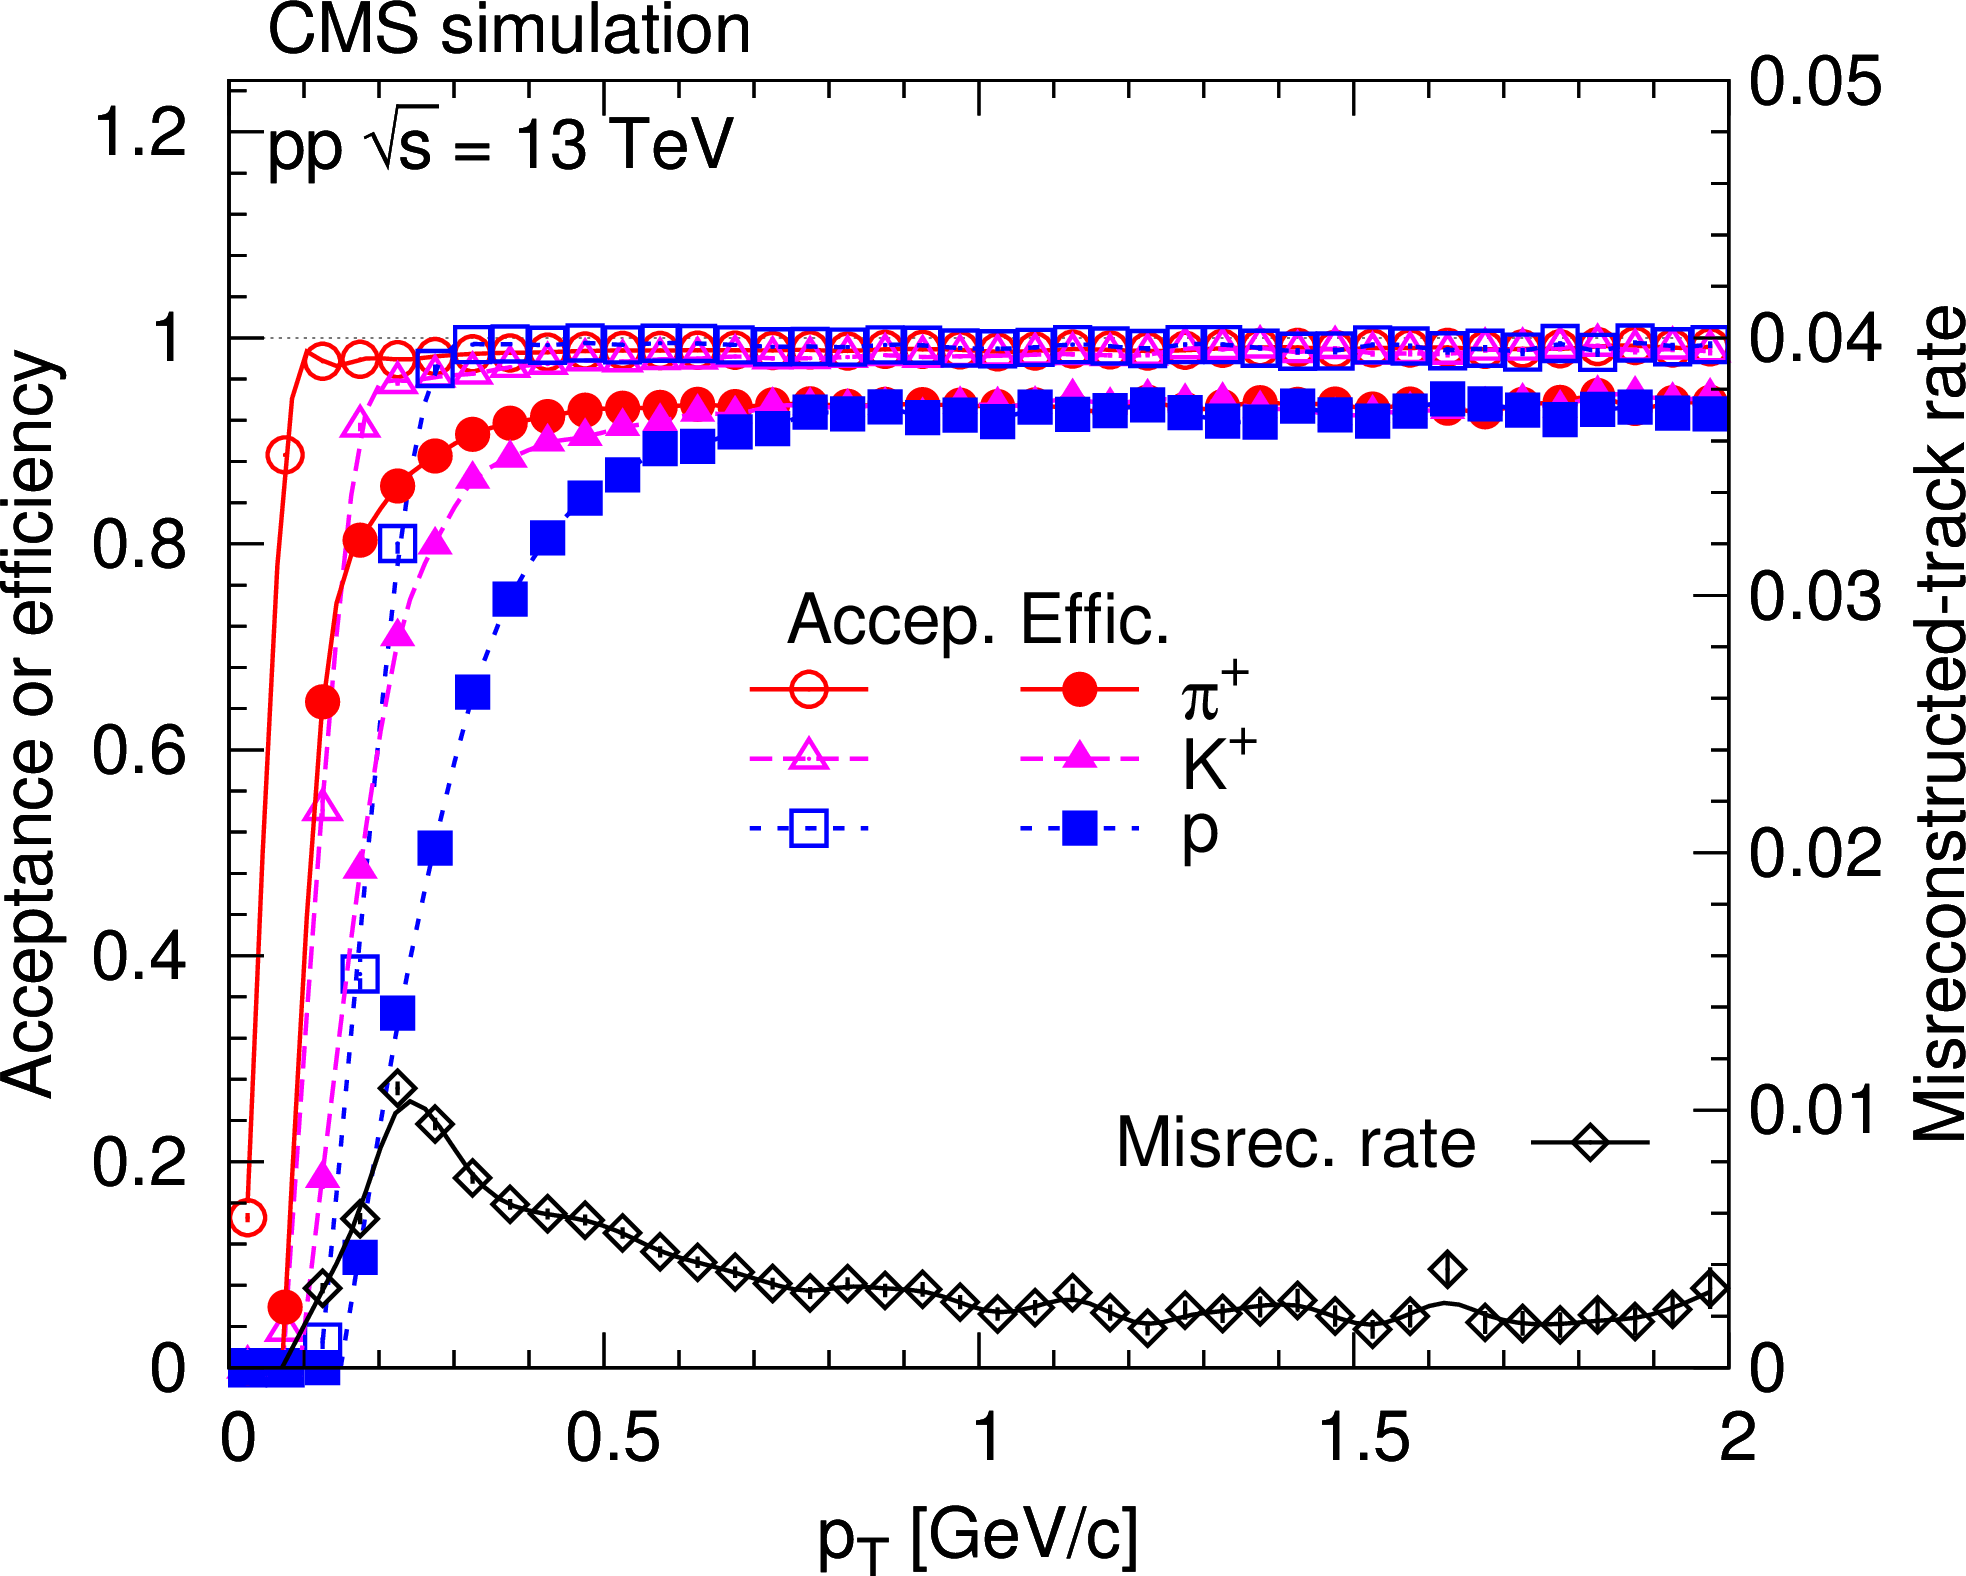
Figure 1:
Acceptance (open markers, left scale), tracking efficiency (filled markers, left scale), and misreconstructed-track rate (right scale) in the range $ {| \eta | } < $ 2.4 as a function of $ {p_{\mathrm {T}}} $ for positively charged pions, kaons, and protons. The values are very similar for negatively charged particles. |
png pdf |
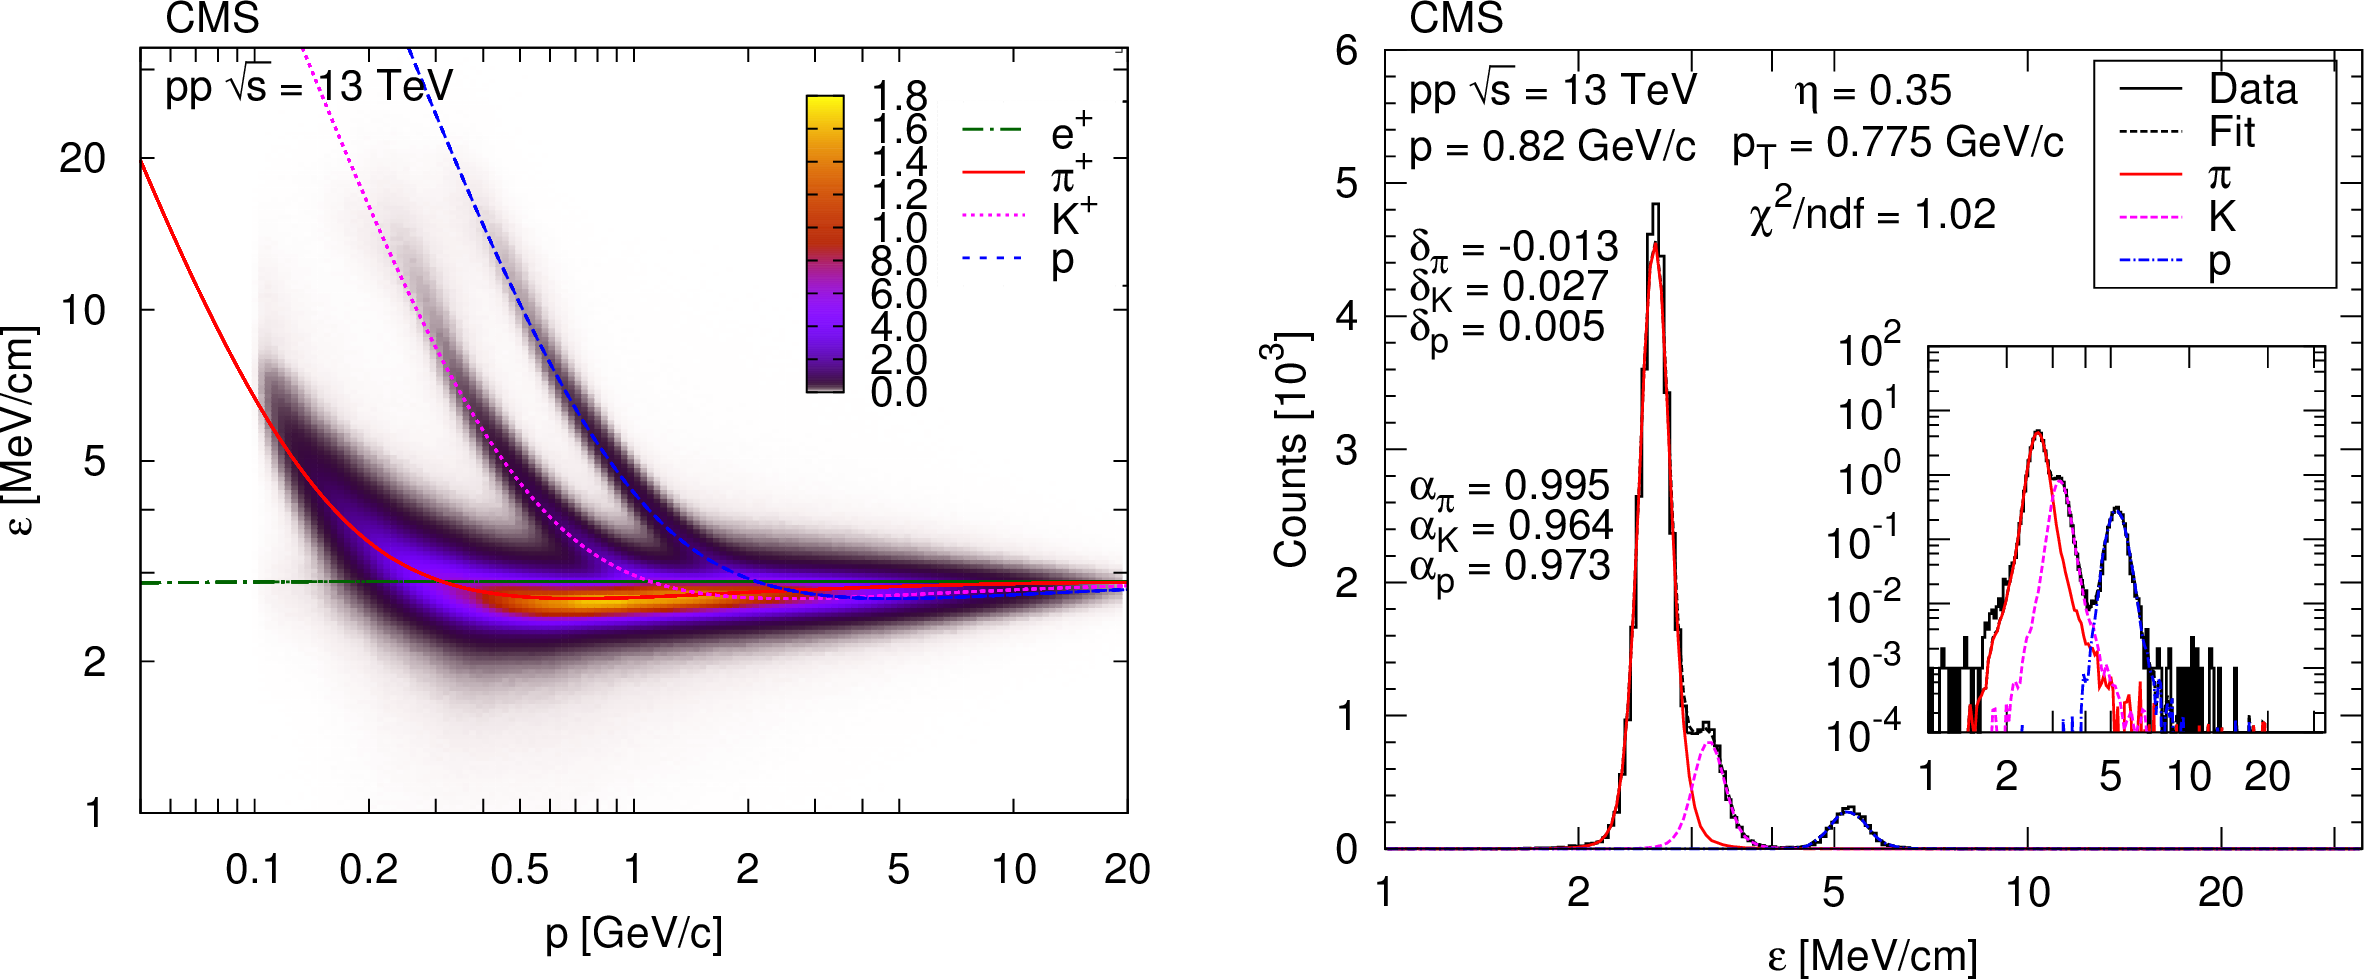
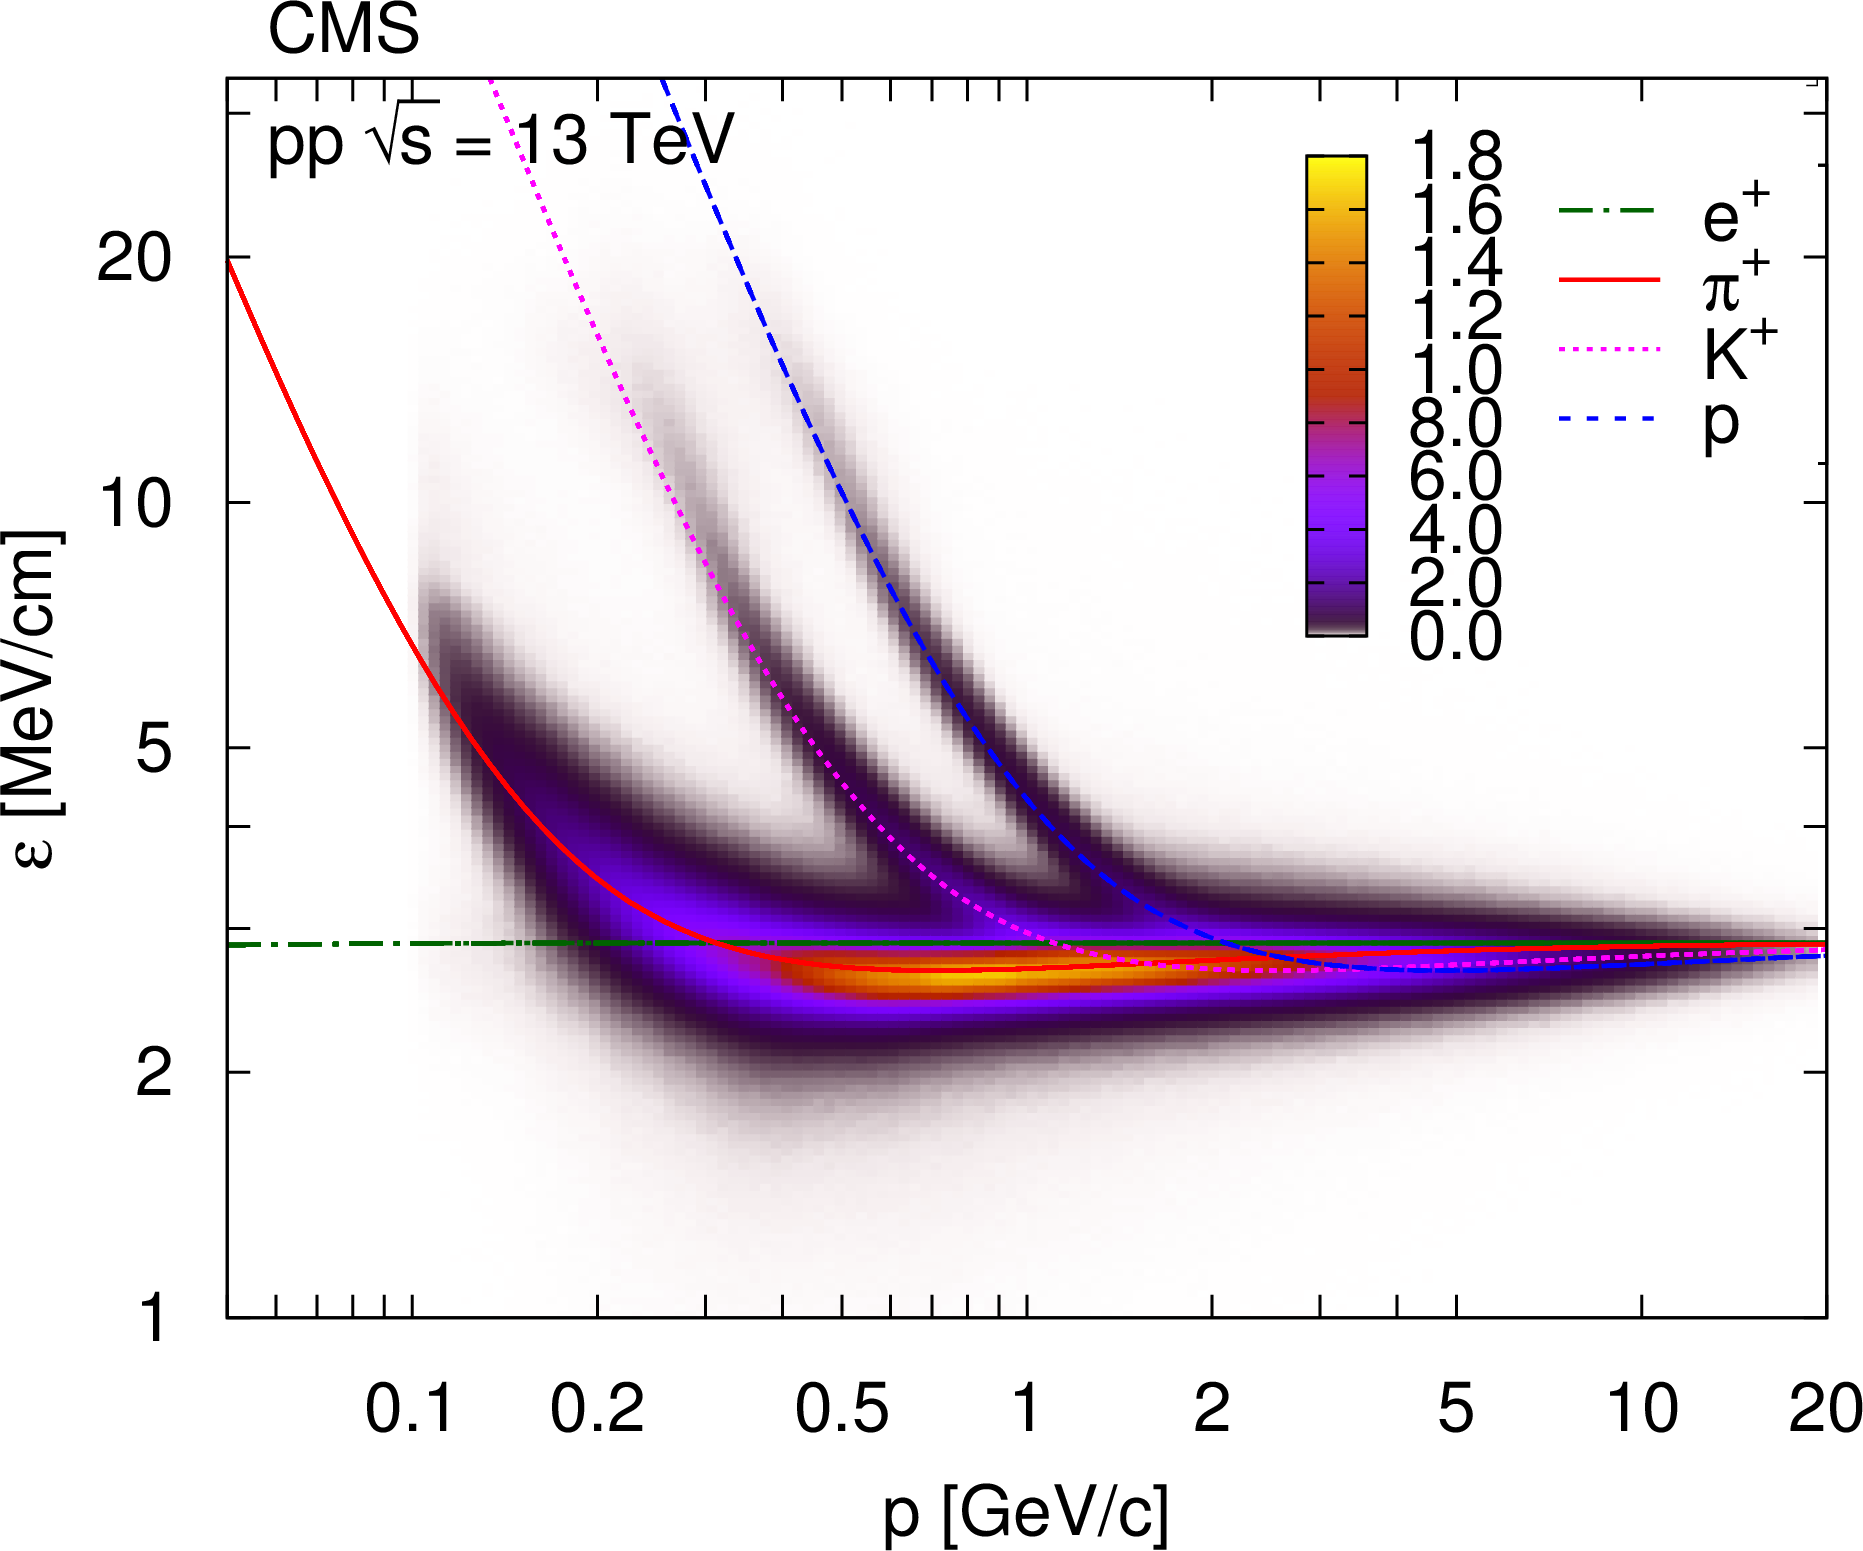
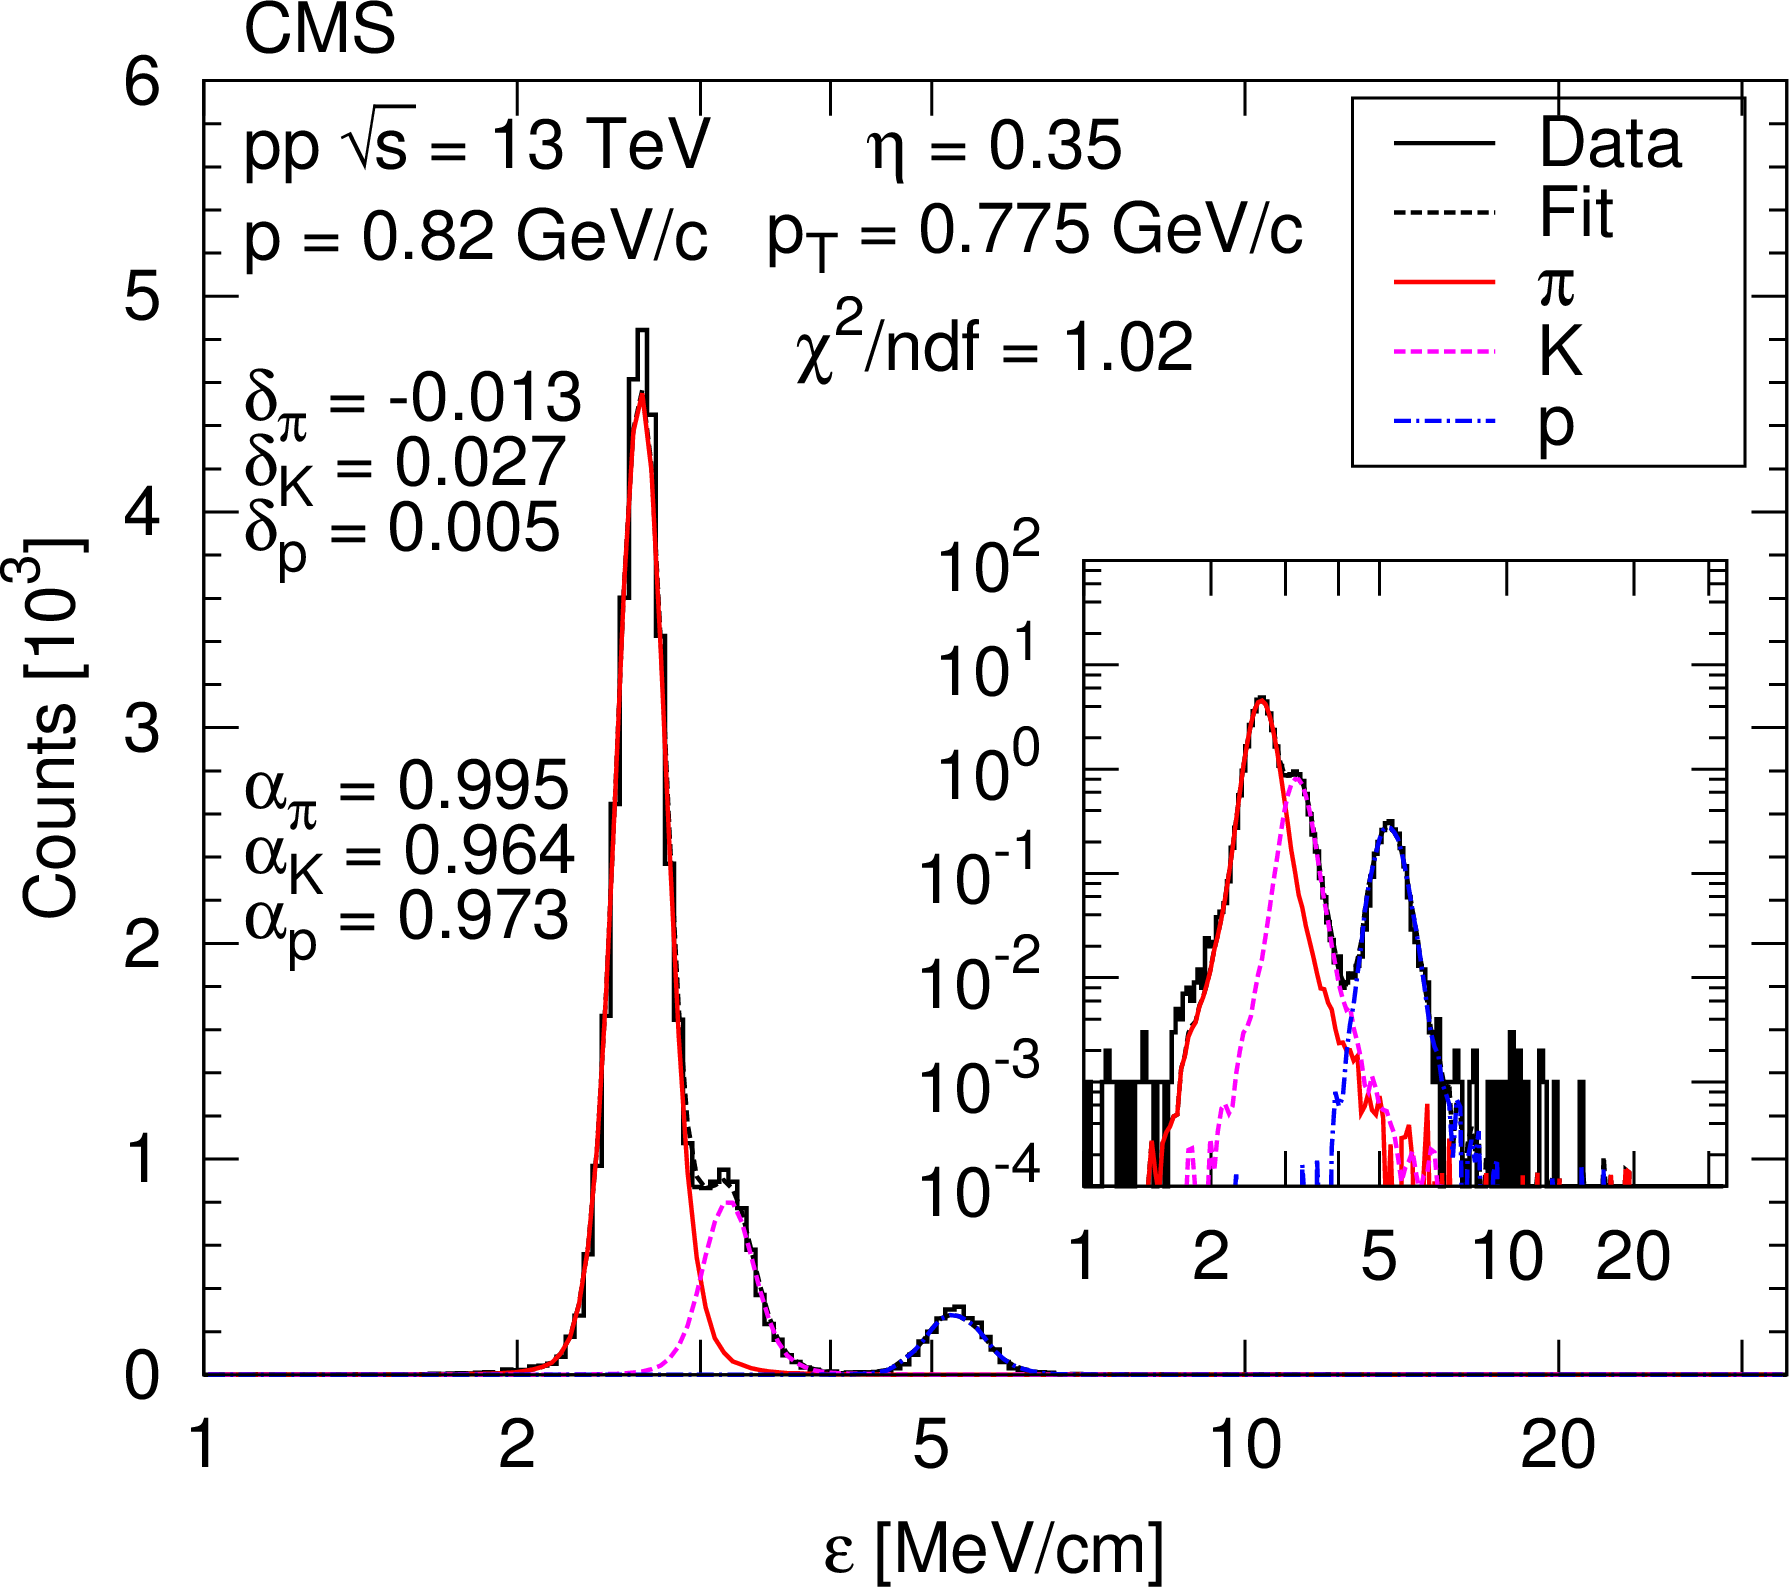
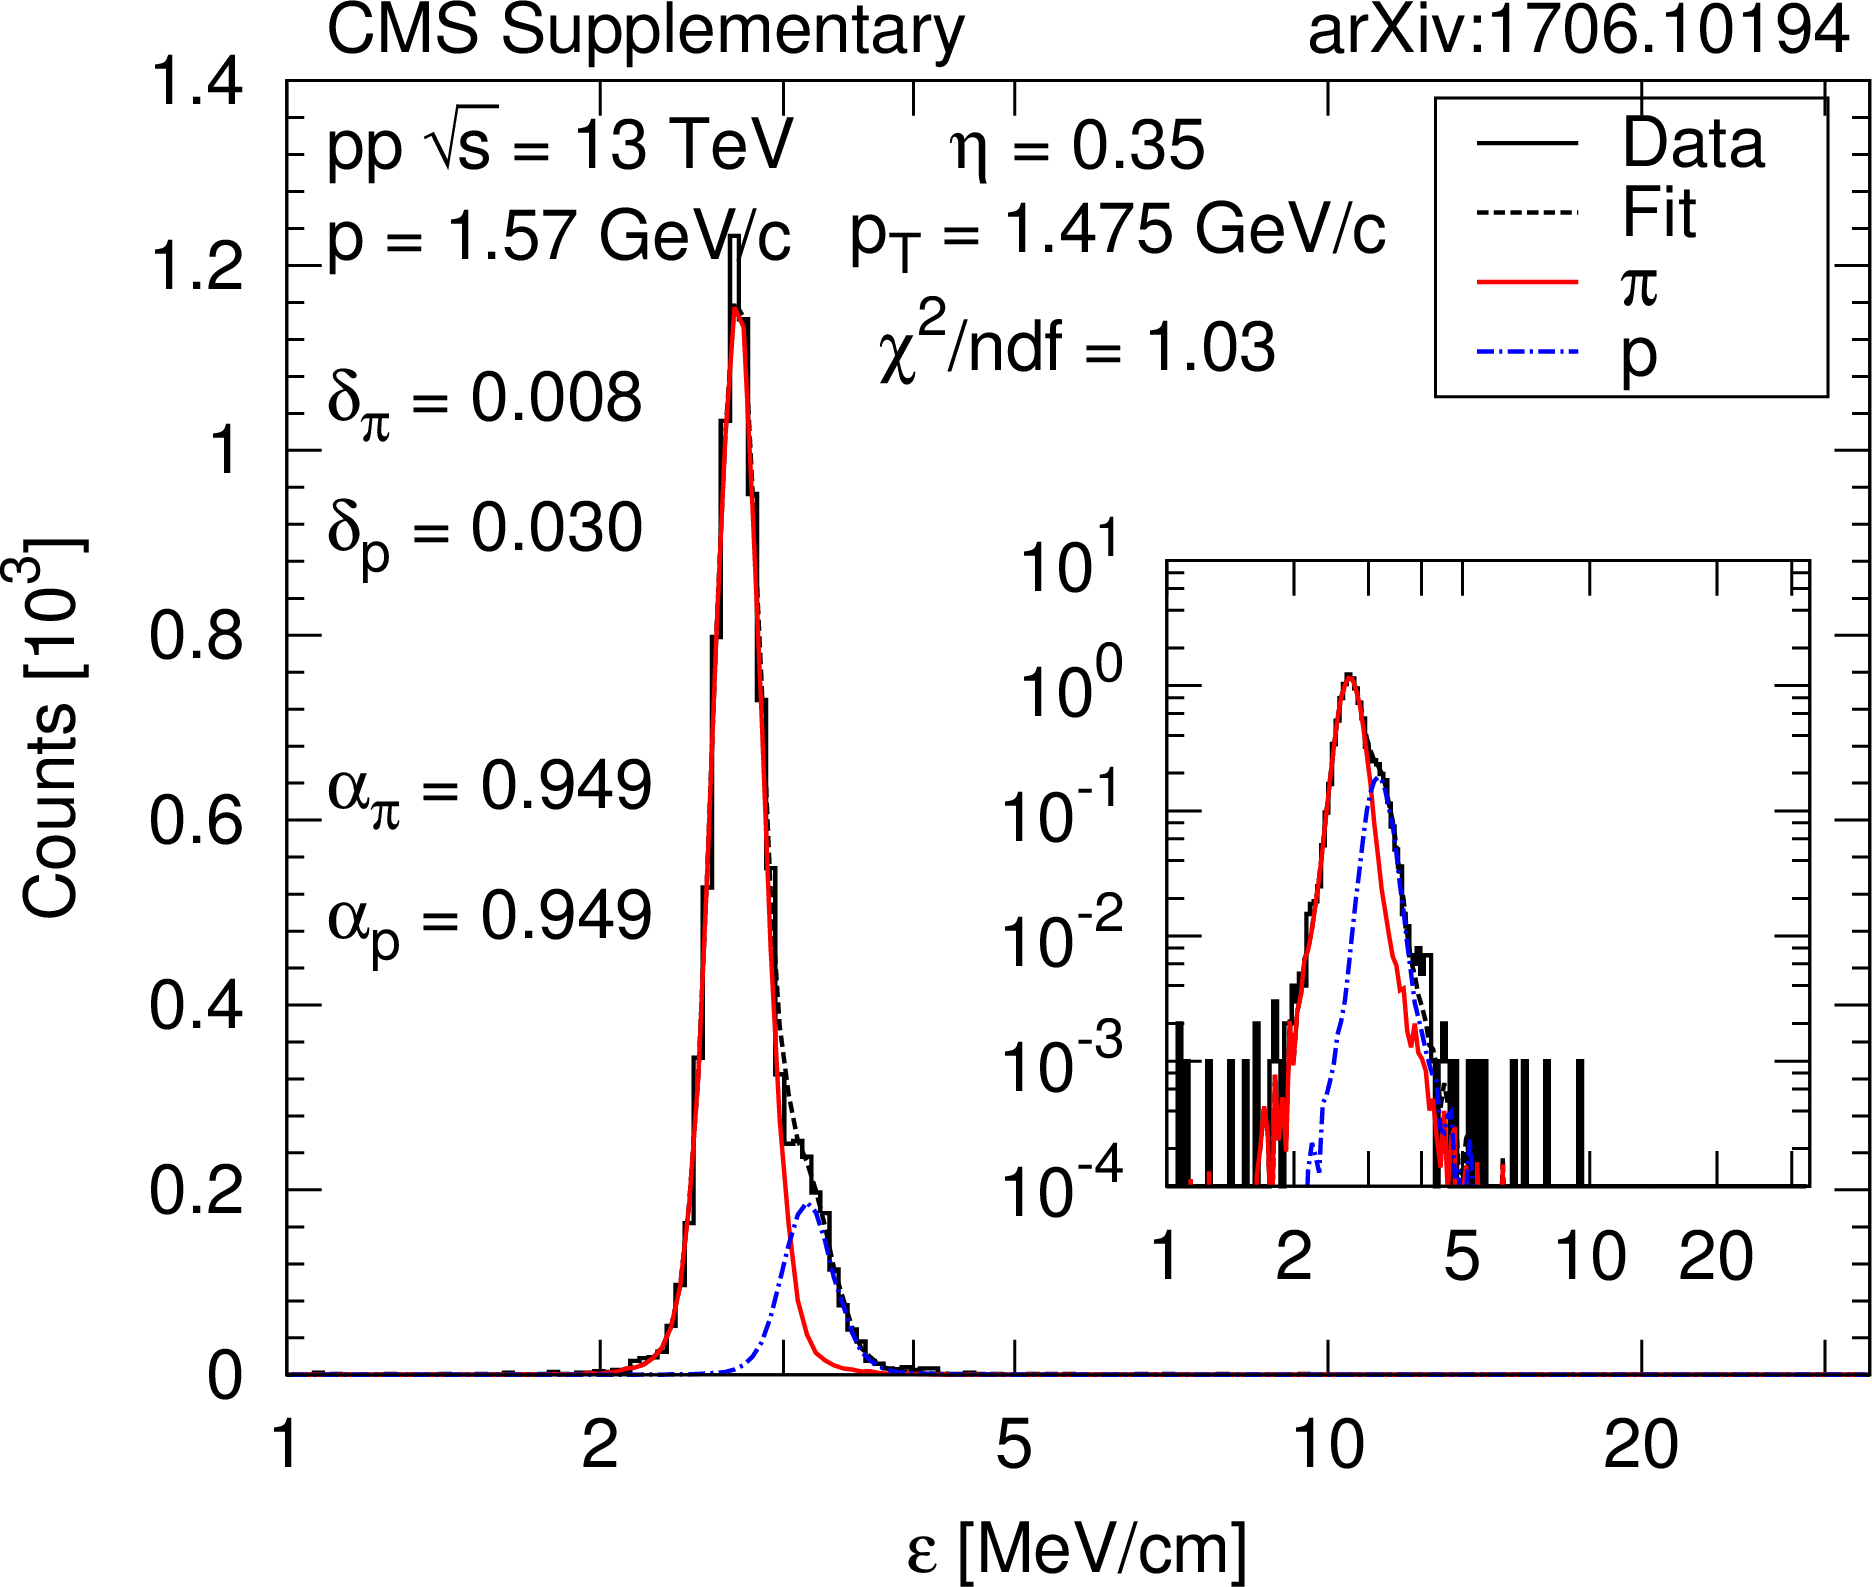
Figure 2:
Left : Distribution of $ {\varepsilon } $ as a function of total momentum $p$, for positively charged reconstructed particles ($\varepsilon $ is the most probable energy loss rate at a reference path length $l_0 = $ 450 $\mu$m). The color scale is shown in arbitrary units and is linear. The curves show the expected $ {\varepsilon } $ for electrons, pions, kaons, and protons (Eq.(30.11) in Ref. [24]). Right : Example $ {\varepsilon } $ distribution at $\eta = $ 0.35 and $ {p_{\mathrm {T}}} = $ 0.775 GeV/$c$ (bin centers), with bin widths $\Delta \eta = $ 0.1 and $\Delta {p_{\mathrm {T}}} = $ 0.05 GeV/$c$. Scale factors ($\alpha $) and shifts ($\delta $) are indicated. The inset shows the distribution with logarithmic vertical scale. |
png pdf |
Figure 2-a:
Left : Distribution of $ {\varepsilon } $ as a function of total momentum $p$, for positively charged reconstructed particles ($\varepsilon $ is the most probable energy loss rate at a reference path length $l_0 = $ 450 $\mu$m). The color scale is shown in arbitrary units and is linear. The curves show the expected $ {\varepsilon } $ for electrons, pions, kaons, and protons (Eq.(30.11) in Ref. [24]). Right : Example $ {\varepsilon } $ distribution at $\eta = $ 0.35 and $ {p_{\mathrm {T}}} = $ 0.775 GeV/$c$ (bin centers), with bin widths $\Delta \eta = $ 0.1 and $\Delta {p_{\mathrm {T}}} = $ 0.05 GeV/$c$. Scale factors ($\alpha $) and shifts ($\delta $) are indicated. The inset shows the distribution with logarithmic vertical scale. |
png pdf |
Figure 2-b:
Left : Distribution of $ {\varepsilon } $ as a function of total momentum $p$, for positively charged reconstructed particles ($\varepsilon $ is the most probable energy loss rate at a reference path length $l_0 = $ 450 $\mu$m). The color scale is shown in arbitrary units and is linear. The curves show the expected $ {\varepsilon } $ for electrons, pions, kaons, and protons (Eq.(30.11) in Ref. [24]). Right : Example $ {\varepsilon } $ distribution at $\eta = $ 0.35 and $ {p_{\mathrm {T}}} = $ 0.775 GeV/$c$ (bin centers), with bin widths $\Delta \eta = $ 0.1 and $\Delta {p_{\mathrm {T}}} = $ 0.05 GeV/$c$. Scale factors ($\alpha $) and shifts ($\delta $) are indicated. The inset shows the distribution with logarithmic vertical scale. |
png pdf |
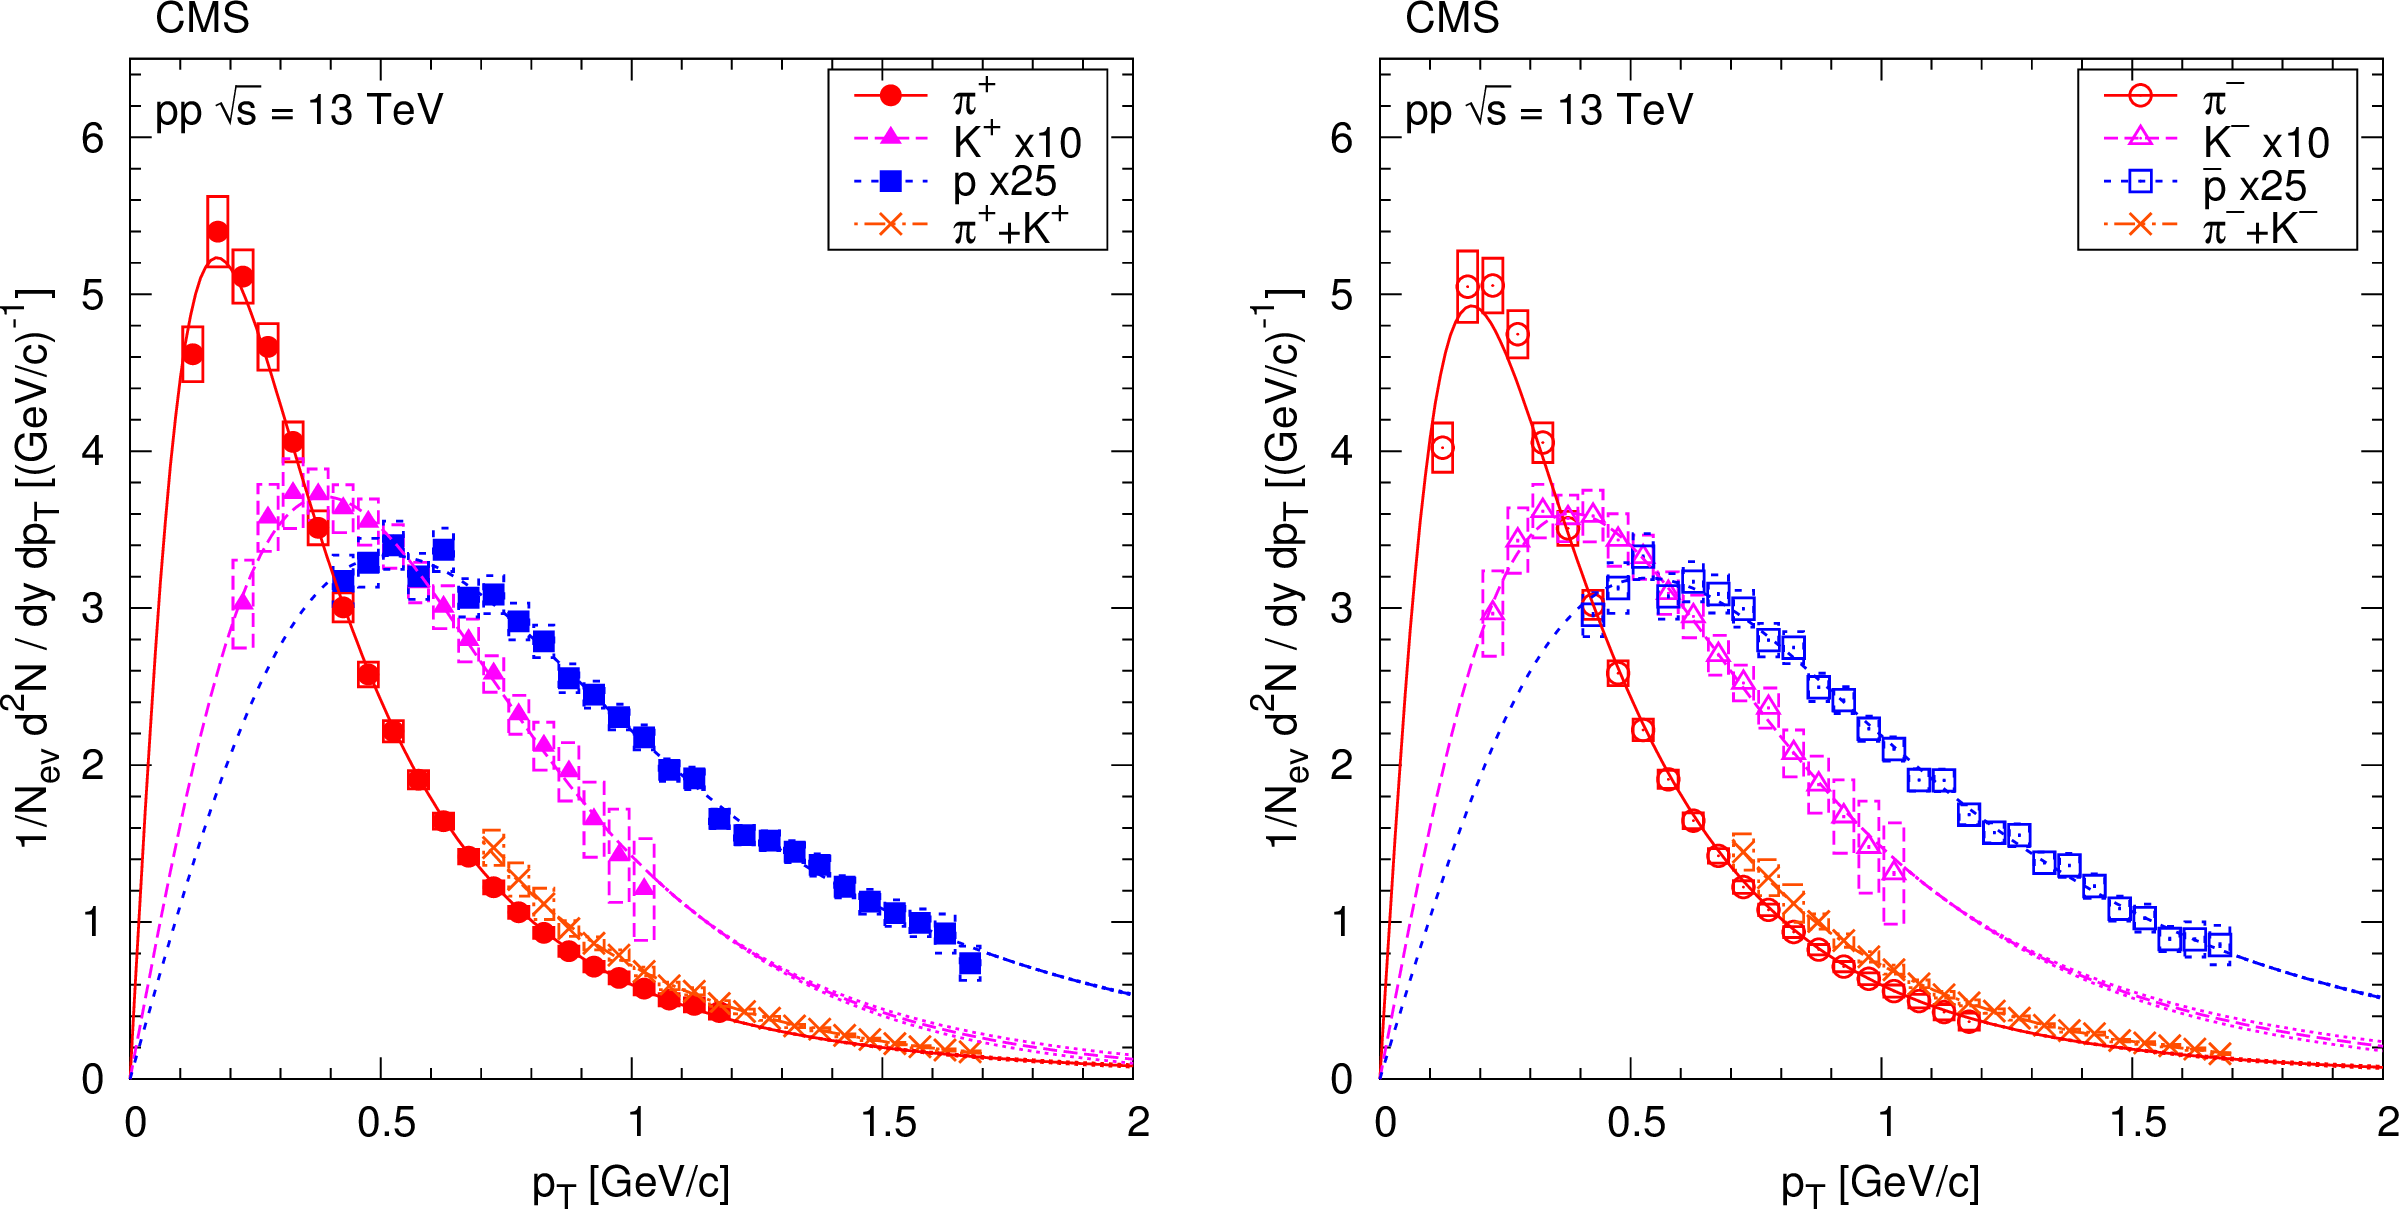
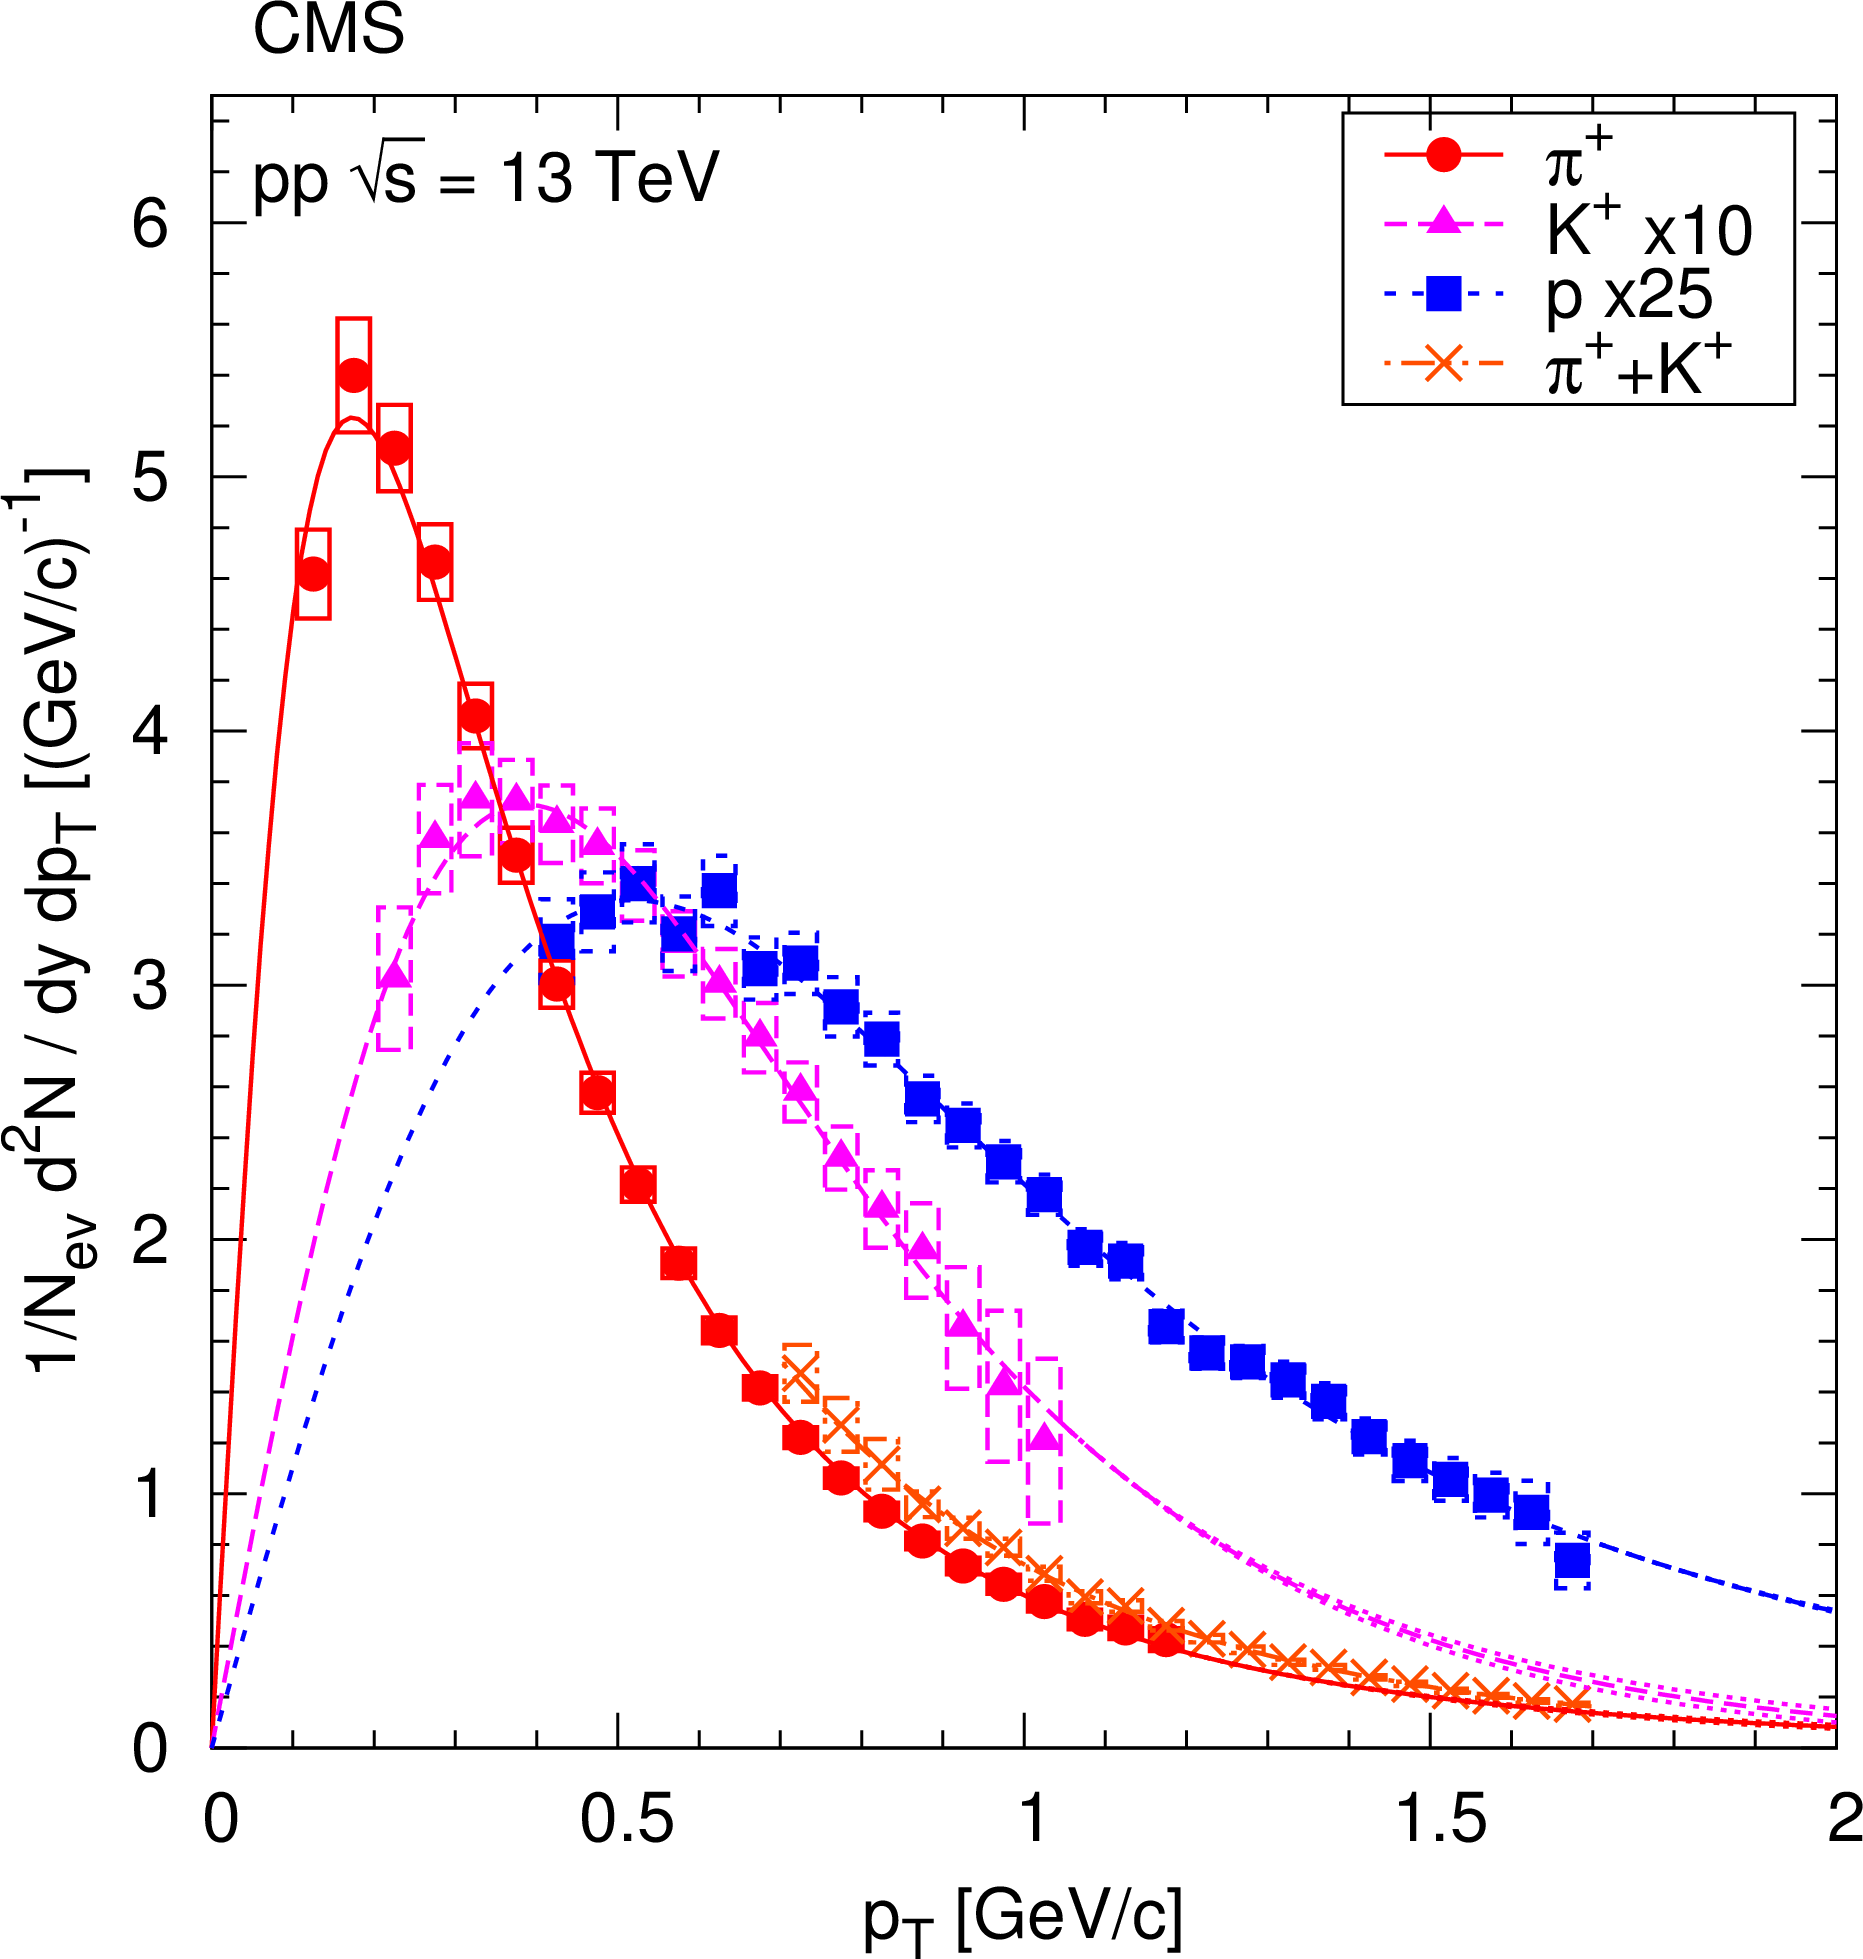
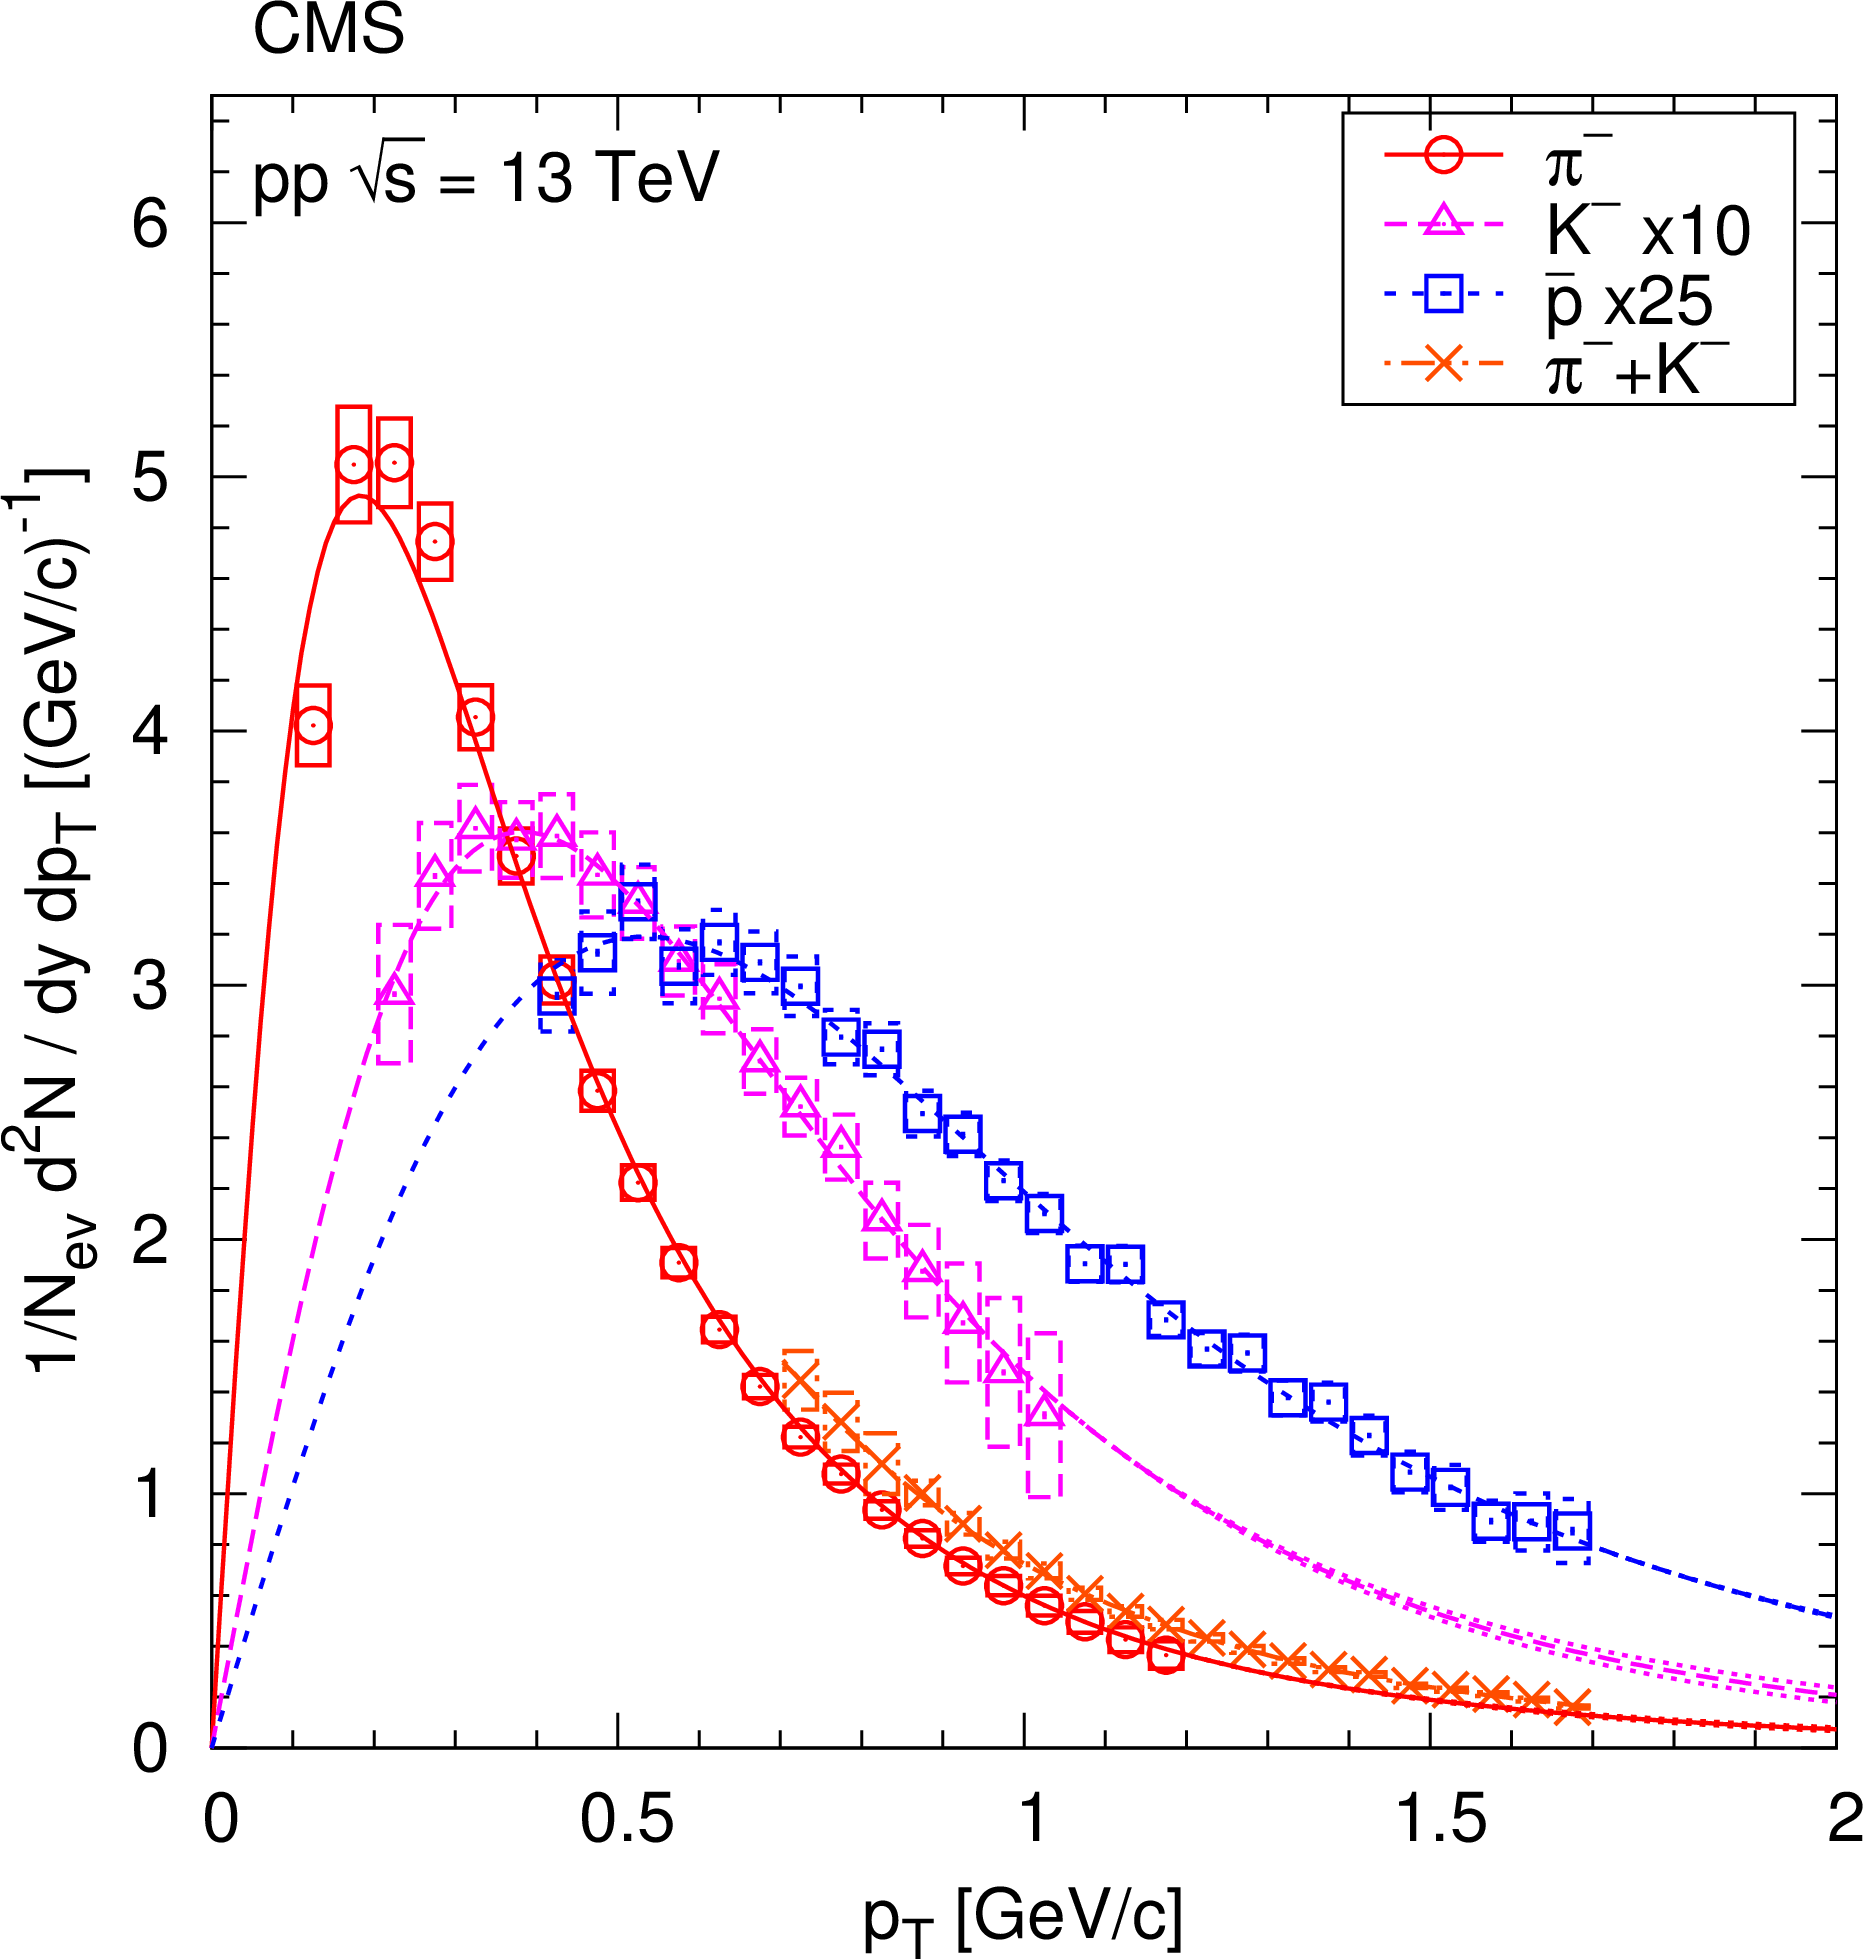
Figure 3:
Transverse momentum distributions of identified charged hadrons (pions, kaons, protons, sum of pions and kaons) from inelastic pp collisions, in the range $ {| y | }< $ 1, for positively (left ) and negatively (right ) charged particles. Kaon and proton distributions are scaled as shown in the legends. Fits to Eqs. (3) and (5) are superimposed. For the $\pi $+K fit, only the region corresponding to the range $ {| \eta | } < $ 1 and 1.05 $ < p < $ 1.7 GeV/$c$ is plotted. Boxes show the uncorrelated systematic uncertainties, while error bars indicate the uncorrelated statistical uncertainties (barely visible). The fully correlated normalization uncertainty (not shown) is 3.0%. Dotted lines (mostly indistinguishable from the nominal fit curves) illustrate the effect of varying the inverse exponent (1/$n$) of the Tsallis-Pareto function by $\pm $0.05 beyond the highest-$ {p_{\mathrm {T}}} $ measured point. |
png pdf |
Figure 3-a:
Transverse momentum distributions of identified charged hadrons (pions, kaons, protons, sum of pions and kaons) from inelastic pp collisions, in the range $ {| y | }< $ 1, for positively (left ) and negatively (right ) charged particles. Kaon and proton distributions are scaled as shown in the legends. Fits to Eqs. (3) and (5) are superimposed. For the $\pi $+K fit, only the region corresponding to the range $ {| \eta | } < $ 1 and 1.05 $ < p < $ 1.7 GeV/$c$ is plotted. Boxes show the uncorrelated systematic uncertainties, while error bars indicate the uncorrelated statistical uncertainties (barely visible). The fully correlated normalization uncertainty (not shown) is 3.0%. Dotted lines (mostly indistinguishable from the nominal fit curves) illustrate the effect of varying the inverse exponent (1/$n$) of the Tsallis-Pareto function by $\pm $0.05 beyond the highest-$ {p_{\mathrm {T}}} $ measured point. |
png pdf |
Figure 3-b:
Transverse momentum distributions of identified charged hadrons (pions, kaons, protons, sum of pions and kaons) from inelastic pp collisions, in the range $ {| y | }< $ 1, for positively (left ) and negatively (right ) charged particles. Kaon and proton distributions are scaled as shown in the legends. Fits to Eqs. (3) and (5) are superimposed. For the $\pi $+K fit, only the region corresponding to the range $ {| \eta | } < $ 1 and 1.05 $ < p < $ 1.7 GeV/$c$ is plotted. Boxes show the uncorrelated systematic uncertainties, while error bars indicate the uncorrelated statistical uncertainties (barely visible). The fully correlated normalization uncertainty (not shown) is 3.0%. Dotted lines (mostly indistinguishable from the nominal fit curves) illustrate the effect of varying the inverse exponent (1/$n$) of the Tsallis-Pareto function by $\pm $0.05 beyond the highest-$ {p_{\mathrm {T}}} $ measured point. |
png pdf |
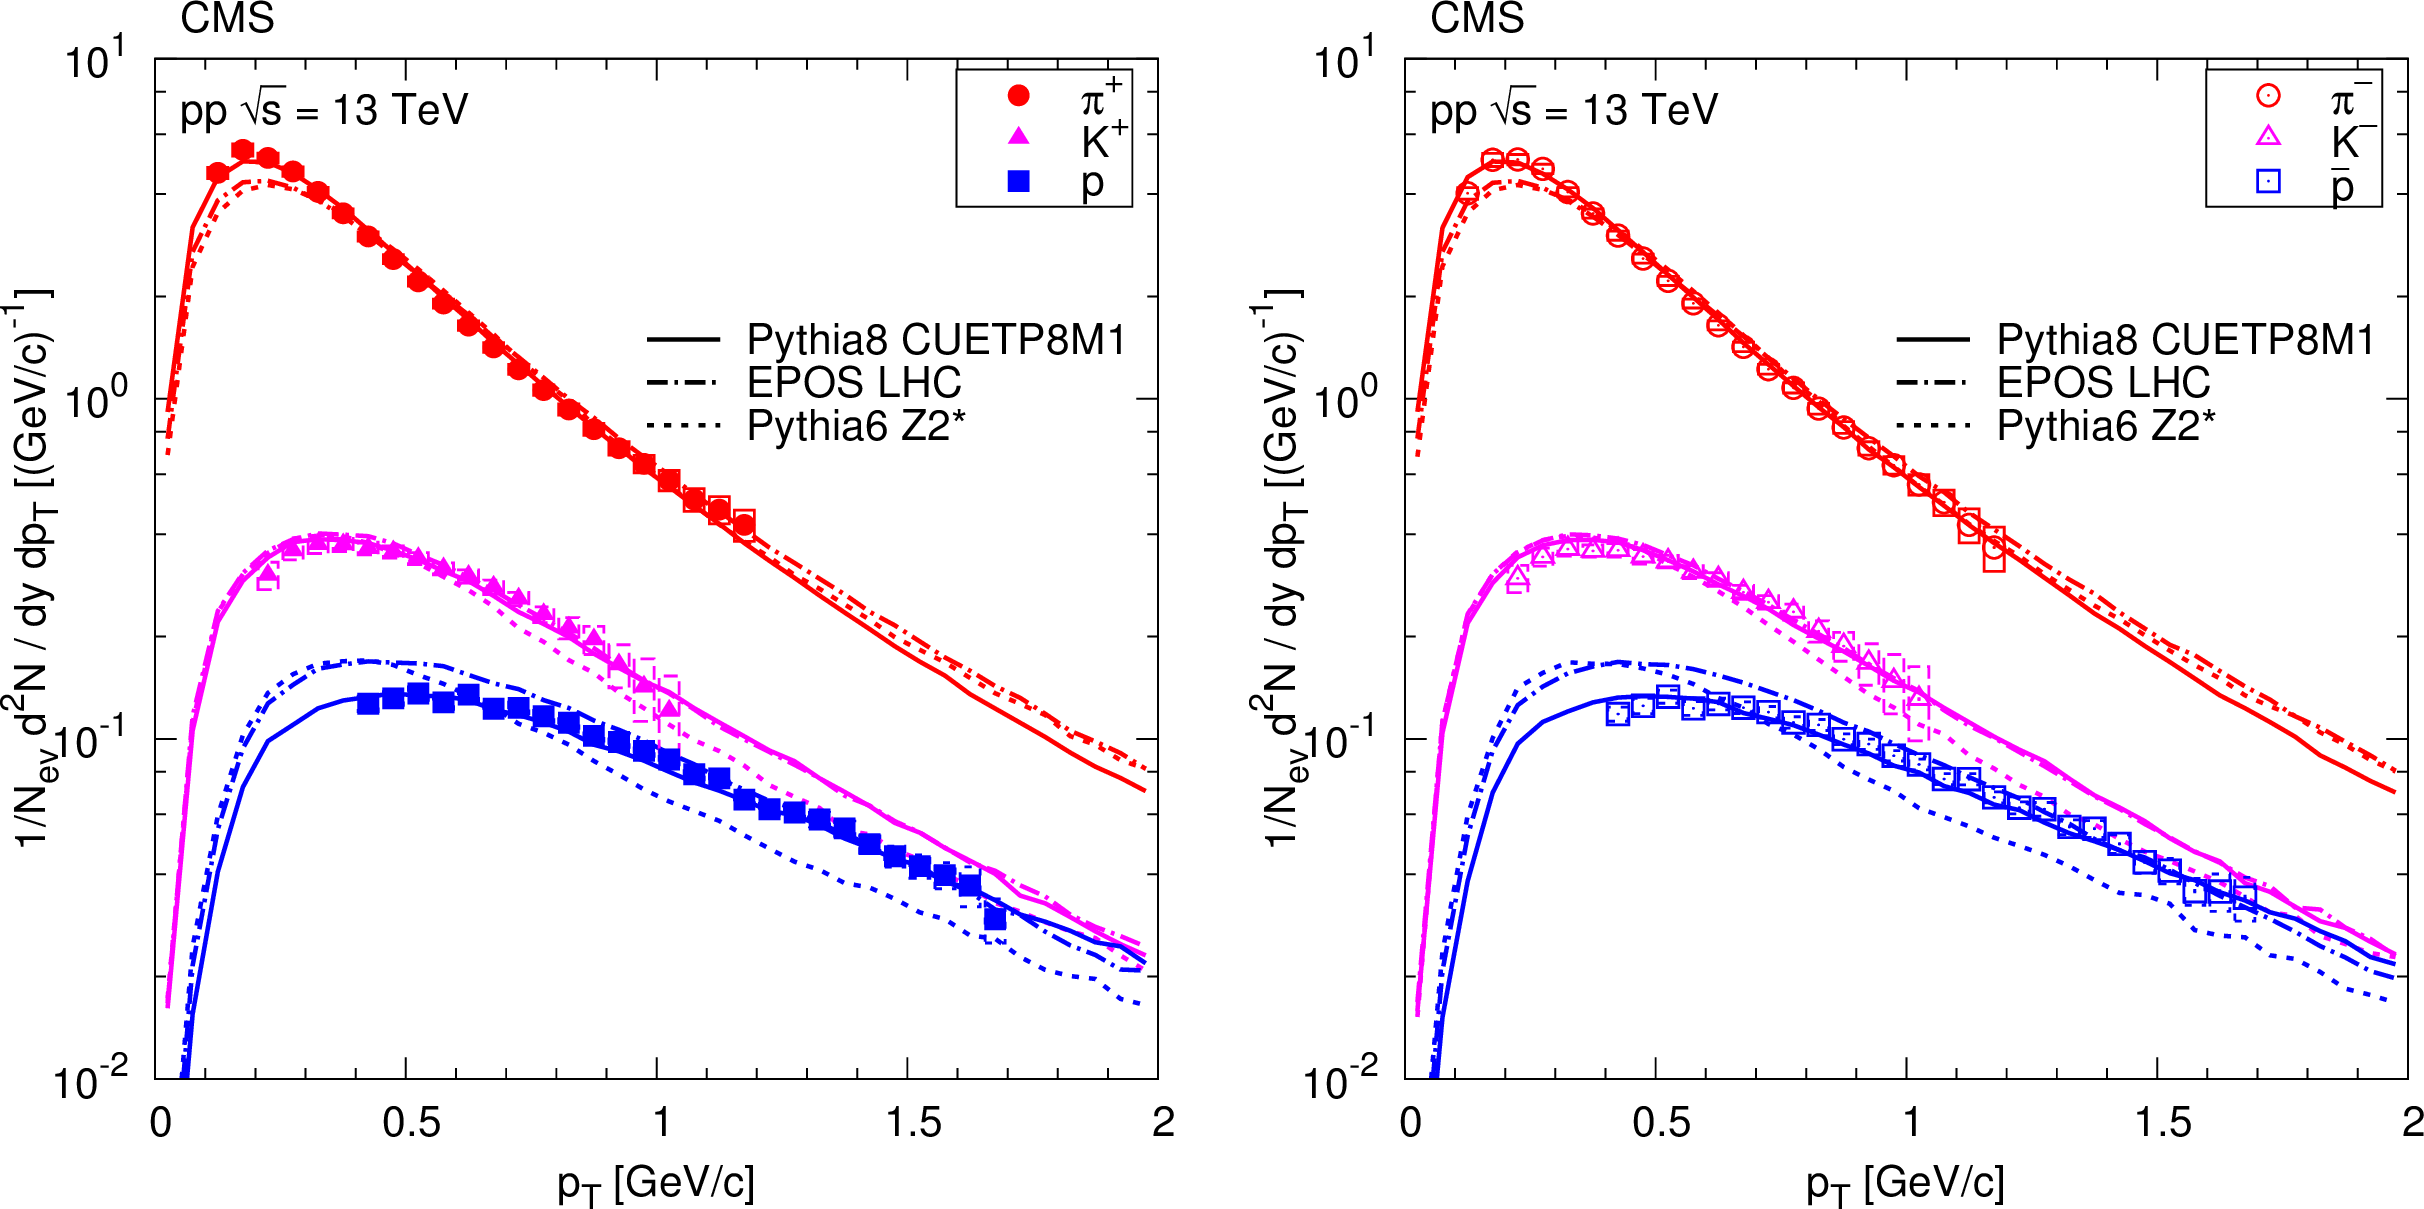
Figure 4:
Transverse momentum distributions of identified charged hadrons (pions, kaons, protons) from inelastic pp collisions, in the range $ {| y | }<$ 1, for positively (left ) and negatively (right ) charged particles. Measured values (same as in Fig. 3) are plotted together with predictions from PYTHIA8, epos, and PYTHIA6. Boxes show the uncorrelated systematic uncertainties, while error bars indicate the uncorrelated statistical uncertainties (hardly visible). The fully correlated normalization uncertainty (not shown) is 3.0%. |
png pdf |
Figure 4-a:
Transverse momentum distributions of identified charged hadrons (pions, kaons, protons) from inelastic pp collisions, in the range $ {| y | }<$ 1, for positively (left ) and negatively (right ) charged particles. Measured values (same as in Fig. 3) are plotted together with predictions from PYTHIA8, epos, and PYTHIA6. Boxes show the uncorrelated systematic uncertainties, while error bars indicate the uncorrelated statistical uncertainties (hardly visible). The fully correlated normalization uncertainty (not shown) is 3.0%. |
png pdf |
Figure 4-b:
Transverse momentum distributions of identified charged hadrons (pions, kaons, protons) from inelastic pp collisions, in the range $ {| y | }<$ 1, for positively (left ) and negatively (right ) charged particles. Measured values (same as in Fig. 3) are plotted together with predictions from PYTHIA8, epos, and PYTHIA6. Boxes show the uncorrelated systematic uncertainties, while error bars indicate the uncorrelated statistical uncertainties (hardly visible). The fully correlated normalization uncertainty (not shown) is 3.0%. |
png pdf |
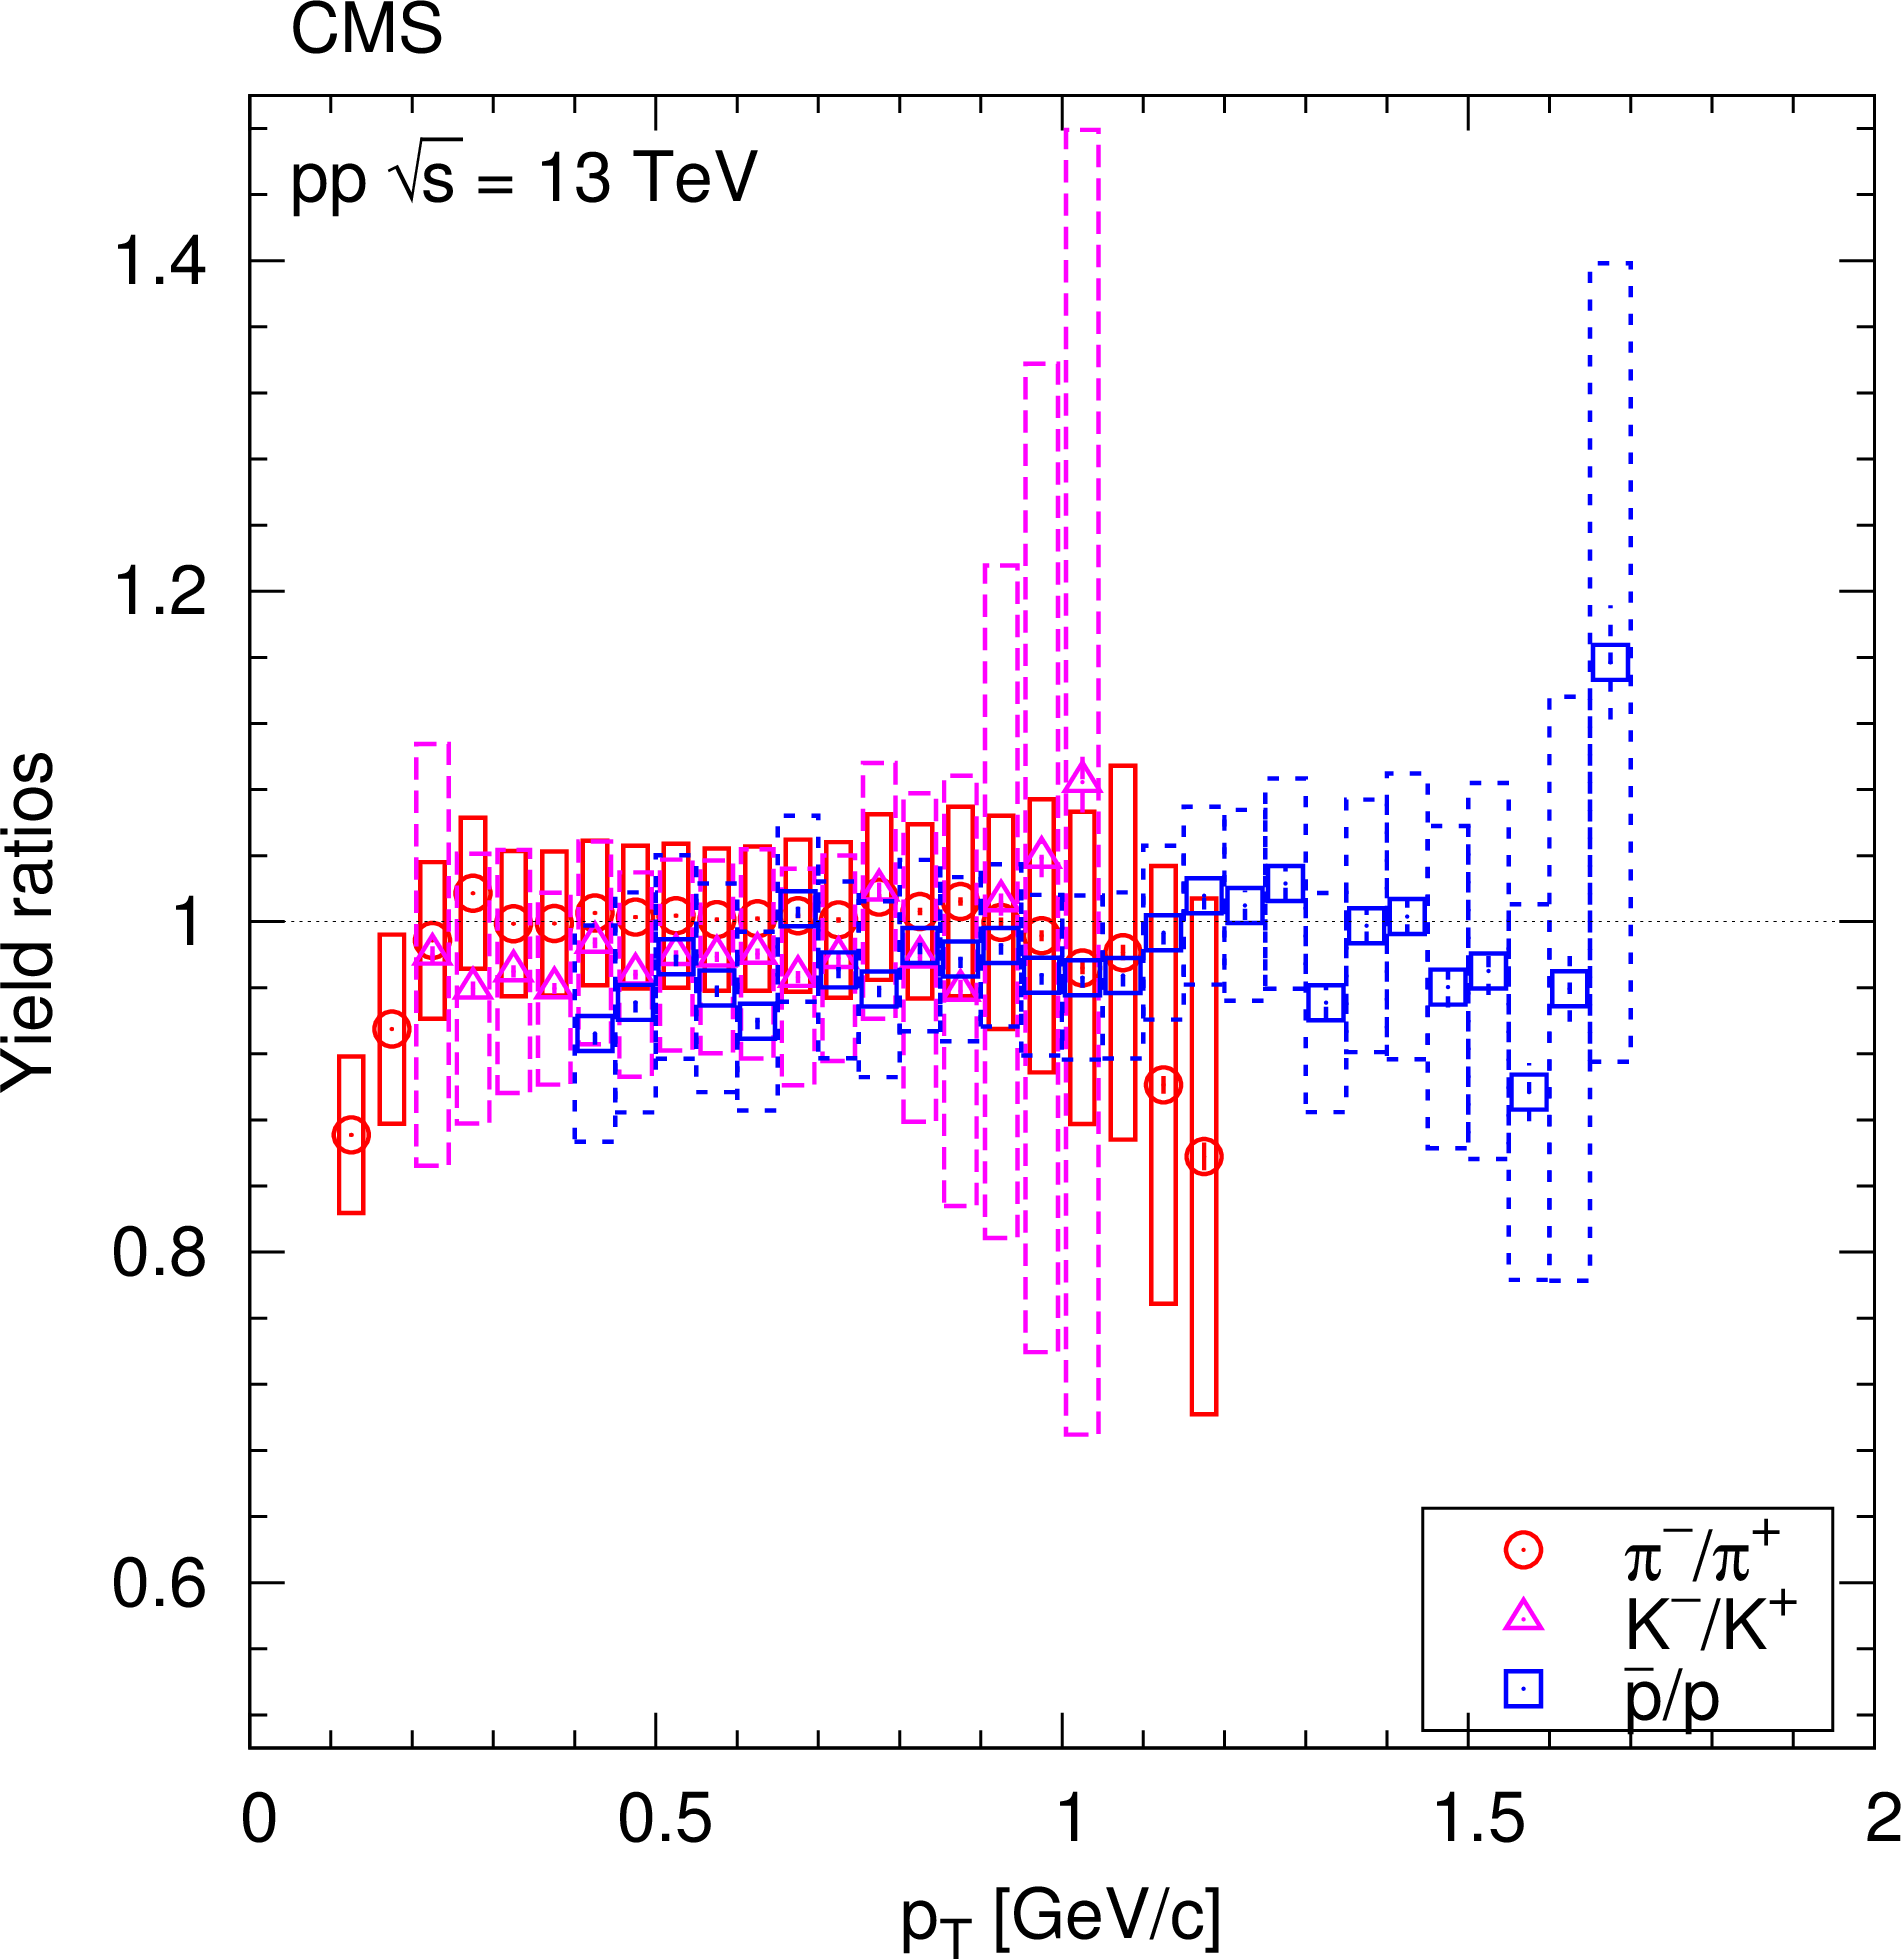
Figure 5:
Ratios of particle yields, K/$\pi $ and p /$\pi $ (left) and opposite-charge ratios (right), as a function of transverse momentum. Error bars indicate the uncorrelated statistical uncertainties, while boxes show the uncorrelated systematic uncertainties. In the left panel, curves indicate predictions from PYTHIA8, epos, and PYTHIA6. |
png pdf |
Figure 5-a:
Ratios of particle yields, K/$\pi $ and p /$\pi $ (left) and opposite-charge ratios (right), as a function of transverse momentum. Error bars indicate the uncorrelated statistical uncertainties, while boxes show the uncorrelated systematic uncertainties. In the left panel, curves indicate predictions from PYTHIA8, epos, and PYTHIA6. |
png pdf |
Figure 5-b:
Ratios of particle yields, K/$\pi $ and p /$\pi $ (left) and opposite-charge ratios (right), as a function of transverse momentum. Error bars indicate the uncorrelated statistical uncertainties, while boxes show the uncorrelated systematic uncertainties. In the left panel, curves indicate predictions from PYTHIA8, epos, and PYTHIA6. |

png pdf |
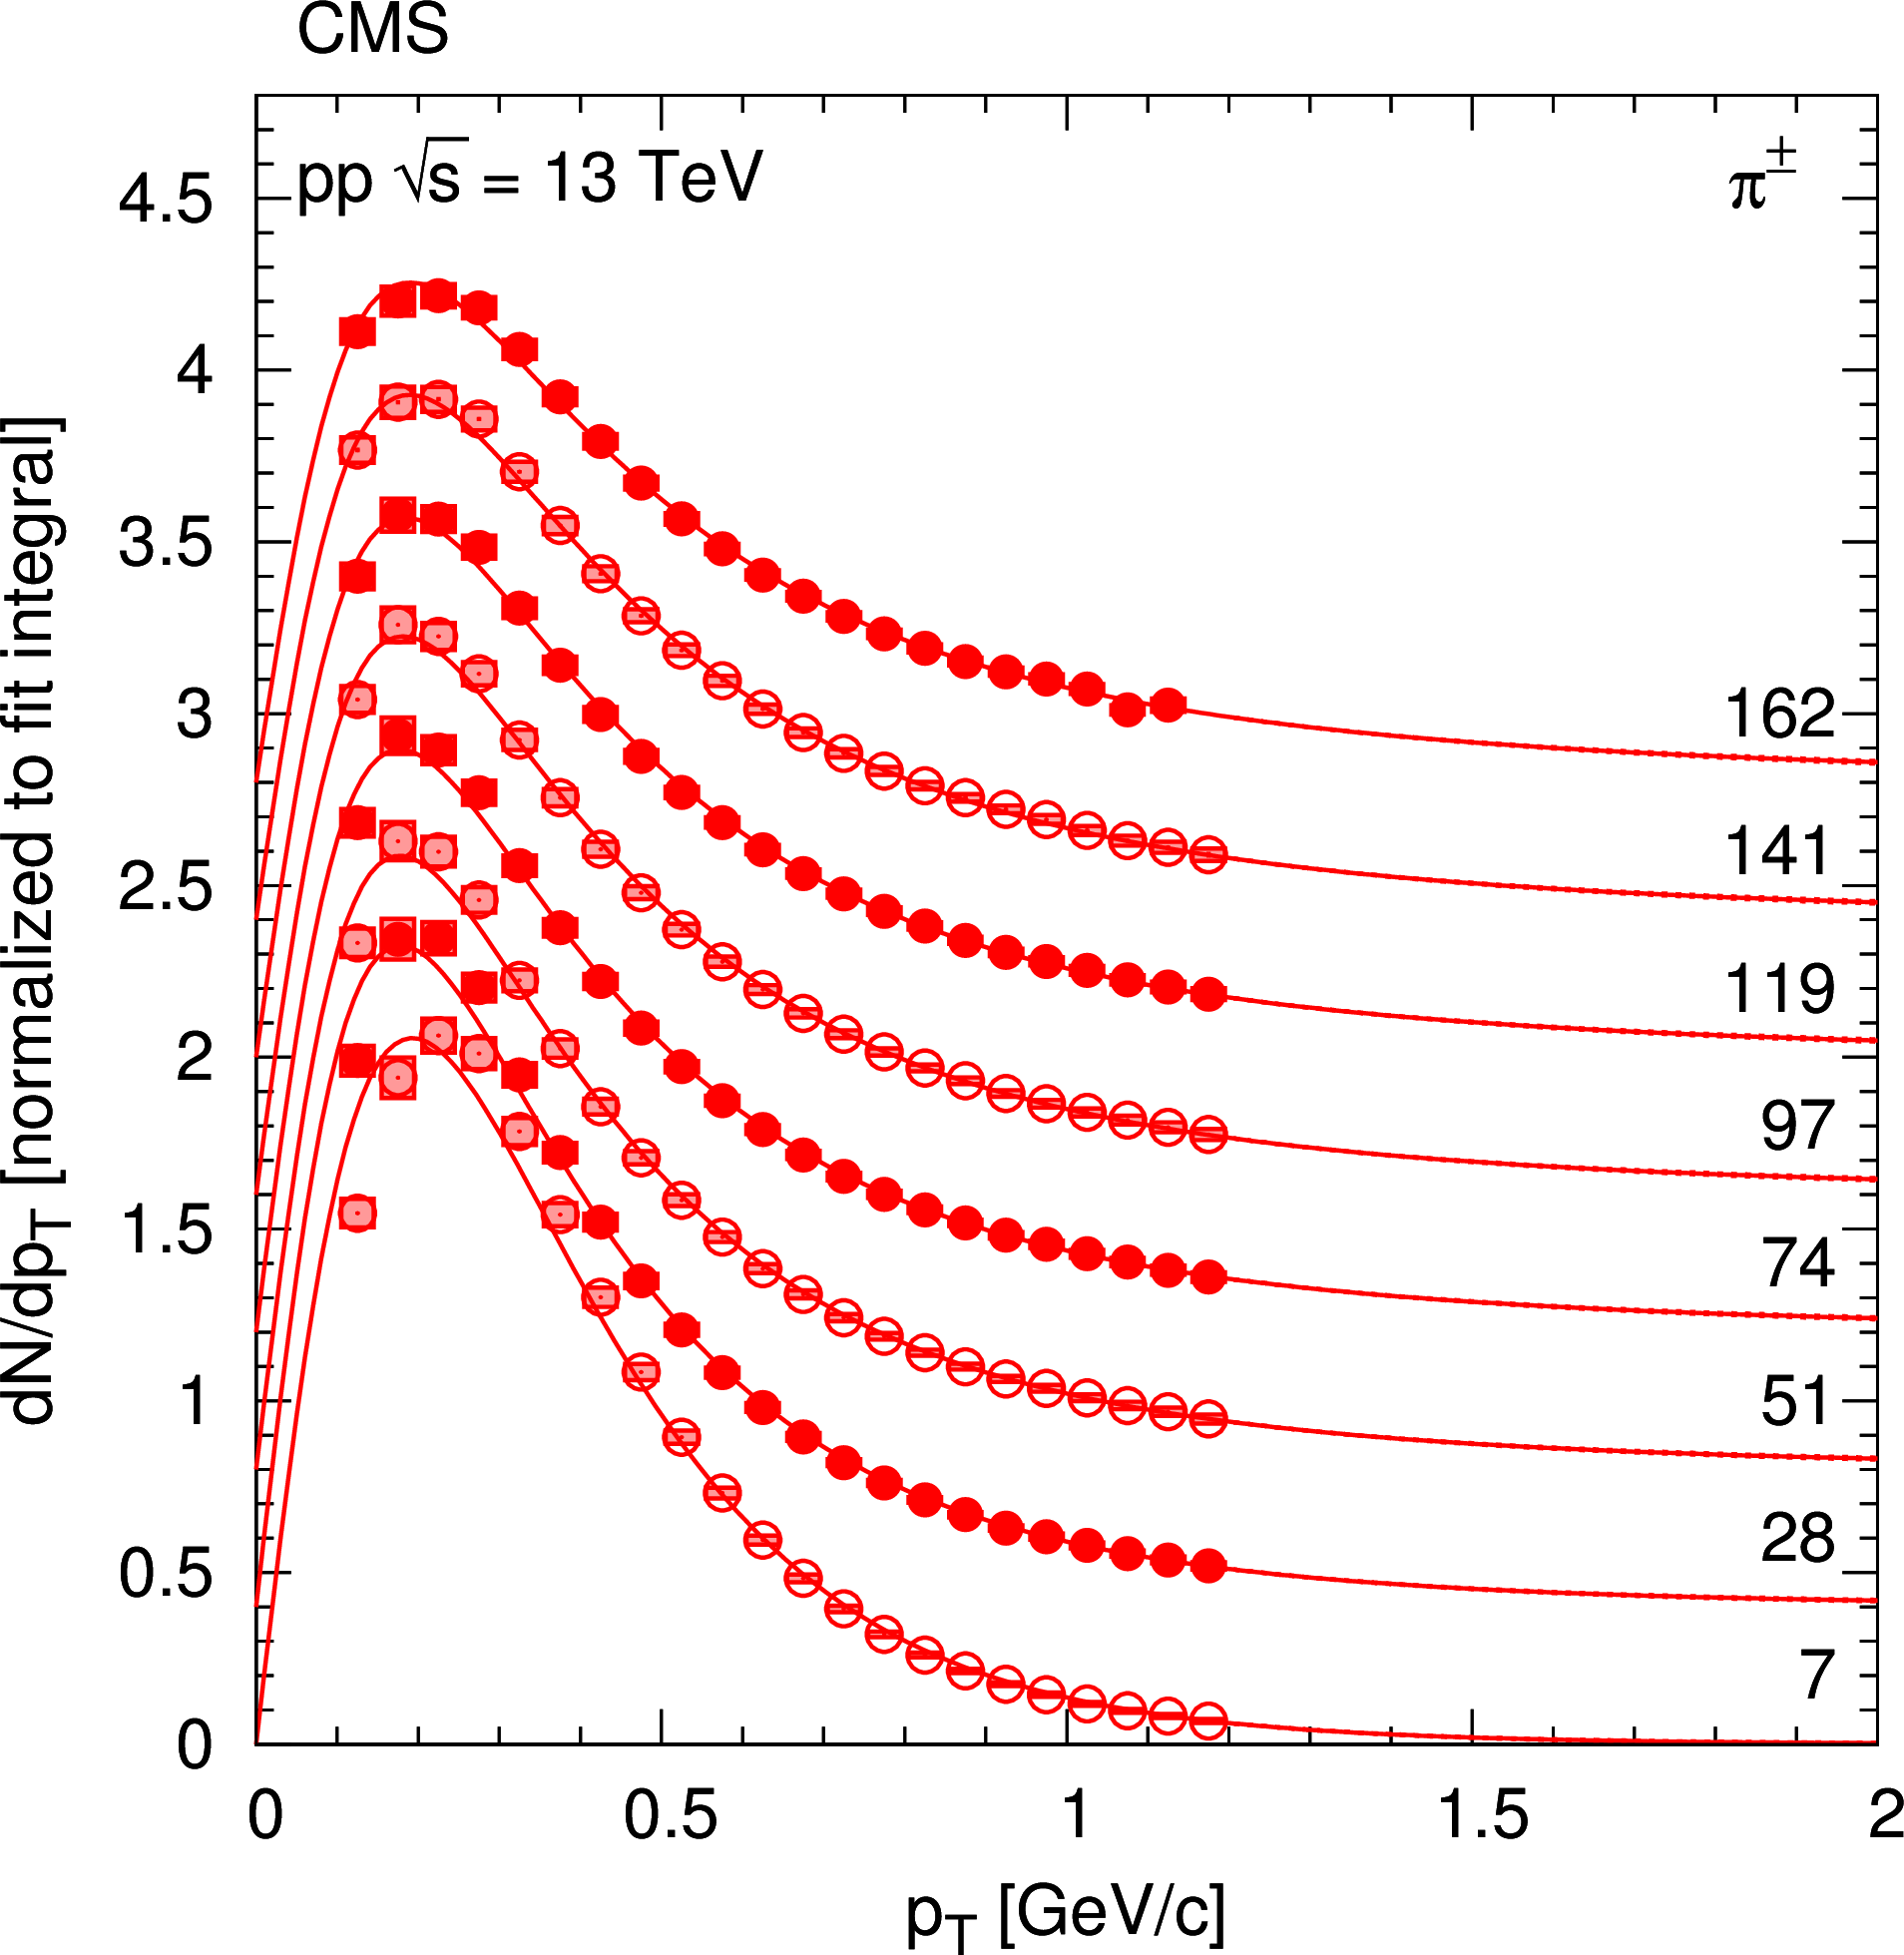
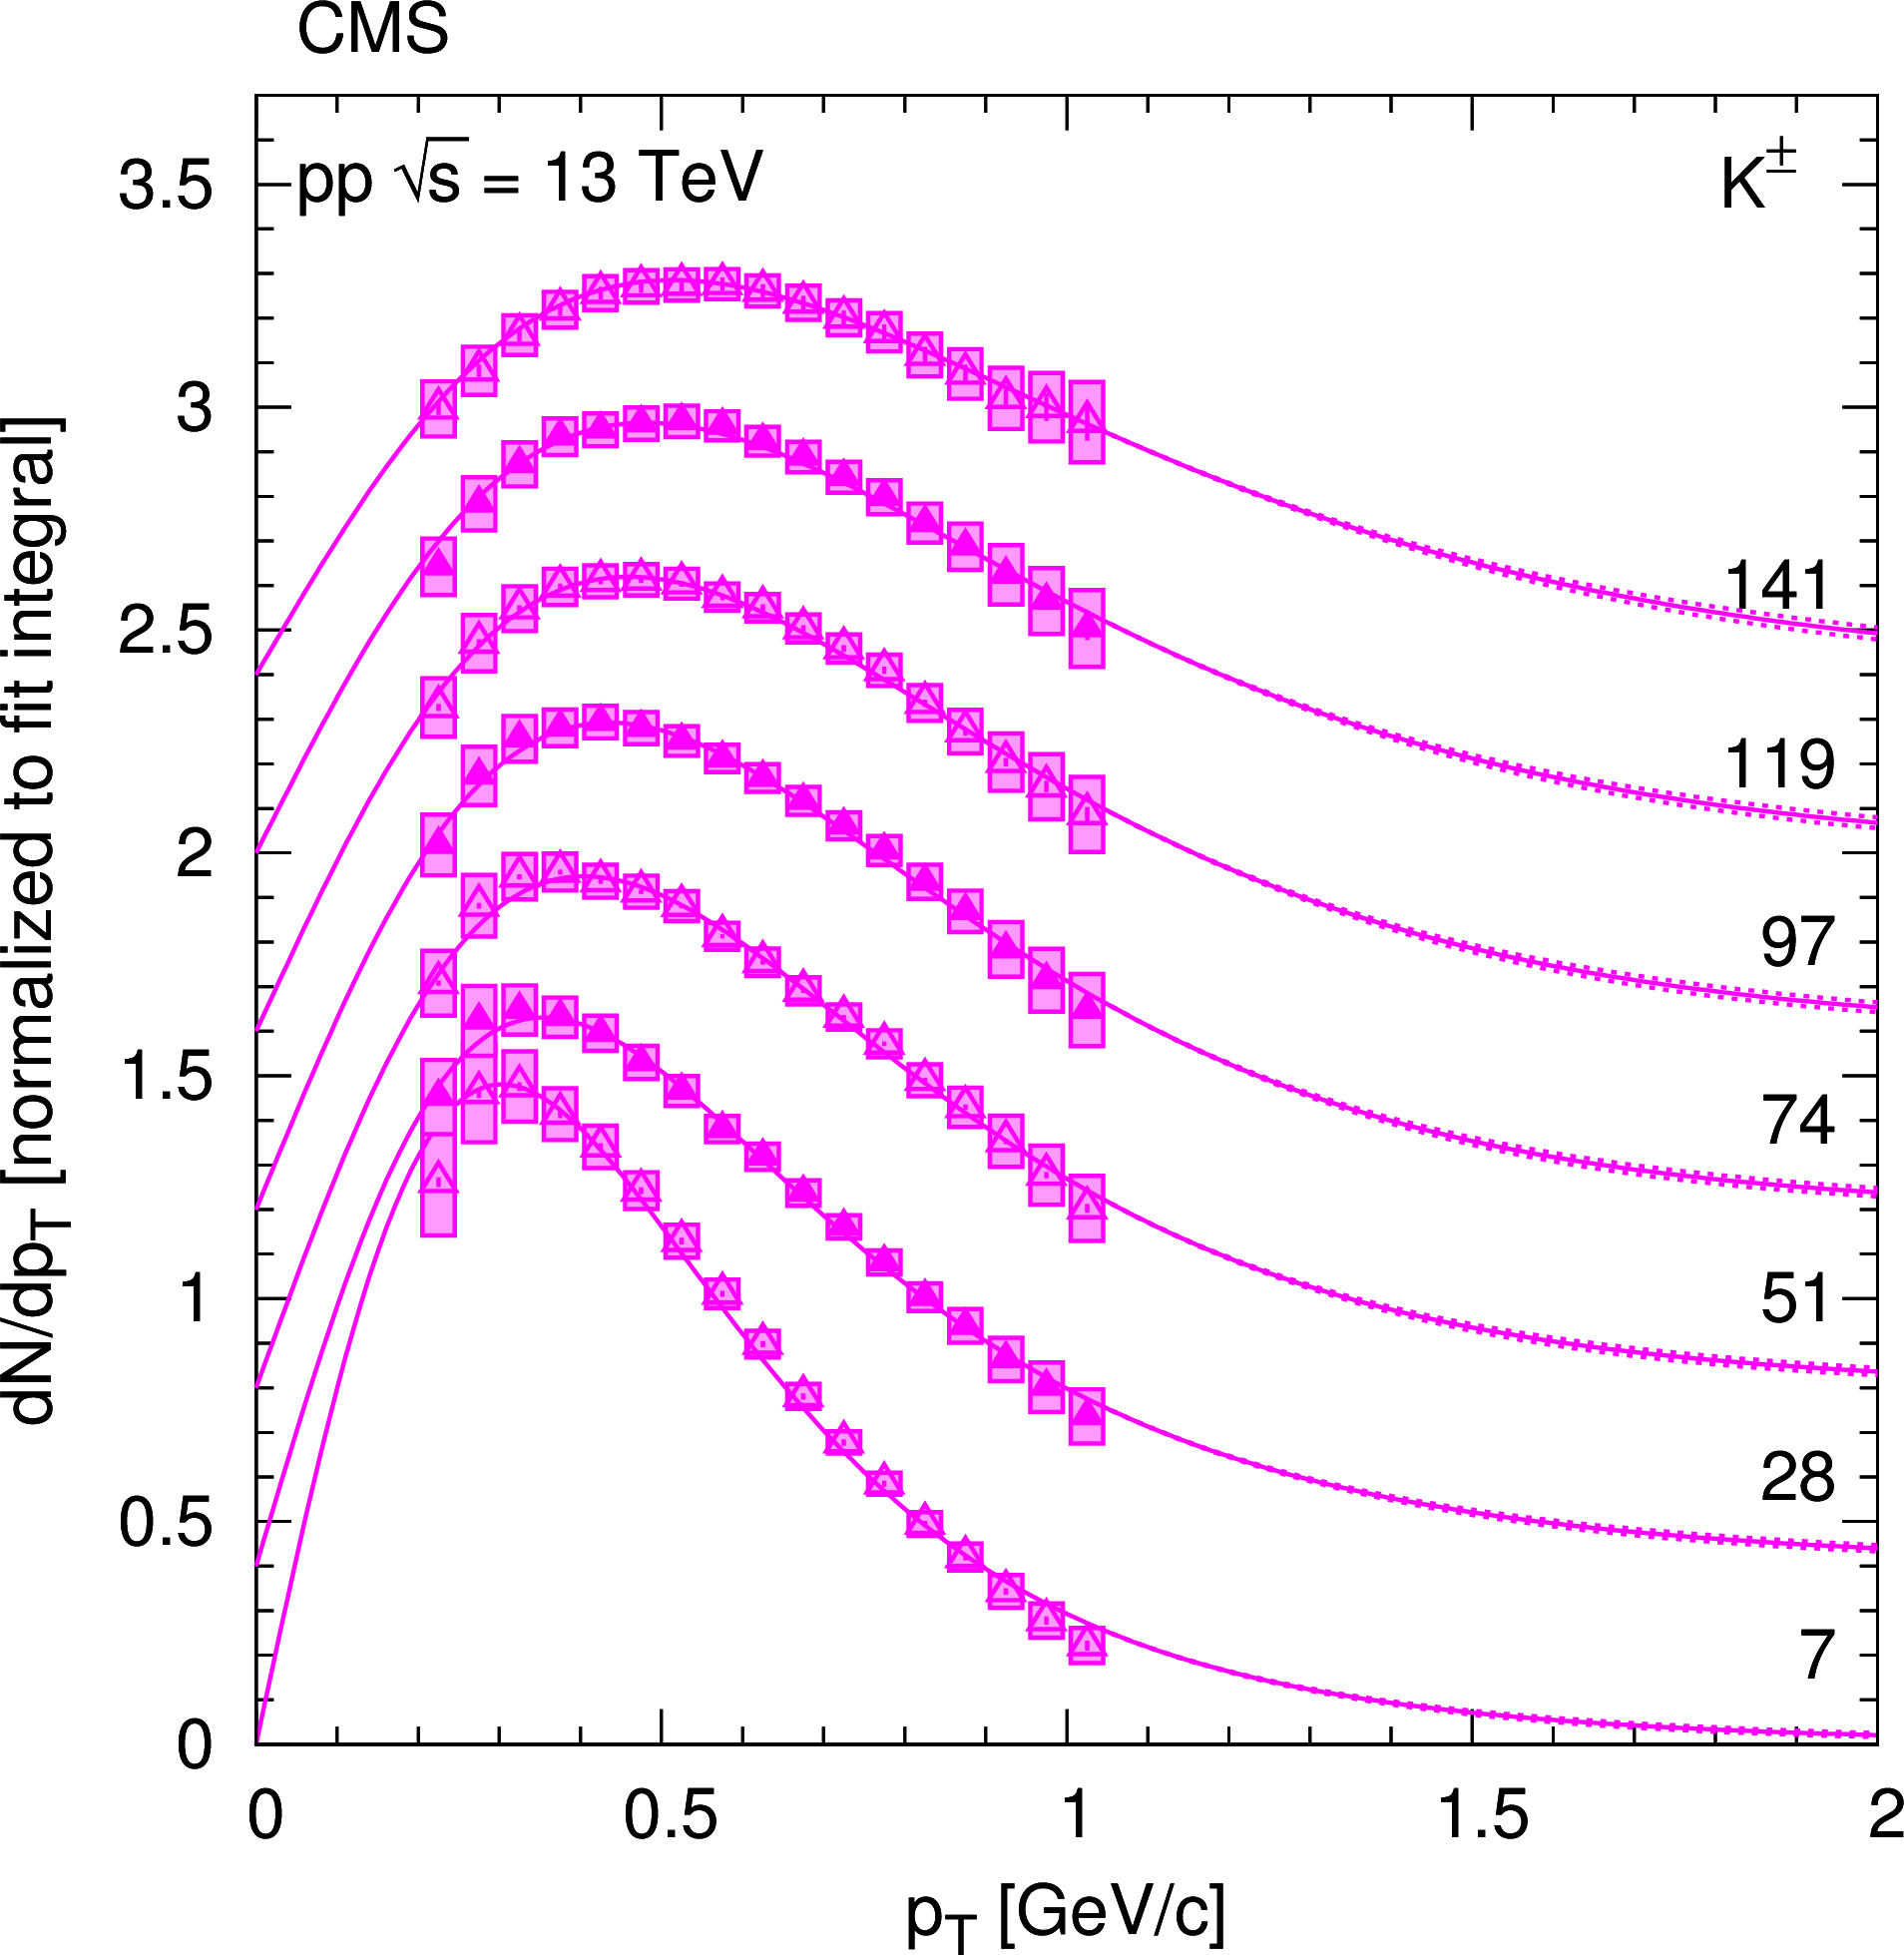
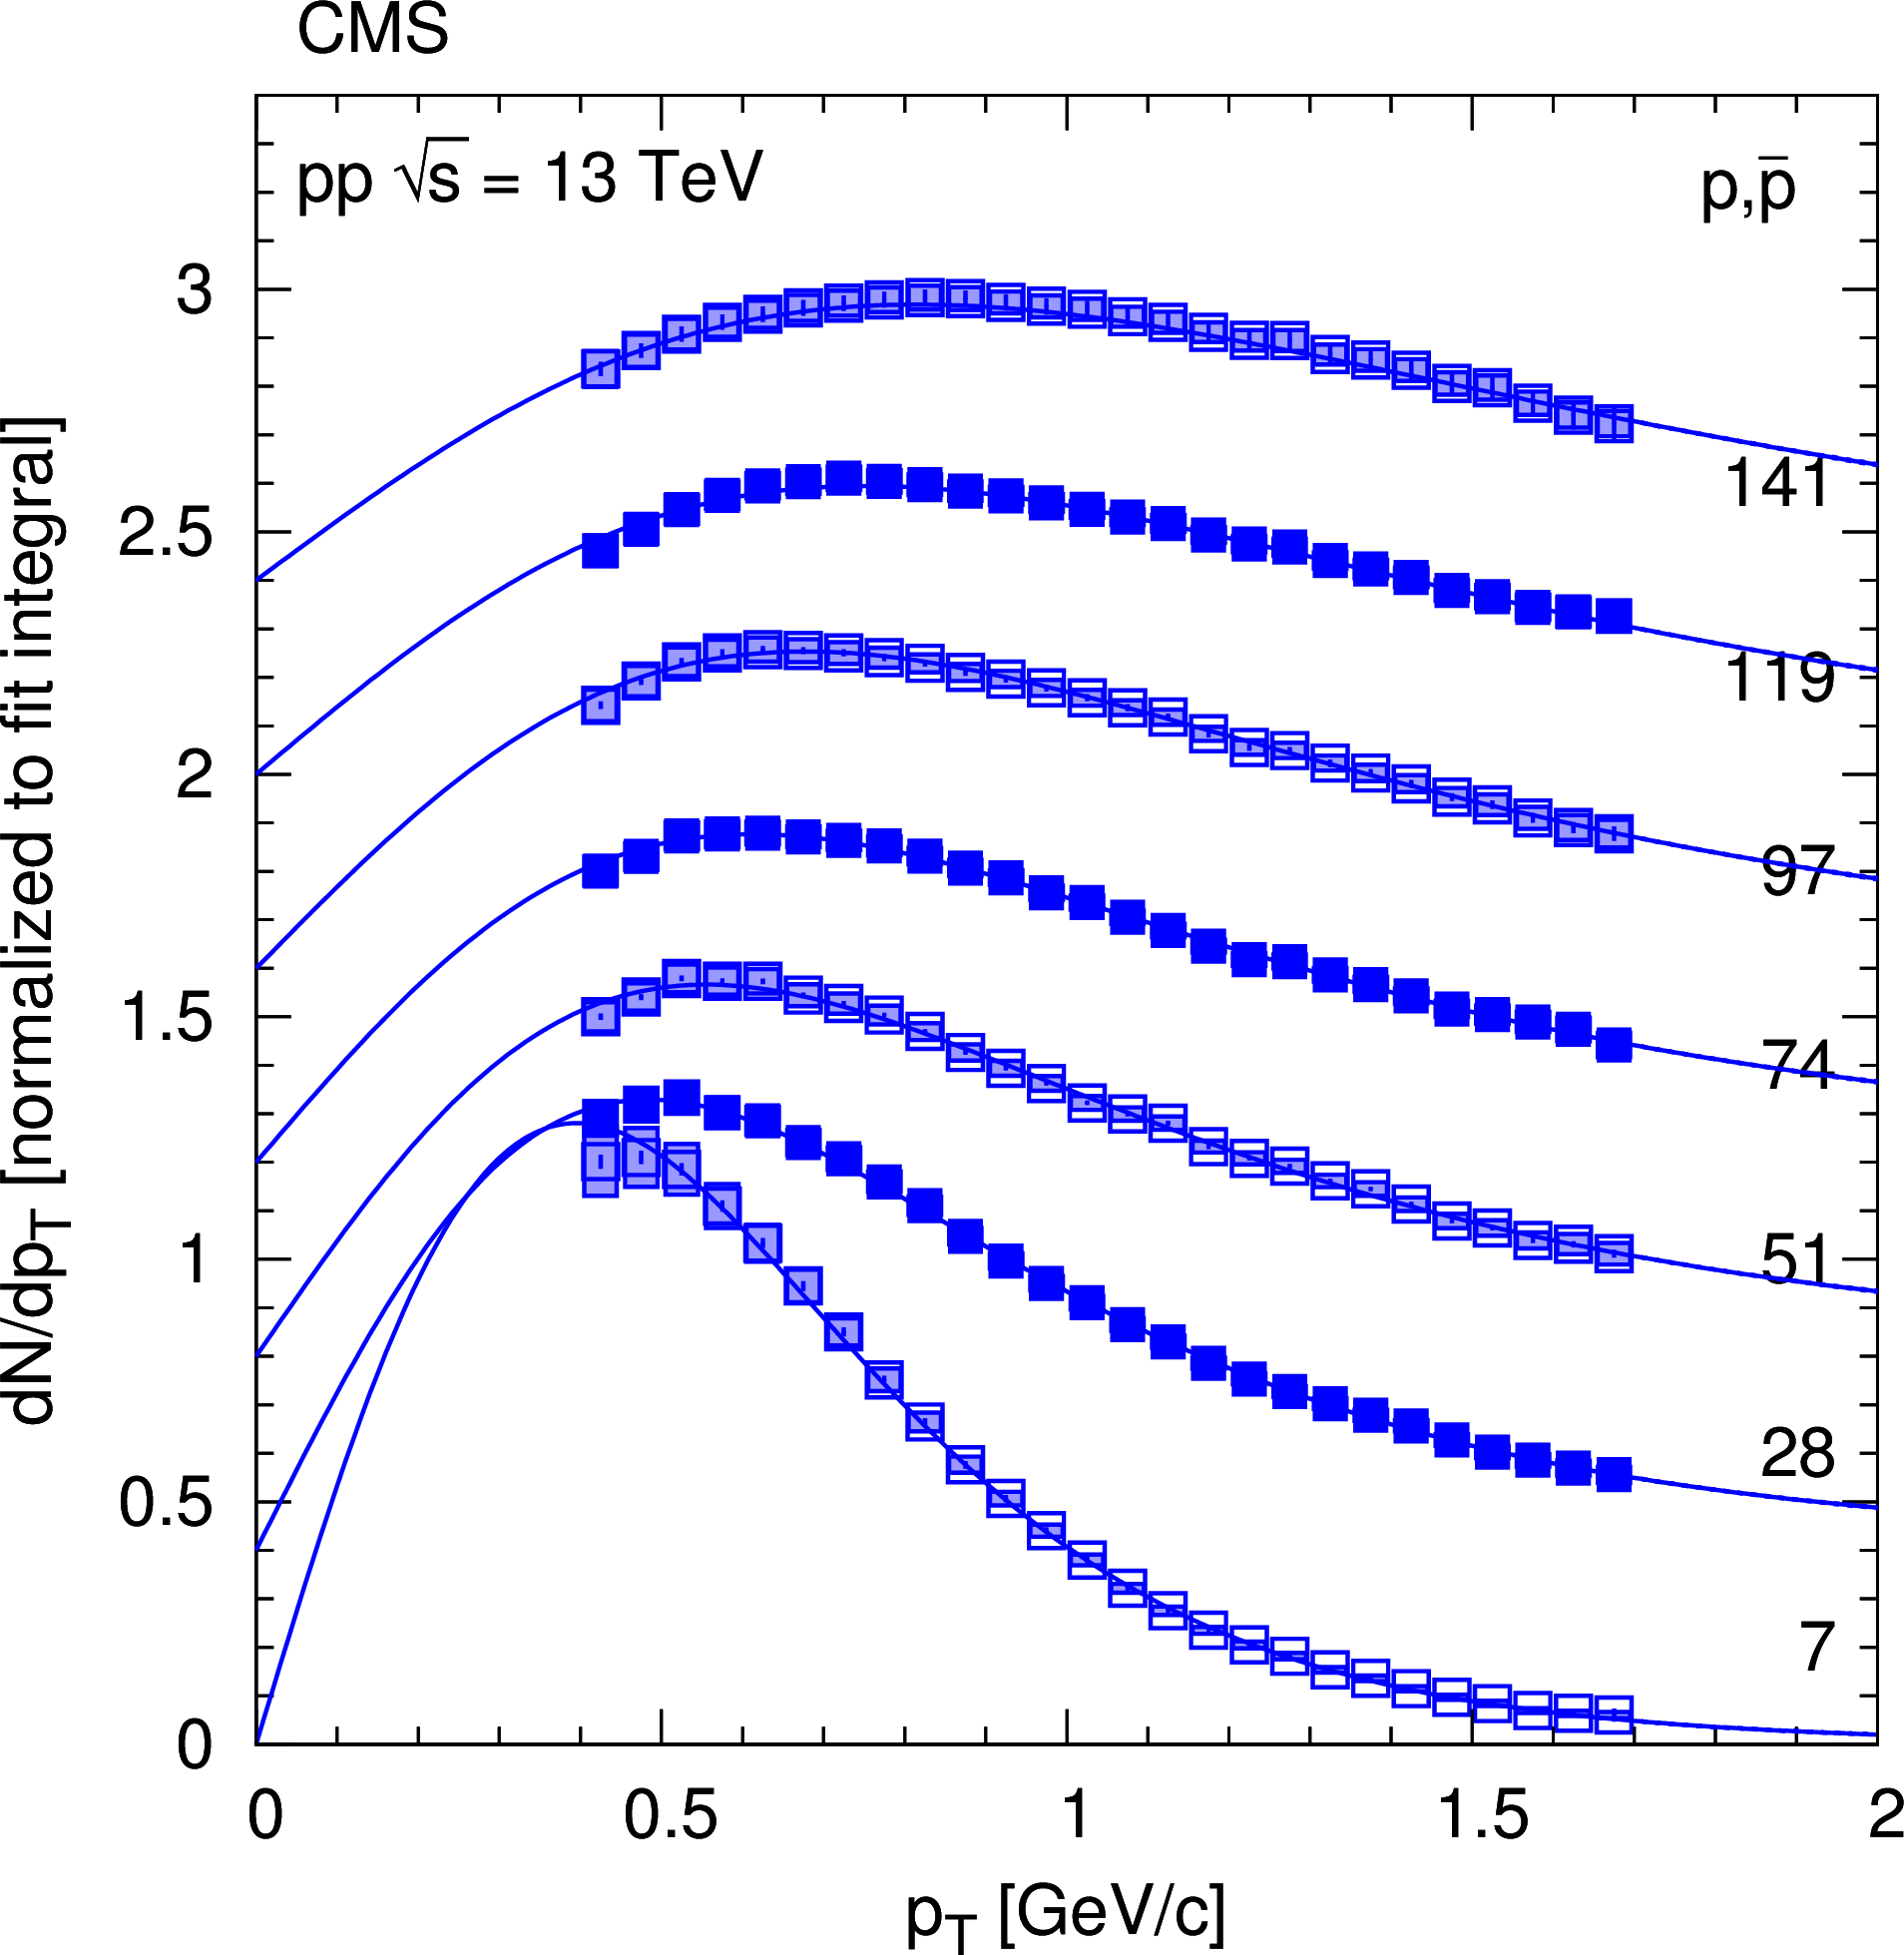
Figure 6:
Transverse momentum distributions of charged pions (top left), kaons (top right), and protons (bottom), normalized such that the fit integral is unity, in every selected multiplicity class ($< N_\text {tracks} > $ values are indicated) in the range $ {| y | }< $ 1, fitted with the Tsallis-Pareto parametrization (solid lines). For better visibility, the result for any given $< N_\text {tracks} > $ bin is shifted by 0.4 units with respect to the adjacent bins. Error bars indicate the uncorrelated statistical uncertainties, while boxes show the uncorrelated systematic uncertainties. Dotted lines (mostly indistinguishable from the nominal fit curves) illustrate the effect of varying the inverse exponent (1/$n$) of the Tsallis-Pareto function by $\pm $0.05 beyond the highest-$ {p_{\mathrm {T}}} $ measured point. |
png pdf |
Figure 6-a:
Transverse momentum distributions of charged pions (top left), kaons (top right), and protons (bottom), normalized such that the fit integral is unity, in every selected multiplicity class ($< N_\text {tracks} > $ values are indicated) in the range $ {| y | }< $ 1, fitted with the Tsallis-Pareto parametrization (solid lines). For better visibility, the result for any given $< N_\text {tracks} > $ bin is shifted by 0.4 units with respect to the adjacent bins. Error bars indicate the uncorrelated statistical uncertainties, while boxes show the uncorrelated systematic uncertainties. Dotted lines (mostly indistinguishable from the nominal fit curves) illustrate the effect of varying the inverse exponent (1/$n$) of the Tsallis-Pareto function by $\pm $0.05 beyond the highest-$ {p_{\mathrm {T}}} $ measured point. |
png pdf |
Figure 6-b:
Transverse momentum distributions of charged pions (top left), kaons (top right), and protons (bottom), normalized such that the fit integral is unity, in every selected multiplicity class ($< N_\text {tracks} > $ values are indicated) in the range $ {| y | }< $ 1, fitted with the Tsallis-Pareto parametrization (solid lines). For better visibility, the result for any given $< N_\text {tracks} > $ bin is shifted by 0.4 units with respect to the adjacent bins. Error bars indicate the uncorrelated statistical uncertainties, while boxes show the uncorrelated systematic uncertainties. Dotted lines (mostly indistinguishable from the nominal fit curves) illustrate the effect of varying the inverse exponent (1/$n$) of the Tsallis-Pareto function by $\pm $0.05 beyond the highest-$ {p_{\mathrm {T}}} $ measured point. |
png pdf |
Figure 6-c:
Transverse momentum distributions of charged pions (top left), kaons (top right), and protons (bottom), normalized such that the fit integral is unity, in every selected multiplicity class ($< N_\text {tracks} > $ values are indicated) in the range $ {| y | }< $ 1, fitted with the Tsallis-Pareto parametrization (solid lines). For better visibility, the result for any given $< N_\text {tracks} > $ bin is shifted by 0.4 units with respect to the adjacent bins. Error bars indicate the uncorrelated statistical uncertainties, while boxes show the uncorrelated systematic uncertainties. Dotted lines (mostly indistinguishable from the nominal fit curves) illustrate the effect of varying the inverse exponent (1/$n$) of the Tsallis-Pareto function by $\pm $0.05 beyond the highest-$ {p_{\mathrm {T}}} $ measured point. |
png pdf |
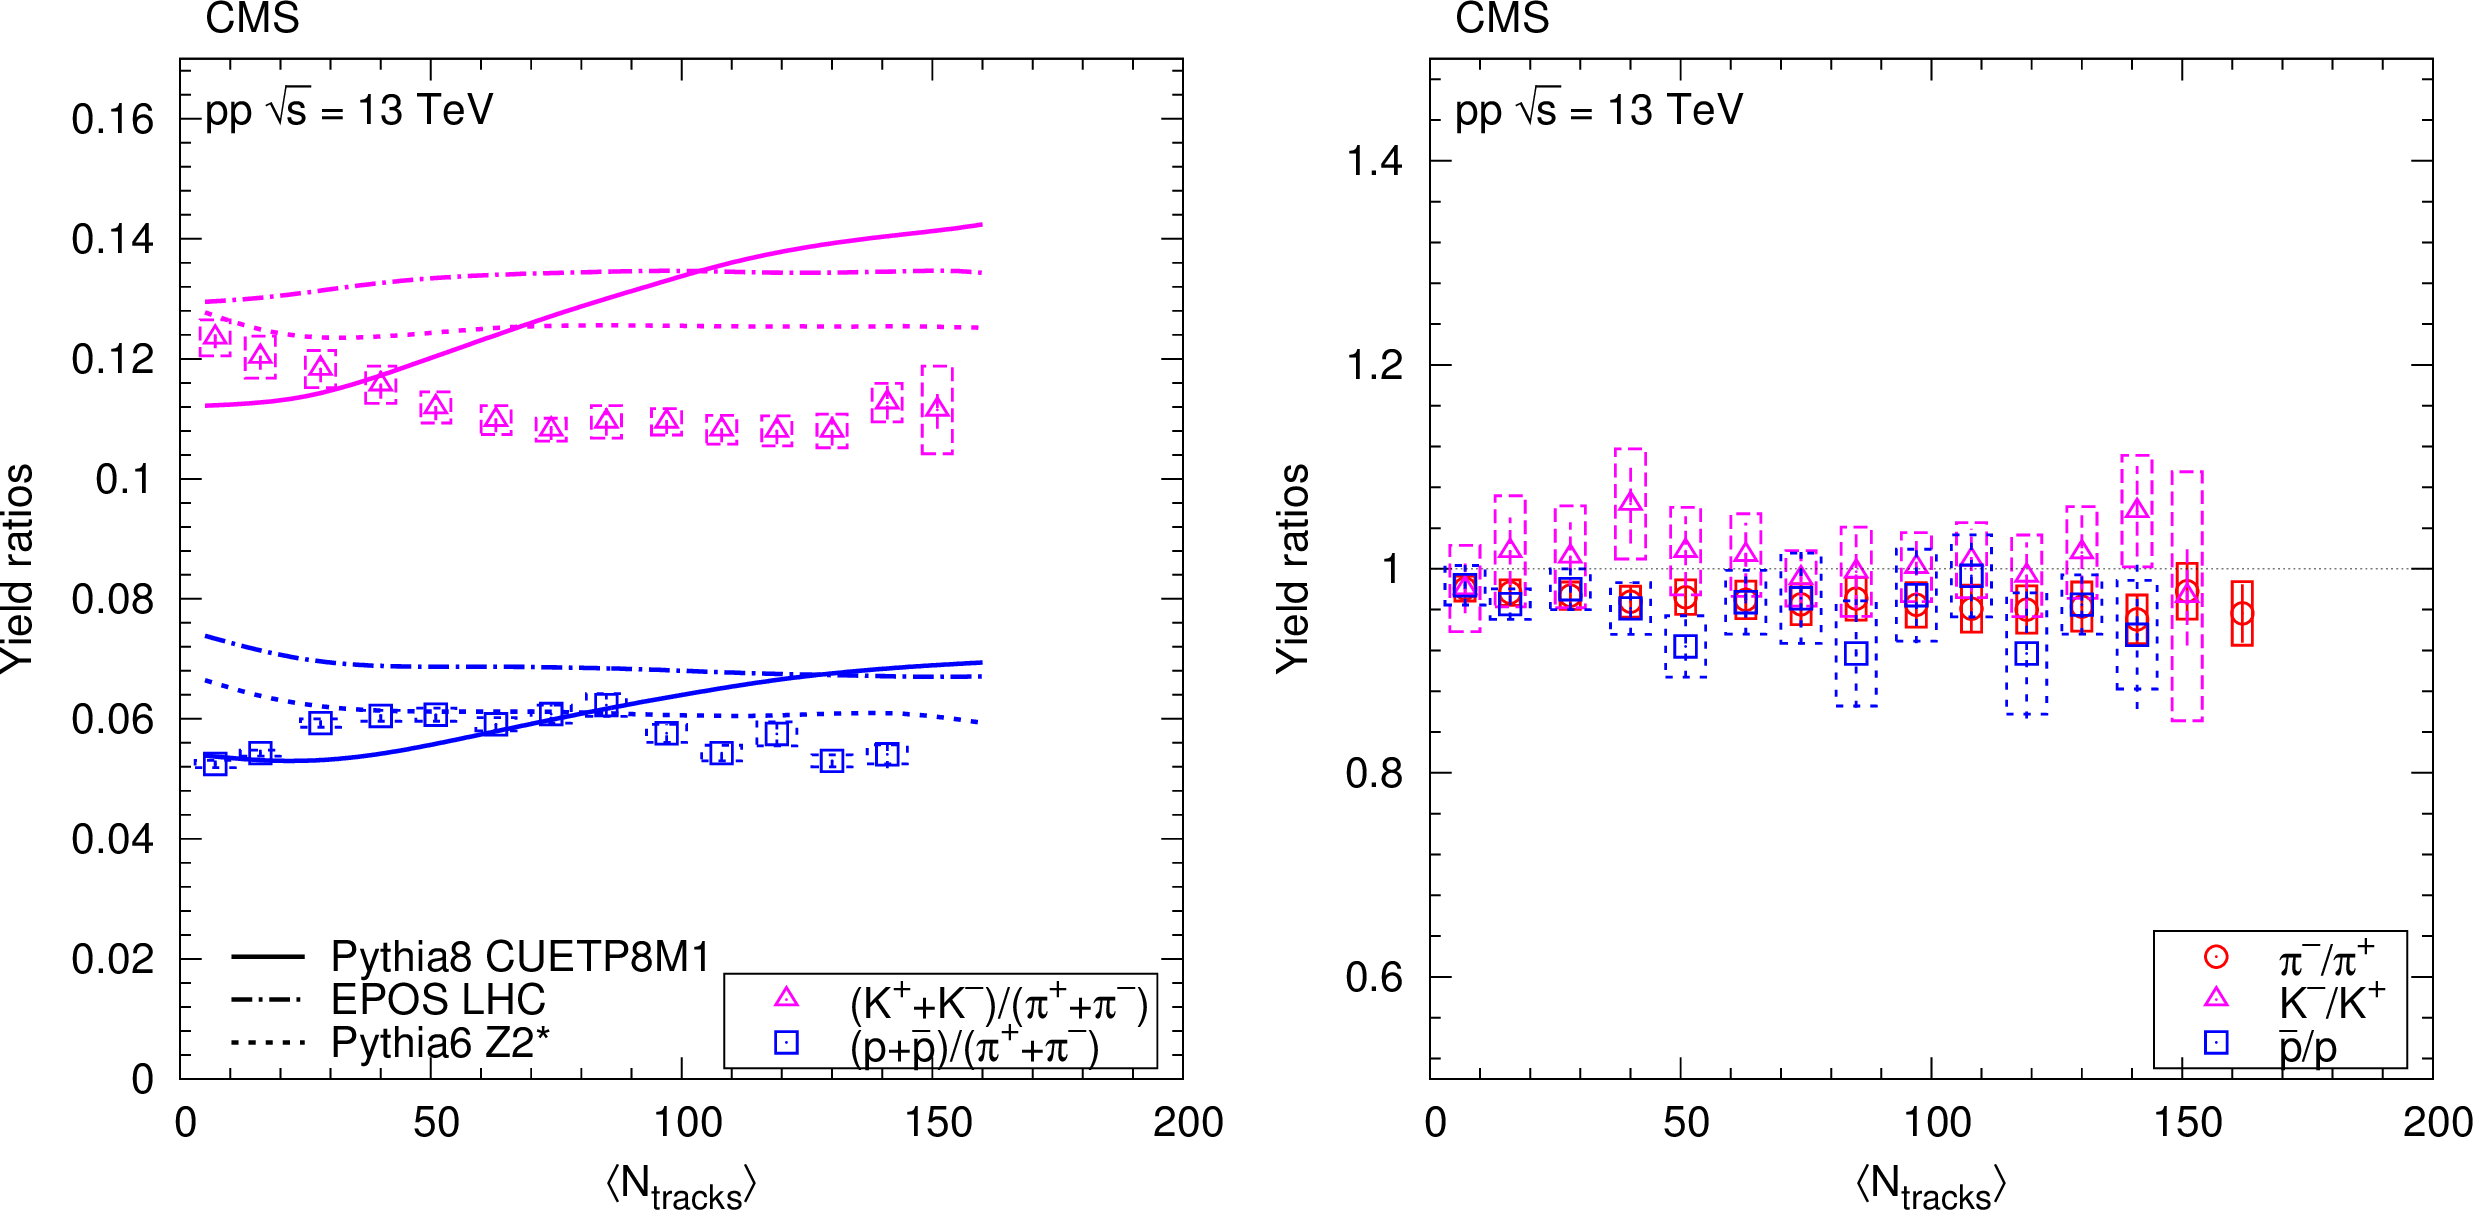
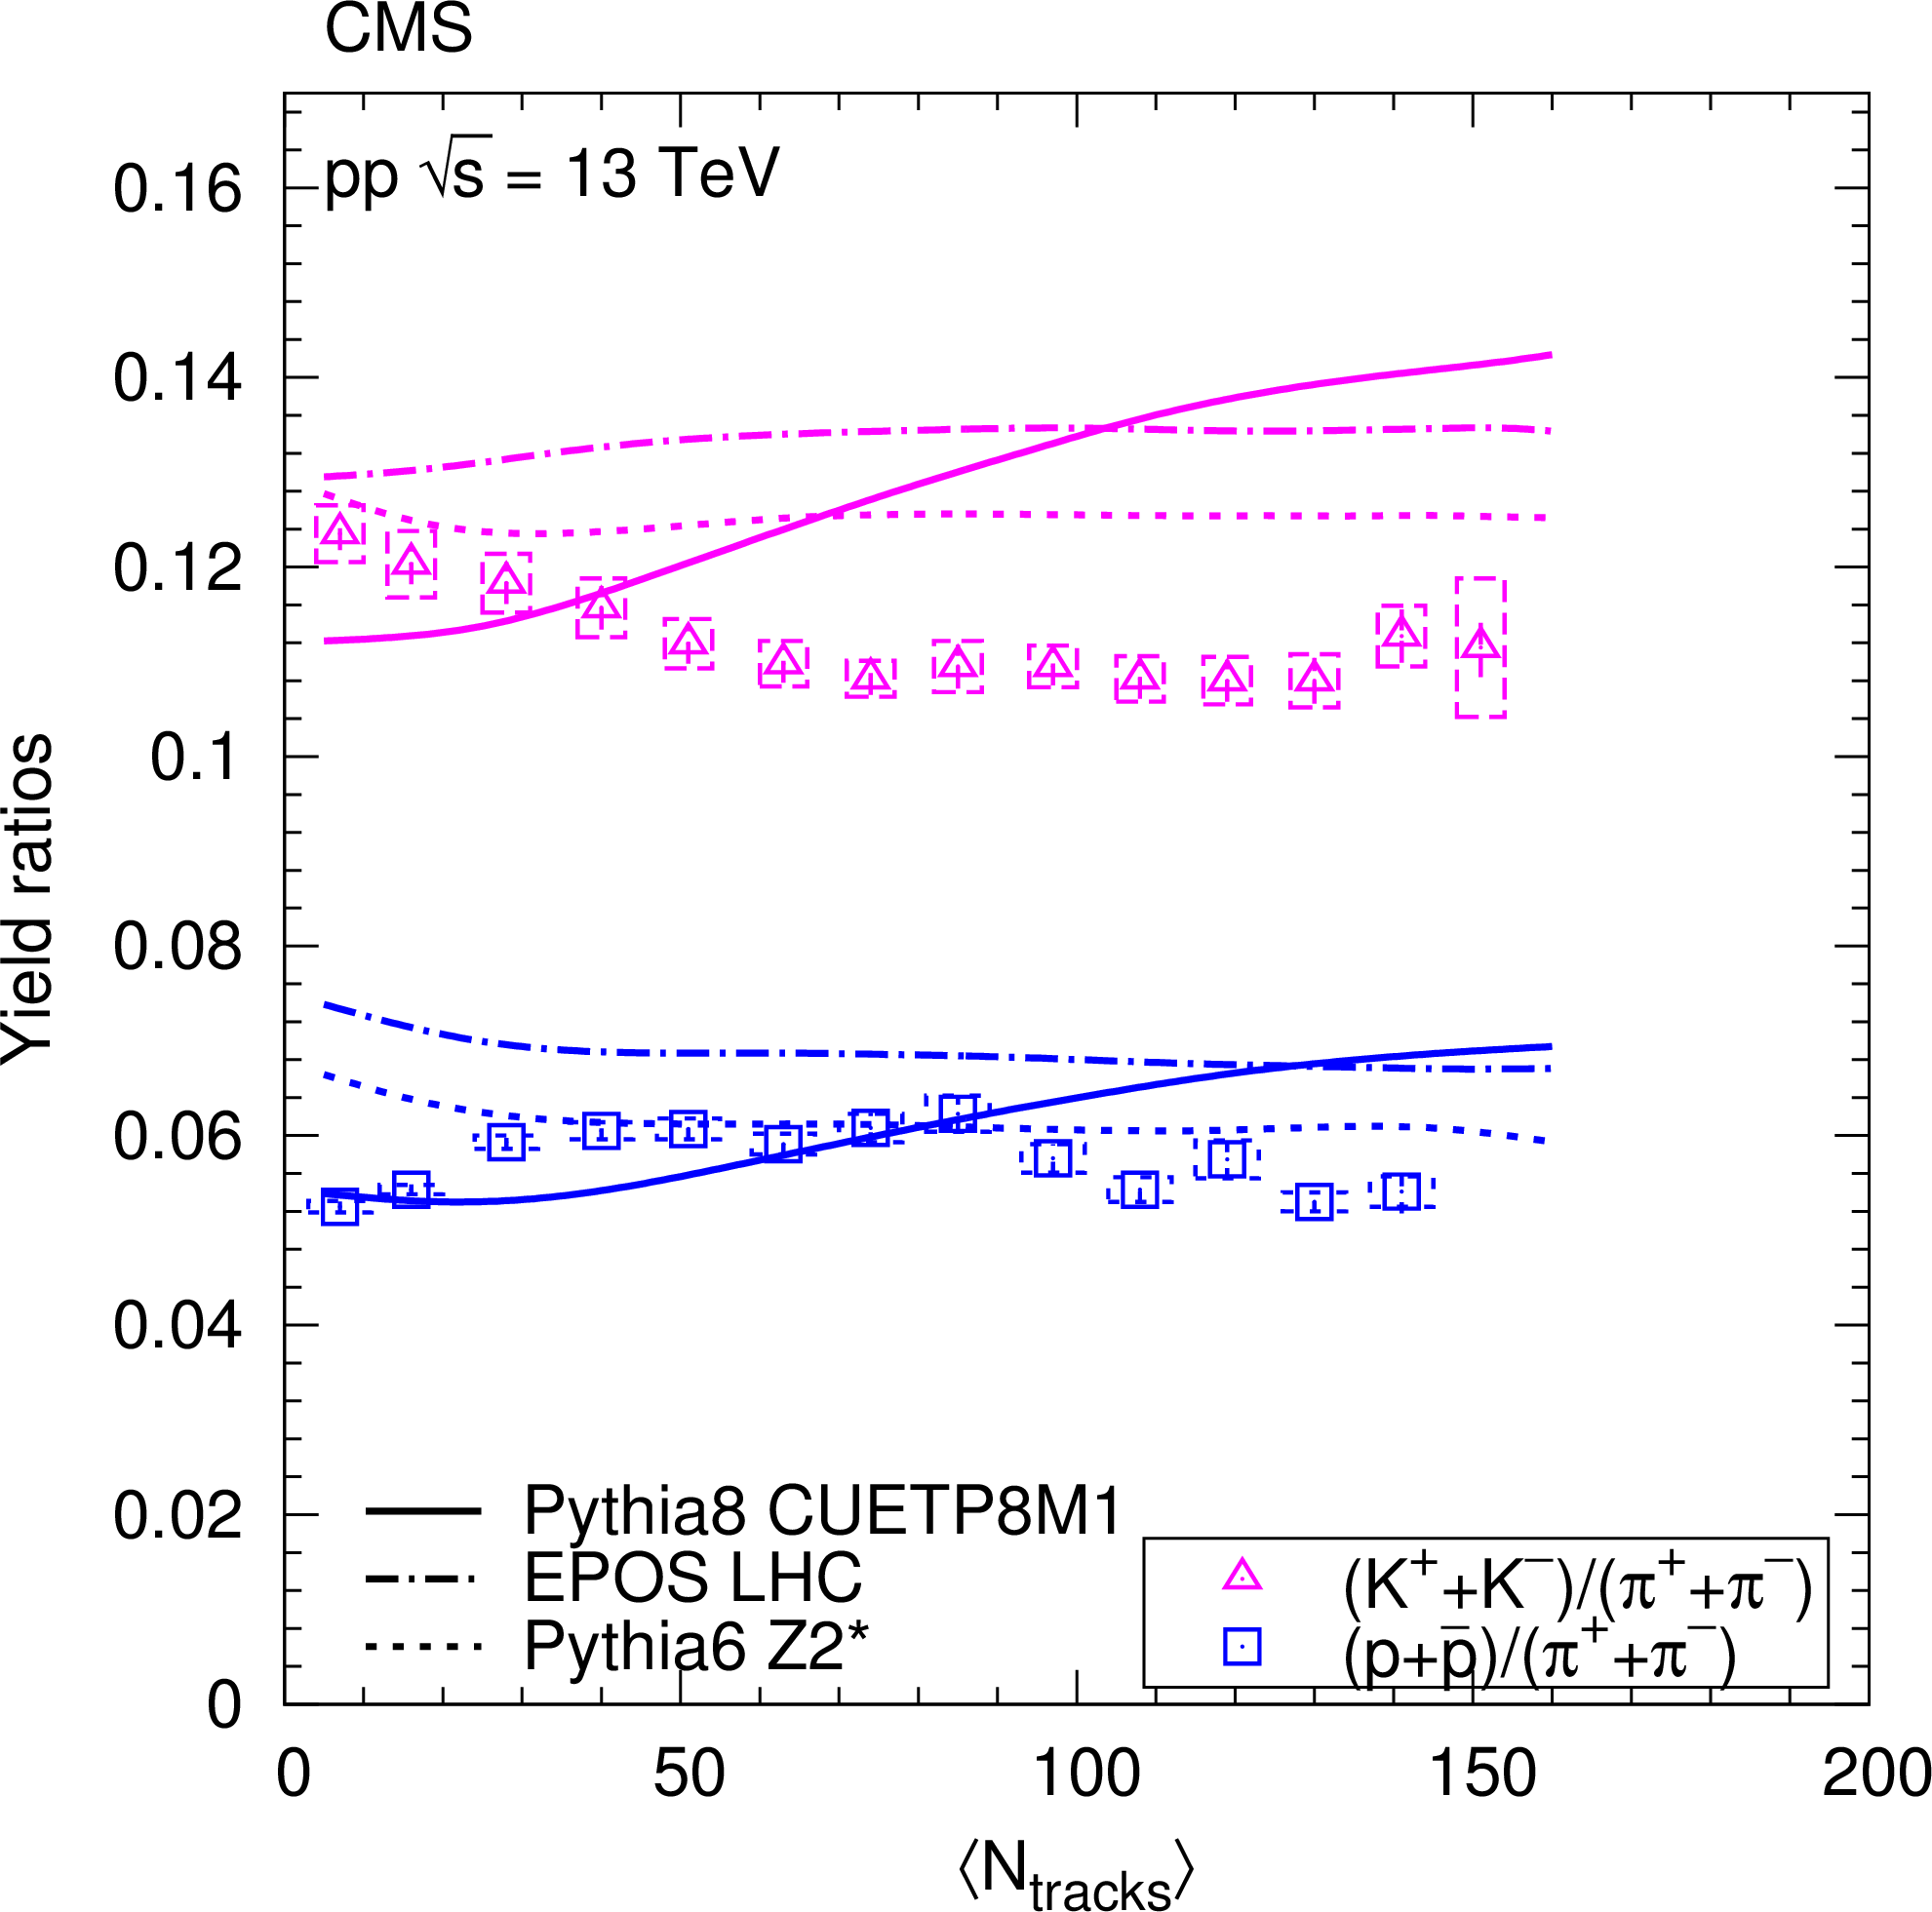
Figure 7:
Ratios of particle yields in the range $ {| y | }< $ 1 as a function of the corrected track multiplicity for $ {| \eta | } < $ 2.4. The K/$\pi $ and p/$\pi $ values are shown in the left panel, and opposite-charge ratios are plotted in the right panel. Error bars indicate the uncorrelated combined uncertainties, while boxes show the uncorrelated systematic uncertainties. In the left panel, curves indicate predictions from PYTHIA8, epos, and PYTHIA6. |
png pdf |
Figure 7-a:
Ratios of particle yields in the range $ {| y | }< $ 1 as a function of the corrected track multiplicity for $ {| \eta | } < $ 2.4. The K/$\pi $ and p/$\pi $ values are shown in the left panel, and opposite-charge ratios are plotted in the right panel. Error bars indicate the uncorrelated combined uncertainties, while boxes show the uncorrelated systematic uncertainties. In the left panel, curves indicate predictions from PYTHIA8, epos, and PYTHIA6. |

png pdf |
Figure 7-b:
Ratios of particle yields in the range $ {| y | }< $ 1 as a function of the corrected track multiplicity for $ {| \eta | } < $ 2.4. The K/$\pi $ and p/$\pi $ values are shown in the left panel, and opposite-charge ratios are plotted in the right panel. Error bars indicate the uncorrelated combined uncertainties, while boxes show the uncorrelated systematic uncertainties. In the left panel, curves indicate predictions from PYTHIA8, epos, and PYTHIA6. |
png pdf |
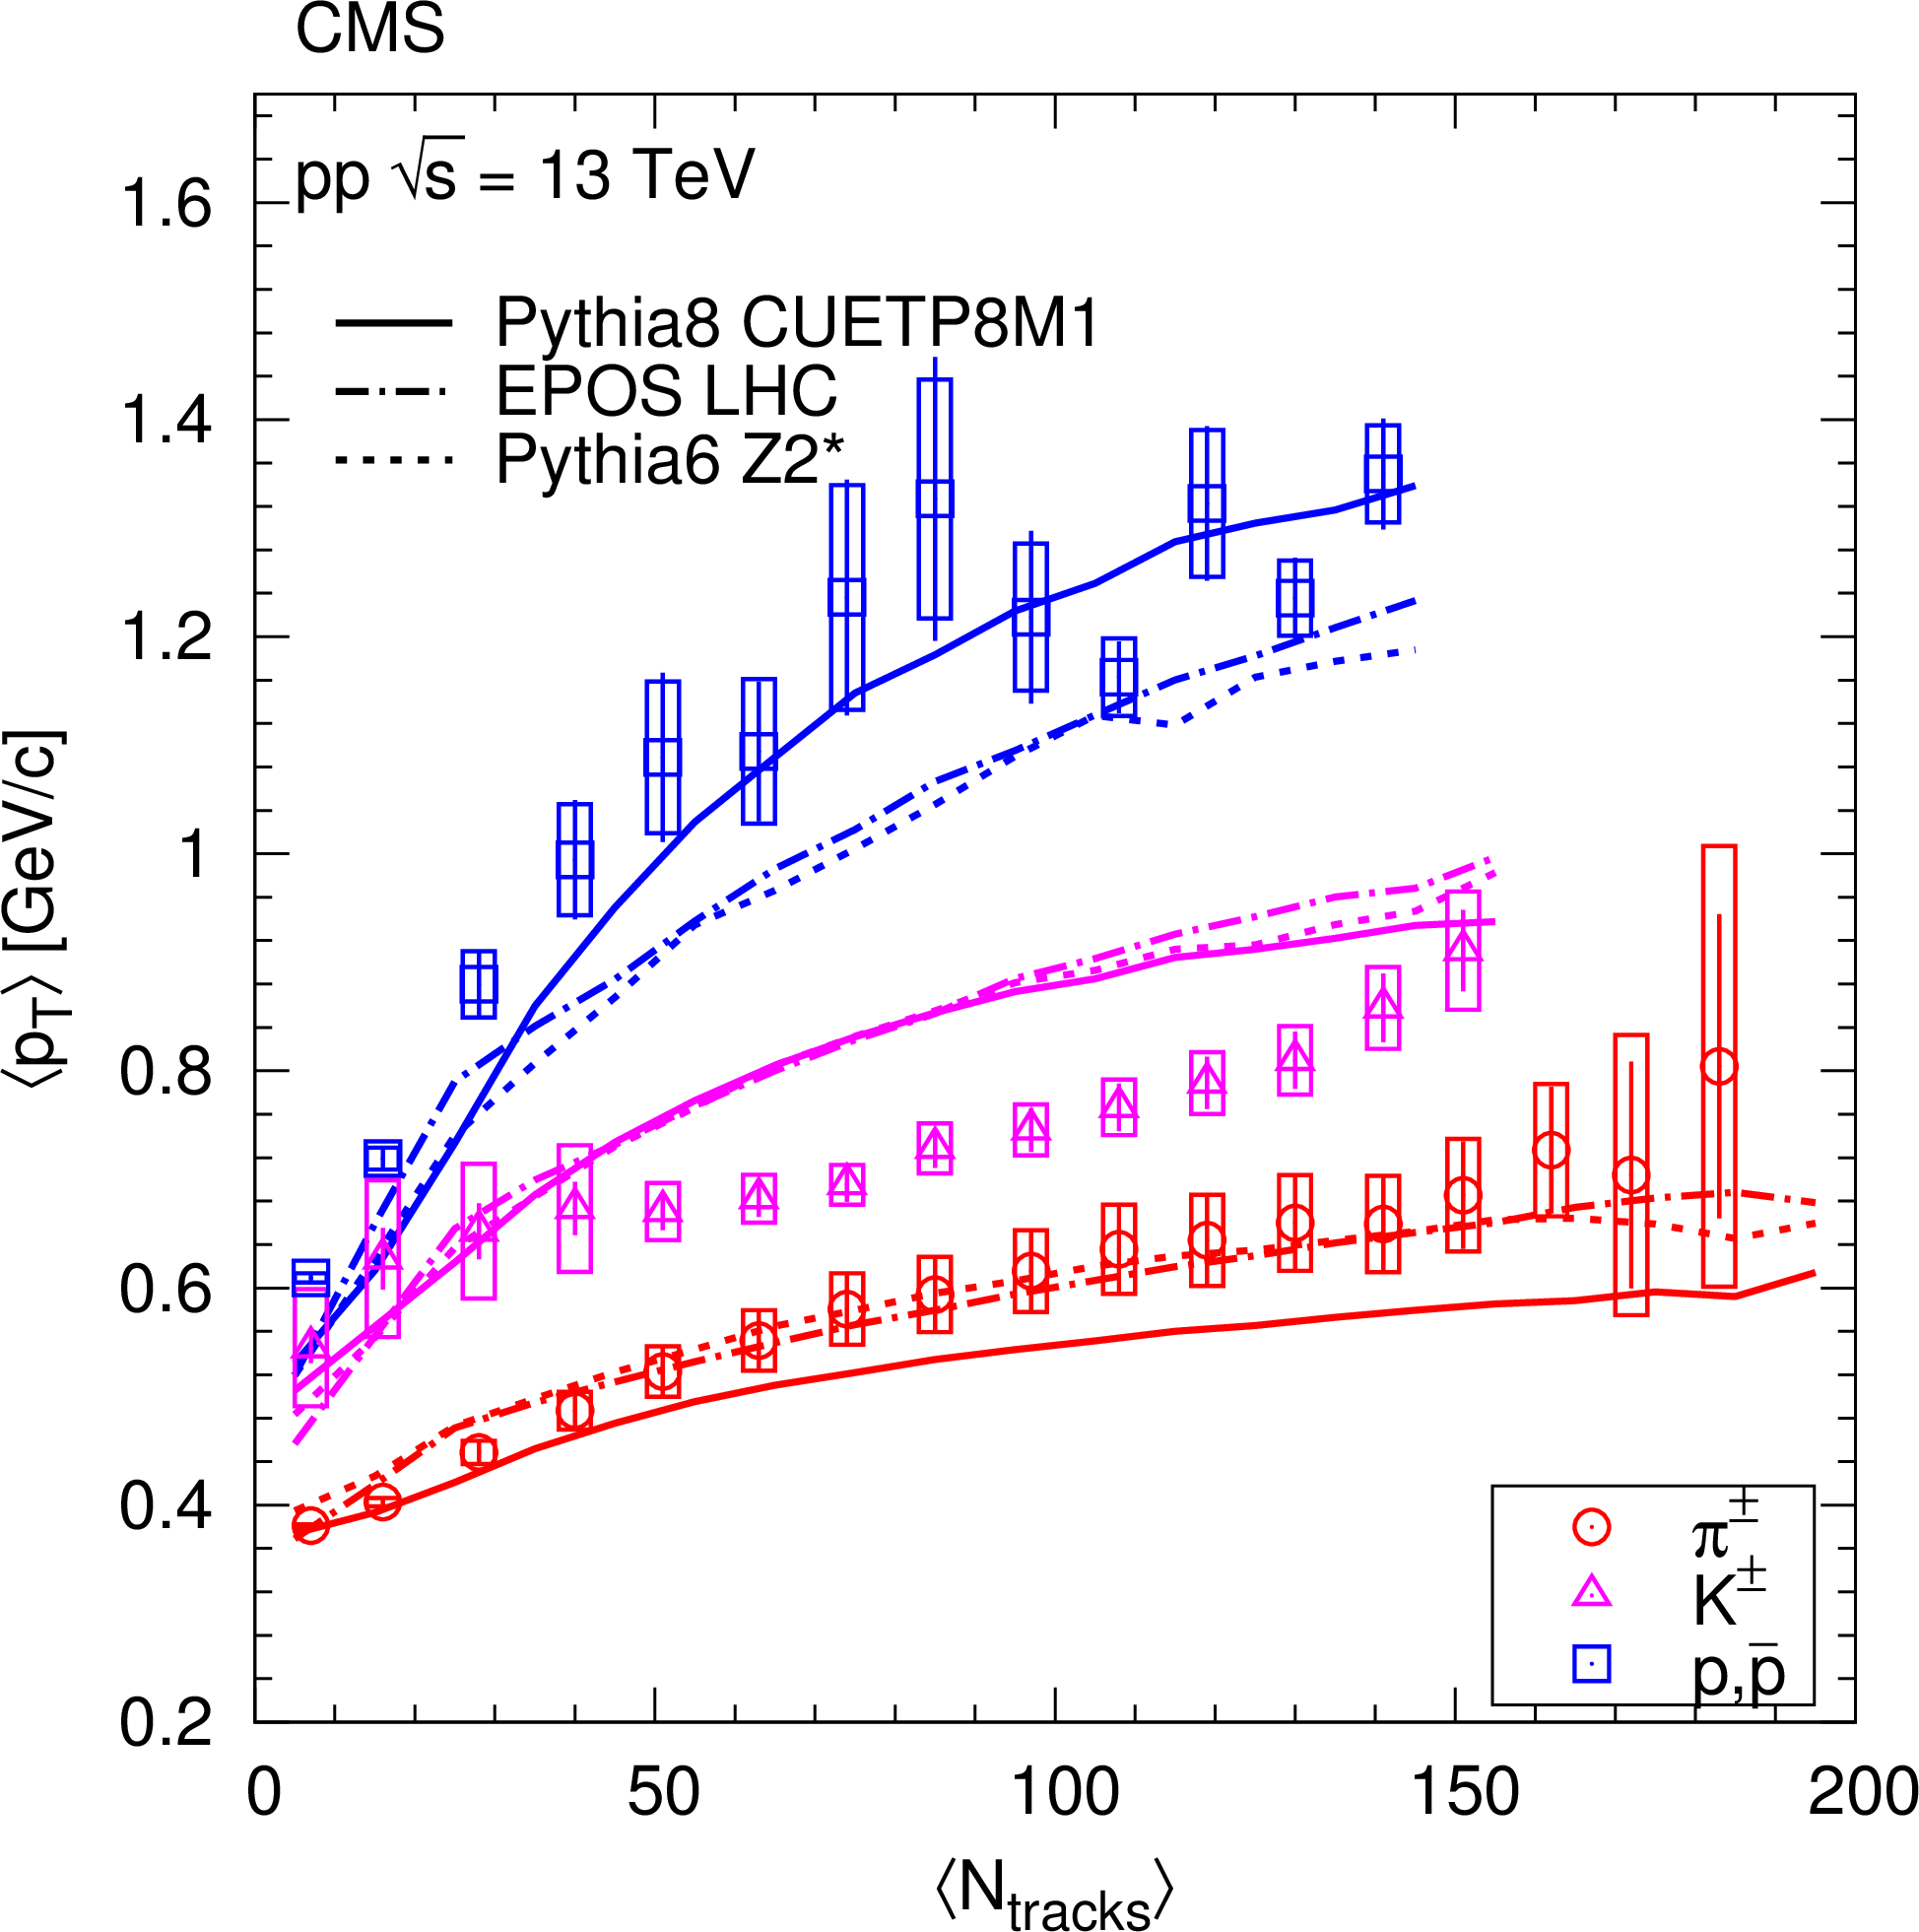
Figure 8:
Average transverse momentum of identified charged hadrons (pions, kaons, protons) in the range $ {| y | }< $ 1, as functions of the corrected track multiplicity for $ {| \eta | } < $ 2.4, computed assuming a Tsallis-Pareto distribution in the unmeasured range. Error bars indicate the uncorrelated combined uncertainties, while boxes show the uncorrelated systematic uncertainties. The fully correlated normalization uncertainty (not shown) is 1.0%. Curves indicate predictions from PYTHIA8, epos, and PYTHIA6. |
png pdf |
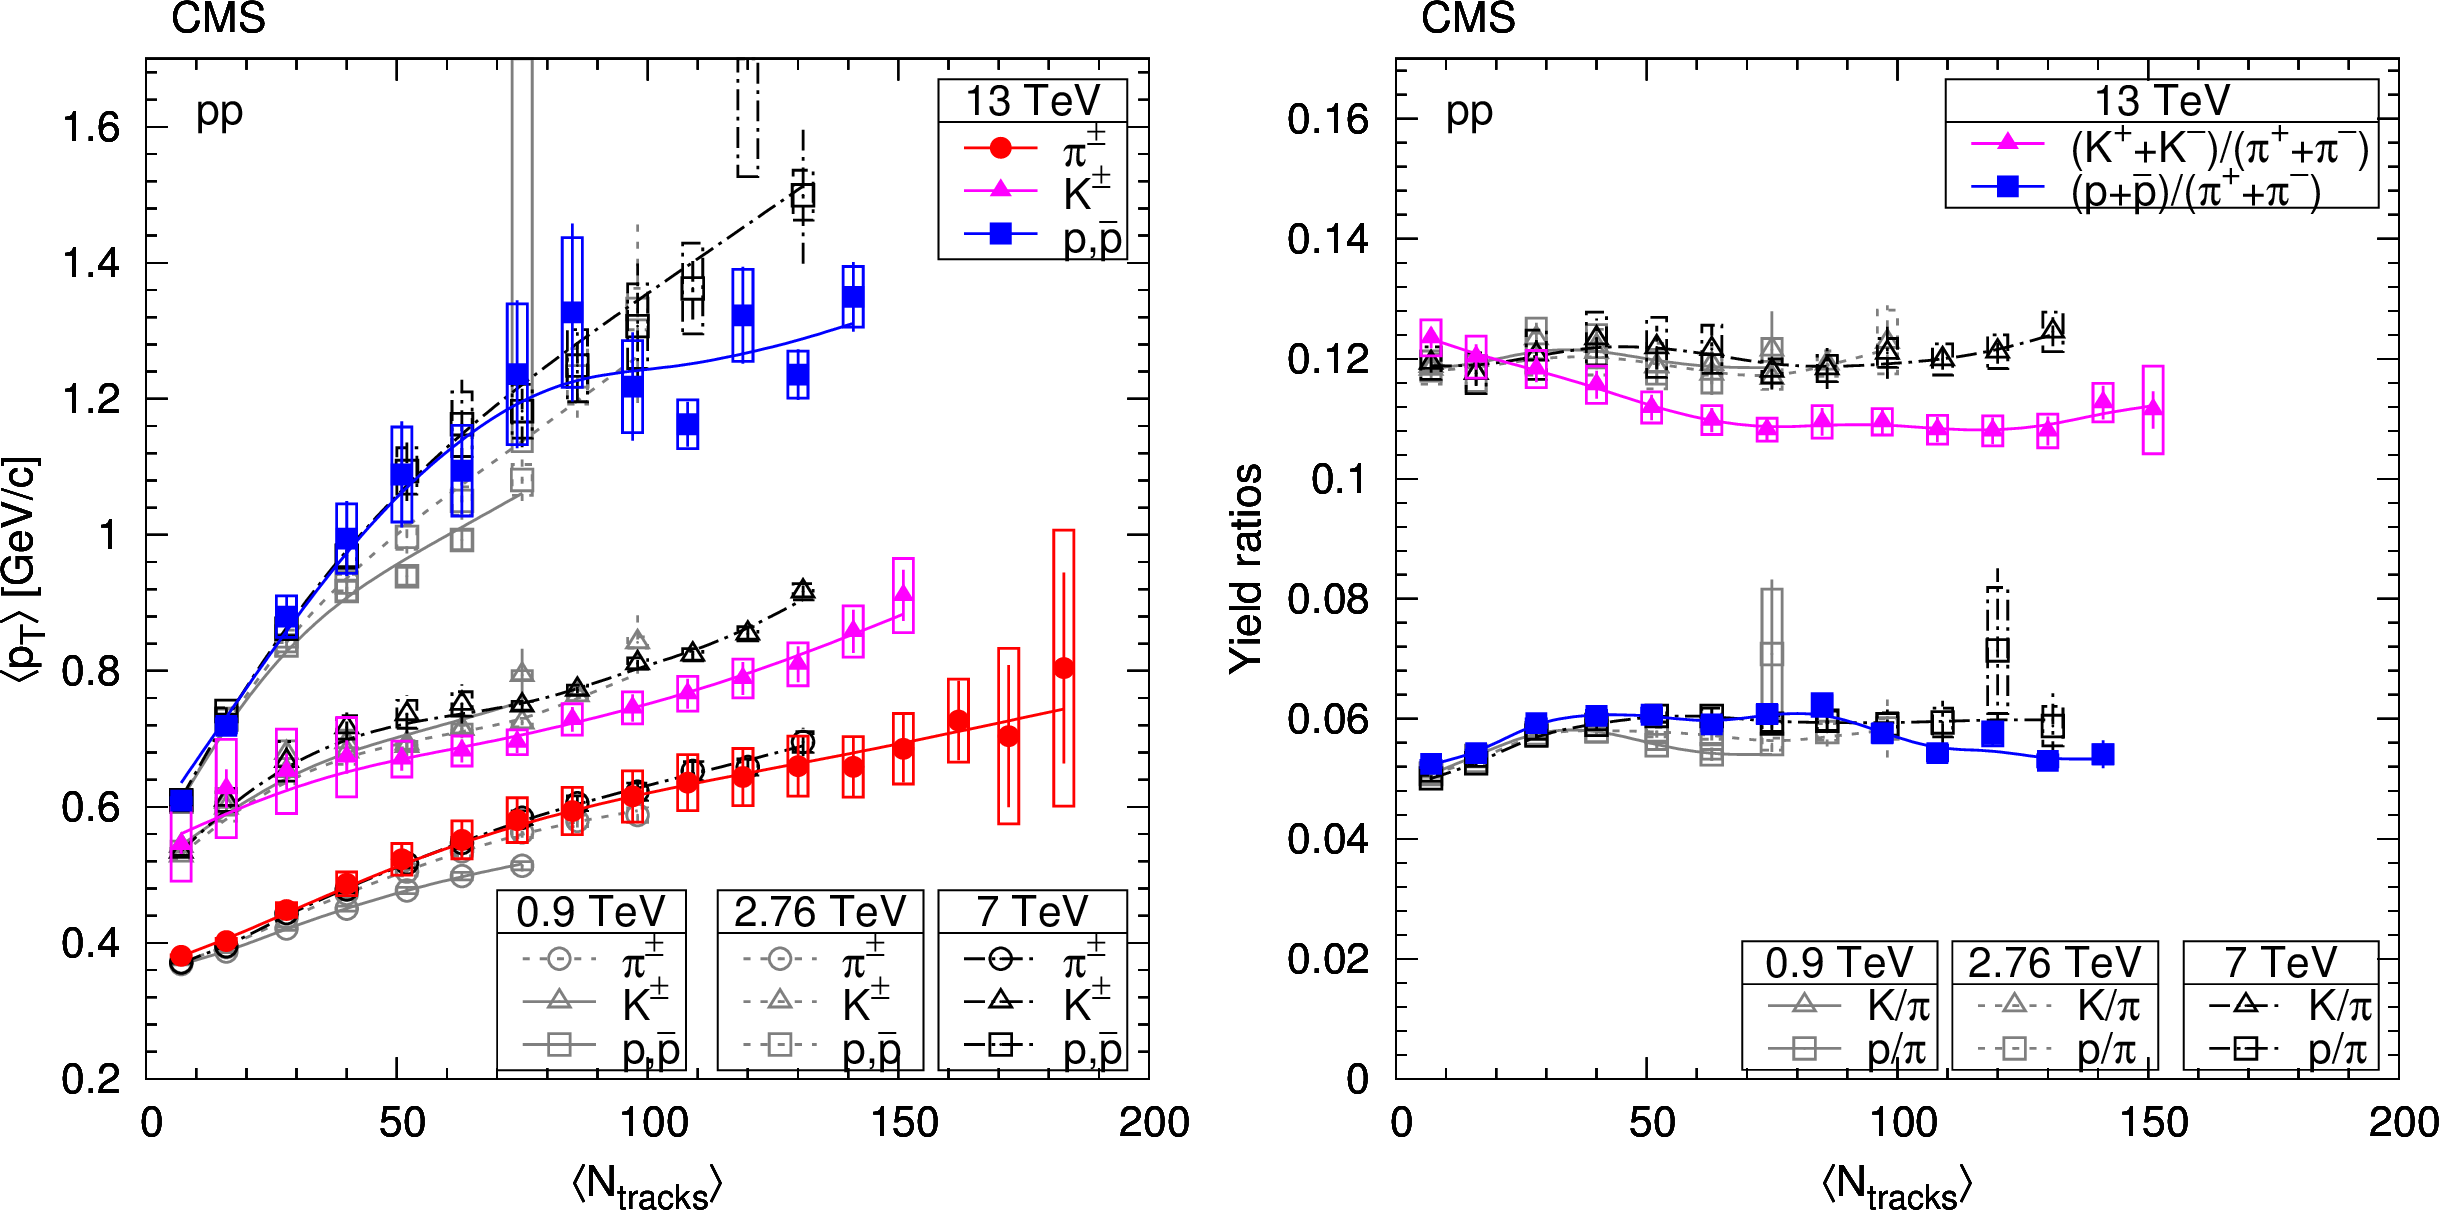
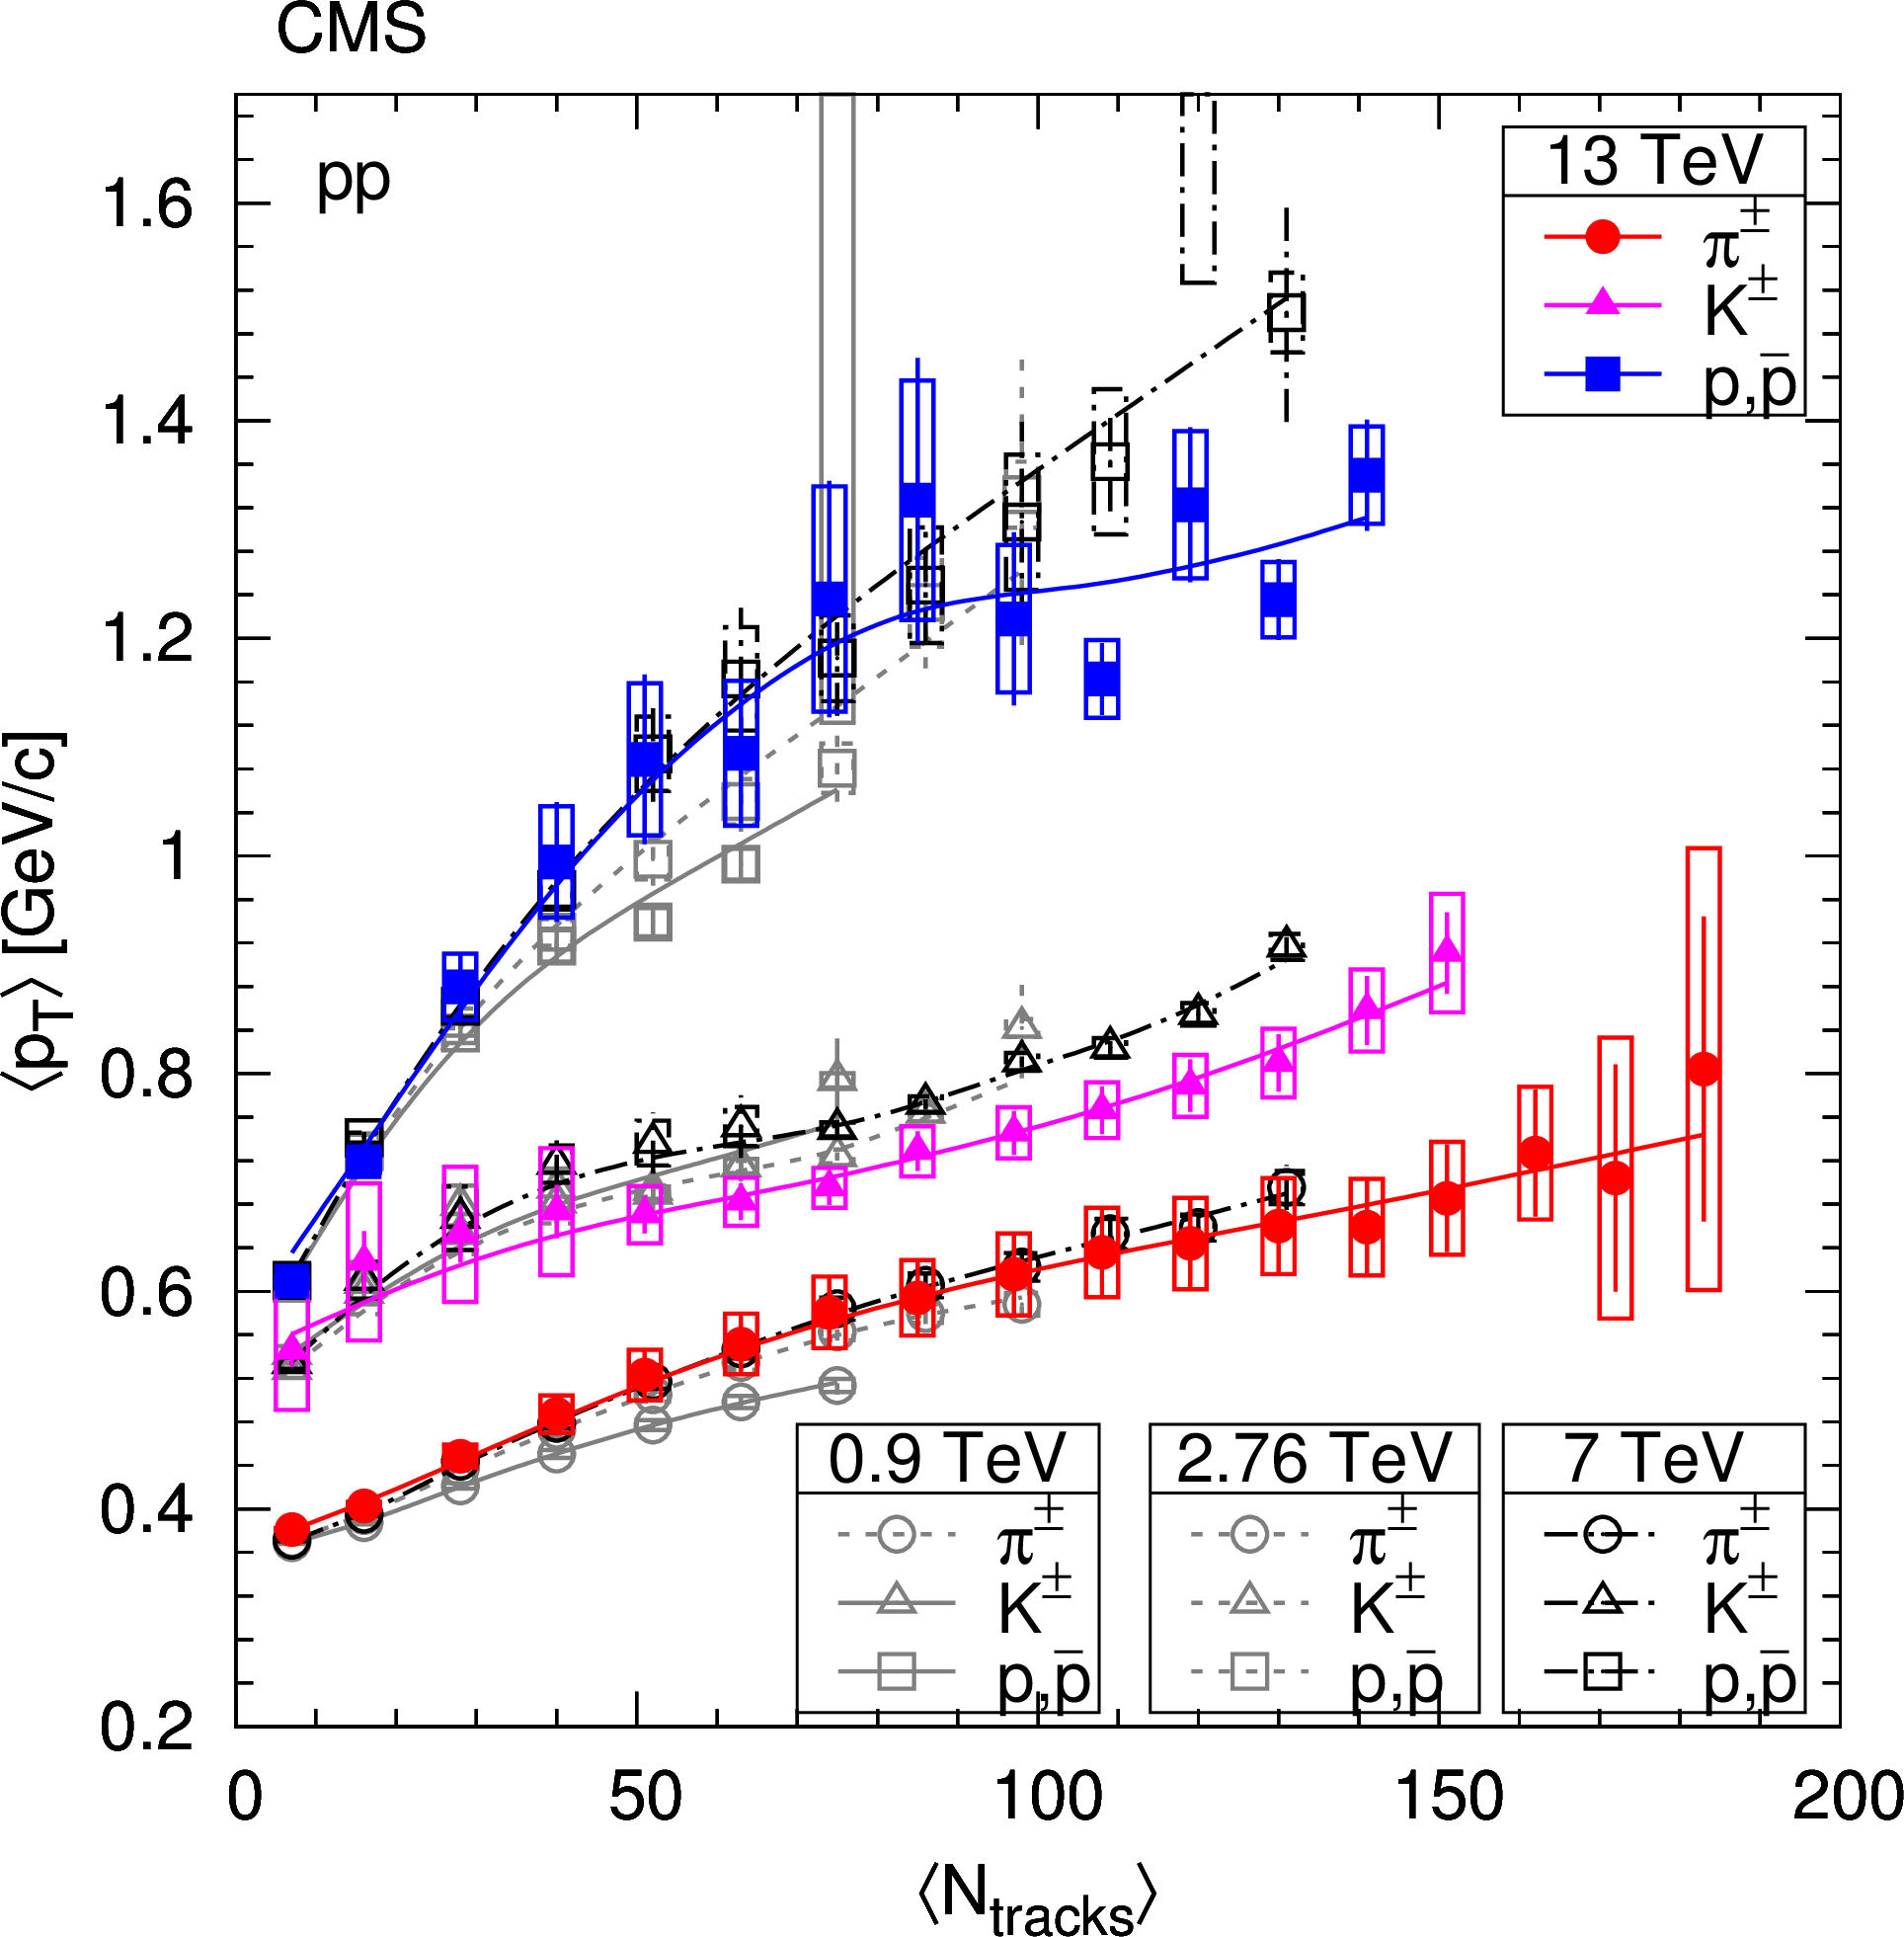
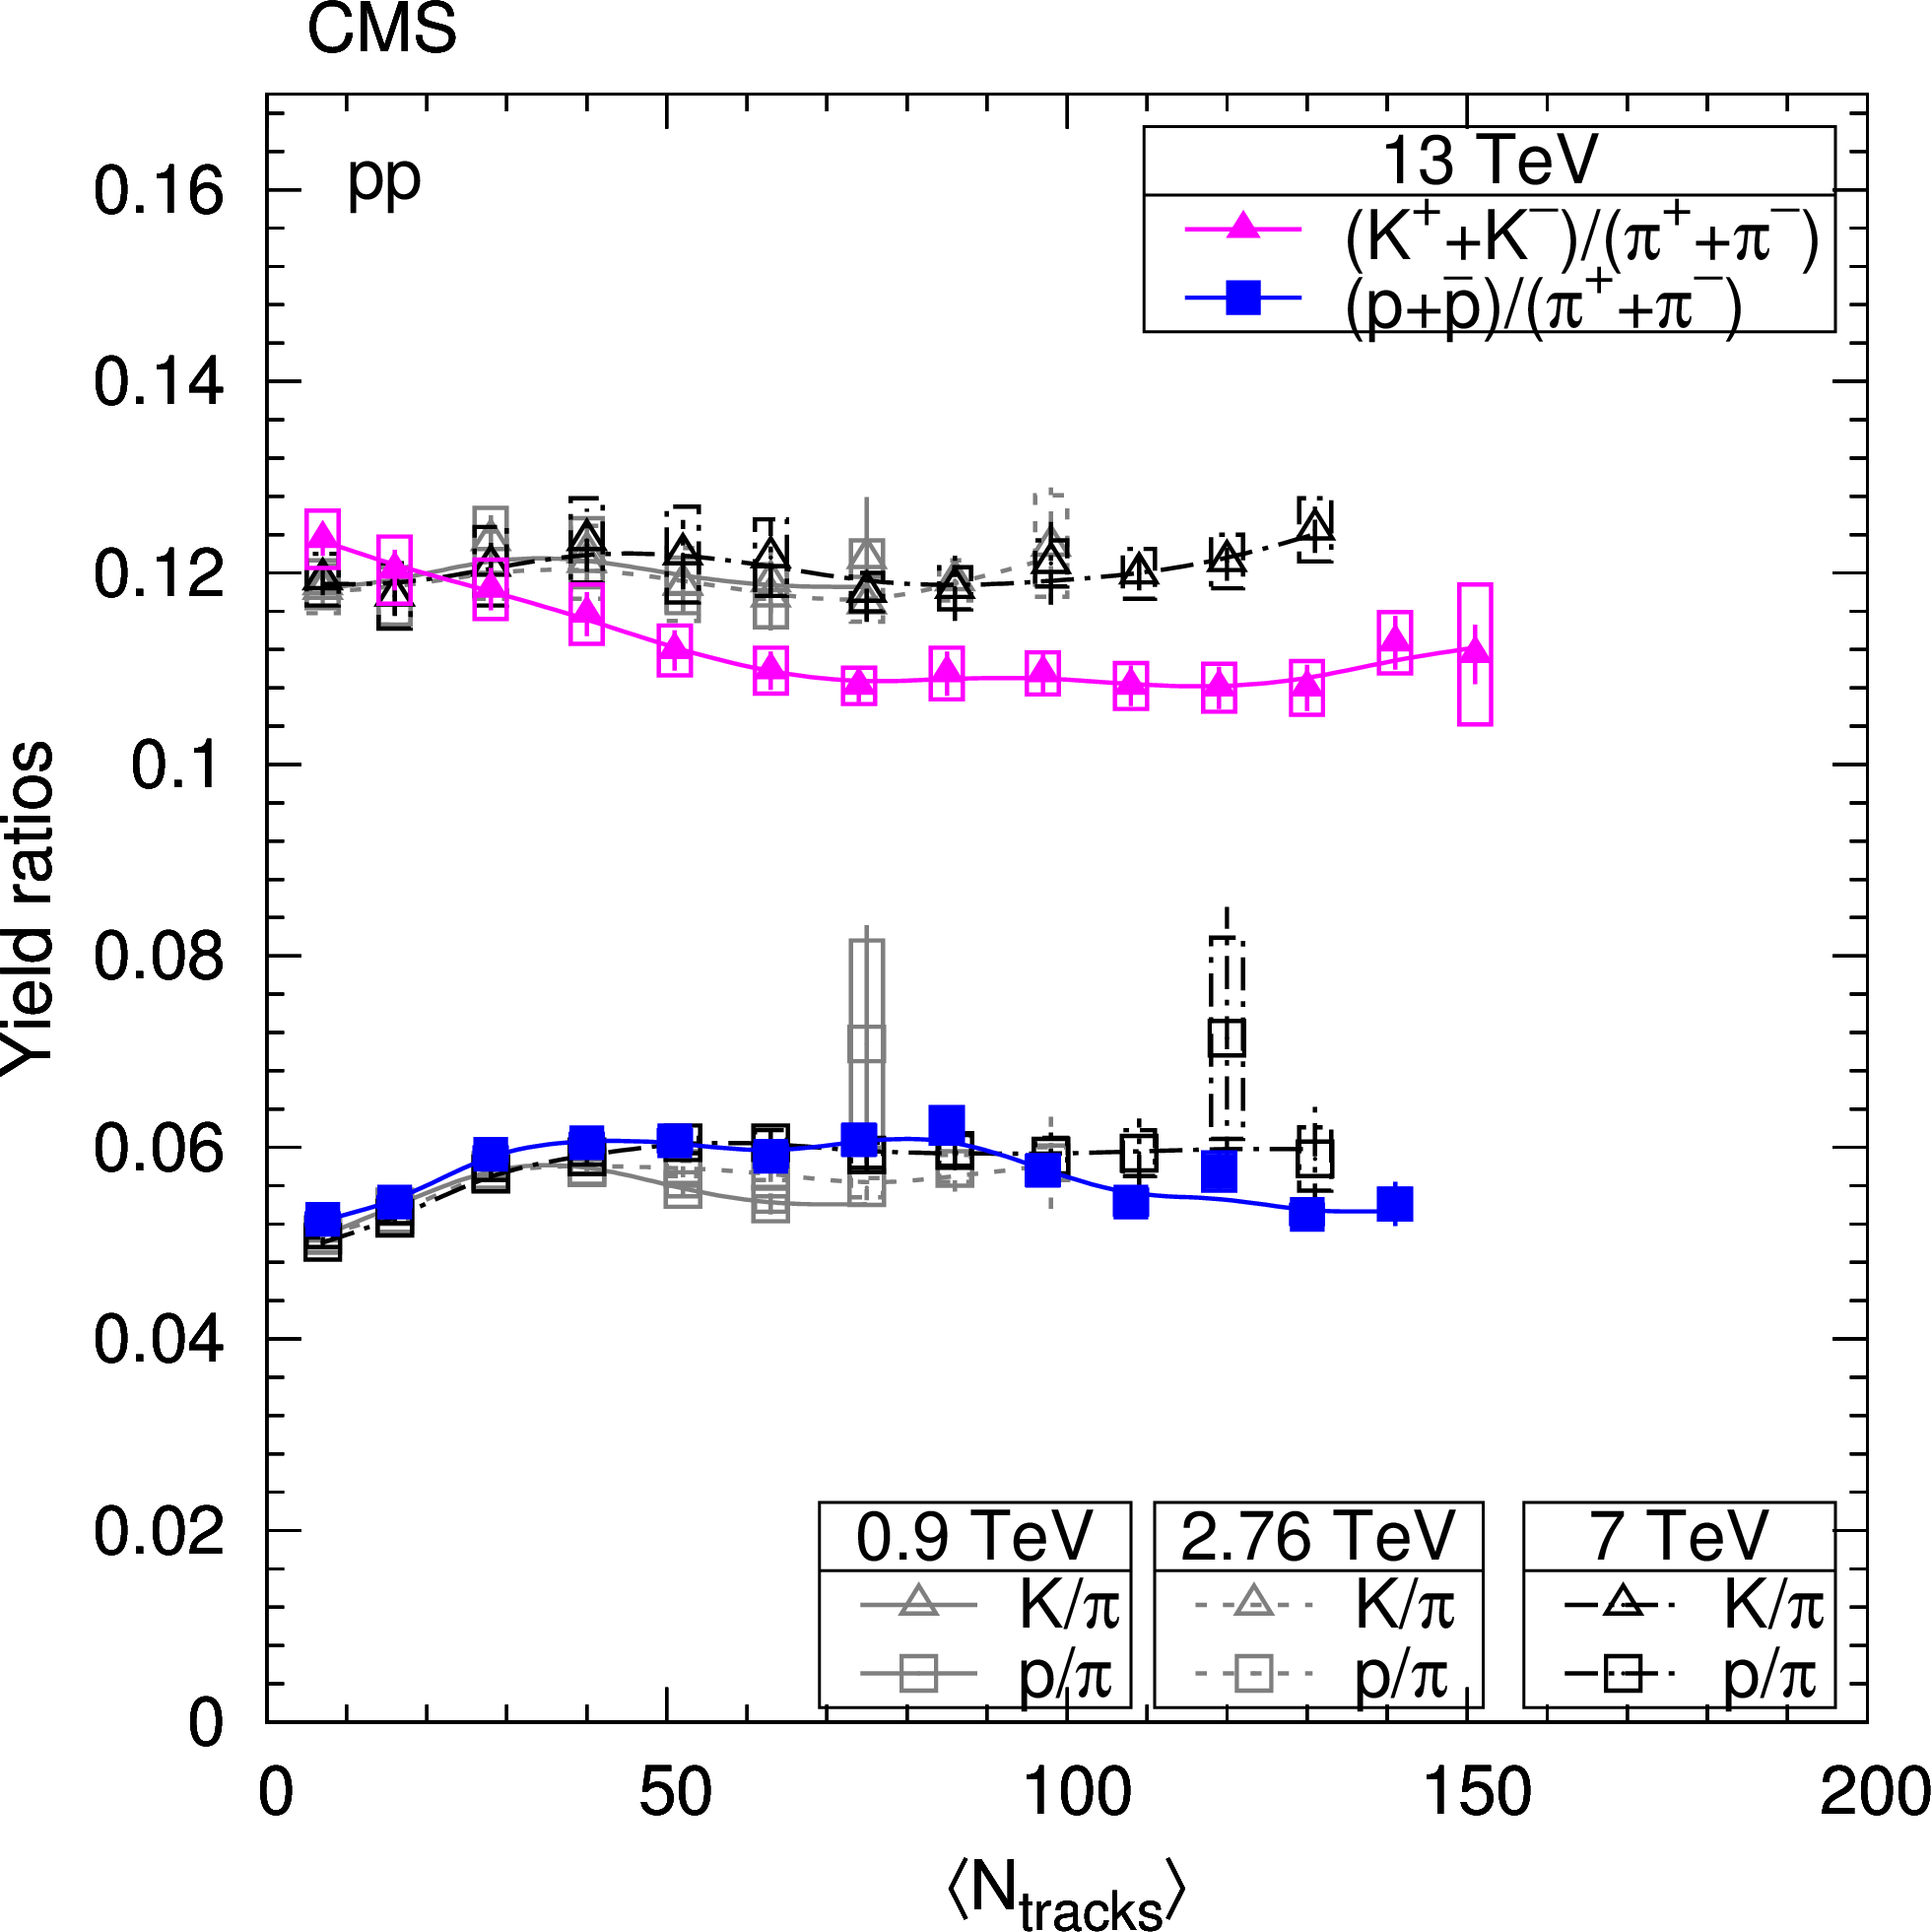
Figure 9:
Average transverse momentum of identified charged hadrons (pions, kaons, protons; left panel) and ratios of particle yields (right panel) in the range $ {| y | }< $ 1 as functions of the corrected track multiplicity for $ {| \eta | } < $ 2.4, for pp collisions at $\sqrt {s} = $ 13 TeV (filled symbols) and at lower energies (open symbols) [2]. Both $< {p_{\mathrm {T}}} > $ and yield ratios are computed assuming a Tsallis-Pareto distribution in the unmeasured range. Error bars indicate the uncorrelated combined uncertainties, while boxes show the uncorrelated systematic uncertainties. For $< {p_{\mathrm {T}}} > $ the fully correlated normalization uncertainty (not shown) is 1.0%. In both plots, lines are drawn to guide the eye (gray solid - 0.9 TeV, gray dotted - 2.76 TeV, black dash-dotted - 7 TeV, colored solid - 13 TeV). |
png pdf |
Figure 9-a:
Average transverse momentum of identified charged hadrons (pions, kaons, protons; left panel) and ratios of particle yields (right panel) in the range $ {| y | }< $ 1 as functions of the corrected track multiplicity for $ {| \eta | } < $ 2.4, for pp collisions at $\sqrt {s} = $ 13 TeV (filled symbols) and at lower energies (open symbols) [2]. Both $< {p_{\mathrm {T}}} > $ and yield ratios are computed assuming a Tsallis-Pareto distribution in the unmeasured range. Error bars indicate the uncorrelated combined uncertainties, while boxes show the uncorrelated systematic uncertainties. For $< {p_{\mathrm {T}}} > $ the fully correlated normalization uncertainty (not shown) is 1.0%. In both plots, lines are drawn to guide the eye (gray solid - 0.9 TeV, gray dotted - 2.76 TeV, black dash-dotted - 7 TeV, colored solid - 13 TeV). |
png pdf |
Figure 9-b:
Average transverse momentum of identified charged hadrons (pions, kaons, protons; left panel) and ratios of particle yields (right panel) in the range $ {| y | }< $ 1 as functions of the corrected track multiplicity for $ {| \eta | } < $ 2.4, for pp collisions at $\sqrt {s} = $ 13 TeV (filled symbols) and at lower energies (open symbols) [2]. Both $< {p_{\mathrm {T}}} > $ and yield ratios are computed assuming a Tsallis-Pareto distribution in the unmeasured range. Error bars indicate the uncorrelated combined uncertainties, while boxes show the uncorrelated systematic uncertainties. For $< {p_{\mathrm {T}}} > $ the fully correlated normalization uncertainty (not shown) is 1.0%. In both plots, lines are drawn to guide the eye (gray solid - 0.9 TeV, gray dotted - 2.76 TeV, black dash-dotted - 7 TeV, colored solid - 13 TeV). |

png pdf |
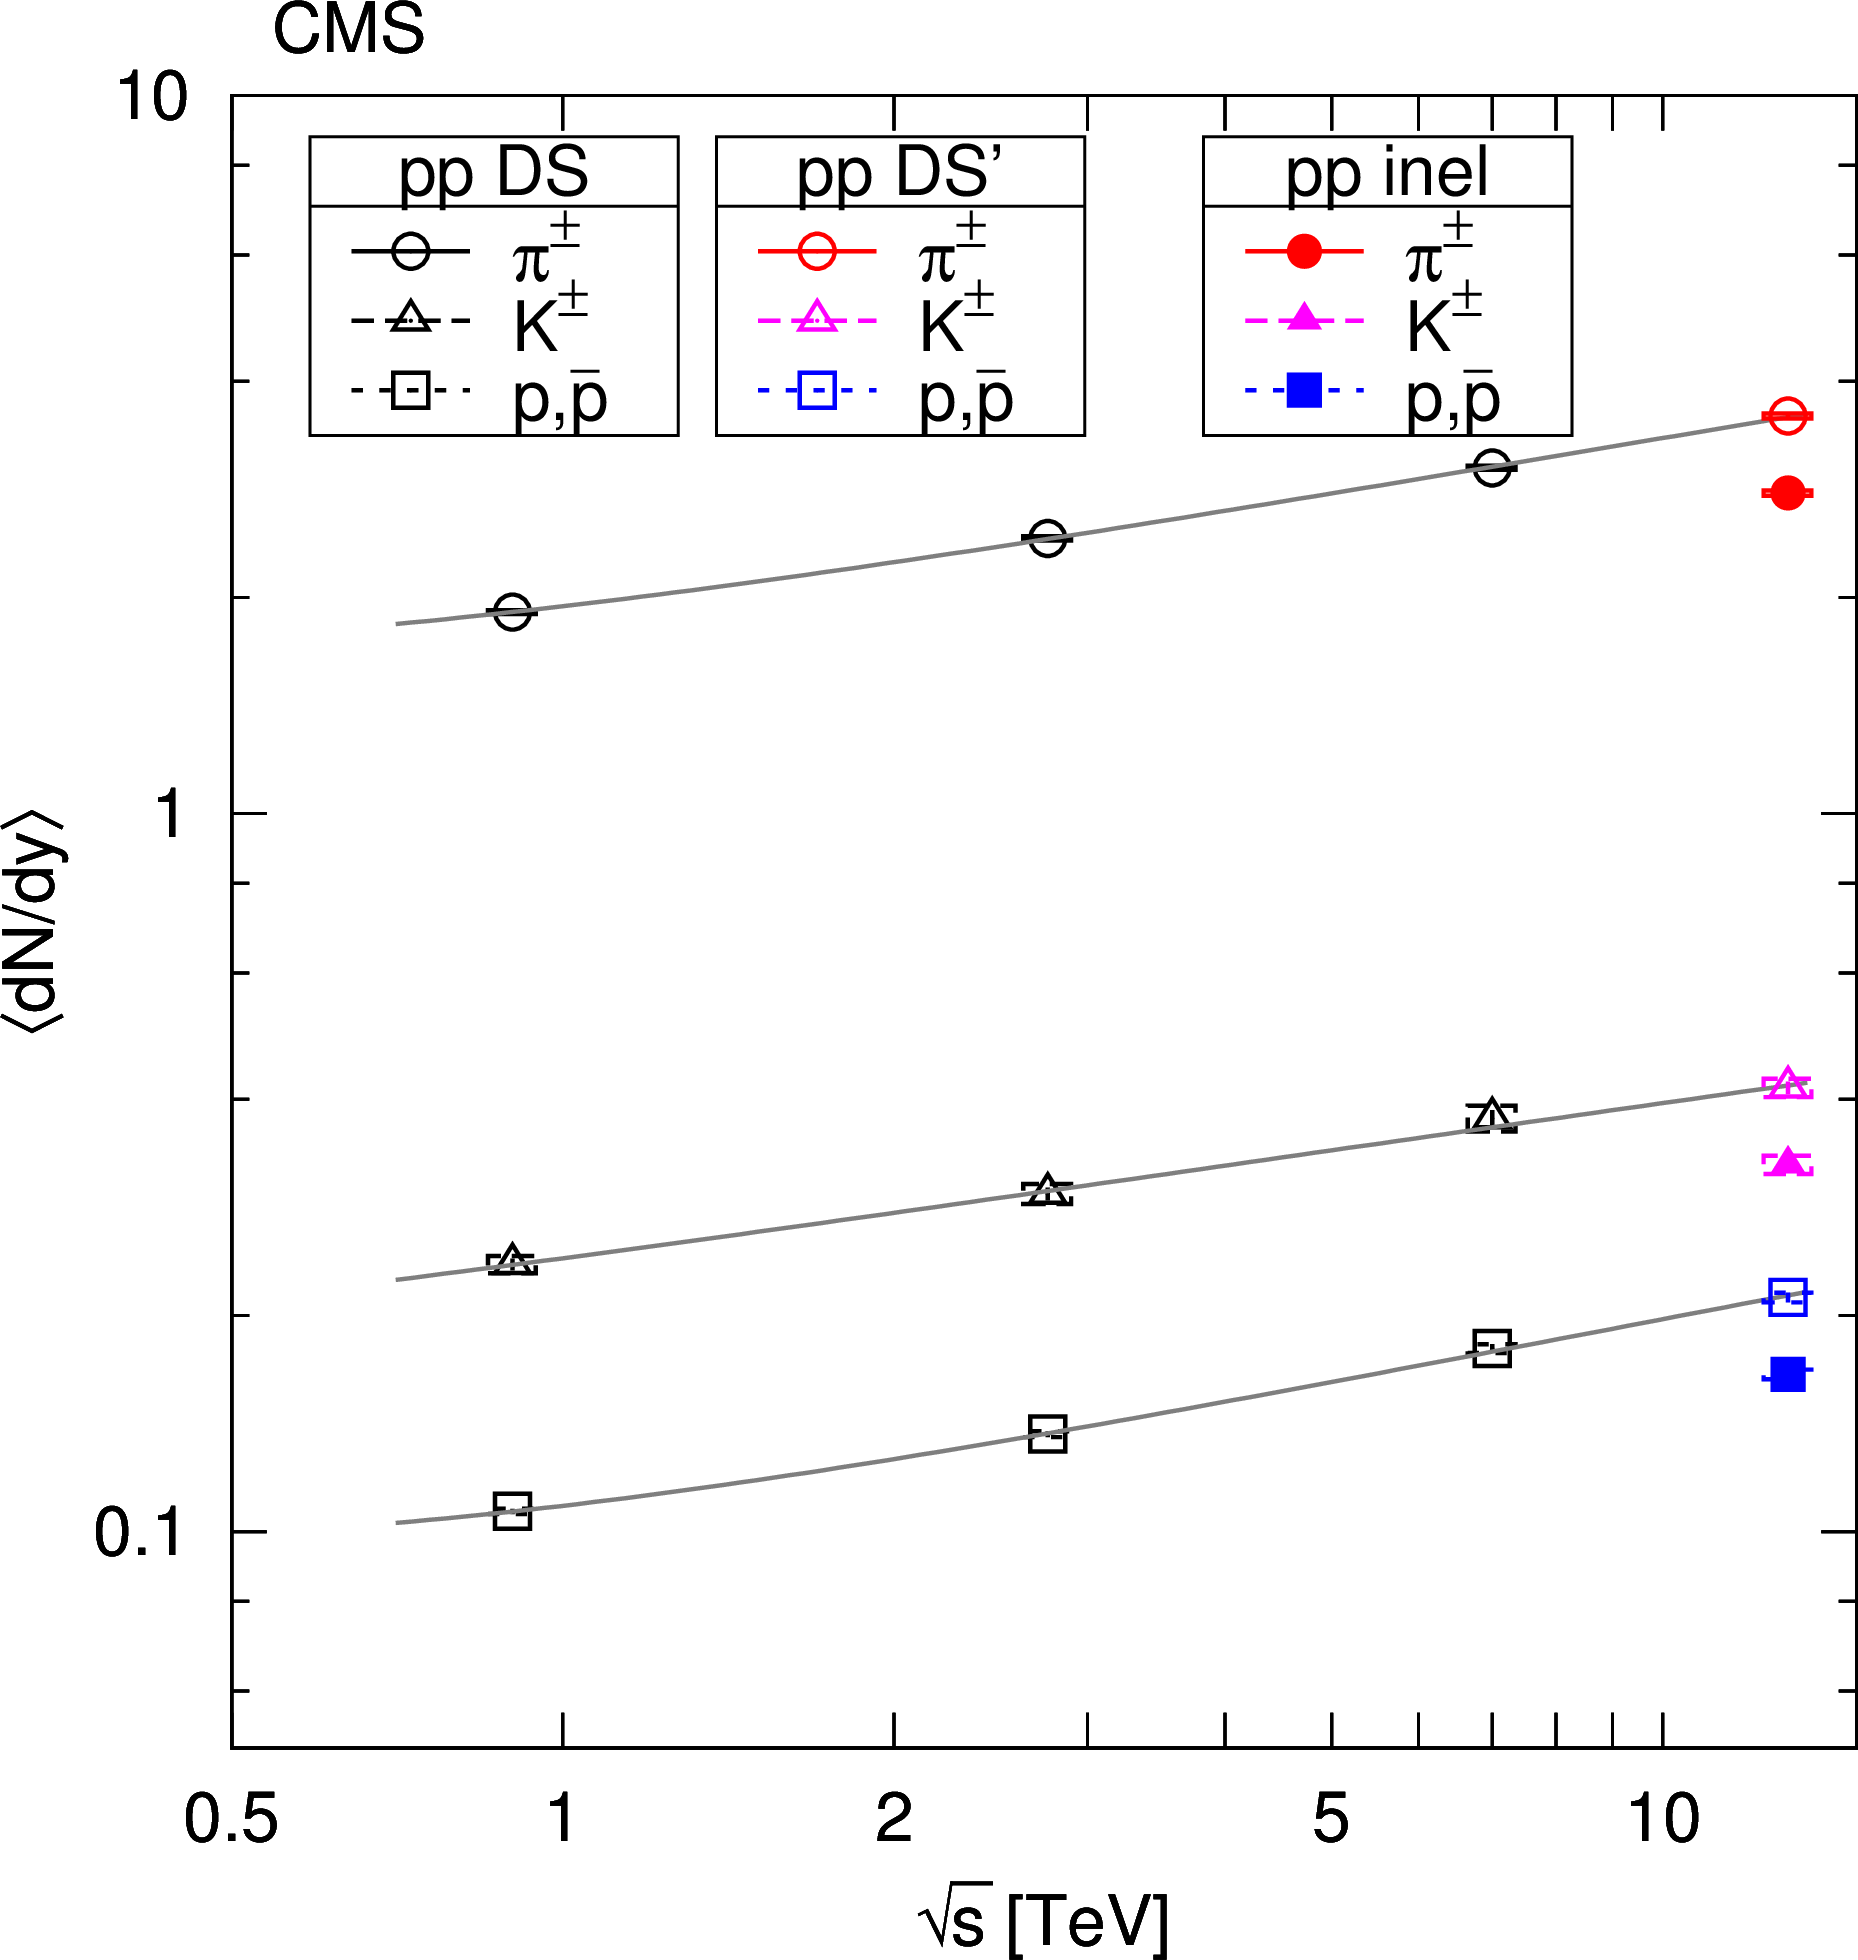
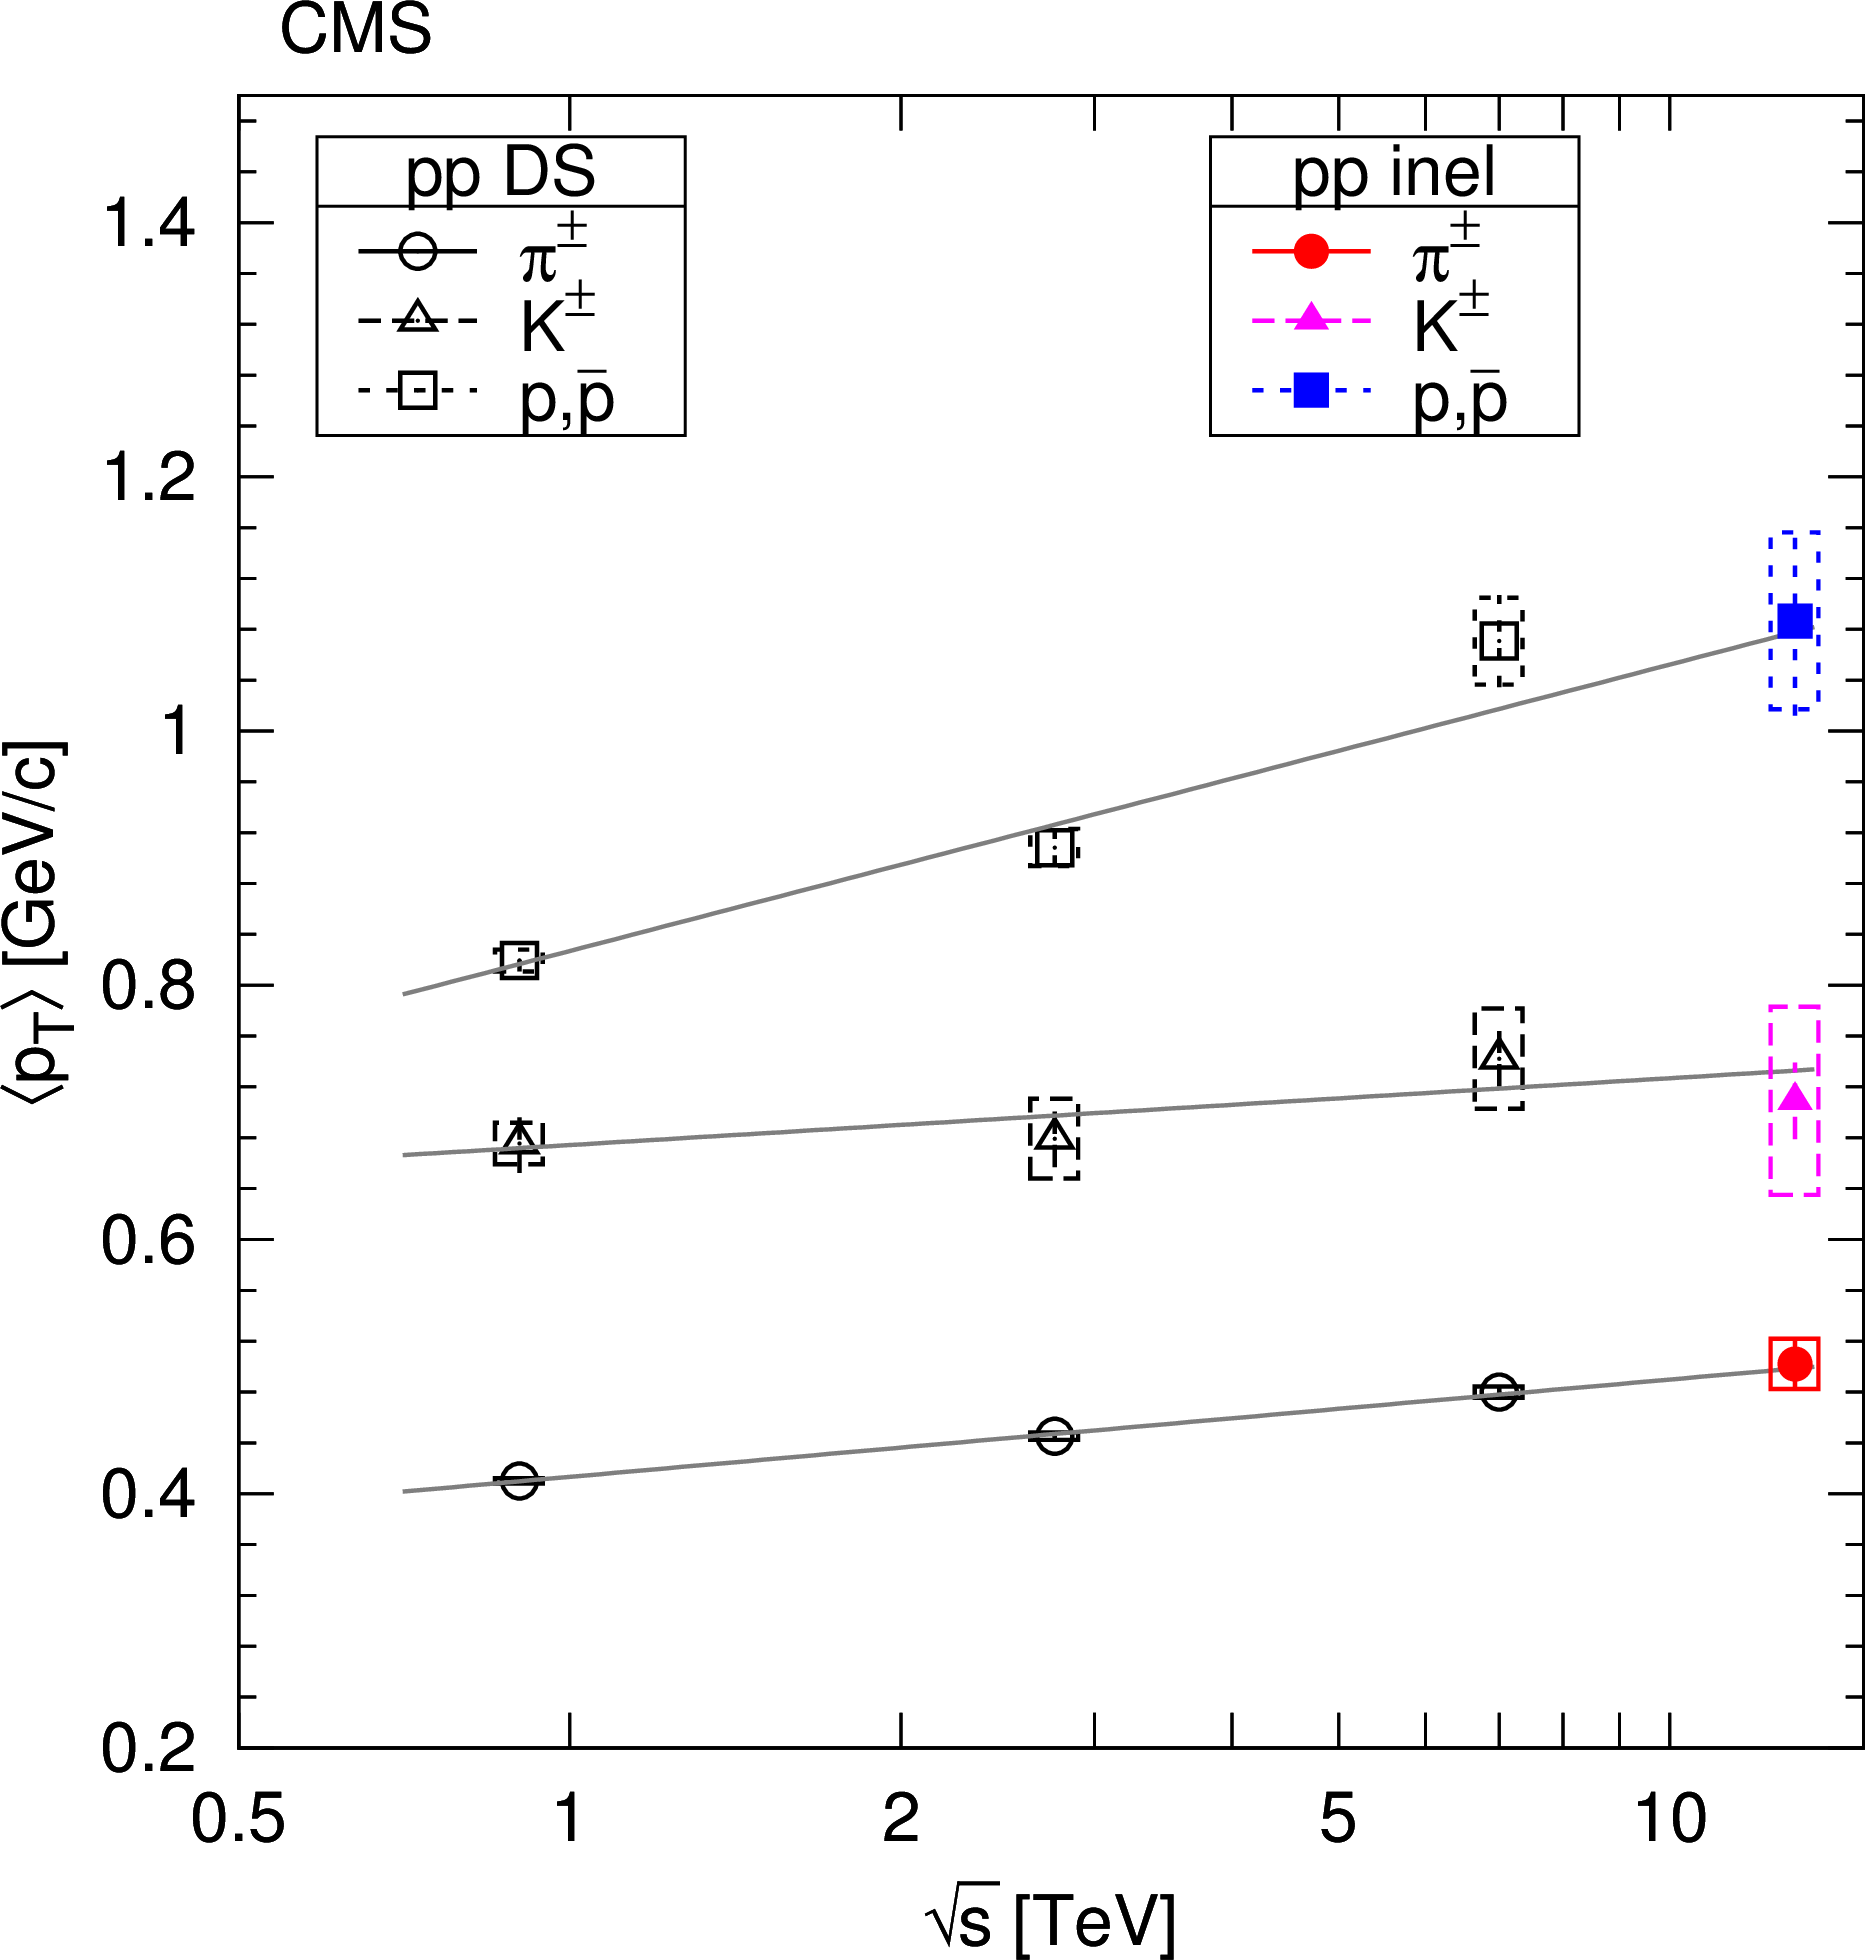
Figure 10:
Average rapidity densities $< {\mathrm {d}}N/ {\mathrm {d}}y> $ (left ) and average transverse momenta $< {p_{\mathrm {T}}} > $ (right ) for $ {| y | } < $ 1 as functions of center-of-mass energy for pp collisions (with data at 0.9, 2.76, and 7 TeV [2]), for charge-averaged pions, kaons, and protons. In the left plot the pp DS' results at 13 TeV have been extrapolated from the inelastic values using simulation. Error bars indicate the uncorrelated combined uncertainties, while boxes show the uncorrelated systematic uncertainties. The curves show parabolic ($< {\mathrm {d}}N/ {\mathrm {d}}y > $) or linear (for $ < {p_{\mathrm {T}}} > $) fits in $\ln{s}$. |
png pdf |
Figure 10-a:
Average rapidity densities $< {\mathrm {d}}N/ {\mathrm {d}}y> $ (left ) and average transverse momenta $< {p_{\mathrm {T}}} > $ (right ) for $ {| y | } < $ 1 as functions of center-of-mass energy for pp collisions (with data at 0.9, 2.76, and 7 TeV [2]), for charge-averaged pions, kaons, and protons. In the left plot the pp DS' results at 13 TeV have been extrapolated from the inelastic values using simulation. Error bars indicate the uncorrelated combined uncertainties, while boxes show the uncorrelated systematic uncertainties. The curves show parabolic ($< {\mathrm {d}}N/ {\mathrm {d}}y > $) or linear (for $ < {p_{\mathrm {T}}} > $) fits in $\ln{s}$. |
png pdf |
Figure 10-b:
Average rapidity densities $< {\mathrm {d}}N/ {\mathrm {d}}y> $ (left ) and average transverse momenta $< {p_{\mathrm {T}}} > $ (right ) for $ {| y | } < $ 1 as functions of center-of-mass energy for pp collisions (with data at 0.9, 2.76, and 7 TeV [2]), for charge-averaged pions, kaons, and protons. In the left plot the pp DS' results at 13 TeV have been extrapolated from the inelastic values using simulation. Error bars indicate the uncorrelated combined uncertainties, while boxes show the uncorrelated systematic uncertainties. The curves show parabolic ($< {\mathrm {d}}N/ {\mathrm {d}}y > $) or linear (for $ < {p_{\mathrm {T}}} > $) fits in $\ln{s}$. |
| Tables | |
png pdf |
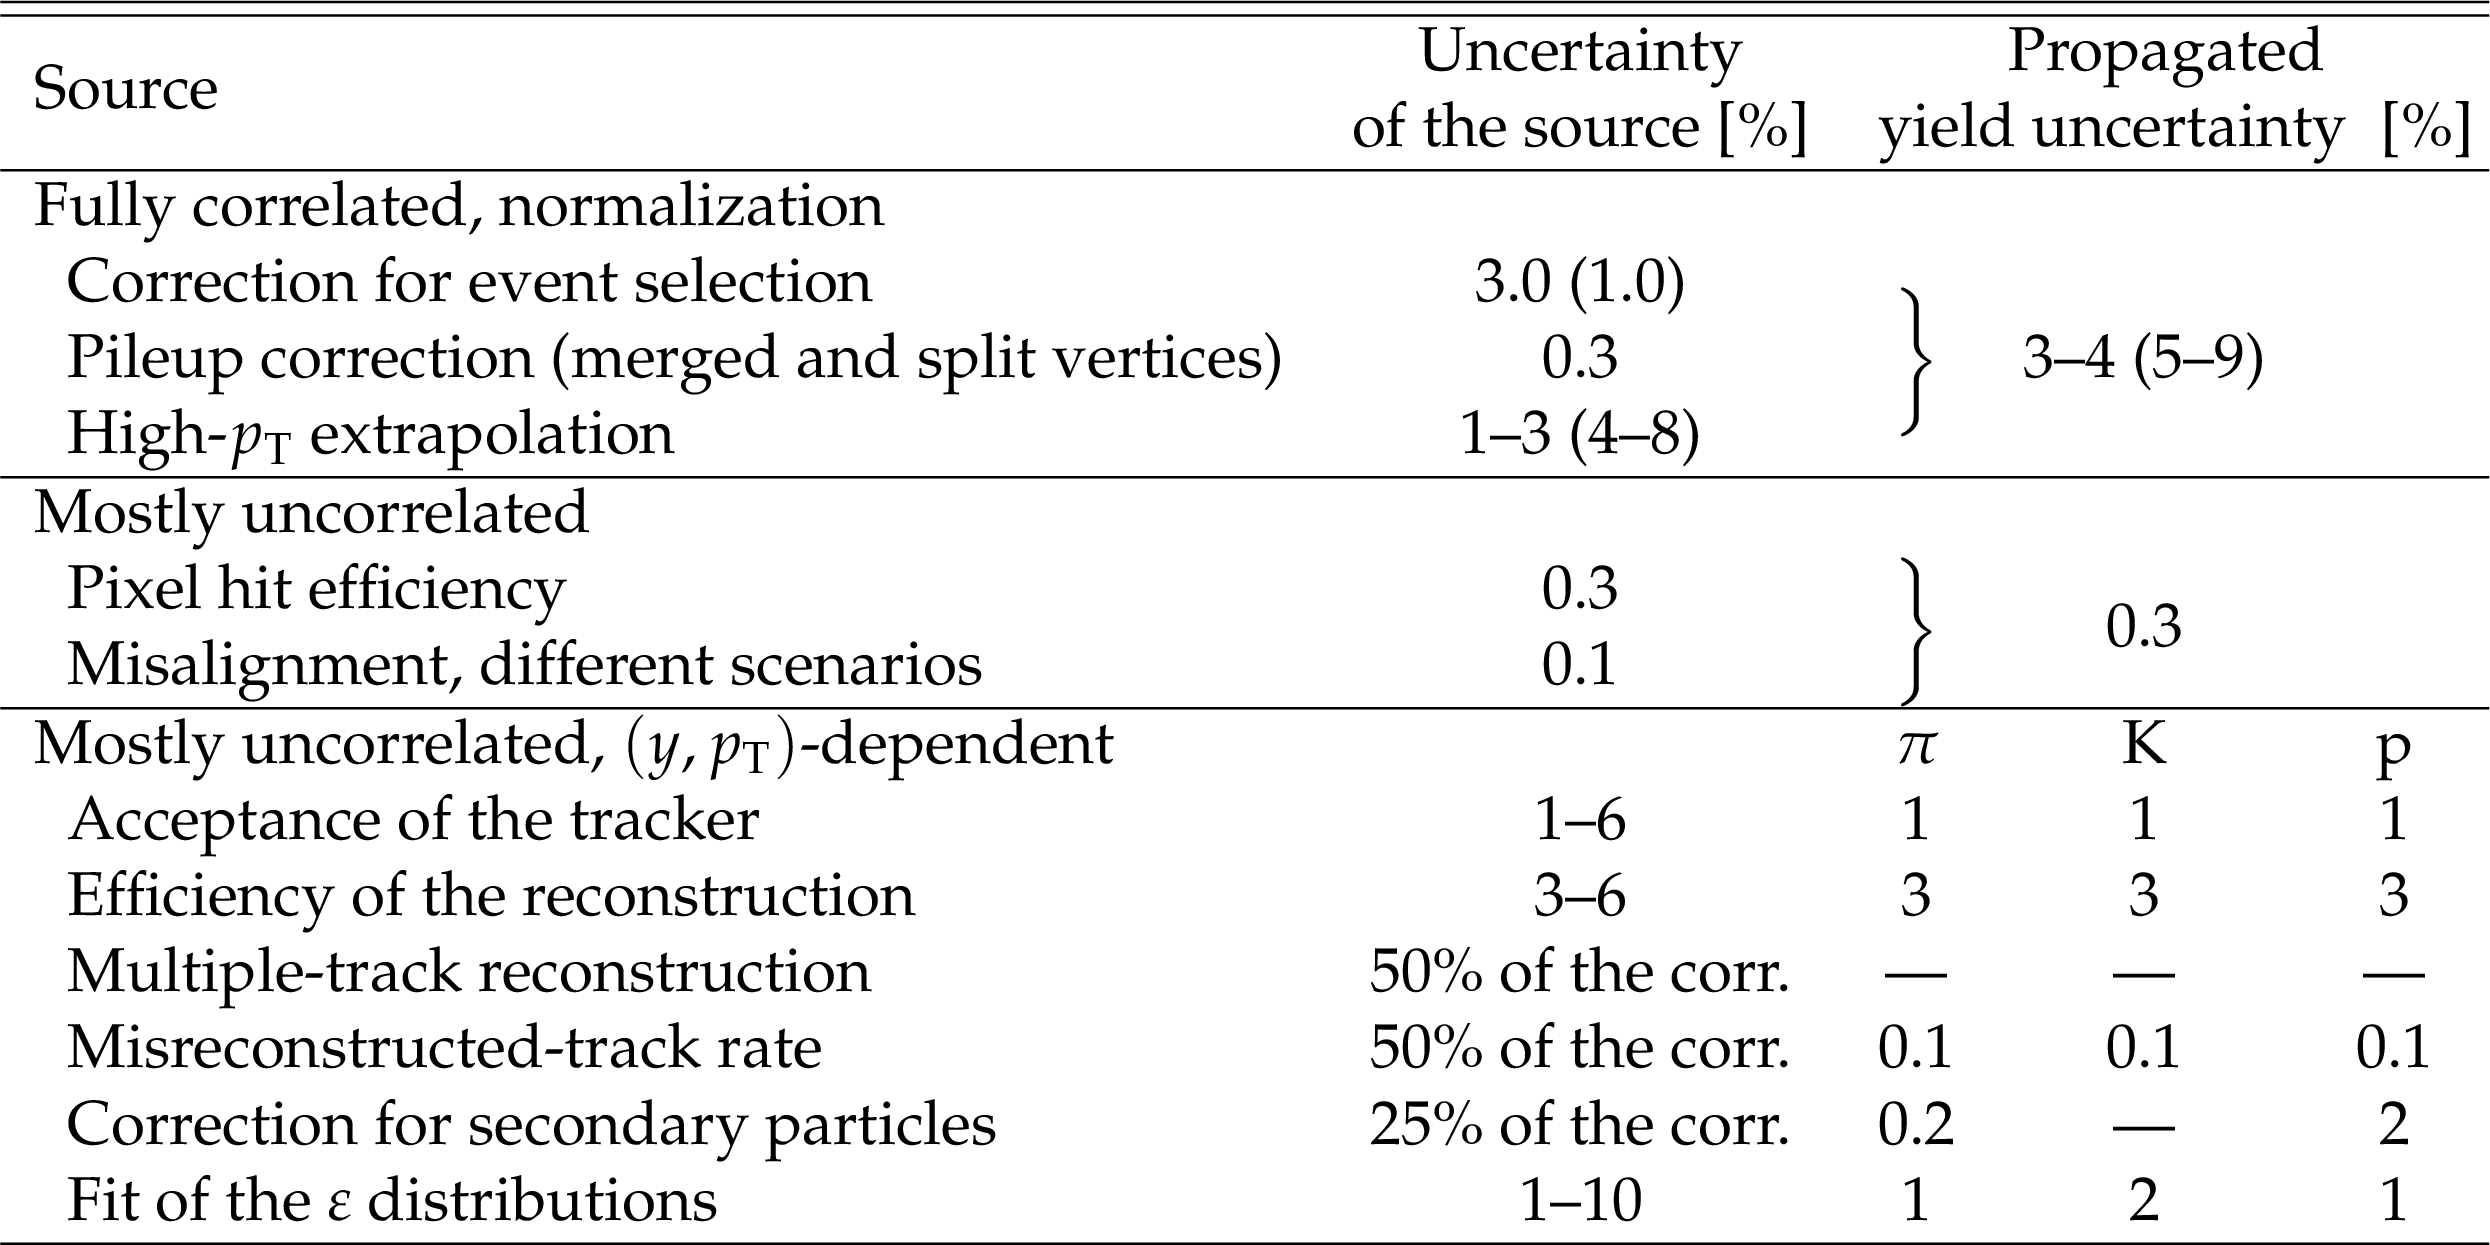
Table 1:
Summary of the systematic uncertainties affecting the $ {p_{\mathrm {T}}} $ spectra. Values in parentheses indicate uncertainties in the $< {p_{\mathrm {T}}} > $ measurement. Representative, particle-specific uncertainties ($\pi$, K, p) are given for $ {p_{\mathrm {T}}} = $ 0.6 GeV/$c$ in the third group of systematic uncertainties. |
png pdf |
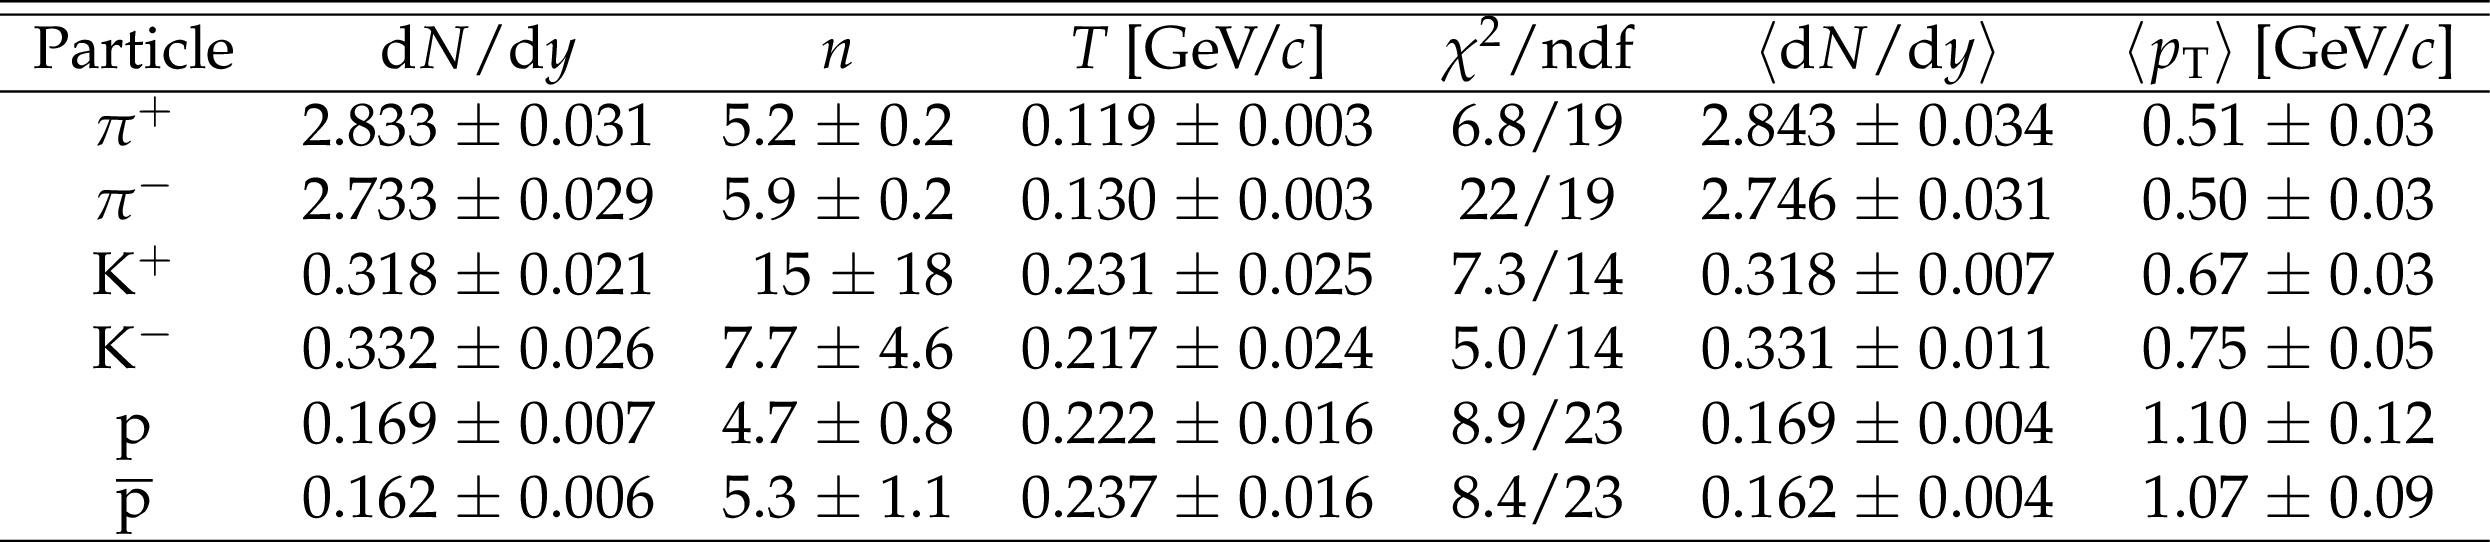
Table 2:
Fit results for $ {\mathrm {d}}N/ {\mathrm {d}}y$, $n$, and $T$ (obtained via Eqs. (3) and (5)), associated goodness-of-fit values, and extracted $< {\mathrm {d}}N/ {\mathrm {d}}y > $ and $< {p_{\mathrm {T}}} > $ averages, for charged pion, kaon, and proton spectra measured in the range $ {| y | } < $ 1 in inelastic pp collisions at 13 TeV. Combined statistical and systematic uncertainties are given. |

png pdf |
Table 3:
Relationship between the number of reconstructed tracks ($N_\text {rec}$) and the average number of corrected tracks ($< N_\text {tracks} > $) in the region $ {| \eta | } < $ 2.4 in the 18 multiplicity classes considered. |
| Summary |
|
Transverse momentum spectra have been measured for different charged hadron species produced in inelastic pp collisions at $ \sqrt{s} = $ 13 TeV. Charged pions, kaons, and protons are identified from the energy deposited in the silicon tracker and the reconstructed particle trajectory. The yields of such hadrons at rapidities $| y | < $ 1 are studied as a function of the event charged particle multiplicity measured in the pseudorapidity range $| \eta | < $ 2.4. The transverse momentum ($ p_{\mathrm{T}} $) spectra are well described by fits using the Tsallis-Pareto parametrization. The ratios of the yields of oppositely-charged particles are close to unity, as expected in the central rapidity region for collisions at this center-of-mass energy. The average $ p_{\mathrm{T}} $ is found to increase with particle mass and event multiplicity, and shows features a slow (logarithmic-like or power-law) dependence on $\sqrt{s}$. As observed in lower-energy data, the $< p_{\mathrm{T}} > $ and the ratios of particle yields are strongly correlated with event particle multiplicity. The PYTHIA8 CUETP8M1 event generator reproduces most features of the measured distributions, which represents a success of the preceding tuning of this model, and epos LHC\ also gives a satisfactory description of several aspects of the data. The present results can be used to further constrain models of hadron production and to provide a better understanding of multiparton interactions, parton hadronization, and final-state effects in high-energy hadron collisions. |
| Additional Figures | |
png pdf |
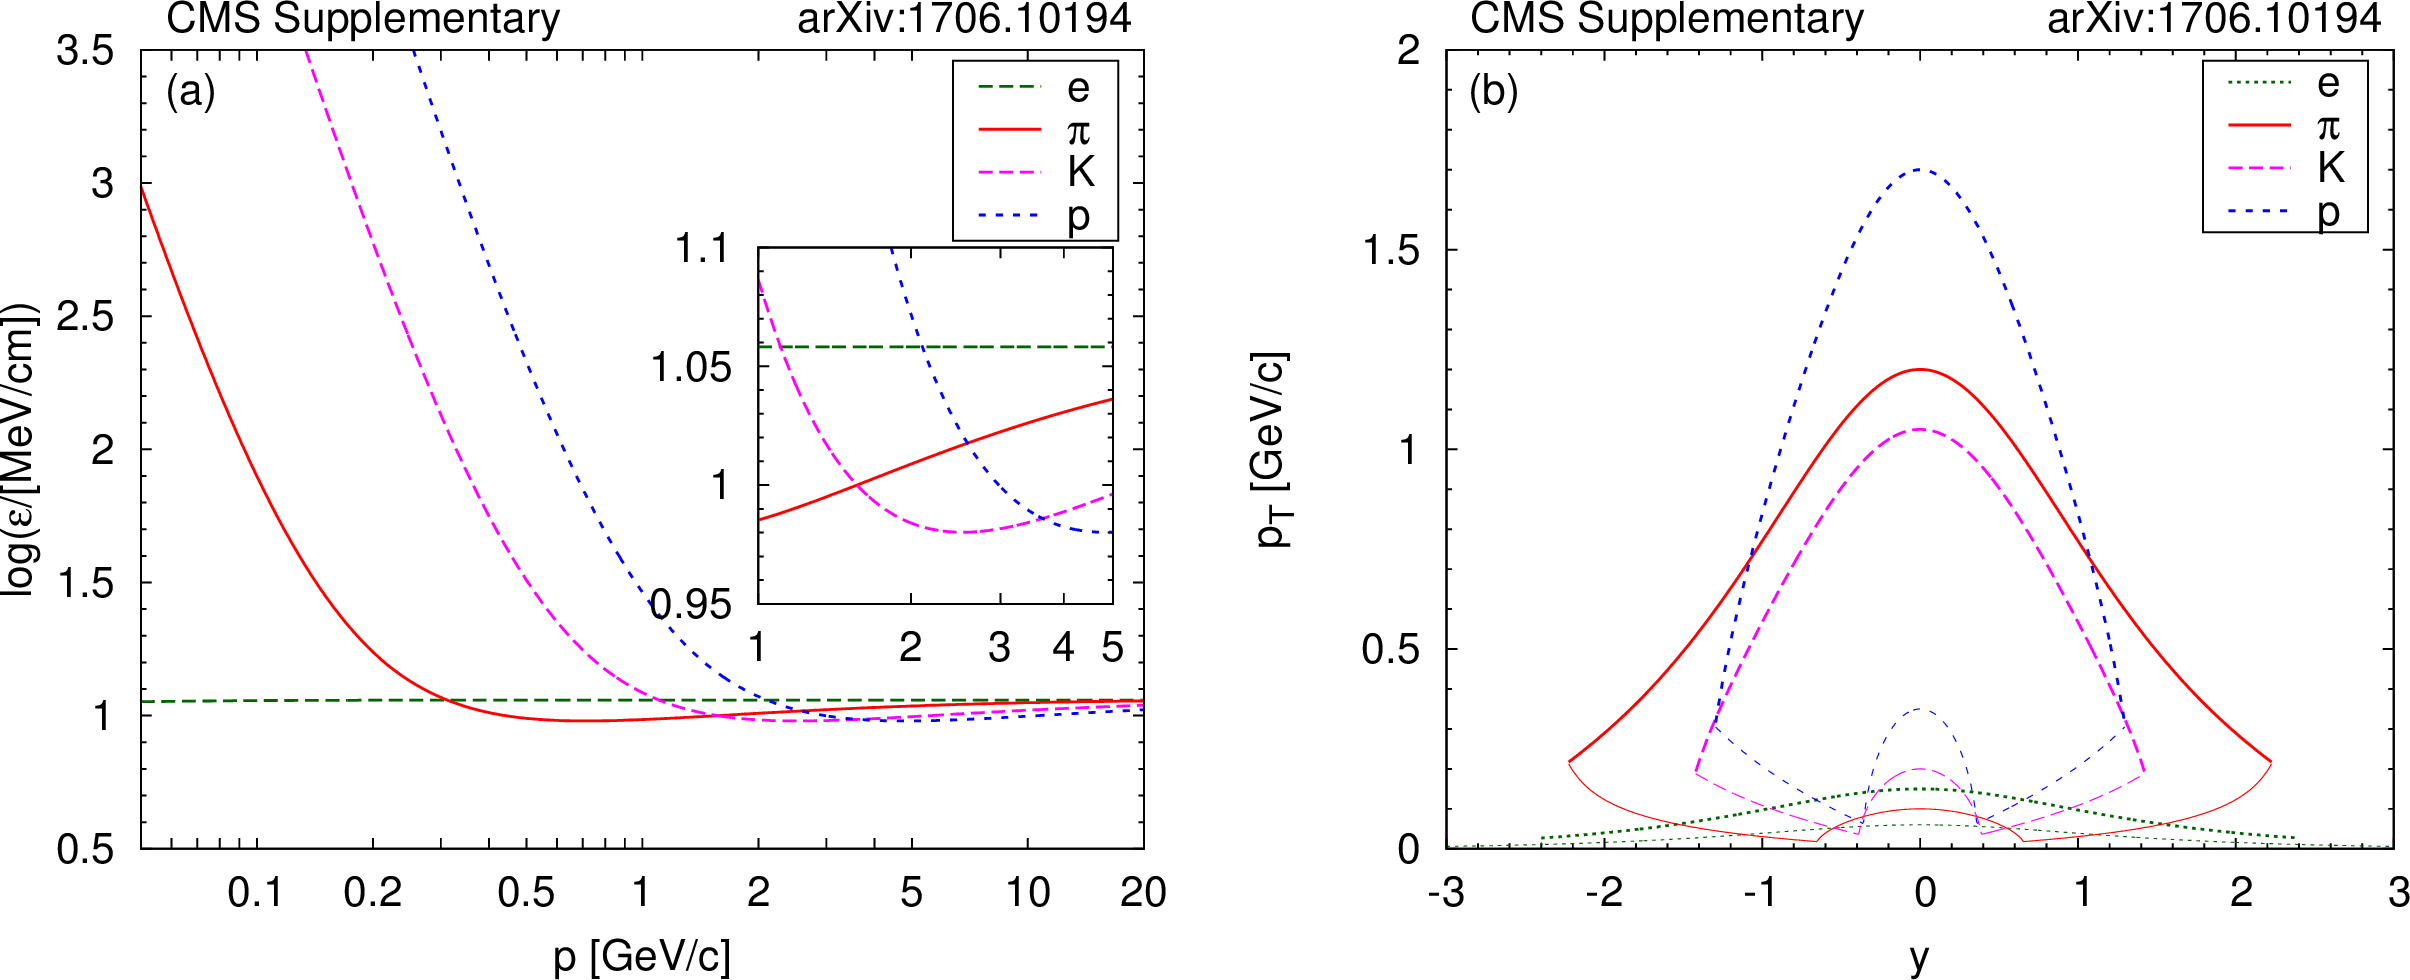
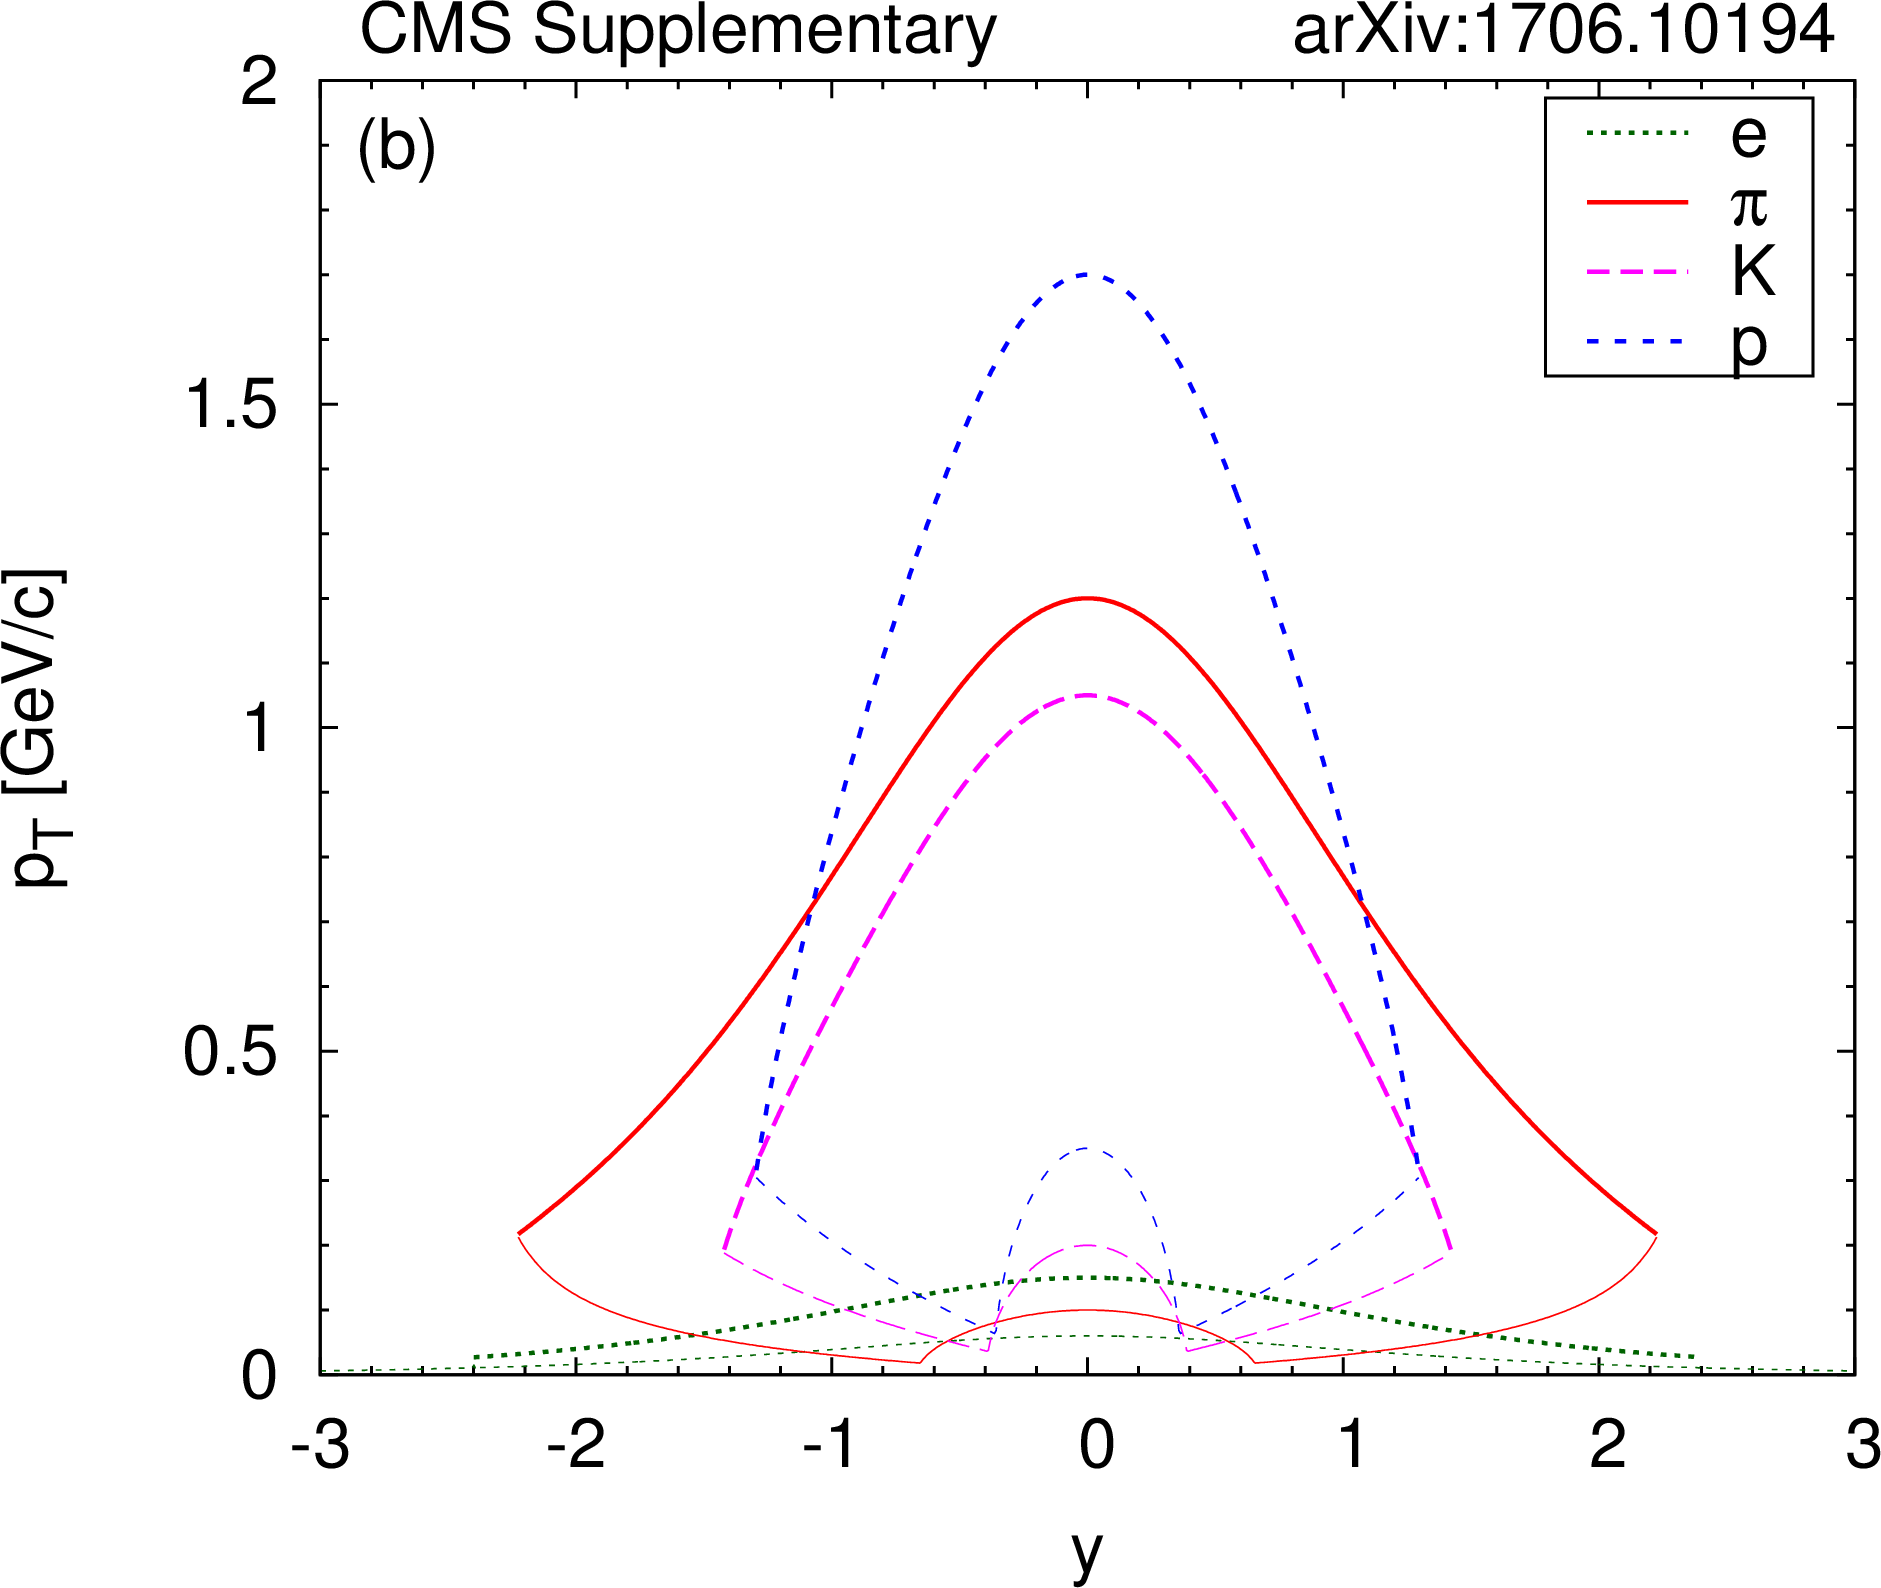
Additional Figure 1:
a) Values of the most probable energy deposit $\varepsilon $ at the reference path length of 450 $\mu$m in silicon for electrons, pions, kaons, and protons [1]. The insert shows the region 1$ < p < 5 $ GeV/$c$. b) The accessible $(y, {p_{\mathrm {T}}} )$ range for electrons, pions, kaons, and protons. It is limited from below according to the $\eta $ acceptance of the tracker, and from above because of limitations in particle identification at higher momentum. |
png pdf |
Additional Figure 1-a:
Values of the most probable energy deposit $\varepsilon $ at the reference path length of 450 $\mu$m in silicon for electrons, pions, kaons, and protons [1]. The insert shows the region 1$ < p < 5 $ GeV/$c$. |
png pdf |
Additional Figure 1-b:
The accessible $(y, {p_{\mathrm {T}}} )$ range for electrons, pions, kaons, and protons. It is limited from below according to the $\eta $ acceptance of the tracker, and from above because of limitations in particle identification at higher momentum. |
png pdf |
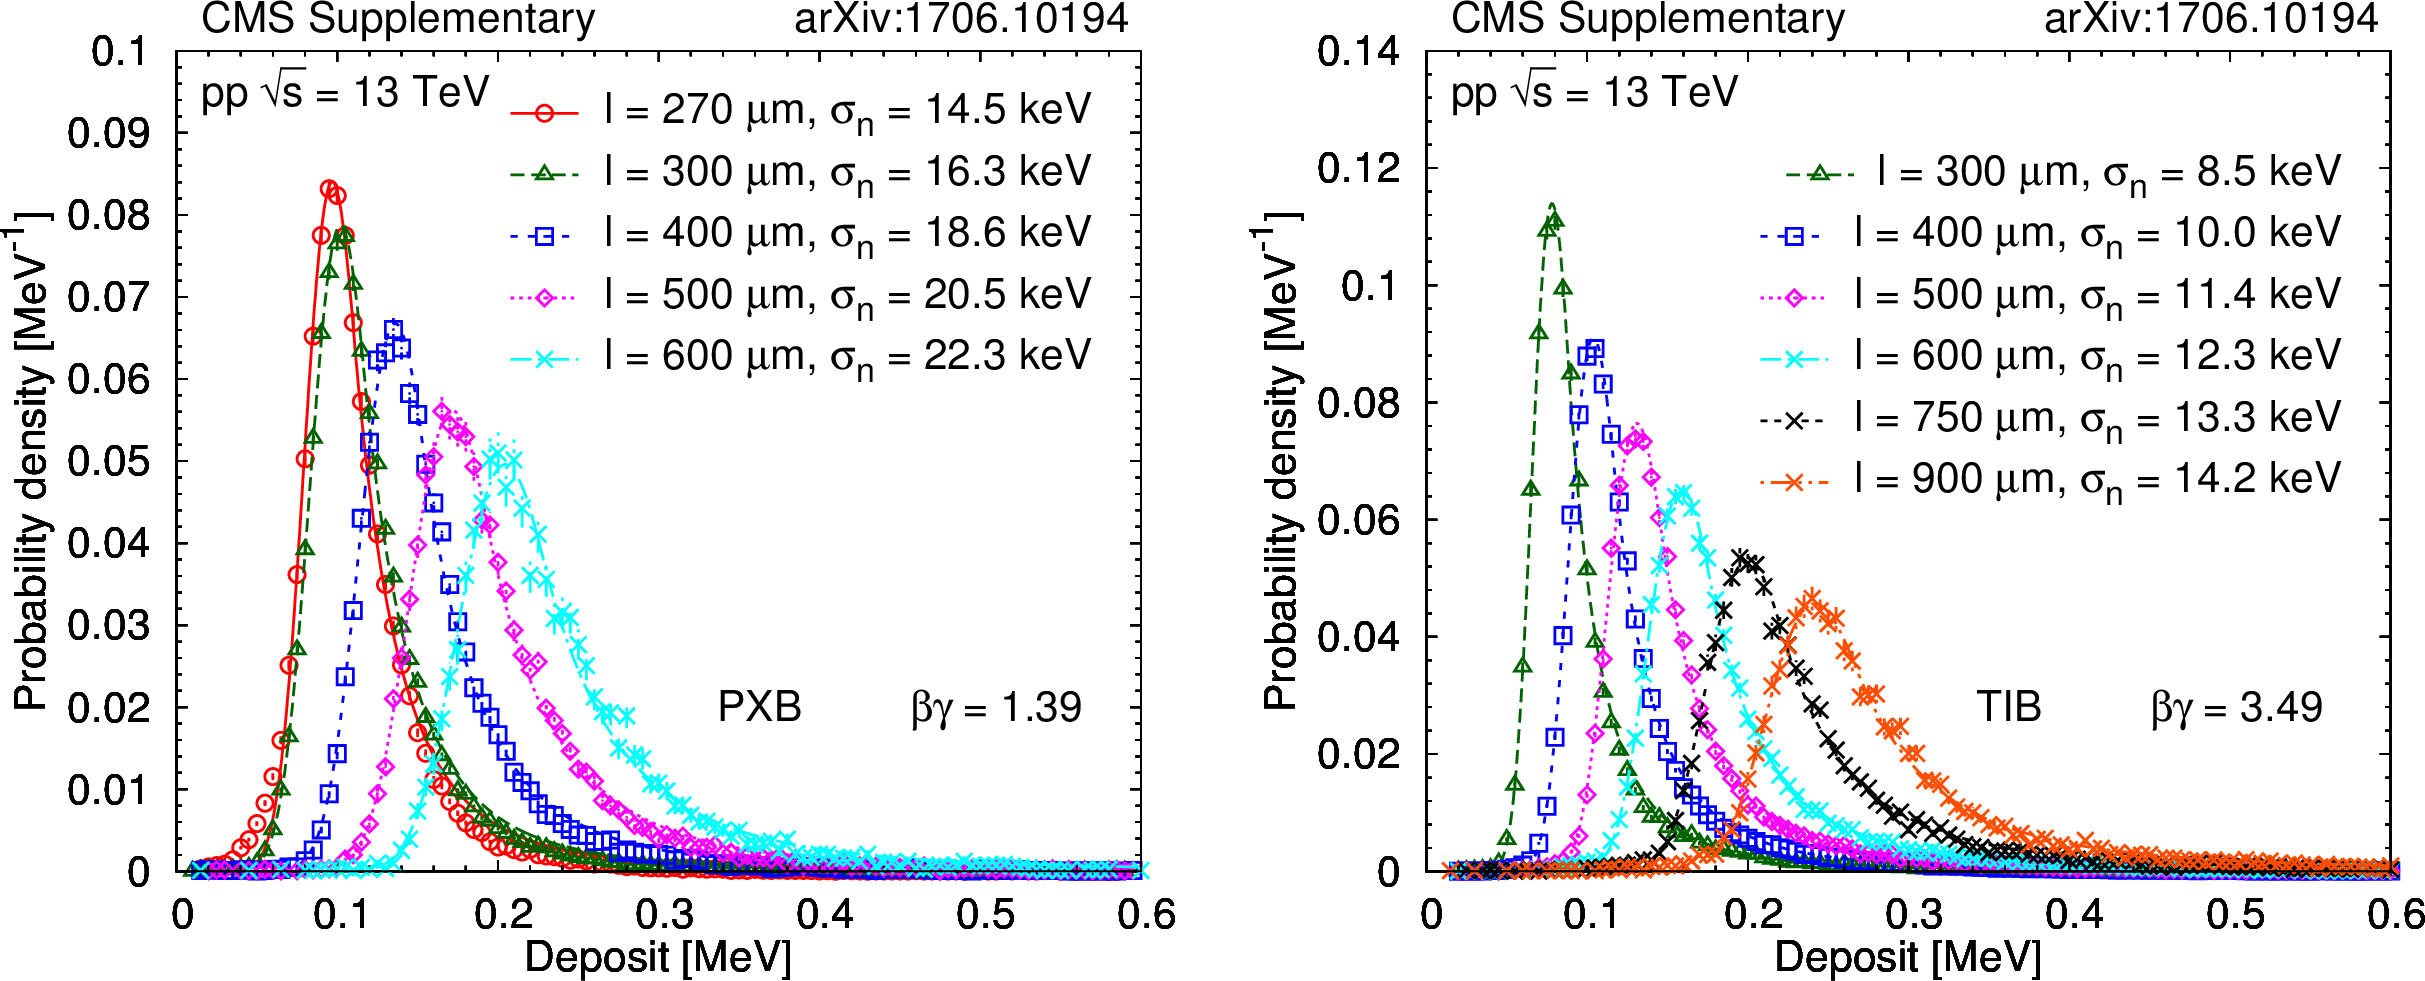
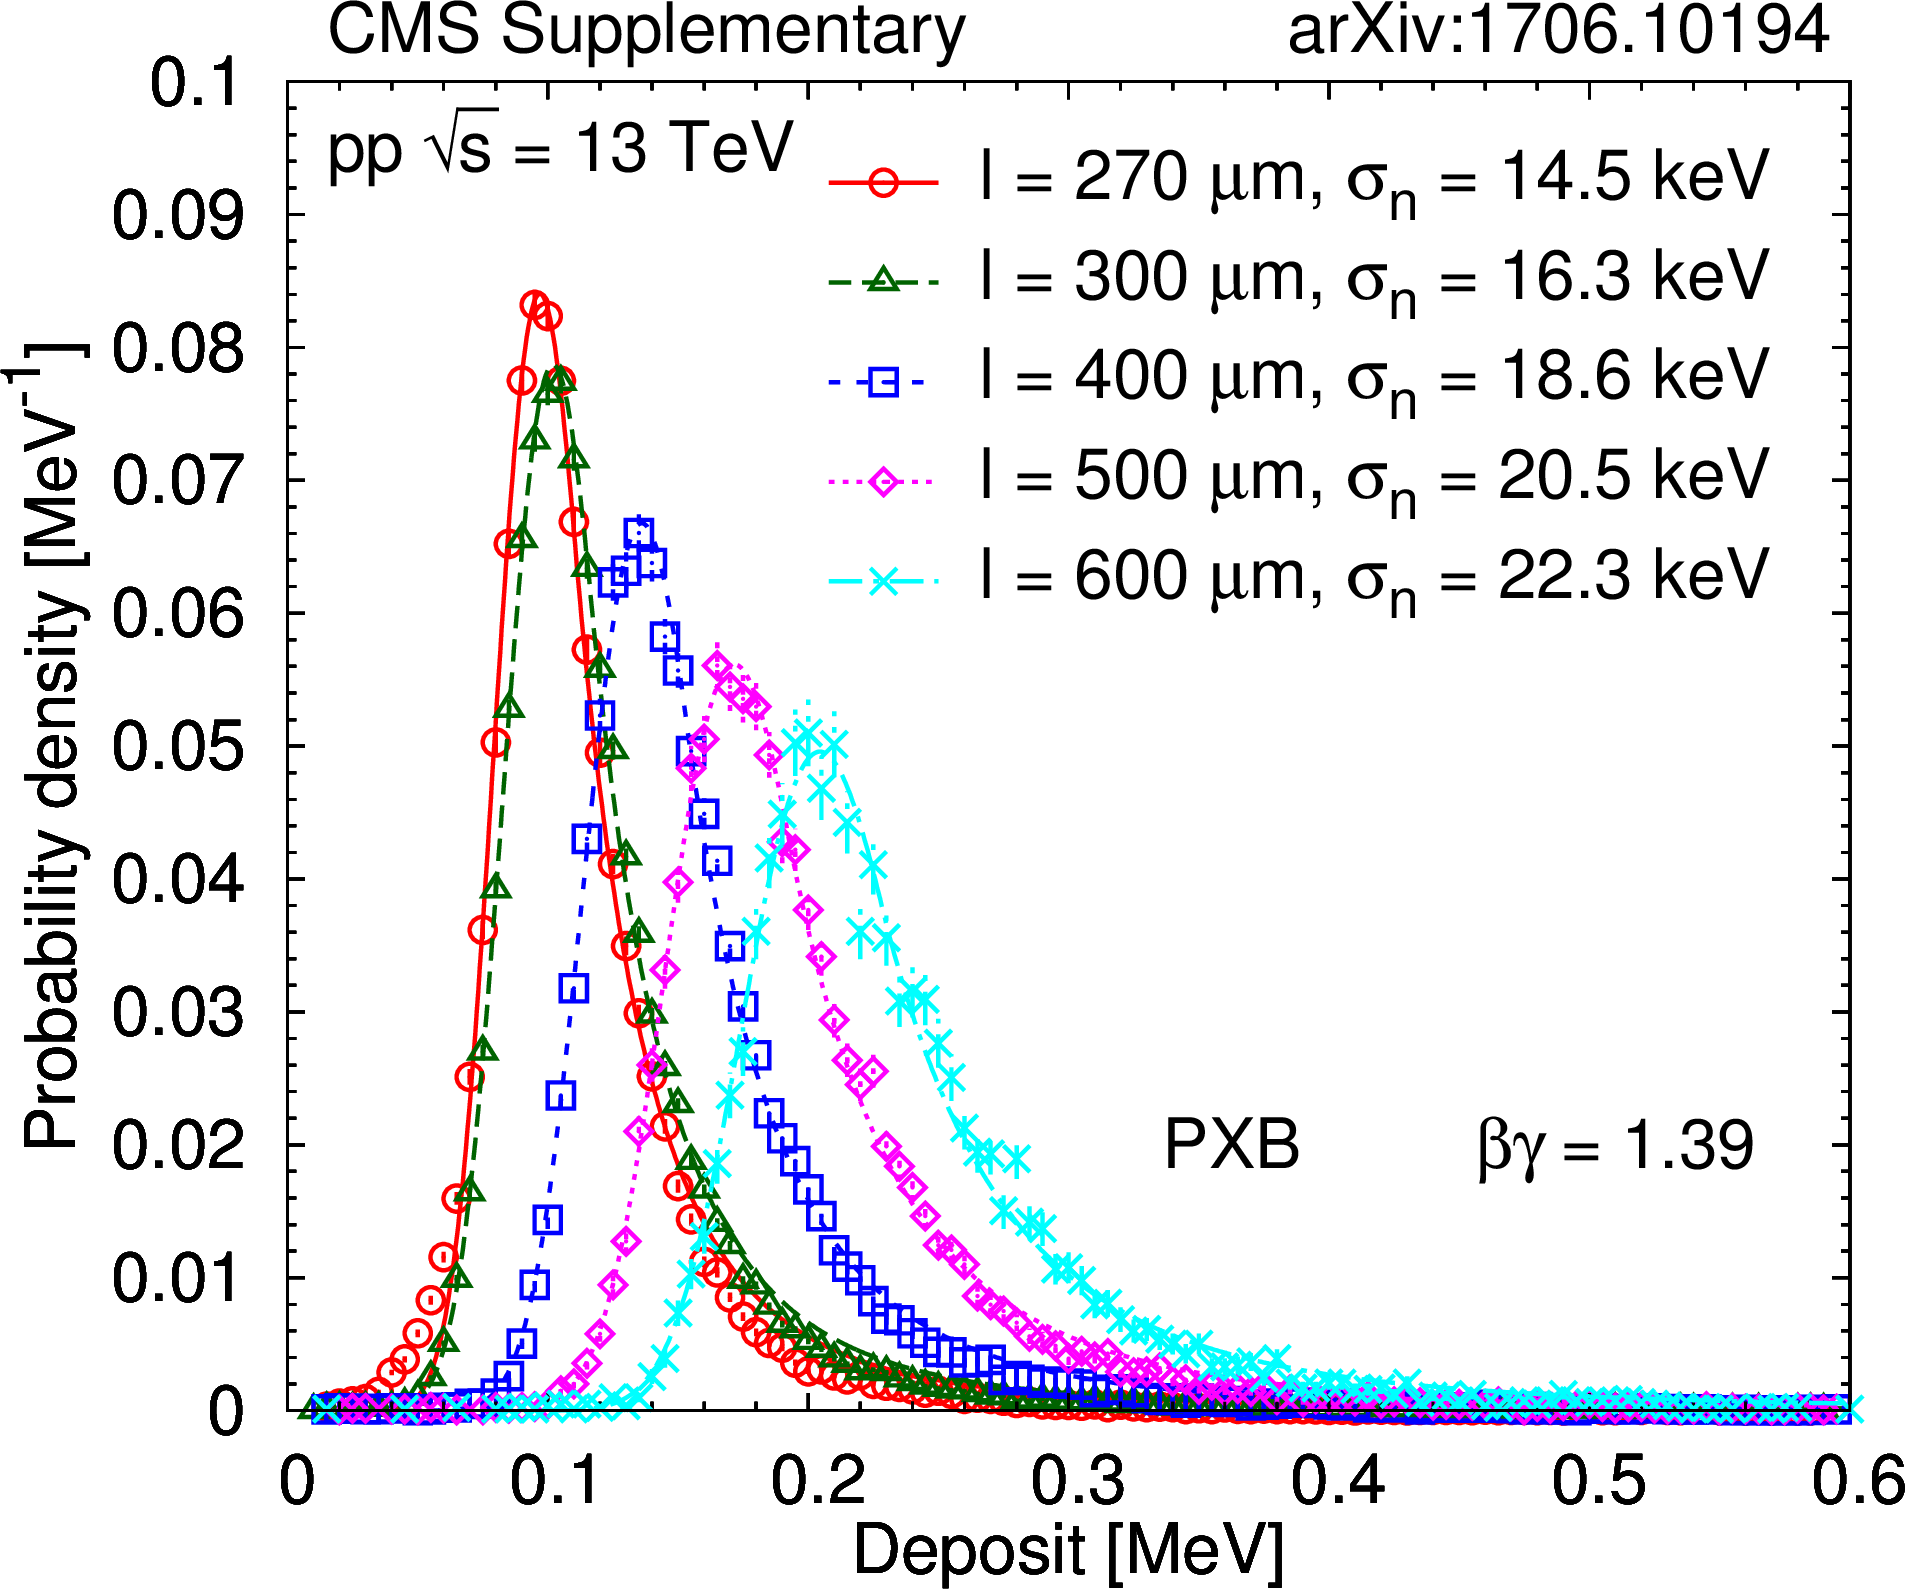
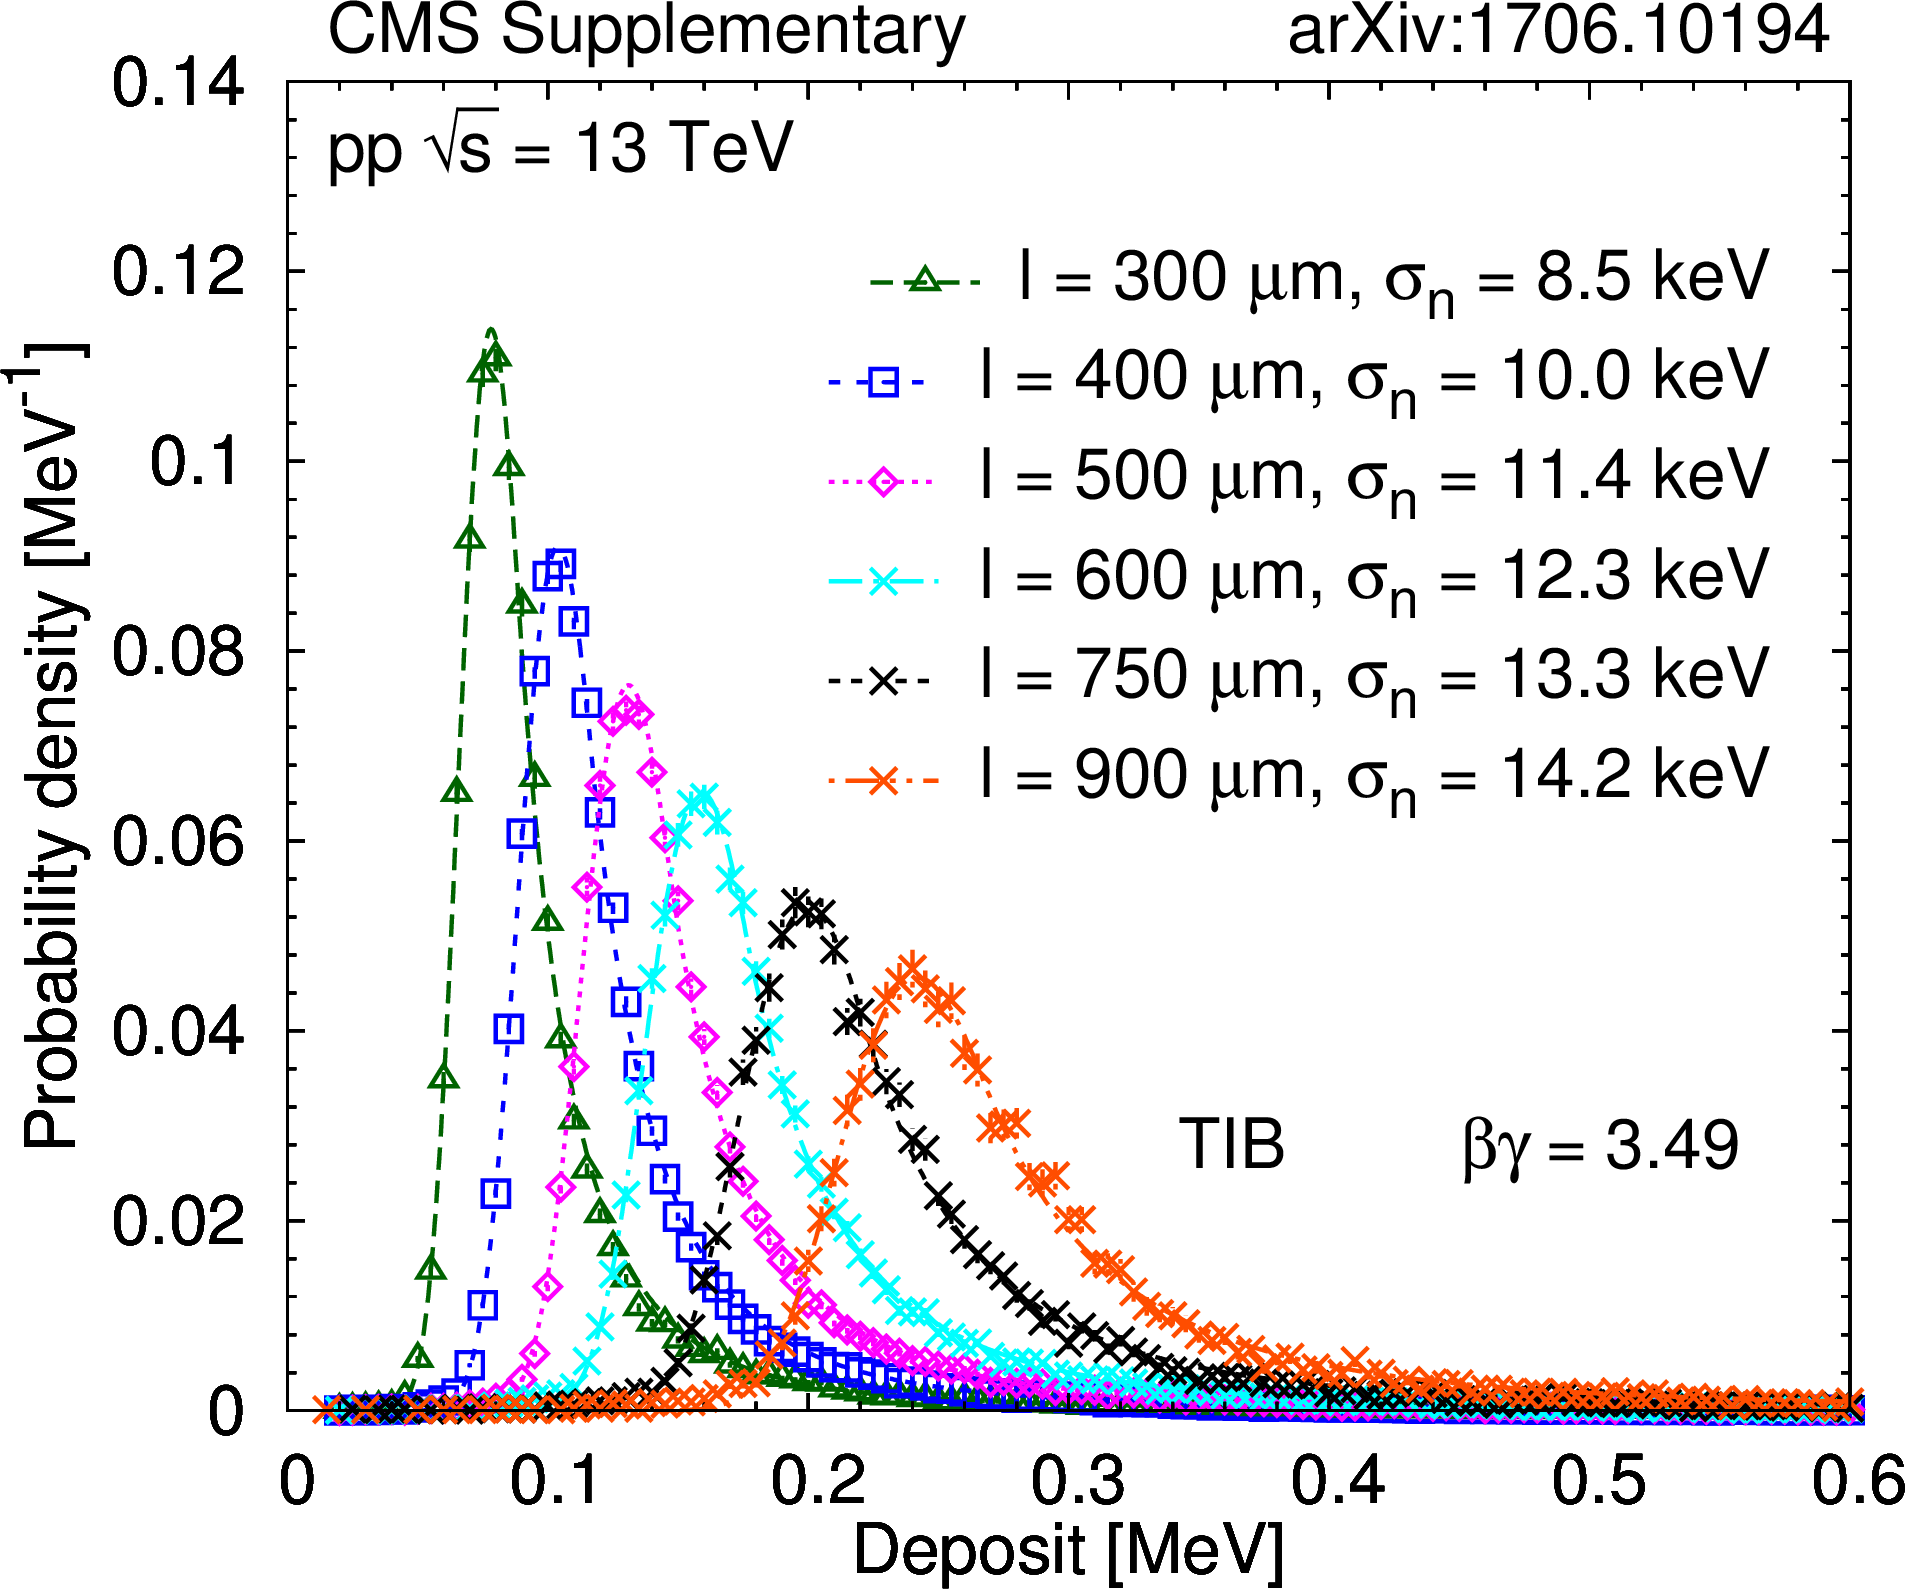
Additional Figure 2:
Validation of energy deposit model for PXB (left) and TIB (right) subdetectors. Measured energy deposit distributions identified hadrons at $\beta \gamma = $ 0.70, 1.39, 2.08 and 3.49 for positively charged particles are shown. Values are given at path lengths of $l =$ 270, 300, 400, 500, 600, 750, and 900 $\mu $m silicon, shown together with model predictions. The average cluster noise $\sigma _n$ is also given. |
png pdf |
Additional Figure 2-a:
Validation of energy deposit model for the PXB subdetector. Measured energy deposit distributions identified hadrons at $\beta \gamma = $ 0.70, 1.39, 2.08 and 3.49 for positively charged particles are shown. Values are given at path lengths of $l =$ 270, 300, 400, 500, 600, 750, and 900 $\mu $m silicon, shown together with model predictions. The average cluster noise $\sigma _n$ is also given. |
png pdf |
Additional Figure 2-b:
Validation of energy deposit model for the TIB subdetector. Measured energy deposit distributions identified hadrons at $\beta \gamma = $ 0.70, 1.39, 2.08 and 3.49 for positively charged particles are shown. Values are given at path lengths of $l =$ 270, 300, 400, 500, 600, 750, and 900 $\mu $m silicon, shown together with model predictions. The average cluster noise $\sigma _n$ is also given. |
png pdf |
Additional Figure 3:
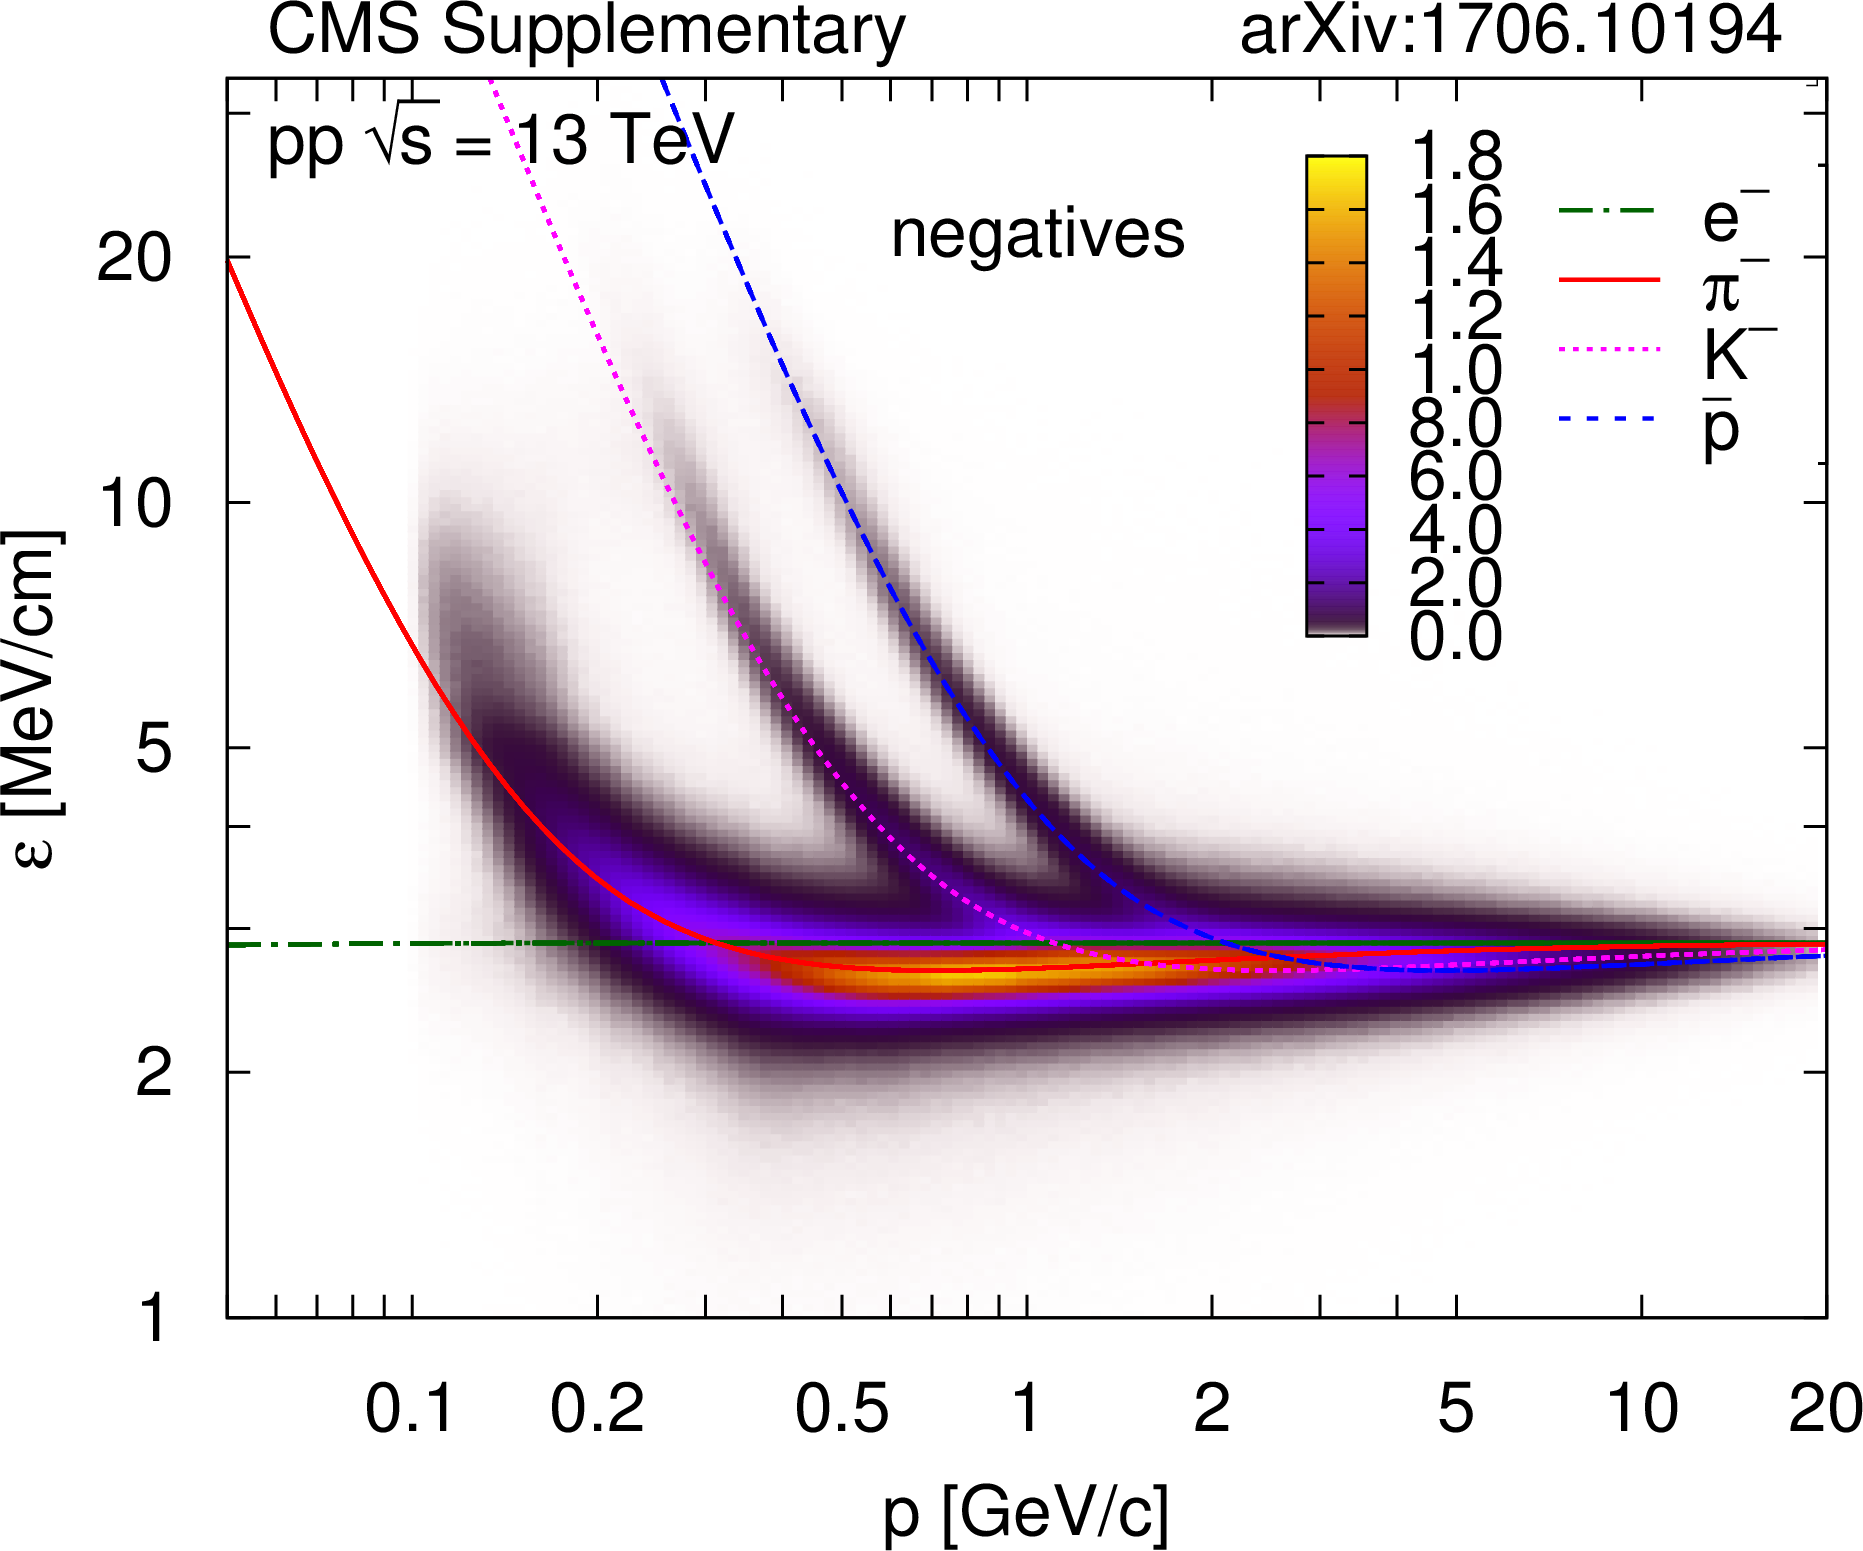
Distribution of $\varepsilon $ values as a function of total momentum $p$ for negatively charged particles. Note that the color scale is linear. The curves show the most probable values for electrons, pions, kaons and protons. |
png pdf |
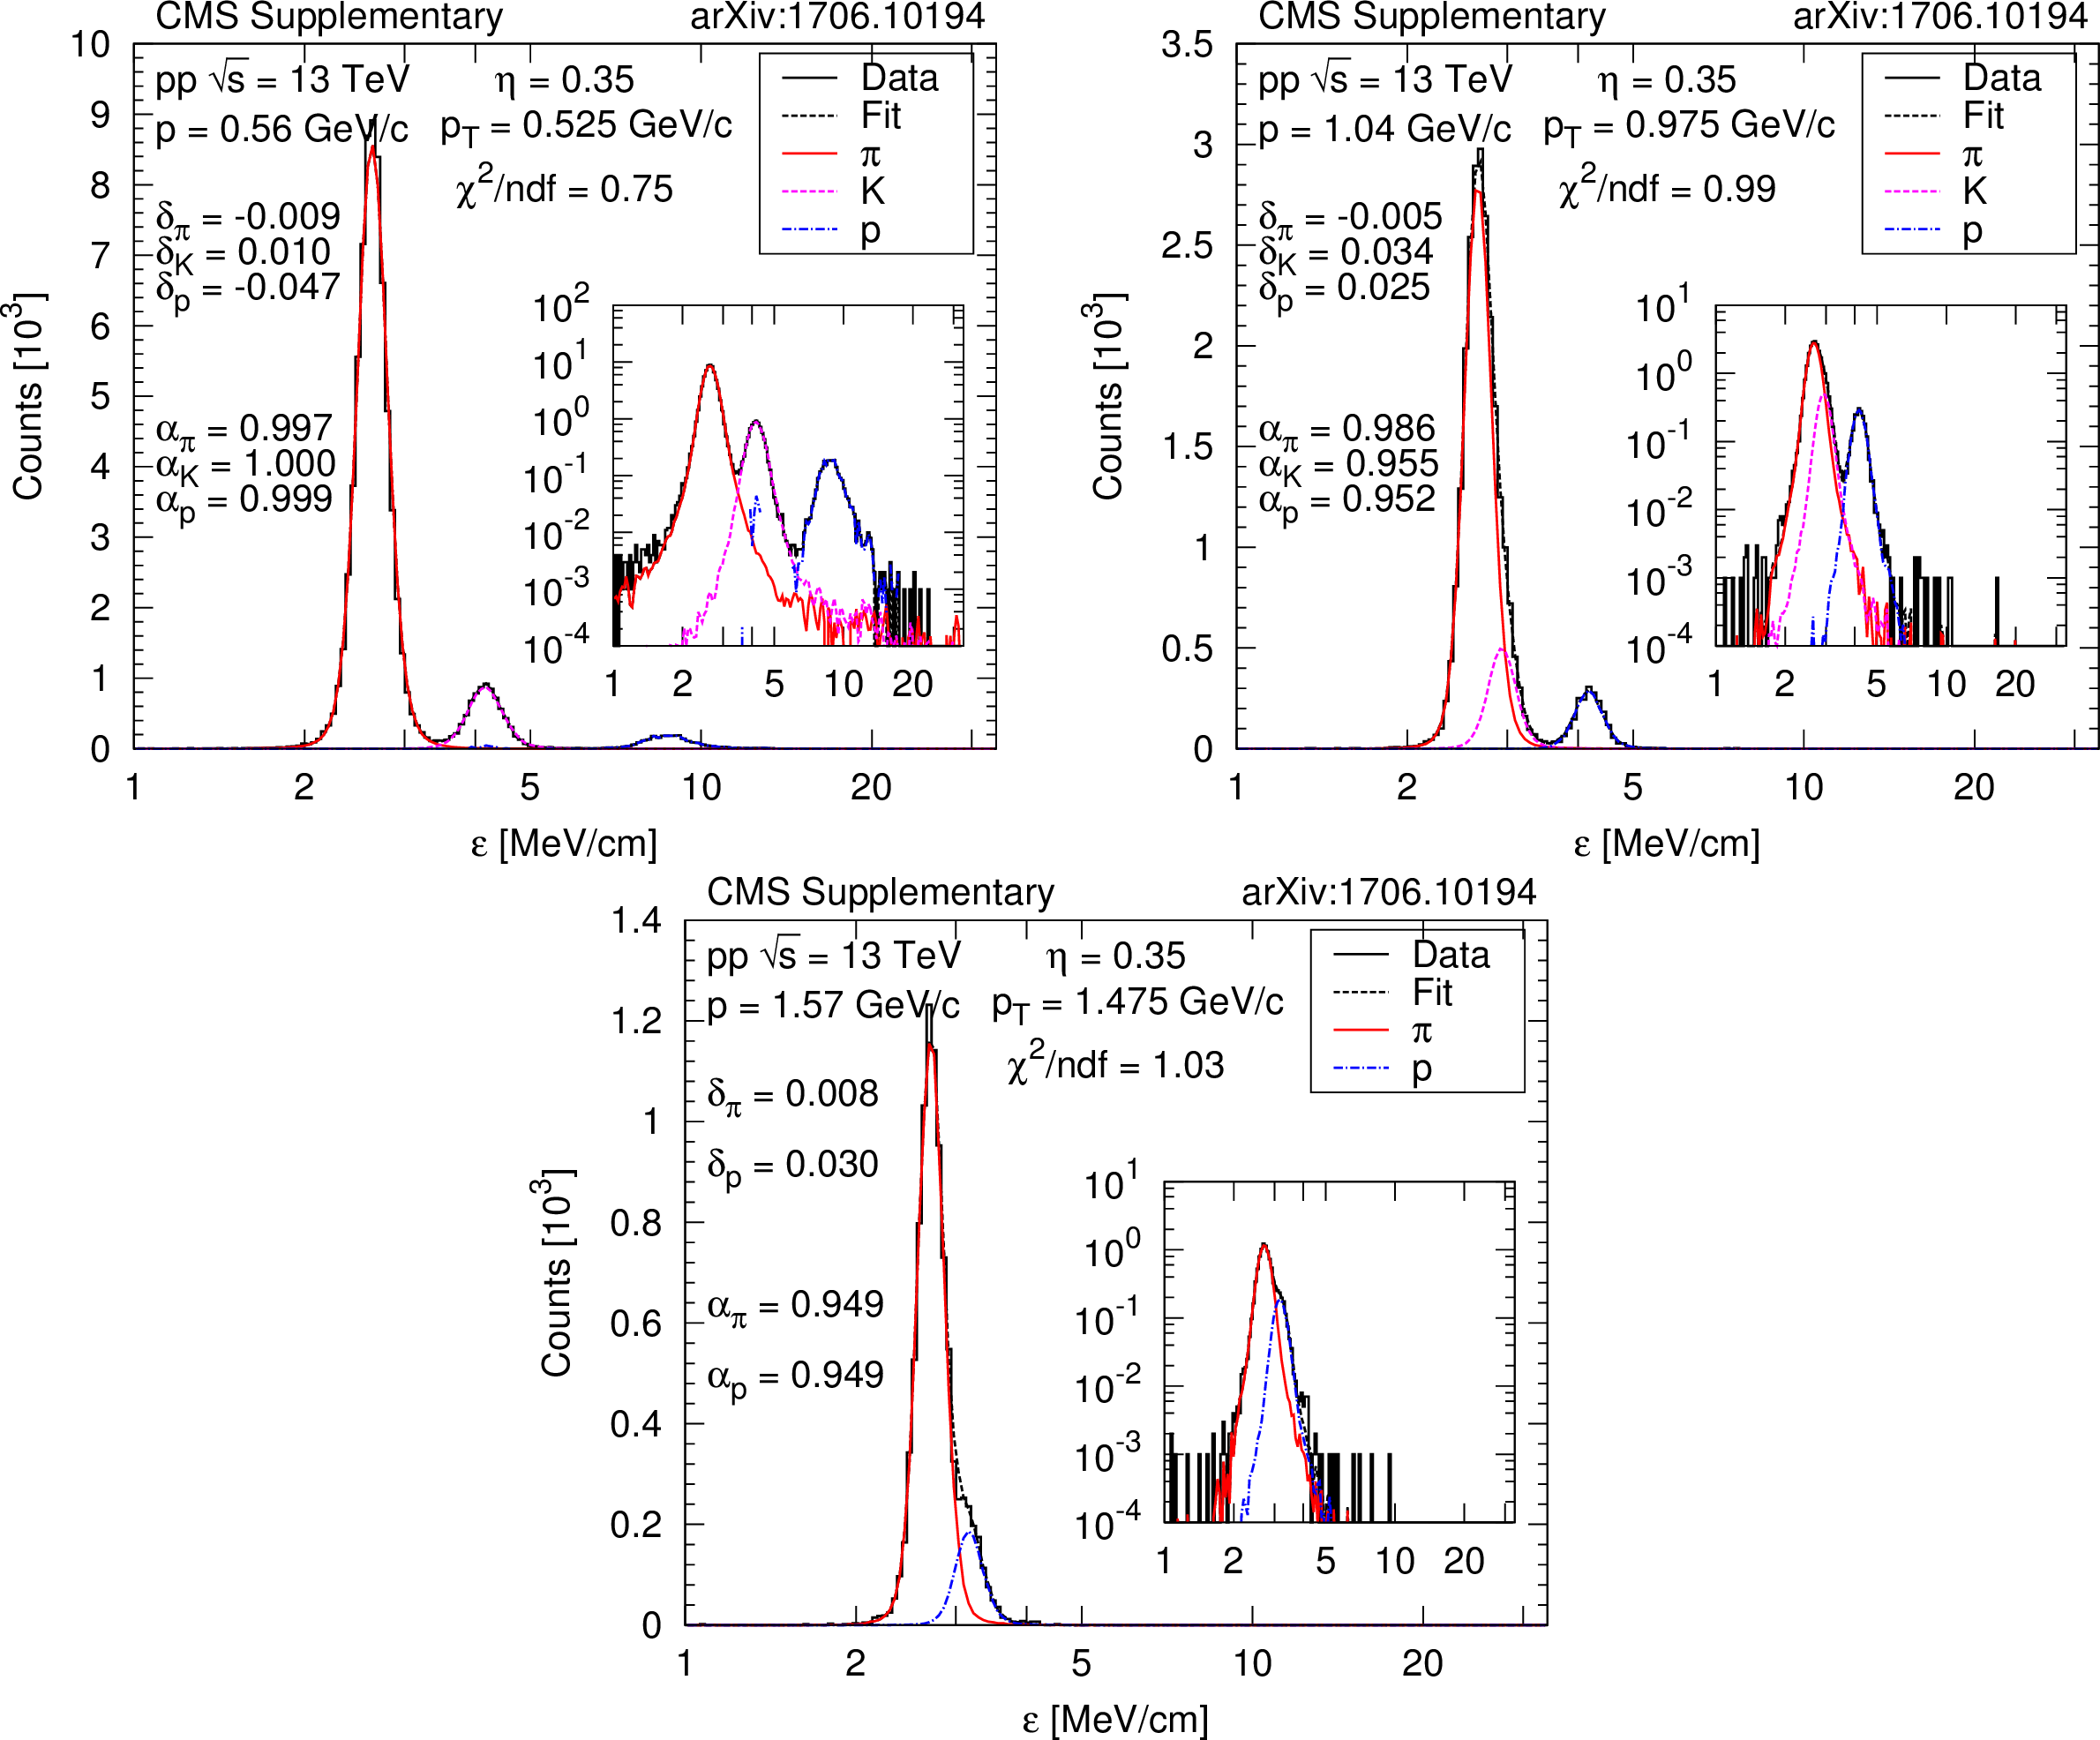
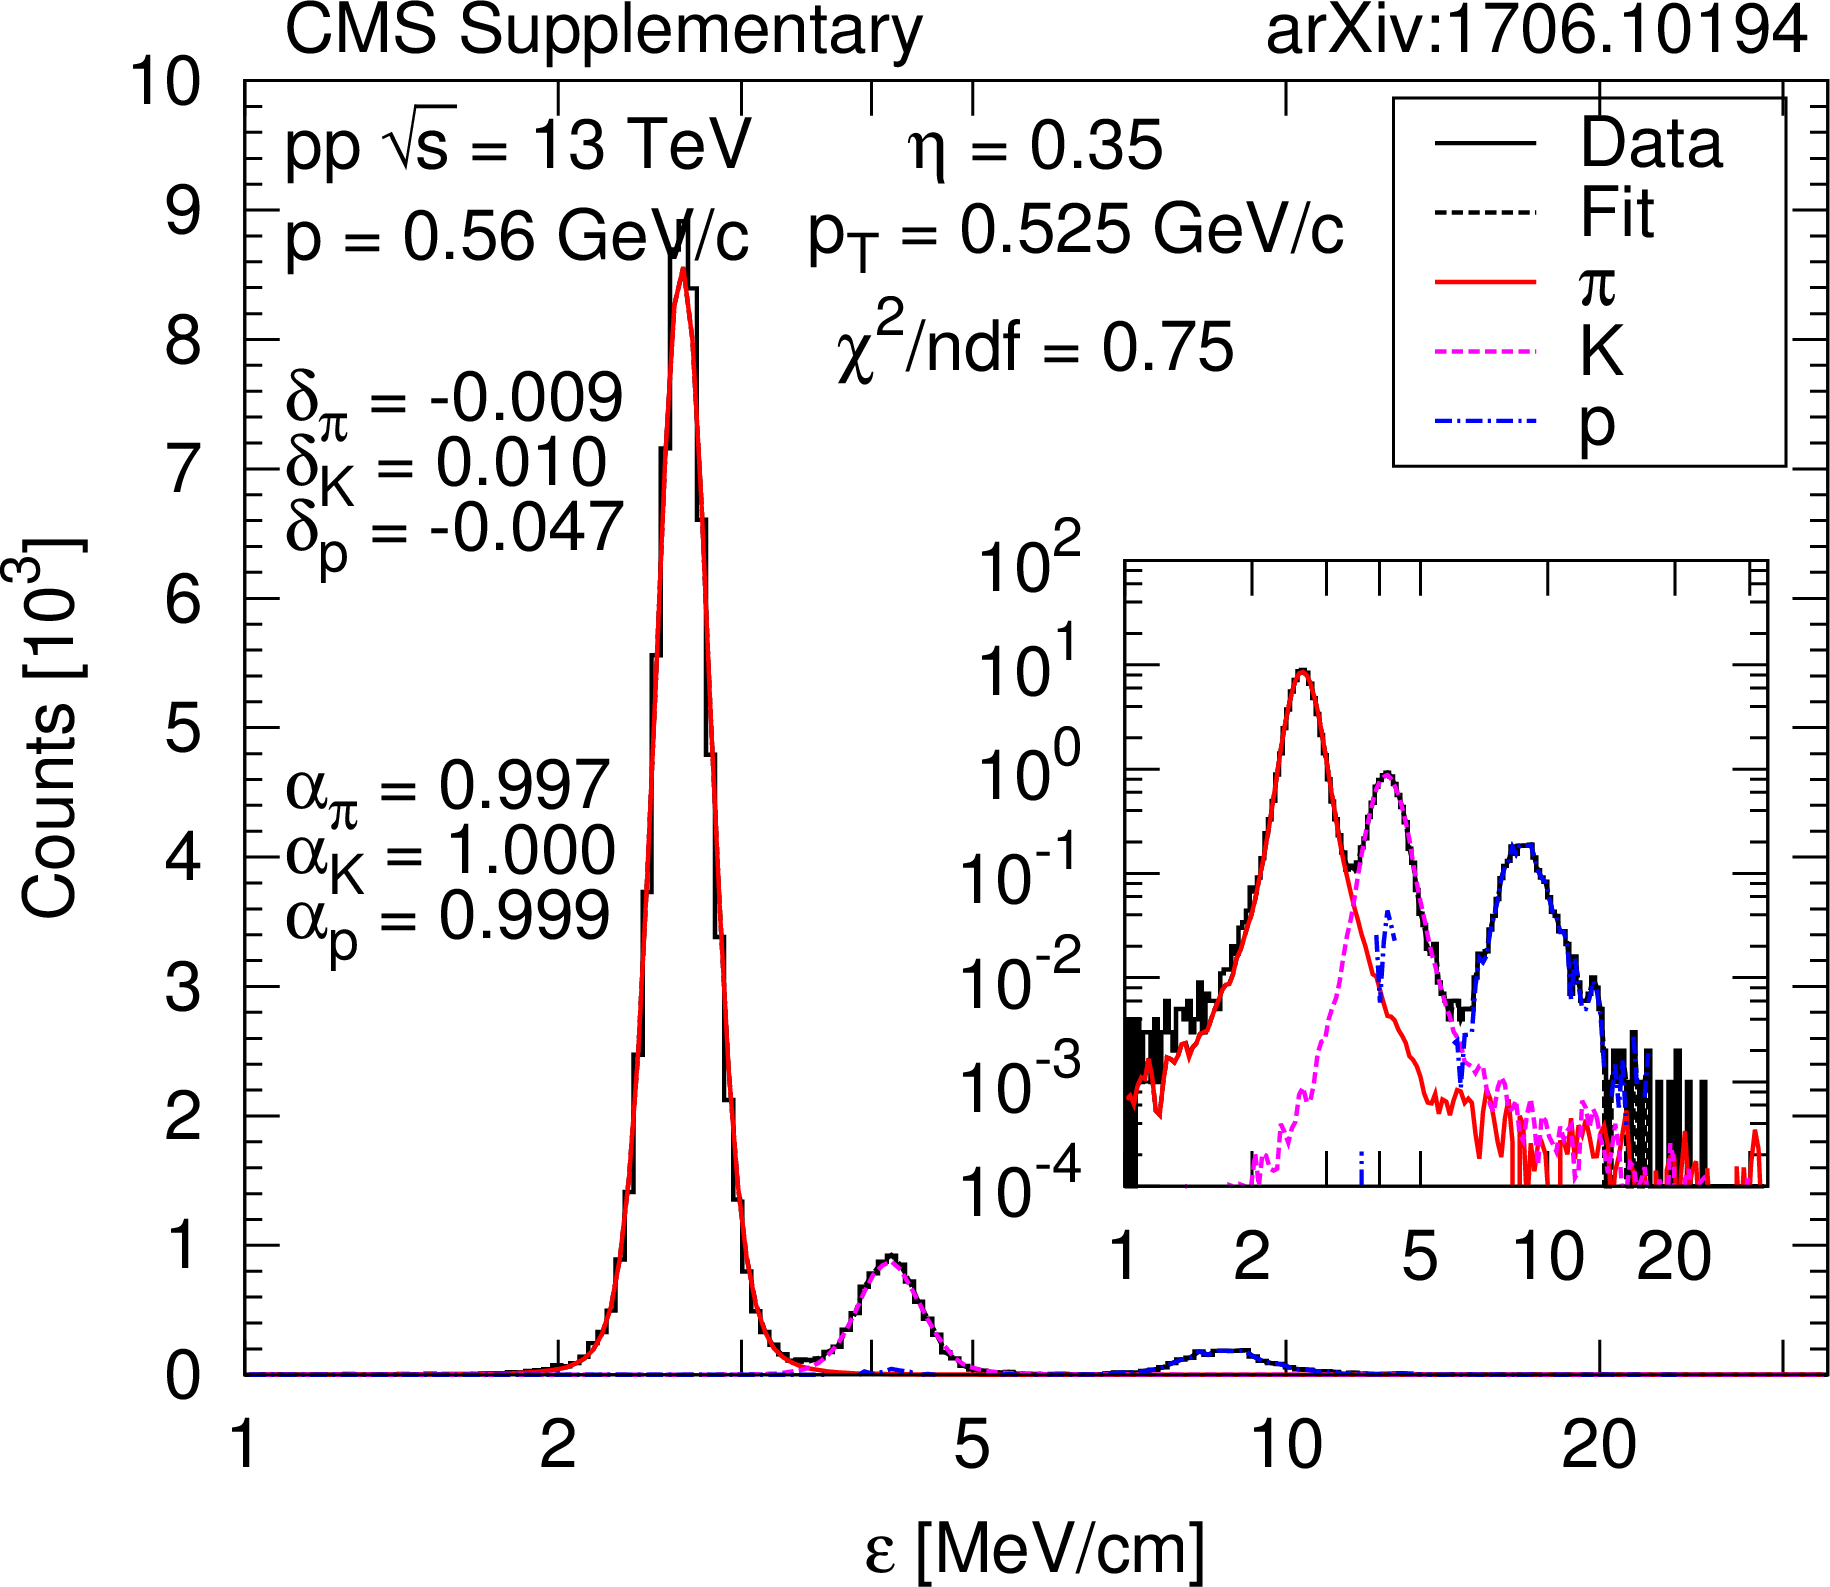
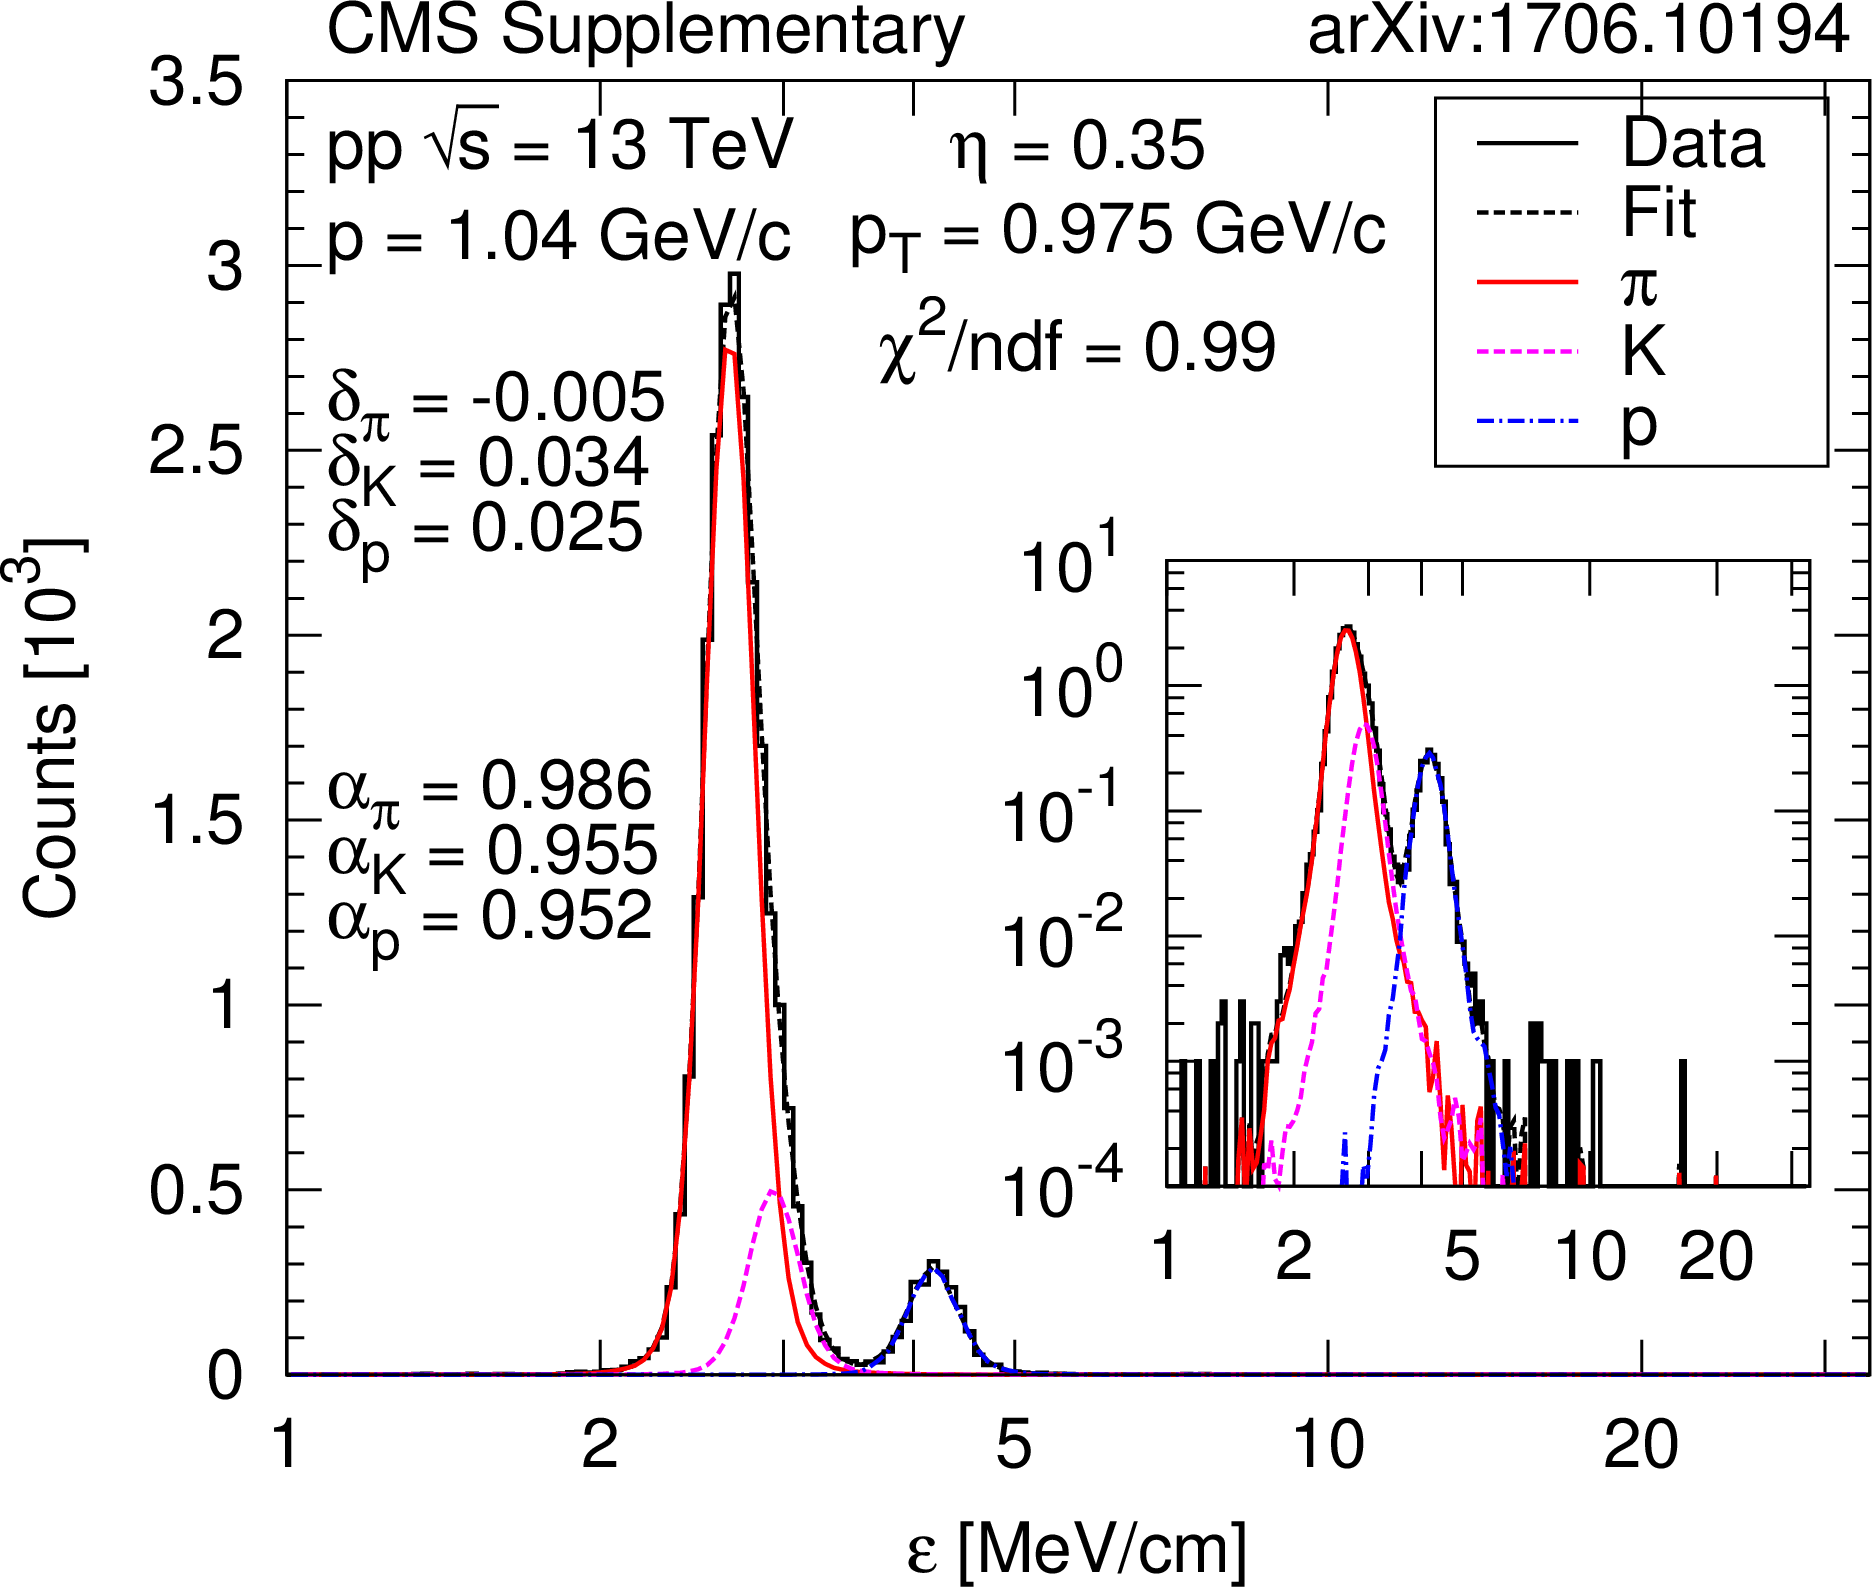
Additional Figure 4:
Example $\varepsilon $ distribution at $\eta = $ 0.35 and $ {p_{\mathrm {T}}} =$ 0.525, 0.975, and 1.475 GeV/$c$ (bin centers), with bin widths $\Delta \eta = $ 0.1 and $\Delta {p_{\mathrm {T}}}= $ 0.05 GeV/$c$. Scale factors ($\alpha $) and shifts ($\delta $) are indicated. The inset shows the distribution with logarithmic vertical scale. |
png pdf |
Additional Figure 4-a:
Example $\varepsilon $ distribution at $\eta = $ 0.35 and $ {p_{\mathrm {T}}} =$ 0.525 GeV/$c$ (bin centers), with bin widths $\Delta \eta = $ 0.1 and $\Delta {p_{\mathrm {T}}}= $ 0.05 GeV/$c$. Scale factors ($\alpha $) and shifts ($\delta $) are indicated. The inset shows the distribution with logarithmic vertical scale. |
png pdf |
Additional Figure 4-b:
Example $\varepsilon $ distribution at $\eta = $ 0.35 and $ {p_{\mathrm {T}}} =$ 0.975 GeV/$c$ (bin centers), with bin widths $\Delta \eta = $ 0.1 and $\Delta {p_{\mathrm {T}}}= $ 0.05 GeV/$c$. Scale factors ($\alpha $) and shifts ($\delta $) are indicated. The inset shows the distribution with logarithmic vertical scale. |
png pdf |
Additional Figure 4-c:
Example $\varepsilon $ distribution at $\eta = $ 0.35 and $ {p_{\mathrm {T}}} =$ 1.475 GeV/$c$ (bin centers), with bin widths $\Delta \eta = $ 0.1 and $\Delta {p_{\mathrm {T}}}= $ 0.05 GeV/$c$. Scale factors ($\alpha $) and shifts ($\delta $) are indicated. The inset shows the distribution with logarithmic vertical scale. |
| References | ||||
| 1 | LHC Forward Physics Working Group Collaboration | LHC forward physics | JPG 43 (2016) 110201 | 1611.05079 |
| 2 | CMS Collaboration | Study of the inclusive production of charged pions, kaons, and protons in pp collisions at $ \sqrt{s} = $ 0.9, 2.76, and 7~TeV | EPJC 72 (2012) 2164 | CMS-FSQ-12-014 1207.4724 |
| 3 | ALICE Collaboration | Measurement of pion, kaon and proton production in proton-proton collisions at $ \sqrt{s} = $ 7 TeV | EPJC 75 (2015) 226 | 1504.00024 |
| 4 | D. d'Enterria et al. | Constraints from the first LHC data on hadronic event generators for ultra-high energy cosmic-ray physics | Astropart. Phys. 35 (2011) 98 | 1101.5596 |
| 5 | CMS Collaboration | Nuclear Effects on the Transverse Momentum Spectra of Charged Particles in pPb Collisions at $ \sqrt{s_{_\mathrm {NN}}} = $ 5.02 TeV | EPJC 75 (2015) 237 | CMS-HIN-12-017 1502.05387 |
| 6 | CMS Collaboration | Charged-particle nuclear modification factors in PbPb and pPb collisions at $ \sqrt{s_{\mathrm{N}\;\mathrm{N}}}= $ 5.02 TeV | JHEP 04 (2017) 039 | CMS-HIN-15-015 1611.01664 |
| 7 | ALICE Collaboration | Centrality dependence of the nuclear modification factor of charged pions, kaons, and protons in Pb-Pb collisions at $ \sqrt{s_{\rm NN}}= $ 2.76 TeV | PRC 93 (2016) 034913 | 1506.07287 |
| 8 | ALICE Collaboration | Pion, kaon, and proton production in central Pb--Pb collisions at $ \sqrt{s_{NN}} = $ 2.76 TeV | PRL 109 (2012) 252301 | 1208.1974 |
| 9 | ALICE Collaboration | Production of charged pions, kaons and protons at large transverse momenta in pp and Pb-d-Pb collisions at $ \sqrt{s_{\rm NN}} = $ 2.76 TeV | PLB 736 (2014) 196 | 1401.1250 |
| 10 | CMS Collaboration | Study of the production of charged pions, kaons, and protons in pPb collisions at $ \sqrt{s_{NN}} =\ $ 5.02 TeV | EPJC 74 (2014) 2847 | CMS-HIN-12-016 1307.3442 |
| 11 | ALICE Collaboration | Production of pions, kaons and protons in pp collisions at $ \sqrt{s} = $ 900 GeV with ALICE at the LHC | EPJC 71 (2011) 1 | 1101.4110 |
| 12 | CMS Collaboration | The CMS experiment at the CERN LHC | JINST 3 (2008) S08004 | CMS-00-001 |
| 13 | T. Sjostrand, S. Mrenna, and P. Z. Skands | PYTHIA 6.4 physics and manual | JHEP 05 (2006) 026 | hep-ph/0603175 |
| 14 | T. Sjostrand, S. Mrenna, and P. Z. Skands | A brief introduction to PYTHIA 8.1 | CPC 178 (2008) 852 | 0710.3820 |
| 15 | K. Werner, F.-M. Liu, and T. Pierog | Parton ladder splitting and the rapidity dependence of transverse momentum spectra in deuteron-gold collisions at RHIC | PRC 74 (2006) 044902 | hep-ph/0506232 |
| 16 | CMS Collaboration | Event generator tunes obtained from underlying event and multiparton scattering measurements | EPJC 76 (2016) 155 | CMS-GEN-14-001 1512.00815 |
| 17 | V. N. Gribov | A Reggeon Diagram Technique | Sov. Phys. JETP 26 (1968) 414.[Zh. Eksp. Teor. Fiz. 53, 654 (1967)] | |
| 18 | T. Pierog et al. | EPOS LHC: Test of collective hadronization with data measured at the CERN Large Hadron Collider | PRC 92 (2015) 034906 | 1306.0121 |
| 19 | CMS Collaboration | Transverse momentum and pseudorapidity distributions of charged hadrons in pp collisions at $ \sqrt{s} = $ 0.9 and 2.36~TeV | JHEP 02 (2010) 041 | CMS-QCD-09-010 1002.0621 |
| 20 | S. Agostinelli et al. | Geant4 --- a simulation toolkit | NIMA 506 (2003) 250 | |
| 21 | F. Sikl\'er | Low $ p_t $ hadronic physics with CMS | Int. J. Mod. Phys. E 16 (2007) 1819 | physics/0702193 |
| 22 | CMS Collaboration | Transverse-momentum and pseudorapidity distributions of charged hadrons in pp collisions at $ \sqrt{s} = $ 7~TeV | PRL 105 (2010) 022002 | CMS-QCD-10-006 1005.3299 |
| 23 | F. Sikl\'er | Study of clustering methods to improve primary vertex finding for collider detectors | NIMA 621 (2010) 526 | 0911.2767 |
| 24 | F. Sikl\'er | A parametrisation of the energy loss distributions of charged particles and its applications for silicon detectors | NIMA 691 (2012) 16 | 1111.3213 |
| 25 | Particle Data Group Collaboration | Review of particle physics | CPC 40 (2016) 100001 | |
| 26 | A. N. Tikhonov | Solution of incorrectly formulated problems and the regularization method | Soviet Math. Dokl. 4 (1963) 1035 | |
| 27 | CMS Collaboration | Strange particle production in pp collisions at $ \sqrt{s} = $ 0.9 and 7~TeV | JHEP 05 (2011) 064 | CMS-QCD-10-007 1102.4282 |
| 28 | C. Tsallis | Possible generalization of Boltzmann-Gibbs statistics | J. Stat. Phys. 52 (1988) 479 | |
| 29 | T. S. Bir\'o, G. Purcsel, and K. Urmossy | Non-extensive approach to quark matter | EPJA 40 (2009) 325 | 0812.2104 |
| 30 | CMS Collaboration | Observation of long-range near-side angular correlations in proton-proton collisions at the LHC | JHEP 09 (2010) 091 | CMS-QCD-10-002 1009.4122 |
| 31 | CMS Collaboration | Observation of long-range near-side angular correlations in proton-lead collisions at the LHC | PLB 718 (2013) 795 | CMS-HIN-12-015 1210.5482 |
| 32 | ALICE Collaboration | Long-range angular correlations on the near and away side in p-Pb collisions at $ \sqrt{s_{NN}}= $ 5.02 TeV | PLB 719 (2013) 29 | 1212.2001 |
| 33 | ATLAS Collaboration | Observation of associated near-side and away-side long-range correlations in $ \sqrt{s_{NN}} = $ 5.02 TeV proton-lead collisions with the ATLAS detector | PRL 110 (2013) 182302 | 1212.5198 |
| 34 | D. d'Enterria and T. Pierog | Global properties of proton-proton collisions at $ \sqrt{s} = $ 100 TeV | JHEP 08 (2016) 170 | 1604.08536 |
| 35 | L. McLerran, M. Praszalowicz, and B. Schenke | Transverse momentum of protons, pions and kaons in high multiplicity pp and pA collisions: Evidence for the color glass condensate? | NP A 916 (2013) 210 | 1306.2350 |
|
|
Compact Muon Solenoid LHC, CERN |
|

|

|

|

|

|