

Compact Muon Solenoid
LHC, CERN
| CMS-GEN-14-001 ; CERN-PH-EP-2015-291 | ||
| Event generator tunes obtained from underlying event and multiparton scattering measurements | ||
| CMS Collaboration | ||
| 2 December 2015 | ||
| Accepted for publication in Eur. Phys. J. C Eur. Phys. J. C 76 (2016) 155 | ||
| Abstract: New sets of parameters (``tunes'') for the underlying-event (UE) modeling of the PYTHIA8, PYTHIA6 and HERWIG++ Monte Carlo event generators are constructed using different parton distribution functions. Combined fits to CMS UE data at $\sqrt{s} =$ 7 TeV and to UE data from the CDF experiment at lower $\sqrt{s}$, are used to study the UE models and constrain their parameters, providing thereby improved predictions for proton-proton collisions at 13 TeV. In addition, it is investigated whether the values of the parameters obtained from fits to UE observables are consistent with the values determined from fitting observables sensitive to double-parton scattering processes. Finally, comparisons of the UE tunes to ``minimum bias'' (MB) events, multijet, and Drell--Yan ($ \mathrm{ q \bar{q} } \rightarrow \mathrm{Z} / \gamma^* \rightarrow$ lepton-antilepton + jets) observables at 7 and 8 TeV are presented, as well as predictions of MB and UE observables at 13 TeV. | ||
| Links: e-print arXiv:1512.00815 [hep-ex] (PDF) ; CDS record ; inSPIRE record ; CADI line (restricted) ; | ||
| Figures | |
png pdf |
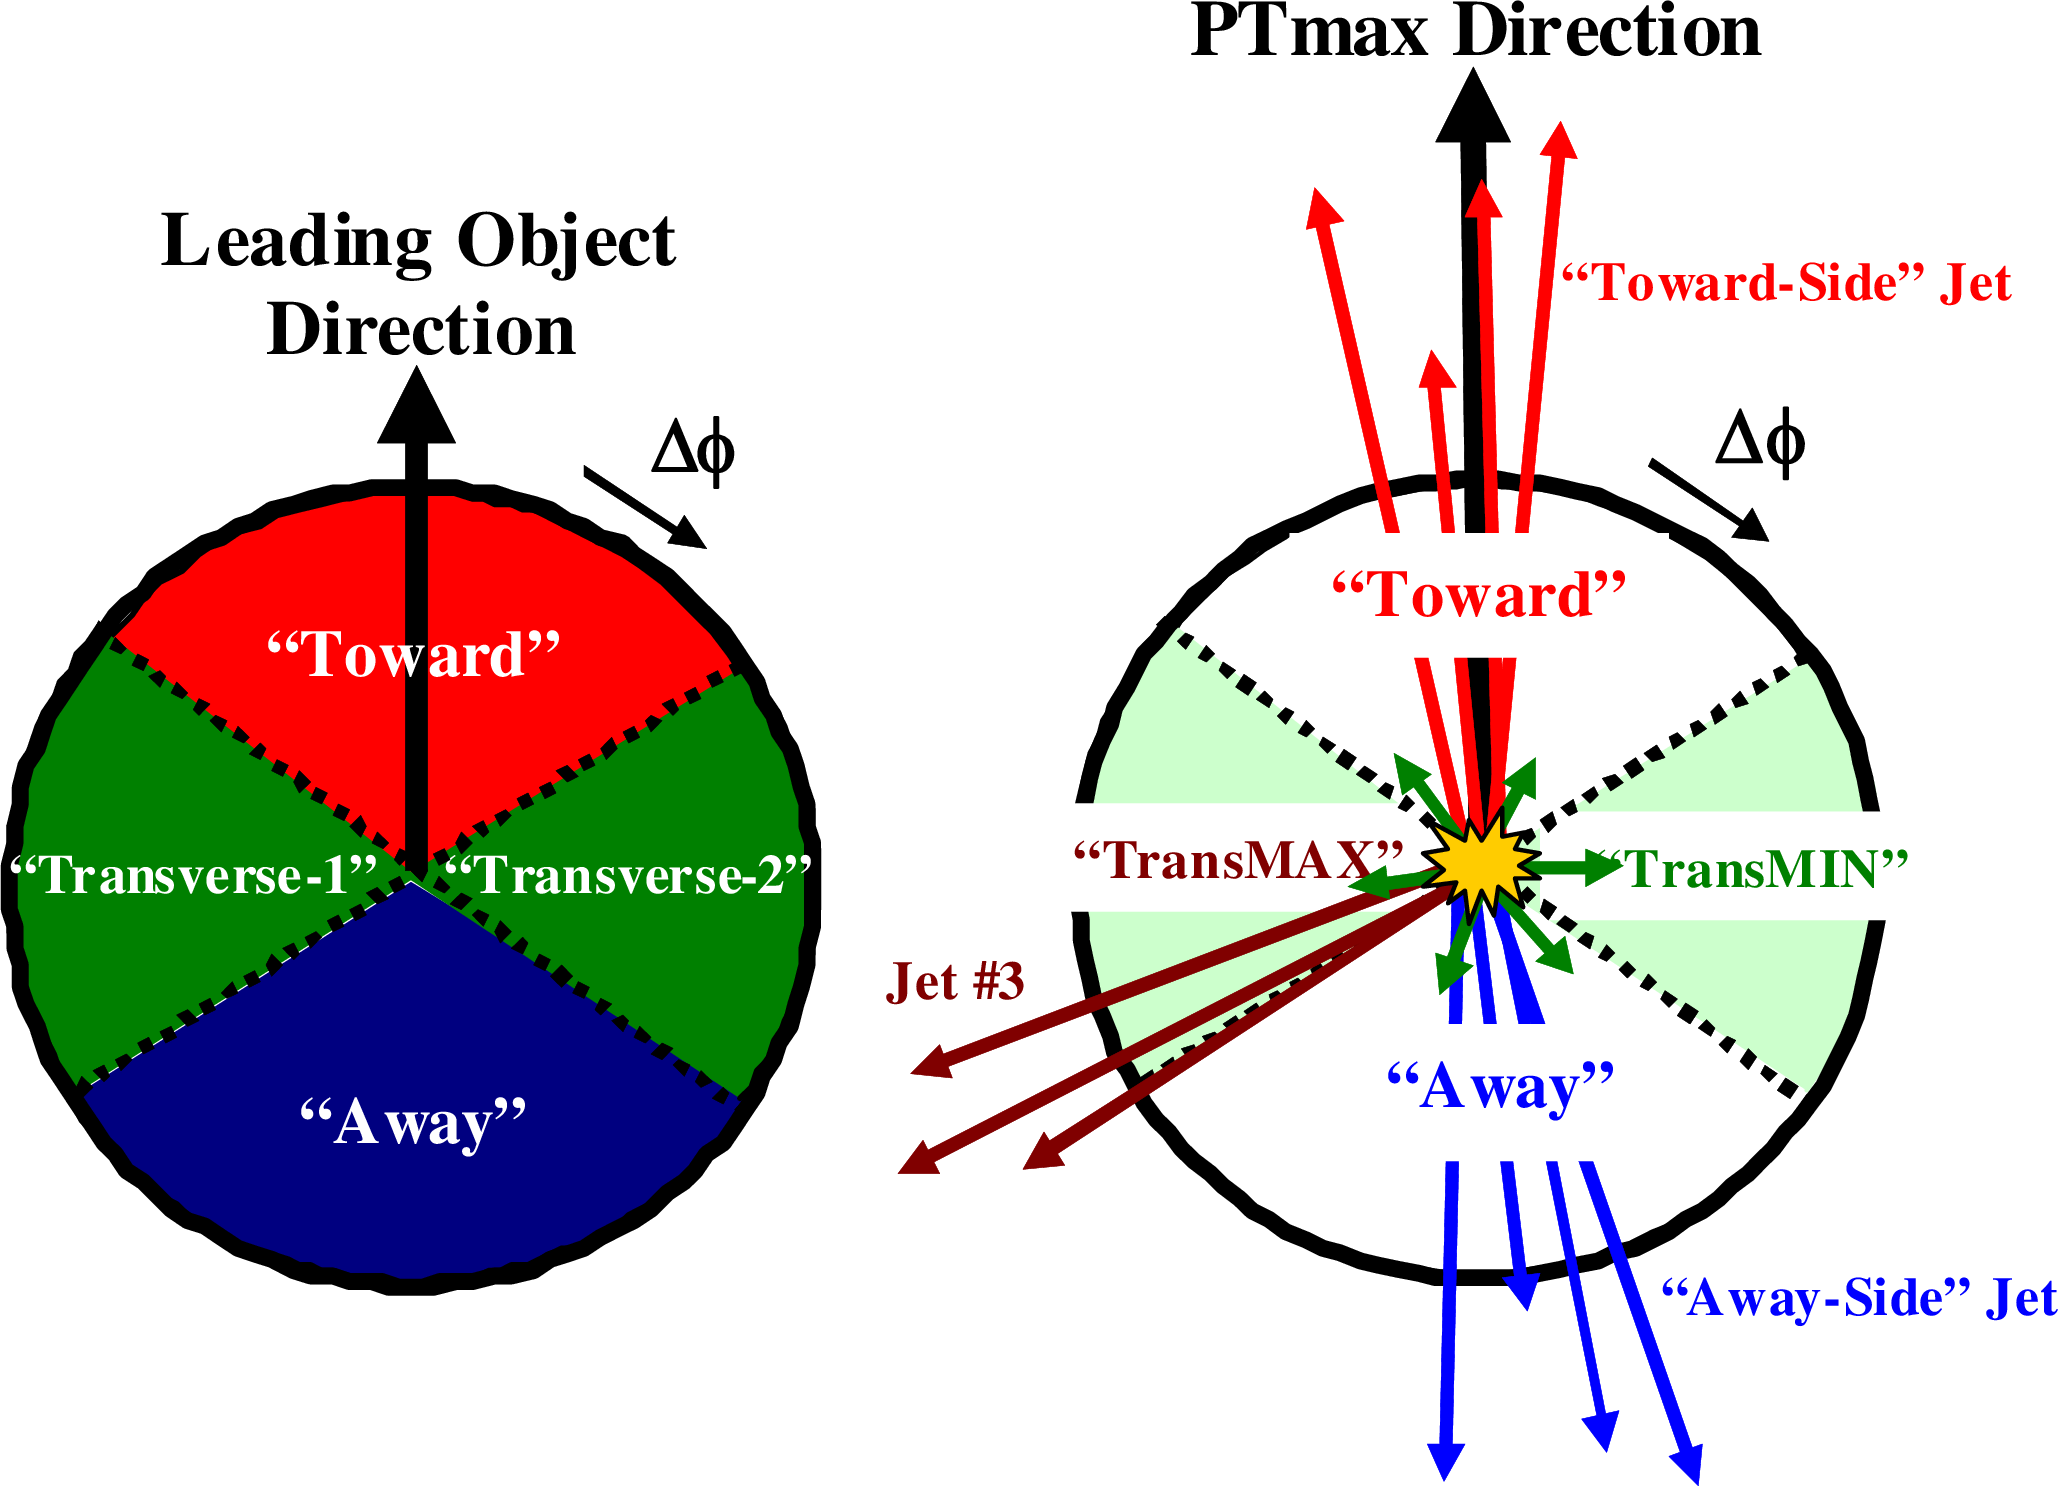
Figure 1:
a: Illustration of the azimuthal regions in an event defined by the $\Delta \phi $\ angle relative to the direction of the leading object. b: Illustration of the topology of a hadron-hadron collision in which a hard parton-parton collision has occurred, and the leading object is taken to be the charged particle of largest $ {p_{\mathrm {T}}} $ in the event, $p_{\rm T}^{\rm max}$. |
png pdf |
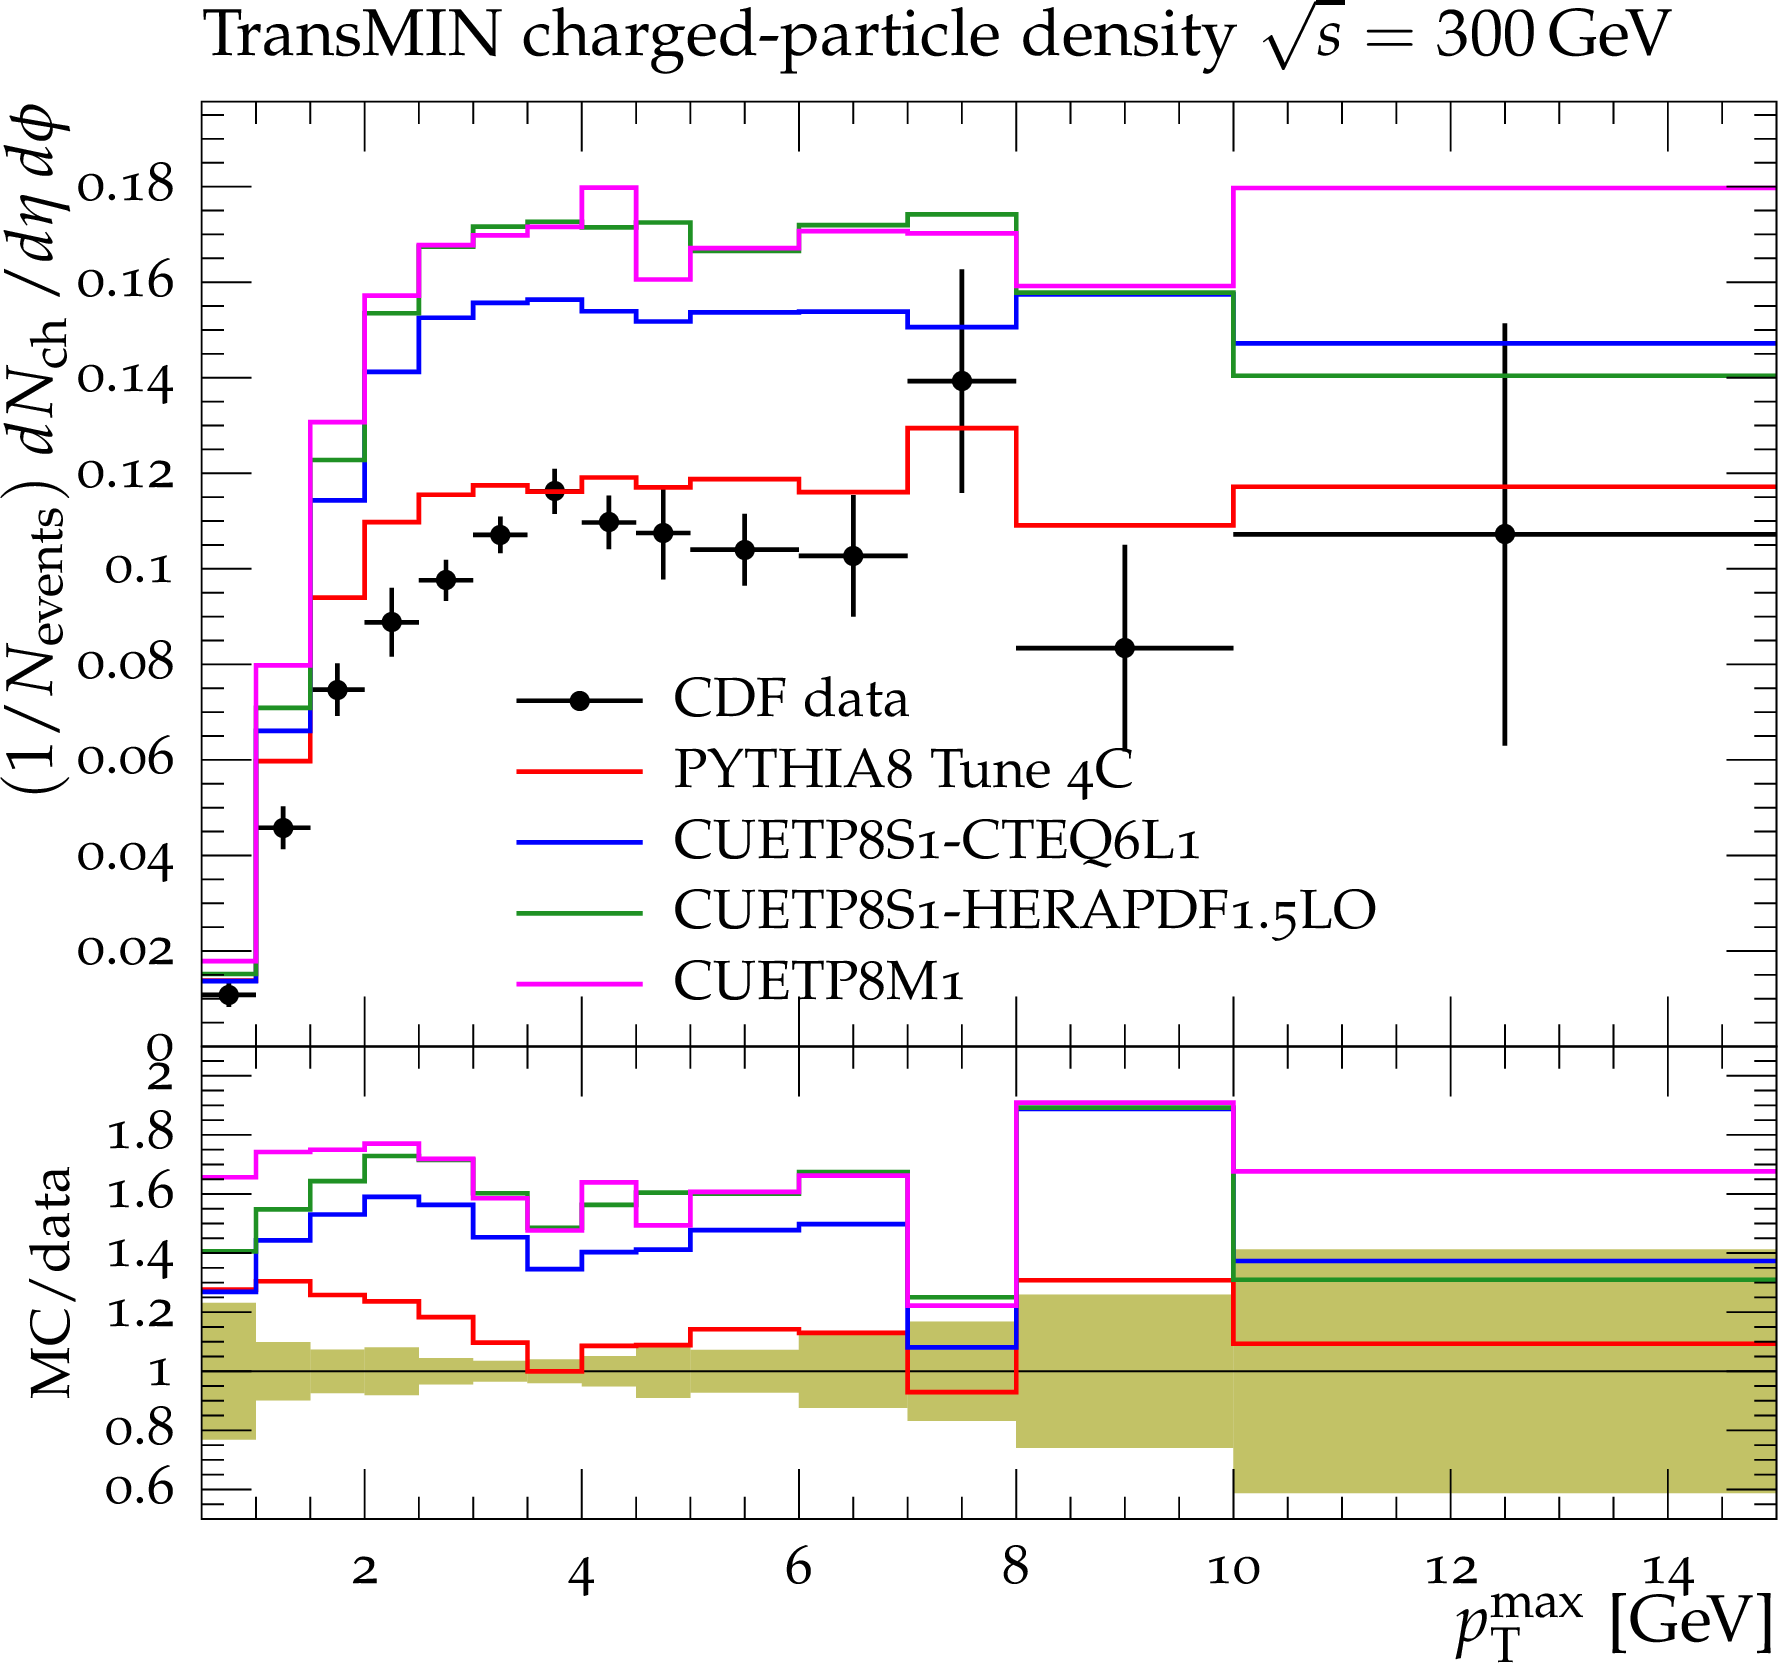
Figure 2-a:
CDF data at $\sqrt {s}=$ 300 GeV[11] on particle (a,b) and $p_{\rm T}^{\rm sum}$\ densities (c,d) for charged particles with $p_{\rm T}> $0.5 GeV and $|\eta |<$ 0.8 in the TransMIN (a,c) and TransMAX (b,d) regions as defined by the leading charged particle, as a function of the transverse momentum of the leading charged-particle $p_{\rm T}^{\rm max}$. The data are compared to PYTHIA8 Tune 4C, CUETP8S1-CTEQ6L1, CUETP8S1-HERAPDF1.5LO, and CUETP8M1. The ratios of MC events to data are given below each panel. The data at $\sqrt {s}=$ 300 GeV are not used in determining these tunes. The green bands in the ratios represent the total experimental uncertainties. |
png pdf |
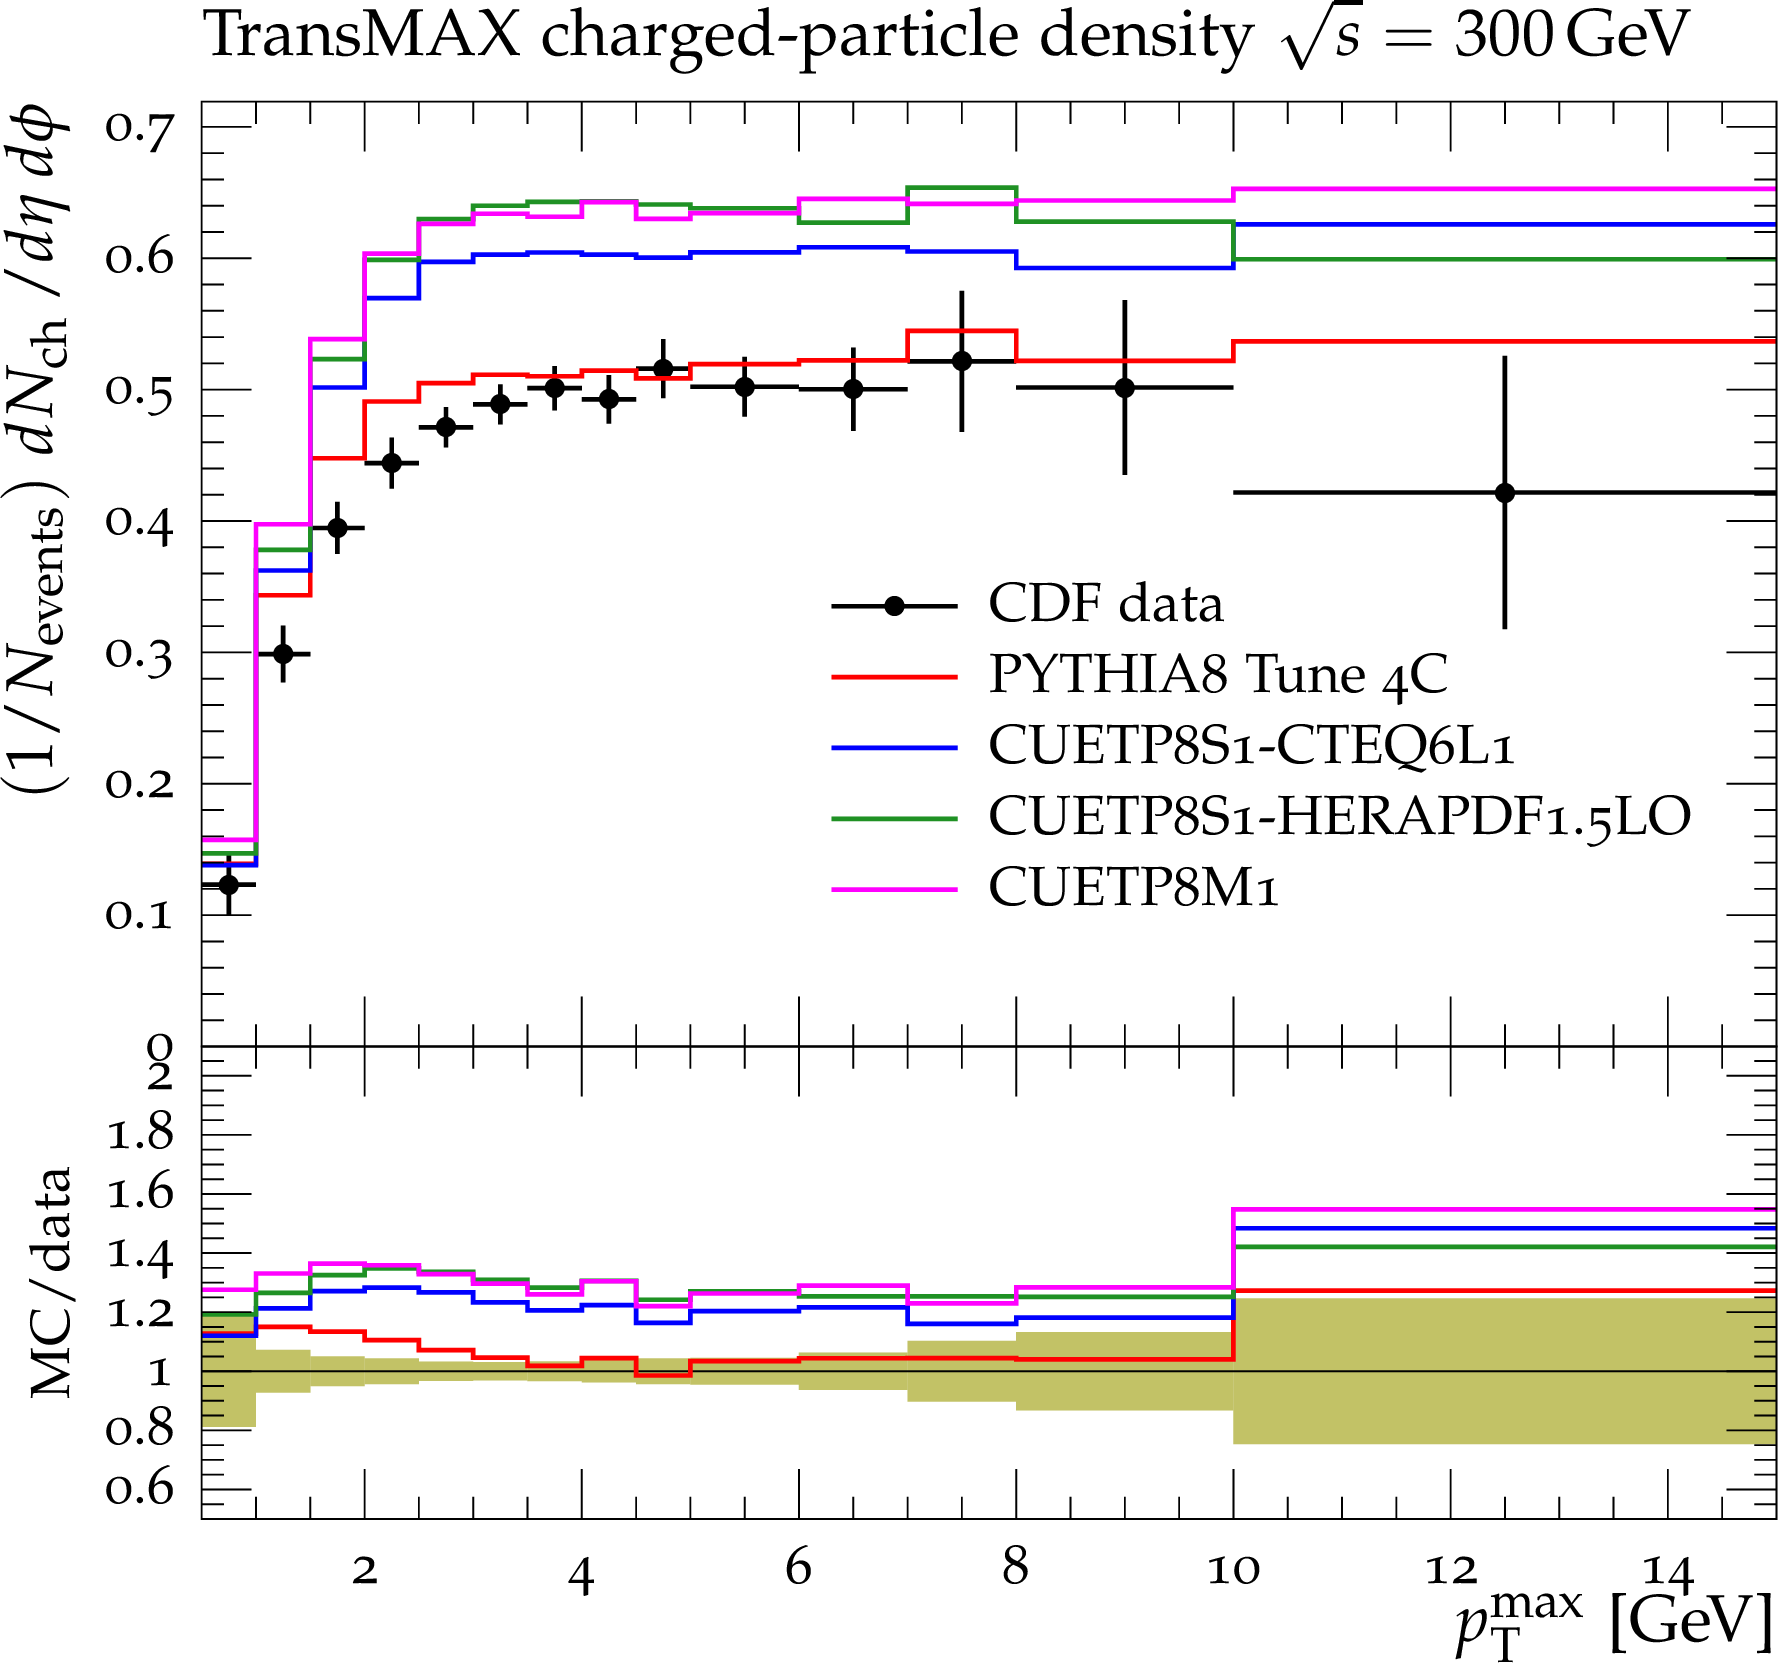
Figure 2-b:
CDF data at $\sqrt {s}=$ 300 GeV[11] on particle (a,b) and $p_{\rm T}^{\rm sum}$\ densities (c,d) for charged particles with $p_{\rm T}> $0.5 GeV and $|\eta |<$ 0.8 in the TransMIN (a,c) and TransMAX (b,d) regions as defined by the leading charged particle, as a function of the transverse momentum of the leading charged-particle $p_{\rm T}^{\rm max}$. The data are compared to PYTHIA8 Tune 4C, CUETP8S1-CTEQ6L1, CUETP8S1-HERAPDF1.5LO, and CUETP8M1. The ratios of MC events to data are given below each panel. The data at $\sqrt {s}=$ 300 GeV are not used in determining these tunes. The green bands in the ratios represent the total experimental uncertainties. |
png pdf |
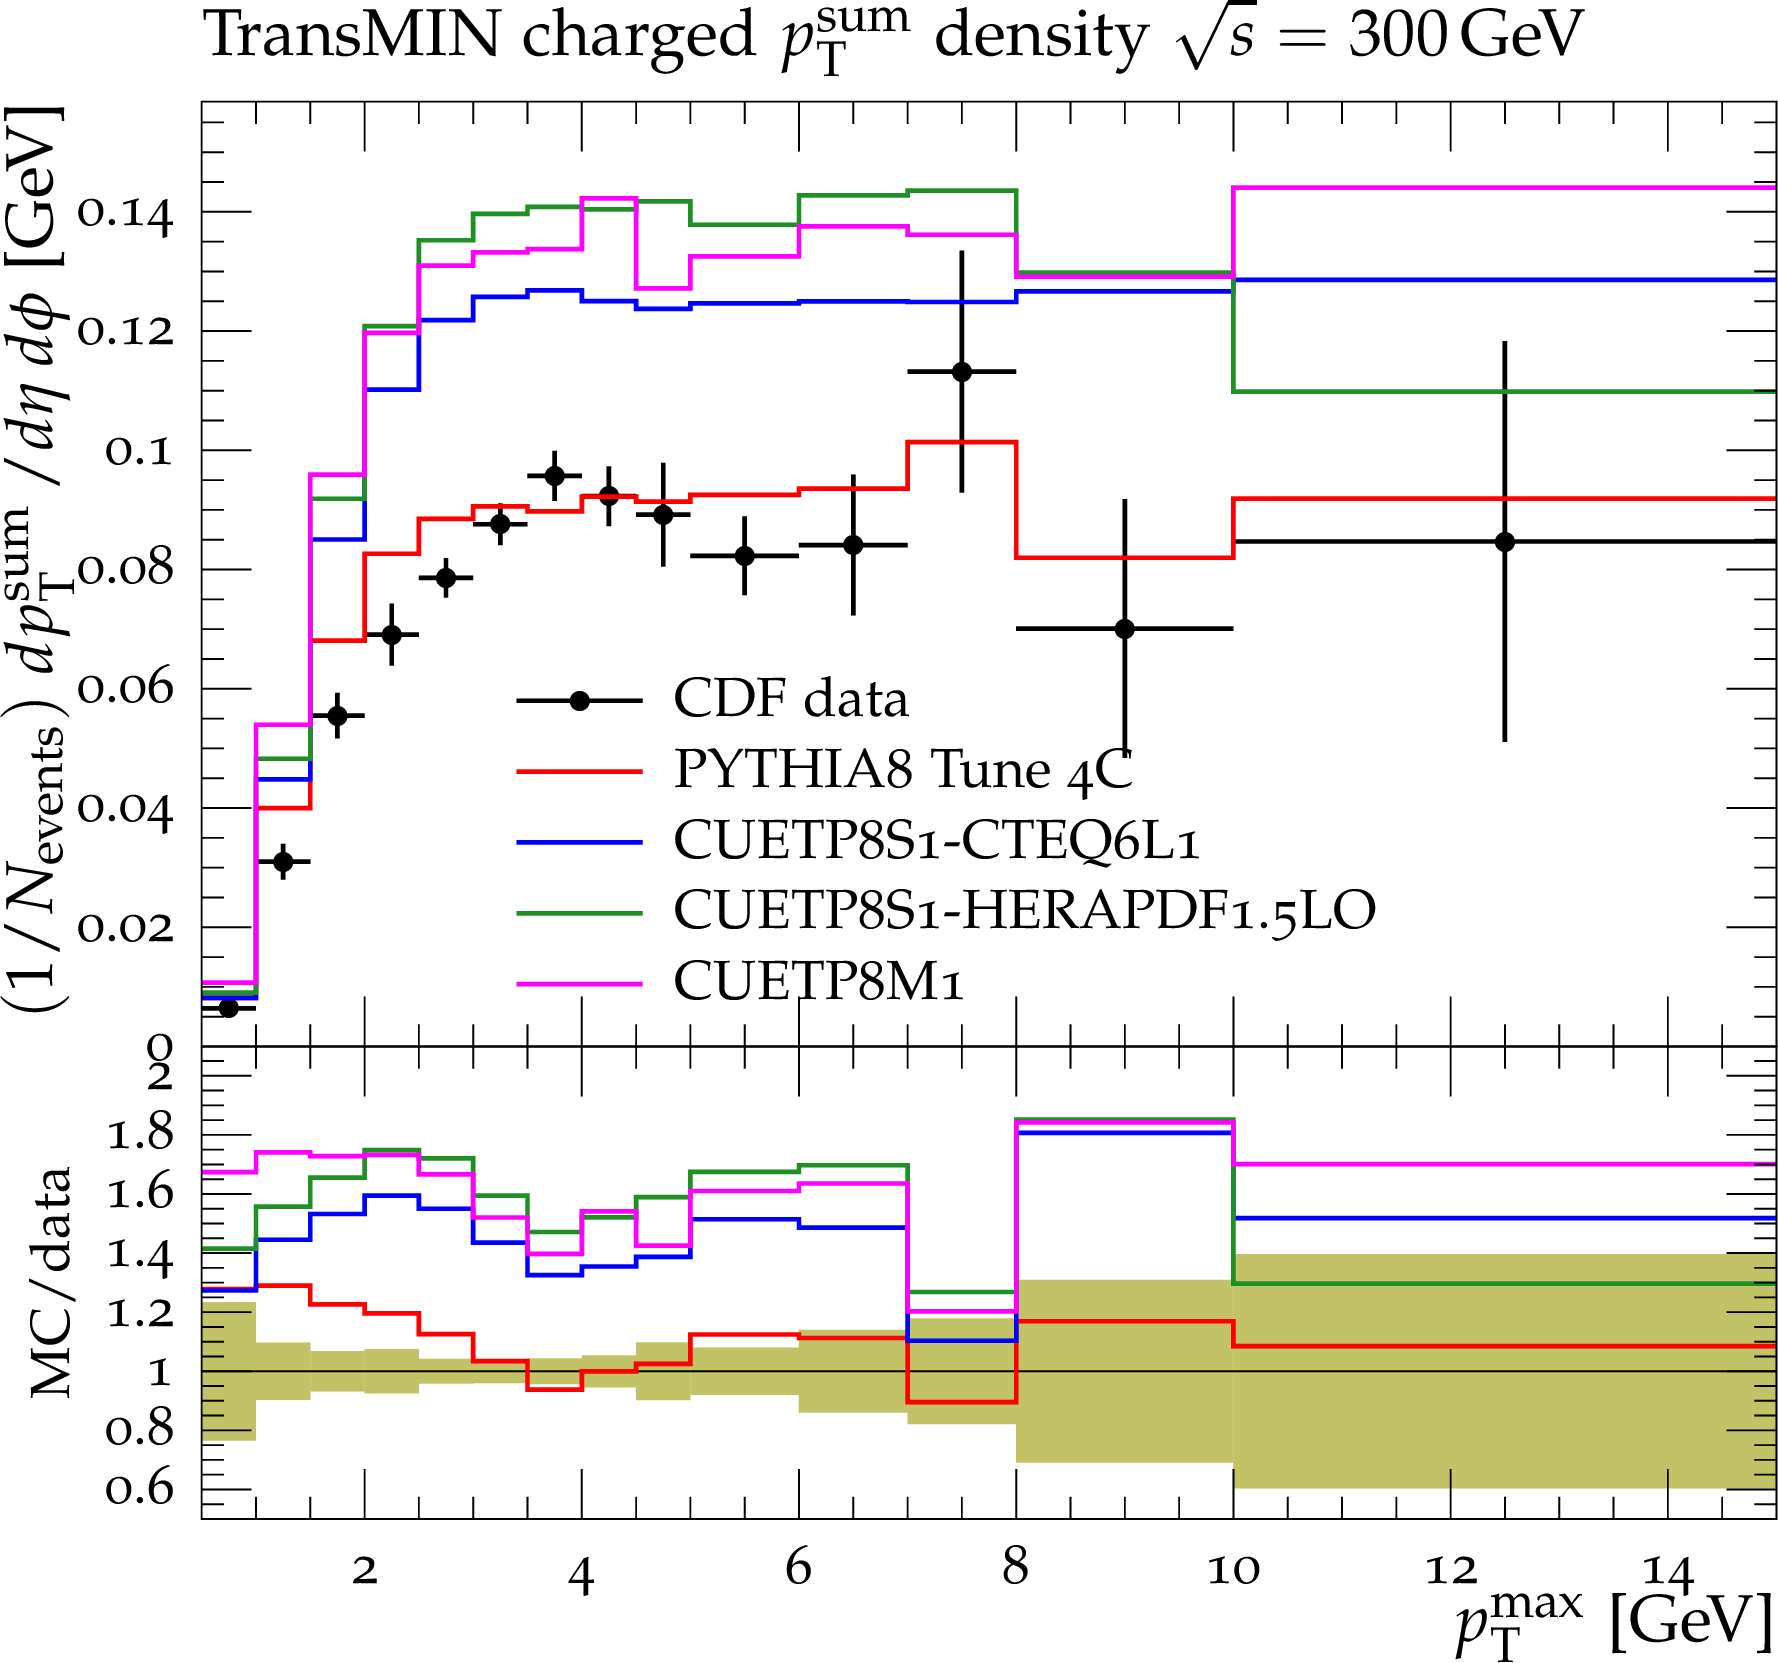
Figure 2-c:
CDF data at $\sqrt {s}=$ 300 GeV[11] on particle (a,b) and $p_{\rm T}^{\rm sum}$\ densities (c,d) for charged particles with $p_{\rm T}> $0.5 GeV and $|\eta |<$ 0.8 in the TransMIN (a,c) and TransMAX (b,d) regions as defined by the leading charged particle, as a function of the transverse momentum of the leading charged-particle $p_{\rm T}^{\rm max}$. The data are compared to PYTHIA8 Tune 4C, CUETP8S1-CTEQ6L1, CUETP8S1-HERAPDF1.5LO, and CUETP8M1. The ratios of MC events to data are given below each panel. The data at $\sqrt {s}=$ 300 GeV are not used in determining these tunes. The green bands in the ratios represent the total experimental uncertainties. |
png pdf |
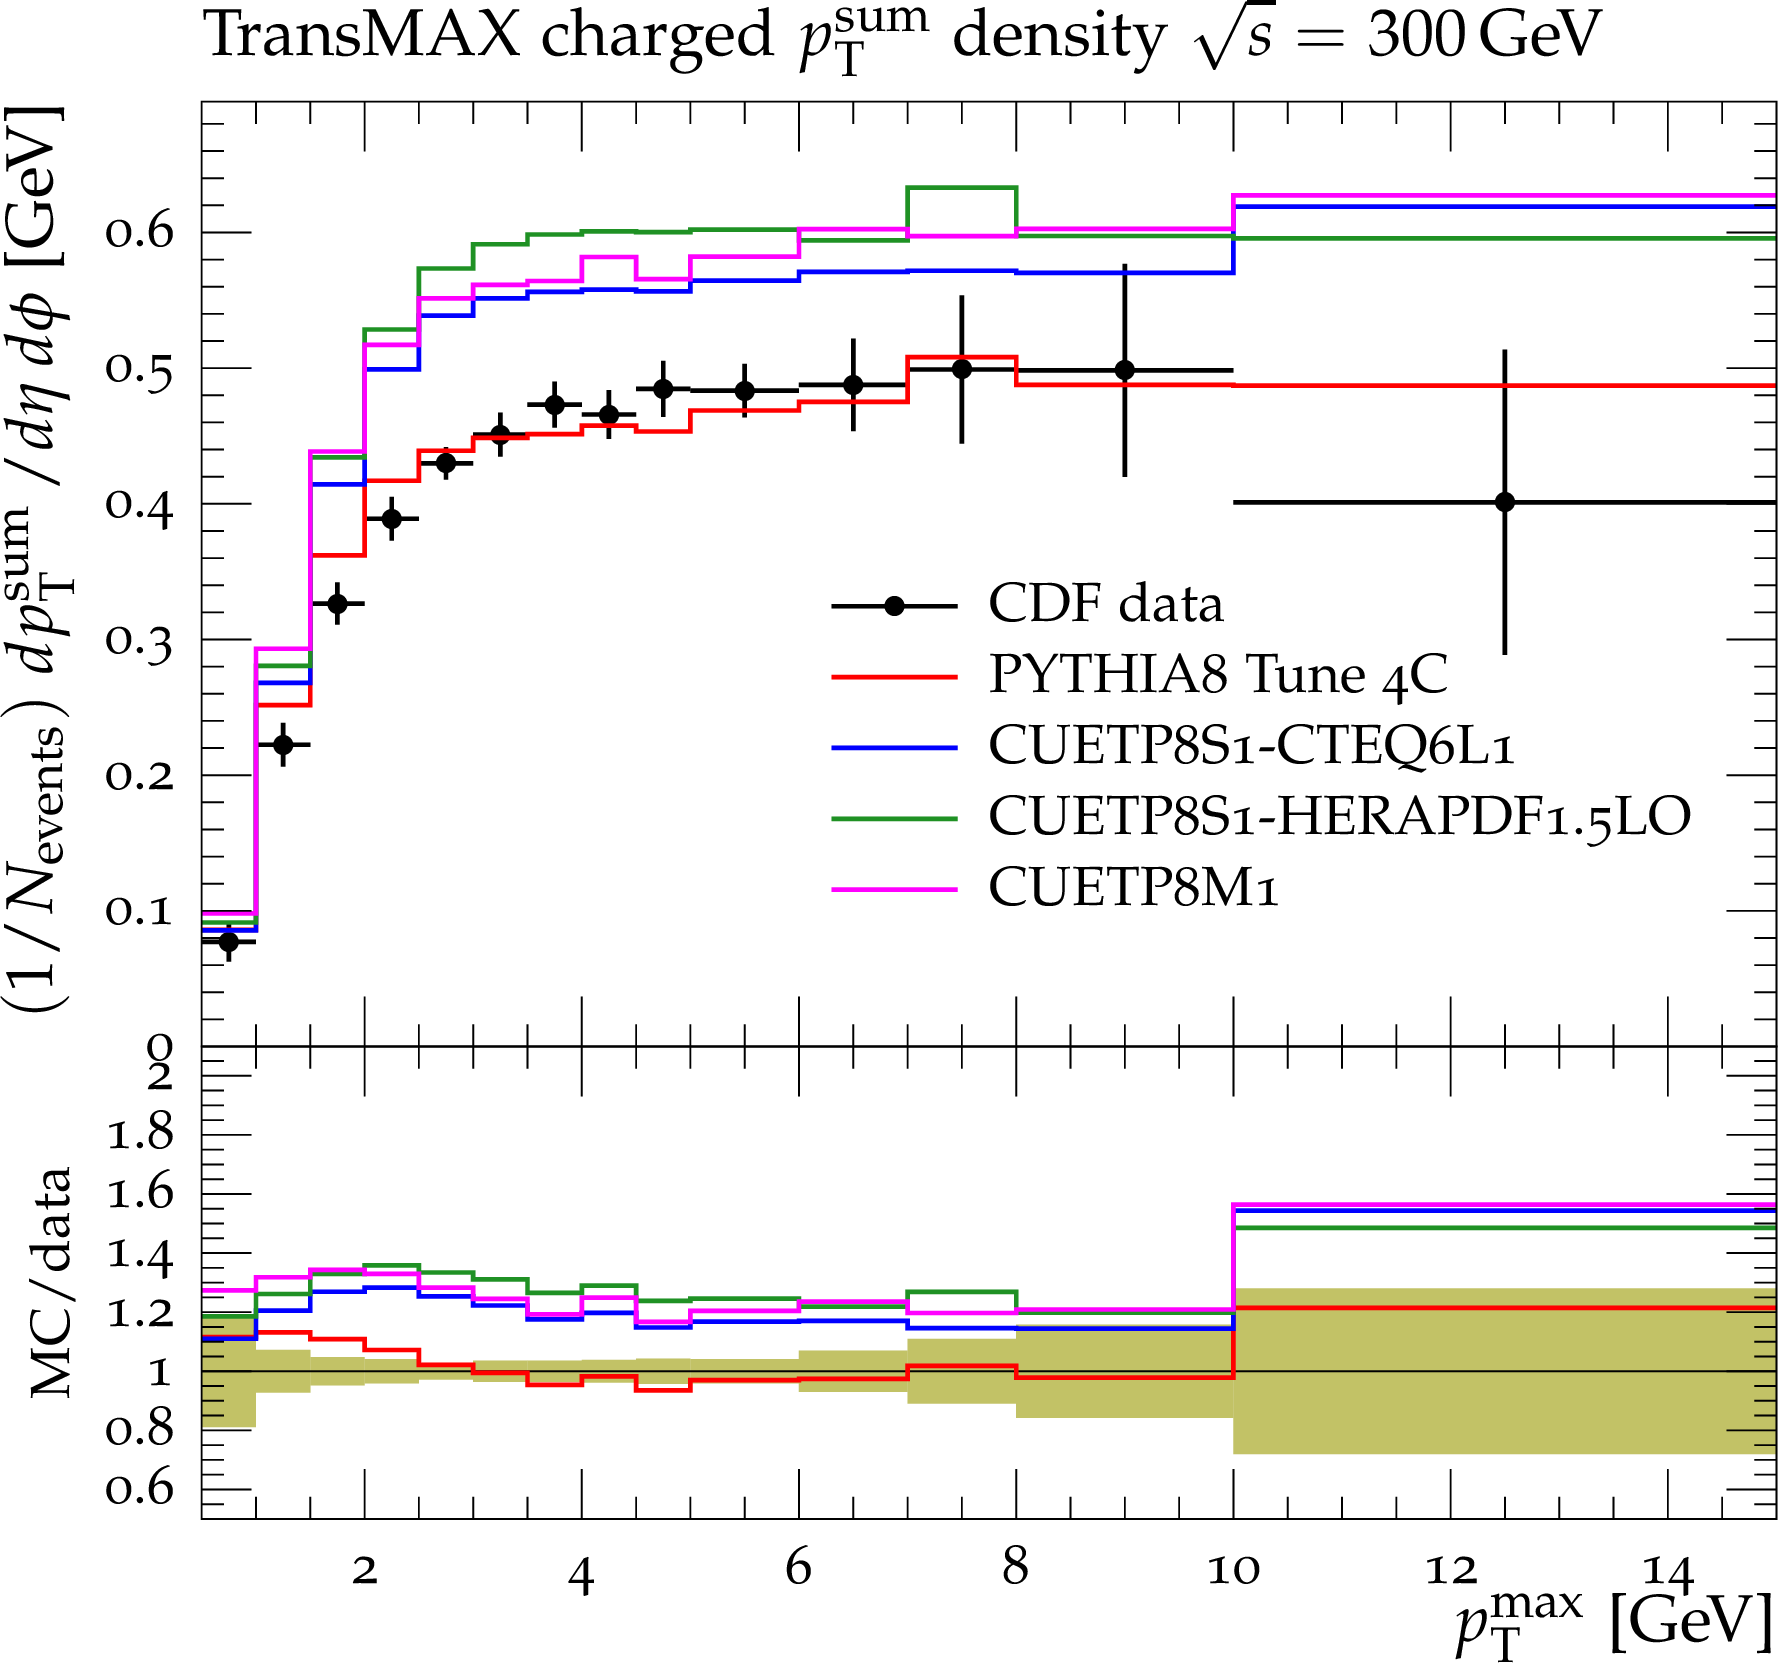
Figure 2-d:
CDF data at $\sqrt {s}=$ 300 GeV[11] on particle (a,b) and $p_{\rm T}^{\rm sum}$\ densities (c,d) for charged particles with $p_{\rm T}> $0.5 GeV and $|\eta |<$ 0.8 in the TransMIN (a,c) and TransMAX (b,d) regions as defined by the leading charged particle, as a function of the transverse momentum of the leading charged-particle $p_{\rm T}^{\rm max}$. The data are compared to PYTHIA8 Tune 4C, CUETP8S1-CTEQ6L1, CUETP8S1-HERAPDF1.5LO, and CUETP8M1. The ratios of MC events to data are given below each panel. The data at $\sqrt {s}=$ 300 GeV are not used in determining these tunes. The green bands in the ratios represent the total experimental uncertainties. |
png pdf |
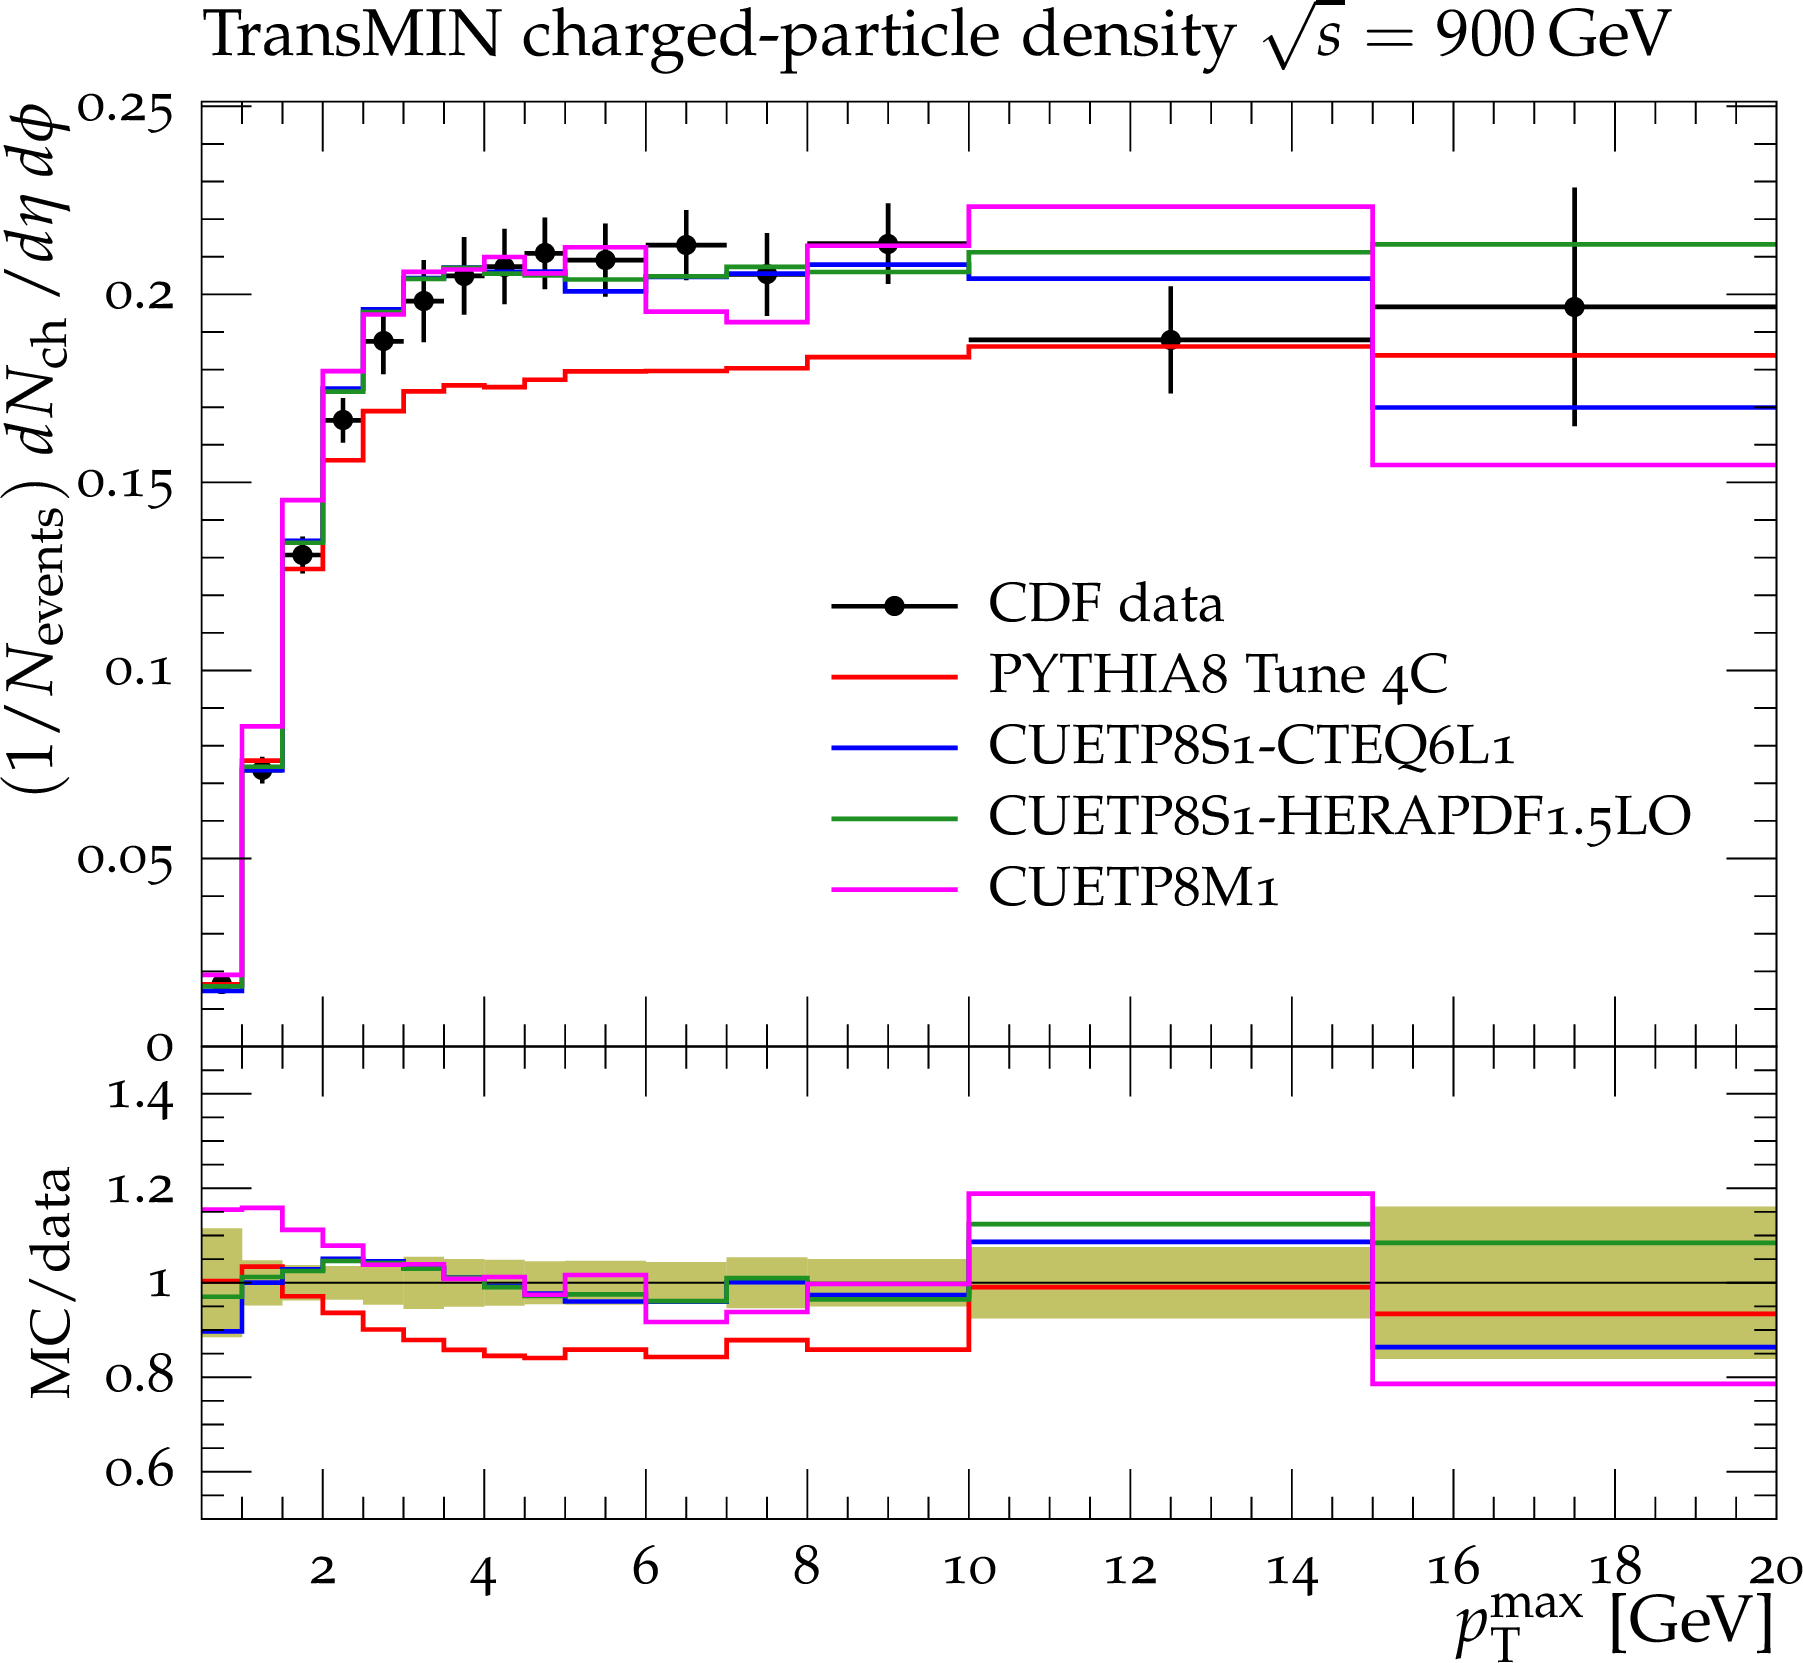
Figure 3-a:
CDF data at $\sqrt {s}=$ 900 GeV[11] on particle (a,b) and $p_{\rm T}^{\rm sum}$ densities (c,d) for charged particles with $p_{\rm T}>$ 0.5 GeV and $|\eta |<$ 0.8 in the TransMIN (a,c) and TransMAX (b,d) regions as defined by the leading charged particle, as a function of the transverse momentum of the leading charged-particle $p_{\rm T}^{\rm max}$. The data are compared to PYTHIA8 Tune 4C, CUETP8S1-CTEQ6L1, CUETP8S1-HERAPDF1.5LO, and CUETP8M1. The ratios of MC events to data are given below each panel. The green bands in the ratios represent the total experimental uncertainties. |

png pdf |
Figure 3-b:
CDF data at $\sqrt {s}=$ 900 GeV[11] on particle (a,b) and $p_{\rm T}^{\rm sum}$ densities (c,d) for charged particles with $p_{\rm T}>$ 0.5 GeV and $|\eta |<$ 0.8 in the TransMIN (a,c) and TransMAX (b,d) regions as defined by the leading charged particle, as a function of the transverse momentum of the leading charged-particle $p_{\rm T}^{\rm max}$. The data are compared to PYTHIA8 Tune 4C, CUETP8S1-CTEQ6L1, CUETP8S1-HERAPDF1.5LO, and CUETP8M1. The ratios of MC events to data are given below each panel. The green bands in the ratios represent the total experimental uncertainties. |
png pdf |
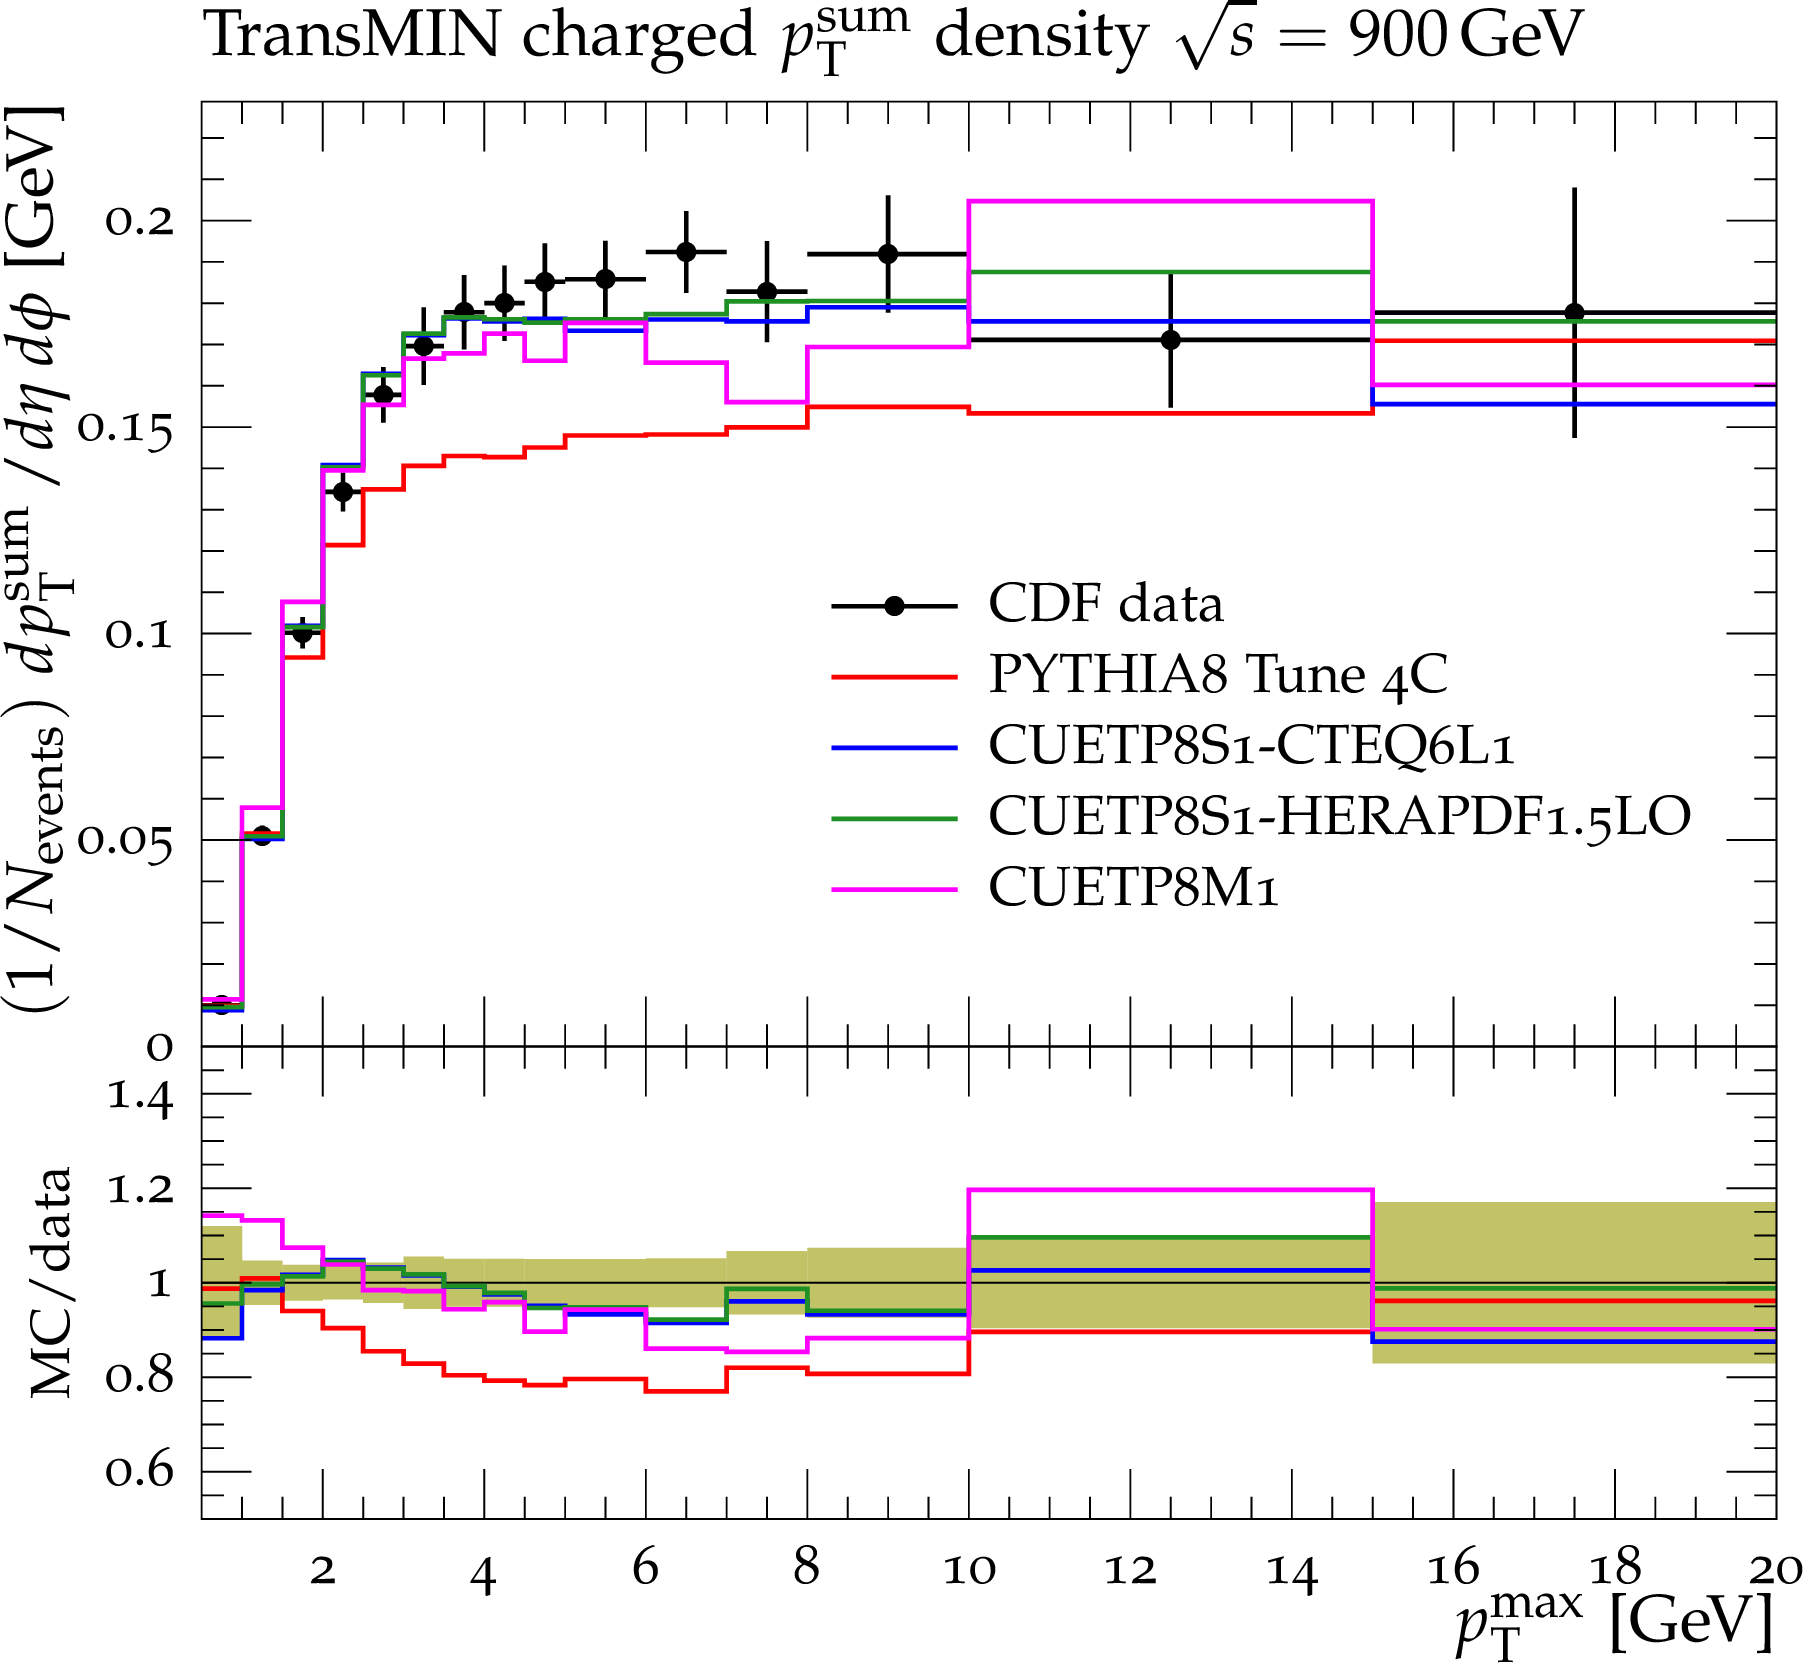
Figure 3-c:
CDF data at $\sqrt {s}=$ 900 GeV[11] on particle (a,b) and $p_{\rm T}^{\rm sum}$ densities (c,d) for charged particles with $p_{\rm T}>$ 0.5 GeV and $|\eta |<$ 0.8 in the TransMIN (a,c) and TransMAX (b,d) regions as defined by the leading charged particle, as a function of the transverse momentum of the leading charged-particle $p_{\rm T}^{\rm max}$. The data are compared to PYTHIA8 Tune 4C, CUETP8S1-CTEQ6L1, CUETP8S1-HERAPDF1.5LO, and CUETP8M1. The ratios of MC events to data are given below each panel. The green bands in the ratios represent the total experimental uncertainties. |
png pdf |
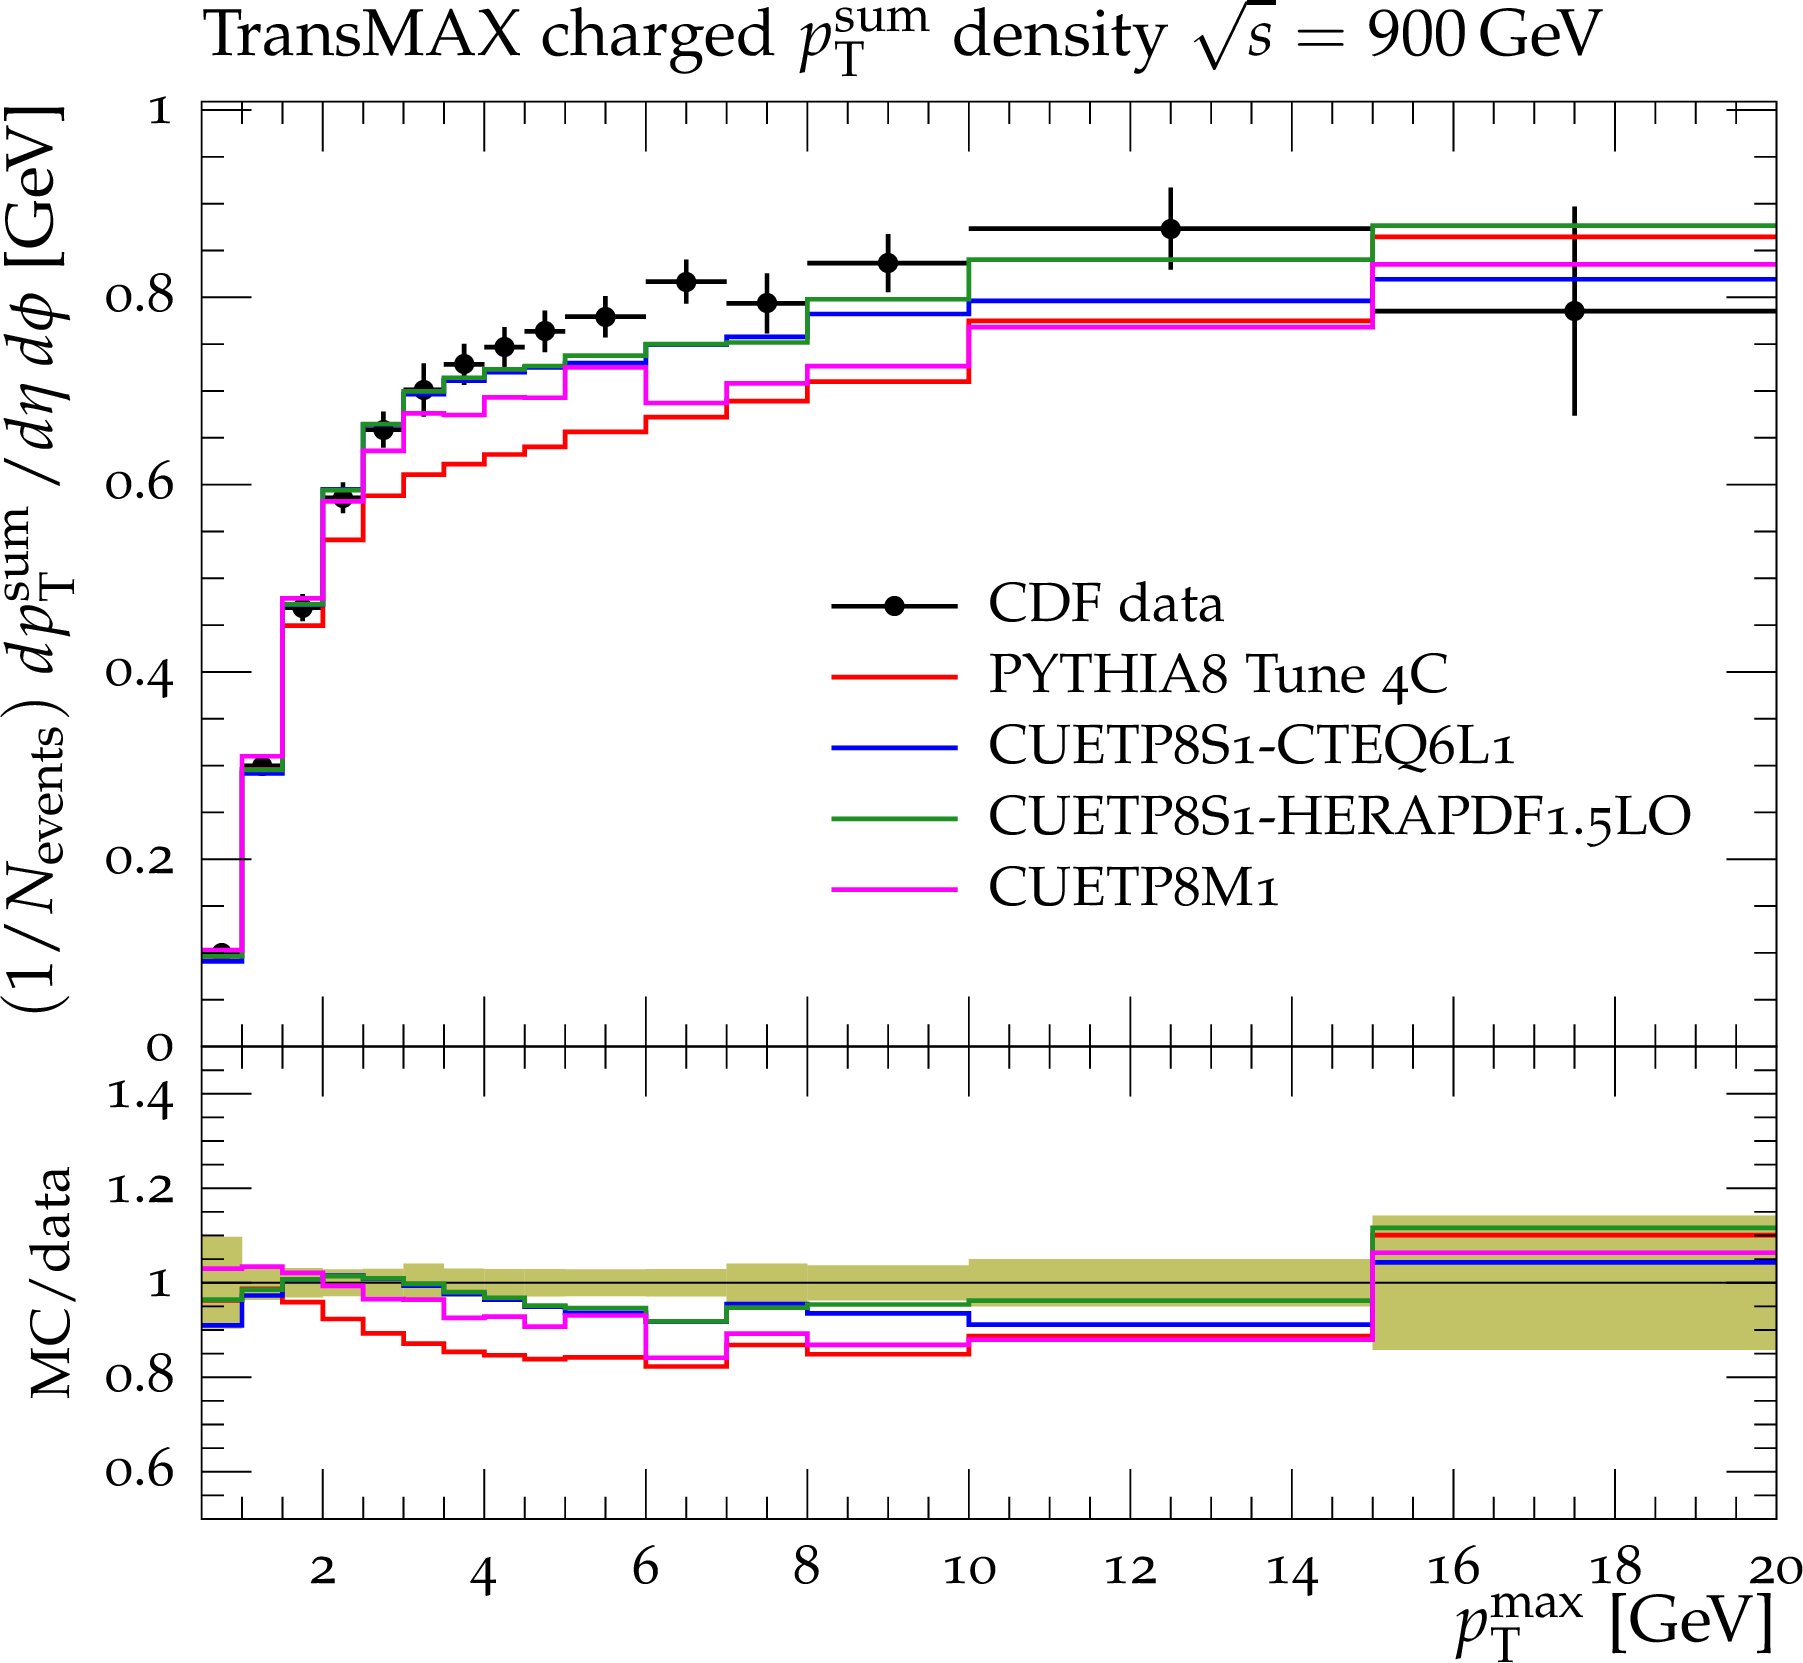
Figure 3-d:
CDF data at $\sqrt {s}=$ 900 GeV[11] on particle (a,b) and $p_{\rm T}^{\rm sum}$ densities (c,d) for charged particles with $p_{\rm T}>$ 0.5 GeV and $|\eta |<$ 0.8 in the TransMIN (a,c) and TransMAX (b,d) regions as defined by the leading charged particle, as a function of the transverse momentum of the leading charged-particle $p_{\rm T}^{\rm max}$. The data are compared to PYTHIA8 Tune 4C, CUETP8S1-CTEQ6L1, CUETP8S1-HERAPDF1.5LO, and CUETP8M1. The ratios of MC events to data are given below each panel. The green bands in the ratios represent the total experimental uncertainties. |
png pdf |
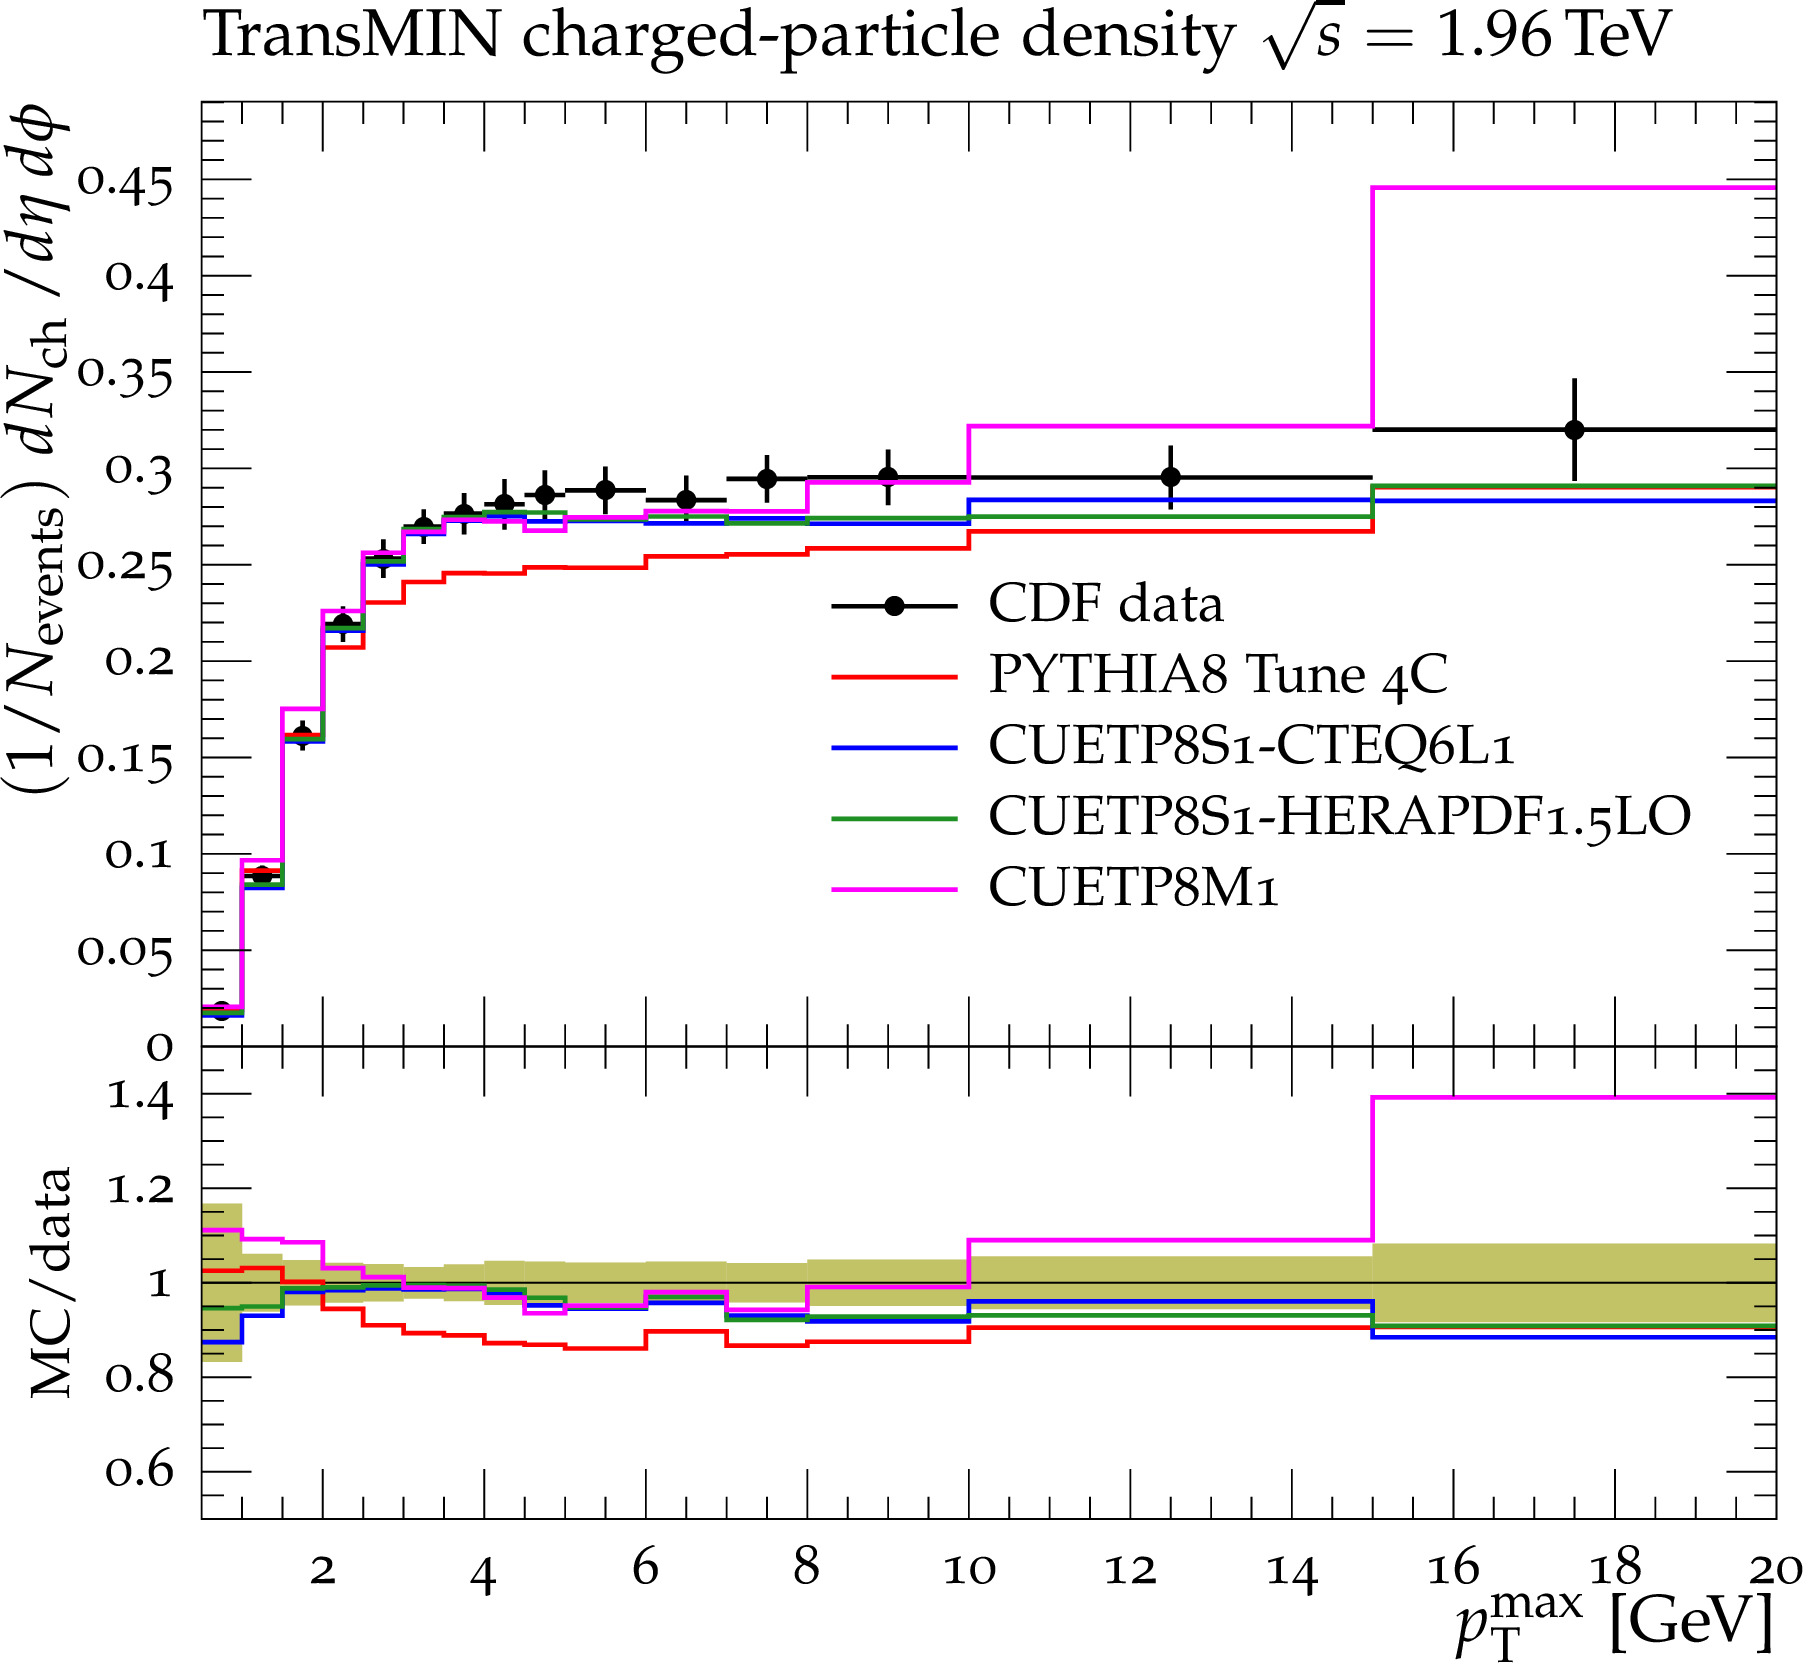
Figure 4-a:
CDF data at $\sqrt {s}= $ 1.96 TeV[11] on particle (a,b) and $p_{\rm T}^{\rm sum}$ densities (c,d) for charged particles with $p_{\rm T}>$ 0.5 GeV and $|\eta |<$ 0.8 in the TransMIN (a,c) and TransMAX (b,d) regions as defined by the leading charged particle, as a function of the transverse momentum of the leading charged-particle $p_{\rm T}^{\rm max}$. The data are compared to PYTHIA8 Tune 4C, CUETP8S1-CTEQ6L1, CUETP8S1-HERAPDF1.5LO, and CUETP8M1. The ratios of MC events to data are given below each panel. The green bands in the ratios represent the total experimental uncertainties. |
png pdf |
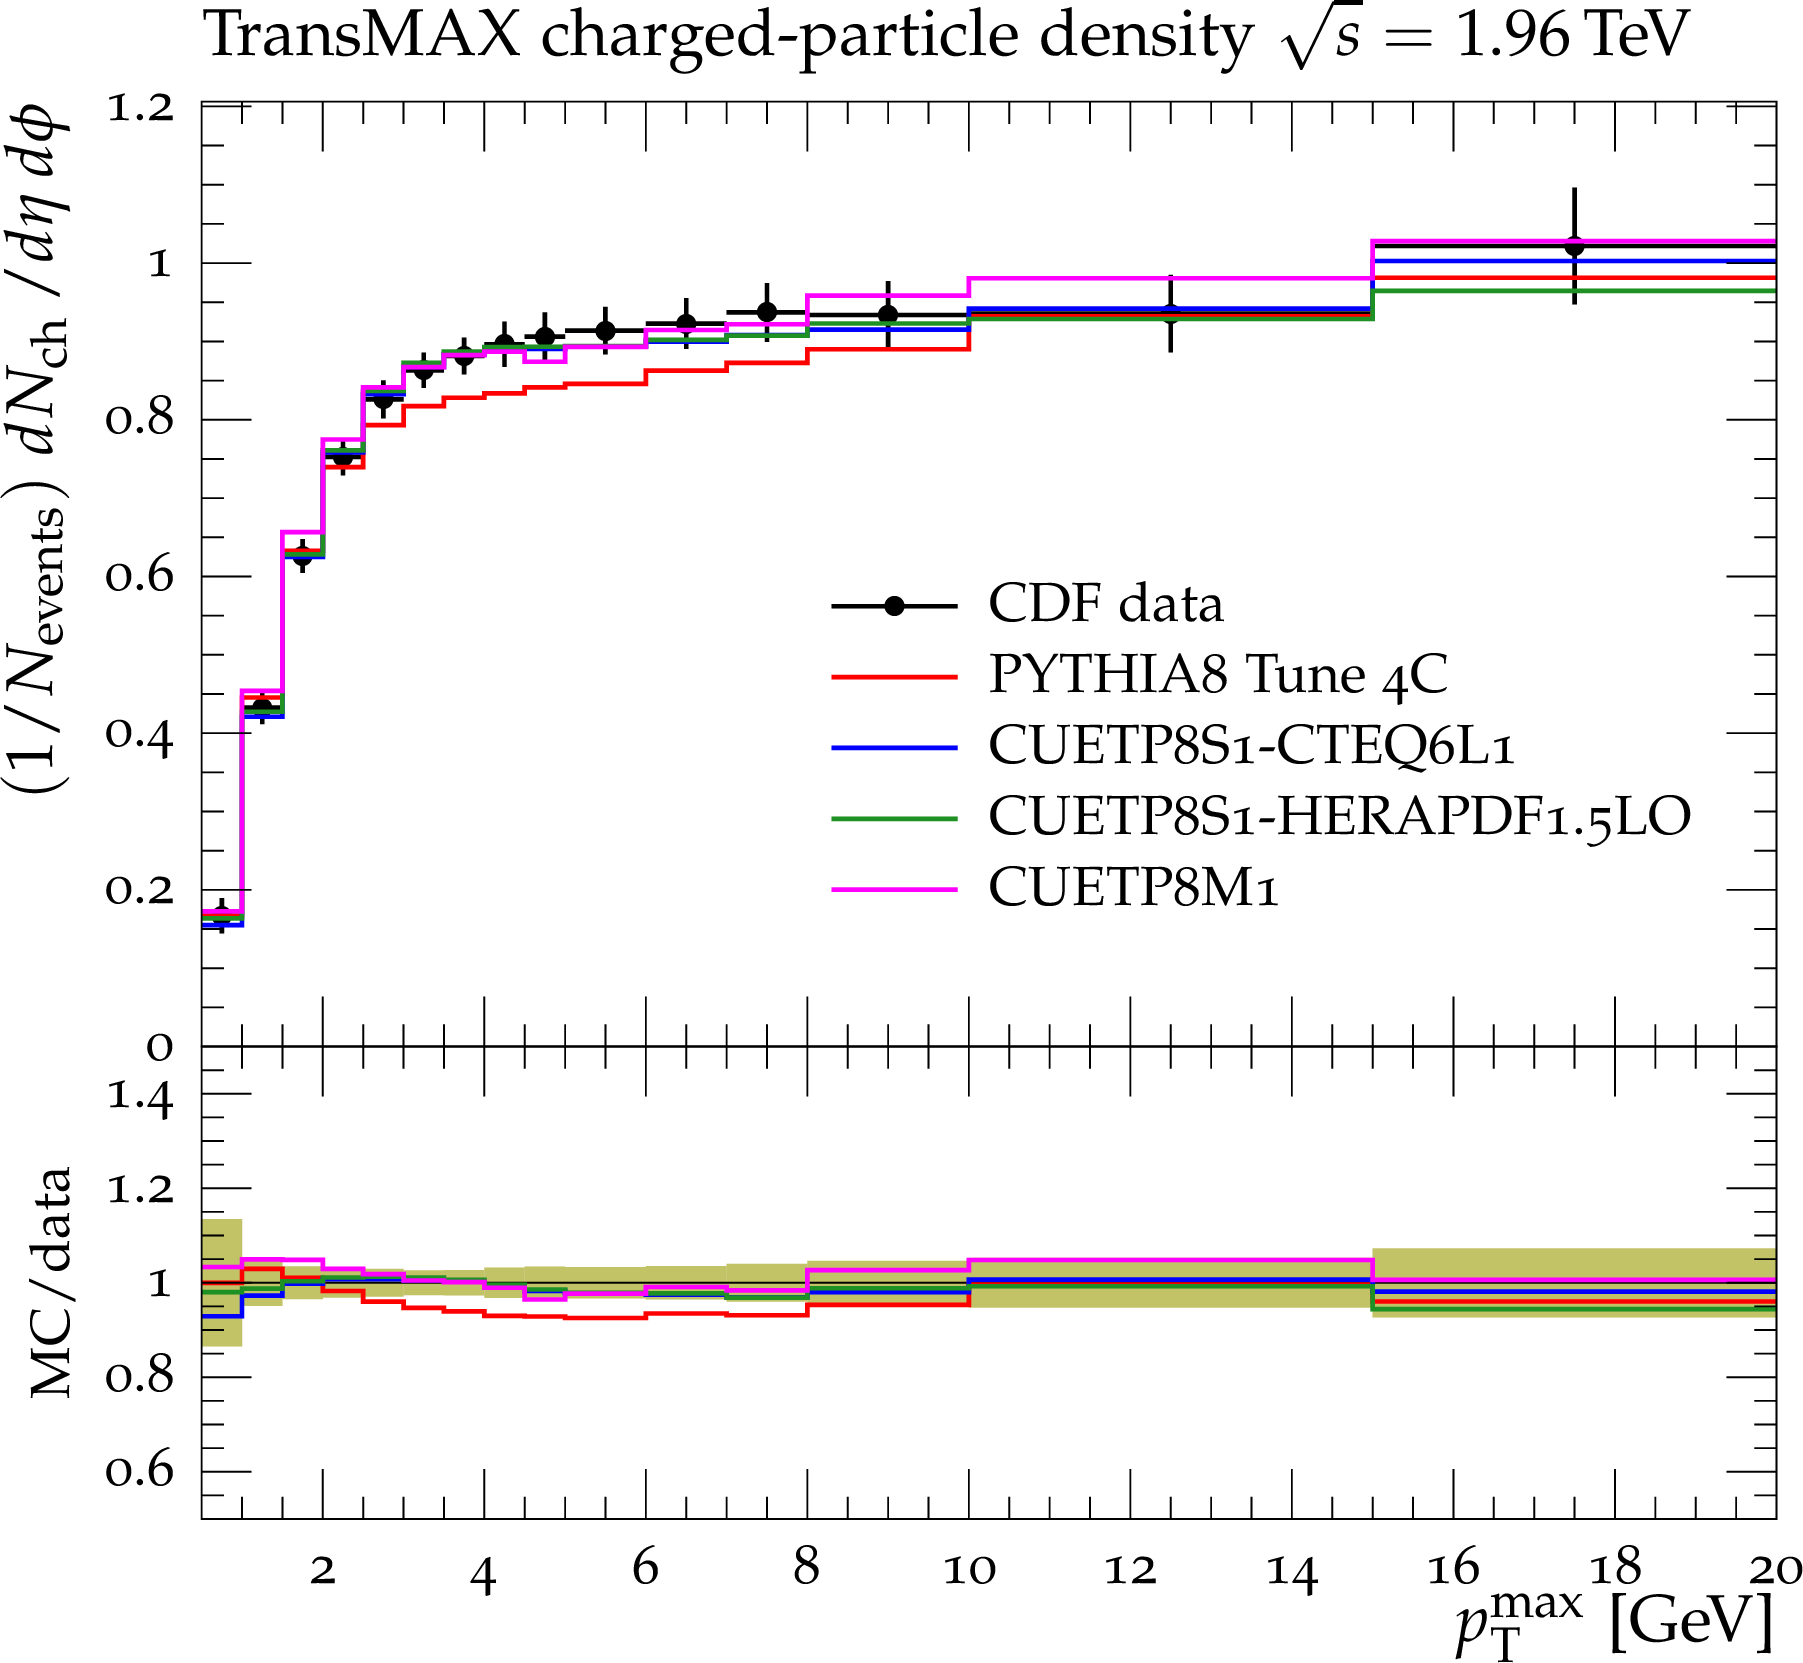
Figure 4-b:
CDF data at $\sqrt {s}= $ 1.96 TeV[11] on particle (a,b) and $p_{\rm T}^{\rm sum}$ densities (c,d) for charged particles with $p_{\rm T}>$ 0.5 GeV and $|\eta |<$ 0.8 in the TransMIN (a,c) and TransMAX (b,d) regions as defined by the leading charged particle, as a function of the transverse momentum of the leading charged-particle $p_{\rm T}^{\rm max}$. The data are compared to PYTHIA8 Tune 4C, CUETP8S1-CTEQ6L1, CUETP8S1-HERAPDF1.5LO, and CUETP8M1. The ratios of MC events to data are given below each panel. The green bands in the ratios represent the total experimental uncertainties. |
png pdf |
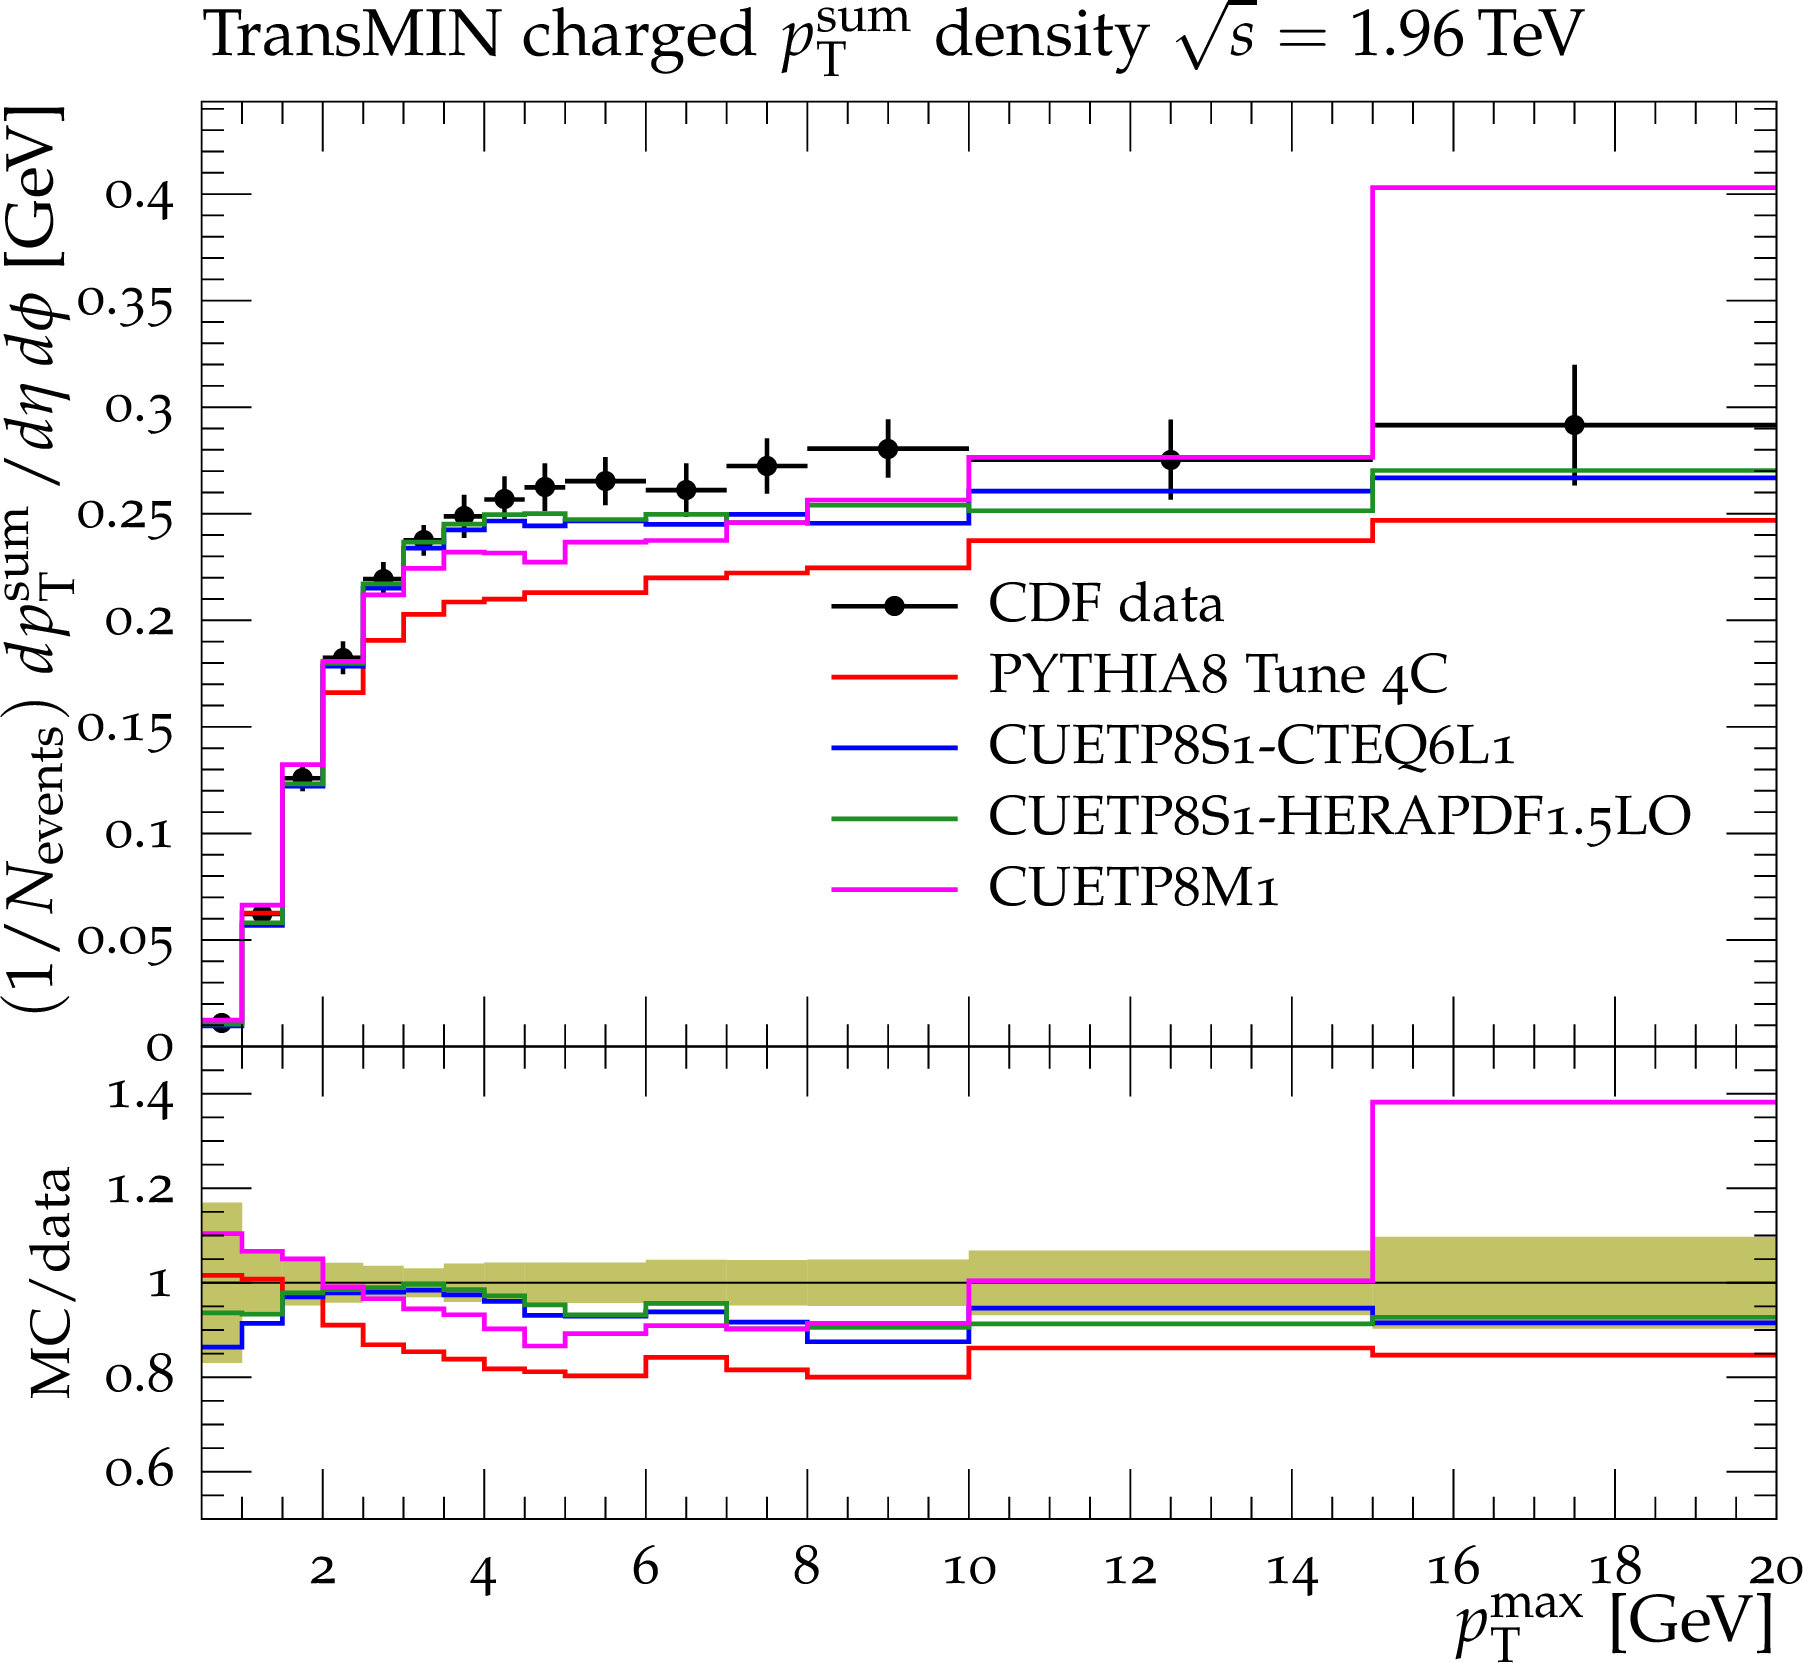
Figure 4-c:
CDF data at $\sqrt {s}= $ 1.96 TeV[11] on particle (a,b) and $p_{\rm T}^{\rm sum}$ densities (c,d) for charged particles with $p_{\rm T}>$ 0.5 GeV and $|\eta |<$ 0.8 in the TransMIN (a,c) and TransMAX (b,d) regions as defined by the leading charged particle, as a function of the transverse momentum of the leading charged-particle $p_{\rm T}^{\rm max}$. The data are compared to PYTHIA8 Tune 4C, CUETP8S1-CTEQ6L1, CUETP8S1-HERAPDF1.5LO, and CUETP8M1. The ratios of MC events to data are given below each panel. The green bands in the ratios represent the total experimental uncertainties. |
png pdf |
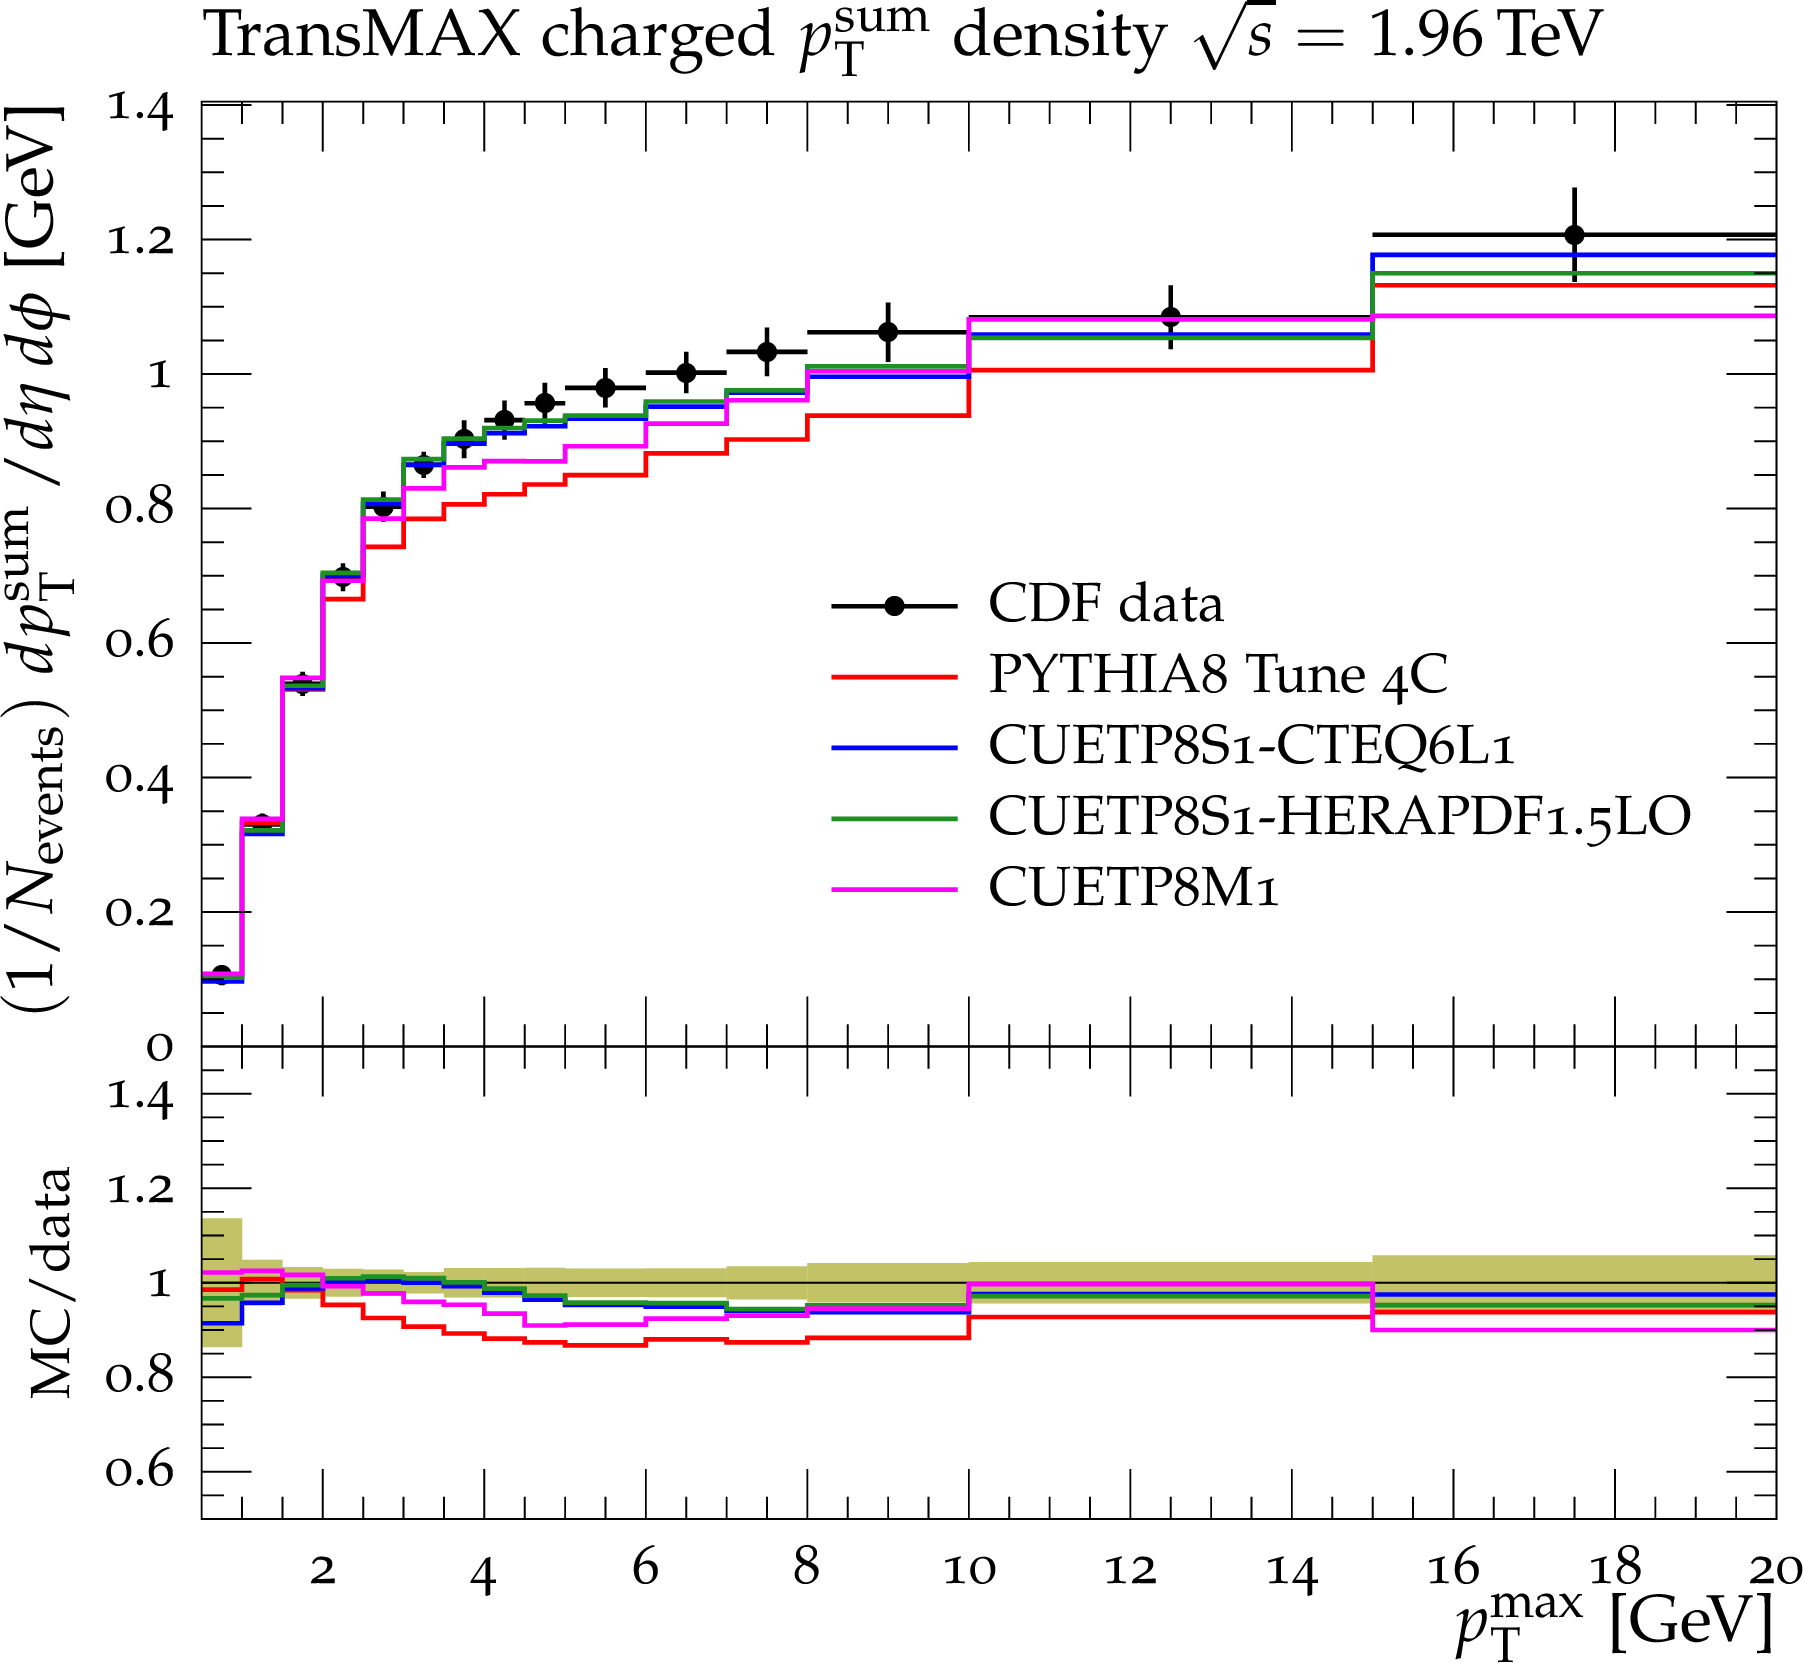
Figure 4-d:
CDF data at $\sqrt {s}= $ 1.96 TeV[11] on particle (a,b) and $p_{\rm T}^{\rm sum}$ densities (c,d) for charged particles with $p_{\rm T}>$ 0.5 GeV and $|\eta |<$ 0.8 in the TransMIN (a,c) and TransMAX (b,d) regions as defined by the leading charged particle, as a function of the transverse momentum of the leading charged-particle $p_{\rm T}^{\rm max}$. The data are compared to PYTHIA8 Tune 4C, CUETP8S1-CTEQ6L1, CUETP8S1-HERAPDF1.5LO, and CUETP8M1. The ratios of MC events to data are given below each panel. The green bands in the ratios represent the total experimental uncertainties. |
png pdf |
Figure 5-a:
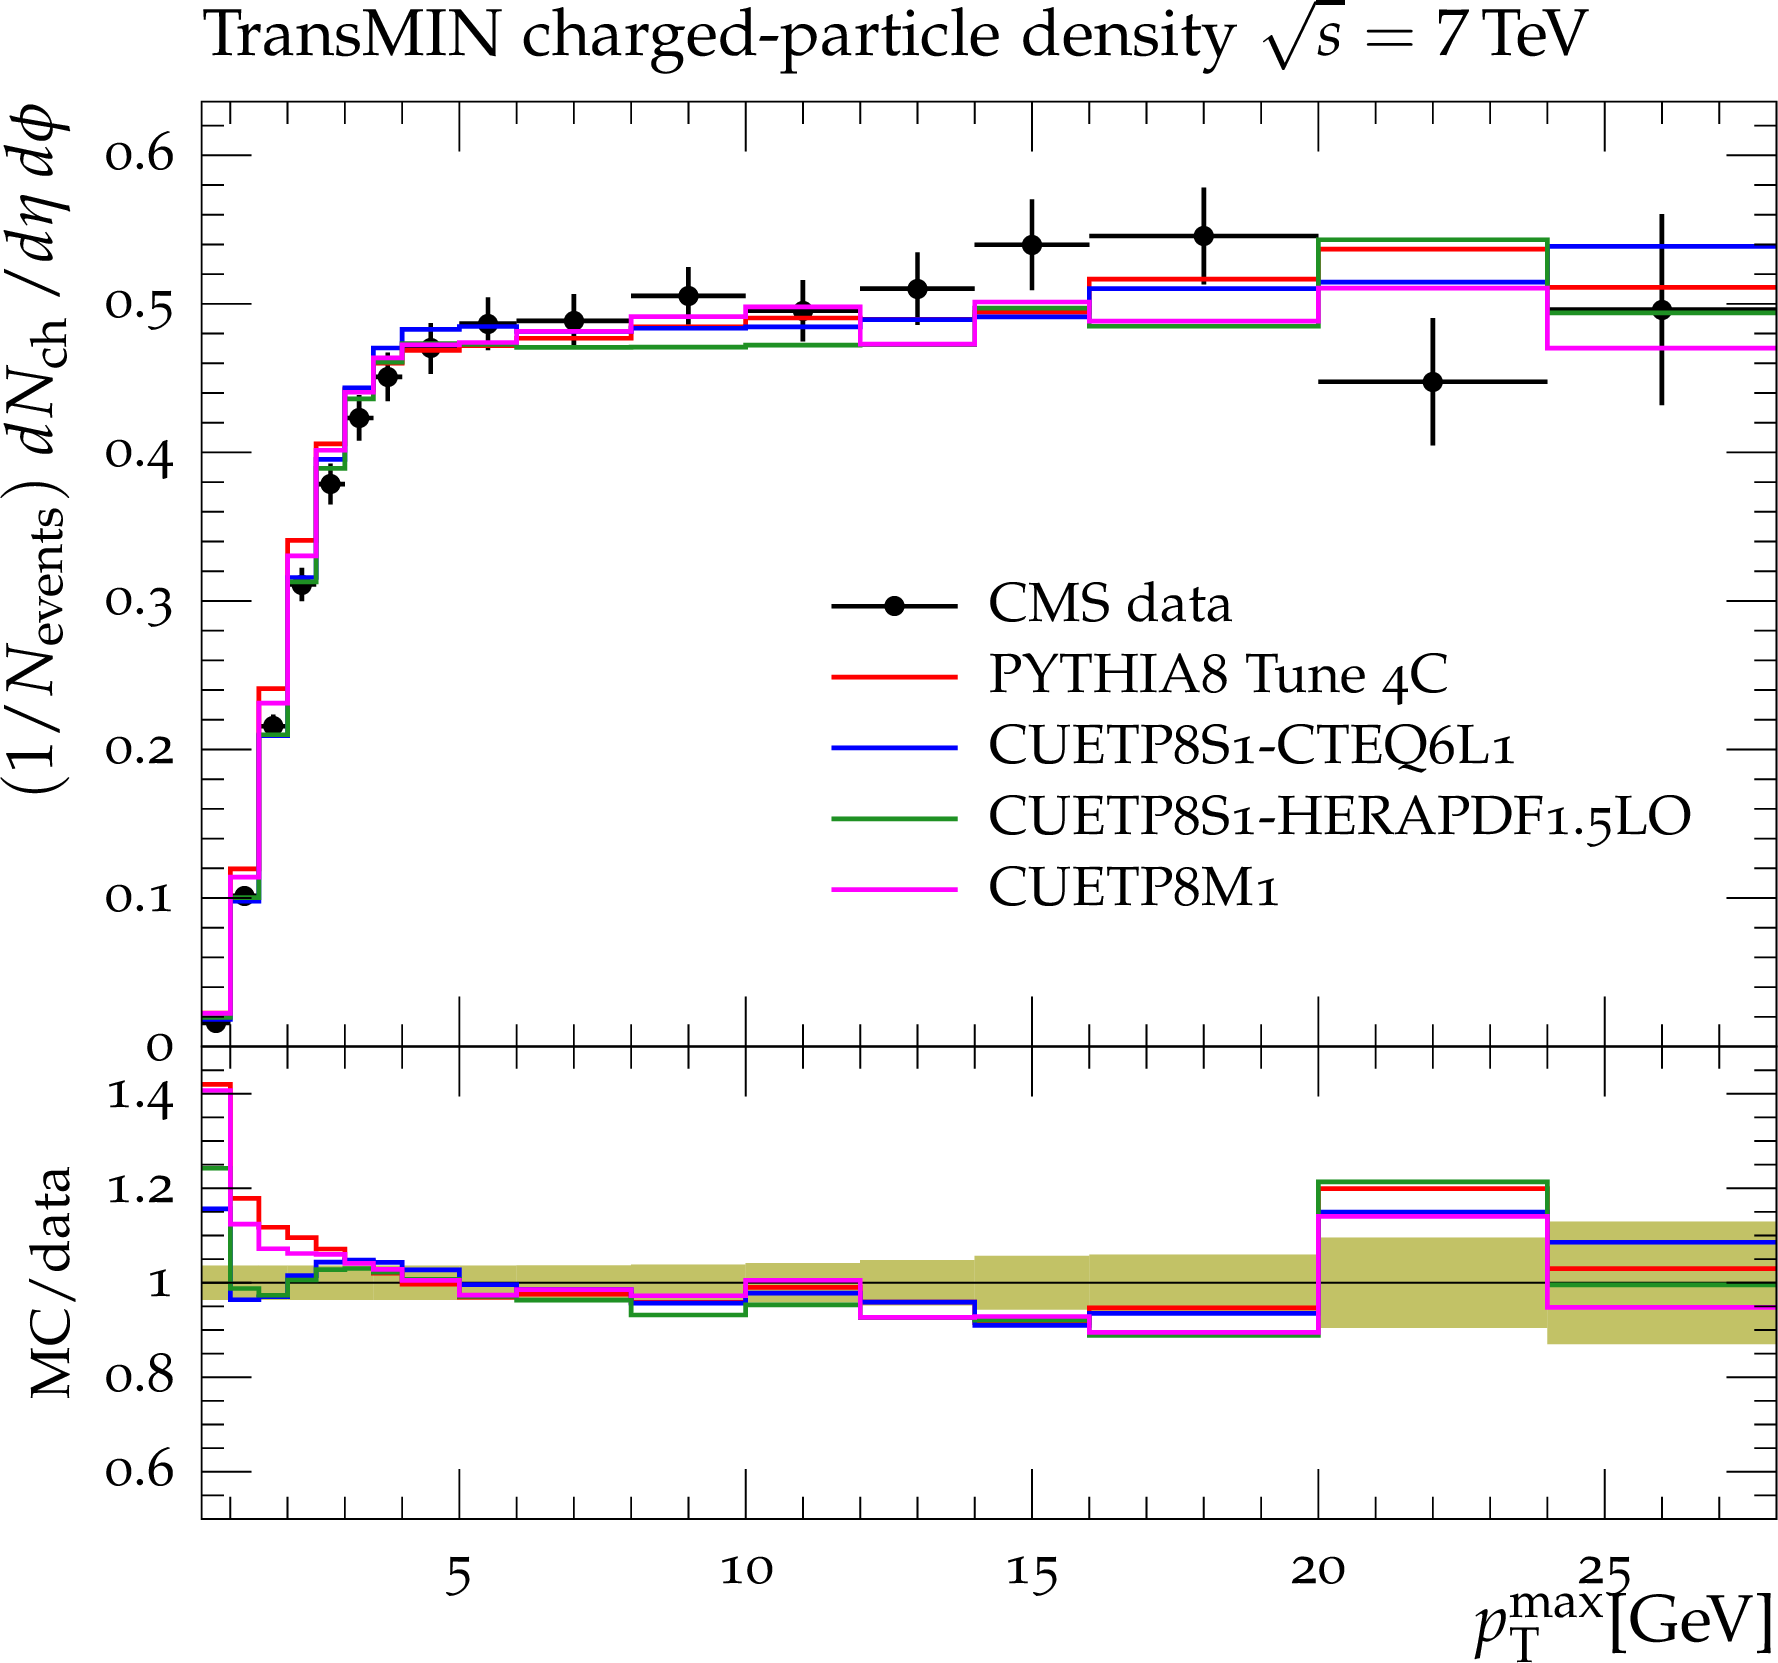
CMS data at $\sqrt {s}=$ 7 TeV[17] on particle (a,b) and $p_{\rm T}^{\rm sum}$ densities (c,d) for charged particles with $p_{\rm T}>0.5$ GeV\ and $|\eta |<0.8$ in the TransMIN (a,c) and TransMAX (b,d) regions as defined by the leading charged particle, as a function of the transverse momentum of the leading charged-particle $p_{\rm T}^{\rm max}$. The data are compared to PYTHIA8 Tune 4C, and CUETP8S1-CTEQ6L1, CUETP8S1-HERAPDF1.5LO, and CUETP8M1. The ratios of MC events to data are given below each panel. The green bands in the ratios represent the total experimental uncertainties. |
png pdf |
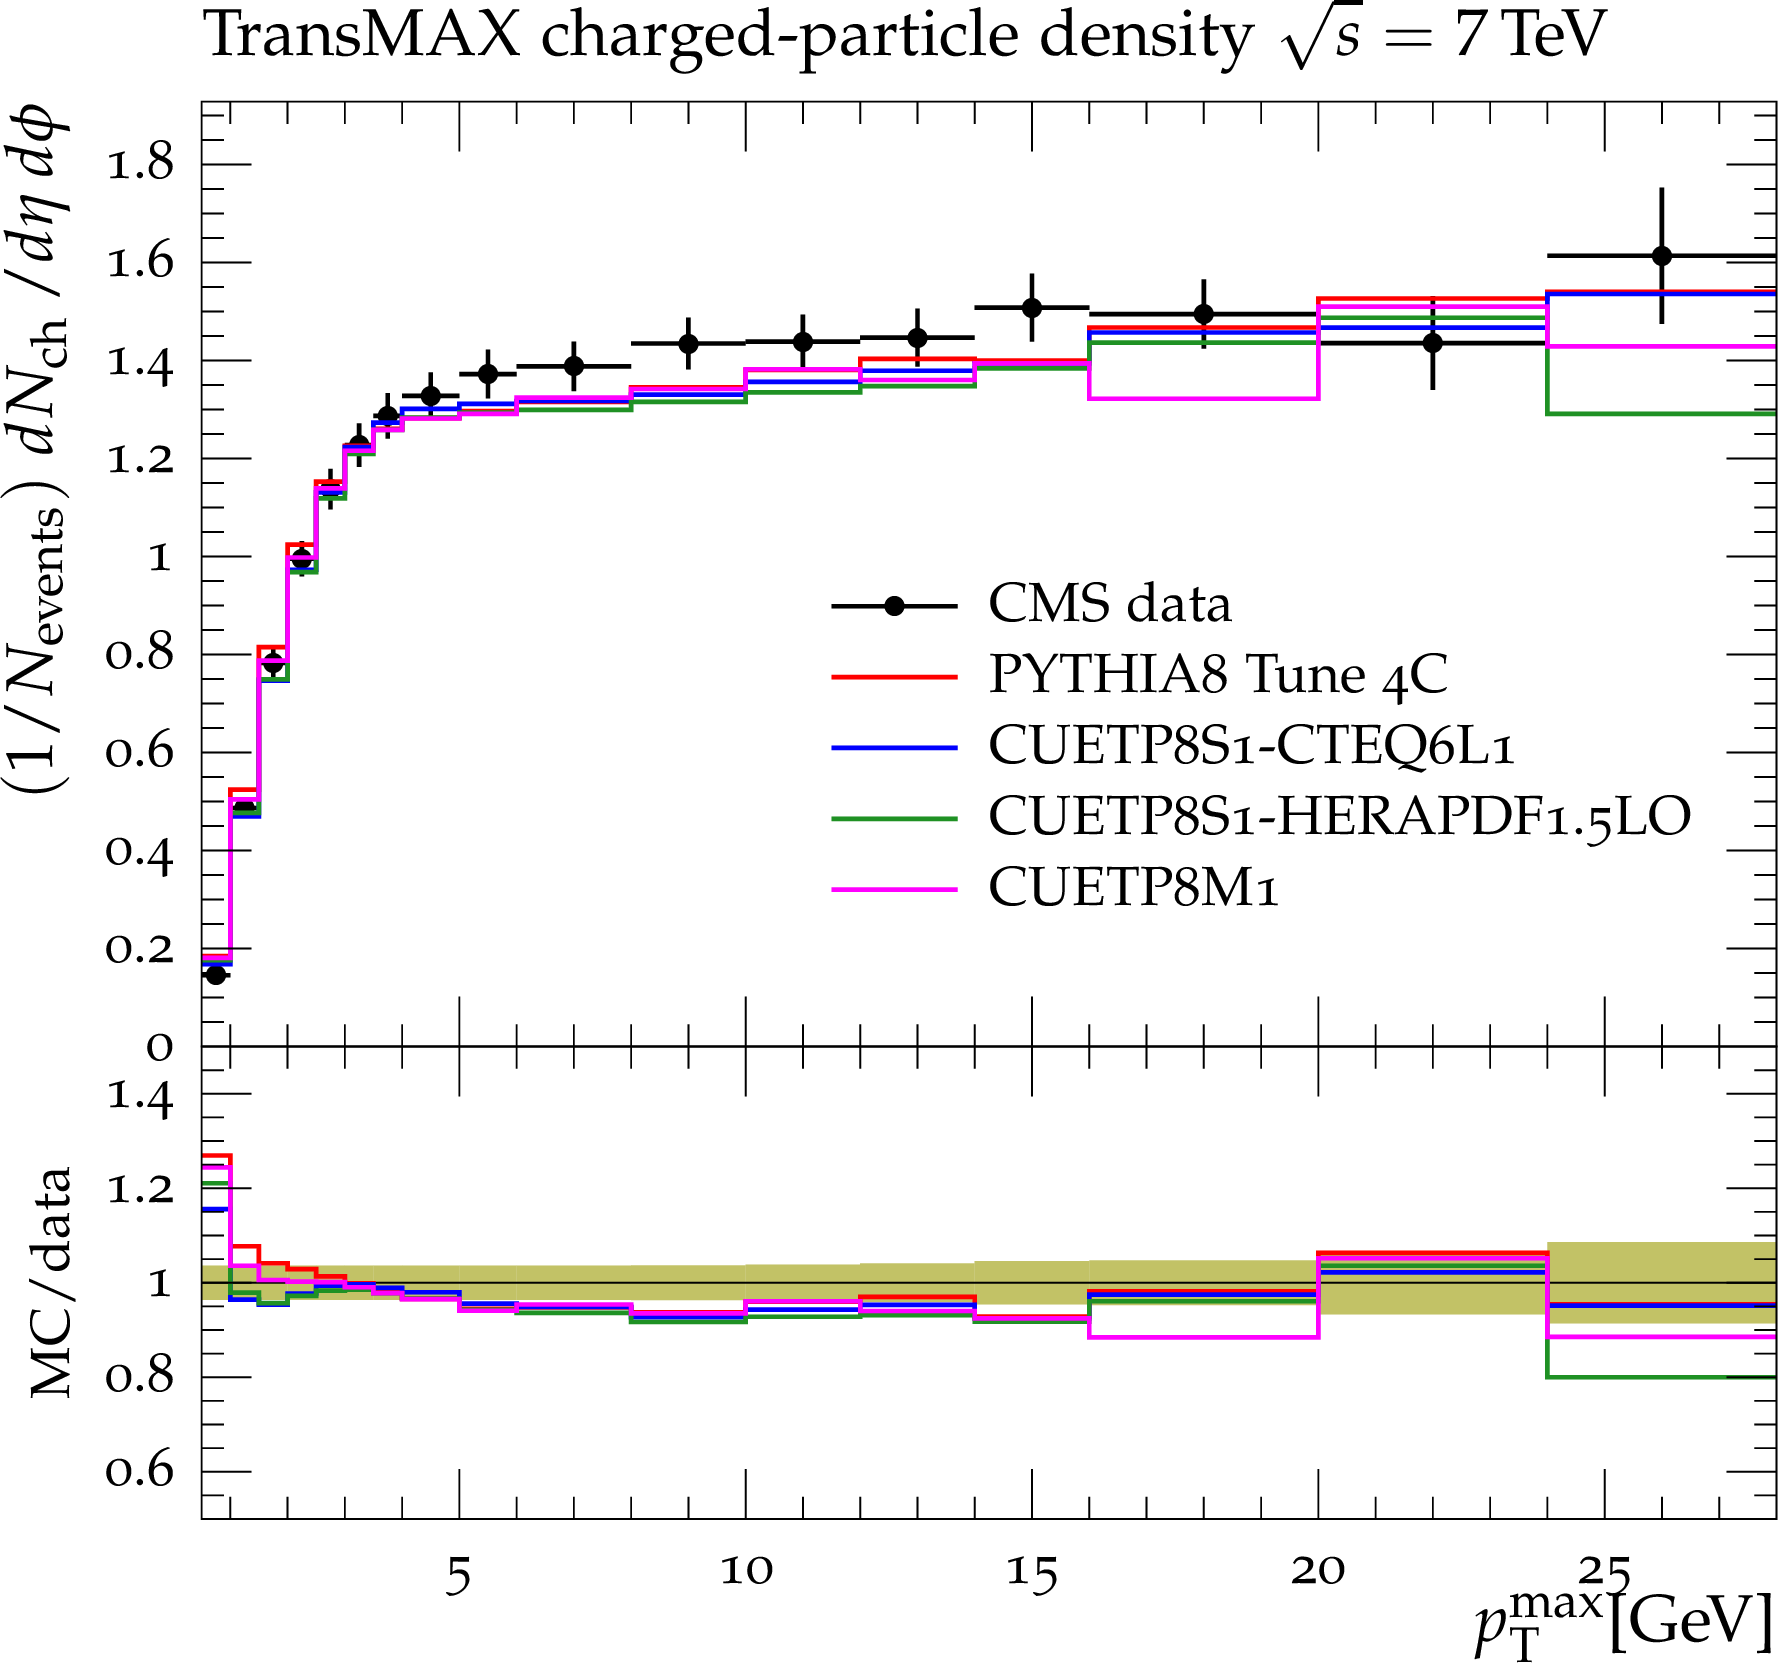
Figure 5-b:
CMS data at $\sqrt {s}=$ 7 TeV[17] on particle (a,b) and $p_{\rm T}^{\rm sum}$ densities (c,d) for charged particles with $p_{\rm T}>0.5$ GeV\ and $|\eta |<0.8$ in the TransMIN (a,c) and TransMAX (b,d) regions as defined by the leading charged particle, as a function of the transverse momentum of the leading charged-particle $p_{\rm T}^{\rm max}$. The data are compared to PYTHIA8 Tune 4C, and CUETP8S1-CTEQ6L1, CUETP8S1-HERAPDF1.5LO, and CUETP8M1. The ratios of MC events to data are given below each panel. The green bands in the ratios represent the total experimental uncertainties. |

png pdf |
Figure 5-c:
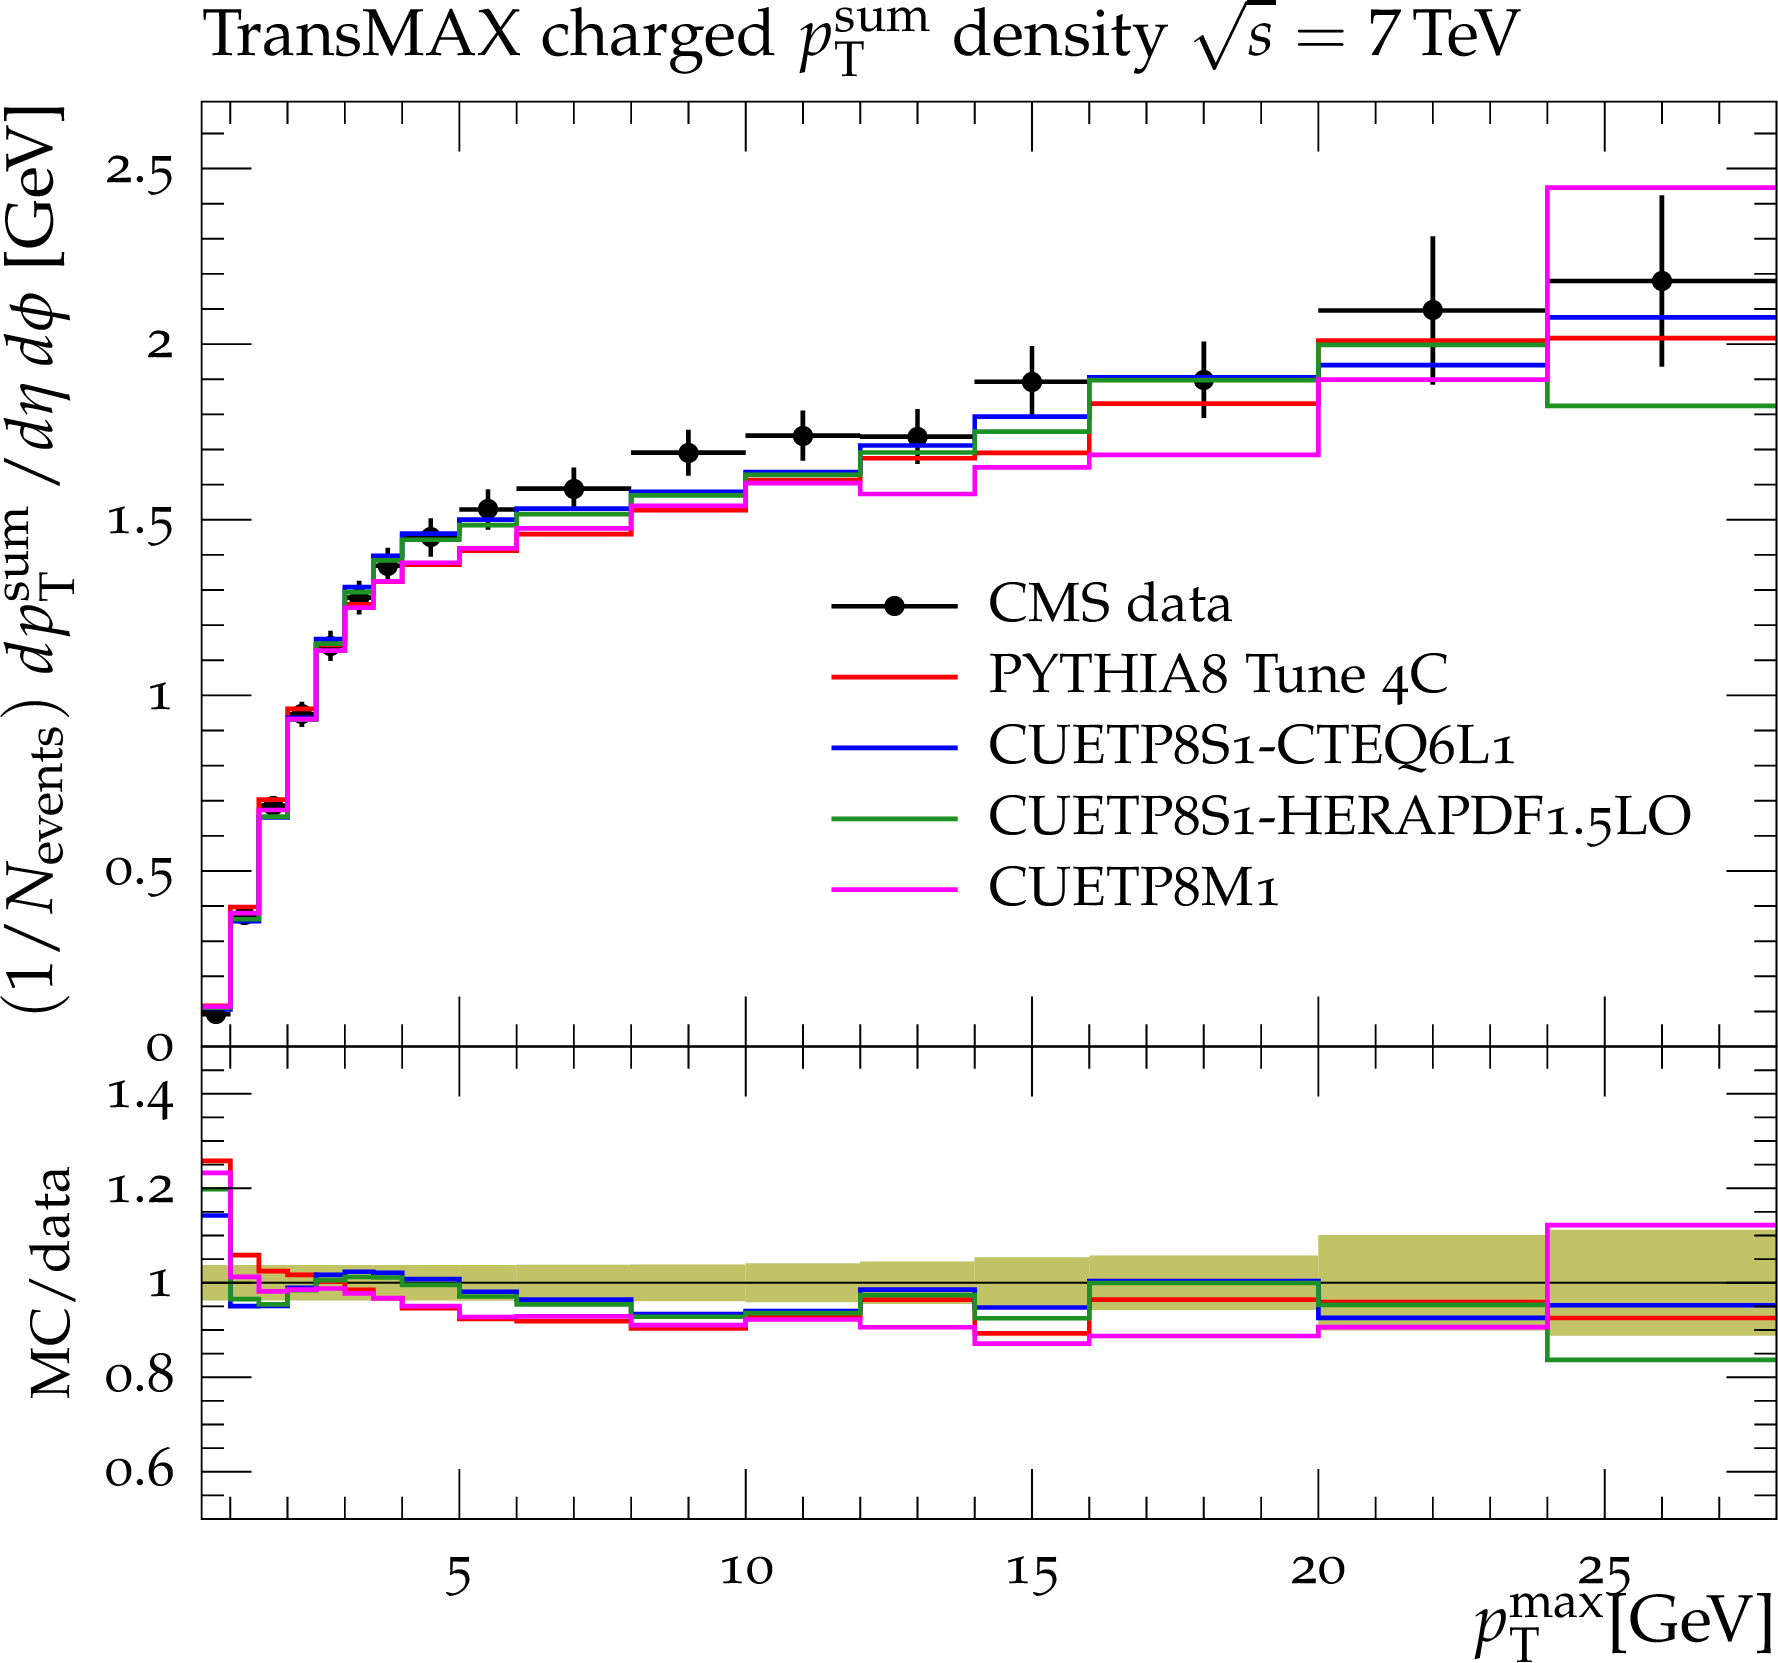
CMS data at $\sqrt {s}=$ 7 TeV[17] on particle (a,b) and $p_{\rm T}^{\rm sum}$ densities (c,d) for charged particles with $p_{\rm T}>0.5$ GeV\ and $|\eta |<0.8$ in the TransMIN (a,c) and TransMAX (b,d) regions as defined by the leading charged particle, as a function of the transverse momentum of the leading charged-particle $p_{\rm T}^{\rm max}$. The data are compared to PYTHIA8 Tune 4C, and CUETP8S1-CTEQ6L1, CUETP8S1-HERAPDF1.5LO, and CUETP8M1. The ratios of MC events to data are given below each panel. The green bands in the ratios represent the total experimental uncertainties. |
png pdf |
Figure 5-d:
CMS data at $\sqrt {s}=$ 7 TeV[17] on particle (a,b) and $p_{\rm T}^{\rm sum}$ densities (c,d) for charged particles with $p_{\rm T}>0.5$ GeV\ and $|\eta |<0.8$ in the TransMIN (a,c) and TransMAX (b,d) regions as defined by the leading charged particle, as a function of the transverse momentum of the leading charged-particle $p_{\rm T}^{\rm max}$. The data are compared to PYTHIA8 Tune 4C, and CUETP8S1-CTEQ6L1, CUETP8S1-HERAPDF1.5LO, and CUETP8M1. The ratios of MC events to data are given below each panel. The green bands in the ratios represent the total experimental uncertainties. |

png pdf |
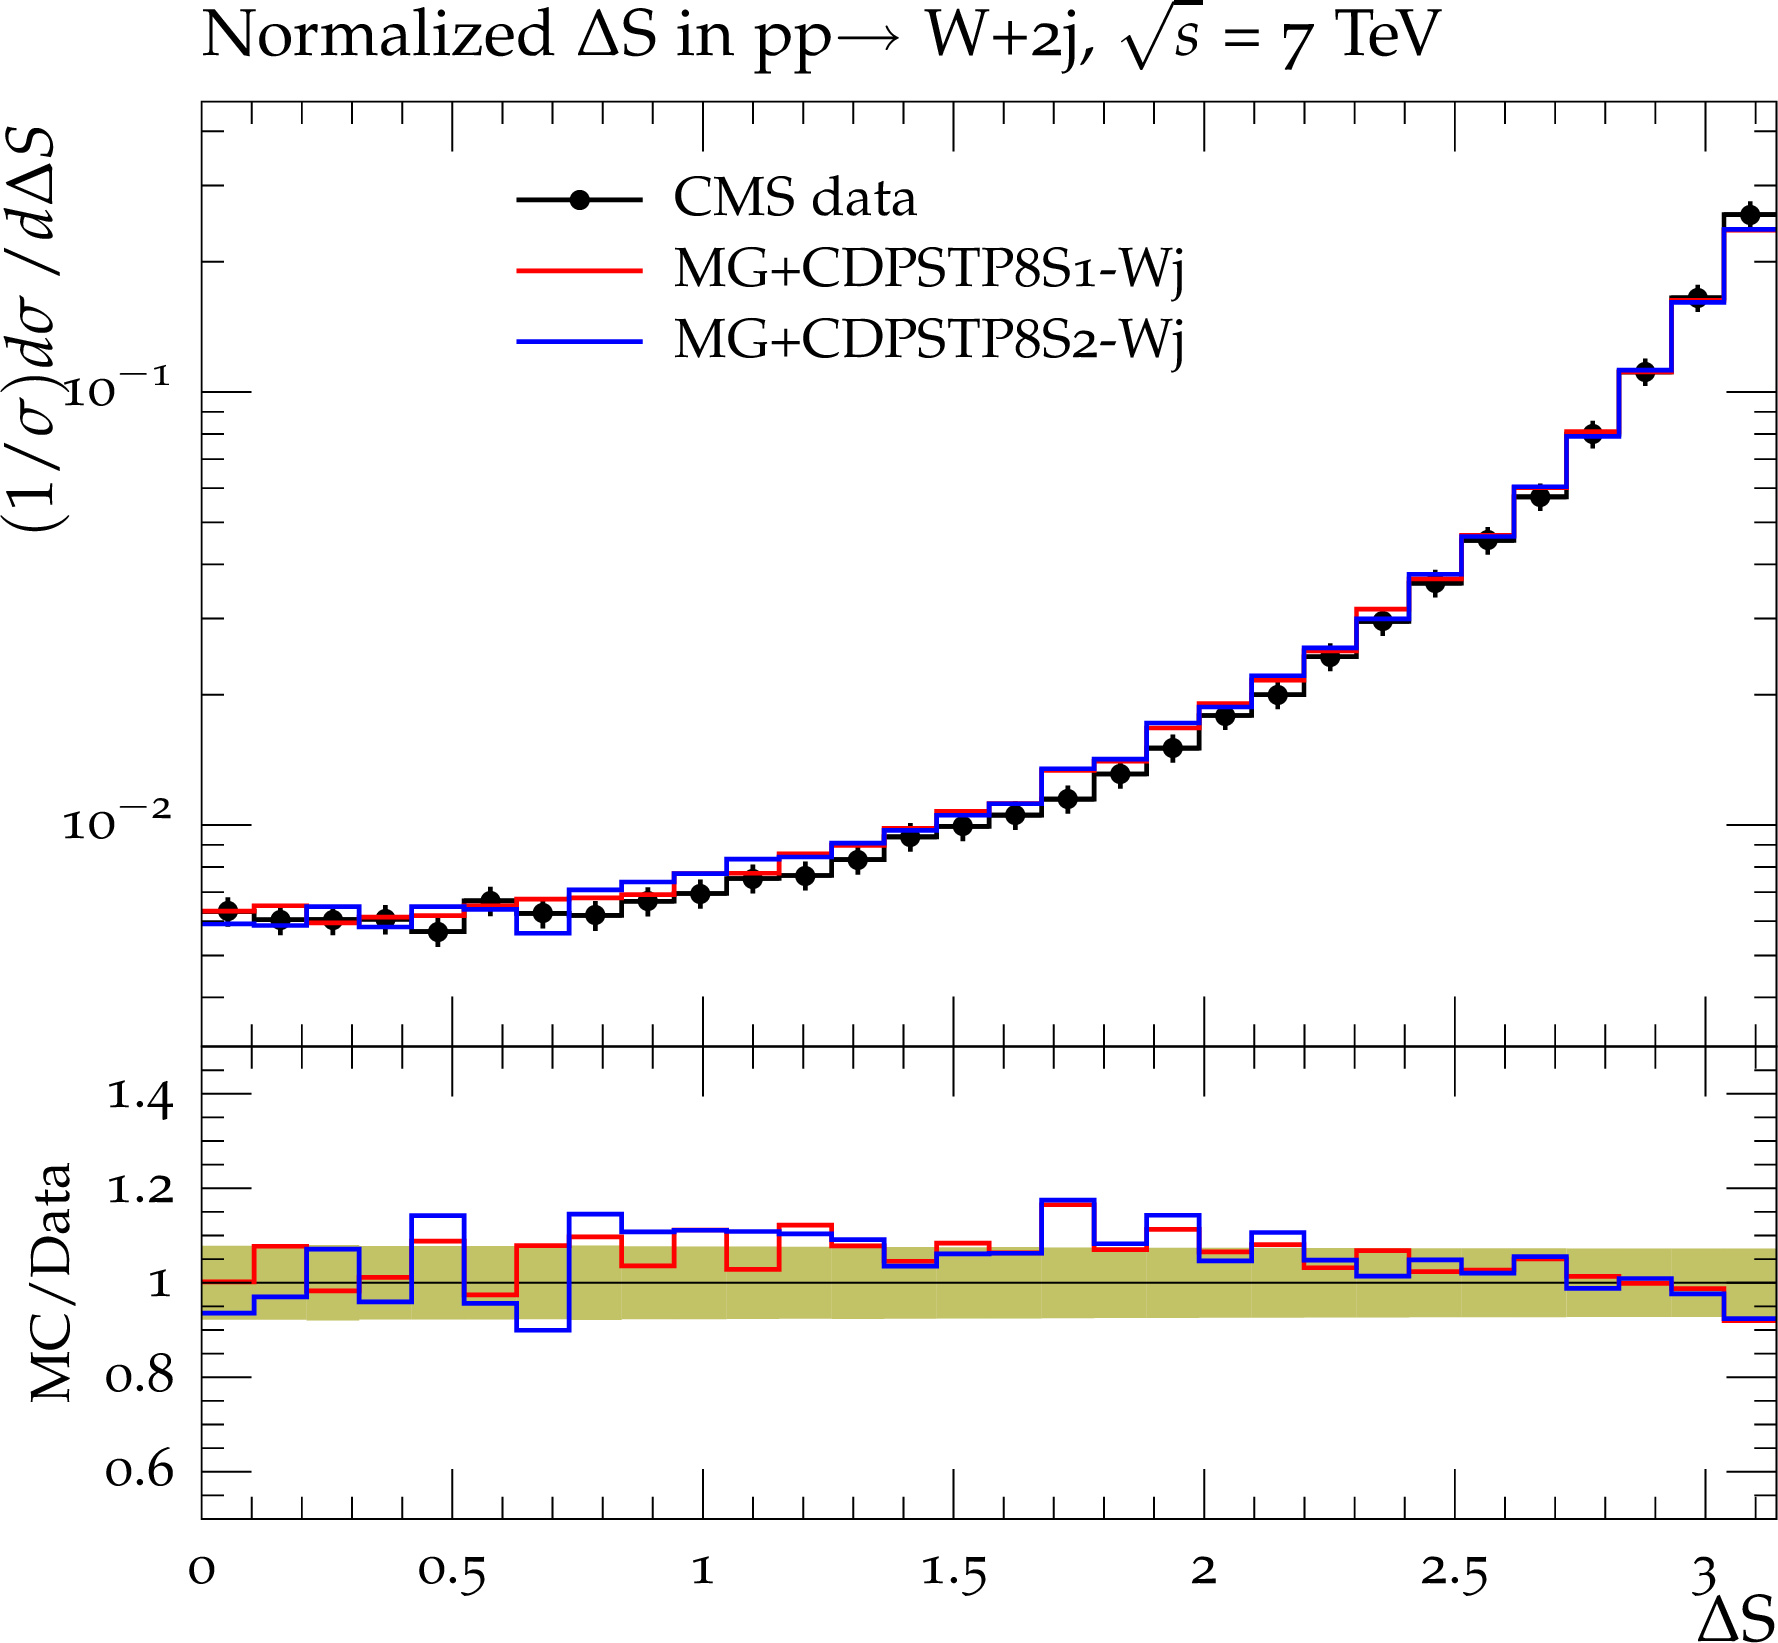
Figure 6-a:
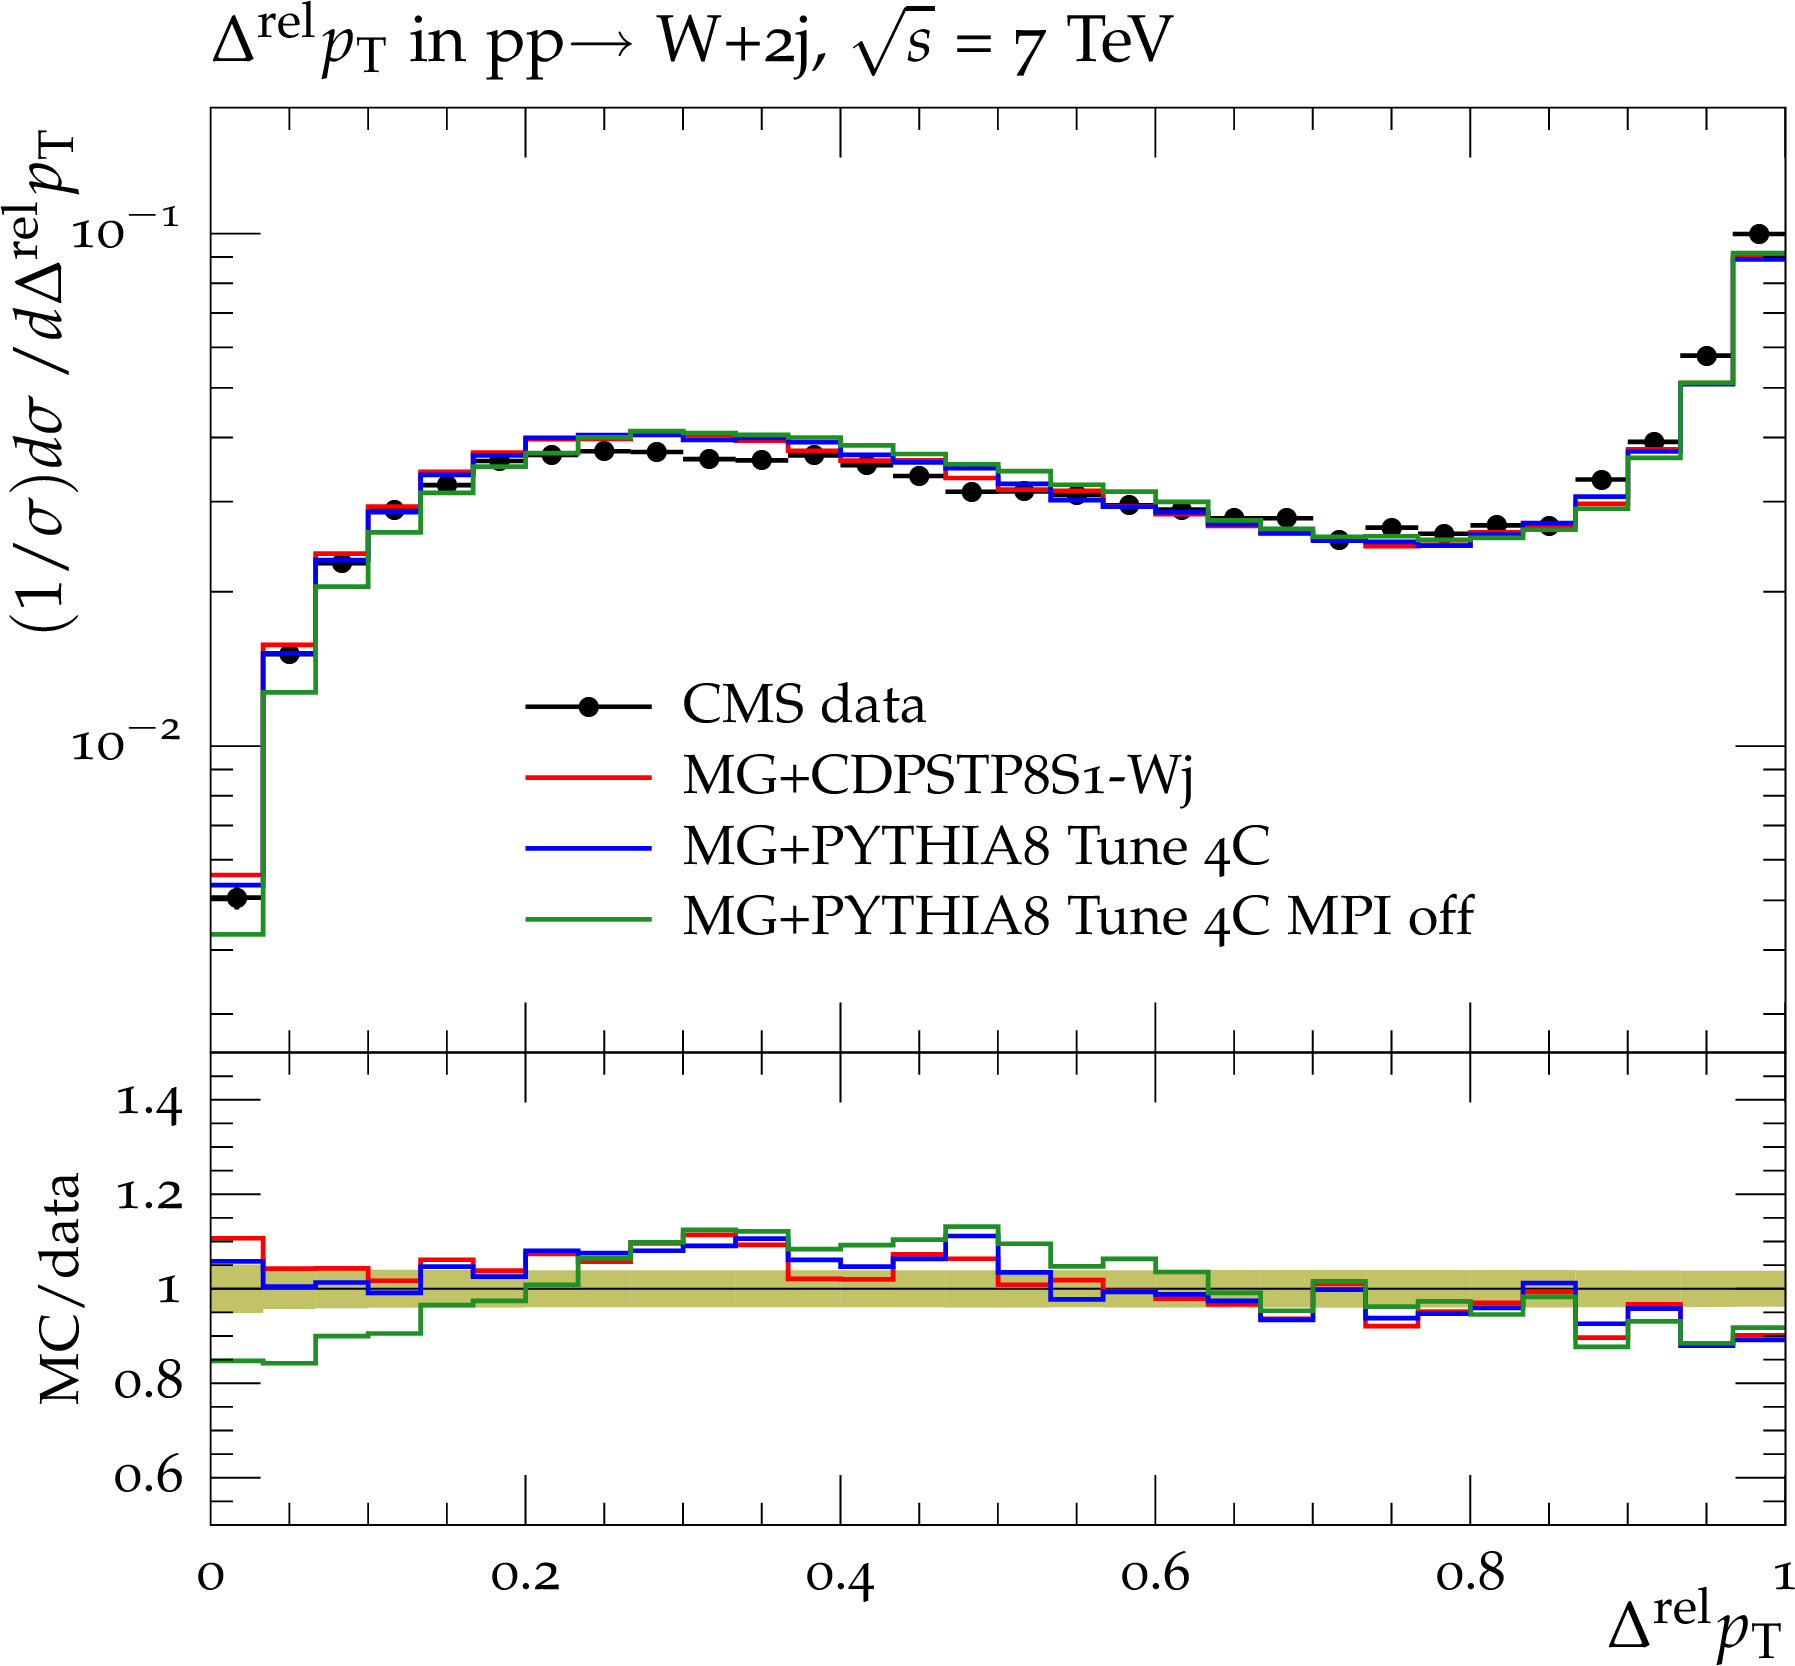
CMS data at $\sqrt {s}=$ 7 TeV[36] for the normalized distributions of the correlation observables $\Delta $S (a,c), and $\Delta ^{\rm rel}p_{\rm T}$ (b,d) in the W+dijet channel, compared to MadGraph (MG) interfaced to: PYTHIA8 Tune 4C, Tune 4C with no MPI, and the CMS PYTHIA8 DPS partial CDPSTP8S1-Wj (top); and CDPSTP8S1-Wj, and CDPSTP8S2-Wj (c,d). The bottom panels of each plot show the ratios of these tunes to the data, and the green bands around unity represent the total experimental uncertainty. |
png pdf |
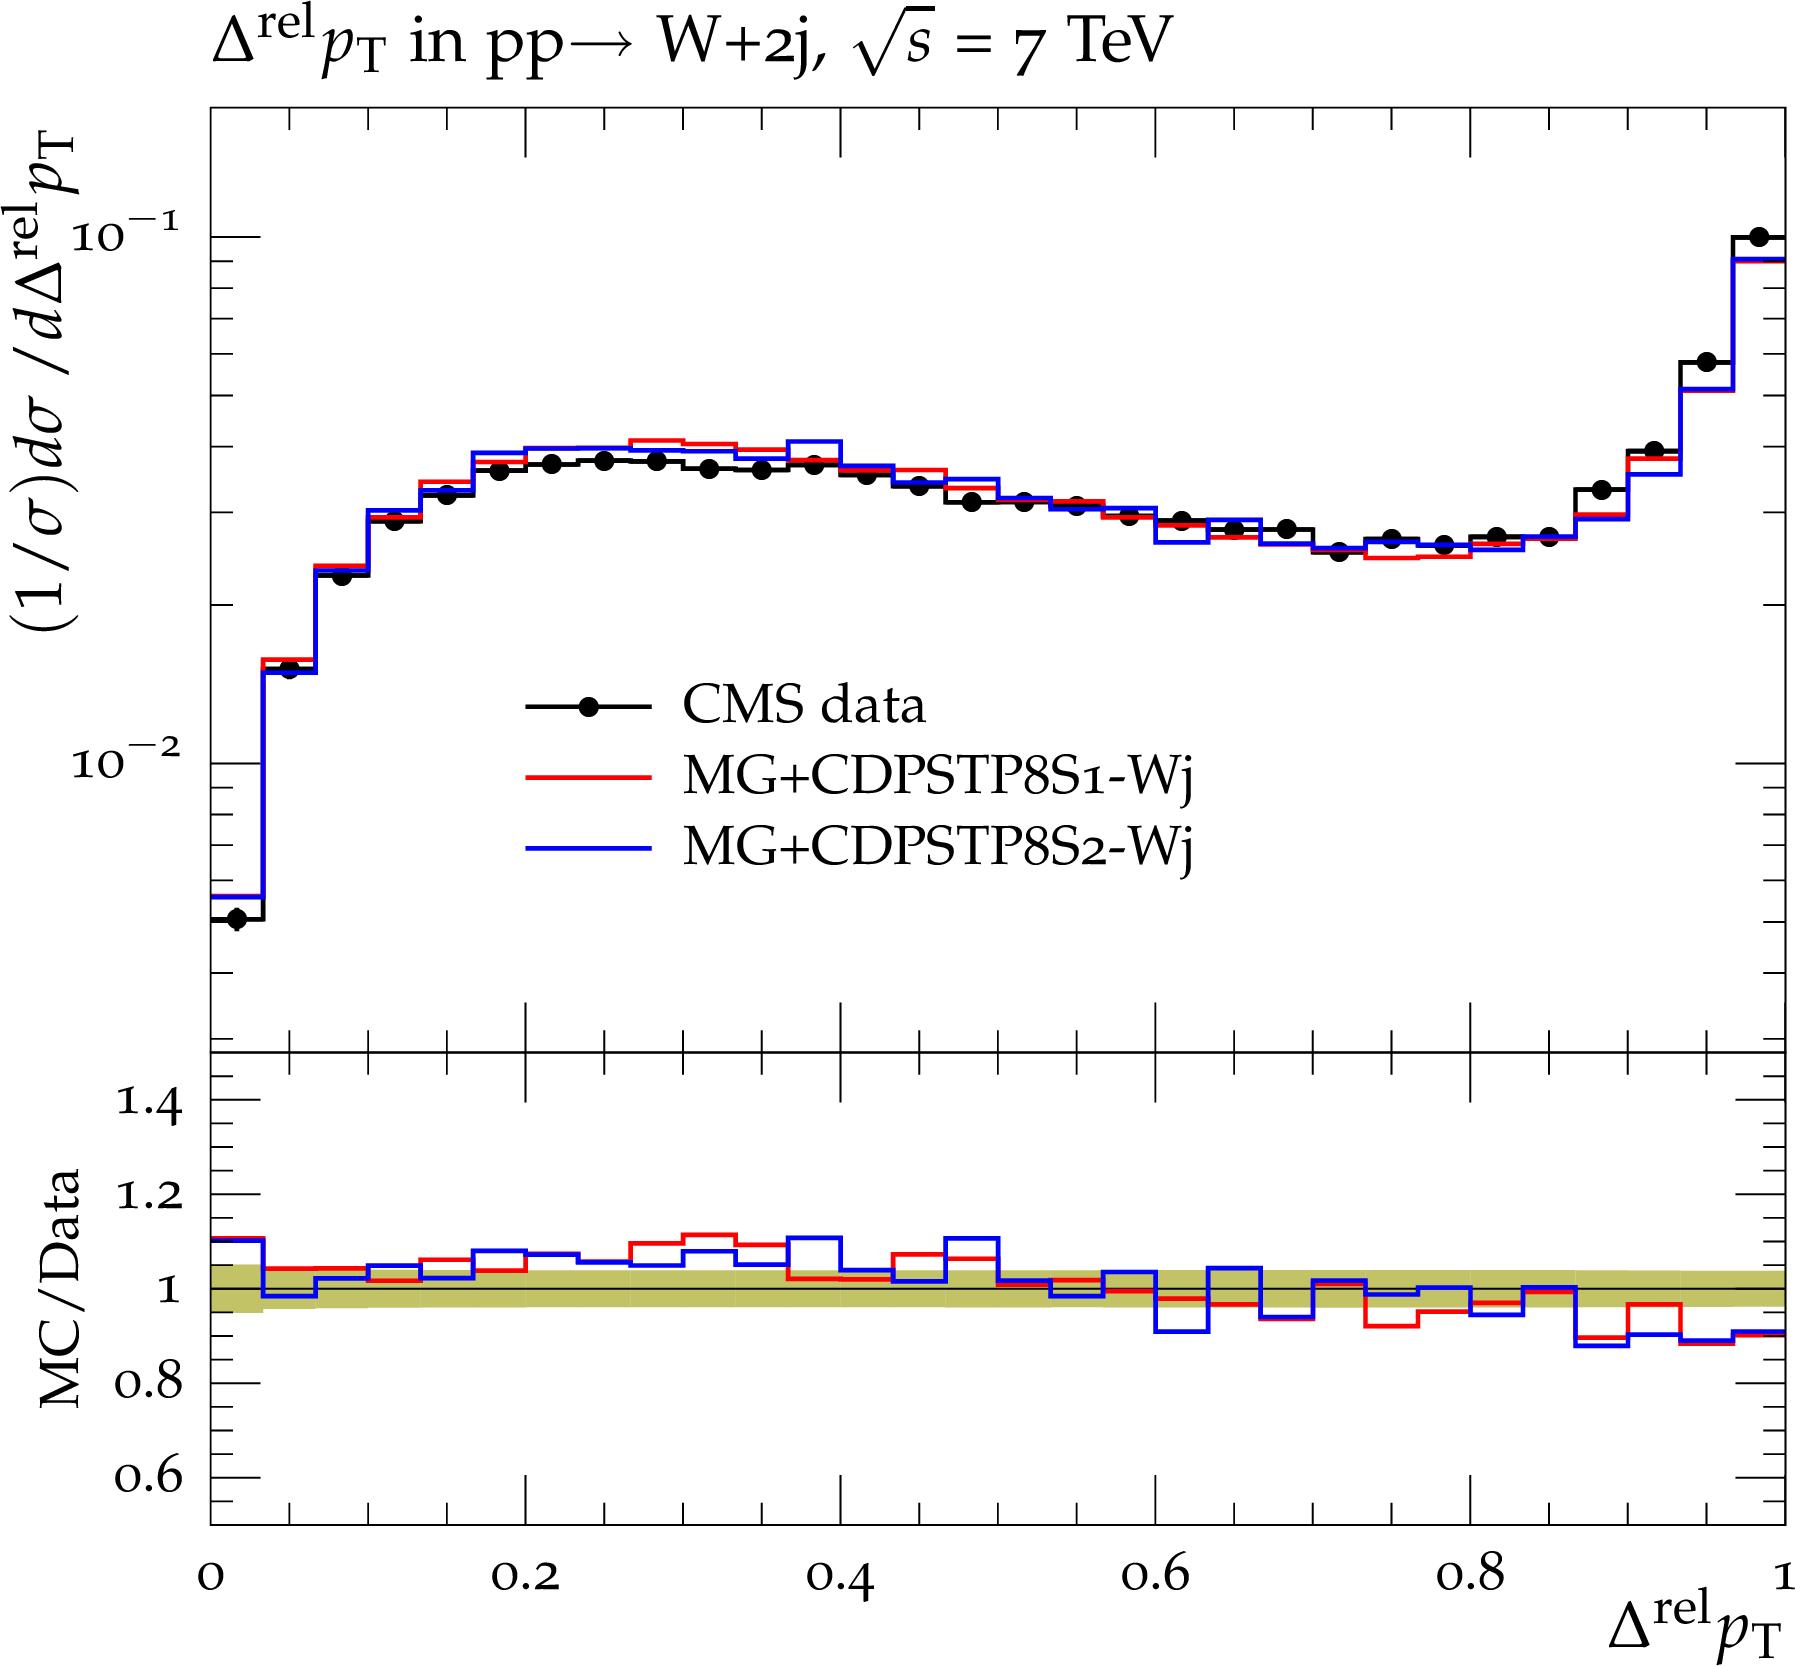
Figure 6-b:
CMS data at $\sqrt {s}=$ 7 TeV[36] for the normalized distributions of the correlation observables $\Delta $S (a,c), and $\Delta ^{\rm rel}p_{\rm T}$ (b,d) in the W+dijet channel, compared to MadGraph (MG) interfaced to: PYTHIA8 Tune 4C, Tune 4C with no MPI, and the CMS PYTHIA8 DPS partial CDPSTP8S1-Wj (top); and CDPSTP8S1-Wj, and CDPSTP8S2-Wj (c,d). The bottom panels of each plot show the ratios of these tunes to the data, and the green bands around unity represent the total experimental uncertainty. |
png pdf |
Figure 6-c:
CMS data at $\sqrt {s}=$ 7 TeV[36] for the normalized distributions of the correlation observables $\Delta $S (a,c), and $\Delta ^{\rm rel}p_{\rm T}$ (b,d) in the W+dijet channel, compared to MadGraph (MG) interfaced to: PYTHIA8 Tune 4C, Tune 4C with no MPI, and the CMS PYTHIA8 DPS partial CDPSTP8S1-Wj (top); and CDPSTP8S1-Wj, and CDPSTP8S2-Wj (c,d). The bottom panels of each plot show the ratios of these tunes to the data, and the green bands around unity represent the total experimental uncertainty. |
png pdf |
Figure 6-d:
CMS data at $\sqrt {s}=$ 7 TeV[36] for the normalized distributions of the correlation observables $\Delta $S (a,c), and $\Delta ^{\rm rel}p_{\rm T}$ (b,d) in the W+dijet channel, compared to MadGraph (MG) interfaced to: PYTHIA8 Tune 4C, Tune 4C with no MPI, and the CMS PYTHIA8 DPS partial CDPSTP8S1-Wj (top); and CDPSTP8S1-Wj, and CDPSTP8S2-Wj (c,d). The bottom panels of each plot show the ratios of these tunes to the data, and the green bands around unity represent the total experimental uncertainty. |
png pdf |
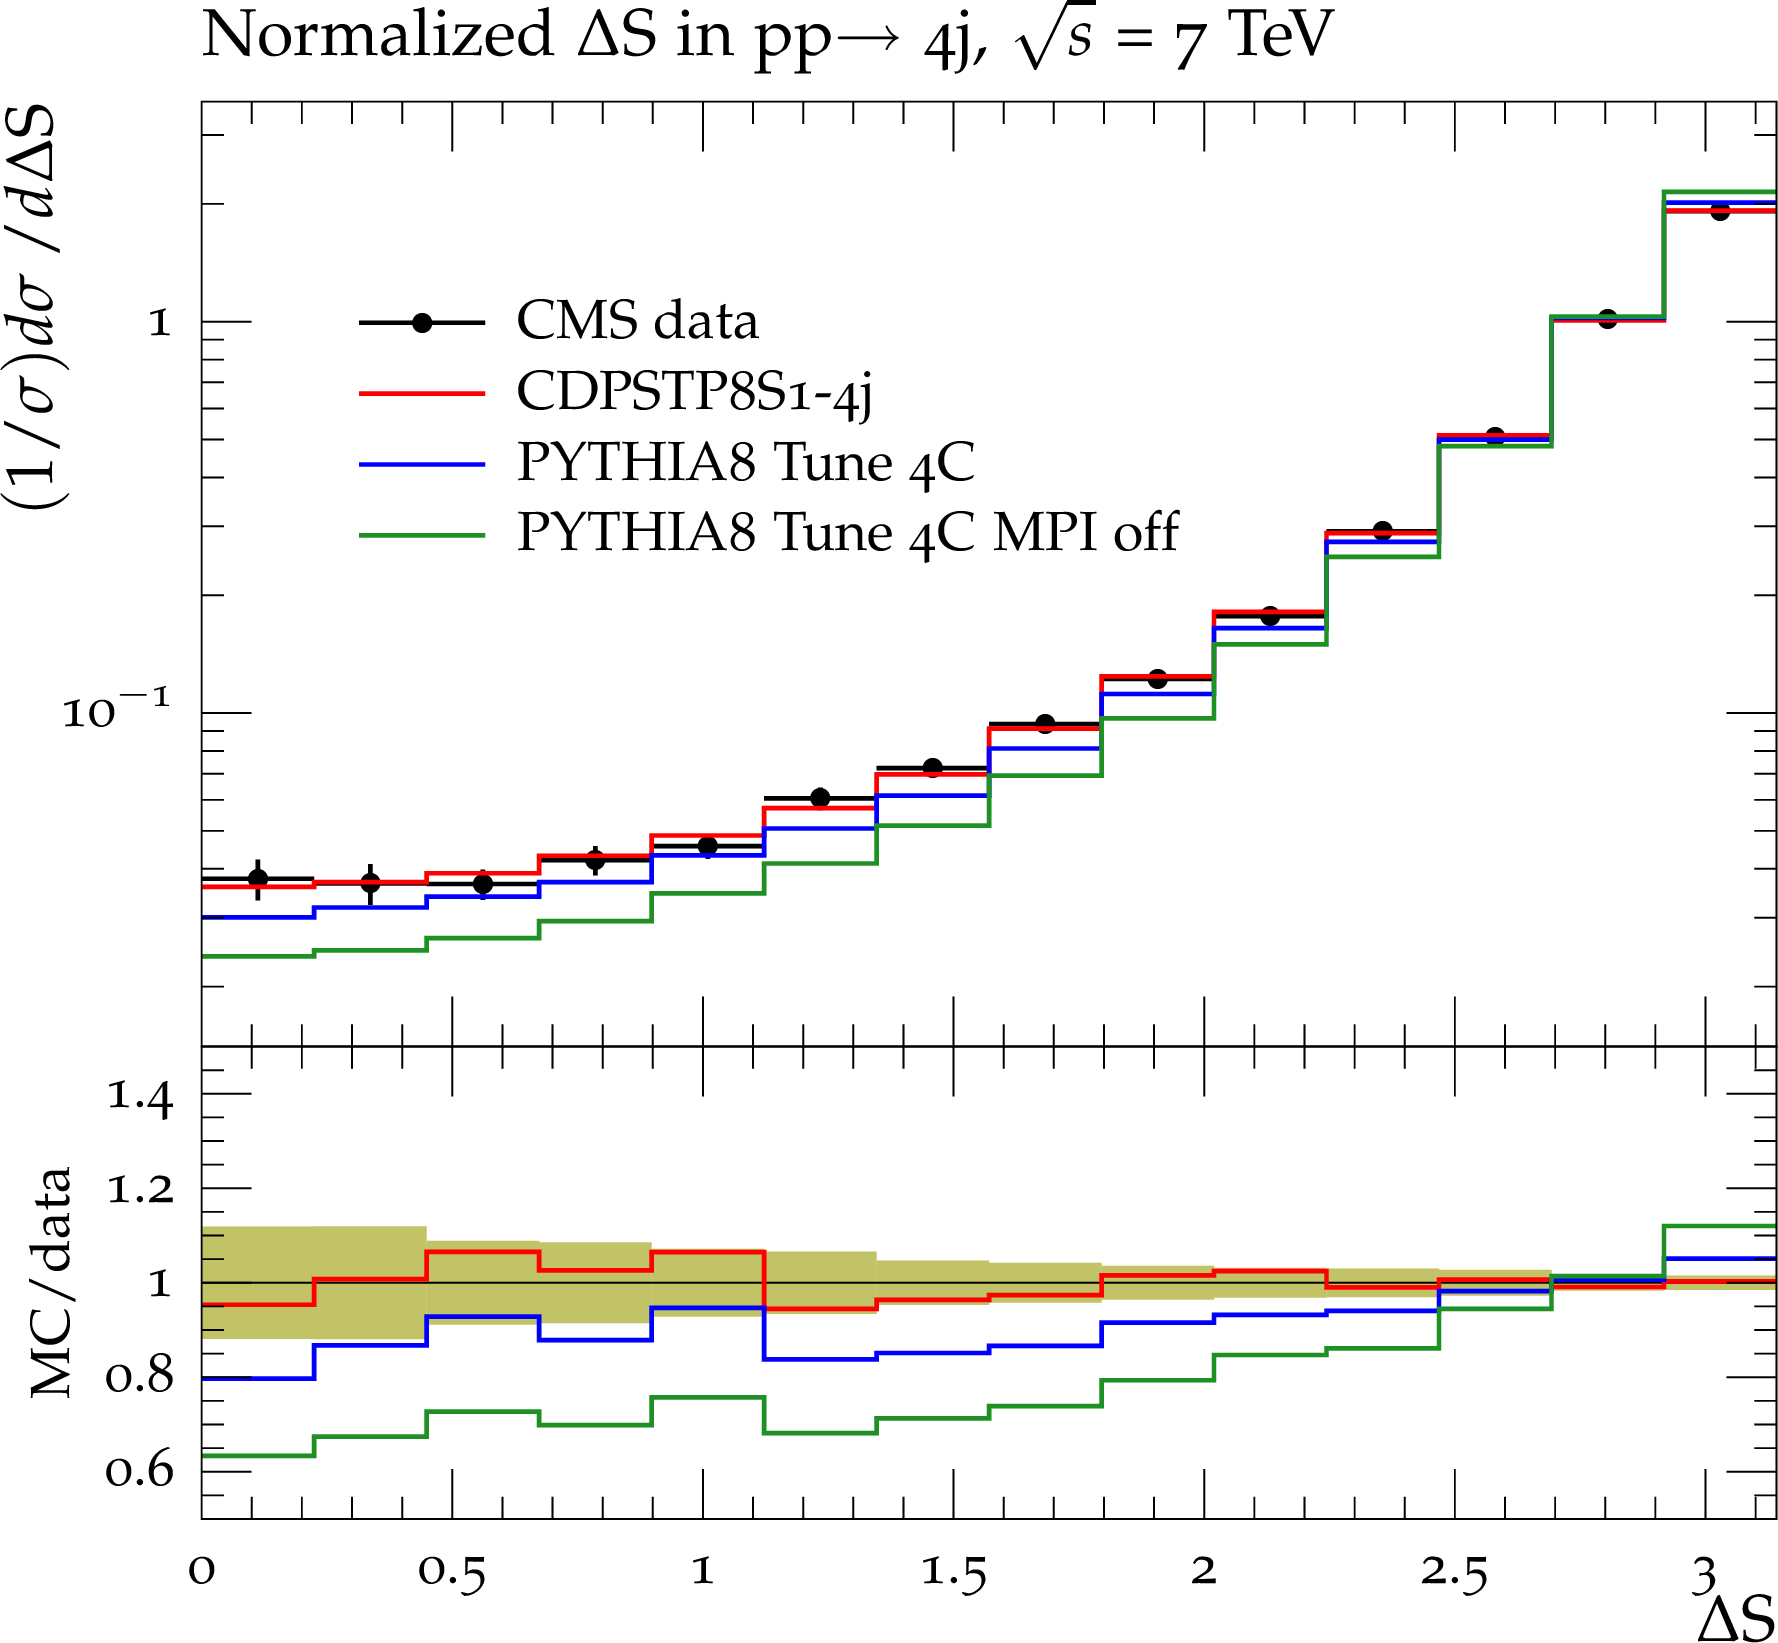
Figure 7-a:
Distributions of the correlation observables $\Delta $S (a) and $\Delta ^{\rm rel}p_{\rm T}$ (b) measured in four-jet production at $\sqrt {s}=$ 7 TeV[37] compared to PYTHIA8 Tune 4C, Tune 4C with no MPI, and CDPSTP8S1-4j. The bottom panels of each plot show the ratios of these predictions to the data, and the green bands around unity represent the total experimental uncertainty. |
png pdf |
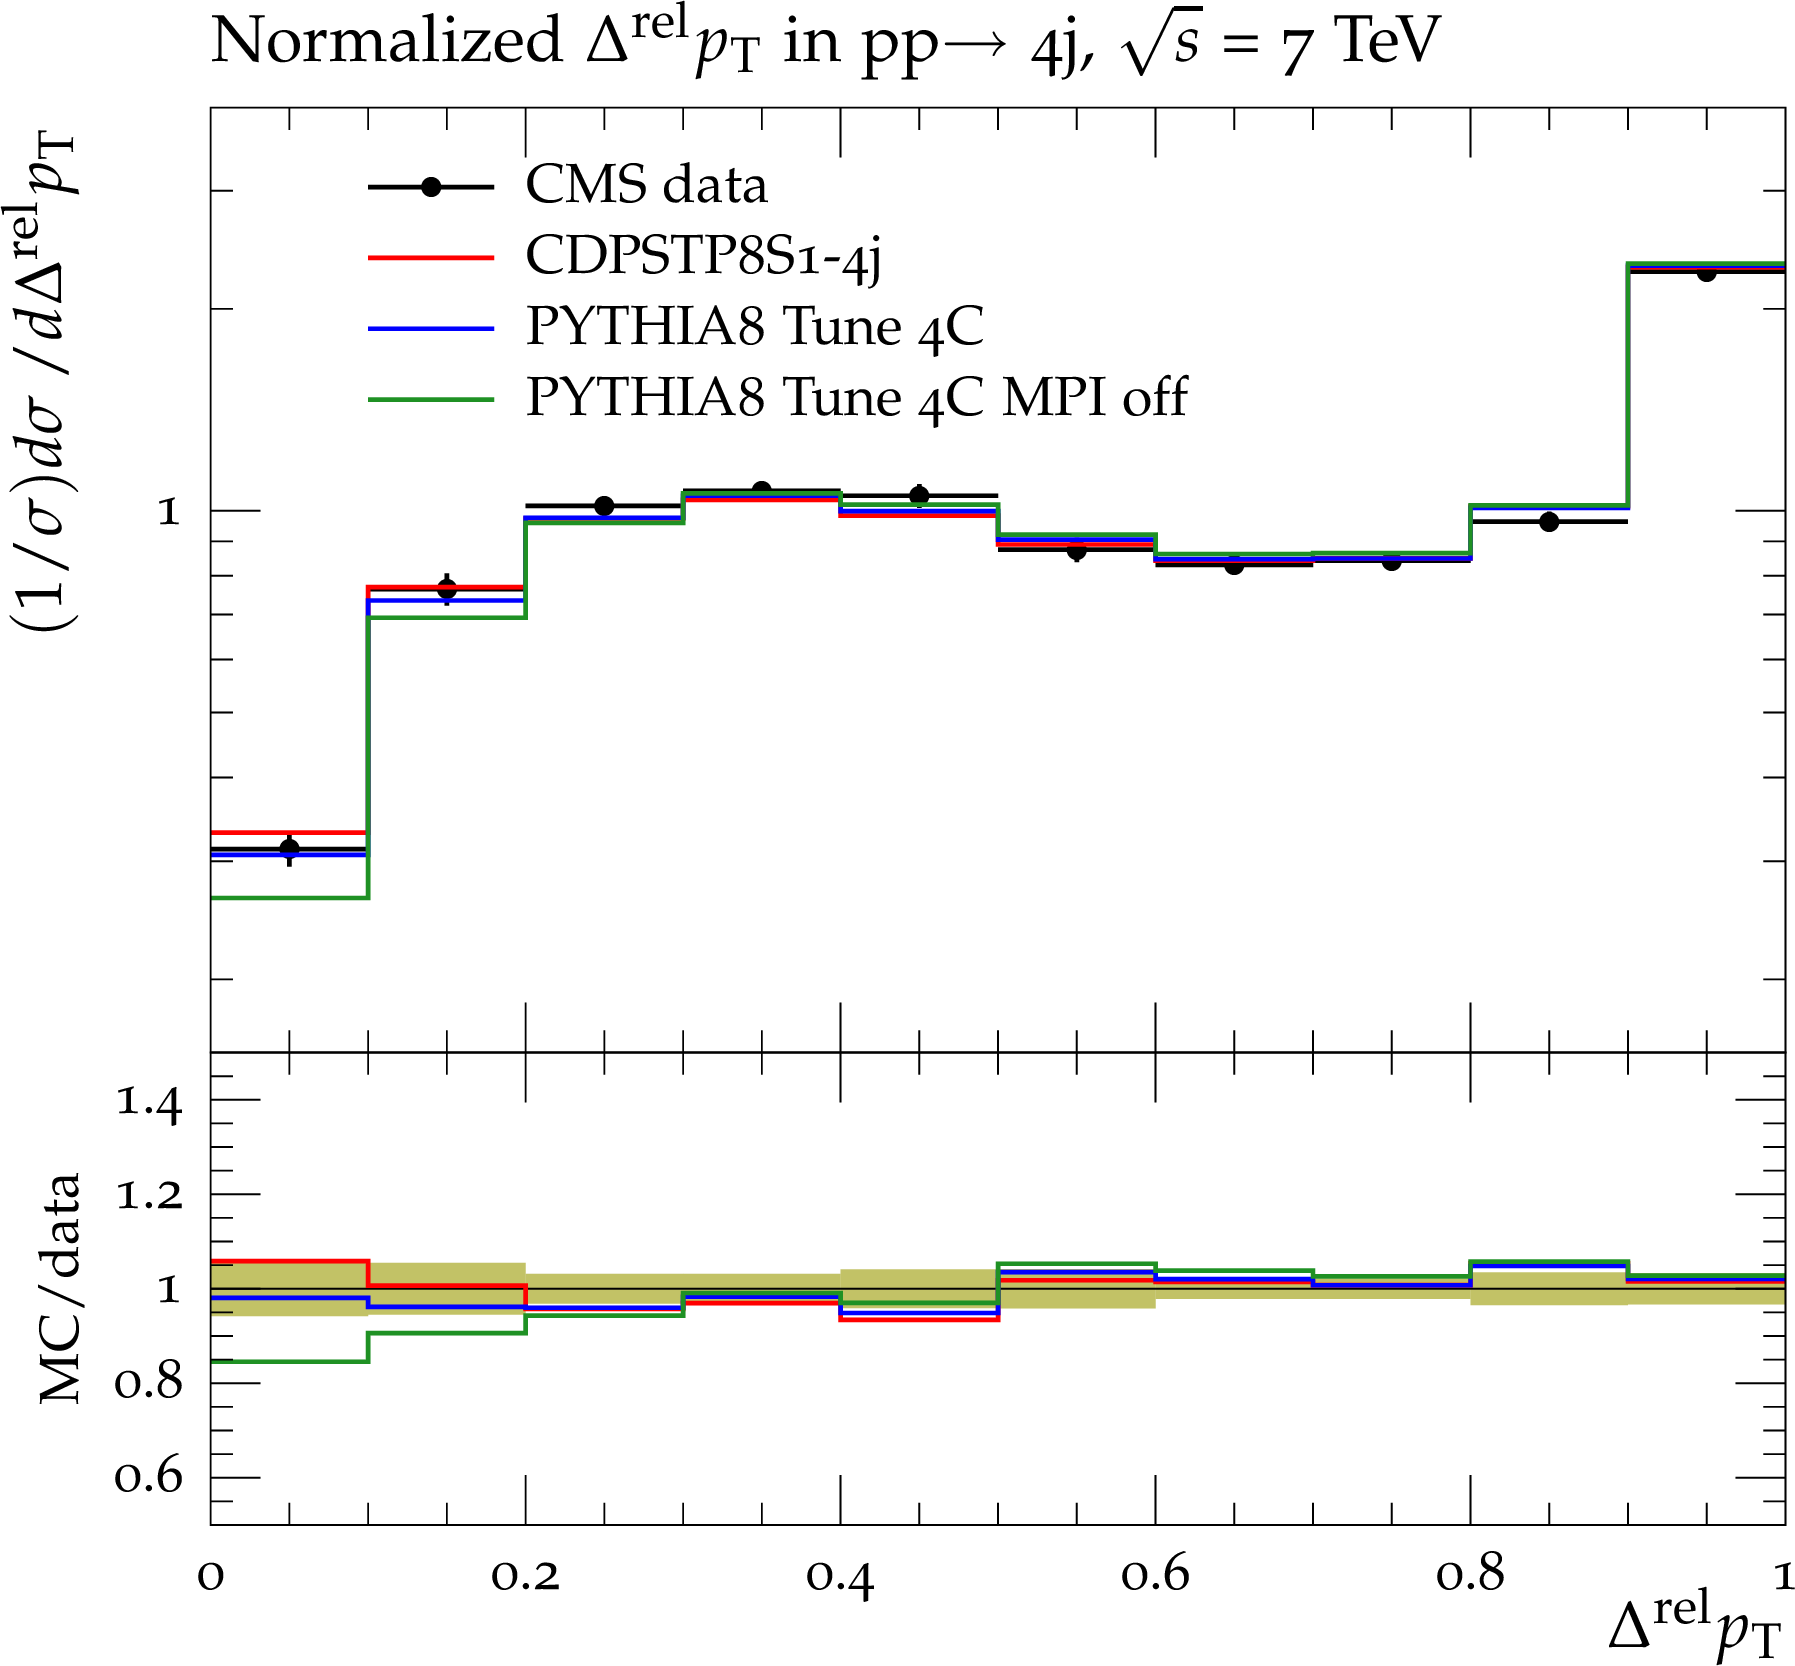
Figure 7-b:
Distributions of the correlation observables $\Delta $S (a) and $\Delta ^{\rm rel}p_{\rm T}$ (b) measured in four-jet production at $\sqrt {s}=$ 7 TeV[37] compared to PYTHIA8 Tune 4C, Tune 4C with no MPI, and CDPSTP8S1-4j. The bottom panels of each plot show the ratios of these predictions to the data, and the green bands around unity represent the total experimental uncertainty. |
png pdf |
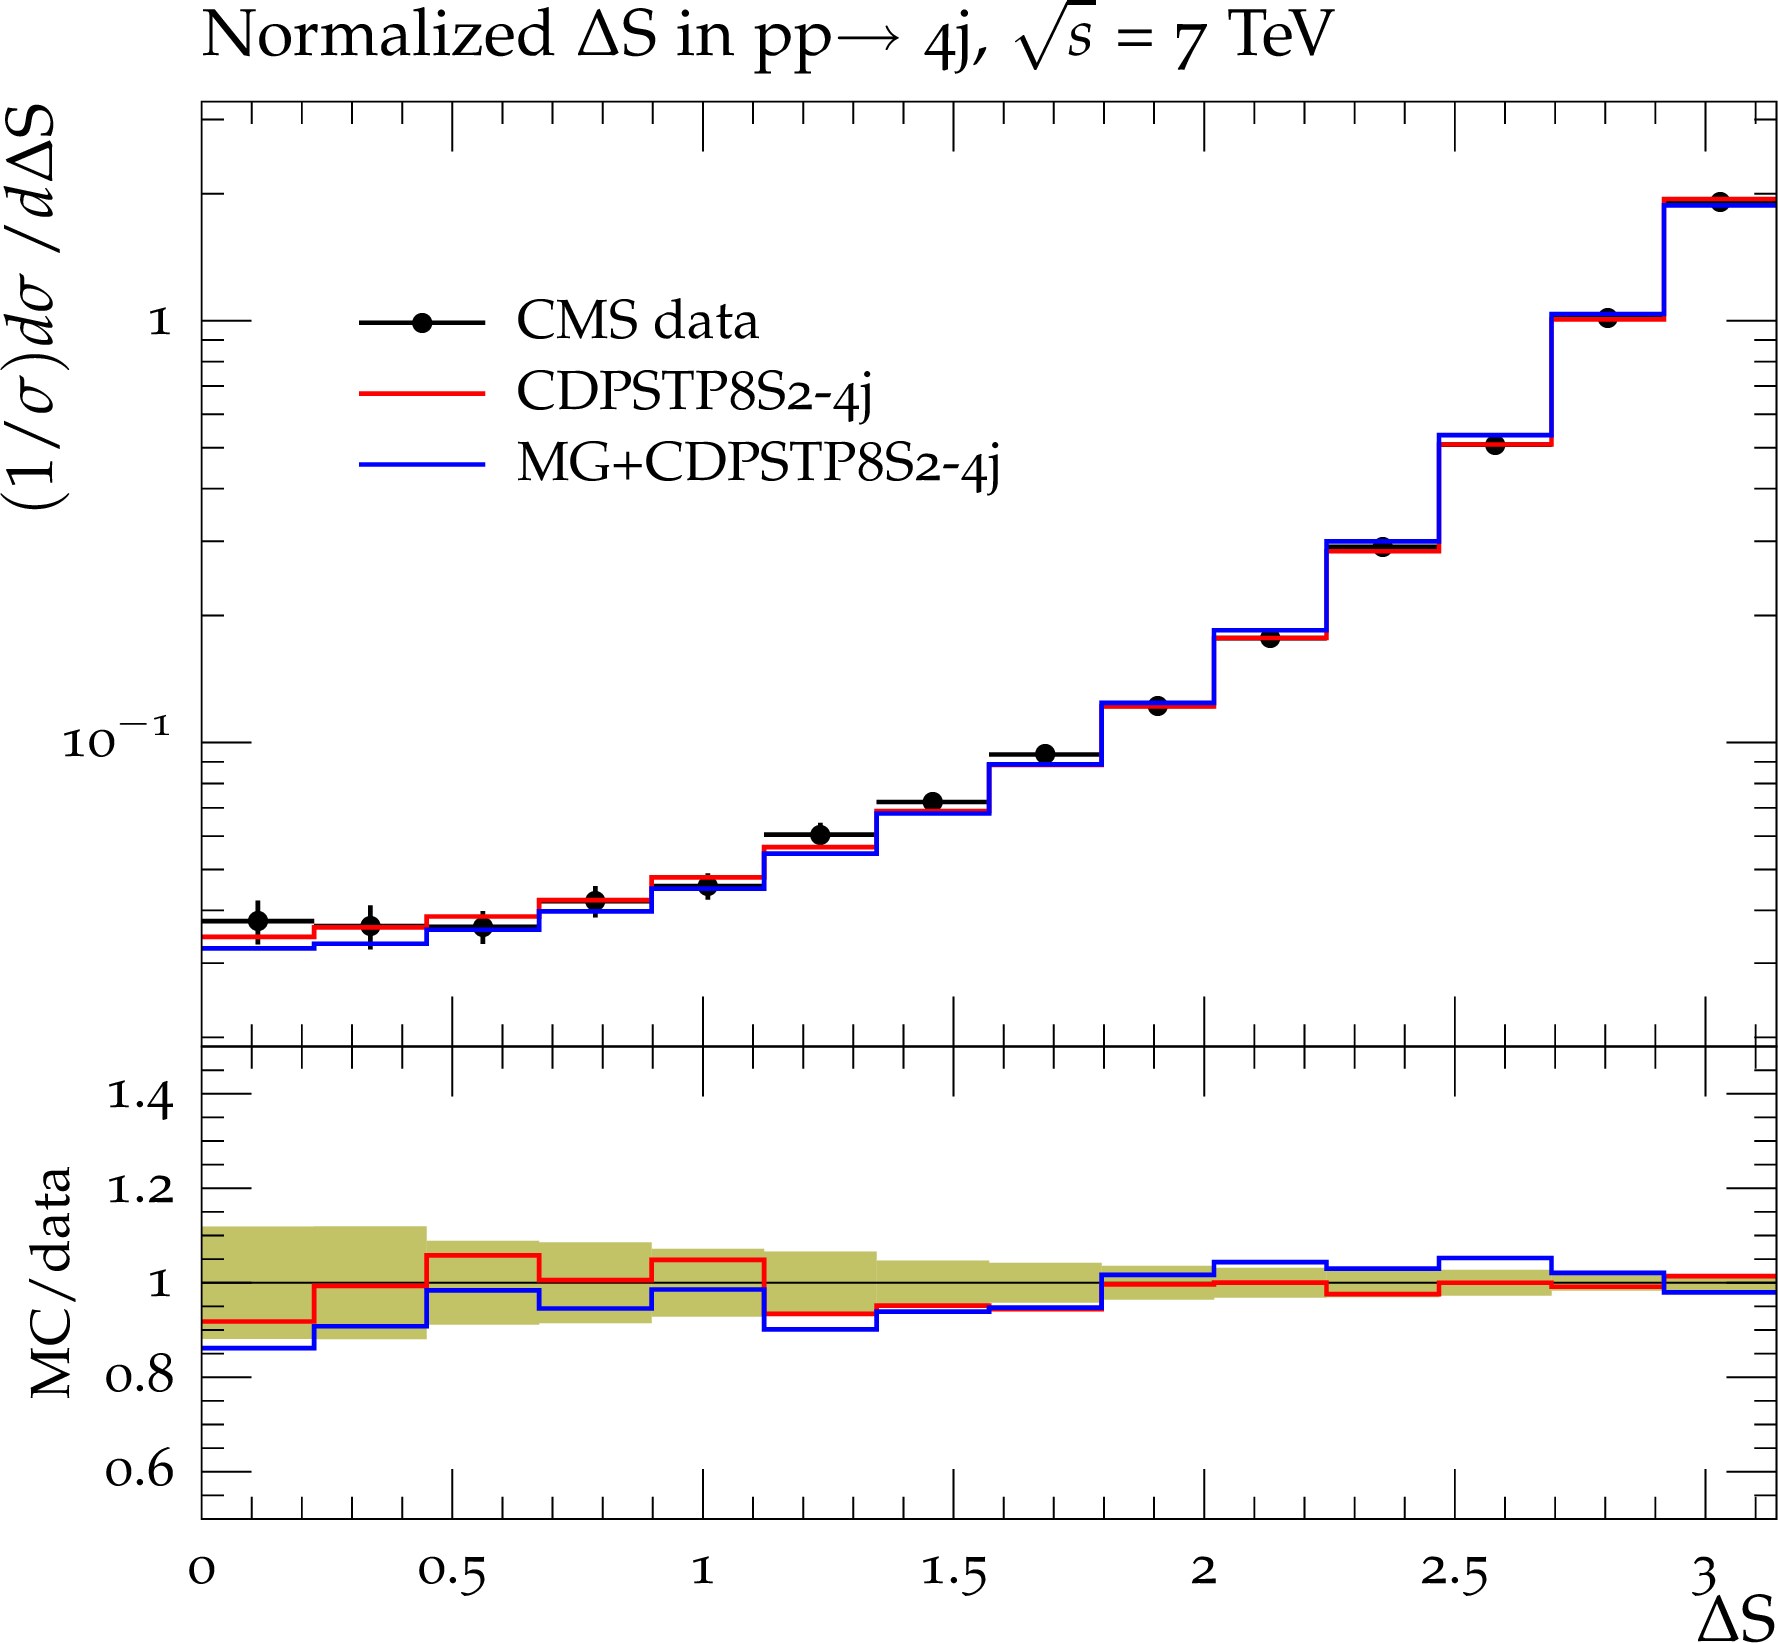
Figure 8-a:
Distributions in the correlation observables $\Delta $S (a,b) and $\Delta ^{\rm rel}p_{\rm T}$ (c,d) measured in four-jet production at $\sqrt {s}= $ 7 TeV[37], compared to predictions of PYTHIA8 using CDPSTP8S2-4j and of MadGraph (MG) interfaced to PYTHIA8 using CDPSTP8S2-4j (a,c) and PYTHIA8 using CUETP8M1 and HERWIG++ with CUETHppS1 (b,d). Also shown are the ratios of the predictions to the data. Predictions for CUETP8M1 (a,c) are shown with an error band corresponding to the total uncertainty obtained from the eigentunes (see Appendix A). The green bands around unity represent the total experimental uncertainty. |
png pdf |
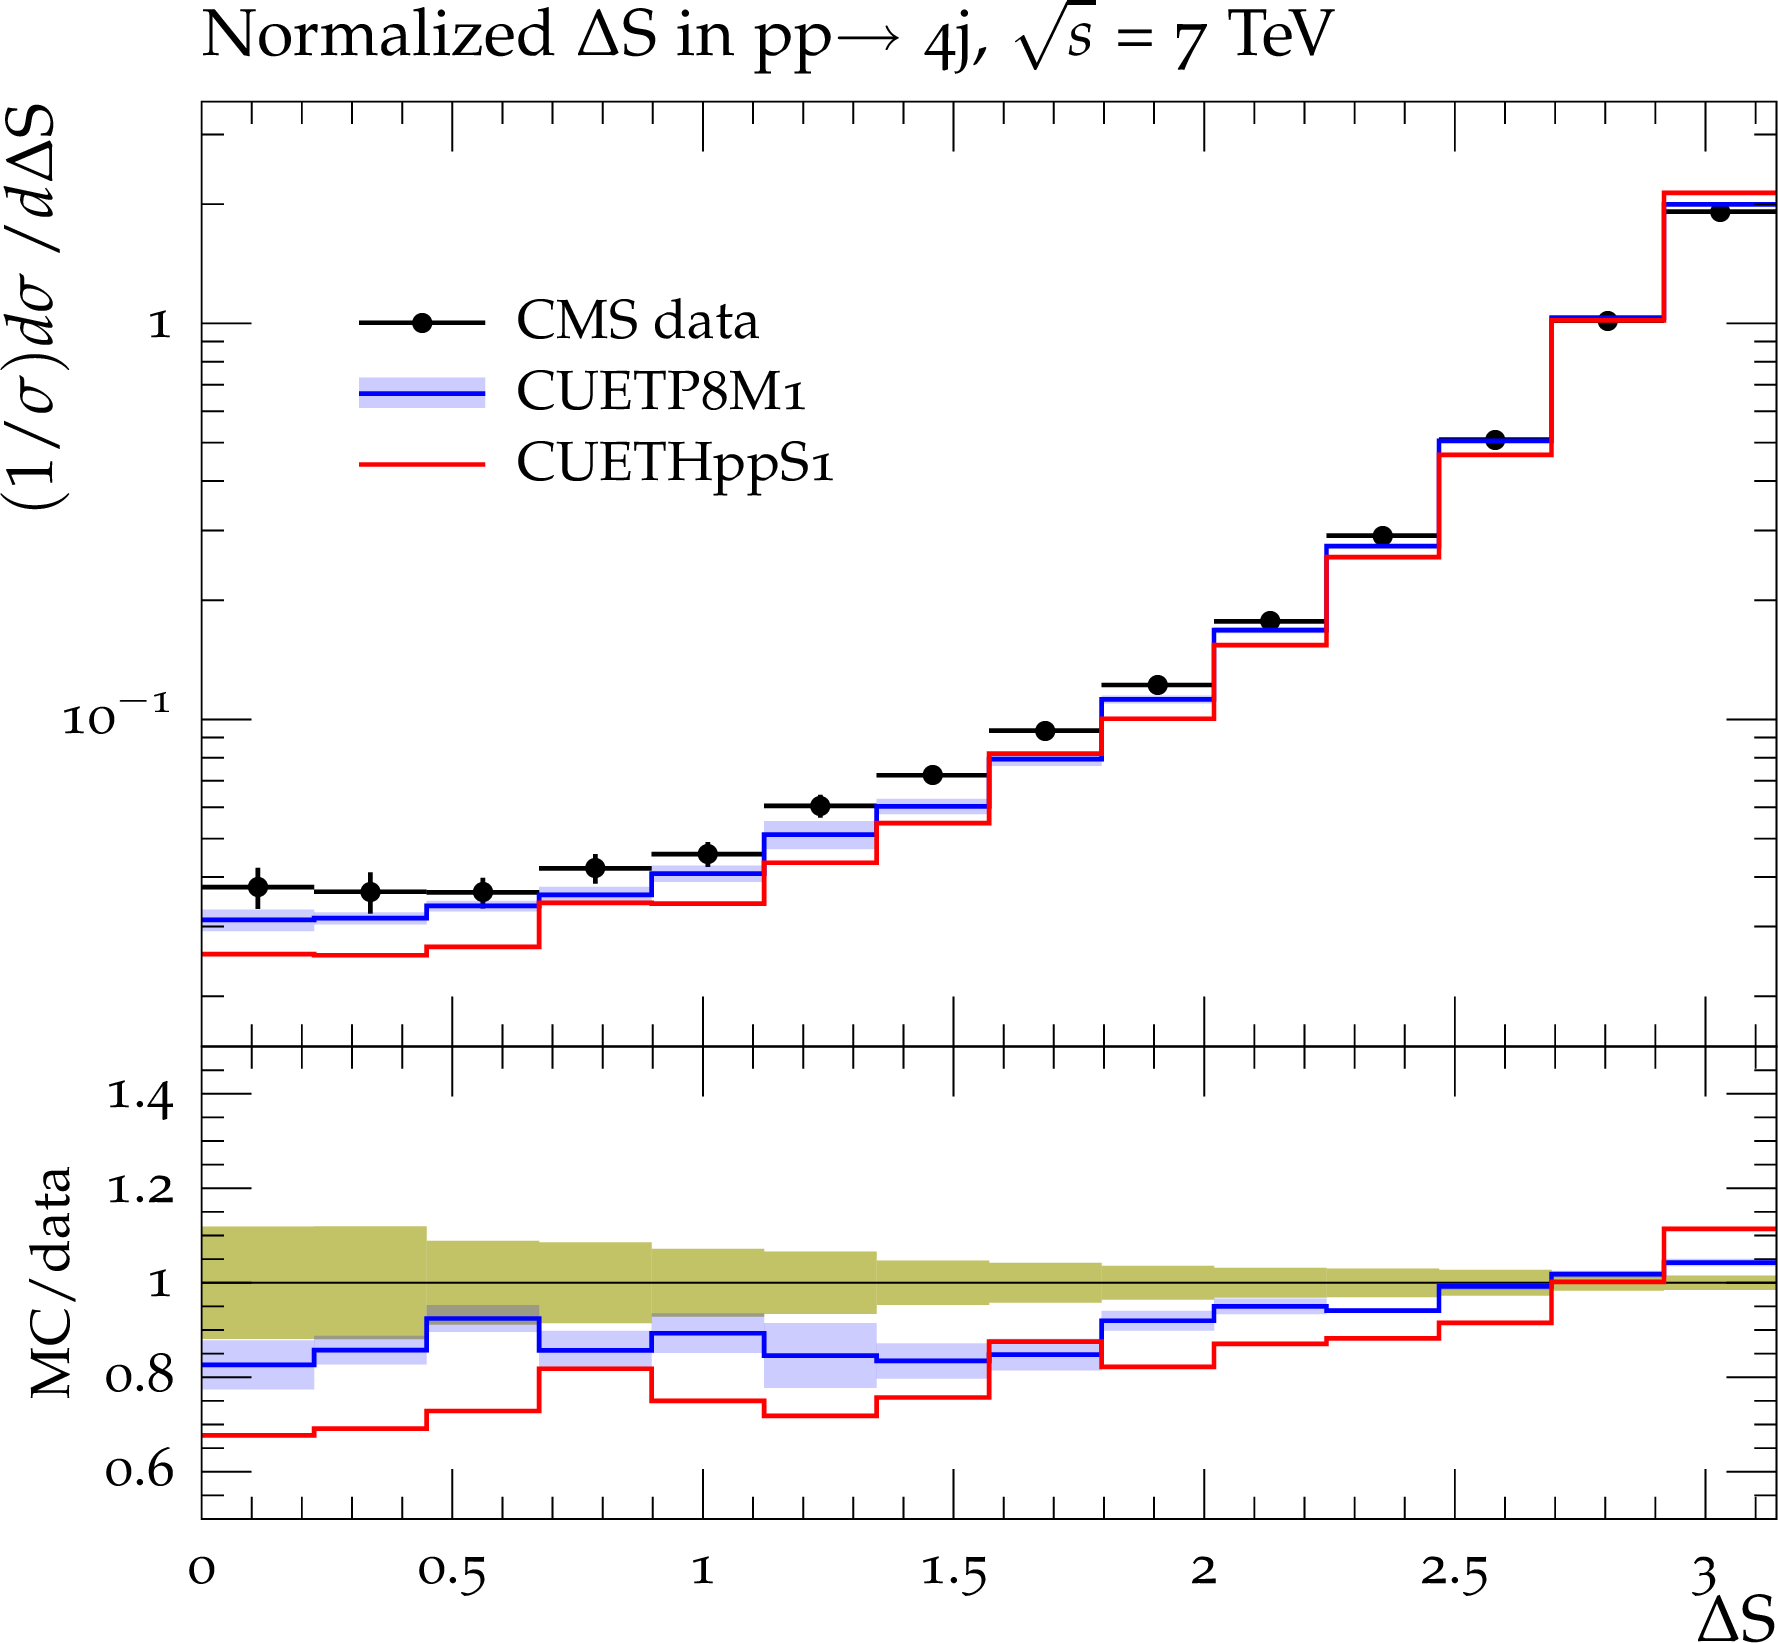
Figure 8-b:
Distributions in the correlation observables $\Delta $S (a,b) and $\Delta ^{\rm rel}p_{\rm T}$ (c,d) measured in four-jet production at $\sqrt {s}= $ 7 TeV[37], compared to predictions of PYTHIA8 using CDPSTP8S2-4j and of MadGraph (MG) interfaced to PYTHIA8 using CDPSTP8S2-4j (a,c) and PYTHIA8 using CUETP8M1 and HERWIG++ with CUETHppS1 (b,d). Also shown are the ratios of the predictions to the data. Predictions for CUETP8M1 (a,c) are shown with an error band corresponding to the total uncertainty obtained from the eigentunes (see Appendix A). The green bands around unity represent the total experimental uncertainty. |
png pdf |
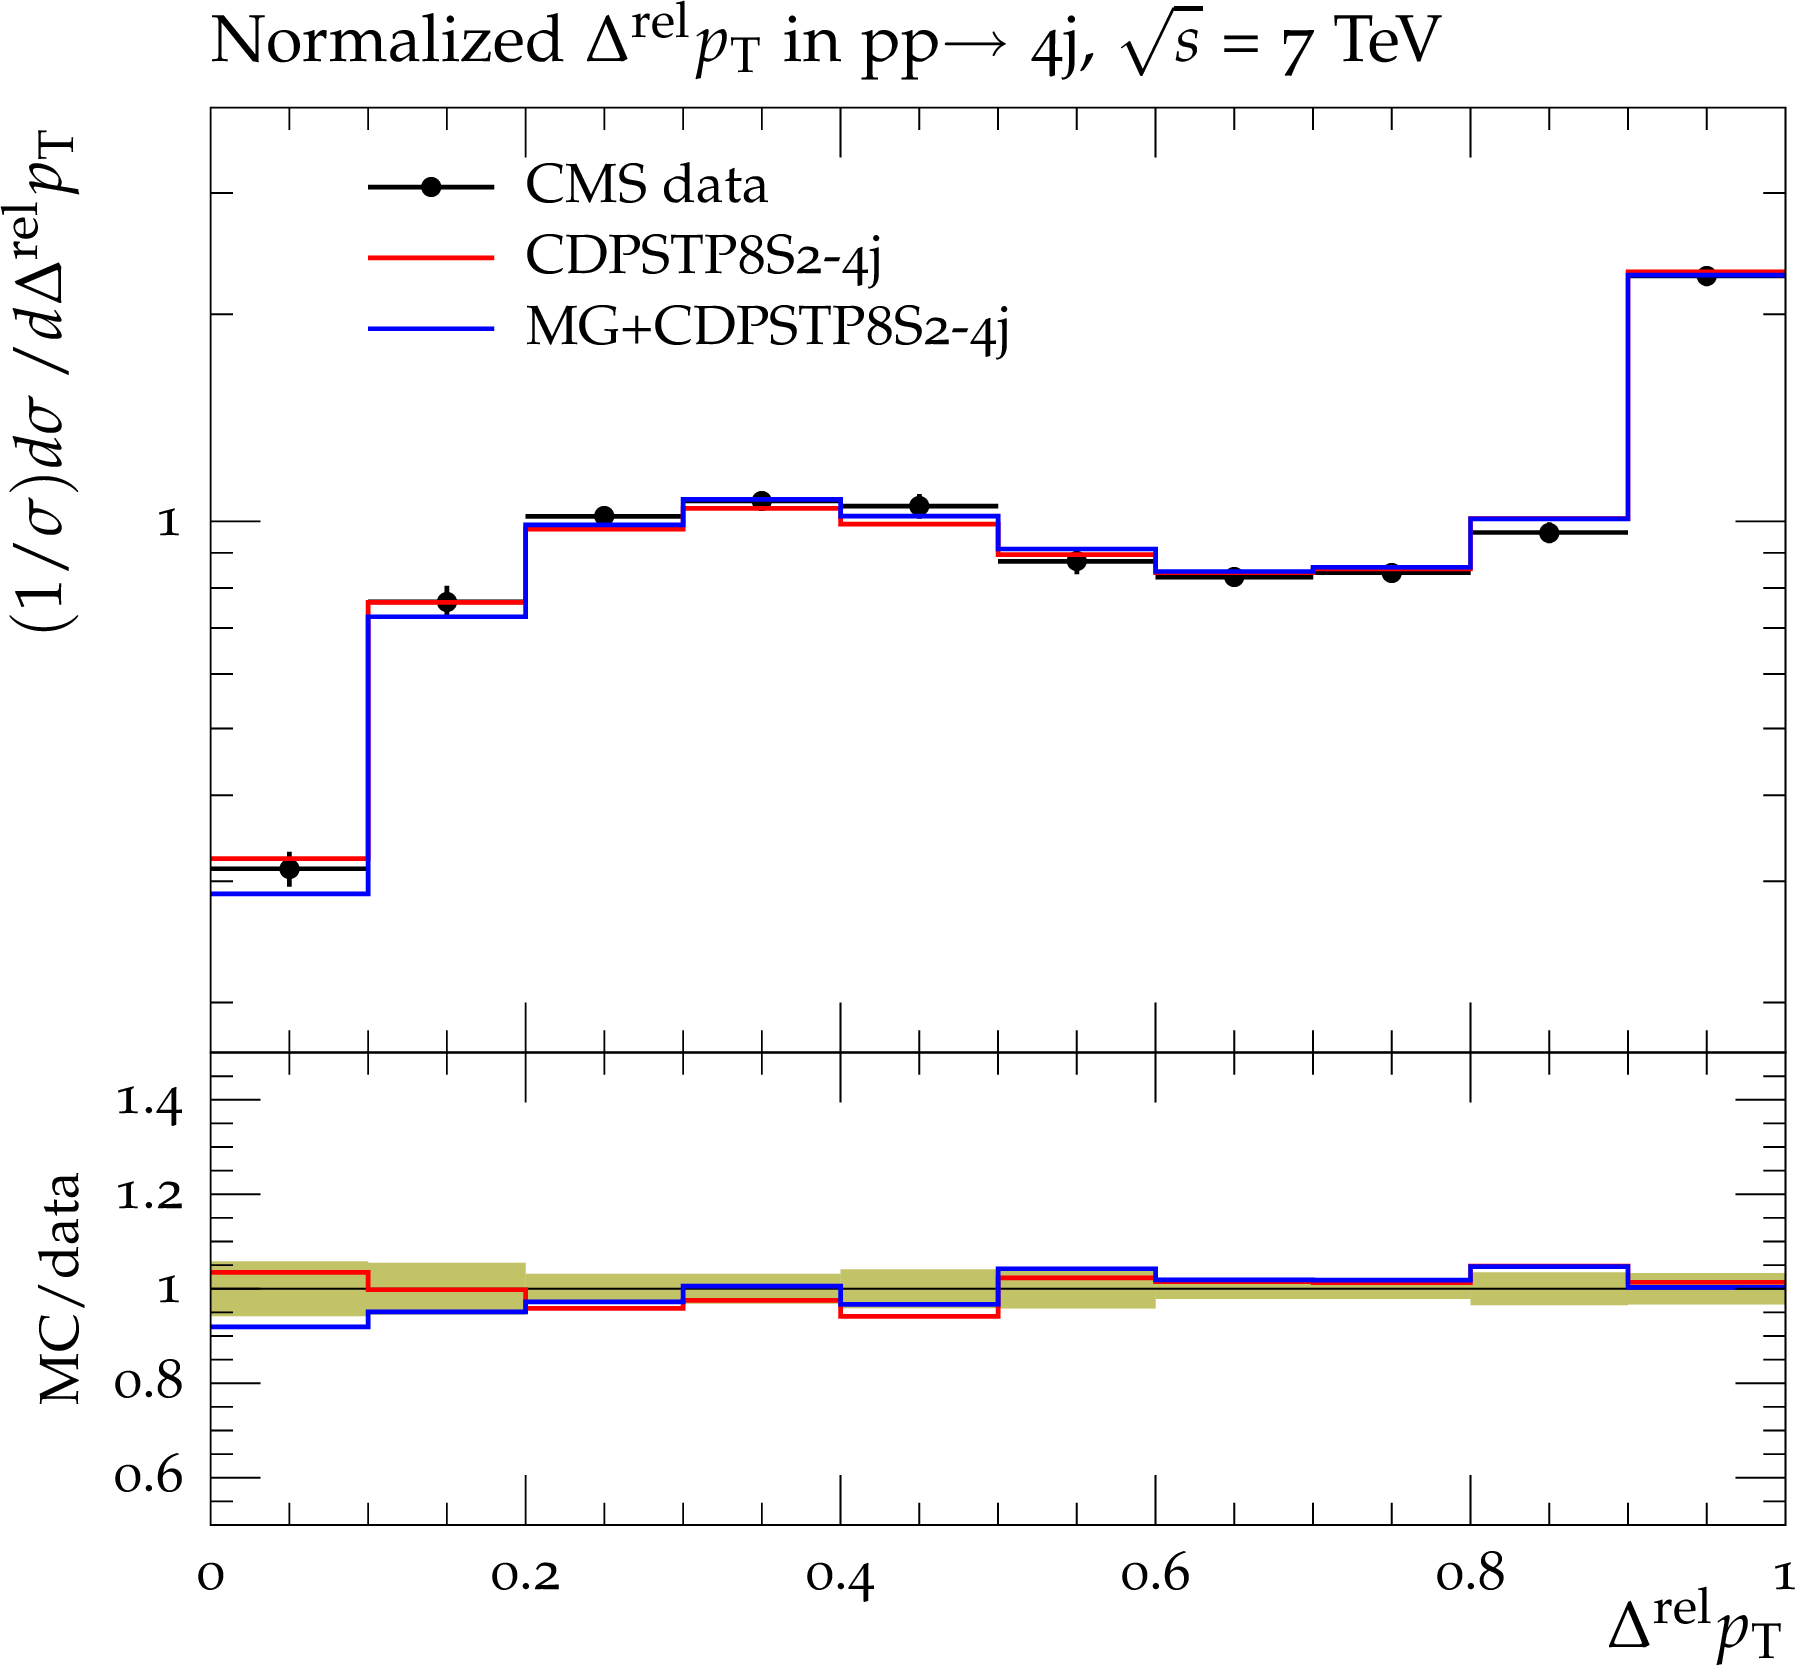
Figure 8-c:
Distributions in the correlation observables $\Delta $S (a,b) and $\Delta ^{\rm rel}p_{\rm T}$ (c,d) measured in four-jet production at $\sqrt {s}= $ 7 TeV[37], compared to predictions of PYTHIA8 using CDPSTP8S2-4j and of MadGraph (MG) interfaced to PYTHIA8 using CDPSTP8S2-4j (a,c) and PYTHIA8 using CUETP8M1 and HERWIG++ with CUETHppS1 (b,d). Also shown are the ratios of the predictions to the data. Predictions for CUETP8M1 (a,c) are shown with an error band corresponding to the total uncertainty obtained from the eigentunes (see Appendix A). The green bands around unity represent the total experimental uncertainty. |
png pdf |
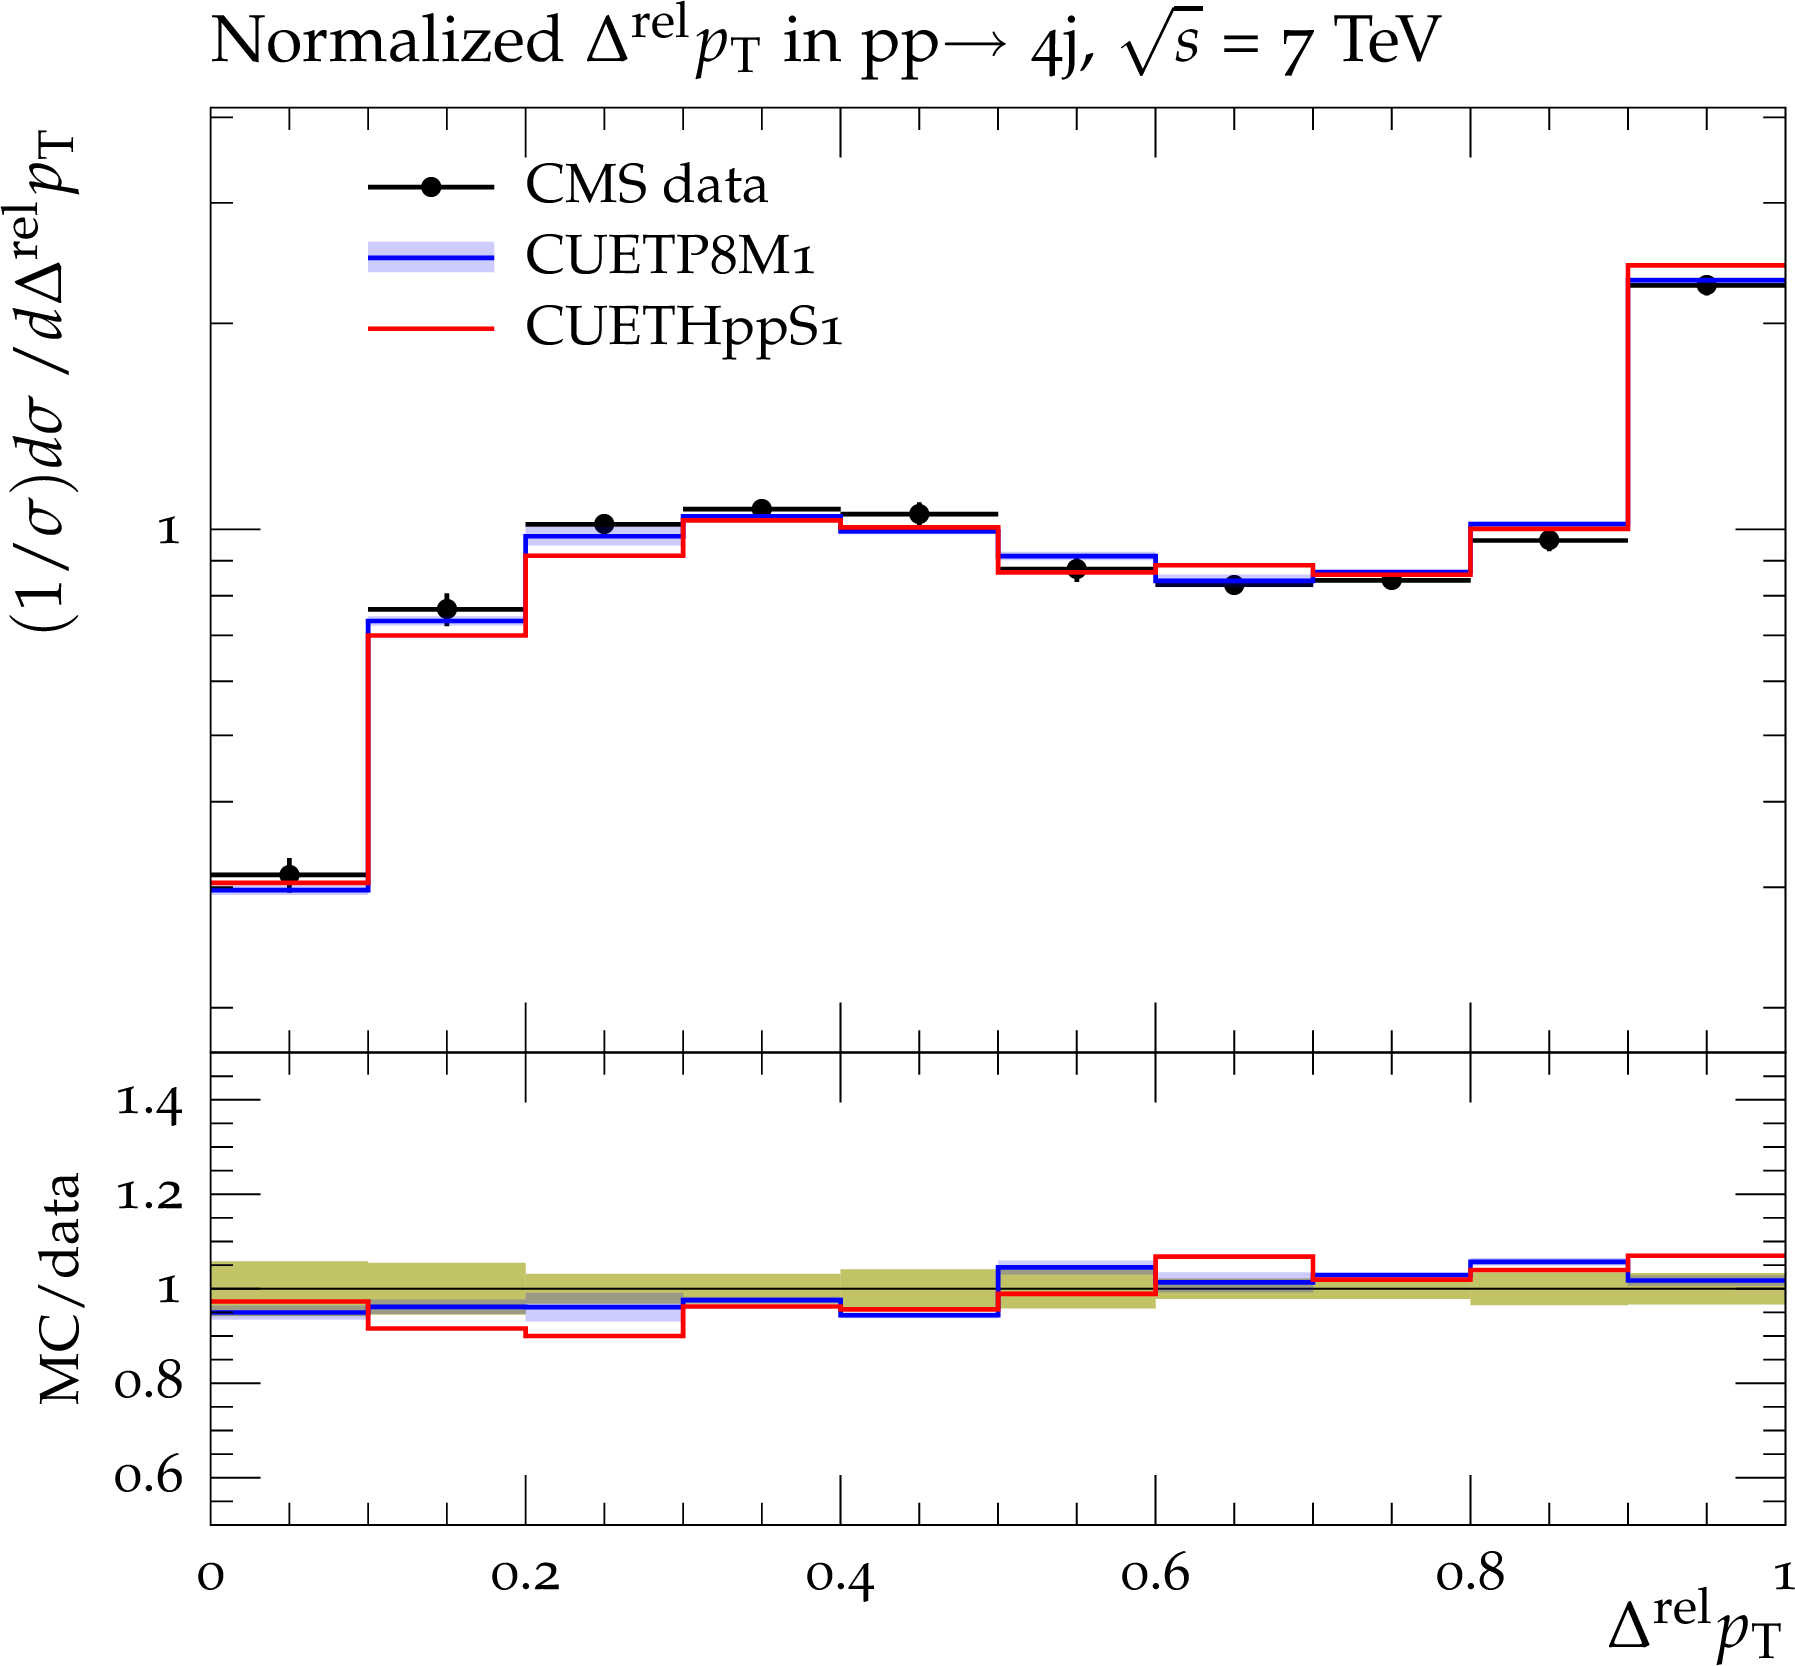
Figure 8-d:
Distributions in the correlation observables $\Delta $S (a,b) and $\Delta ^{\rm rel}p_{\rm T}$ (c,d) measured in four-jet production at $\sqrt {s}= $ 7 TeV[37], compared to predictions of PYTHIA8 using CDPSTP8S2-4j and of MadGraph (MG) interfaced to PYTHIA8 using CDPSTP8S2-4j (a,c) and PYTHIA8 using CUETP8M1 and HERWIG++ with CUETHppS1 (b,d). Also shown are the ratios of the predictions to the data. Predictions for CUETP8M1 (a,c) are shown with an error band corresponding to the total uncertainty obtained from the eigentunes (see Appendix A). The green bands around unity represent the total experimental uncertainty. |
png pdf |
Figure 9-a:
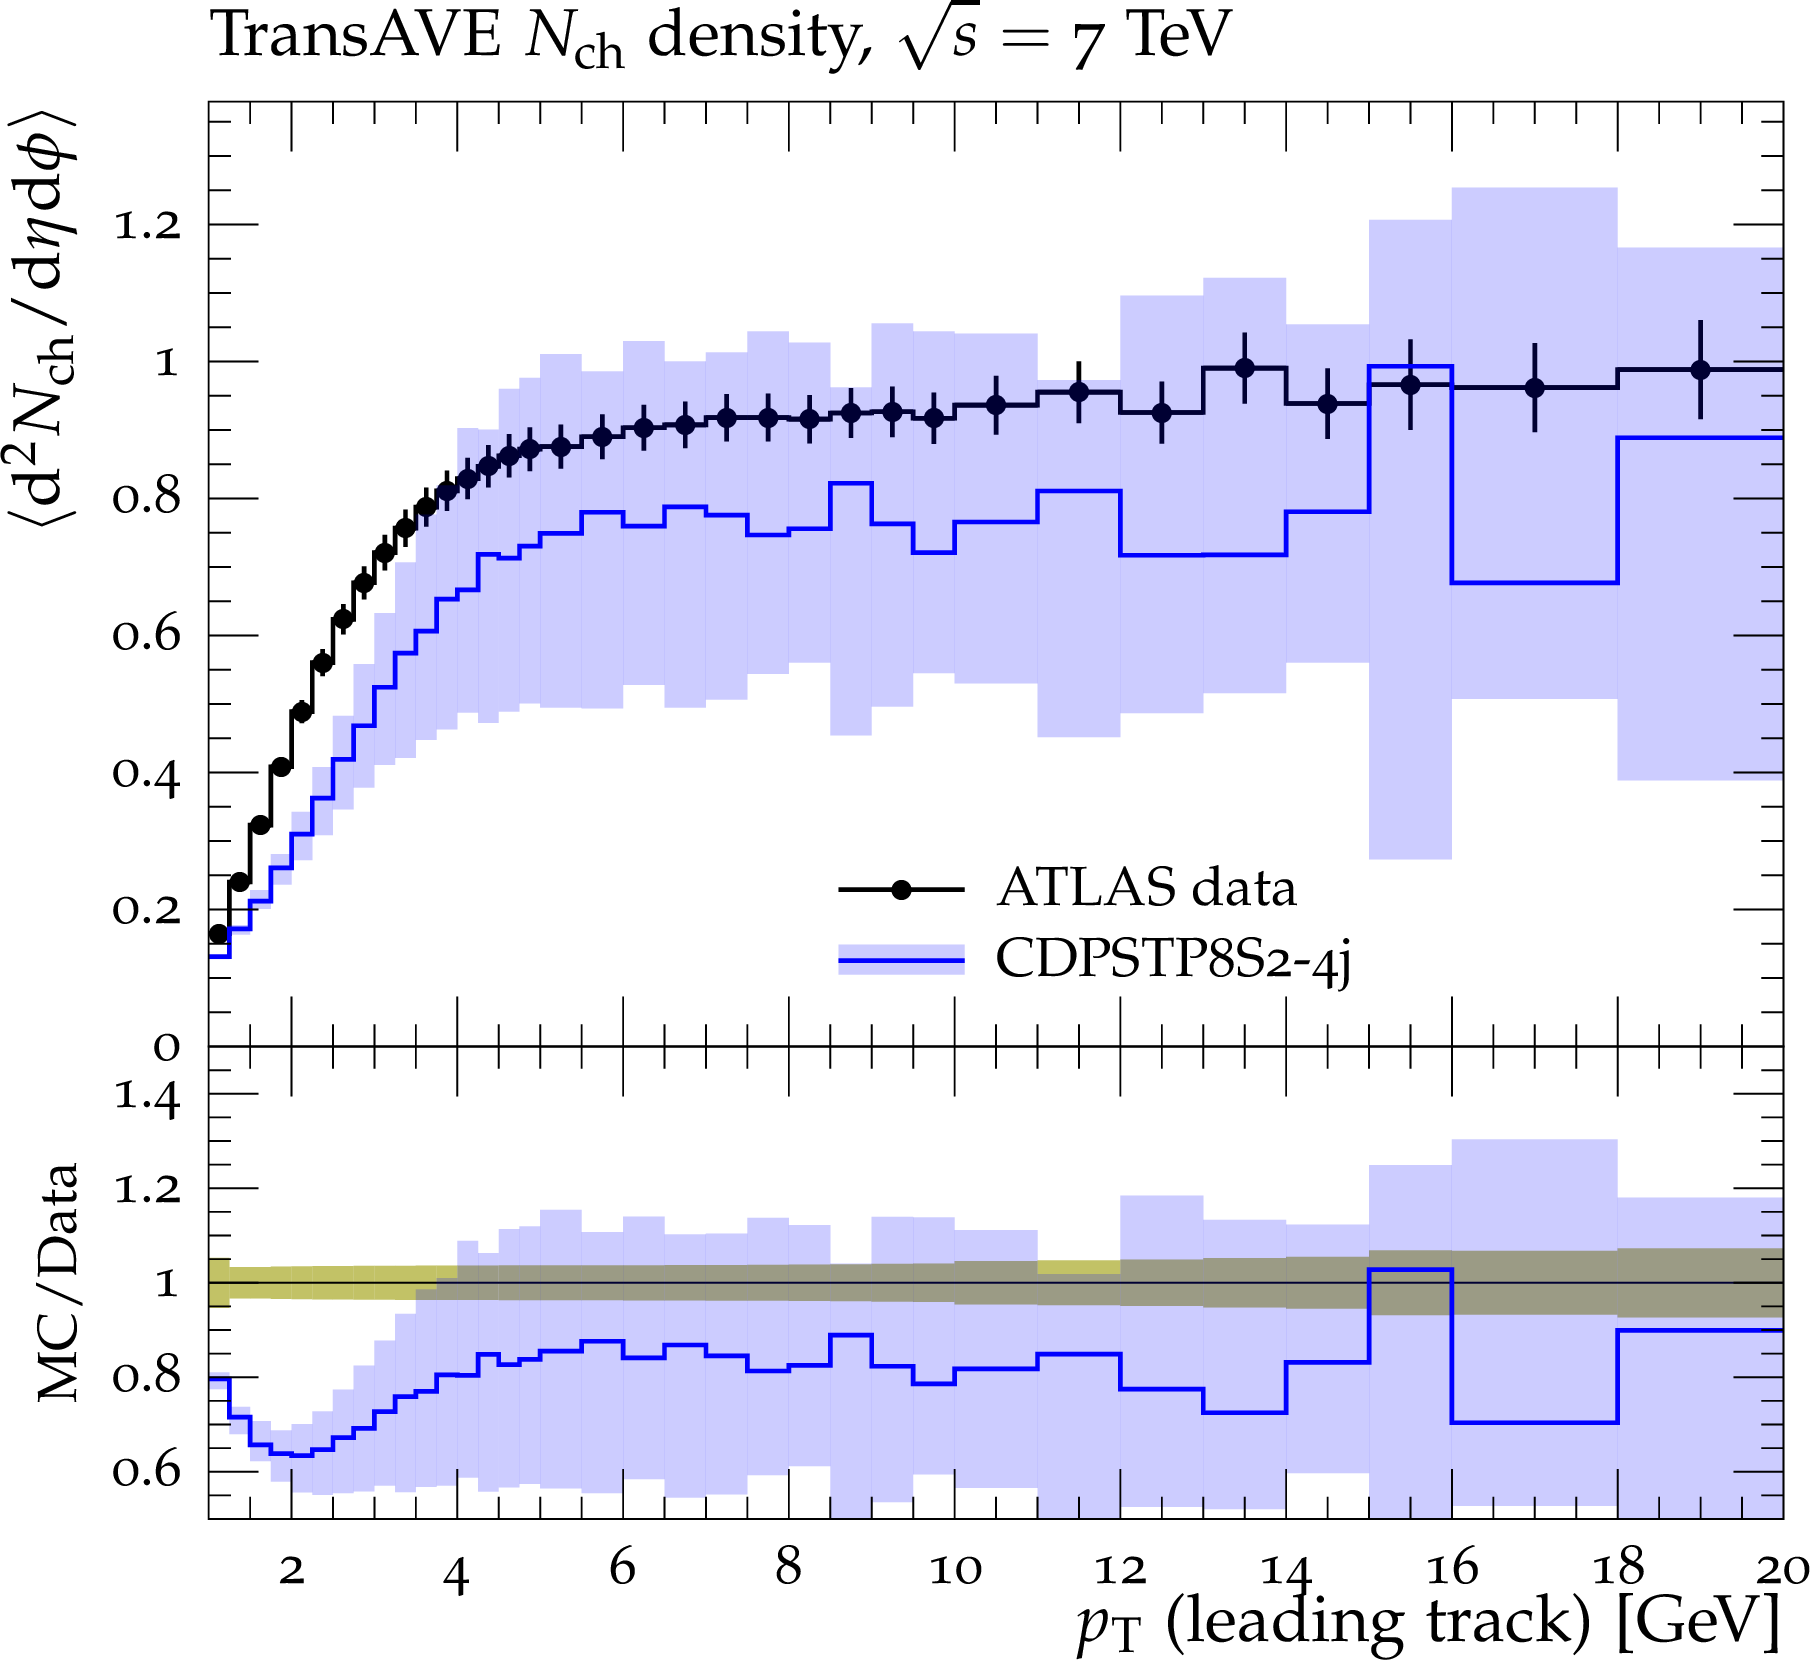
ATLAS data at $\sqrt {s}=$ 7 TeV[39] for charged-particle (a,c) and $p_{\rm T}^{\rm sum}$\ densities (b,d) with $p_{\rm T}>$ 0.5 GeV and $|\eta |<$ 2.0 in the transverse (TransAVE) region compared to predictions of PYTHIA8 using CDPSTP8S2-4j (a,c) and CUETP8S1-CTEQ6L1, CUETP8S1-HERAPDF1.5LO, and CUETP8M1, plus HERWIG++ using CUETHppS1 (b,d). The predictions of CDPSTP8S2-4j are shown with an error band corresponding to the total uncertainty obtained from the eigentunes (see Appendix A). The bottom panels of each plot show the ratios of these predictions to the data, and the green bands around unity represent the total experimental uncertainty. |
png pdf |
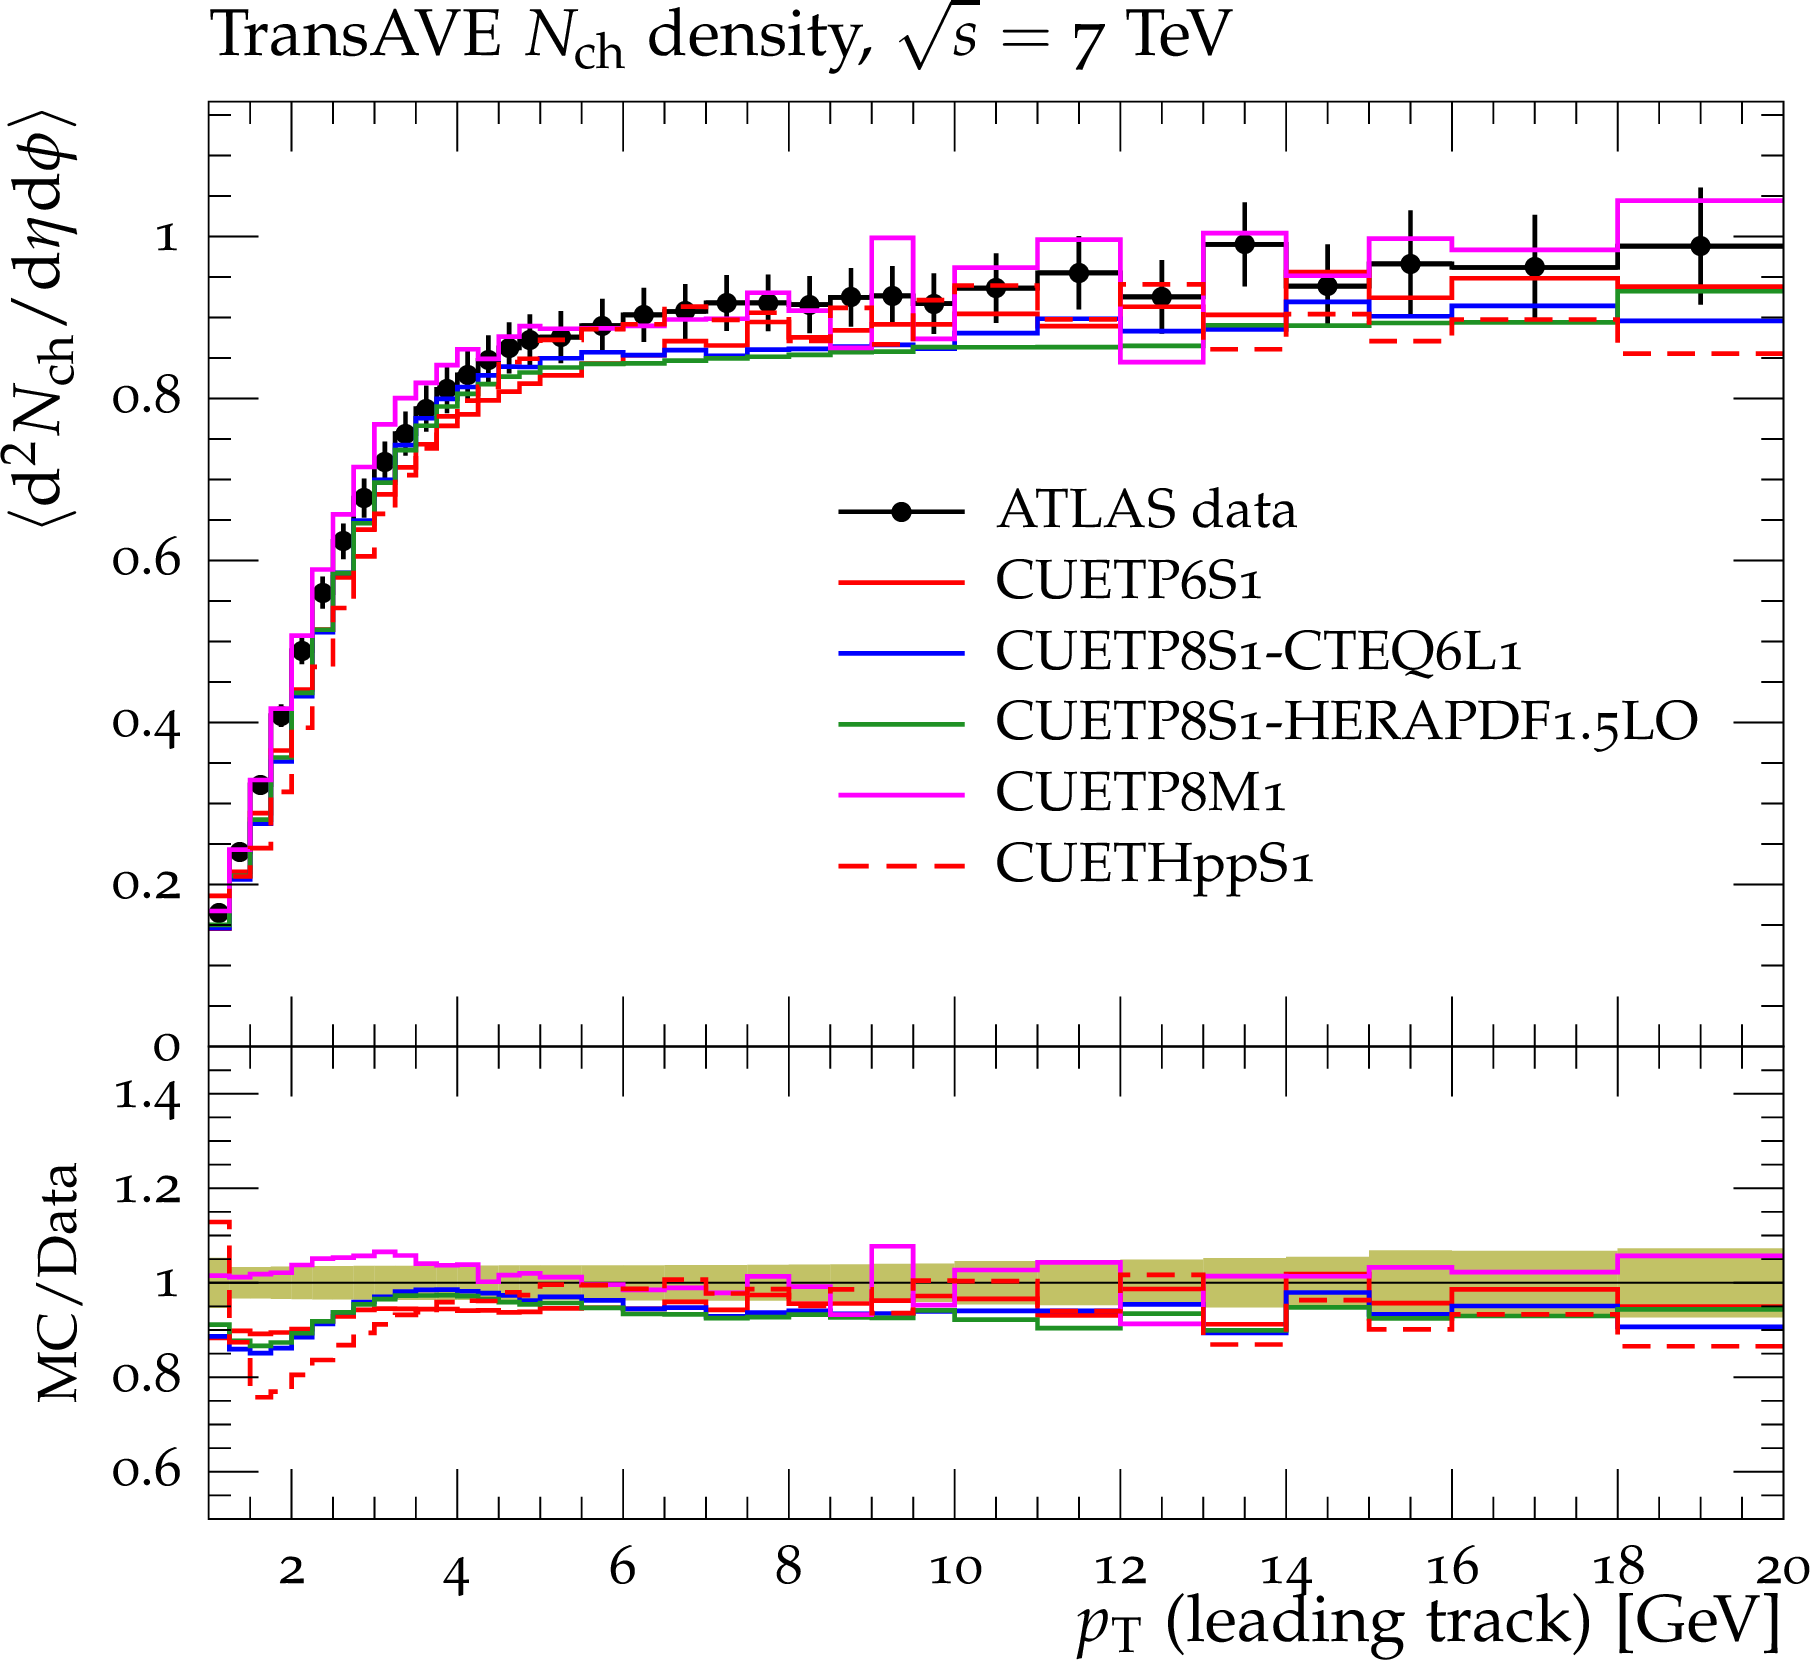
Figure 9-b:
ATLAS data at $\sqrt {s}=$ 7 TeV[39] for charged-particle (a,c) and $p_{\rm T}^{\rm sum}$\ densities (b,d) with $p_{\rm T}>$ 0.5 GeV and $|\eta |<$ 2.0 in the transverse (TransAVE) region compared to predictions of PYTHIA8 using CDPSTP8S2-4j (a,c) and CUETP8S1-CTEQ6L1, CUETP8S1-HERAPDF1.5LO, and CUETP8M1, plus HERWIG++ using CUETHppS1 (b,d). The predictions of CDPSTP8S2-4j are shown with an error band corresponding to the total uncertainty obtained from the eigentunes (see Appendix A). The bottom panels of each plot show the ratios of these predictions to the data, and the green bands around unity represent the total experimental uncertainty. |
png pdf |
Figure 9-c:
ATLAS data at $\sqrt {s}=$ 7 TeV[39] for charged-particle (a,c) and $p_{\rm T}^{\rm sum}$\ densities (b,d) with $p_{\rm T}>$ 0.5 GeV and $|\eta |<$ 2.0 in the transverse (TransAVE) region compared to predictions of PYTHIA8 using CDPSTP8S2-4j (a,c) and CUETP8S1-CTEQ6L1, CUETP8S1-HERAPDF1.5LO, and CUETP8M1, plus HERWIG++ using CUETHppS1 (b,d). The predictions of CDPSTP8S2-4j are shown with an error band corresponding to the total uncertainty obtained from the eigentunes (see Appendix A). The bottom panels of each plot show the ratios of these predictions to the data, and the green bands around unity represent the total experimental uncertainty. |
png pdf |
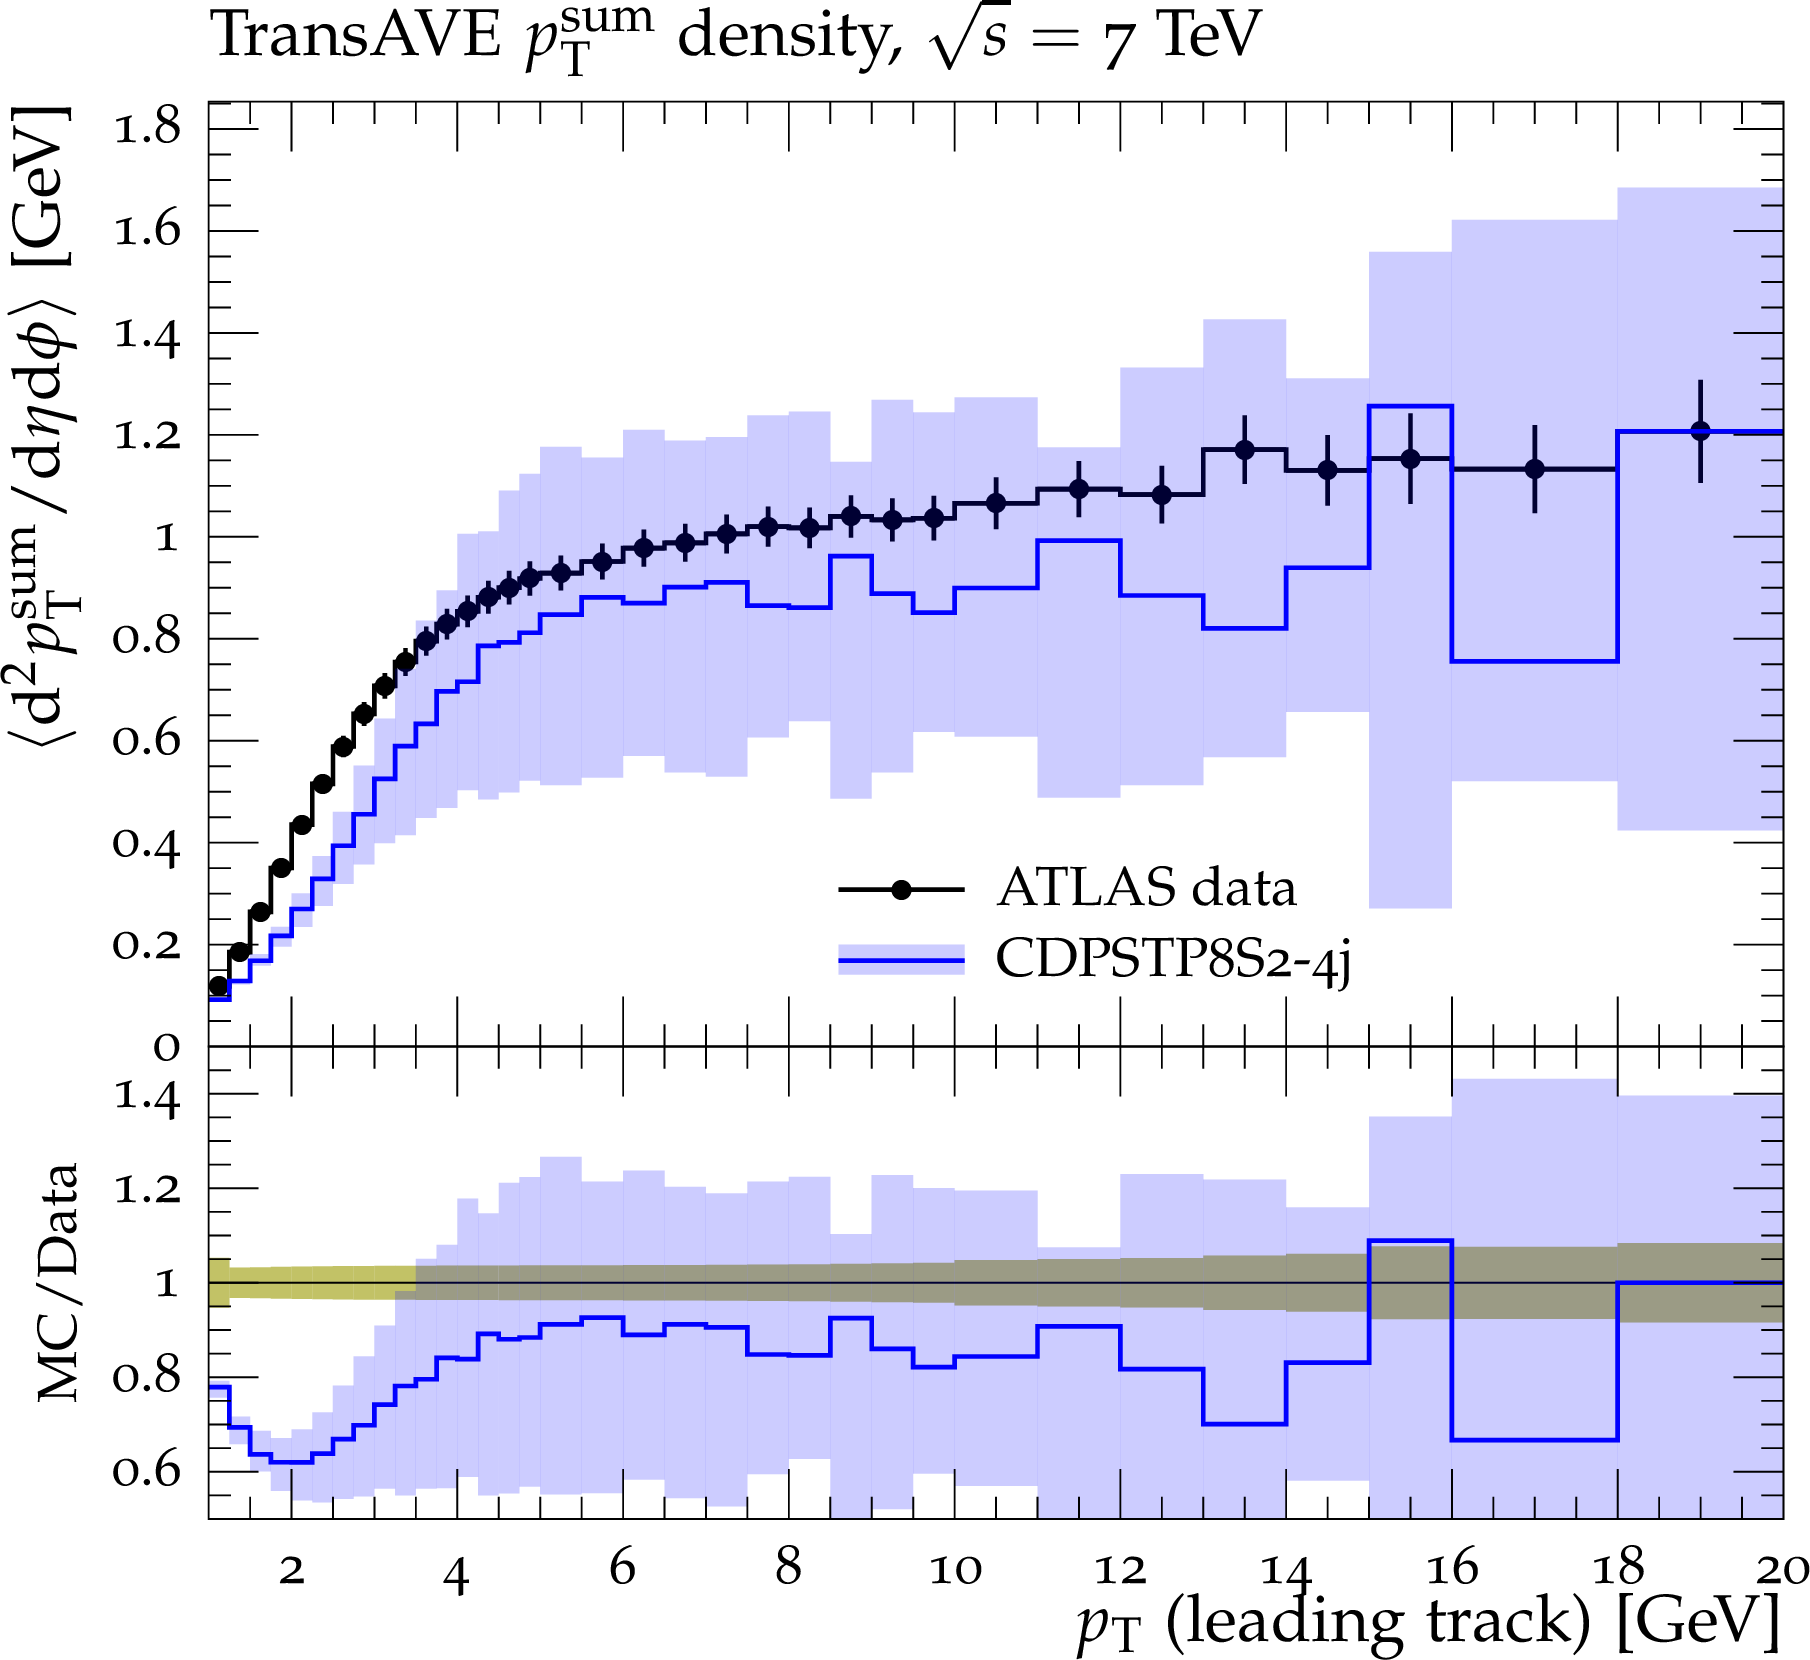
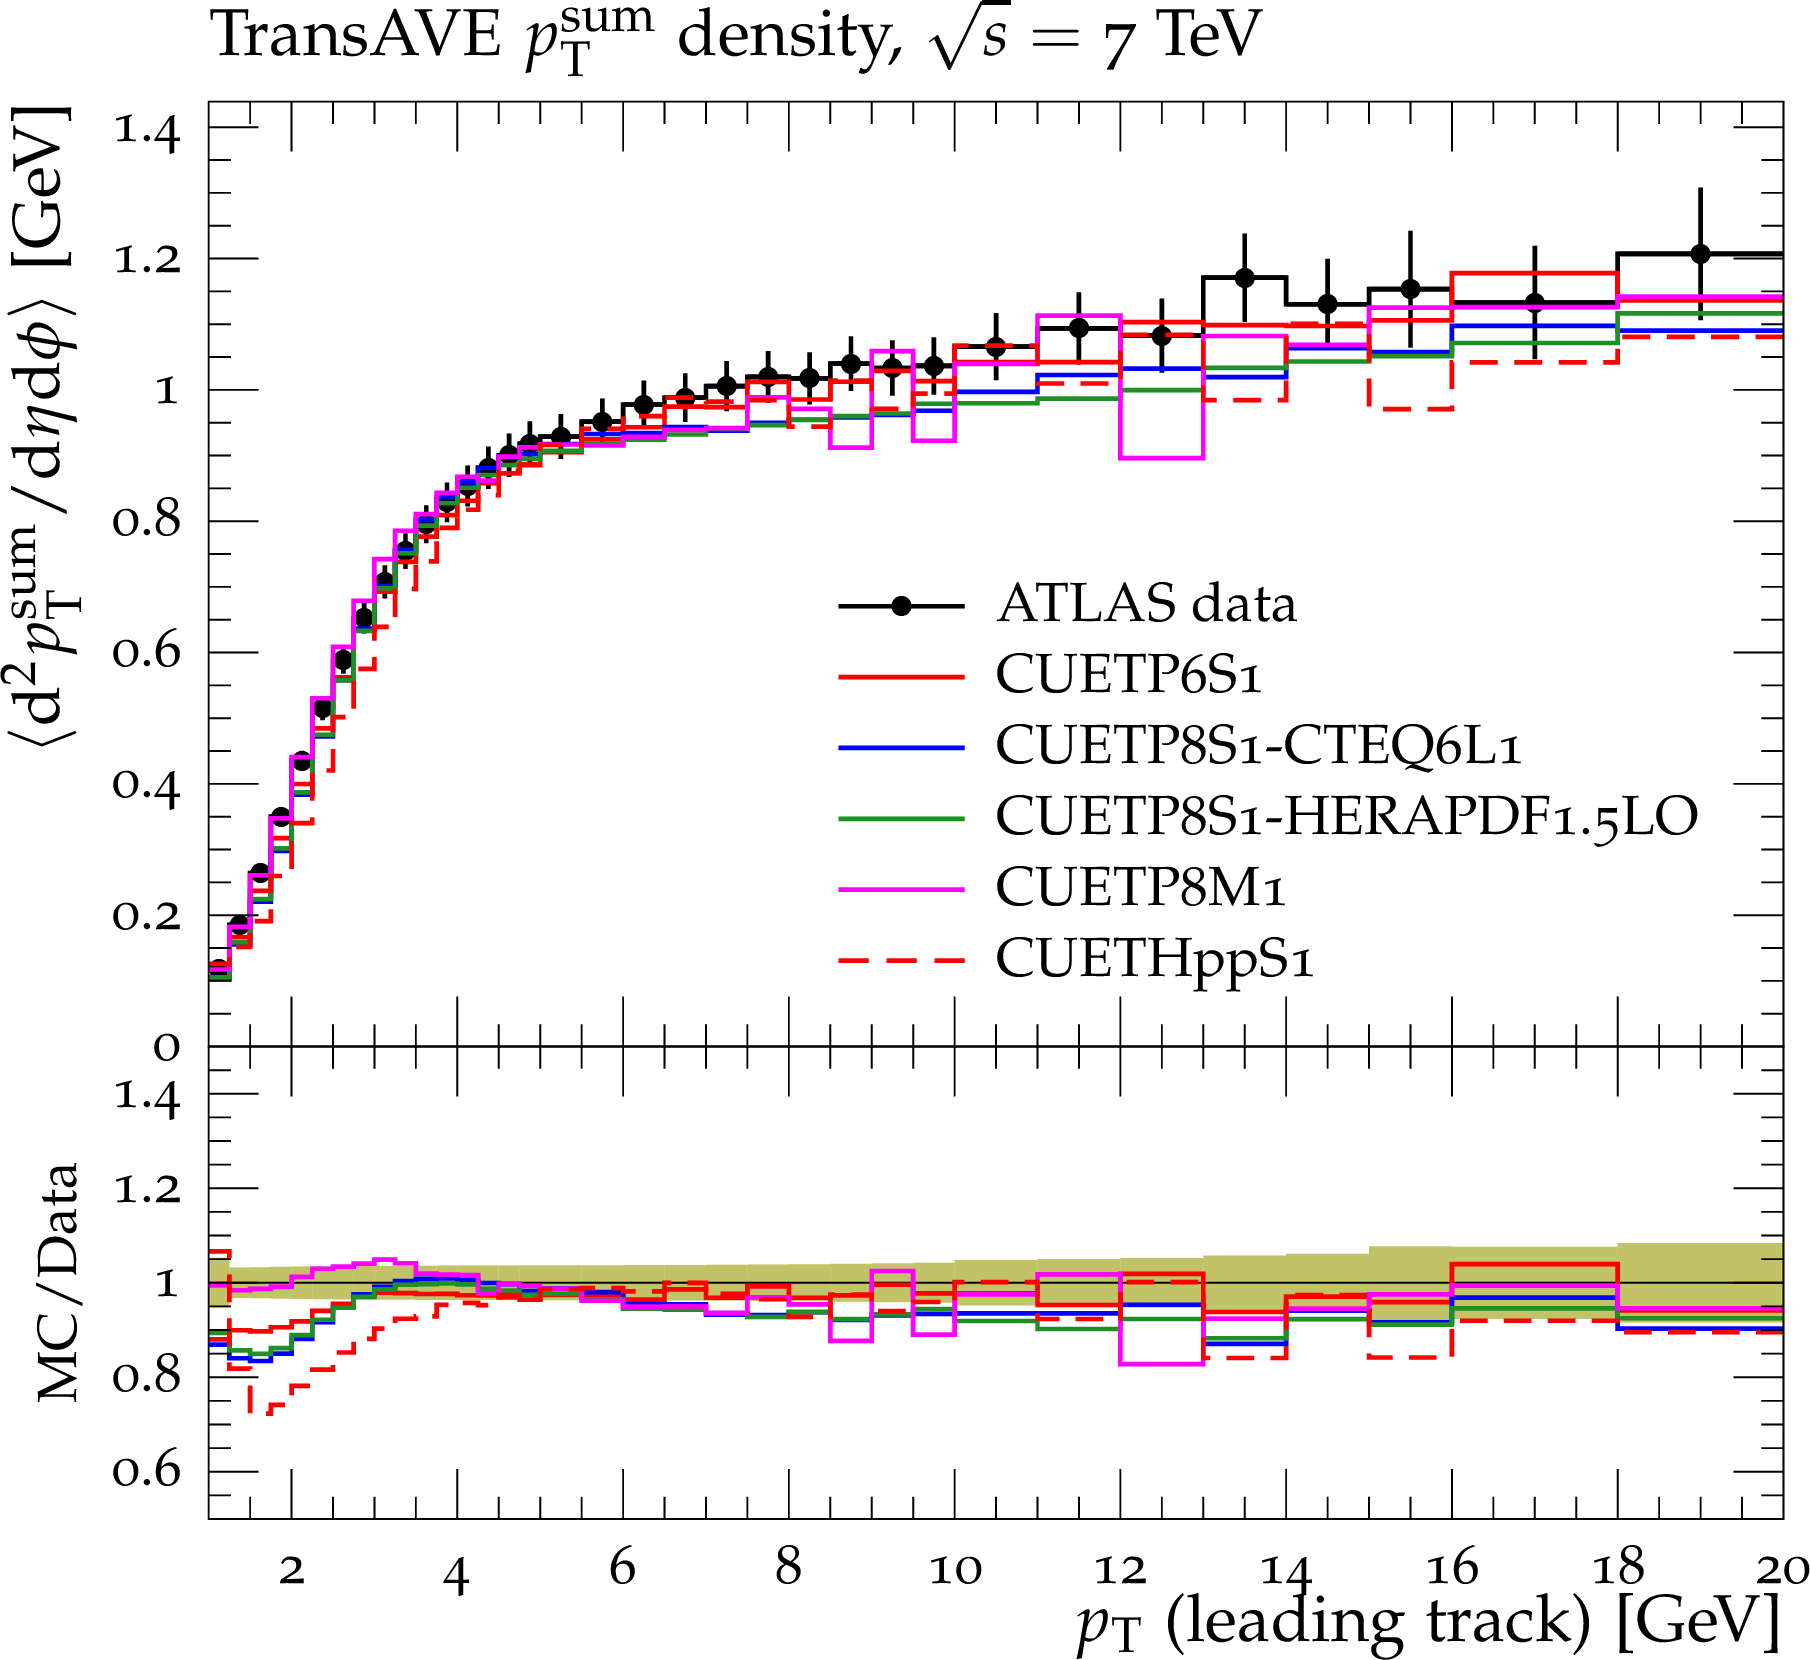
Figure 9-d:
ATLAS data at $\sqrt {s}=$ 7 TeV[39] for charged-particle (a,c) and $p_{\rm T}^{\rm sum}$\ densities (b,d) with $p_{\rm T}>$ 0.5 GeV and $|\eta |<$ 2.0 in the transverse (TransAVE) region compared to predictions of PYTHIA8 using CDPSTP8S2-4j (a,c) and CUETP8S1-CTEQ6L1, CUETP8S1-HERAPDF1.5LO, and CUETP8M1, plus HERWIG++ using CUETHppS1 (b,d). The predictions of CDPSTP8S2-4j are shown with an error band corresponding to the total uncertainty obtained from the eigentunes (see Appendix A). The bottom panels of each plot show the ratios of these predictions to the data, and the green bands around unity represent the total experimental uncertainty. |
png pdf |
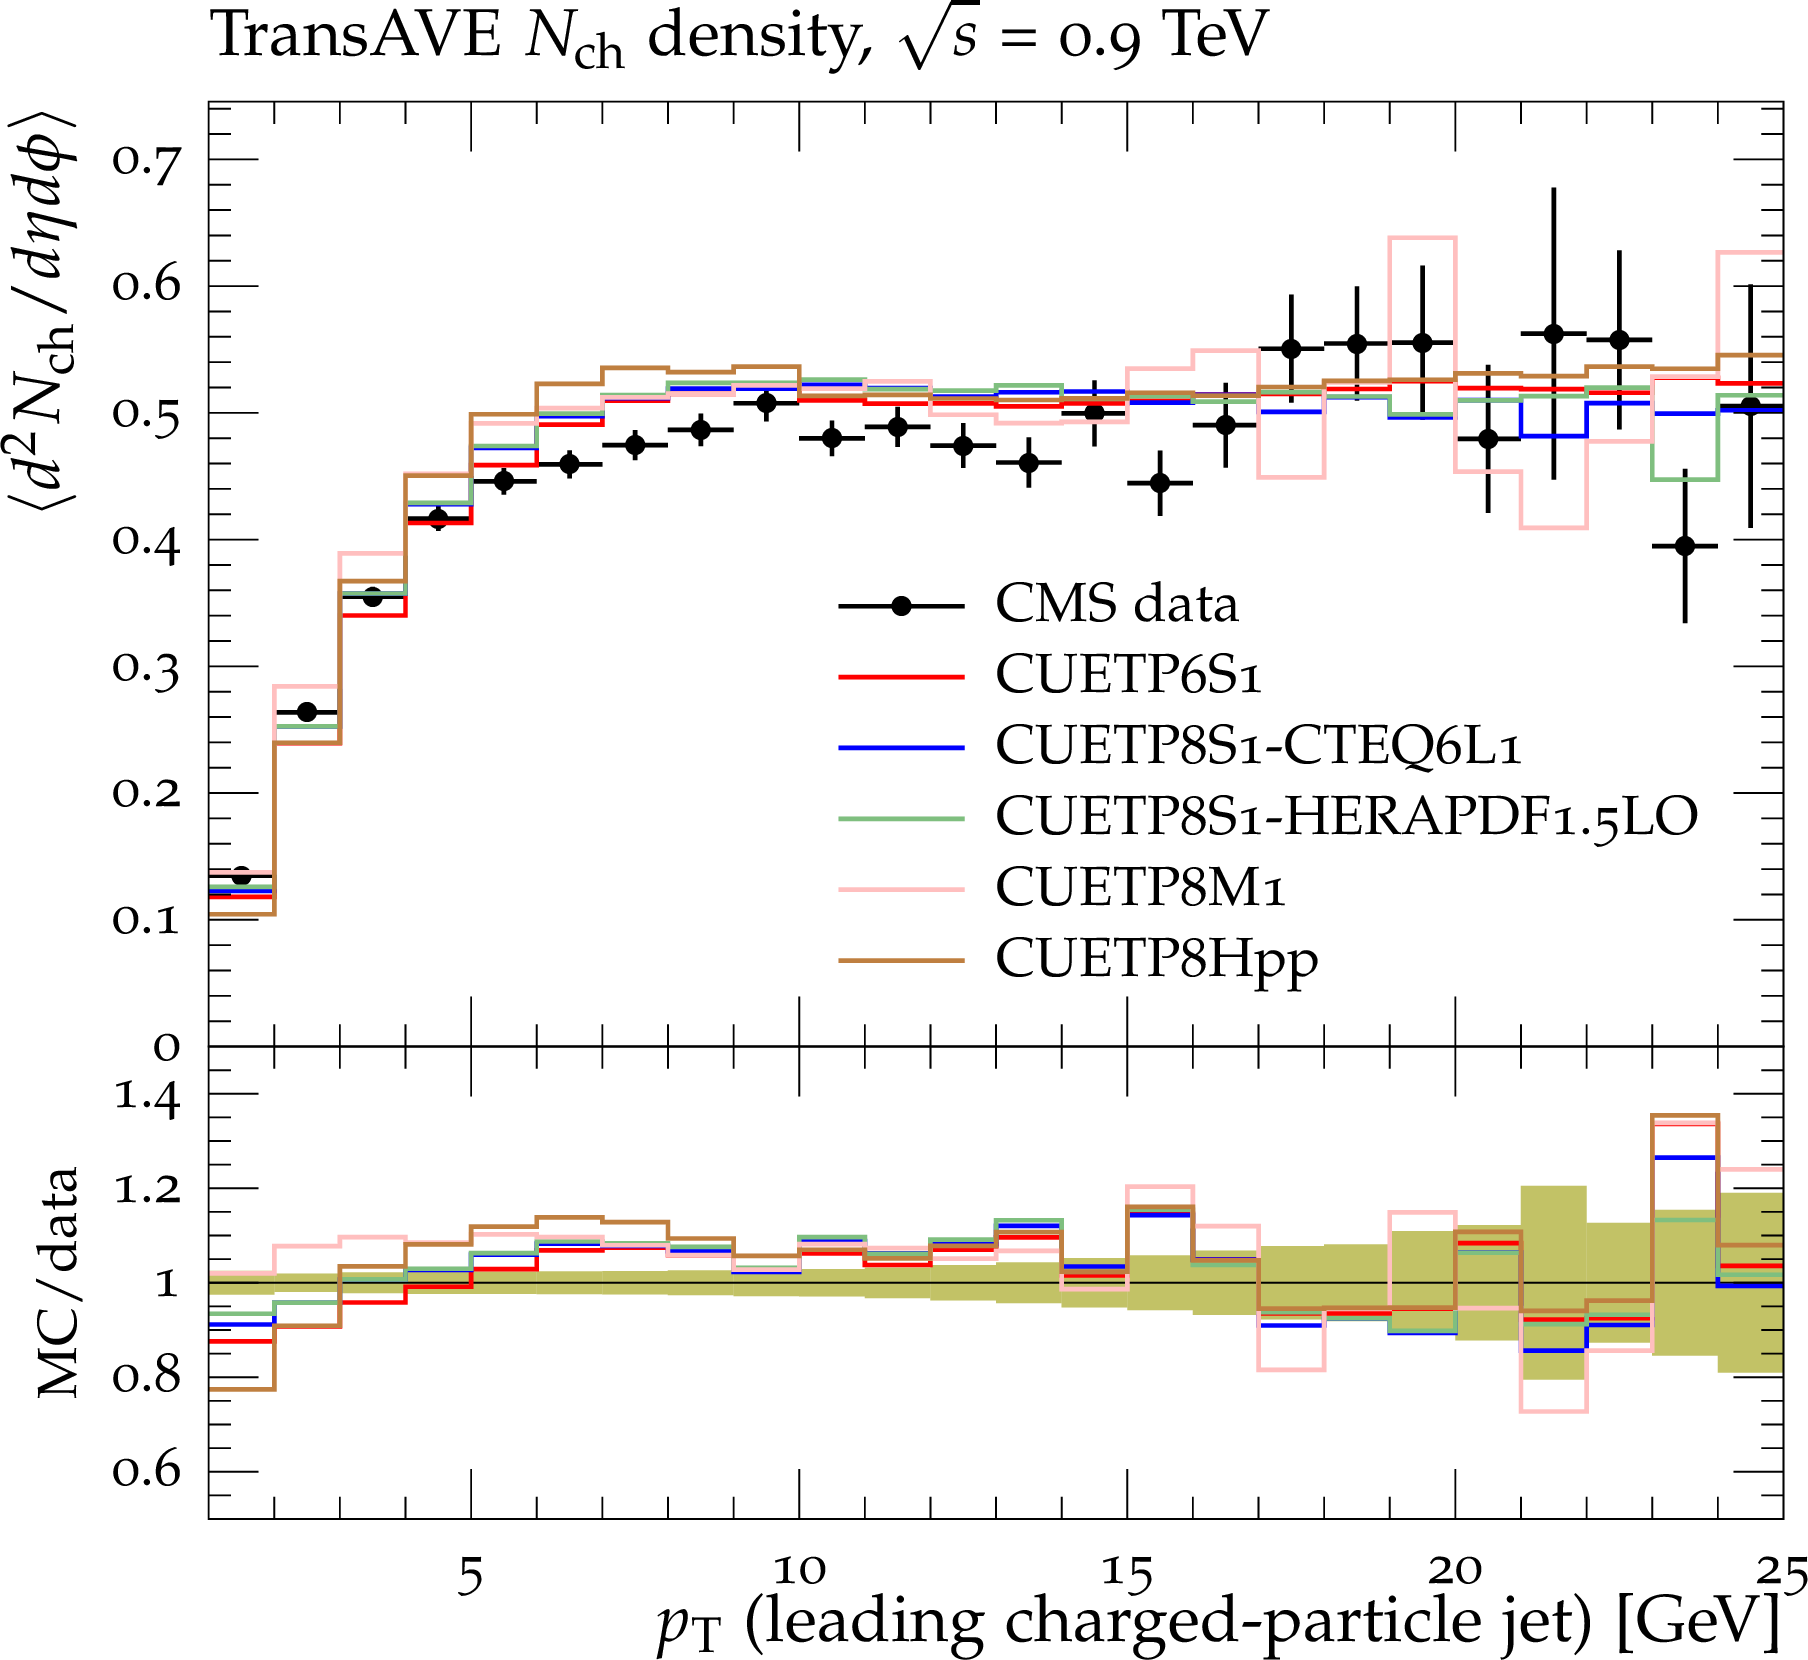
Figure 10-a:
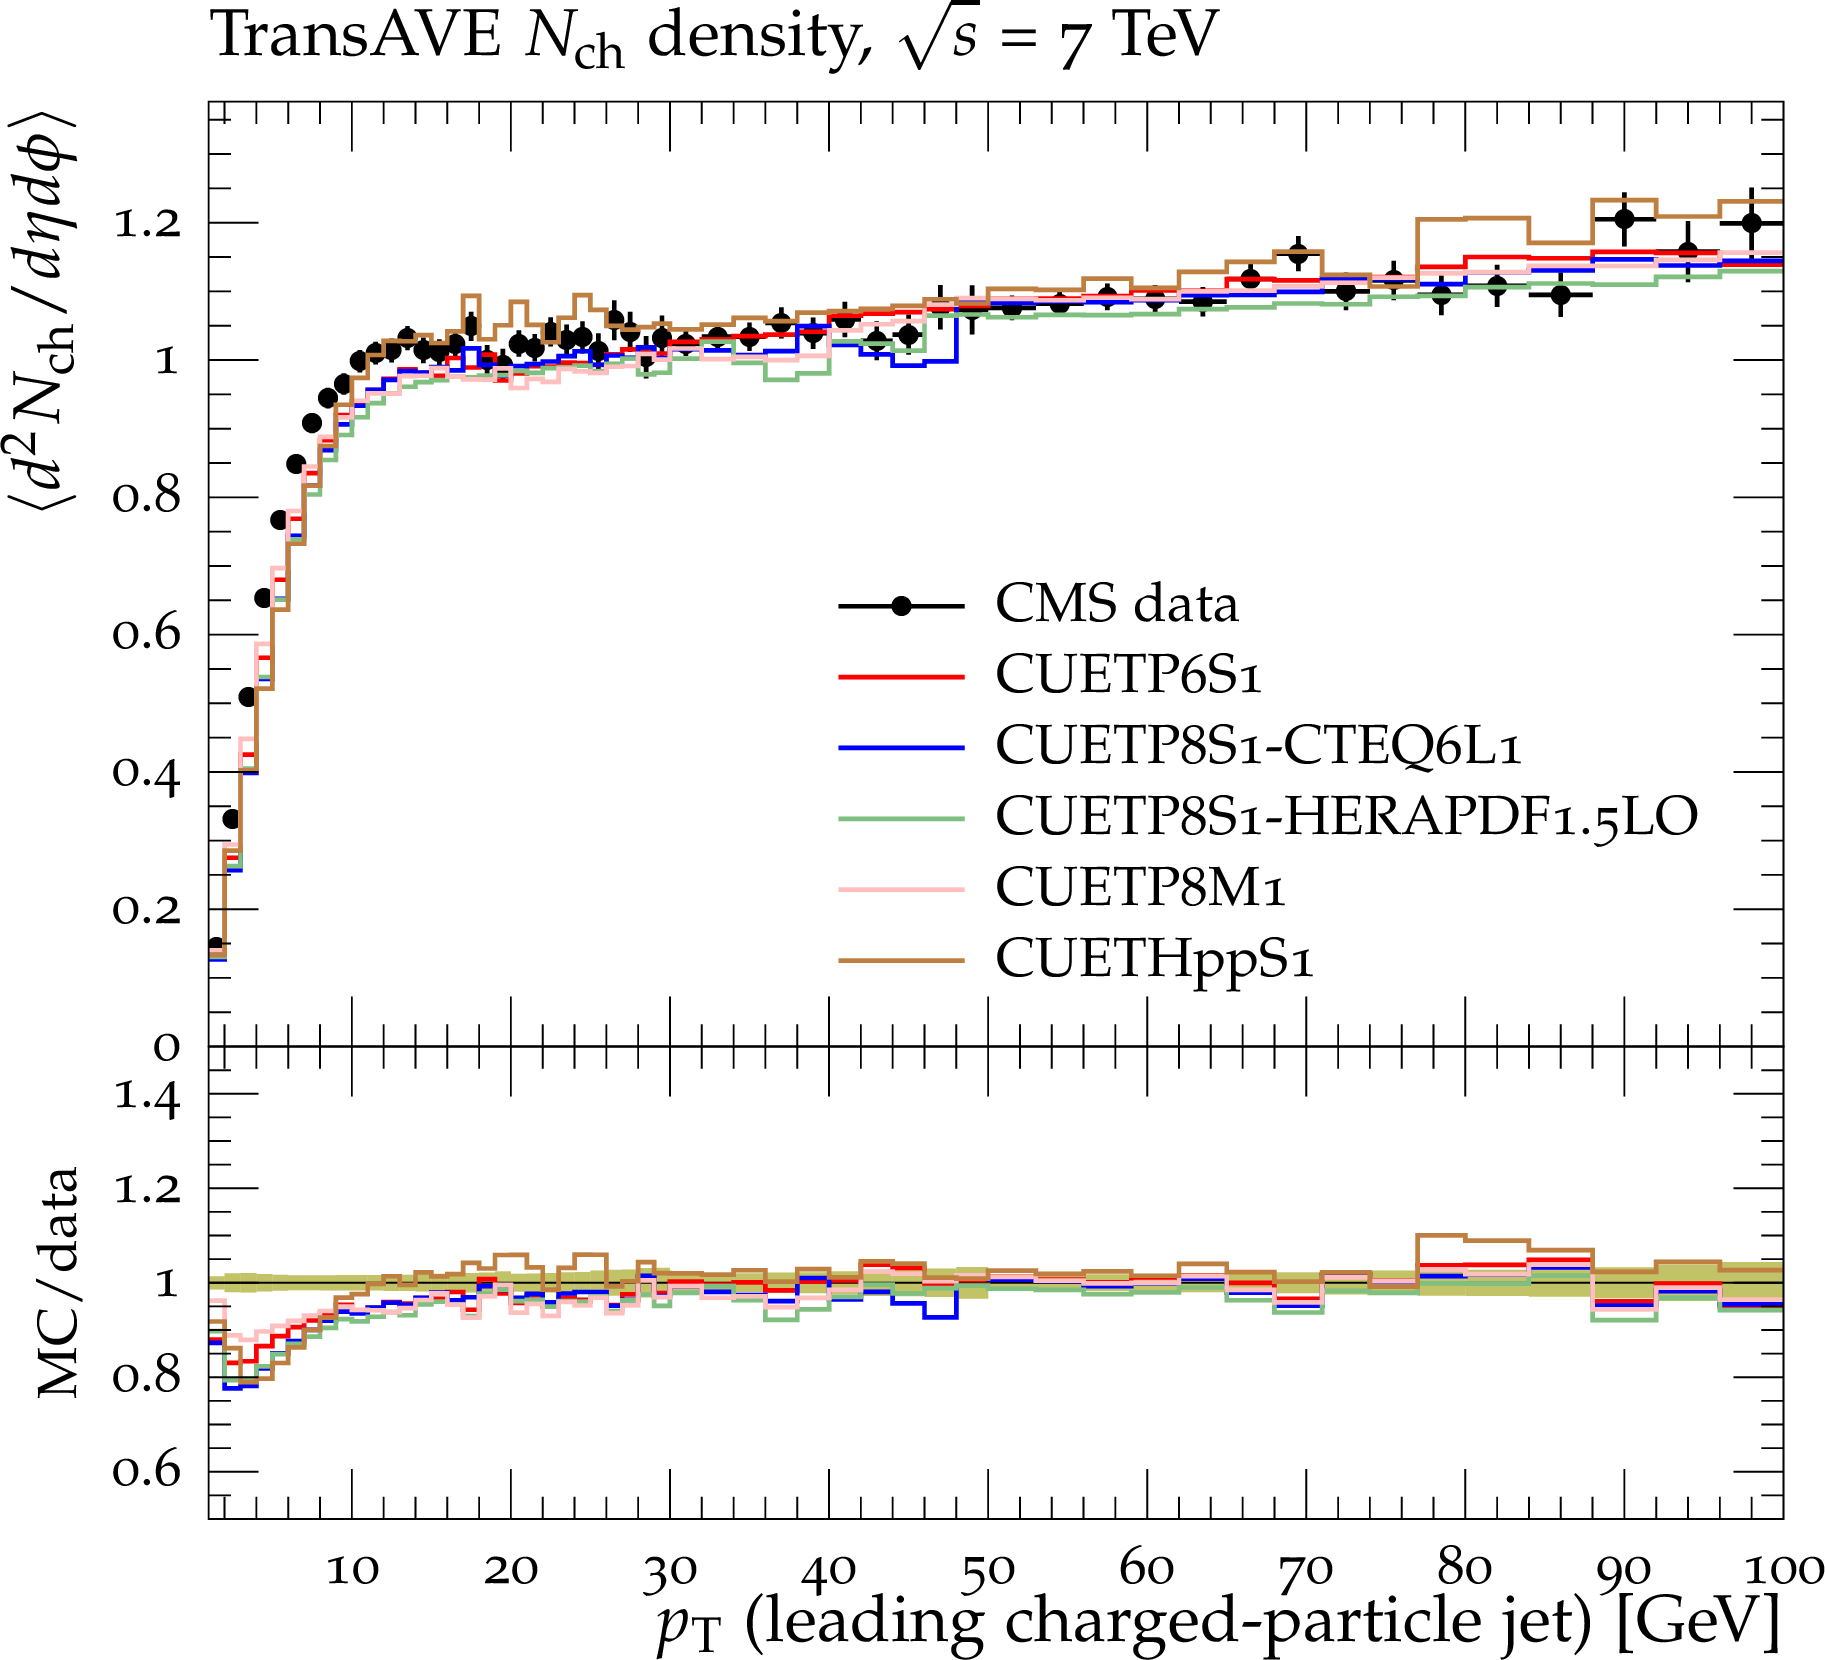
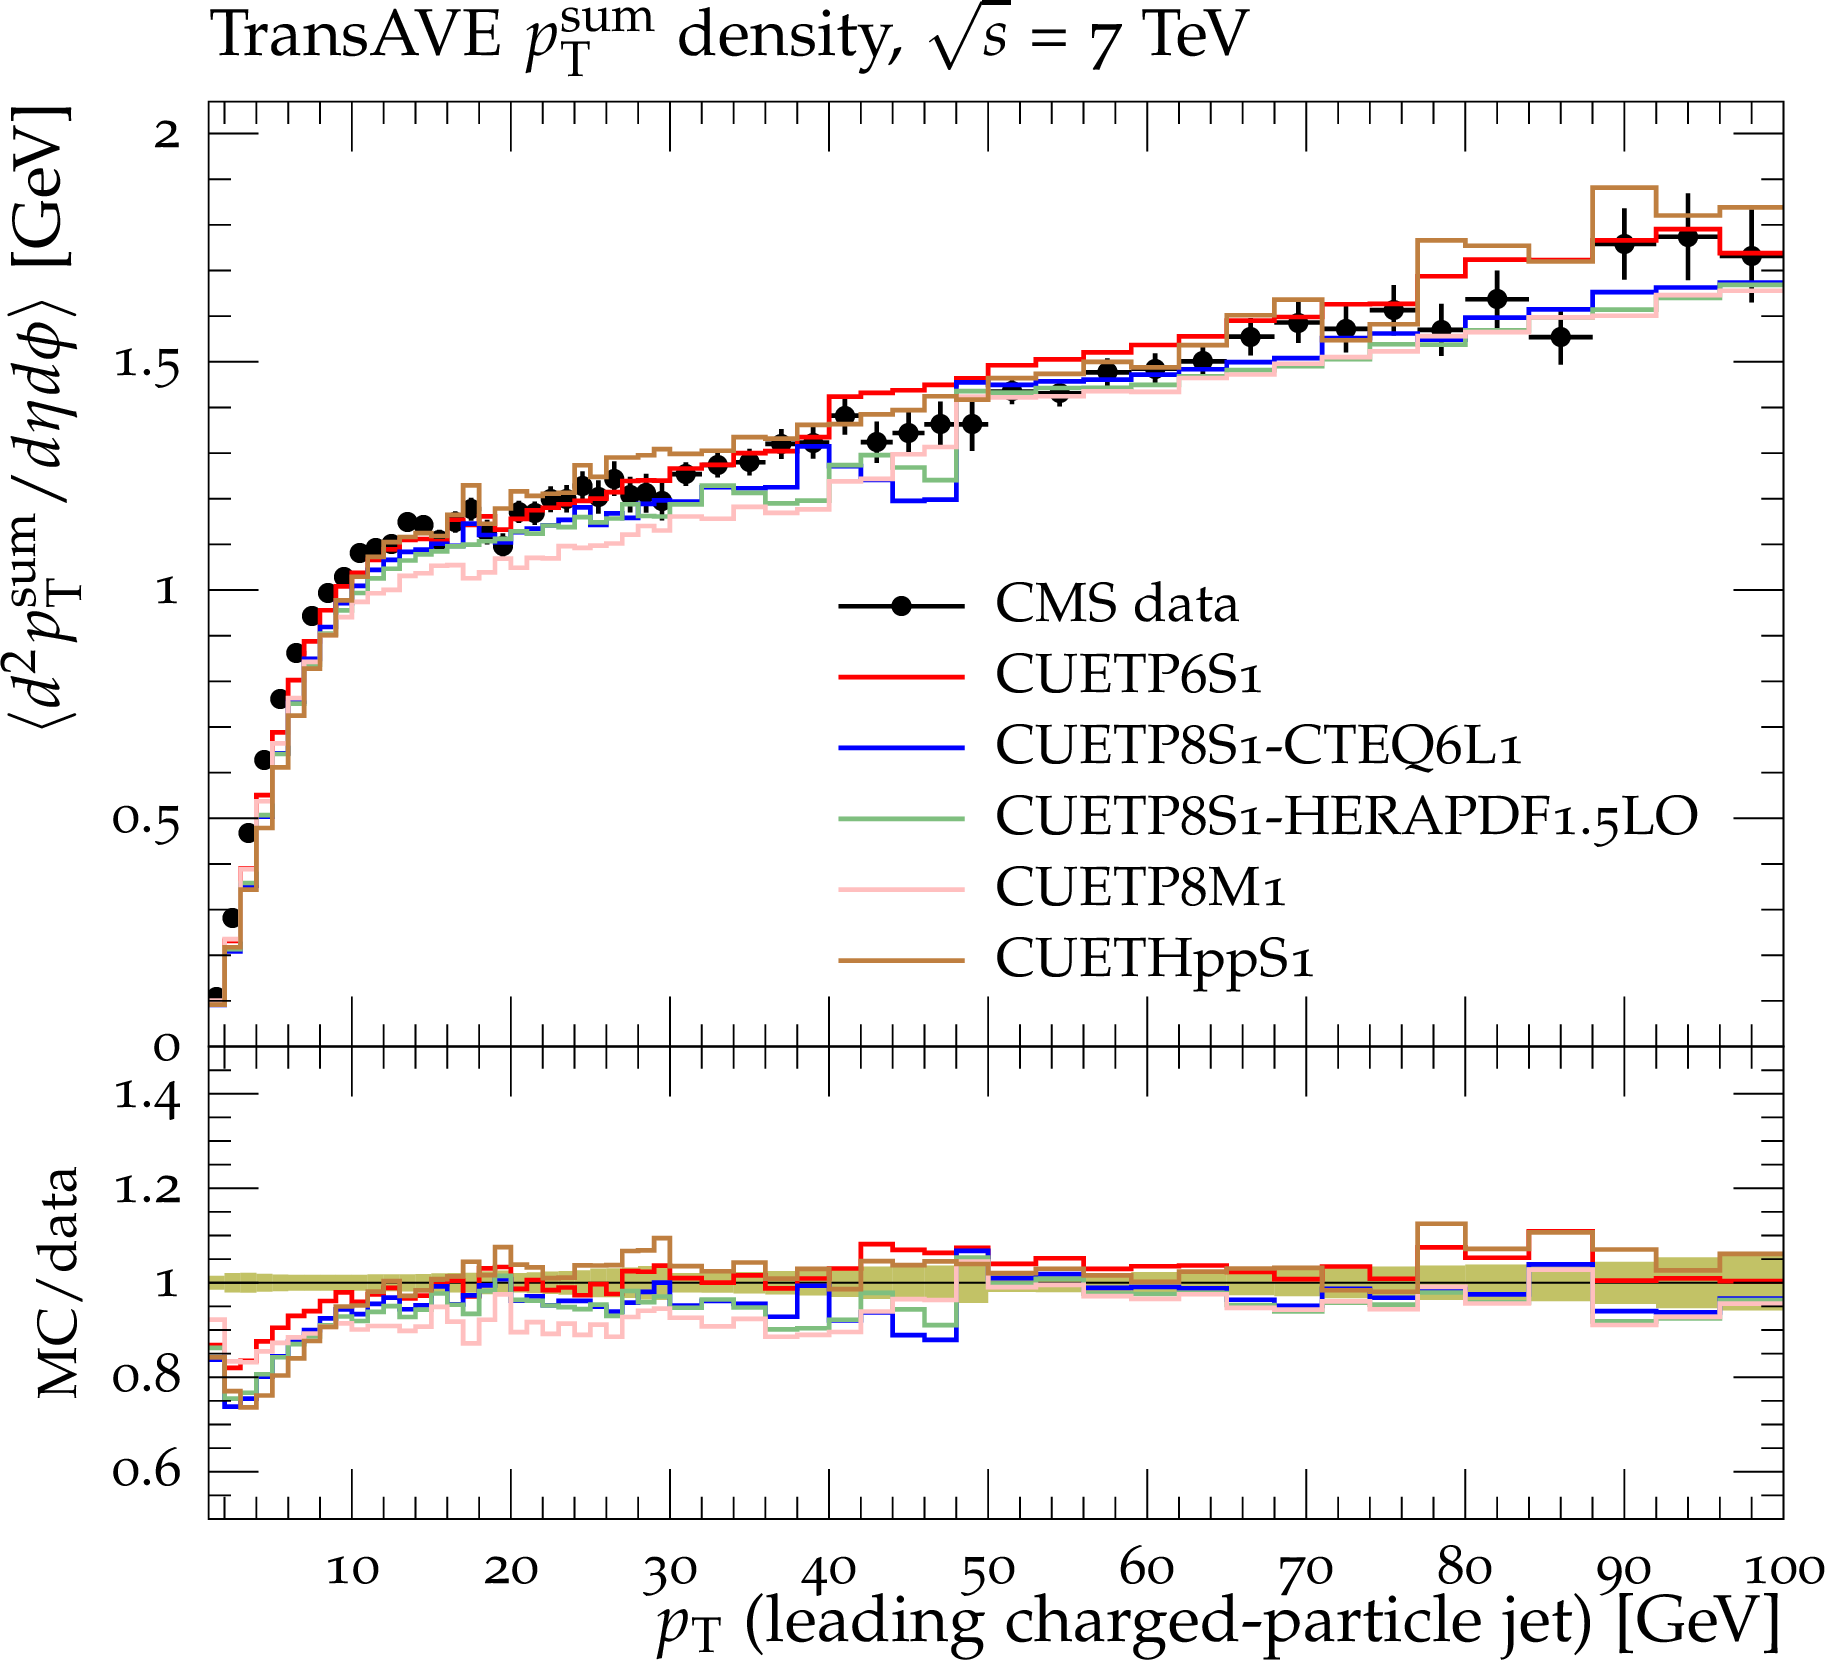
CMS data on charged-particle (a,c,e) and $p_{\rm T}^{\rm sum}$ (b,d,f) densities at $\sqrt {s} =$ 0.9[24] (a,b), $2.76$[42] (c,d), and $7$ TeV[24] (e,f) with $p_{\rm T}>$ 0.5 GeV and $|\eta |< $ 2.0 in the transverse (TransAVE) region as defined by the leading charged-particle jet, as a function of the transverse momentum of the leading charged-particle jet. The data are compared to predictions of PYTHIA6 using CUETP6S1-CTEQ6L1, PYTHIA8 using CUETP8S1-CTEQ6L1, CUETP8S1-HERAPDF1.5LO, and CUETP8M1, and HERWIG++ using CUETHppS1. The bottom panels of each plot show the ratios of these predictions to the data, and the green bands around unity represent the total experimental uncertainty. |
png pdf |
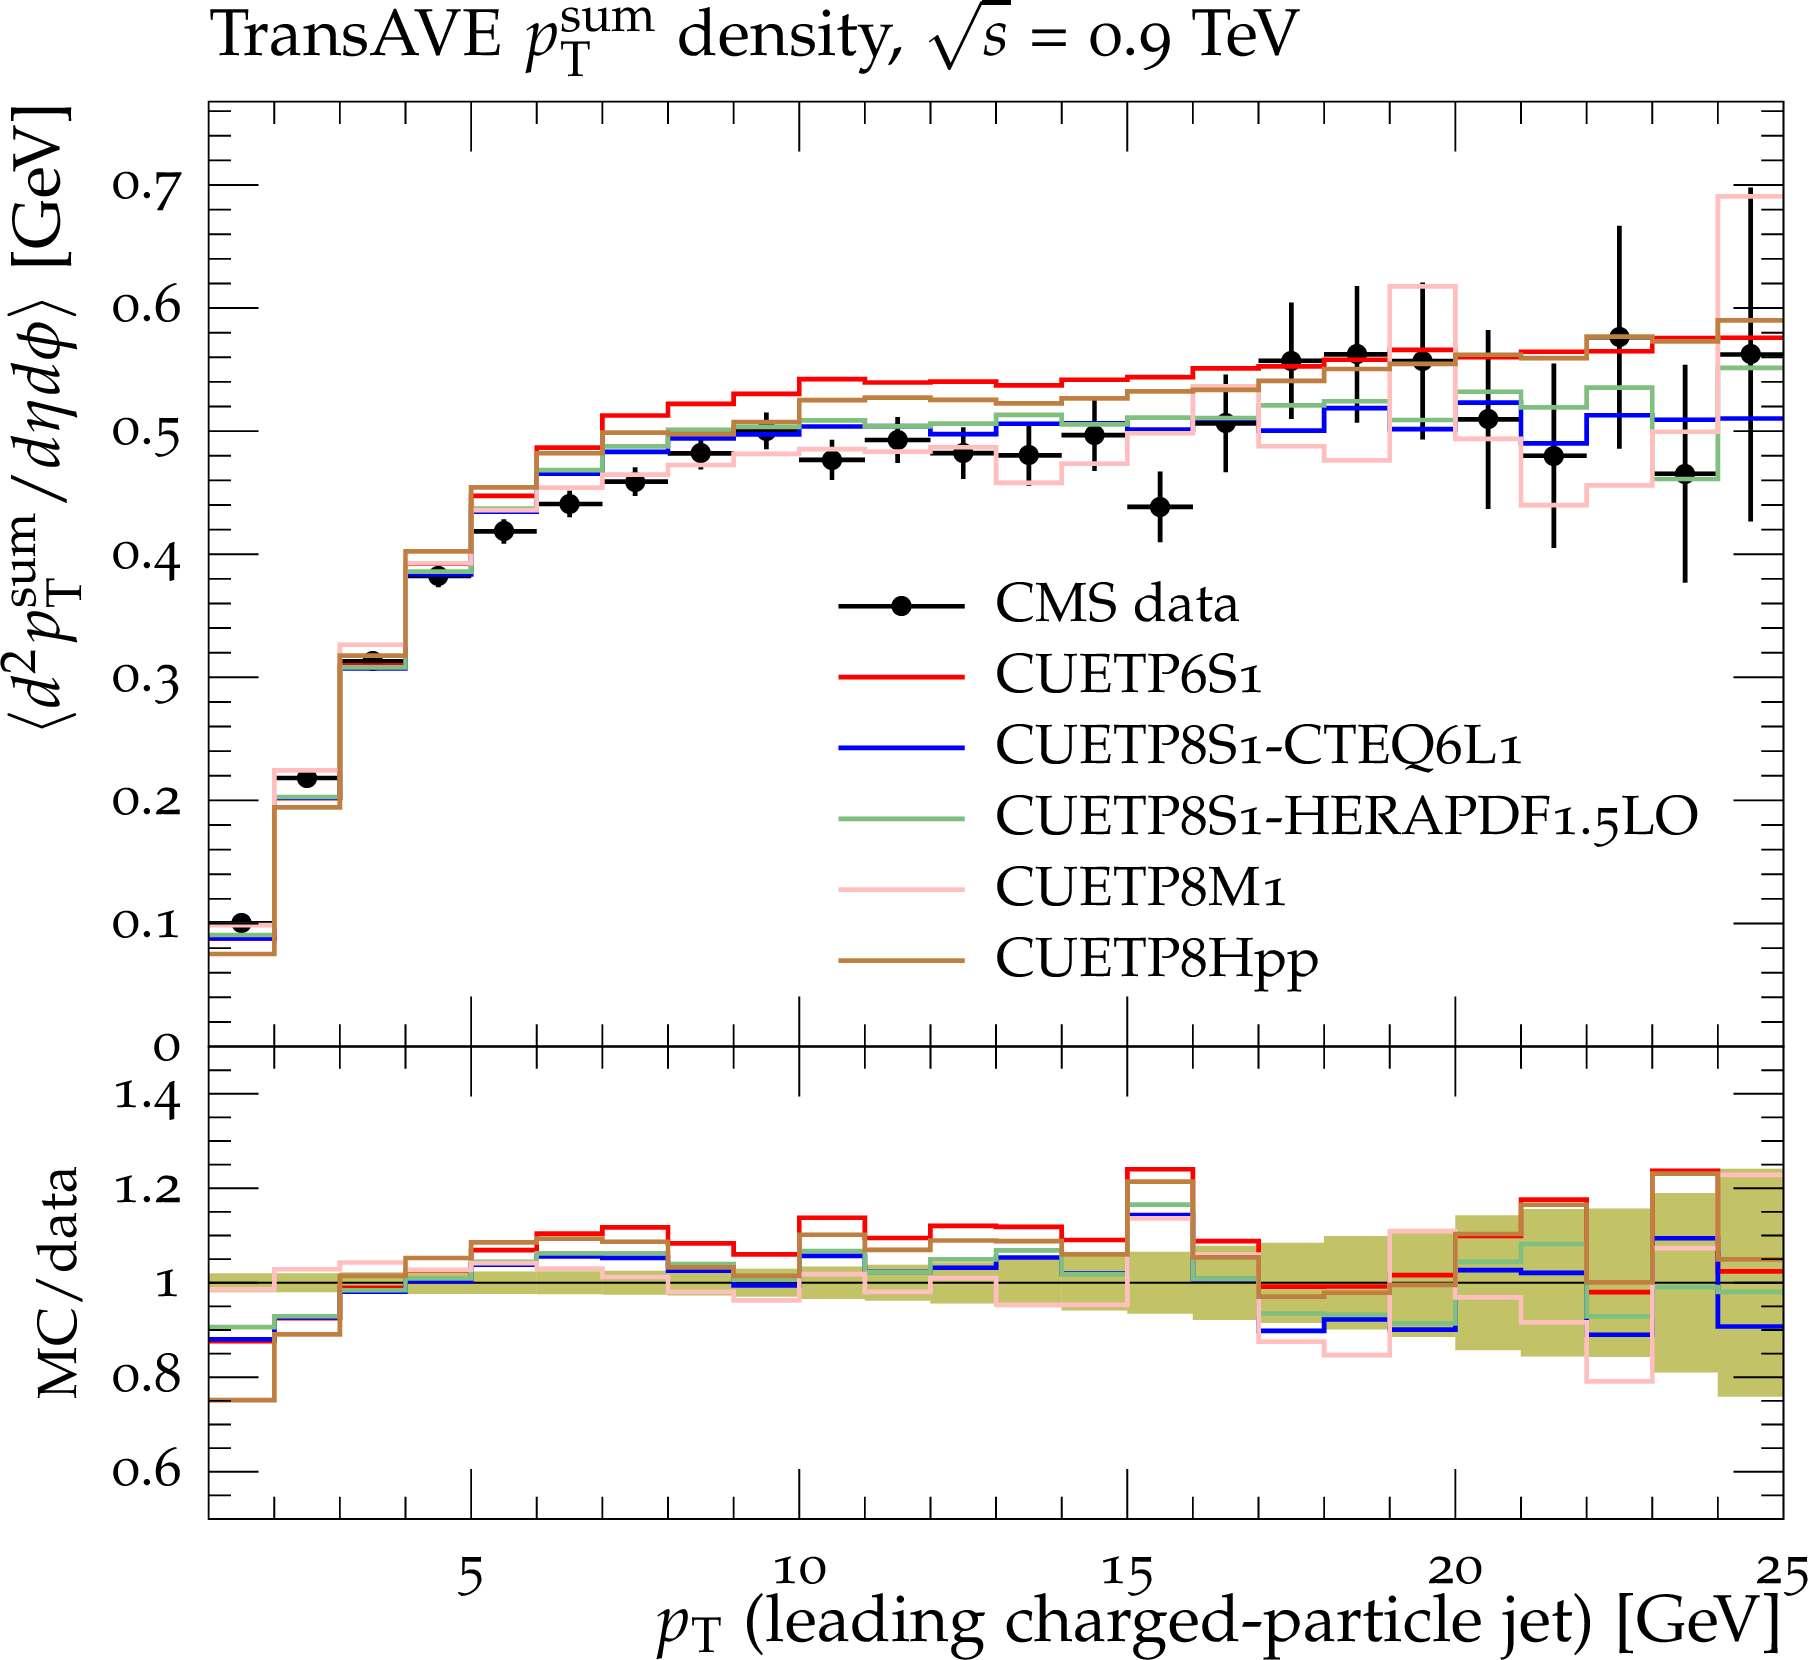
Figure 10-b:
CMS data on charged-particle (a,c,e) and $p_{\rm T}^{\rm sum}$ (b,d,f) densities at $\sqrt {s} =$ 0.9[24] (a,b), $2.76$[42] (c,d), and $7$ TeV[24] (e,f) with $p_{\rm T}>$ 0.5 GeV and $|\eta |< $ 2.0 in the transverse (TransAVE) region as defined by the leading charged-particle jet, as a function of the transverse momentum of the leading charged-particle jet. The data are compared to predictions of PYTHIA6 using CUETP6S1-CTEQ6L1, PYTHIA8 using CUETP8S1-CTEQ6L1, CUETP8S1-HERAPDF1.5LO, and CUETP8M1, and HERWIG++ using CUETHppS1. The bottom panels of each plot show the ratios of these predictions to the data, and the green bands around unity represent the total experimental uncertainty. |
png pdf |
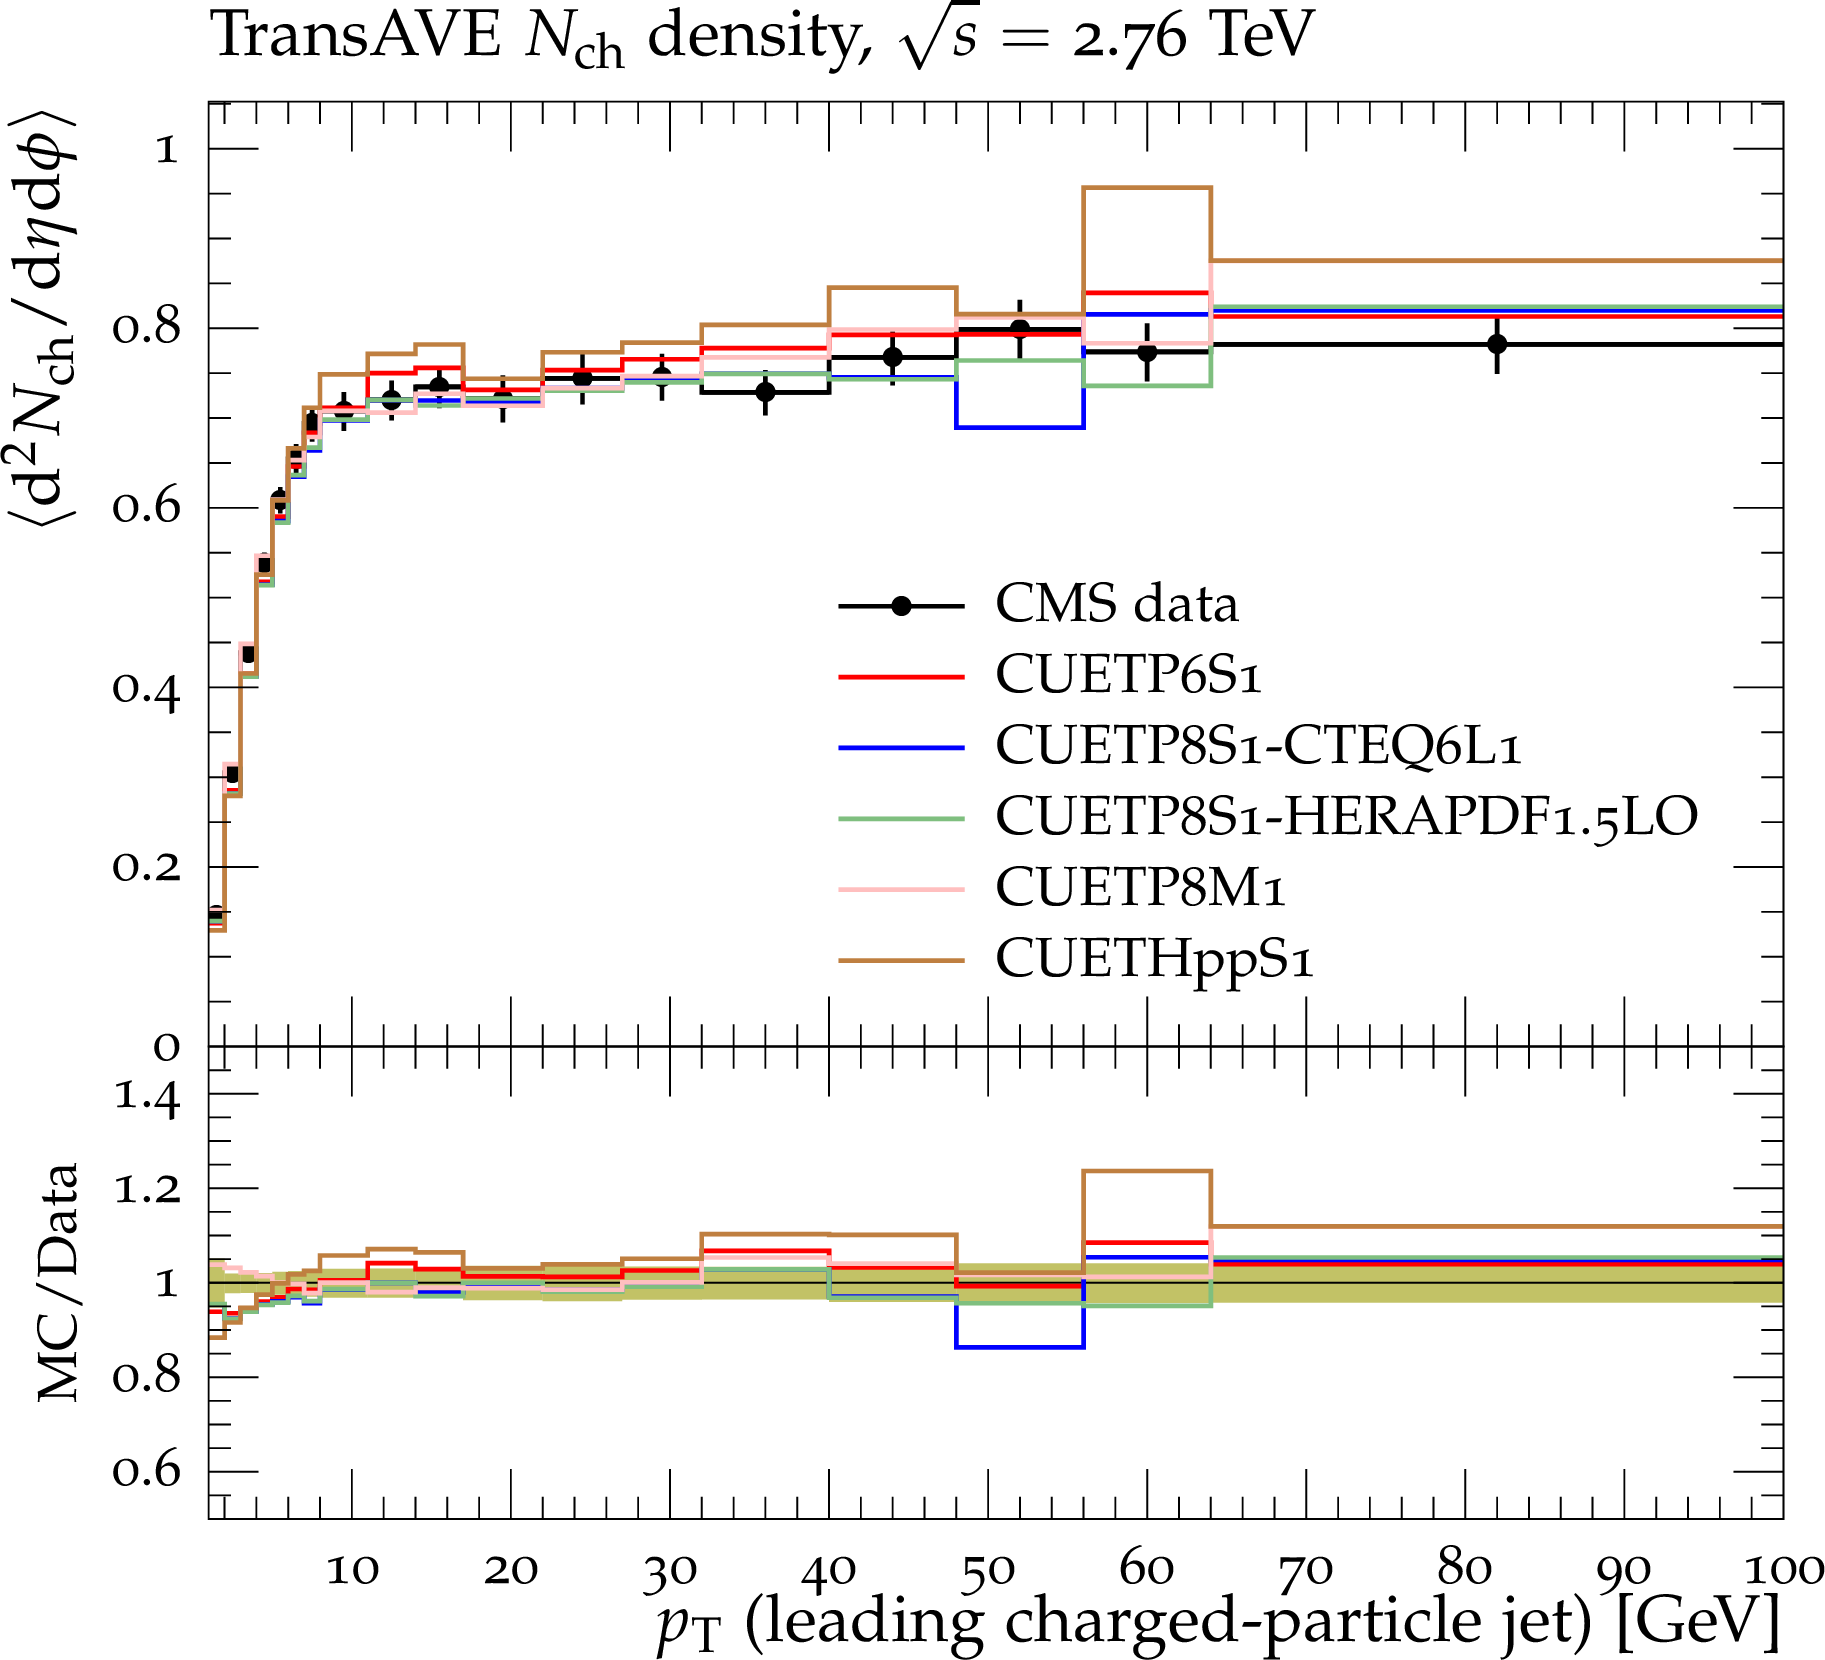
Figure 10-c:
CMS data on charged-particle (a,c,e) and $p_{\rm T}^{\rm sum}$ (b,d,f) densities at $\sqrt {s} =$ 0.9[24] (a,b), $2.76$[42] (c,d), and $7$ TeV[24] (e,f) with $p_{\rm T}>$ 0.5 GeV and $|\eta |< $ 2.0 in the transverse (TransAVE) region as defined by the leading charged-particle jet, as a function of the transverse momentum of the leading charged-particle jet. The data are compared to predictions of PYTHIA6 using CUETP6S1-CTEQ6L1, PYTHIA8 using CUETP8S1-CTEQ6L1, CUETP8S1-HERAPDF1.5LO, and CUETP8M1, and HERWIG++ using CUETHppS1. The bottom panels of each plot show the ratios of these predictions to the data, and the green bands around unity represent the total experimental uncertainty. |
png pdf |
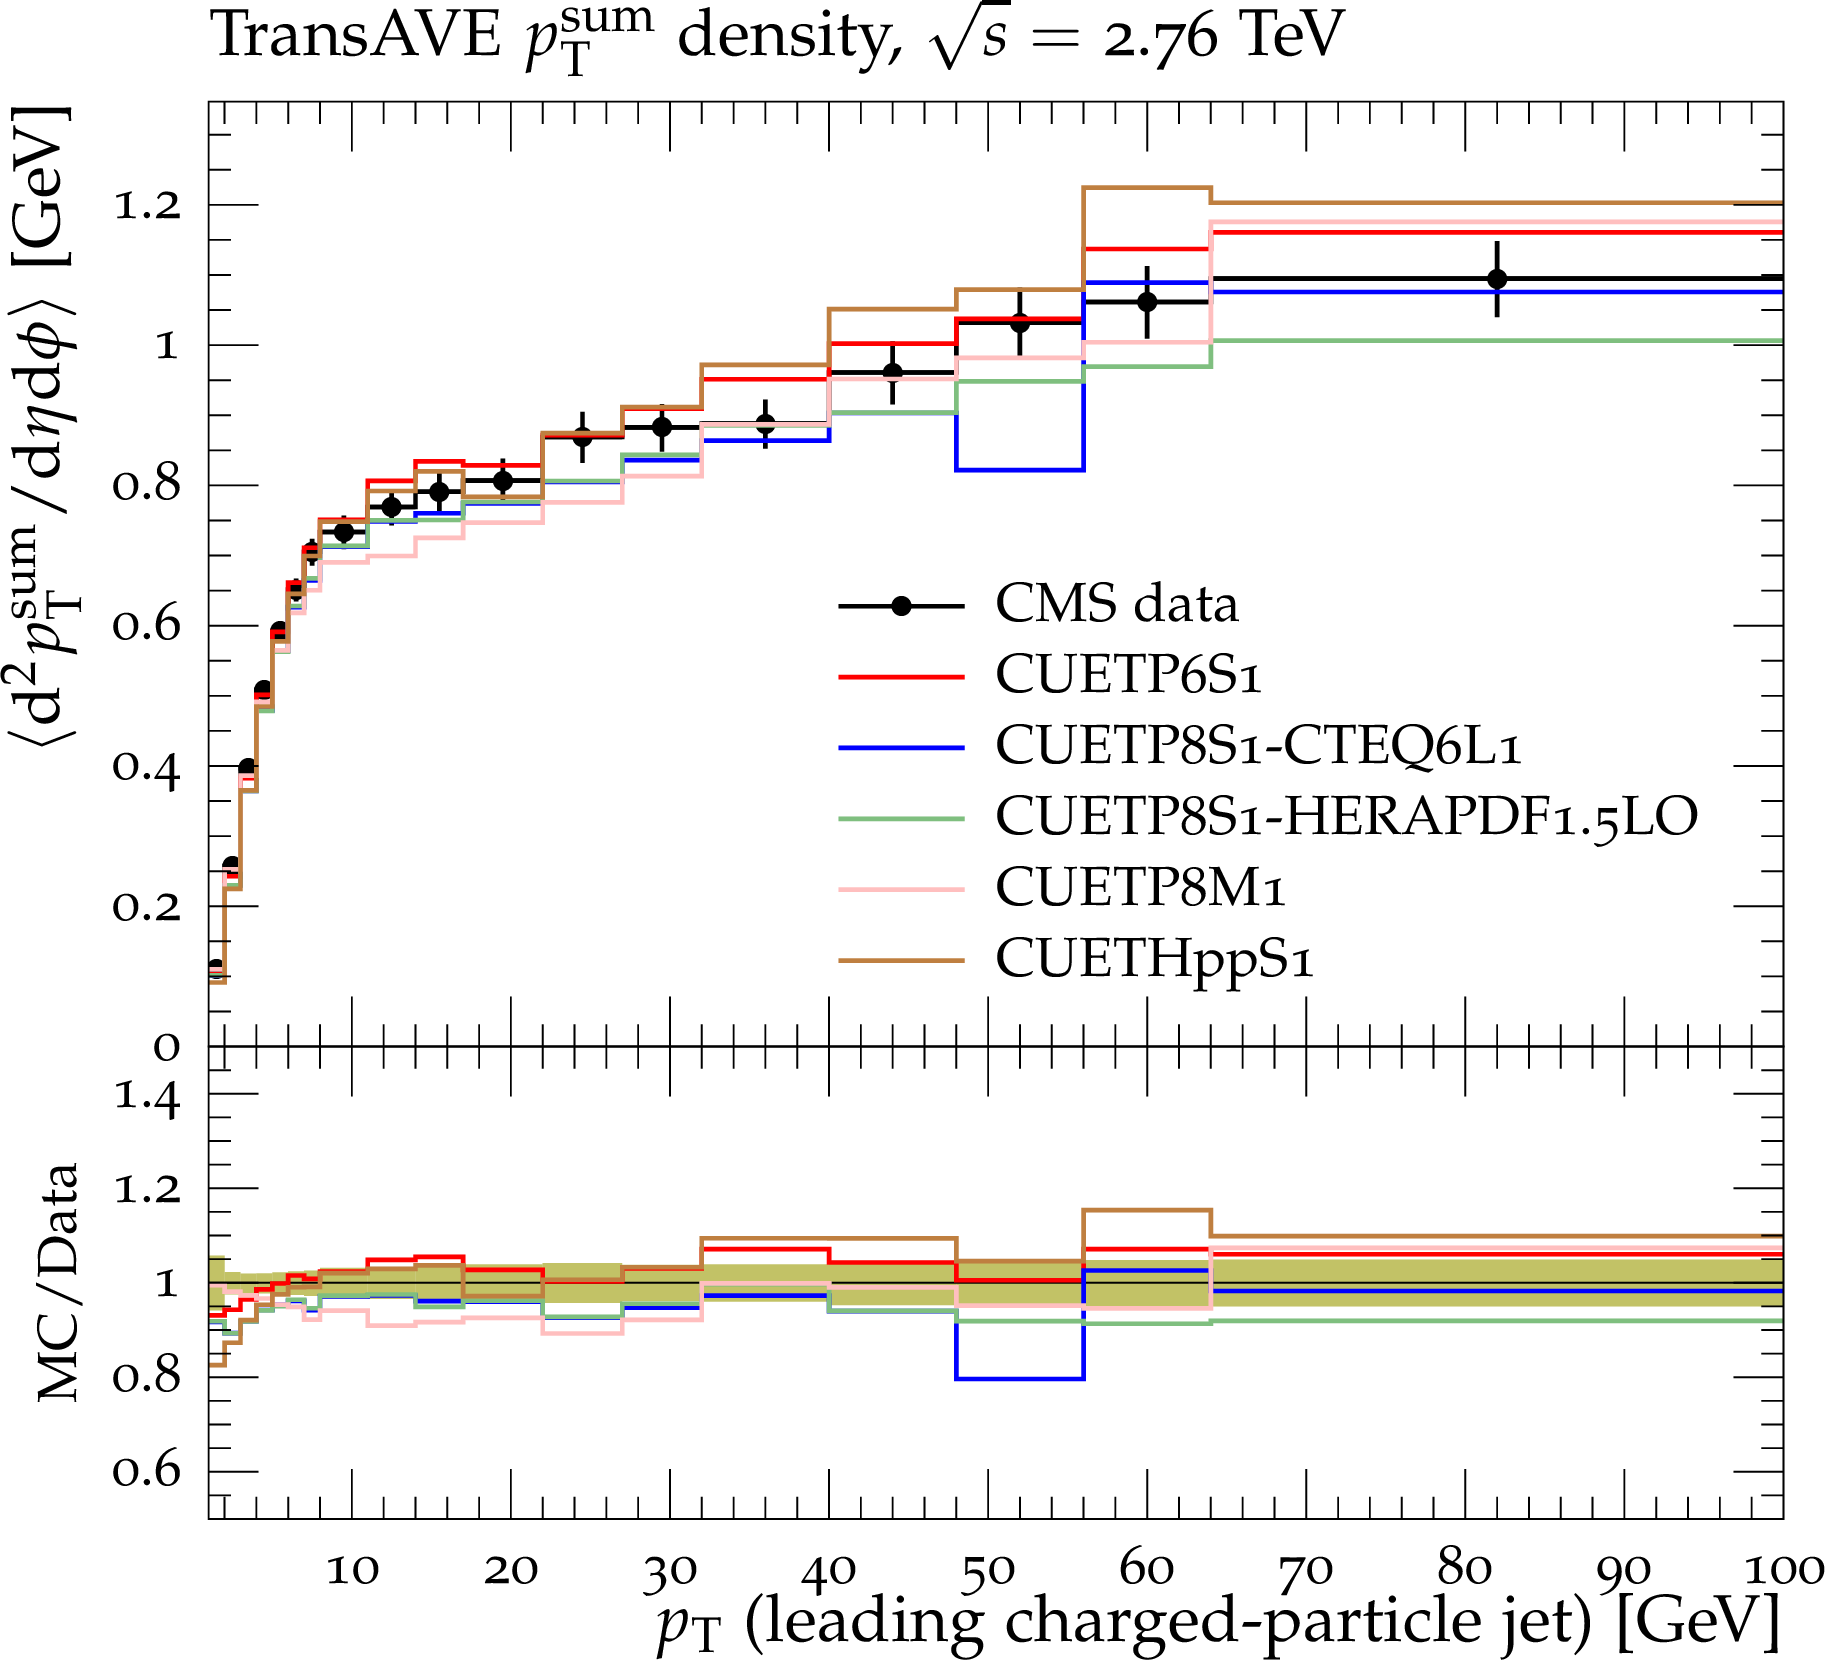
Figure 10-d:
CMS data on charged-particle (a,c,e) and $p_{\rm T}^{\rm sum}$ (b,d,f) densities at $\sqrt {s} =$ 0.9[24] (a,b), $2.76$[42] (c,d), and $7$ TeV[24] (e,f) with $p_{\rm T}>$ 0.5 GeV and $|\eta |< $ 2.0 in the transverse (TransAVE) region as defined by the leading charged-particle jet, as a function of the transverse momentum of the leading charged-particle jet. The data are compared to predictions of PYTHIA6 using CUETP6S1-CTEQ6L1, PYTHIA8 using CUETP8S1-CTEQ6L1, CUETP8S1-HERAPDF1.5LO, and CUETP8M1, and HERWIG++ using CUETHppS1. The bottom panels of each plot show the ratios of these predictions to the data, and the green bands around unity represent the total experimental uncertainty. |
png pdf |
Figure 10-e:
CMS data on charged-particle (a,c,e) and $p_{\rm T}^{\rm sum}$ (b,d,f) densities at $\sqrt {s} =$ 0.9[24] (a,b), $2.76$[42] (c,d), and $7$ TeV[24] (e,f) with $p_{\rm T}>$ 0.5 GeV and $|\eta |< $ 2.0 in the transverse (TransAVE) region as defined by the leading charged-particle jet, as a function of the transverse momentum of the leading charged-particle jet. The data are compared to predictions of PYTHIA6 using CUETP6S1-CTEQ6L1, PYTHIA8 using CUETP8S1-CTEQ6L1, CUETP8S1-HERAPDF1.5LO, and CUETP8M1, and HERWIG++ using CUETHppS1. The bottom panels of each plot show the ratios of these predictions to the data, and the green bands around unity represent the total experimental uncertainty. |
png pdf |
Figure 10-f:
CMS data on charged-particle (a,c,e) and $p_{\rm T}^{\rm sum}$ (b,d,f) densities at $\sqrt {s} =$ 0.9[24] (a,b), $2.76$[42] (c,d), and $7$ TeV[24] (e,f) with $p_{\rm T}>$ 0.5 GeV and $|\eta |< $ 2.0 in the transverse (TransAVE) region as defined by the leading charged-particle jet, as a function of the transverse momentum of the leading charged-particle jet. The data are compared to predictions of PYTHIA6 using CUETP6S1-CTEQ6L1, PYTHIA8 using CUETP8S1-CTEQ6L1, CUETP8S1-HERAPDF1.5LO, and CUETP8M1, and HERWIG++ using CUETHppS1. The bottom panels of each plot show the ratios of these predictions to the data, and the green bands around unity represent the total experimental uncertainty. |
png pdf |
Figure 11-a:
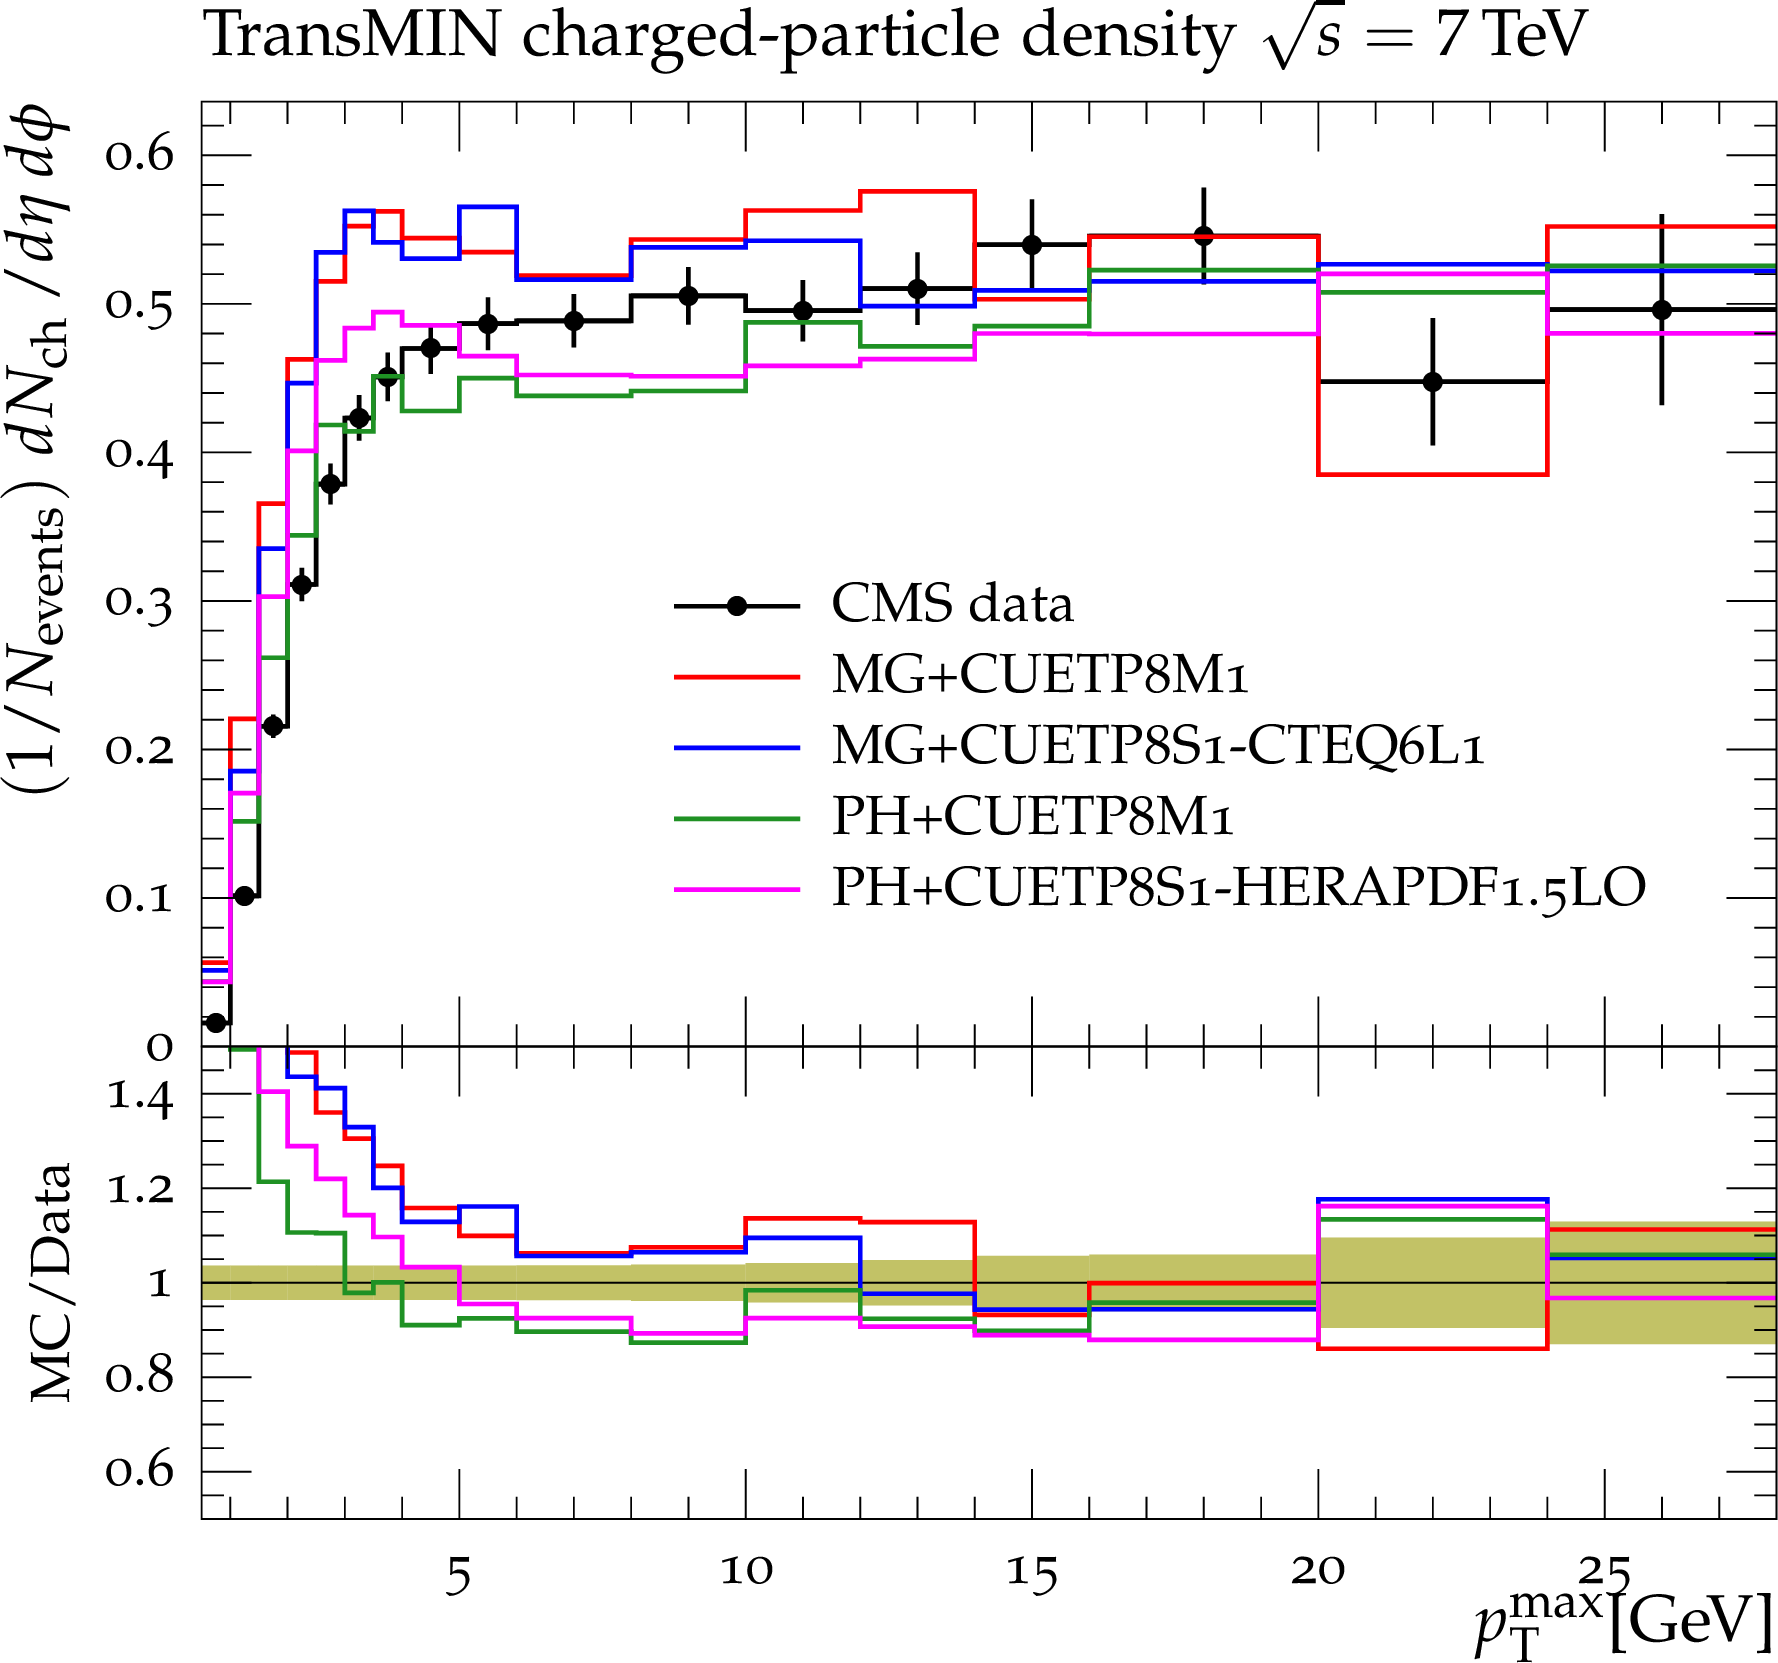
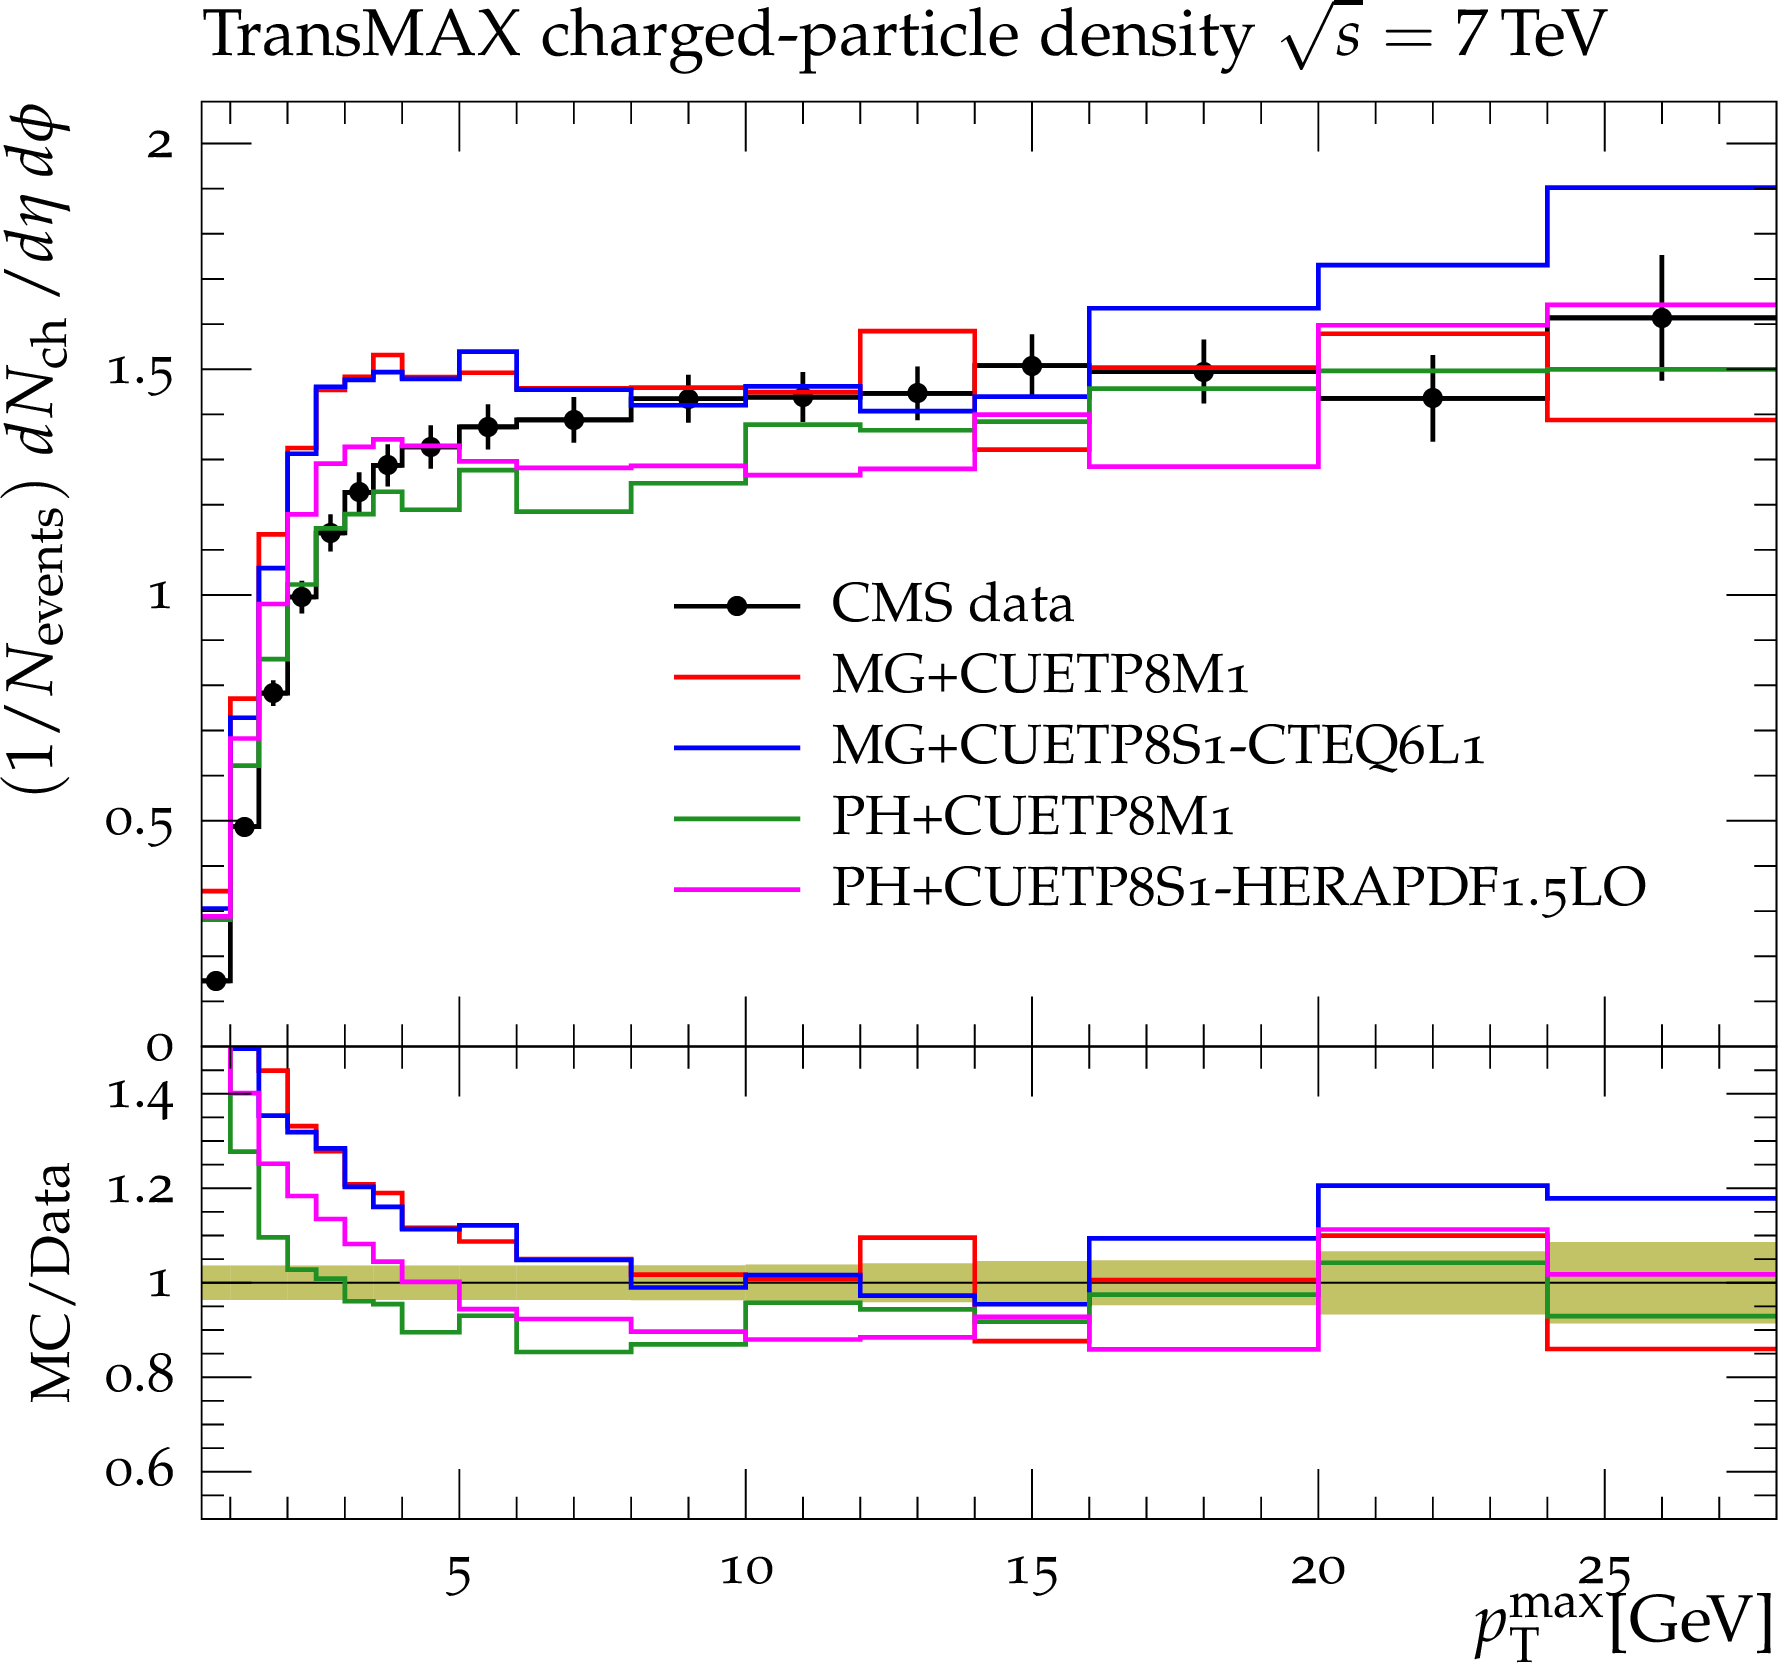
CMS data at $\sqrt {s}= $ 7 TeV [17] for particle (a,b) and $p_{\rm T}^{\rm sum}$\ densities (c,d) for charged particles with $p_{\rm T}>$ 0.5 GeV and $|\eta |<$ 0.8 in the TransMIN (a,c) and TransMAX (b,d) regions, as defined by the leading charged particle, as a function of the transverse momentum of the leading charged-particle $p_{\rm T}^{\rm max}$. The data are compared to MadGraph (MG), interfaced to PYTHIA8 using CUETP8S1-CTEQ6L1 and CUETP8M1, and to POWHEG (PH), interfaced to PYTHIA8 using CUETP8S1-HERAPDF1.5LO and CUETP8M1. The bottom panels of each plot show the ratios of these predictions to the data, and the green bands around unity represent the total experimental uncertainty. |
png pdf |
Figure 11-b:
CMS data at $\sqrt {s}= $ 7 TeV [17] for particle (a,b) and $p_{\rm T}^{\rm sum}$\ densities (c,d) for charged particles with $p_{\rm T}>$ 0.5 GeV and $|\eta |<$ 0.8 in the TransMIN (a,c) and TransMAX (b,d) regions, as defined by the leading charged particle, as a function of the transverse momentum of the leading charged-particle $p_{\rm T}^{\rm max}$. The data are compared to MadGraph (MG), interfaced to PYTHIA8 using CUETP8S1-CTEQ6L1 and CUETP8M1, and to POWHEG (PH), interfaced to PYTHIA8 using CUETP8S1-HERAPDF1.5LO and CUETP8M1. The bottom panels of each plot show the ratios of these predictions to the data, and the green bands around unity represent the total experimental uncertainty. |
png pdf |
Figure 11-c:
CMS data at $\sqrt {s}= $ 7 TeV [17] for particle (a,b) and $p_{\rm T}^{\rm sum}$\ densities (c,d) for charged particles with $p_{\rm T}>$ 0.5 GeV and $|\eta |<$ 0.8 in the TransMIN (a,c) and TransMAX (b,d) regions, as defined by the leading charged particle, as a function of the transverse momentum of the leading charged-particle $p_{\rm T}^{\rm max}$. The data are compared to MadGraph (MG), interfaced to PYTHIA8 using CUETP8S1-CTEQ6L1 and CUETP8M1, and to POWHEG (PH), interfaced to PYTHIA8 using CUETP8S1-HERAPDF1.5LO and CUETP8M1. The bottom panels of each plot show the ratios of these predictions to the data, and the green bands around unity represent the total experimental uncertainty. |
png pdf |
Figure 11-d:
CMS data at $\sqrt {s}= $ 7 TeV [17] for particle (a,b) and $p_{\rm T}^{\rm sum}$\ densities (c,d) for charged particles with $p_{\rm T}>$ 0.5 GeV and $|\eta |<$ 0.8 in the TransMIN (a,c) and TransMAX (b,d) regions, as defined by the leading charged particle, as a function of the transverse momentum of the leading charged-particle $p_{\rm T}^{\rm max}$. The data are compared to MadGraph (MG), interfaced to PYTHIA8 using CUETP8S1-CTEQ6L1 and CUETP8M1, and to POWHEG (PH), interfaced to PYTHIA8 using CUETP8S1-HERAPDF1.5LO and CUETP8M1. The bottom panels of each plot show the ratios of these predictions to the data, and the green bands around unity represent the total experimental uncertainty. |
png pdf |
Figure 12-a:
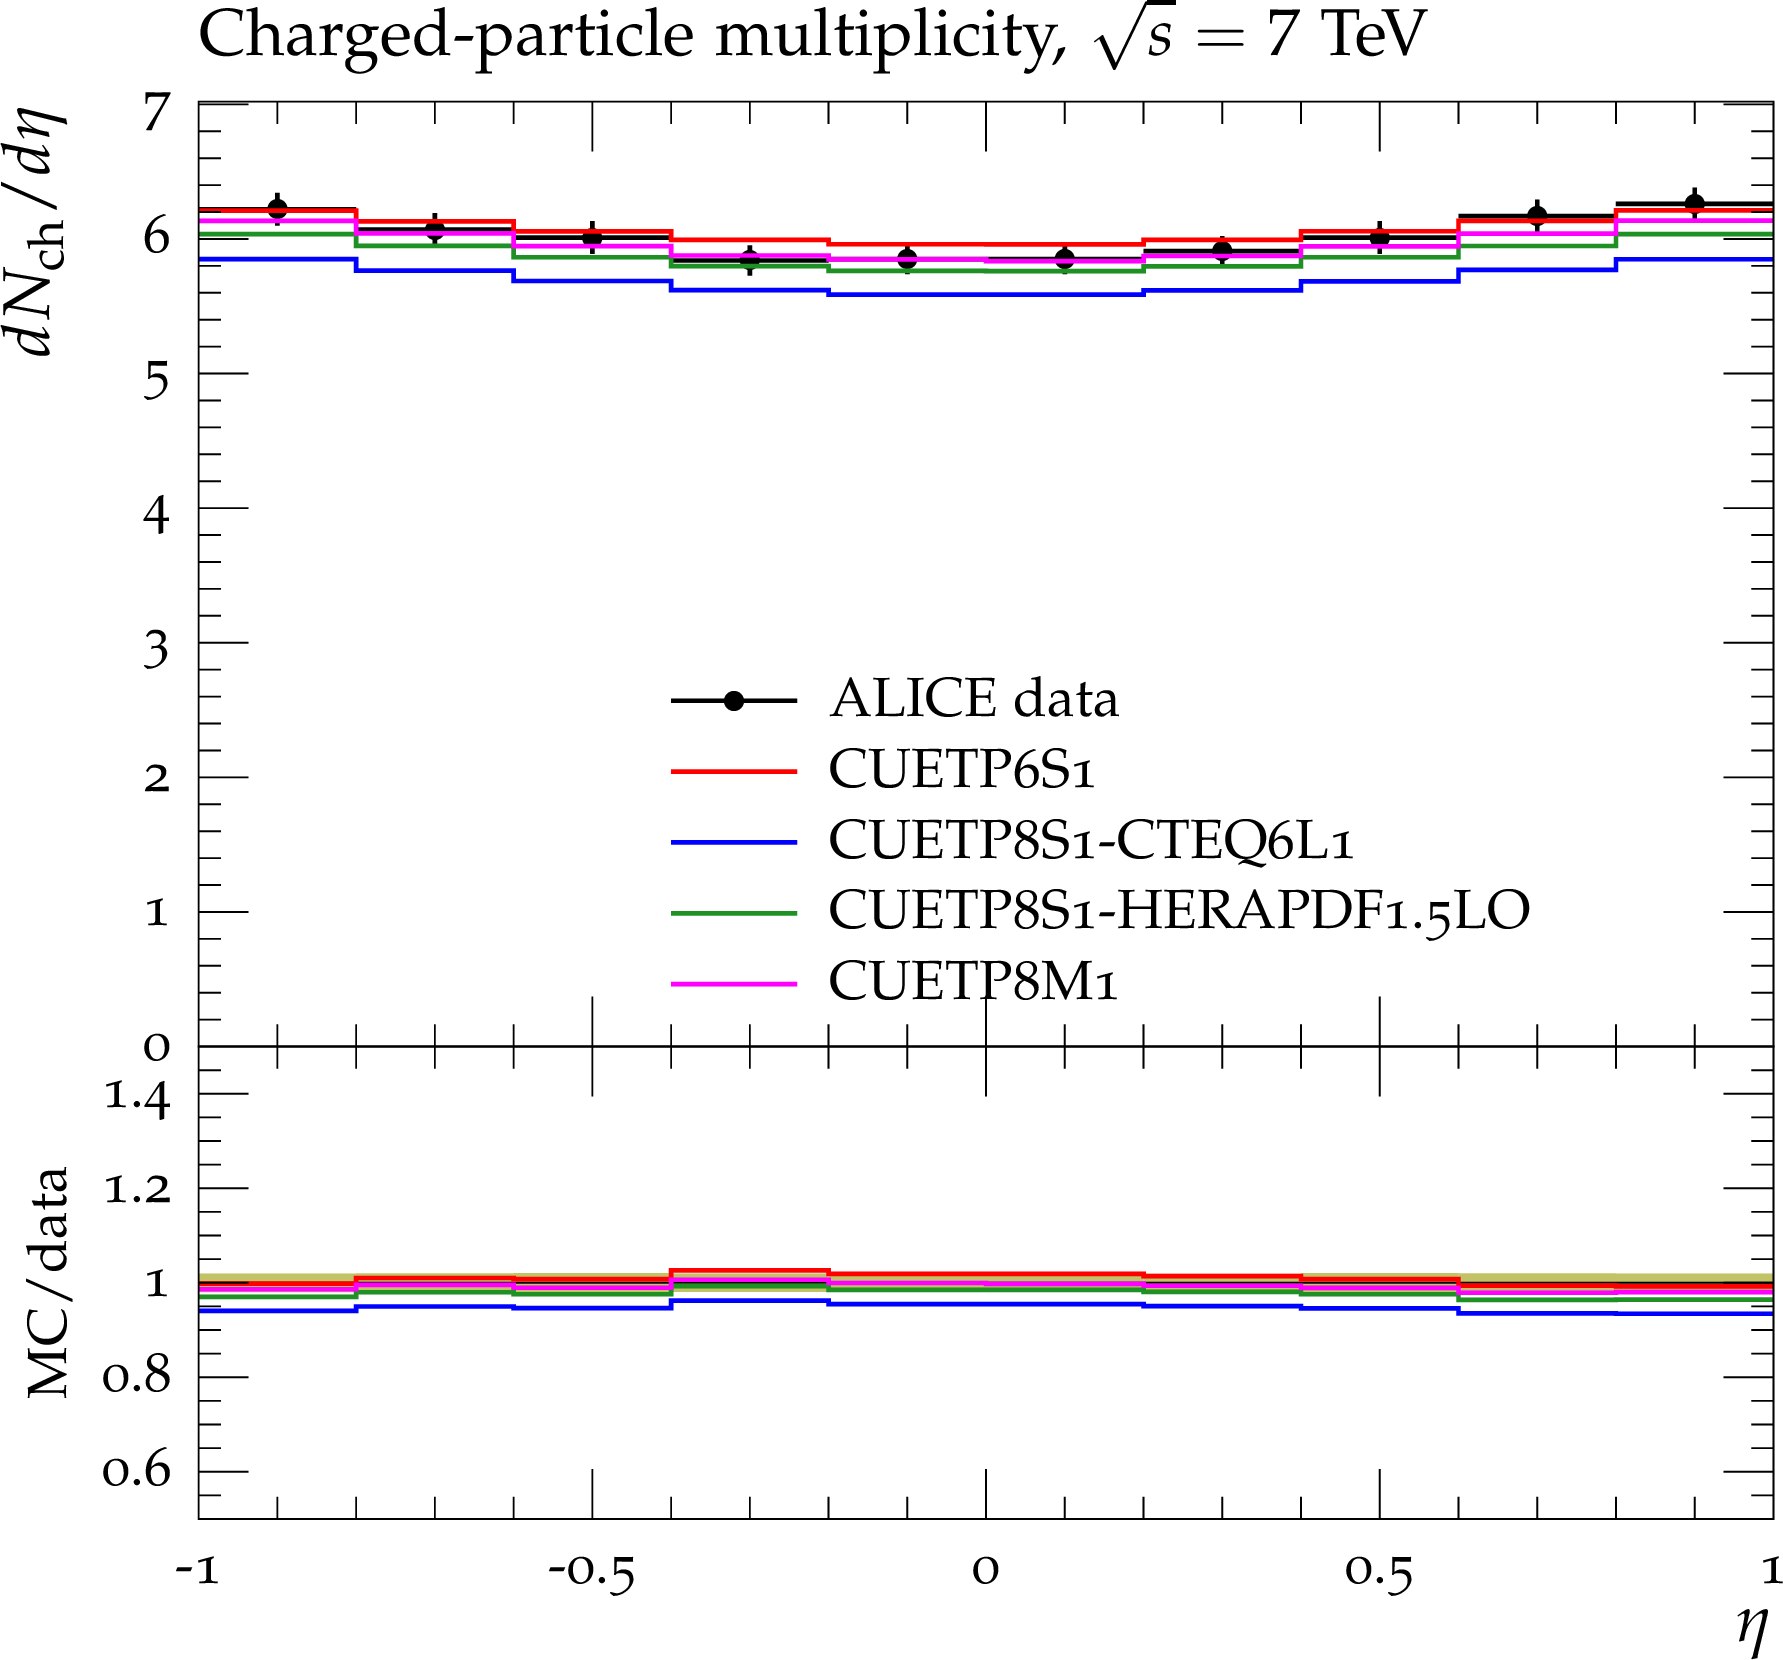
ALICE data at $\sqrt {s}=$ 7 TeV[47] for the charged-particle pseudorapidity distribution, $ {\mathrm {d}}\mathrm {N}_{\text {ch}}/ {\mathrm {d}}\eta $, in inclusive inelastic pp collisions (a). TOTEM data at $\sqrt {s}=$ 7 TeV[48] for the charged-particle pseudorapidity distribution, $ {\mathrm {d}}\mathrm {N}_{\text {ch}}/ {\mathrm {d}}\eta $, in inclusive inelastic pp collisions ($p_{\rm T}>$ 40 MeV, $\mathrm {N}_{\rm chg}\ge$ 1) (b). CMS data at $\sqrt {s}=$ 7 TeV[50] for the energy flow $ {\mathrm {d}}E/ {\mathrm {d}}\eta $, in MB pp collisions. The data are compared to PYTHIA6 using CUETP6S1-CTEQ6L1, and to PYTHIA8 using CUETP8S1-CTEQ6L1, CUETP8S1-HERAPDF1.5LO, and CUETP8M1. The bottom panels of each plot show the ratios of these predictions to the data, and the green bands around unity represent the total experimental uncertainty. |
png pdf |
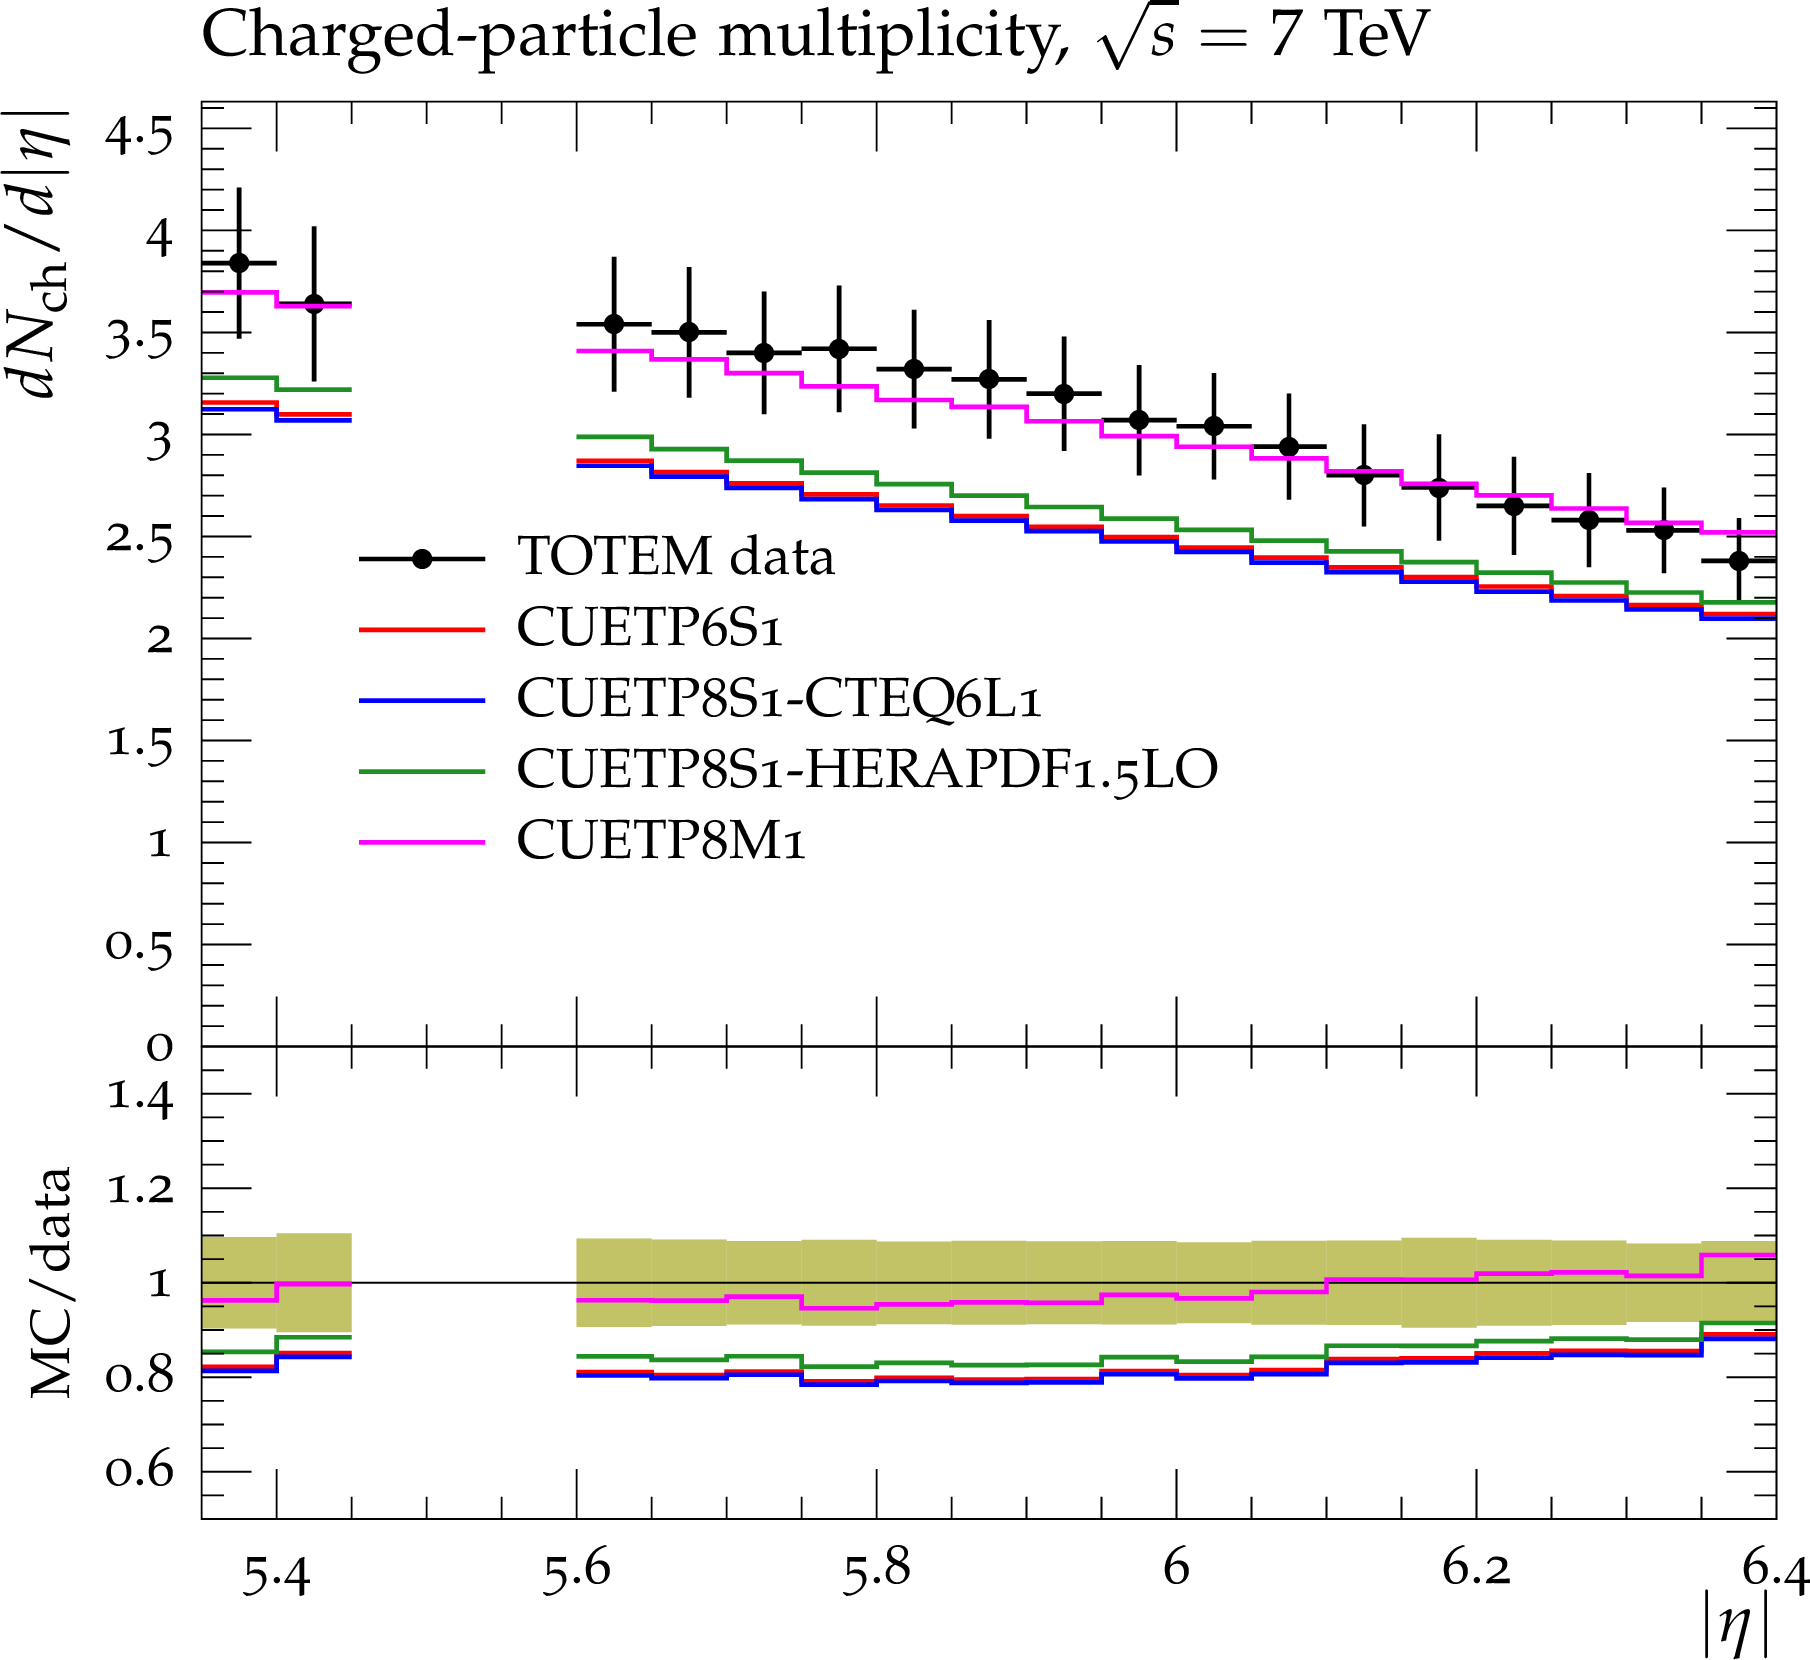
Figure 12-b:
ALICE data at $\sqrt {s}=$ 7 TeV[47] for the charged-particle pseudorapidity distribution, $ {\mathrm {d}}\mathrm {N}_{\text {ch}}/ {\mathrm {d}}\eta $, in inclusive inelastic pp collisions (a). TOTEM data at $\sqrt {s}=$ 7 TeV[48] for the charged-particle pseudorapidity distribution, $ {\mathrm {d}}\mathrm {N}_{\text {ch}}/ {\mathrm {d}}\eta $, in inclusive inelastic pp collisions ($p_{\rm T}>$ 40 MeV, $\mathrm {N}_{\rm chg}\ge$ 1) (b). CMS data at $\sqrt {s}=$ 7 TeV[50] for the energy flow $ {\mathrm {d}}E/ {\mathrm {d}}\eta $, in MB pp collisions. The data are compared to PYTHIA6 using CUETP6S1-CTEQ6L1, and to PYTHIA8 using CUETP8S1-CTEQ6L1, CUETP8S1-HERAPDF1.5LO, and CUETP8M1. The bottom panels of each plot show the ratios of these predictions to the data, and the green bands around unity represent the total experimental uncertainty. |

png pdf |
Figure 12-c:
ALICE data at $\sqrt {s}=$ 7 TeV[47] for the charged-particle pseudorapidity distribution, $ {\mathrm {d}}\mathrm {N}_{\text {ch}}/ {\mathrm {d}}\eta $, in inclusive inelastic pp collisions (a). TOTEM data at $\sqrt {s}=$ 7 TeV[48] for the charged-particle pseudorapidity distribution, $ {\mathrm {d}}\mathrm {N}_{\text {ch}}/ {\mathrm {d}}\eta $, in inclusive inelastic pp collisions ($p_{\rm T}>$ 40 MeV, $\mathrm {N}_{\rm chg}\ge$ 1) (b). CMS data at $\sqrt {s}=$ 7 TeV[50] for the energy flow $ {\mathrm {d}}E/ {\mathrm {d}}\eta $, in MB pp collisions. The data are compared to PYTHIA6 using CUETP6S1-CTEQ6L1, and to PYTHIA8 using CUETP8S1-CTEQ6L1, CUETP8S1-HERAPDF1.5LO, and CUETP8M1. The bottom panels of each plot show the ratios of these predictions to the data, and the green bands around unity represent the total experimental uncertainty. |
png pdf |
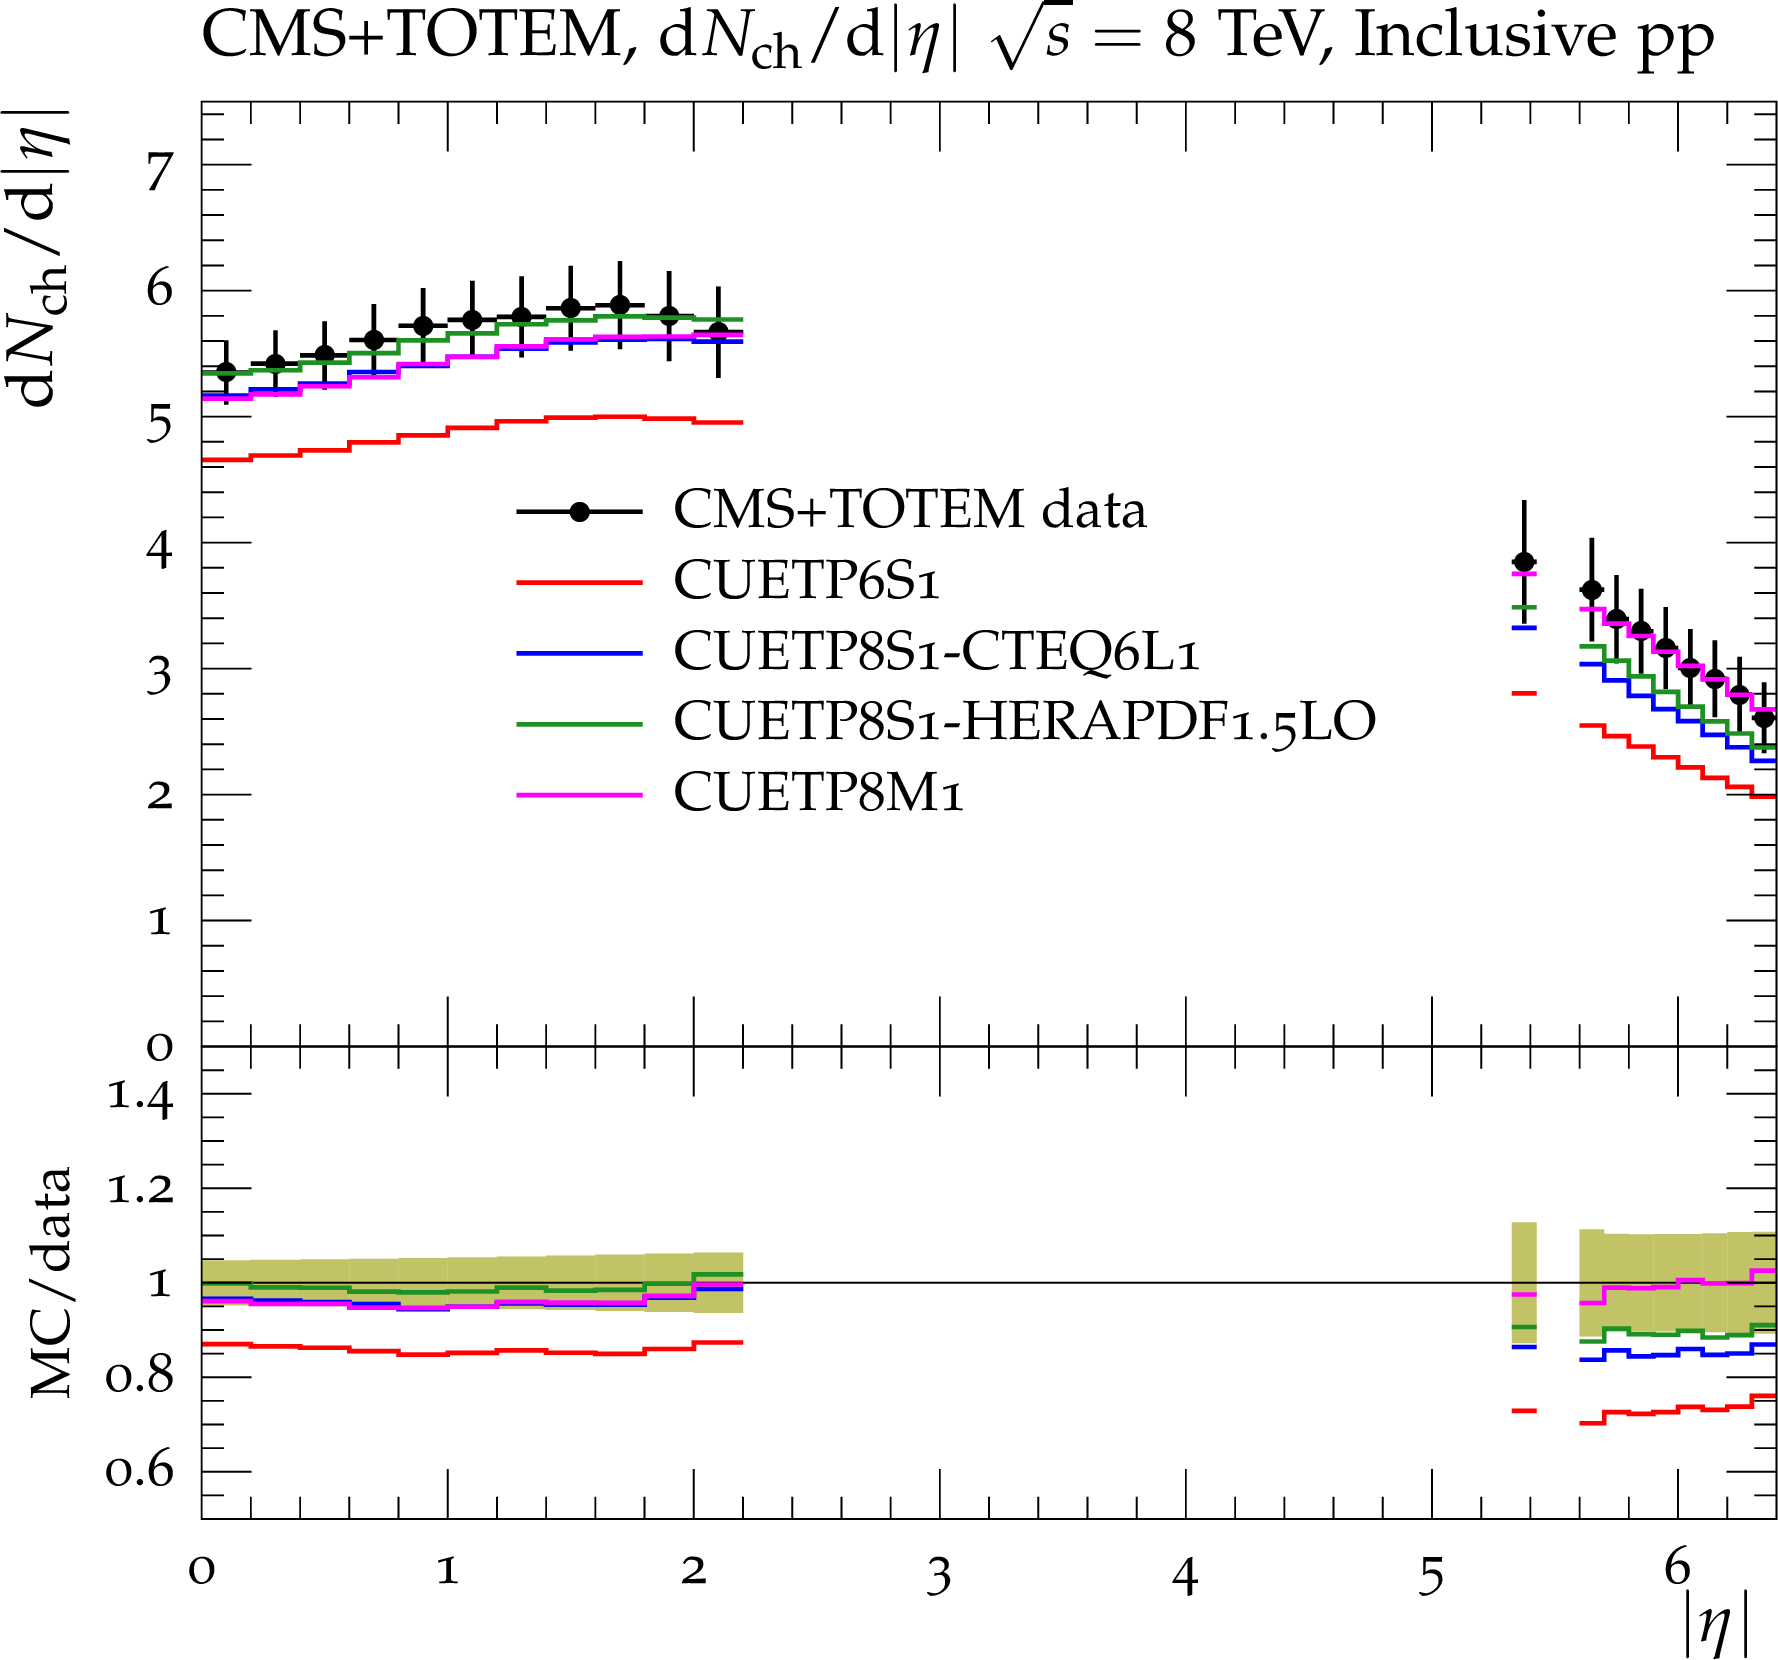
Figure 13-a:
Combined CMS and TOTEM data at $\sqrt {s}=$ 8 TeV[50] for the charged-particle distribution $ {\mathrm {d}}\mathrm {N}_{\text {ch}}/ {\mathrm {d}}\eta $, in inclusive inelastic (a), NSD-enhanced (b), and SD-enhanced (c) pp collisions. The data are compared to PYTHIA6\ using CUETP6S1-CTEQ6L1, and to PYTHIA8 using CUETP8S1-CTEQ6L1, CUETP8S1-HERAPDF1.5LO, and CUETP8M1. The bottom panels of each plot show the ratios of these predictions to the data, and the green bands around unity represent the total experimental uncertainty. |
png pdf |
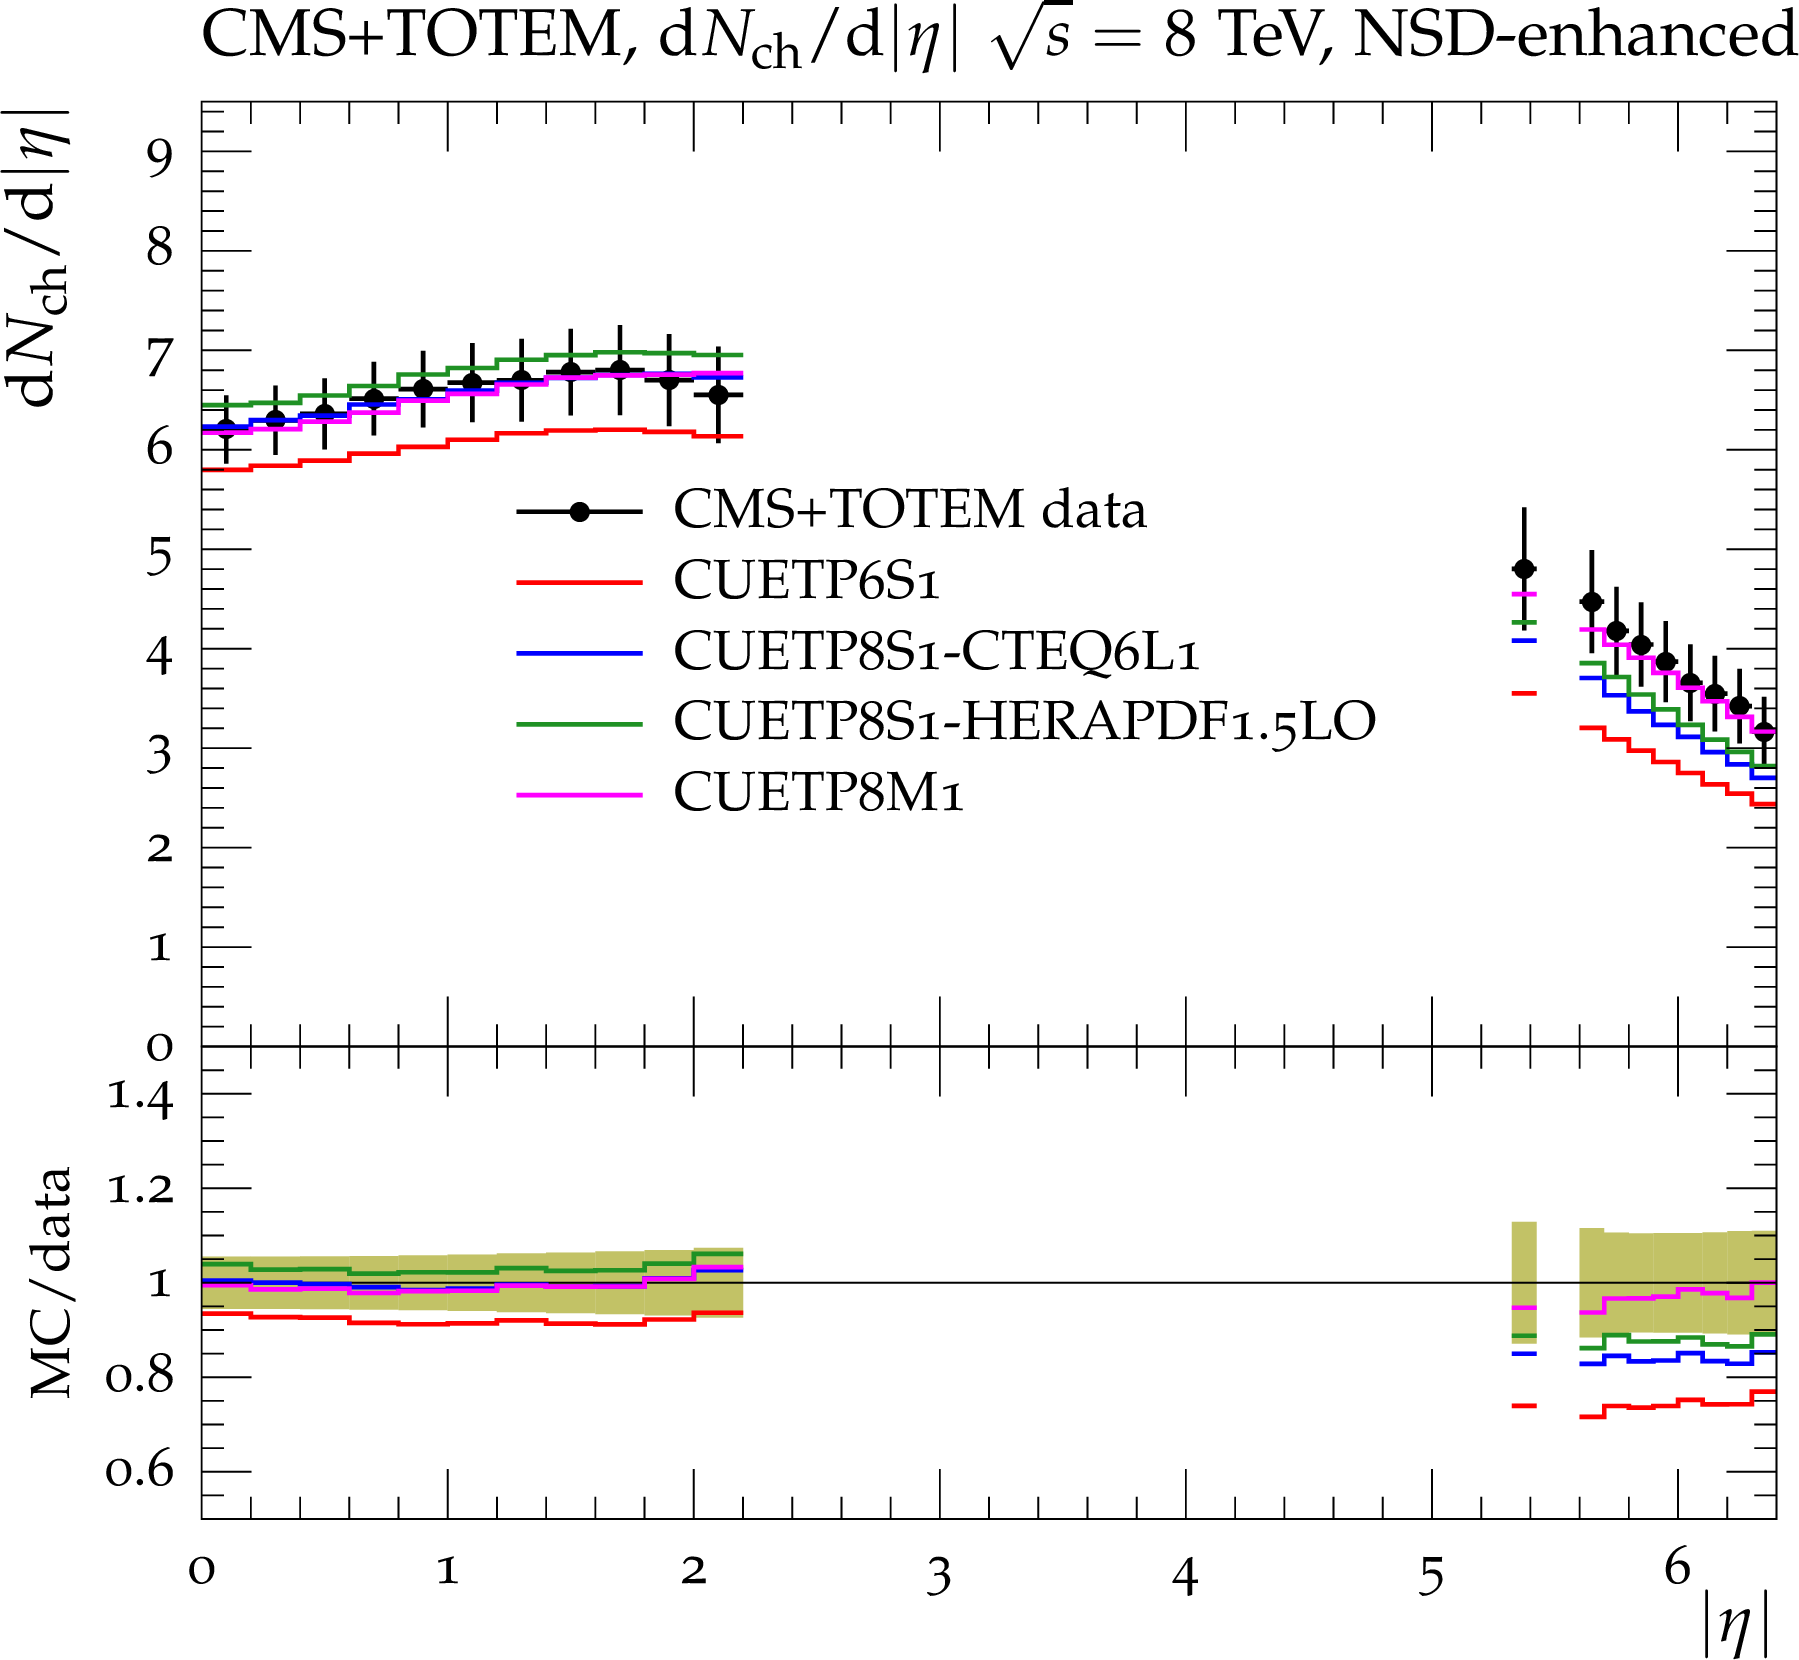
Figure 13-b:
Combined CMS and TOTEM data at $\sqrt {s}=$ 8 TeV[50] for the charged-particle distribution $ {\mathrm {d}}\mathrm {N}_{\text {ch}}/ {\mathrm {d}}\eta $, in inclusive inelastic (a), NSD-enhanced (b), and SD-enhanced (c) pp collisions. The data are compared to PYTHIA6\ using CUETP6S1-CTEQ6L1, and to PYTHIA8 using CUETP8S1-CTEQ6L1, CUETP8S1-HERAPDF1.5LO, and CUETP8M1. The bottom panels of each plot show the ratios of these predictions to the data, and the green bands around unity represent the total experimental uncertainty. |
png pdf |
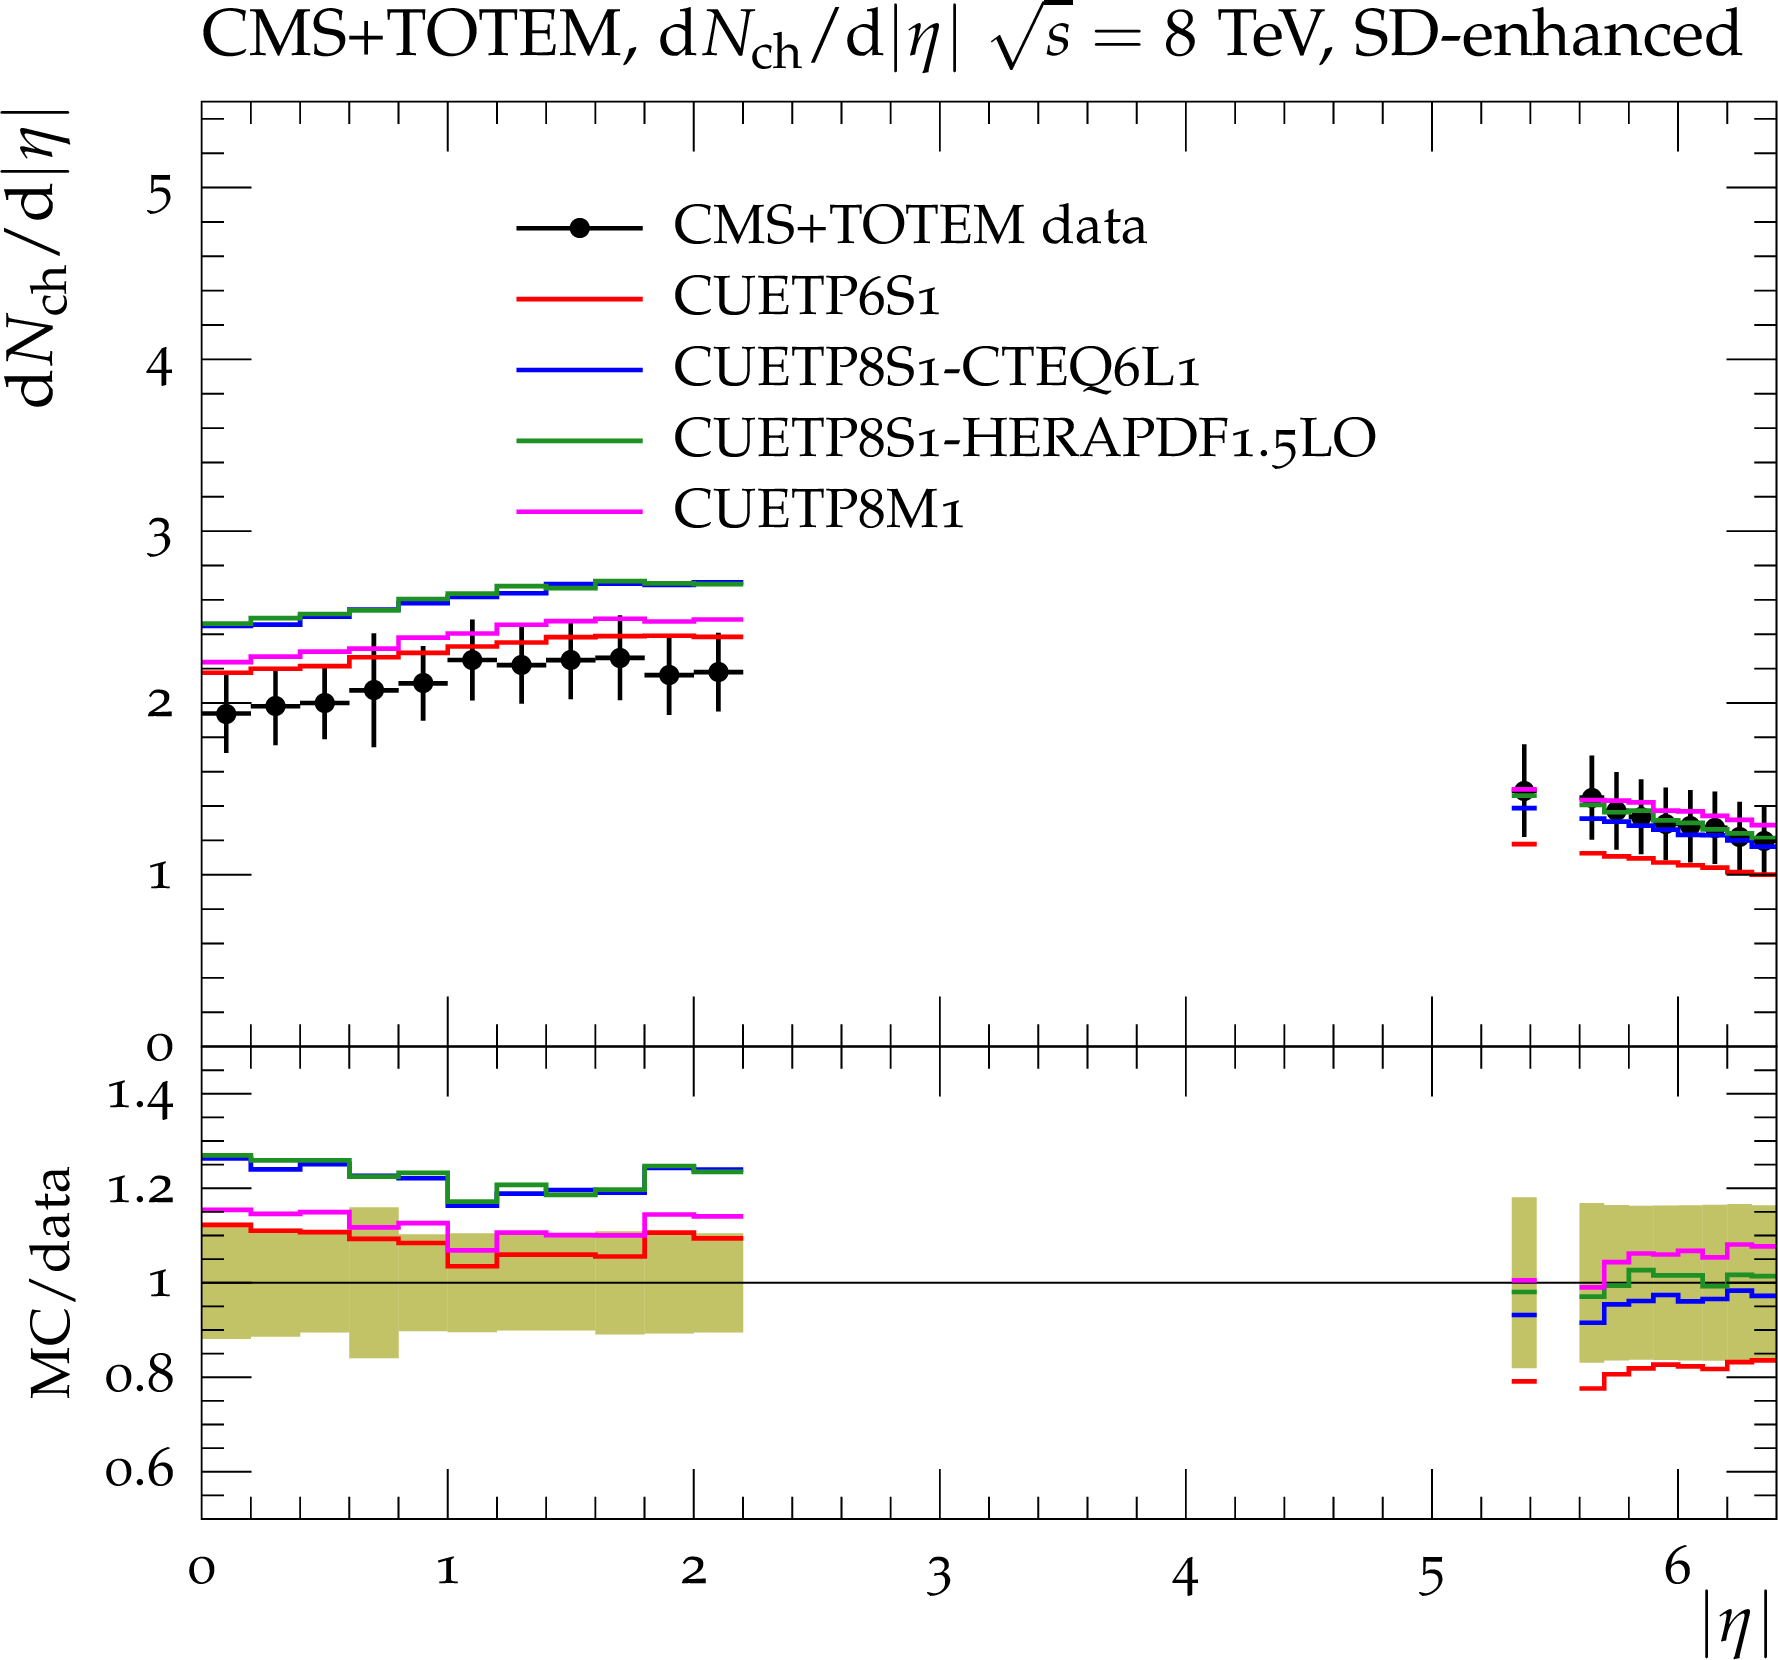
Figure 13-c:
Combined CMS and TOTEM data at $\sqrt {s}=$ 8 TeV[50] for the charged-particle distribution $ {\mathrm {d}}\mathrm {N}_{\text {ch}}/ {\mathrm {d}}\eta $, in inclusive inelastic (a), NSD-enhanced (b), and SD-enhanced (c) pp collisions. The data are compared to PYTHIA6\ using CUETP6S1-CTEQ6L1, and to PYTHIA8 using CUETP8S1-CTEQ6L1, CUETP8S1-HERAPDF1.5LO, and CUETP8M1. The bottom panels of each plot show the ratios of these predictions to the data, and the green bands around unity represent the total experimental uncertainty. |

png pdf |
Figure 14-a:
Comparison of gluon distributions in the proton for the CTEQ6L1, HERAPDF1.5LO, and NNPDF2.3LO PDF sets, at the $Q^2$ = 10 GeV$^2$ (left) and 100 GeV$^2$ (right). |
png pdf |
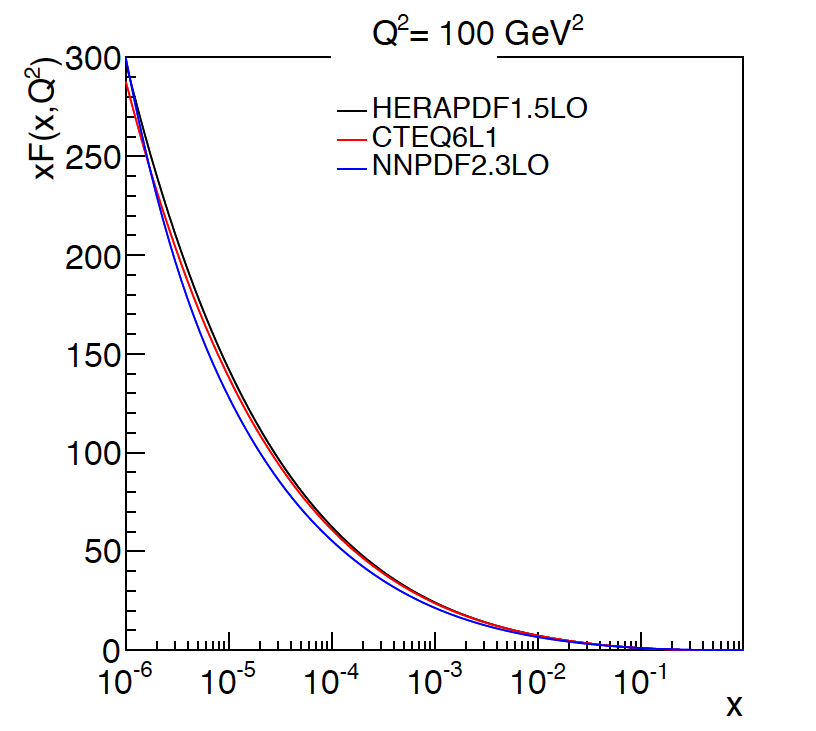
Figure 14-b:
Comparison of gluon distributions in the proton for the CTEQ6L1, HERAPDF1.5LO, and NNPDF2.3LO PDF sets, at the $Q^2$ = 10 GeV$^2$ (left) and 100 GeV$^2$ (right). |
png pdf |
Figure 15-a:
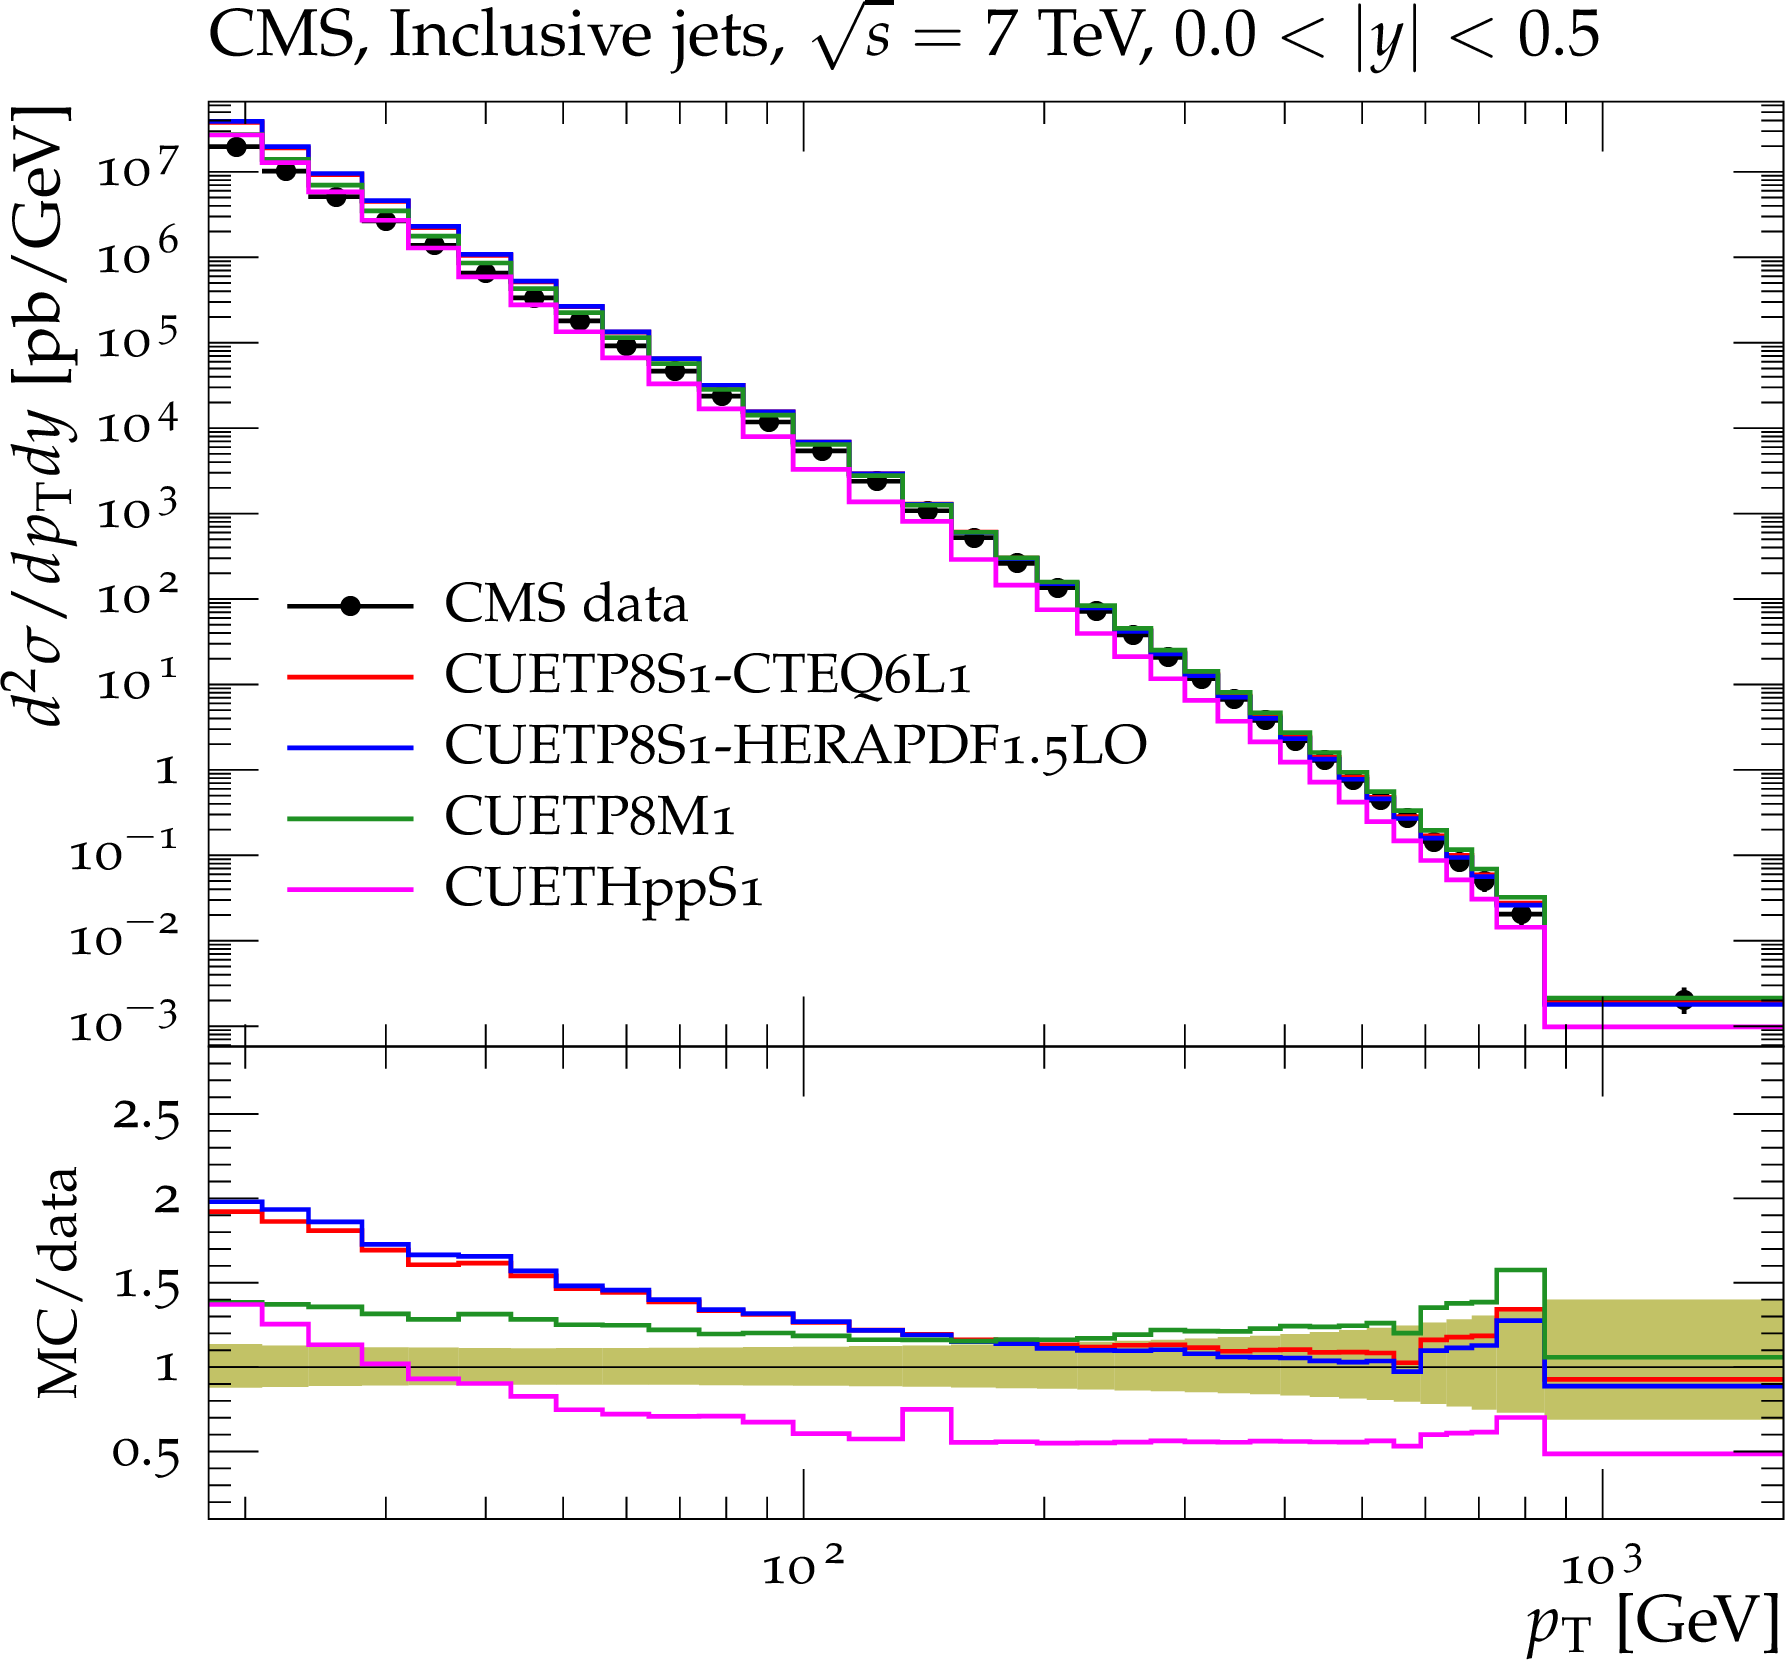
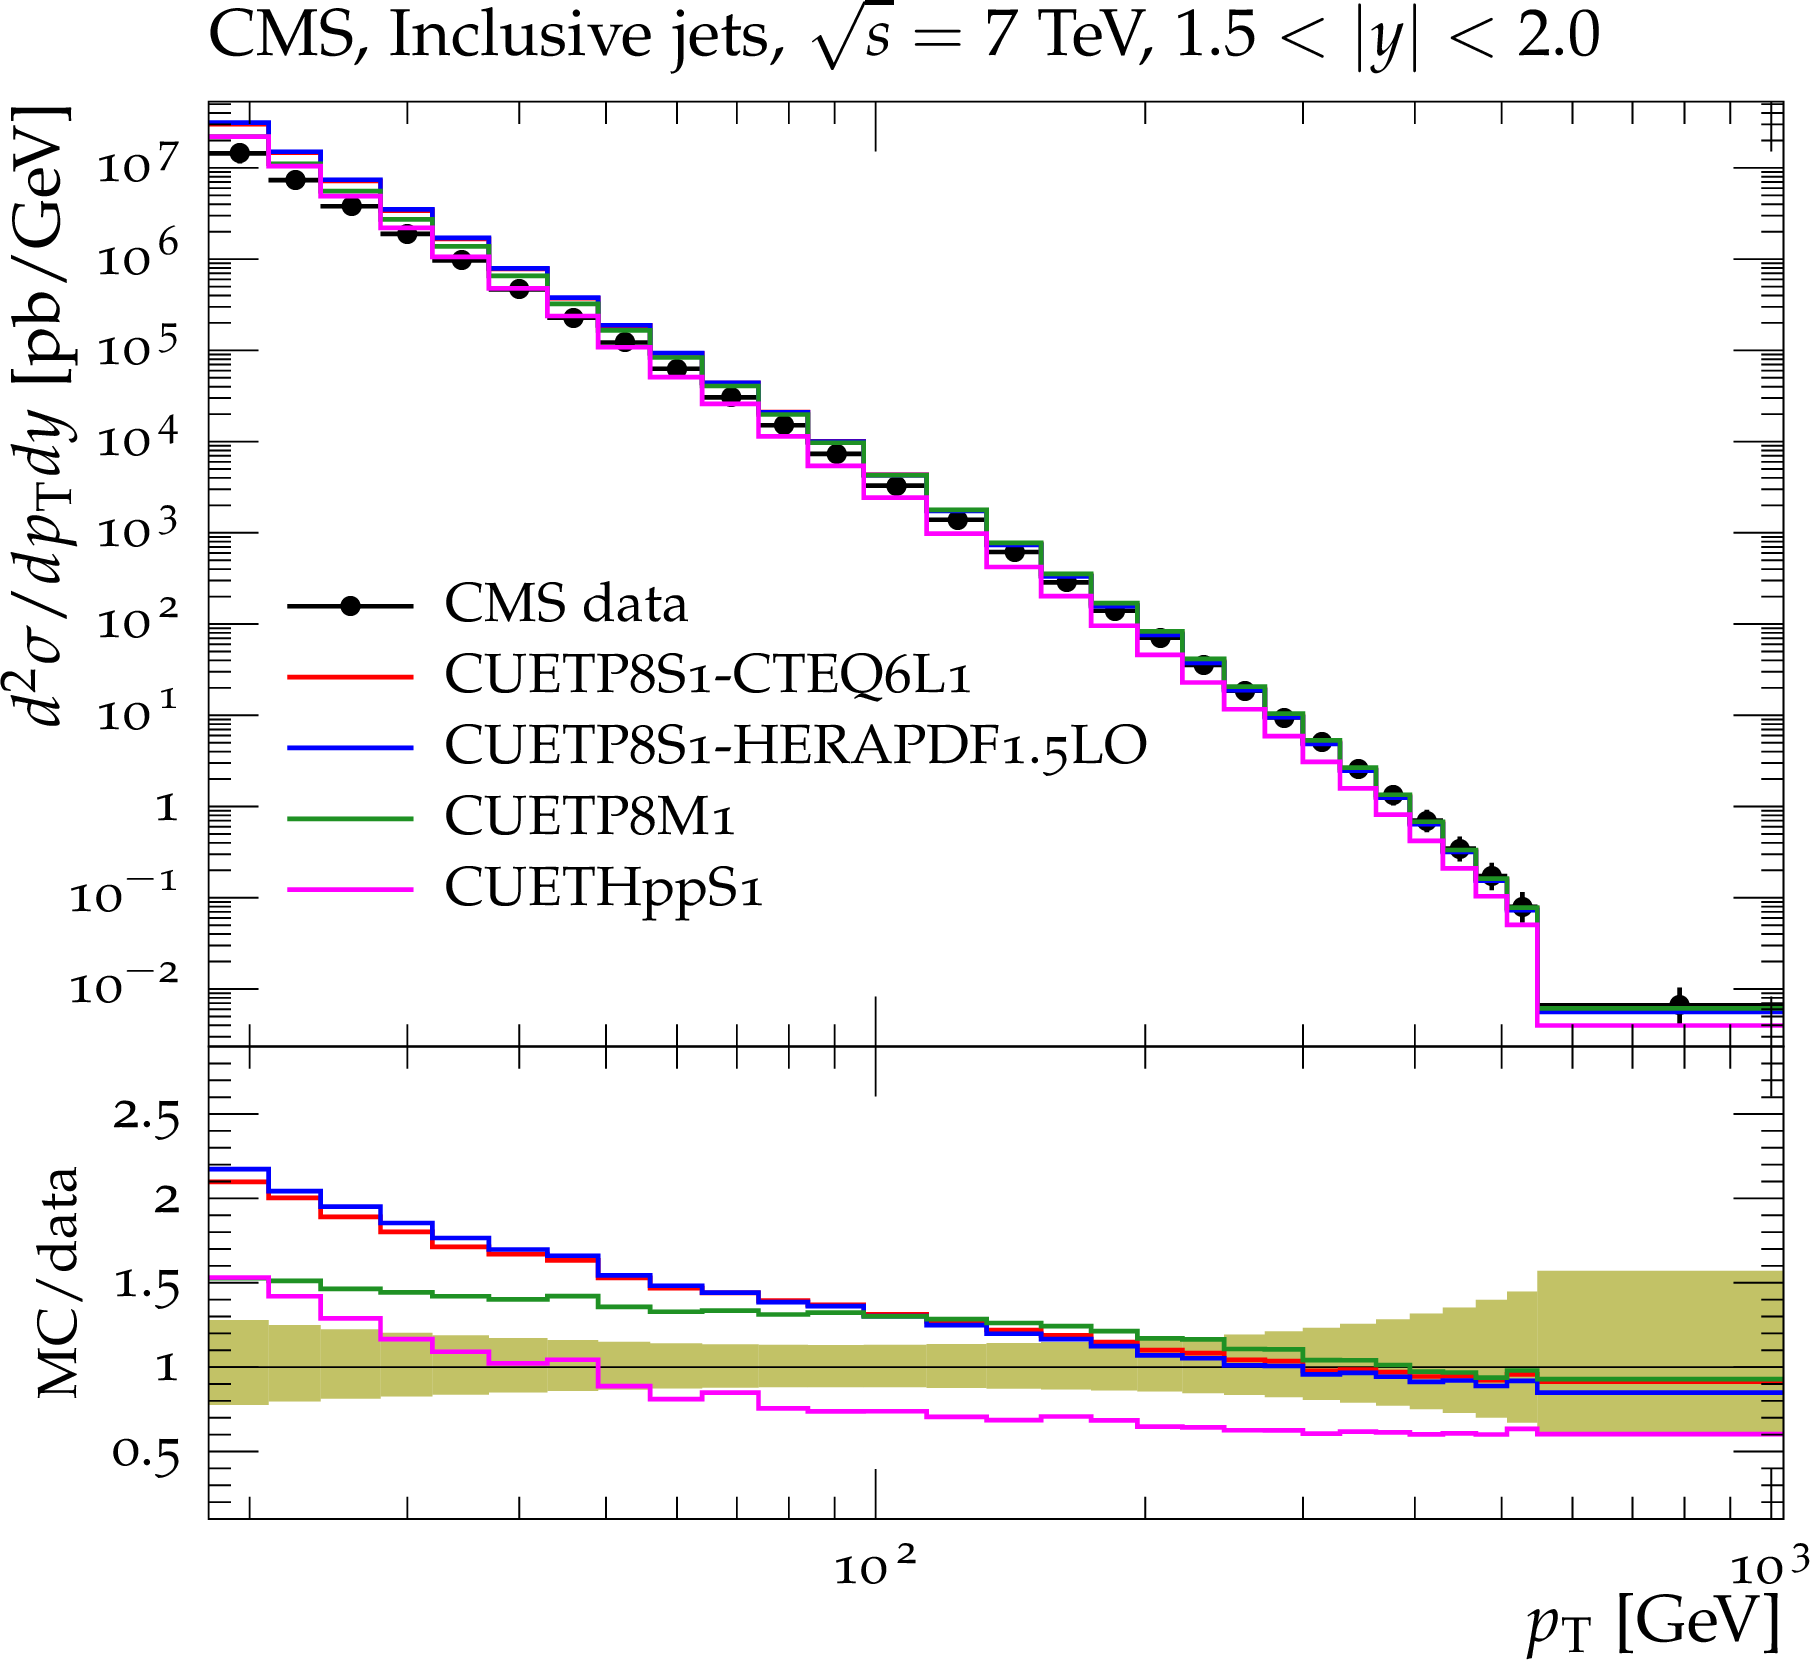
CMS data at $\sqrt {s}=$ 7 TeV[51] for the inclusive jet cross section as a function of $ {p_{\mathrm {T}}} $ in different rapidity ranges compared to predictions of PYTHIA8 using CUETP8S1-CTEQ6L1, CUETP8S1-HERAPDF, and CUETP8M1, and of HERWIG++ using CUETHppS1. The bottom panels of each plot show the ratios of these predictions to the data, and the green bands around unity represent the total experimental uncertainty. |

png pdf |
Figure 15-b:
CMS data at $\sqrt {s}=$ 7 TeV[51] for the inclusive jet cross section as a function of $ {p_{\mathrm {T}}} $ in different rapidity ranges compared to predictions of PYTHIA8 using CUETP8S1-CTEQ6L1, CUETP8S1-HERAPDF, and CUETP8M1, and of HERWIG++ using CUETHppS1. The bottom panels of each plot show the ratios of these predictions to the data, and the green bands around unity represent the total experimental uncertainty. |
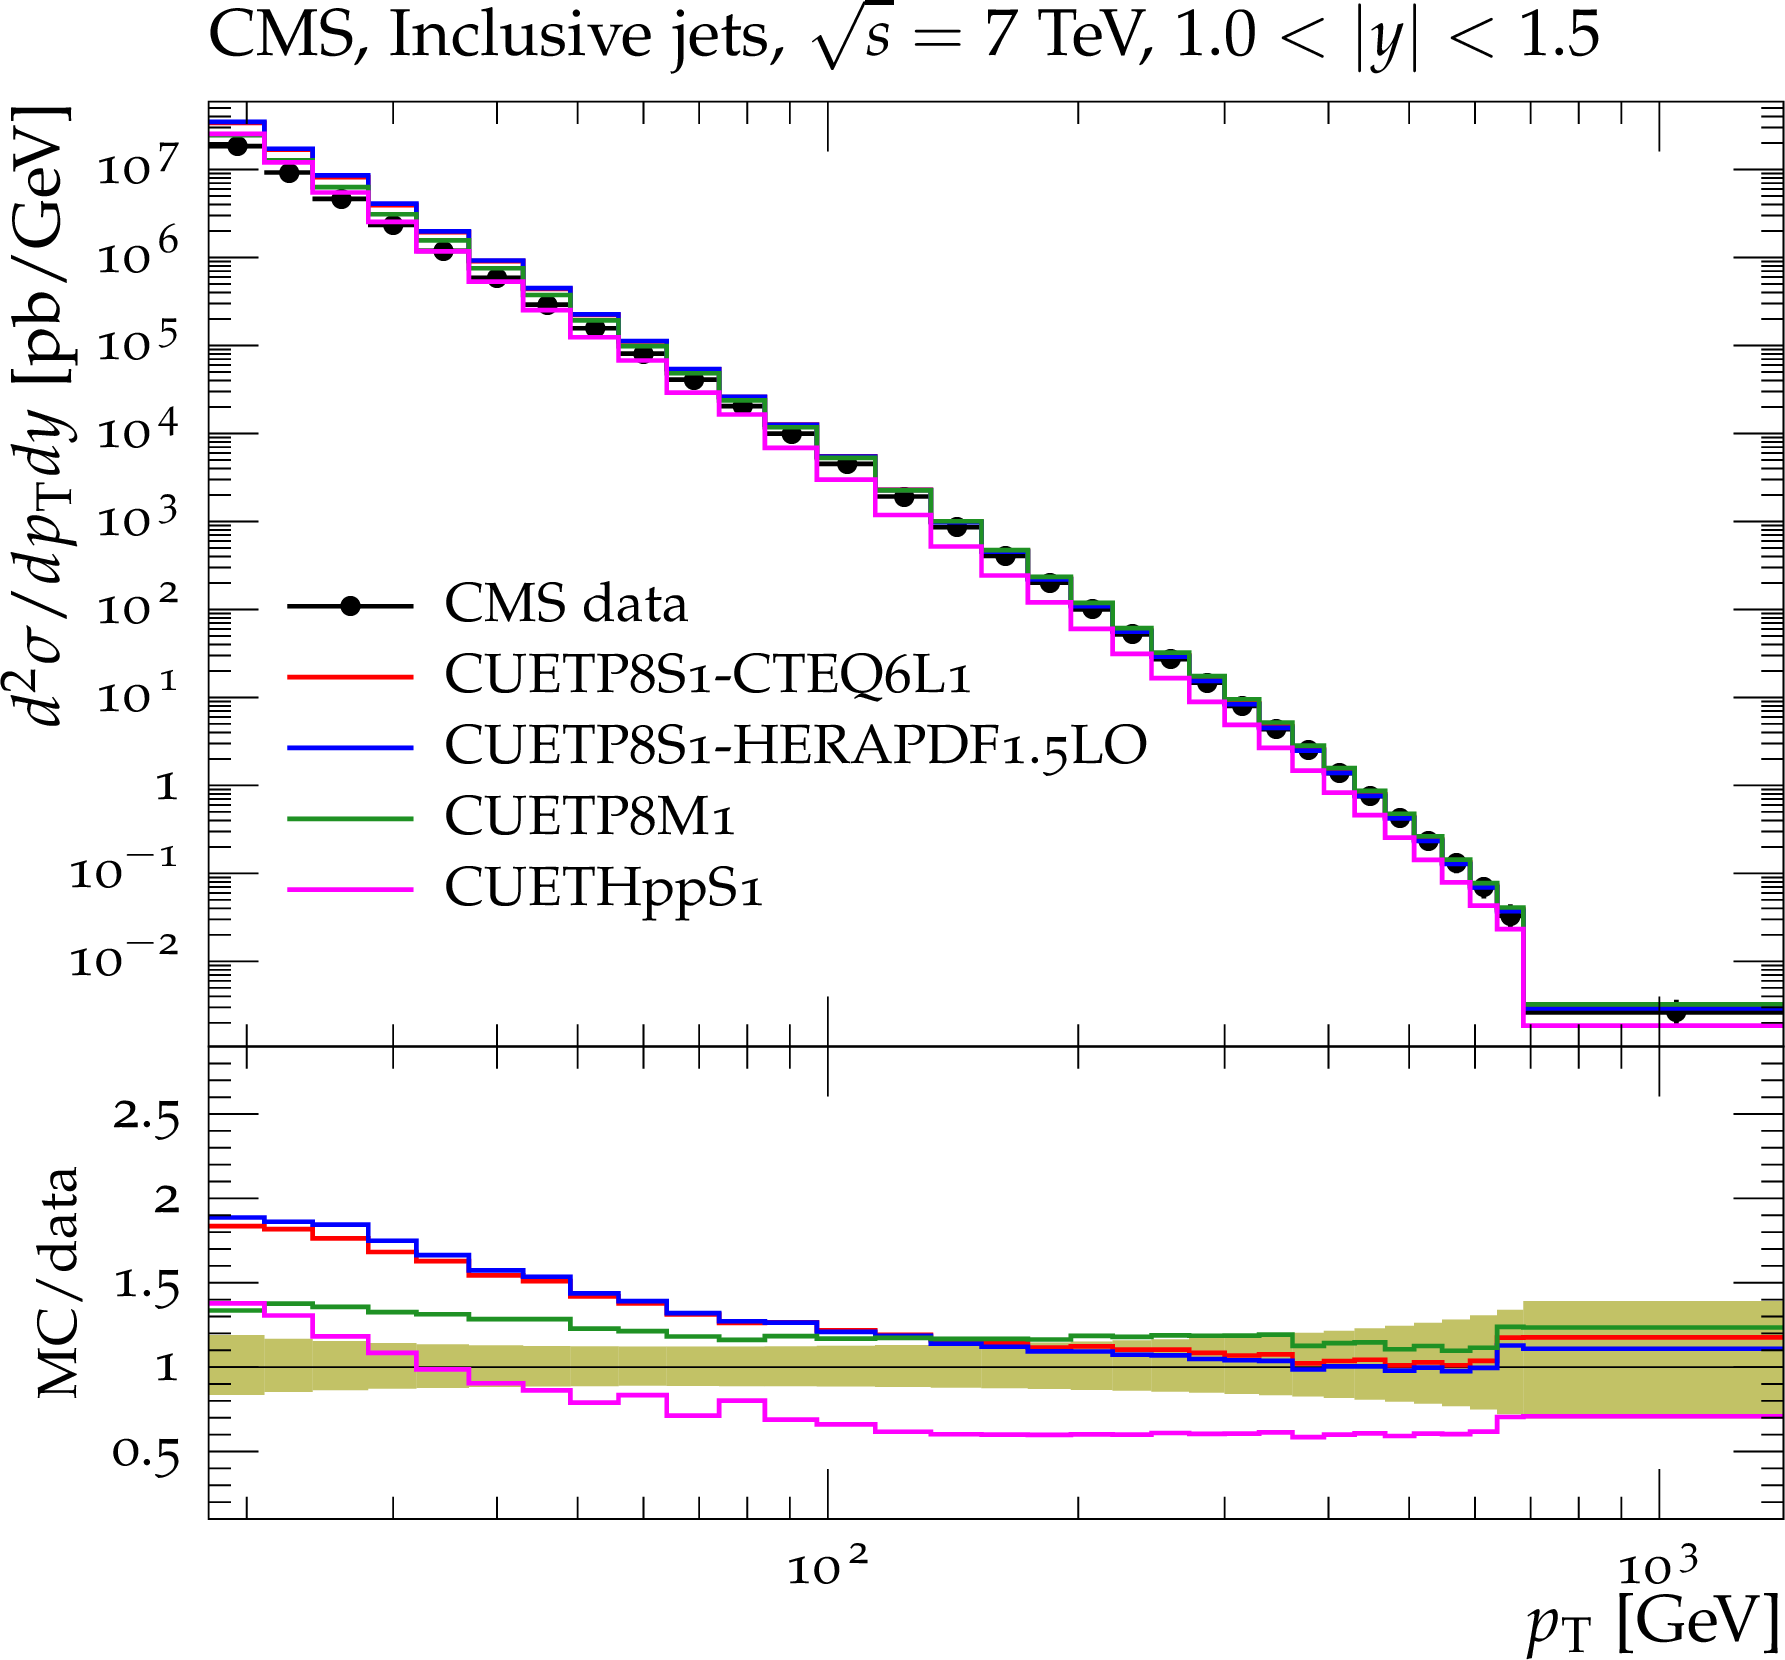
png pdf |
Figure 15-c:
CMS data at $\sqrt {s}=$ 7 TeV[51] for the inclusive jet cross section as a function of $ {p_{\mathrm {T}}} $ in different rapidity ranges compared to predictions of PYTHIA8 using CUETP8S1-CTEQ6L1, CUETP8S1-HERAPDF, and CUETP8M1, and of HERWIG++ using CUETHppS1. The bottom panels of each plot show the ratios of these predictions to the data, and the green bands around unity represent the total experimental uncertainty. |
png pdf |
Figure 15-d:
CMS data at $\sqrt {s}=$ 7 TeV[51] for the inclusive jet cross section as a function of $ {p_{\mathrm {T}}} $ in different rapidity ranges compared to predictions of PYTHIA8 using CUETP8S1-CTEQ6L1, CUETP8S1-HERAPDF, and CUETP8M1, and of HERWIG++ using CUETHppS1. The bottom panels of each plot show the ratios of these predictions to the data, and the green bands around unity represent the total experimental uncertainty. |
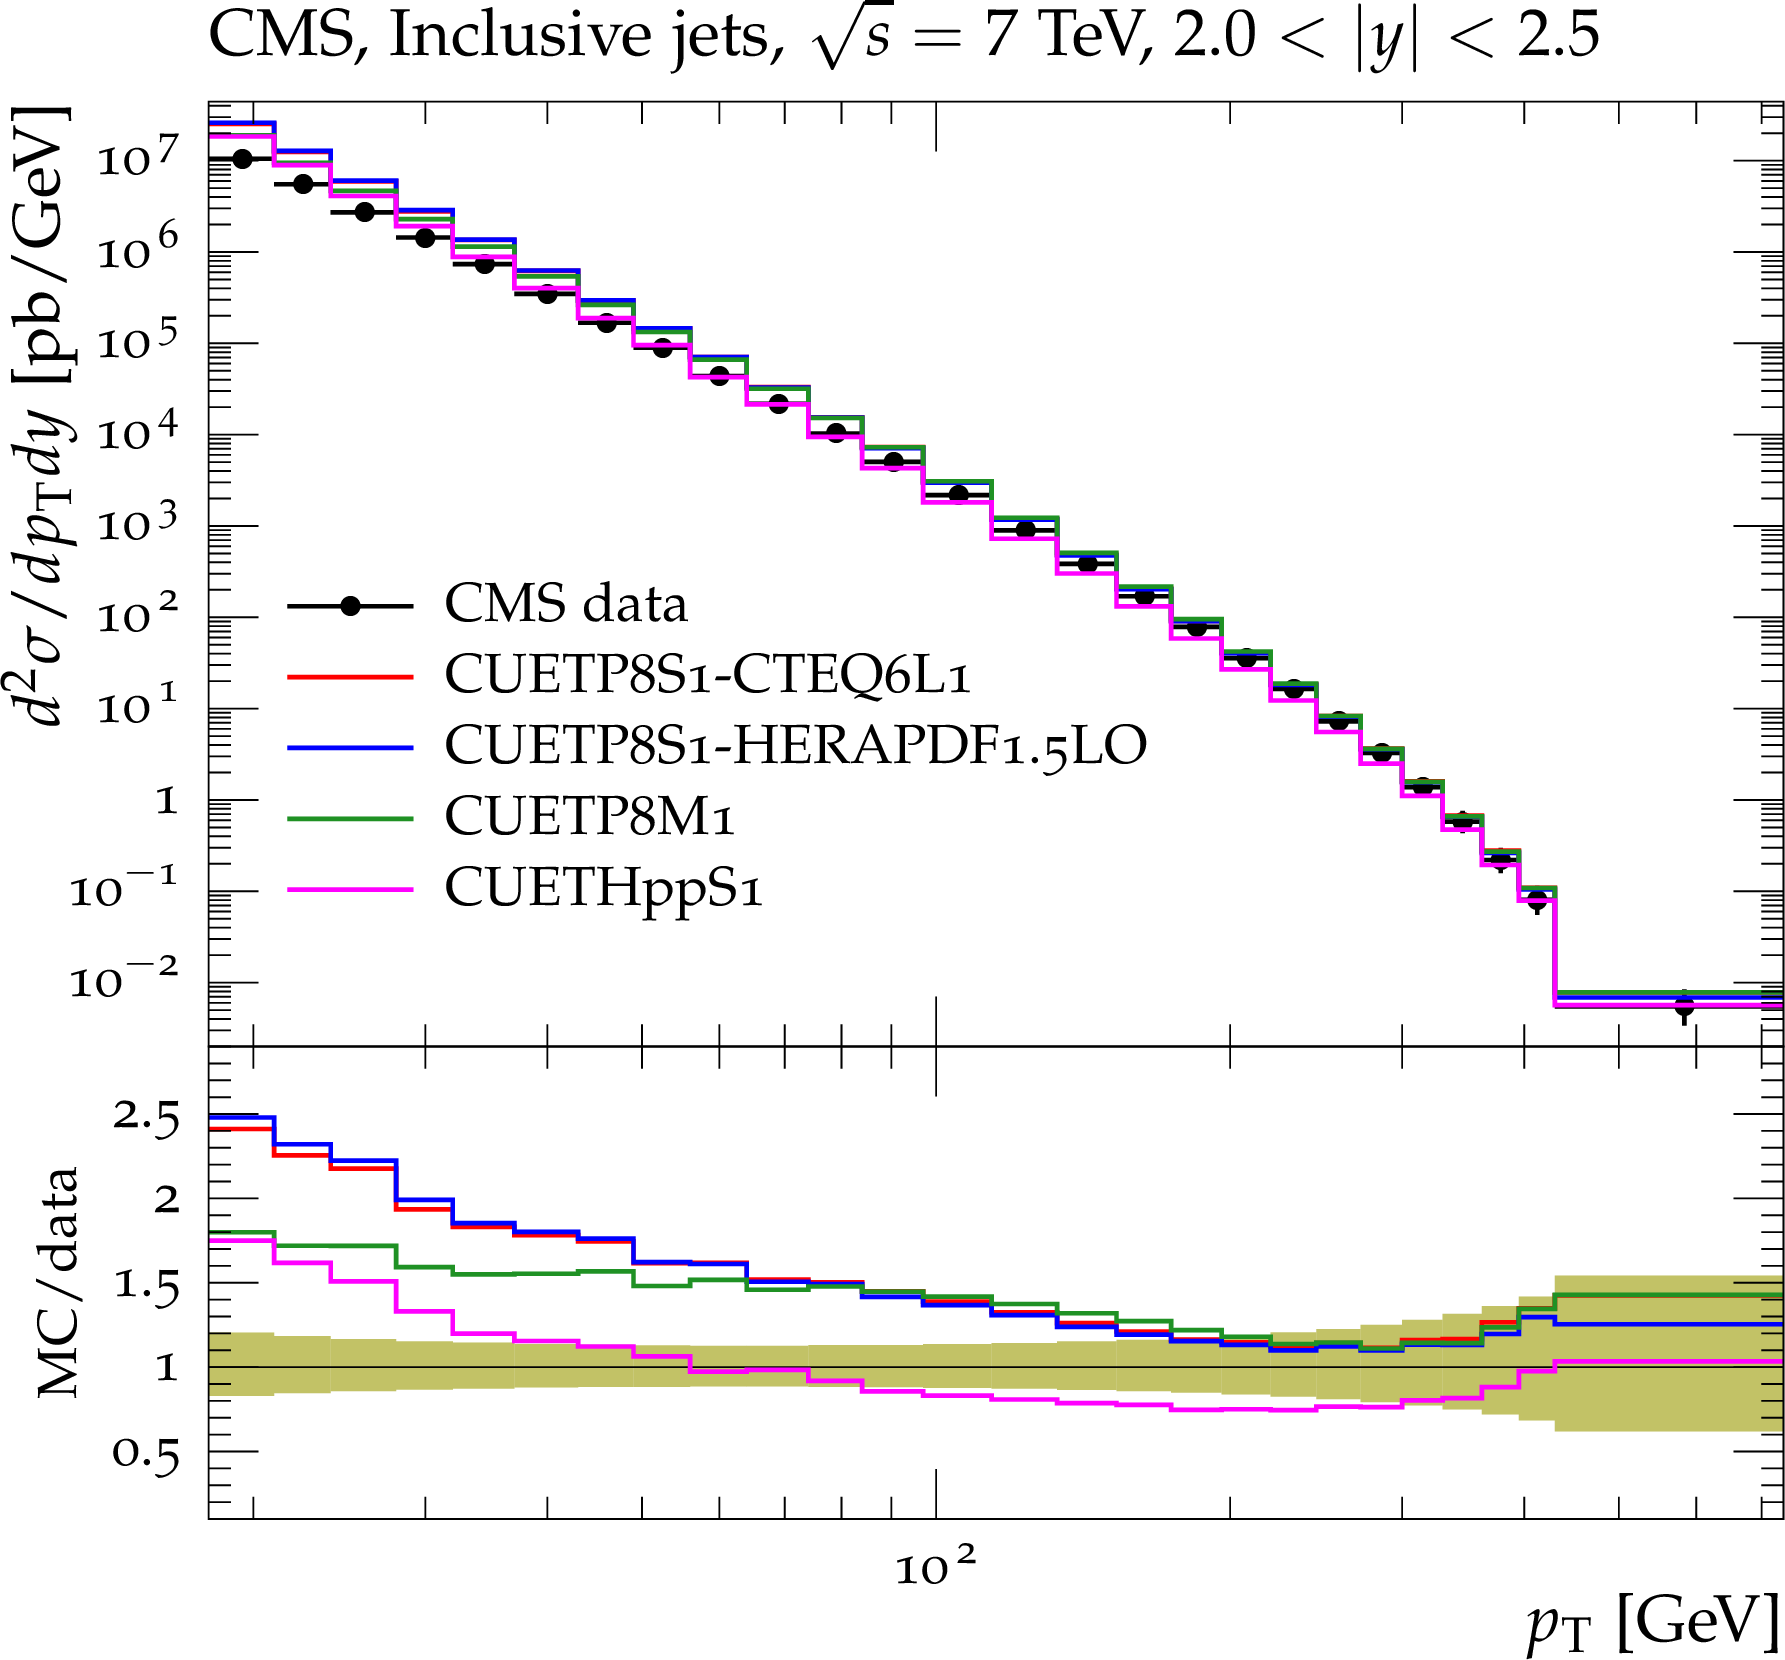
png pdf |
Figure 15-e:
CMS data at $\sqrt {s}=$ 7 TeV[51] for the inclusive jet cross section as a function of $ {p_{\mathrm {T}}} $ in different rapidity ranges compared to predictions of PYTHIA8 using CUETP8S1-CTEQ6L1, CUETP8S1-HERAPDF, and CUETP8M1, and of HERWIG++ using CUETHppS1. The bottom panels of each plot show the ratios of these predictions to the data, and the green bands around unity represent the total experimental uncertainty. |

png pdf |
Figure 15-f:
CMS data at $\sqrt {s}=$ 7 TeV[51] for the inclusive jet cross section as a function of $ {p_{\mathrm {T}}} $ in different rapidity ranges compared to predictions of PYTHIA8 using CUETP8S1-CTEQ6L1, CUETP8S1-HERAPDF, and CUETP8M1, and of HERWIG++ using CUETHppS1. The bottom panels of each plot show the ratios of these predictions to the data, and the green bands around unity represent the total experimental uncertainty. |
png pdf |
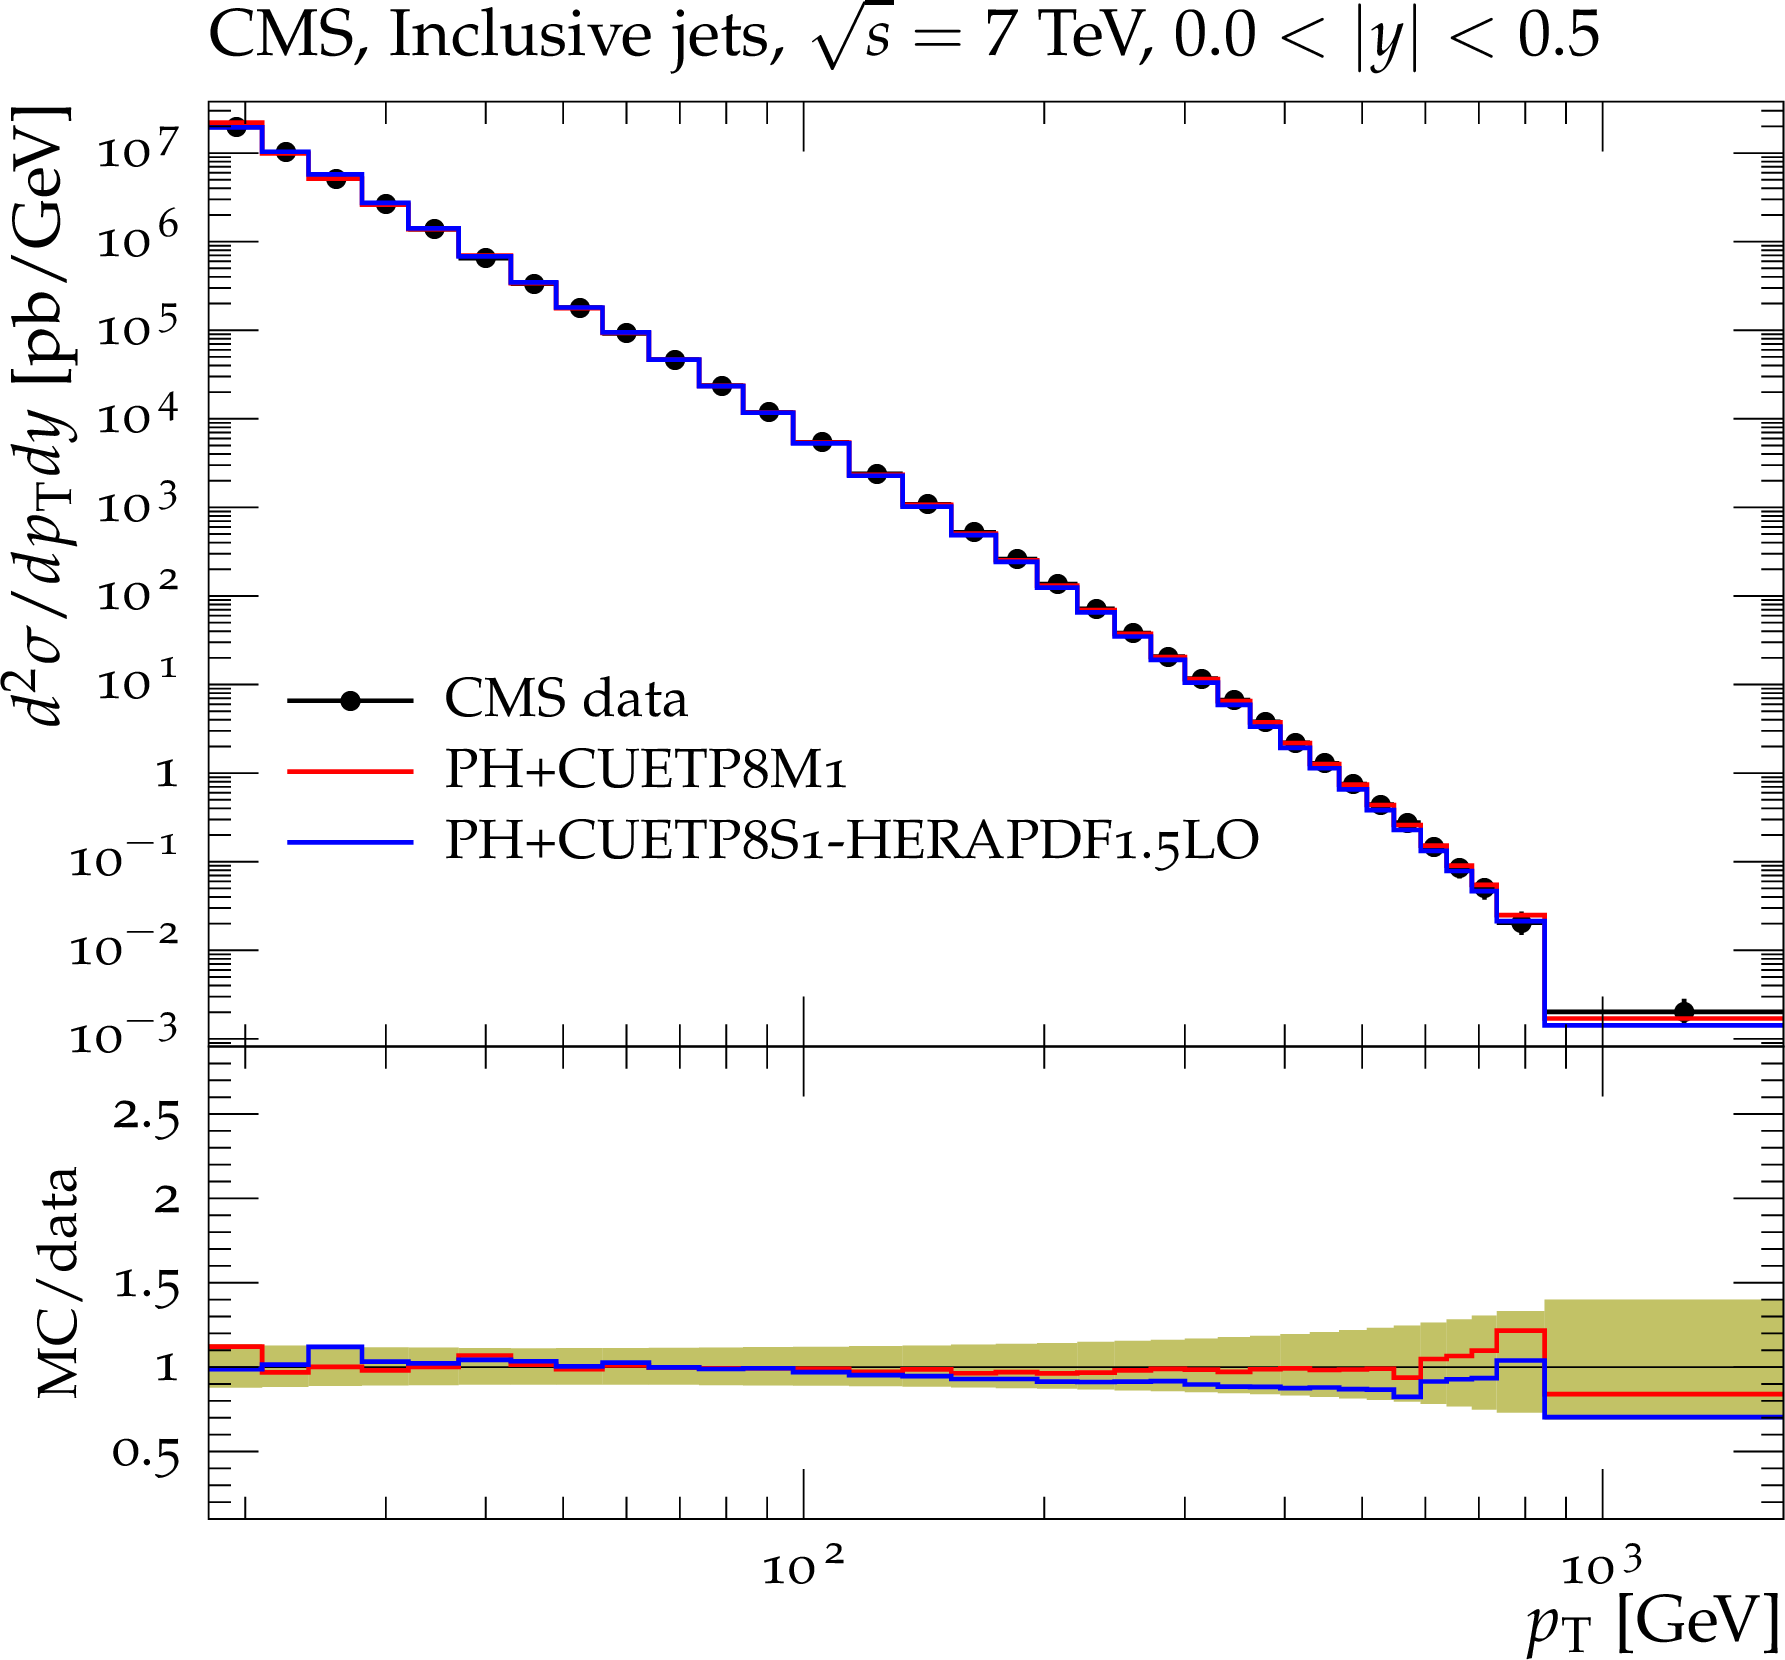
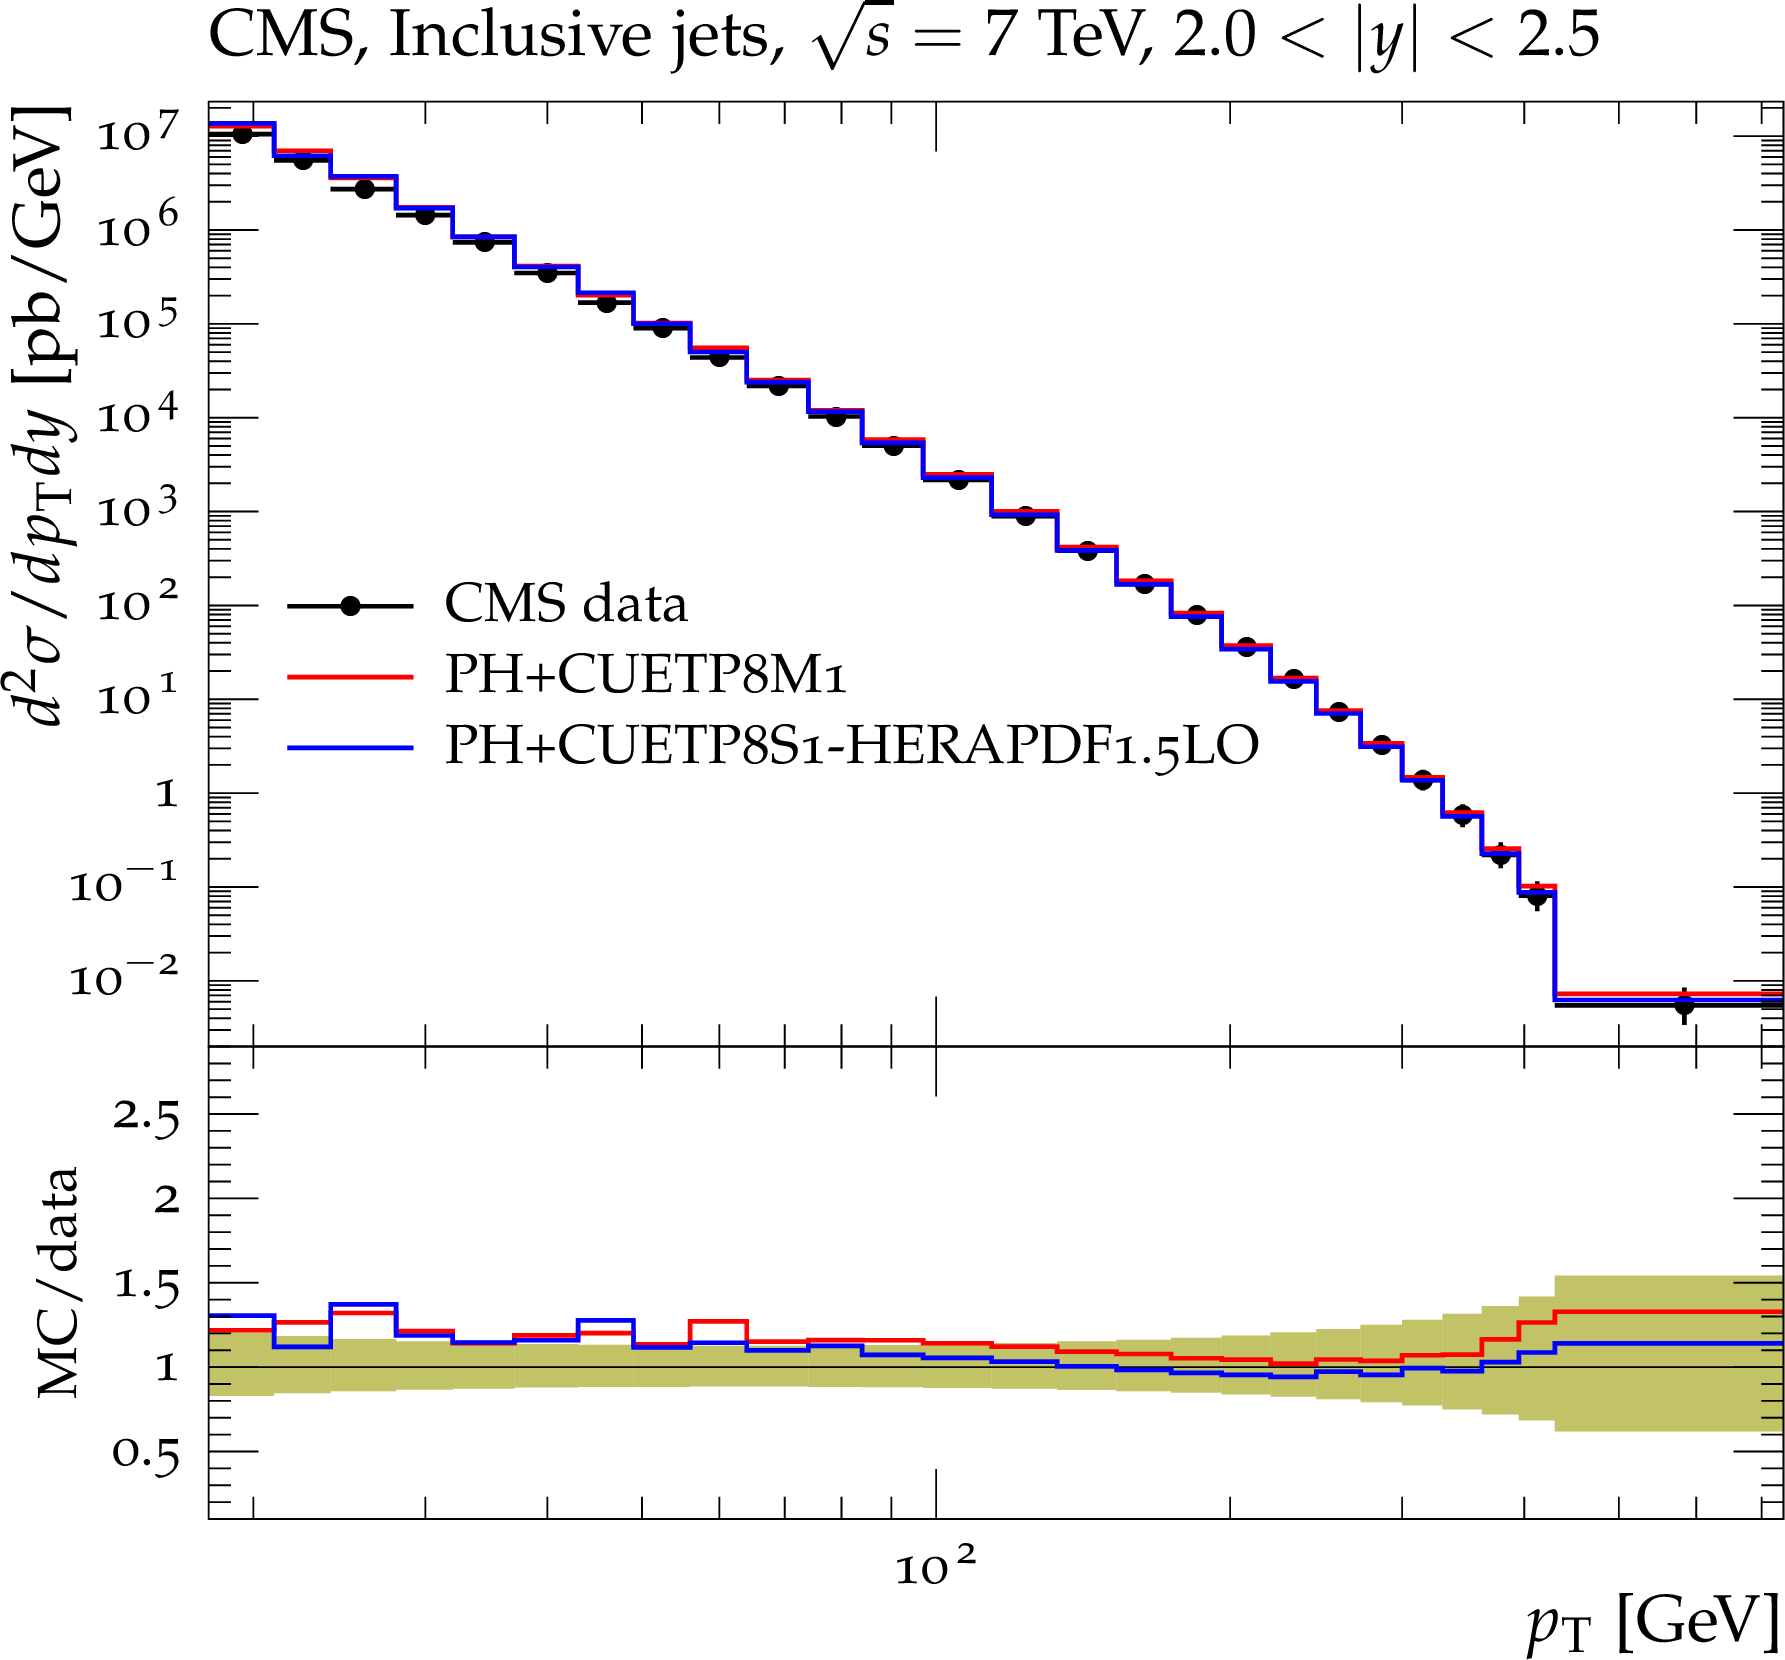
Figure 16-a:
CMS data at $\sqrt {s}=$ 7 TeV[51] for the inclusive jet cross section as a function of $ {p_{\mathrm {T}}} $ in different rapidity ranges compared to predictions of POWHEG interfaced to PYTHIA8 using CUETP8S1-HERAPDF1.5LO\ and CUETP8M1. The bottom panels of each plot show the ratios of these predictions to the data, and the green bands around unity represent the total experimental uncertainty. |
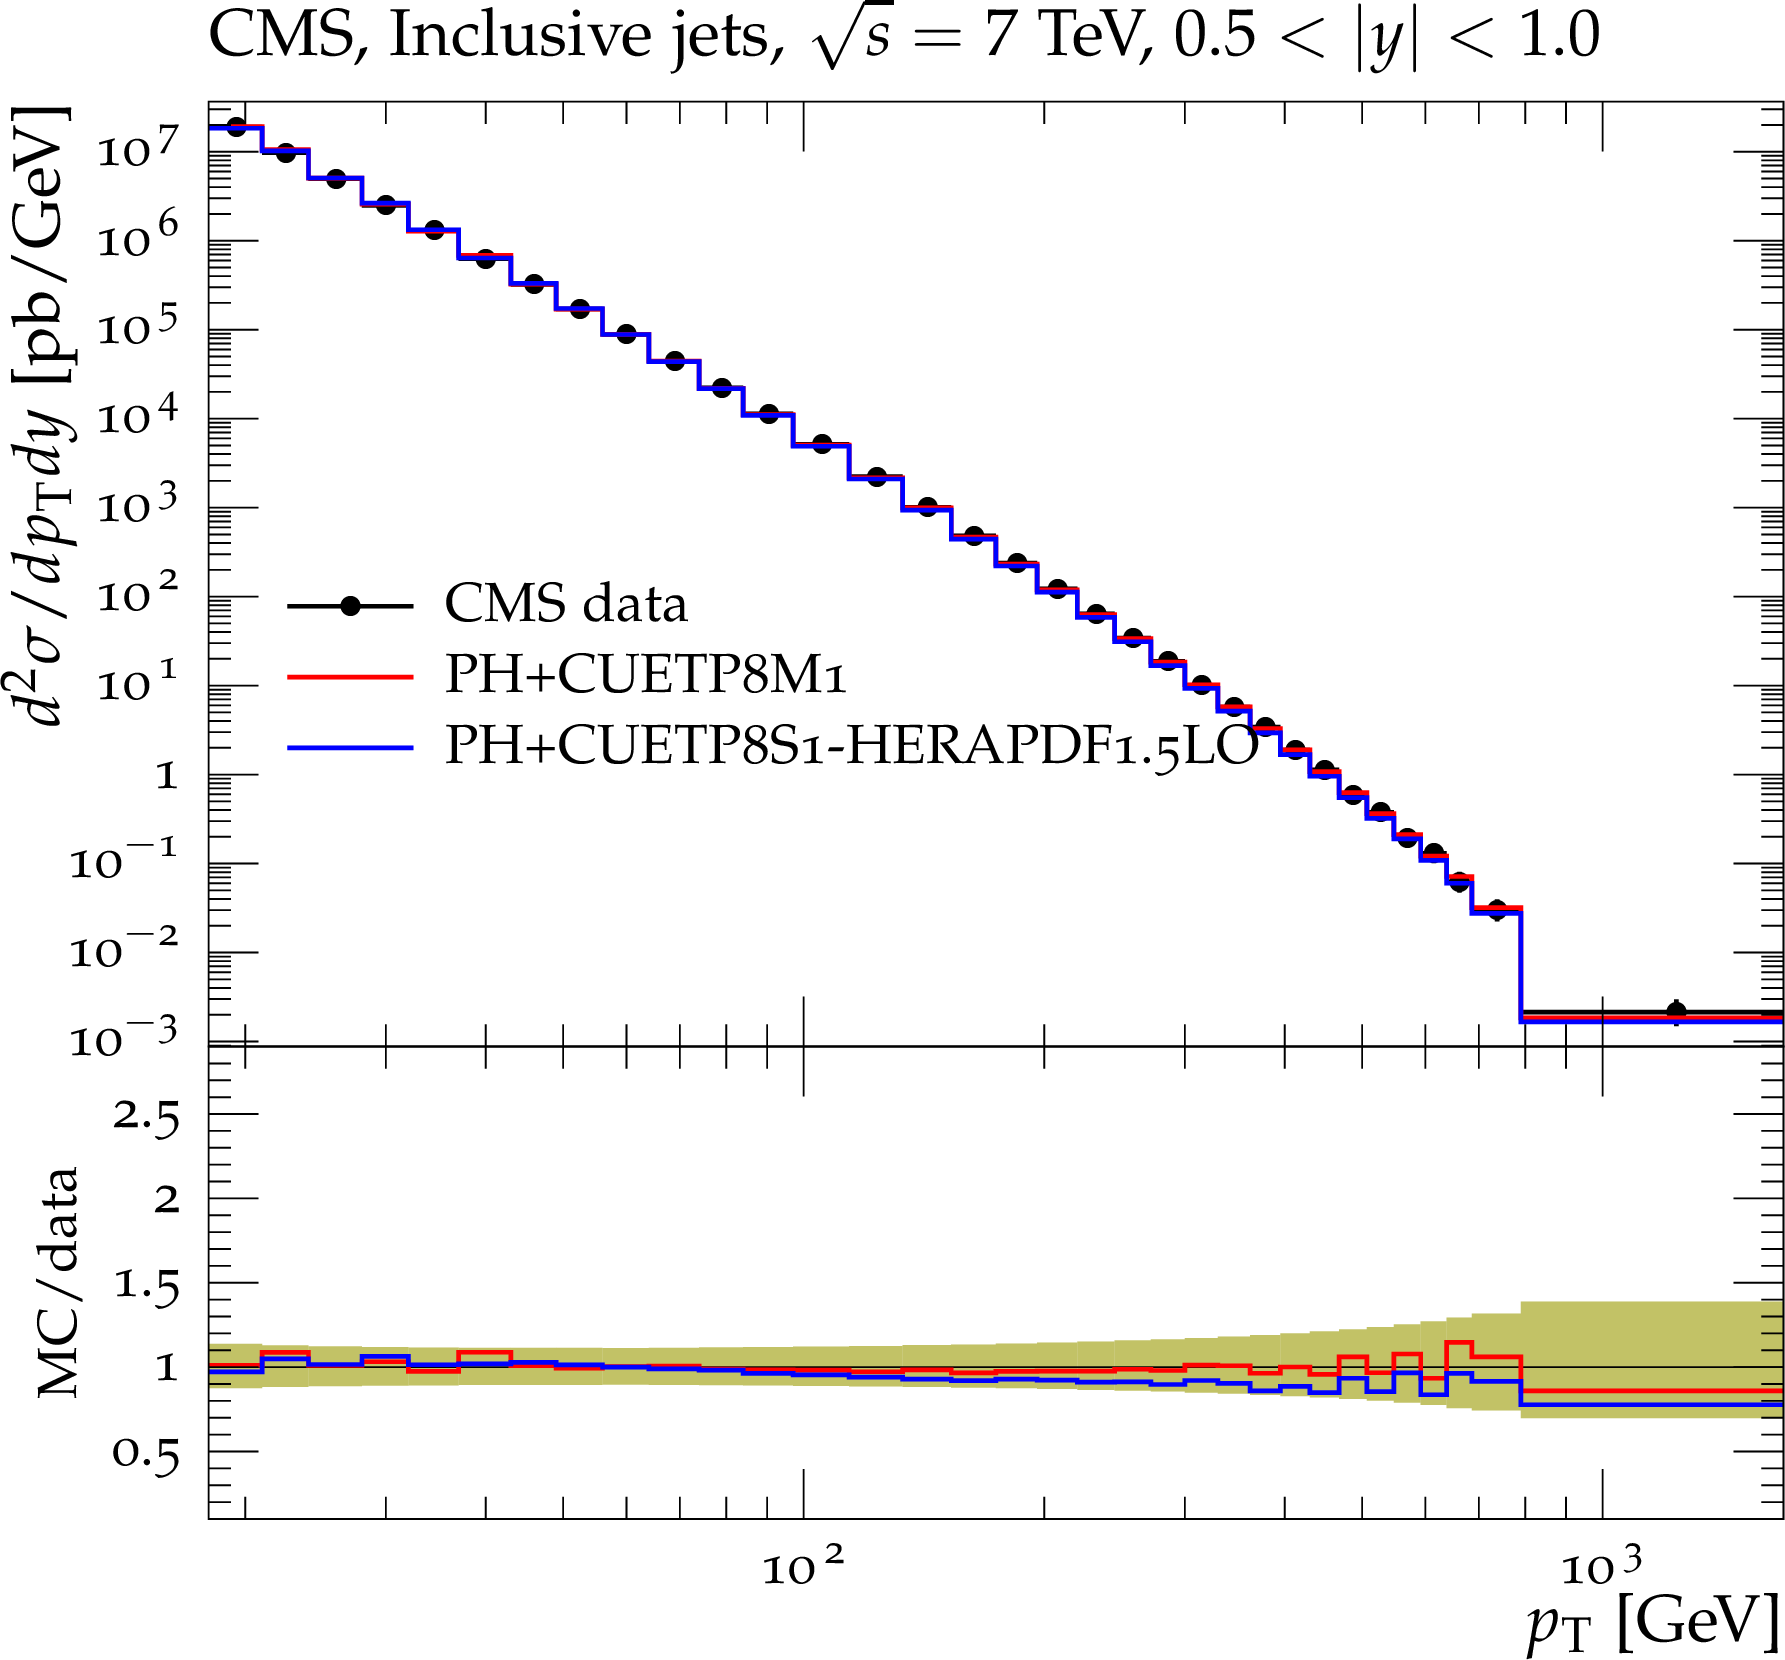
png pdf |
Figure 16-b:
CMS data at $\sqrt {s}=$ 7 TeV[51] for the inclusive jet cross section as a function of $ {p_{\mathrm {T}}} $ in different rapidity ranges compared to predictions of POWHEG interfaced to PYTHIA8 using CUETP8S1-HERAPDF1.5LO\ and CUETP8M1. The bottom panels of each plot show the ratios of these predictions to the data, and the green bands around unity represent the total experimental uncertainty. |
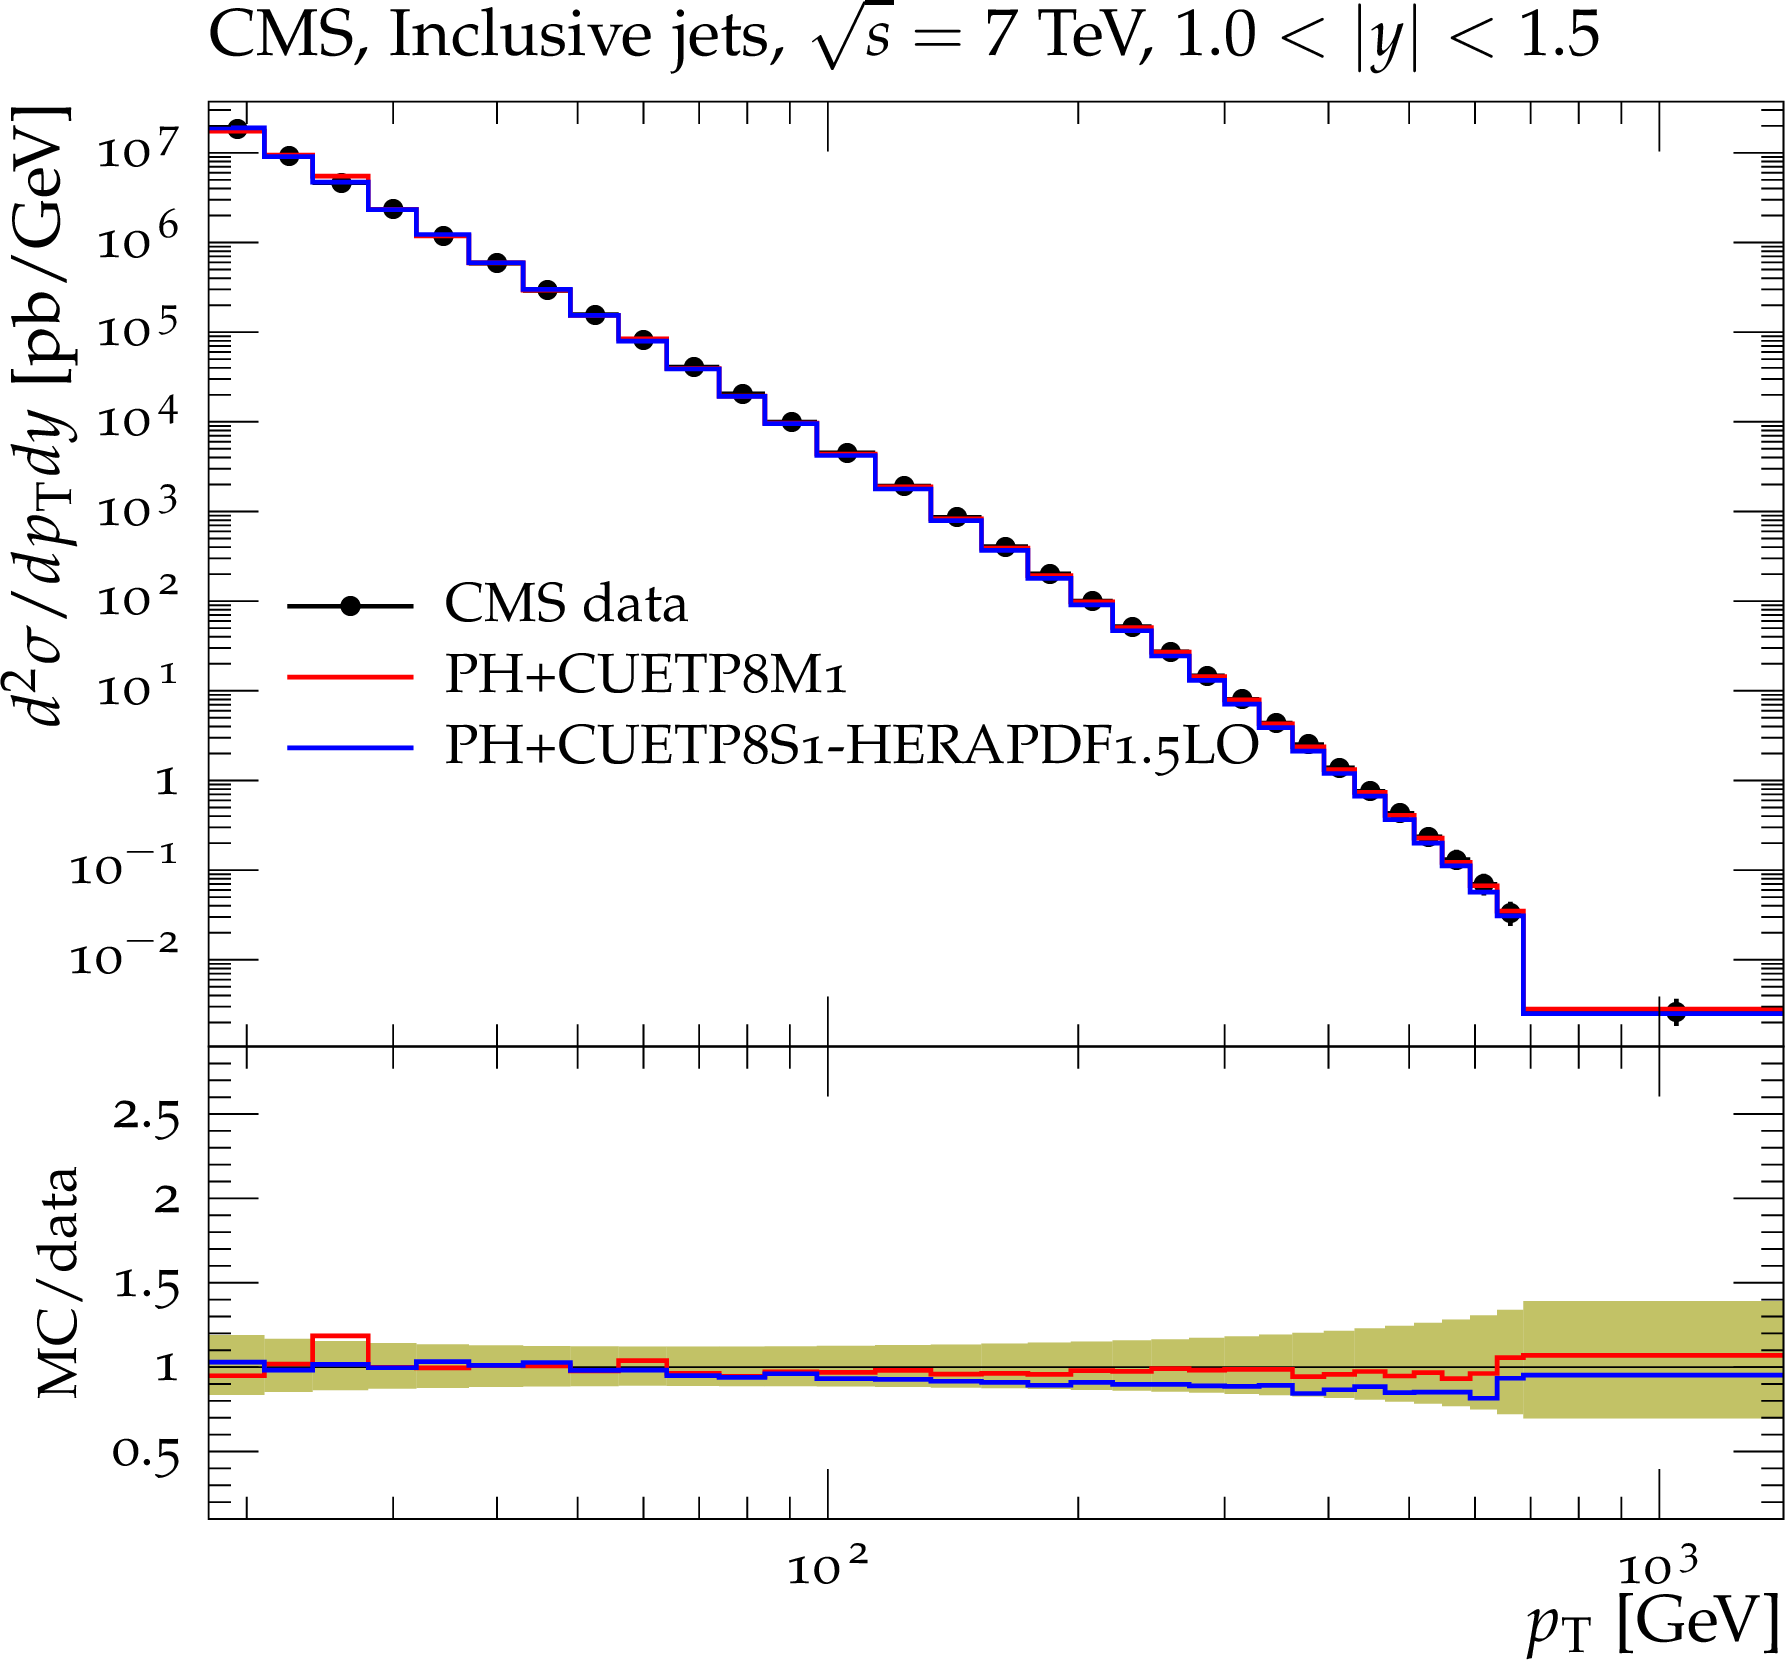
png pdf |
Figure 16-c:
CMS data at $\sqrt {s}=$ 7 TeV[51] for the inclusive jet cross section as a function of $ {p_{\mathrm {T}}} $ in different rapidity ranges compared to predictions of POWHEG interfaced to PYTHIA8 using CUETP8S1-HERAPDF1.5LO\ and CUETP8M1. The bottom panels of each plot show the ratios of these predictions to the data, and the green bands around unity represent the total experimental uncertainty. |
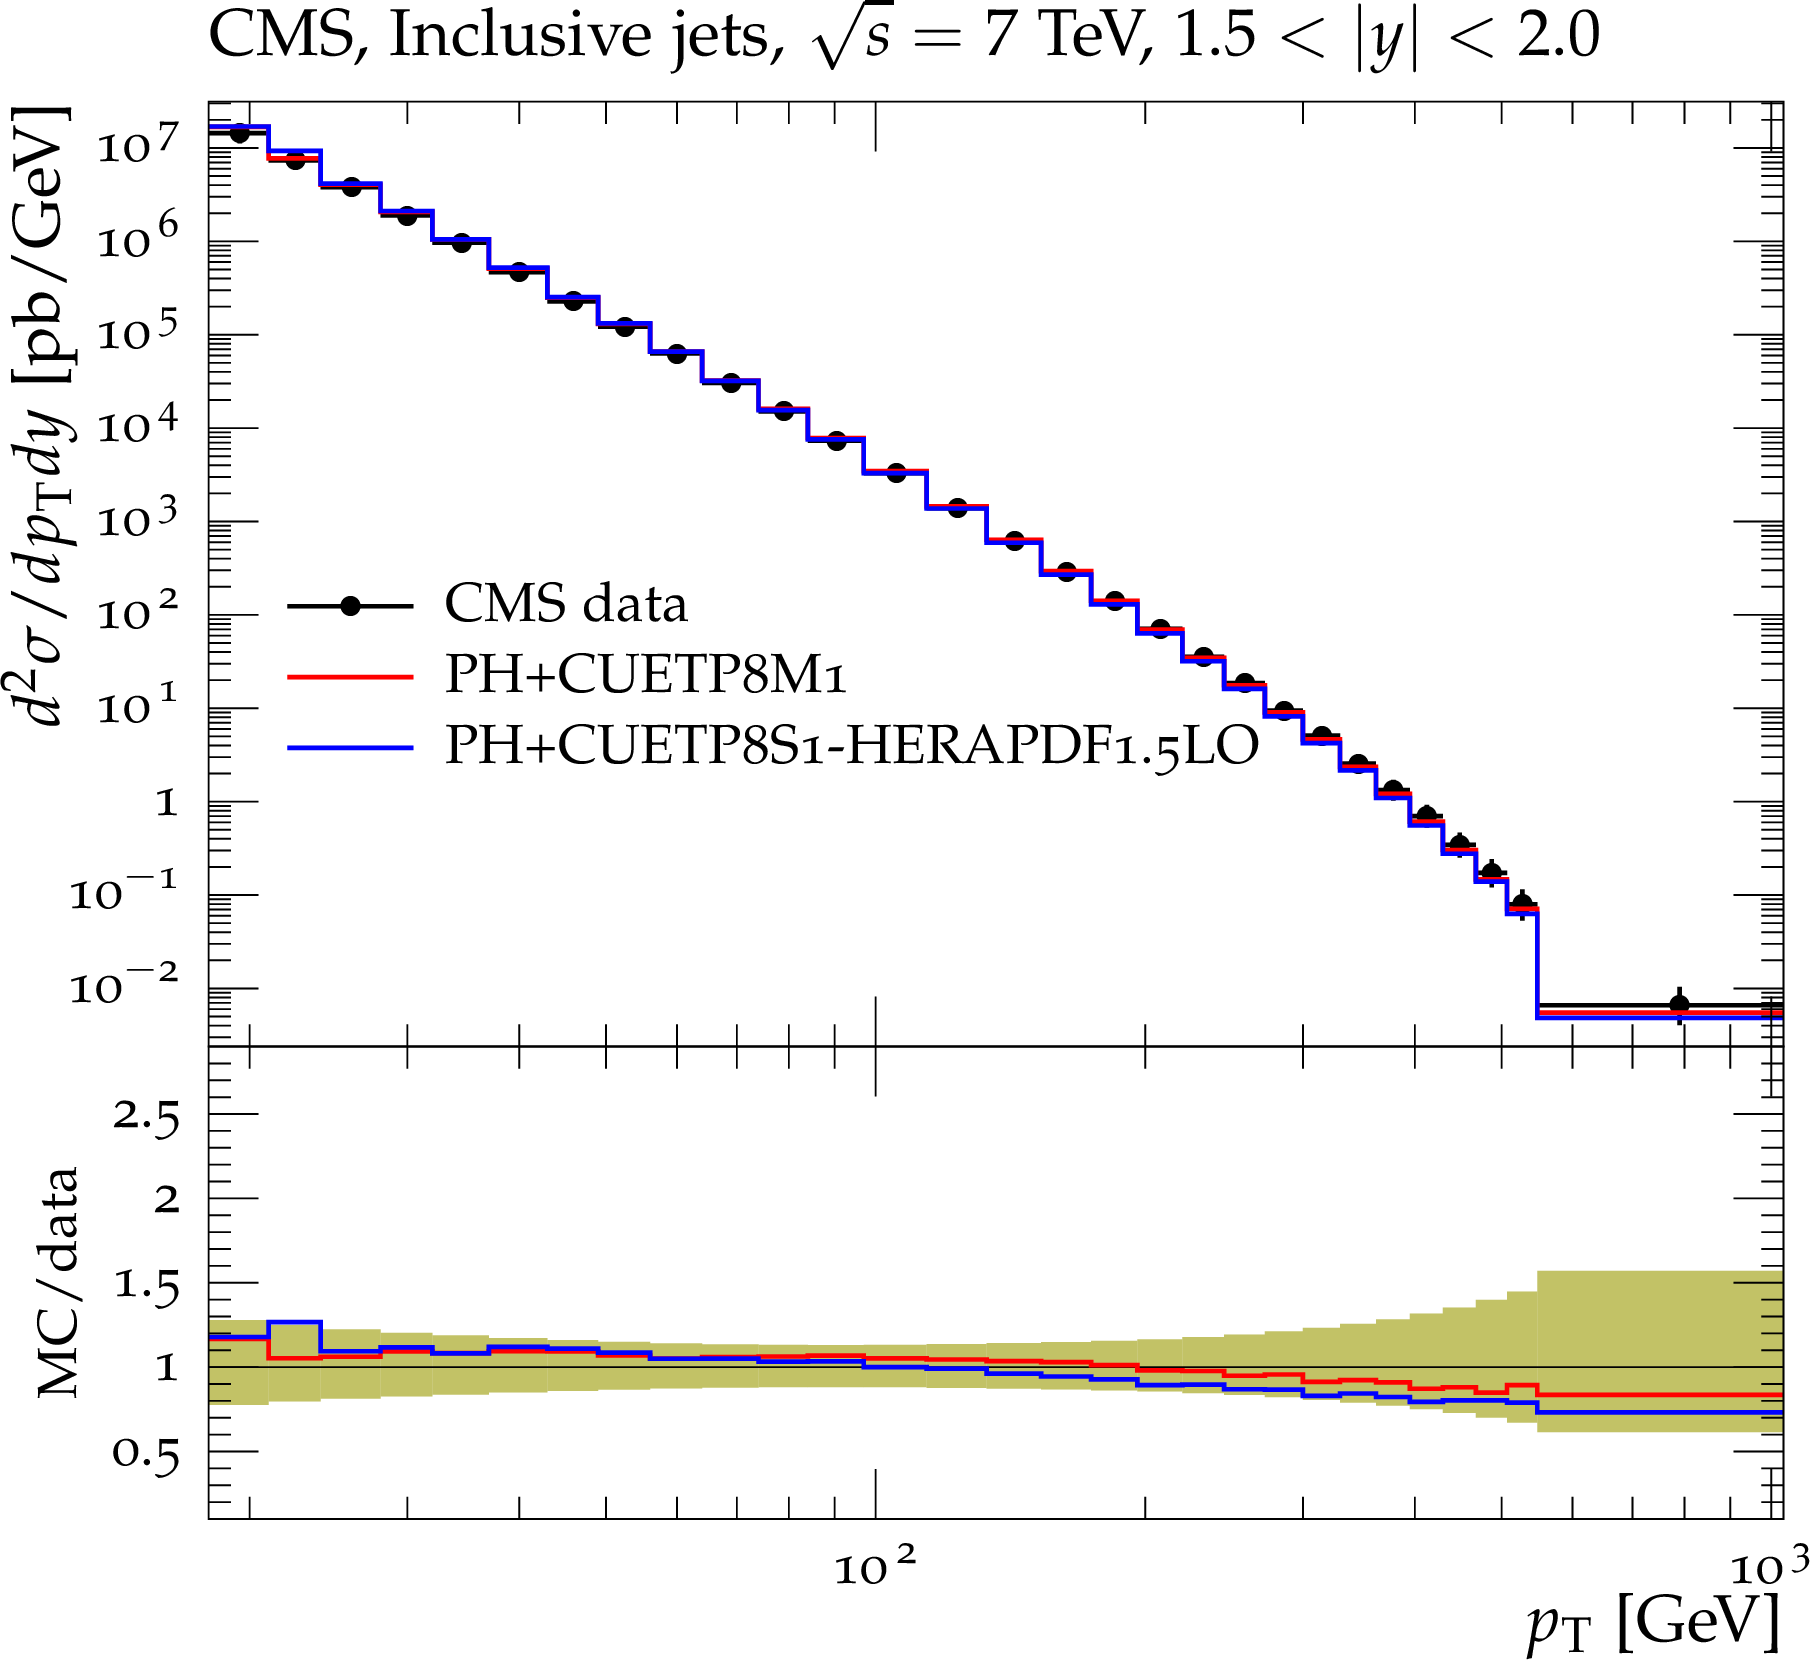
png pdf |
Figure 16-d:
CMS data at $\sqrt {s}=$ 7 TeV[51] for the inclusive jet cross section as a function of $ {p_{\mathrm {T}}} $ in different rapidity ranges compared to predictions of POWHEG interfaced to PYTHIA8 using CUETP8S1-HERAPDF1.5LO\ and CUETP8M1. The bottom panels of each plot show the ratios of these predictions to the data, and the green bands around unity represent the total experimental uncertainty. |
png pdf |
Figure 16-e:
CMS data at $\sqrt {s}=$ 7 TeV[51] for the inclusive jet cross section as a function of $ {p_{\mathrm {T}}} $ in different rapidity ranges compared to predictions of POWHEG interfaced to PYTHIA8 using CUETP8S1-HERAPDF1.5LO\ and CUETP8M1. The bottom panels of each plot show the ratios of these predictions to the data, and the green bands around unity represent the total experimental uncertainty. |

png pdf |
Figure 16-f:
CMS data at $\sqrt {s}=$ 7 TeV[51] for the inclusive jet cross section as a function of $ {p_{\mathrm {T}}} $ in different rapidity ranges compared to predictions of POWHEG interfaced to PYTHIA8 using CUETP8S1-HERAPDF1.5LO\ and CUETP8M1. The bottom panels of each plot show the ratios of these predictions to the data, and the green bands around unity represent the total experimental uncertainty. |
png pdf |
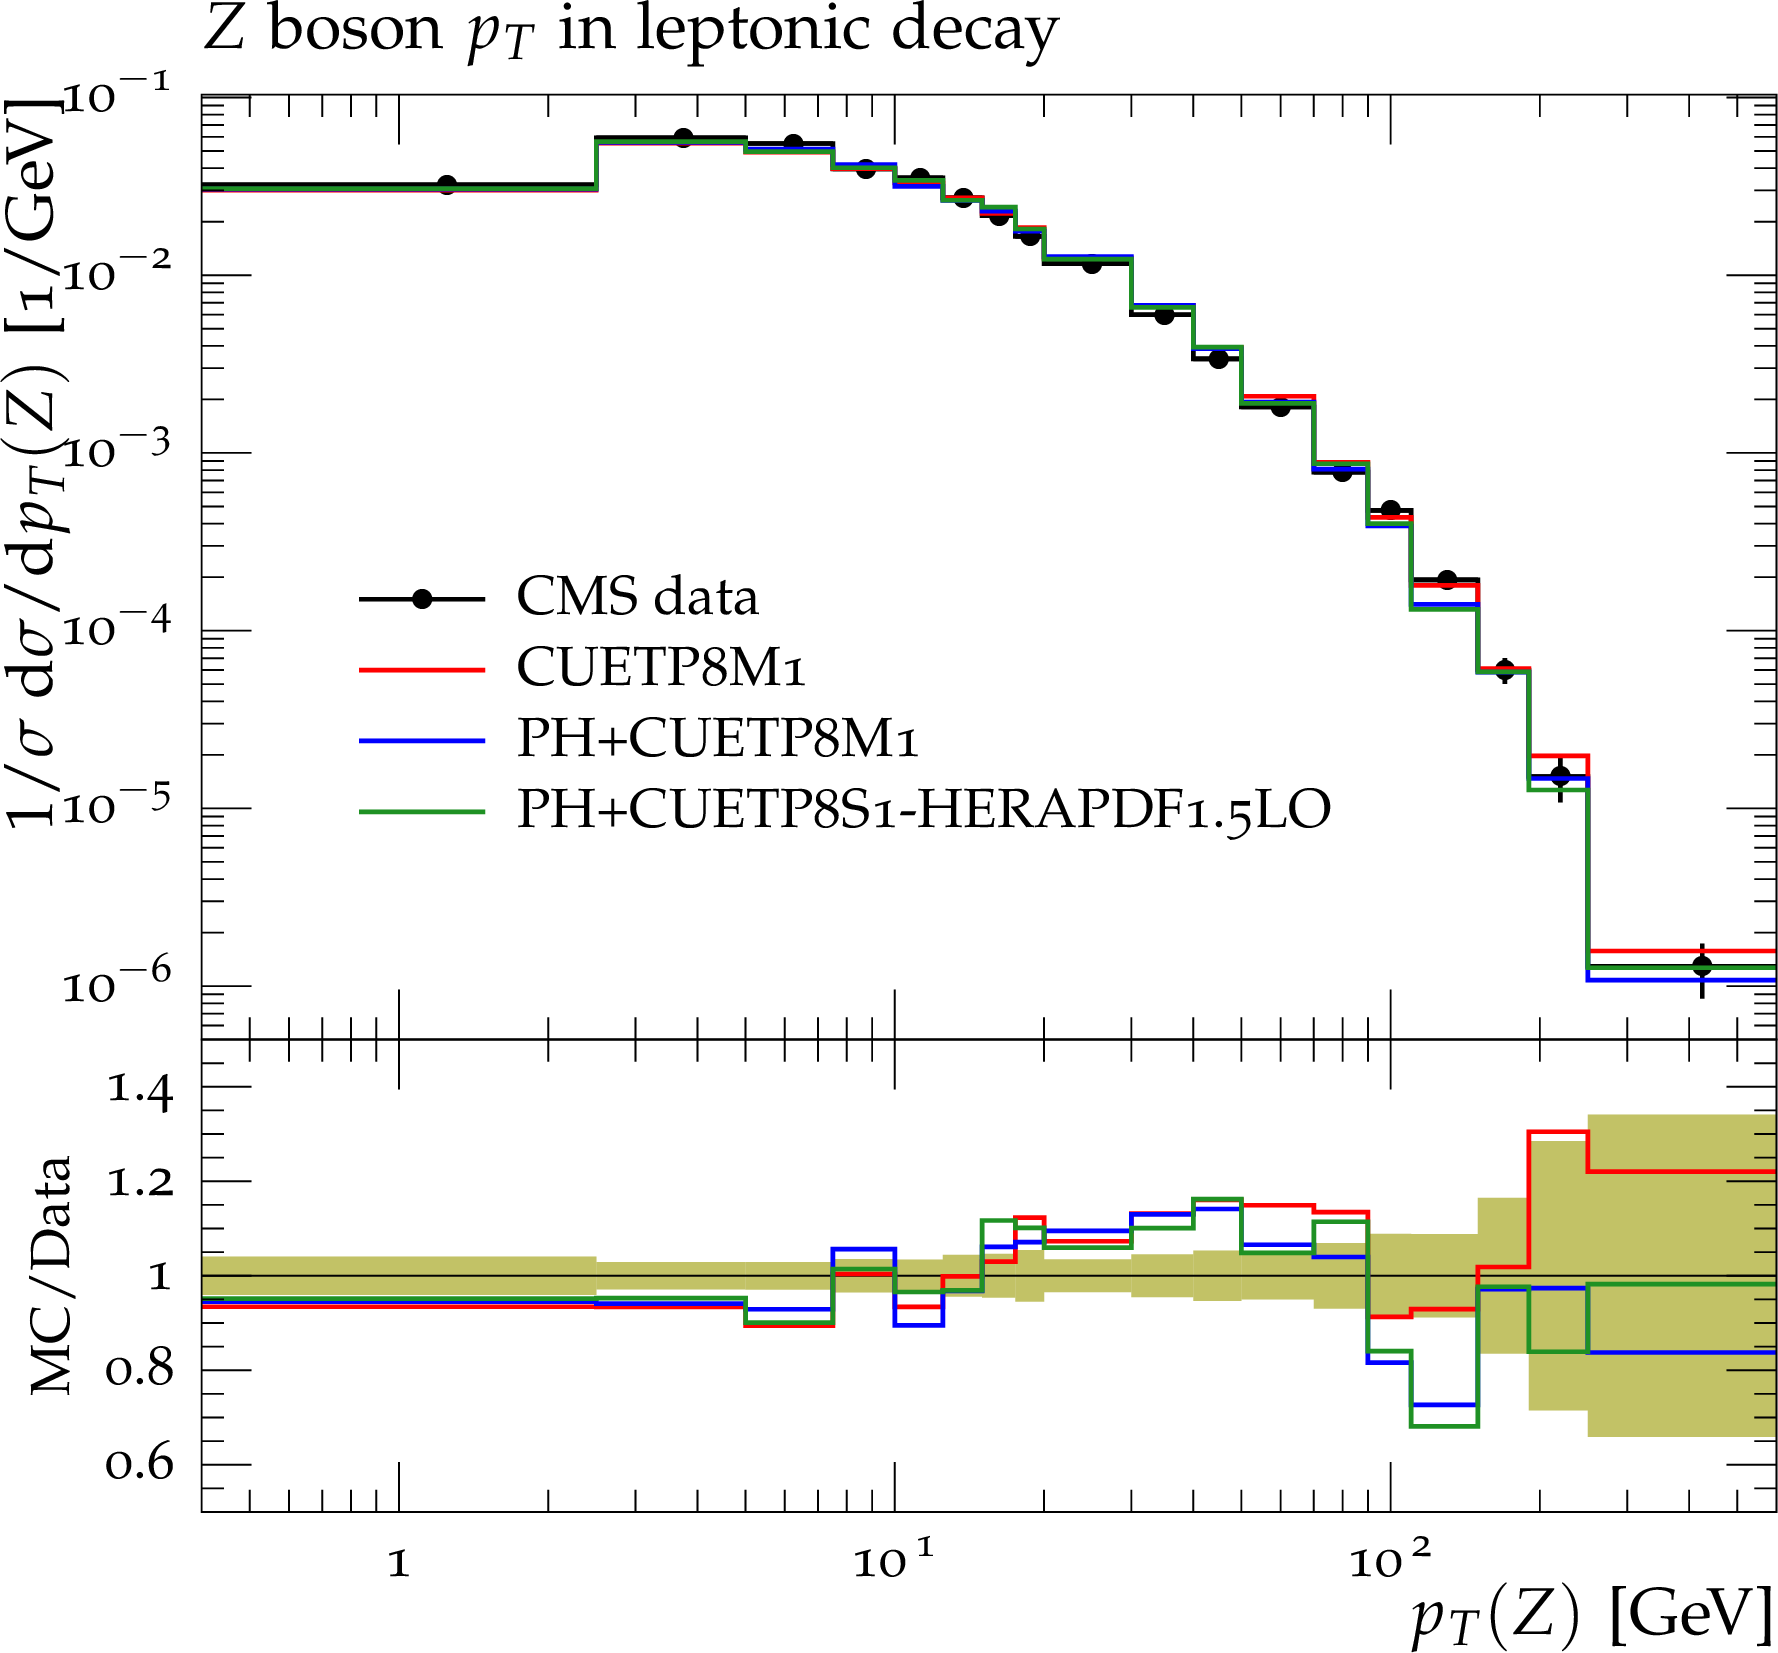
Figure 17-a:
Transverse momentum $ {p_{\mathrm {T}}} $ (a) and rapidity distributions (b) of Z boson production in pp collisions at $\sqrt {s}=$ 7 TeV[52]. The data are compared to PYTHIA8 using CUETP8M1, and to POWHEG interfaced to PYTHIA8 using CUETP8S1-CTEQ6L1 and CUETP8M1. The green bands in the ratios represent the total experimental uncertainty. |
png pdf |
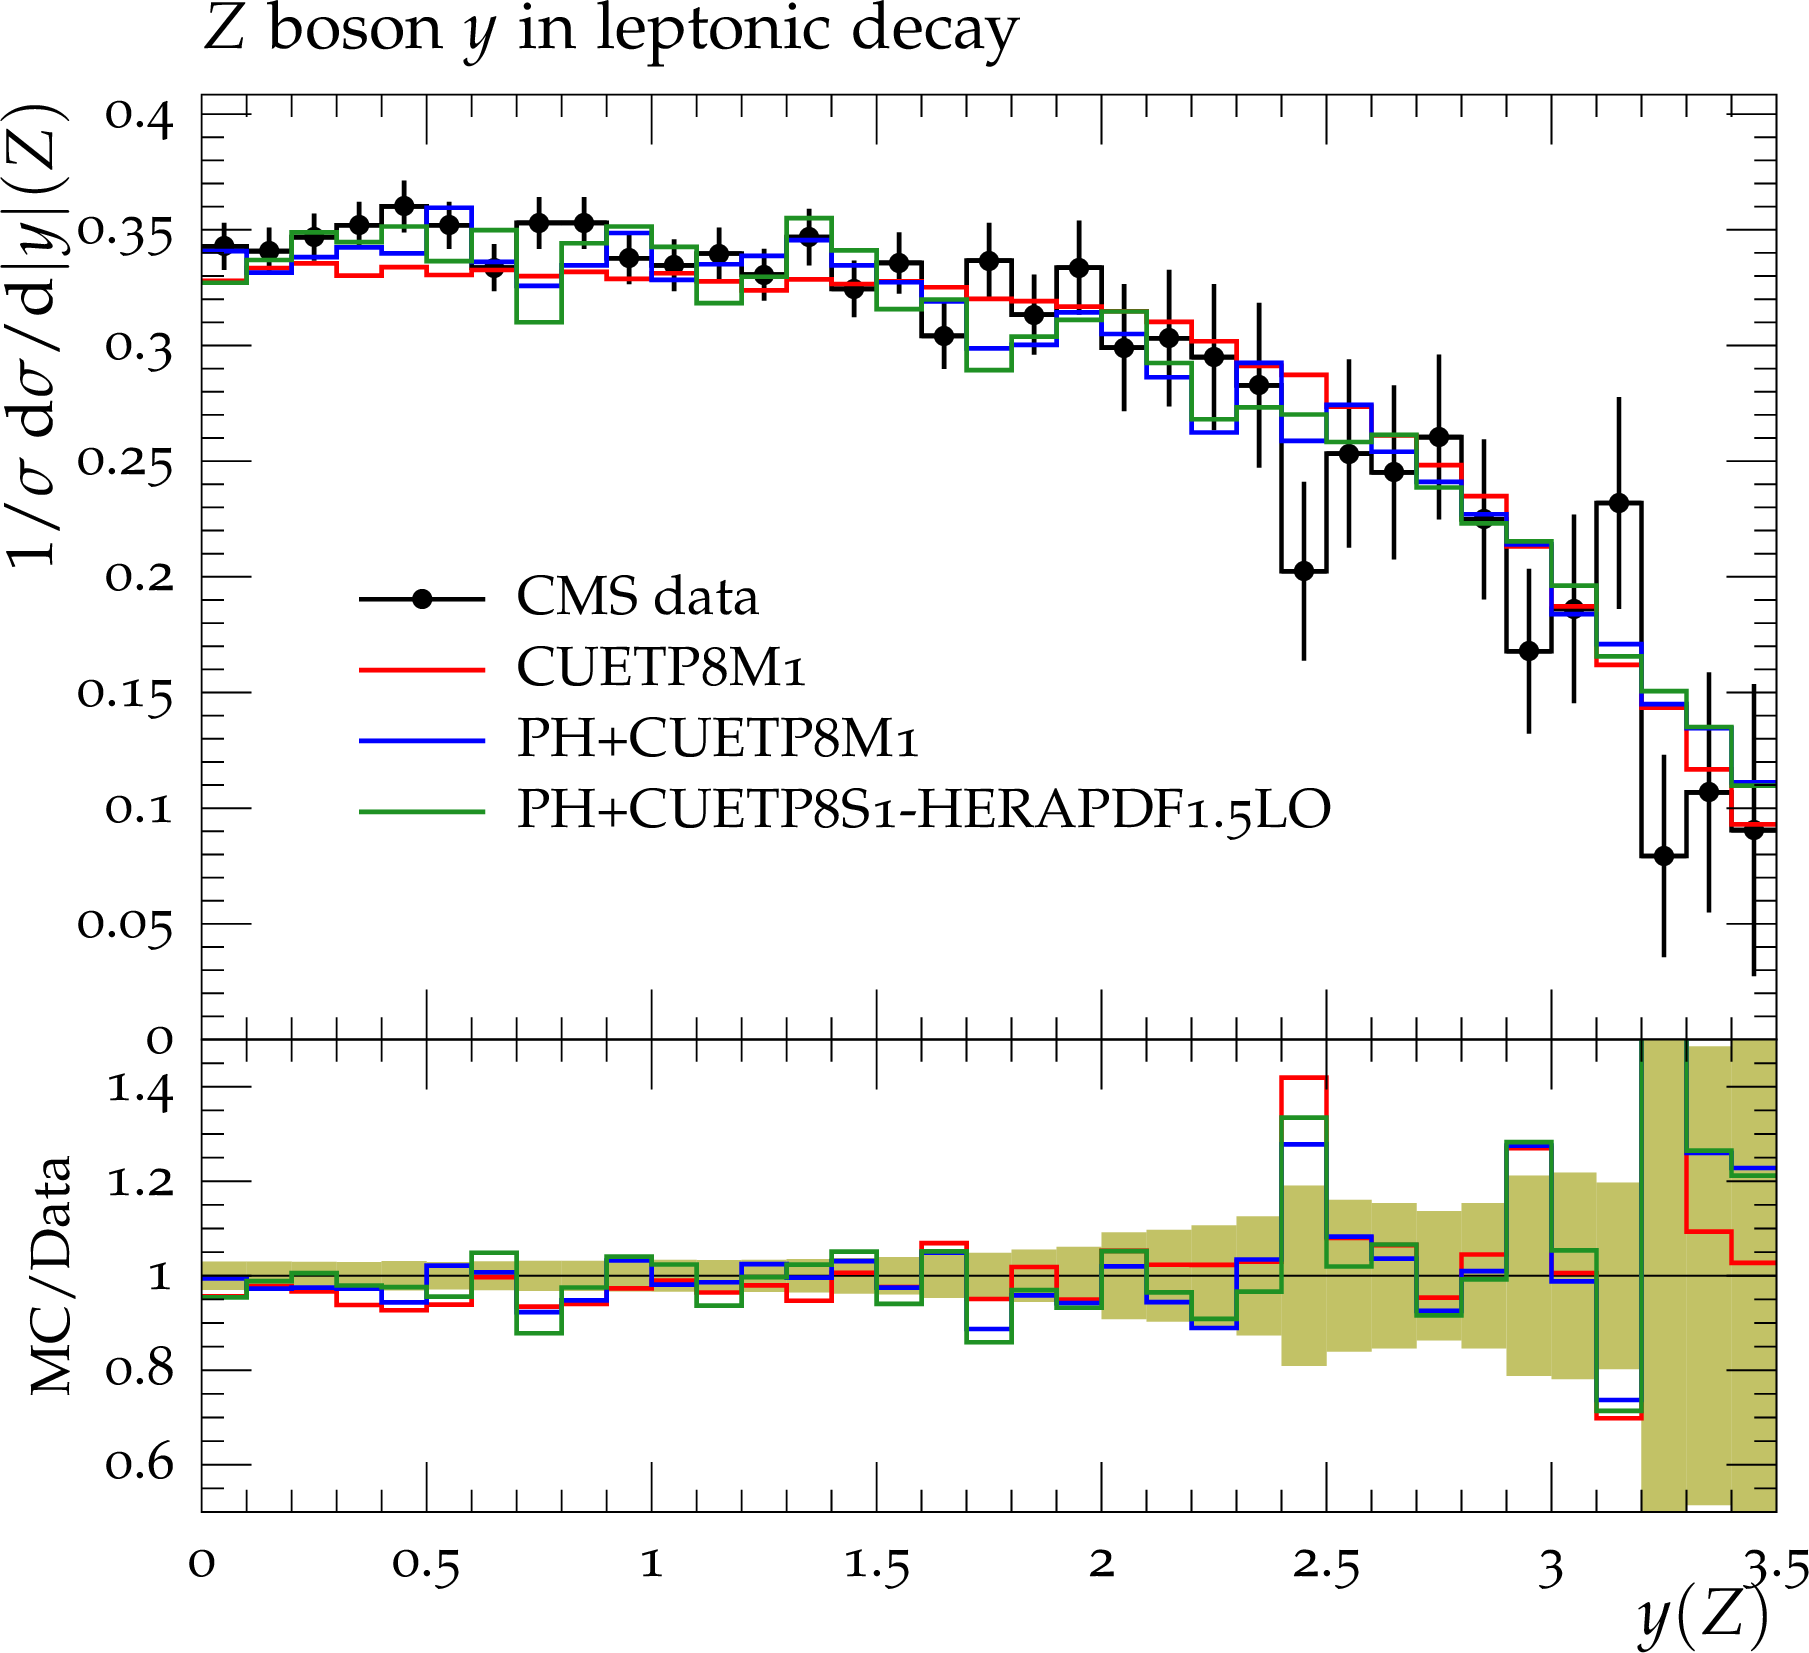
Figure 17-b:
Transverse momentum $ {p_{\mathrm {T}}} $ (a) and rapidity distributions (b) of Z boson production in pp collisions at $\sqrt {s}=$ 7 TeV[52]. The data are compared to PYTHIA8 using CUETP8M1, and to POWHEG interfaced to PYTHIA8 using CUETP8S1-CTEQ6L1 and CUETP8M1. The green bands in the ratios represent the total experimental uncertainty. |
png pdf |
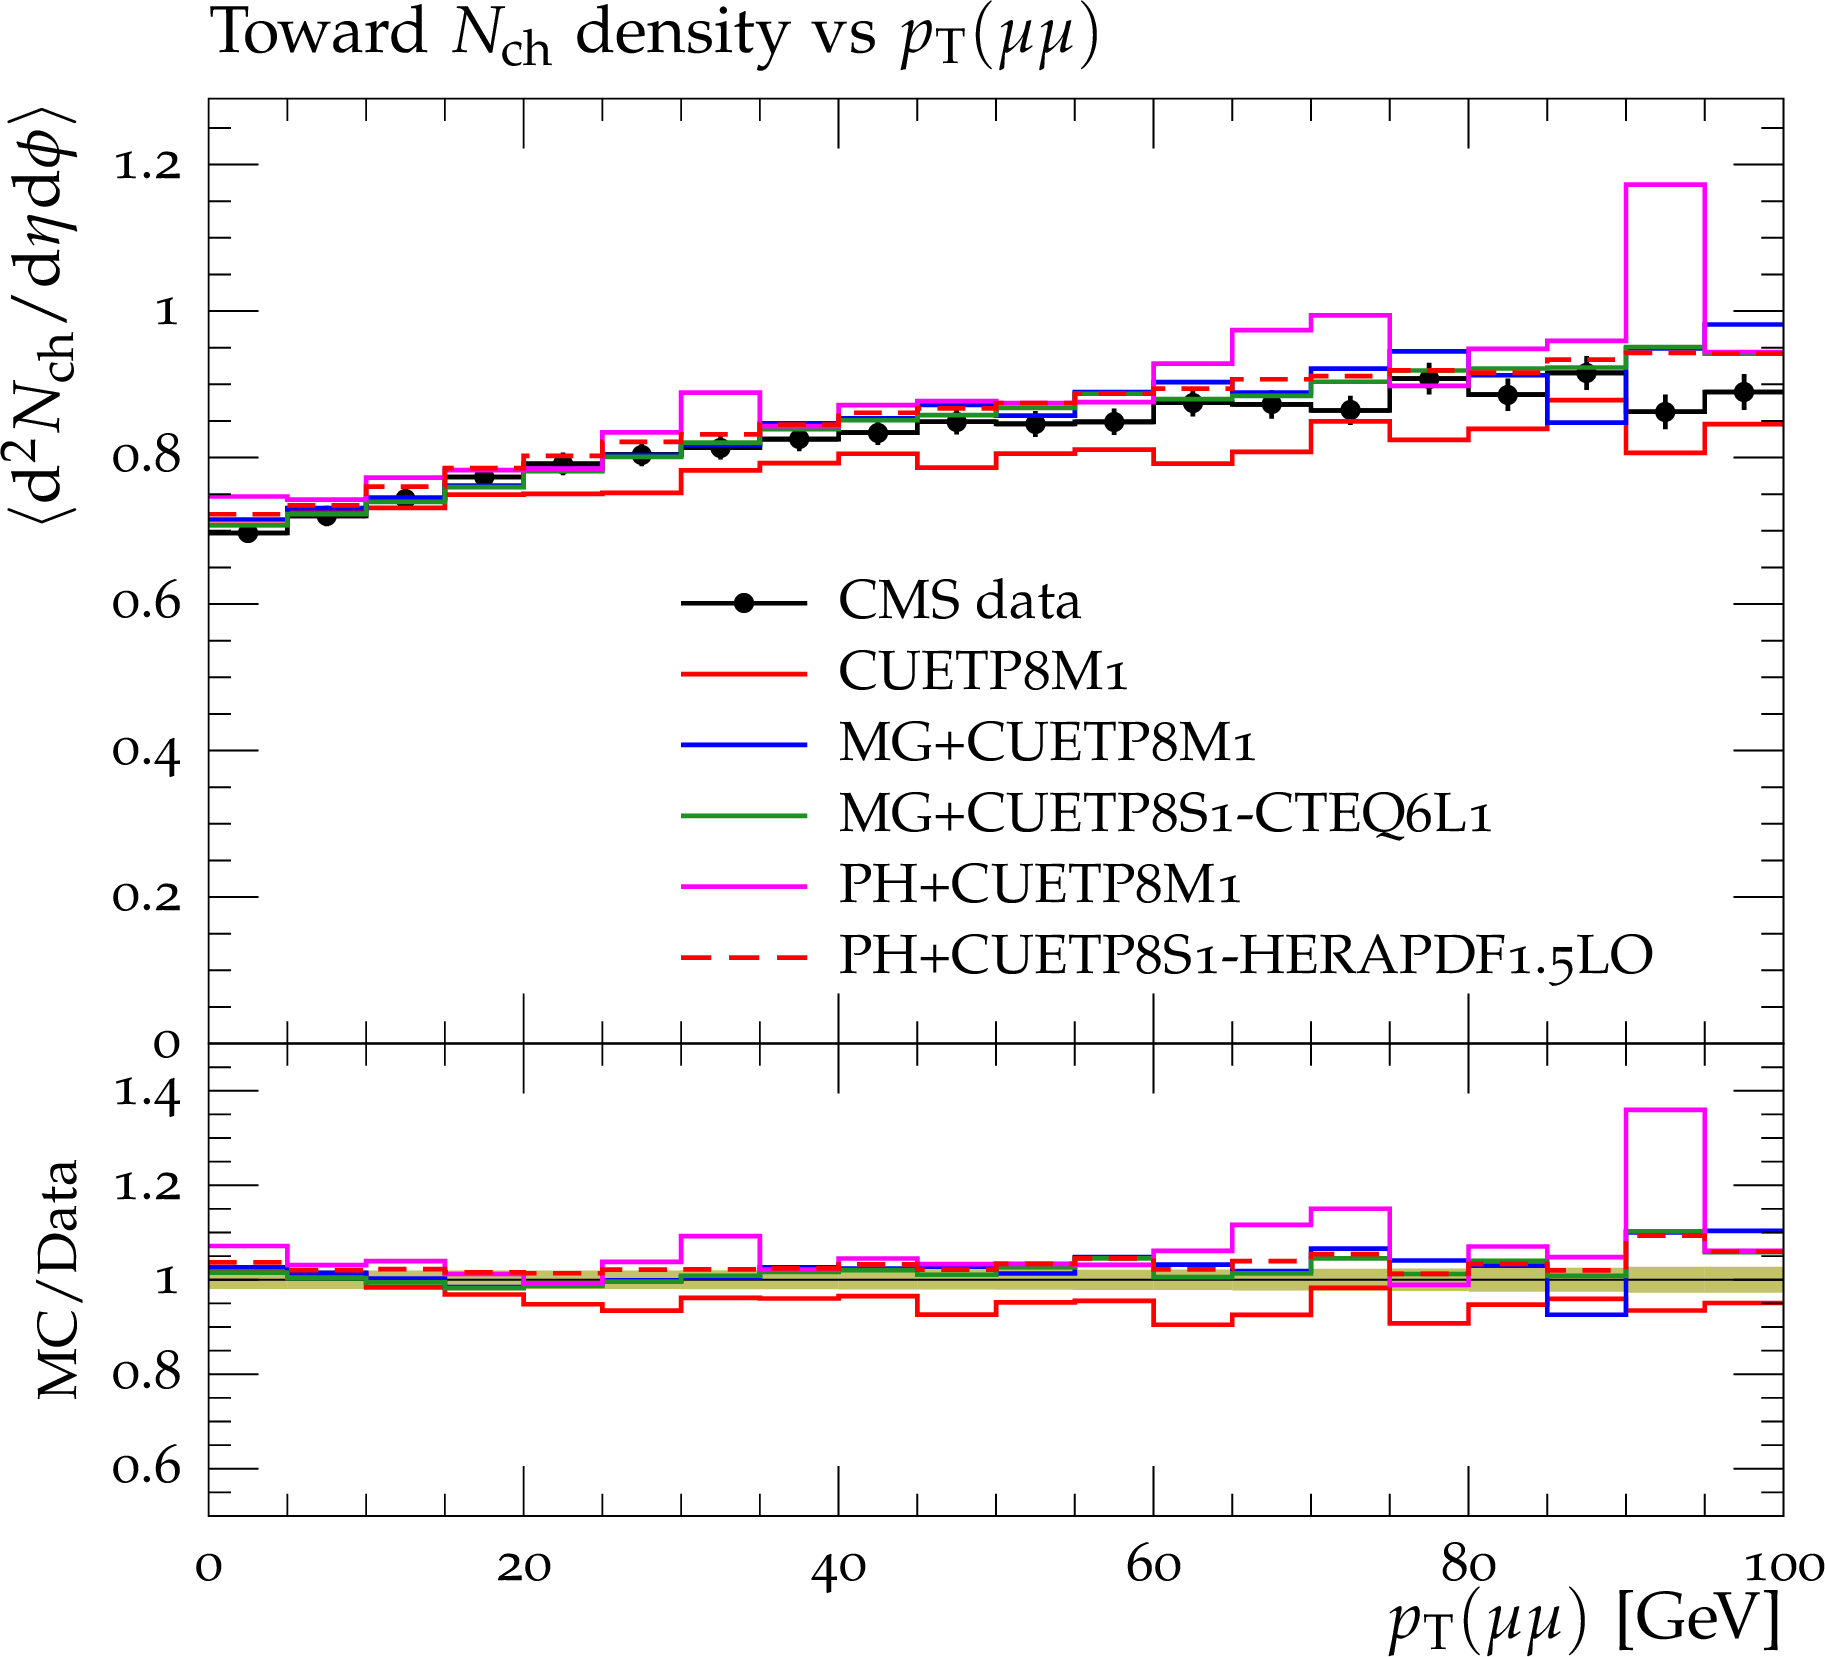
Figure 18-a:
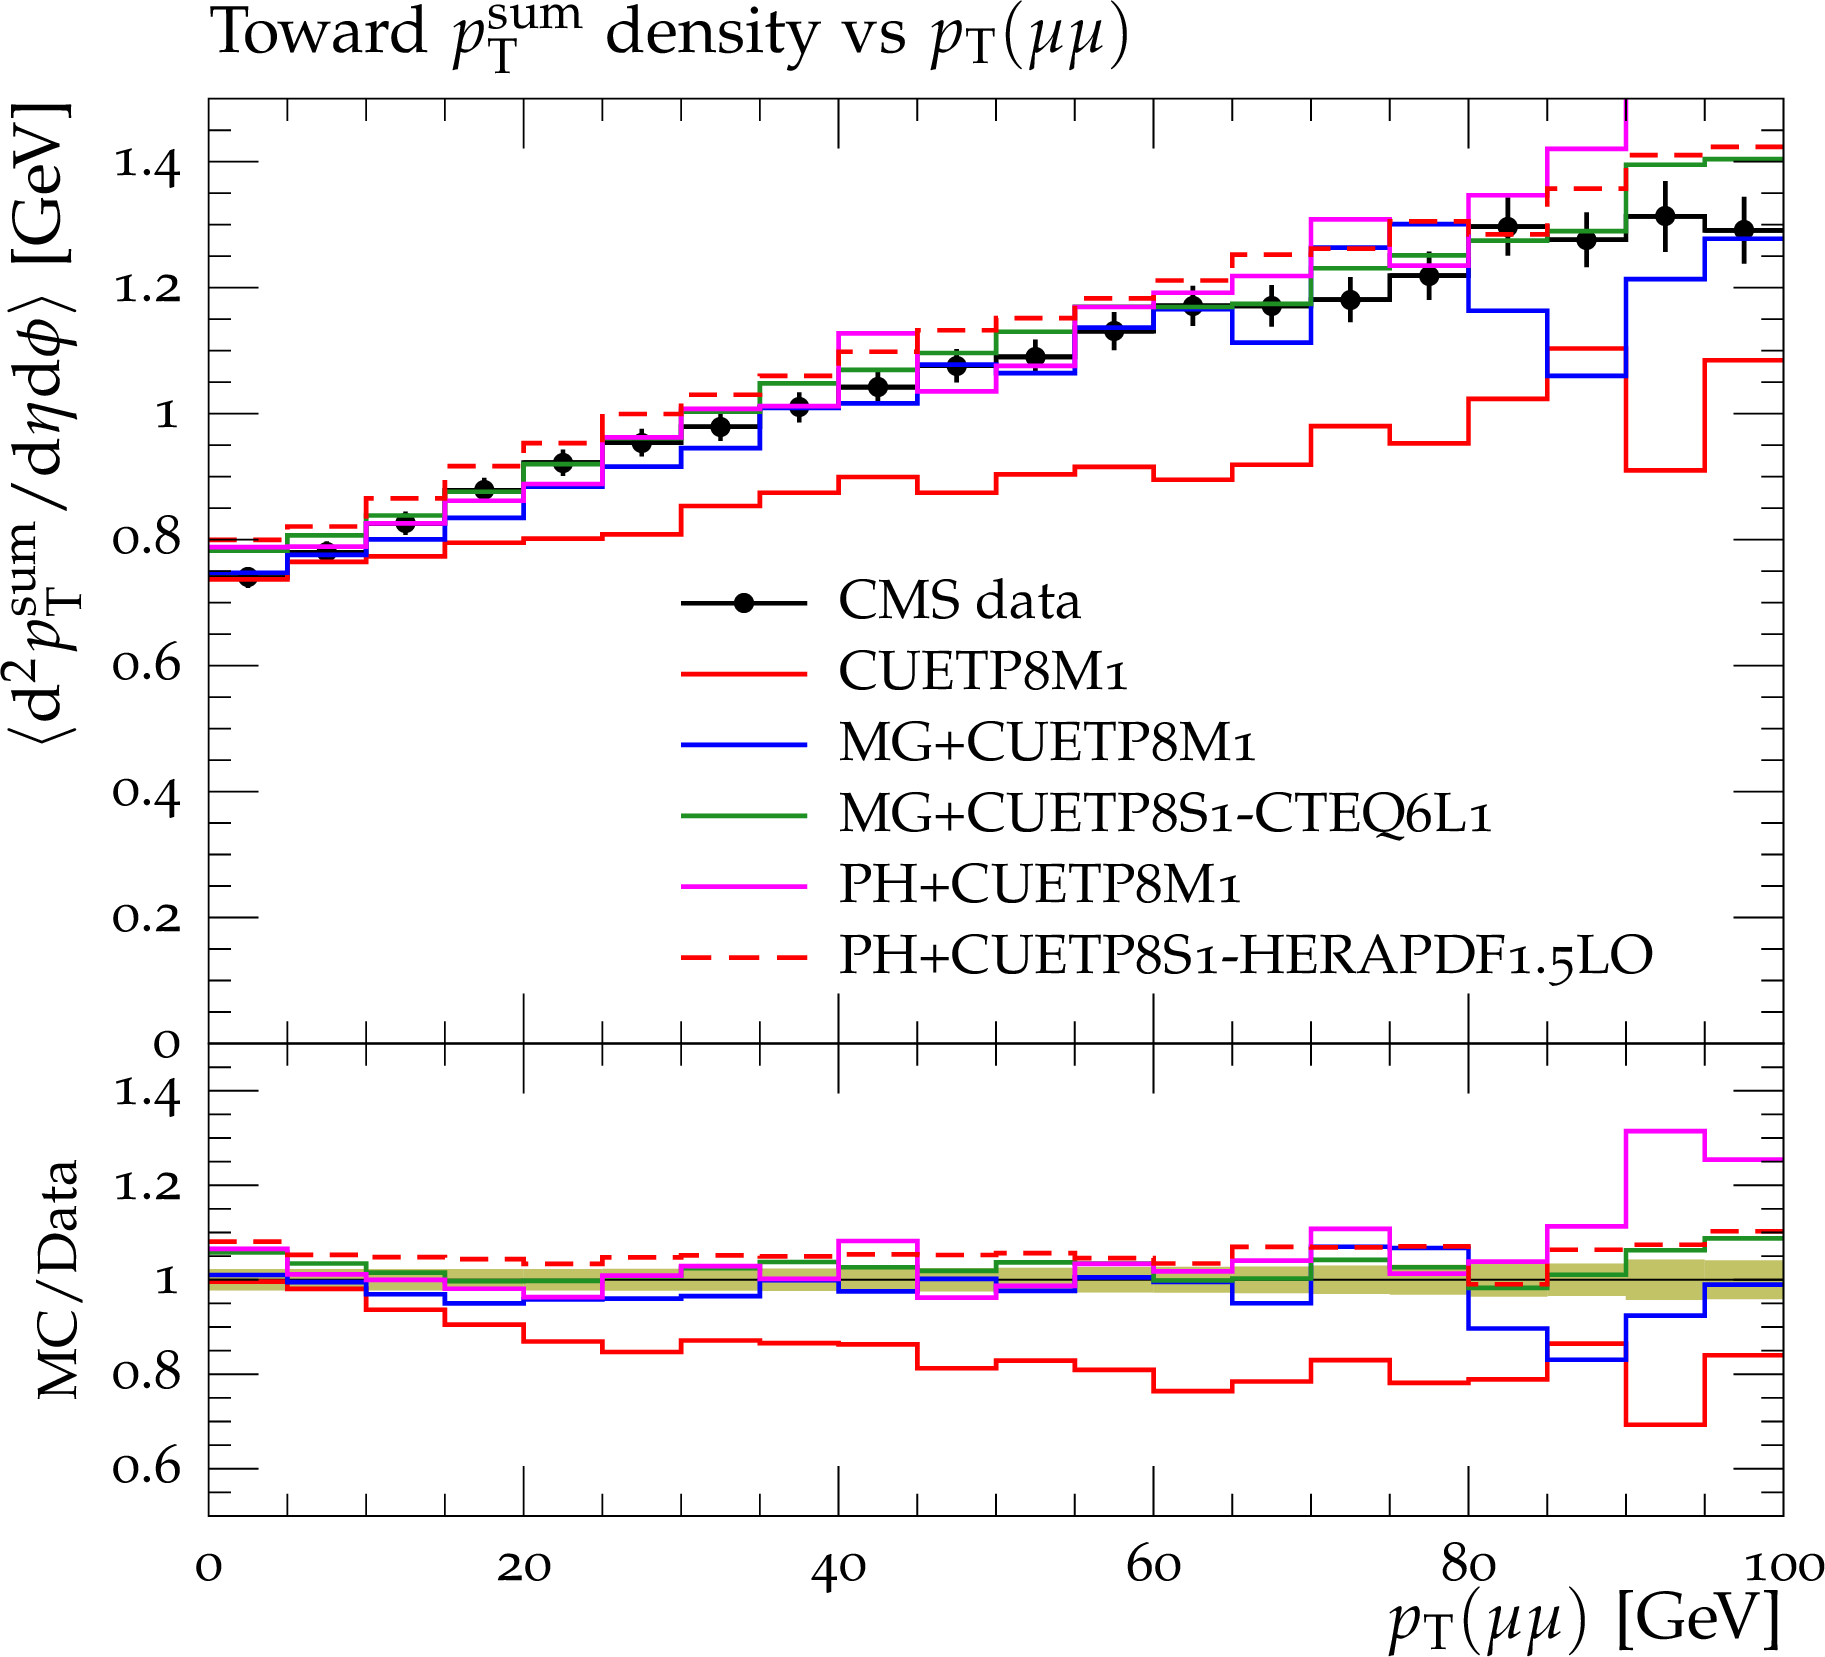
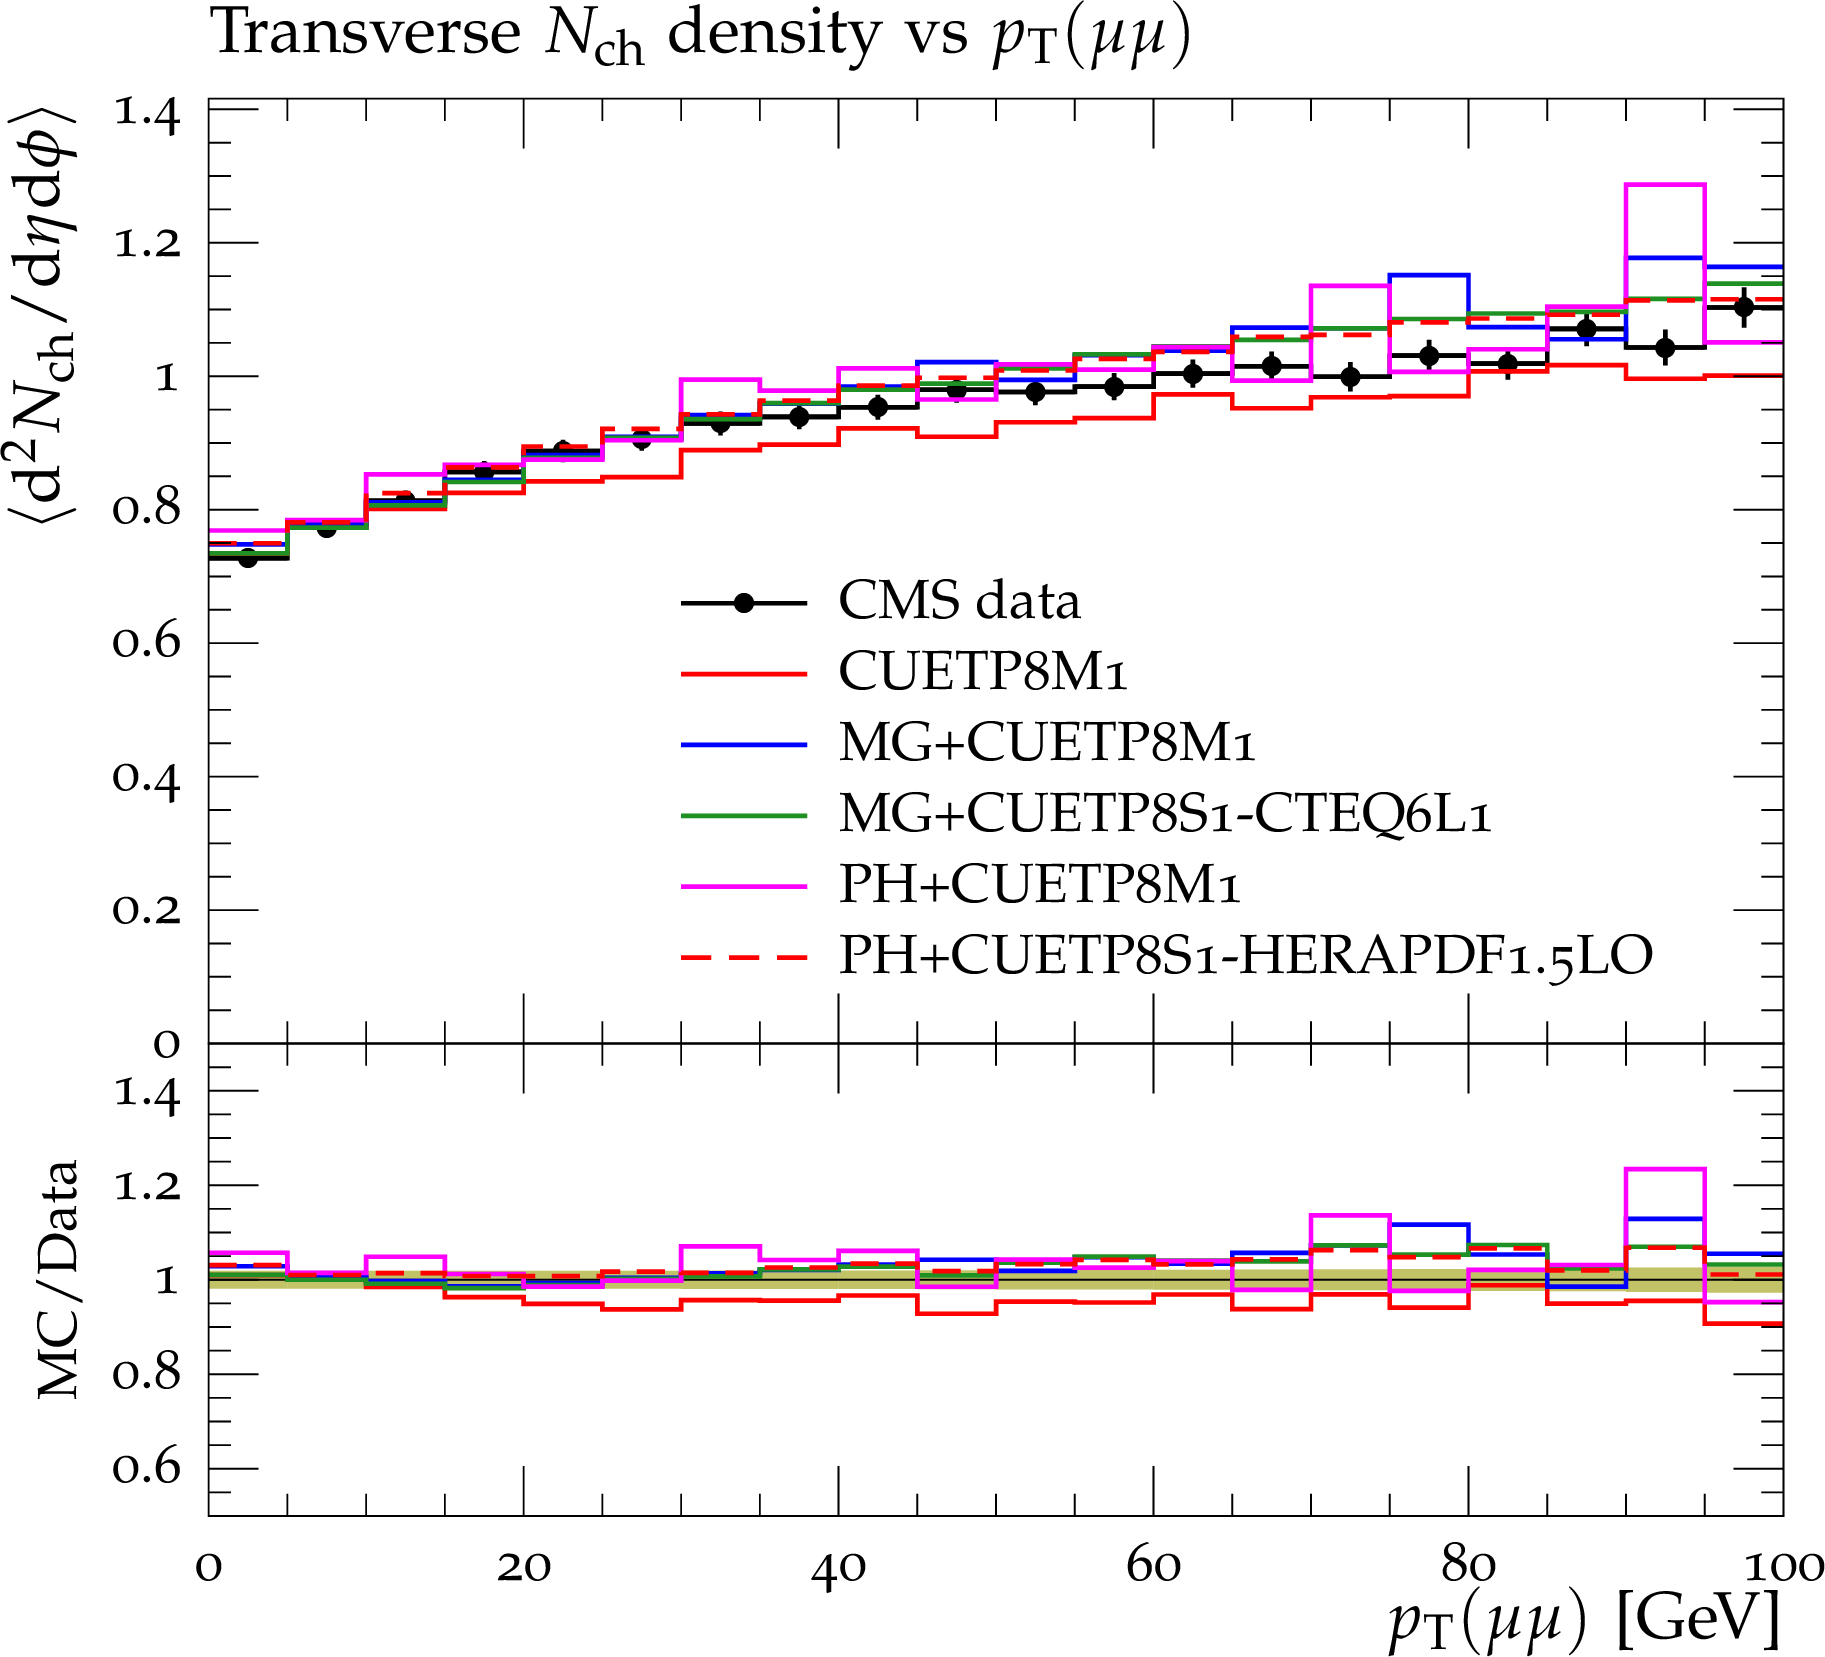
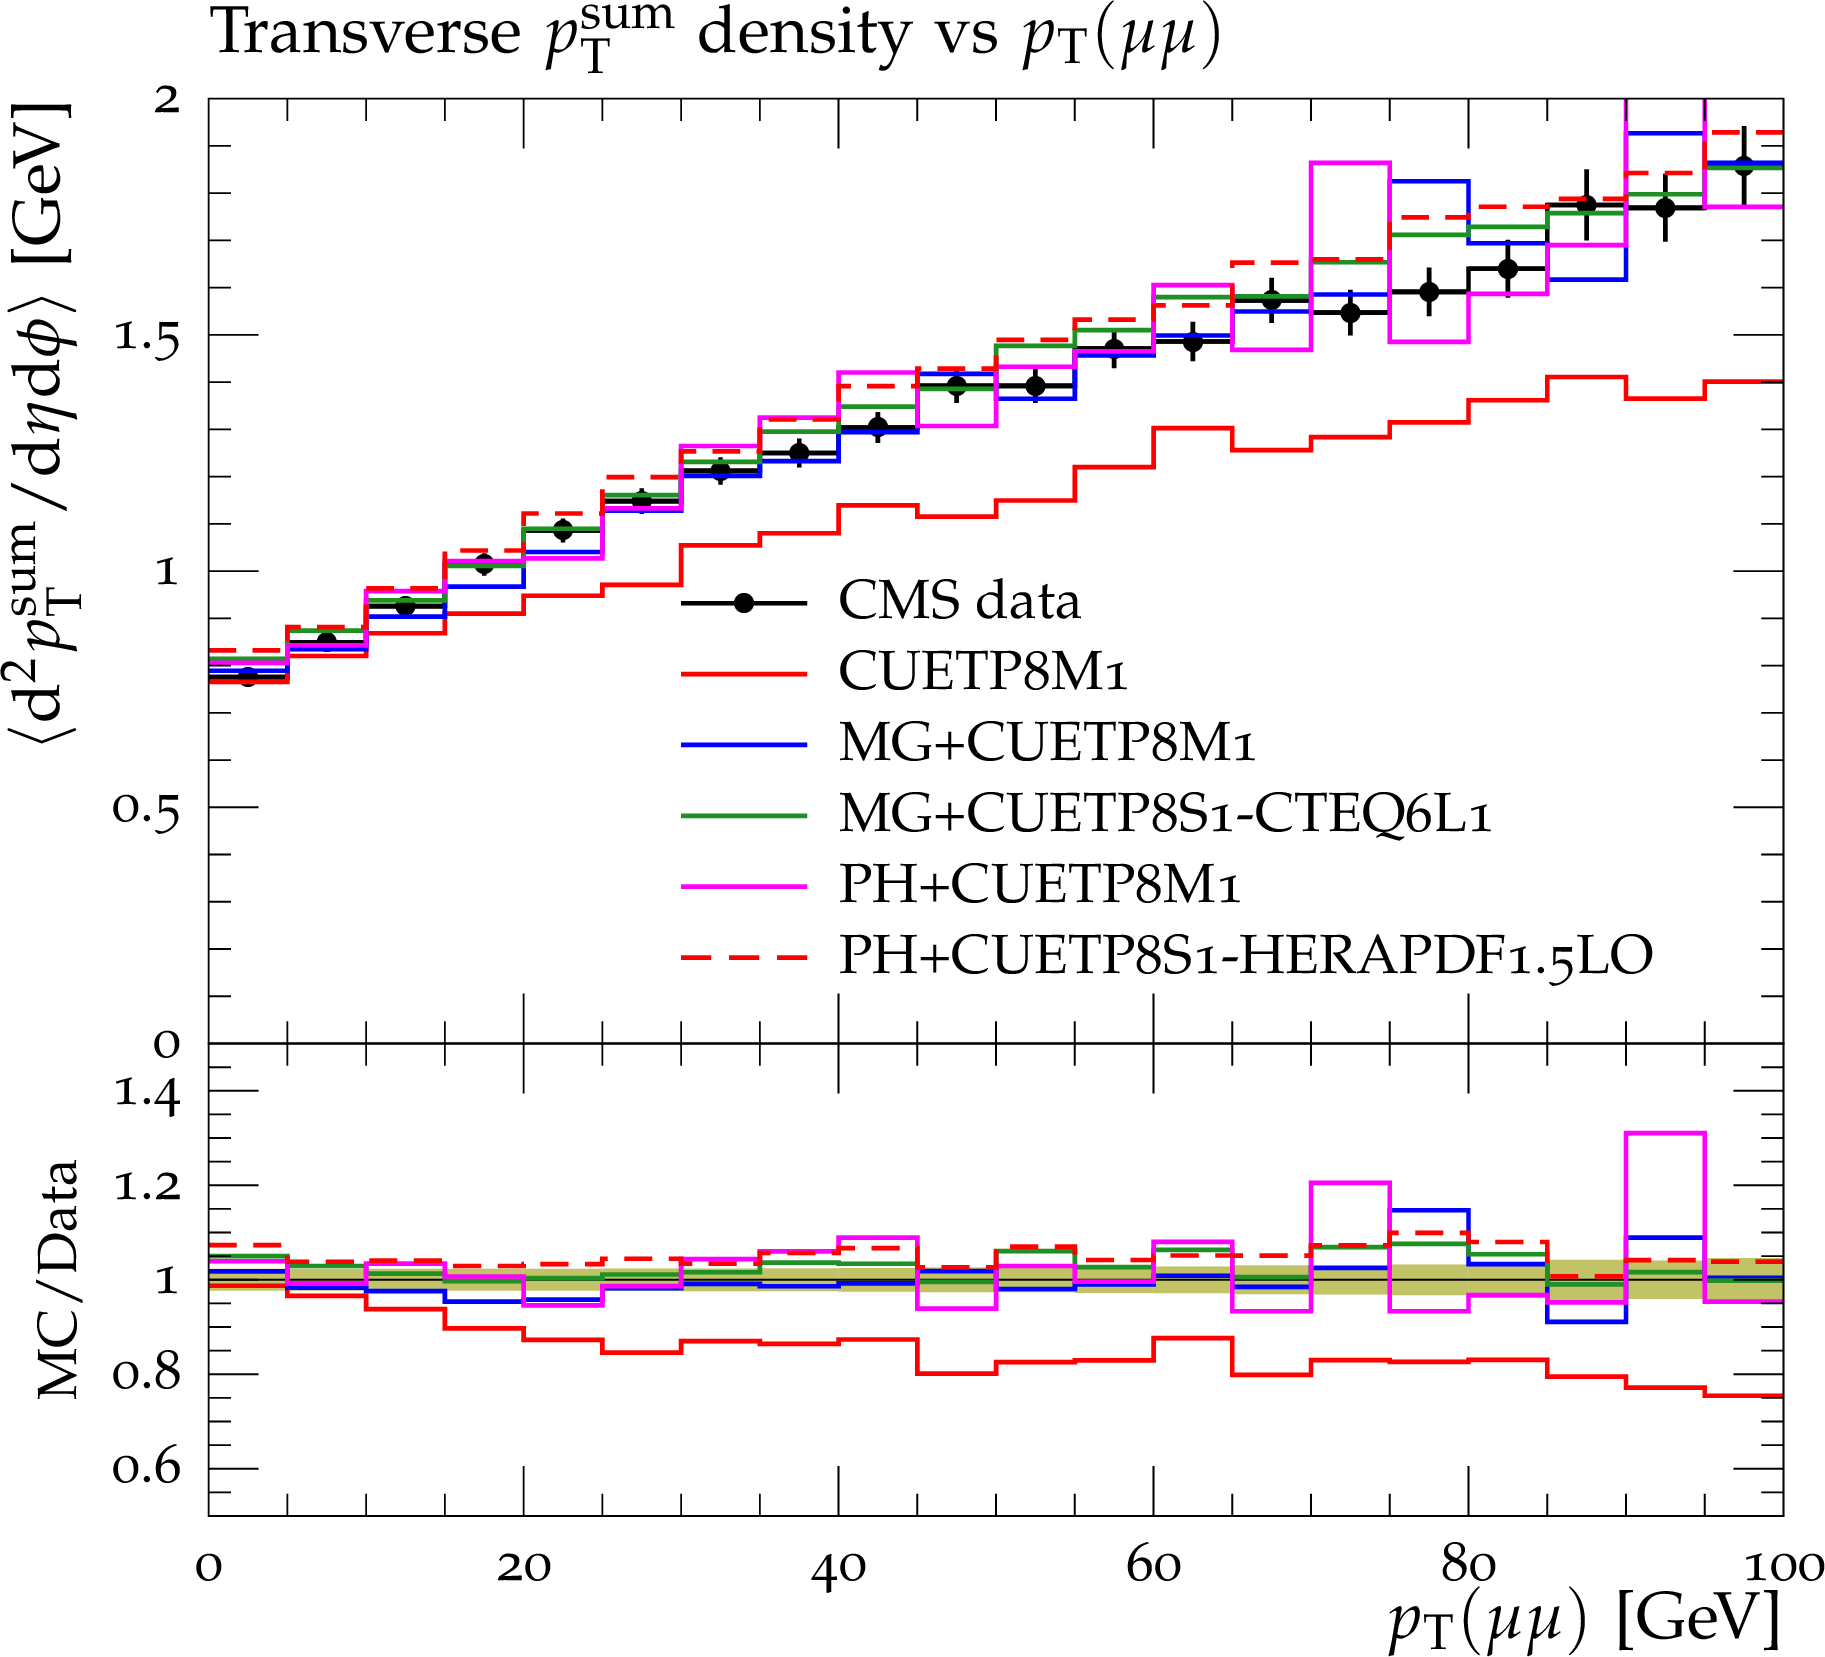
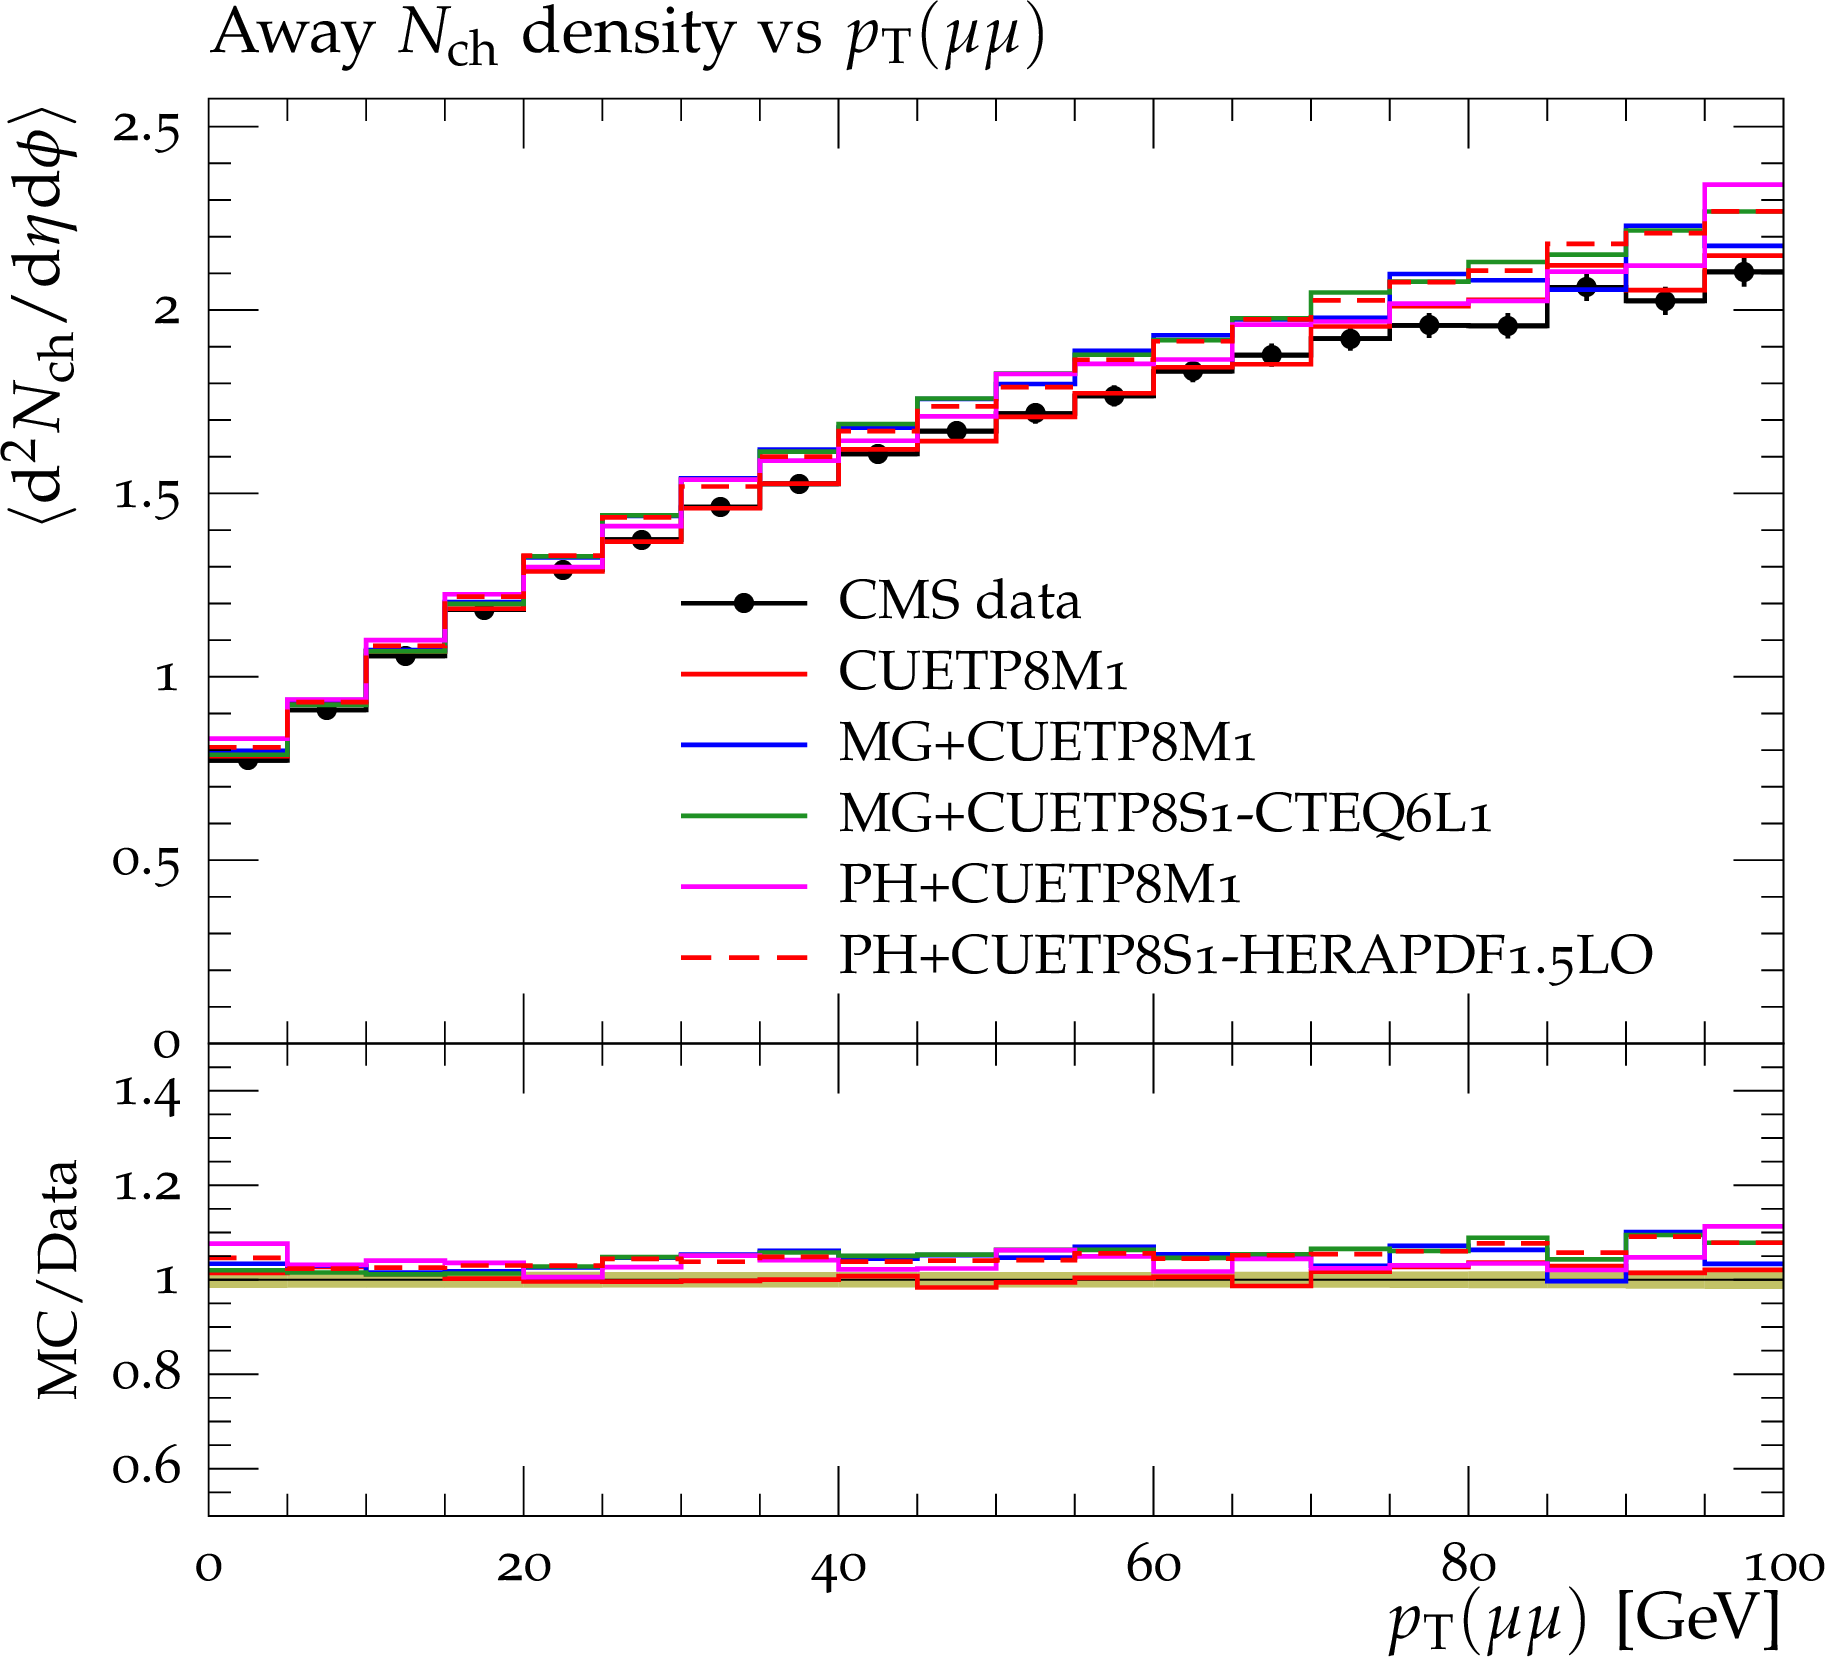
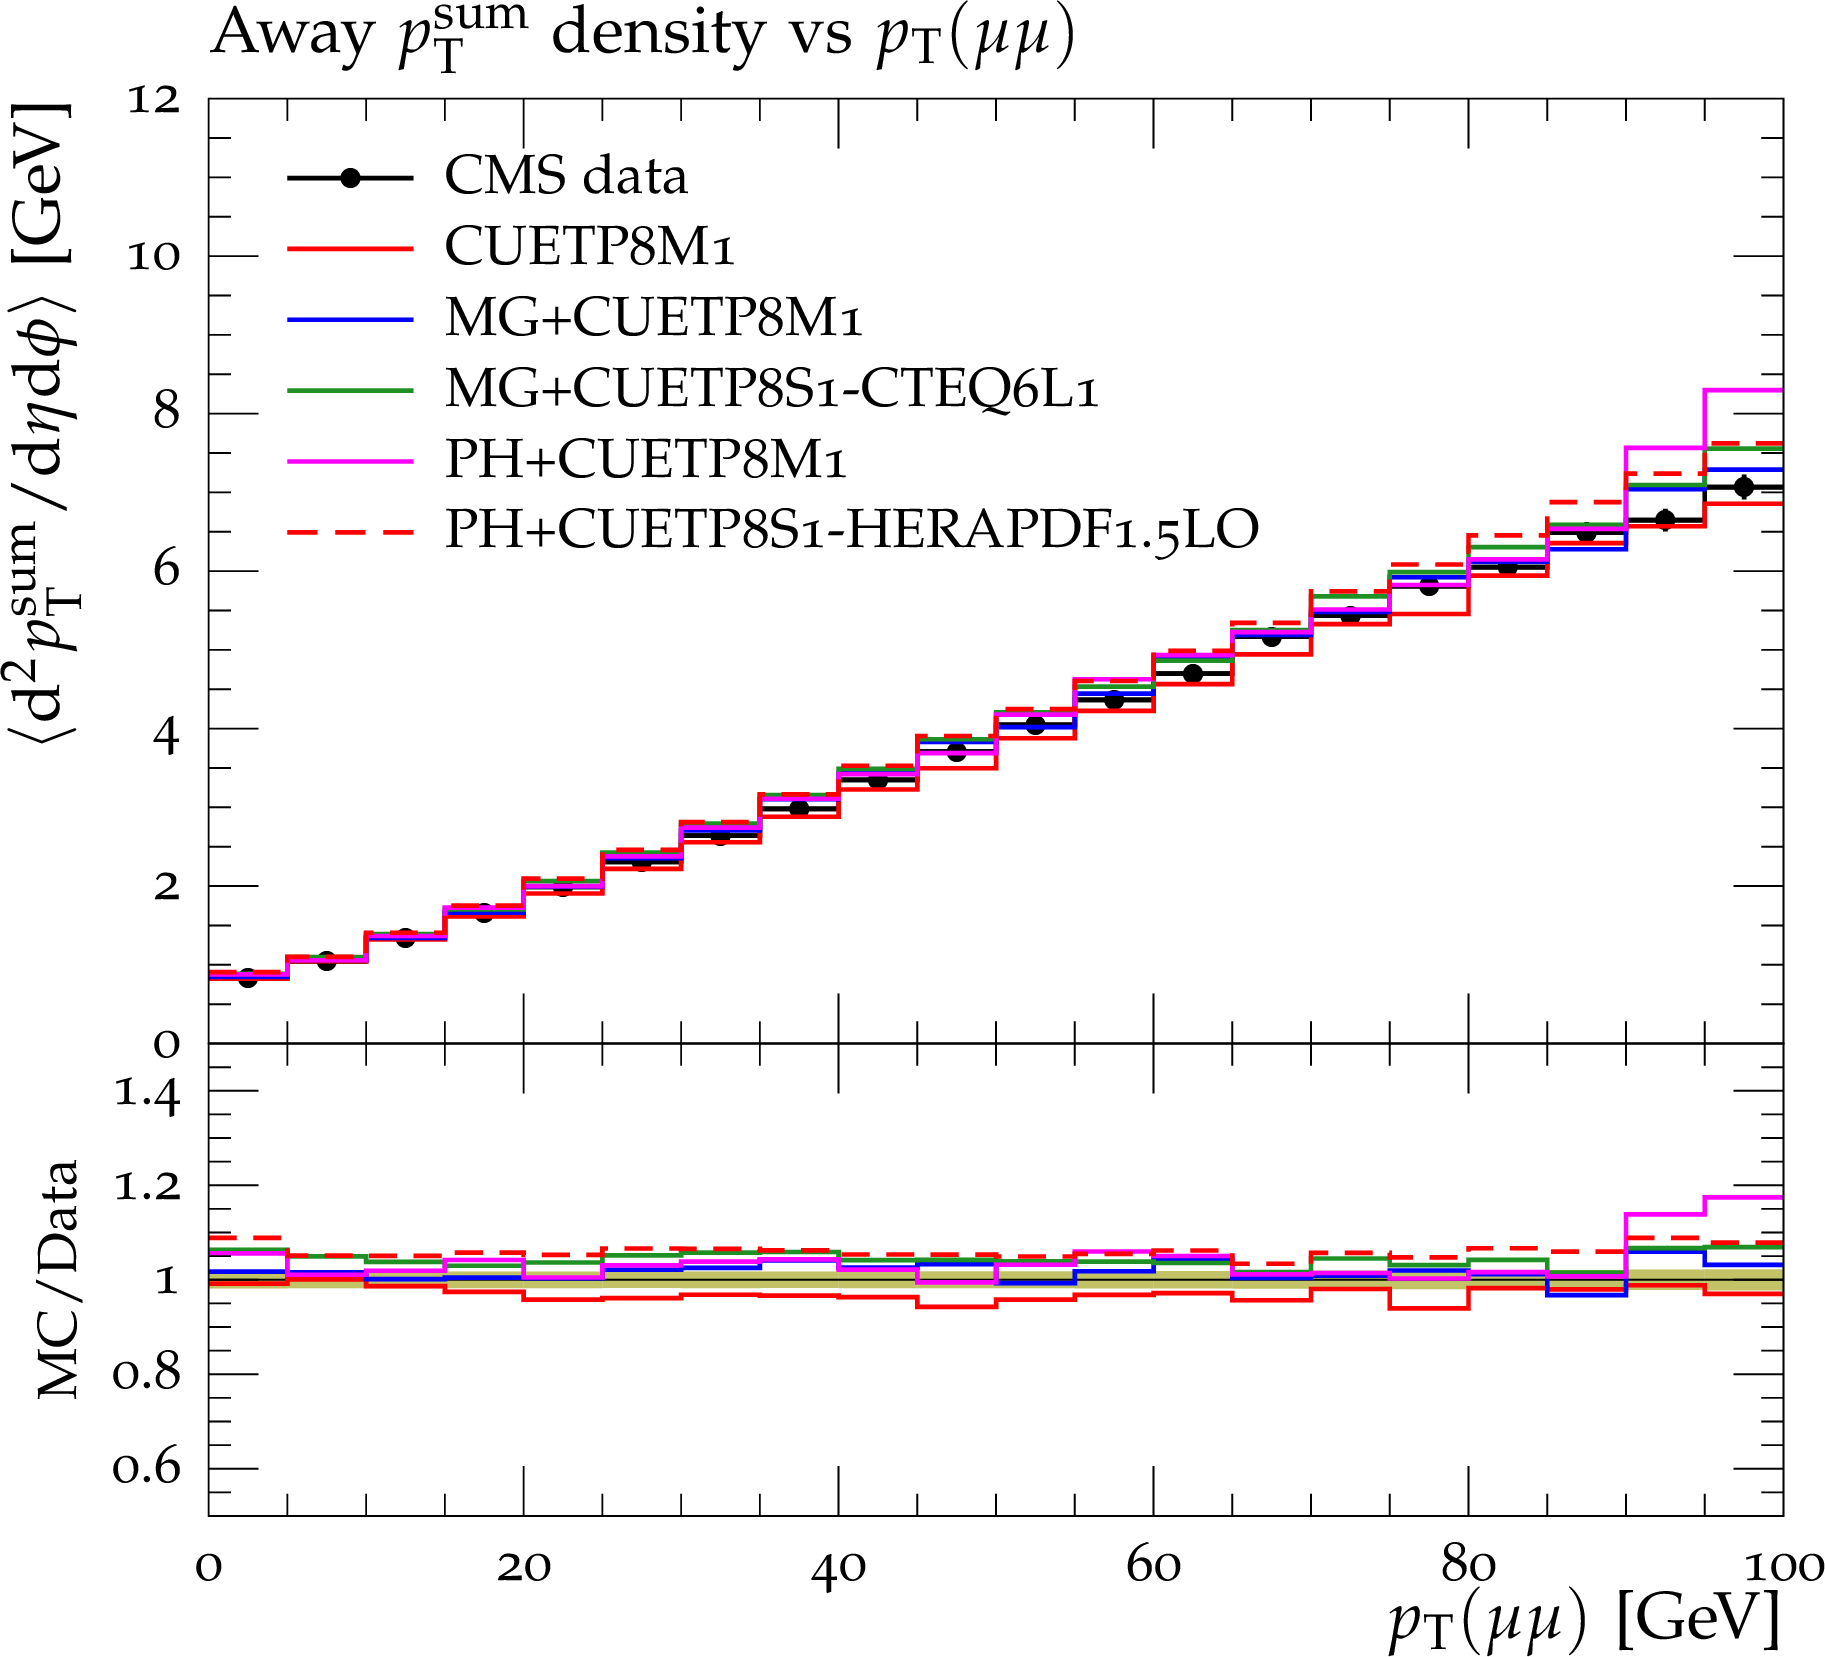
Charged-particle (a,c,e) and $p_{\rm T}^{\rm sum}$ densities (b,d,f) in the toward (a,b), away (c,d), and transverse (TransAVE) (e,f) regions, as defined by the Z-boson direction in Drell--Yan production at $\sqrt {s}=$ 7 TeV[26]. The data are compared to PYTHIA8 using CUETP8M1, to MadGraph (MG) interfaced to PYTHIA8 using CUETP8S1-CTEQ6L1\ and CUETP8M1, and to POWHEG (PH) interfaced to PYTHIA8 using CUETP8S1-HERAPDF1.5LO and CUETP8M1. The green bands in the ratios represent the total experimental uncertainty. |
png pdf |
Figure 18-b:
Charged-particle (a,c,e) and $p_{\rm T}^{\rm sum}$ densities (b,d,f) in the toward (a,b), away (c,d), and transverse (TransAVE) (e,f) regions, as defined by the Z-boson direction in Drell--Yan production at $\sqrt {s}=$ 7 TeV[26]. The data are compared to PYTHIA8 using CUETP8M1, to MadGraph (MG) interfaced to PYTHIA8 using CUETP8S1-CTEQ6L1\ and CUETP8M1, and to POWHEG (PH) interfaced to PYTHIA8 using CUETP8S1-HERAPDF1.5LO and CUETP8M1. The green bands in the ratios represent the total experimental uncertainty. |
png pdf |
Figure 18-c:
Charged-particle (a,c,e) and $p_{\rm T}^{\rm sum}$ densities (b,d,f) in the toward (a,b), away (c,d), and transverse (TransAVE) (e,f) regions, as defined by the Z-boson direction in Drell--Yan production at $\sqrt {s}=$ 7 TeV[26]. The data are compared to PYTHIA8 using CUETP8M1, to MadGraph (MG) interfaced to PYTHIA8 using CUETP8S1-CTEQ6L1\ and CUETP8M1, and to POWHEG (PH) interfaced to PYTHIA8 using CUETP8S1-HERAPDF1.5LO and CUETP8M1. The green bands in the ratios represent the total experimental uncertainty. |
png pdf |
Figure 18-d:
Charged-particle (a,c,e) and $p_{\rm T}^{\rm sum}$ densities (b,d,f) in the toward (a,b), away (c,d), and transverse (TransAVE) (e,f) regions, as defined by the Z-boson direction in Drell--Yan production at $\sqrt {s}=$ 7 TeV[26]. The data are compared to PYTHIA8 using CUETP8M1, to MadGraph (MG) interfaced to PYTHIA8 using CUETP8S1-CTEQ6L1\ and CUETP8M1, and to POWHEG (PH) interfaced to PYTHIA8 using CUETP8S1-HERAPDF1.5LO and CUETP8M1. The green bands in the ratios represent the total experimental uncertainty. |
png pdf |
Figure 18-e:
Charged-particle (a,c,e) and $p_{\rm T}^{\rm sum}$ densities (b,d,f) in the toward (a,b), away (c,d), and transverse (TransAVE) (e,f) regions, as defined by the Z-boson direction in Drell--Yan production at $\sqrt {s}=$ 7 TeV[26]. The data are compared to PYTHIA8 using CUETP8M1, to MadGraph (MG) interfaced to PYTHIA8 using CUETP8S1-CTEQ6L1\ and CUETP8M1, and to POWHEG (PH) interfaced to PYTHIA8 using CUETP8S1-HERAPDF1.5LO and CUETP8M1. The green bands in the ratios represent the total experimental uncertainty. |
png pdf |
Figure 18-f:
Charged-particle (a,c,e) and $p_{\rm T}^{\rm sum}$ densities (b,d,f) in the toward (a,b), away (c,d), and transverse (TransAVE) (e,f) regions, as defined by the Z-boson direction in Drell--Yan production at $\sqrt {s}=$ 7 TeV[26]. The data are compared to PYTHIA8 using CUETP8M1, to MadGraph (MG) interfaced to PYTHIA8 using CUETP8S1-CTEQ6L1\ and CUETP8M1, and to POWHEG (PH) interfaced to PYTHIA8 using CUETP8S1-HERAPDF1.5LO and CUETP8M1. The green bands in the ratios represent the total experimental uncertainty. |
png pdf |
Figure 19-a:
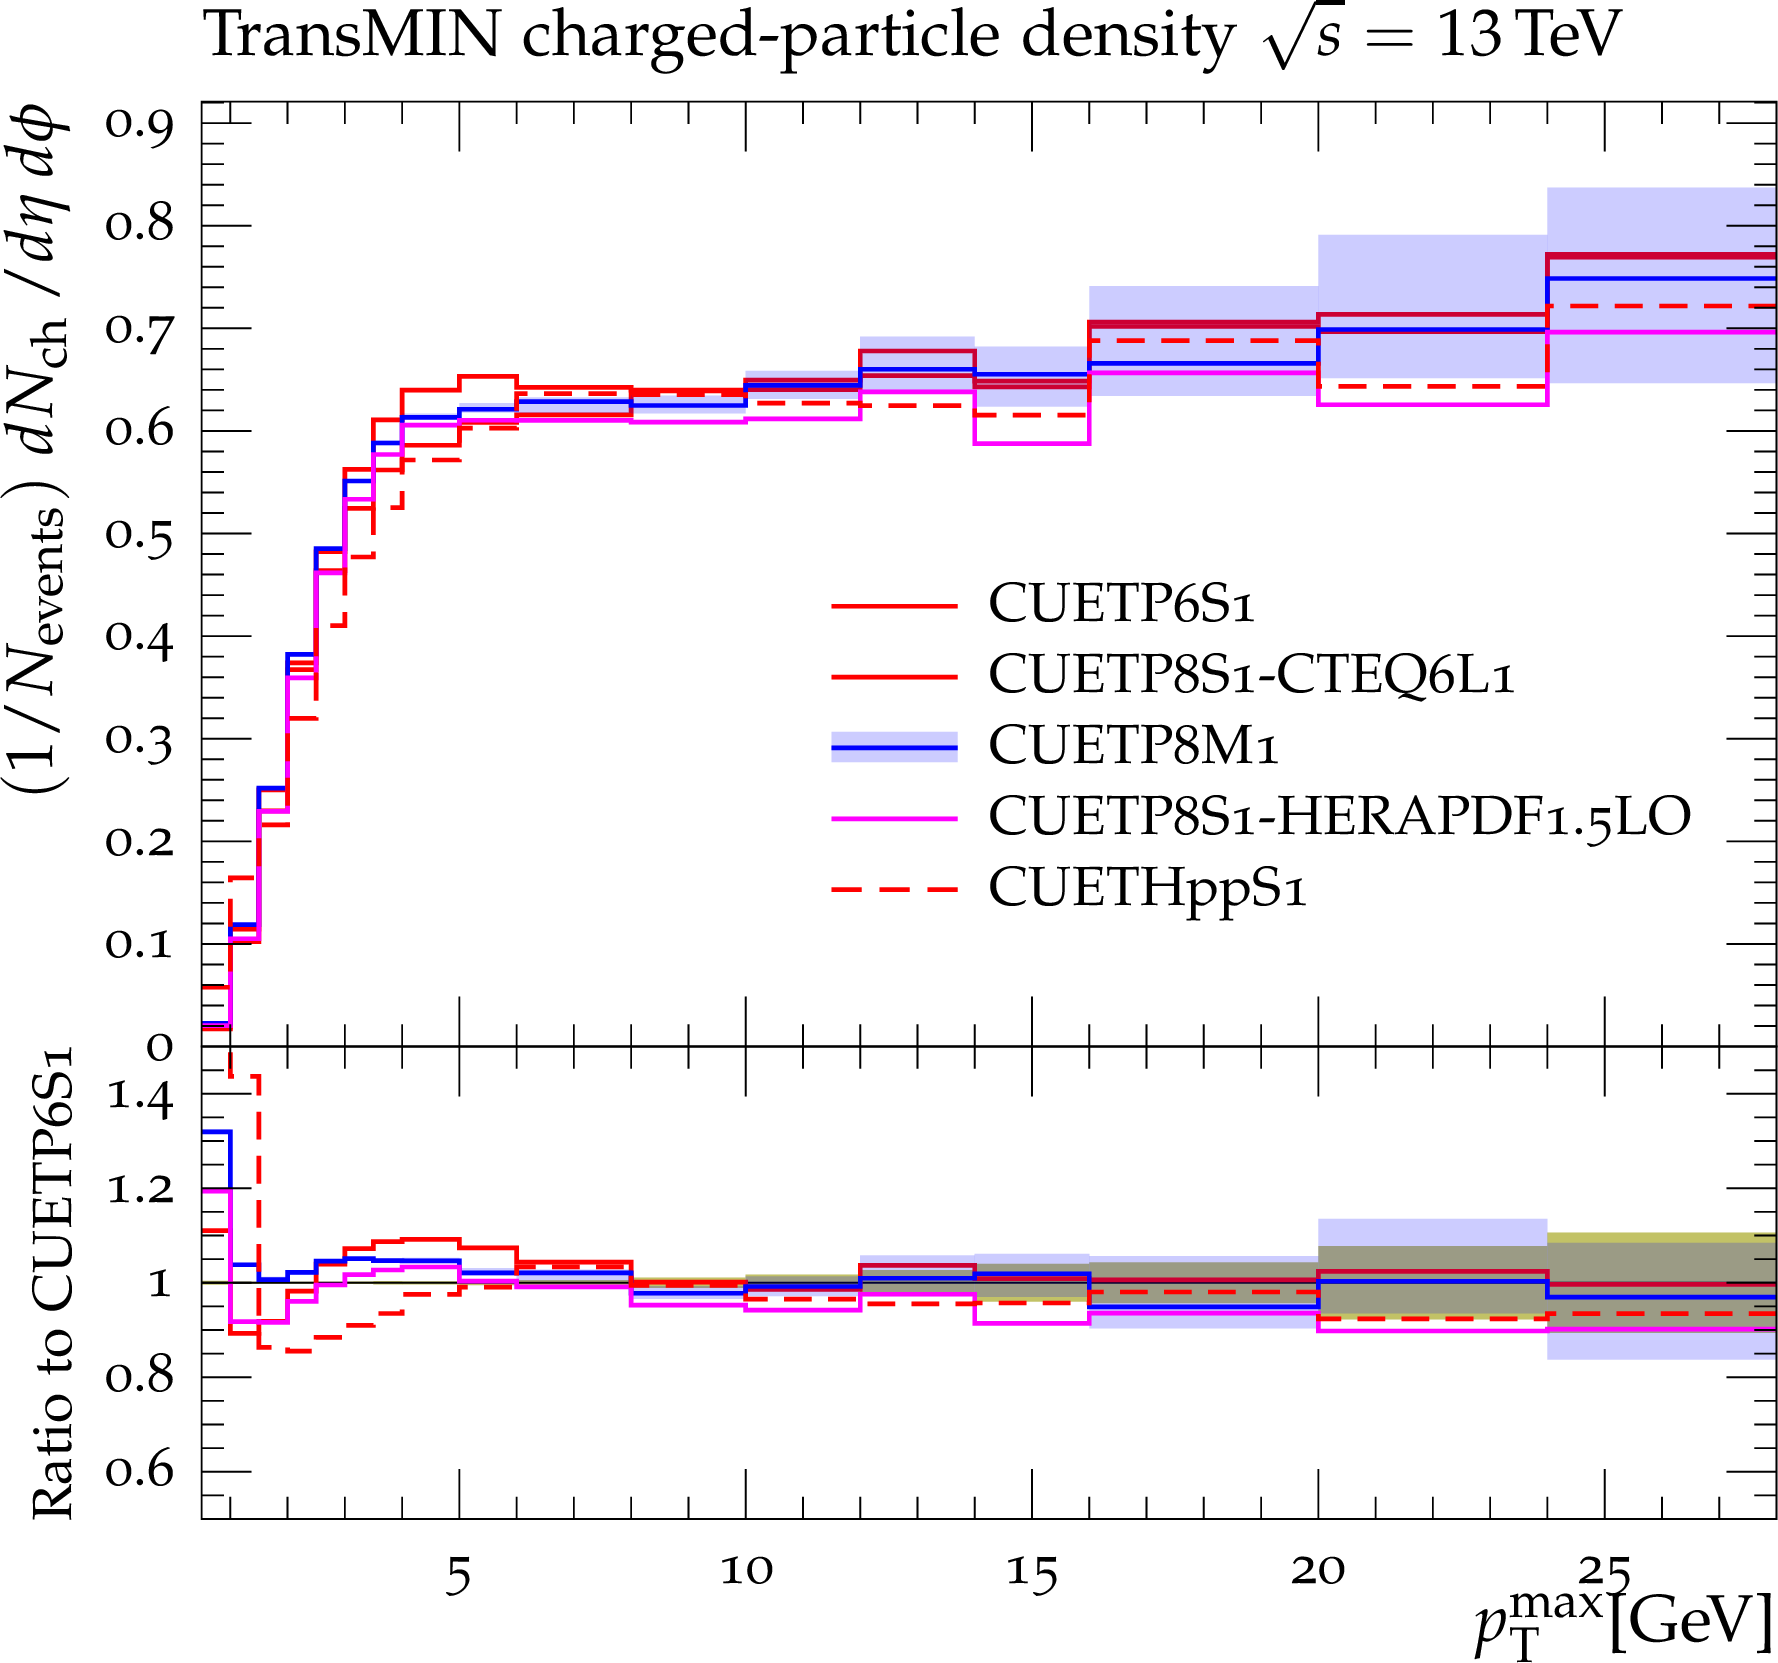
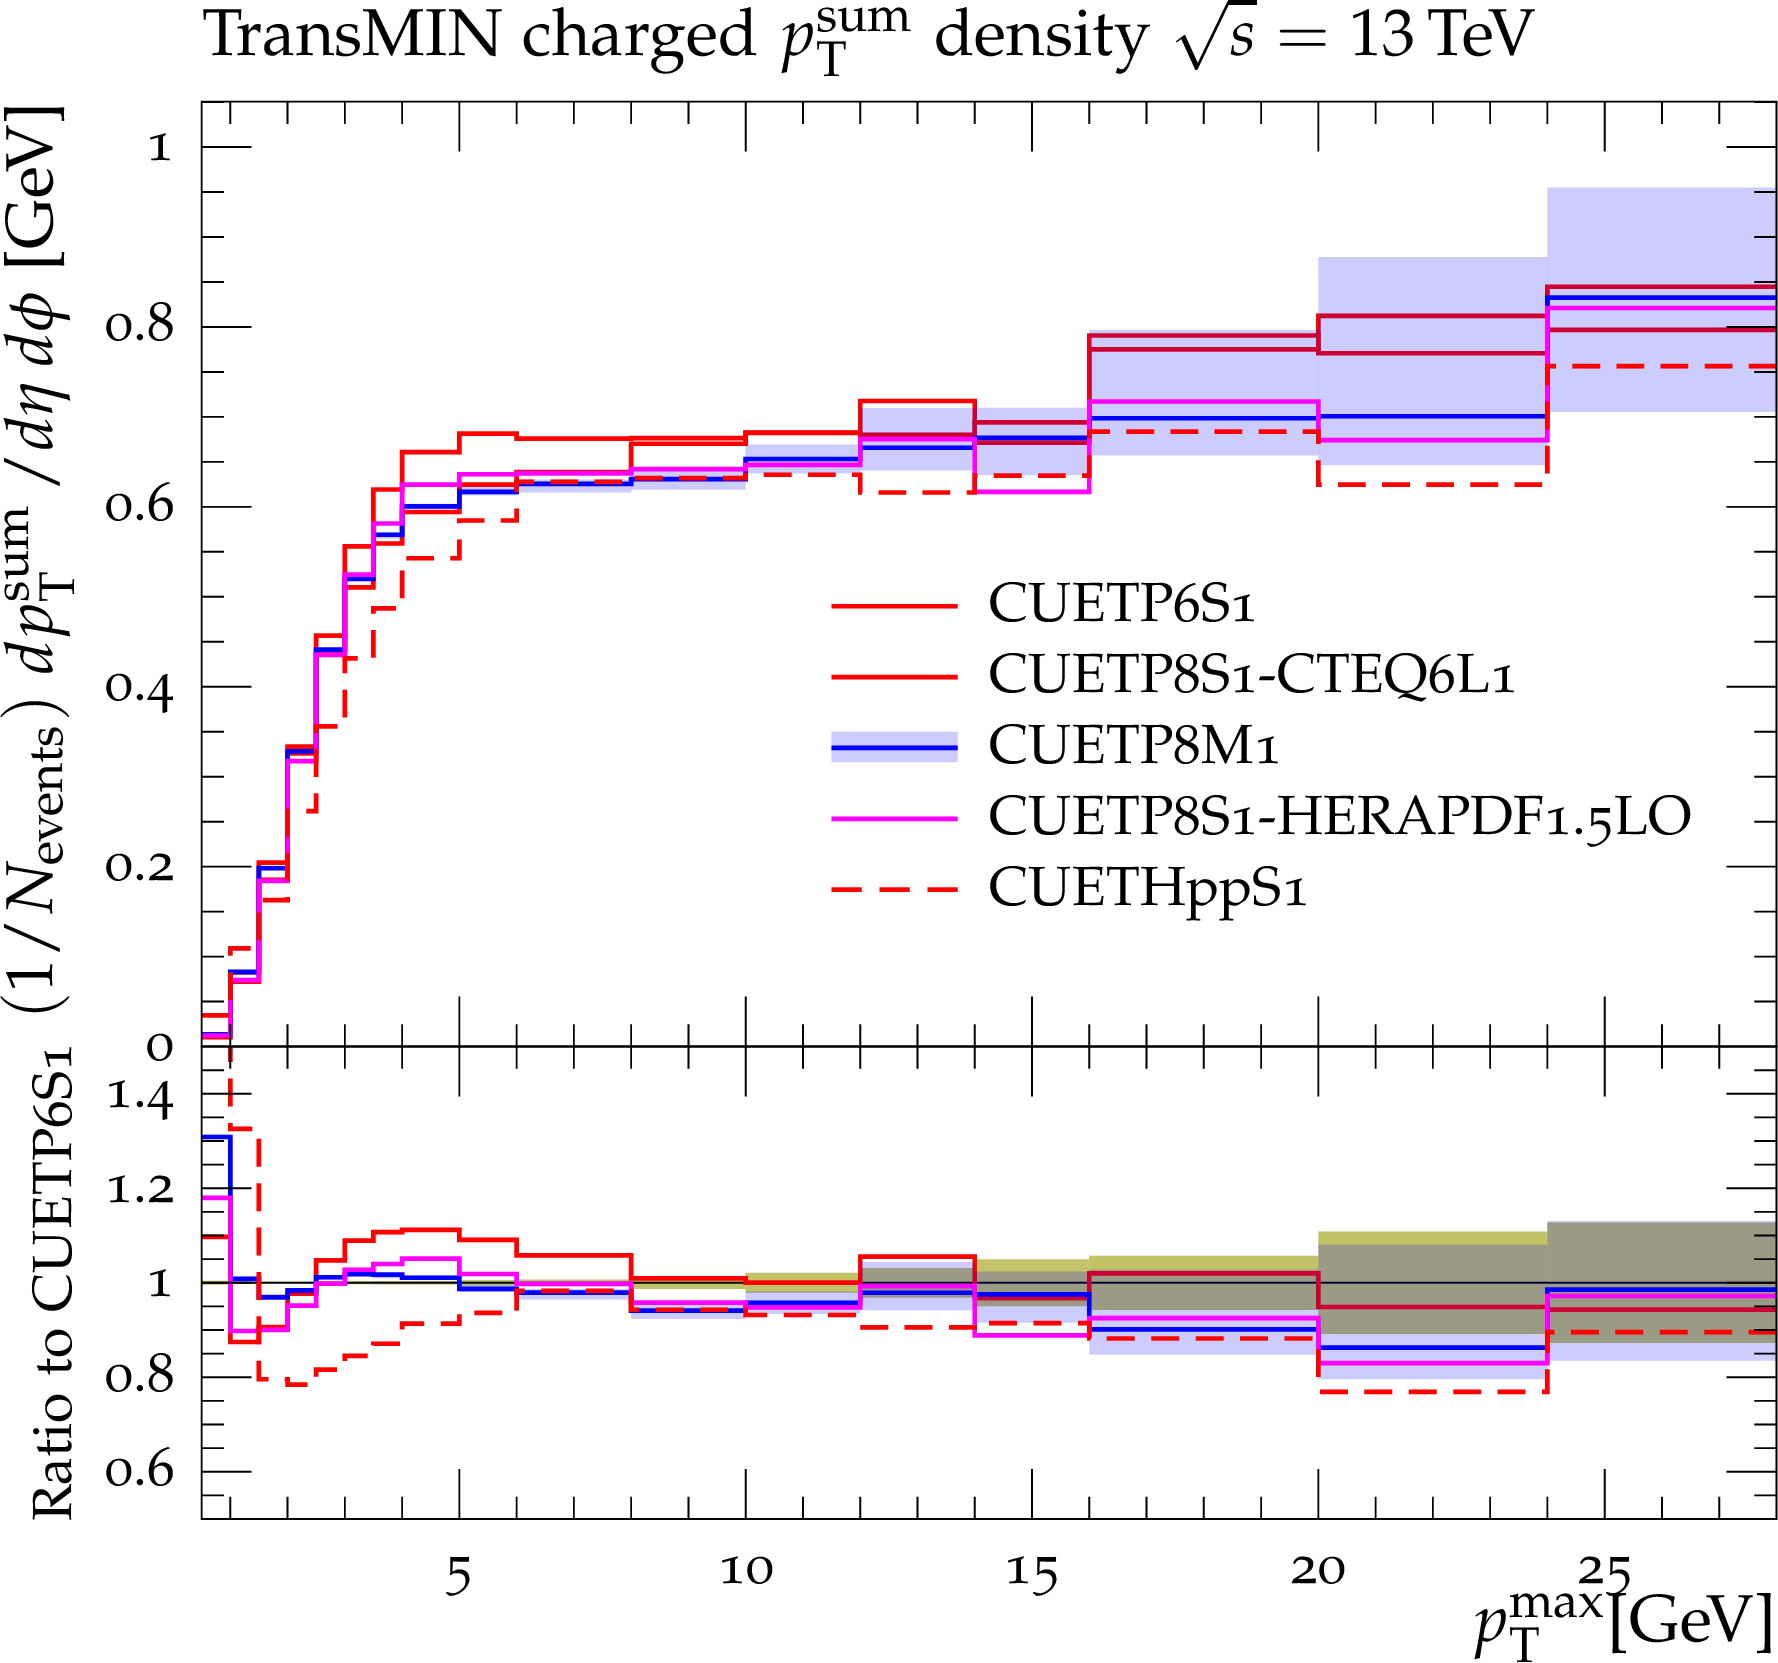
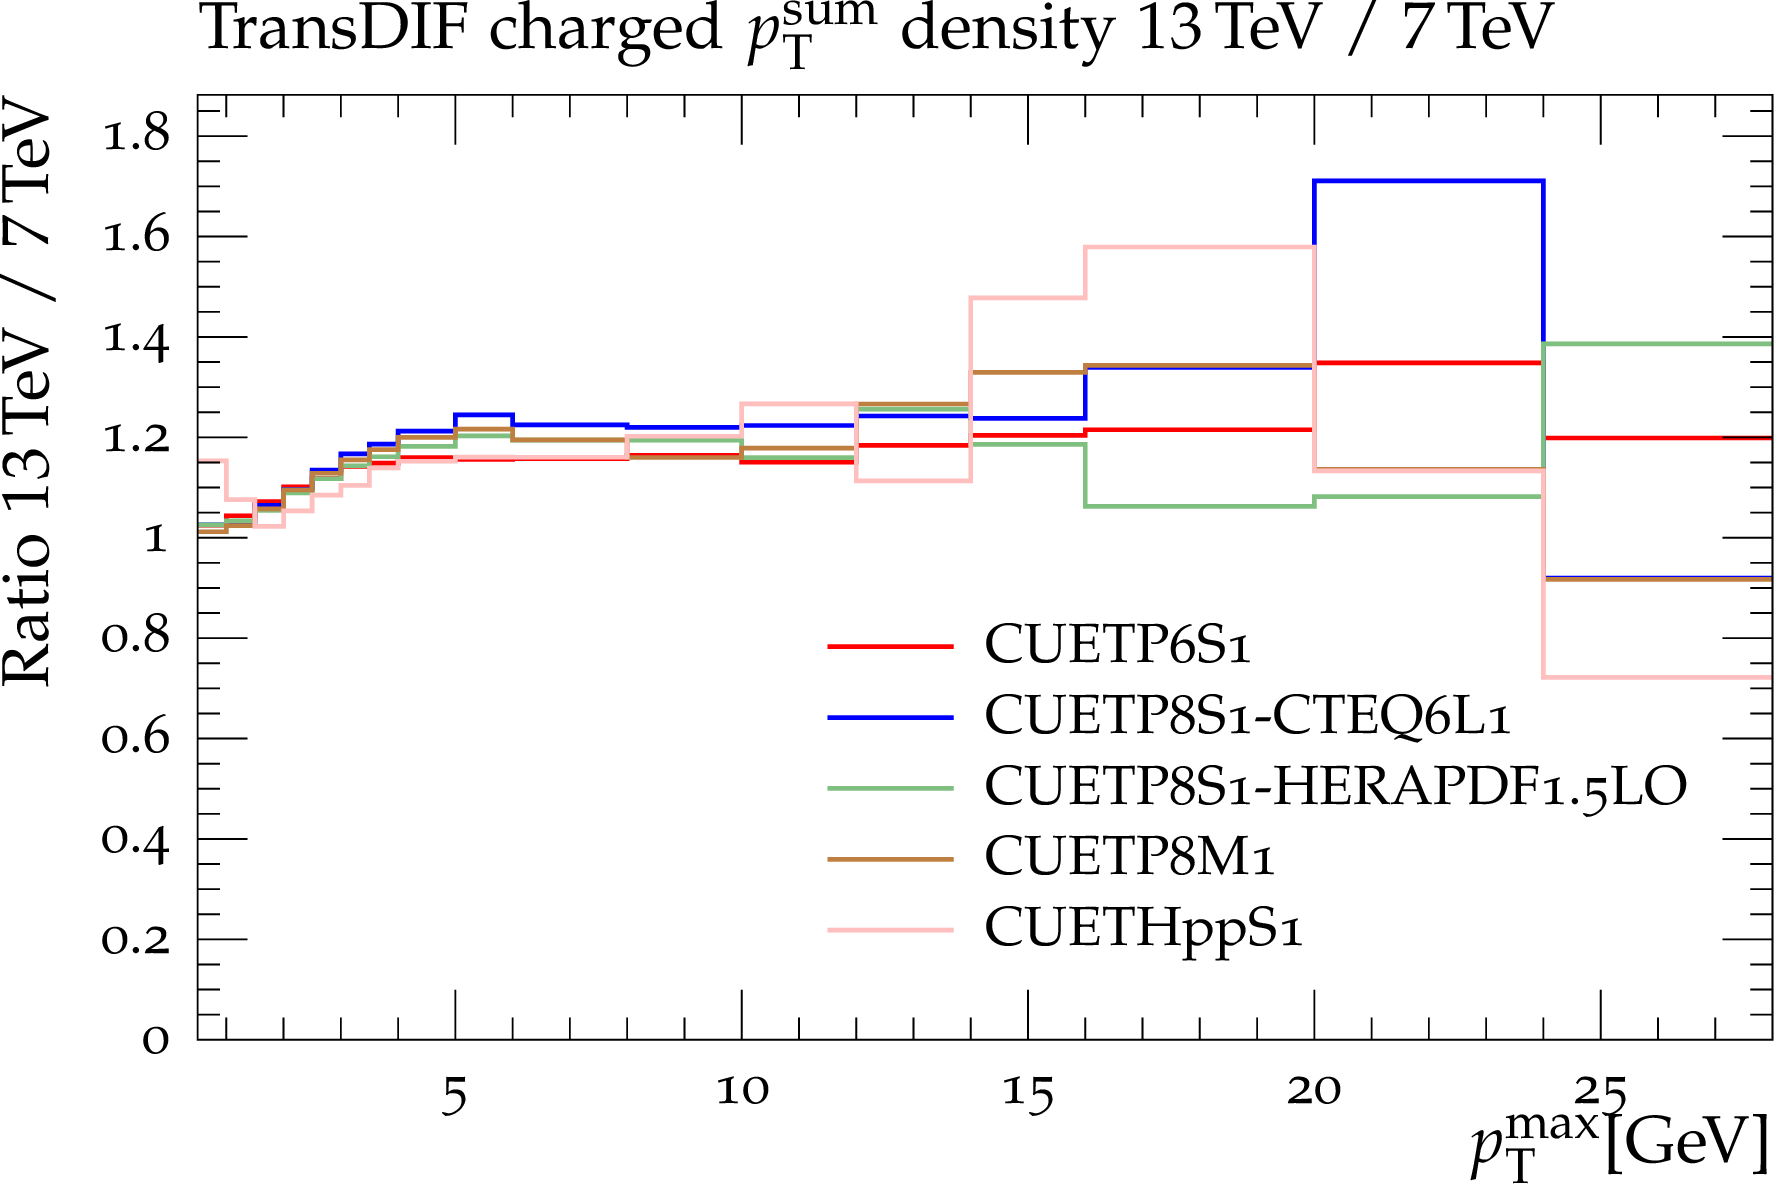
Predictions at $\sqrt {s}=$ 13 TeV for the particle (a,c,e) and the $p_{\rm T}^{\rm sum}$\ densities (b,d,f) for charged particles with $p_{\rm T}>$ 0.5 GeV and $|\eta |<$ 0.8 in the TransMIN (a,b), TransMAX (c,d), and TransDIF (e,f) regions, as defined by the leading charged particle, as a function of the leading charged-particle $p_{\rm T}^{\rm max}$ for the five CMS UE tunes: PYTHIA6 CUETP6S1-CTEQ6L1, and PYTHIA8 CUETP8S1-CTEQ6L1, CUETP8S1-HERAPDF1.5LO, and CUETP8M1, and HERWIG++ CUETHppS1. Also shown are the ratio of the tunes to predictions of CUETP8S1-CTEQ6L1. Predictions for CUETP8M1\ are shown along with the envelope (green bands) of the corresponding eigentunes. |
png pdf |
Figure 19-b:
Predictions at $\sqrt {s}=$ 13 TeV for the particle (a,c,e) and the $p_{\rm T}^{\rm sum}$\ densities (b,d,f) for charged particles with $p_{\rm T}>$ 0.5 GeV and $|\eta |<$ 0.8 in the TransMIN (a,b), TransMAX (c,d), and TransDIF (e,f) regions, as defined by the leading charged particle, as a function of the leading charged-particle $p_{\rm T}^{\rm max}$ for the five CMS UE tunes: PYTHIA6 CUETP6S1-CTEQ6L1, and PYTHIA8 CUETP8S1-CTEQ6L1, CUETP8S1-HERAPDF1.5LO, and CUETP8M1, and HERWIG++ CUETHppS1. Also shown are the ratio of the tunes to predictions of CUETP8S1-CTEQ6L1. Predictions for CUETP8M1\ are shown along with the envelope (green bands) of the corresponding eigentunes. |
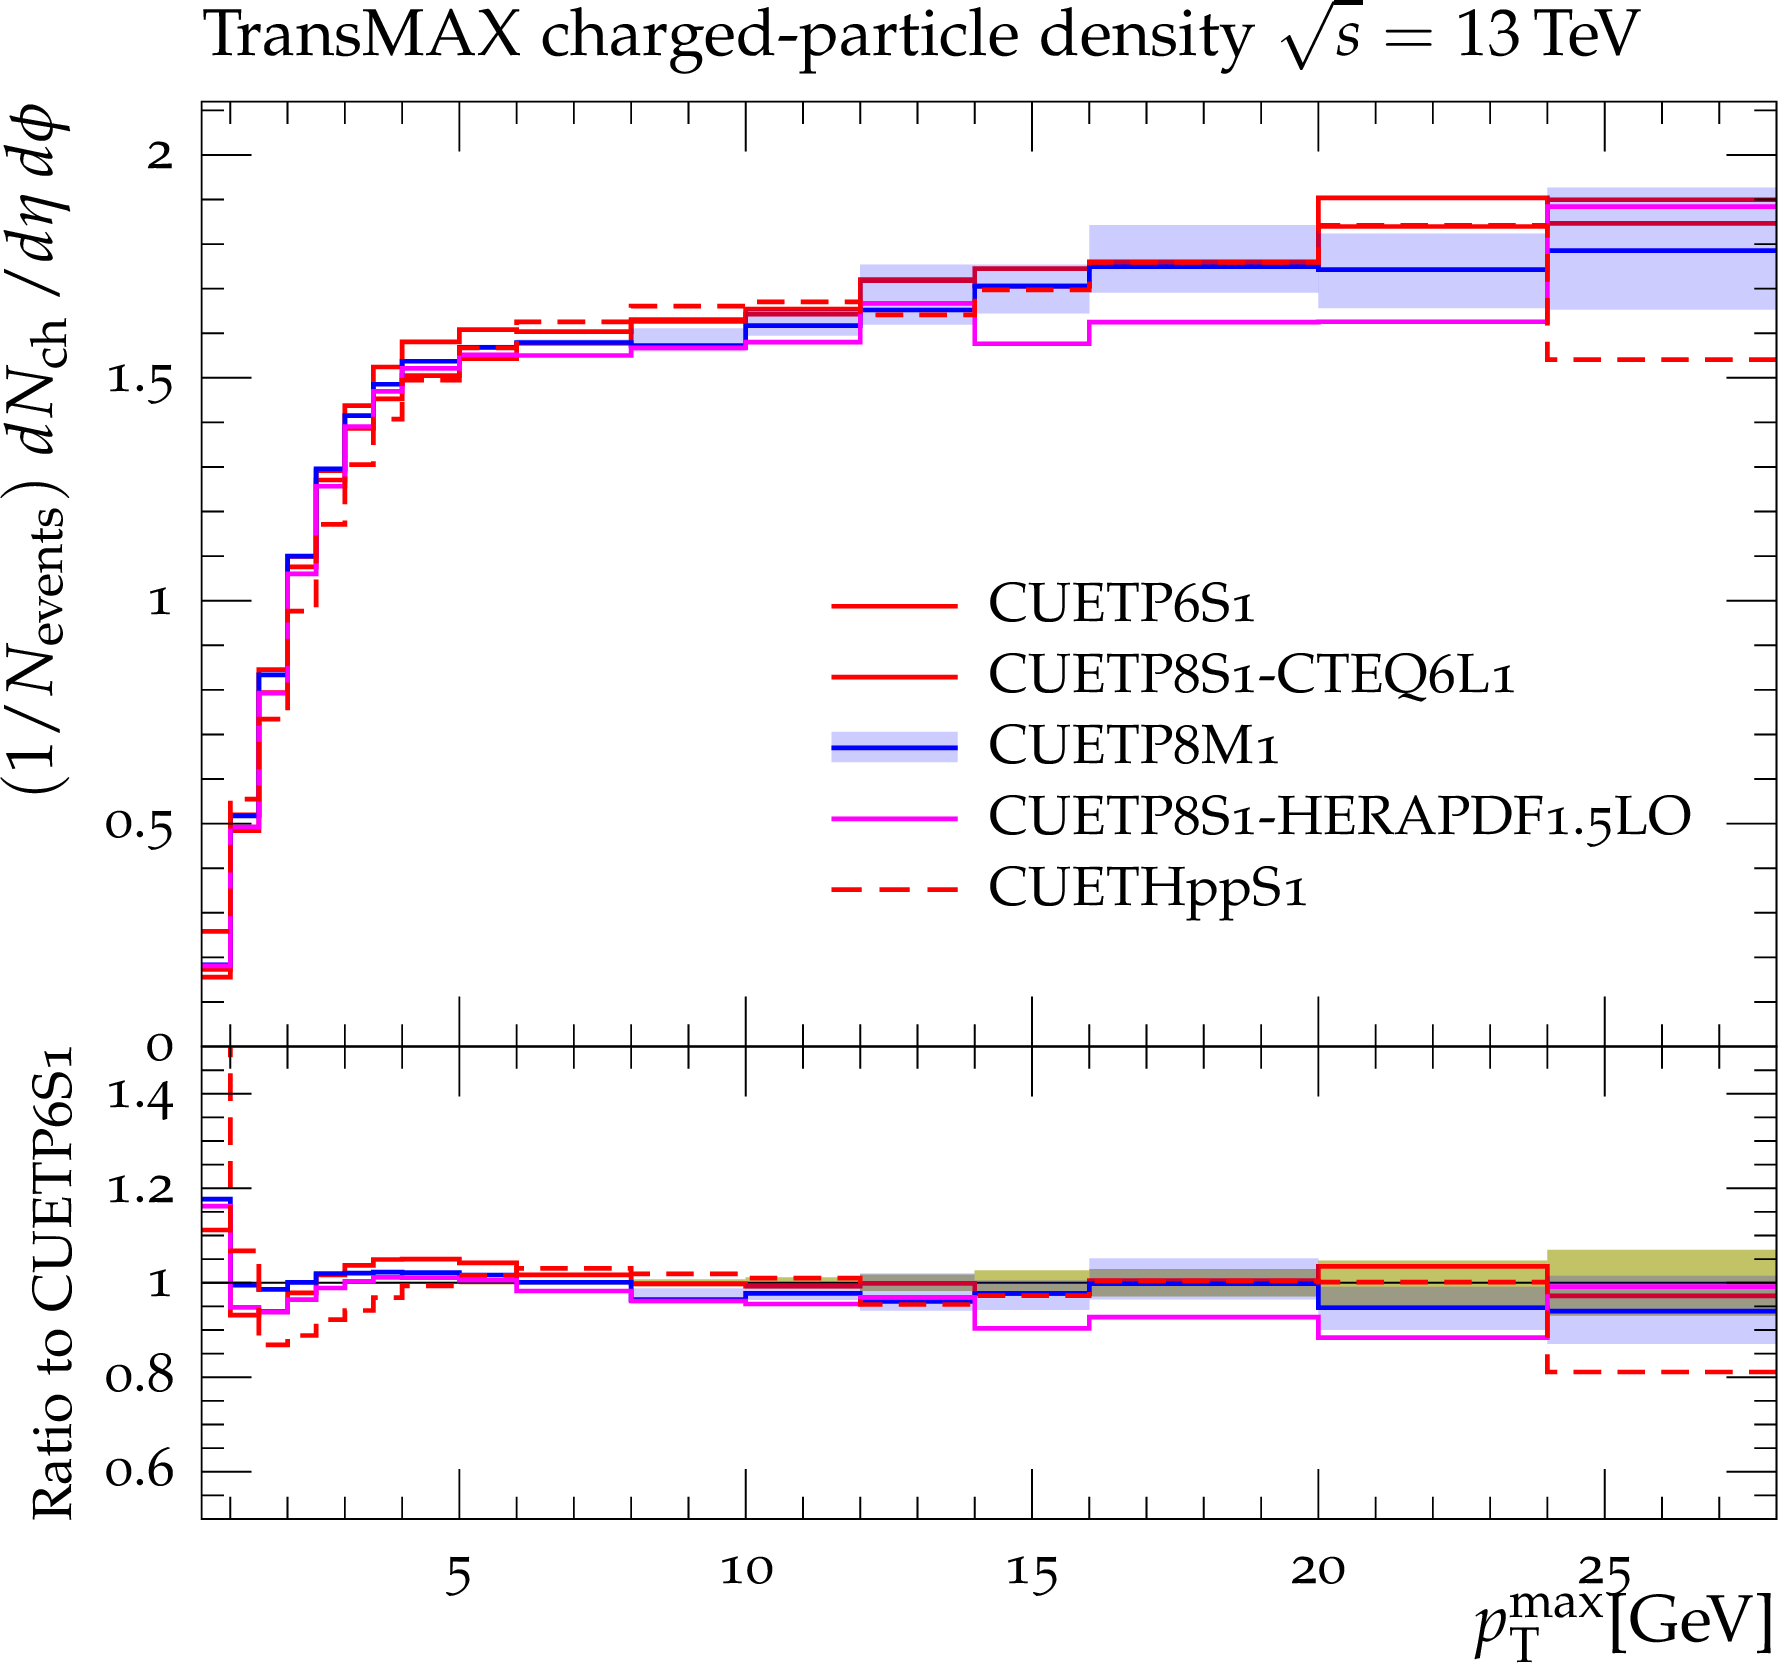
png pdf |
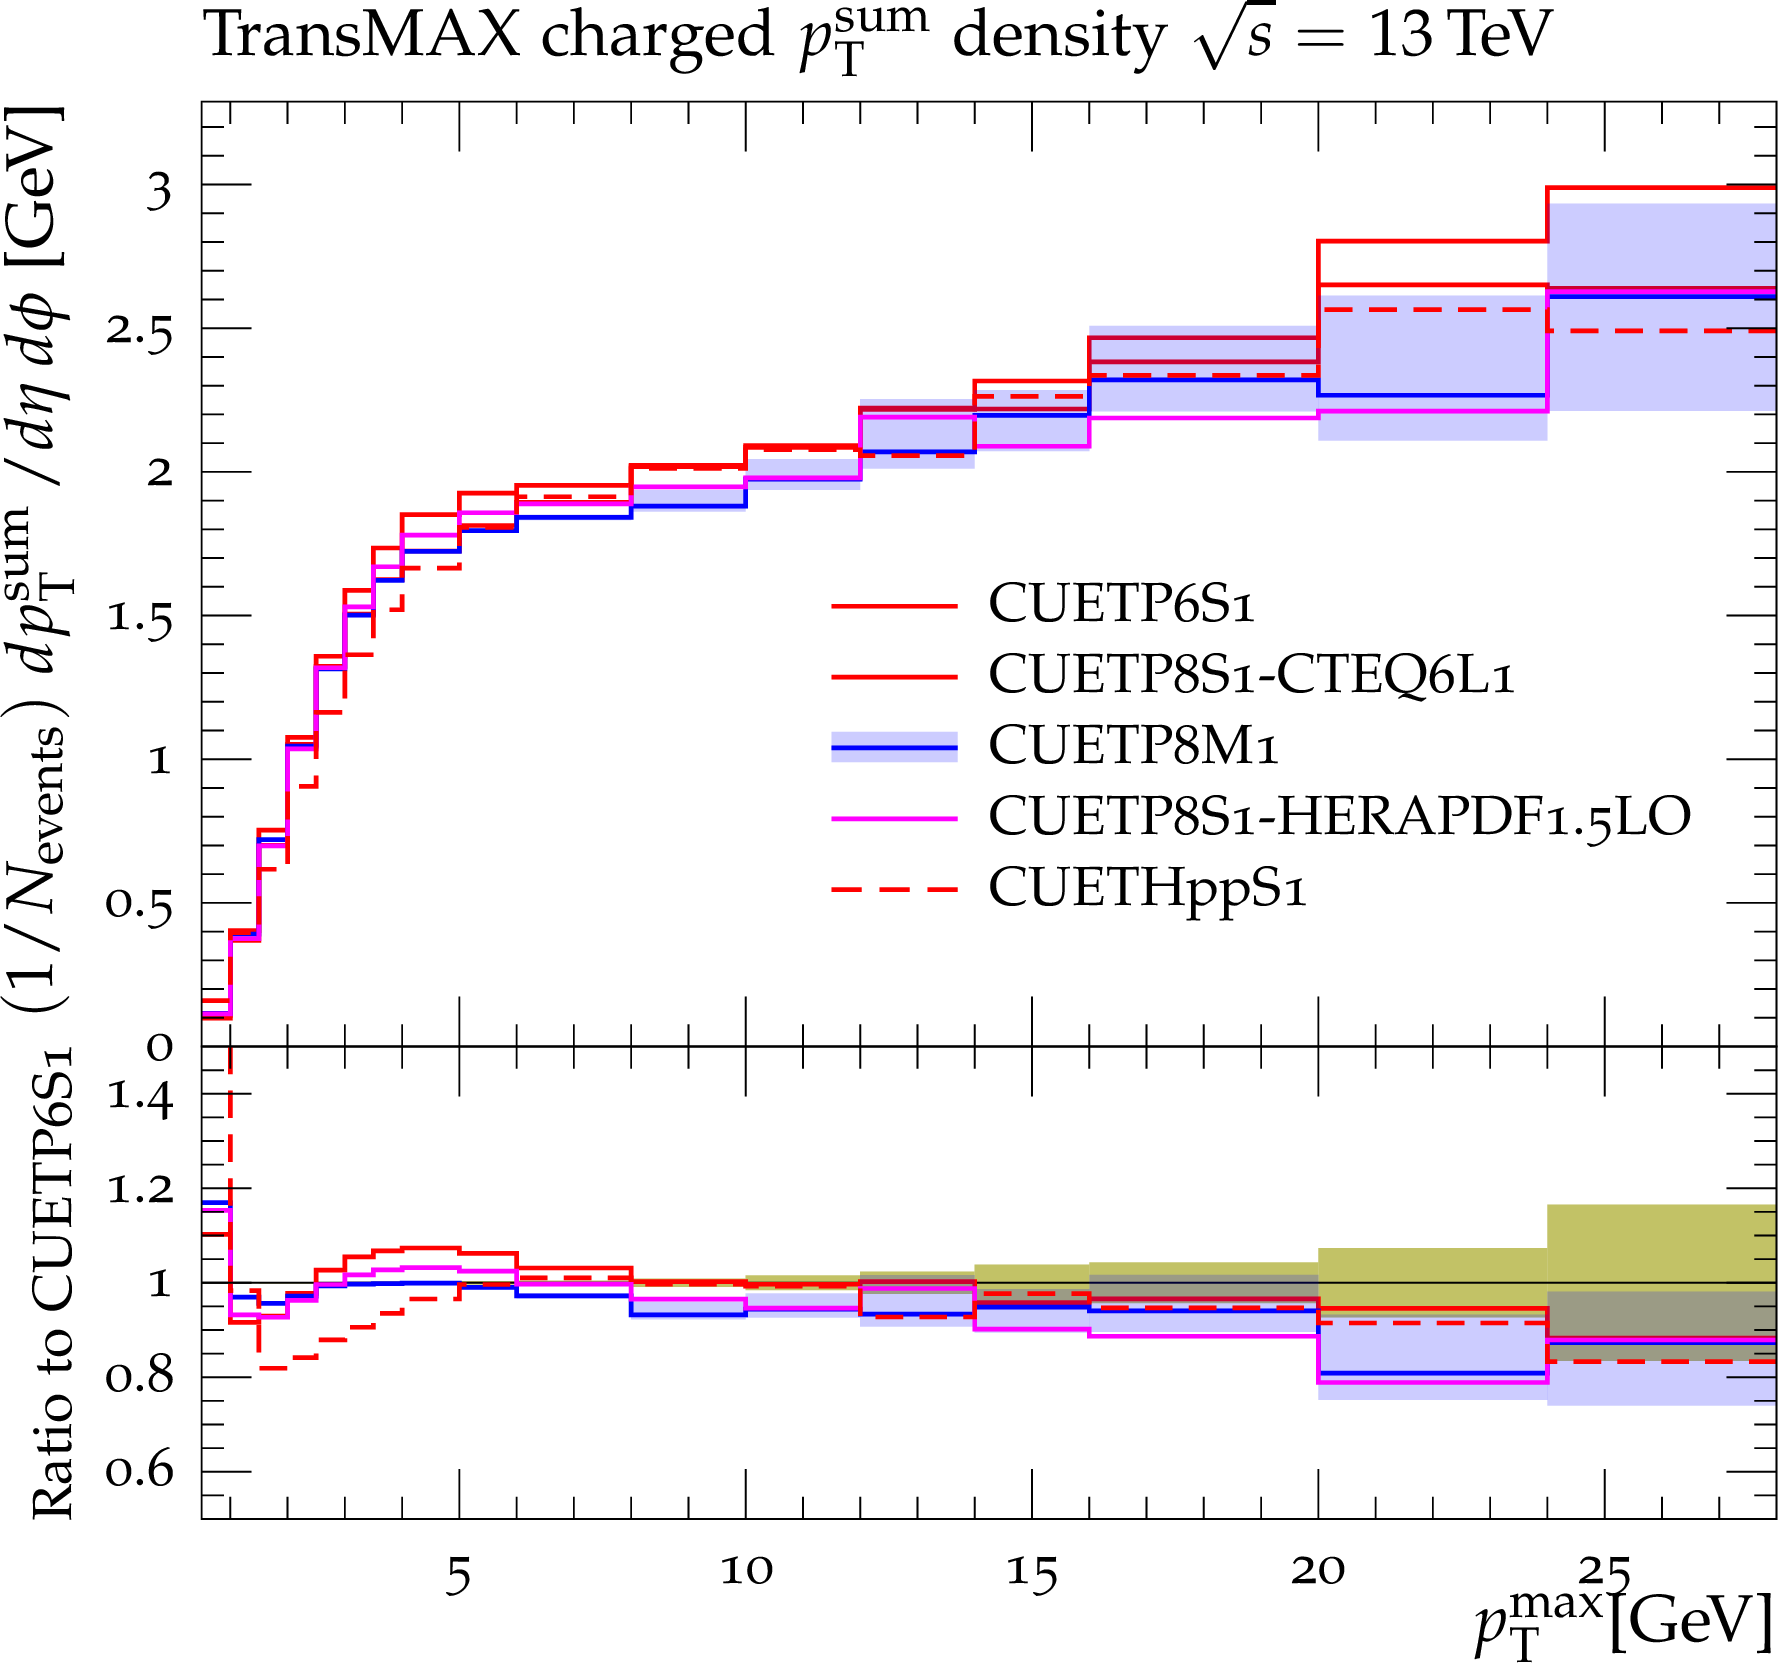
Figure 19-c:
Predictions at $\sqrt {s}=$ 13 TeV for the particle (a,c,e) and the $p_{\rm T}^{\rm sum}$\ densities (b,d,f) for charged particles with $p_{\rm T}>$ 0.5 GeV and $|\eta |<$ 0.8 in the TransMIN (a,b), TransMAX (c,d), and TransDIF (e,f) regions, as defined by the leading charged particle, as a function of the leading charged-particle $p_{\rm T}^{\rm max}$ for the five CMS UE tunes: PYTHIA6 CUETP6S1-CTEQ6L1, and PYTHIA8 CUETP8S1-CTEQ6L1, CUETP8S1-HERAPDF1.5LO, and CUETP8M1, and HERWIG++ CUETHppS1. Also shown are the ratio of the tunes to predictions of CUETP8S1-CTEQ6L1. Predictions for CUETP8M1\ are shown along with the envelope (green bands) of the corresponding eigentunes. |
png pdf |
Figure 19-d:
Predictions at $\sqrt {s}=$ 13 TeV for the particle (a,c,e) and the $p_{\rm T}^{\rm sum}$\ densities (b,d,f) for charged particles with $p_{\rm T}>$ 0.5 GeV and $|\eta |<$ 0.8 in the TransMIN (a,b), TransMAX (c,d), and TransDIF (e,f) regions, as defined by the leading charged particle, as a function of the leading charged-particle $p_{\rm T}^{\rm max}$ for the five CMS UE tunes: PYTHIA6 CUETP6S1-CTEQ6L1, and PYTHIA8 CUETP8S1-CTEQ6L1, CUETP8S1-HERAPDF1.5LO, and CUETP8M1, and HERWIG++ CUETHppS1. Also shown are the ratio of the tunes to predictions of CUETP8S1-CTEQ6L1. Predictions for CUETP8M1\ are shown along with the envelope (green bands) of the corresponding eigentunes. |

png pdf |
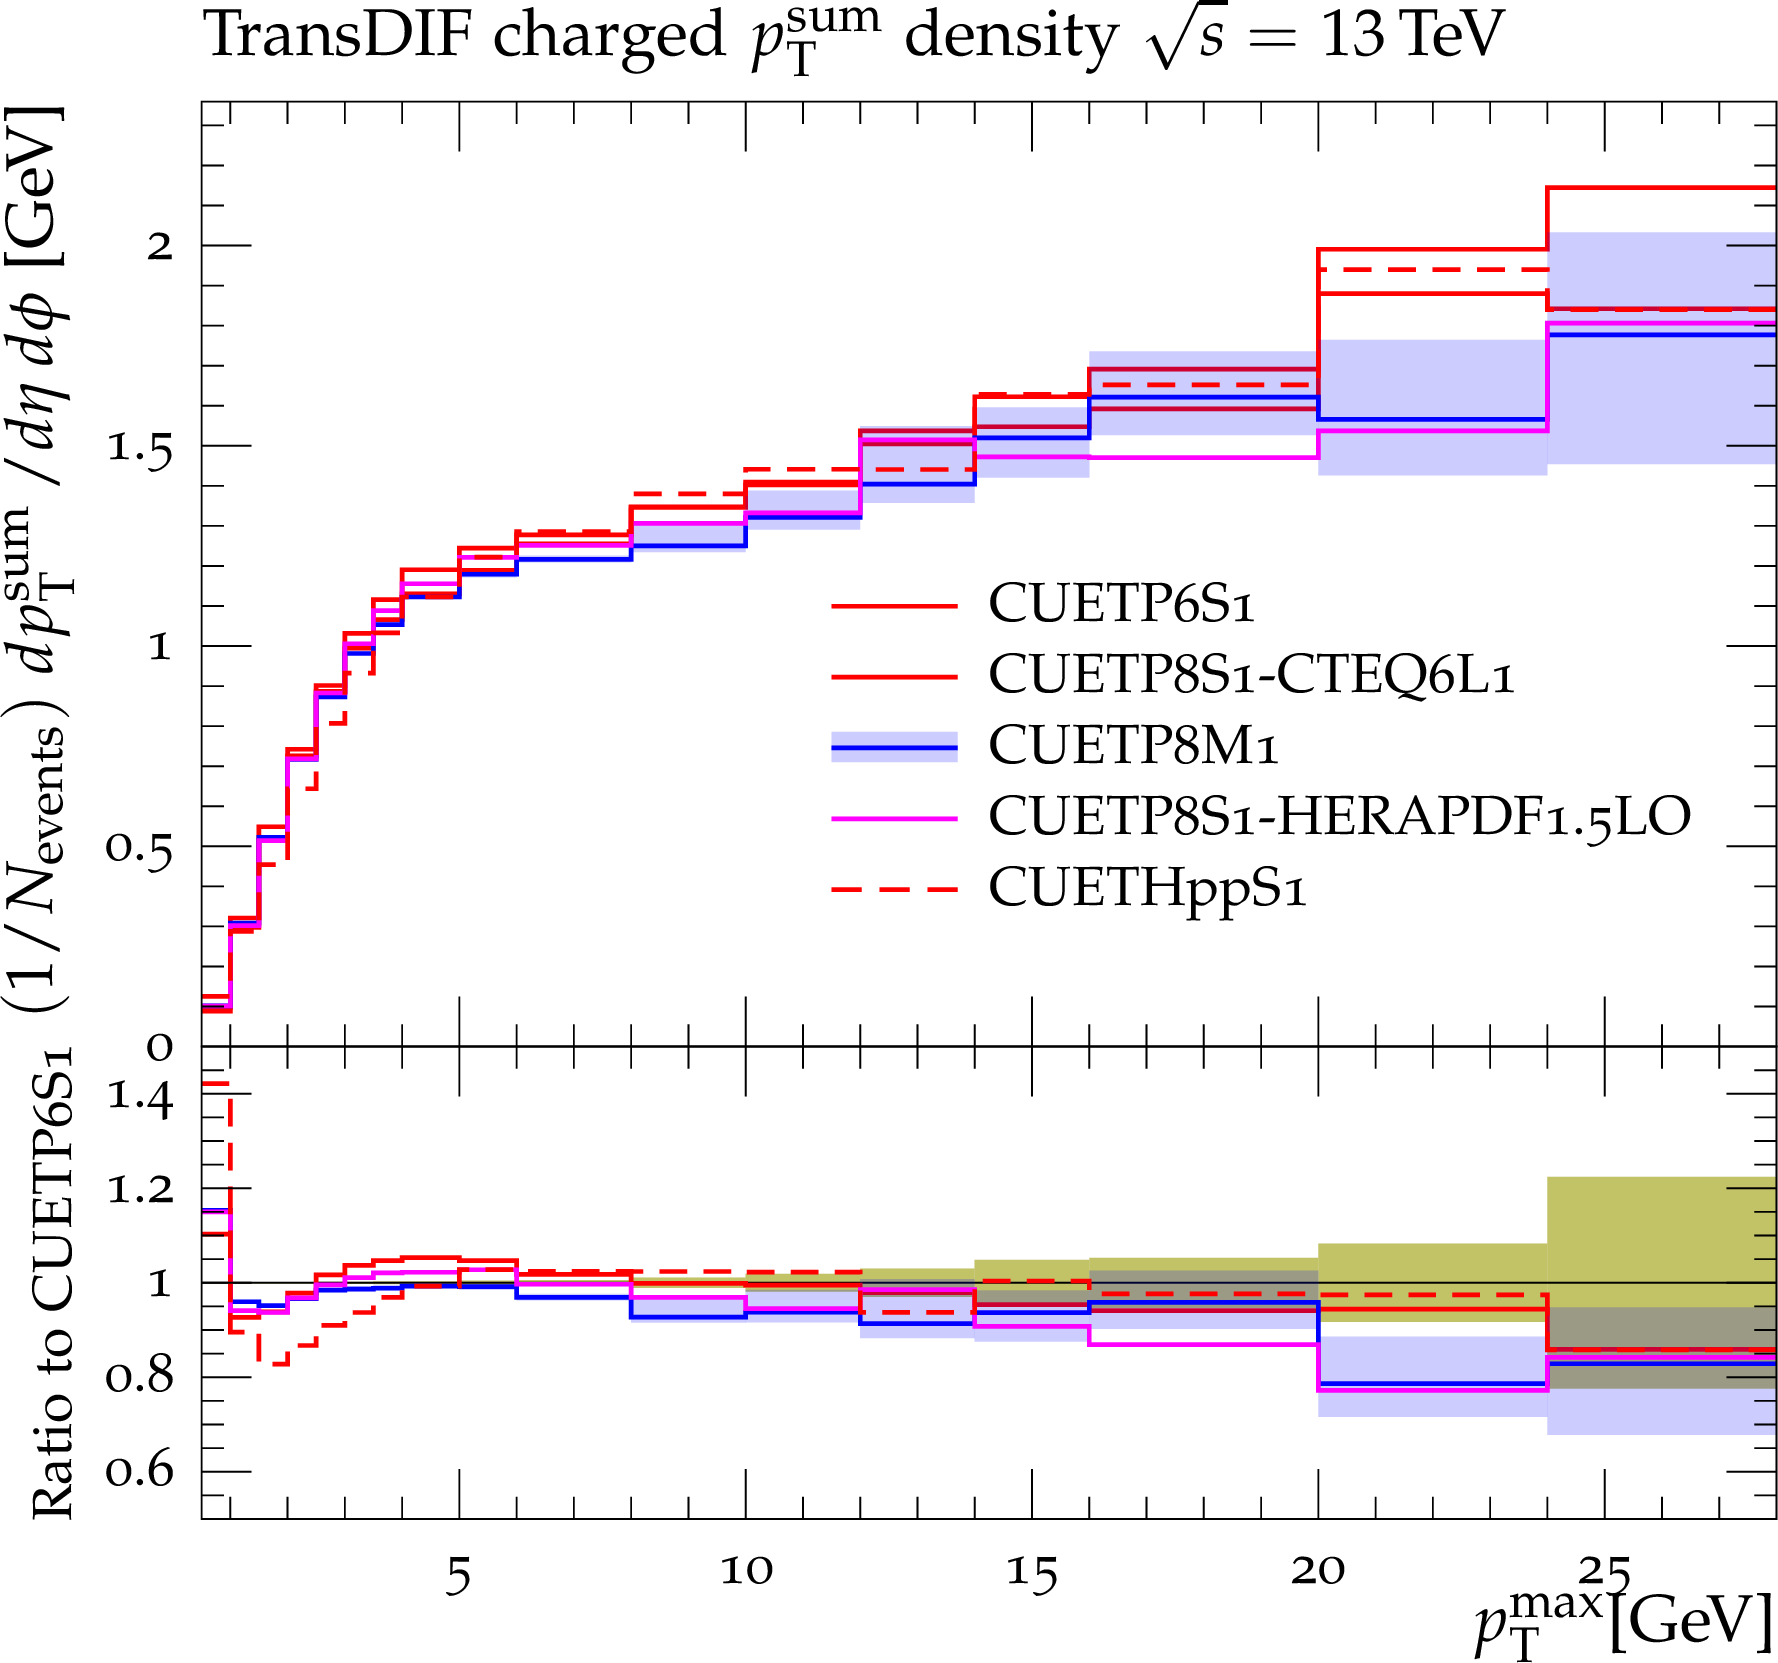
Figure 19-e:
Predictions at $\sqrt {s}=$ 13 TeV for the particle (a,c,e) and the $p_{\rm T}^{\rm sum}$\ densities (b,d,f) for charged particles with $p_{\rm T}>$ 0.5 GeV and $|\eta |<$ 0.8 in the TransMIN (a,b), TransMAX (c,d), and TransDIF (e,f) regions, as defined by the leading charged particle, as a function of the leading charged-particle $p_{\rm T}^{\rm max}$ for the five CMS UE tunes: PYTHIA6 CUETP6S1-CTEQ6L1, and PYTHIA8 CUETP8S1-CTEQ6L1, CUETP8S1-HERAPDF1.5LO, and CUETP8M1, and HERWIG++ CUETHppS1. Also shown are the ratio of the tunes to predictions of CUETP8S1-CTEQ6L1. Predictions for CUETP8M1\ are shown along with the envelope (green bands) of the corresponding eigentunes. |
png pdf |
Figure 19-f:
Predictions at $\sqrt {s}=$ 13 TeV for the particle (a,c,e) and the $p_{\rm T}^{\rm sum}$\ densities (b,d,f) for charged particles with $p_{\rm T}>$ 0.5 GeV and $|\eta |<$ 0.8 in the TransMIN (a,b), TransMAX (c,d), and TransDIF (e,f) regions, as defined by the leading charged particle, as a function of the leading charged-particle $p_{\rm T}^{\rm max}$ for the five CMS UE tunes: PYTHIA6 CUETP6S1-CTEQ6L1, and PYTHIA8 CUETP8S1-CTEQ6L1, CUETP8S1-HERAPDF1.5LO, and CUETP8M1, and HERWIG++ CUETHppS1. Also shown are the ratio of the tunes to predictions of CUETP8S1-CTEQ6L1. Predictions for CUETP8M1\ are shown along with the envelope (green bands) of the corresponding eigentunes. |
png pdf |
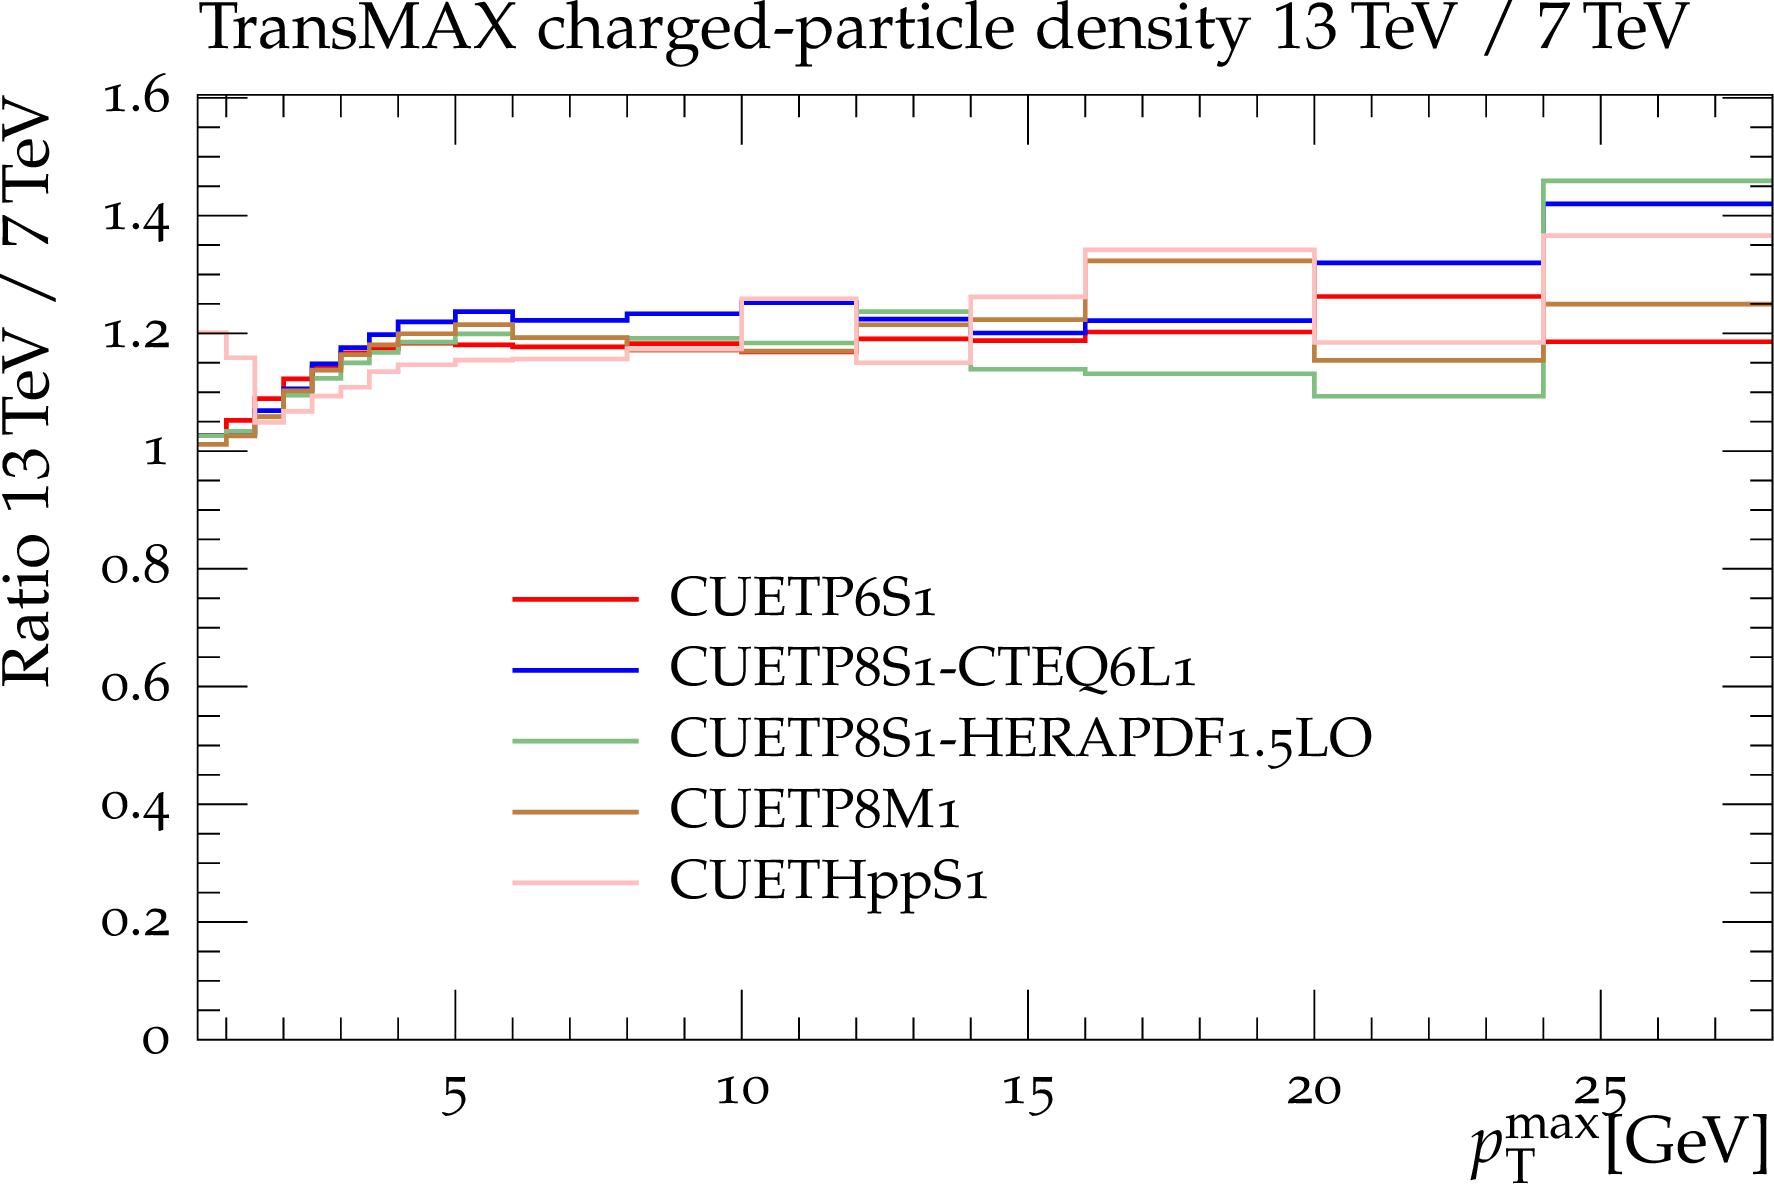
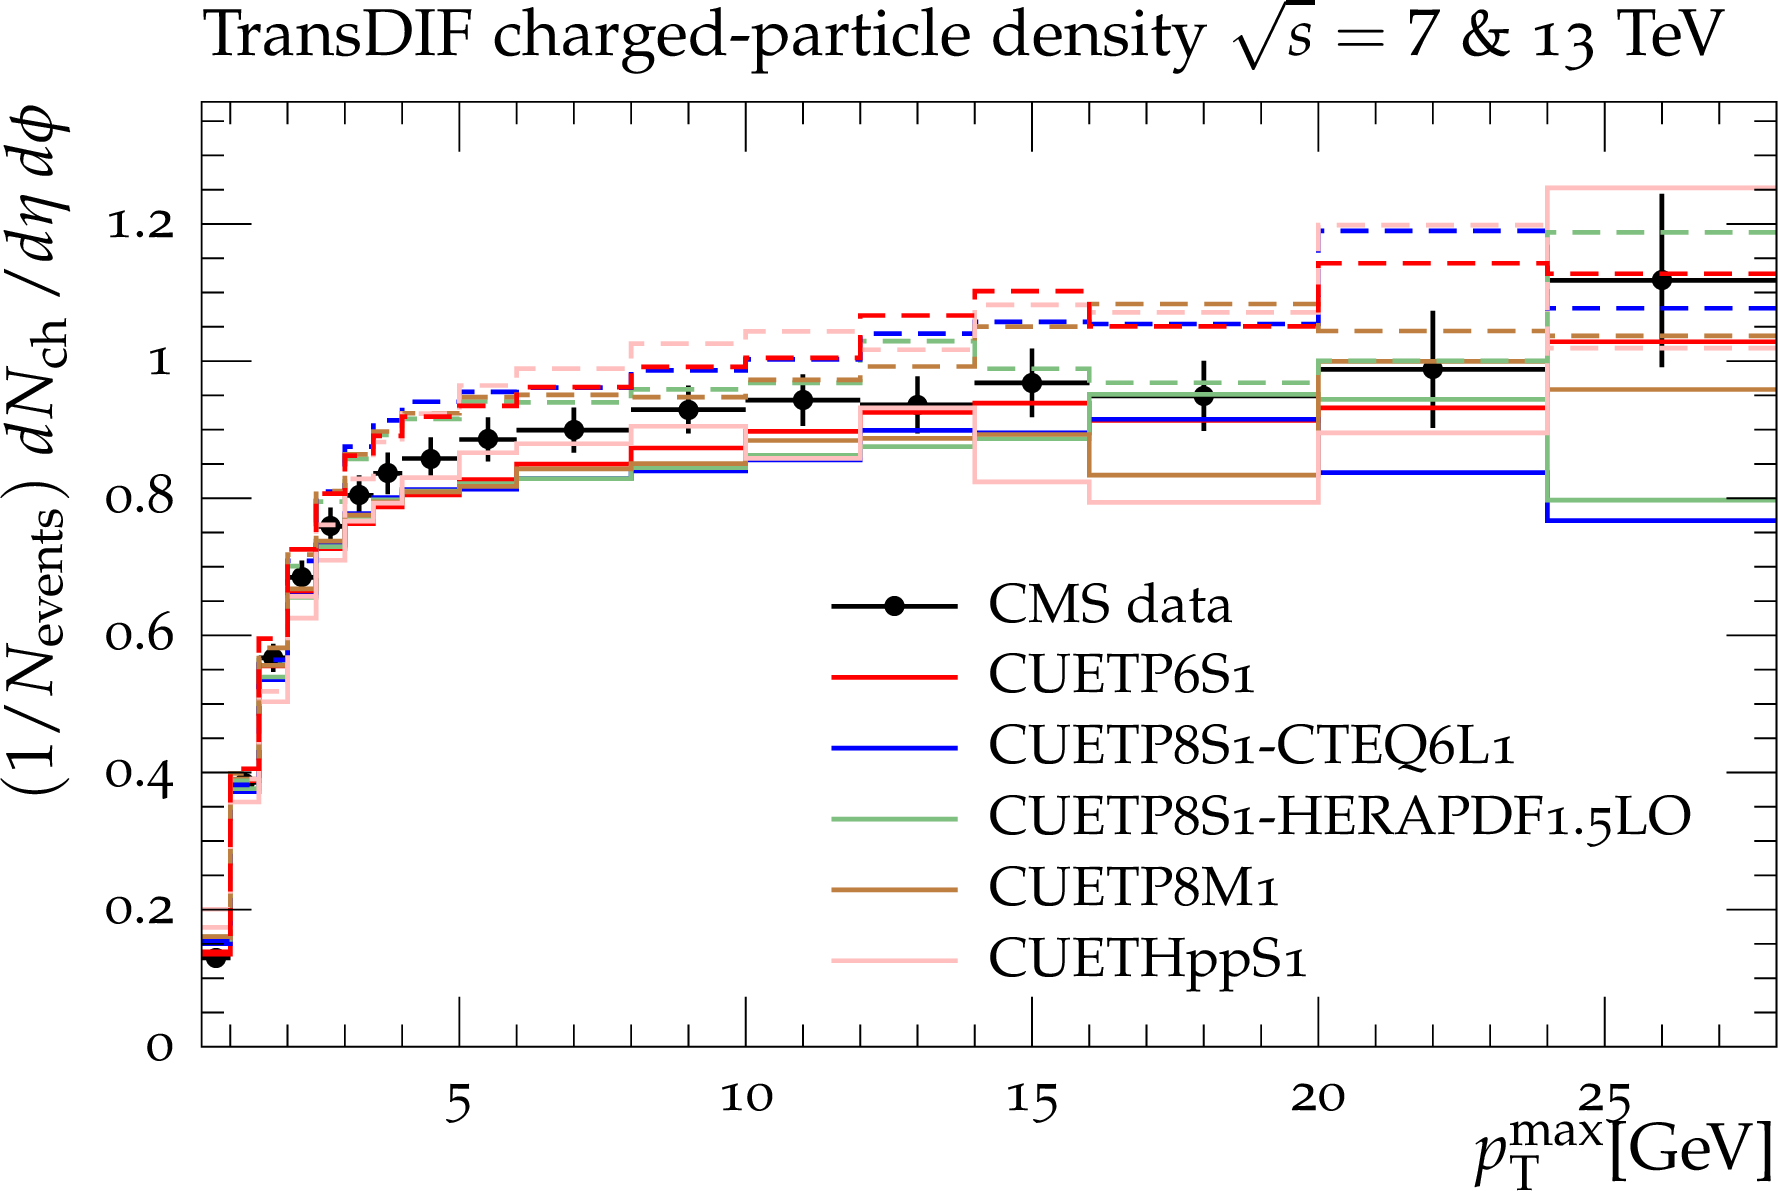
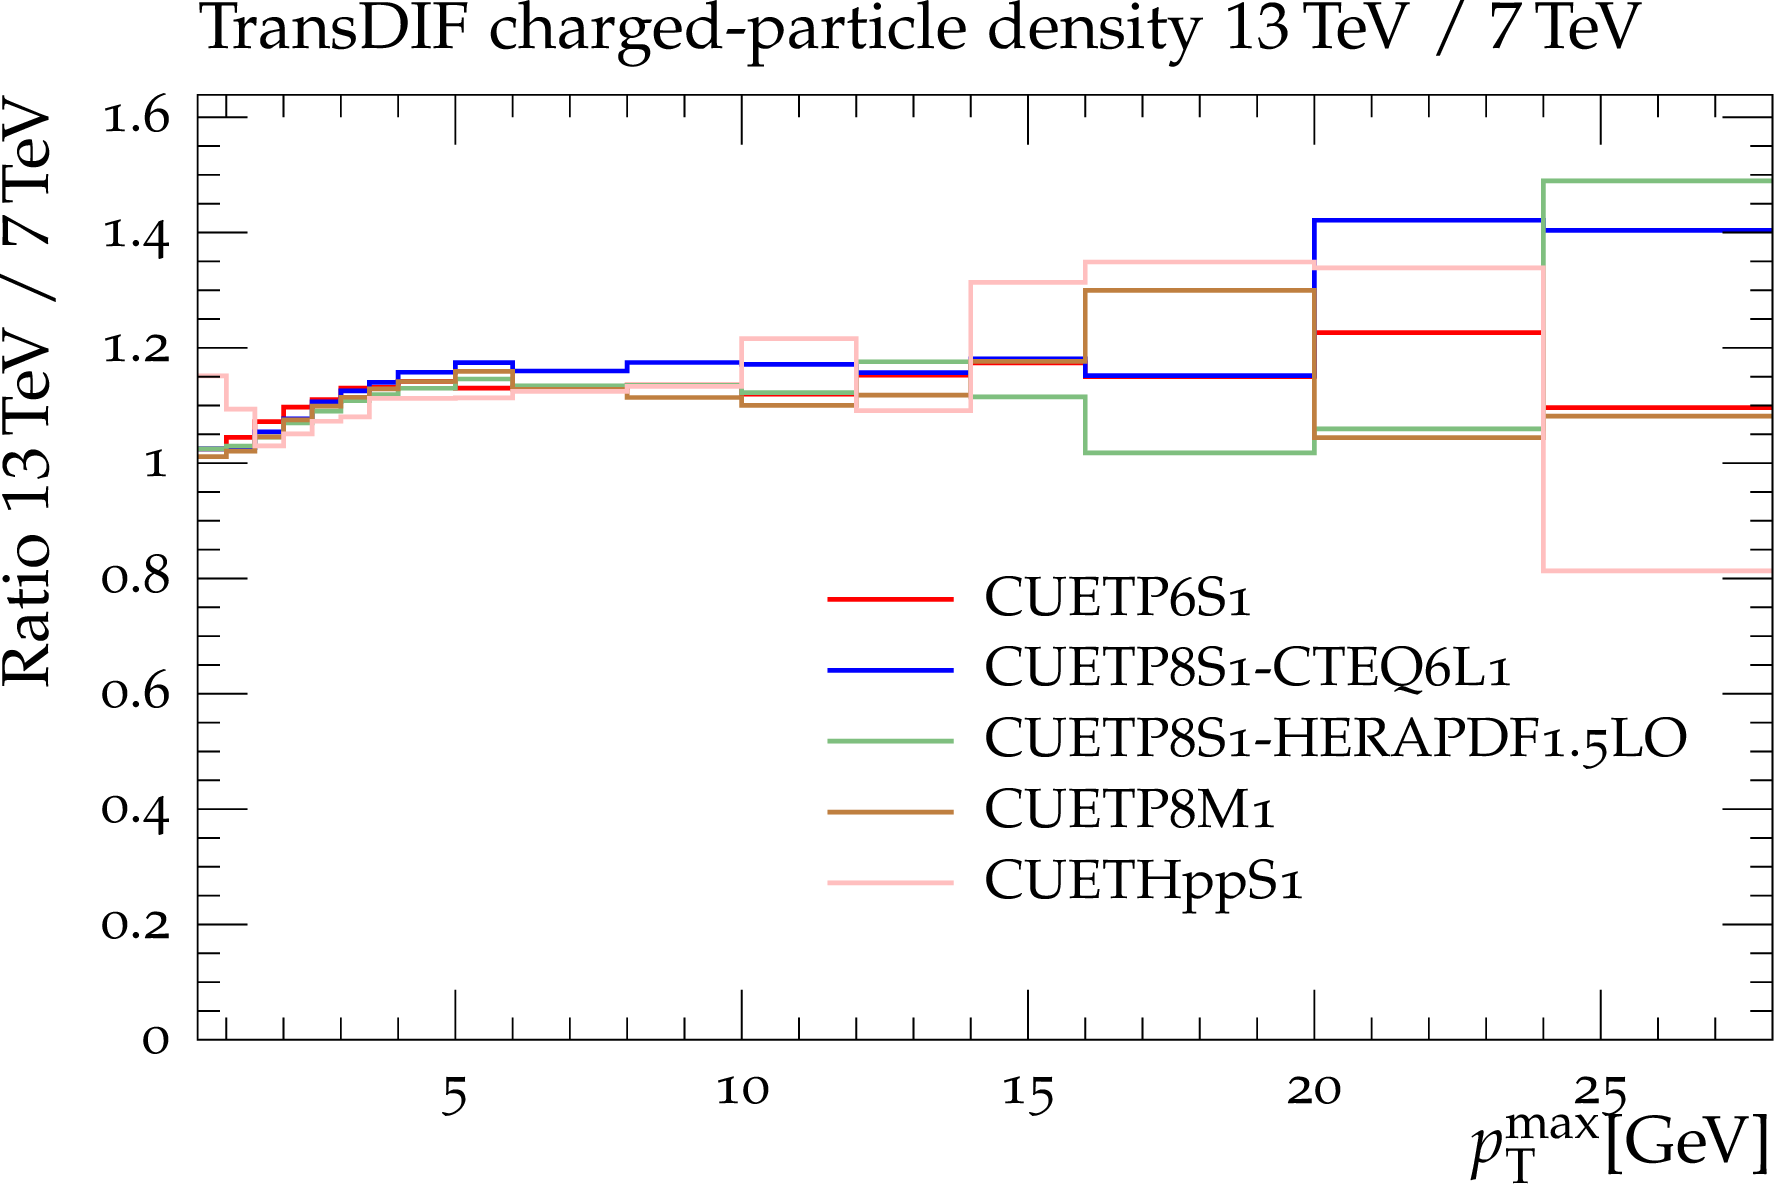
Figure 20-a:
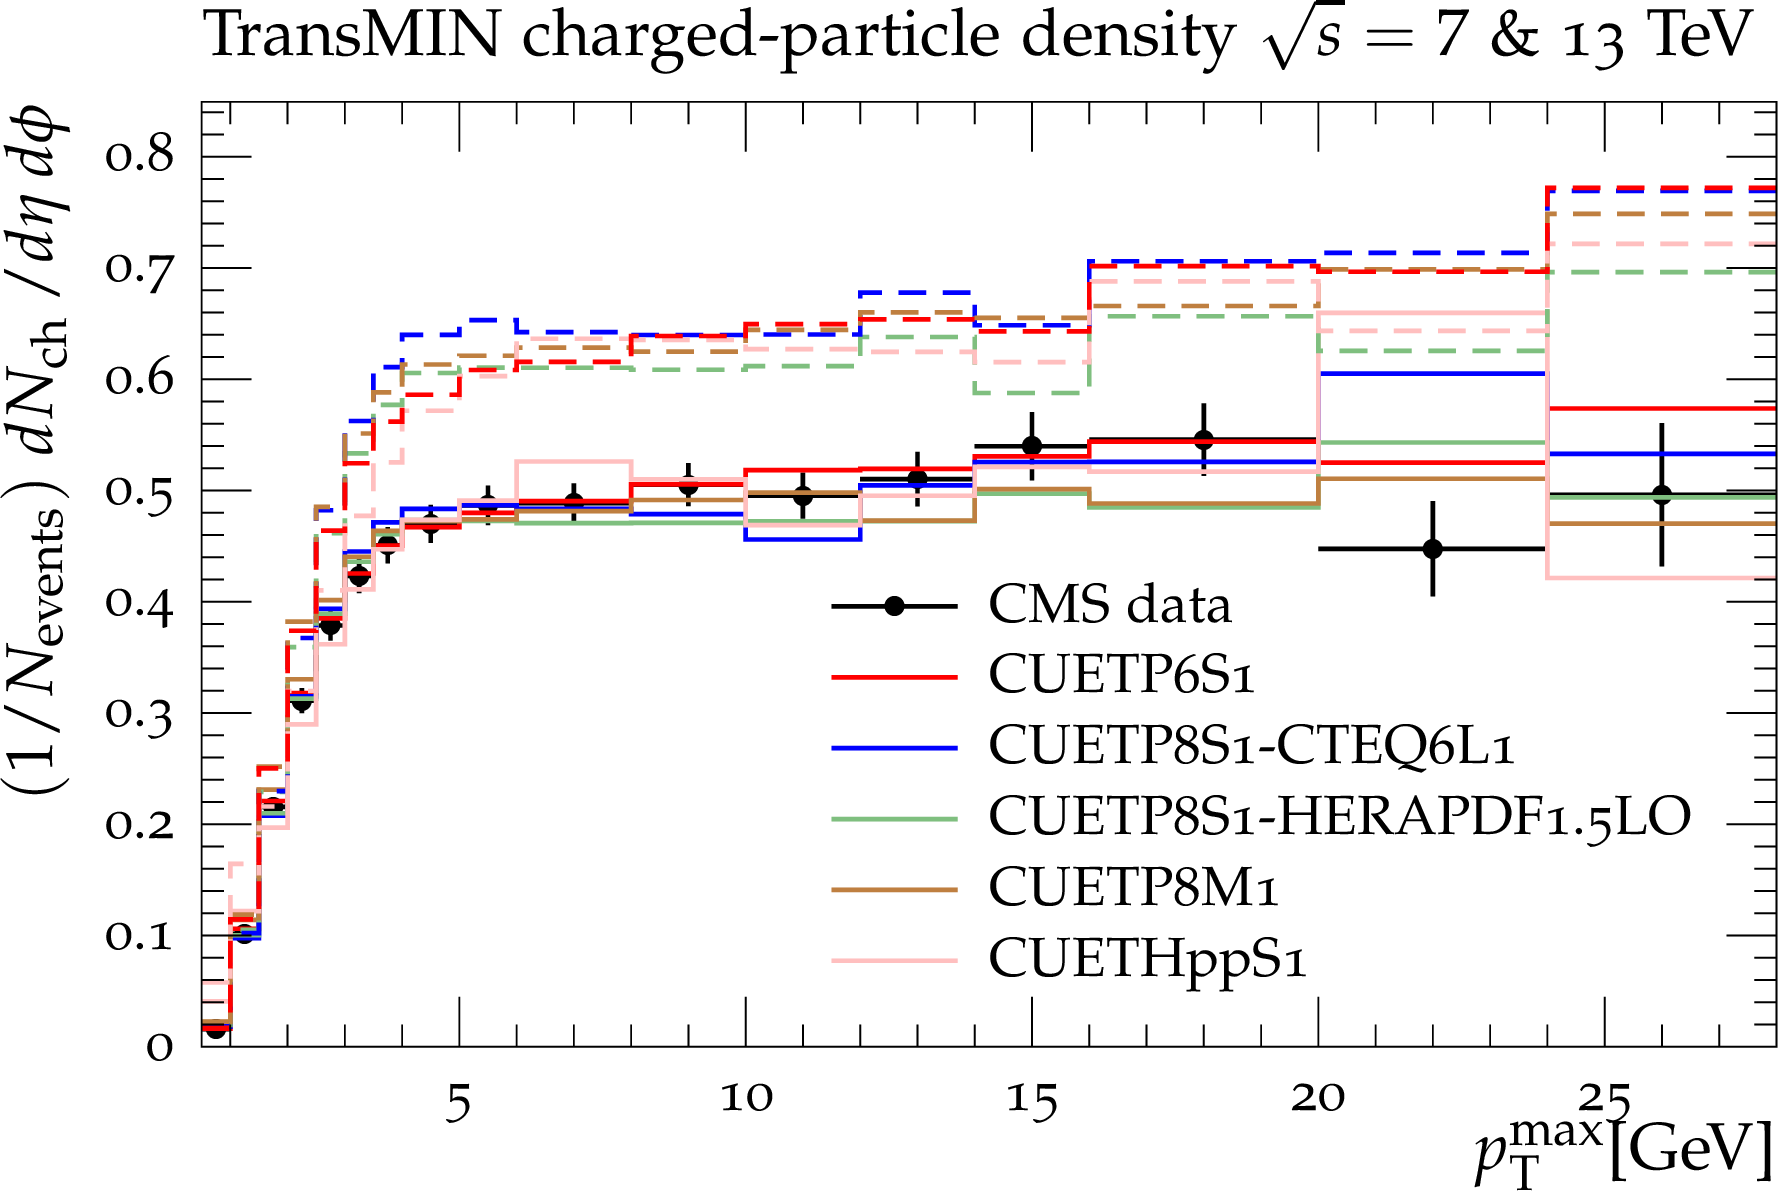
Charged-particle density at $\sqrt {s}=$ 7 TeV for particles with $p_{\rm T}>$ 0.5 GeV and $|\eta |<$ 0.8 in the TransMIN (a,b), TransMAX (c,d), and TransDIF (e,f) regions, as defined by the leading charged particle, as a function of the leading charged-particle $p_{\rm T}^{\rm max}$. The data are compared to PYTHIA6 using CUETP6S1-CTEQ6L1, to PYTHIA8 using CUETP8S1-CTEQ6L1, CUETP8S1-HERAPDF1.5LO, and CUETP8M1, and to HERWIG++ using CUETHppS1. Also shown are the predictions (a,c,e) based on the CMS UE tunes at 13 TeV (dashed lines), and the ratio of the 13 TeV to 7 TeV results for the five tunes (b,d,f). |

png pdf |
Figure 20-b:
Charged-particle density at $\sqrt {s}=$ 7 TeV for particles with $p_{\rm T}>$ 0.5 GeV and $|\eta |<$ 0.8 in the TransMIN (a,b), TransMAX (c,d), and TransDIF (e,f) regions, as defined by the leading charged particle, as a function of the leading charged-particle $p_{\rm T}^{\rm max}$. The data are compared to PYTHIA6 using CUETP6S1-CTEQ6L1, to PYTHIA8 using CUETP8S1-CTEQ6L1, CUETP8S1-HERAPDF1.5LO, and CUETP8M1, and to HERWIG++ using CUETHppS1. Also shown are the predictions (a,c,e) based on the CMS UE tunes at 13 TeV (dashed lines), and the ratio of the 13 TeV to 7 TeV results for the five tunes (b,d,f). |
png pdf |
Figure 20-c:
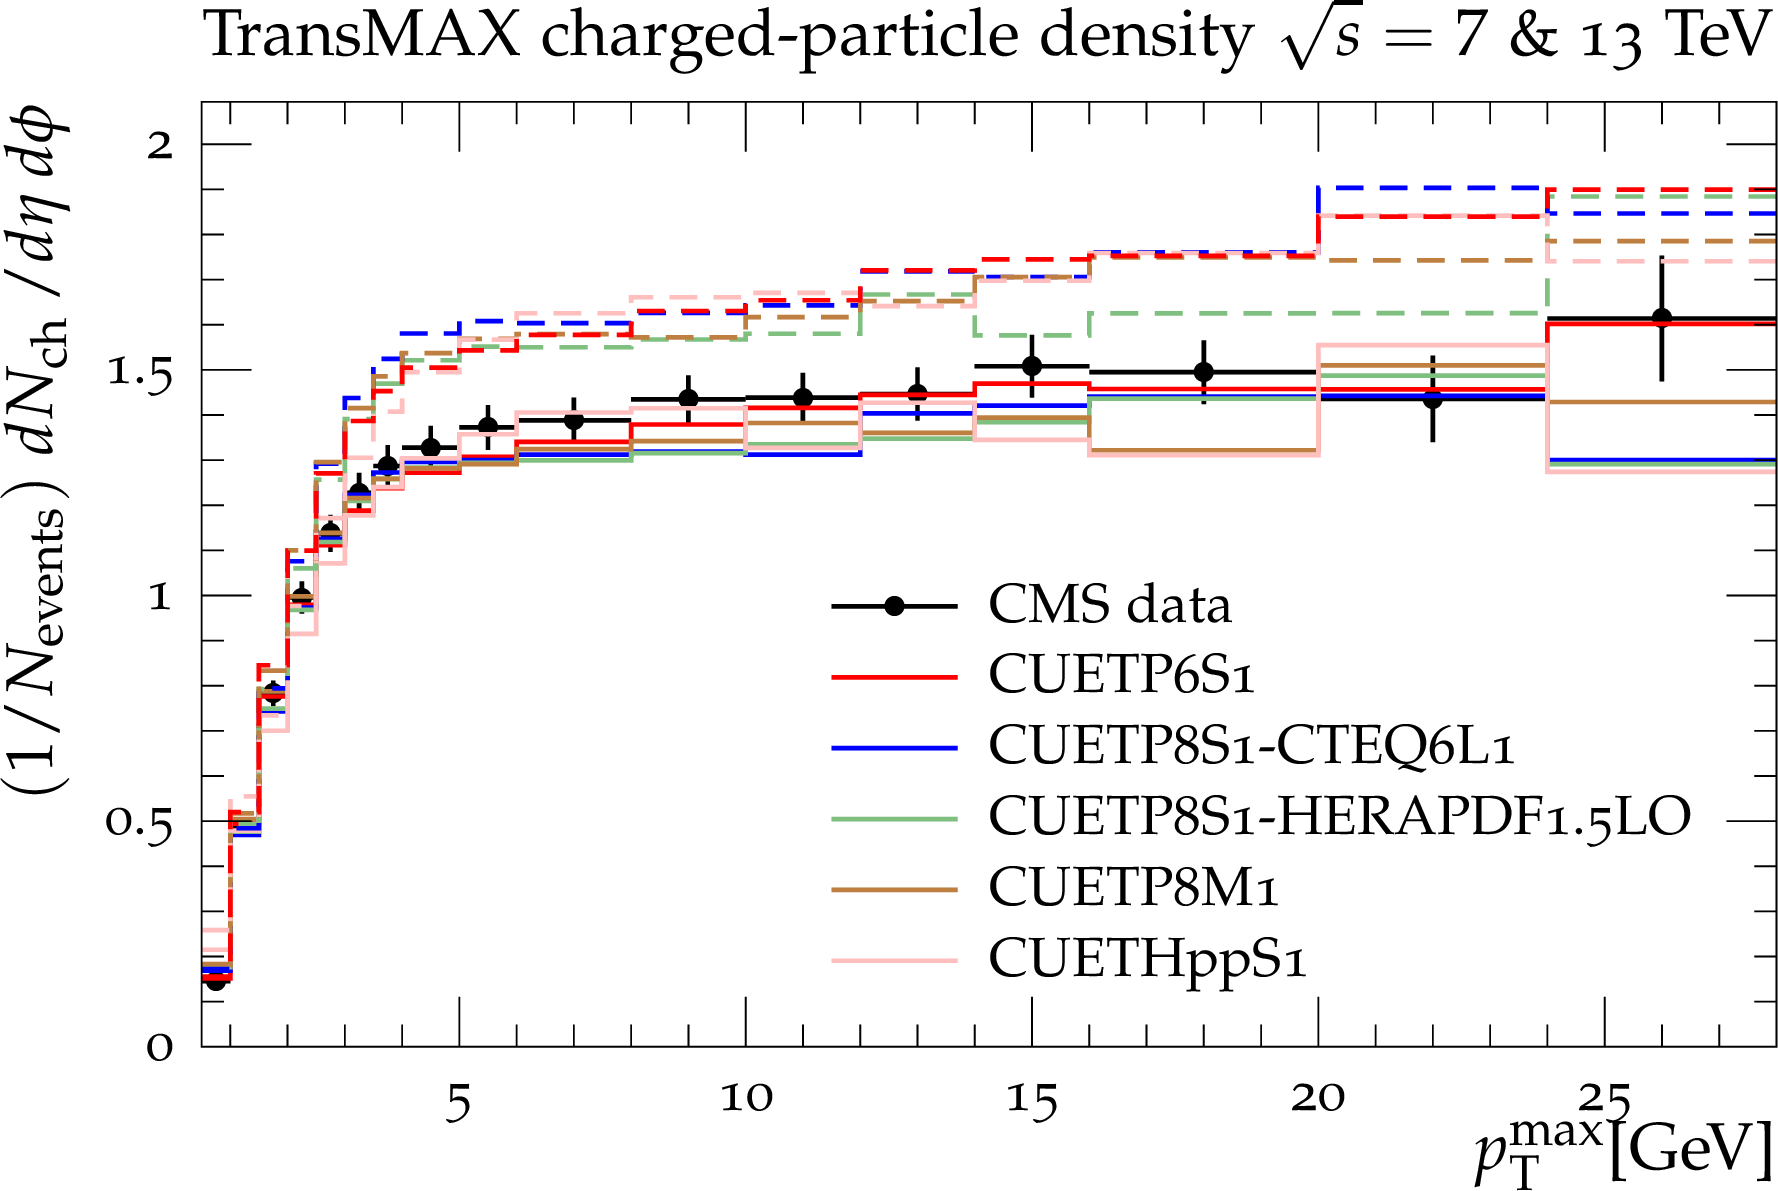
Charged-particle density at $\sqrt {s}=$ 7 TeV for particles with $p_{\rm T}>$ 0.5 GeV and $|\eta |<$ 0.8 in the TransMIN (a,b), TransMAX (c,d), and TransDIF (e,f) regions, as defined by the leading charged particle, as a function of the leading charged-particle $p_{\rm T}^{\rm max}$. The data are compared to PYTHIA6 using CUETP6S1-CTEQ6L1, to PYTHIA8 using CUETP8S1-CTEQ6L1, CUETP8S1-HERAPDF1.5LO, and CUETP8M1, and to HERWIG++ using CUETHppS1. Also shown are the predictions (a,c,e) based on the CMS UE tunes at 13 TeV (dashed lines), and the ratio of the 13 TeV to 7 TeV results for the five tunes (b,d,f). |
png pdf |
Figure 20-d:
Charged-particle density at $\sqrt {s}=$ 7 TeV for particles with $p_{\rm T}>$ 0.5 GeV and $|\eta |<$ 0.8 in the TransMIN (a,b), TransMAX (c,d), and TransDIF (e,f) regions, as defined by the leading charged particle, as a function of the leading charged-particle $p_{\rm T}^{\rm max}$. The data are compared to PYTHIA6 using CUETP6S1-CTEQ6L1, to PYTHIA8 using CUETP8S1-CTEQ6L1, CUETP8S1-HERAPDF1.5LO, and CUETP8M1, and to HERWIG++ using CUETHppS1. Also shown are the predictions (a,c,e) based on the CMS UE tunes at 13 TeV (dashed lines), and the ratio of the 13 TeV to 7 TeV results for the five tunes (b,d,f). |
png pdf |
Figure 20-e:
Charged-particle density at $\sqrt {s}=$ 7 TeV for particles with $p_{\rm T}>$ 0.5 GeV and $|\eta |<$ 0.8 in the TransMIN (a,b), TransMAX (c,d), and TransDIF (e,f) regions, as defined by the leading charged particle, as a function of the leading charged-particle $p_{\rm T}^{\rm max}$. The data are compared to PYTHIA6 using CUETP6S1-CTEQ6L1, to PYTHIA8 using CUETP8S1-CTEQ6L1, CUETP8S1-HERAPDF1.5LO, and CUETP8M1, and to HERWIG++ using CUETHppS1. Also shown are the predictions (a,c,e) based on the CMS UE tunes at 13 TeV (dashed lines), and the ratio of the 13 TeV to 7 TeV results for the five tunes (b,d,f). |
png pdf |
Figure 20-f:
Charged-particle density at $\sqrt {s}=$ 7 TeV for particles with $p_{\rm T}>$ 0.5 GeV and $|\eta |<$ 0.8 in the TransMIN (a,b), TransMAX (c,d), and TransDIF (e,f) regions, as defined by the leading charged particle, as a function of the leading charged-particle $p_{\rm T}^{\rm max}$. The data are compared to PYTHIA6 using CUETP6S1-CTEQ6L1, to PYTHIA8 using CUETP8S1-CTEQ6L1, CUETP8S1-HERAPDF1.5LO, and CUETP8M1, and to HERWIG++ using CUETHppS1. Also shown are the predictions (a,c,e) based on the CMS UE tunes at 13 TeV (dashed lines), and the ratio of the 13 TeV to 7 TeV results for the five tunes (b,d,f). |
png pdf |
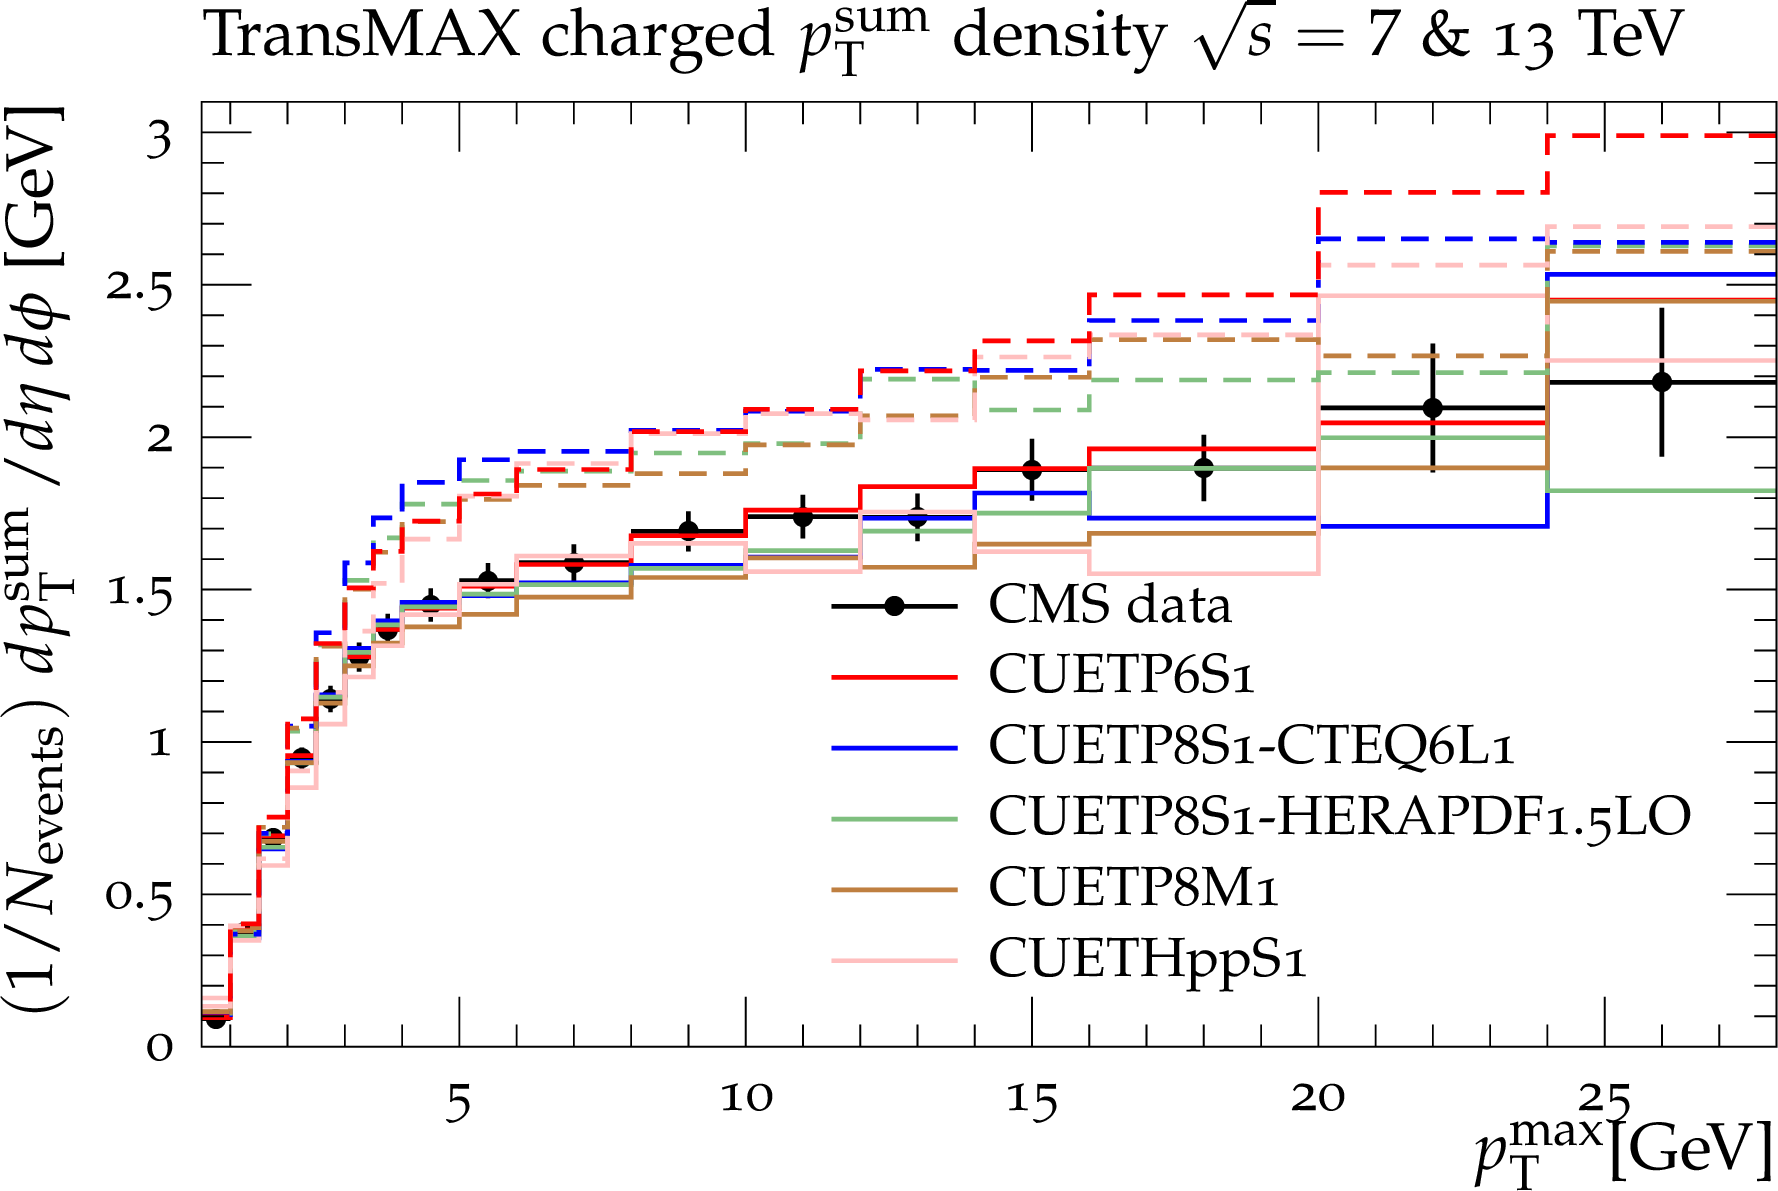
Figure 21-a:
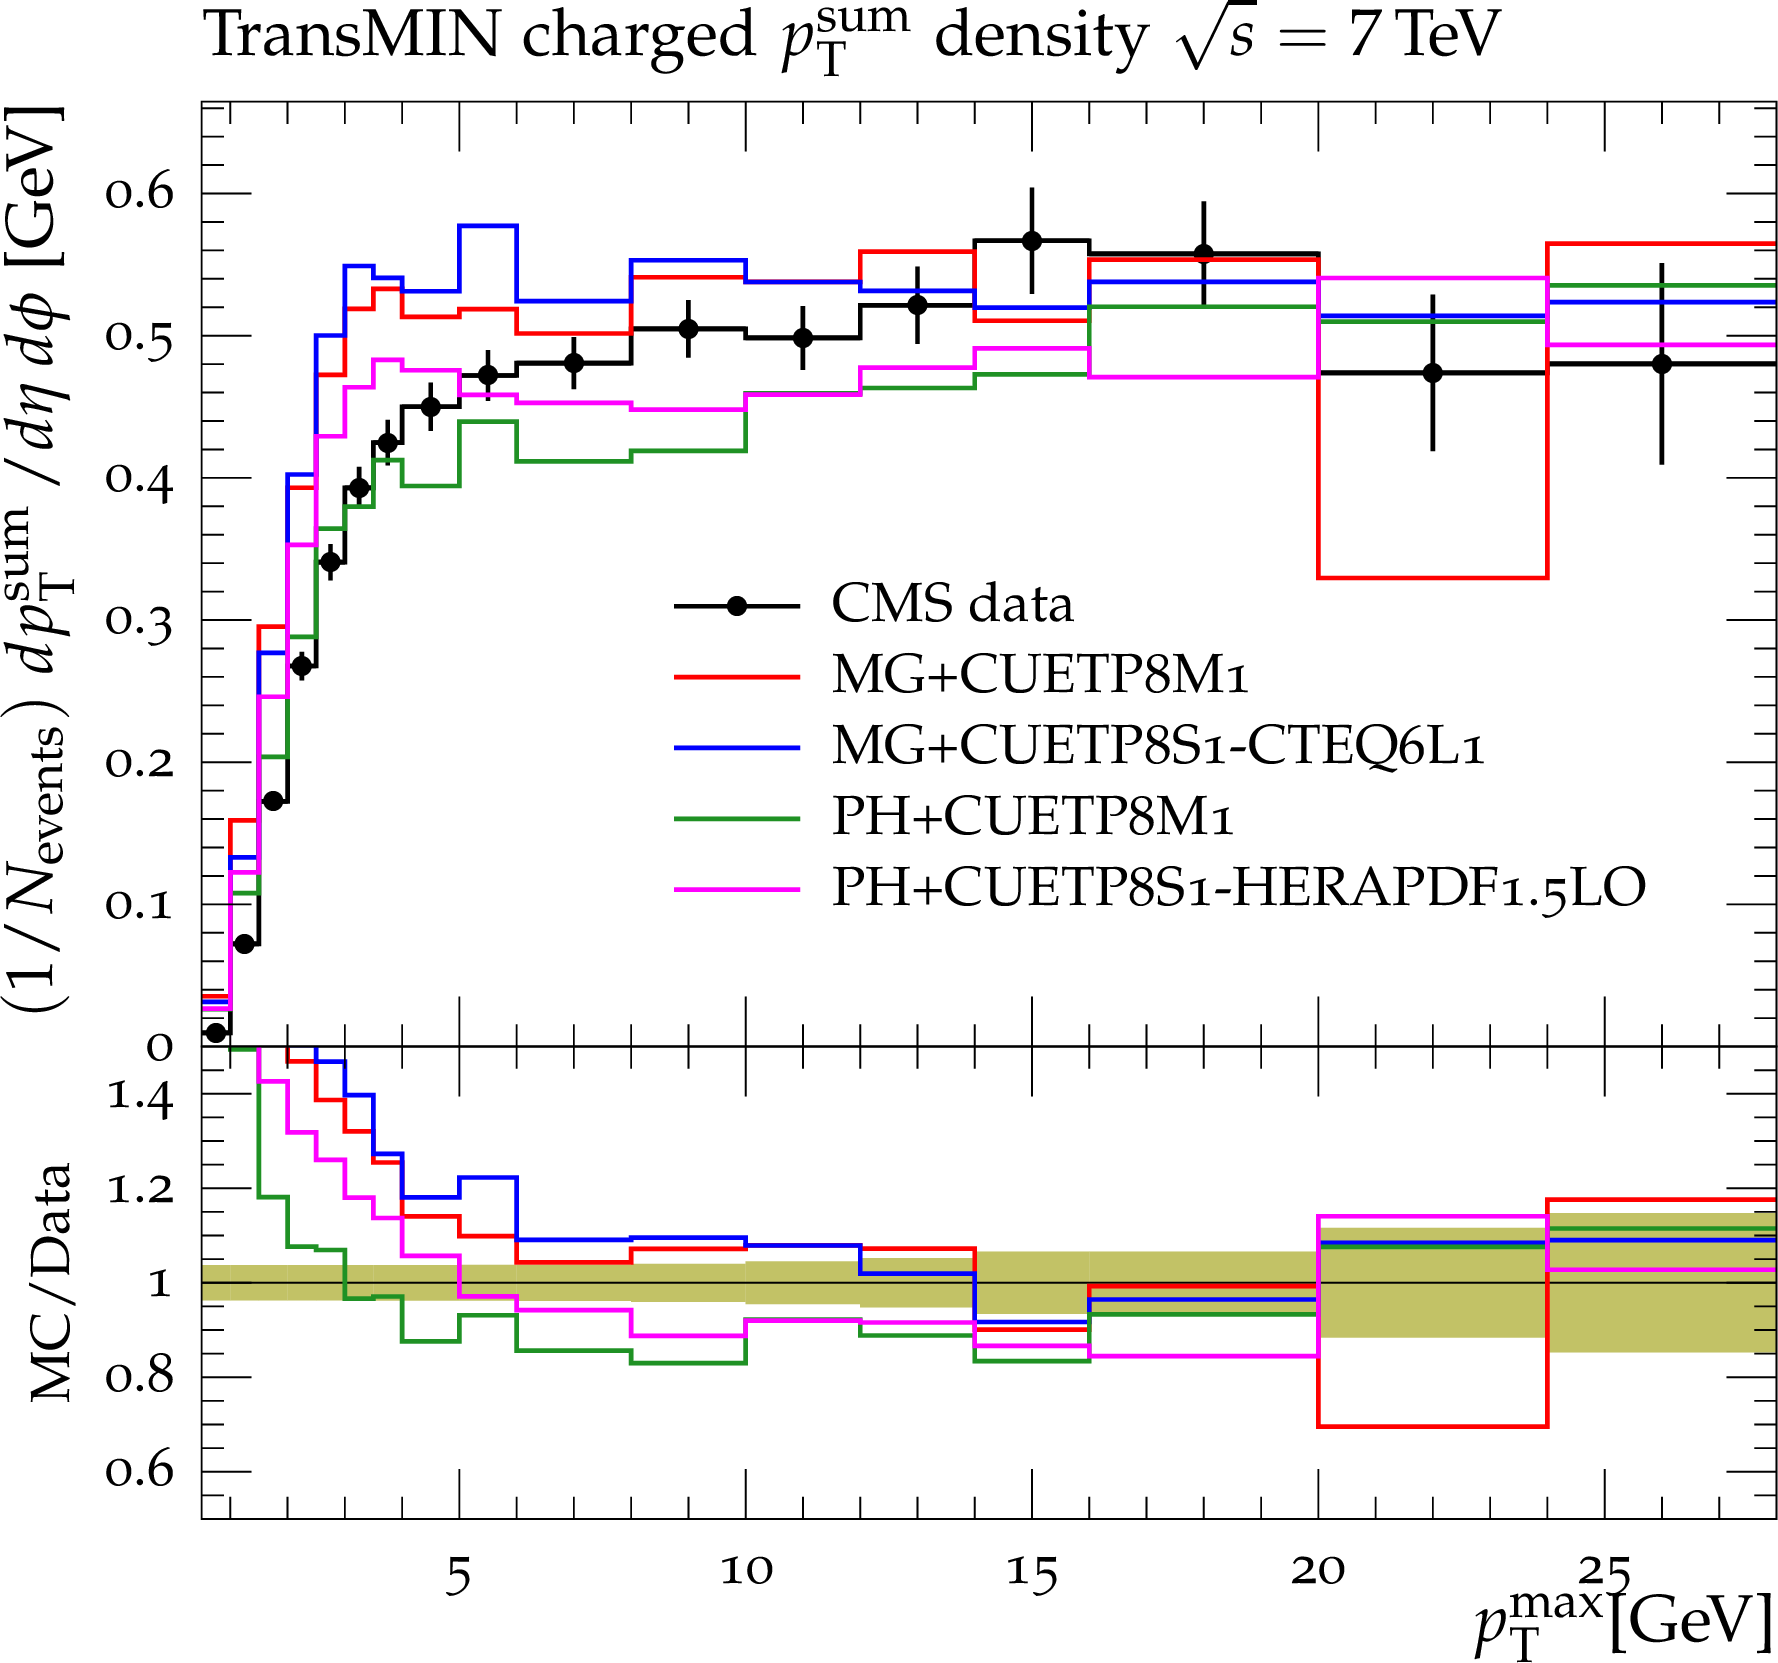
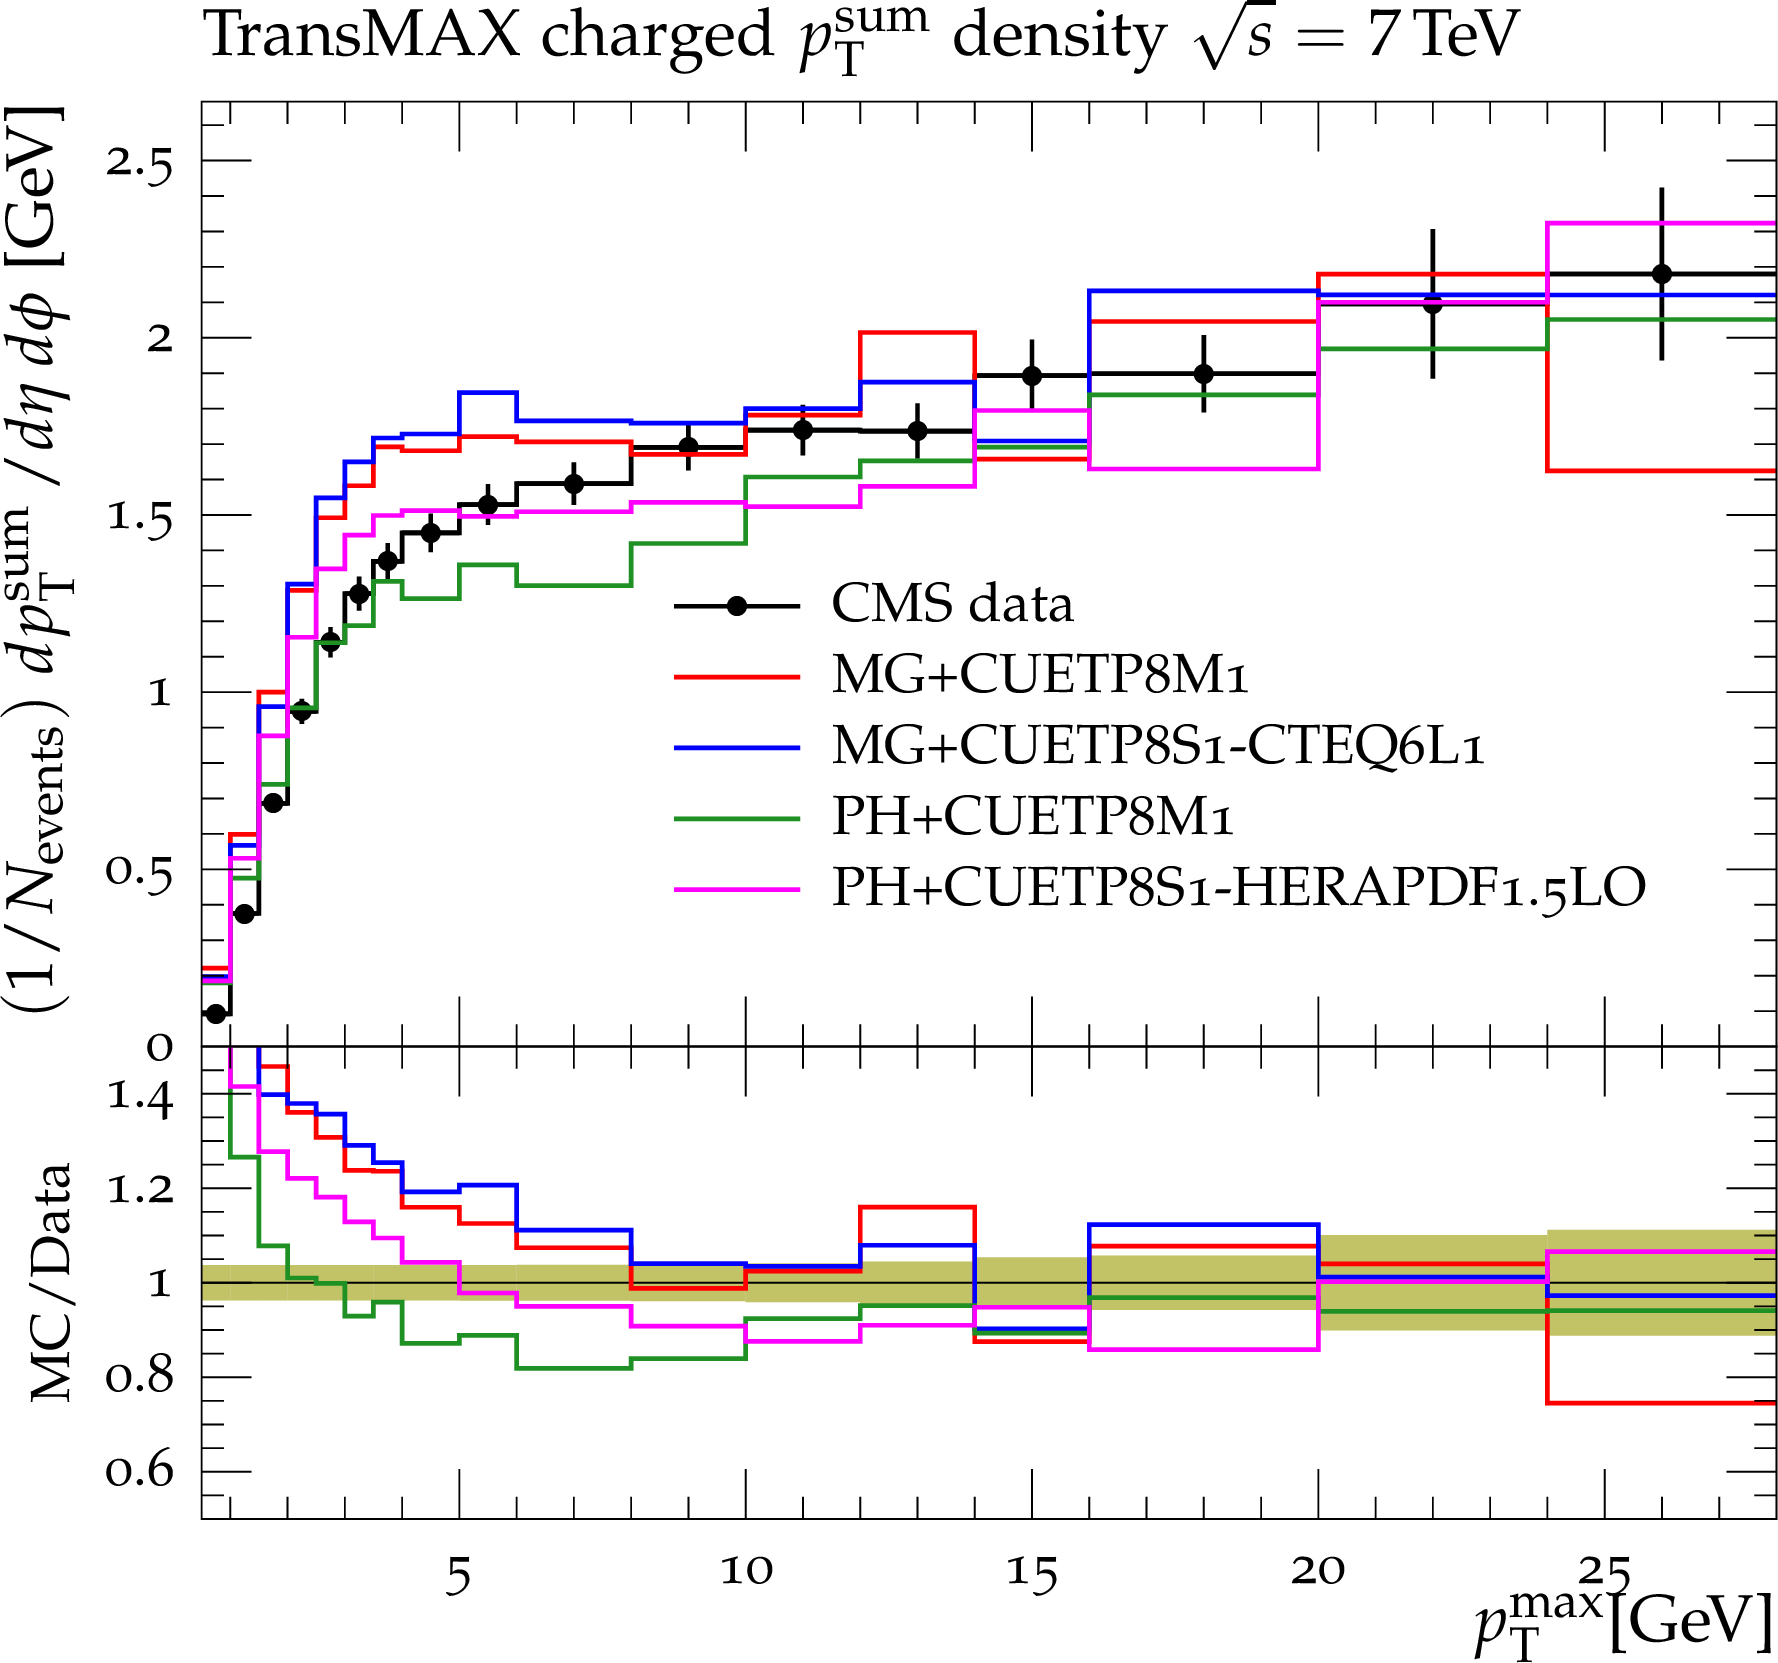
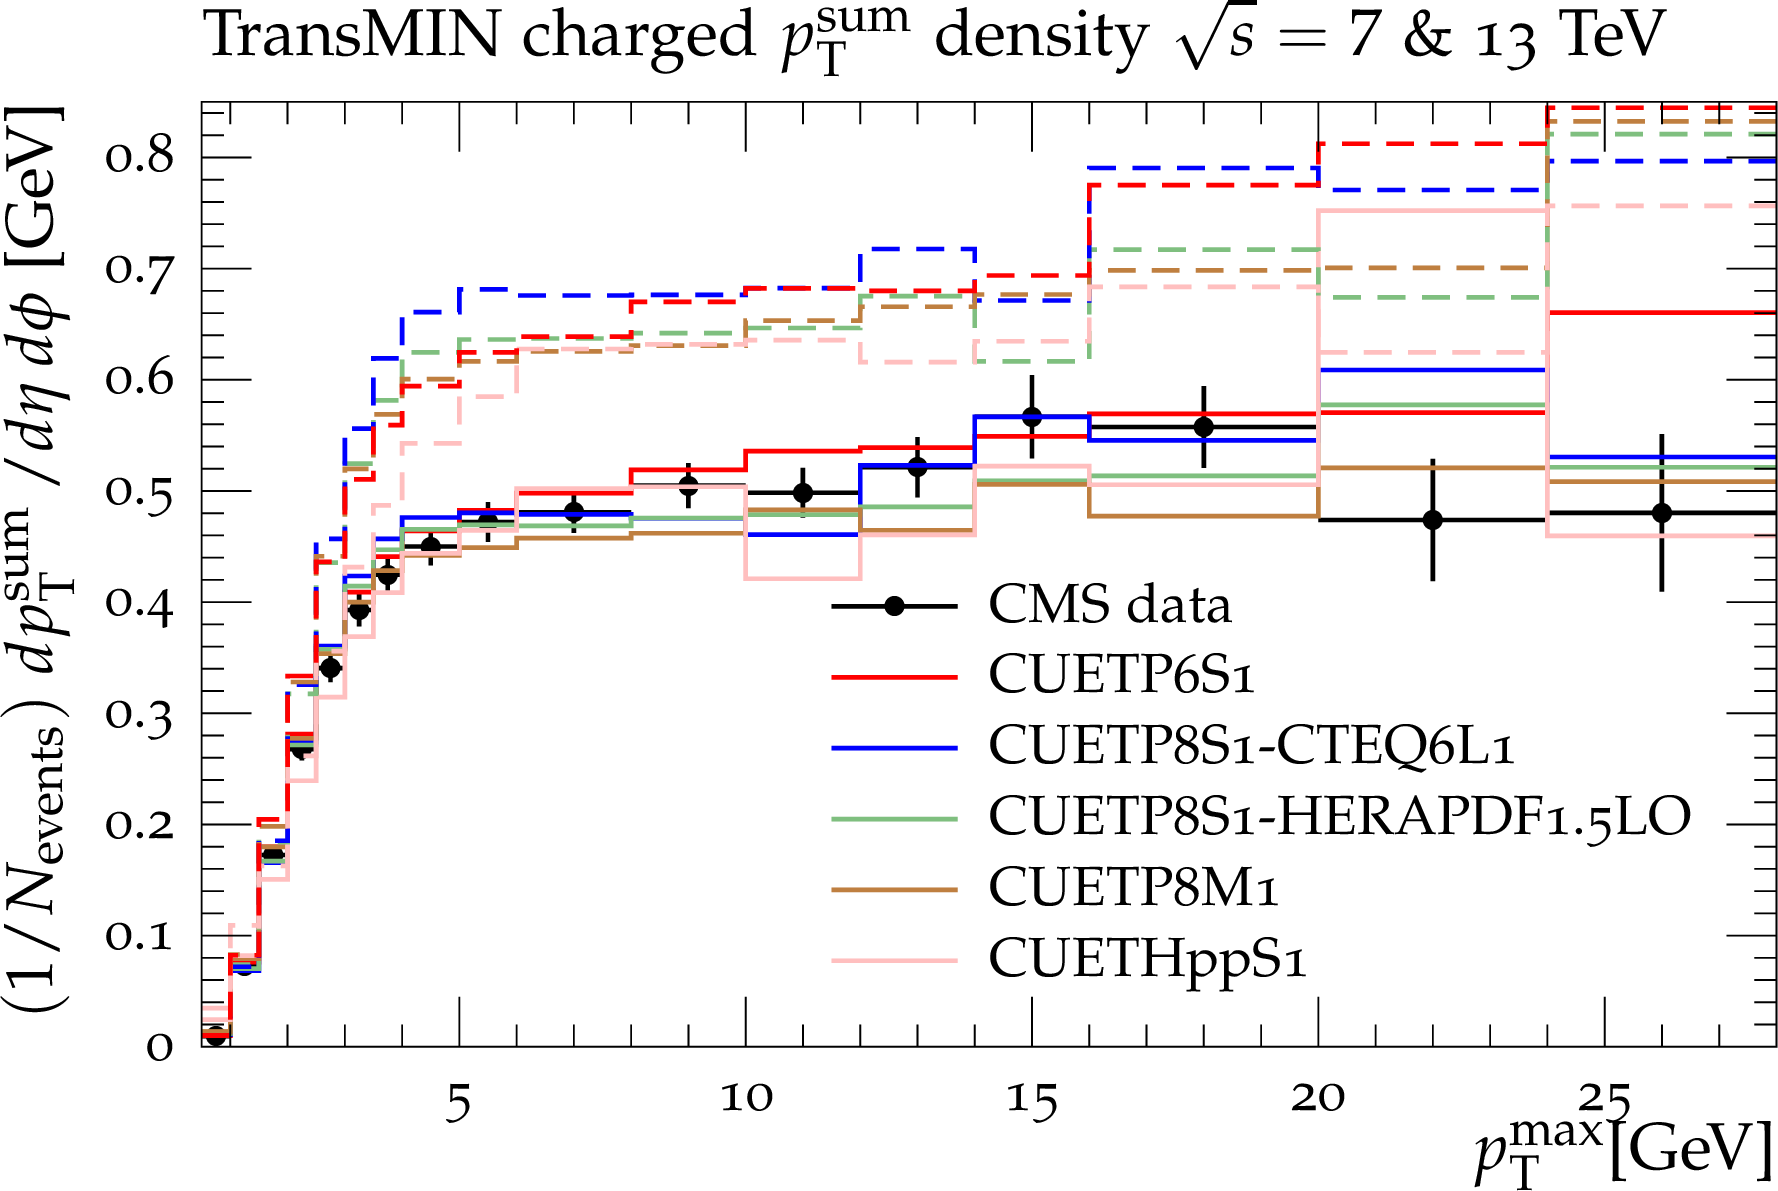
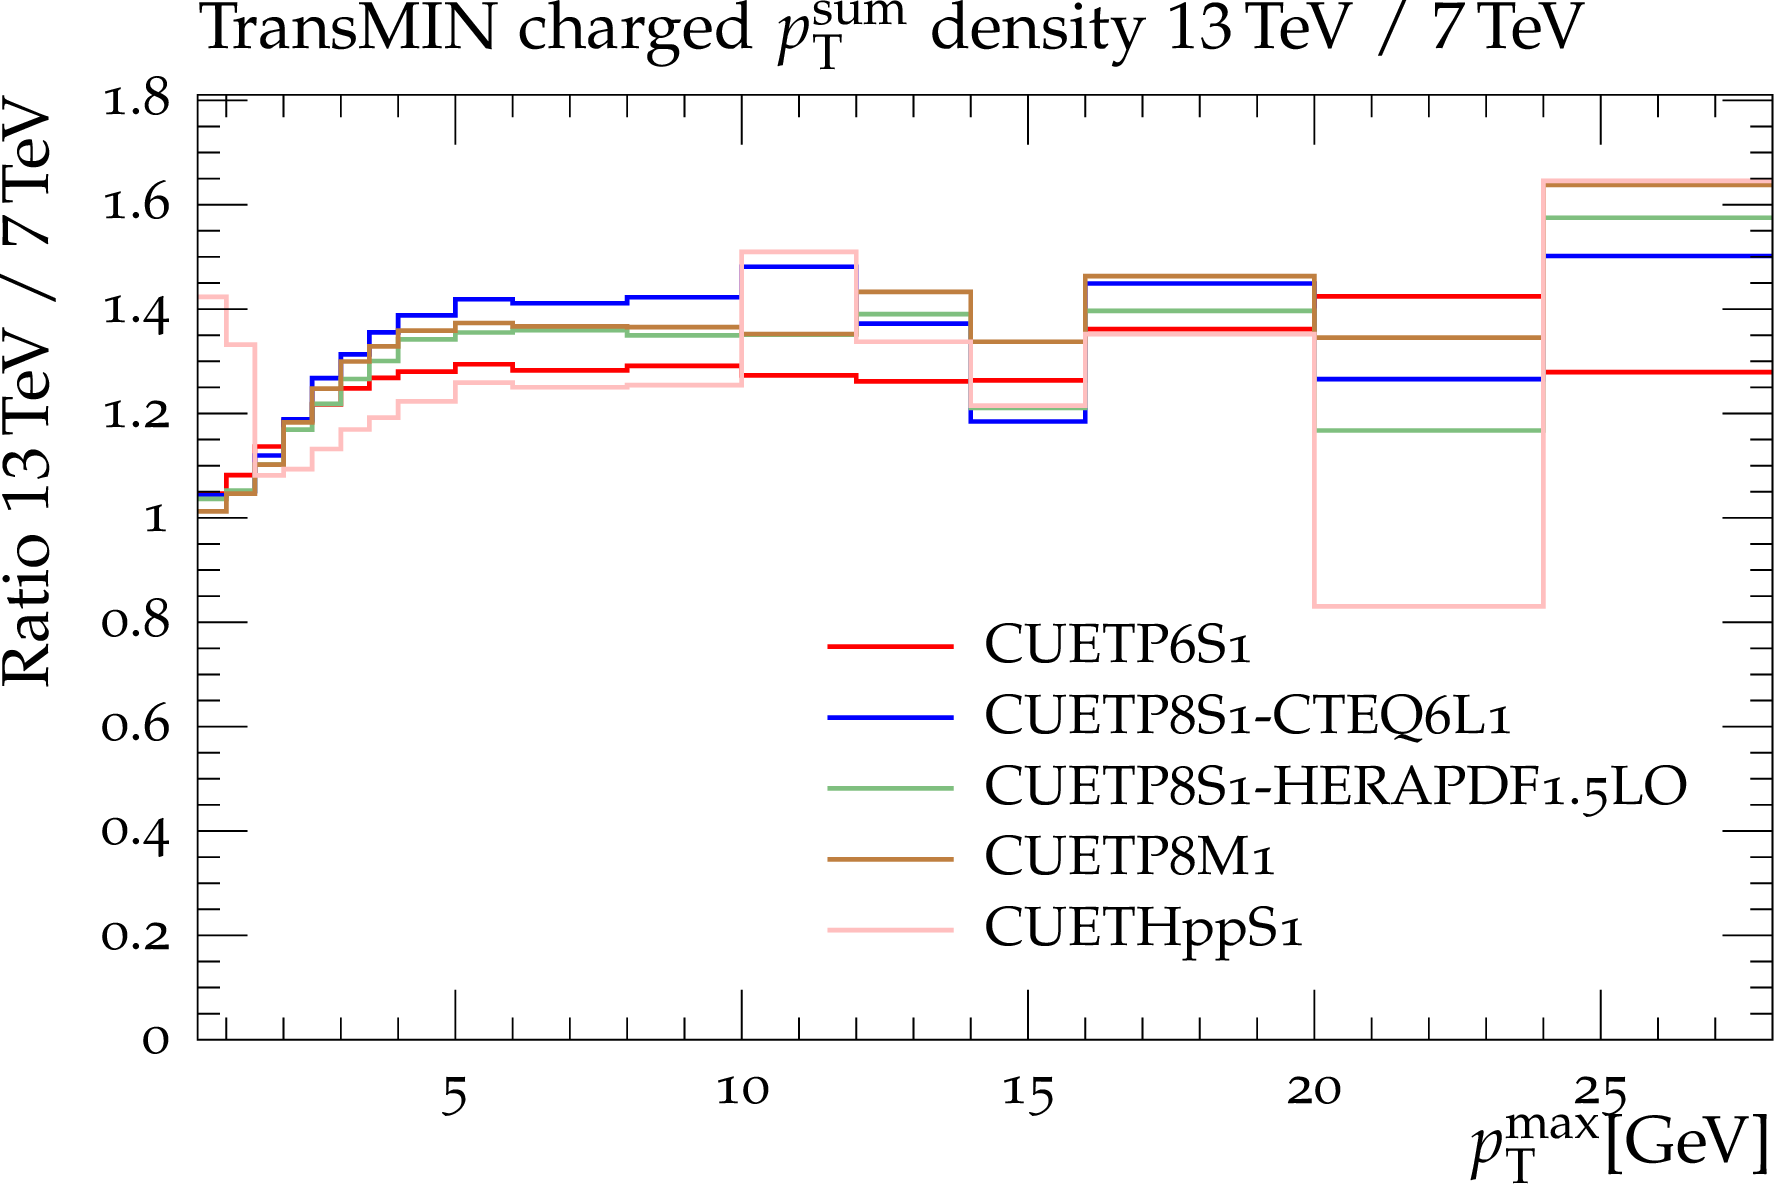
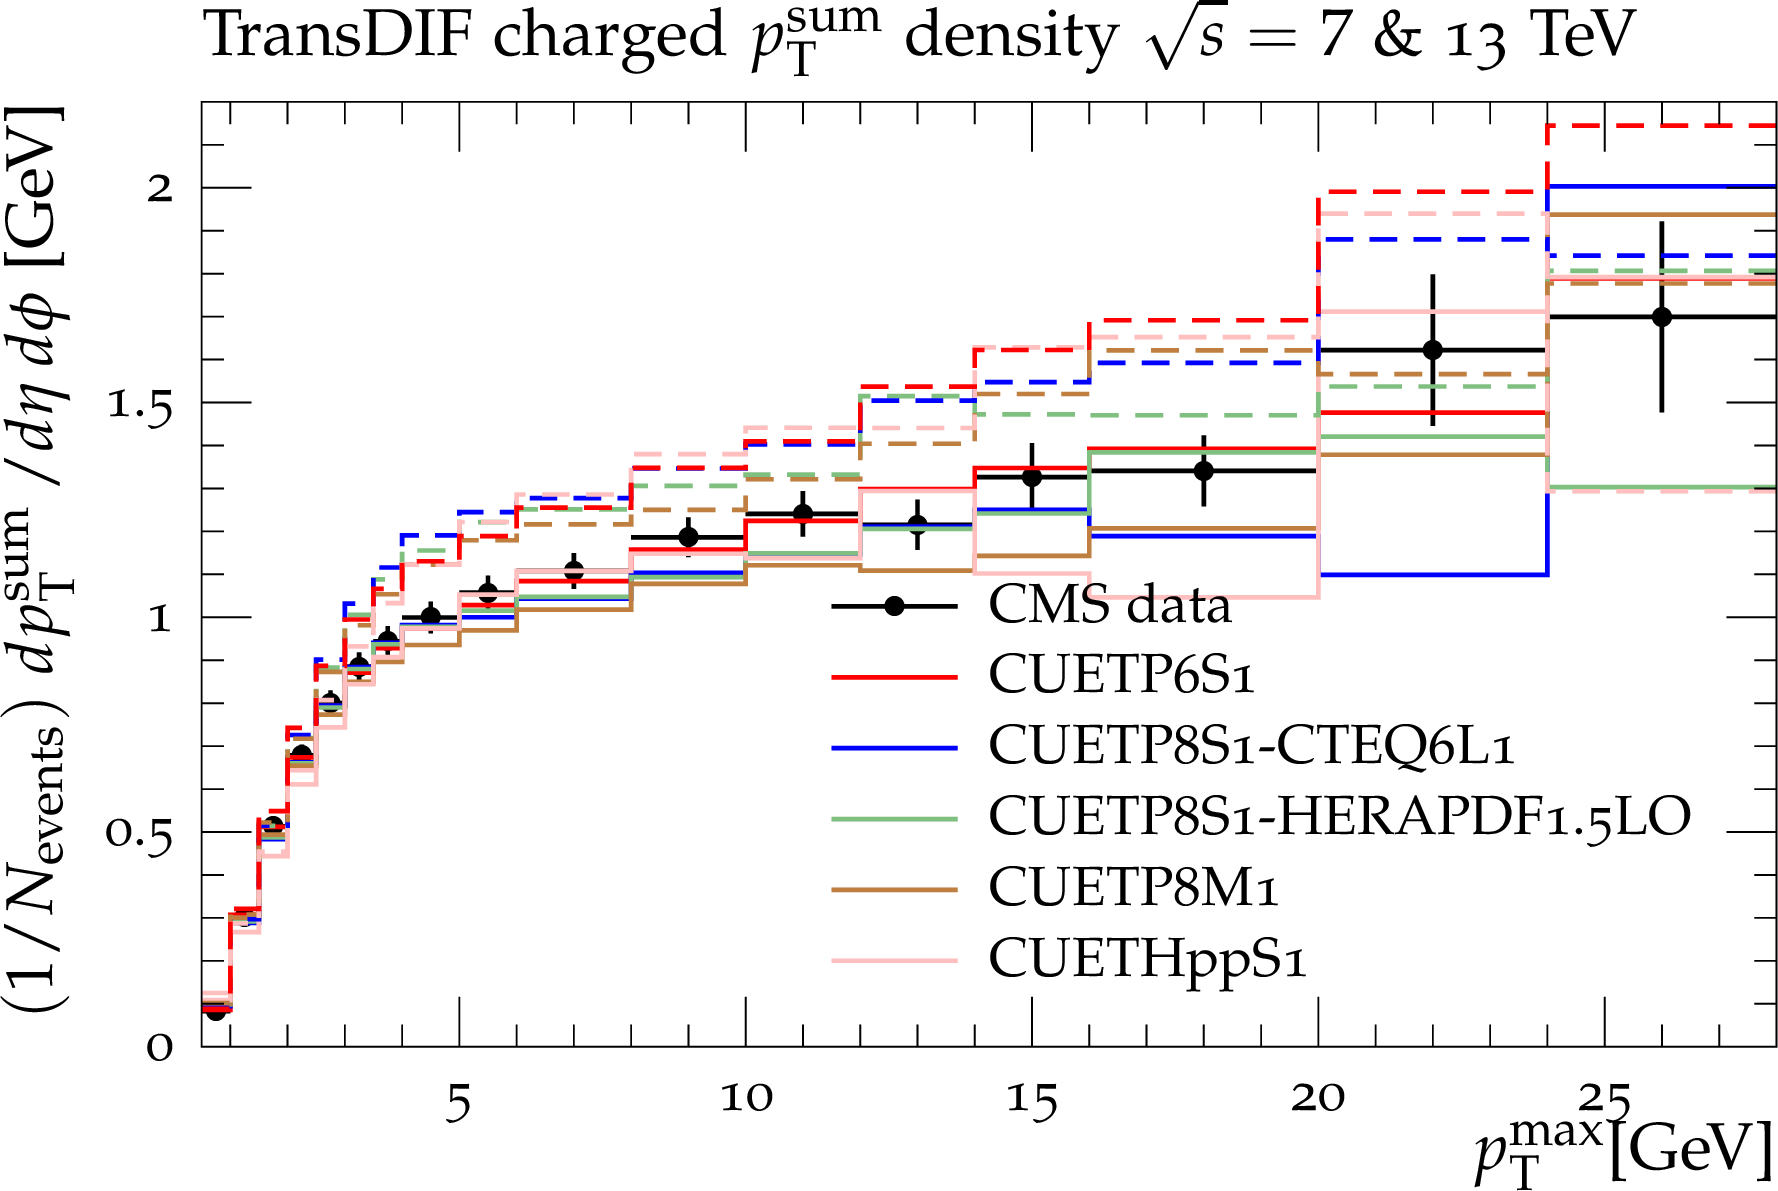
Charged $p_{\rm T}^{\rm sum}$\ density at $\sqrt {s}=$ 7 TeV for particles with $p_{\rm T}>$ 0.5 GeV and $|\eta |< $ 0.8 in the TransMIN (a,b), TransMAX (c,d), and TransDIF (e,f) regions, as defined by the leading charged particle, as a function of the leading charged-particle $p_{\rm T}^{\rm max}$. The data are compared to PYTHIA6 using CUETP6S1-CTEQ6L1, to PYTHIA8 using CUETP8S1-CTEQ6L1, CUETP8S1-HERAPDF1.5LO, and CUETP8M1, and to HERWIG++\ using CUETHppS1. Also shown are the predictions (a,c,e) based on the CMS UE tunes at 13 TeV (dashed lines), and the ratio of the 13 TeV to 7 TeV results for the five tunes (b,d,f). |
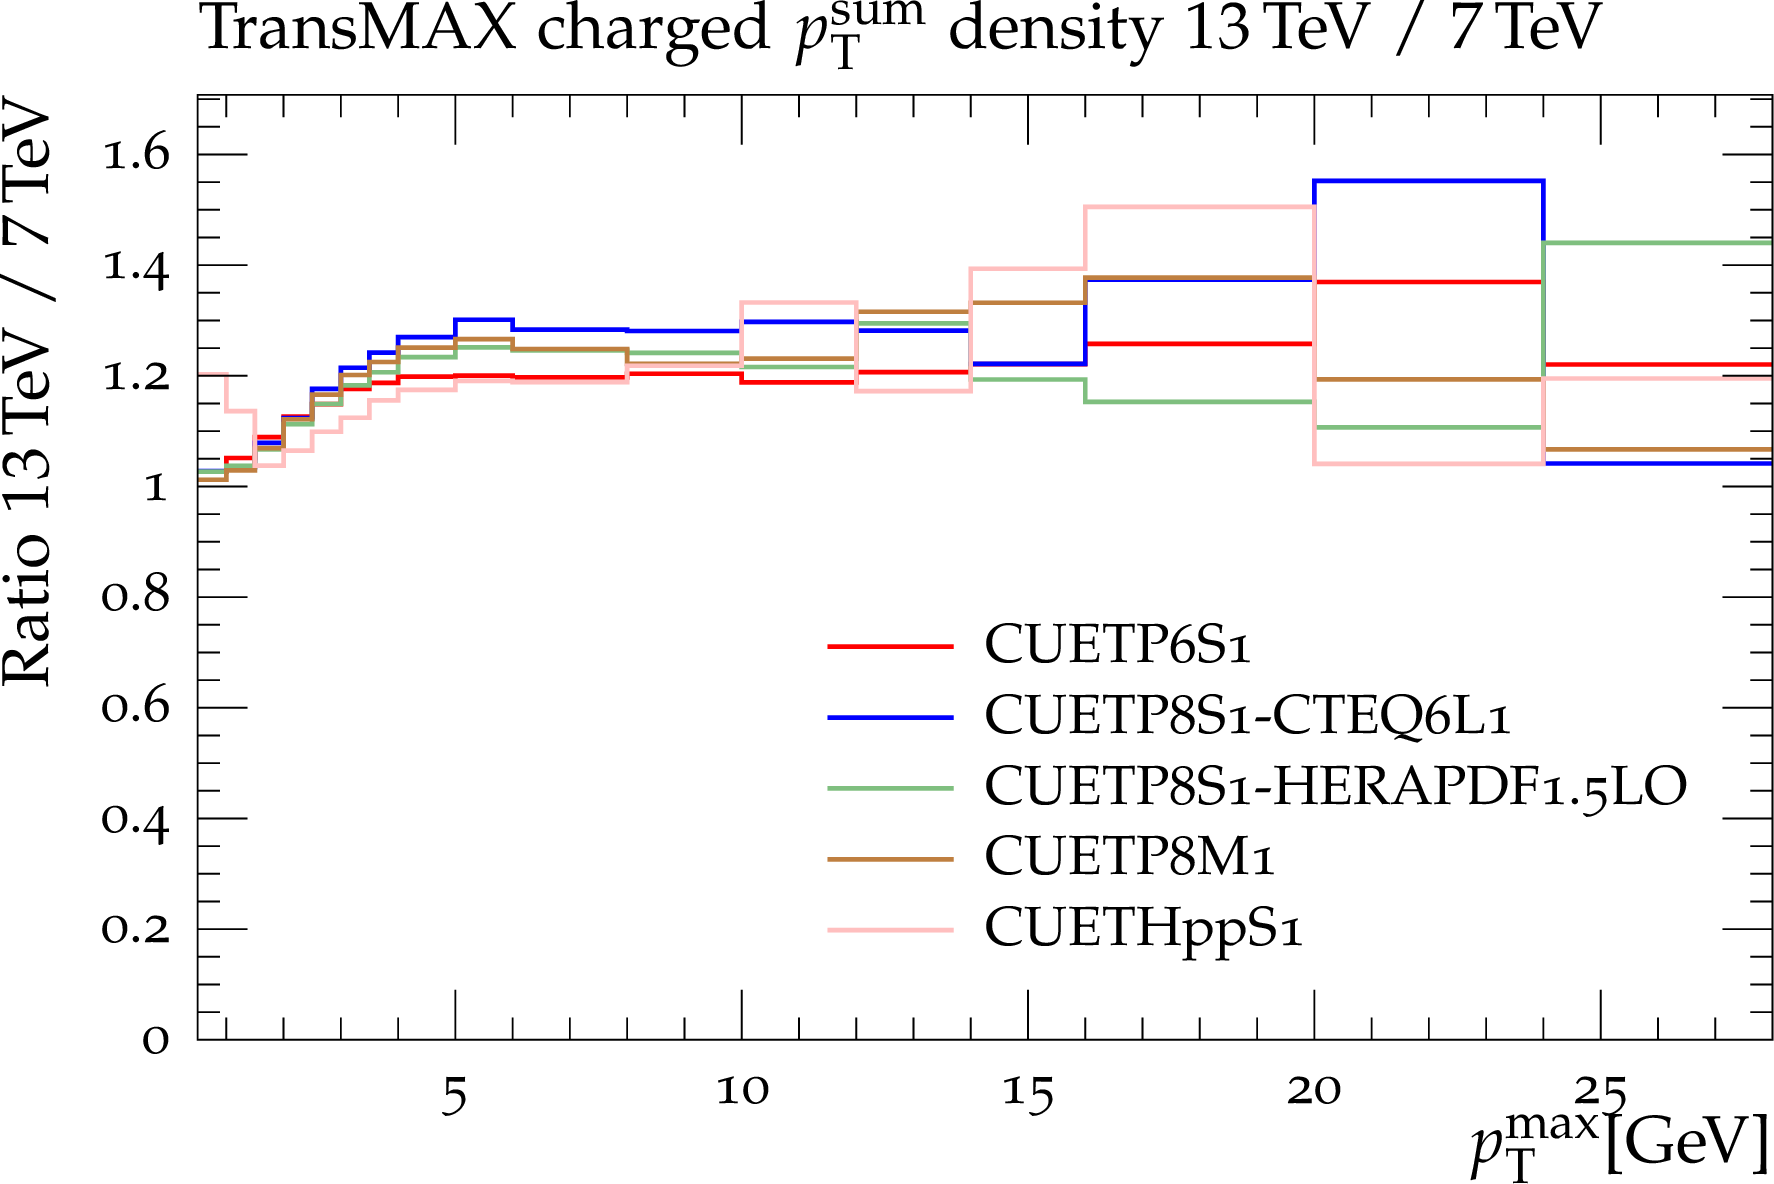
png pdf |
Figure 21-b:
Charged $p_{\rm T}^{\rm sum}$\ density at $\sqrt {s}=$ 7 TeV for particles with $p_{\rm T}>$ 0.5 GeV and $|\eta |< $ 0.8 in the TransMIN (a,b), TransMAX (c,d), and TransDIF (e,f) regions, as defined by the leading charged particle, as a function of the leading charged-particle $p_{\rm T}^{\rm max}$. The data are compared to PYTHIA6 using CUETP6S1-CTEQ6L1, to PYTHIA8 using CUETP8S1-CTEQ6L1, CUETP8S1-HERAPDF1.5LO, and CUETP8M1, and to HERWIG++\ using CUETHppS1. Also shown are the predictions (a,c,e) based on the CMS UE tunes at 13 TeV (dashed lines), and the ratio of the 13 TeV to 7 TeV results for the five tunes (b,d,f). |
png pdf |
Figure 21-c:
Charged $p_{\rm T}^{\rm sum}$\ density at $\sqrt {s}=$ 7 TeV for particles with $p_{\rm T}>$ 0.5 GeV and $|\eta |< $ 0.8 in the TransMIN (a,b), TransMAX (c,d), and TransDIF (e,f) regions, as defined by the leading charged particle, as a function of the leading charged-particle $p_{\rm T}^{\rm max}$. The data are compared to PYTHIA6 using CUETP6S1-CTEQ6L1, to PYTHIA8 using CUETP8S1-CTEQ6L1, CUETP8S1-HERAPDF1.5LO, and CUETP8M1, and to HERWIG++\ using CUETHppS1. Also shown are the predictions (a,c,e) based on the CMS UE tunes at 13 TeV (dashed lines), and the ratio of the 13 TeV to 7 TeV results for the five tunes (b,d,f). |
png pdf |
Figure 21-d:
Charged $p_{\rm T}^{\rm sum}$\ density at $\sqrt {s}=$ 7 TeV for particles with $p_{\rm T}>$ 0.5 GeV and $|\eta |< $ 0.8 in the TransMIN (a,b), TransMAX (c,d), and TransDIF (e,f) regions, as defined by the leading charged particle, as a function of the leading charged-particle $p_{\rm T}^{\rm max}$. The data are compared to PYTHIA6 using CUETP6S1-CTEQ6L1, to PYTHIA8 using CUETP8S1-CTEQ6L1, CUETP8S1-HERAPDF1.5LO, and CUETP8M1, and to HERWIG++\ using CUETHppS1. Also shown are the predictions (a,c,e) based on the CMS UE tunes at 13 TeV (dashed lines), and the ratio of the 13 TeV to 7 TeV results for the five tunes (b,d,f). |
png pdf |
Figure 21-e:
Charged $p_{\rm T}^{\rm sum}$\ density at $\sqrt {s}=$ 7 TeV for particles with $p_{\rm T}>$ 0.5 GeV and $|\eta |< $ 0.8 in the TransMIN (a,b), TransMAX (c,d), and TransDIF (e,f) regions, as defined by the leading charged particle, as a function of the leading charged-particle $p_{\rm T}^{\rm max}$. The data are compared to PYTHIA6 using CUETP6S1-CTEQ6L1, to PYTHIA8 using CUETP8S1-CTEQ6L1, CUETP8S1-HERAPDF1.5LO, and CUETP8M1, and to HERWIG++\ using CUETHppS1. Also shown are the predictions (a,c,e) based on the CMS UE tunes at 13 TeV (dashed lines), and the ratio of the 13 TeV to 7 TeV results for the five tunes (b,d,f). |
png pdf |
Figure 21-f:
Charged $p_{\rm T}^{\rm sum}$\ density at $\sqrt {s}=$ 7 TeV for particles with $p_{\rm T}>$ 0.5 GeV and $|\eta |< $ 0.8 in the TransMIN (a,b), TransMAX (c,d), and TransDIF (e,f) regions, as defined by the leading charged particle, as a function of the leading charged-particle $p_{\rm T}^{\rm max}$. The data are compared to PYTHIA6 using CUETP6S1-CTEQ6L1, to PYTHIA8 using CUETP8S1-CTEQ6L1, CUETP8S1-HERAPDF1.5LO, and CUETP8M1, and to HERWIG++\ using CUETHppS1. Also shown are the predictions (a,c,e) based on the CMS UE tunes at 13 TeV (dashed lines), and the ratio of the 13 TeV to 7 TeV results for the five tunes (b,d,f). |
png pdf |
Figure 22:
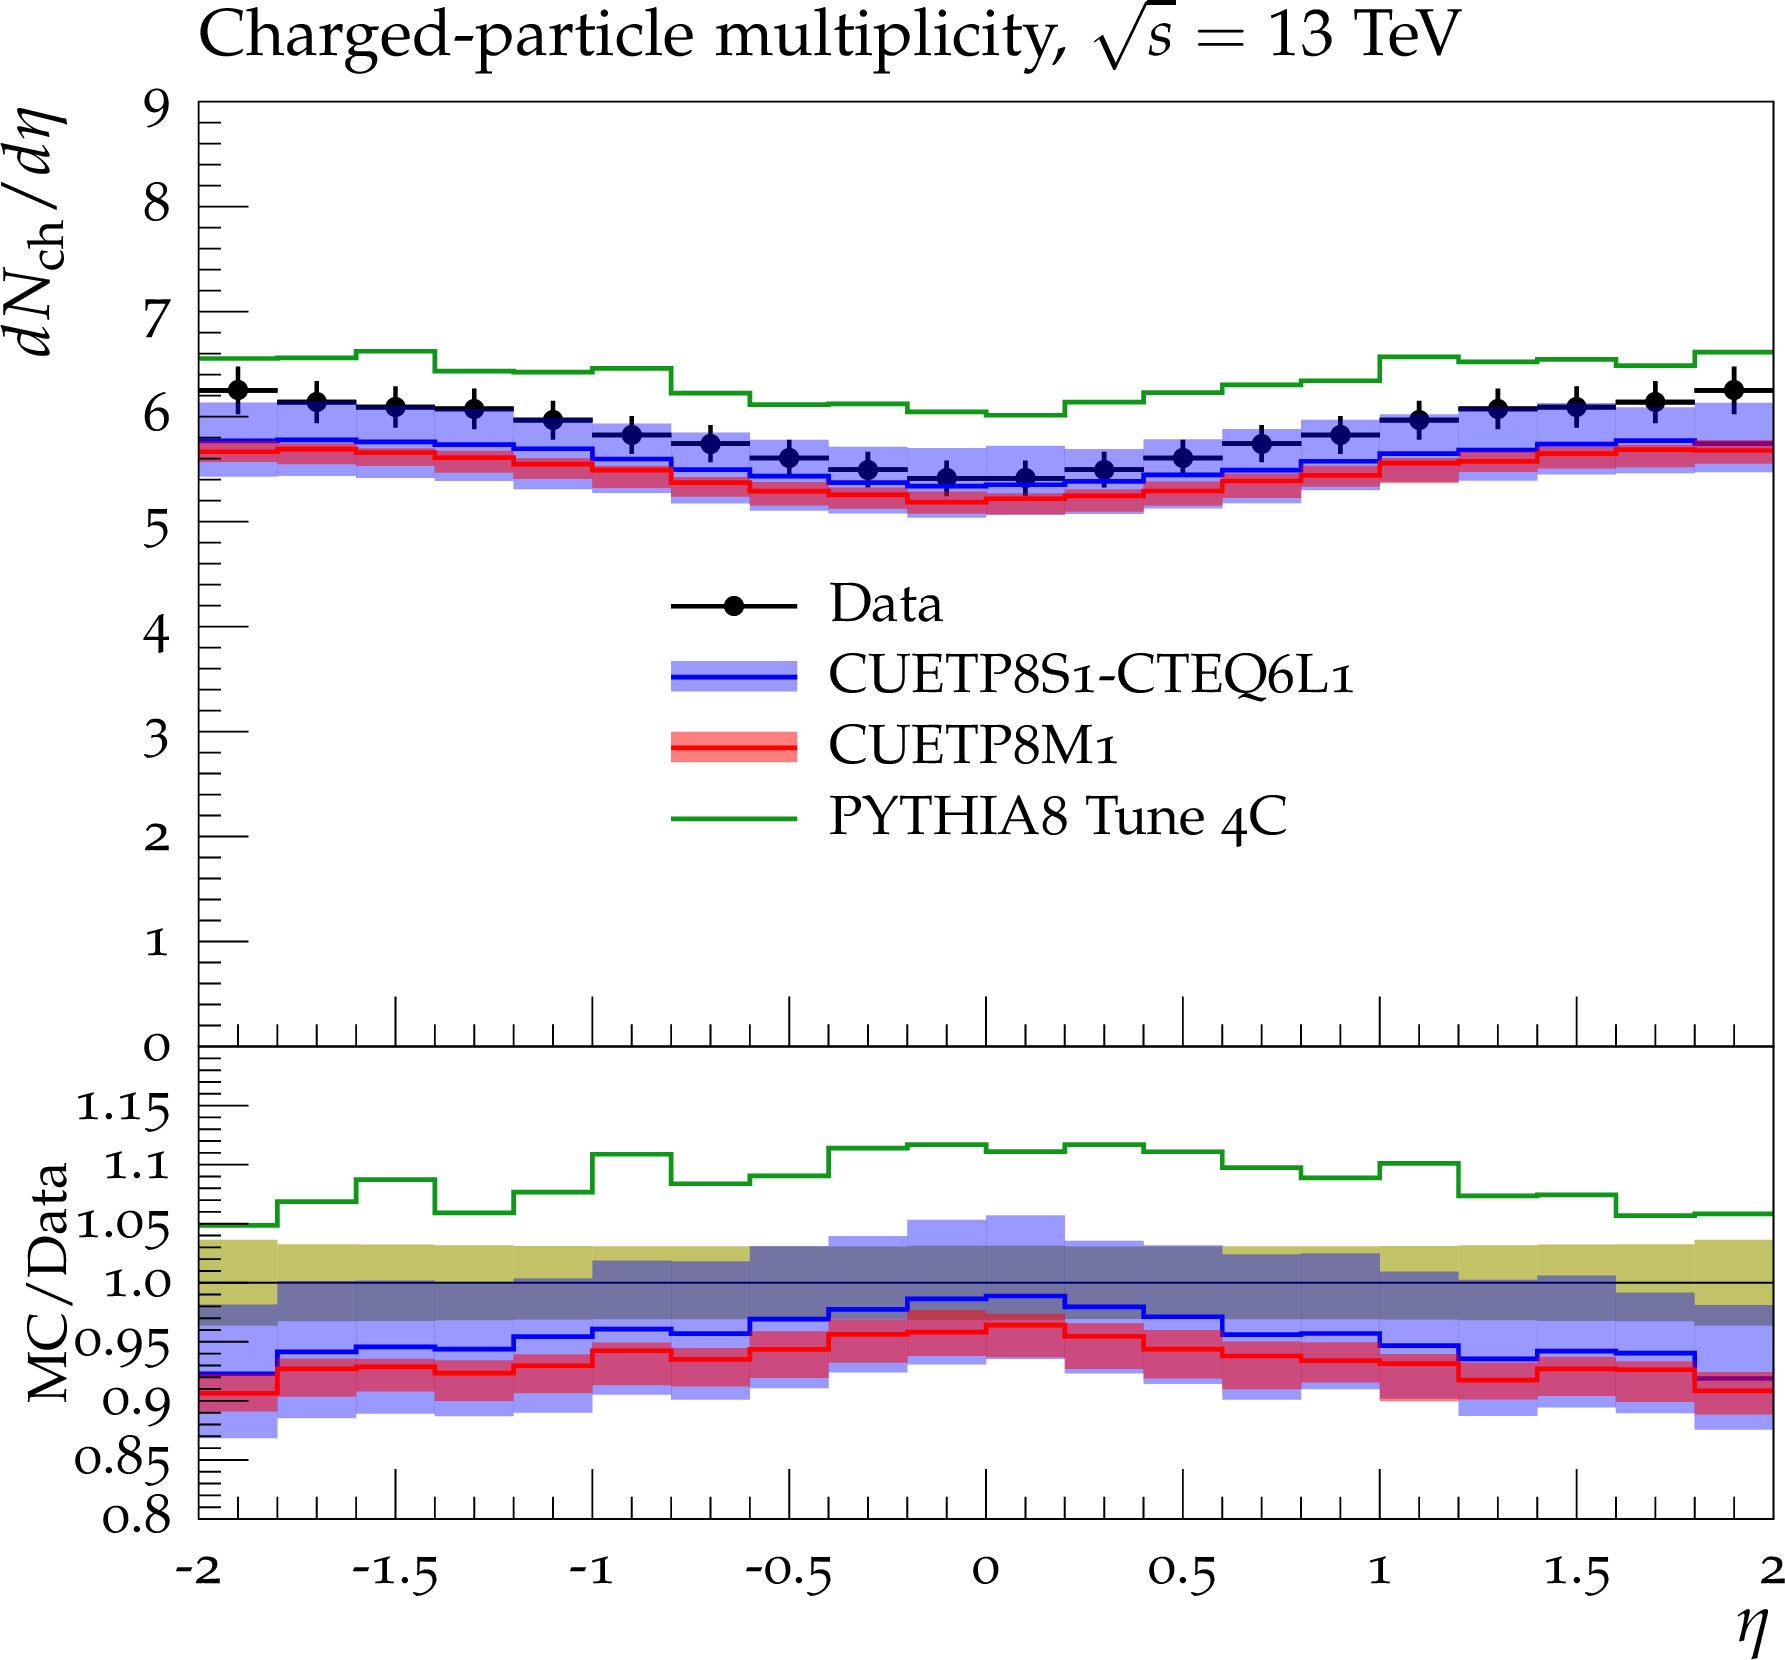
CMS data at $\sqrt {s}=$ 13 TeV[53] for the charged-particle pseudorapidity distribution, $ {\mathrm {d}}\mathrm {N}_{\text {ch}}/ {\mathrm {d}}\eta $, in inelastic proton-proton collisions. The data are compared to predictions of PYTHIA8 using CUETP8S1-CTEQ6L1, CUETP8M1, and Tune 4C. The predictions based on CUETP8S1-CTEQ6L1 and CUETP8M1 are shown with an error band corresponding to the total uncertainty obtained from the eigentunes. Also shown are the ratios of these predictions to the data. The green band represents the total experimental uncertainty on the data. |
png pdf |
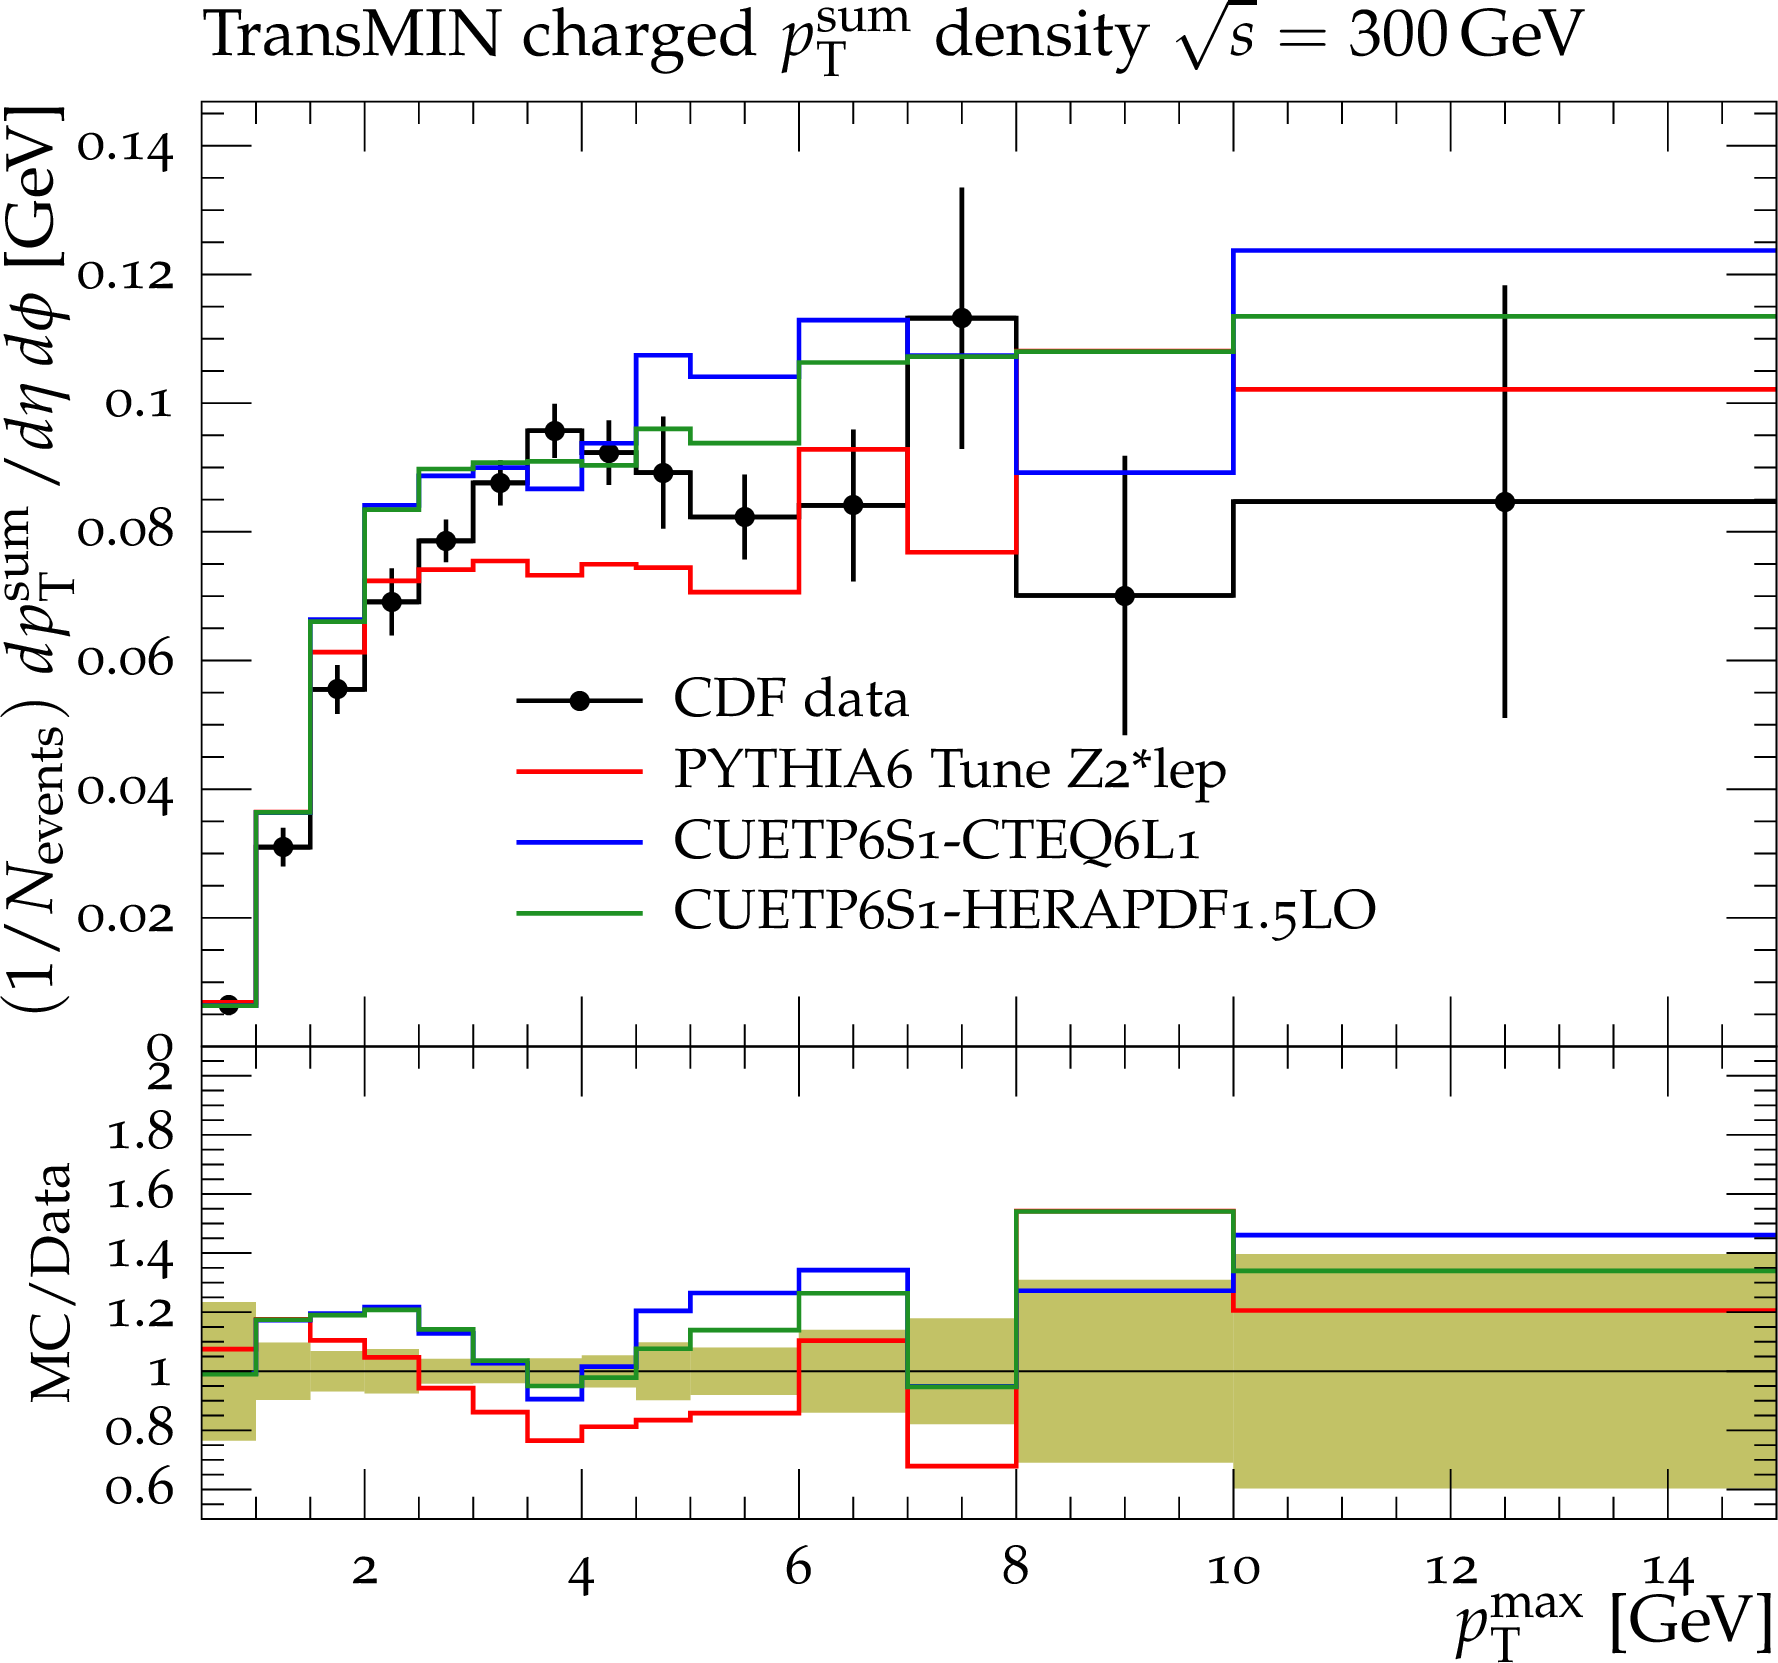
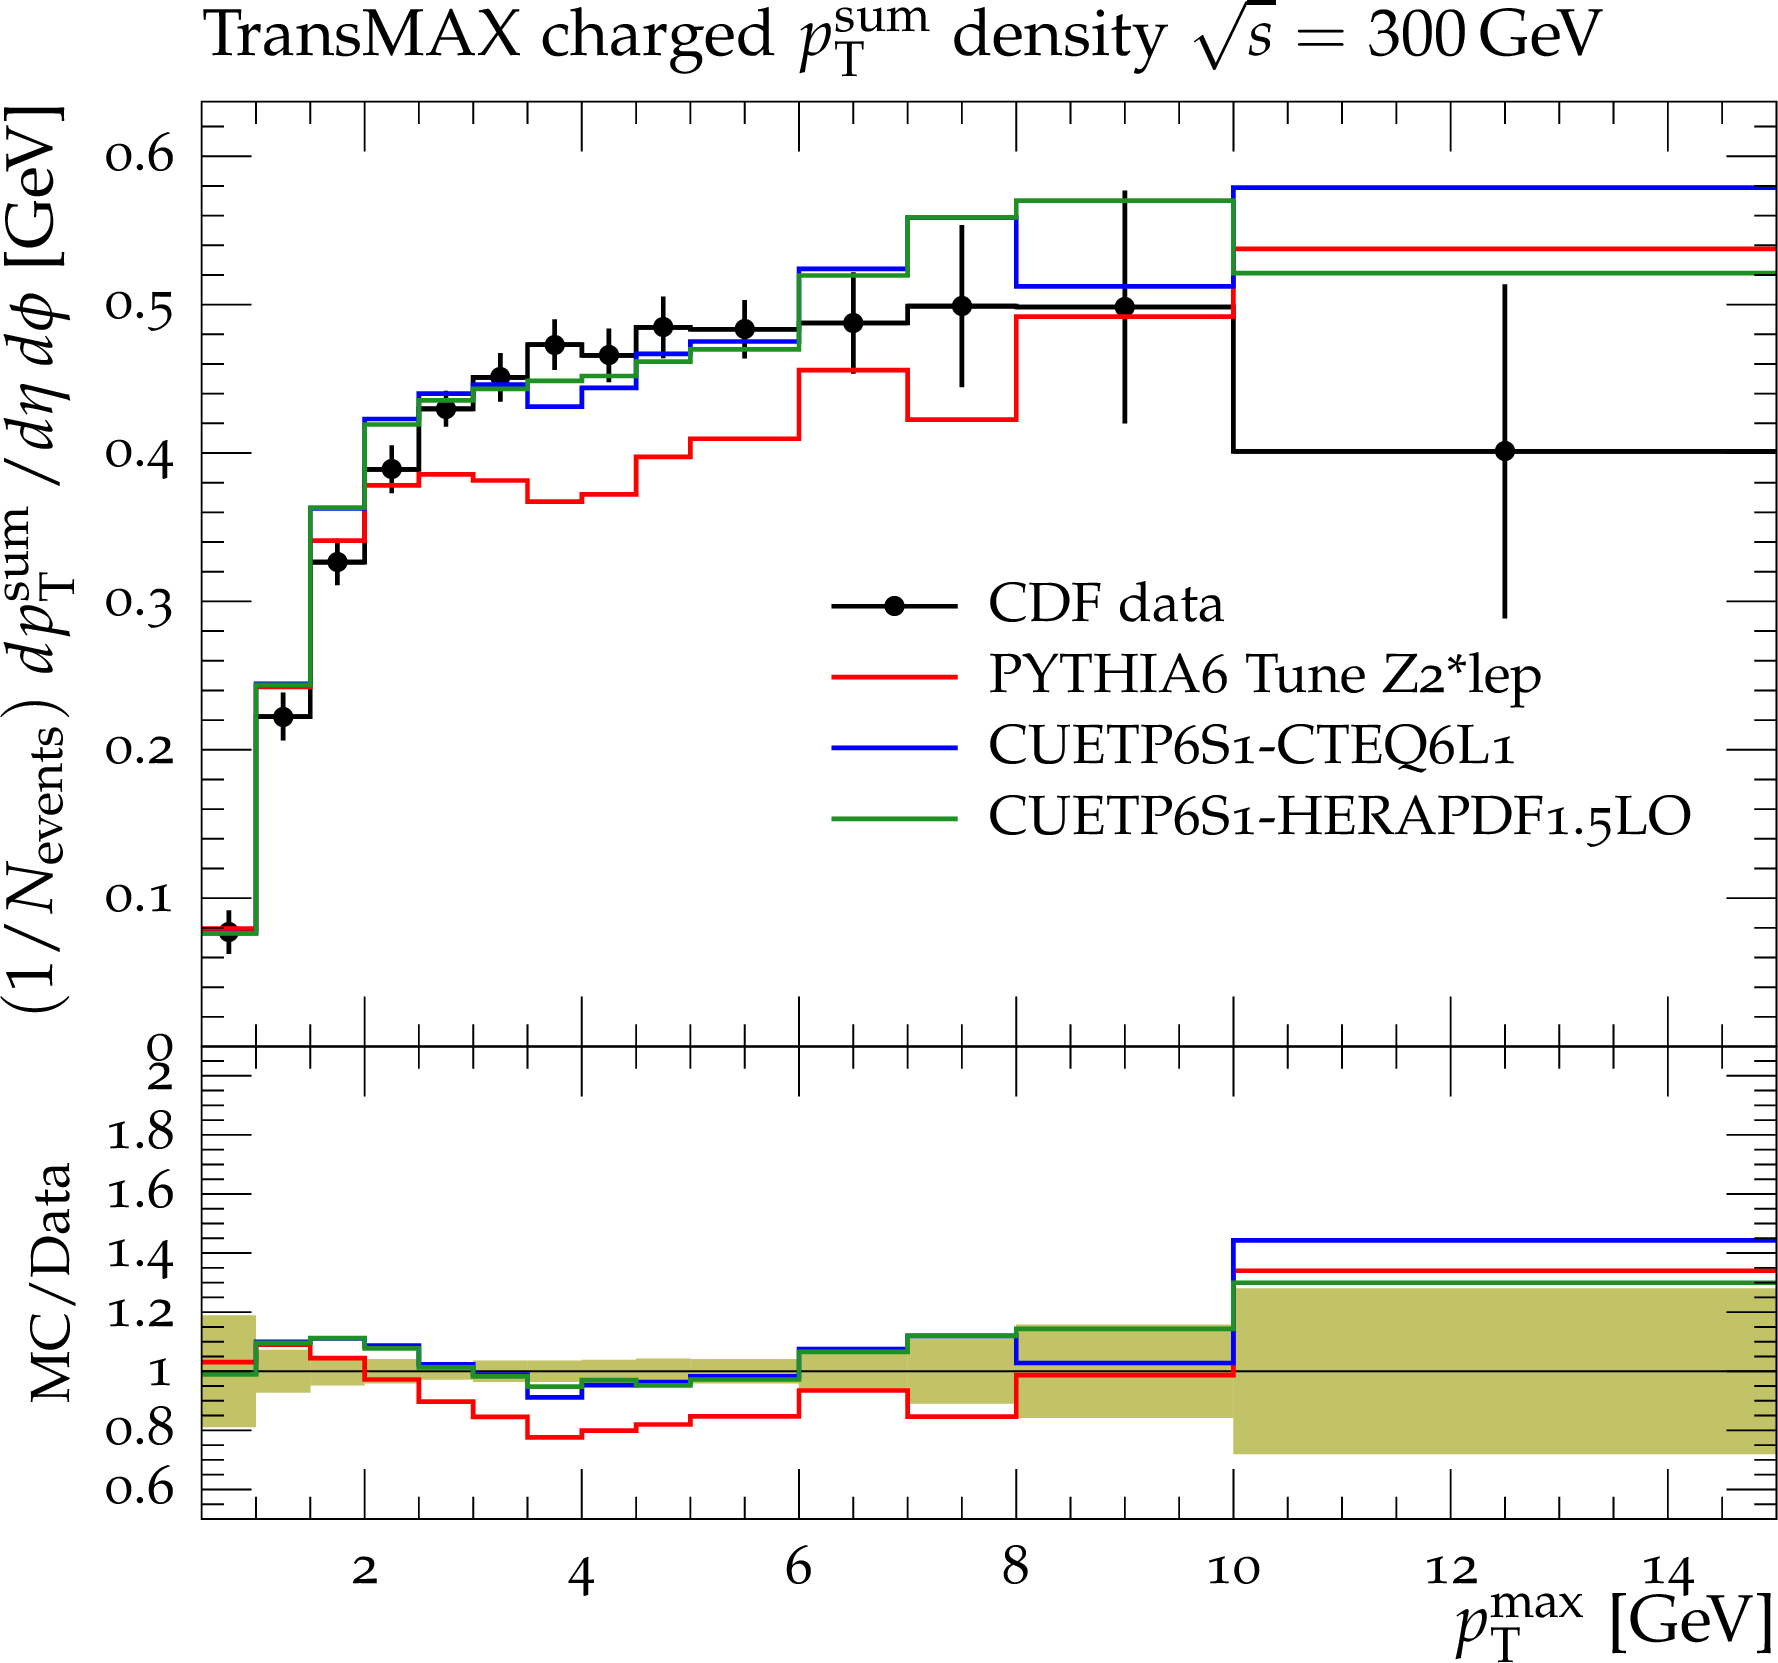
Figure 23-a:
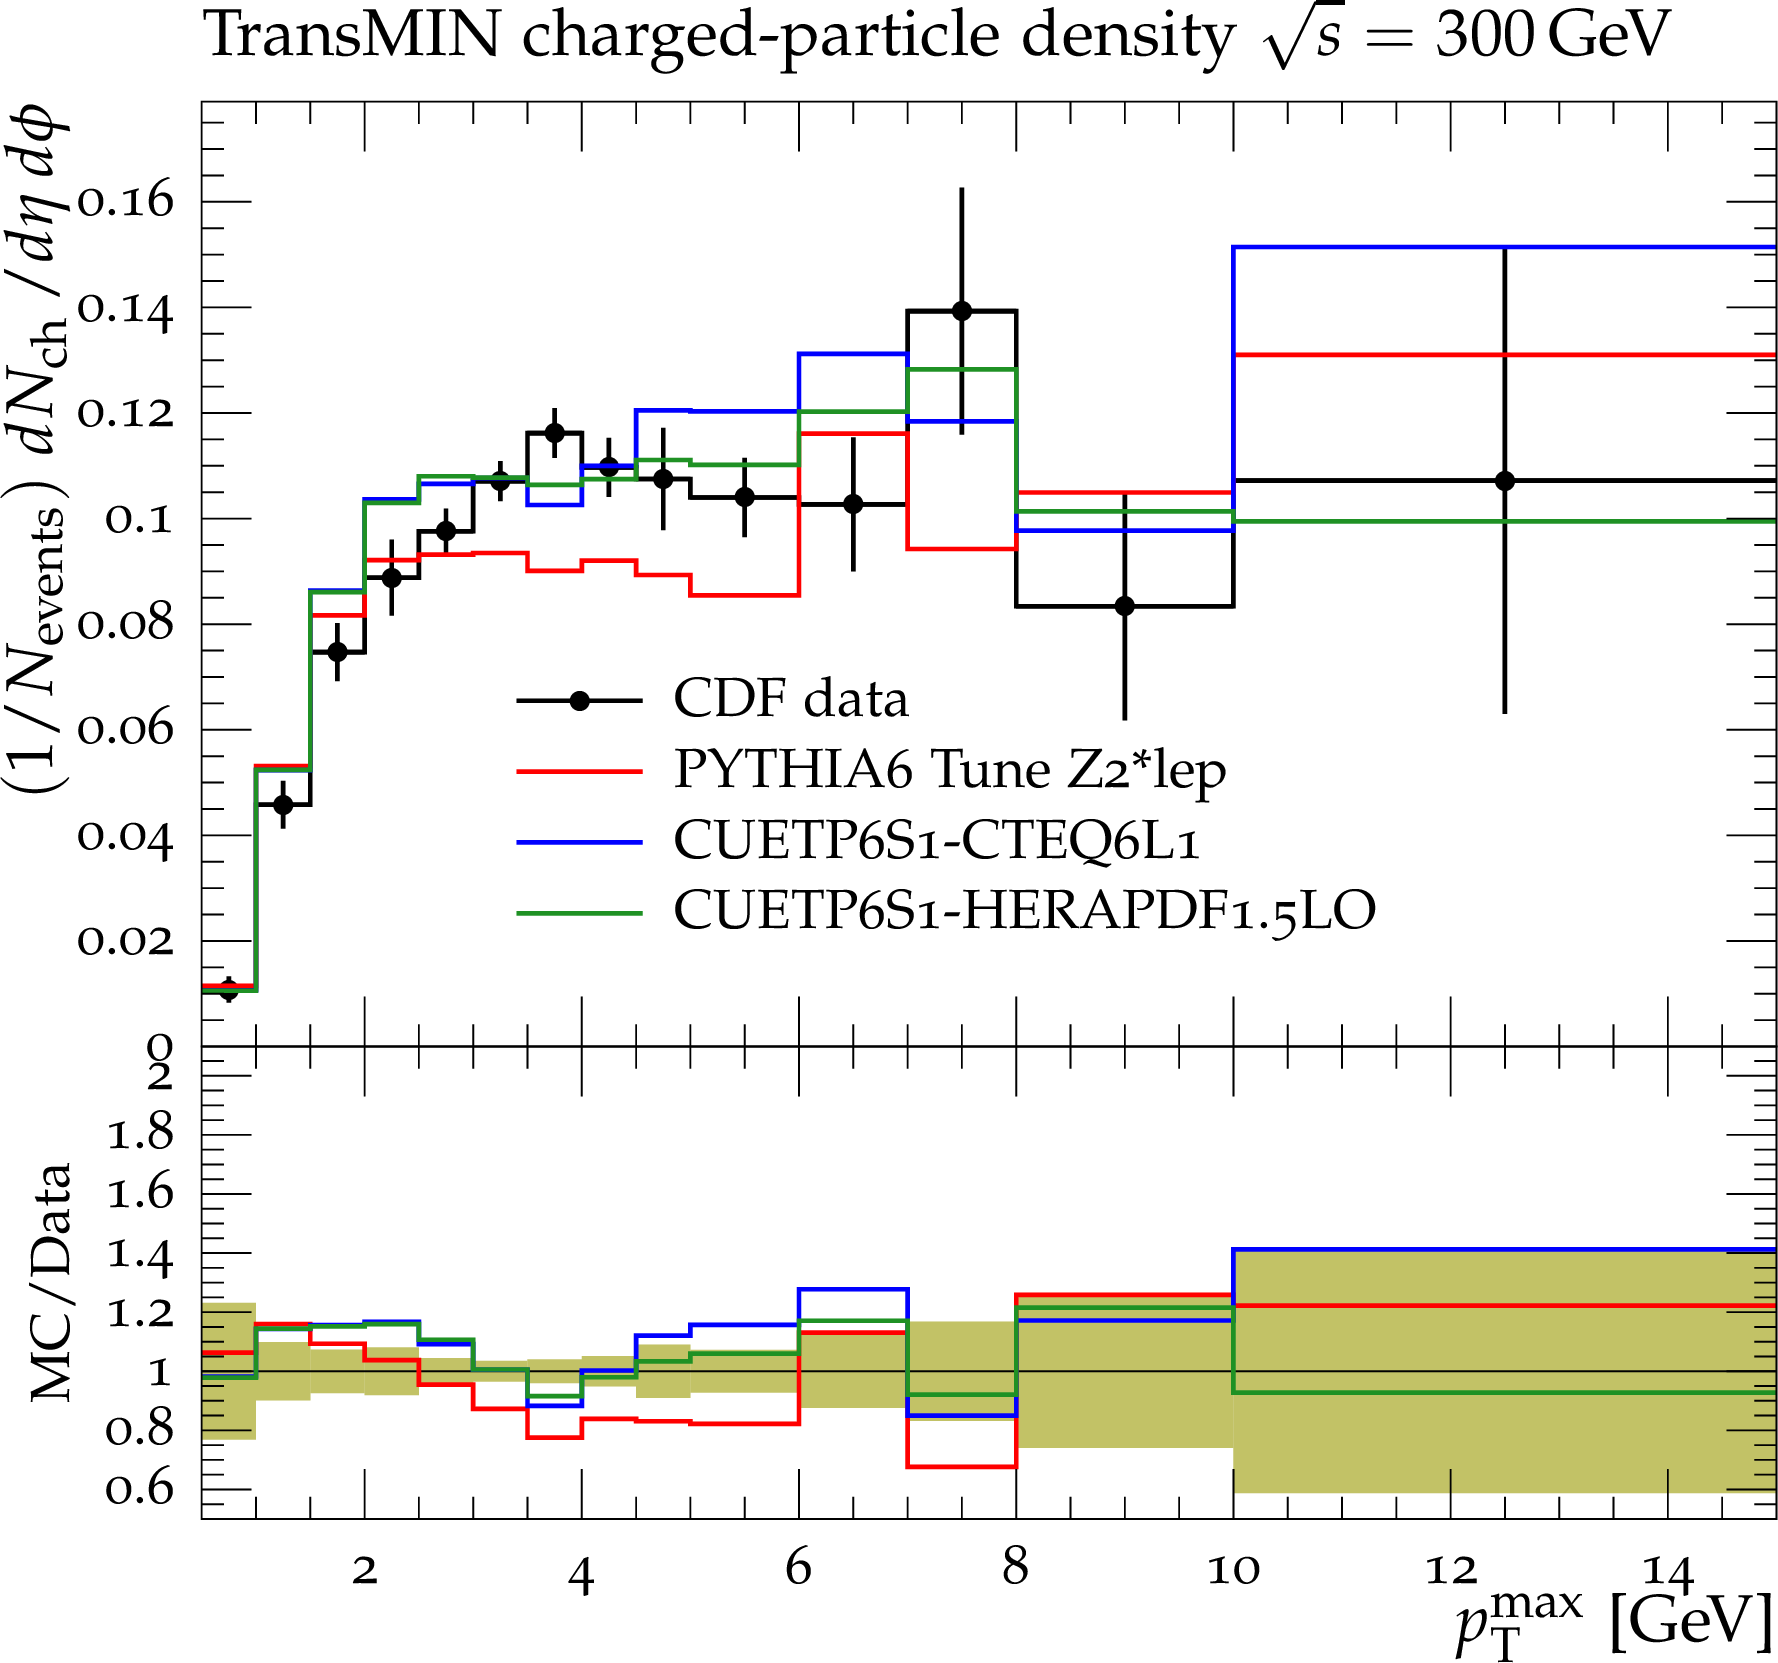
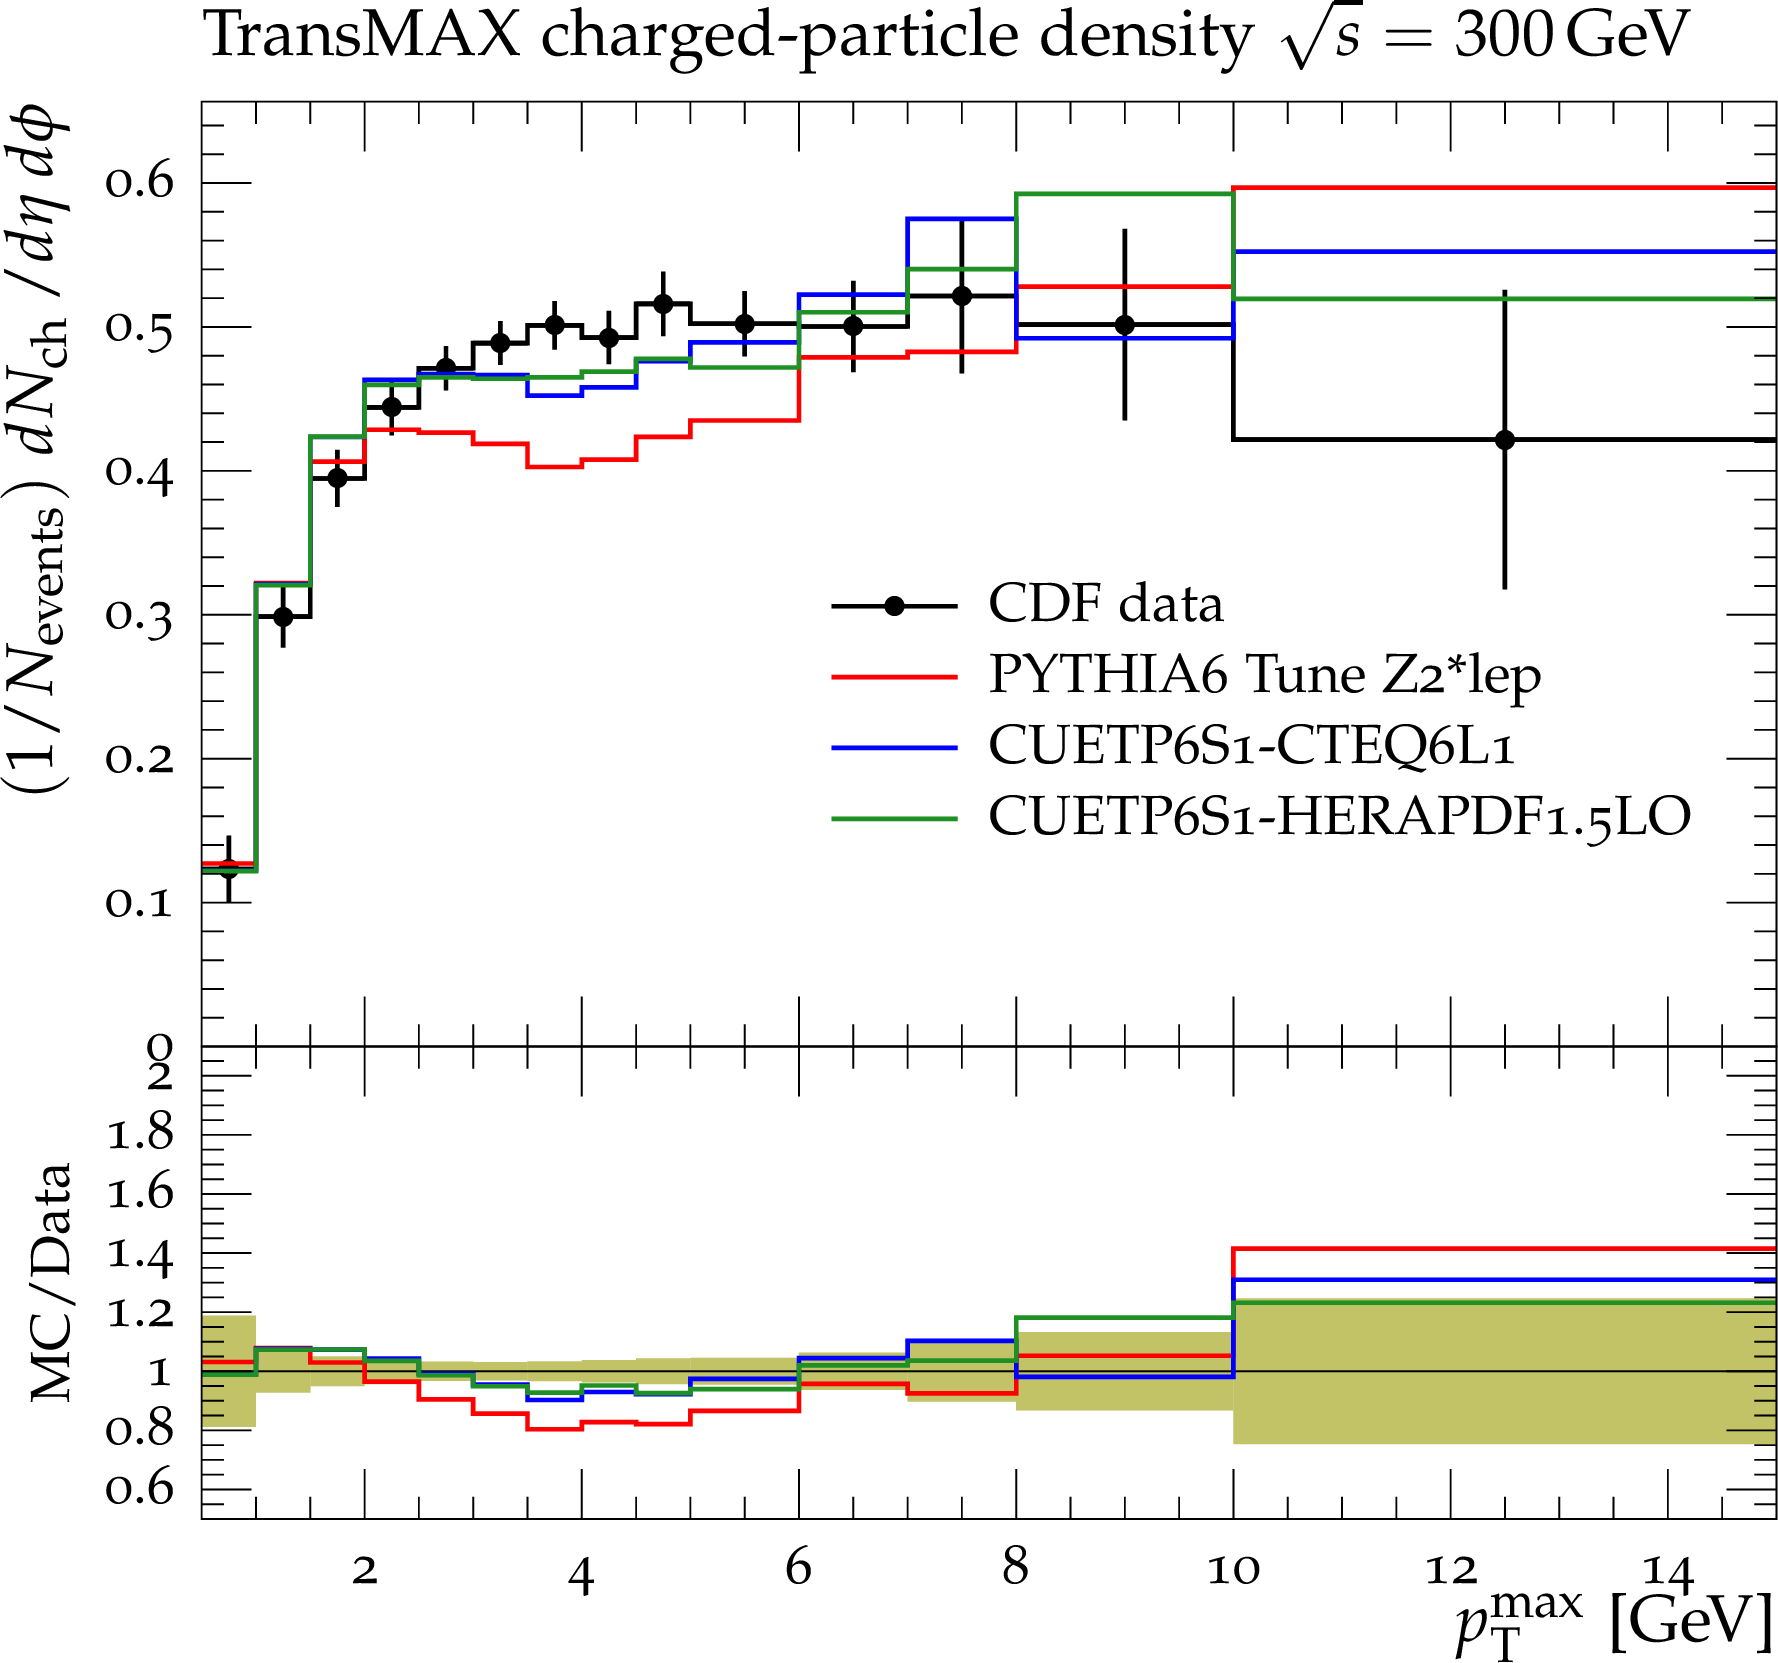
CDF data at $\sqrt {s}= $300 GeV[11] on the particle (a,b) and $p_{\rm T}^{\rm sum}$\ densities (c,d) for charged particles with $p_{\rm T}> $ 0.5 GeV and $|\eta |<$ 0.8 in the TransMIN (a,c) and TransMAX\ (b,d) regions as defined by the leading charged particle, as a function of the transverse momentum of the leading charged-particle $p_{\rm T}^{\rm max}$. The data are compared to the PYTHIA6 Tune Z$2^*$lep, CUETP6S1-CTEQ6L1 and CUETP6S1-HERAPDF1.5LO. The green bands in the ratios represent the total experimental uncertainties. |
png pdf |
Figure 23-b:
CDF data at $\sqrt {s}= $300 GeV[11] on the particle (a,b) and $p_{\rm T}^{\rm sum}$\ densities (c,d) for charged particles with $p_{\rm T}> $ 0.5 GeV and $|\eta |<$ 0.8 in the TransMIN (a,c) and TransMAX\ (b,d) regions as defined by the leading charged particle, as a function of the transverse momentum of the leading charged-particle $p_{\rm T}^{\rm max}$. The data are compared to the PYTHIA6 Tune Z$2^*$lep, CUETP6S1-CTEQ6L1 and CUETP6S1-HERAPDF1.5LO. The green bands in the ratios represent the total experimental uncertainties. |
png pdf |
Figure 23-c:
CDF data at $\sqrt {s}= $300 GeV[11] on the particle (a,b) and $p_{\rm T}^{\rm sum}$\ densities (c,d) for charged particles with $p_{\rm T}> $ 0.5 GeV and $|\eta |<$ 0.8 in the TransMIN (a,c) and TransMAX\ (b,d) regions as defined by the leading charged particle, as a function of the transverse momentum of the leading charged-particle $p_{\rm T}^{\rm max}$. The data are compared to the PYTHIA6 Tune Z$2^*$lep, CUETP6S1-CTEQ6L1 and CUETP6S1-HERAPDF1.5LO. The green bands in the ratios represent the total experimental uncertainties. |
png pdf |
Figure 23-d:
CDF data at $\sqrt {s}= $300 GeV[11] on the particle (a,b) and $p_{\rm T}^{\rm sum}$\ densities (c,d) for charged particles with $p_{\rm T}> $ 0.5 GeV and $|\eta |<$ 0.8 in the TransMIN (a,c) and TransMAX\ (b,d) regions as defined by the leading charged particle, as a function of the transverse momentum of the leading charged-particle $p_{\rm T}^{\rm max}$. The data are compared to the PYTHIA6 Tune Z$2^*$lep, CUETP6S1-CTEQ6L1 and CUETP6S1-HERAPDF1.5LO. The green bands in the ratios represent the total experimental uncertainties. |
png pdf |
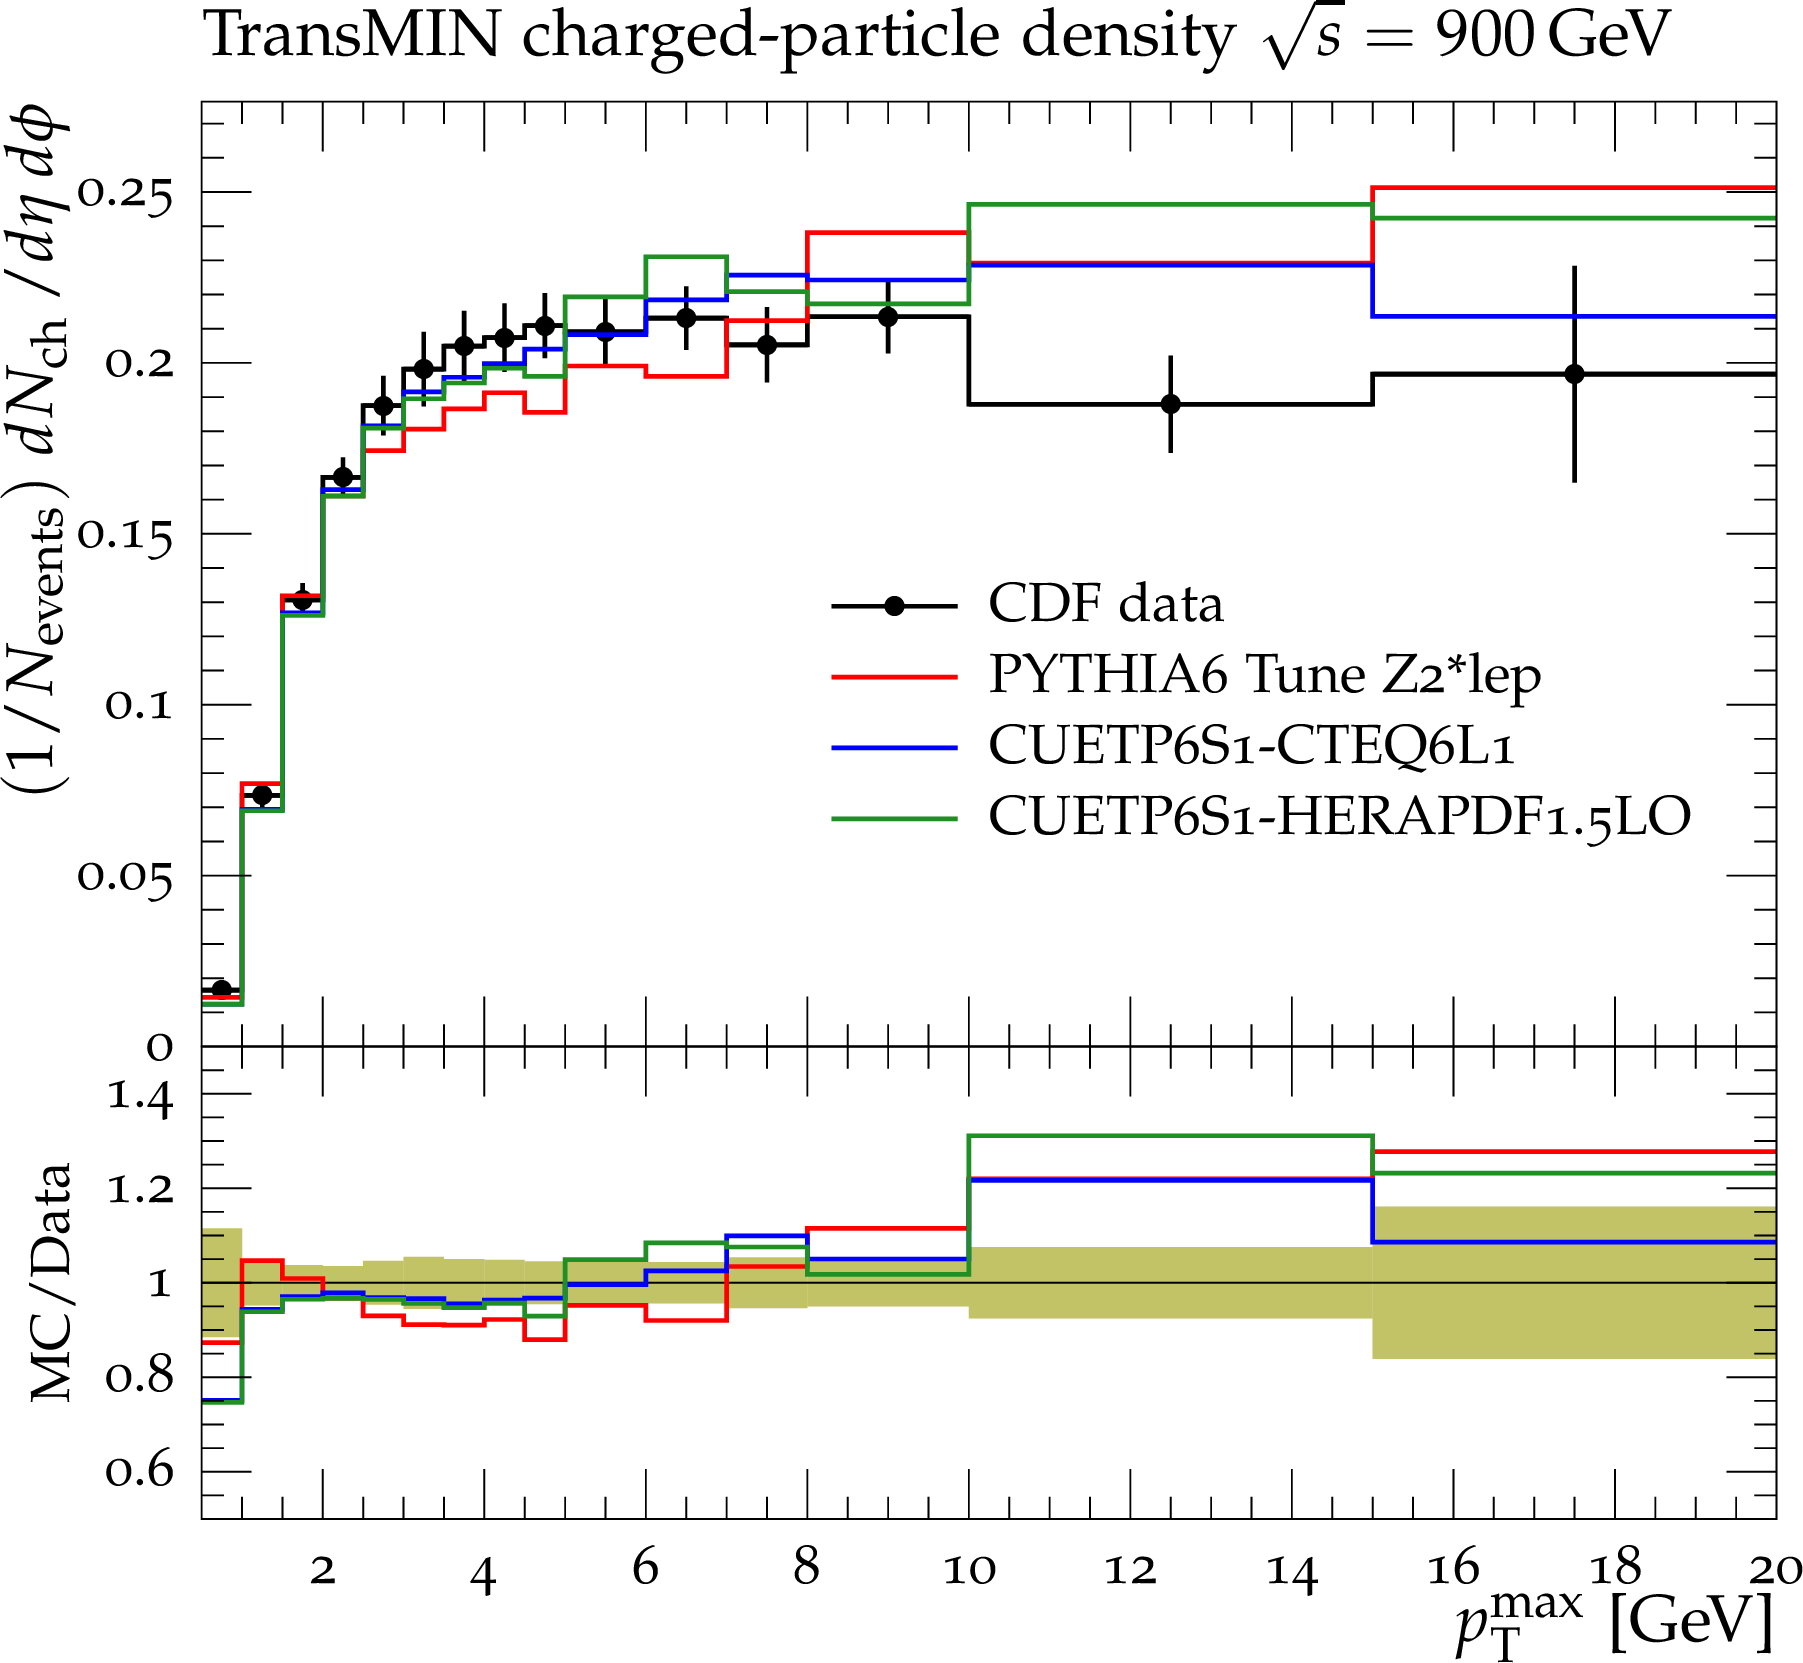
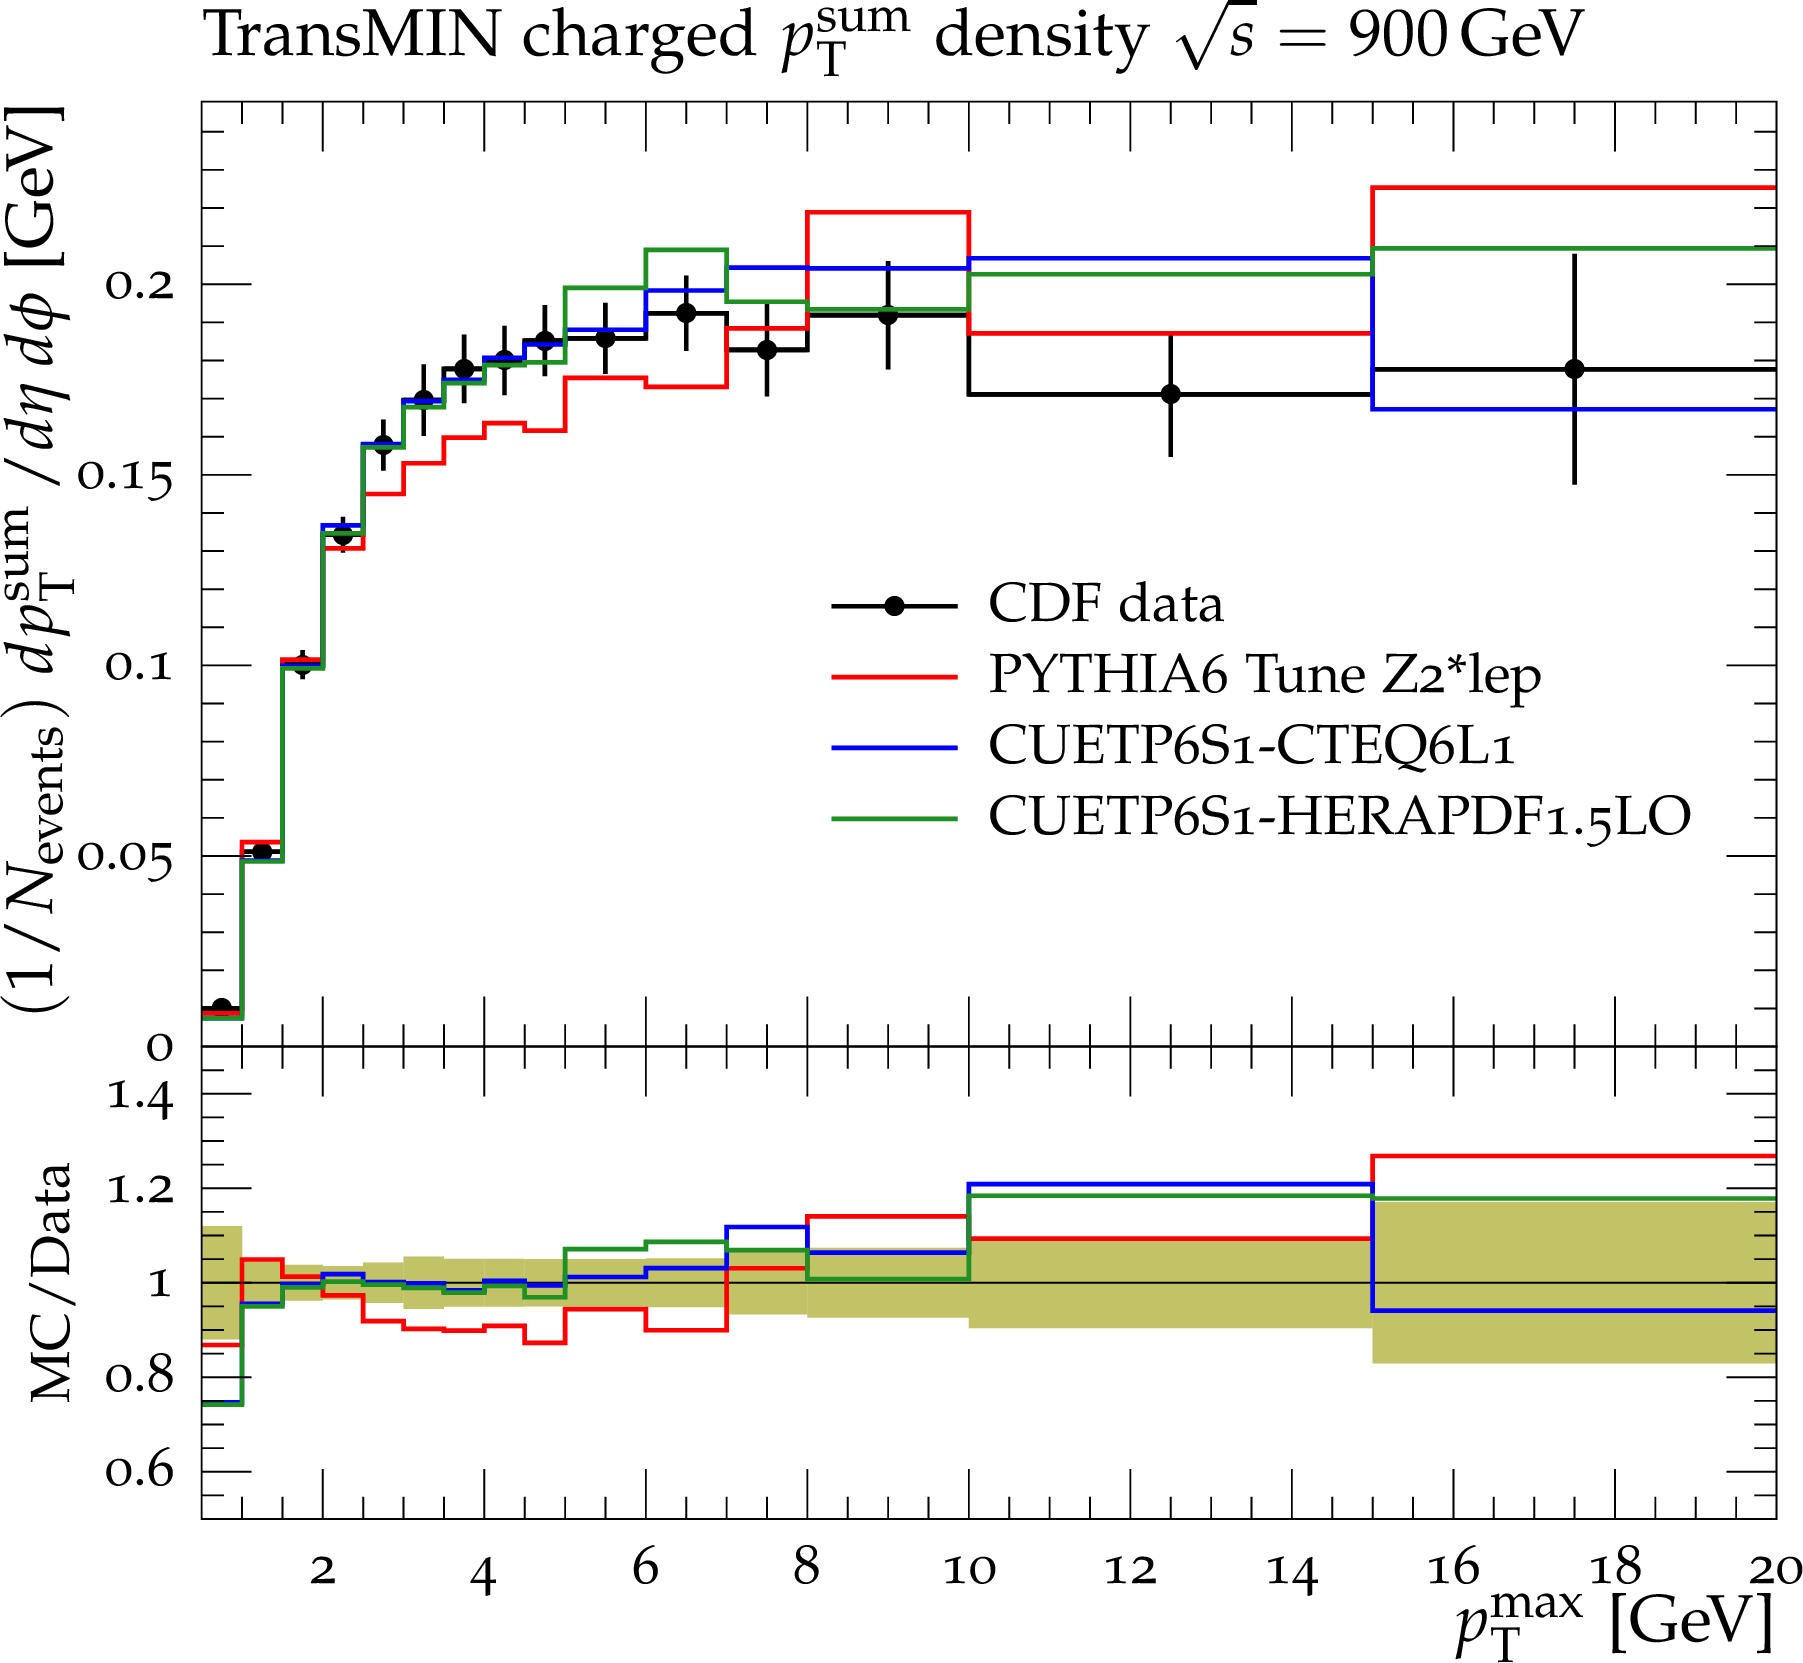
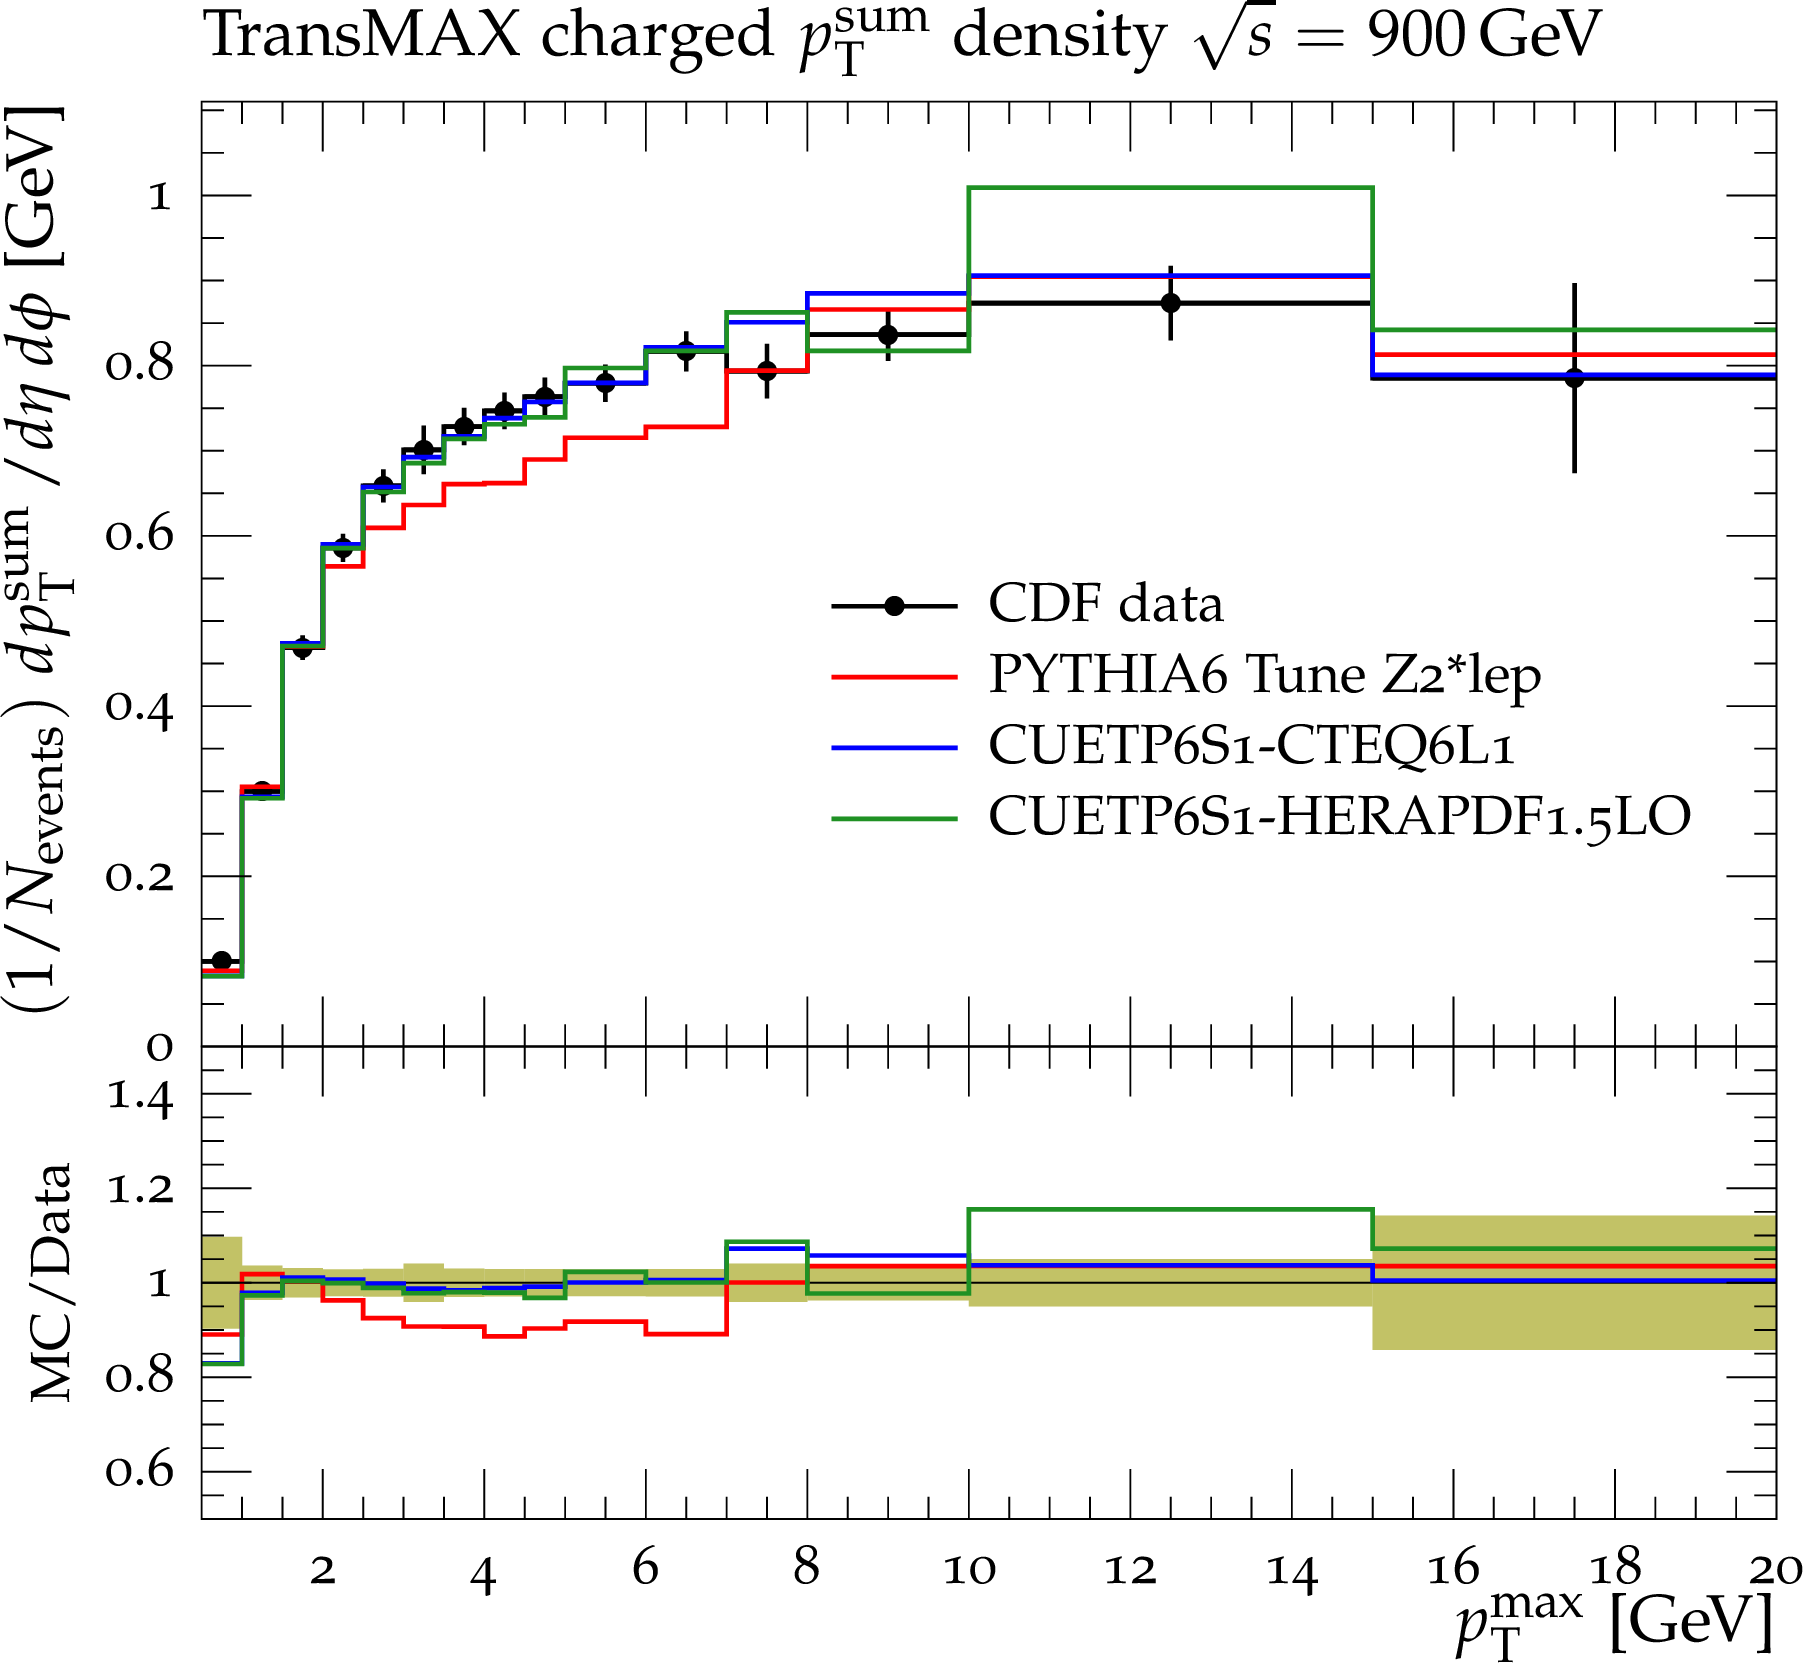
Figure 24-a:
CDF data at $\sqrt {s}= $ 900 GeV[11] on the particle (a,b) and $p_{\rm T}^{\rm sum}$\ densities (c,d) for charged particles with $p_{\rm T}>0.5$ GeV and $|\eta |<$ 0.8 in the TransMIN (a,c) and TransMAX (b,d) regions as defined by the leading charged particle, as a function of the transverse momentum of the leading-charged particle $p_{\rm T}^{\rm max}$. The data are compared to the PYTHIA6 Tune Z$2^*$lep, CUETP6S1-CTEQ6L1 and CUETP6S1-HERAPDF1.5LO. The green bands in the ratios represent the total experimental uncertainties. |

png pdf |
Figure 24-b:
CDF data at $\sqrt {s}= $ 900 GeV[11] on the particle (a,b) and $p_{\rm T}^{\rm sum}$\ densities (c,d) for charged particles with $p_{\rm T}>0.5$ GeV and $|\eta |<$ 0.8 in the TransMIN (a,c) and TransMAX (b,d) regions as defined by the leading charged particle, as a function of the transverse momentum of the leading-charged particle $p_{\rm T}^{\rm max}$. The data are compared to the PYTHIA6 Tune Z$2^*$lep, CUETP6S1-CTEQ6L1 and CUETP6S1-HERAPDF1.5LO. The green bands in the ratios represent the total experimental uncertainties. |
png pdf |
Figure 24-c:
CDF data at $\sqrt {s}= $ 900 GeV[11] on the particle (a,b) and $p_{\rm T}^{\rm sum}$\ densities (c,d) for charged particles with $p_{\rm T}>0.5$ GeV and $|\eta |<$ 0.8 in the TransMIN (a,c) and TransMAX (b,d) regions as defined by the leading charged particle, as a function of the transverse momentum of the leading-charged particle $p_{\rm T}^{\rm max}$. The data are compared to the PYTHIA6 Tune Z$2^*$lep, CUETP6S1-CTEQ6L1 and CUETP6S1-HERAPDF1.5LO. The green bands in the ratios represent the total experimental uncertainties. |
png pdf |
Figure 24-d:
CDF data at $\sqrt {s}= $ 900 GeV[11] on the particle (a,b) and $p_{\rm T}^{\rm sum}$\ densities (c,d) for charged particles with $p_{\rm T}>0.5$ GeV and $|\eta |<$ 0.8 in the TransMIN (a,c) and TransMAX (b,d) regions as defined by the leading charged particle, as a function of the transverse momentum of the leading-charged particle $p_{\rm T}^{\rm max}$. The data are compared to the PYTHIA6 Tune Z$2^*$lep, CUETP6S1-CTEQ6L1 and CUETP6S1-HERAPDF1.5LO. The green bands in the ratios represent the total experimental uncertainties. |

png pdf |
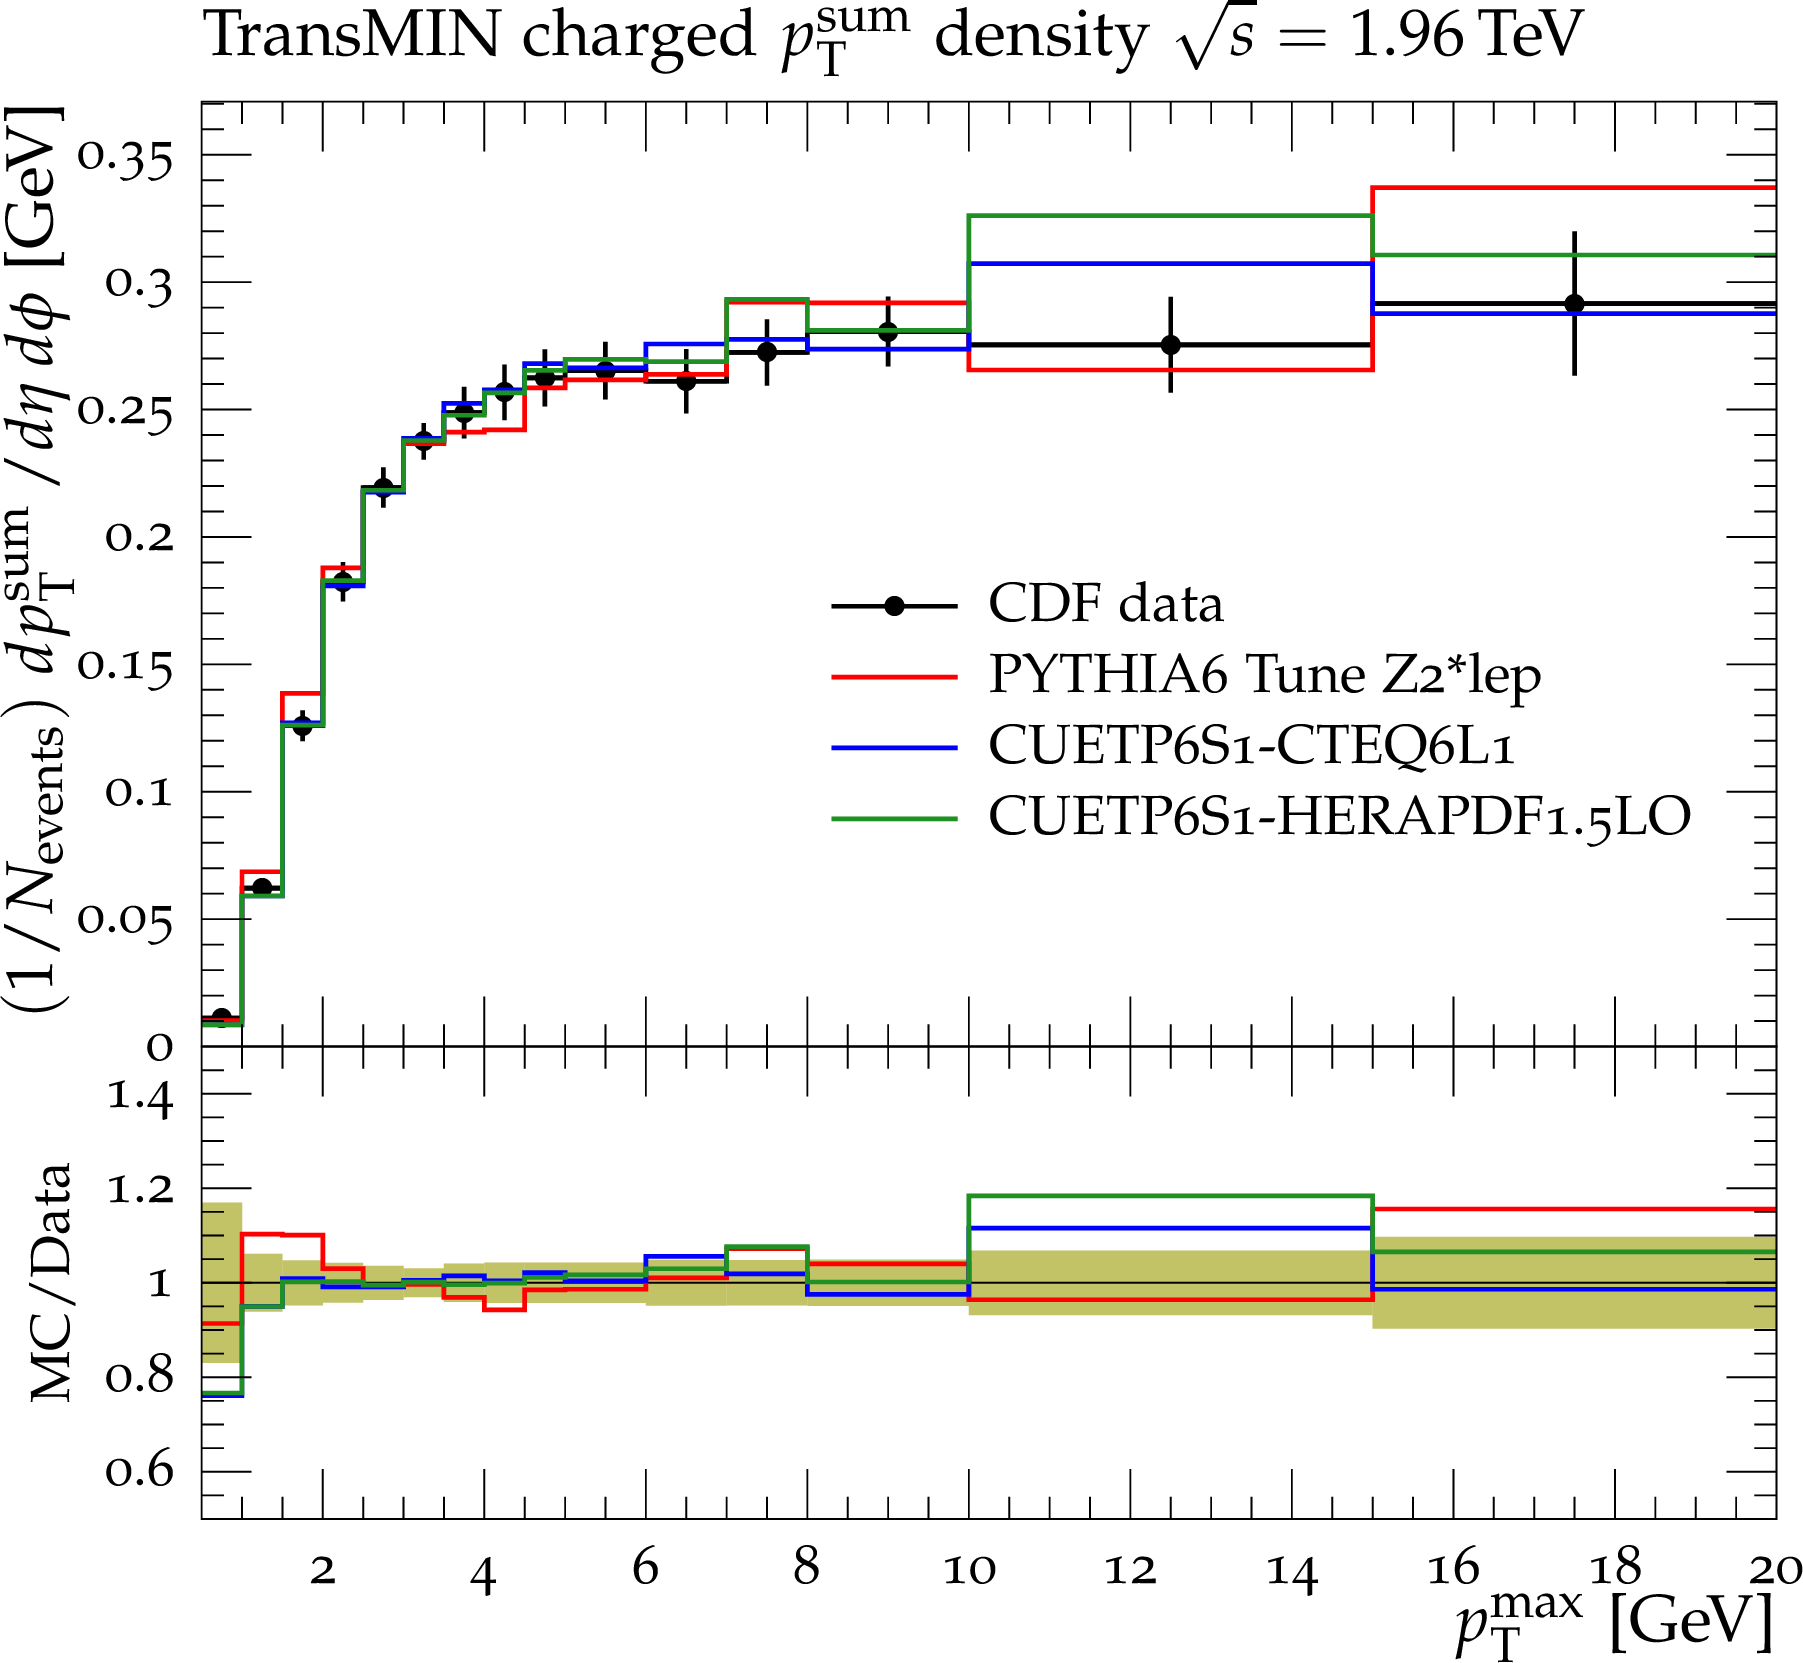
Figure 25-a:
CDF data at $\sqrt {s}=$ 1.96 TeV[11] on the particle (a,b) and $p_{\rm T}^{\rm sum}$\ densities (c,d) for charged particles with $p_{\rm T}>$ 0.5 GeV and $|\eta |<$ 0.8 in the TransMIN (a,d) and TransMAX (b,d) regions as defined by the leading charged particle, as a function of the transverse momentum of the leading charged-particle $p_{\rm T}^{\rm max}$. The data are compared to the PYTHIA6 Tune Z$2^*$lep, CUETP6S1-CTEQ6L1\ and CUETP6S1-HERAPDF1.5LO. The green bands in the ratios represent the total experimental uncertainties. |

png pdf |
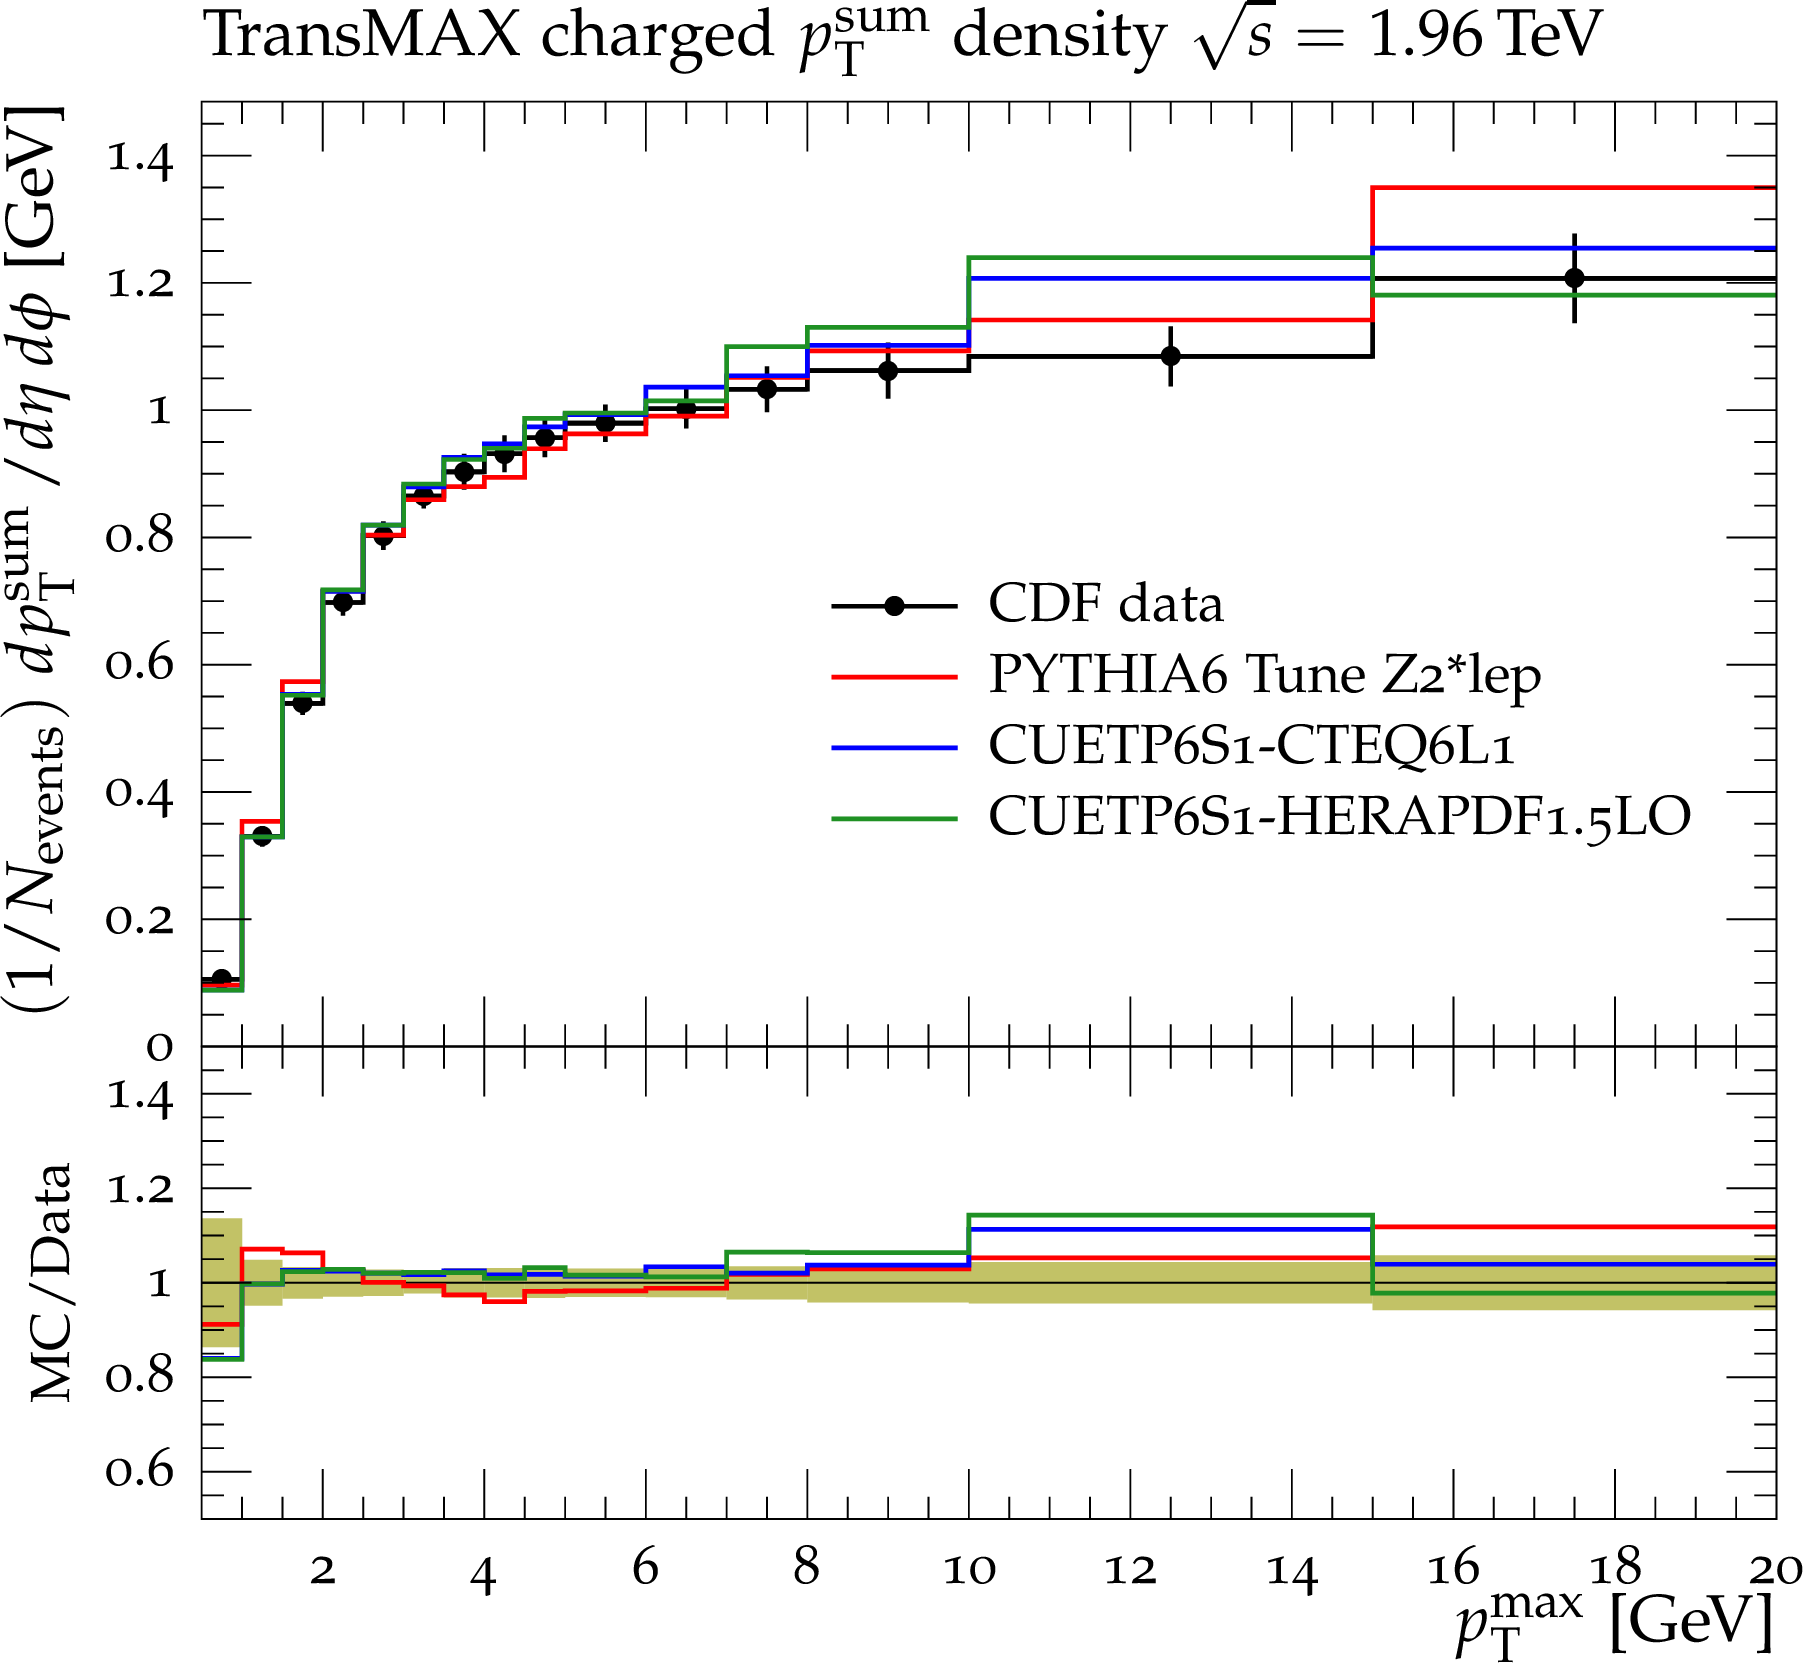
Figure 25-b:
CDF data at $\sqrt {s}=$ 1.96 TeV[11] on the particle (a,b) and $p_{\rm T}^{\rm sum}$\ densities (c,d) for charged particles with $p_{\rm T}>$ 0.5 GeV and $|\eta |<$ 0.8 in the TransMIN (a,d) and TransMAX (b,d) regions as defined by the leading charged particle, as a function of the transverse momentum of the leading charged-particle $p_{\rm T}^{\rm max}$. The data are compared to the PYTHIA6 Tune Z$2^*$lep, CUETP6S1-CTEQ6L1\ and CUETP6S1-HERAPDF1.5LO. The green bands in the ratios represent the total experimental uncertainties. |
png pdf |
Figure 25-c:
CDF data at $\sqrt {s}=$ 1.96 TeV[11] on the particle (a,b) and $p_{\rm T}^{\rm sum}$\ densities (c,d) for charged particles with $p_{\rm T}>$ 0.5 GeV and $|\eta |<$ 0.8 in the TransMIN (a,d) and TransMAX (b,d) regions as defined by the leading charged particle, as a function of the transverse momentum of the leading charged-particle $p_{\rm T}^{\rm max}$. The data are compared to the PYTHIA6 Tune Z$2^*$lep, CUETP6S1-CTEQ6L1\ and CUETP6S1-HERAPDF1.5LO. The green bands in the ratios represent the total experimental uncertainties. |
png pdf |
Figure 25-d:
CDF data at $\sqrt {s}=$ 1.96 TeV[11] on the particle (a,b) and $p_{\rm T}^{\rm sum}$\ densities (c,d) for charged particles with $p_{\rm T}>$ 0.5 GeV and $|\eta |<$ 0.8 in the TransMIN (a,d) and TransMAX (b,d) regions as defined by the leading charged particle, as a function of the transverse momentum of the leading charged-particle $p_{\rm T}^{\rm max}$. The data are compared to the PYTHIA6 Tune Z$2^*$lep, CUETP6S1-CTEQ6L1\ and CUETP6S1-HERAPDF1.5LO. The green bands in the ratios represent the total experimental uncertainties. |
png pdf |
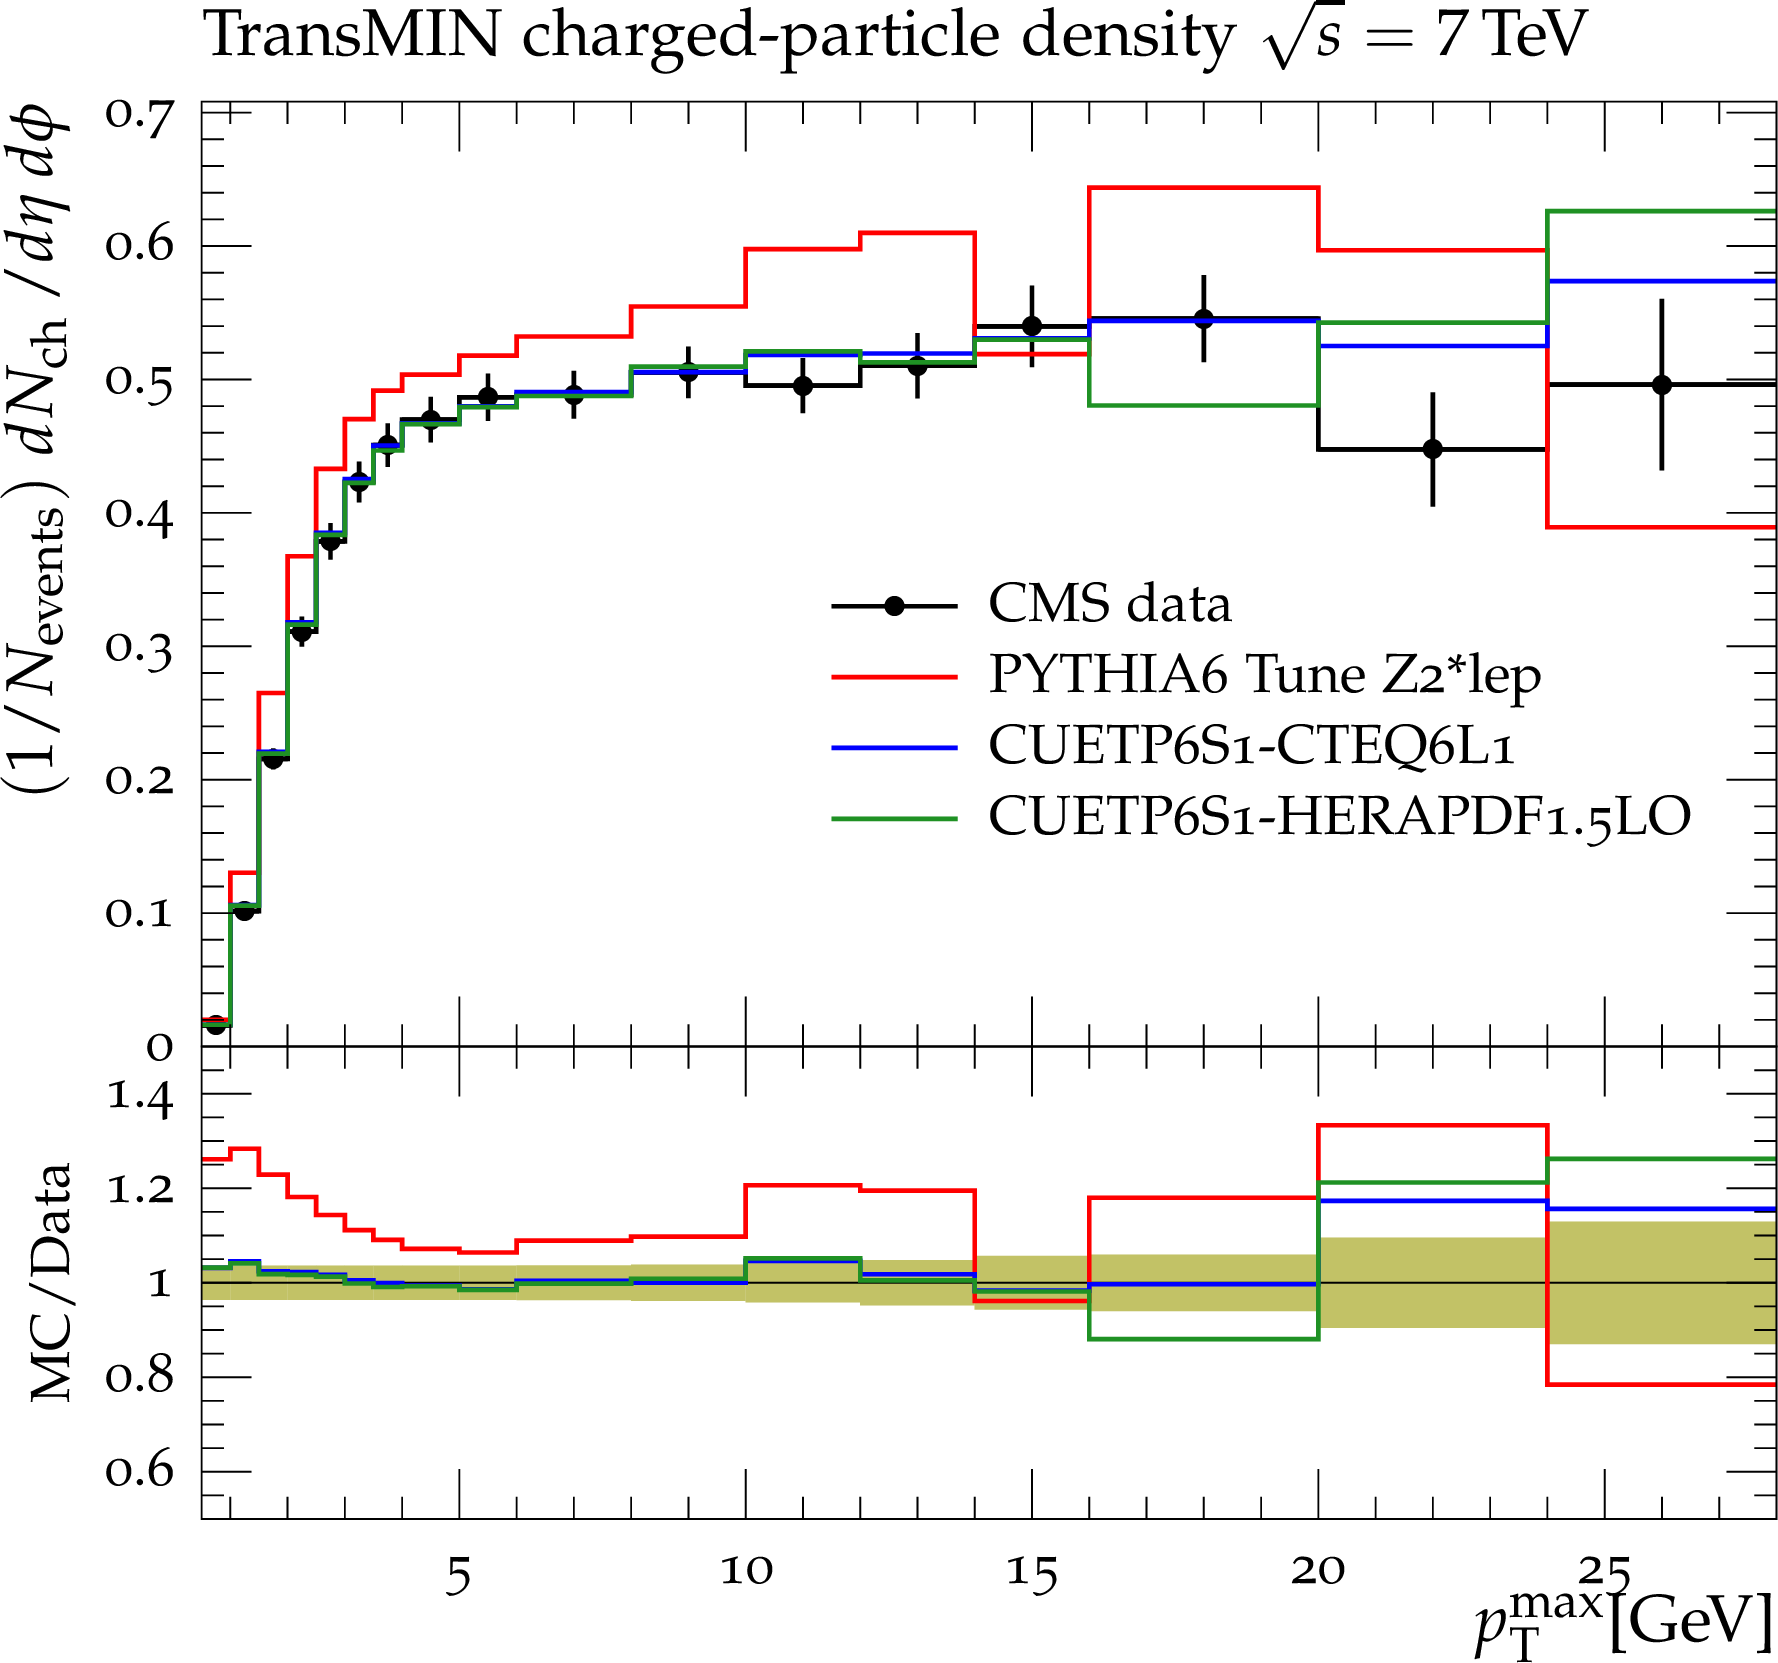
Figure 26-a:
CMS data at $\sqrt {s}=$ 7 TeV[17] on the particle (a,b) and $p_{\rm T}^{\rm sum}$\ densities (c,d) for charged particles with $p_{\rm T}>$ 0.5 GeV and $|\eta |<$ 0.8 in the TransMIN (a,c) and TransMAX (b,d) regions as defined by the leading charged particle, as a function of the transverse momentum of the leading charged-particle $p_{\rm T}^{\rm max}$. The data are compared to the PYTHIA6\ Tune Z$2^*$lep, CUETP6S1-CTEQ6L1\ and CUETP6S1-HERAPDF1.5LO. The green bands in the ratios represent the total experimental uncertainties. |
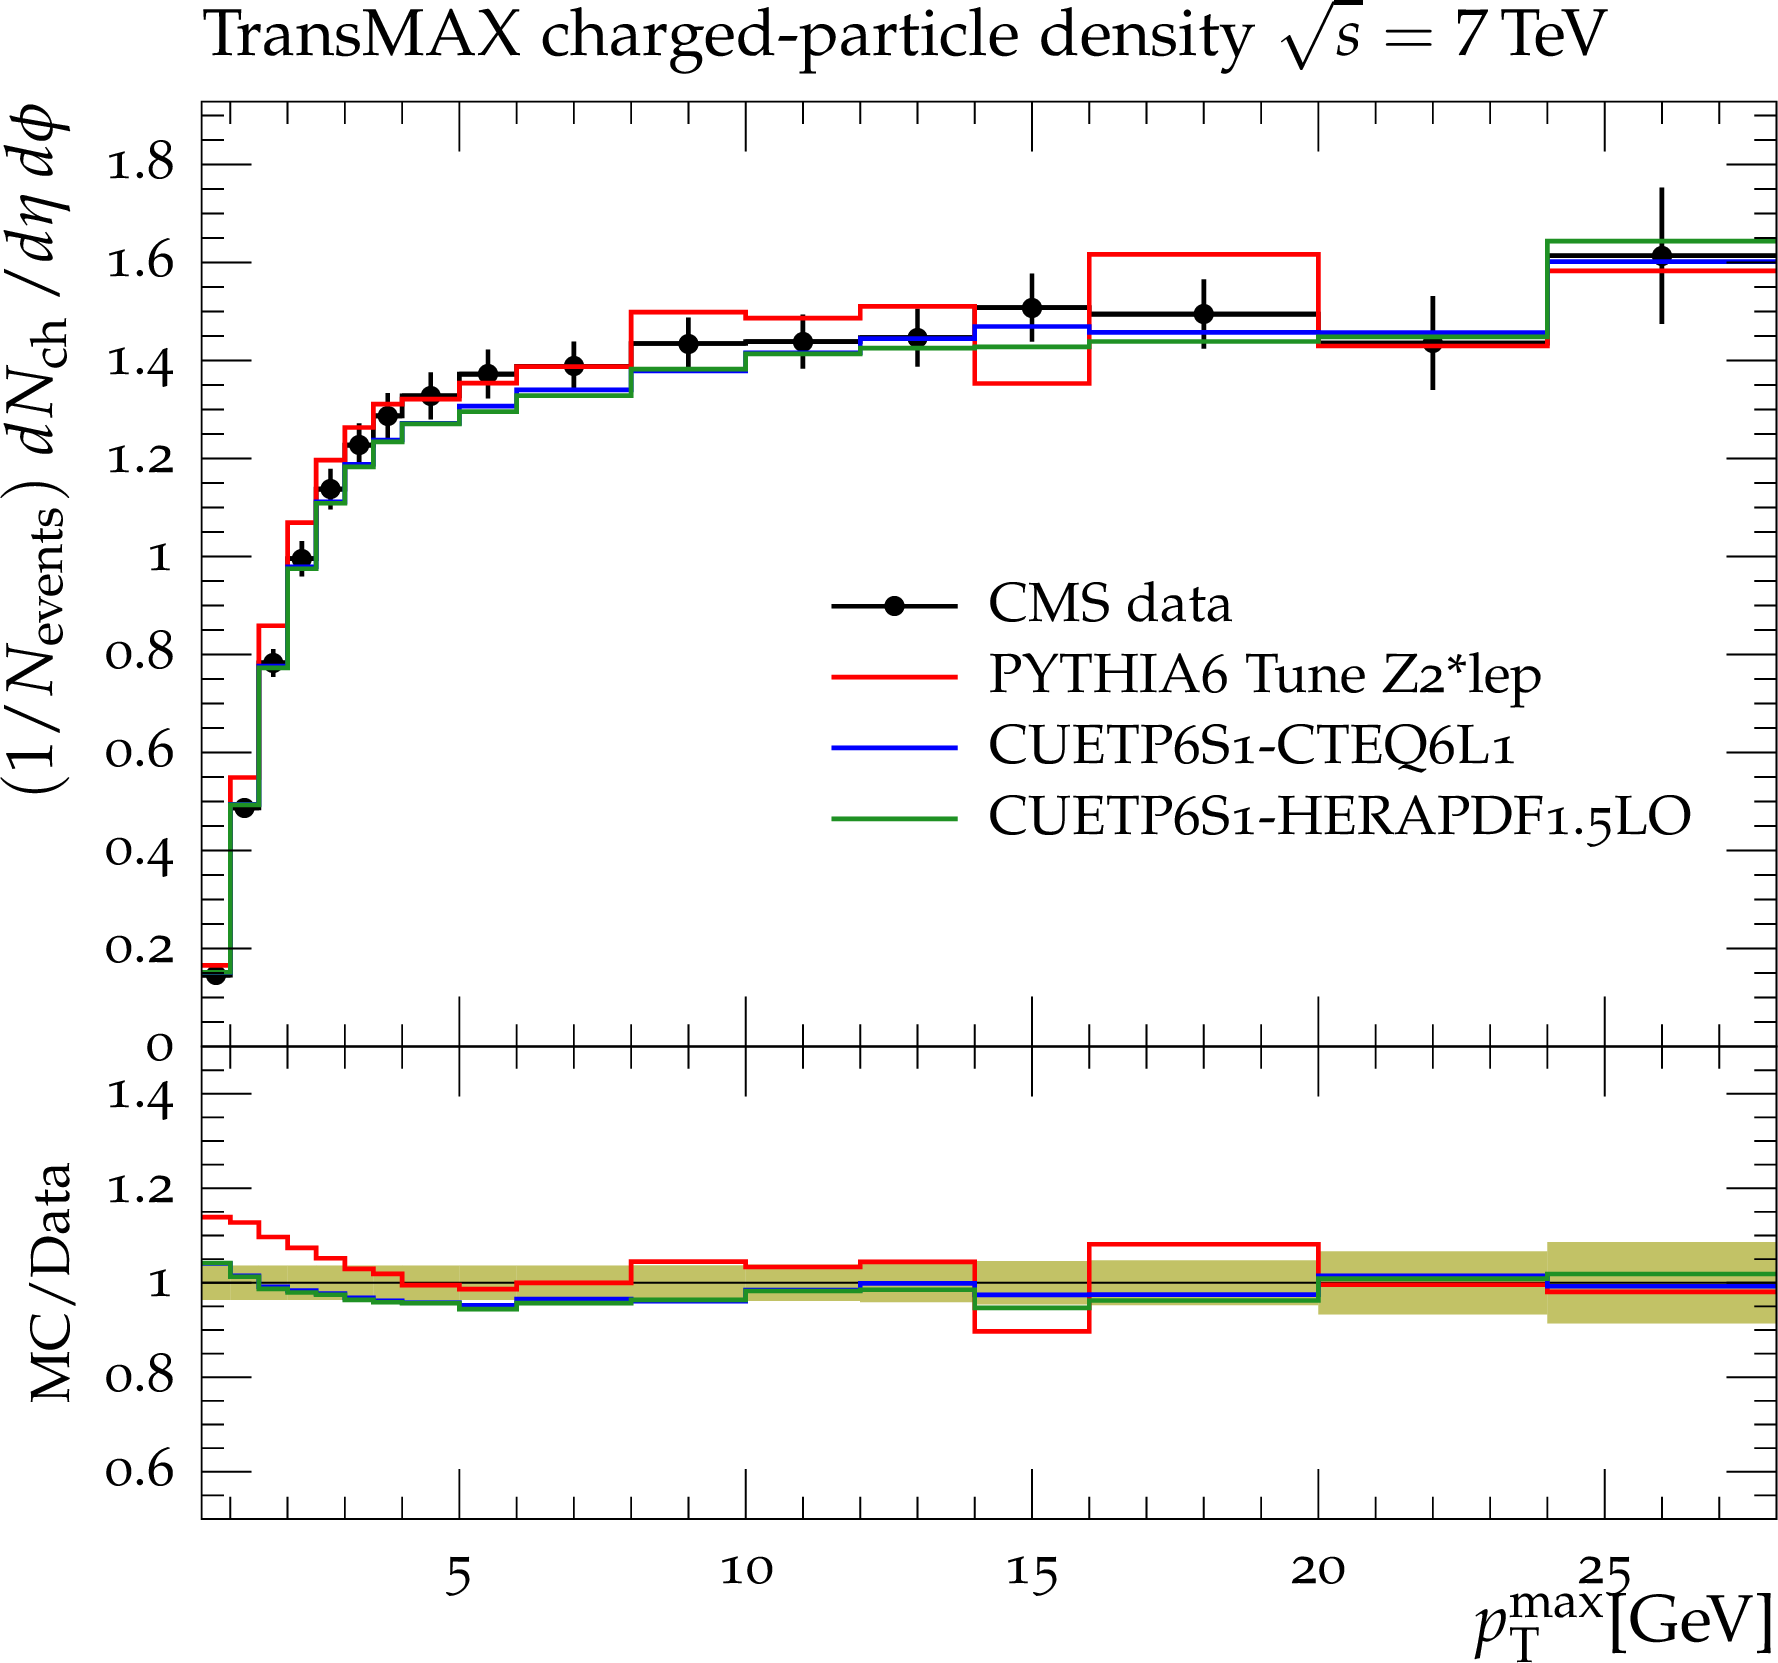
png pdf |
Figure 26-b:
CMS data at $\sqrt {s}=$ 7 TeV[17] on the particle (a,b) and $p_{\rm T}^{\rm sum}$\ densities (c,d) for charged particles with $p_{\rm T}>$ 0.5 GeV and $|\eta |<$ 0.8 in the TransMIN (a,c) and TransMAX (b,d) regions as defined by the leading charged particle, as a function of the transverse momentum of the leading charged-particle $p_{\rm T}^{\rm max}$. The data are compared to the PYTHIA6\ Tune Z$2^*$lep, CUETP6S1-CTEQ6L1\ and CUETP6S1-HERAPDF1.5LO. The green bands in the ratios represent the total experimental uncertainties. |
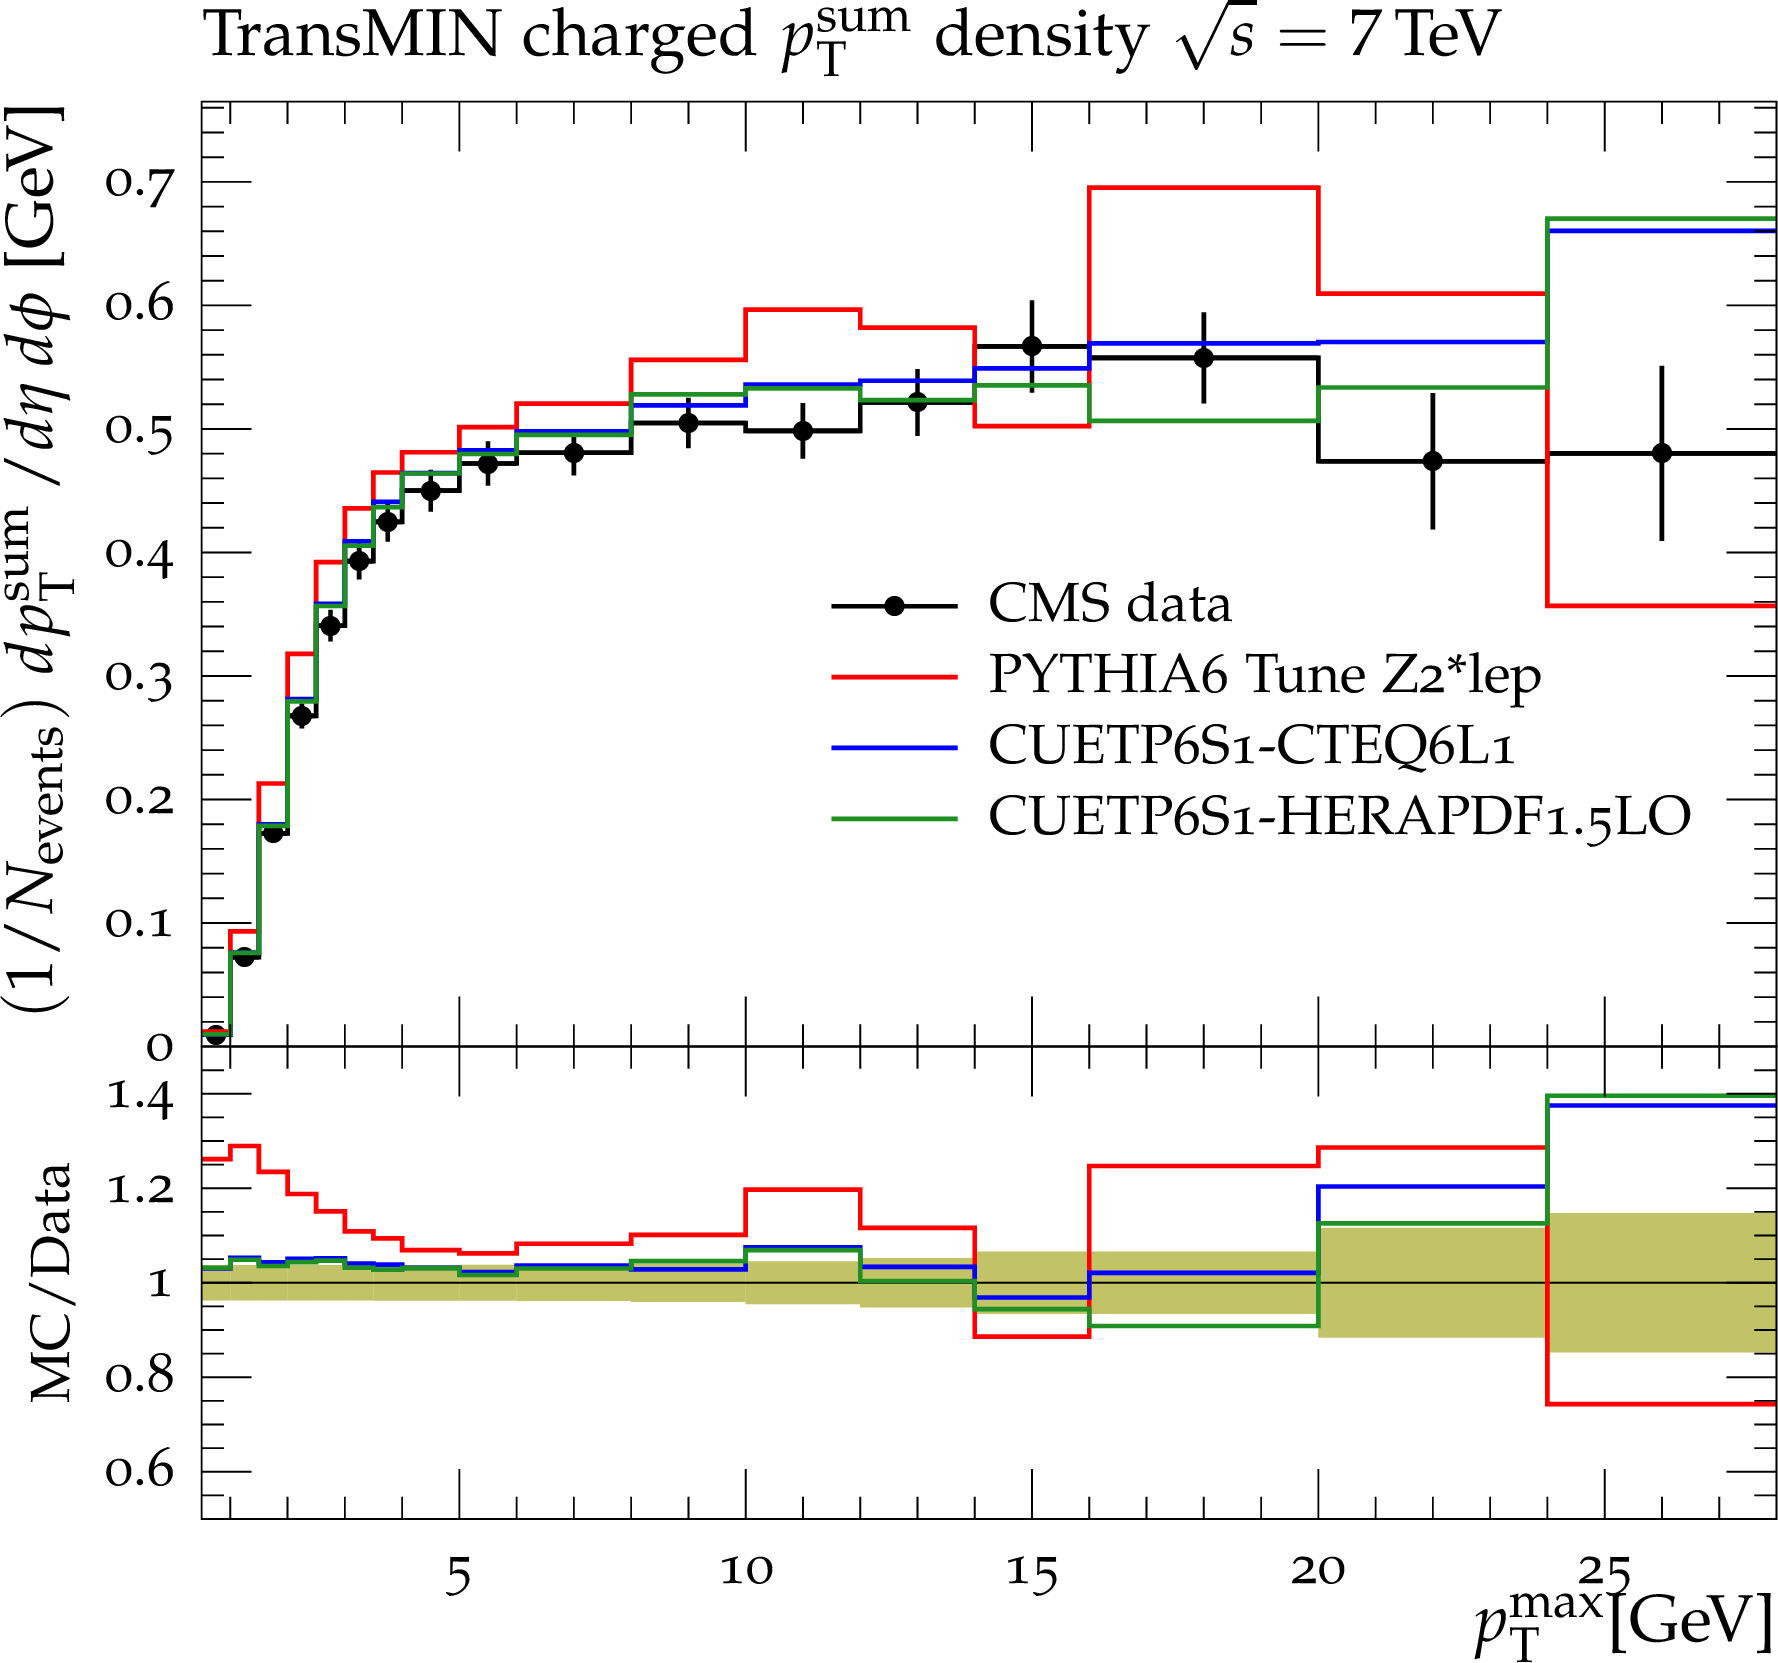
png pdf |
Figure 26-c:
CMS data at $\sqrt {s}=$ 7 TeV[17] on the particle (a,b) and $p_{\rm T}^{\rm sum}$\ densities (c,d) for charged particles with $p_{\rm T}>$ 0.5 GeV and $|\eta |<$ 0.8 in the TransMIN (a,c) and TransMAX (b,d) regions as defined by the leading charged particle, as a function of the transverse momentum of the leading charged-particle $p_{\rm T}^{\rm max}$. The data are compared to the PYTHIA6\ Tune Z$2^*$lep, CUETP6S1-CTEQ6L1\ and CUETP6S1-HERAPDF1.5LO. The green bands in the ratios represent the total experimental uncertainties. |
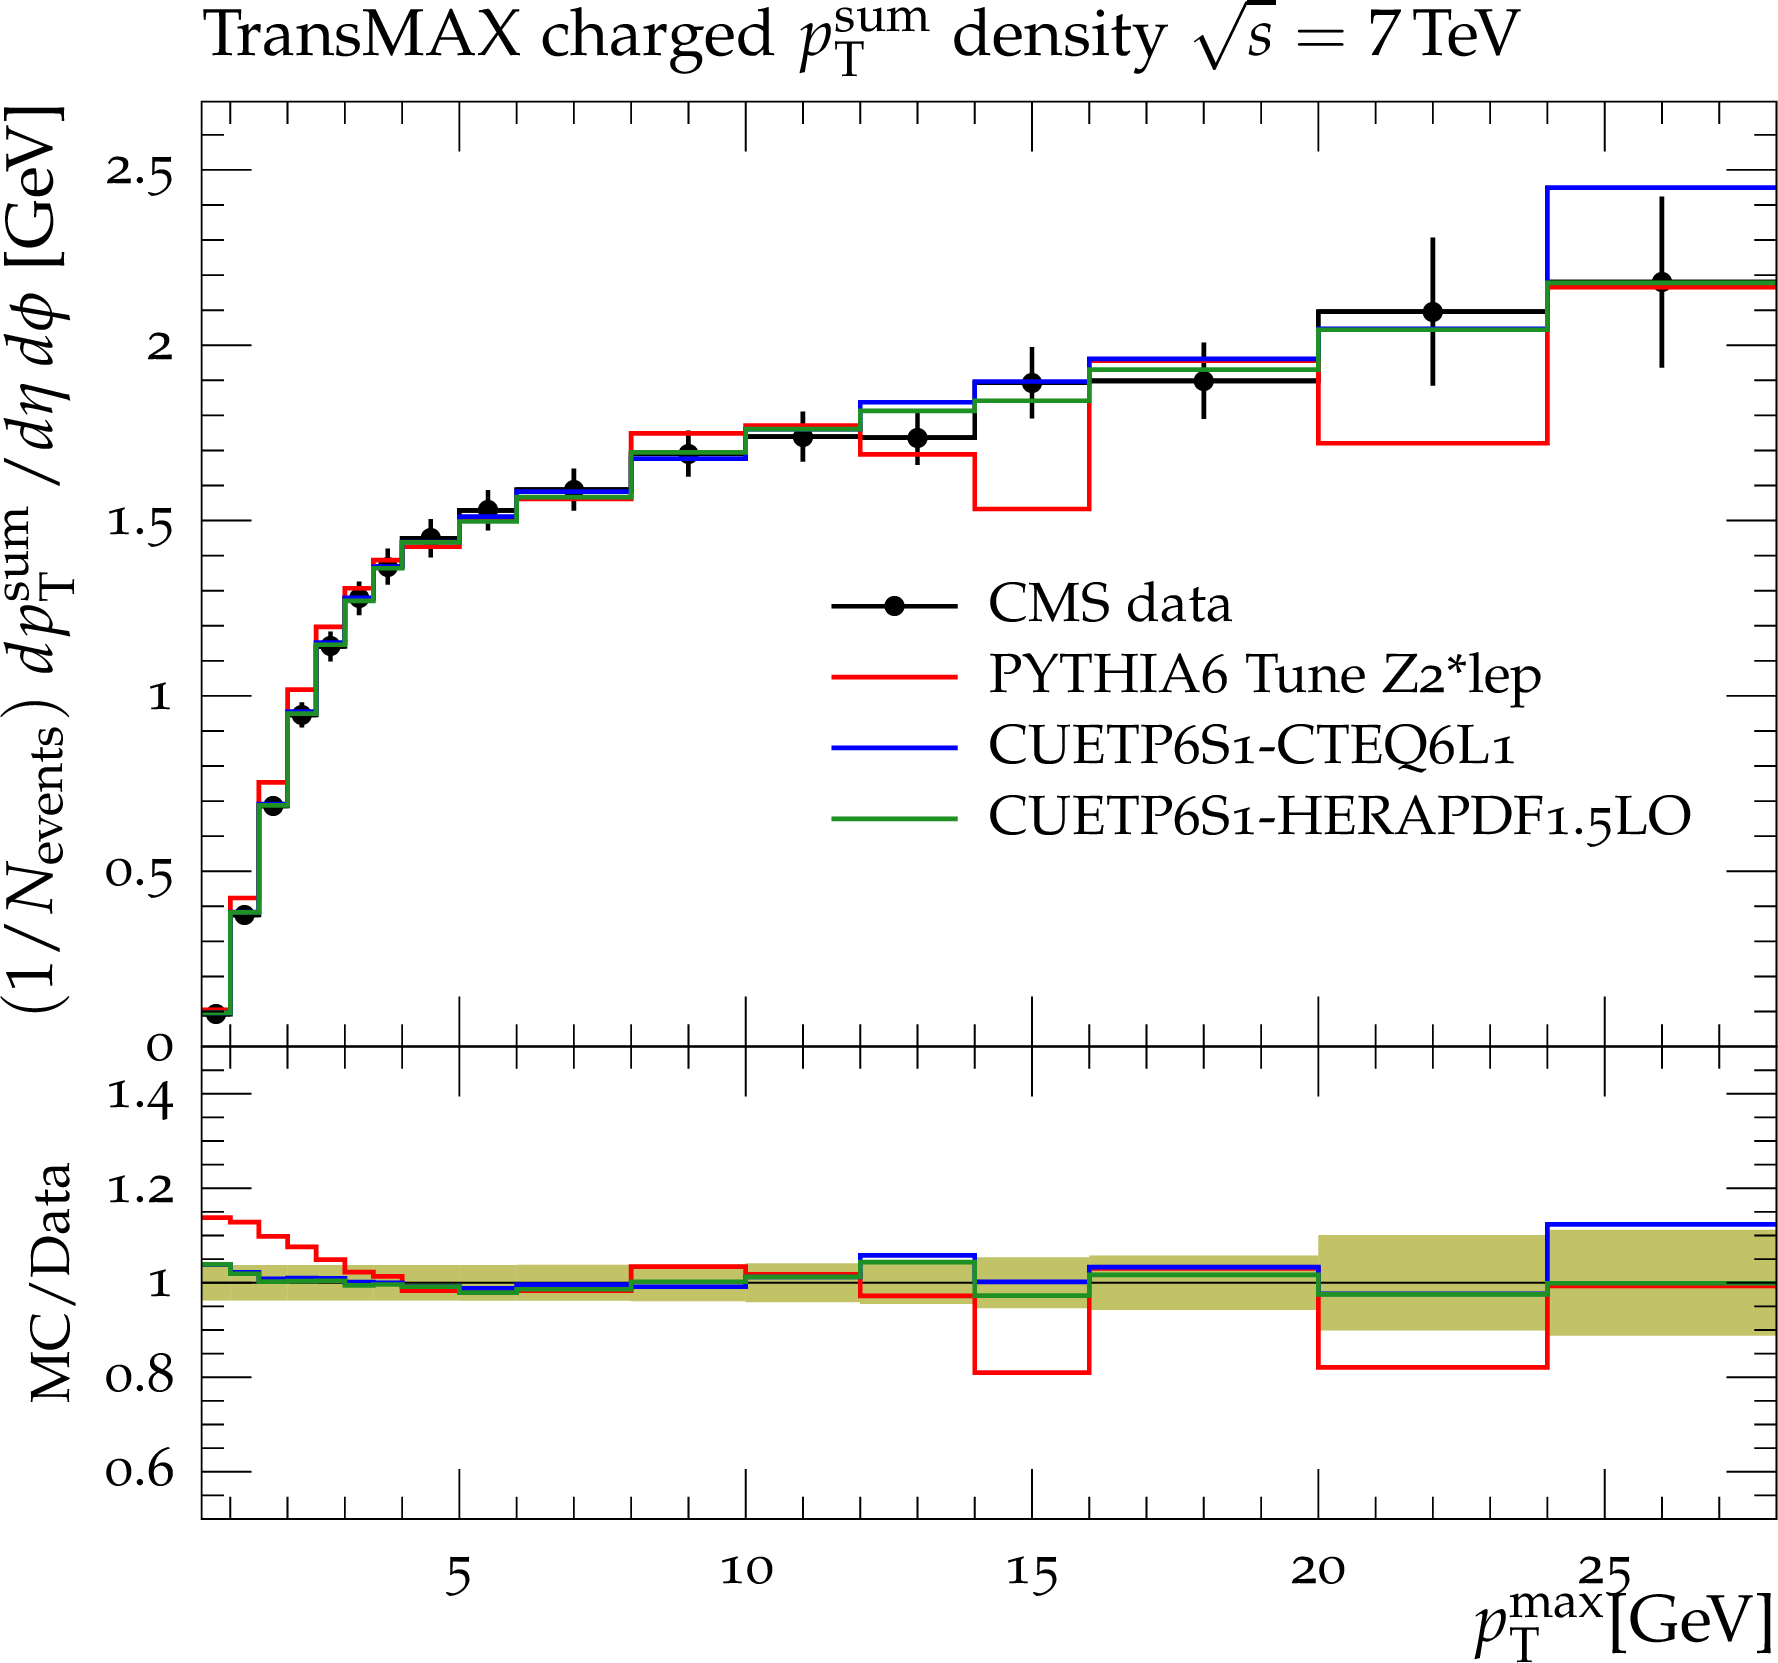
png pdf |
Figure 26-d:
CMS data at $\sqrt {s}=$ 7 TeV[17] on the particle (a,b) and $p_{\rm T}^{\rm sum}$\ densities (c,d) for charged particles with $p_{\rm T}>$ 0.5 GeV and $|\eta |<$ 0.8 in the TransMIN (a,c) and TransMAX (b,d) regions as defined by the leading charged particle, as a function of the transverse momentum of the leading charged-particle $p_{\rm T}^{\rm max}$. The data are compared to the PYTHIA6\ Tune Z$2^*$lep, CUETP6S1-CTEQ6L1\ and CUETP6S1-HERAPDF1.5LO. The green bands in the ratios represent the total experimental uncertainties. |
png pdf |
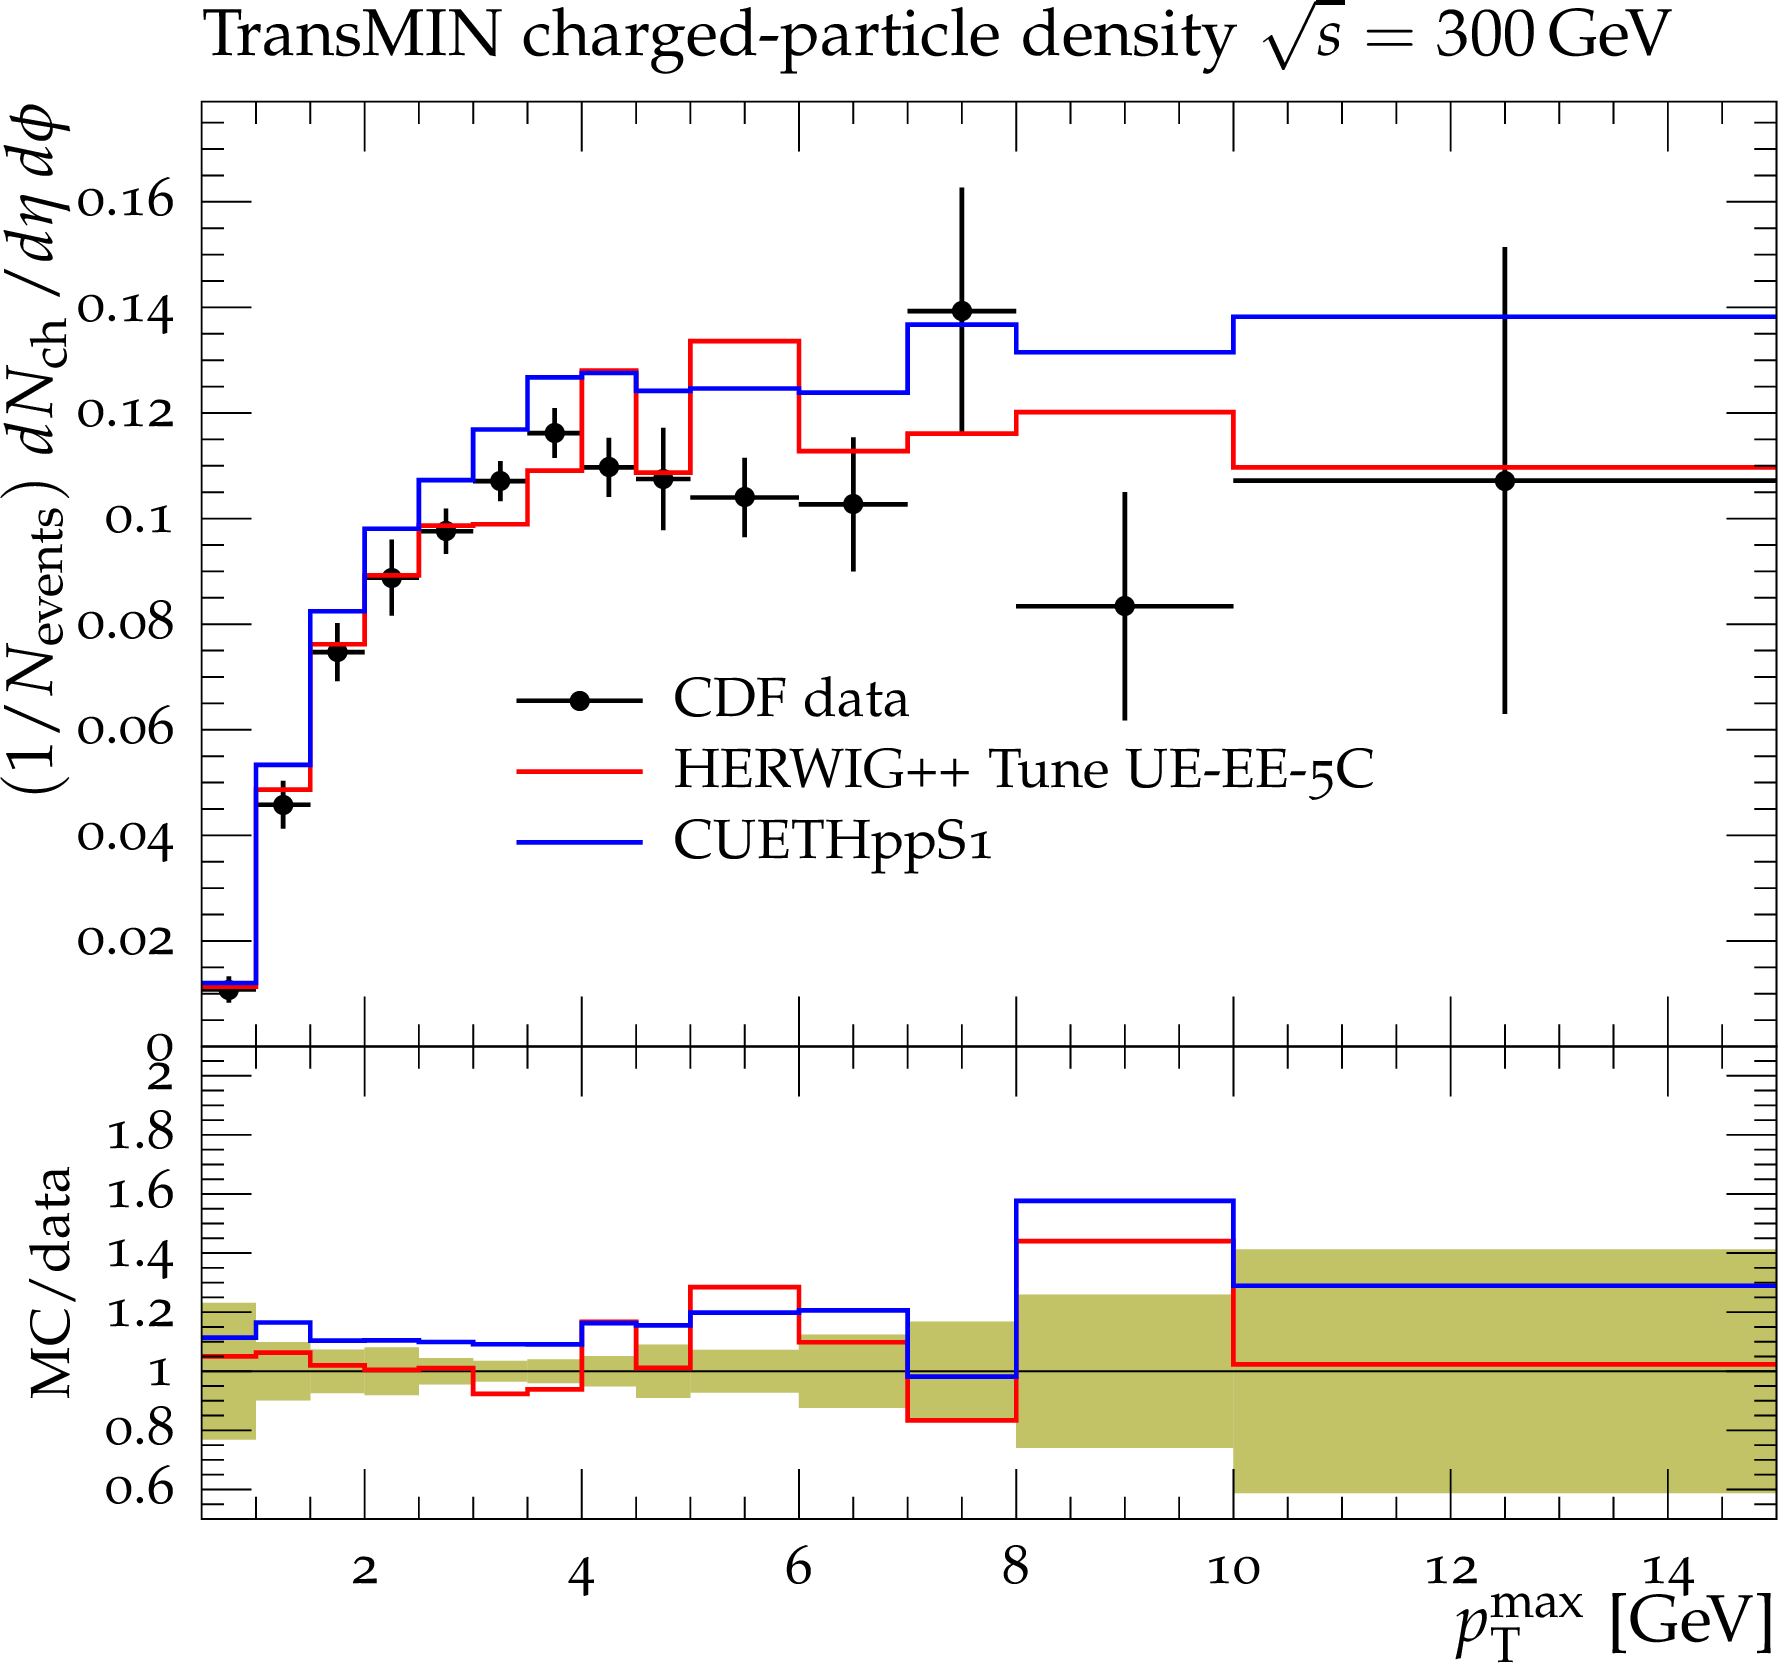
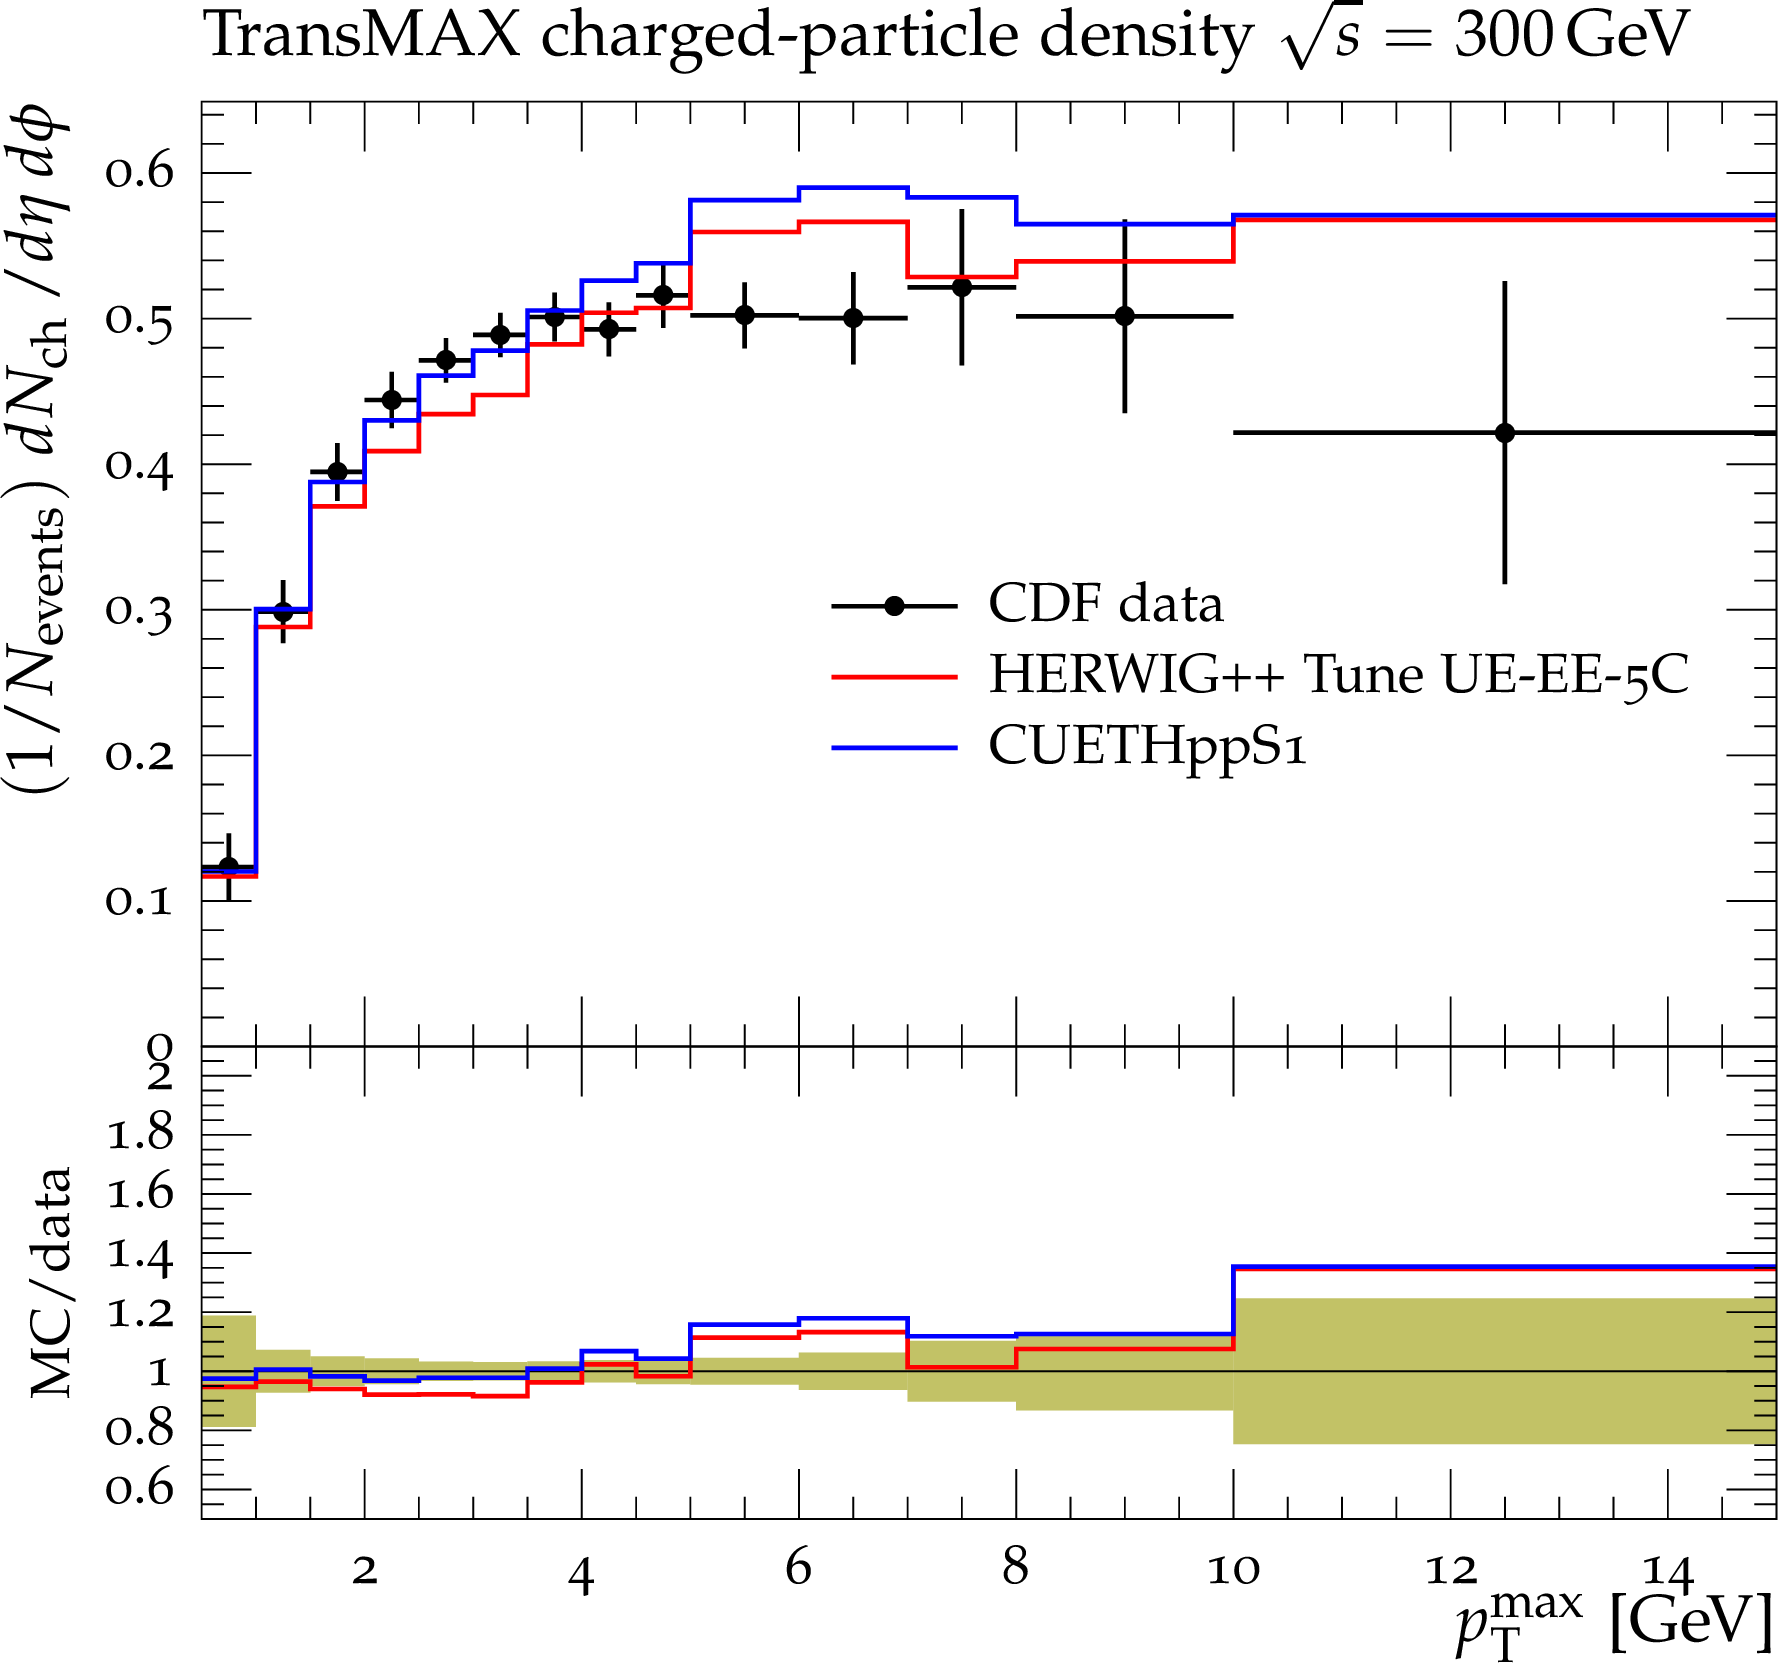
Figure 27-a:
CDF data at $\sqrt {s}=$ 300 GeV[11] on particle (a,b) and $p_{\rm T}^{\rm sum}$\ densities (c,d) for charged particles with $p_{\rm T}>$ 0.5 GeV and $|\eta |<$ 0.8 in the TransMIN\ (a,c) and TransMAX\ (b,d) regions as defined by the leading charged particle, as a function of the transverse momentum of the leading charged-particle $p_{\rm T}^{\rm max}$. The data are compared to the HERWIG++ Tune UE-EE-$5$C and CUETHppS1. The green bands in the ratios represent the total experimental uncertainties. |
png pdf |
Figure 27-b:
CDF data at $\sqrt {s}=$ 300 GeV[11] on particle (a,b) and $p_{\rm T}^{\rm sum}$\ densities (c,d) for charged particles with $p_{\rm T}>$ 0.5 GeV and $|\eta |<$ 0.8 in the TransMIN\ (a,c) and TransMAX\ (b,d) regions as defined by the leading charged particle, as a function of the transverse momentum of the leading charged-particle $p_{\rm T}^{\rm max}$. The data are compared to the HERWIG++ Tune UE-EE-$5$C and CUETHppS1. The green bands in the ratios represent the total experimental uncertainties. |
png pdf |
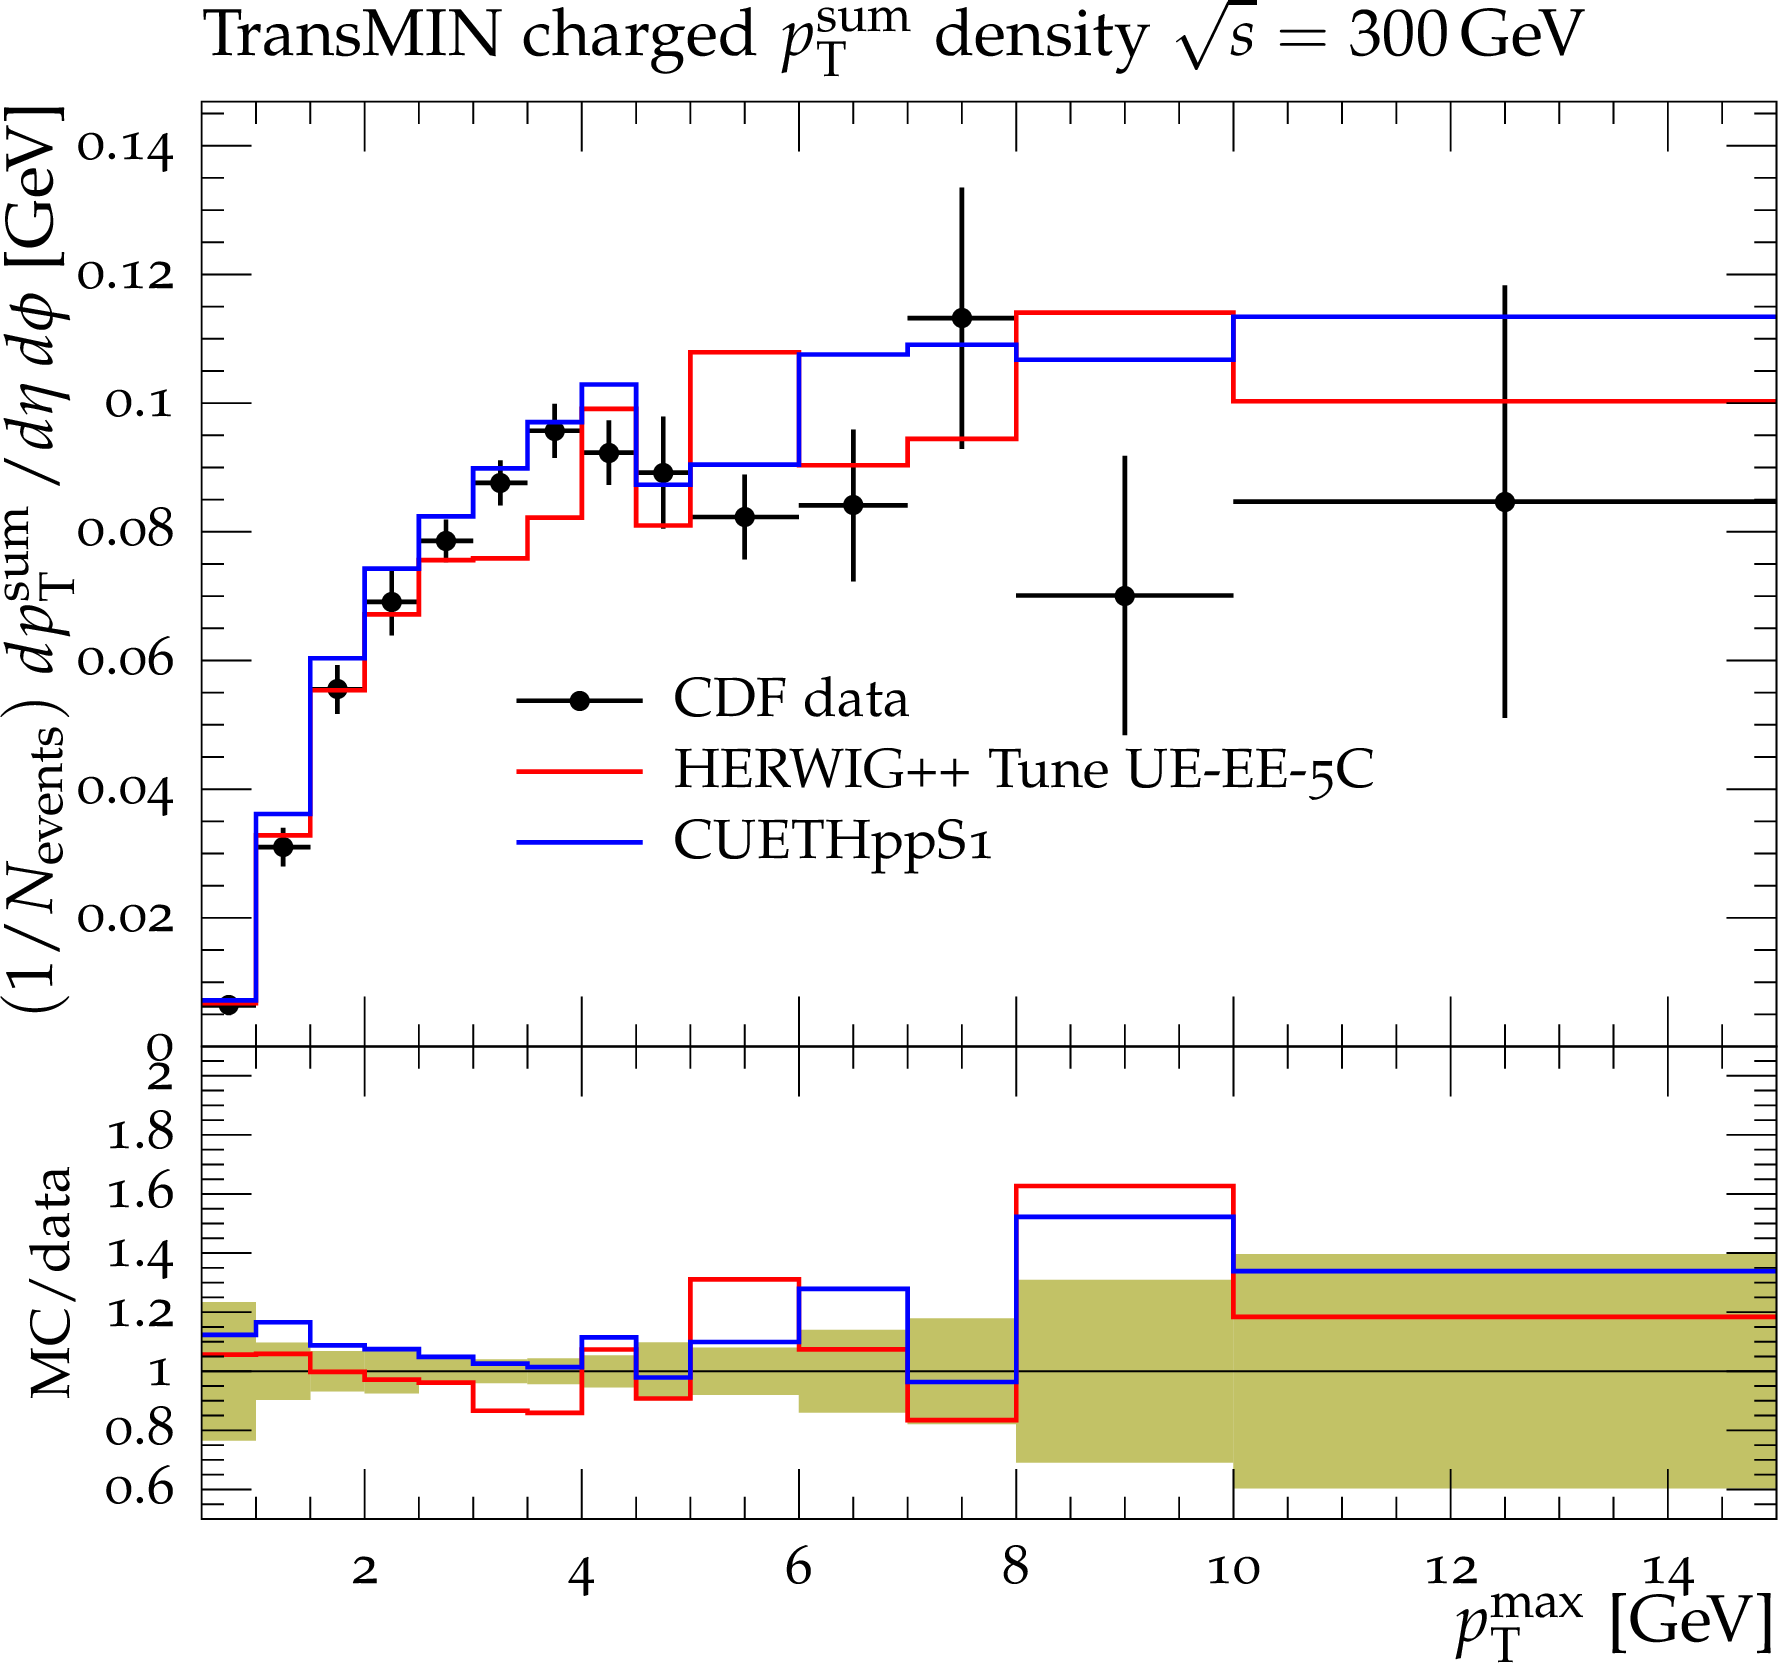
Figure 27-c:
CDF data at $\sqrt {s}=$ 300 GeV[11] on particle (a,b) and $p_{\rm T}^{\rm sum}$\ densities (c,d) for charged particles with $p_{\rm T}>$ 0.5 GeV and $|\eta |<$ 0.8 in the TransMIN\ (a,c) and TransMAX\ (b,d) regions as defined by the leading charged particle, as a function of the transverse momentum of the leading charged-particle $p_{\rm T}^{\rm max}$. The data are compared to the HERWIG++ Tune UE-EE-$5$C and CUETHppS1. The green bands in the ratios represent the total experimental uncertainties. |
png pdf |
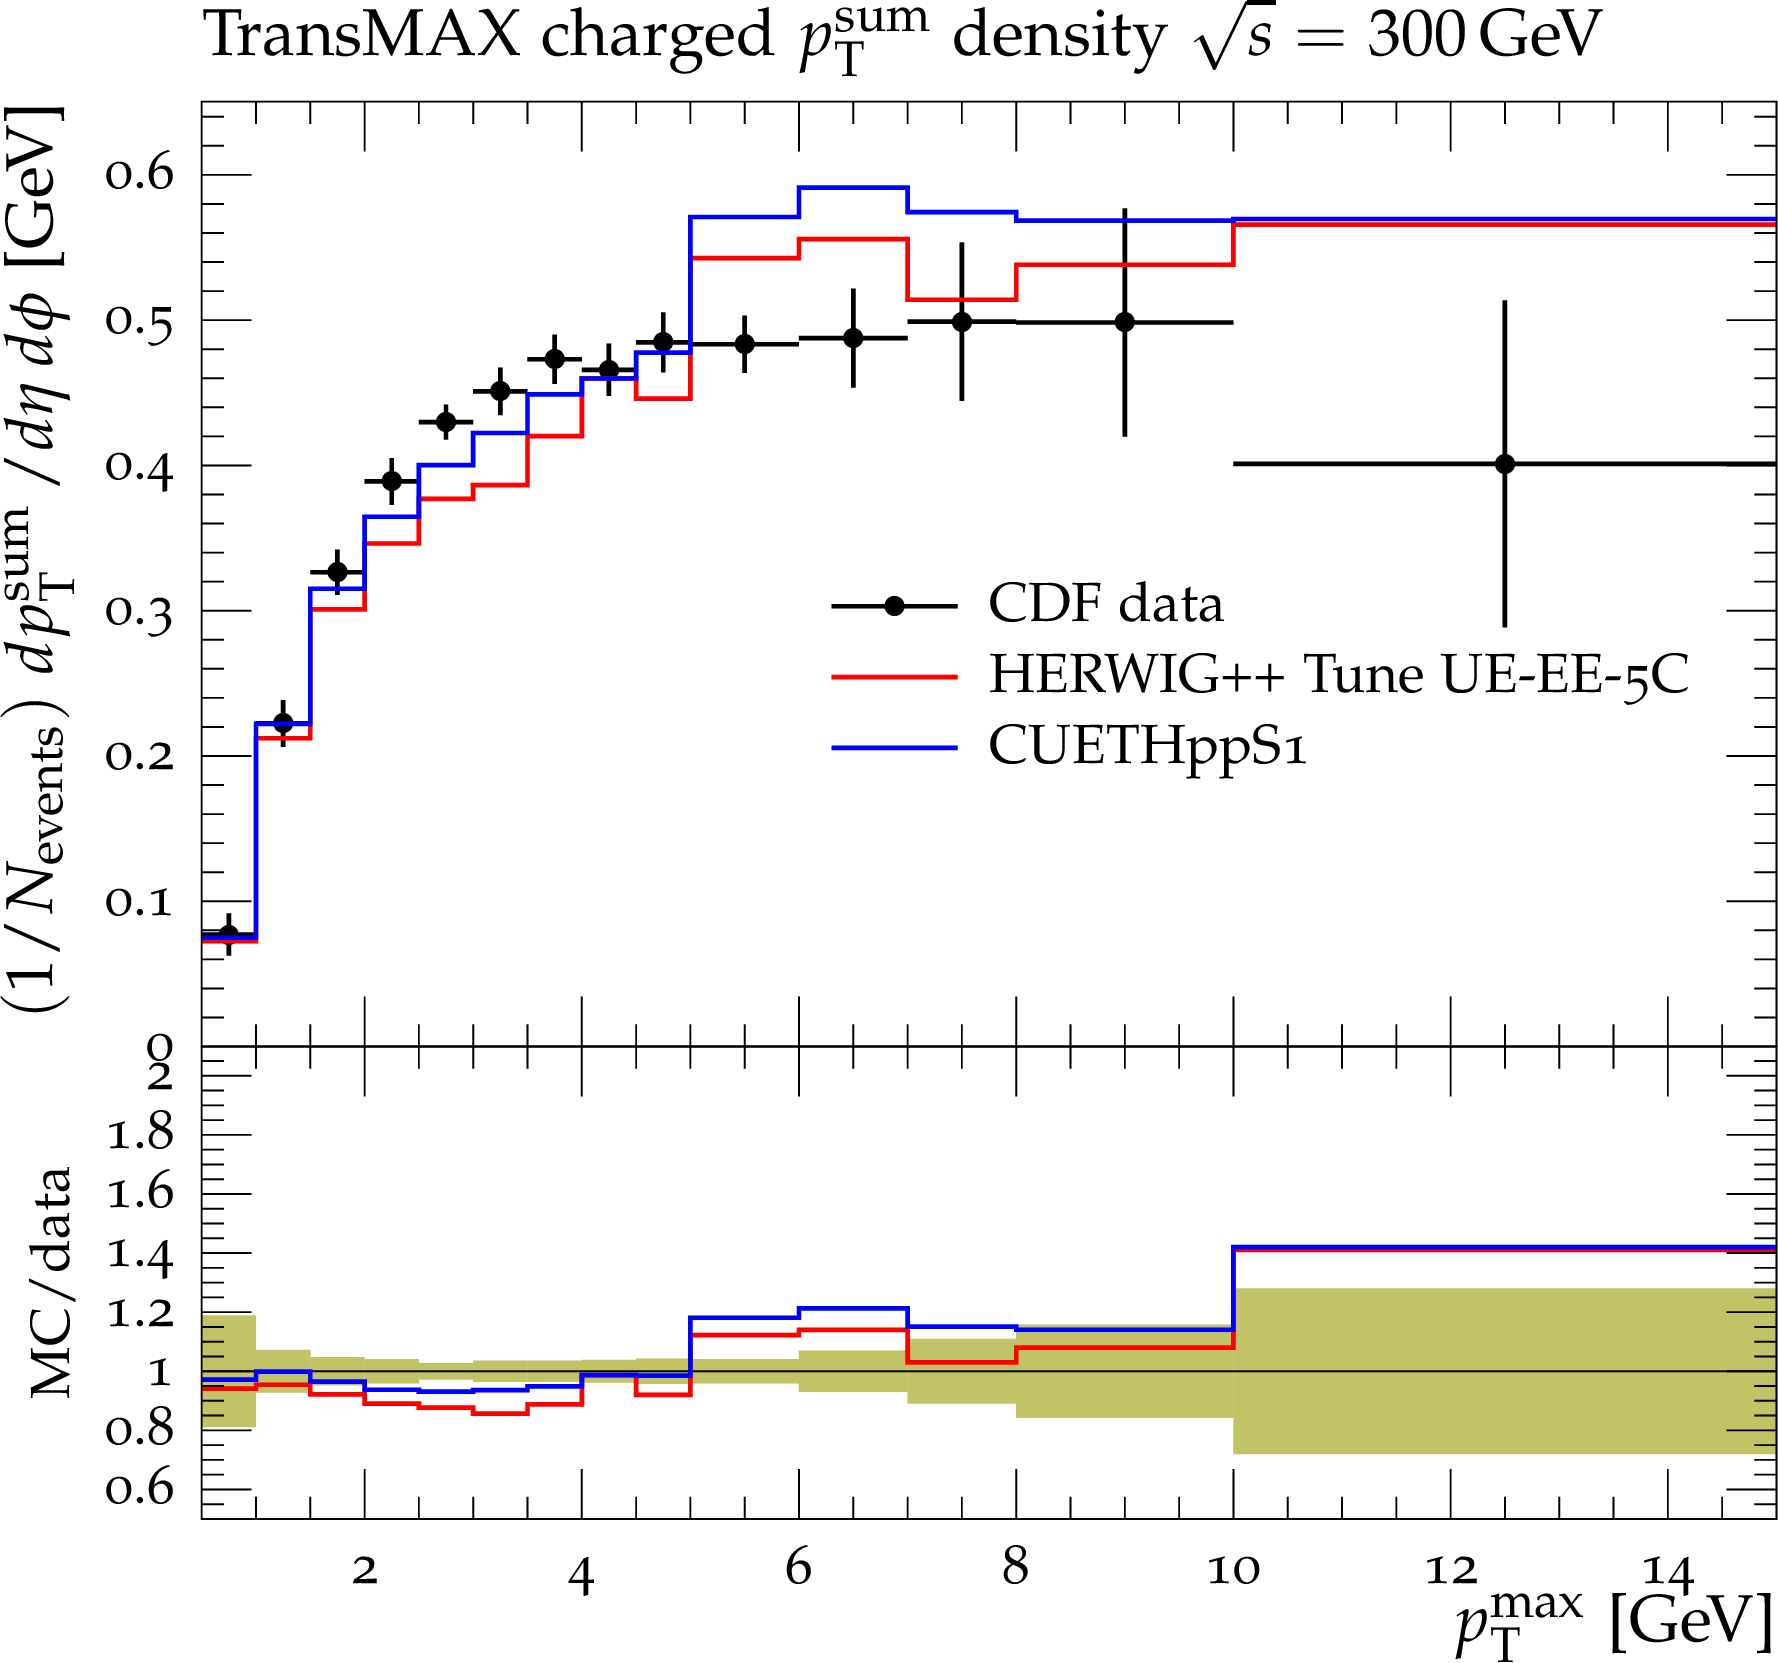
Figure 27-d:
CDF data at $\sqrt {s}=$ 300 GeV[11] on particle (a,b) and $p_{\rm T}^{\rm sum}$\ densities (c,d) for charged particles with $p_{\rm T}>$ 0.5 GeV and $|\eta |<$ 0.8 in the TransMIN\ (a,c) and TransMAX\ (b,d) regions as defined by the leading charged particle, as a function of the transverse momentum of the leading charged-particle $p_{\rm T}^{\rm max}$. The data are compared to the HERWIG++ Tune UE-EE-$5$C and CUETHppS1. The green bands in the ratios represent the total experimental uncertainties. |
png pdf |
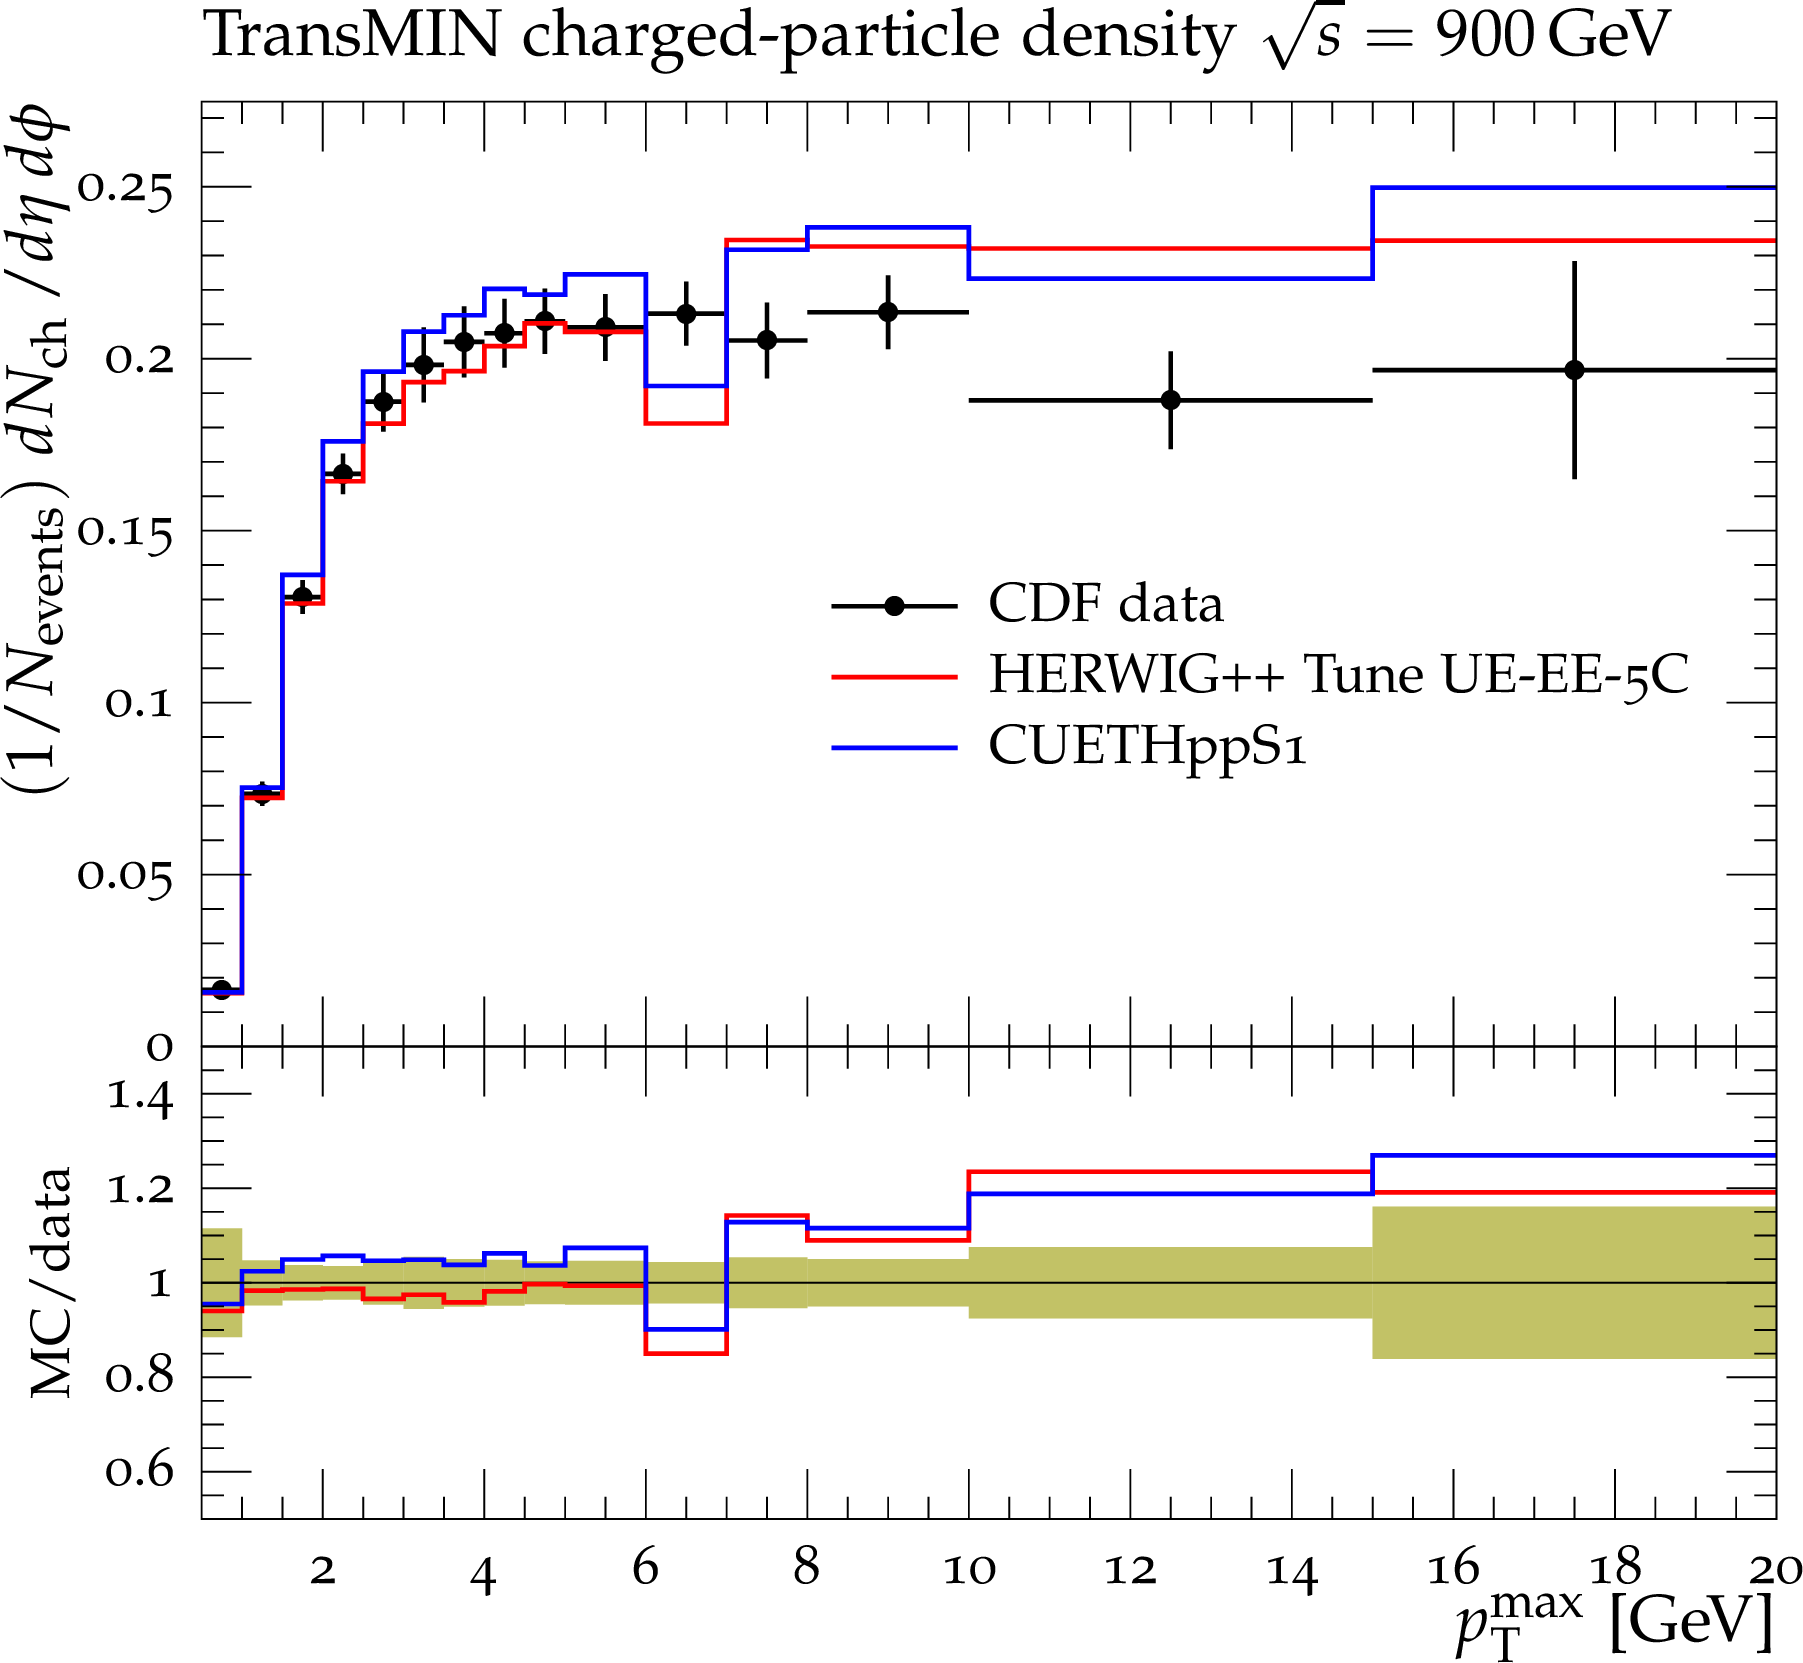
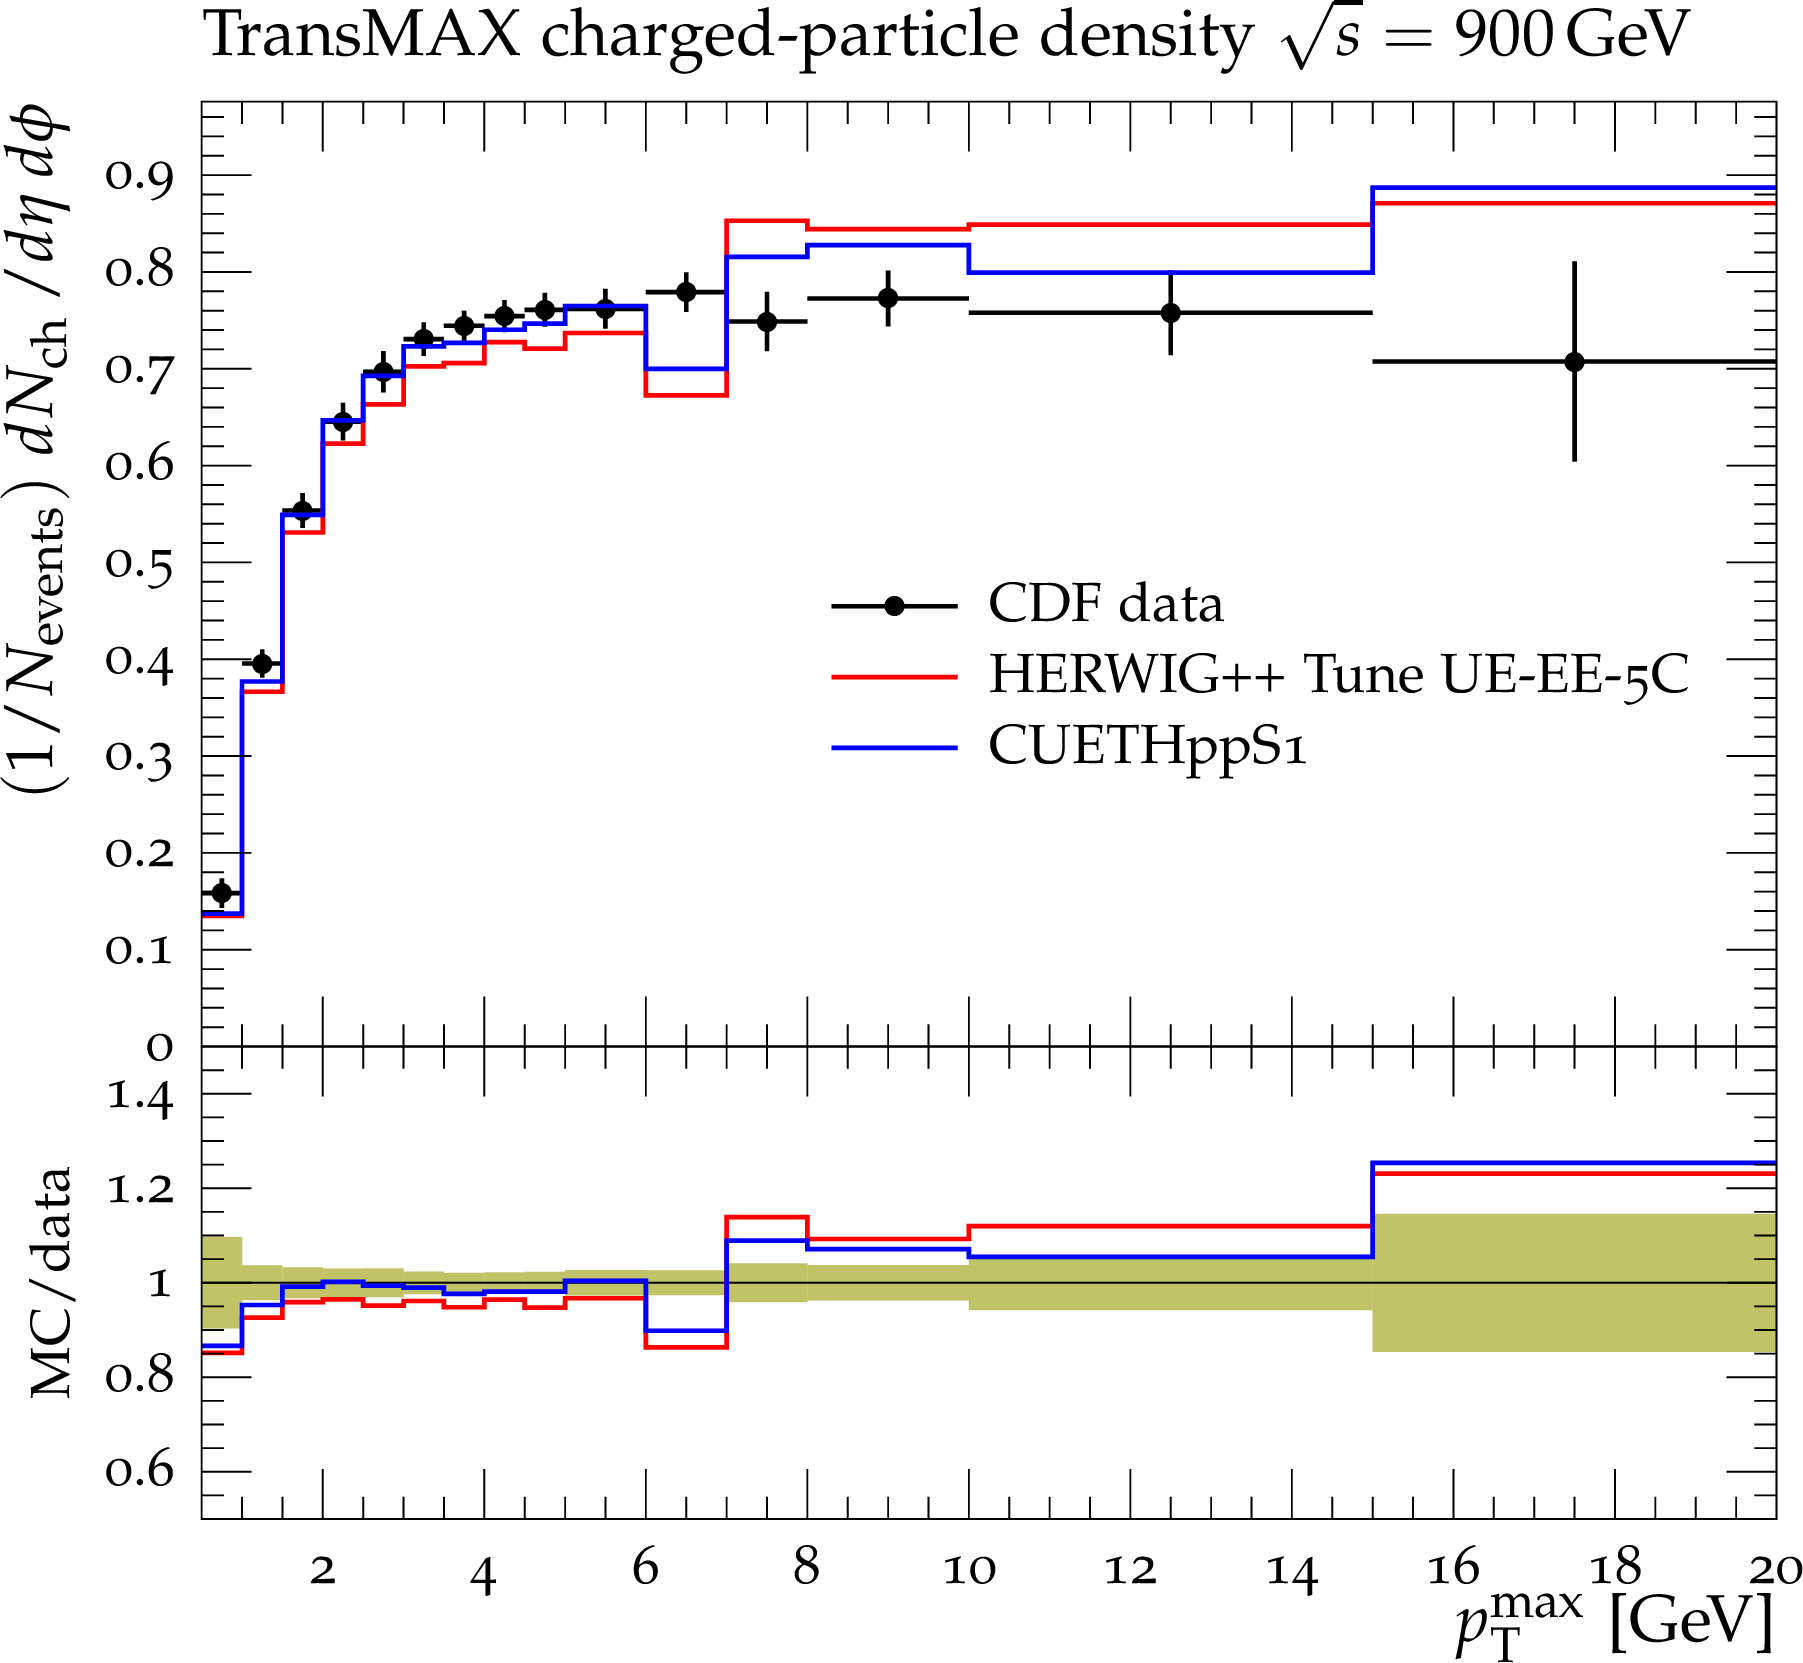
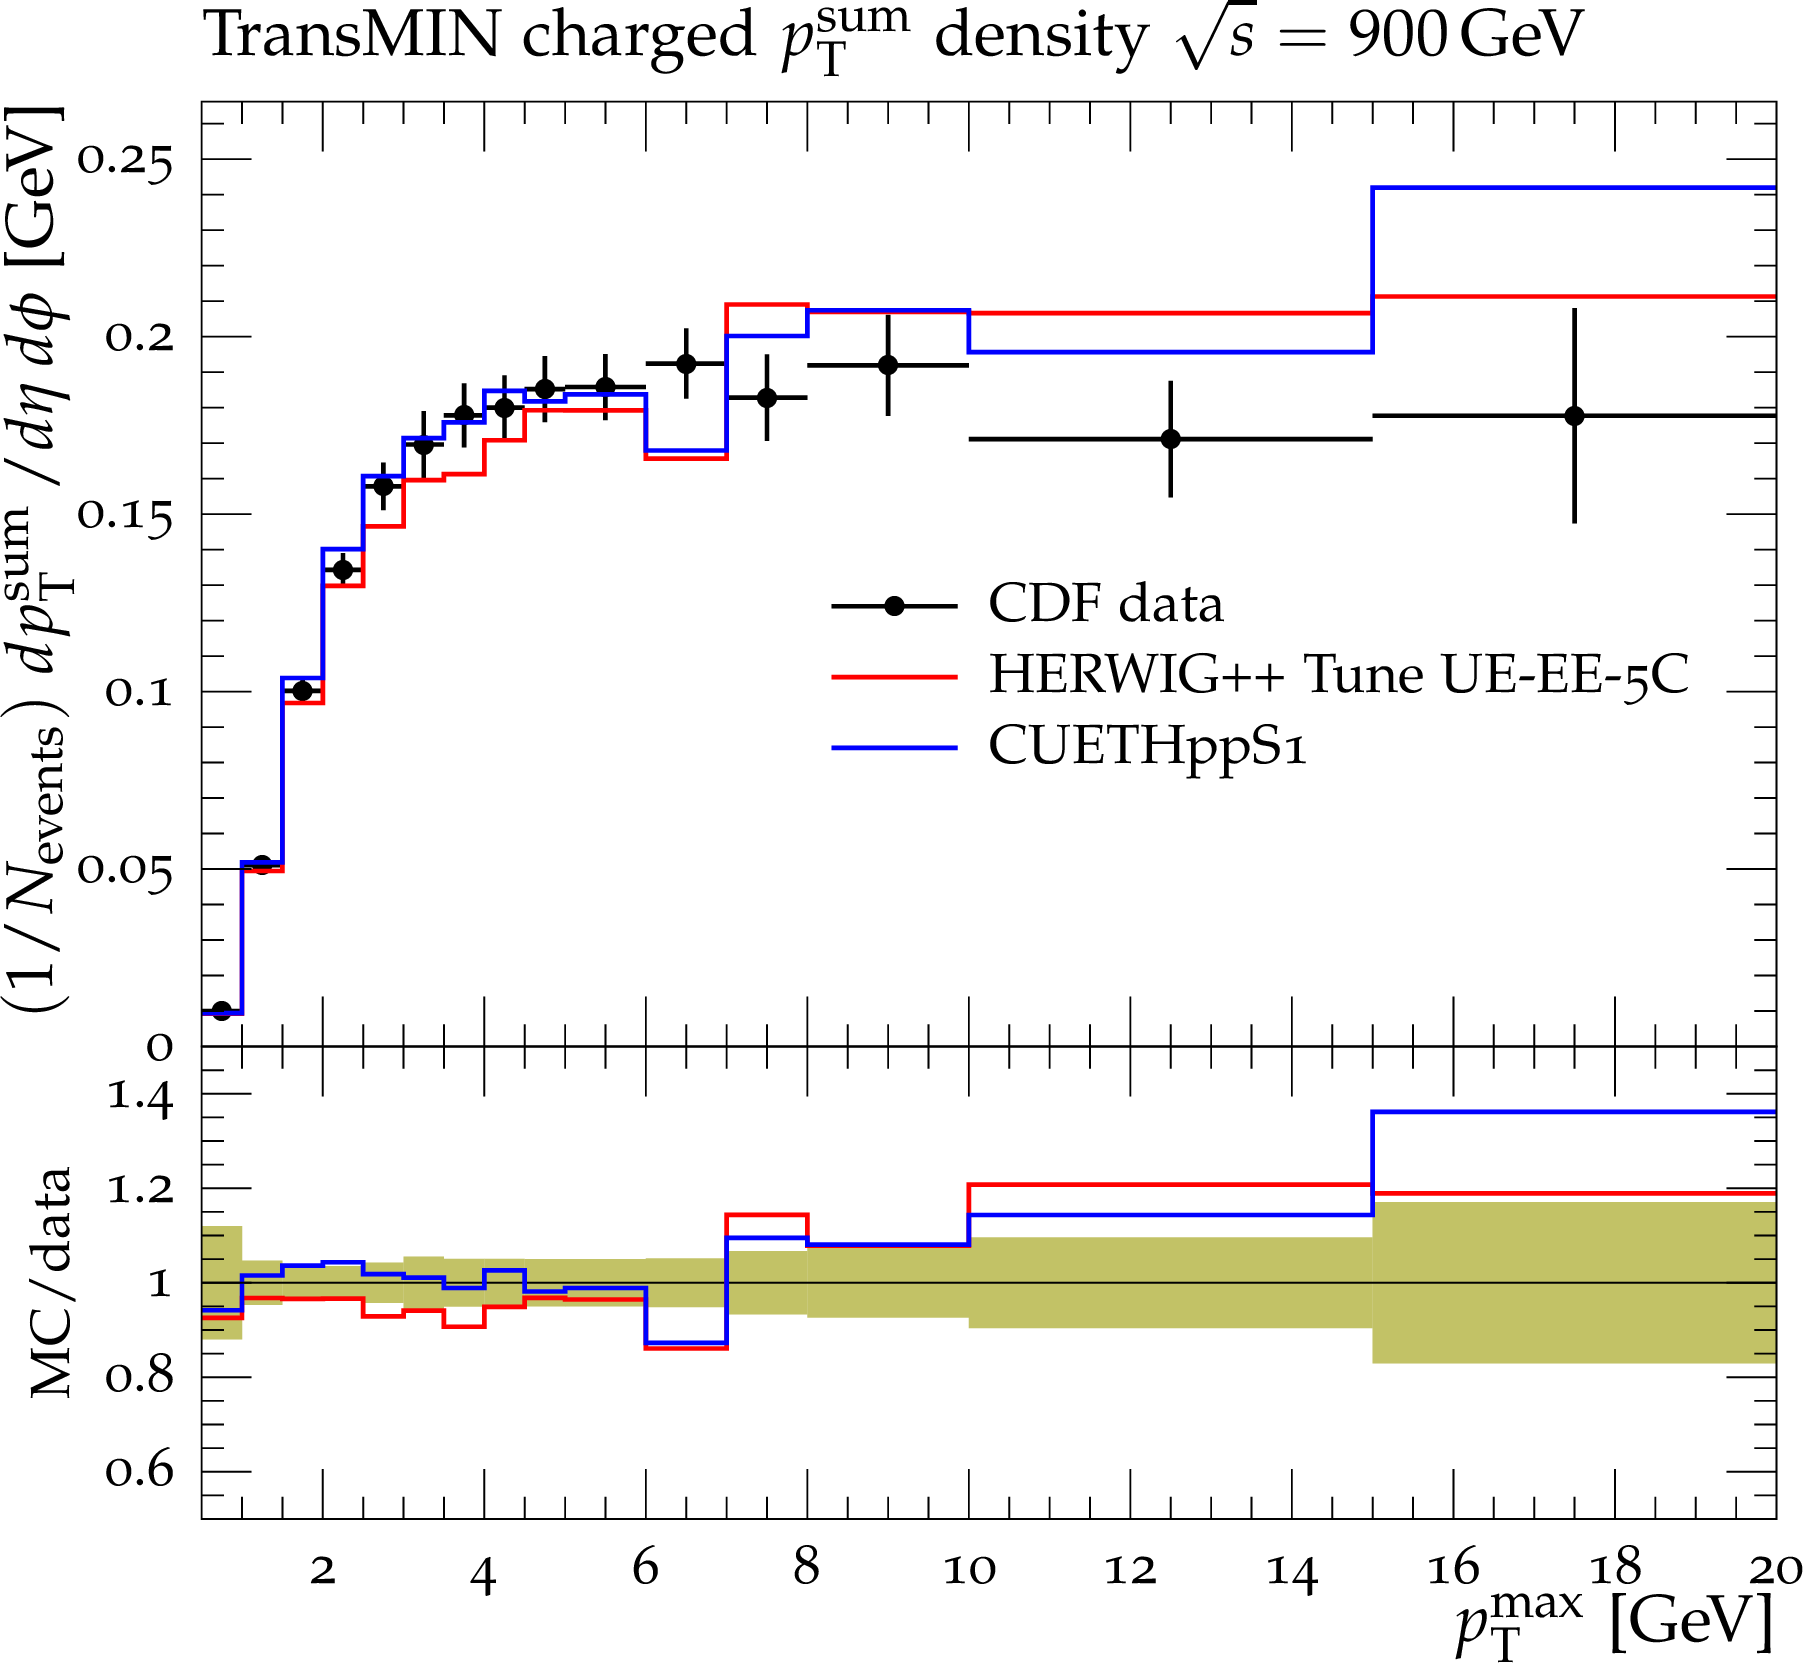
Figure 28-a:
CDF data at $\sqrt {s}=$ 900 GeV[11] on particle (a,b) and $p_{\rm T}^{\rm sum}$\ densities (c,d) for charged particles with $p_{\rm T}>$ 0.5 GeV and $|\eta |<$ 0.8 in the TransMIN (a,c) and TransMAX (b,d) regions as defined by the leading charged particle, as a function of the transverse momentum of the leading charged-particle $p_{\rm T}^{\rm max}$. The data are compared to the HERWIG++ Tune UE-EE-$5$C\ and CUETHppS1. The green bands in the ratios represent the total experimental uncertainties. |
png pdf |
Figure 28-b:
CDF data at $\sqrt {s}=$ 900 GeV[11] on particle (a,b) and $p_{\rm T}^{\rm sum}$\ densities (c,d) for charged particles with $p_{\rm T}>$ 0.5 GeV and $|\eta |<$ 0.8 in the TransMIN (a,c) and TransMAX (b,d) regions as defined by the leading charged particle, as a function of the transverse momentum of the leading charged-particle $p_{\rm T}^{\rm max}$. The data are compared to the HERWIG++ Tune UE-EE-$5$C\ and CUETHppS1. The green bands in the ratios represent the total experimental uncertainties. |
png pdf |
Figure 28-c:
CDF data at $\sqrt {s}=$ 900 GeV[11] on particle (a,b) and $p_{\rm T}^{\rm sum}$\ densities (c,d) for charged particles with $p_{\rm T}>$ 0.5 GeV and $|\eta |<$ 0.8 in the TransMIN (a,c) and TransMAX (b,d) regions as defined by the leading charged particle, as a function of the transverse momentum of the leading charged-particle $p_{\rm T}^{\rm max}$. The data are compared to the HERWIG++ Tune UE-EE-$5$C\ and CUETHppS1. The green bands in the ratios represent the total experimental uncertainties. |

png pdf |
Figure 28-d:
CDF data at $\sqrt {s}=$ 900 GeV[11] on particle (a,b) and $p_{\rm T}^{\rm sum}$\ densities (c,d) for charged particles with $p_{\rm T}>$ 0.5 GeV and $|\eta |<$ 0.8 in the TransMIN (a,c) and TransMAX (b,d) regions as defined by the leading charged particle, as a function of the transverse momentum of the leading charged-particle $p_{\rm T}^{\rm max}$. The data are compared to the HERWIG++ Tune UE-EE-$5$C\ and CUETHppS1. The green bands in the ratios represent the total experimental uncertainties. |
png pdf |
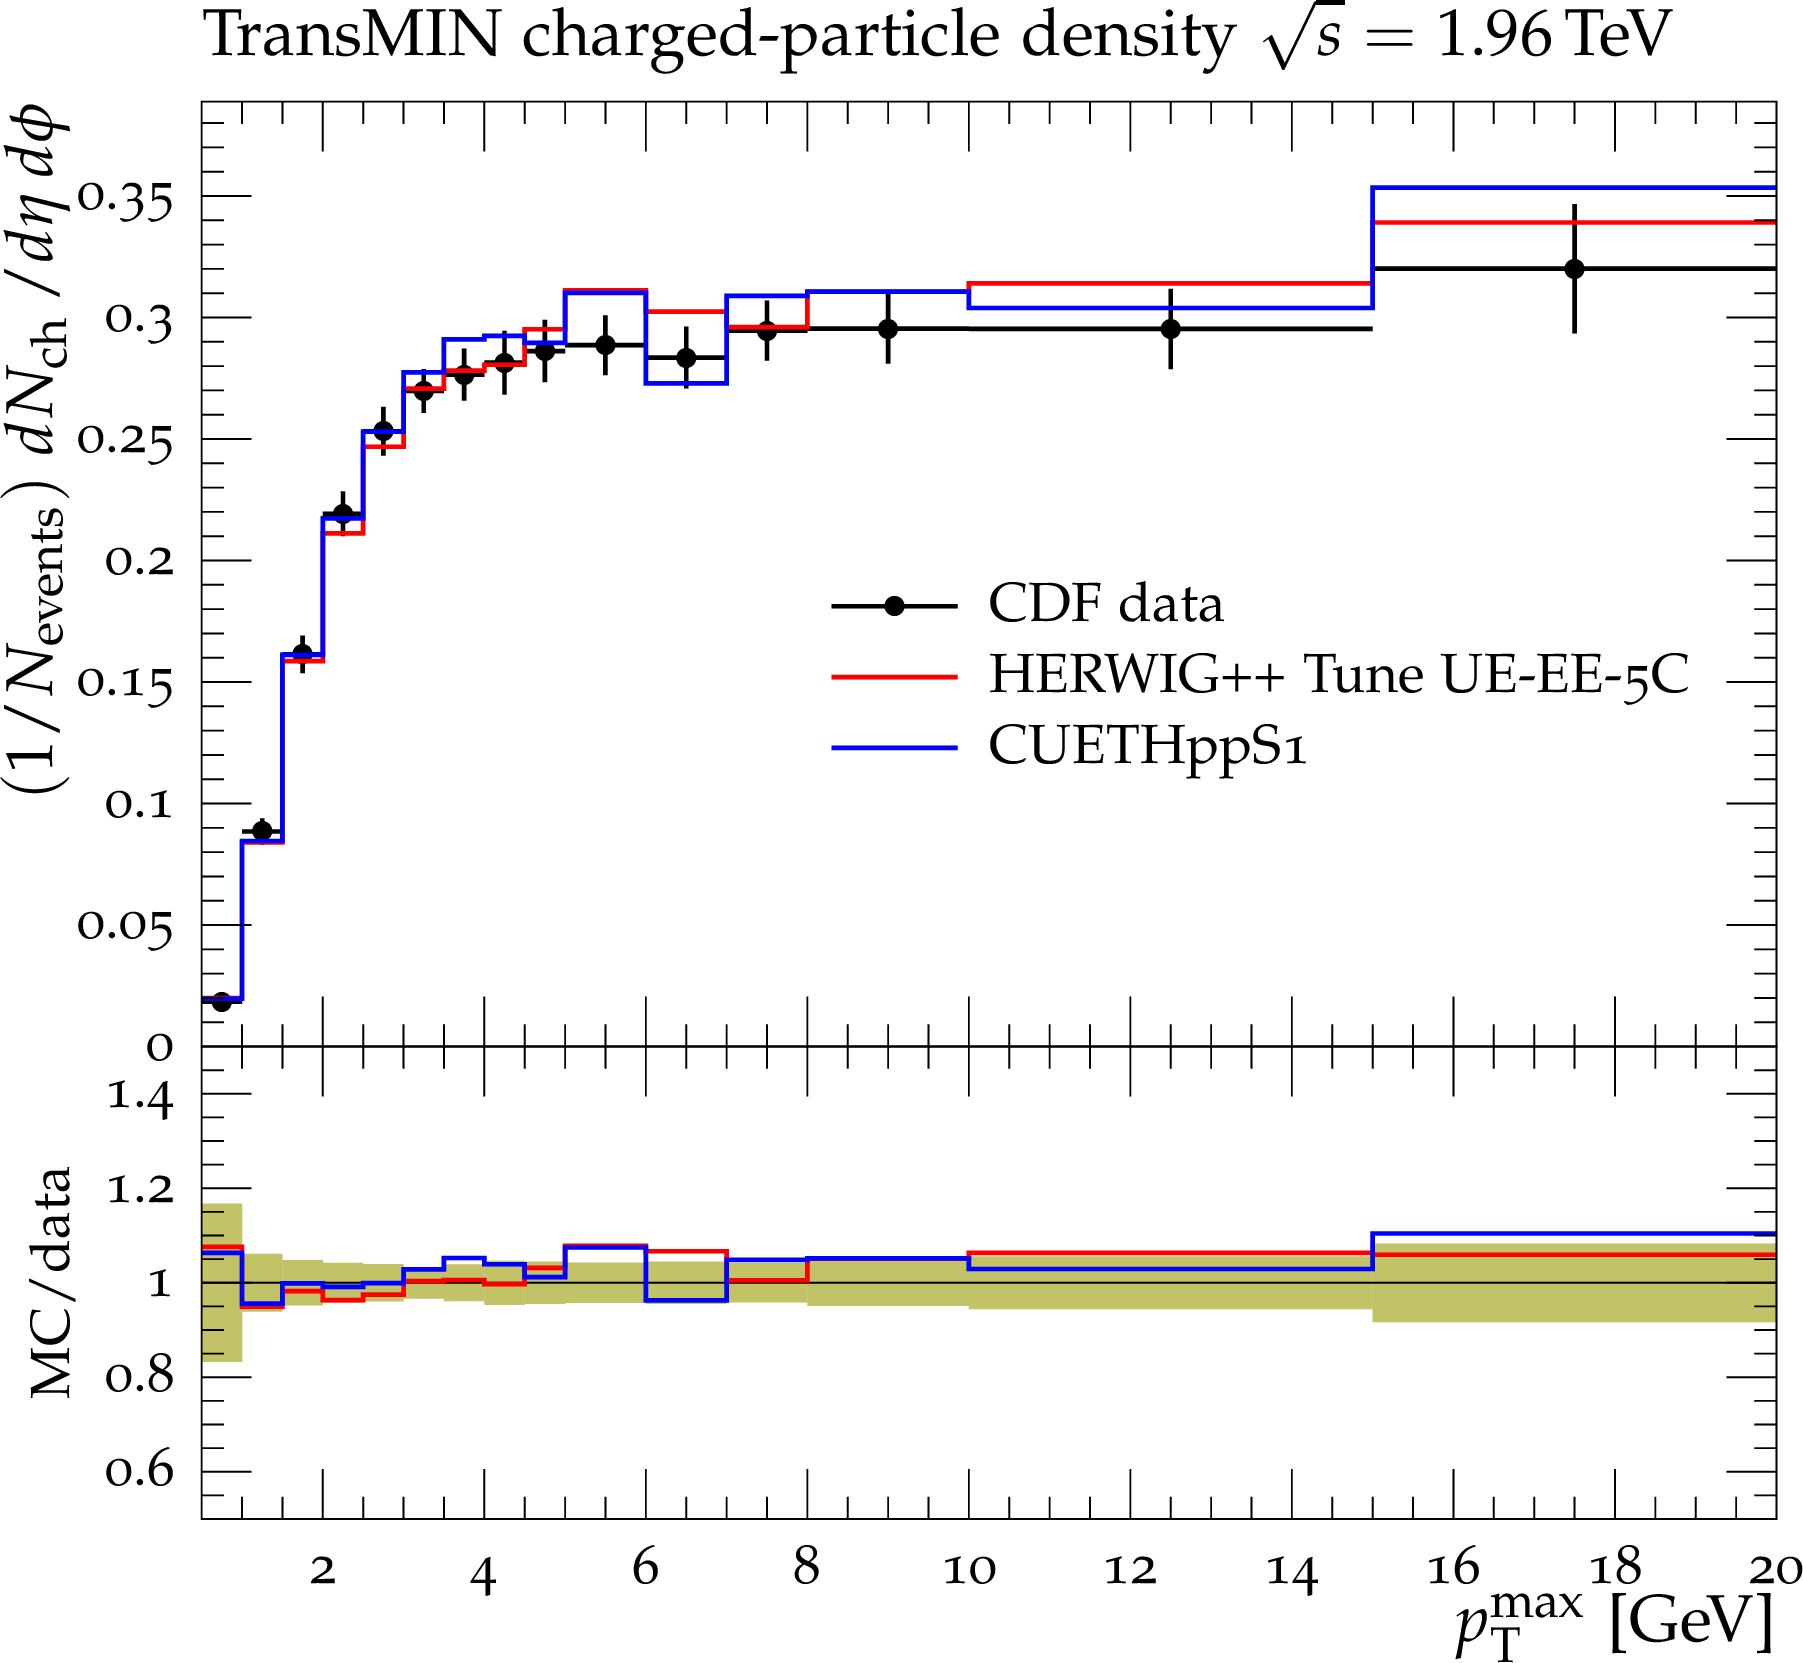
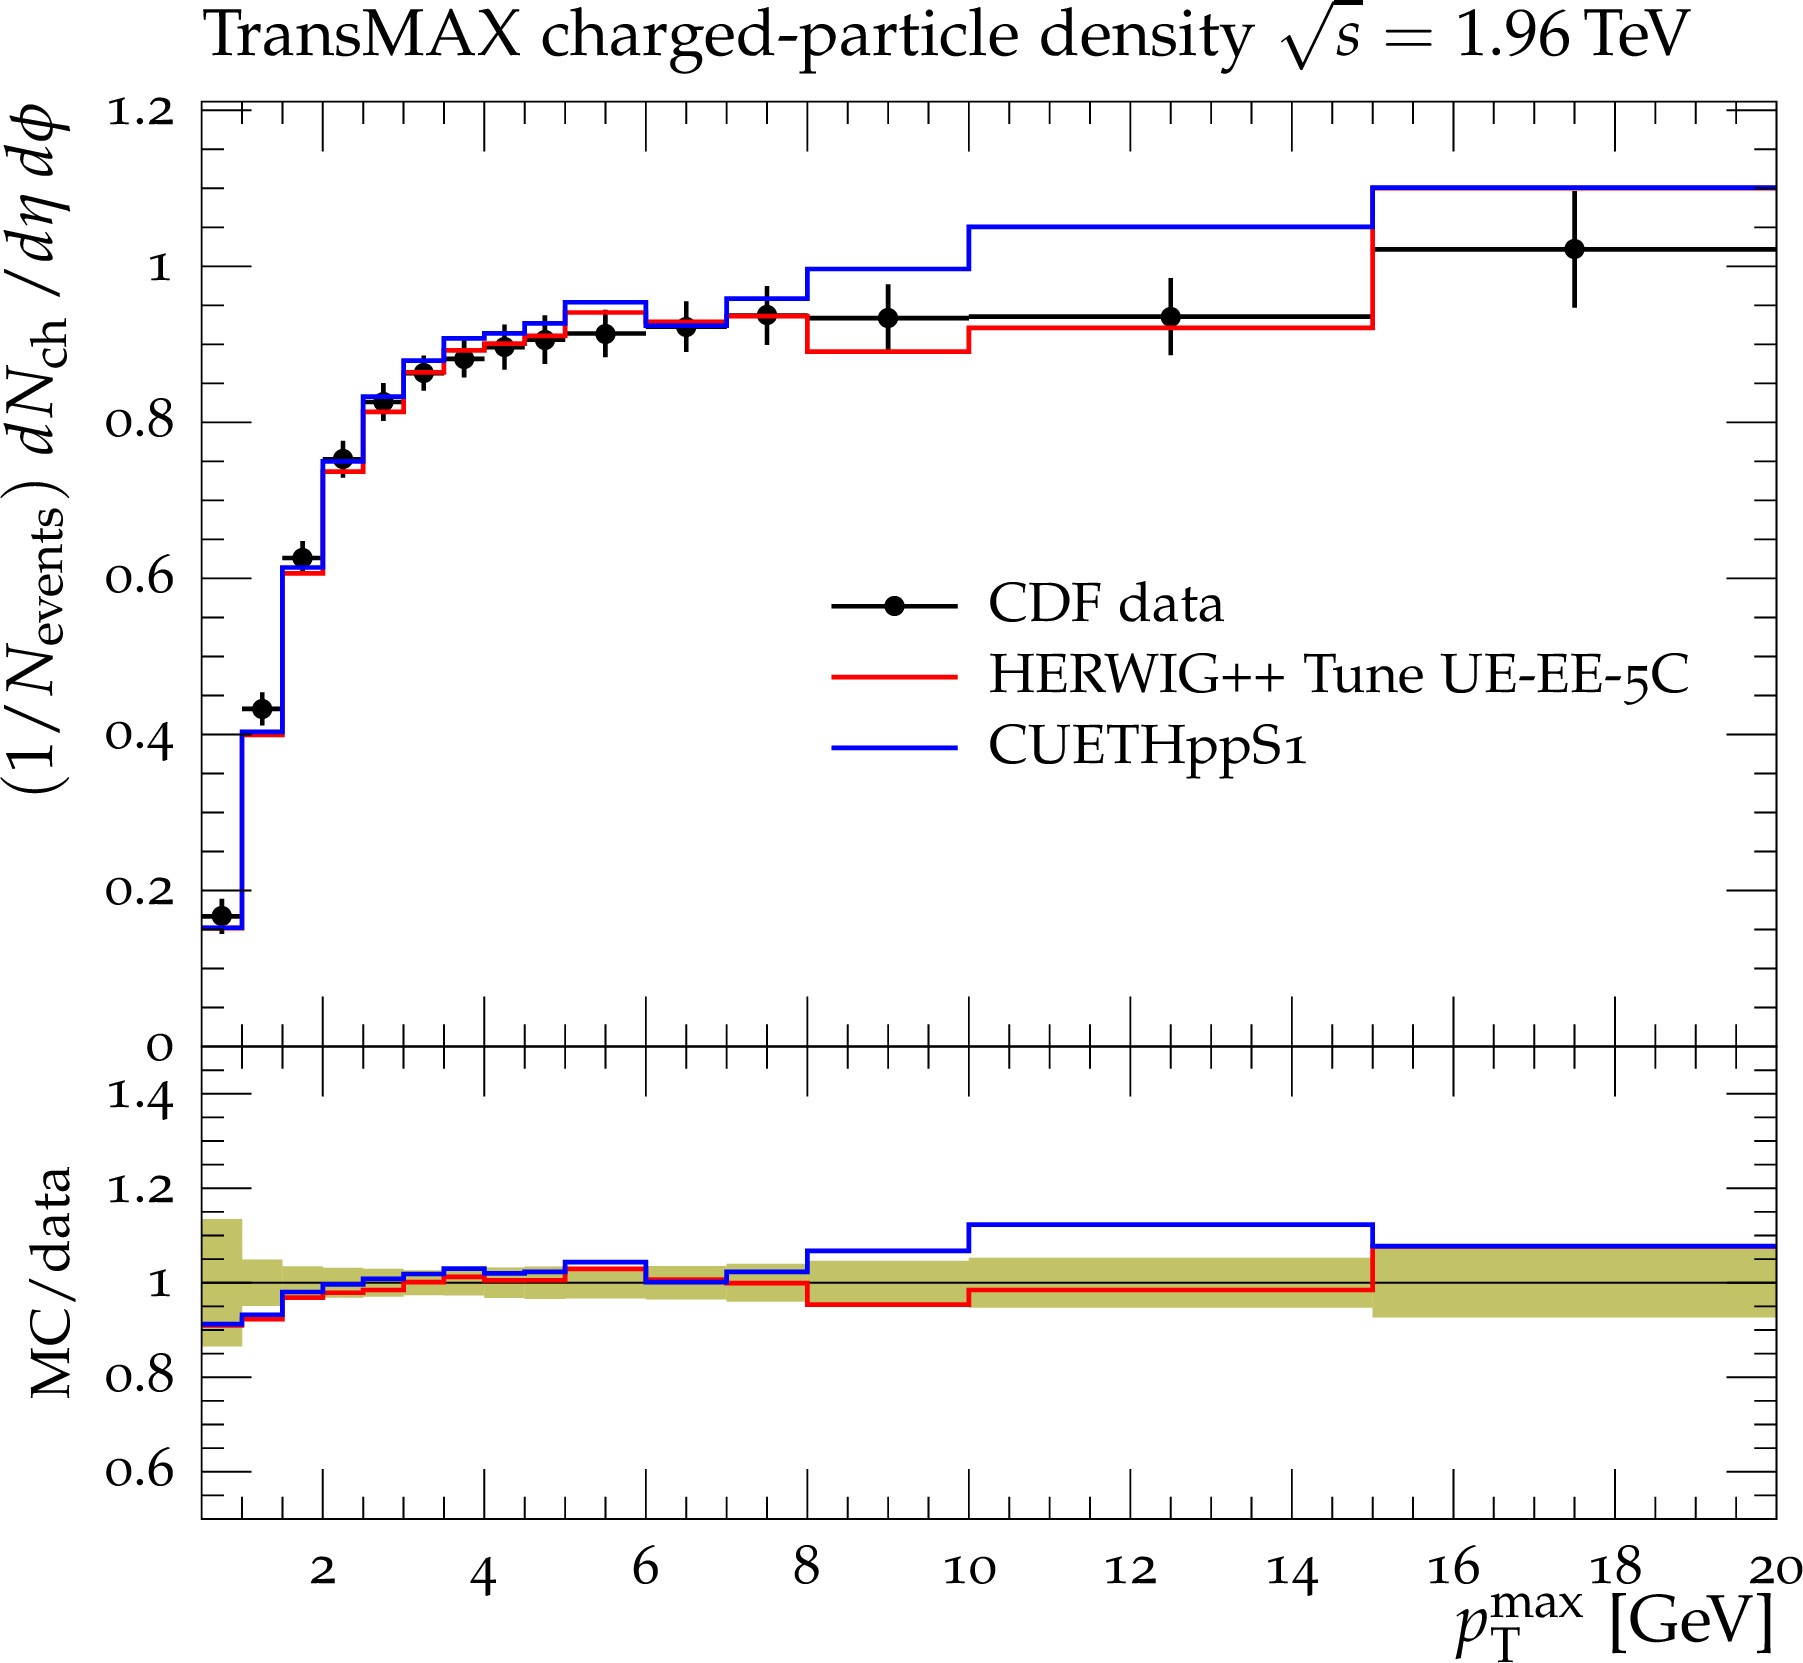
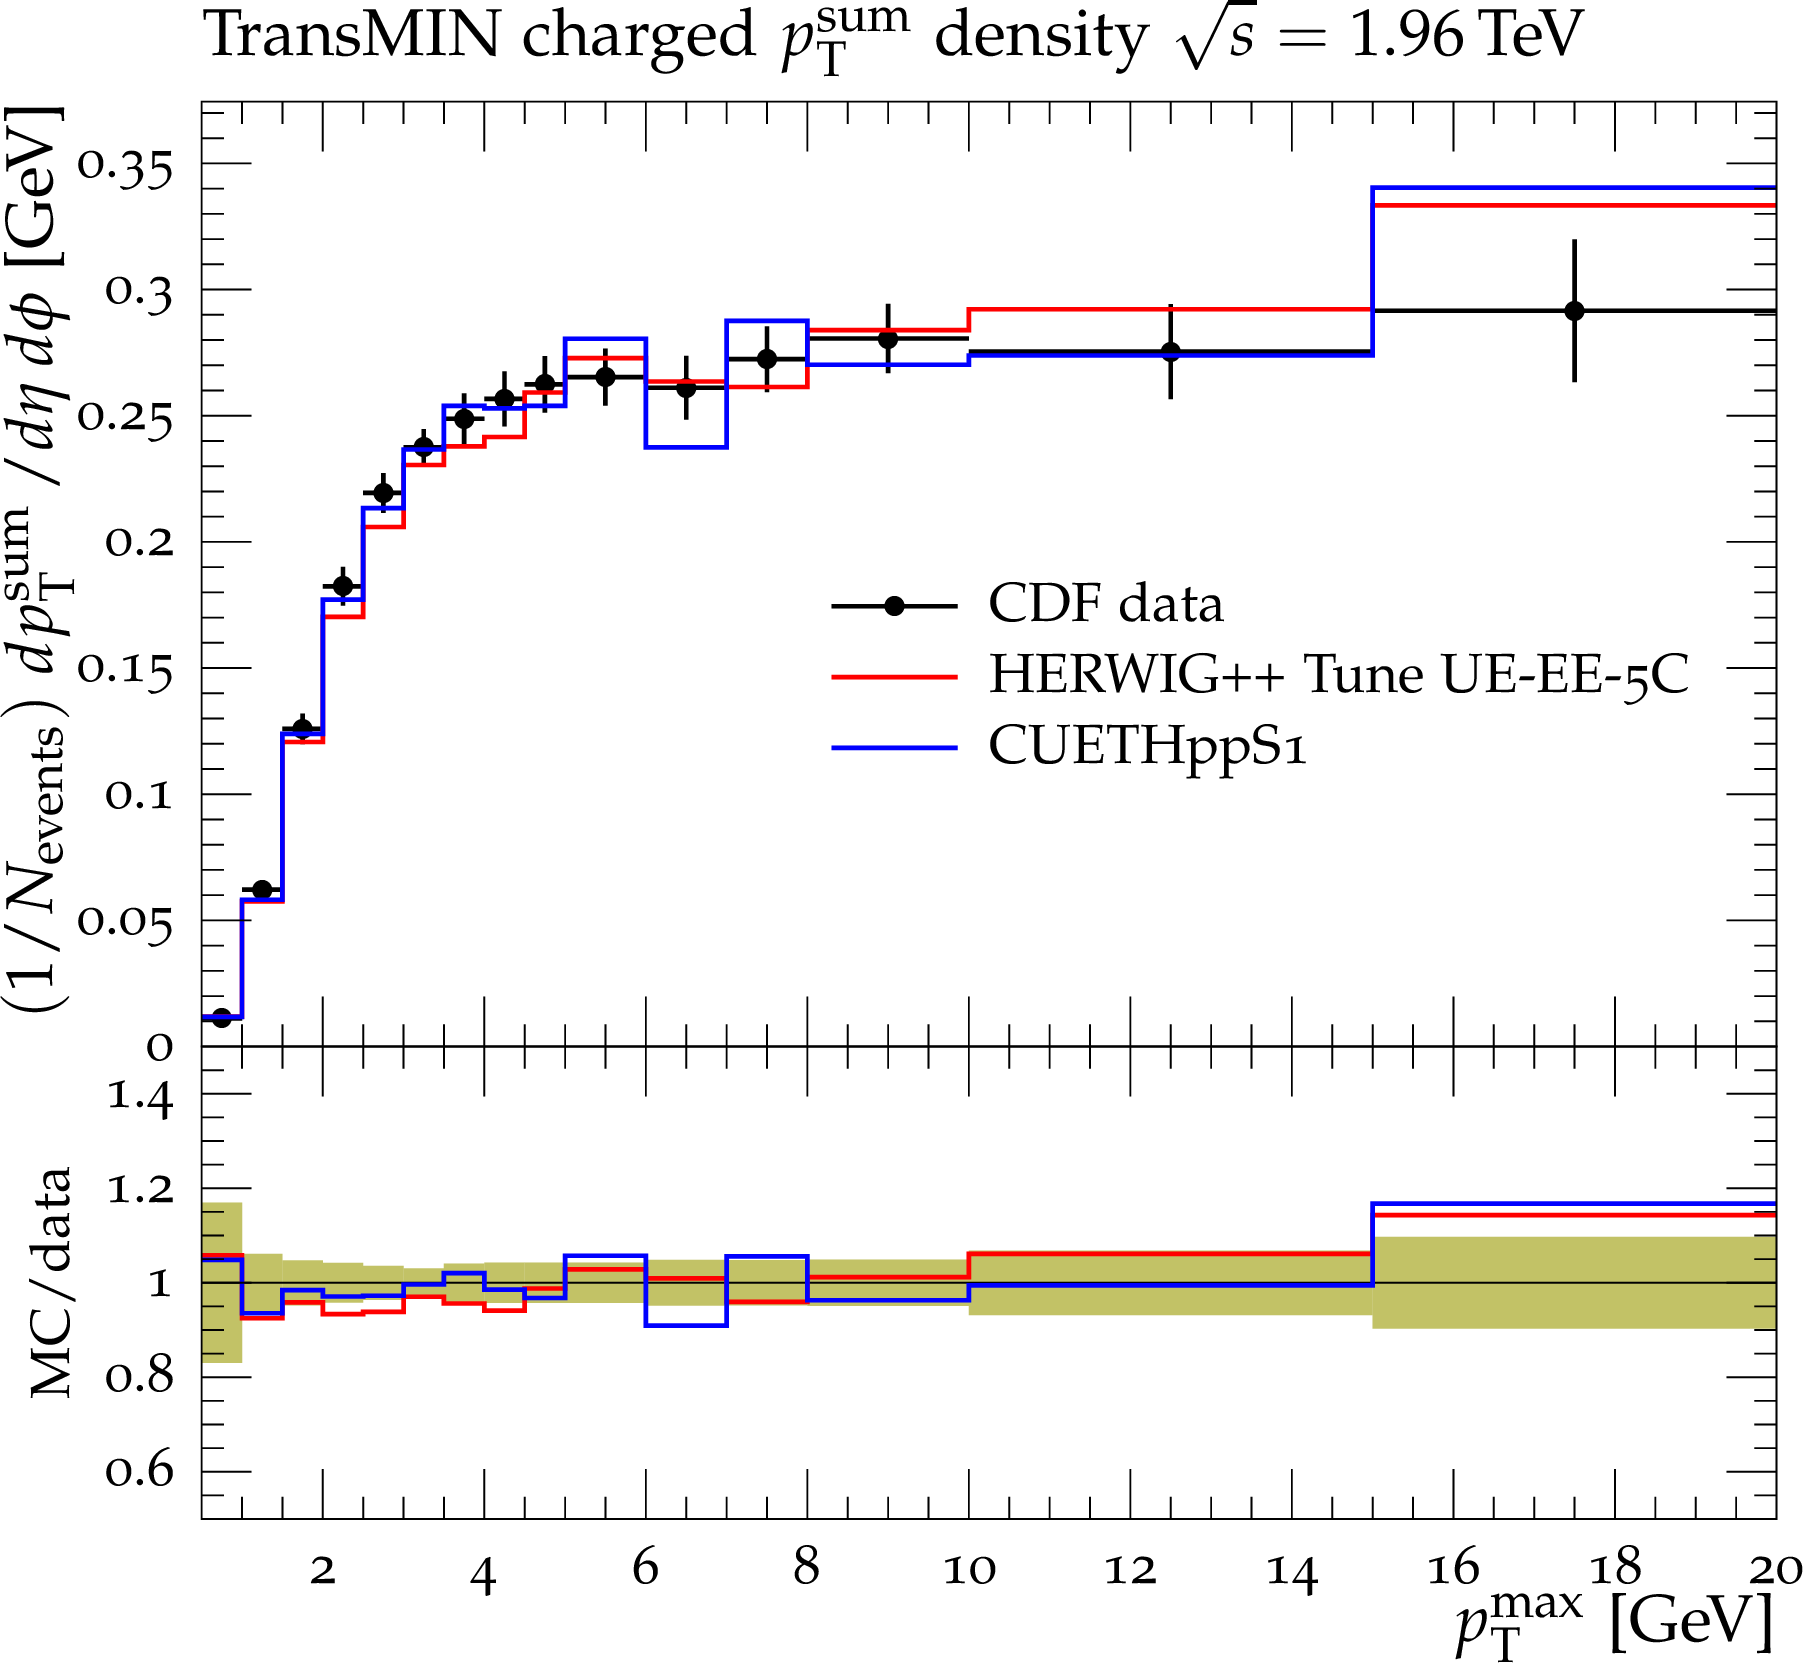
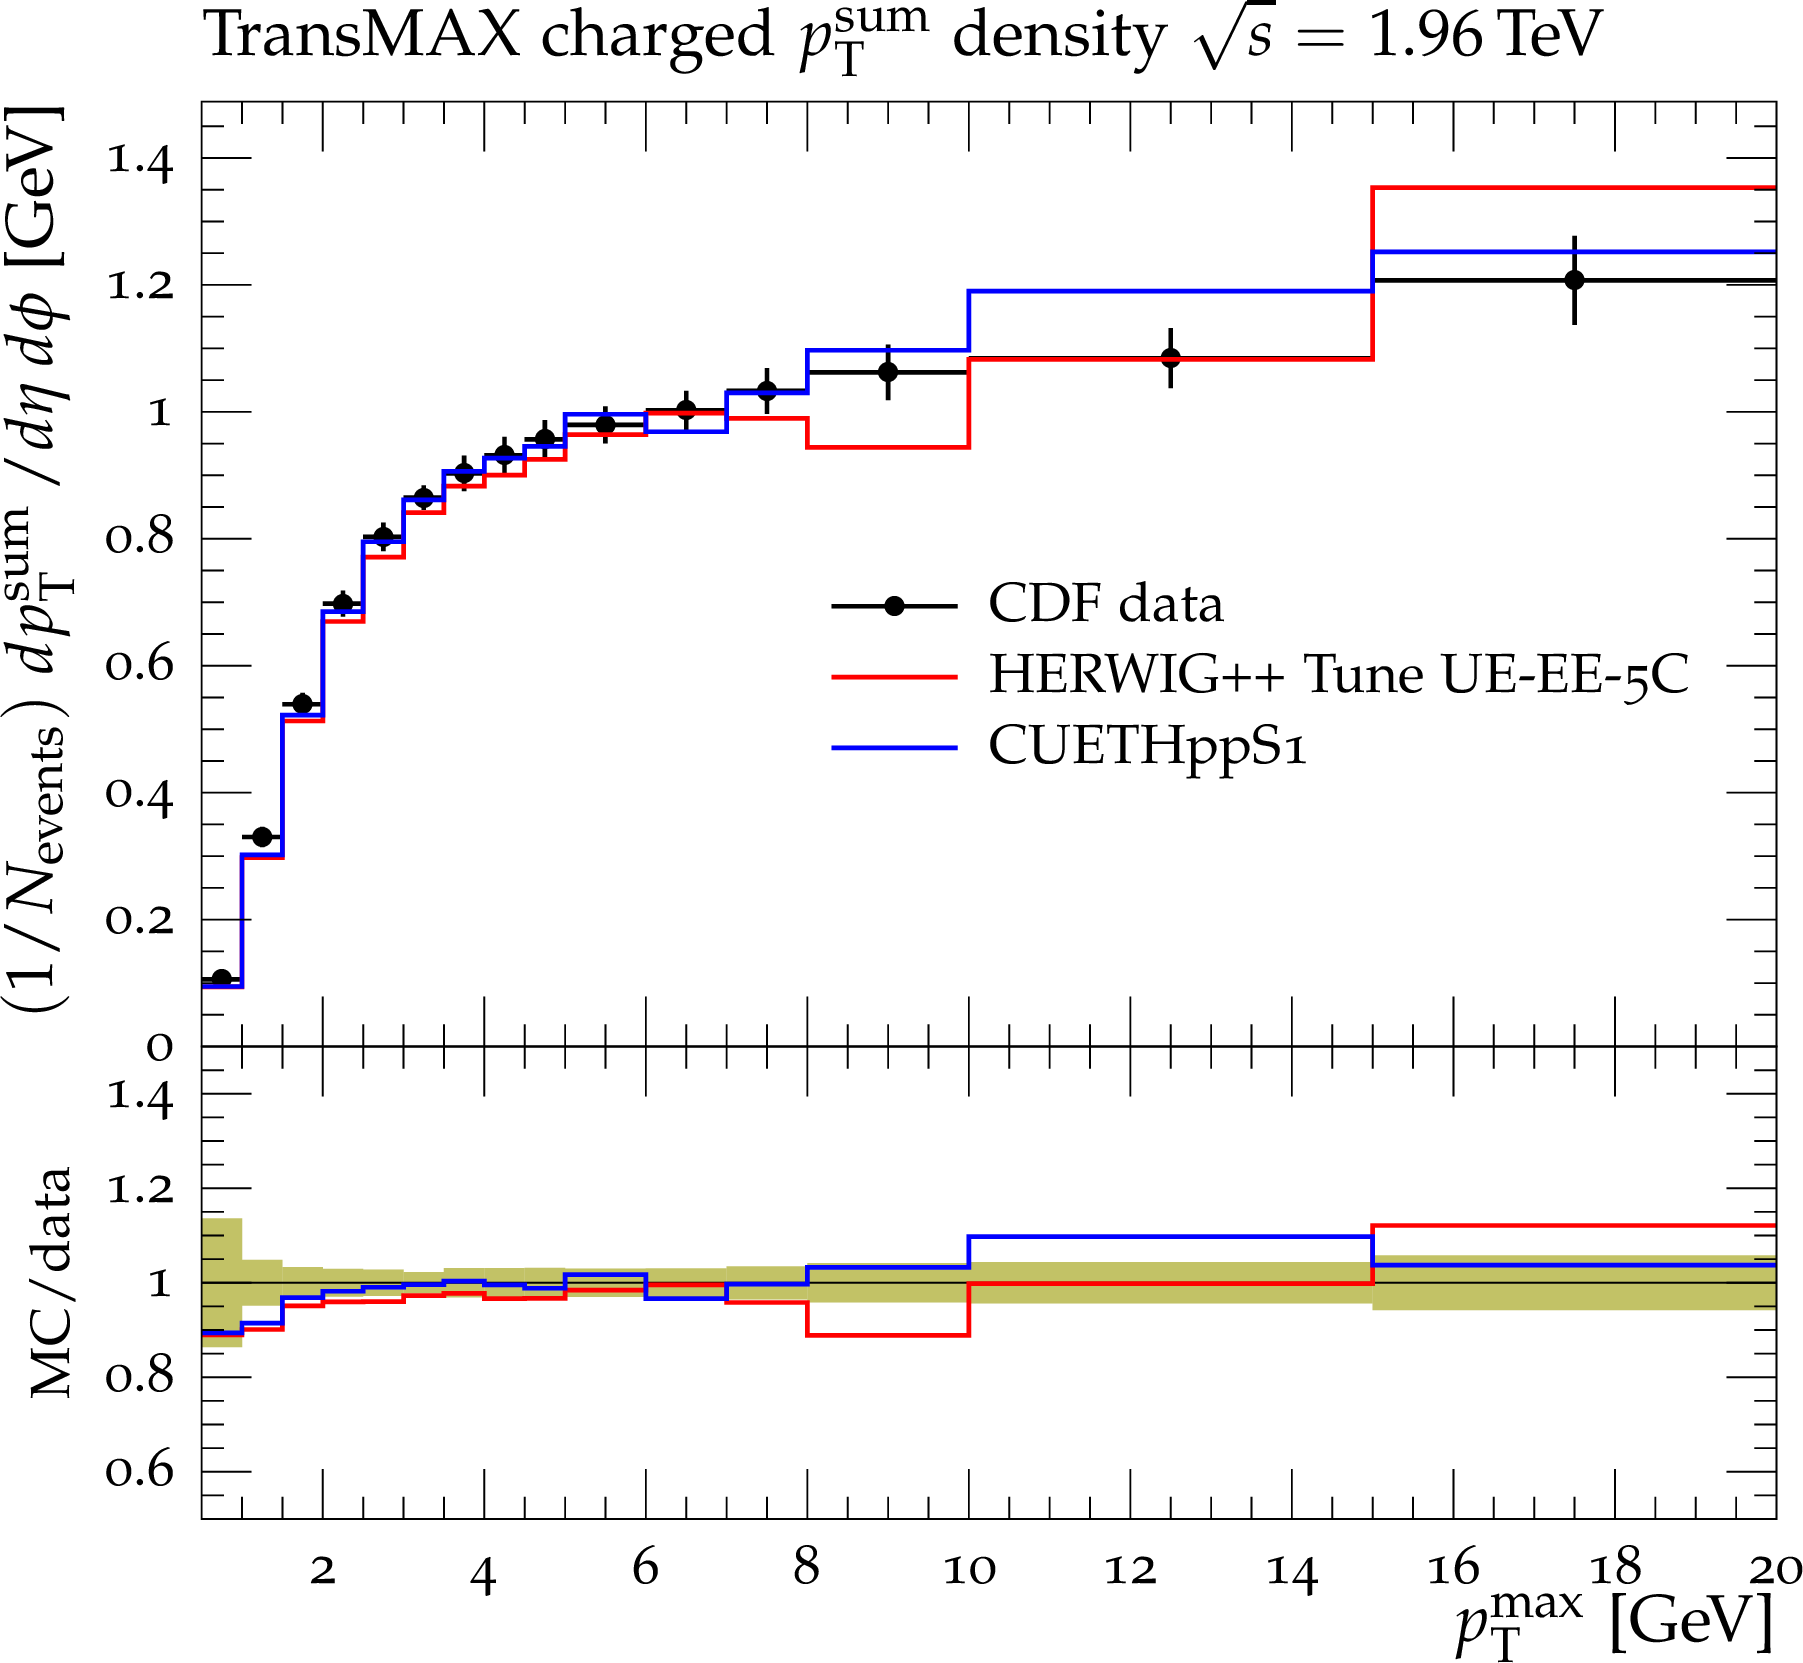
Figure 29-a:
CDF data at $\sqrt {s}=$ 1.96 TeV[11] on particle (a,b) and $p_{\rm T}^{\rm sum}$\ densities (c,d) for charged particles with $p_{\rm T}>$ 0.5 GeV and $|\eta |<$ 0.8 in the TransMIN (a,c) and TransMAX (b,d) regions as defined by the leading charged particle, as a function of the transverse momentum of the leading charged-particle $p_{\rm T}^{\rm max}$. The data are compared to the HERWIG++ Tune UE-EE-$5$C and CUETHppS1. The green bands in the ratios represent the total experimental uncertainties. |
png pdf |
Figure 29-b:
CDF data at $\sqrt {s}=$ 1.96 TeV[11] on particle (a,b) and $p_{\rm T}^{\rm sum}$\ densities (c,d) for charged particles with $p_{\rm T}>$ 0.5 GeV and $|\eta |<$ 0.8 in the TransMIN (a,c) and TransMAX (b,d) regions as defined by the leading charged particle, as a function of the transverse momentum of the leading charged-particle $p_{\rm T}^{\rm max}$. The data are compared to the HERWIG++ Tune UE-EE-$5$C and CUETHppS1. The green bands in the ratios represent the total experimental uncertainties. |
png pdf |
Figure 29-c:
CDF data at $\sqrt {s}=$ 1.96 TeV[11] on particle (a,b) and $p_{\rm T}^{\rm sum}$\ densities (c,d) for charged particles with $p_{\rm T}>$ 0.5 GeV and $|\eta |<$ 0.8 in the TransMIN (a,c) and TransMAX (b,d) regions as defined by the leading charged particle, as a function of the transverse momentum of the leading charged-particle $p_{\rm T}^{\rm max}$. The data are compared to the HERWIG++ Tune UE-EE-$5$C and CUETHppS1. The green bands in the ratios represent the total experimental uncertainties. |
png pdf |
Figure 29-d:
CDF data at $\sqrt {s}=$ 1.96 TeV[11] on particle (a,b) and $p_{\rm T}^{\rm sum}$\ densities (c,d) for charged particles with $p_{\rm T}>$ 0.5 GeV and $|\eta |<$ 0.8 in the TransMIN (a,c) and TransMAX (b,d) regions as defined by the leading charged particle, as a function of the transverse momentum of the leading charged-particle $p_{\rm T}^{\rm max}$. The data are compared to the HERWIG++ Tune UE-EE-$5$C and CUETHppS1. The green bands in the ratios represent the total experimental uncertainties. |
png pdf |
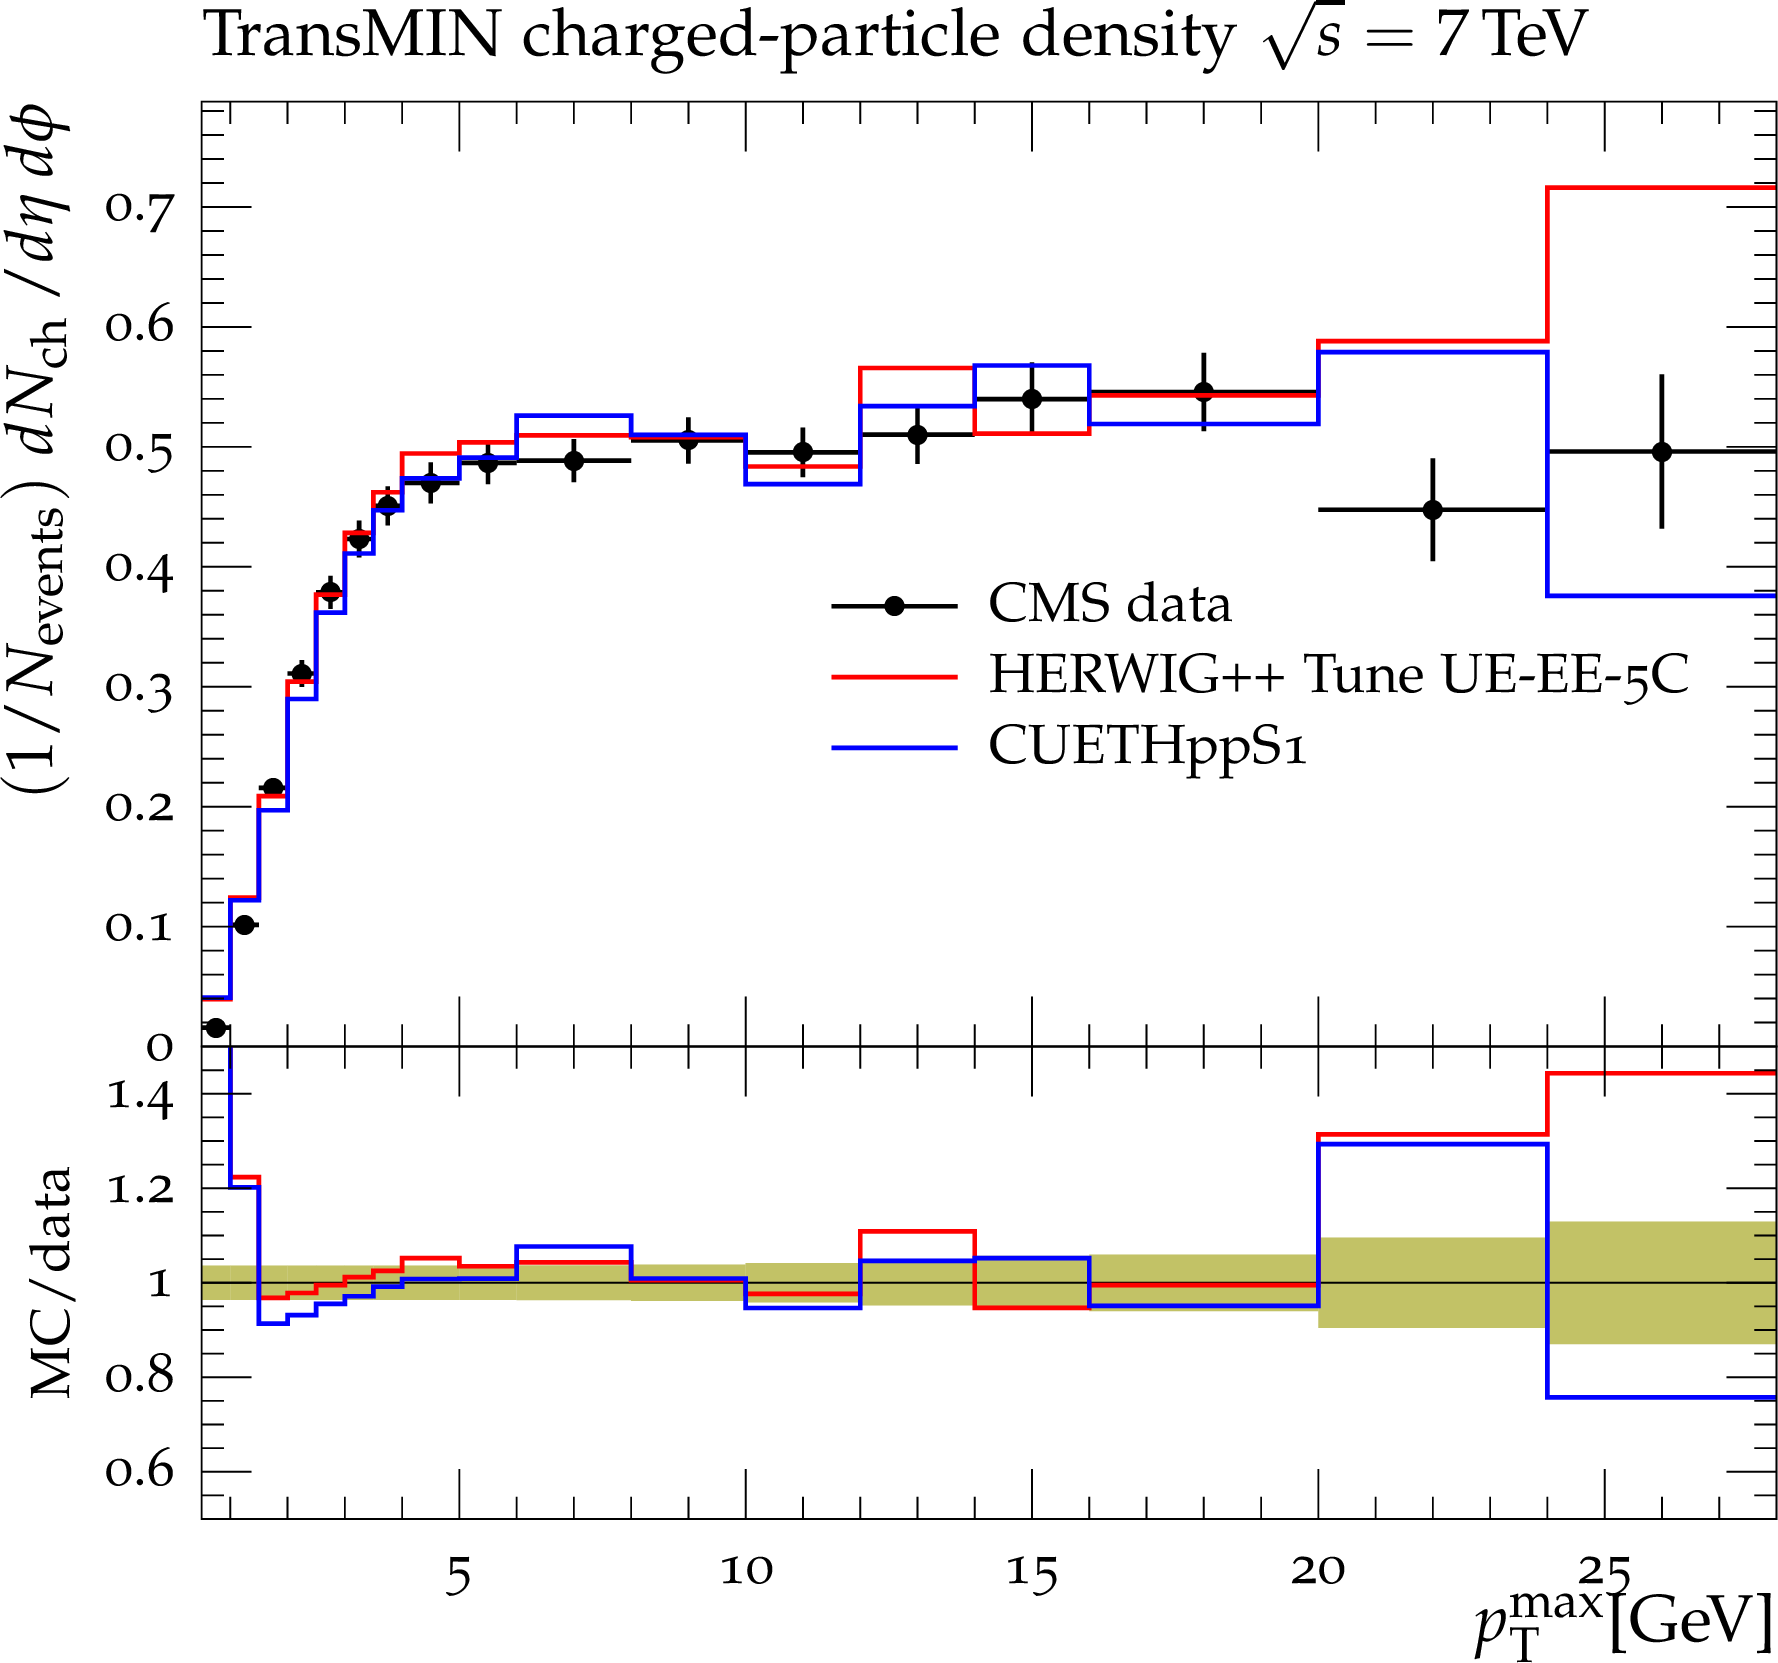
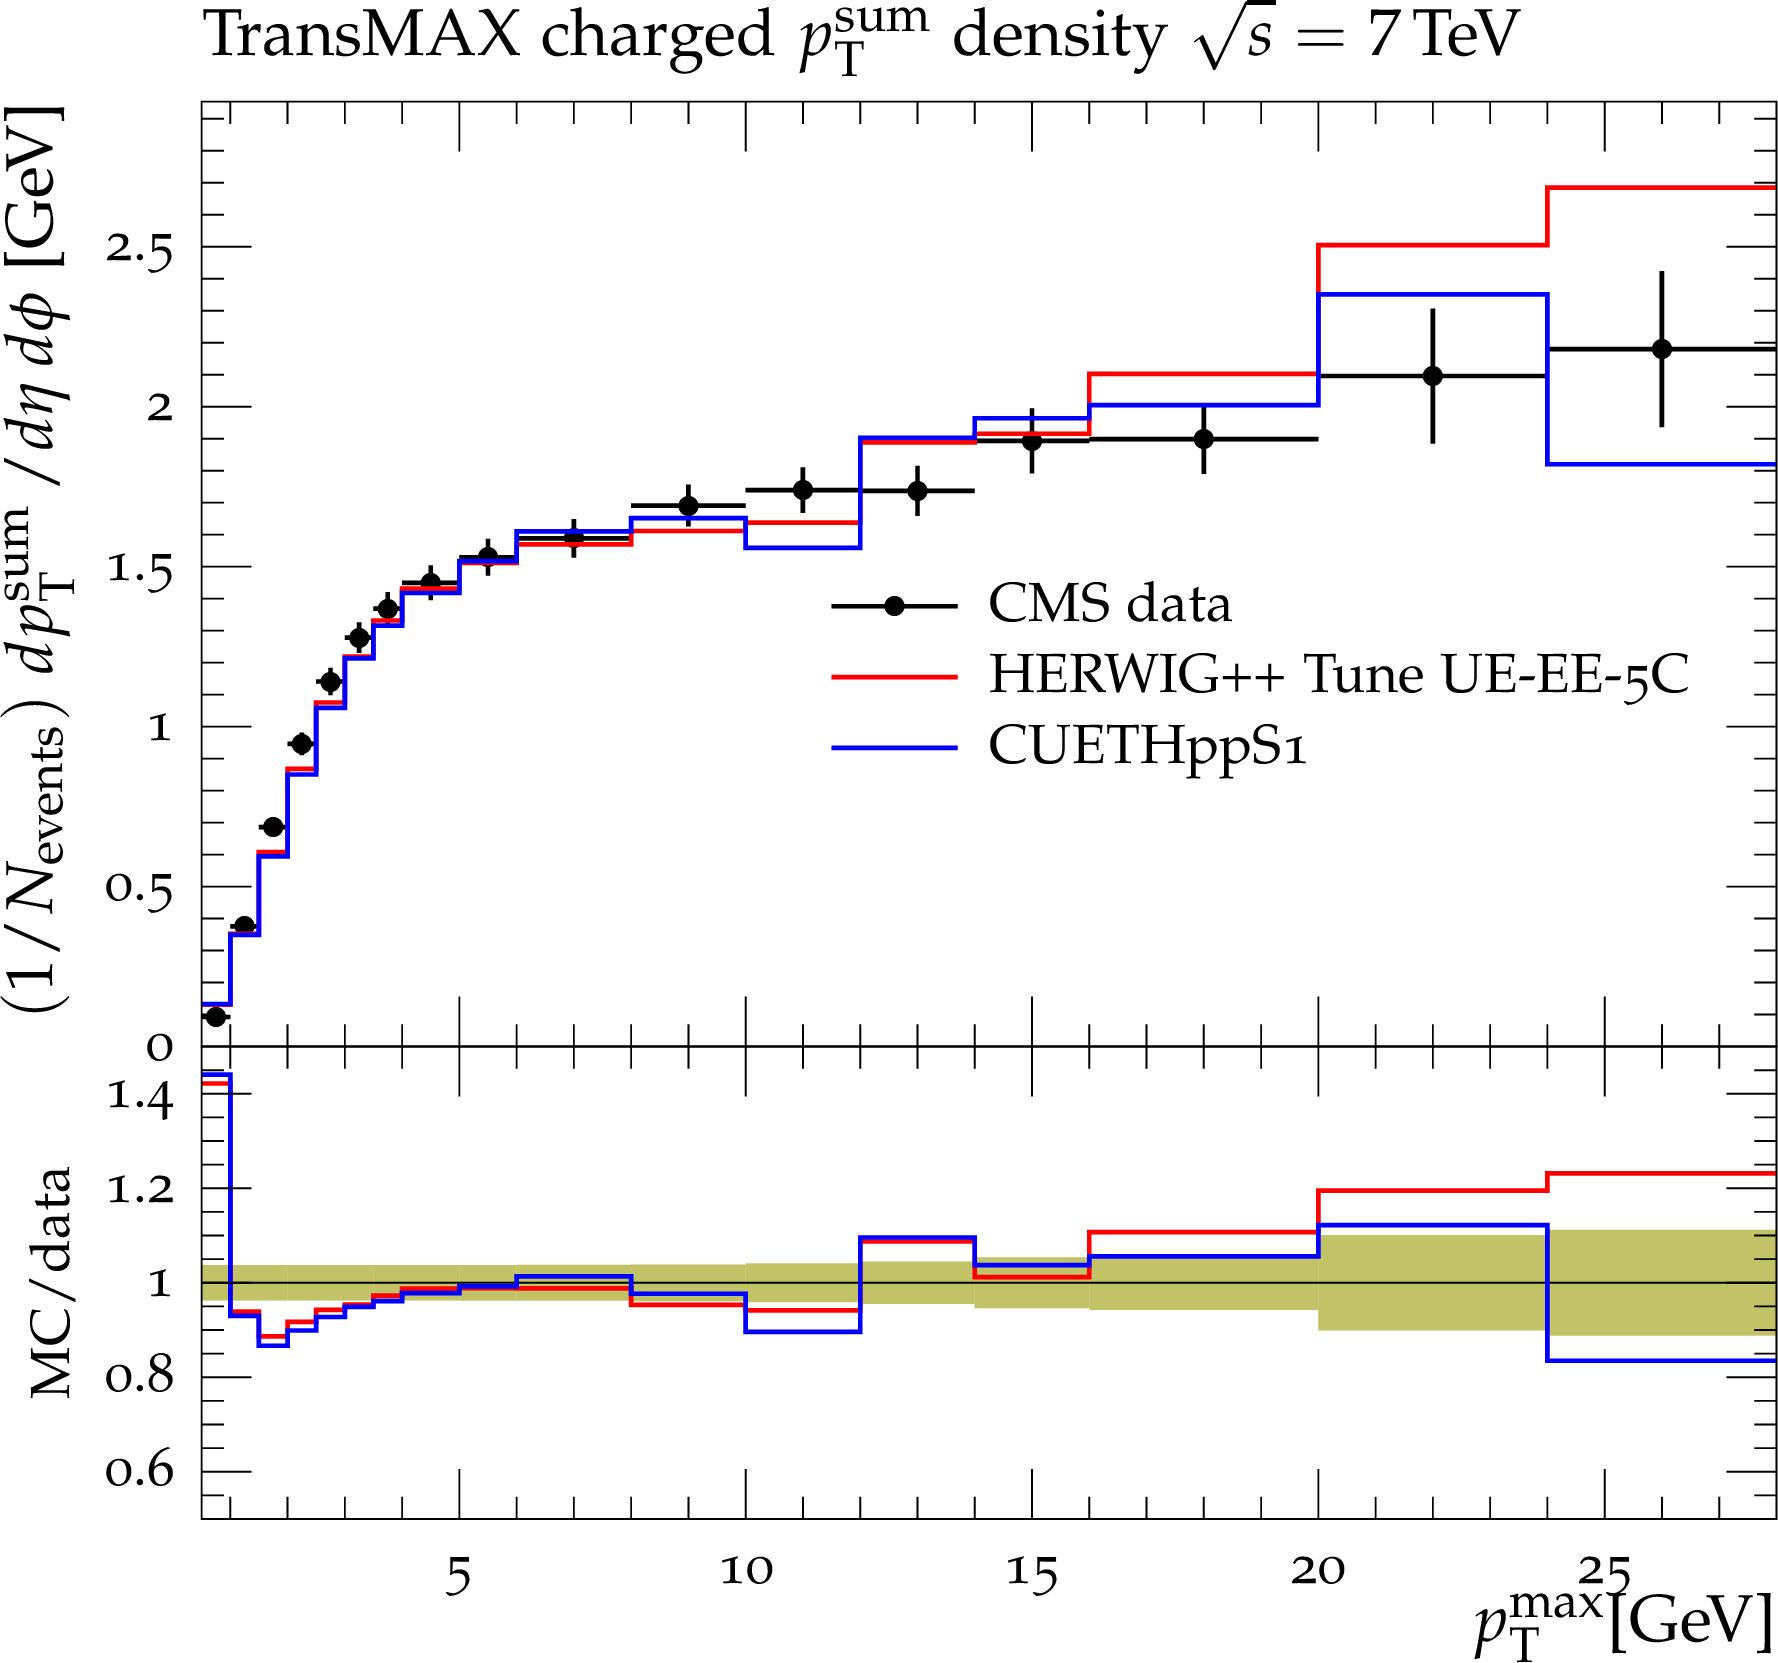
Figure 30-a:
CMS data at $\sqrt {s}=$ 7 TeV[17] on particle (a,b) and $p_{\rm T}^{\rm sum}$\ densities (c,d) for charged particles with $p_{\rm T}>$ 0.5 GeV and $|\eta |<$ 0.8 in the TransMIN (a,c) and TransMAX (b,d) regions as defined by the leading charged particle, as a function of the transverse momentum of the leading charged-particle $p_{\rm T}^{\rm max}$. The data are compared to the HERWIG++ Tune UE-EE-$5$C and CUETHppS1. The green bands in the ratios represent the total experimental uncertainties. |

png pdf |
Figure 30-b:
CMS data at $\sqrt {s}=$ 7 TeV[17] on particle (a,b) and $p_{\rm T}^{\rm sum}$\ densities (c,d) for charged particles with $p_{\rm T}>$ 0.5 GeV and $|\eta |<$ 0.8 in the TransMIN (a,c) and TransMAX (b,d) regions as defined by the leading charged particle, as a function of the transverse momentum of the leading charged-particle $p_{\rm T}^{\rm max}$. The data are compared to the HERWIG++ Tune UE-EE-$5$C and CUETHppS1. The green bands in the ratios represent the total experimental uncertainties. |

png pdf |
Figure 30-c:
CMS data at $\sqrt {s}=$ 7 TeV[17] on particle (a,b) and $p_{\rm T}^{\rm sum}$\ densities (c,d) for charged particles with $p_{\rm T}>$ 0.5 GeV and $|\eta |<$ 0.8 in the TransMIN (a,c) and TransMAX (b,d) regions as defined by the leading charged particle, as a function of the transverse momentum of the leading charged-particle $p_{\rm T}^{\rm max}$. The data are compared to the HERWIG++ Tune UE-EE-$5$C and CUETHppS1. The green bands in the ratios represent the total experimental uncertainties. |
png pdf |
Figure 30-d:
CMS data at $\sqrt {s}=$ 7 TeV[17] on particle (a,b) and $p_{\rm T}^{\rm sum}$\ densities (c,d) for charged particles with $p_{\rm T}>$ 0.5 GeV and $|\eta |<$ 0.8 in the TransMIN (a,c) and TransMAX (b,d) regions as defined by the leading charged particle, as a function of the transverse momentum of the leading charged-particle $p_{\rm T}^{\rm max}$. The data are compared to the HERWIG++ Tune UE-EE-$5$C and CUETHppS1. The green bands in the ratios represent the total experimental uncertainties. |
png pdf |
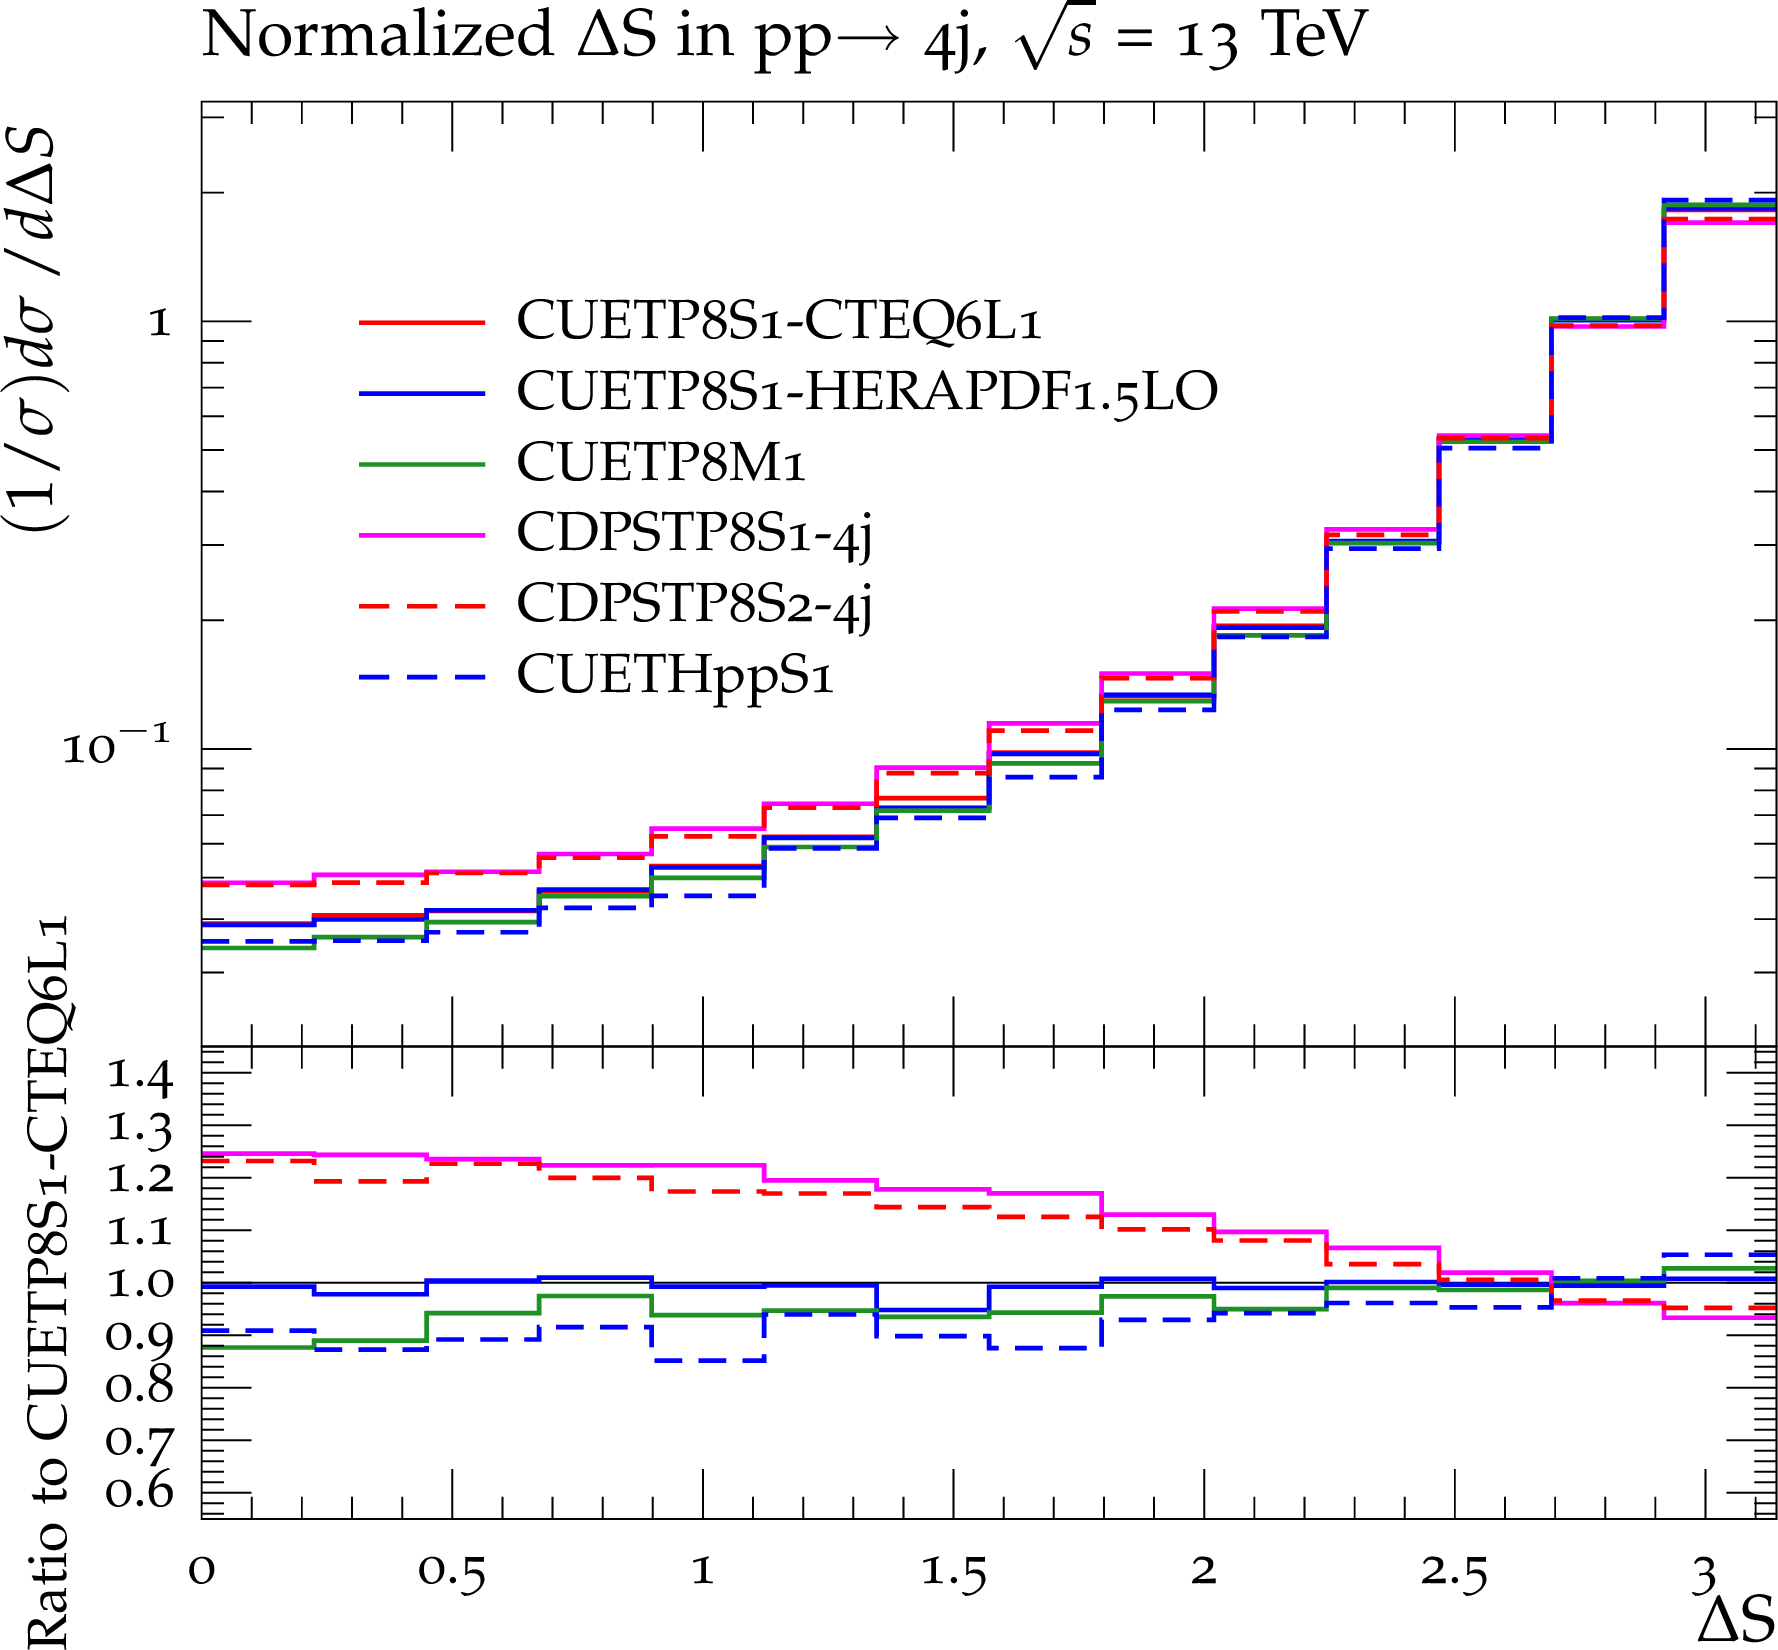
Figure 31-a:
Predictions at $\sqrt {s}=$ 13 TeV for the normalized distributions of the correlation observables $\Delta $S (a), and $\Delta ^{\rm rel}p_{\rm T}$\ (b) for four-jet production in pp collisions for the three CMS PYTHIA8 UE tunes CUETP8S1-CTEQ6L1, CUETP8S1-HERAPDF1.5LO, and CUETP8M1, for CUETHppS1, and for CDPSTP$8$S$1$-$4$j\ and CDPSTP$8$S$2$-$4$j. Also shown are the ratios of the tunes to predictions of CUETP8S1-CTEQ6L1. |
png pdf |
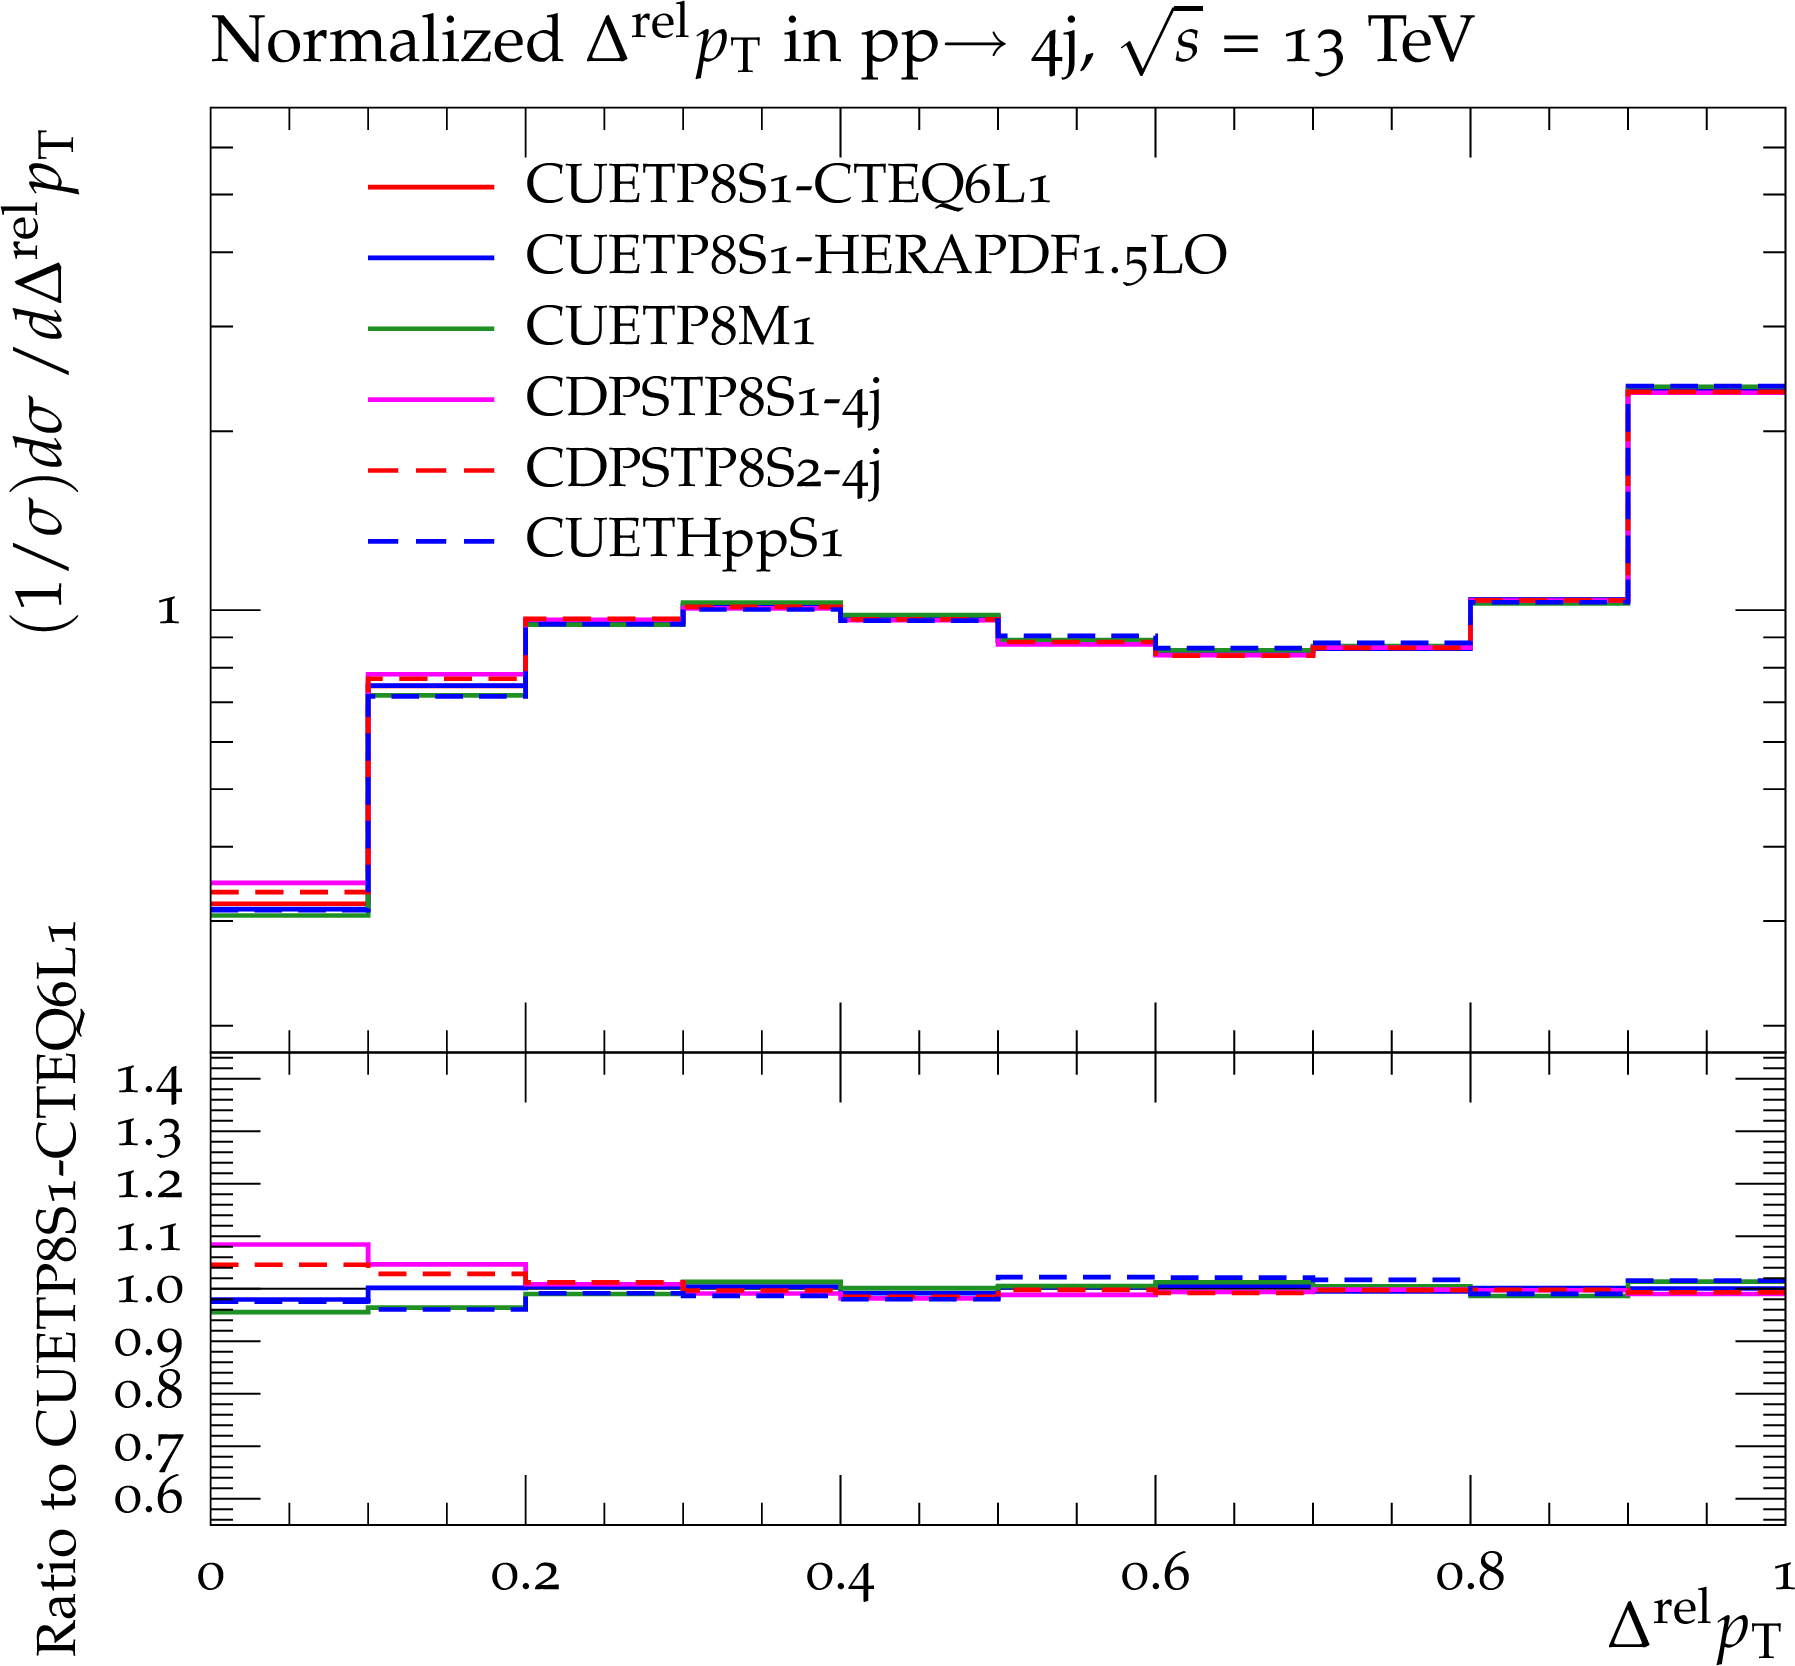
Figure 31-b:
Predictions at $\sqrt {s}=$ 13 TeV for the normalized distributions of the correlation observables $\Delta $S (a), and $\Delta ^{\rm rel}p_{\rm T}$\ (b) for four-jet production in pp collisions for the three CMS PYTHIA8 UE tunes CUETP8S1-CTEQ6L1, CUETP8S1-HERAPDF1.5LO, and CUETP8M1, for CUETHppS1, and for CDPSTP$8$S$1$-$4$j\ and CDPSTP$8$S$2$-$4$j. Also shown are the ratios of the tunes to predictions of CUETP8S1-CTEQ6L1. |
png pdf |
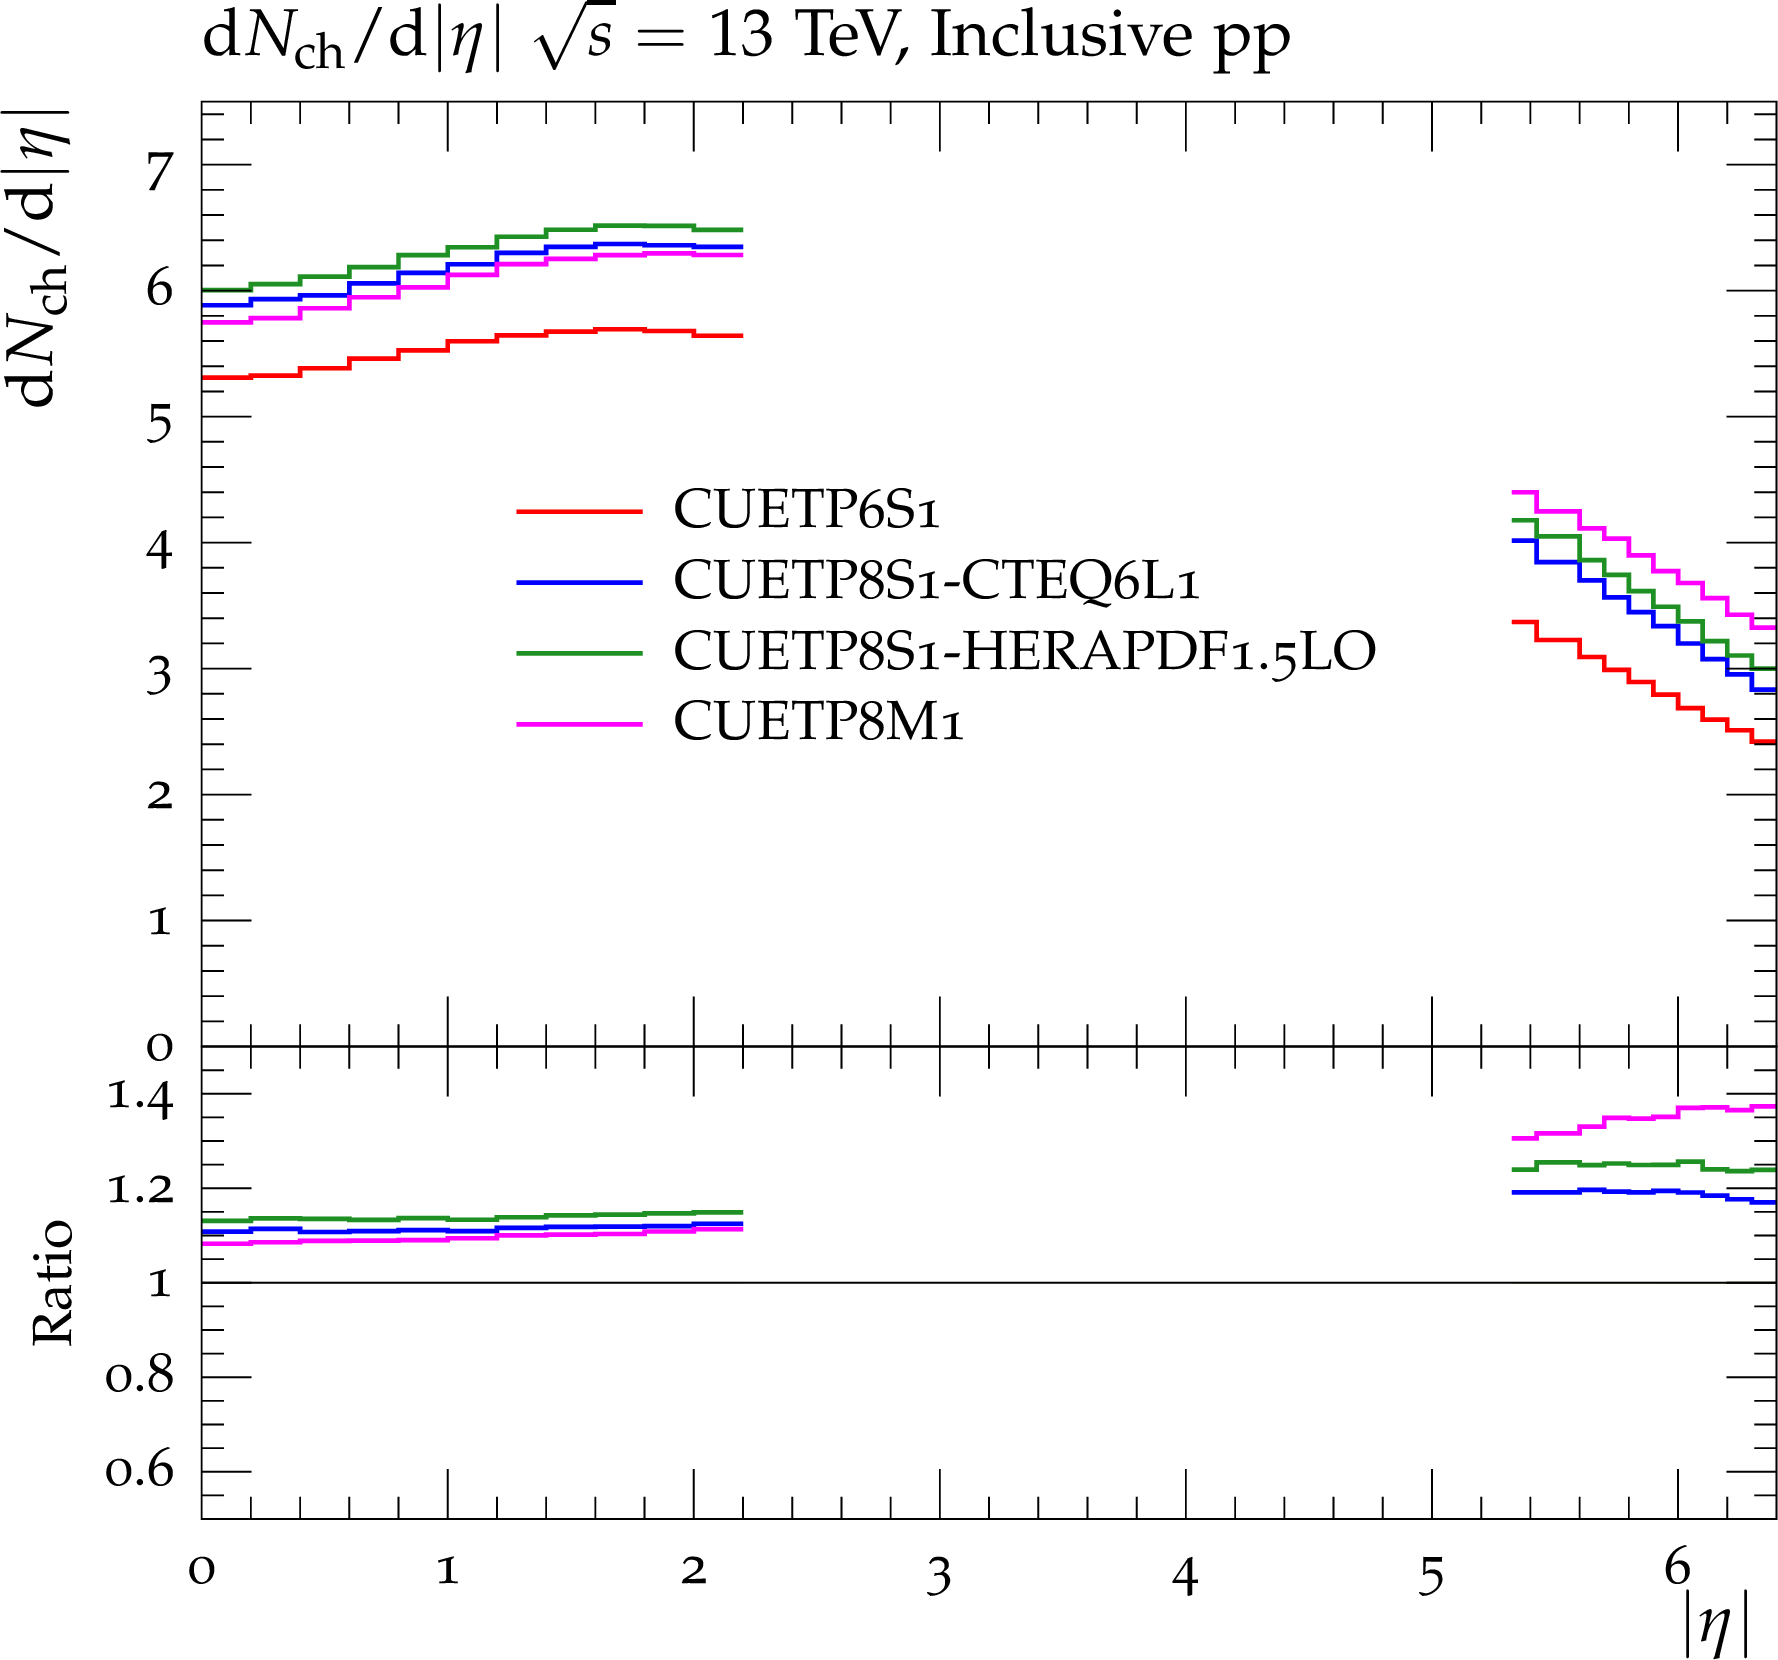
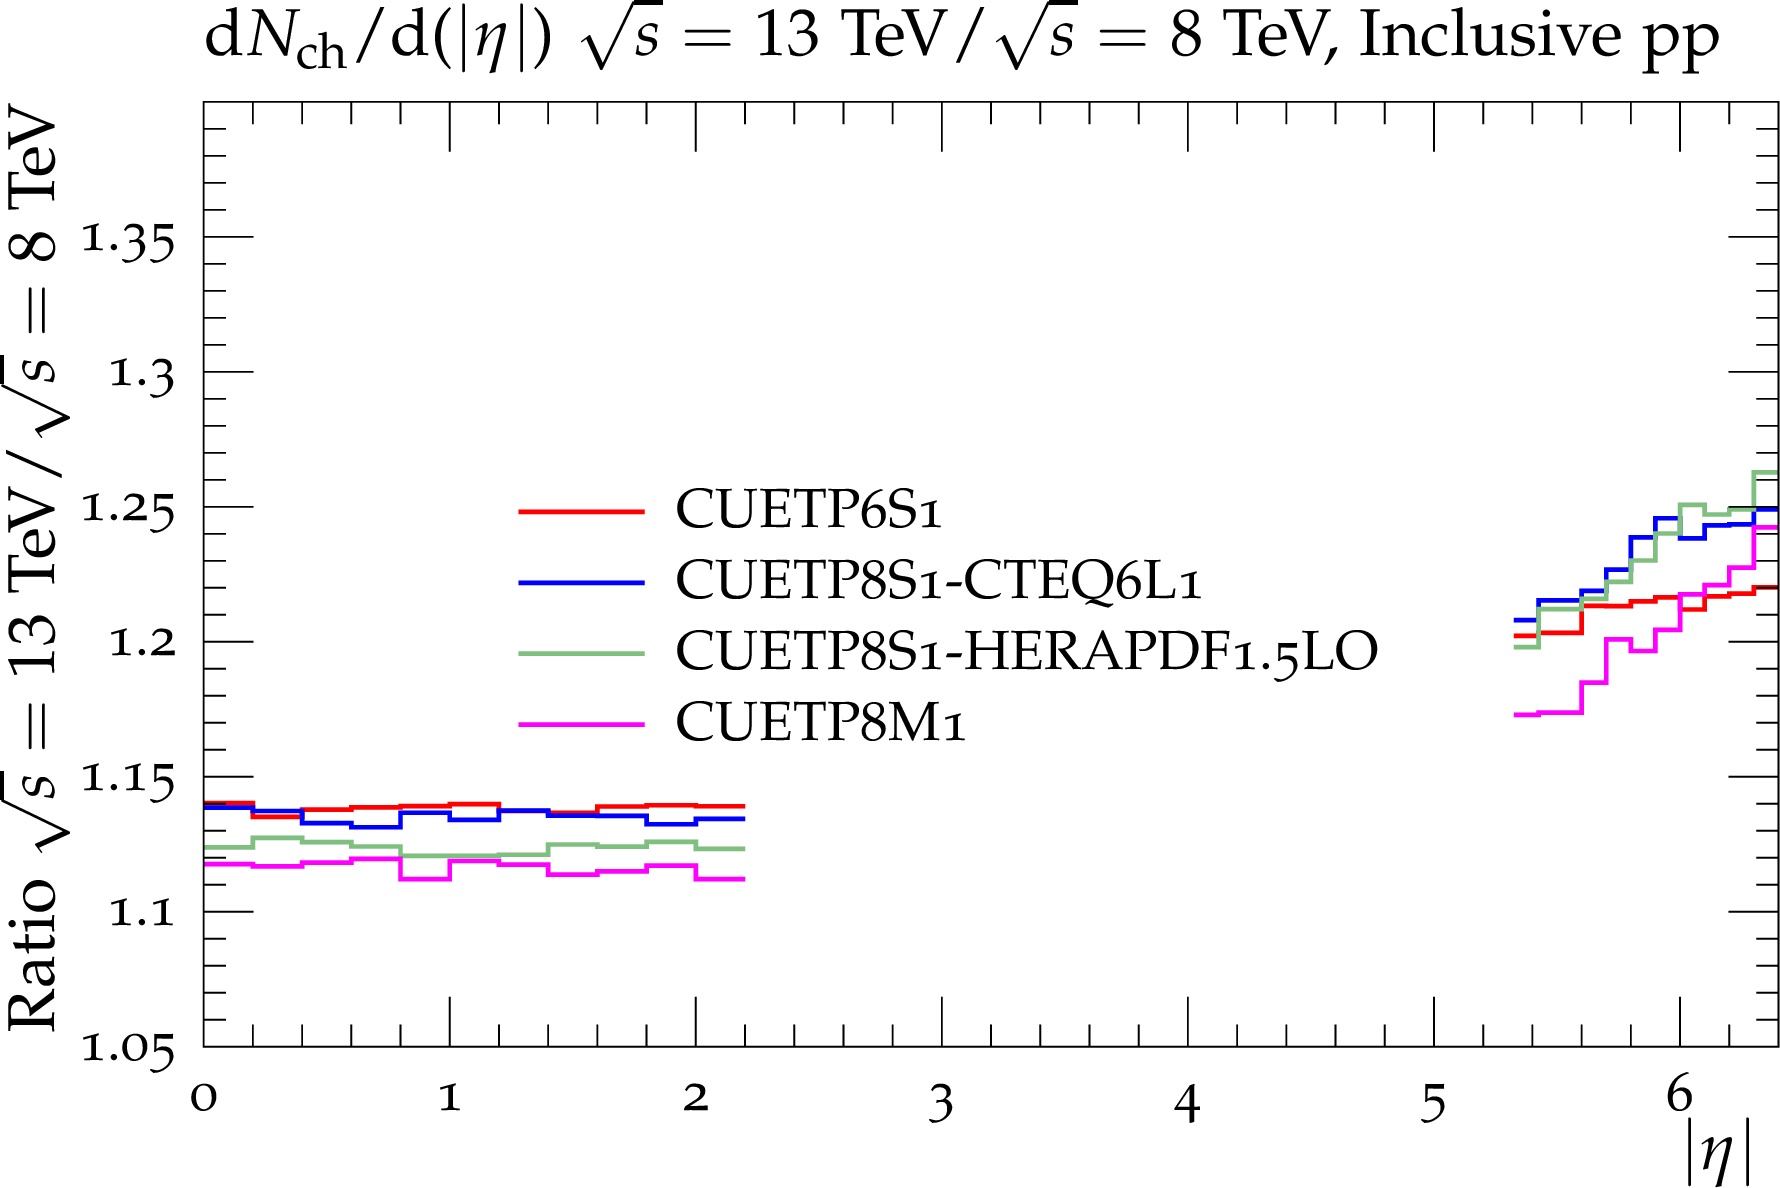
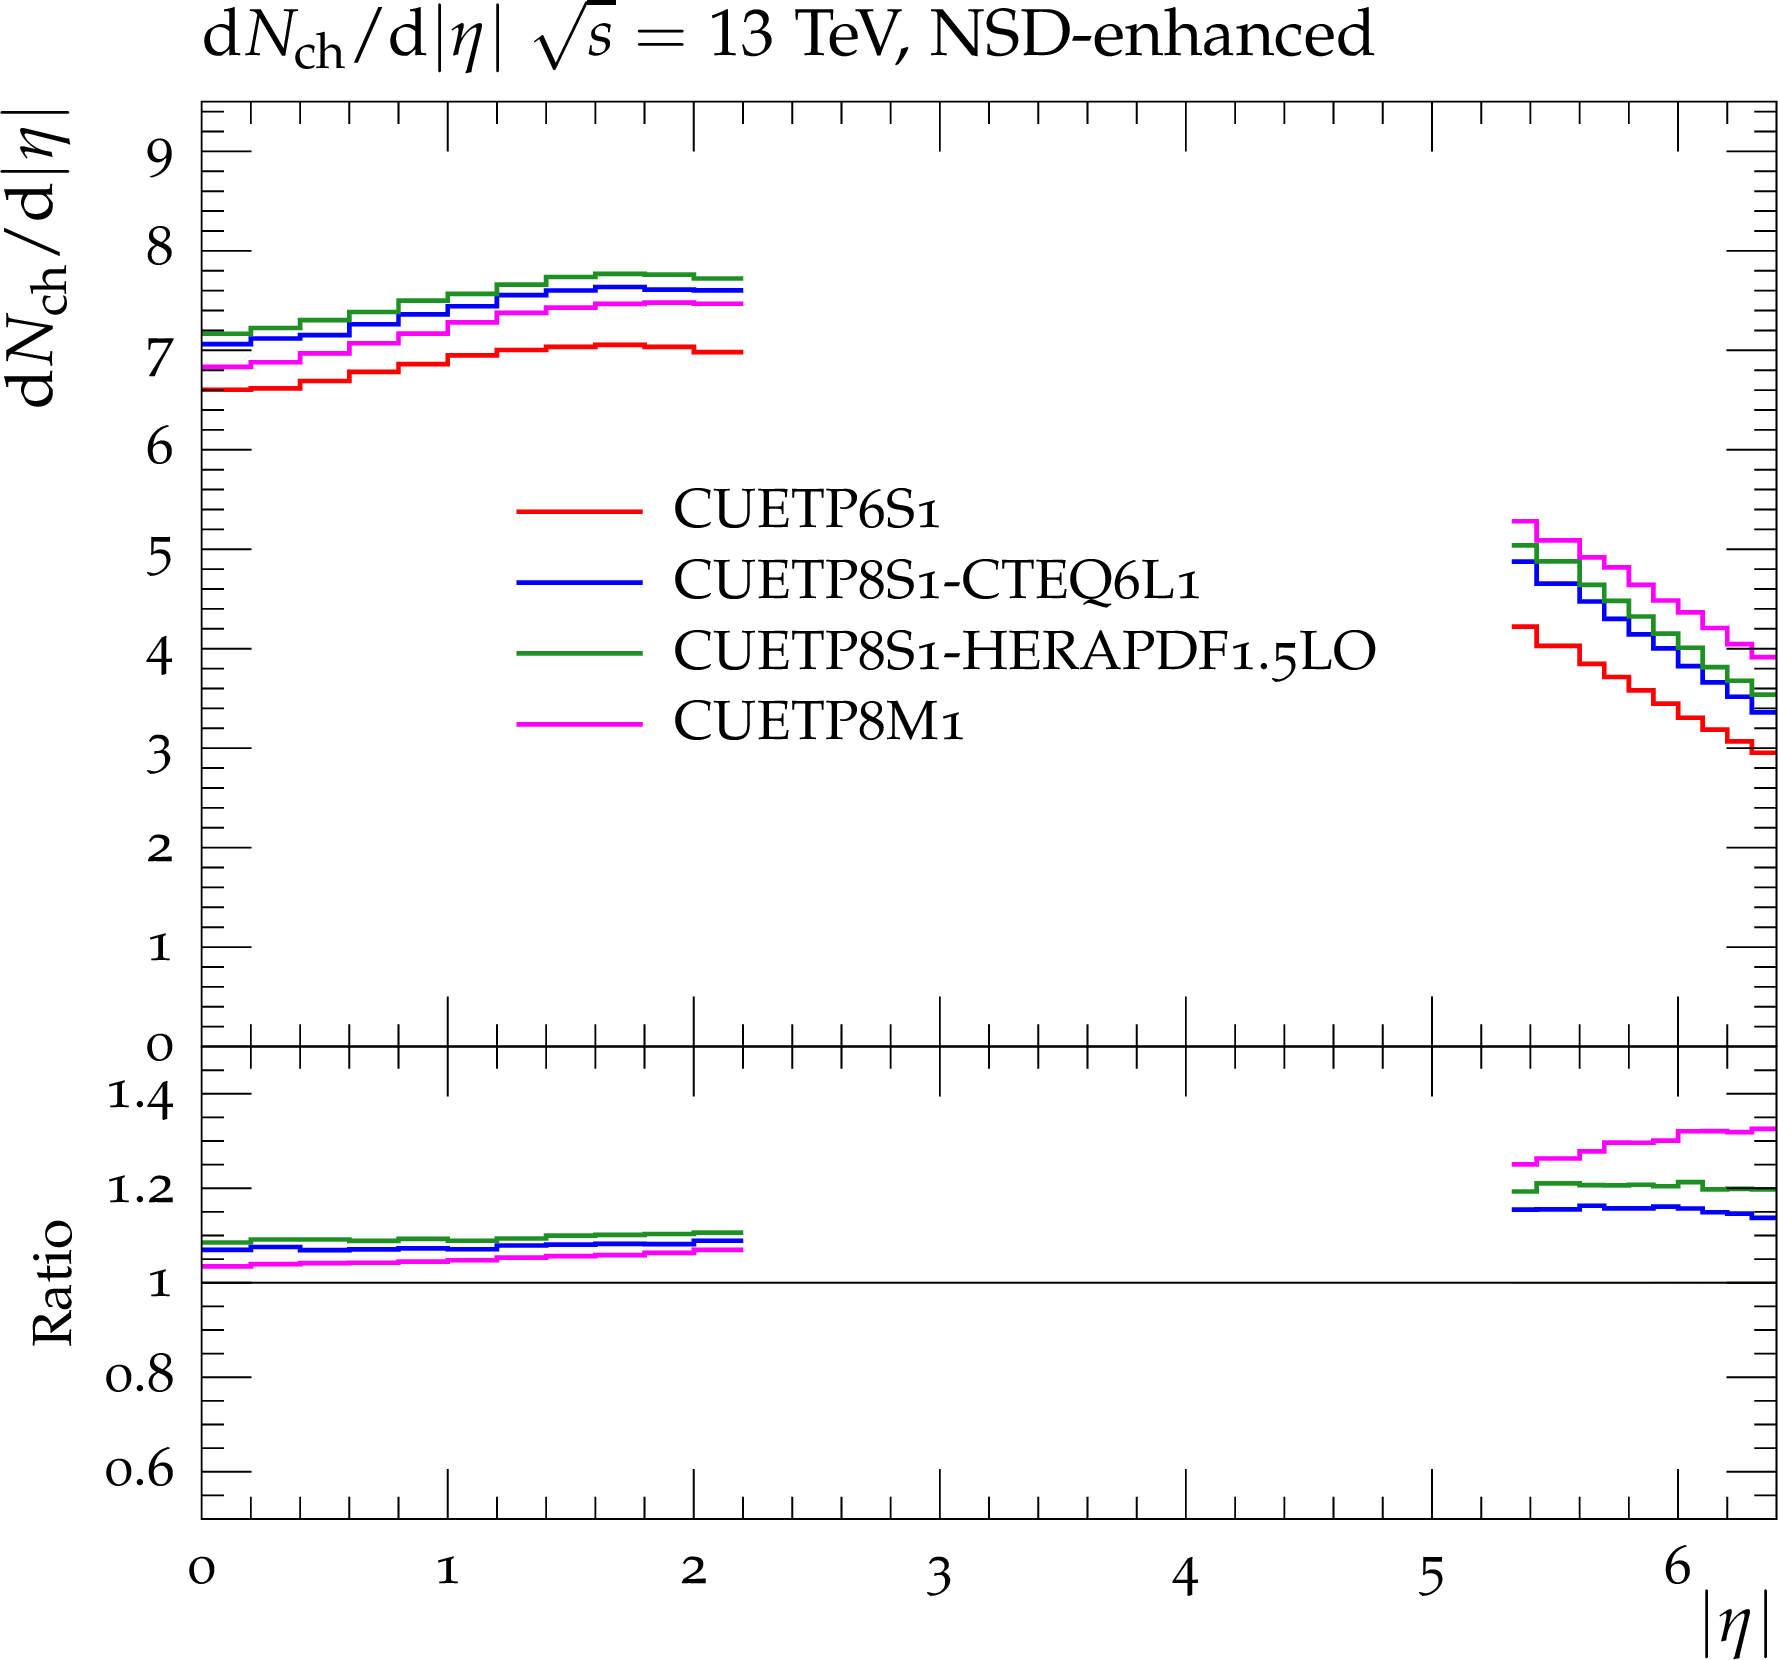
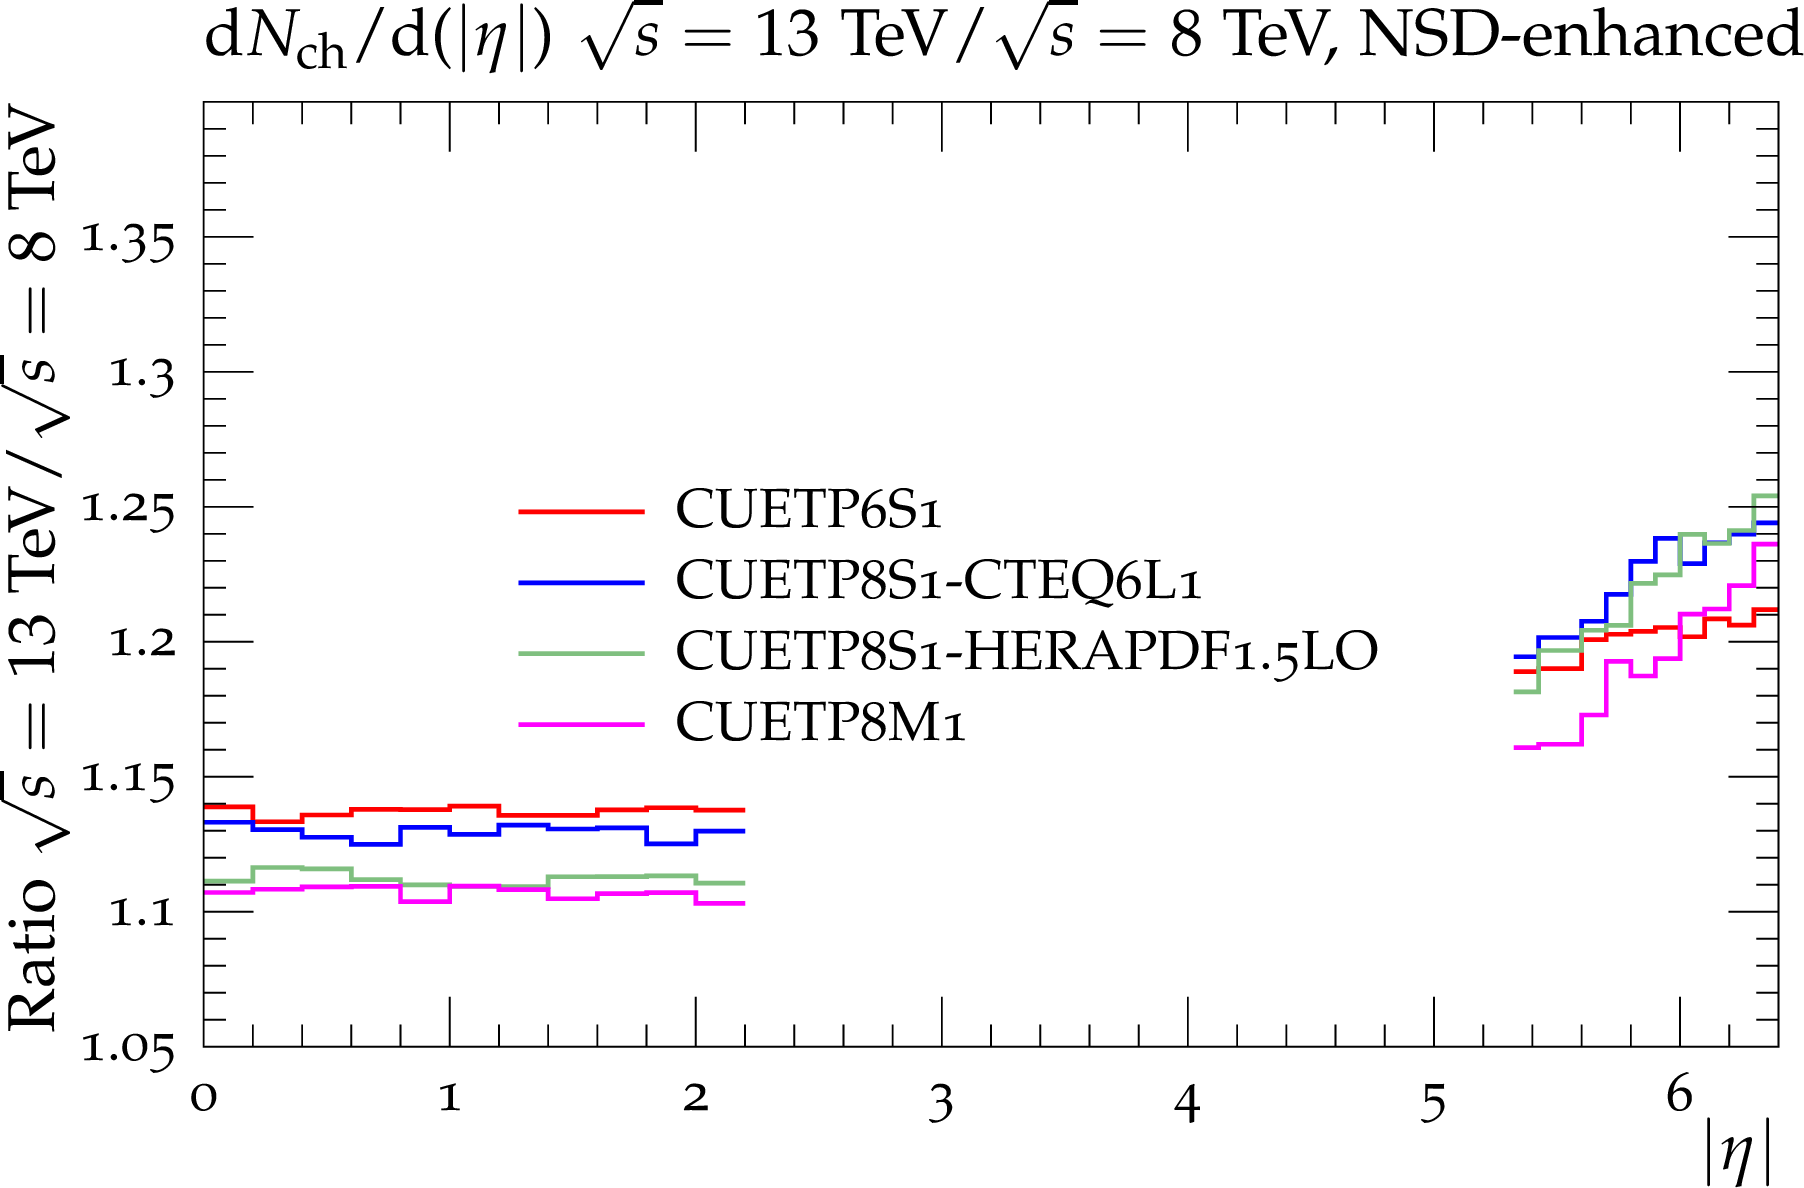
Figure 32-a:
Predictions at $\sqrt {s}=$ 13 TeV for the charged-particle pseudorapidity distribution $ {\mathrm {d}}\mathrm {N}_{\text {ch}}/ {\mathrm {d}}\eta $, for (a,b) inelastic, (c,d) NSD-enhanced, and (e,f) SD-enhanced pp collisions from CUETP6S1-CTEQ6L1, CUETP8S1-CTEQ6L1, CUETP8S1-HERAPDF1.5LO, and CUETP8M1. Also shown are the ratios of the tunes to predictions of CUETP8M1, and the ratio of 13 TeV to 8 TeV results for each of the tunes (b,d,f). |
png pdf |
Figure 32-b:
Predictions at $\sqrt {s}=$ 13 TeV for the charged-particle pseudorapidity distribution $ {\mathrm {d}}\mathrm {N}_{\text {ch}}/ {\mathrm {d}}\eta $, for (a,b) inelastic, (c,d) NSD-enhanced, and (e,f) SD-enhanced pp collisions from CUETP6S1-CTEQ6L1, CUETP8S1-CTEQ6L1, CUETP8S1-HERAPDF1.5LO, and CUETP8M1. Also shown are the ratios of the tunes to predictions of CUETP8M1, and the ratio of 13 TeV to 8 TeV results for each of the tunes (b,d,f). |
png pdf |
Figure 32-c:
Predictions at $\sqrt {s}=$ 13 TeV for the charged-particle pseudorapidity distribution $ {\mathrm {d}}\mathrm {N}_{\text {ch}}/ {\mathrm {d}}\eta $, for (a,b) inelastic, (c,d) NSD-enhanced, and (e,f) SD-enhanced pp collisions from CUETP6S1-CTEQ6L1, CUETP8S1-CTEQ6L1, CUETP8S1-HERAPDF1.5LO, and CUETP8M1. Also shown are the ratios of the tunes to predictions of CUETP8M1, and the ratio of 13 TeV to 8 TeV results for each of the tunes (b,d,f). |
png pdf |
Figure 32-d:
Predictions at $\sqrt {s}=$ 13 TeV for the charged-particle pseudorapidity distribution $ {\mathrm {d}}\mathrm {N}_{\text {ch}}/ {\mathrm {d}}\eta $, for (a,b) inelastic, (c,d) NSD-enhanced, and (e,f) SD-enhanced pp collisions from CUETP6S1-CTEQ6L1, CUETP8S1-CTEQ6L1, CUETP8S1-HERAPDF1.5LO, and CUETP8M1. Also shown are the ratios of the tunes to predictions of CUETP8M1, and the ratio of 13 TeV to 8 TeV results for each of the tunes (b,d,f). |
png pdf |
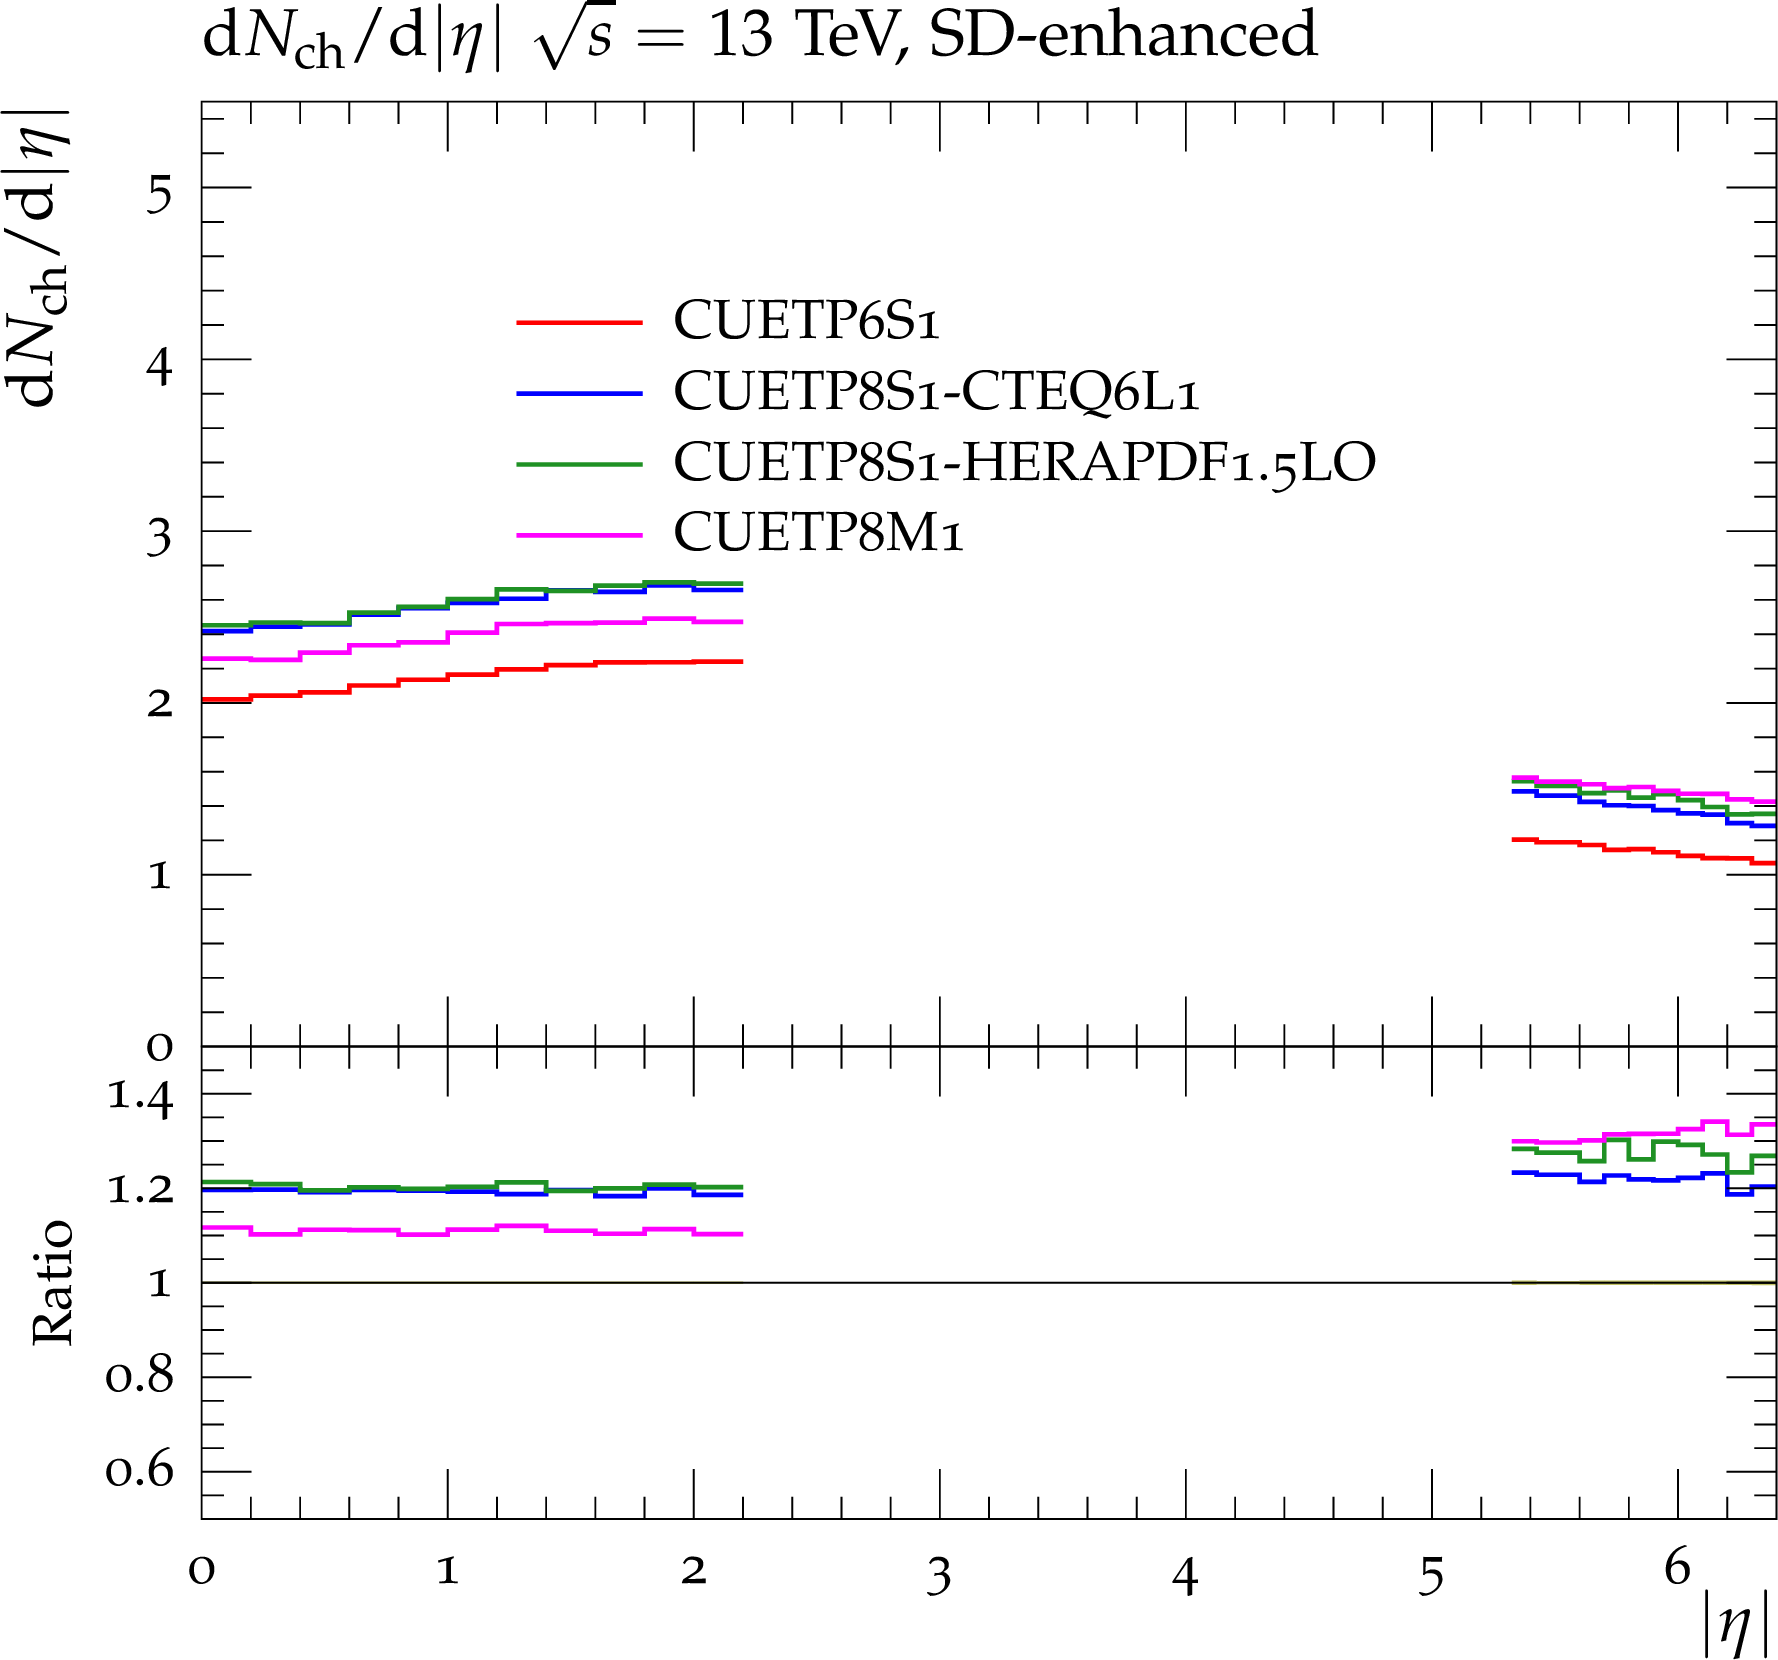
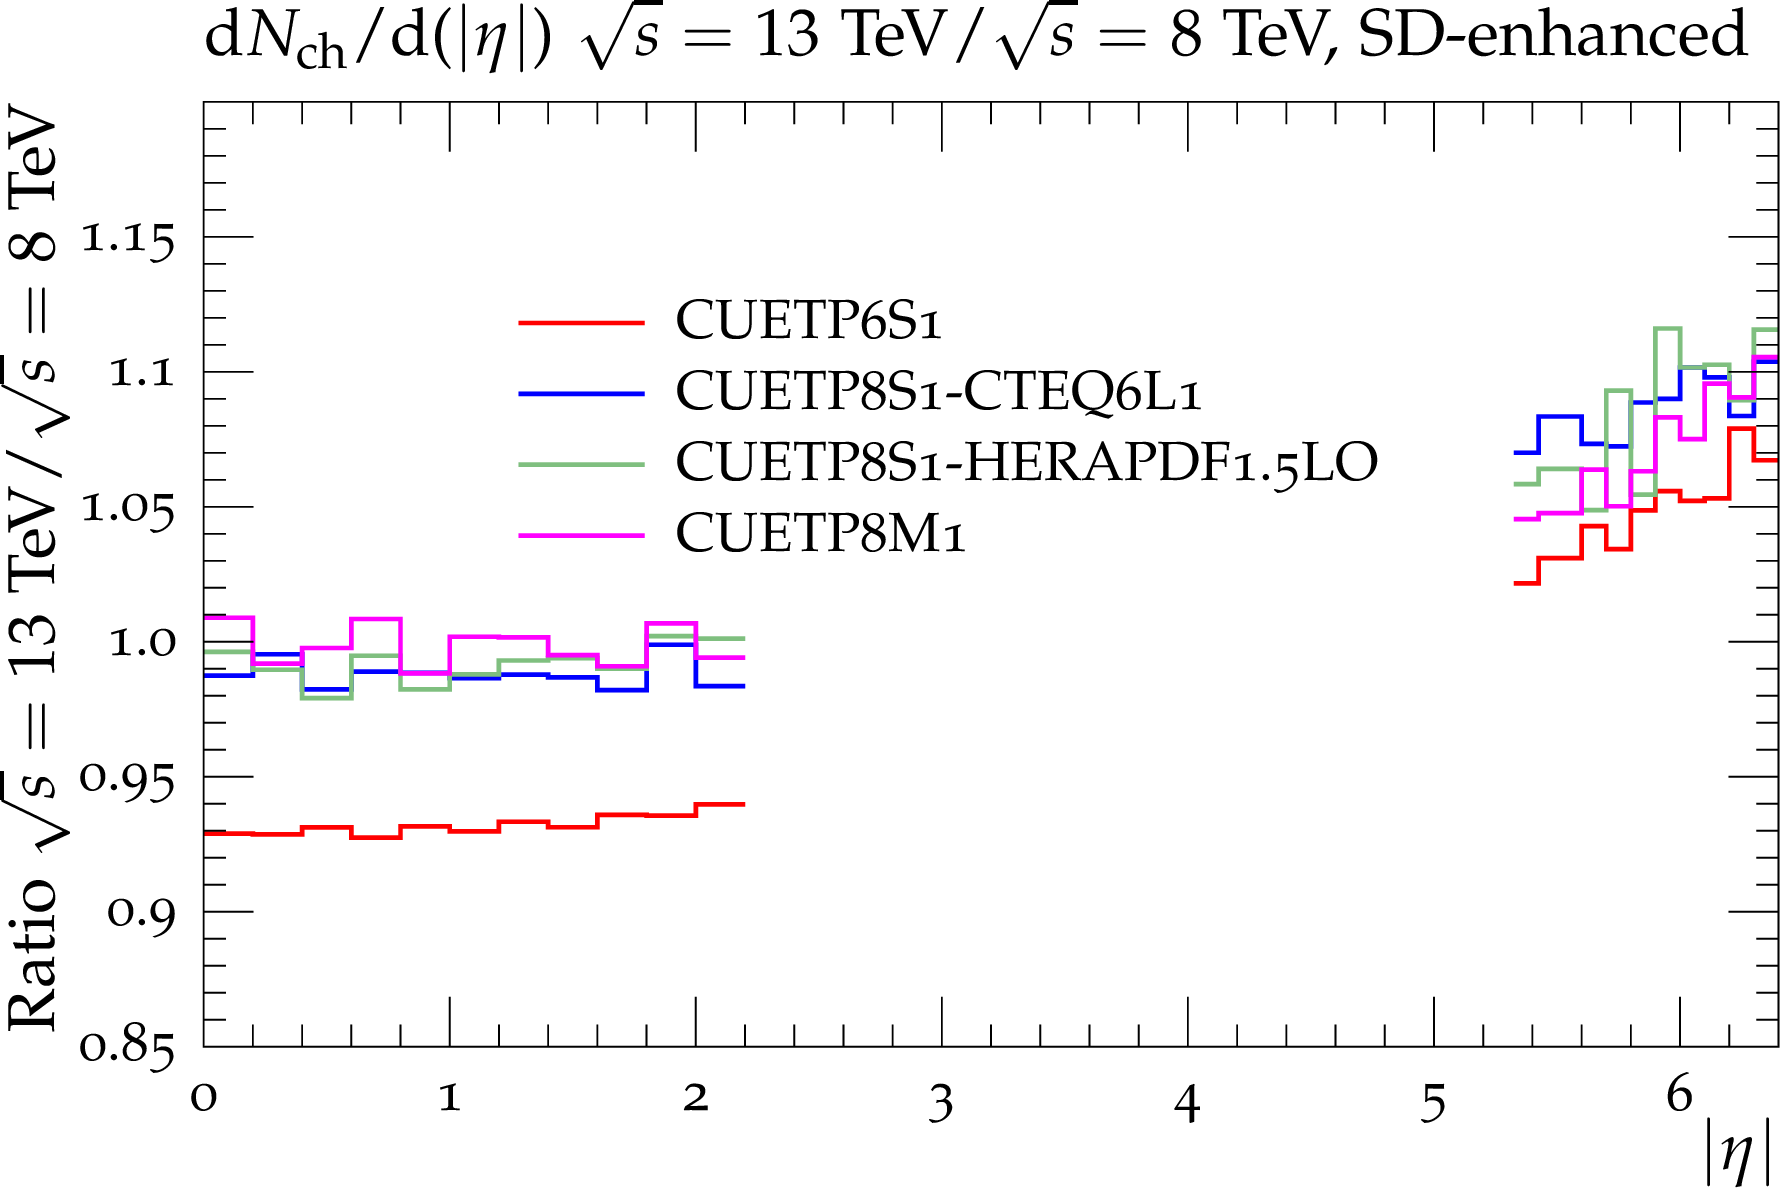
Figure 32-e:
Predictions at $\sqrt {s}=$ 13 TeV for the charged-particle pseudorapidity distribution $ {\mathrm {d}}\mathrm {N}_{\text {ch}}/ {\mathrm {d}}\eta $, for (a,b) inelastic, (c,d) NSD-enhanced, and (e,f) SD-enhanced pp collisions from CUETP6S1-CTEQ6L1, CUETP8S1-CTEQ6L1, CUETP8S1-HERAPDF1.5LO, and CUETP8M1. Also shown are the ratios of the tunes to predictions of CUETP8M1, and the ratio of 13 TeV to 8 TeV results for each of the tunes (b,d,f). |
png pdf |
Figure 32-f:
Predictions at $\sqrt {s}=$ 13 TeV for the charged-particle pseudorapidity distribution $ {\mathrm {d}}\mathrm {N}_{\text {ch}}/ {\mathrm {d}}\eta $, for (a,b) inelastic, (c,d) NSD-enhanced, and (e,f) SD-enhanced pp collisions from CUETP6S1-CTEQ6L1, CUETP8S1-CTEQ6L1, CUETP8S1-HERAPDF1.5LO, and CUETP8M1. Also shown are the ratios of the tunes to predictions of CUETP8M1, and the ratio of 13 TeV to 8 TeV results for each of the tunes (b,d,f). |
| Tables | |

png pdf |
Table 1:
Parameters in PYTHIA6\cite {Sjostrand:2006za}, PYTHIA8cite {oai:arXiv.org:0710.3820}, and HERWIG++cite {Bahr:2008pv,Bellm:2013lba} MC event generators that, together with some chosen PDF, determine the energy dependence of MPI. |
png pdf |
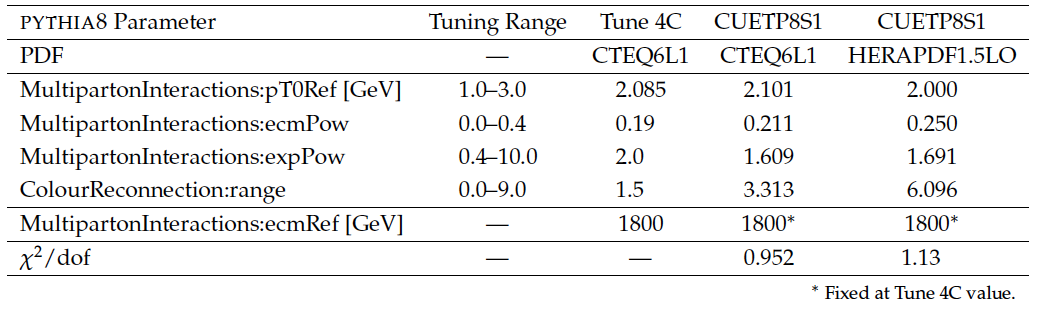
Table 2:
The PYTHIA8 parameters, tuning range, Tune 4C values\cite {Corke:2010yf}, and best-fit values for CUETP8S1-CTEQ6L1 and CUETP8S1-HERAPDF1.5LO, obtained from fits to the TransMAX and TransMIN charged-particle and $p_{\rm T}^{\rm sum}$\ densities, as defined by the leading charged-particle $p_{\rm T}^{\rm max}$at $\sqrt {s} =$ 0.9, 1.96, and 7 TeV. The $\sqrt {s}=$ 300 GeV data are excluded from the fit. |
png pdf |
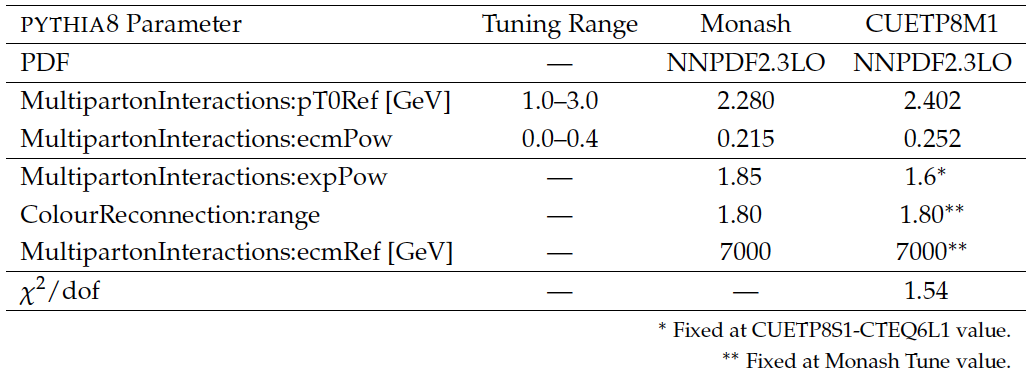
Table 3:
The PYTHIA8 parameters, tuning range, Monash values\cite {Skands:2014pea}, and best-fit values for CUETP8M1, obtained from fits to the TransMAX and TransMIN charged-particle and $p_{\rm T}^{\rm sum}$\ densities, as defined by the leading charged-particle $p_{\rm T}^{\rm max}$at $\sqrt {s} =$ 0.9, 1.96, and 7 TeV. The $\sqrt {s}=$ 300 GeV data are excluded from the fit. |
png pdf |
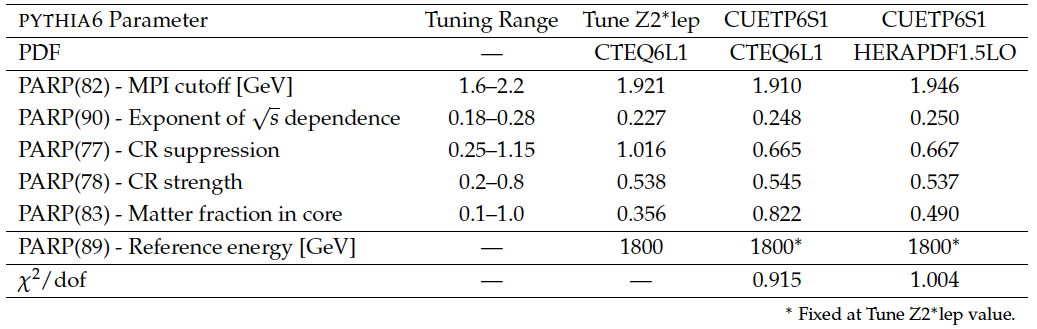
Table 4:
The PYTHIA6\ parameters, tuning range, Tune Z$2^*$lep\ values\cite {Skands:2010ak}, and best-fit values for CUETP6S1-CTEQ6L1and CUETP6S1-HERAPDF1.5LO, obtained from fits to the TransMAX and TransMIN charged-particle and $p_{\rm T}^{\rm sum}$\ densities as defined by the $p_{\rm T}^{\rm max}$\ of the leading charged particle at $\sqrt {s} =$ 0.3, 0.9, 1.96, and 7 TeV. |

png pdf |
Table 5:
The HERWIG++ parameters, tuning range, Tune UE-EE-5C values\cite {Seymour:2013qka}, and best-fit values for CUETHppS1, obtained from a fit to the TransMAX and TransMIN charged-particle and $p_{\rm T}^{\rm sum}$\ densities as a function of the leading charged-particle $p_{\rm T}^{\rm max}$at $\sqrt {s} =$ 0.3, 0.9, 1.96, and 7 TeV. |

png pdf |
Table 6:
The PYTHIA8 parameters, tuning ranges, Tune 4C values\cite {Corke:2010yf} and best-fit values of CDPSTP8S1-Wj and CDPSTP8S2-Wj, obtained from fits to DPS observables in W+dijet production with the MadGraph event generator interfaced to PYTHIA8. Also shown are the predicted values of $\sigma _{\rm eff}$ at $\sqrt {s}=$ 7 TeV, and the uncertainties obtained from the eigentunes. |
png pdf |
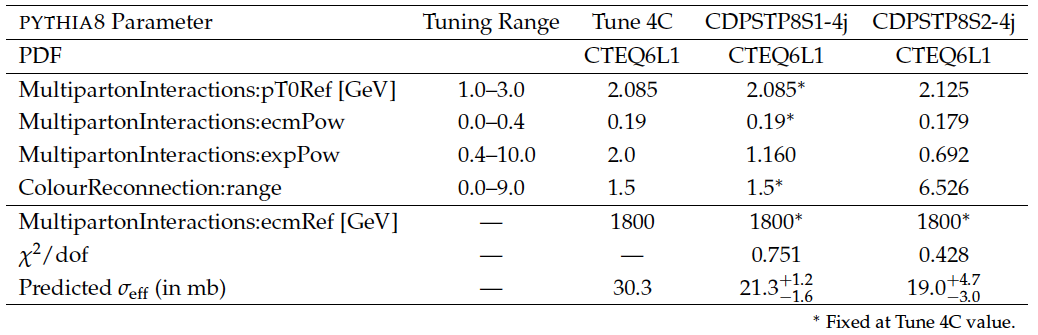
Table 7:
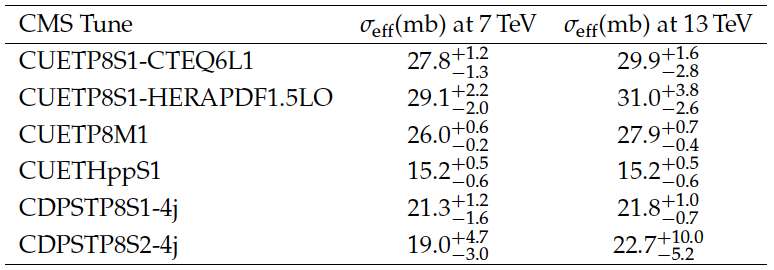
The PYTHIA8 parameters, tuning ranges, Tune 4C values\cite {Corke:2010yf} and best-fit values of CDPSTP8S1-4j and CDPSTP8S2-4j, obtained from fits to DPS observables in four-jet production. Also shown are the predicted values of $\sigma _{\rm eff}$ at $\sqrt {s}=$ 7 TeV, and the uncertainties obtained from the eigentunes. |
png pdf |
Table 8:
Values of $\sigma _{\rm eff}$ at $\sqrt {s}=$ 7 TeV and 13 TeV for CUETP8S1-CTEQ6L1, CUETP8S1-HERAPDF1.5LO, and CUETP8M1, CUETHppS1, and for CDPSTP8S1-4j and CDPSTP8S2-4j. At $\sqrt {s}=$ 7 TeV, also shown are the uncertainties in $\sigma _{\rm eff}$ obtained from the eigentunes. |
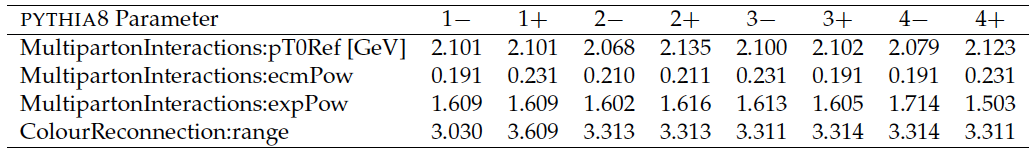
png pdf |
Table 9:
Eigentunes sets for CUETP8S1-CTEQ6L1. |
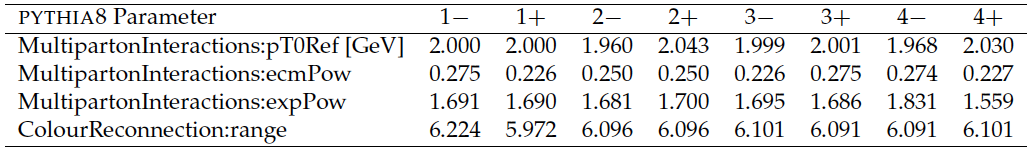
png pdf |
Table 10:
Eigentunes sets for CUETP8S1-HERAPDF. |
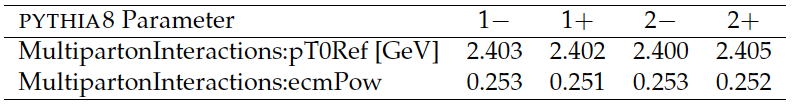
png pdf |
Table 11:
Eigentunes sets for CUETP8M1. |
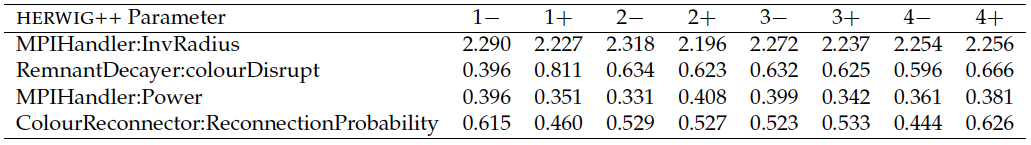
png pdf |
Table 12:
Eigentunes sets for CUETHppS1. |
| Summary |
|
We have constructed new tunes of the PYTHIA event generator using various sets of underlying event (UE) data, for different parton distribution functions. By simultaneously fitting UE data at several center-of-mass energies, models for UE have been tested and their parameters constrained. The improvement in the description of UE data provided by the new CMS tunes at different collision energies gives confidence that they can provide reliable predictions at $\sqrt{s} =$ 13 TeV, where all the new UE tunes predict similar results for the UE observables. The observables sensitive to double-parton scattering (DPS) were fitted directly by tuning the MPI parameters. To study the dependence of the DPS-sensitive observables on the MPI parameters, two W+dijet DPS tunes and two four-jet DPS tunes were constructed. The CMS UE tunes perform fairly well in the description of DPS observables, but they do not fit the DPS data as well as the DPS tunes do. On the other hand, the CMS DPS tunes do not fit the UE data as well as the UE tunes. At present, we are not able to accurately describe both soft and hard MPI within the current PYTHIA and HERWIG++ frameworks. By fitting DPS-sensitive observables, we have also calculated the DPS effective cross section $\sigma_{\text{eff}}$ associated to each model. This method can be applied to any final-state with two hard particles produced, in order to determine the seff values associated to the different MPI models implemented in the current MC event generators. Predictions of PYTHIA8 using the CMS UE tunes agree fairly well with the MB observables in the central region ($\eta| <$ 2) and can be interfaced to higher-order and multileg matrix-element generators, such as POWHEG and MADGRAPH, while maintaining their good description of the UE. It is not necessary to produce separate tunes for these generators. In addition, we have verified that the measured particle pseudorapidity density at 13 TeV is well reproduced by the new CMS UE Tunes. Furthermore, all of the new CMS tunes come with their eigentunes, which can be used to determine the uncertainties associated with the theoretical predictions. These new CMS tunes will play an important role in predicting and analyzing LHC data at 13 and 14 TeV. |
| References | ||||
| 1 | T. Sjostrand, S. Mrenna, and P. Skands | PYTHIA 6.4 physics and manual | JHEP 05 (2006) 026 | hep-ph/0603175 |
| 2 | T. Sjostrand, L. Lonnblad, and S. Mrenna | PYTHIA 6.2: physics and manual | hep-ph/0108264 | |
| 3 | T. Sjostrand and M. van Zijl | A multiple interaction model for the event structure in hadron collisions | PRD 36 (1987) 2019 | |
| 4 | M. Bengtsson, T. Sjostrand, and M. van Zijl | Initial state radiation effects on $ W $ and jet production | Z. Phys. C 32 (1986) 67 | |
| 5 | T. Sjostrand, S. Mrenna, and P. Z. Skands | A brief introduction to PYTHIA 8.1 | CPC 178 (2008) 852 | 0710.3820 |
| 6 | M. Bahr et al. | Herwig++ physics and manual | EPJC 58 (2008) 639 | 0803.0883 |
| 7 | J. Bellm et al. | Herwig++ 2.7 Release Note | 1310.6877 | |
| 8 | M. G. Albrow et al. | Tevatron-for-LHC report of the QCD working group | hep-ph/0610012 | |
| 9 | CDF Collaboration | Studying the 'underlying event' at CDF and the LHC | FERMILAB-CONF-09-792-E | |
| 10 | P. Z. Skands | The Perugia tunes | in Proceedings, 1st International Workshop on Multiple Partonic Interactions at the LHC (MPI08) 2009 | 0905.3418 |
| 11 | CDF Collaboration | A study of the energy dependence of the underlying event in proton-antiproton collisions | PRD 92 (2015), no. 9, 092009 | 1508.05340 |
| 12 | G. A. Schuler and T. Sjostrand | Hadronic diffractive cross-sections and the rise of the total cross-section | PRD 49 (1994) 2257 | |
| 13 | A. V. Manohar and W. J. Waalewijn | What is double parton scattering? | PLB 713 (2012) 196 | 1202.5034 |
| 14 | A. Del Fabbro and D. Treleani | Double parton scatterings at the CERN LHC | in Multiparticle production: New frontiers in soft physics and correlations on the threshold of the third millennium. Proceedings, 9th International Workshop, Torino, Italy, June 12-17, 2000, volume 92, p. 130 2001 | |
| 15 | B. Blok, Y. Dokshitzer, L. Frankfurt, and M. Strikman | Perturbative QCD correlations in multi-parton collisions | EPJC 74 (2014) 2926 | 1306.3763 |
| 16 | P. Bartalini et al. | Multi-parton interactions at the LHC | 1111.0469 | |
| 17 | CMS Collaboration | Measurement of the underlying event activity at the LHC at 7 TeV and comparison with 0.9 TeV | CDS | |
| 18 | A. Buckley et al. | Rivet user manual | CPC 184 (2013) 2803 | 1003.0694 |
| 19 | A. Buckley et al. | Systematic event generator tuning for the LHC | EPJC 65 (2010) 331 | 0907.2973 |
| 20 | J. Pumplin et al. | New generation of parton distributions with uncertainties from global QCD analysis | JHEP 07 (2002) 012 | hep-ph/0201195 |
| 21 | A. M. Cooper-Sarkar | HERAPDF1.5LO PDF set with experimental uncertainties | in Proceedings, 22nd International Workshop on Deep-Inelastic Scattering and Related Subjects (DIS 2014), volume DIS2014, p. 0322014 | |
| 22 | NNPDF Collaboration | Parton distributions with QED corrections | NPB 877 (2013) 290 | 1308.0598 |
| 23 | NNPDF Collaboration | Unbiased global determination of parton distributions and their uncertainties at NNLO and at LO | NPB 855 (2012) 153 | 1107.2652 |
| 24 | CMS Collaboration | Measurement of the underlying event activity at the LHC with $ \sqrt{s} = $ 7 TeV and comparison with $ \sqrt{s} = $ 0.9 TeV | JHEP 09 (2011) 109 | CMS-QCD-10-010 1107.0330 |
| 25 | CMS Collaboration | Study of the underlying event at forward rapidity in pp collisions at $ \sqrt{s} = $ 0.9 , $ 2.76 $, and 7 TeV | JHEP 04 (2013) 072 | CMS-FWD-11-003 1302.2394 |
| 26 | CMS Collaboration | Measurement of the underlying event in the Drell-Yan process in proton-proton collisions at $ \sqrt{s} = $ 7 TeV | EPJC 72 (2012) 2080 | CMS-QCD-11-012 1204.1411 |
| 27 | J. Pumplin | Hard underlying event correction to inclusive jet cross-sections | PRD 57 (1998) 5787 | hep-ph/9708464 |
| 28 | R. Corke and T. Sjostrand | Interleaved parton showers and tuning prospects | JHEP 03 (2011) 032 | 1011.1759 |
| 29 | P. Skands, S. Carrazza, and J. Rojo | Tuning PYTHIA 8.1: the Monash 2013 tune | EPJC 74 (2014) 3024 | 1404.5630 |
| 30 | M. H. Seymour and A. Siodmok | Constraining MPI models using $ \sigma_{\text{eff}} $ and recent Tevatron and LHC underlying event data | JHEP 10 (2013) 113 | 1307.5015 |
| 31 | P. Z. Skands | Tuning Monte Carlo generators: the Perugia tunes | PRD 82 (2010) 074018 | 1005.3457 |
| 32 | AFS Collaboration | Double parton scattering in pp collisions at $ \sqrt{s} = $ 63 GeV | Z. Phys. C 34 (1987) | |
| 33 | CDF Collaboration | Double parton scattering in $ \bar{p} p $ collisions at $ \sqrt{s} = $ 1.8 TeV | Z. Phys. D 56 (1997) | |
| 34 | UA2 Collaboration | A study of multi-jet events at the CERN $ \bar{p} p $ collider and a search for double parton scattering | PLB 268 (1991) 145 | |
| 35 | ATLAS Collaboration | Measurement of hard double-parton interactions in $ W(\to \ell\nu) $ + 2-jet events at $ \sqrt{s} = $ 7 TeV with the ATLAS detector | New J. Phys. 15 (2013) 033038 | 1301.6872 |
| 36 | CMS Collaboration | Study of double parton scattering using W + 2-jet events in proton-proton collisions at $ \sqrt{s} = $ 7 TeV | JHEP 03 (2014) 032 | CMS-FSQ-12-028 1312.5729 |
| 37 | CMS Collaboration | Measurement of four-jet production in proton-proton collisions at $ \sqrt{s} = $ 7 TeV | PRD 89 (2014) 092010 | CMS-FSQ-12-013 1312.6440 |
| 38 | J. Alwall et al. | MadGraph 5 : going beyond | JHEP 06 (2011) 128 | 1106.0522 |
| 39 | ATLAS Collaboration | Measurement of underlying event characteristics using charged particles in $ pp $ collisions at $ \sqrt{s} = $ 900 GeV and 7 TeV with the ATLAS detector | PRD 83 (2011) 112001 | 1012.0791 |
| 40 | B. Blok and P. Gunnellini | Dynamical approach to MPI four-jet production in Pythia | EPJC 75 (2015) 282 | 1503.08246 |
| 41 | M. Diehl, T. Kasemets, and S. Keane | Correlations in double parton distributions: effects of evolution | JHEP 05 (2014) 118 | 1401.1233 |
| 42 | CMS Collaboration | Measurement of the underlying event activity using charged-particle jets in proton-proton collisions at $ \sqrt(s) = $ 2.76 TeV | JHEP 09 (2015) 137 | CMS-FSQ-12-025 1507.07229 |
| 43 | B. Cooper et al. | Importance of a consistent choice of $ \alpha_s $ in the matching of AlpGen and Pythia | Eur. Phys. J.C 72 (2012) 2078 | 1109.5295 |
| 44 | P. A. Nason | Recent developments in POWHEG | in Proceedings, 9th International Symposium on Radiative Corrections: Applications of quantum field theory to phenomenology. (RADCOR 2009), volume RADCOR2009, p. 018 2010 | 1001.2747 |
| 45 | S. Alioli, P. Nason, C. Oleari, and E. Re | A general framework for implementing NLO calculations in shower Monte Carlo programs: the POWHEG BOX | JHEP 06 (2010) 043 | 1002.2581 |
| 46 | H.-L. Lai et al. | New parton distributions for collider physics | PRD 82 (2010) 074024 | 1007.2241 |
| 47 | ALICE Collaboration | Charged-particle multiplicity measurement in proton-proton collisions at $ \sqrt{s} = $ 7 TeV with ALICE at LHC | EPJC 68 (2010) 345 | 1004.3514 |
| 48 | TOTEM Collaboration | First measurement of the total proton-proton cross section at the LHC energy of $ \sqrt{s} = $ 7 TeV | Europhys. Lett. 96 (2011) 21002 | 1110.1395 |
| 49 | CMS Collaboration | Measurement of energy flow at large pseudorapidities in pp collisions at $ \sqrt{s} = $ 0.9 and 7 TeV | JHEP 11 (2011) 148 | CMS-FWD-10-011 1110.0211 |
| 50 | CMS and TOTEM Collaborations | Measurement of pseudorapidity distributions of charged particles in proton-proton collisions at $ \sqrt{s} = $ 8 TeV by the CMS and TOTEM experiments | EPJC 74 (2014) 3053 | 1405.0722 |
| 51 | CMS Collaboration | Measurement of the inclusive jet cross section in pp collisions at $ \sqrt{s} = $ 7 TeV | PRL 107 (2011) 132001 | CMS-QCD-10-011 1106.0208 |
| 52 | CMS Collaboration | Measurement of the rapidity and transverse momentum distributions of Z bosons in pp collisions at $ \sqrt{s} = $ 7 TeV | PRD 85 (2012) 032002 | CMS-EWK-10-010 1110.4973 |
| 53 | CMS Collaboration | Pseudorapidity distribution of charged hadrons in proton-proton collisions at $ \sqrt{s} = $ 13 TeV | PLB 751 (2015) 143 | CMS-FSQ-15-001 1507.05915 |
|
|
Compact Muon Solenoid LHC, CERN |
|

|

|

|

|

|