

Compact Muon Solenoid
LHC, CERN
| CMS-HIN-14-009 ; CERN-EP-2017-009 | ||
| Measurement of prompt and nonprompt $ \mathrm{J} / \psi $ production in pp and pPb collisions at $\sqrt{s_{\mathrm{NN}}} = $ 5.02 TeV | ||
| CMS Collaboration | ||
| 6 February 2017 | ||
| Eur. Phys. J. C 77 (2017) 269 | ||
| Abstract: This paper reports the measurement of $ \mathrm{J} / \psi $ meson production in proton-proton (pp) and proton-lead (pPb) collisions at a center-of-mass energy per nucleon pair of 5.02 TeV by the CMS experiment at the LHC. The data samples used in the analysis correspond to integrated luminosities of 28 pb$^{-1}$ and 35 nb$^{-1}$ for pp and pPb collisions, respectively. Prompt and nonprompt $ \mathrm{J} / \psi $ mesons, the latter issuing from the decay of B mesons, are measured in their dimuon decay channels. Differential cross sections are measured in the transverse momentum range of 2 $ < p_{\mathrm{T}} < $ 30 GeV/$c$, and center-of-mass rapidity ranges of $| {y_{\mathrm{CM}}} | < $ 2.4 (pp) and $-2.87 < y_{\mathrm{CM}} < 1.93 $ (pPb). The nuclear modification factor, $R_{{\mathrm{ p }\mathrm{Pb}} }$, is measured as functions of $p_{\mathrm{T}}$ and $y_{\mathrm{CM}}$. Small modifications of the $ \mathrm{J} / \psi $ cross sections are observed in pPb relative to pp collisions. The ratio of $ \mathrm{J} / \psi $ production cross sections in p-going and Pb-going directions, $R_{\mathrm{FB}}$, studied as functions of $p_{\mathrm{T}}$ and $y_{\mathrm{CM}}$, shows a significant decrease for increasing transverse energy deposited at large pseudorapidities. These results, which cover a wide kinematic range, provide new insight on the role of cold nuclear matter effects on prompt and nonprompt $ \mathrm{J} / \psi $ production. | ||
| Links: e-print arXiv:1702.01462 [nucl-ex] (PDF) ; CDS record ; inSPIRE record ; HepData record ; CADI line (restricted) ; | ||
| Figures & Tables | Summary | Additional Figures | References | CMS Publications |
|---|
| Figures | |
png pdf |
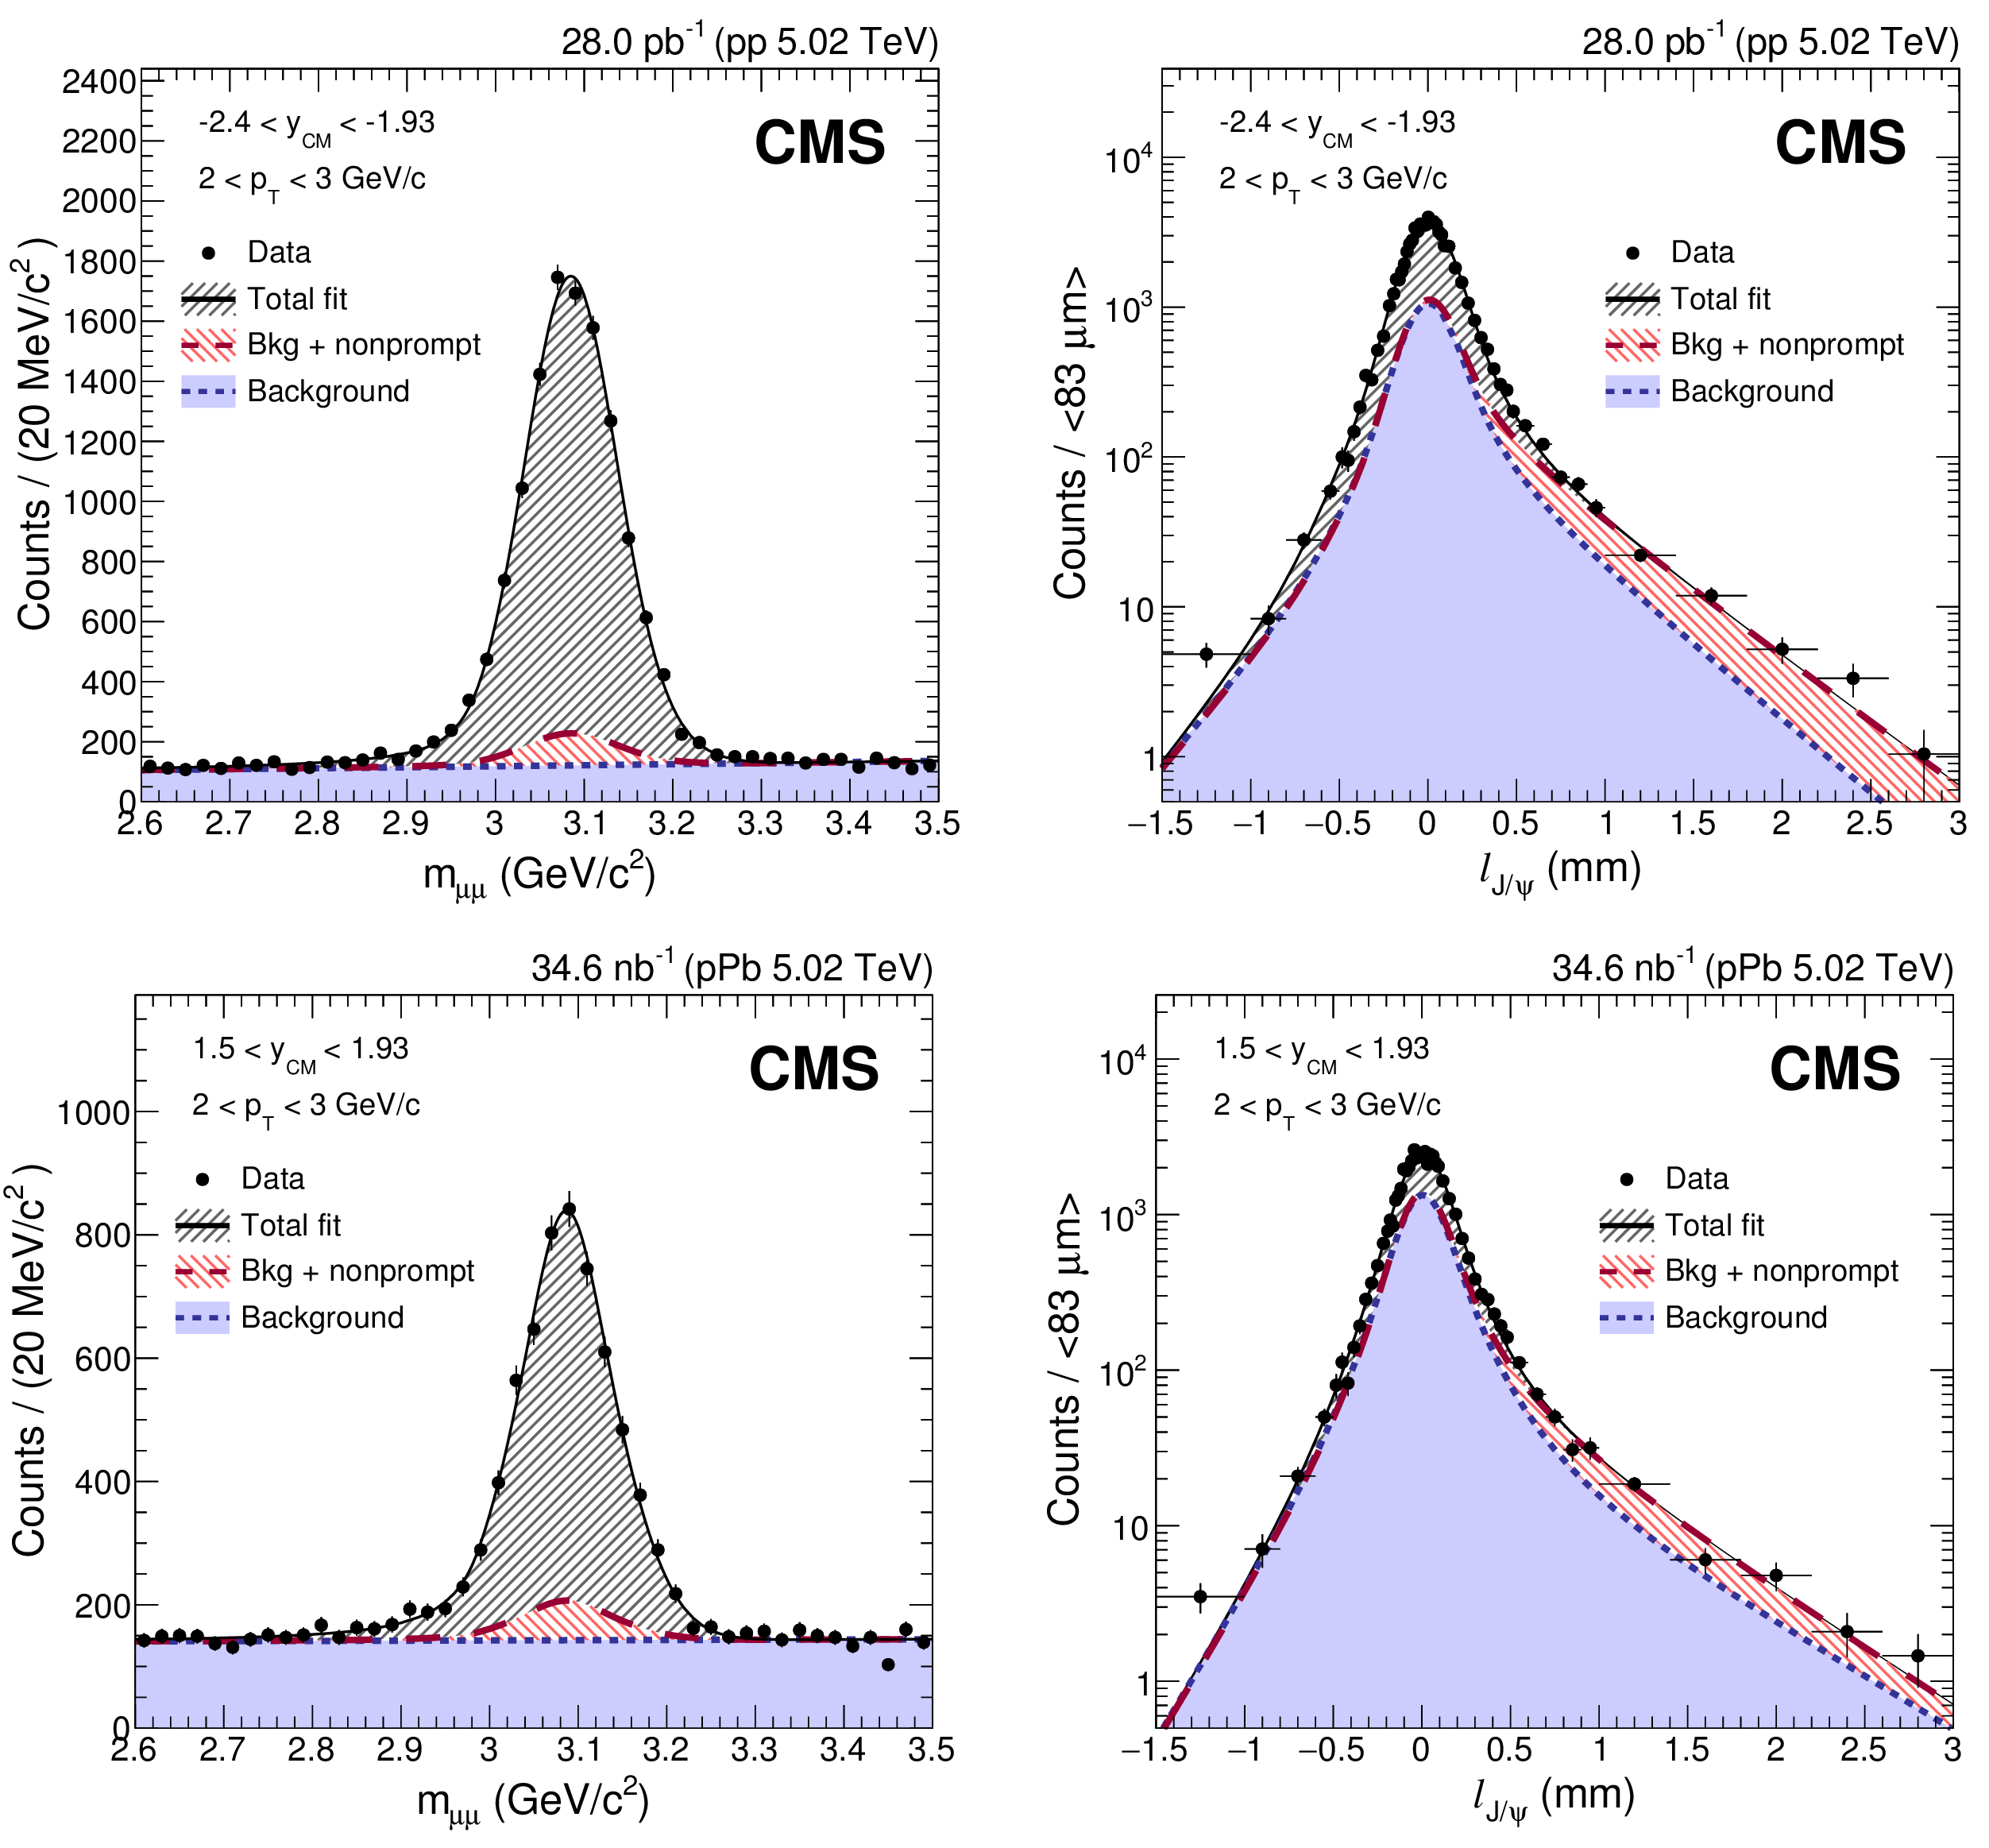
Figure 1:
Examples of the invariant mass (left) and pseudo-proper decay length (right) distributions of $ \mu^{+} \mu^{-} $ pairs for pp (upper) and pPb (lower) collisions. The projections of the 2D fit function onto the respective axes are overlaid as solid lines. The long-dashed lines show the fitted contribution of nonprompt $ \mathrm{J} / \psi $ mesons. The fitted background contributions are shown by short-dashed lines. |

png pdf |
Figure 1-a:
Invariant mass distribution of $ \mu^{+} \mu^{-} $ pairs for pp collisions. The projections of the 2D fit function onto the respective axes are overlaid as solid lines. The long-dashed lines show the fitted contribution of nonprompt $ \mathrm{J} / \psi $ mesons. The fitted background contributions are shown by short-dashed lines. |
png pdf |
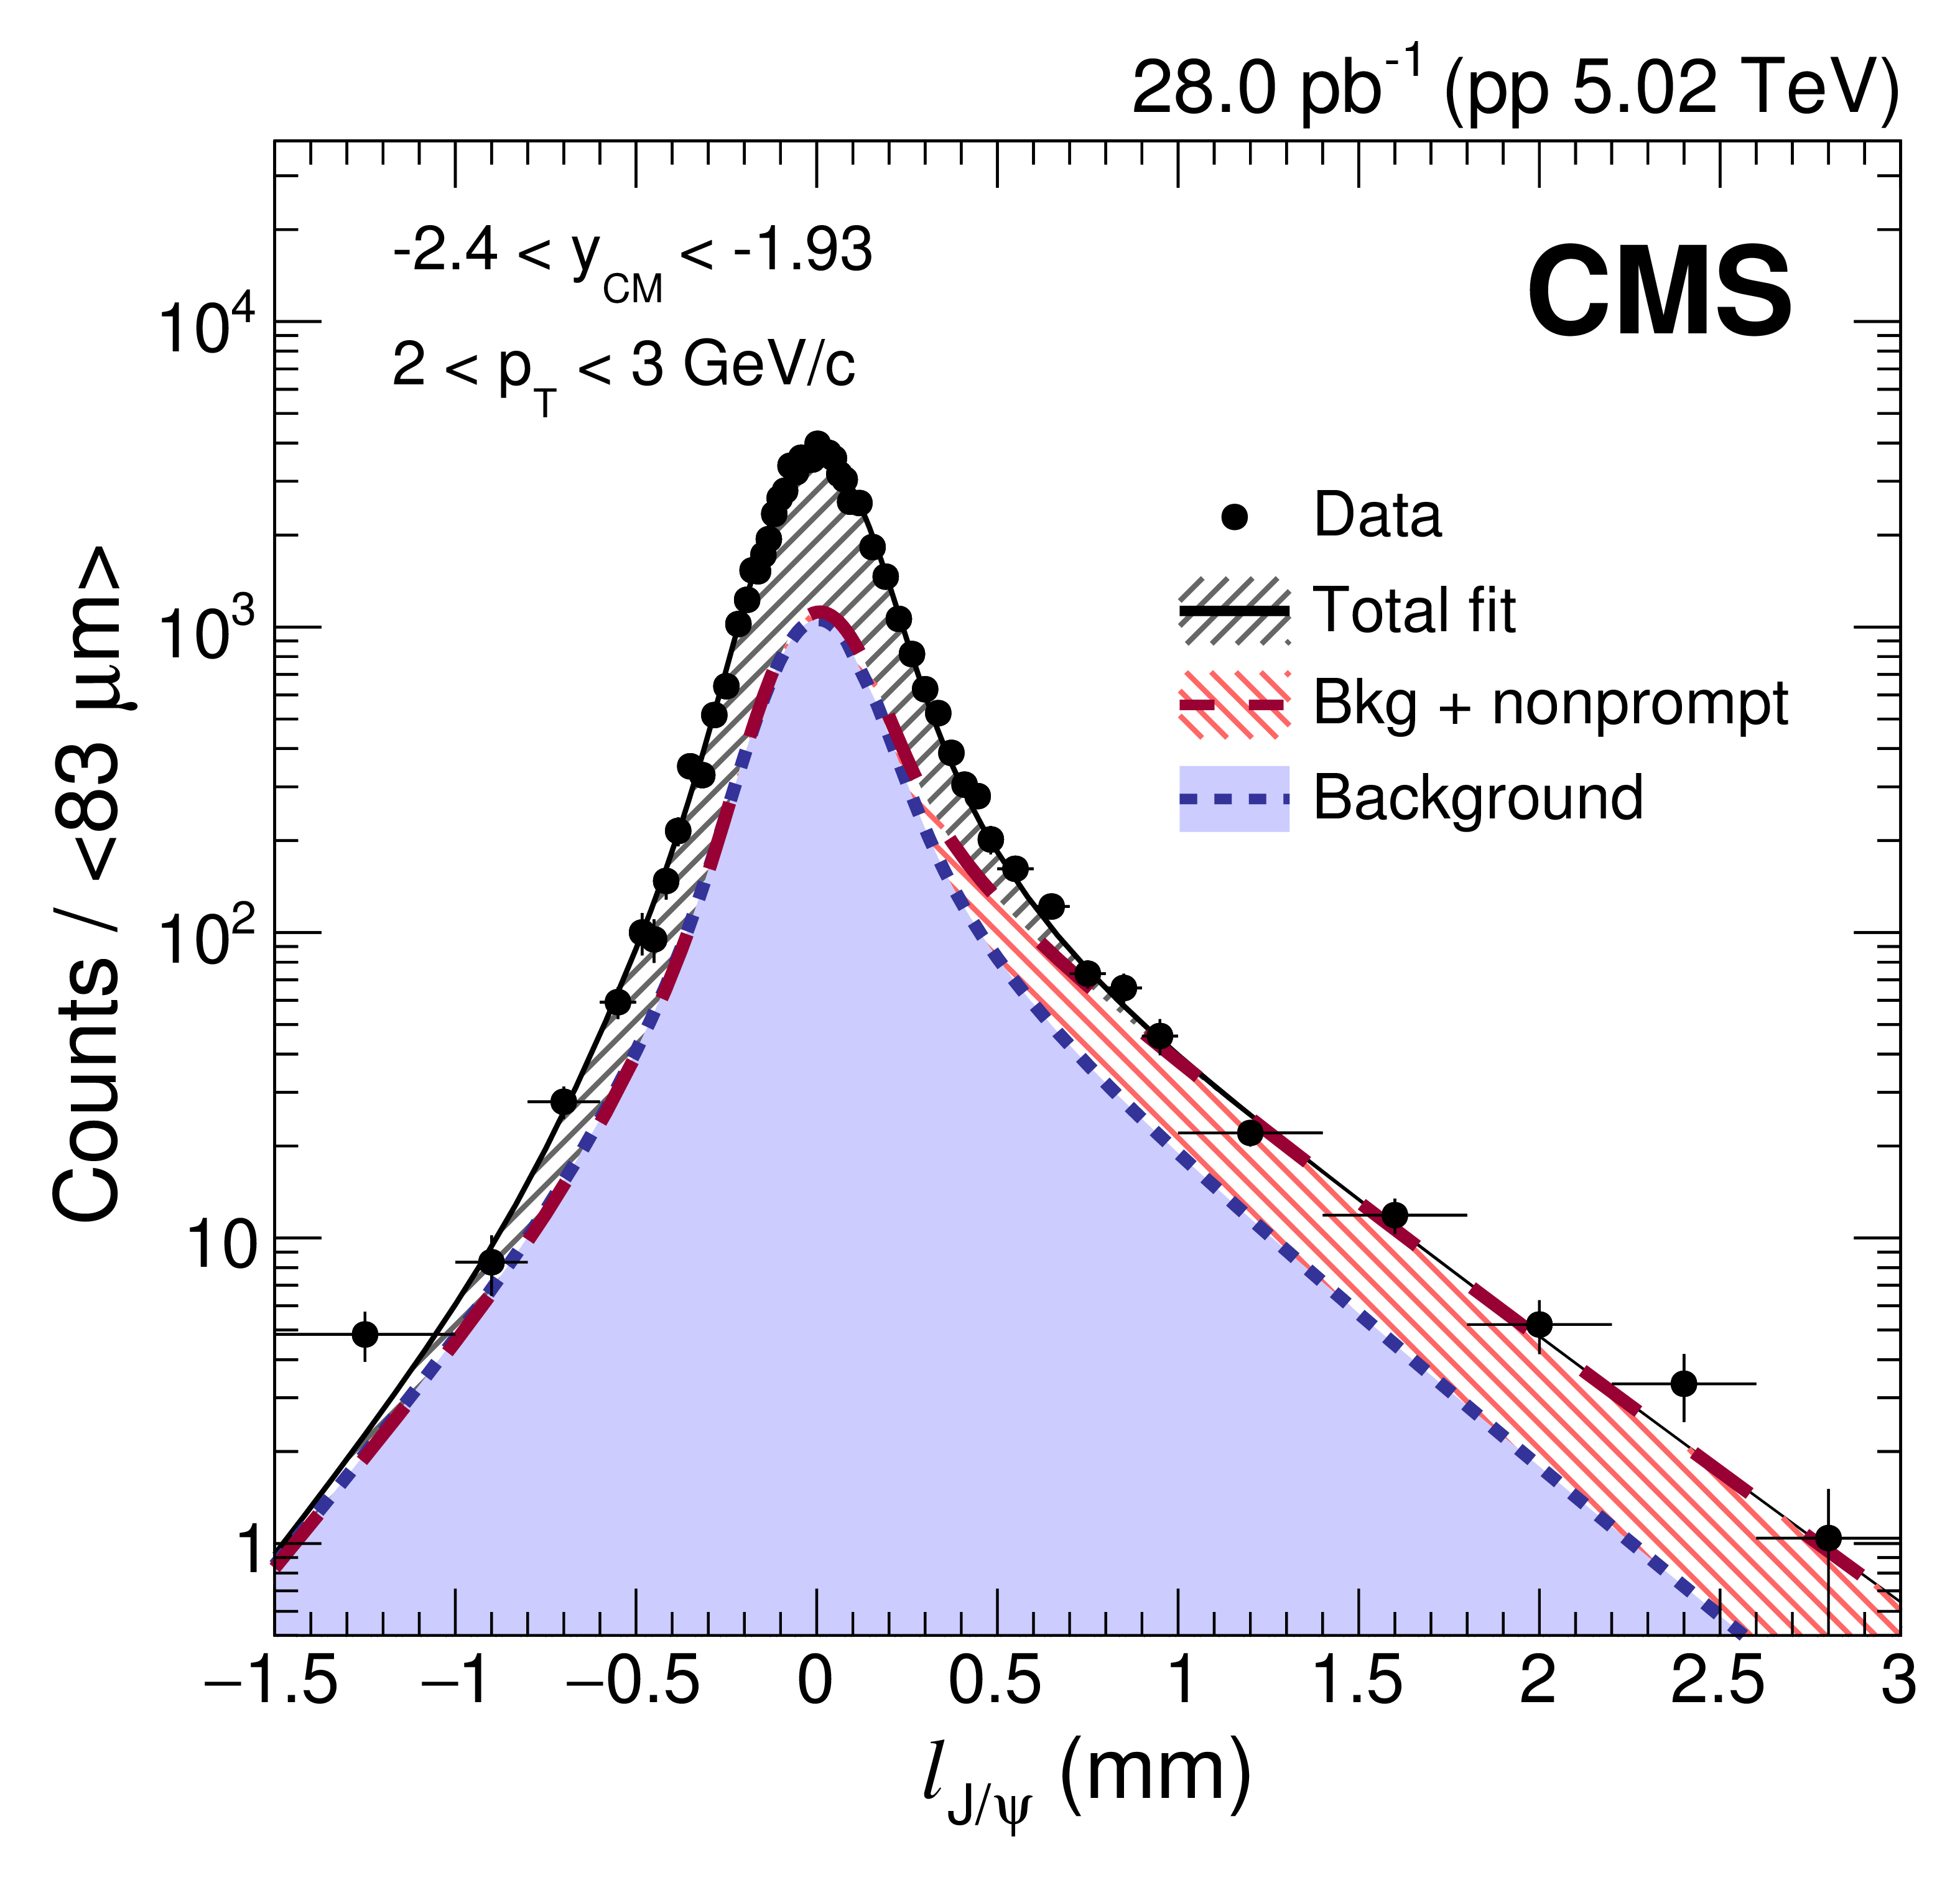
Figure 1-b:
Pseudo-proper decay length distribution of $ \mu^{+} \mu^{-} $ pairs for pp collisions. The projections of the 2D fit function onto the respective axes are overlaid as solid lines. The long-dashed lines show the fitted contribution of nonprompt $ \mathrm{J} / \psi $ mesons. The fitted background contributions are shown by short-dashed lines. |
png pdf |
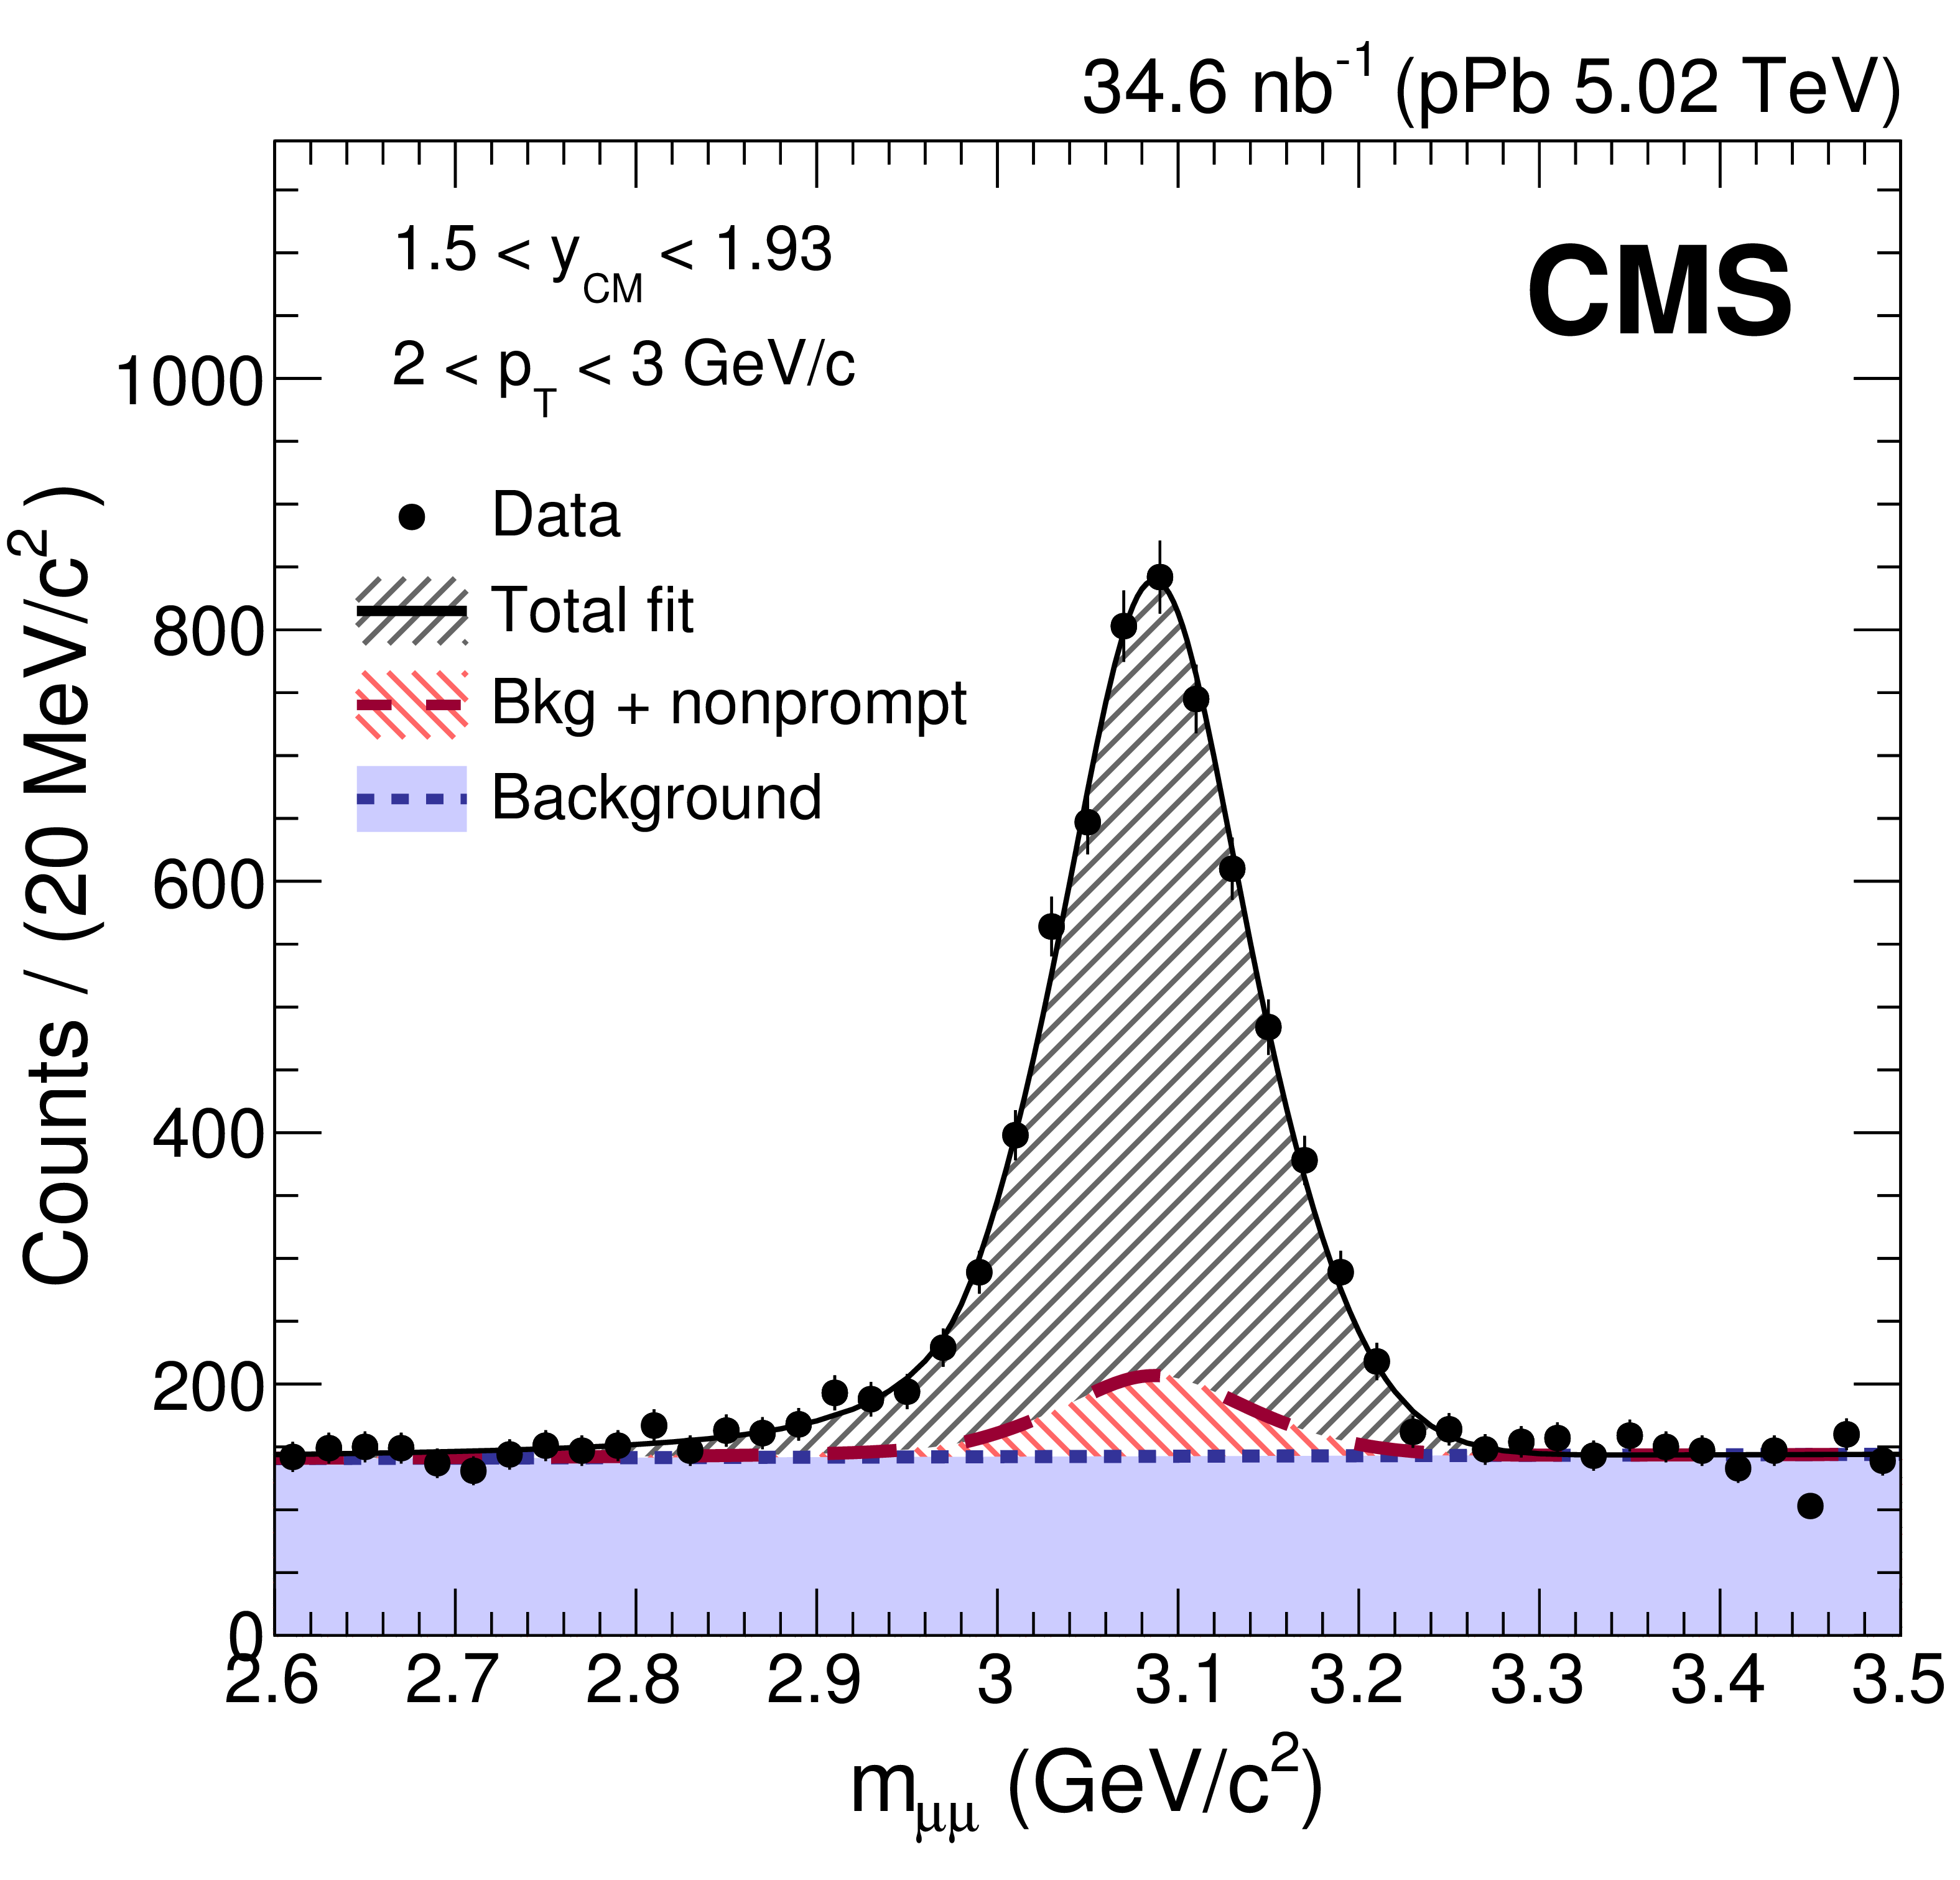
Figure 1-c:
Invariant mass distribution of $ \mu^{+} \mu^{-} $ pairs for Pb collisions. The projections of the 2D fit function onto the respective axes are overlaid as solid lines. The long-dashed lines show the fitted contribution of nonprompt $ \mathrm{J} / \psi $ mesons. The fitted background contributions are shown by short-dashed lines. |
png pdf |
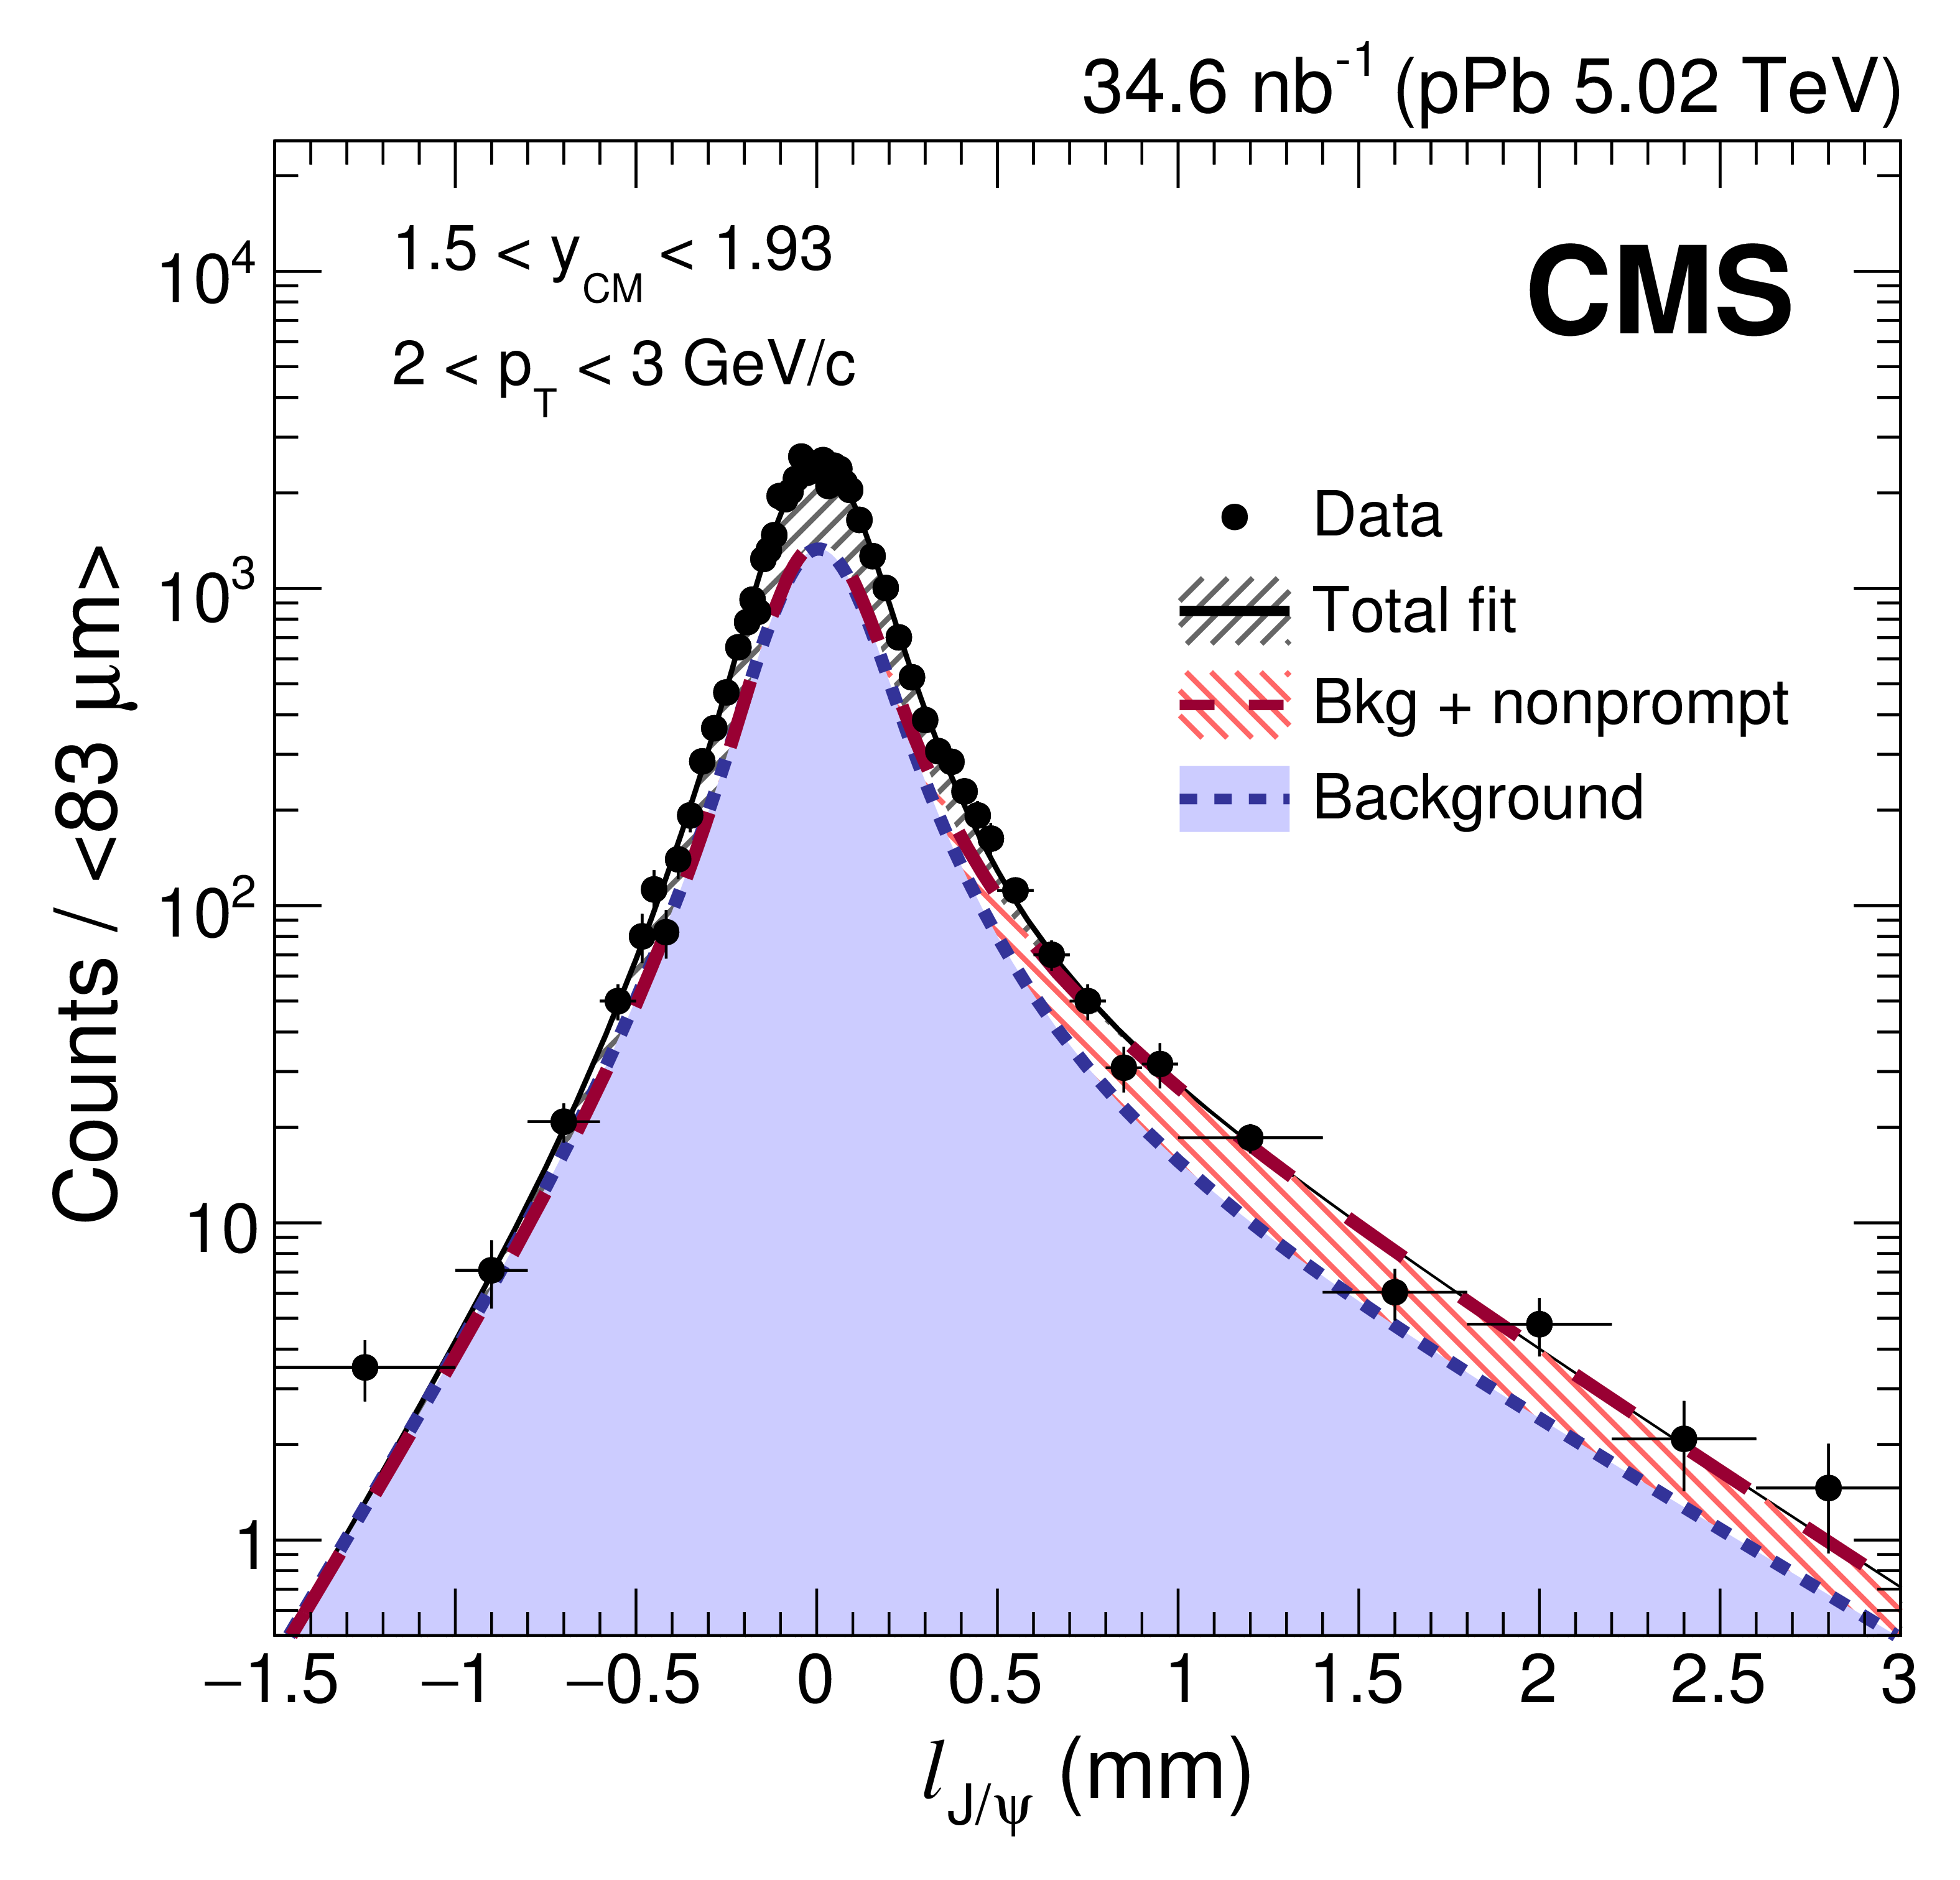
Figure 1-d:
Pseudo-proper decay length distribution of $ \mu^{+} \mu^{-} $ pairs for pPb collisions. The projections of the 2D fit function onto the respective axes are overlaid as solid lines. The long-dashed lines show the fitted contribution of nonprompt $ \mathrm{J} / \psi $ mesons. The fitted background contributions are shown by short-dashed lines. |
png pdf |
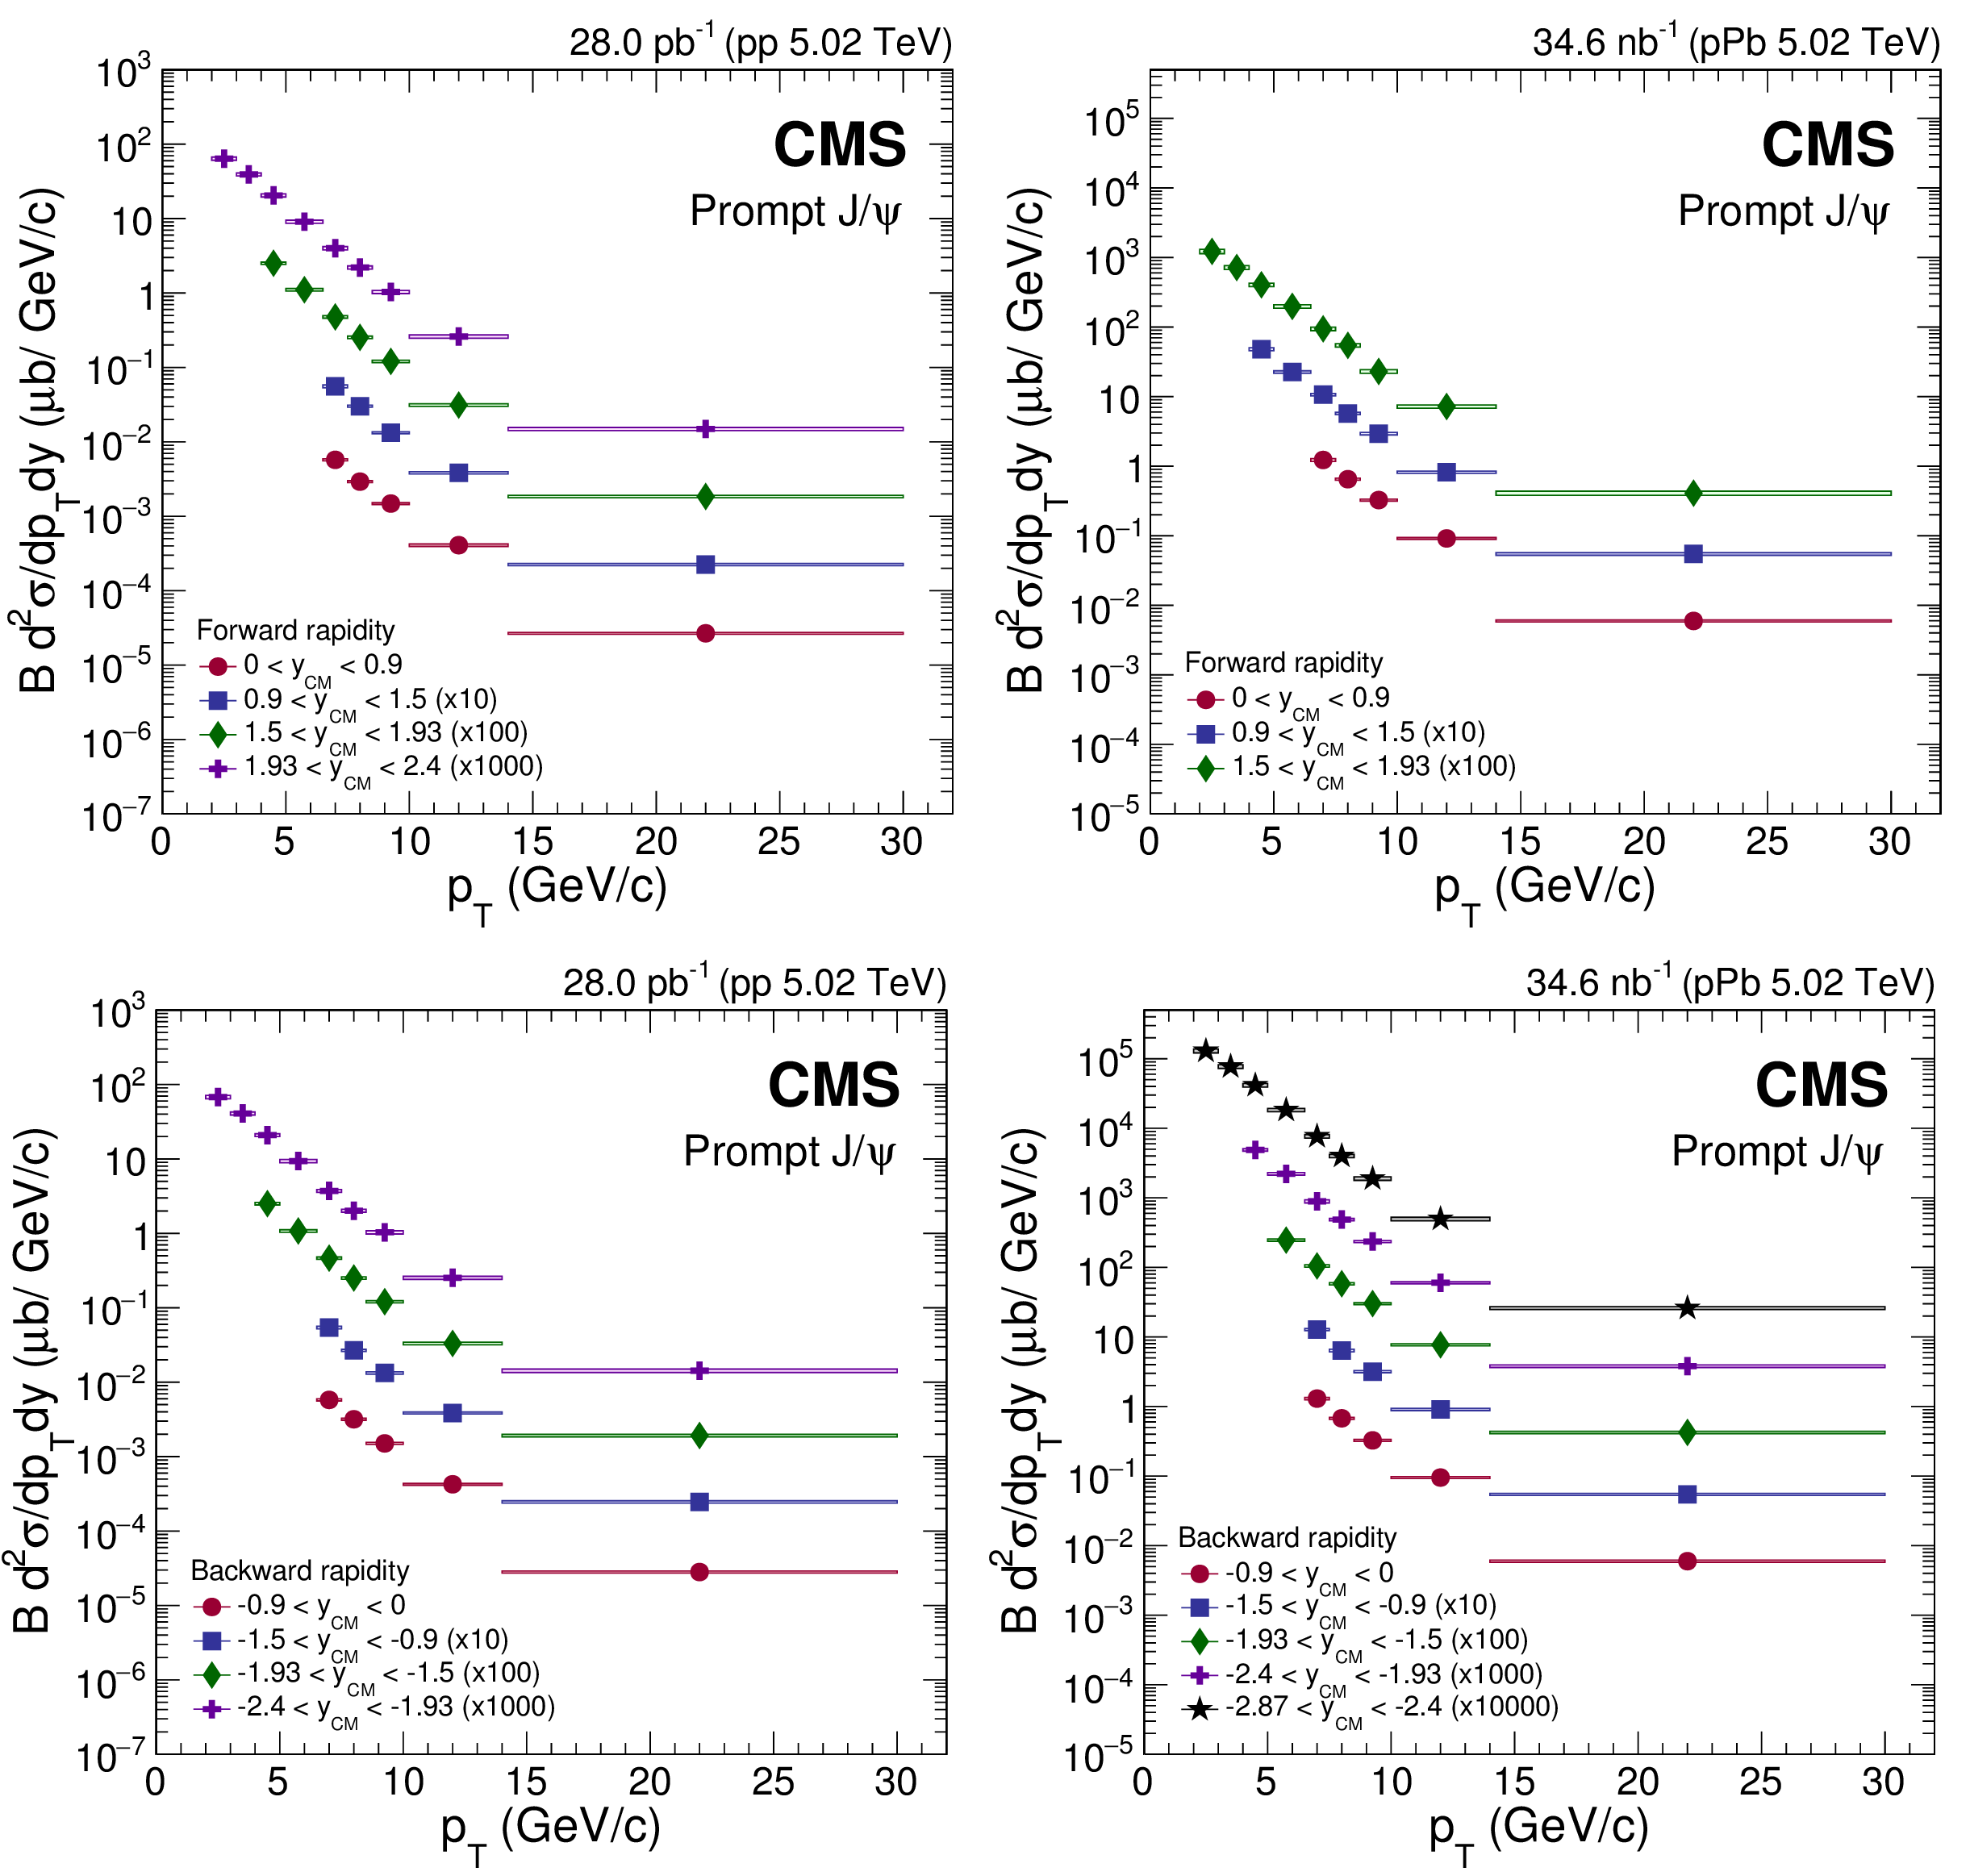
Figure 2:
Differential cross section (multiplied by the dimuon branching fraction) of prompt $ \mathrm{J} / \psi $ mesons in pp (left) and pPb (right) collisions at forward (upper) and backward (lower) $ {y_{\mathrm {CM}}} $. The vertical bars (smaller than the symbols in most cases) represent the statistical uncertainties and the shaded boxes show the systematic uncertainties. The fully correlated global uncertainty from the integrated luminosity determination, 2.3% for pp and 3.5% for pPb collisions, is not included in the point-by-point uncertainties. |
png pdf |
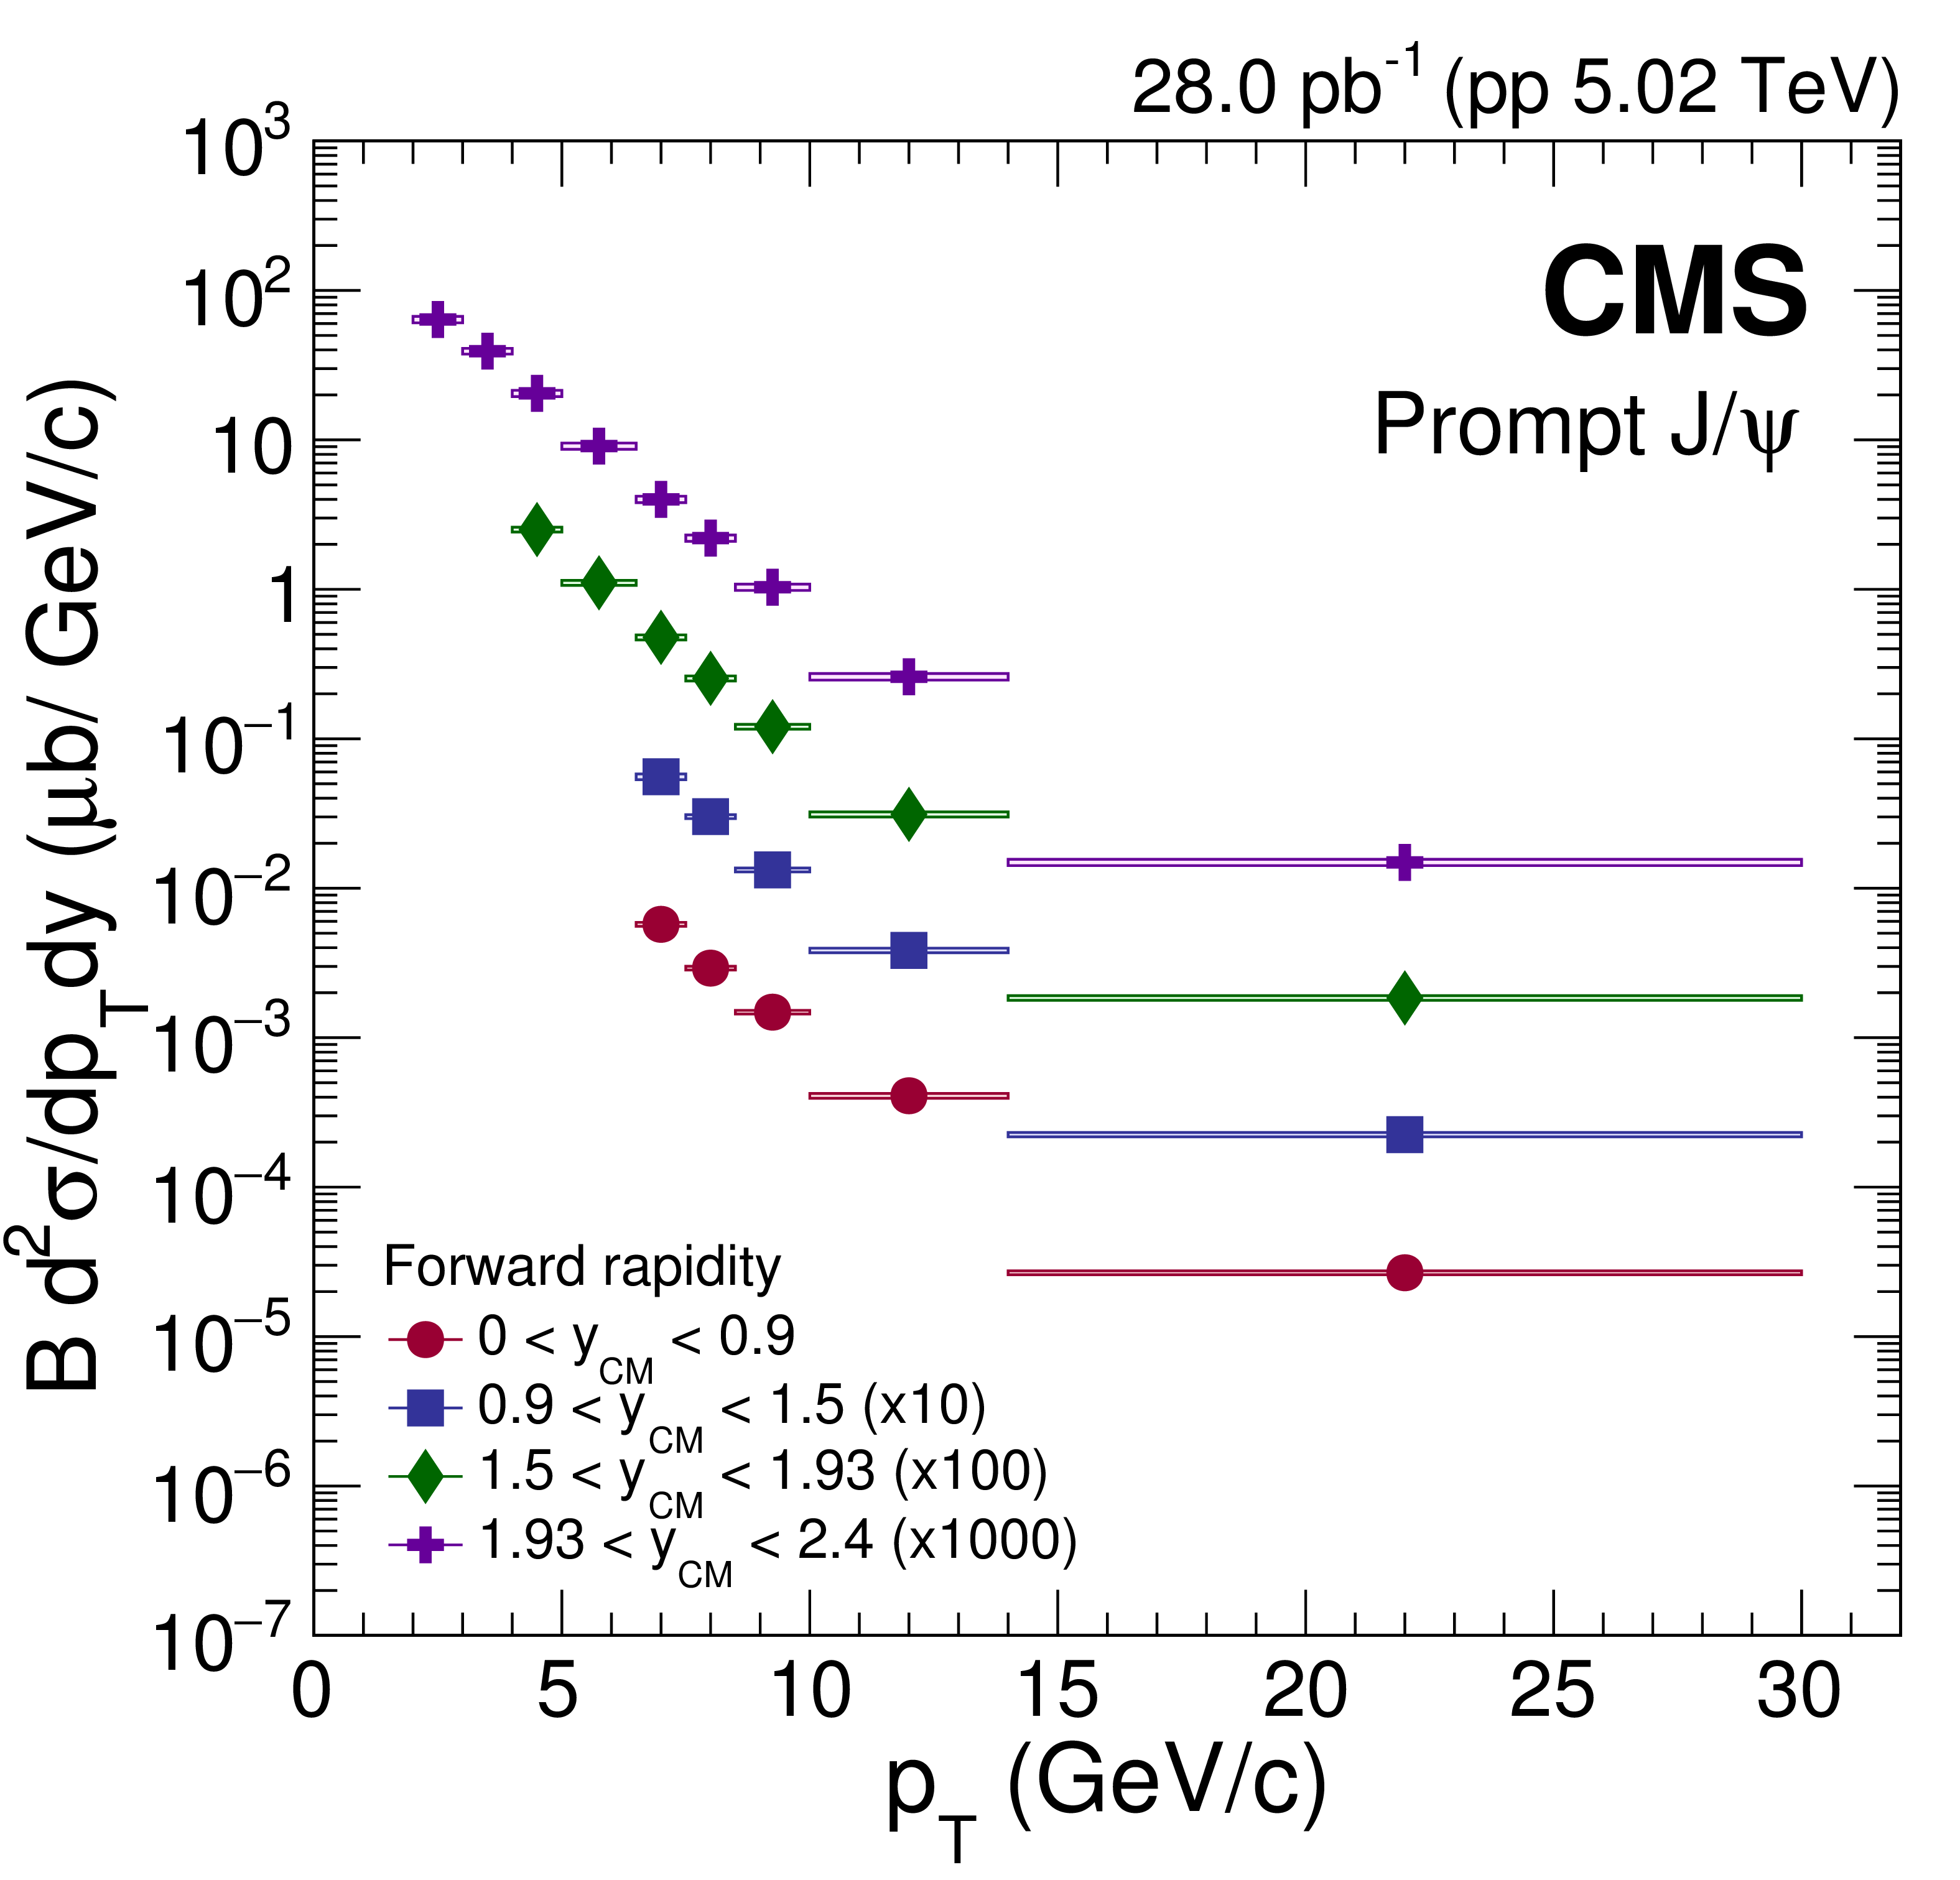
Figure 2-a:
Differential cross section (multiplied by the dimuon branching fraction) of prompt $ \mathrm{J} / \psi $ mesons in pp collisions at forward $ {y_{\mathrm {CM}}} $. The vertical bars (smaller than the symbols in most cases) represent the statistical uncertainties and the shaded boxes show the systematic uncertainties. The fully correlated global uncertainty from the integrated luminosity determination, 2.3%, is not included in the point-by-point uncertainties. |
png pdf |
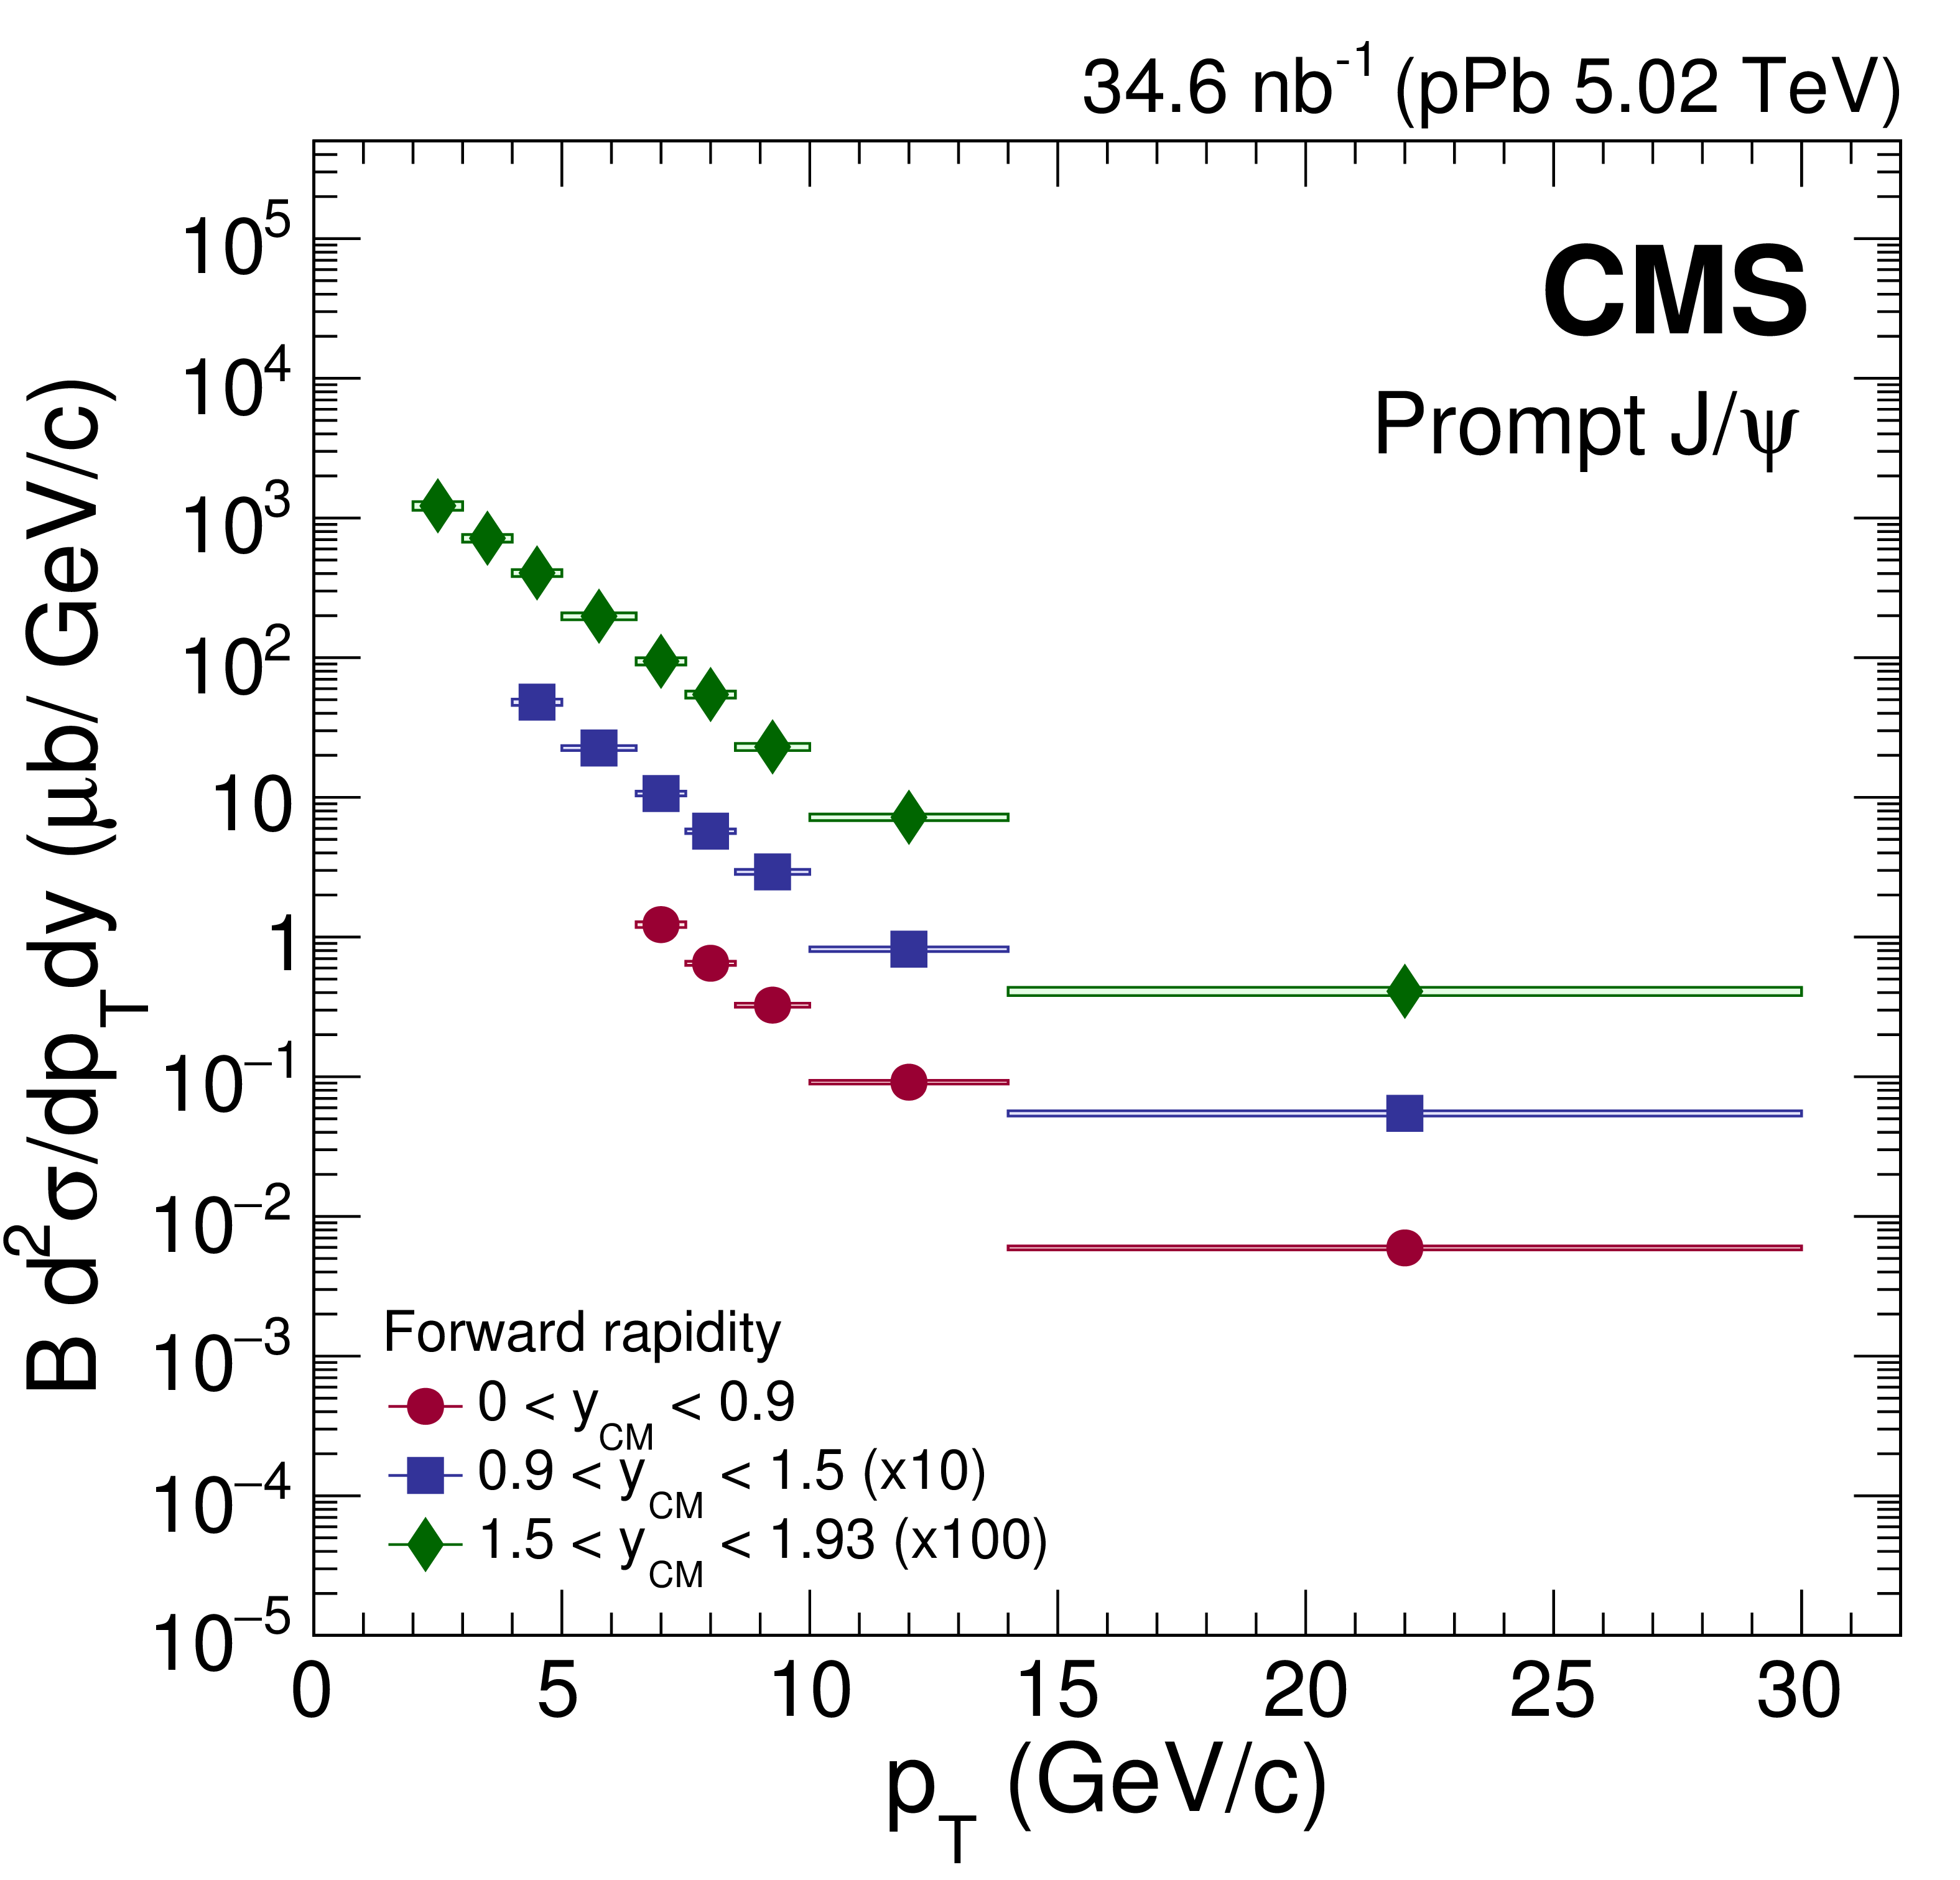
Figure 2-b:
Differential cross section (multiplied by the dimuon branching fraction) of prompt $ \mathrm{J} / \psi $ mesons in pPb collisions at forward $ {y_{\mathrm {CM}}} $. The vertical bars (smaller than the symbols in most cases) represent the statistical uncertainties and the shaded boxes show the systematic uncertainties. The fully correlated global uncertainty from the integrated luminosity determination, 3.5%, is not included in the point-by-point uncertainties. |
png pdf |
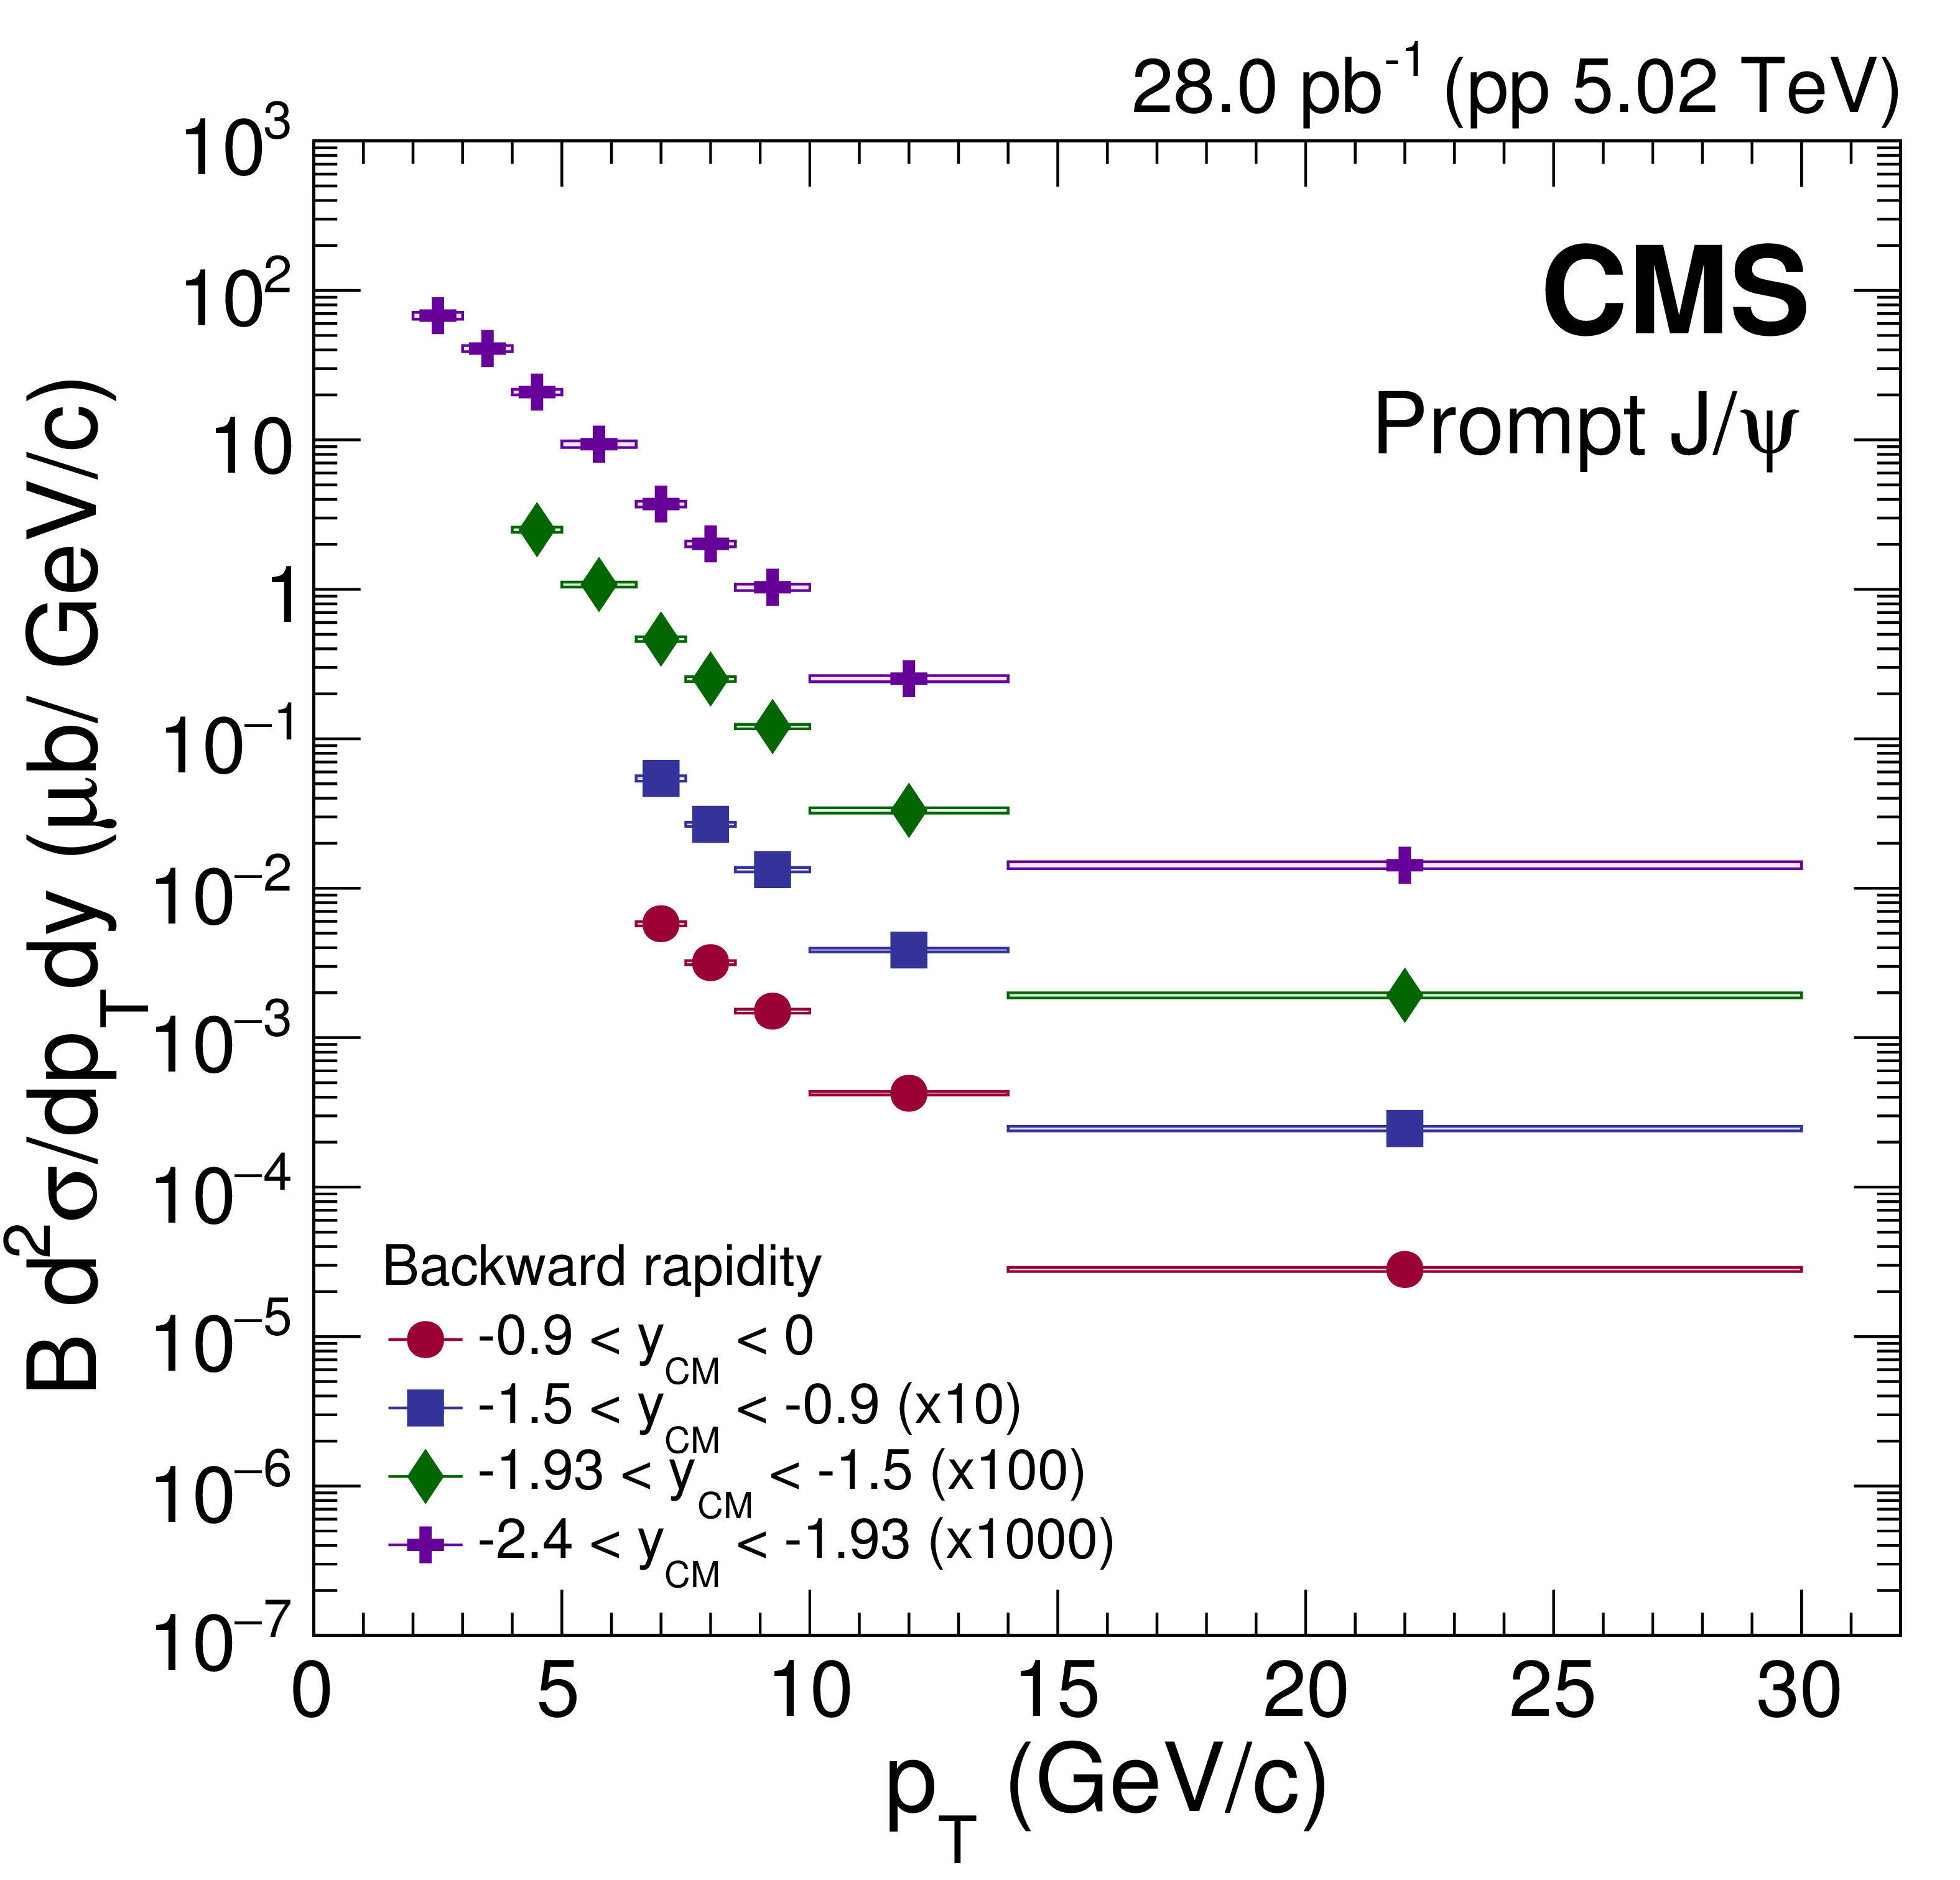
Figure 2-c:
Differential cross section (multiplied by the dimuon branching fraction) of prompt $ \mathrm{J} / \psi $ mesons in pp collisions at backward $ {y_{\mathrm {CM}}} $. The vertical bars (smaller than the symbols in most cases) represent the statistical uncertainties and the shaded boxes show the systematic uncertainties. The fully correlated global uncertainty from the integrated luminosity determination, 2.3%, is not included in the point-by-point uncertainties. |

png pdf |
Figure 2-d:
Differential cross section (multiplied by the dimuon branching fraction) of prompt $ \mathrm{J} / \psi $ mesons in pPb collisions at backward $ {y_{\mathrm {CM}}} $. The vertical bars (smaller than the symbols in most cases) represent the statistical uncertainties and the shaded boxes show the systematic uncertainties. The fully correlated global uncertainty from the integrated luminosity determination, 3.5%, is not included in the point-by-point uncertainties. |

png pdf |
Figure 3:
Rapidity dependence of the cross section (multiplied by the dimuon branching fraction) for prompt $ \mathrm{J} / \psi $ mesons in the $ {p_{\mathrm {T}}} $ intervals of 6.5 $ < {p_{\mathrm {T}}} < $ 10 GeV/$c$ (circles) and 10 $ < {p_{\mathrm {T}}} < $ 30 GeV/$c$ (squares) in pp (left) and pPb (right) collisions. The vertical dashed line indicates $ {y_{\mathrm {CM}}} = $ 0. The vertical bars (smaller than the symbols in most cases) represent the statistical uncertainties and the shaded boxes show the systematic uncertainties. The fully correlated global uncertainty from the integrated luminosity determination, 2.3% for pp and 3.5% for pPb collisions, is not included in the point-by-point uncertainties. |

png pdf |
Figure 3-a:
Rapidity dependence of the cross section (multiplied by the dimuon branching fraction) for prompt $ \mathrm{J} / \psi $ mesons in the $ {p_{\mathrm {T}}} $ intervals of 6.5 $ < {p_{\mathrm {T}}} < $ 10 GeV/$c$ (circles) and 10 $ < {p_{\mathrm {T}}} < $ 30 GeV/$c$ (squares) in pp collisions. The vertical dashed line indicates $ {y_{\mathrm {CM}}} = $ 0. The vertical bars (smaller than the symbols in most cases) represent the statistical uncertainties and the shaded boxes show the systematic uncertainties. The fully correlated global uncertainty from the integrated luminosity determination, 2.3%, is not included in the point-by-point uncertainties. |

png pdf |
Figure 3-b:
Rapidity dependence of the cross section (multiplied by the dimuon branching fraction) for prompt $ \mathrm{J} / \psi $ mesons in the $ {p_{\mathrm {T}}} $ intervals of 6.5 $ < {p_{\mathrm {T}}} < $ 10 GeV/$c$ (circles) and 10 $ < {p_{\mathrm {T}}} < $ 30 GeV/$c$ (squares) in pPb collisions. The vertical dashed line indicates $ {y_{\mathrm {CM}}} = $ 0. The vertical bars (smaller than the symbols in most cases) represent the statistical uncertainties and the shaded boxes show the systematic uncertainties. The fully correlated global uncertainty from the integrated luminosity determination, 3.5%, is not included in the point-by-point uncertainties. |

png pdf |
Figure 4:
Transverse momentum dependence of $ {R_{\mathrm{ p } \mathrm {Pb}}} $ for prompt $ \mathrm{J} / \psi $ mesons in seven $ {y_{\mathrm {CM}}} $ ranges. The vertical bars represent the statistical uncertainties and the shaded boxes show the systematic uncertainties. The fully correlated global uncertainty of 4.2% is displayed as a gray box at $ {R_{\mathrm{ p } \mathrm {Pb}}} = $ 1 next to the left axis. The predictions of shadowing models based on the parameterizations EPS09 and nCTEQ15 [14,46-48] are also shown. |
png pdf |
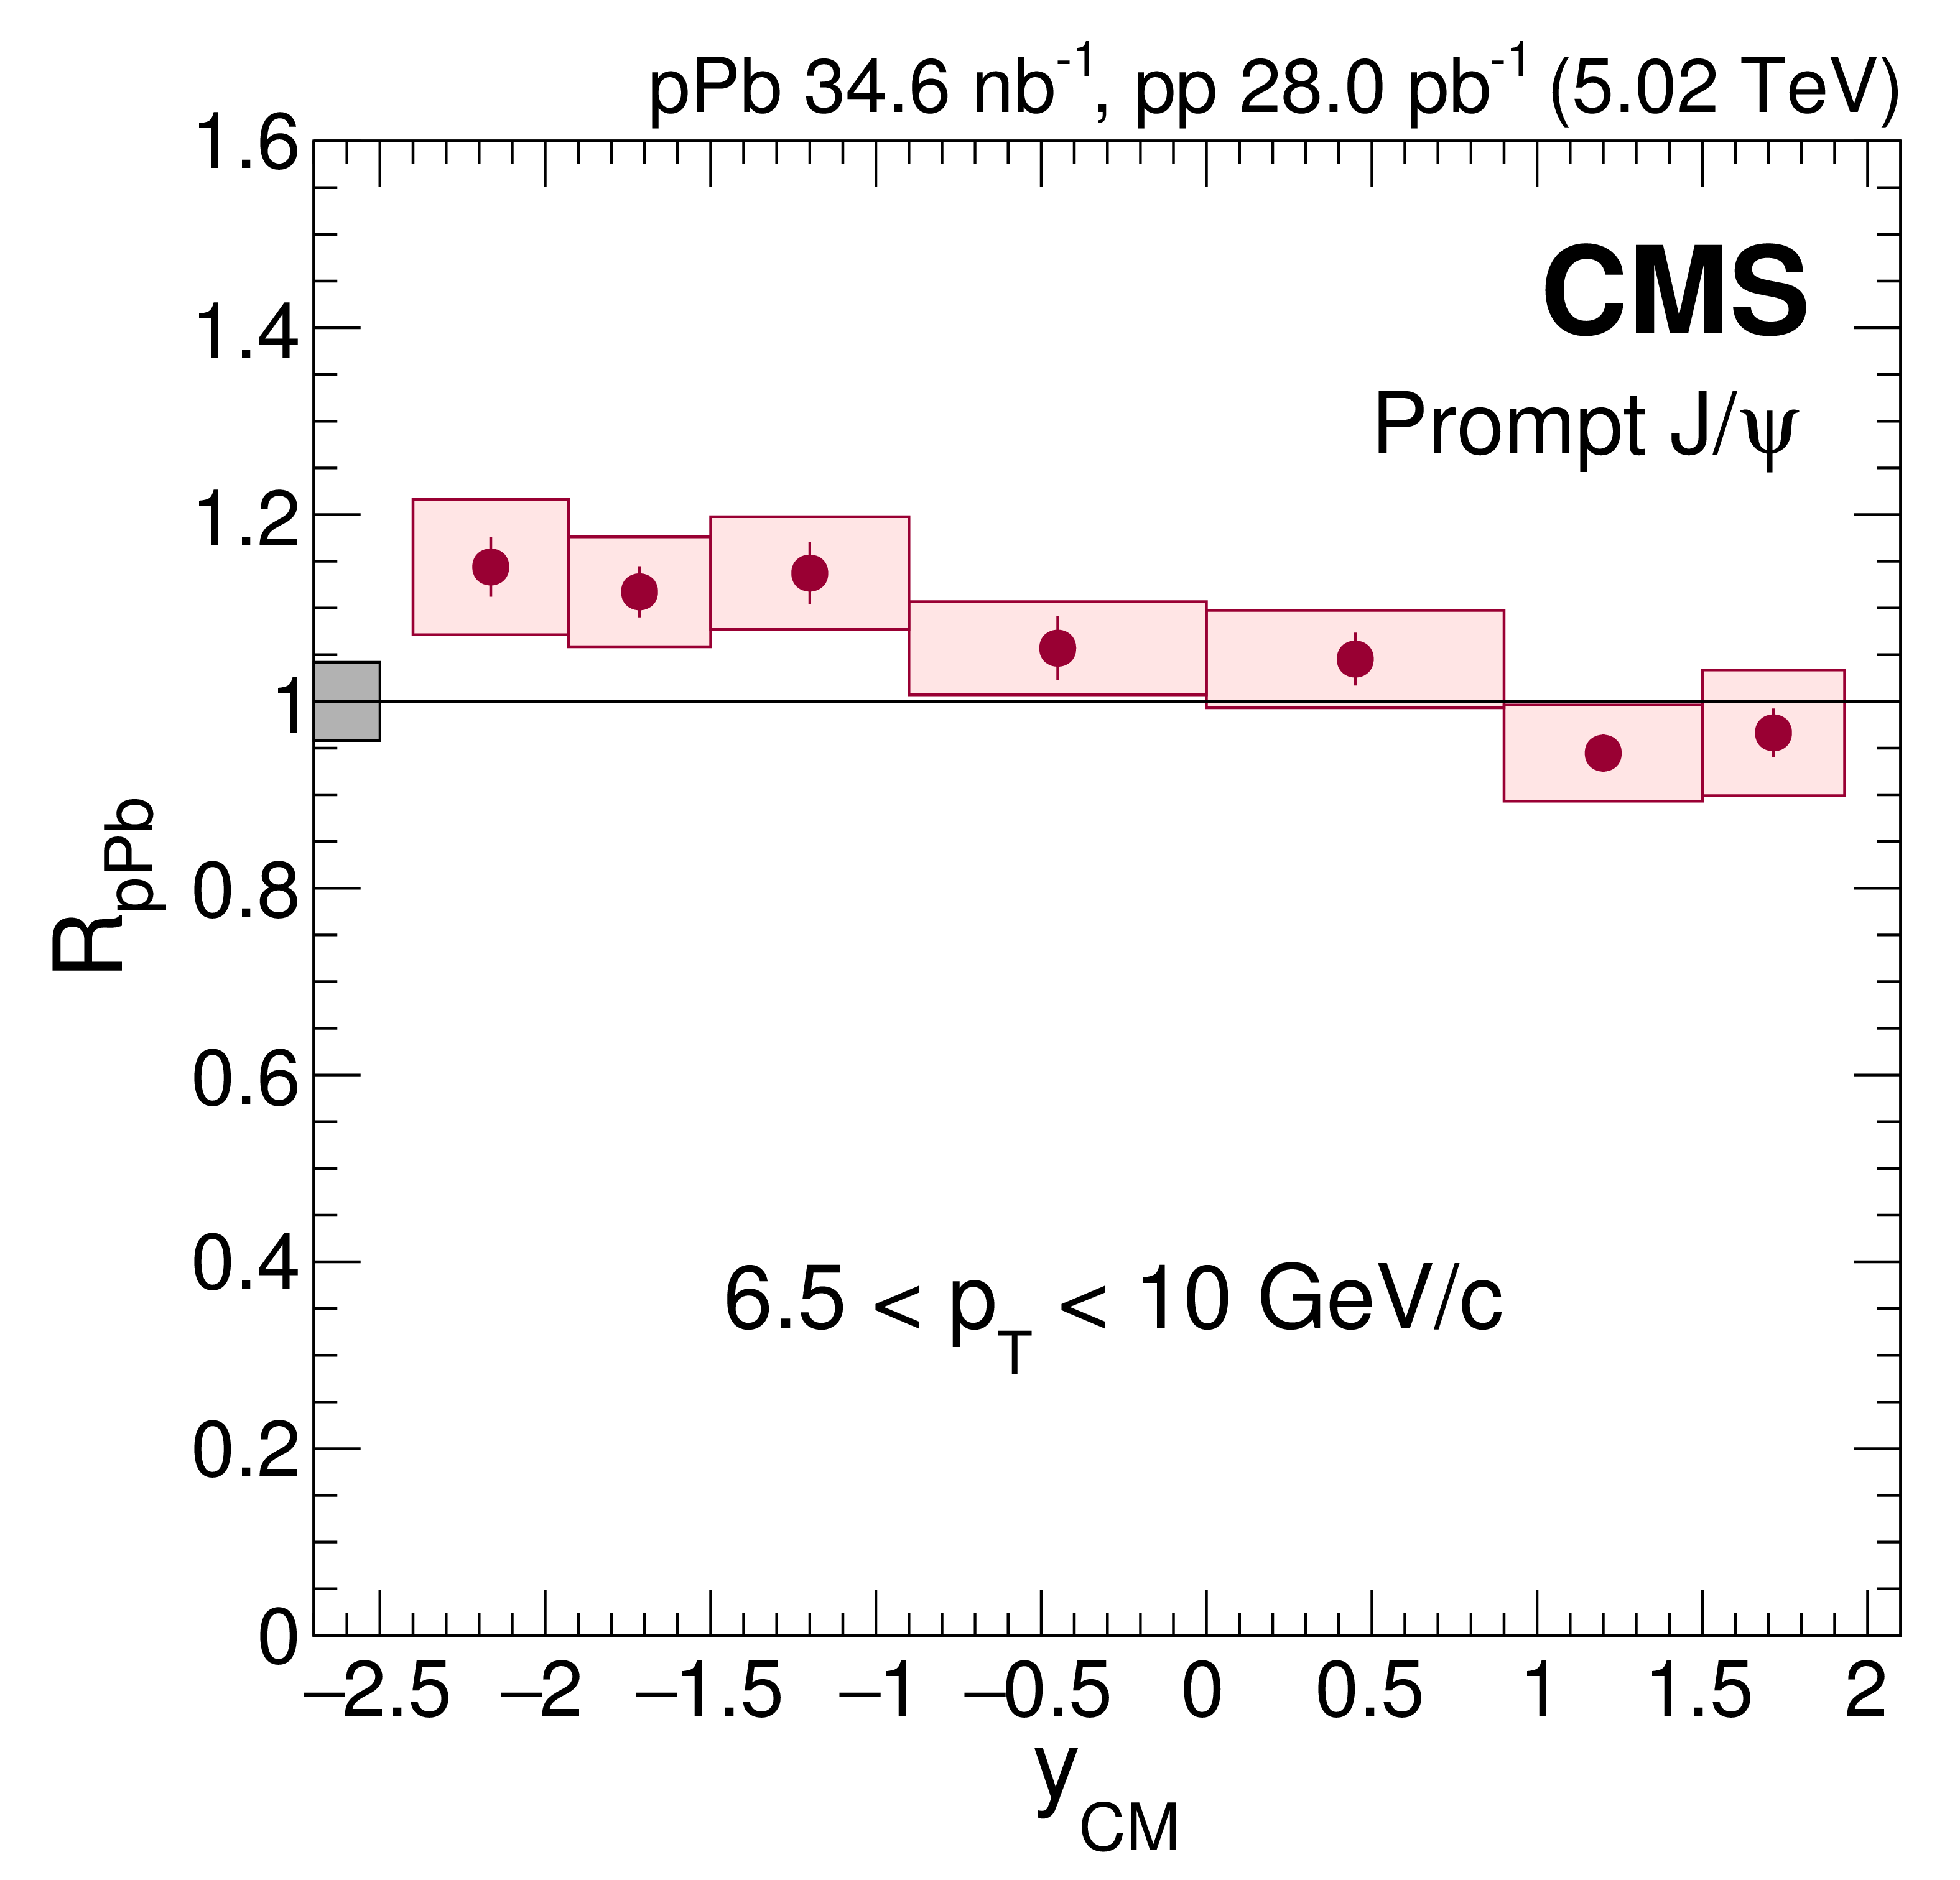
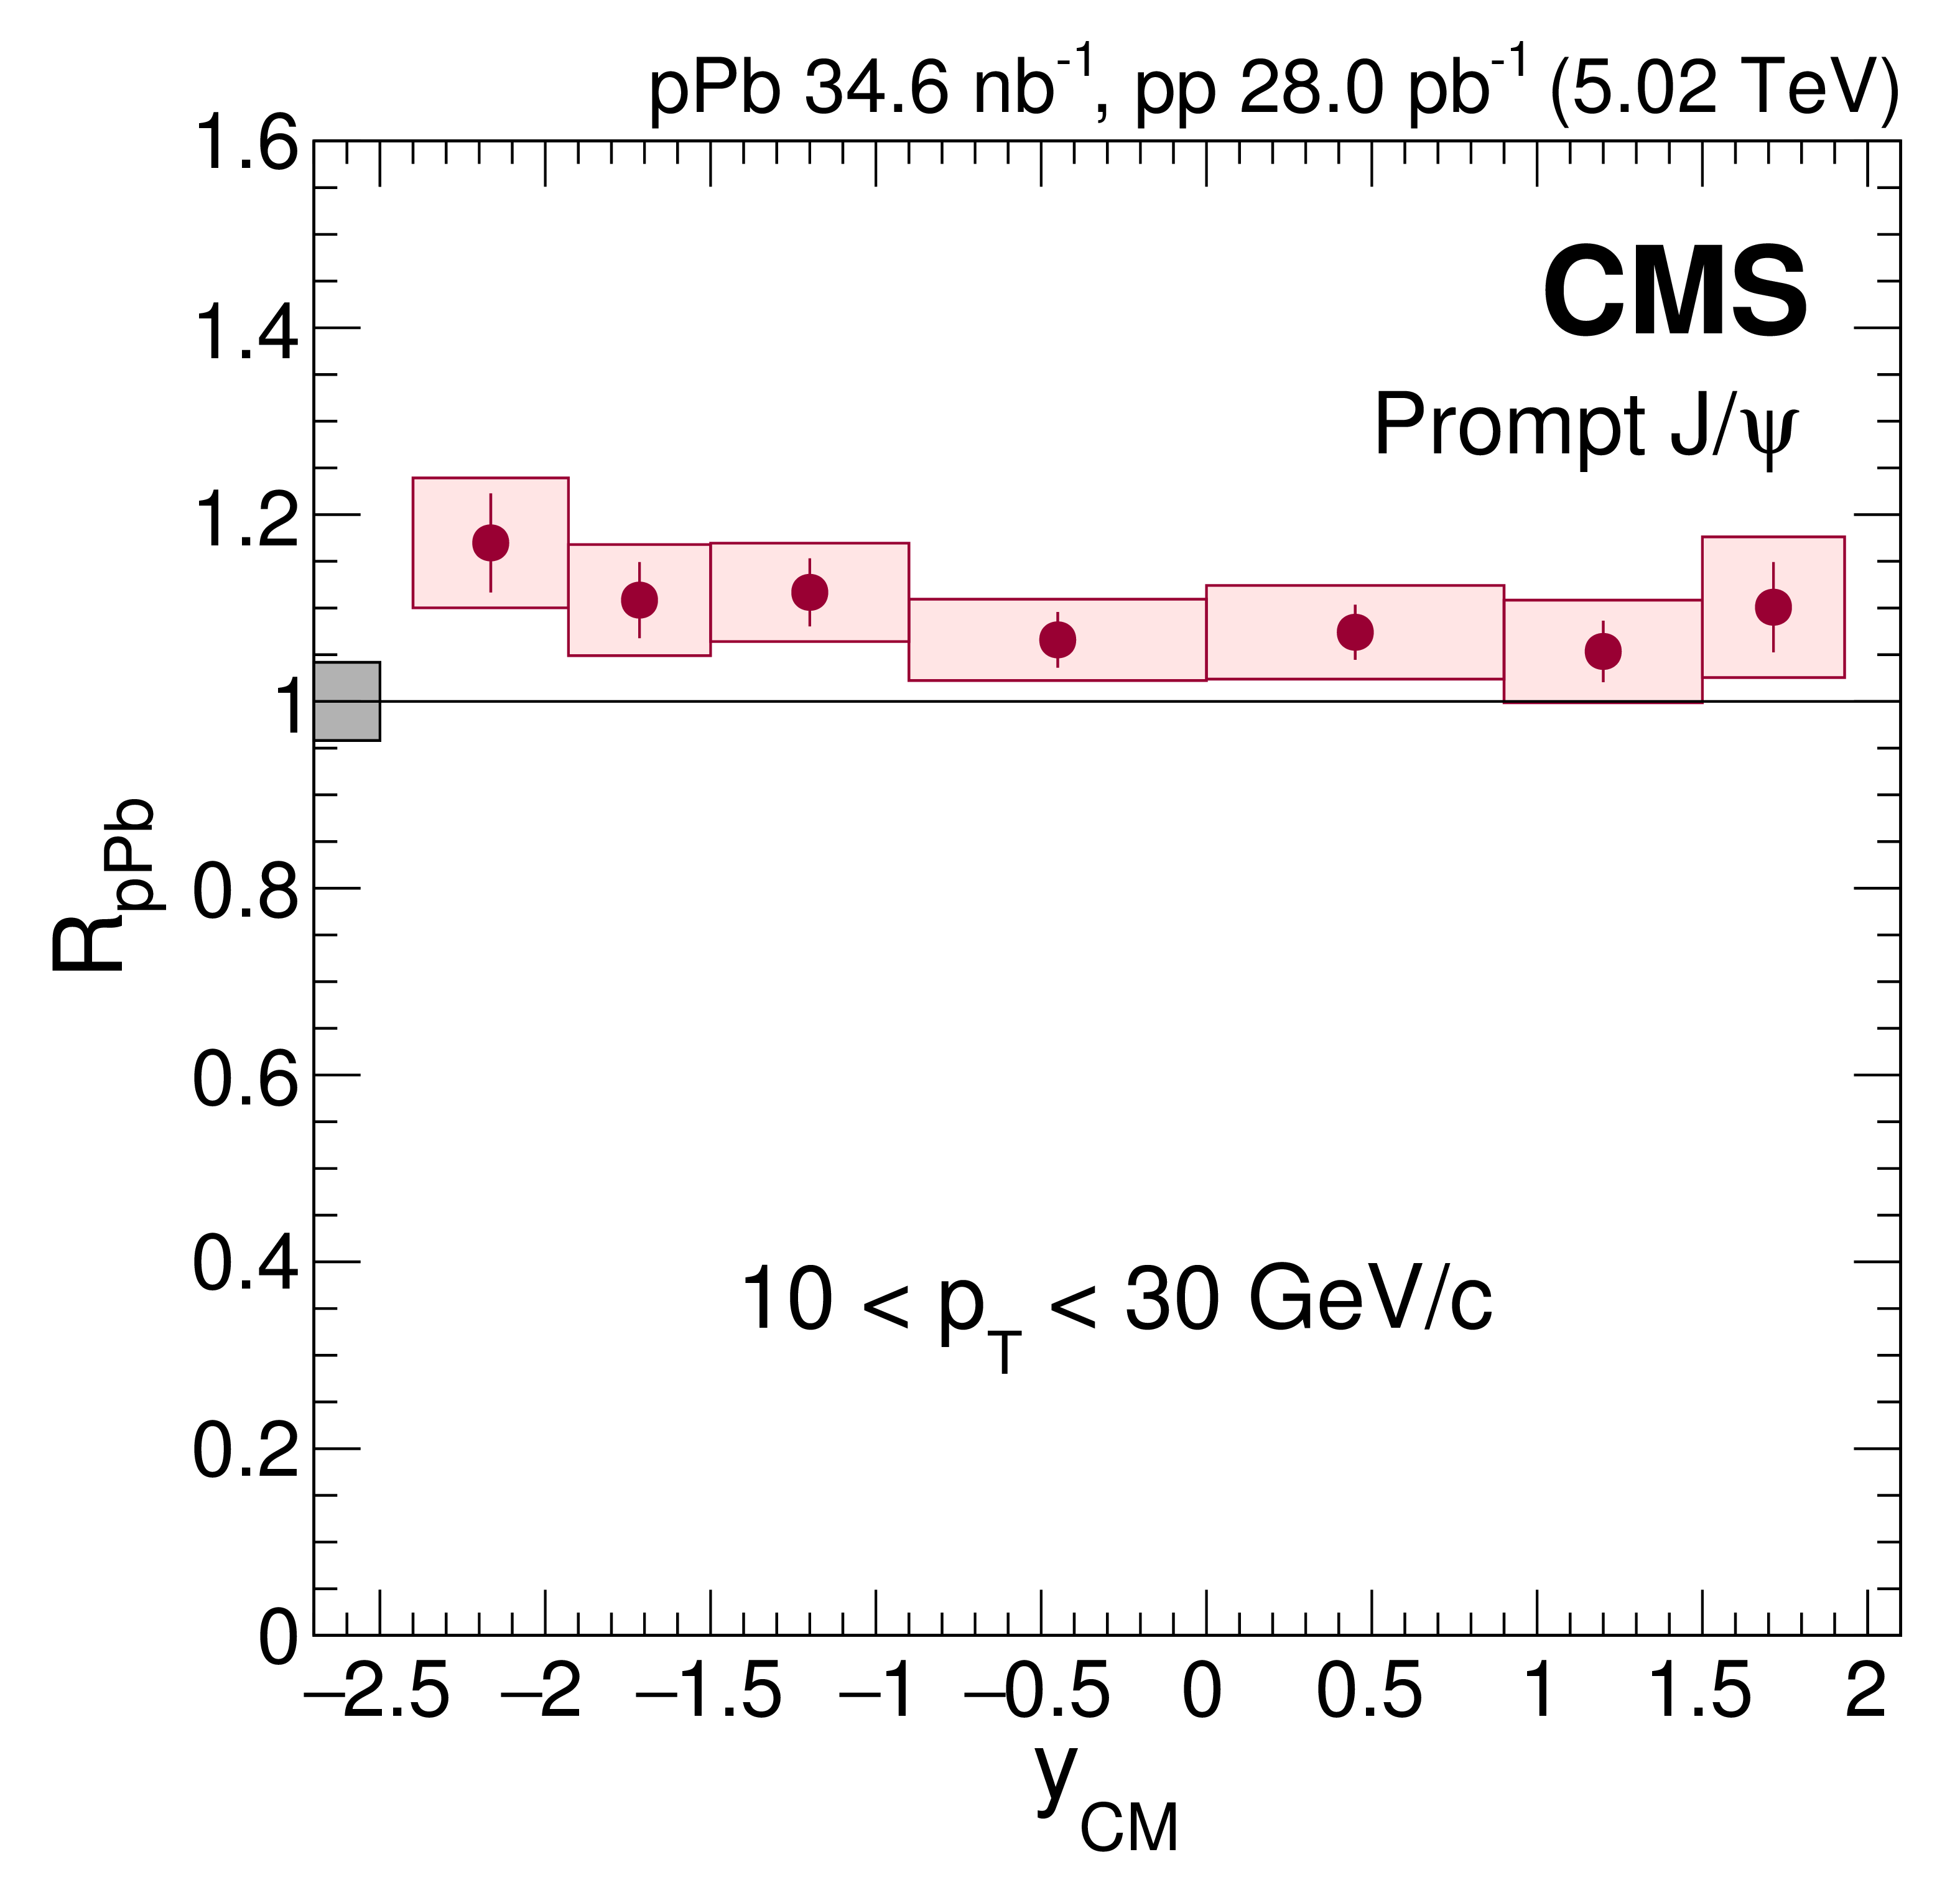
Figure 5:
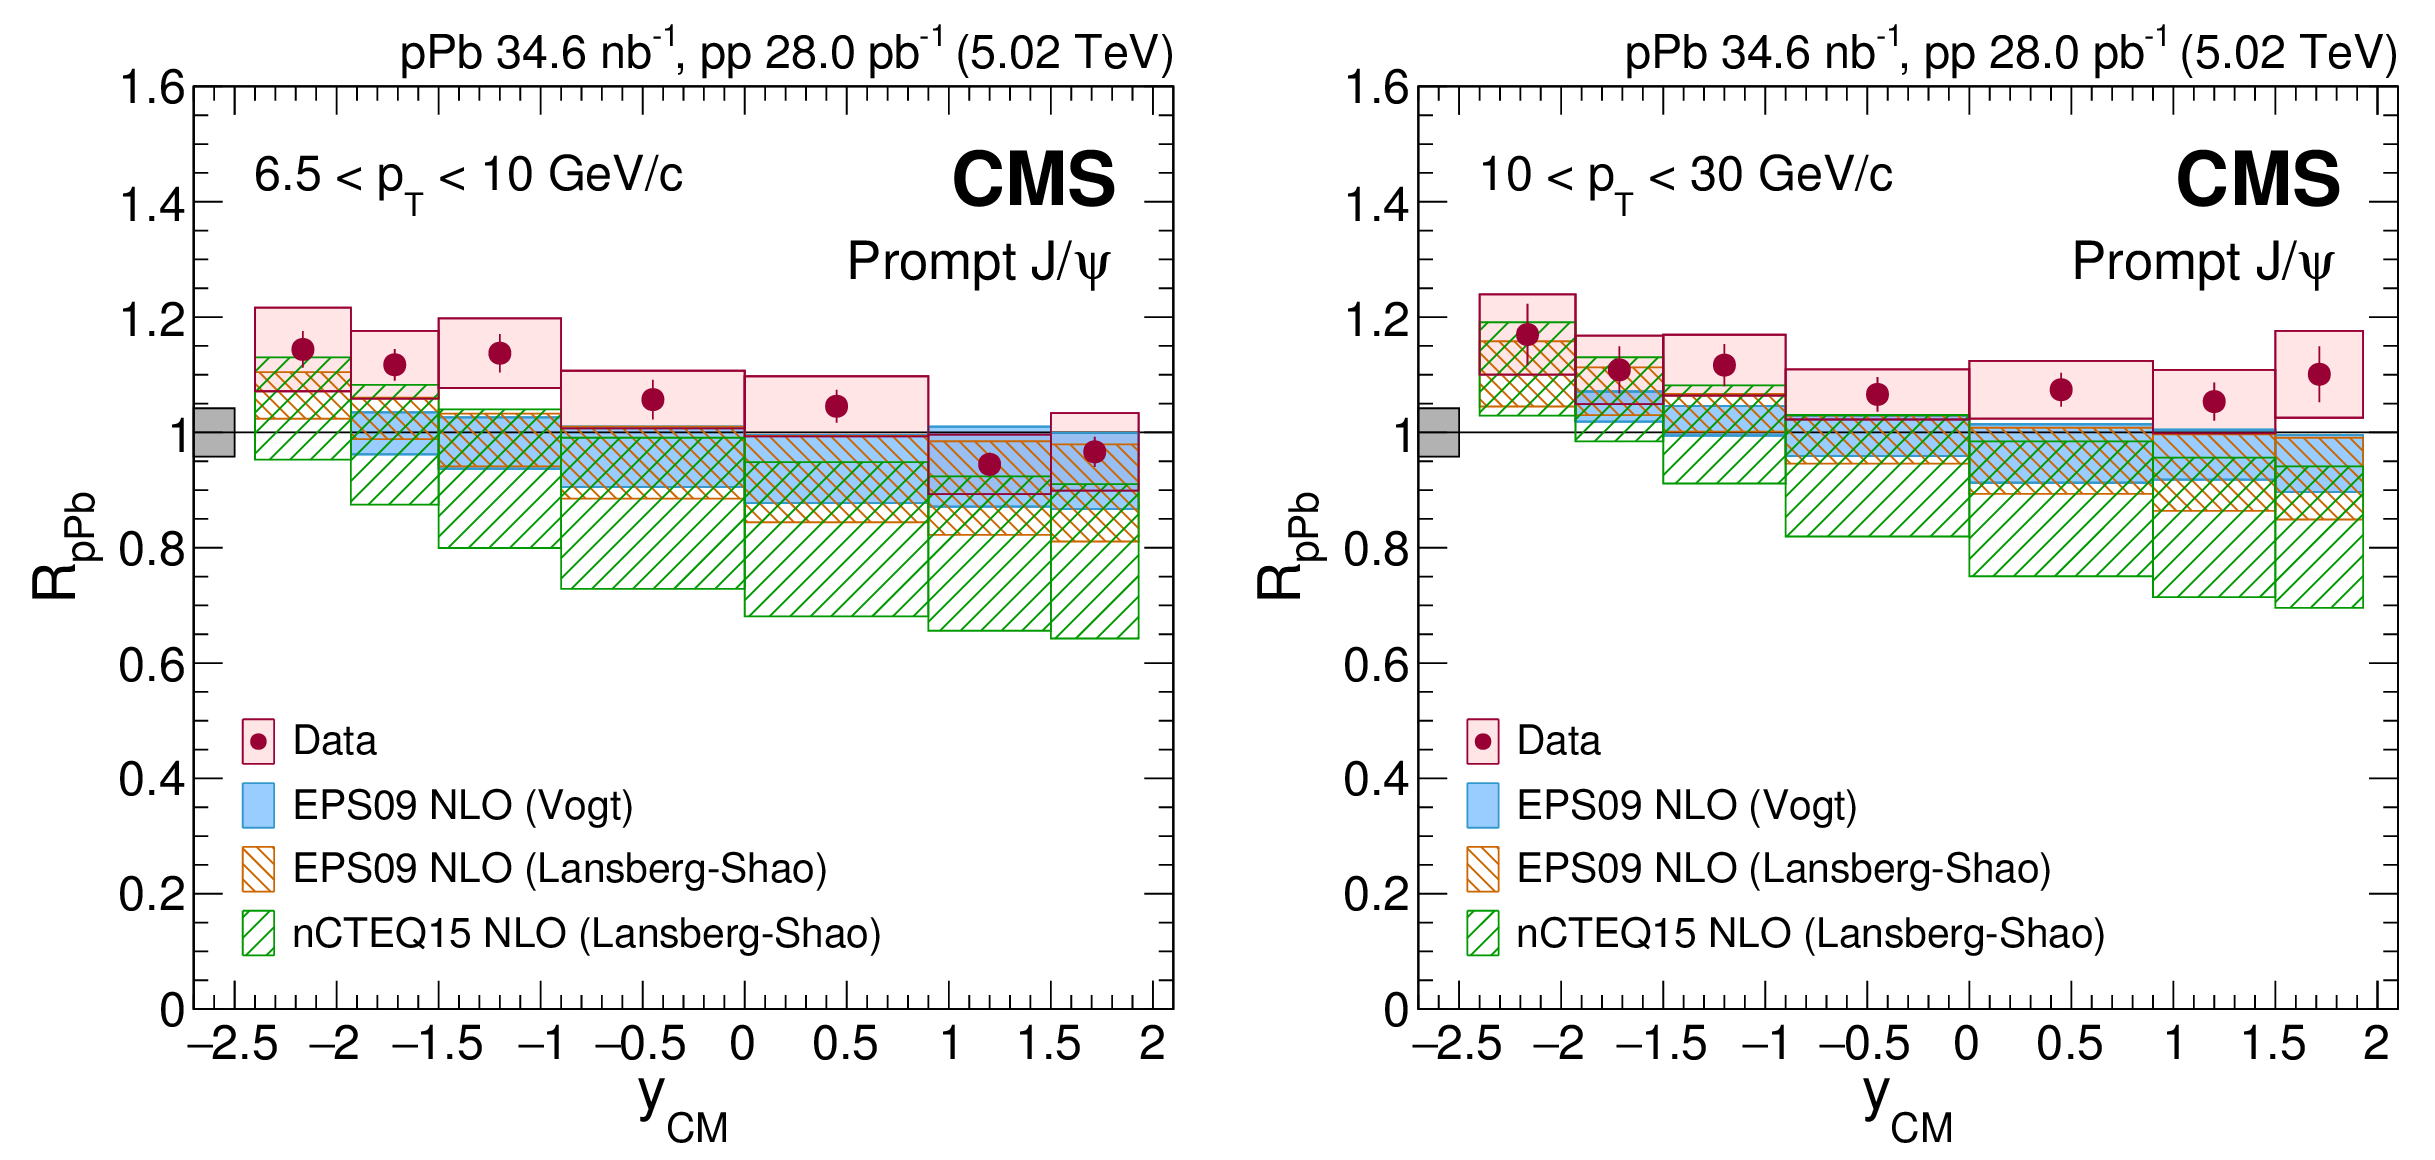
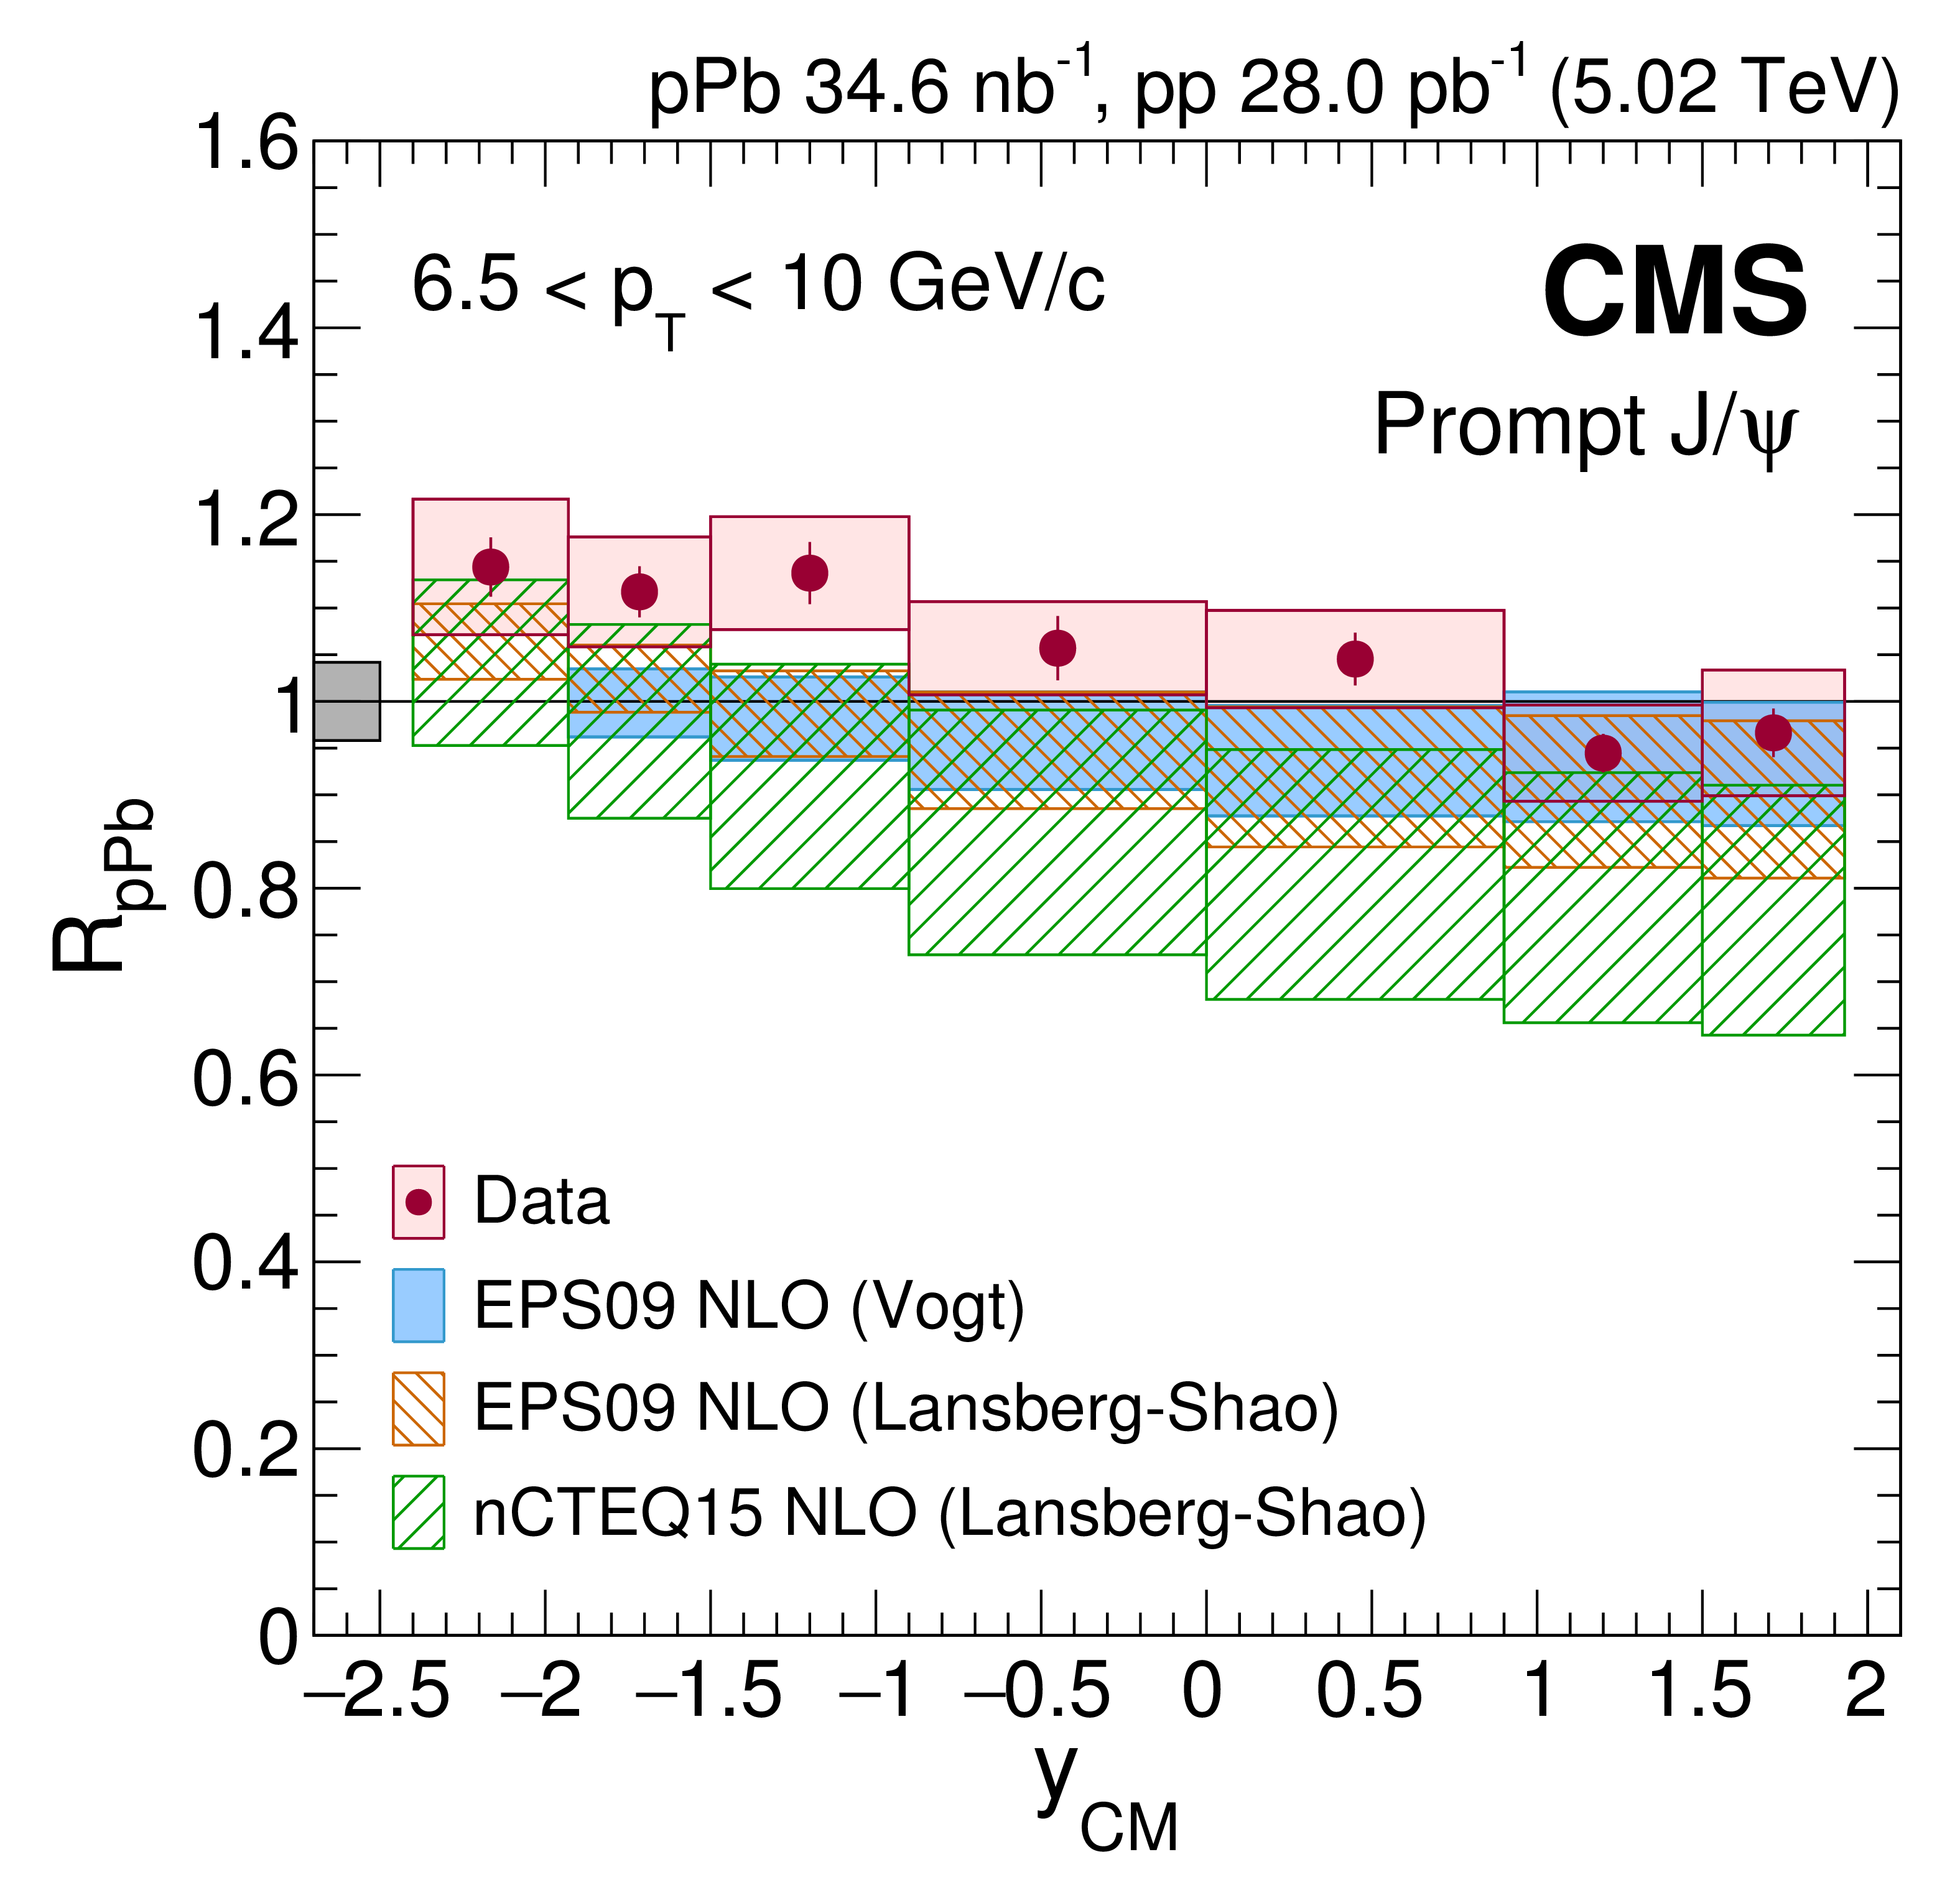
Rapidity dependence of $ {R_{\mathrm{ p } \mathrm {Pb}}} $ for prompt $ \mathrm{J} / \psi $ mesons in two $ {p_{\mathrm {T}}} $ ranges: 6.5 $ < {p_{\mathrm {T}}} < $ 10 GeV/$c$ (left) and 10 $ < {p_{\mathrm {T}}} < $ 30 GeV/$c$ (right). The vertical bars represent the statistical uncertainties and the shaded boxes show the systematic uncertainties. The fully correlated global uncertainty of 4.2% is displayed as a gray box at $ {R_{\mathrm{ p } \mathrm {Pb}}} = $ 1 next to the left axis. The predictions of shadowing models based on the parameterizations EPS09 and nCTEQ15 [14,45,46,47] are also shown. |
png pdf |
Figure 5-a:
Rapidity dependence of $ {R_{\mathrm{ p } \mathrm {Pb}}} $ for prompt $ \mathrm{J} / \psi $ mesons in $ {p_{\mathrm {T}}} $ range 6.5 $ < {p_{\mathrm {T}}} < $ 10 GeV/$c$. The vertical bars represent the statistical uncertainties and the shaded boxes show the systematic uncertainties. The fully correlated global uncertainty of 4.2% is displayed as a gray box at $ {R_{\mathrm{ p } \mathrm {Pb}}} = $ 1 next to the left axis. The predictions of shadowing models based on the parameterizations EPS09 and nCTEQ15 [14,46-48] are also shown. |

png pdf |
Figure 5-b:
Rapidity dependence of $ {R_{\mathrm{ p } \mathrm {Pb}}} $ for prompt $ \mathrm{J} / \psi $ mesons in $ {p_{\mathrm {T}}} $ range 10 $ < {p_{\mathrm {T}}} < $ 30 GeV/$c$. The vertical bars represent the statistical uncertainties and the shaded boxes show the systematic uncertainties. The fully correlated global uncertainty of 4.2% is displayed as a gray box at $ {R_{\mathrm{ p } \mathrm {Pb}}} = $ 1 next to the left axis. The predictions of shadowing models based on the parameterizations EPS09 and nCTEQ15 [14,46-48] are also shown. |
png pdf |
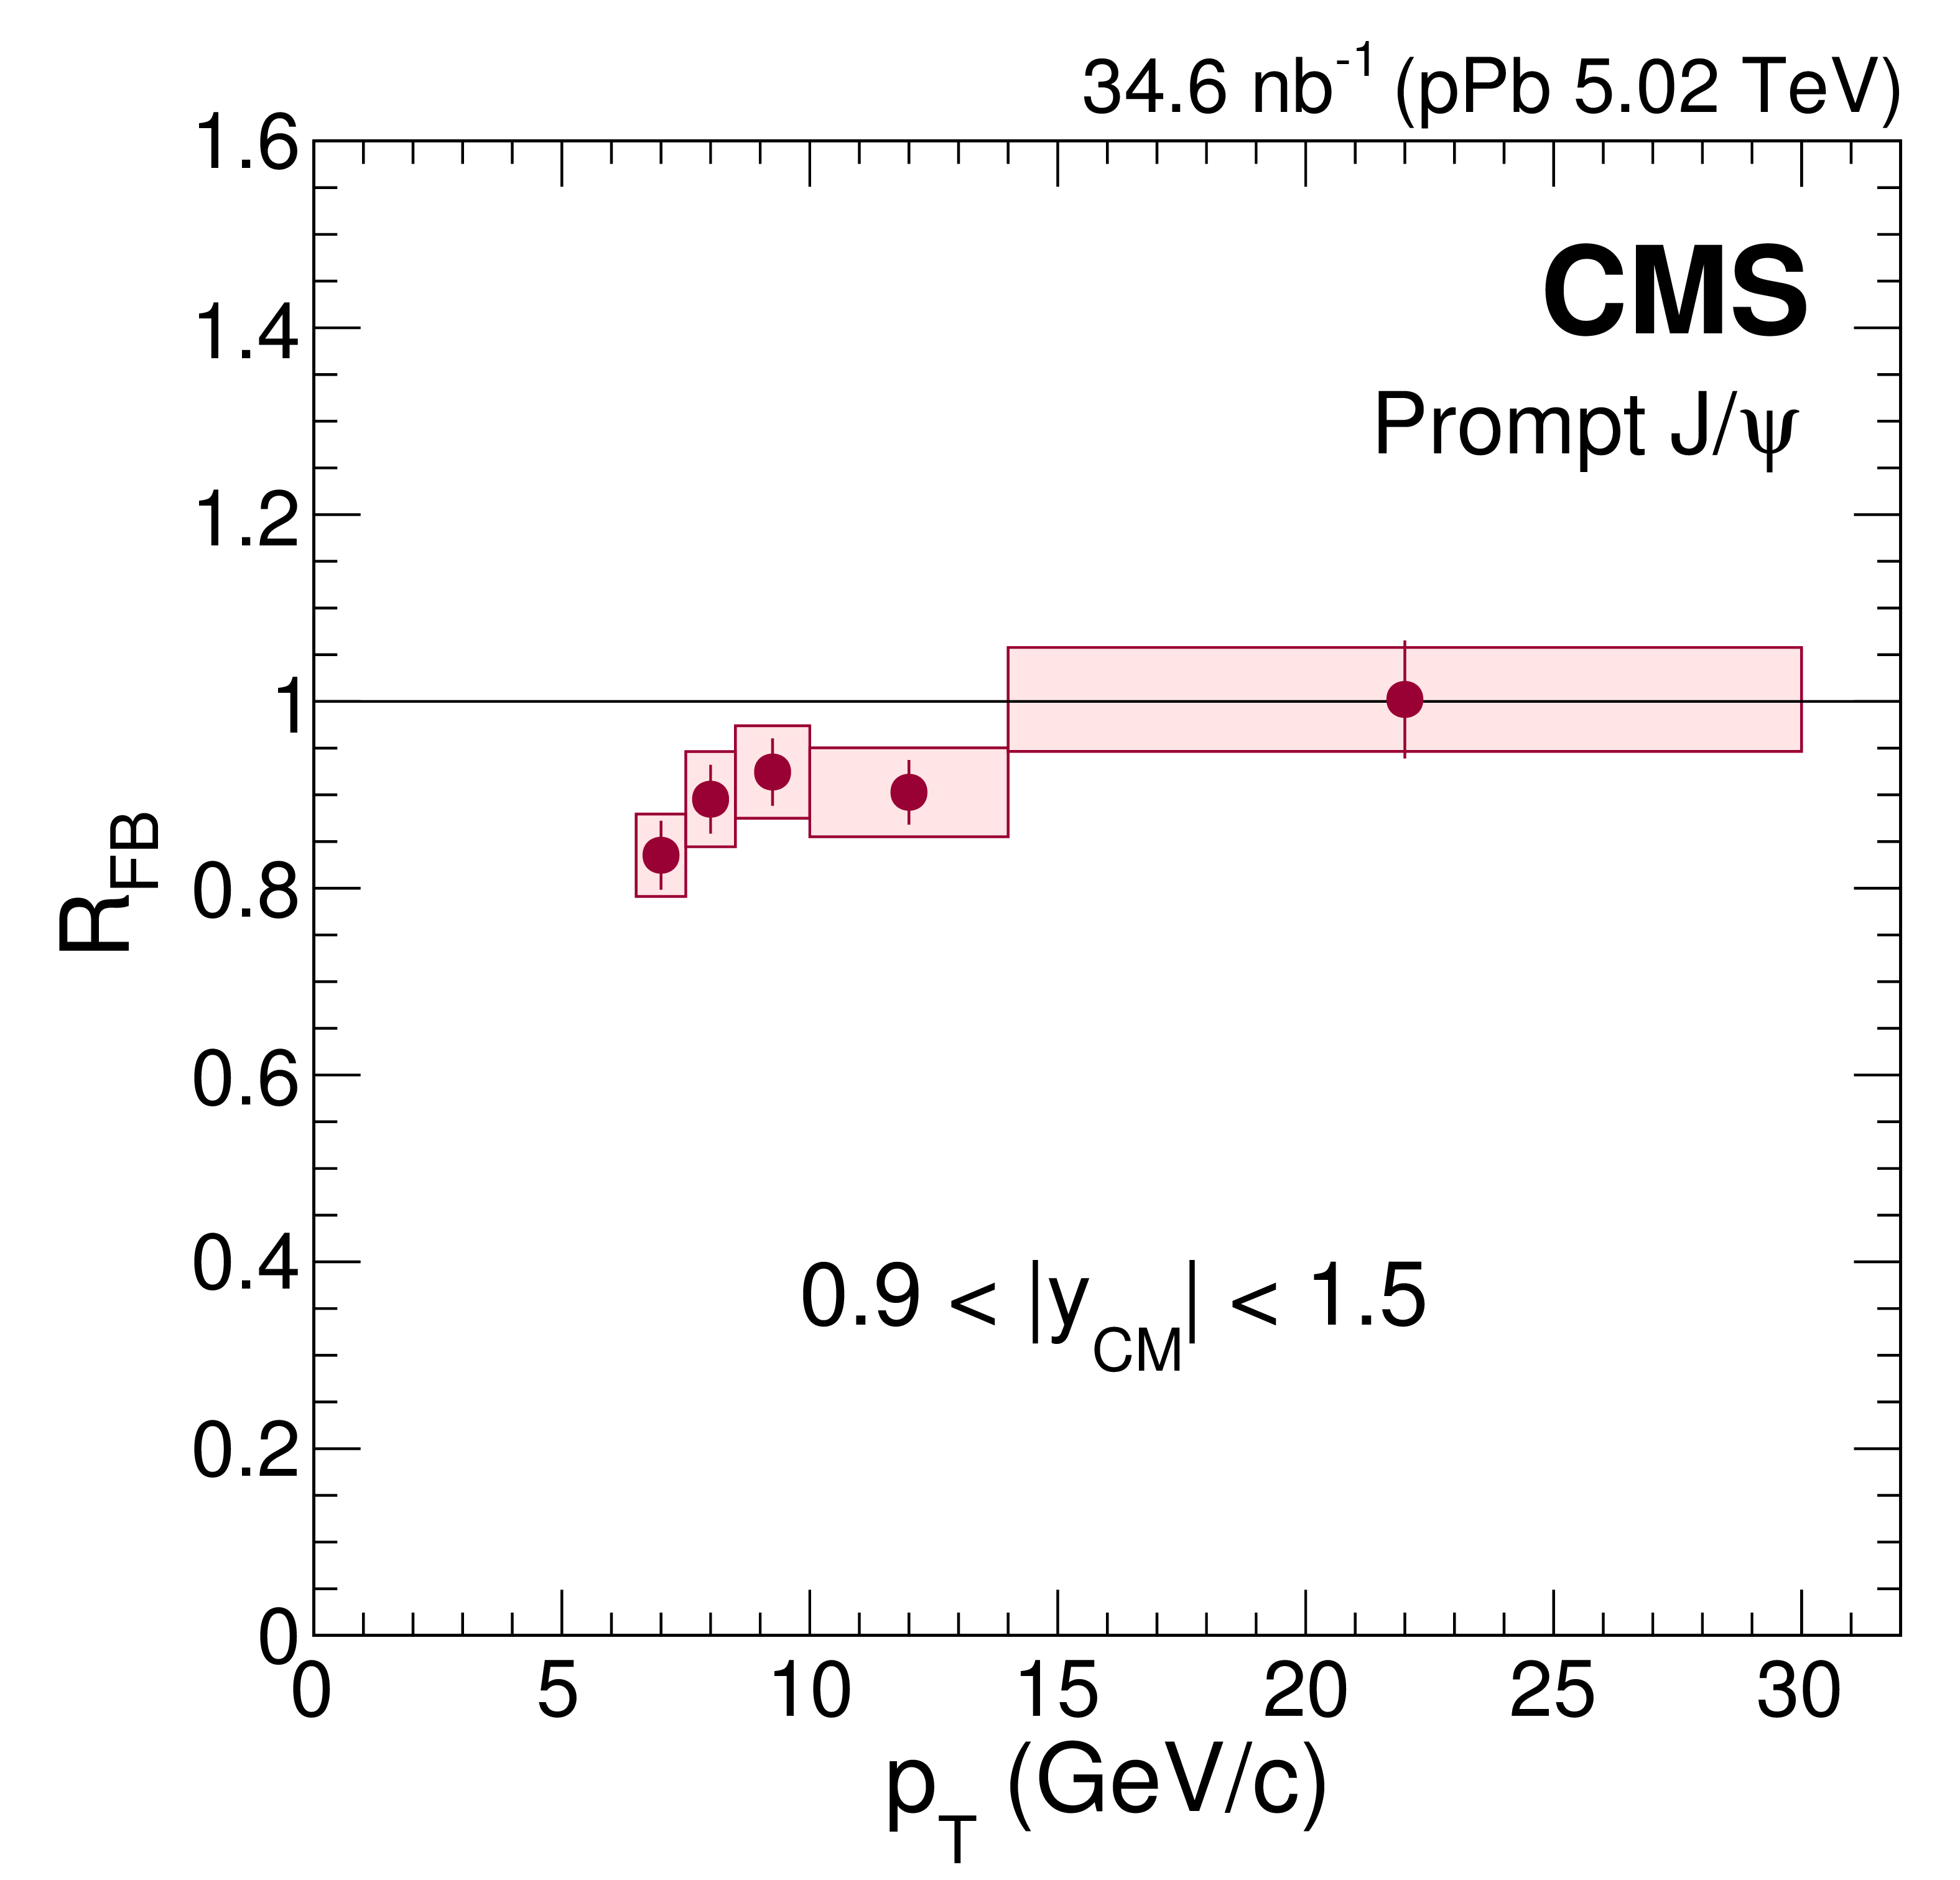
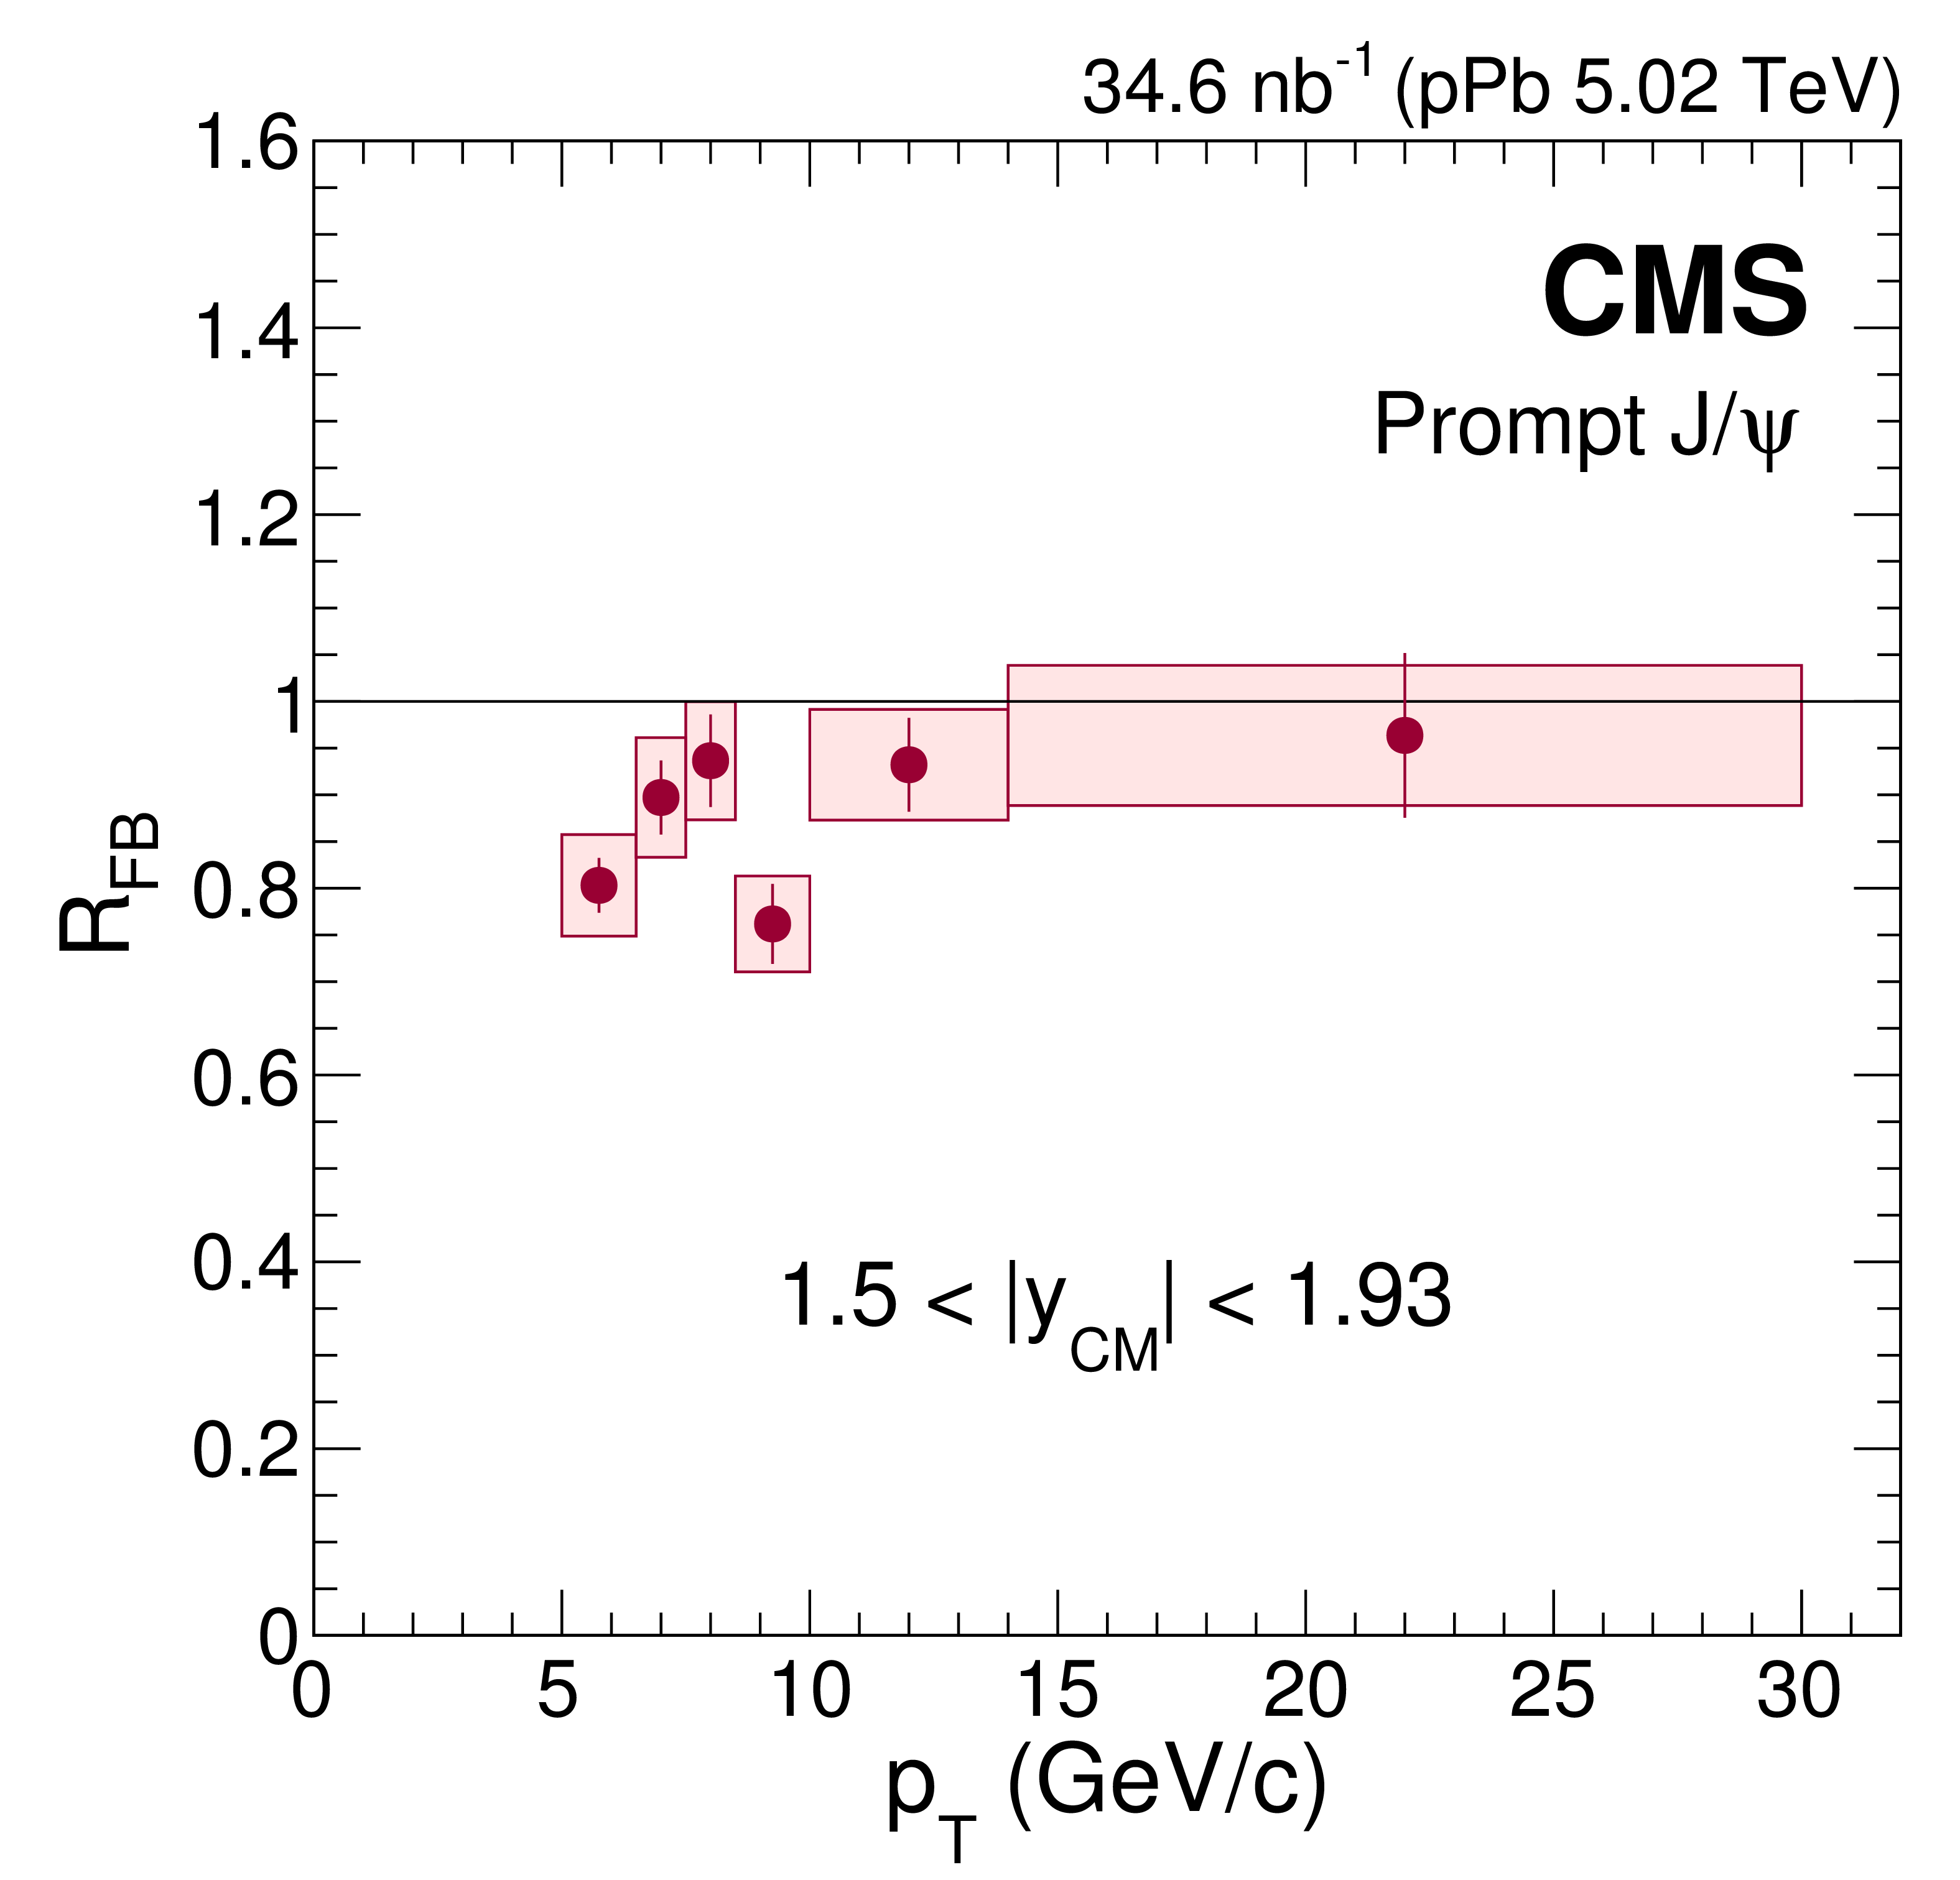
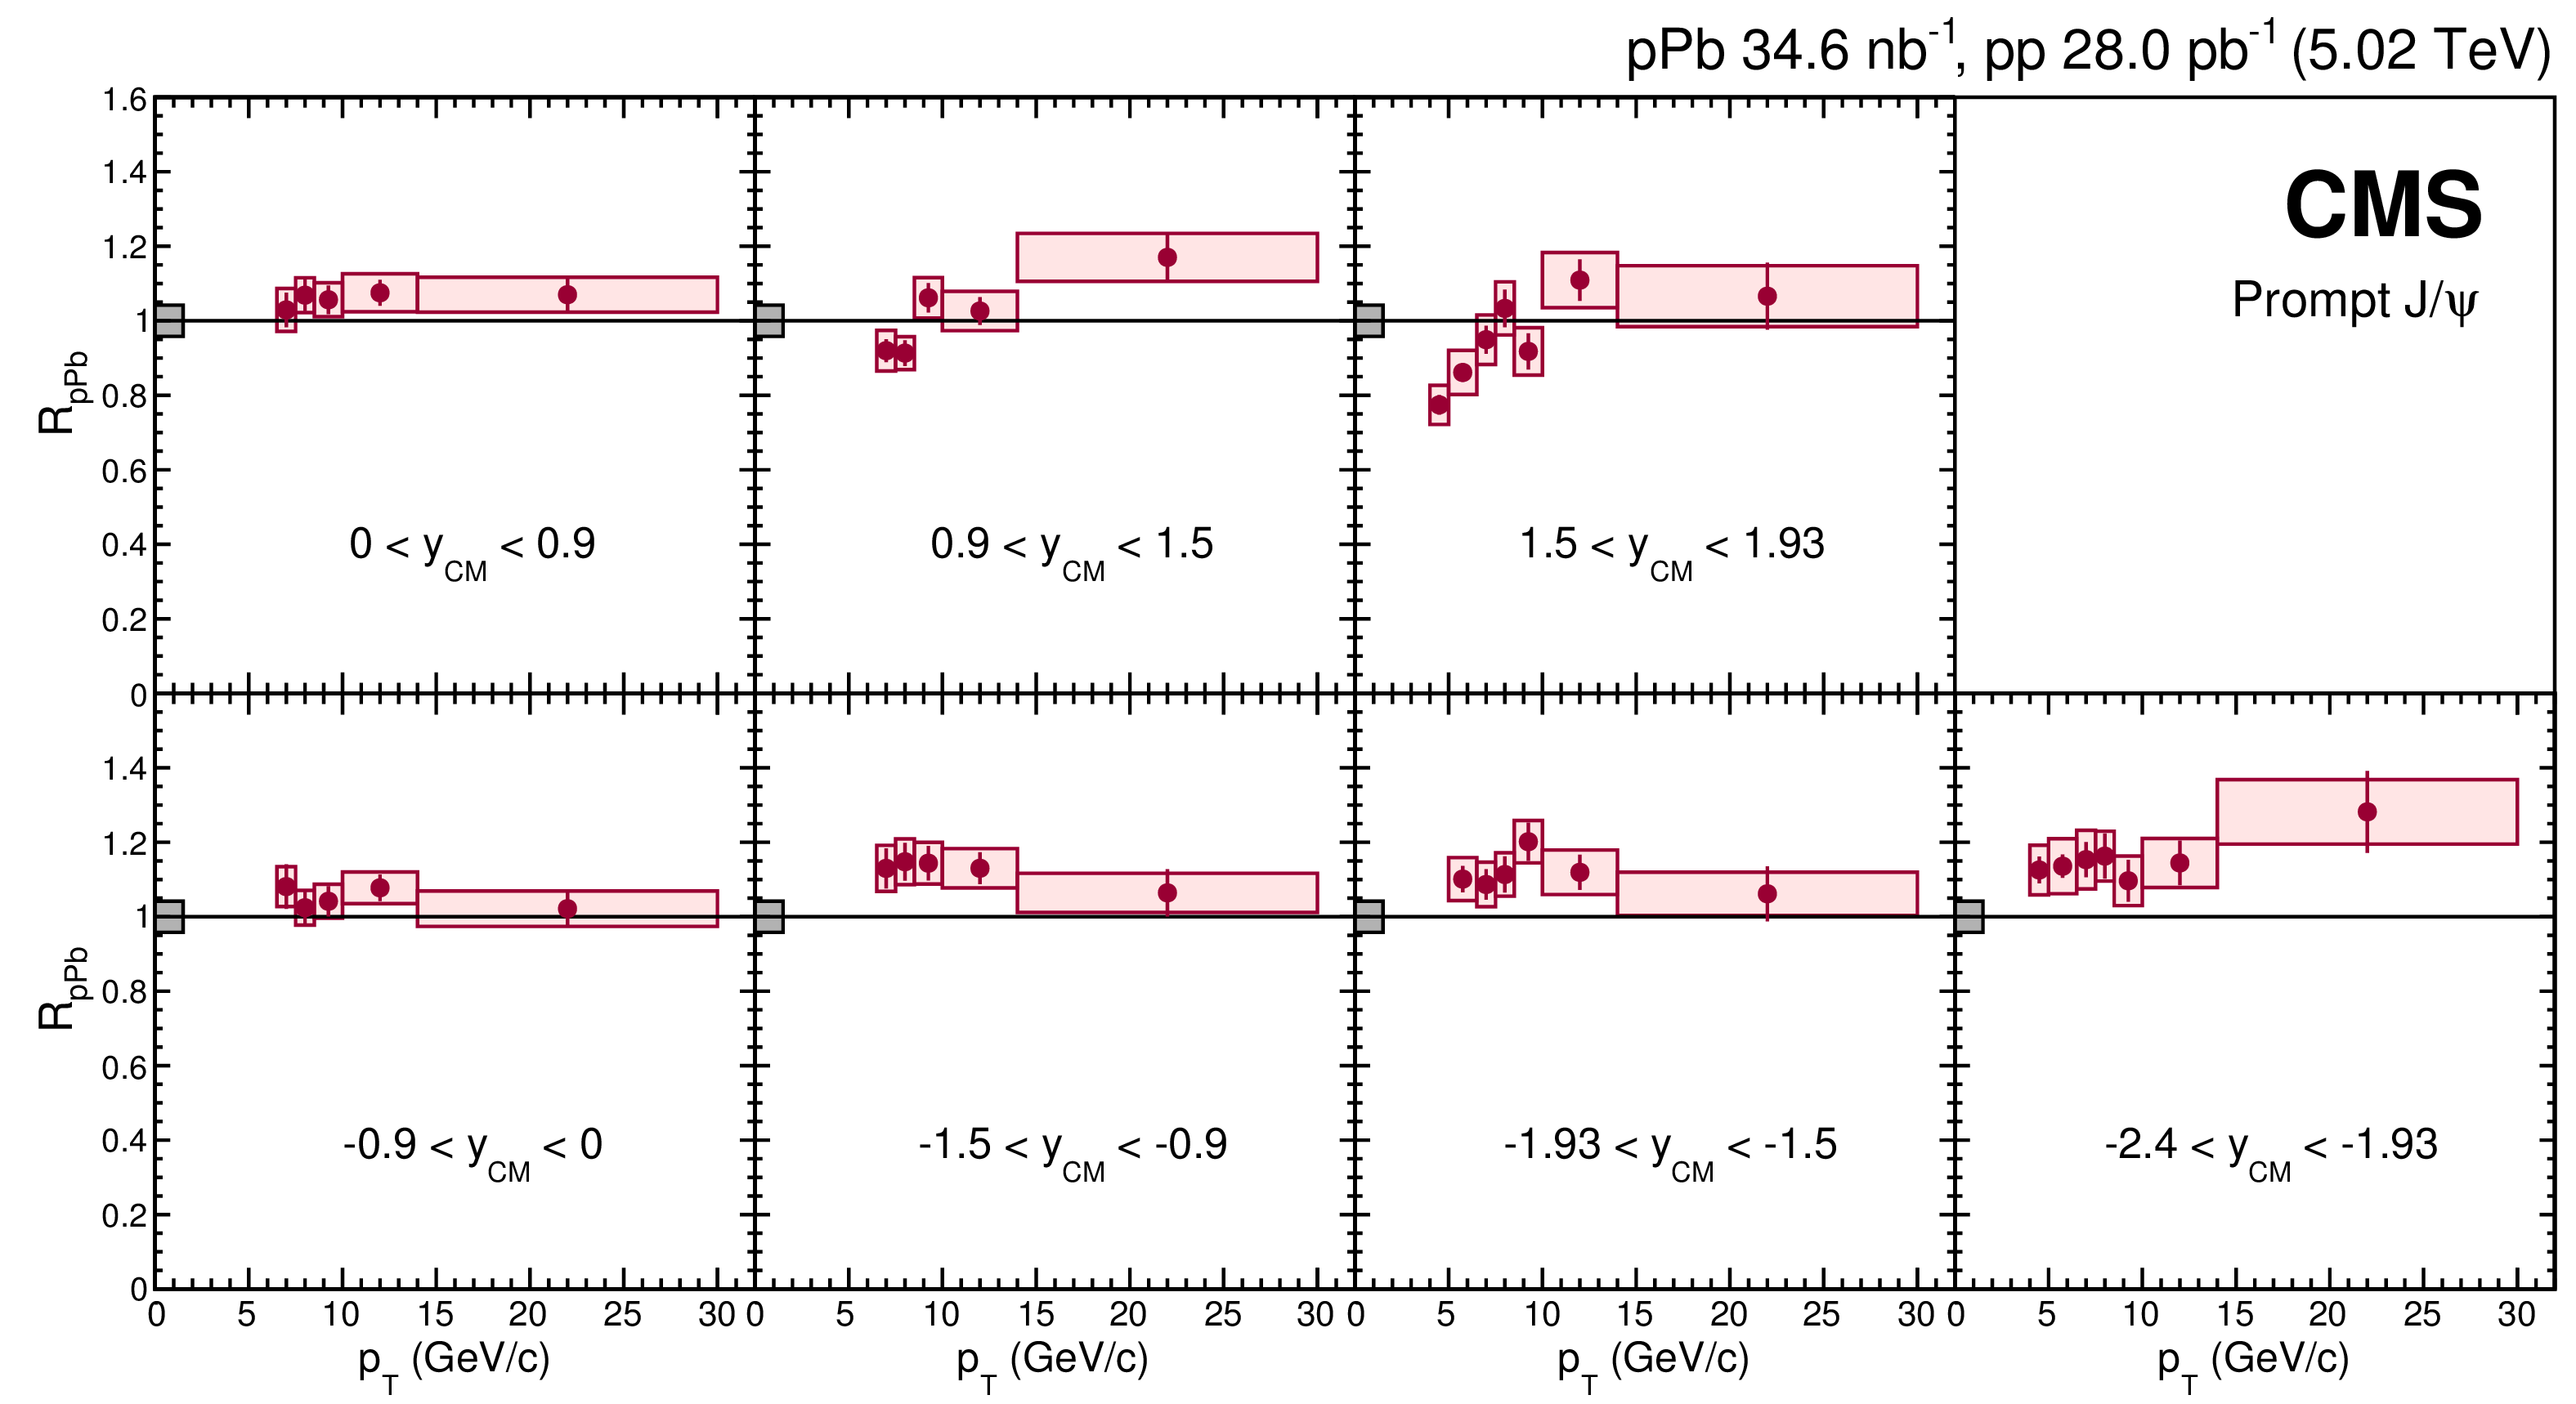
Figure 6:
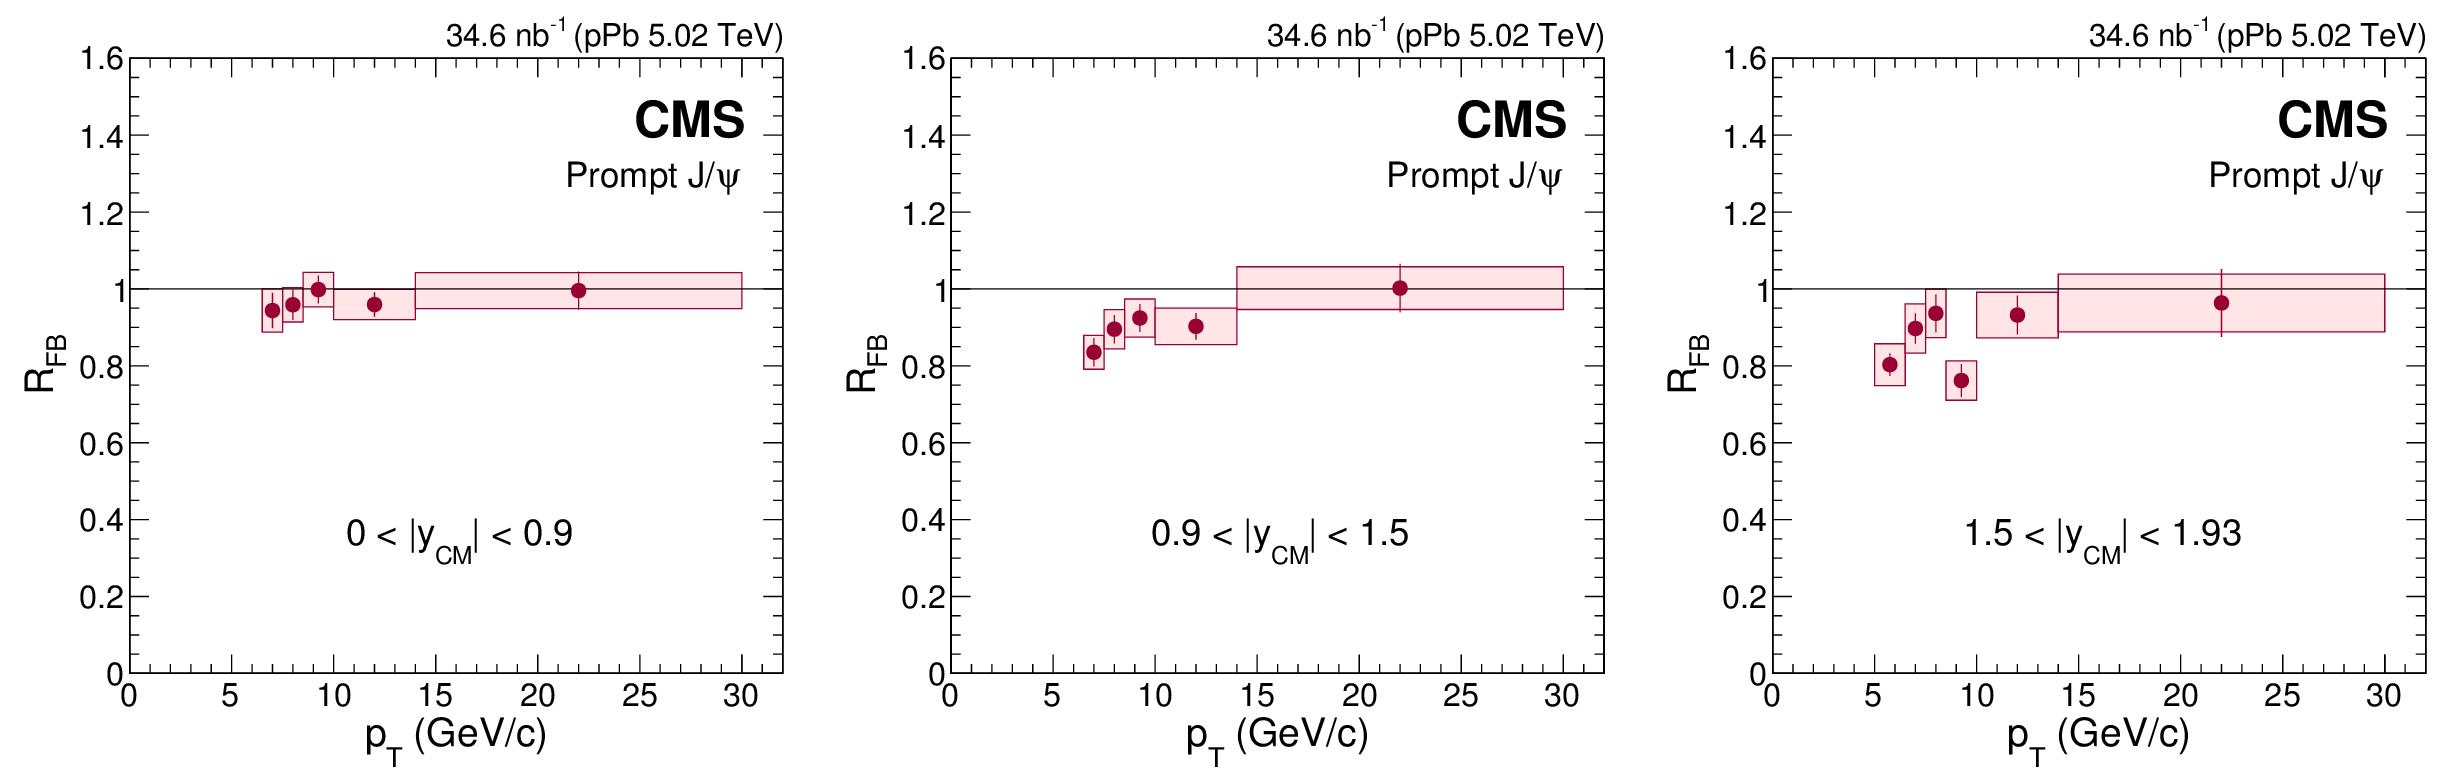
Transverse momentum dependence of $ {R_{\mathrm {FB}}} $ for prompt $ \mathrm{J} / \psi $ mesons in three $ {y_{\mathrm {CM}}} $ regions. The vertical bars represent the statistical uncertainties and the shaded boxes show the systematic uncertainties. |
png pdf |
Figure 6-a:
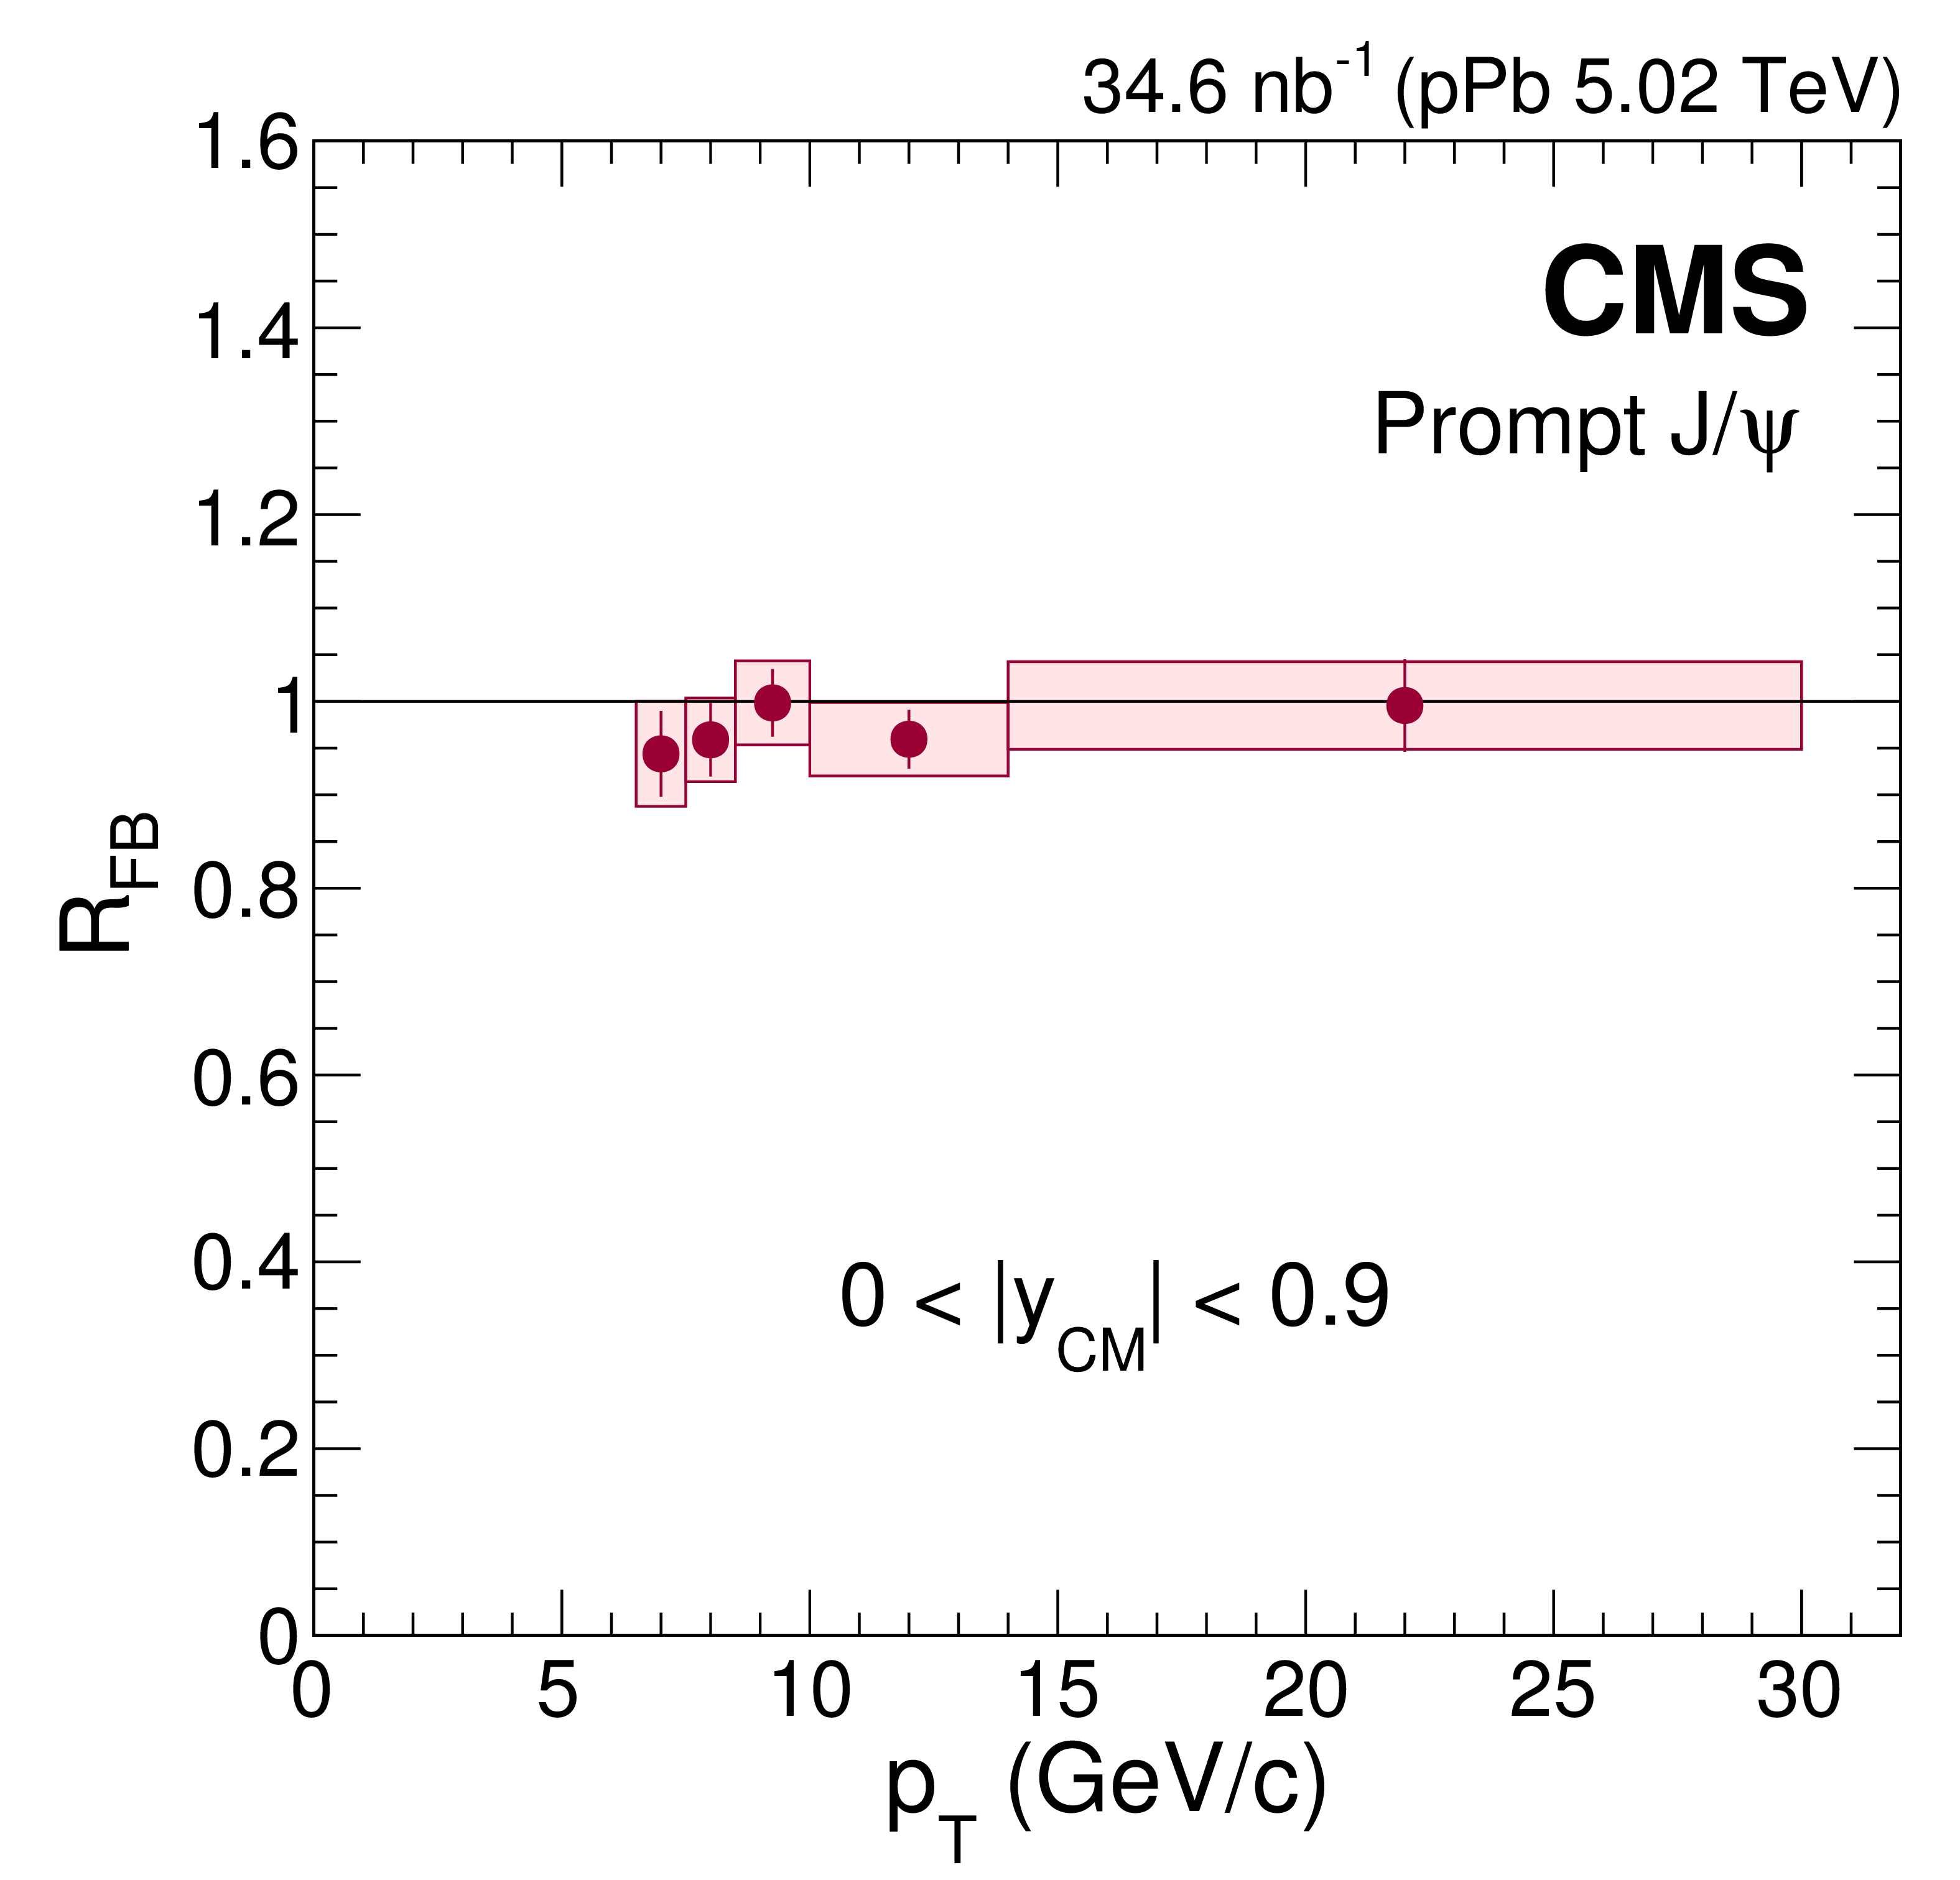
Transverse momentum dependence of $ {R_{\mathrm {FB}}} $ for prompt $ \mathrm{J} / \psi $ mesons in the 0 $ < {y_{\mathrm {CM}}} < $ 0.9 region. The vertical bars represent the statistical uncertainties and the shaded boxes show the systematic uncertainties. |
png pdf |
Figure 6-b:
Transverse momentum dependence of $ {R_{\mathrm {FB}}} $ for prompt $ \mathrm{J} / \psi $ mesons in the 0.9 $ < {y_{\mathrm {CM}}} < $ 1.5 region. The vertical bars represent the statistical uncertainties and the shaded boxes show the systematic uncertainties. |
png pdf |
Figure 6-c:
Transverse momentum dependence of $ {R_{\mathrm {FB}}} $ for prompt $ \mathrm{J} / \psi $ mesons in the 1.5 $ < {y_{\mathrm {CM}}} < $ 1.93 region. The vertical bars represent the statistical uncertainties and the shaded boxes show the systematic uncertainties. |

png pdf |
Figure 7:
Dependence of $ {R_{\mathrm {FB}}} $ for prompt $ \mathrm{J} / \psi $ mesons on the hadronic activity in the event, given by the transverse energy deposited in the CMS detector at large pseudorapidities ${E_{\mathrm {T}}^{{\mathrm {HF}} {| \eta | }>4}} $. Data points are slightly shifted horizontally so that they do not overlap. The vertical bars represent the statistical uncertainties and the shaded boxes show the systematic uncertainties. |
png pdf |
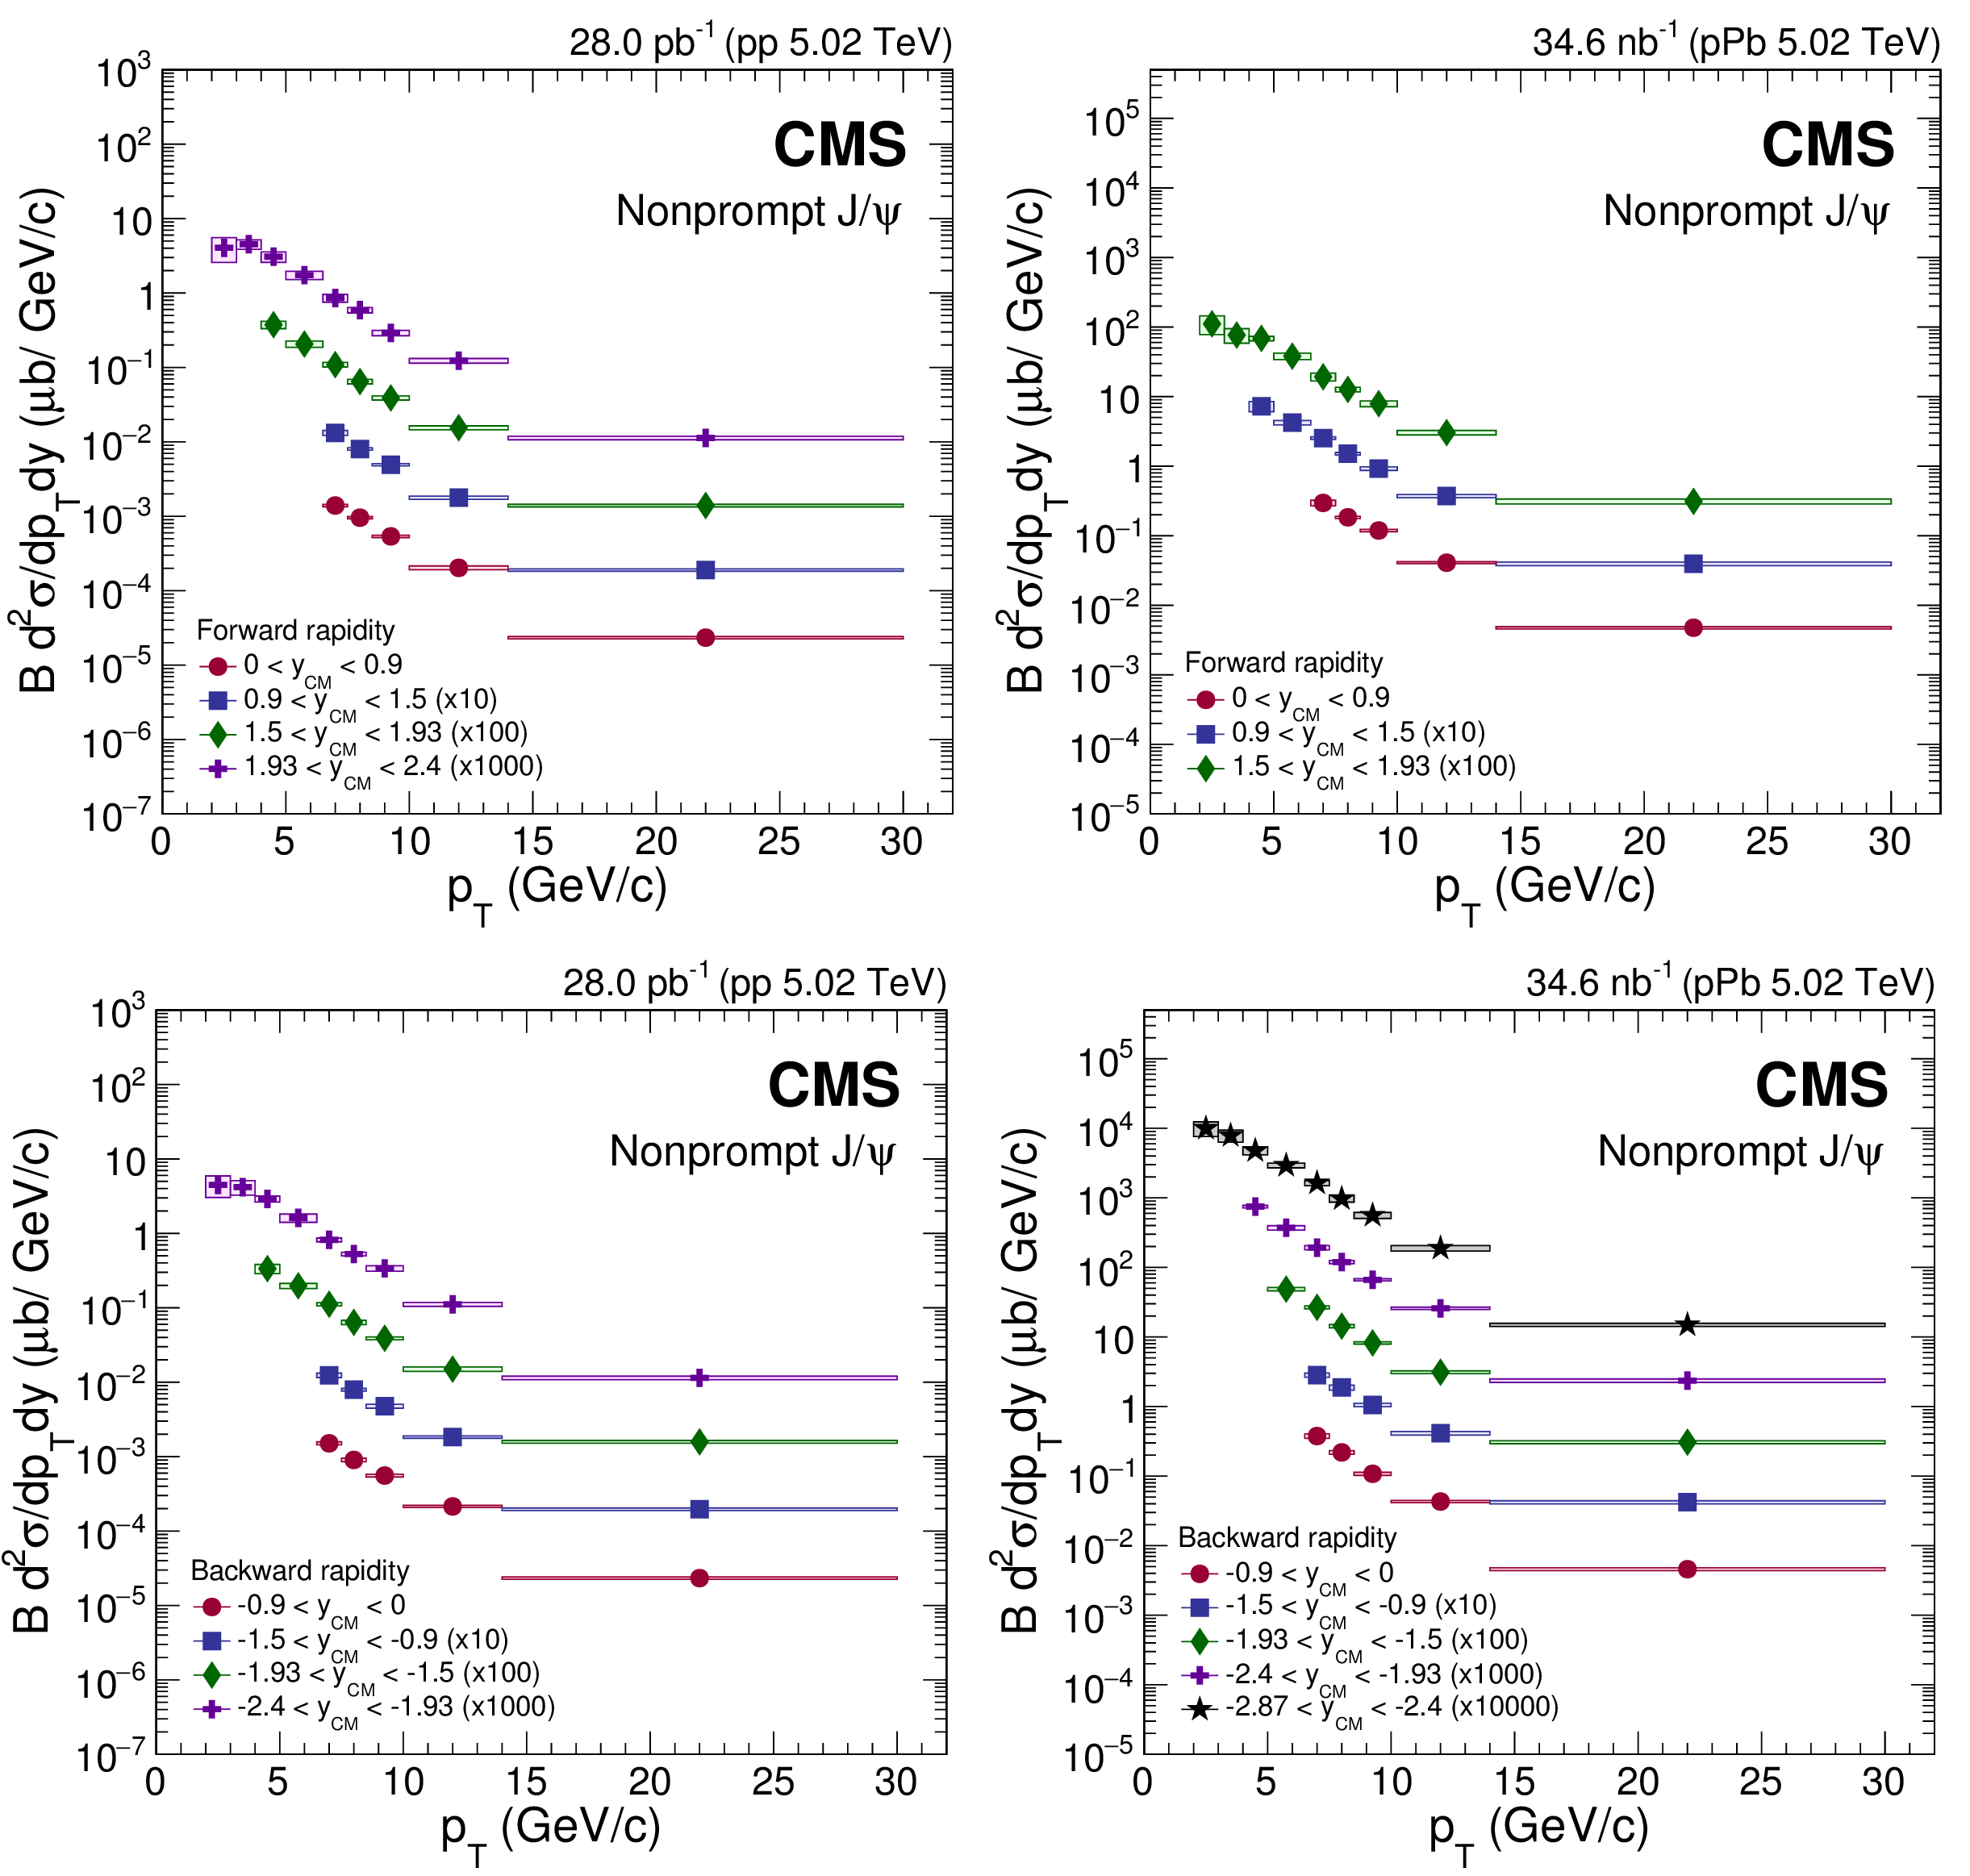
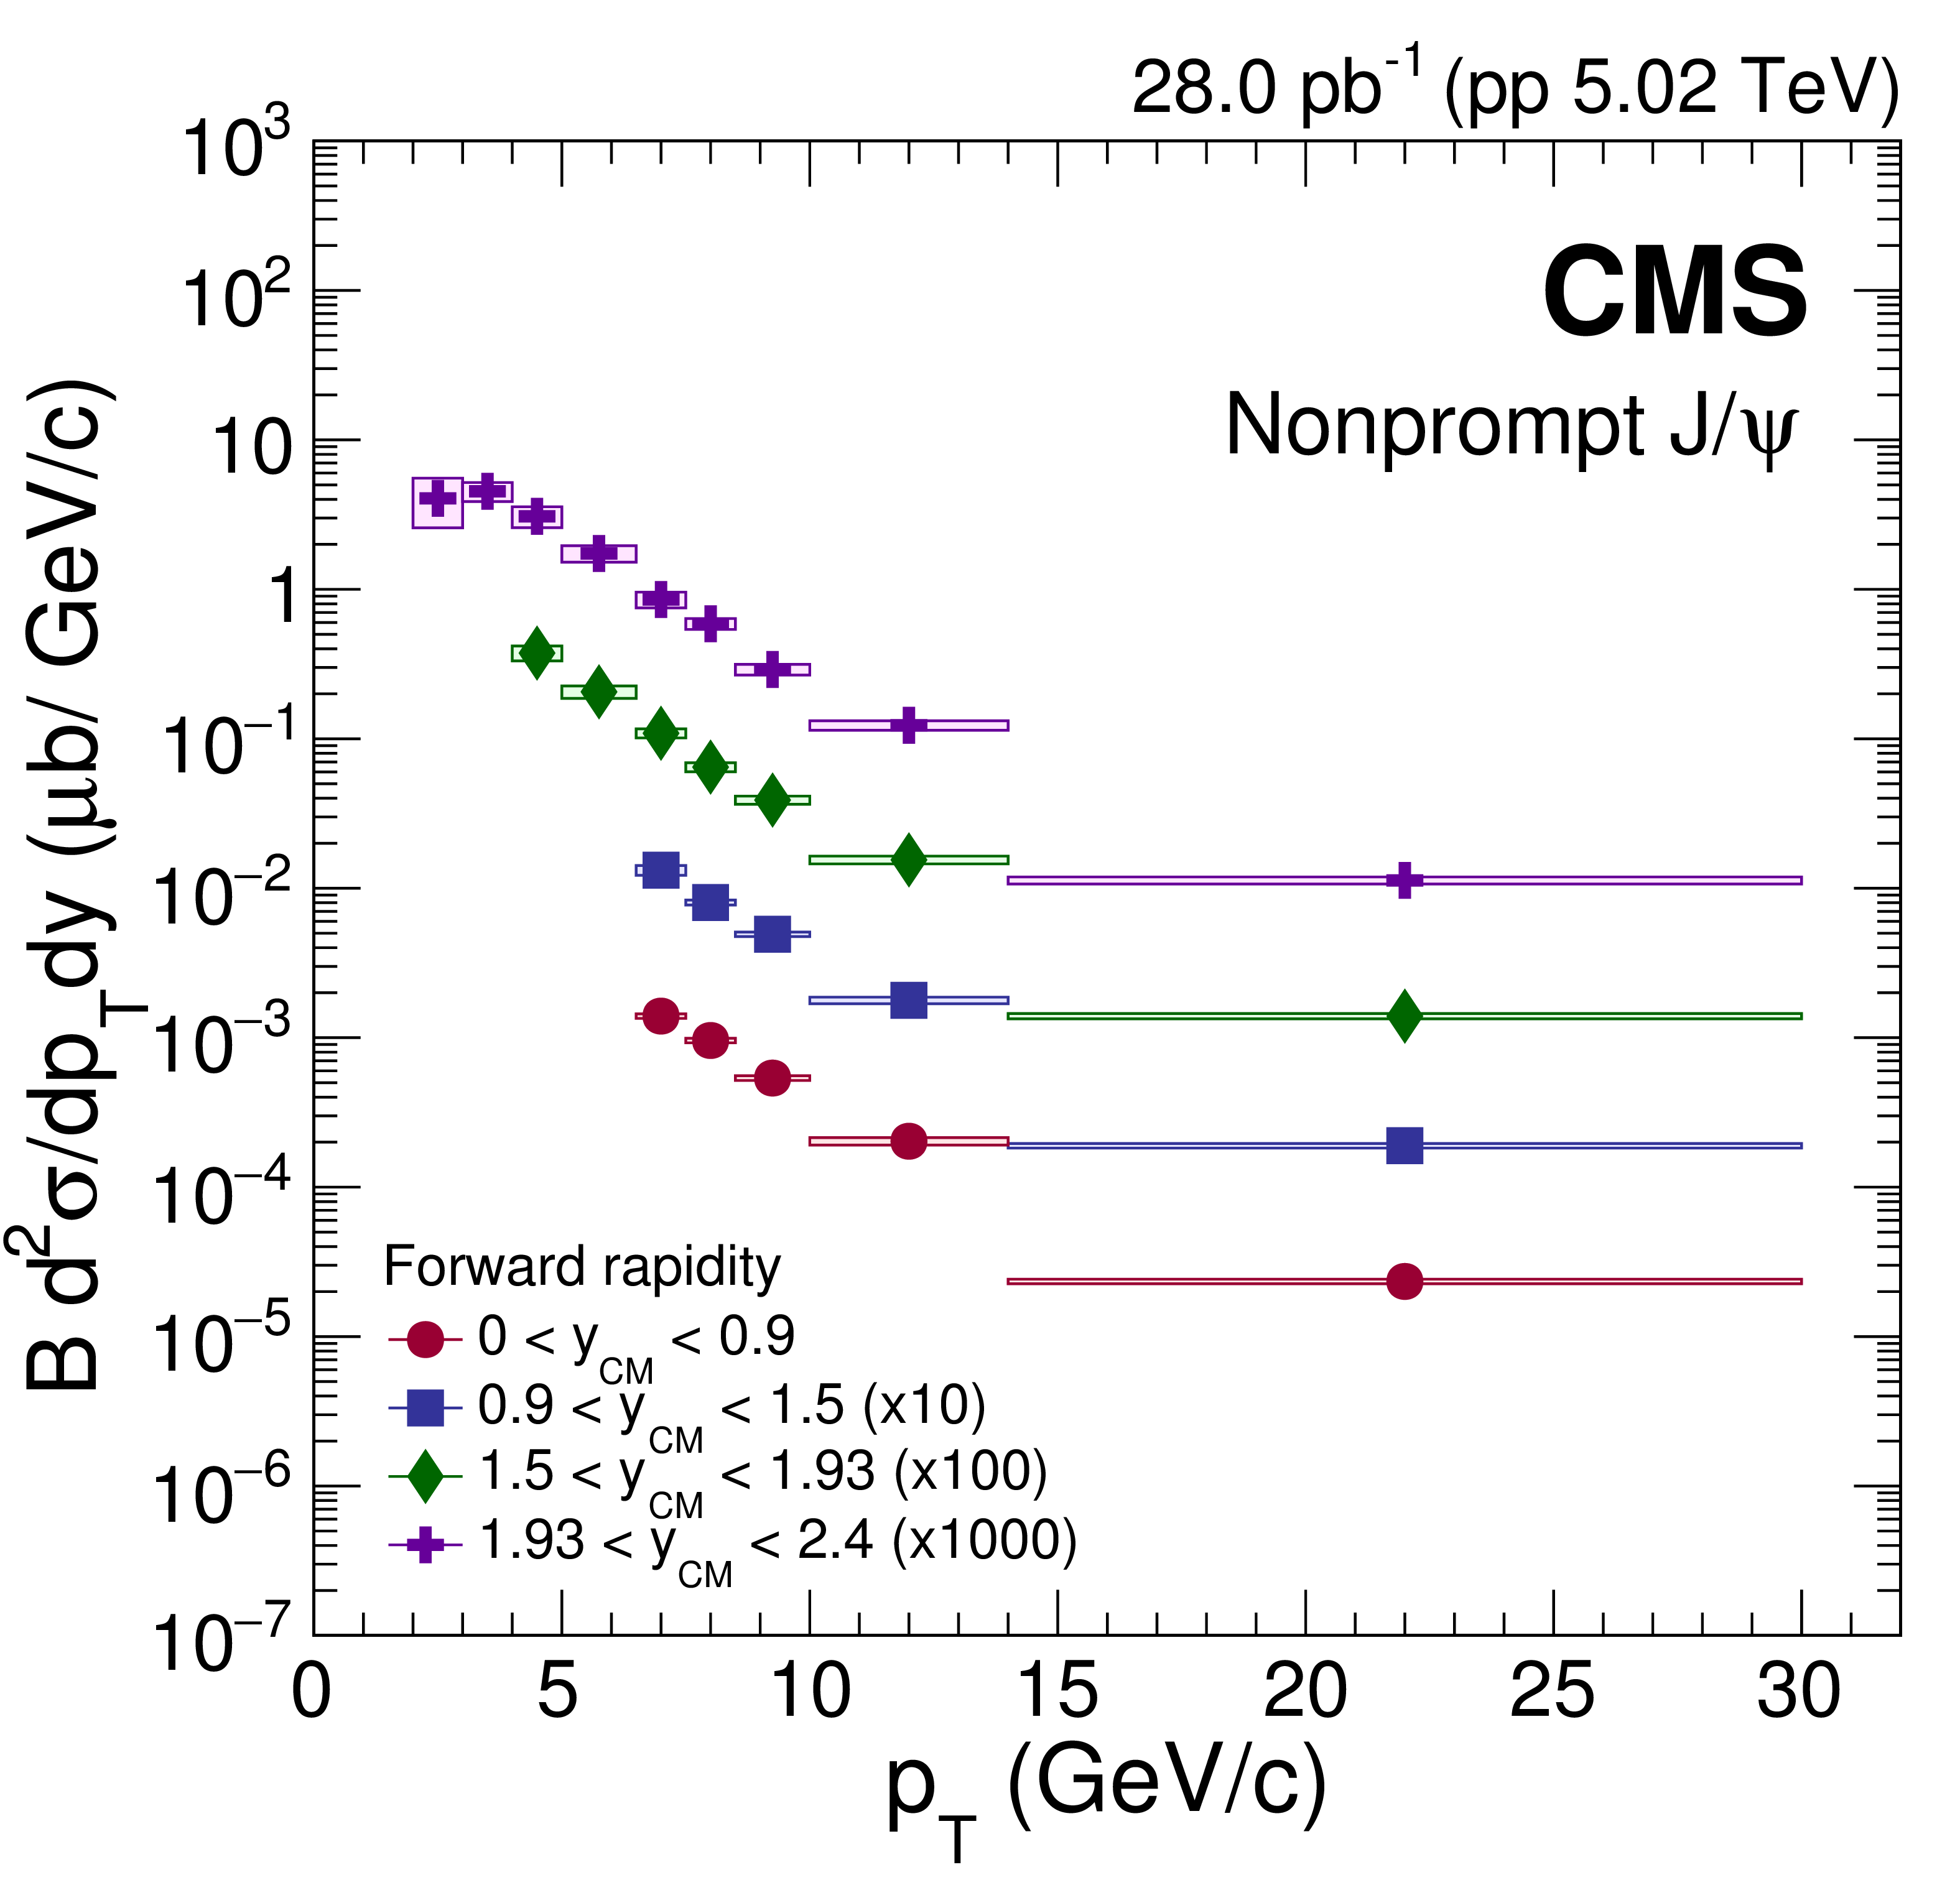
Figure 8:
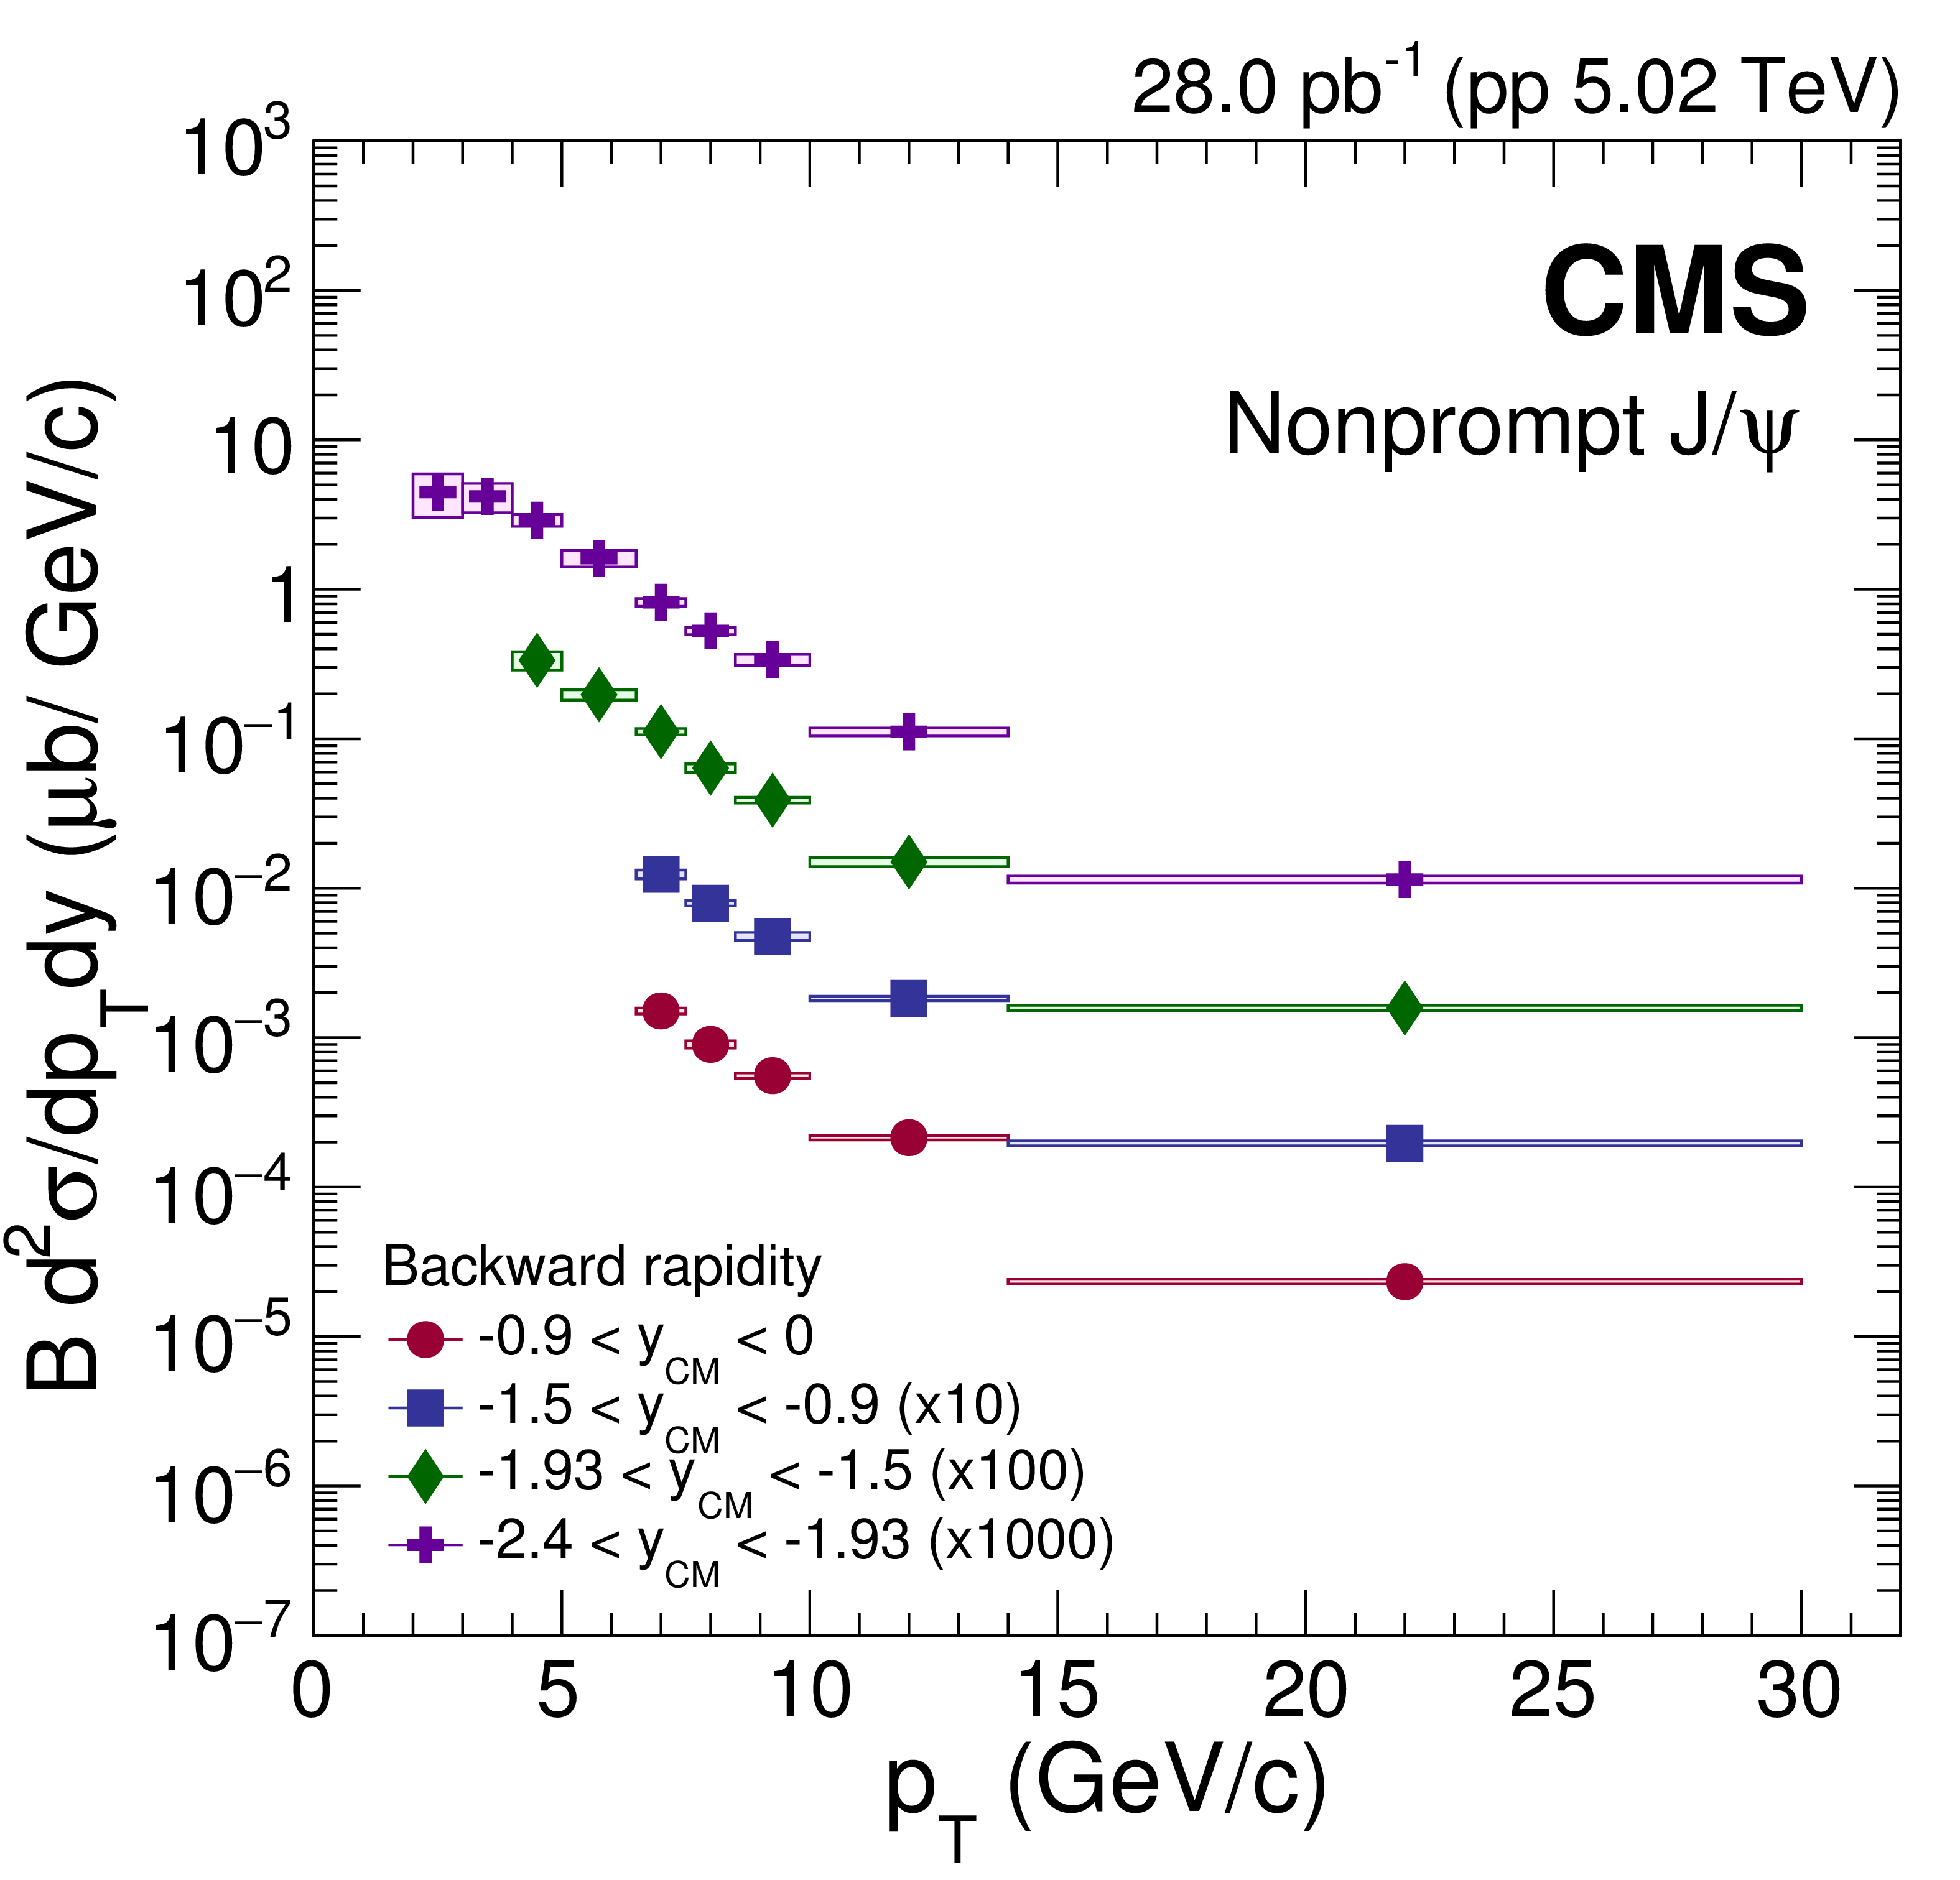
Differential cross section (multiplied by the dimuon branching fraction) of nonprompt $ \mathrm{J} / \psi $ mesons in pp (left) and pPb (right) collisions at forward (upper) and backward (lower) $ {y_{\mathrm {CM}}} $. The vertical bars (smaller than the symbols in most cases) represent the statistical uncertainties and the shaded boxes show the systematic uncertainties. The fully correlated global uncertainty from the integrated luminosity determination, 2.3% for pp and 3.5% for pPb collisions, is not included in the point-by-point uncertainties. |
png pdf |
Figure 8-a:
Differential cross section (multiplied by the dimuon branching fraction) of nonprompt $ \mathrm{J} / \psi $ mesons in pp collisions at forward $ {y_{\mathrm {CM}}} $. The vertical bars (smaller than the symbols in most cases) represent the statistical uncertainties and the shaded boxes show the systematic uncertainties. The fully correlated global uncertainty from the integrated luminosity determination, 2.3%, is not included in the point-by-point uncertainties. |
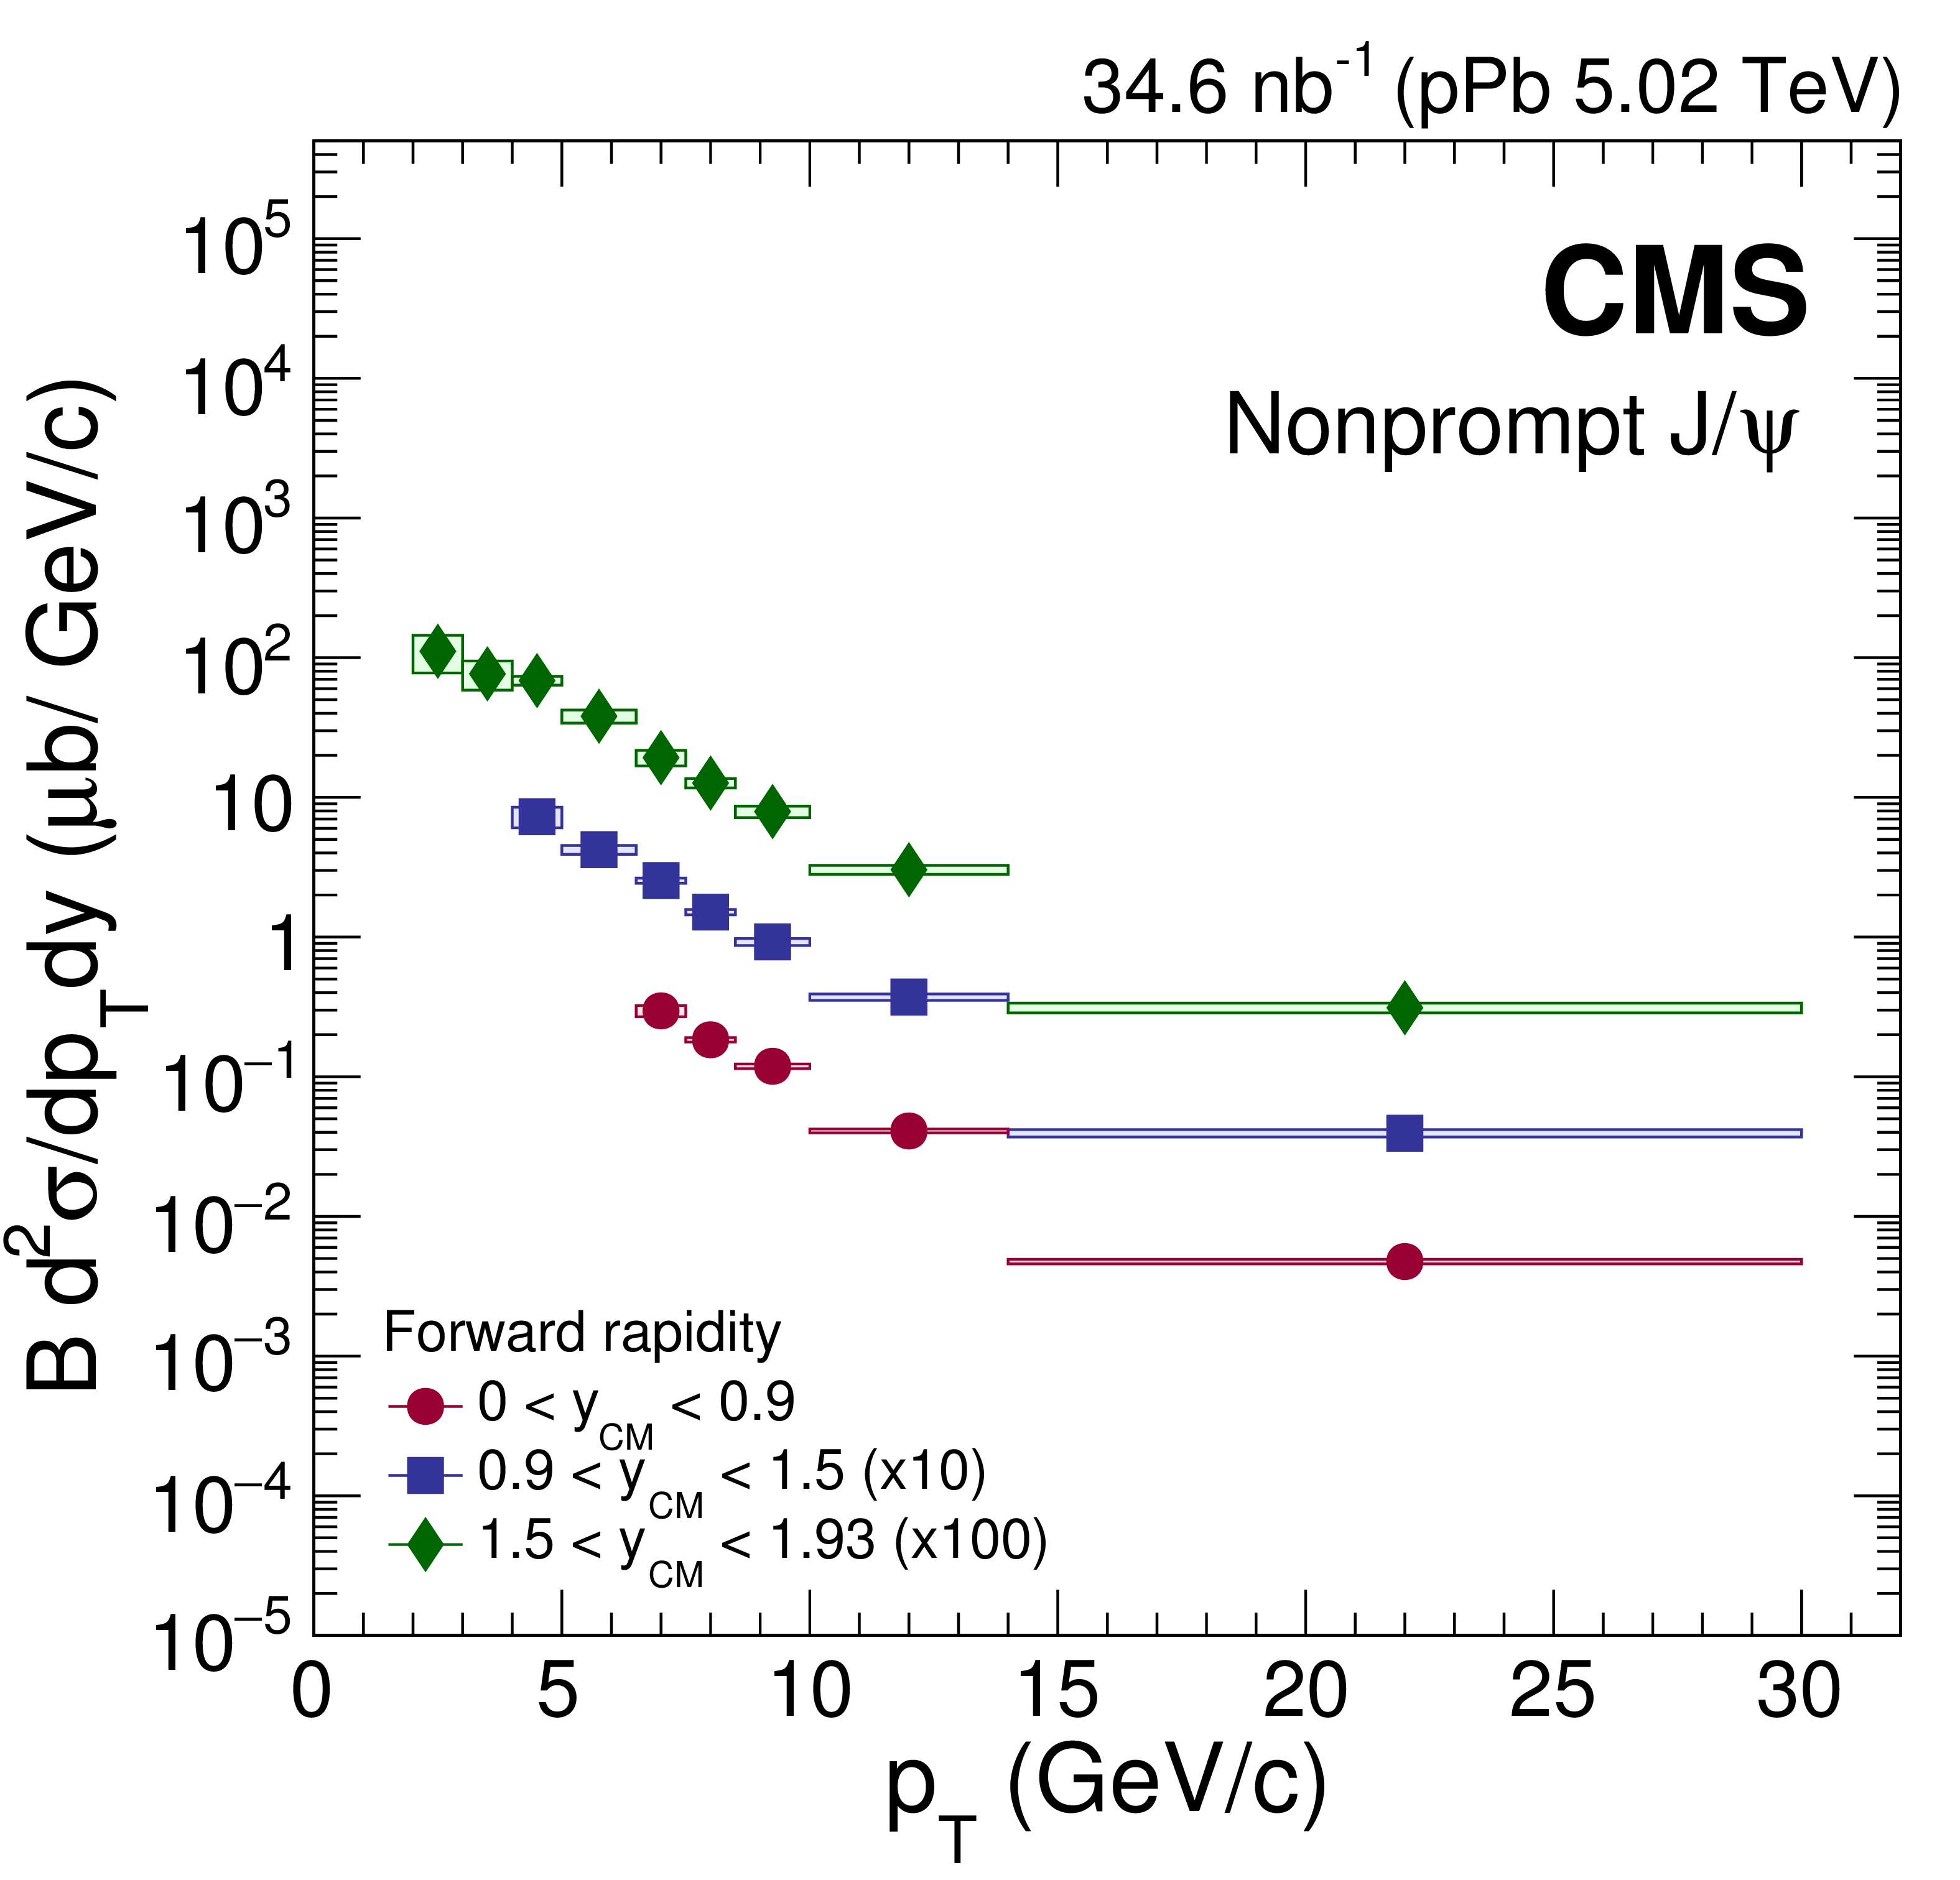
png pdf |
Figure 8-b:
Differential cross section (multiplied by the dimuon branching fraction) of nonprompt $ \mathrm{J} / \psi $ mesons in pPb collisions at forward $ {y_{\mathrm {CM}}} $. The vertical bars (smaller than the symbols in most cases) represent the statistical uncertainties and the shaded boxes show the systematic uncertainties. The fully correlated global uncertainty from the integrated luminosity determination, 3.5%, is not included in the point-by-point uncertainties. |
png pdf |
Figure 8-c:
Differential cross section (multiplied by the dimuon branching fraction) of nonprompt $ \mathrm{J} / \psi $ mesons in pp collisions at backward $ {y_{\mathrm {CM}}} $. The vertical bars (smaller than the symbols in most cases) represent the statistical uncertainties and the shaded boxes show the systematic uncertainties. The fully correlated global uncertainty from the integrated luminosity determination, 2.3%, is not included in the point-by-point uncertainties. |

png pdf |
Figure 8-d:
Differential cross section (multiplied by the dimuon branching fraction) of nonprompt $ \mathrm{J} / \psi $ mesons in pPb collisions at backward $ {y_{\mathrm {CM}}} $. The vertical bars (smaller than the symbols in most cases) represent the statistical uncertainties and the shaded boxes show the systematic uncertainties. The fully correlated global uncertainty from the integrated luminosity determination, 3.5%, is not included in the point-by-point uncertainties. |
png pdf |
Figure 9:
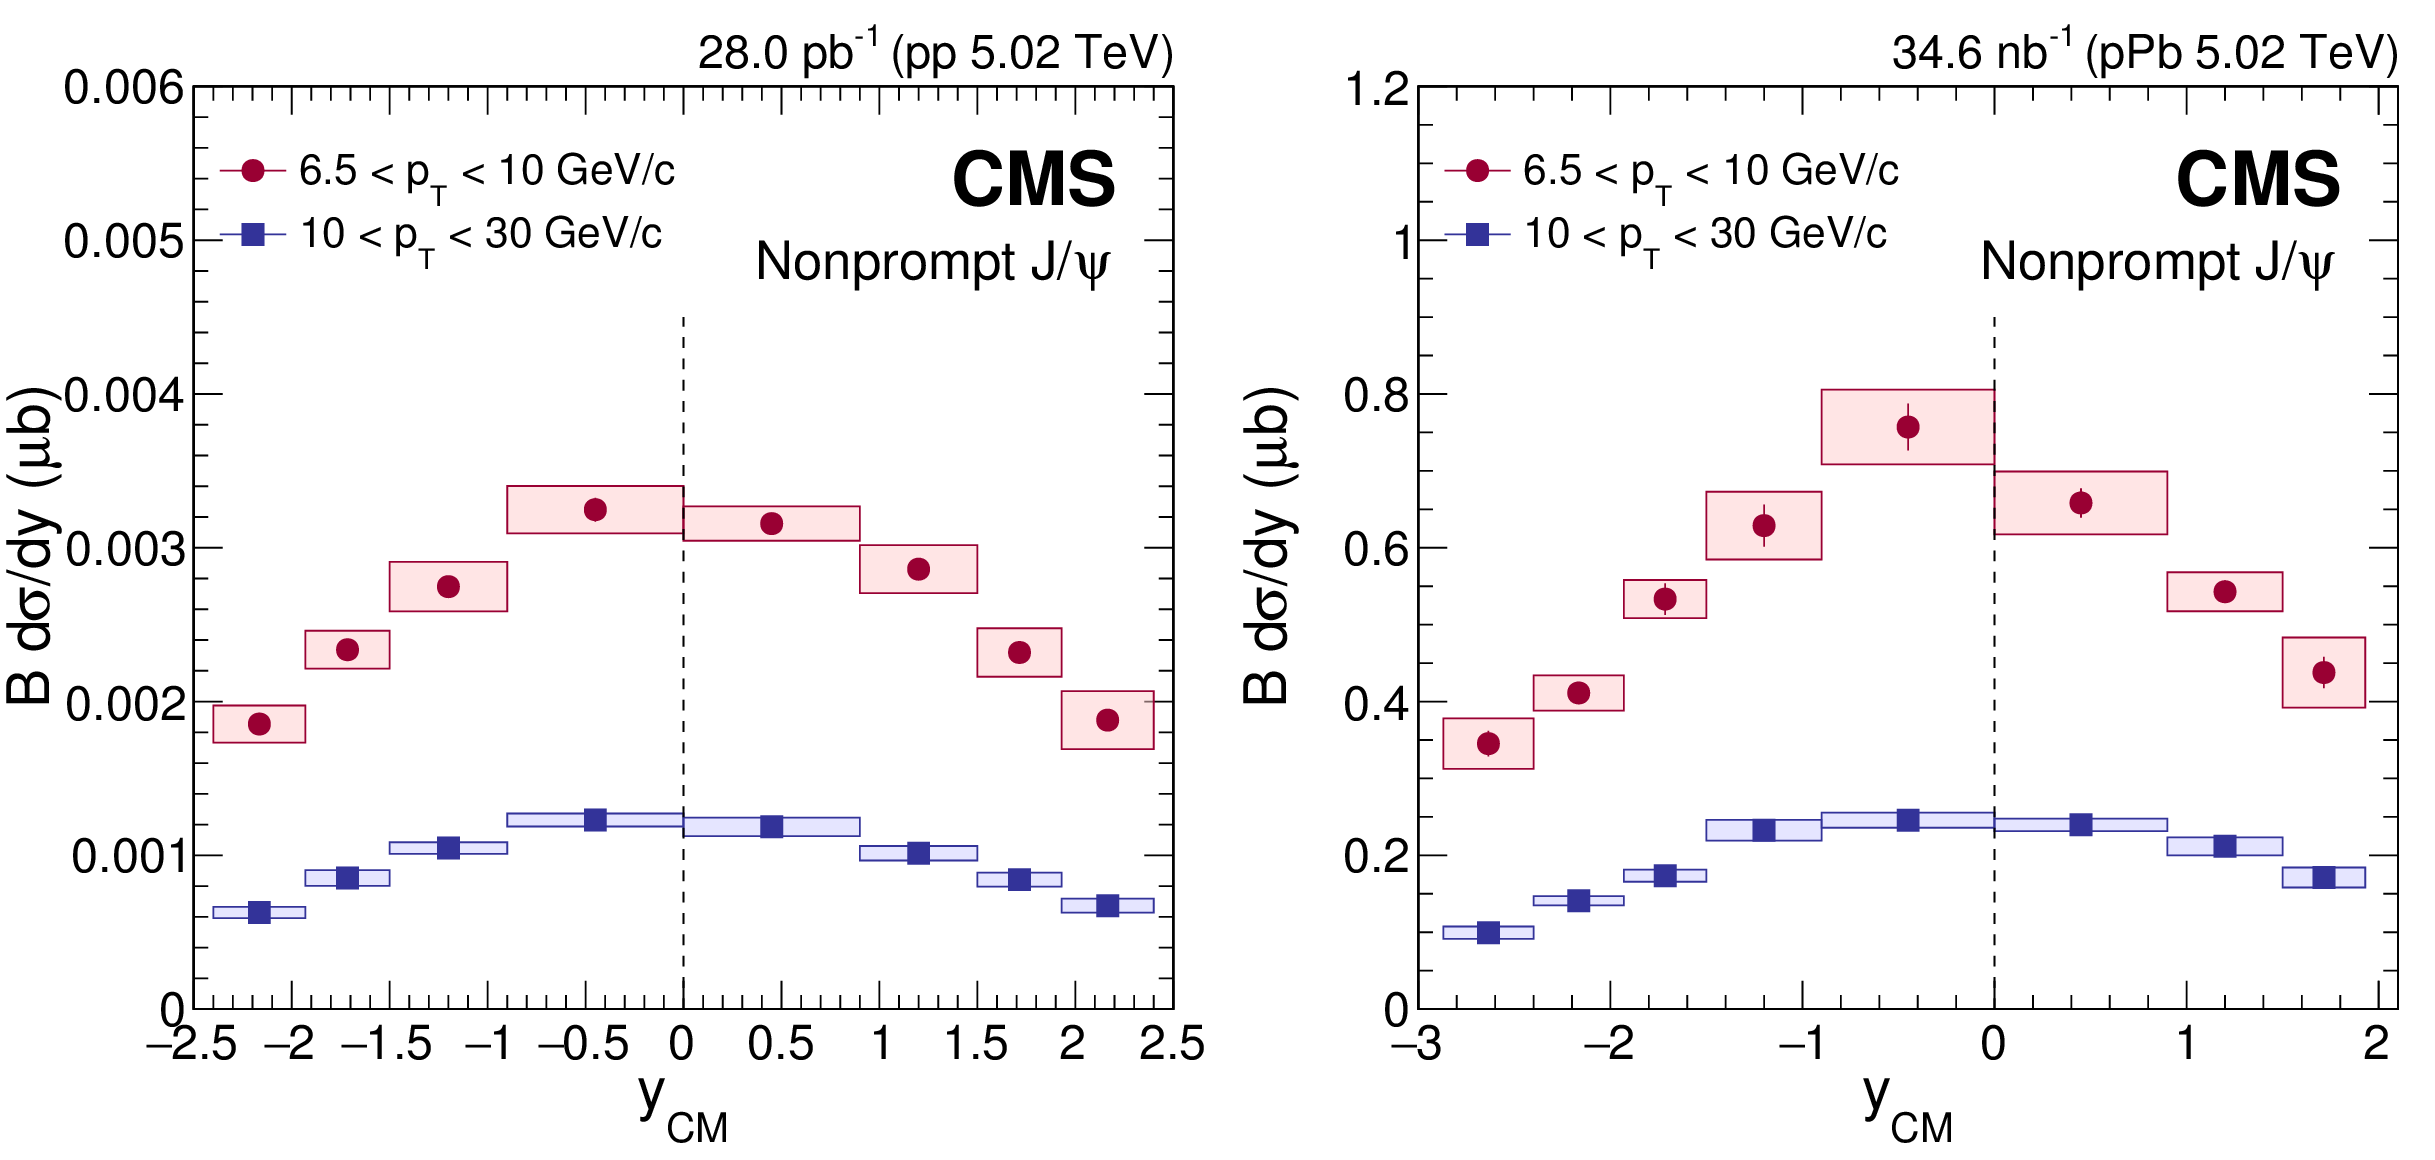
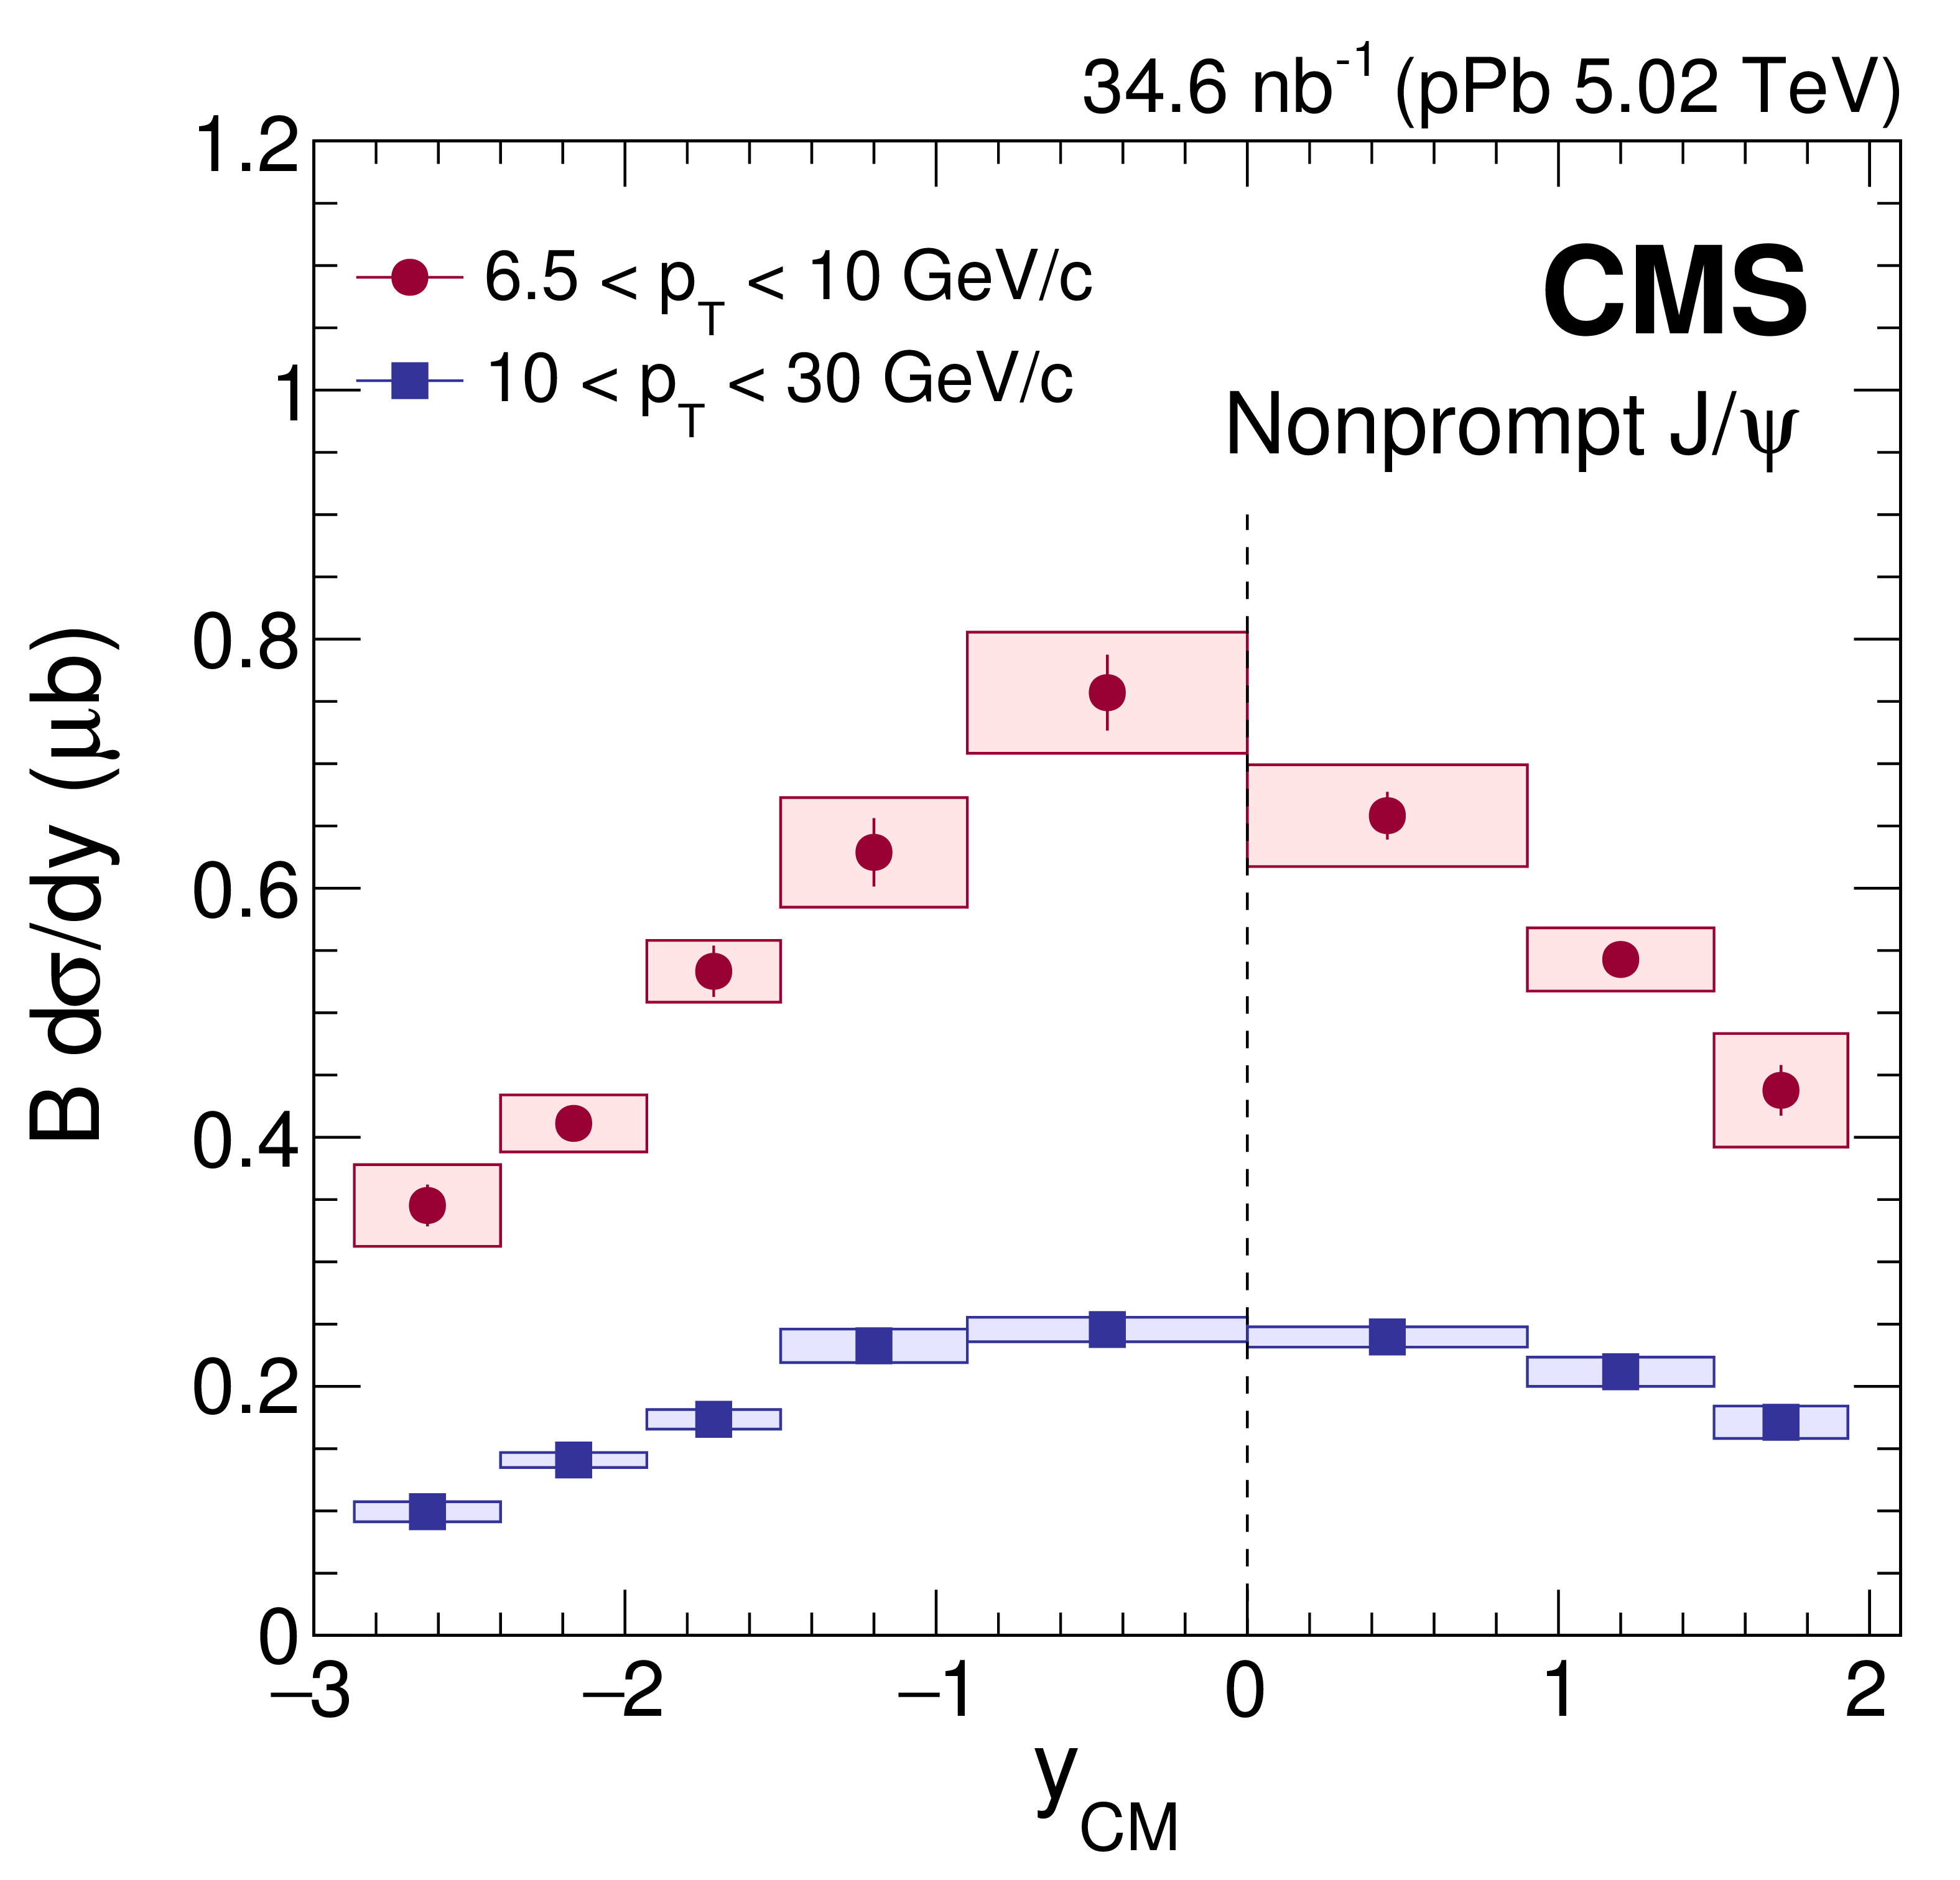
Rapidity dependence of the cross section (multiplied by the dimuon branching fraction) for nonprompt $ \mathrm{J} / \psi $ mesons in the $ {p_{\mathrm {T}}} $ intervals of 6.5 $ < {p_{\mathrm {T}}} < $ 10 GeV/$c$ (circles) and 10 $ < {p_{\mathrm {T}}} < $ 30 GeV/$c$ (squares) in pp (left) and pPb (right) collisions. The vertical dashed line indicates $ {y_{\mathrm {CM}}} = $ 0. The vertical bars (smaller than the symbols in most cases) represent the statistical uncertainties and the shaded boxes show the systematic uncertainties. The fully correlated global uncertainty from the integrated luminosity determination, 2.3% for pp and 3.5% for pPb collisions, is not included in the point-by-point uncertainties. |

png pdf |
Figure 9-a:
Rapidity dependence of the cross section (multiplied by the dimuon branching fraction) for nonprompt $ \mathrm{J} / \psi $ mesons in the $ {p_{\mathrm {T}}} $ intervals of 6.5 $ < {p_{\mathrm {T}}} < $ 10 GeV/$c$ (circles) and 10 $ < {p_{\mathrm {T}}} < $ 30 GeV/$c$ (squares) in pp collisions. The vertical dashed line indicates $ {y_{\mathrm {CM}}} = $ 0. The vertical bars (smaller than the symbols in most cases) represent the statistical uncertainties and the shaded boxes show the systematic uncertainties. The fully correlated global uncertainty from the integrated luminosity determination, 2.3%, is not included in the point-by-point uncertainties. |
png pdf |
Figure 9-b:
Rapidity dependence of the cross section (multiplied by the dimuon branching fraction) for nonprompt $ \mathrm{J} / \psi $ mesons in the $ {p_{\mathrm {T}}} $ intervals of 6.5 $ < {p_{\mathrm {T}}} < $ 10 GeV/$c$ (circles) and 10 $ < {p_{\mathrm {T}}} < $ 30 GeV/$c$ (squares) in pPb collisions. The vertical dashed line indicates $ {y_{\mathrm {CM}}} = $ 0. The vertical bars (smaller than the symbols in most cases) represent the statistical uncertainties and the shaded boxes show the systematic uncertainties. The fully correlated global uncertainty from the integrated luminosity determination, 3.5%, is not included in the point-by-point uncertainties. |
png pdf |
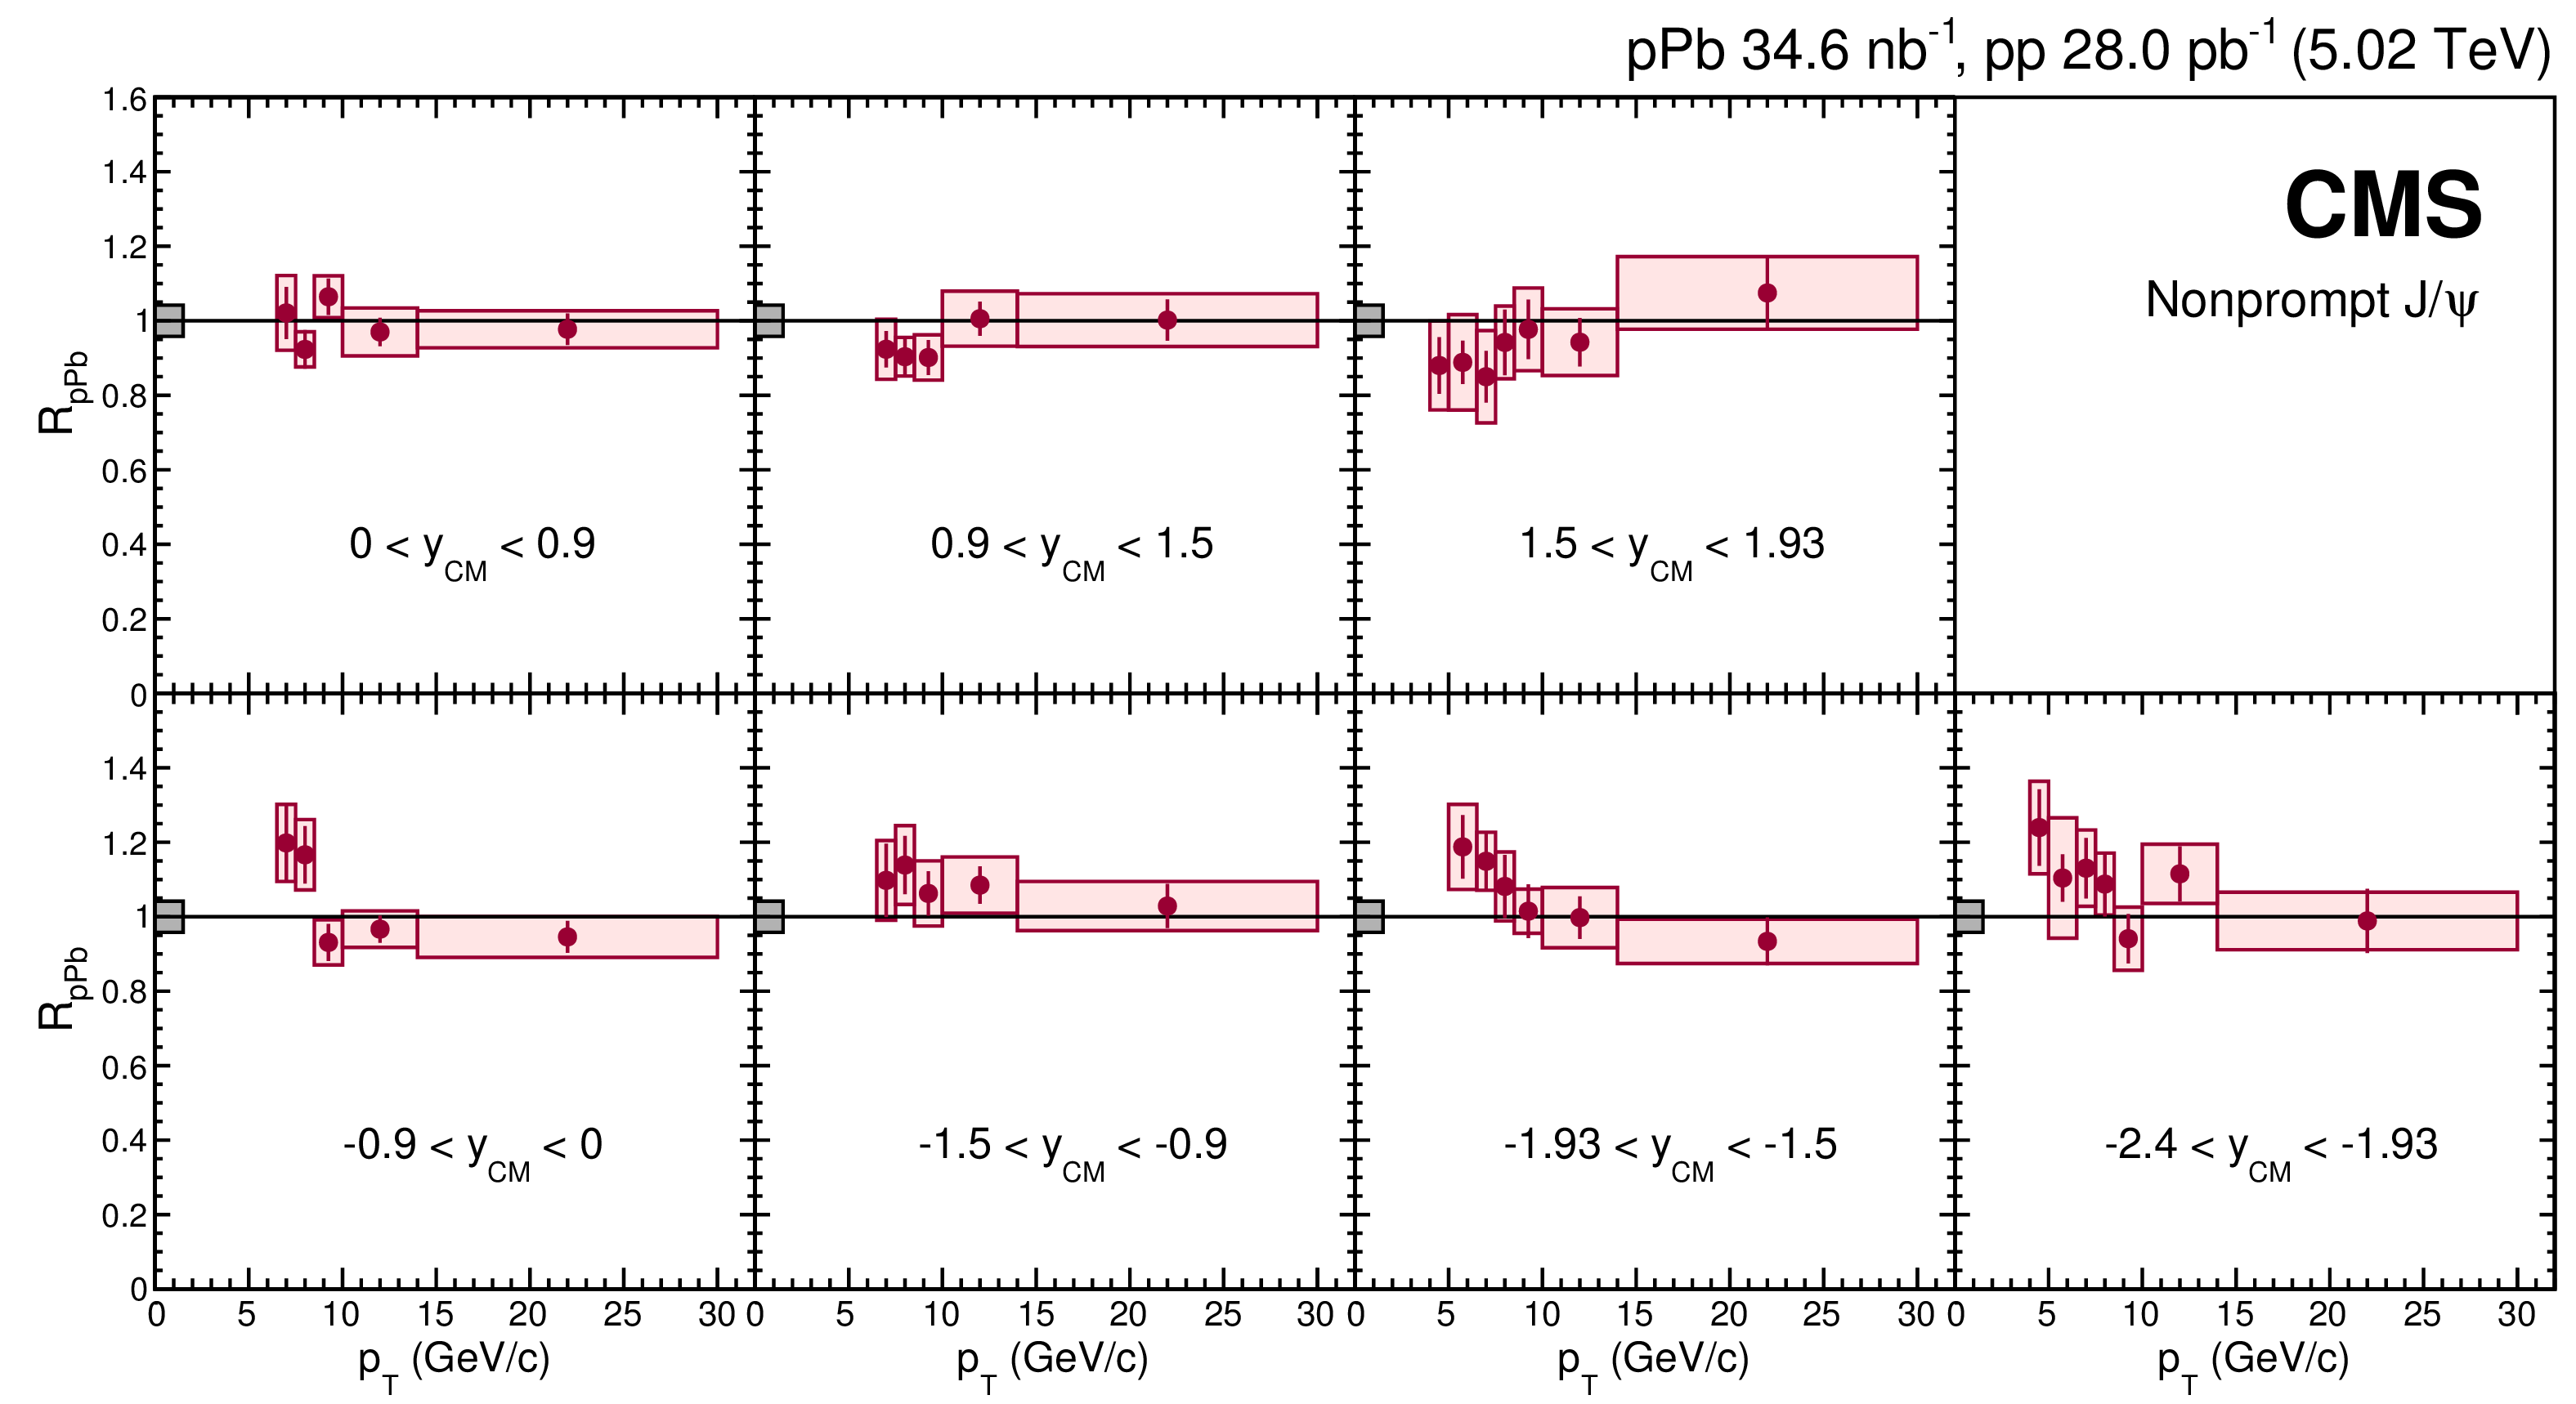
Figure 10:
Transverse momentum dependence of $ {R_{\mathrm{ p } \mathrm {Pb}}} $ for nonprompt $ \mathrm{J} / \psi $ mesons in seven ${y_{\mathrm {CM}}}$ ranges. The vertical bars represent the statistical uncertainties and the shaded boxes show the systematic uncertainties. The fully correlated global uncertainty of 4.2% is displayed as a gray box at $ {R_{\mathrm{ p } \mathrm {Pb}}} = $ 1 next to the left axis. |
png pdf |
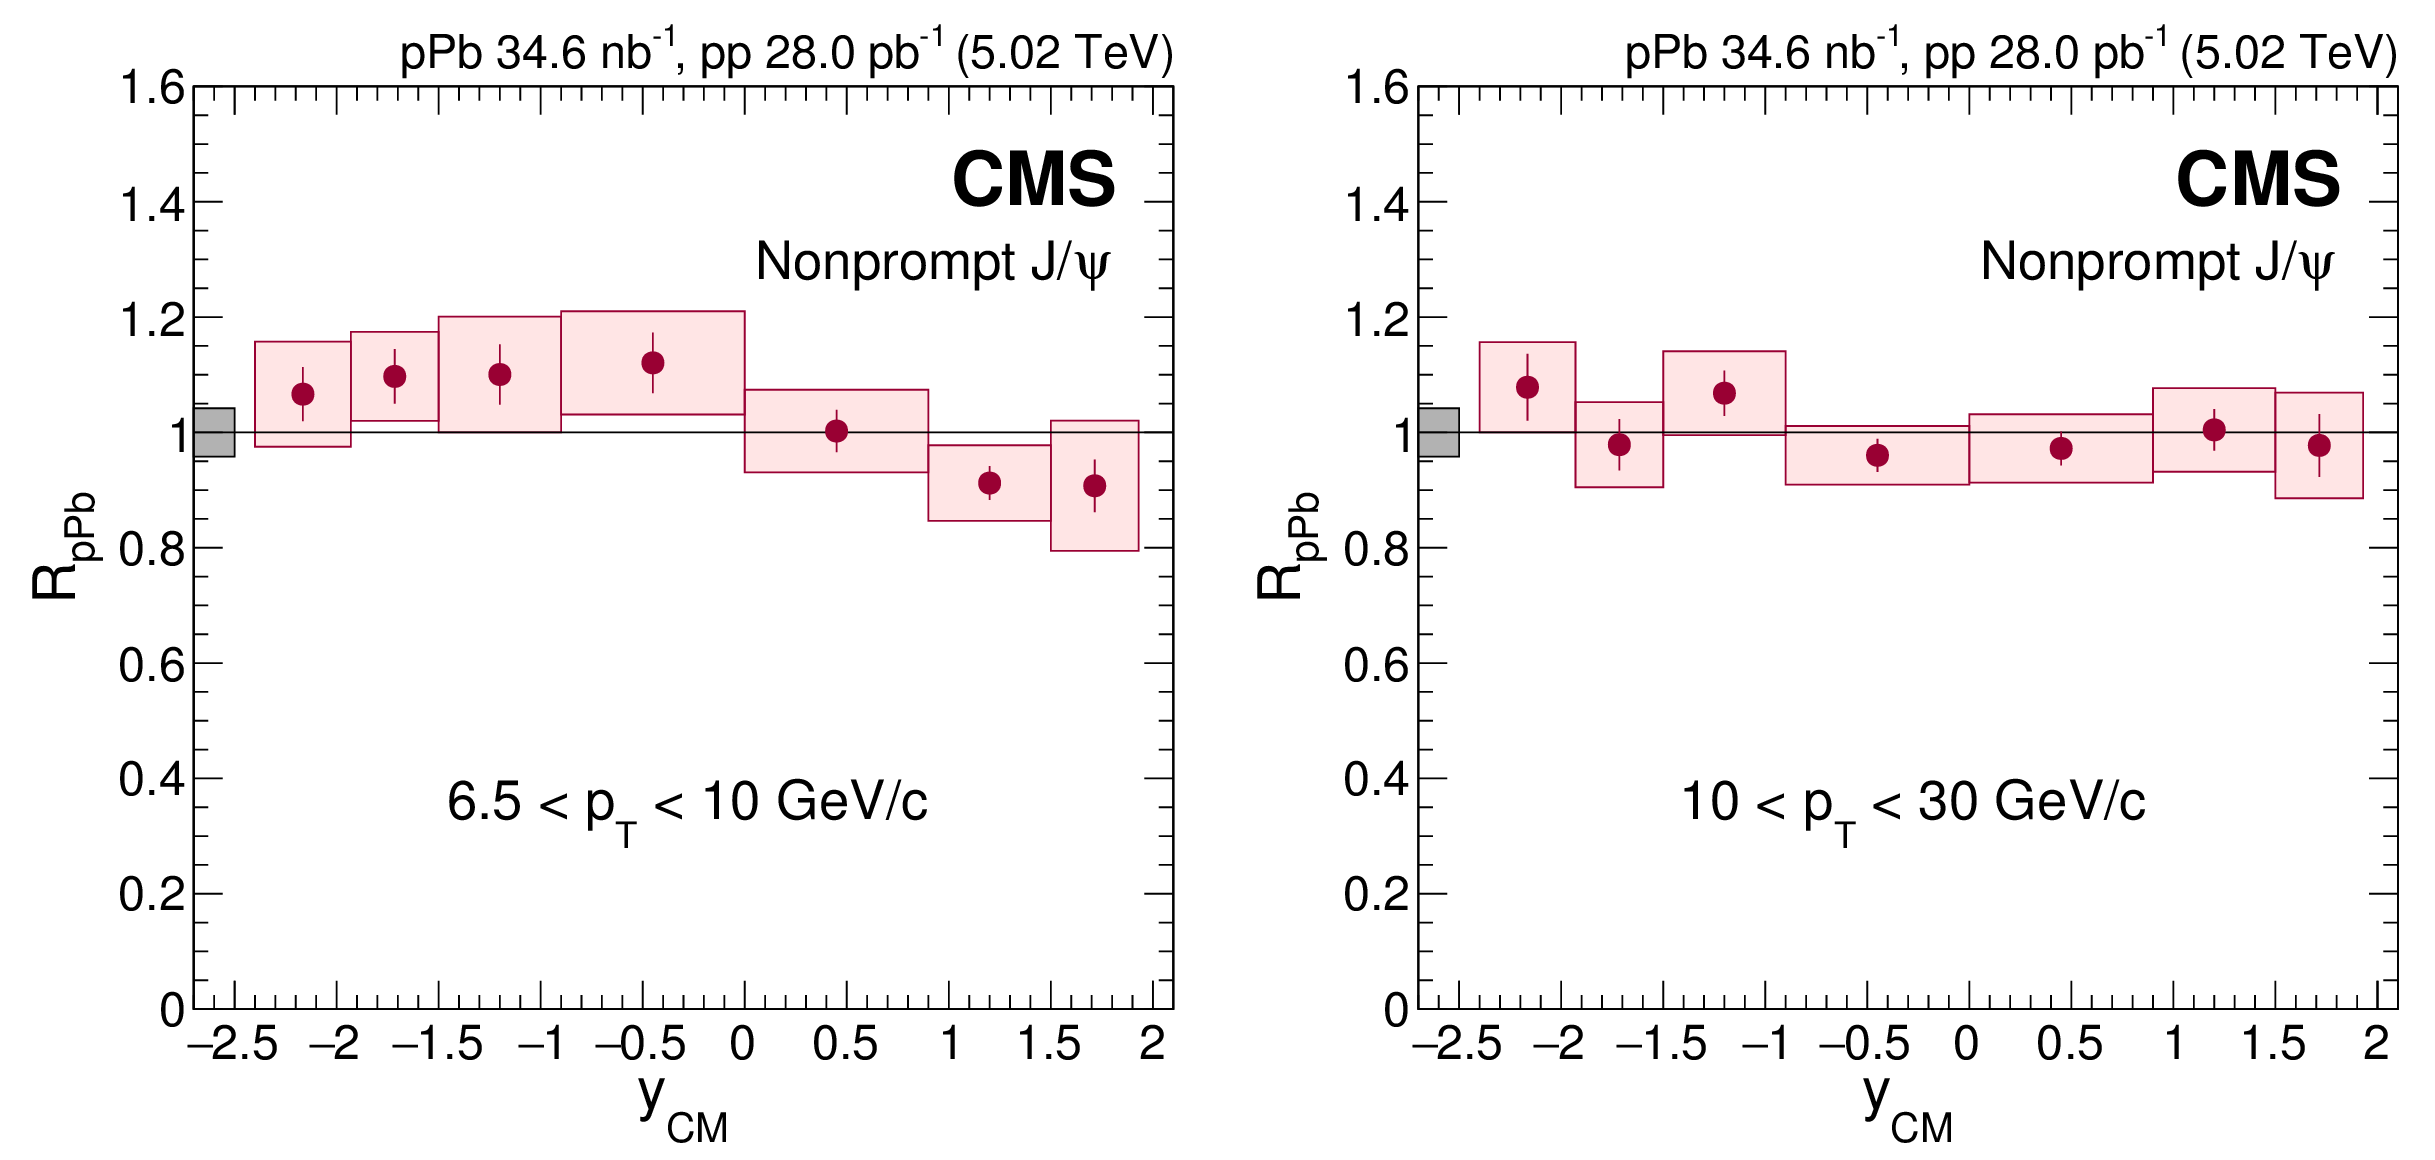
Figure 11:
Rapidity dependence of $ {R_{\mathrm{ p } \mathrm {Pb}}} $ for nonprompt $ \mathrm{J} / \psi $ mesons in two $ {p_{\mathrm {T}}} $ ranges: 6.5 $ < {p_{\mathrm {T}}} < $ 10 GeV/$c$ (left) and 10 $ < {p_{\mathrm {T}}} < $ 30 GeV/$c$ (right). The vertical bars represent the statistical uncertainties and the shaded boxes show the systematic uncertainties. The fully correlated global uncertainty of 4.2% is displayed as a gray box at $ {R_{\mathrm{ p } \mathrm {Pb}}} = $ 1 next to the left axis. |
png pdf |
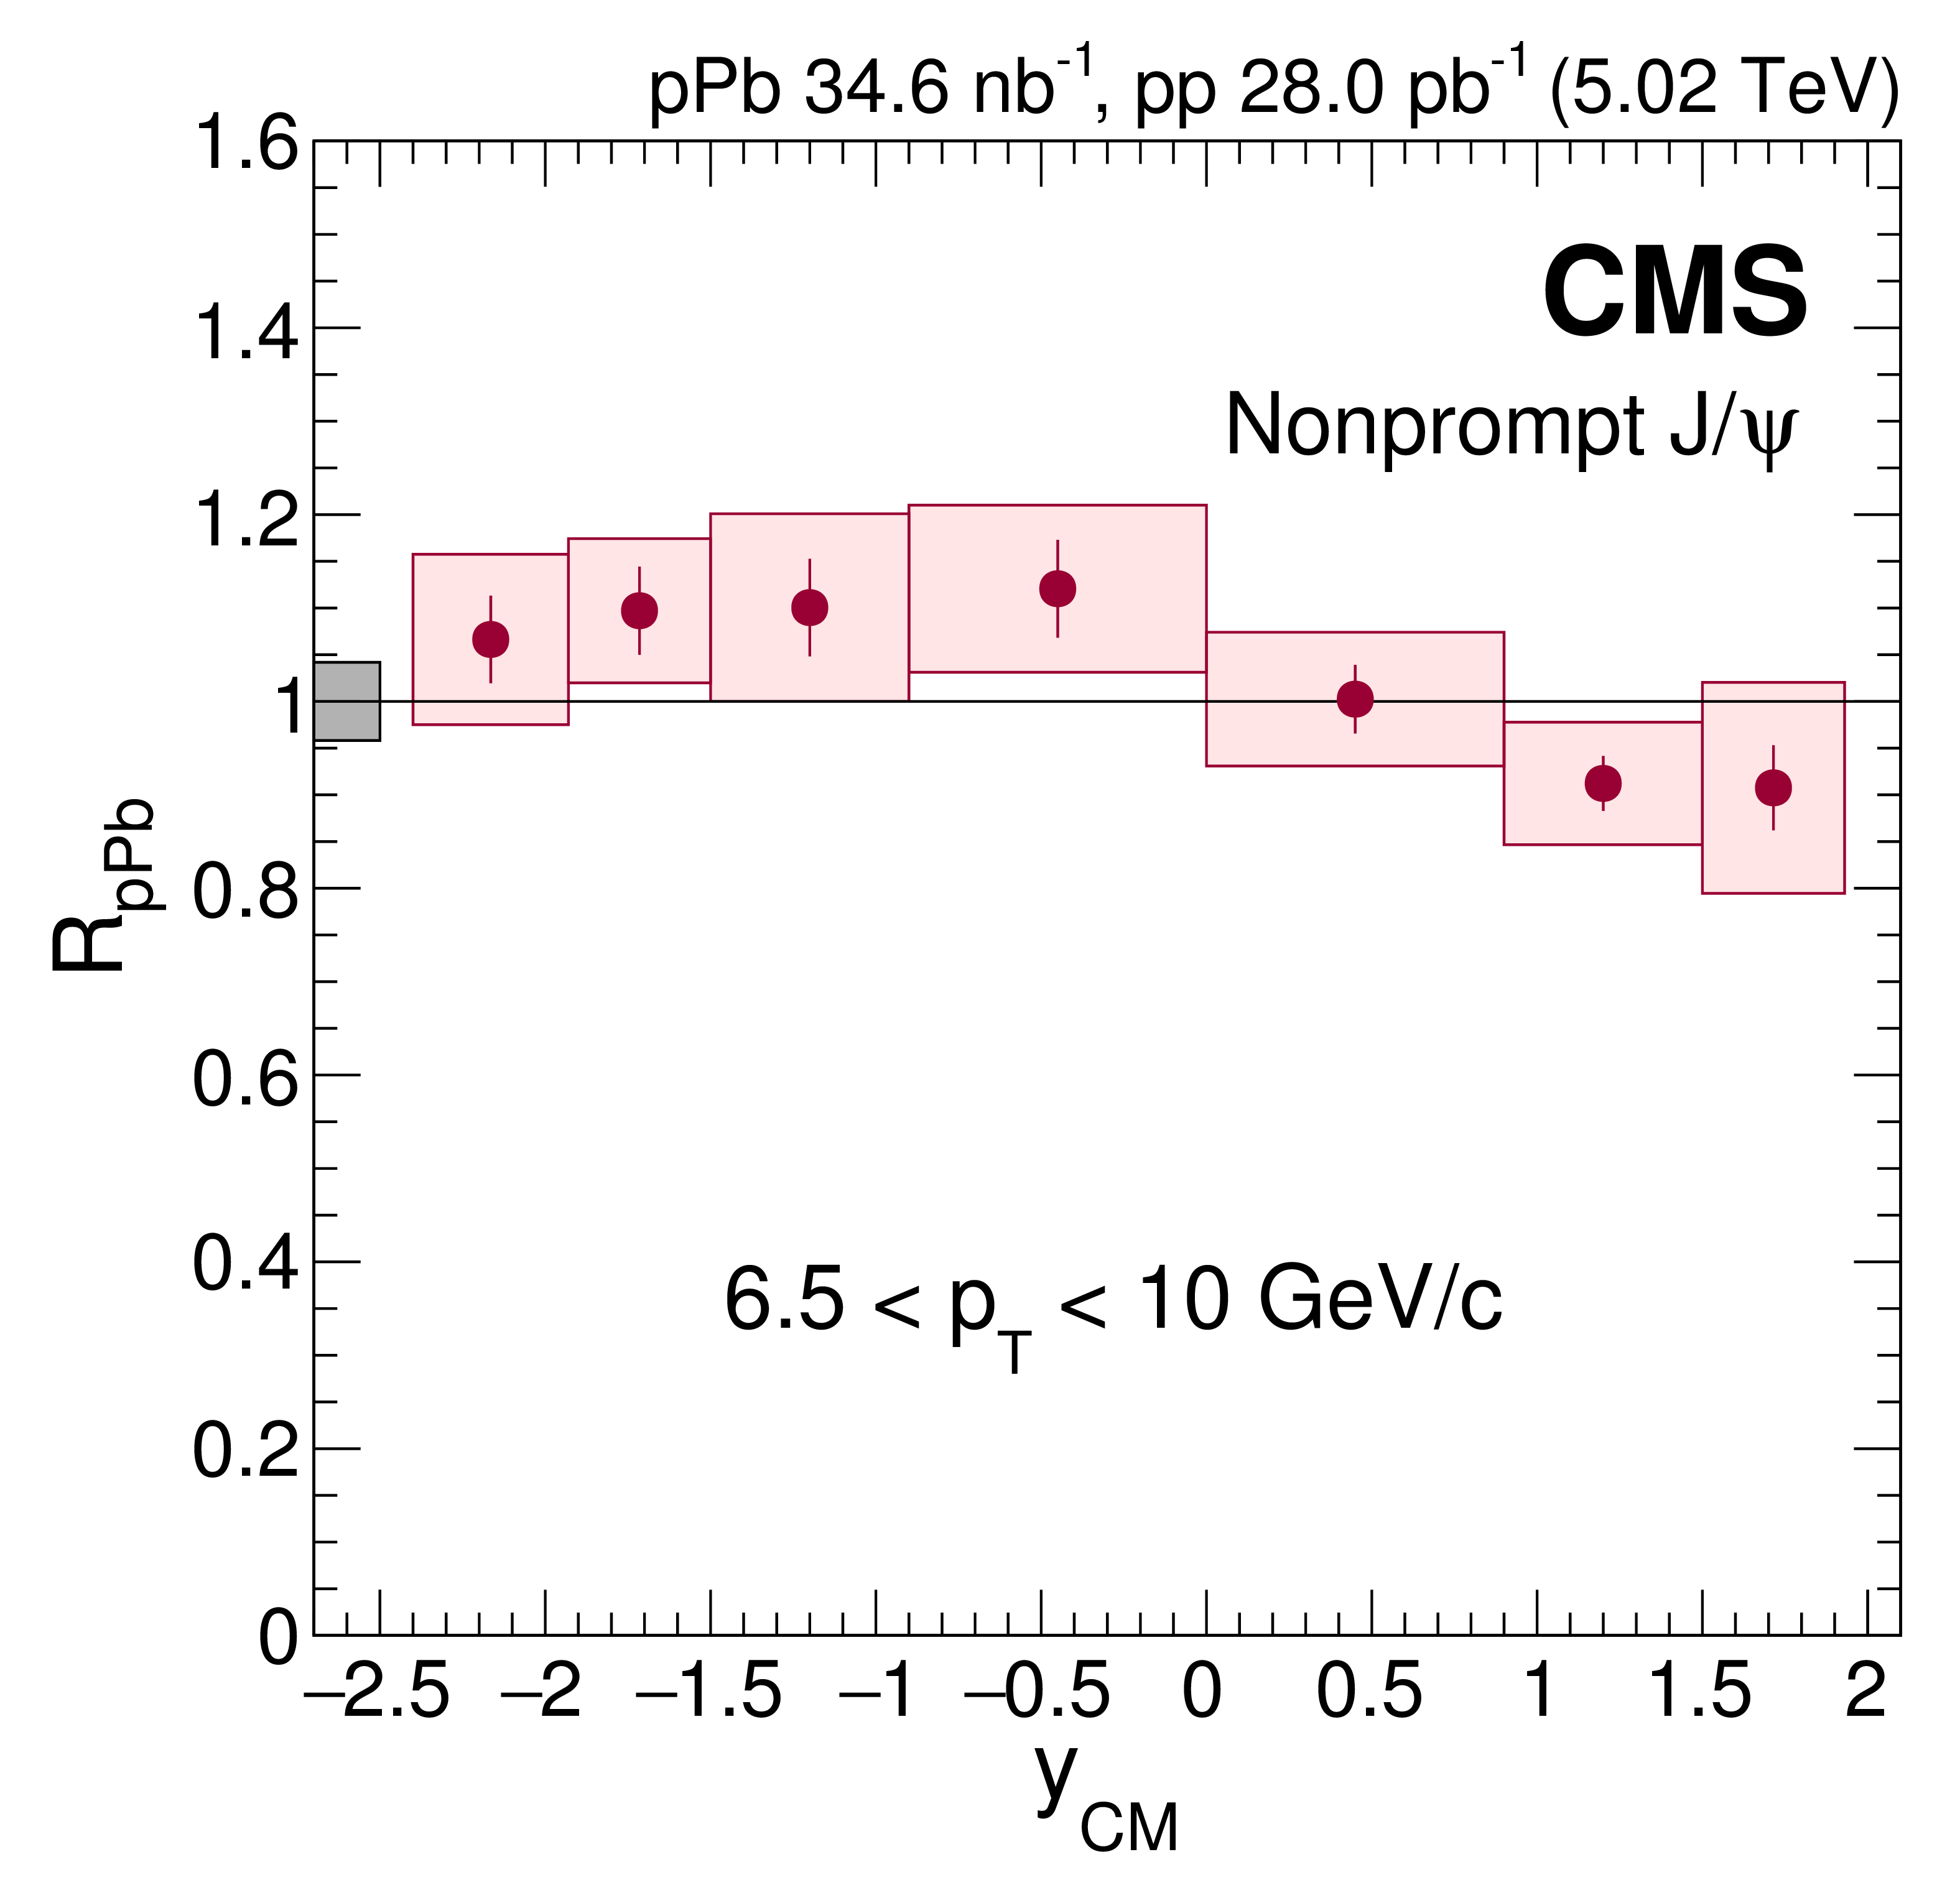
Figure 11-a:
Rapidity dependence of $ {R_{\mathrm{ p } \mathrm {Pb}}} $ for nonprompt $ \mathrm{J} / \psi $ mesons in $ {p_{\mathrm {T}}} $ range 6.5 $ < {p_{\mathrm {T}}} < $ 10 GeV/$c$. The vertical bars represent the statistical uncertainties and the shaded boxes show the systematic uncertainties. The fully correlated global uncertainty of 4.2% is displayed as a gray box at $ {R_{\mathrm{ p } \mathrm {Pb}}} = $ 1 next to the left axis. |
png pdf |
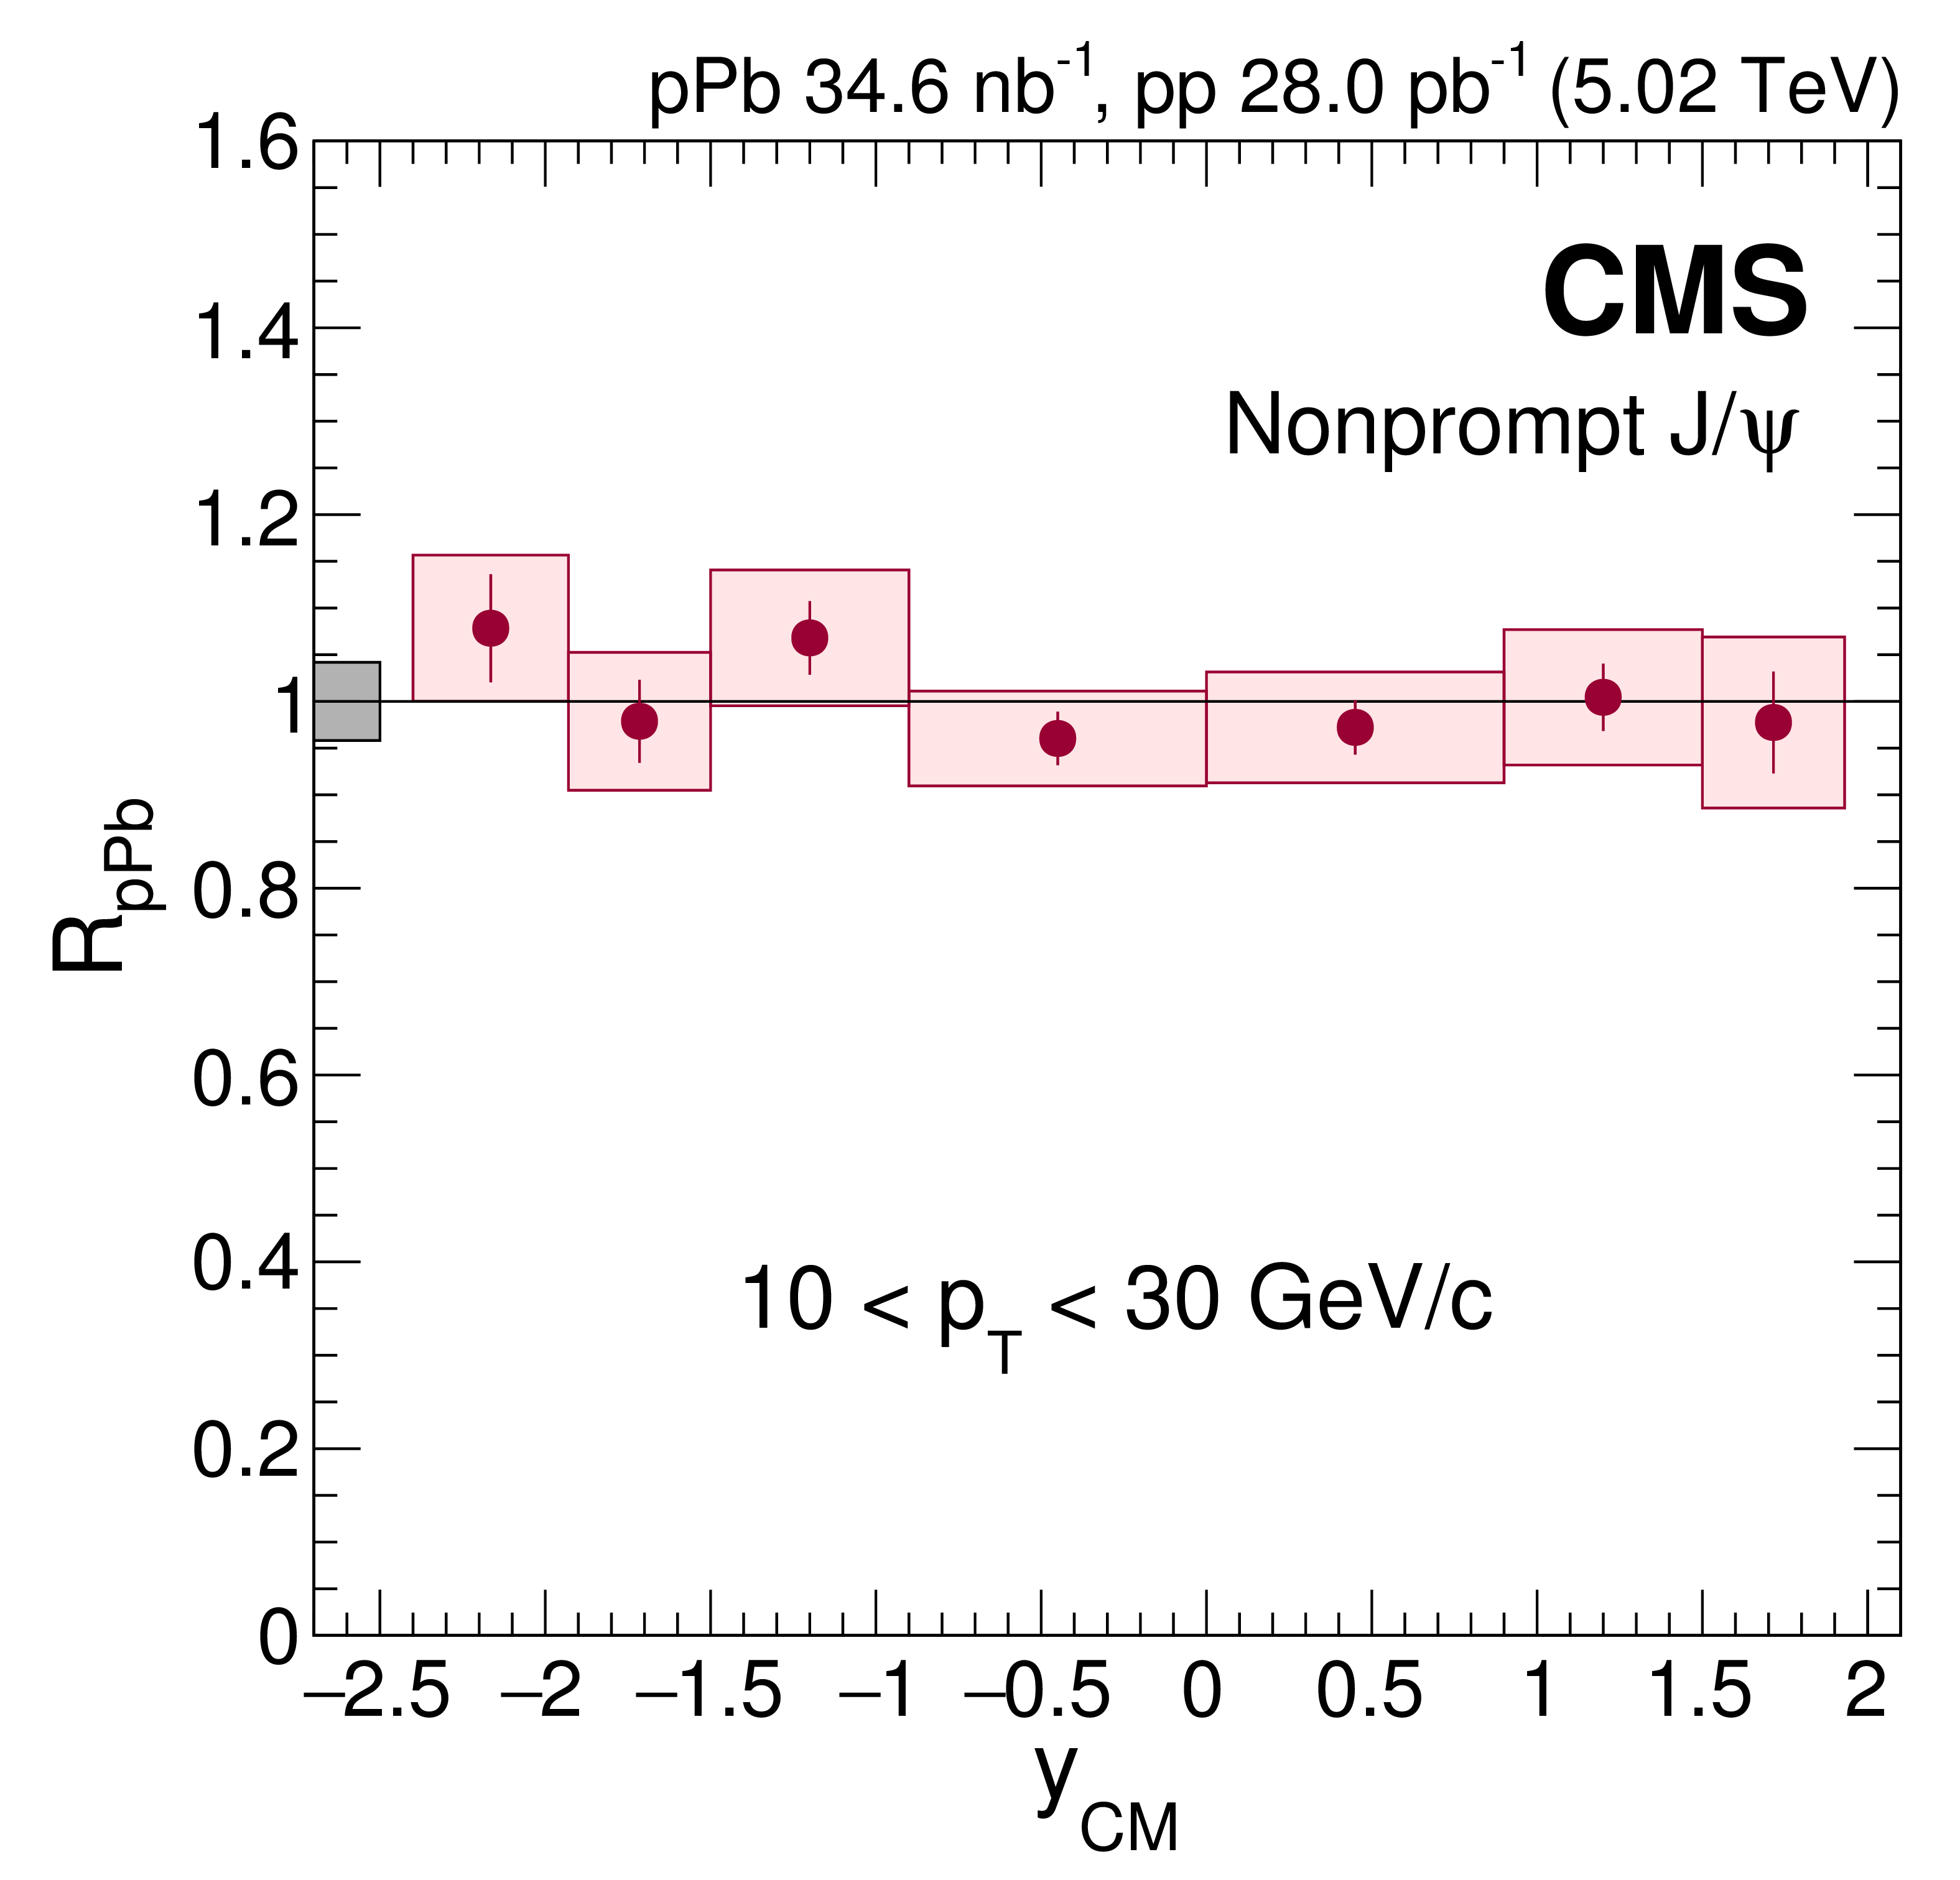
Figure 11-b:
Rapidity dependence of $ {R_{\mathrm{ p } \mathrm {Pb}}} $ for nonprompt $ \mathrm{J} / \psi $ mesons in $ {p_{\mathrm {T}}} $ range 10 $ < {p_{\mathrm {T}}} < $ 30 GeV/$c$. The vertical bars represent the statistical uncertainties and the shaded boxes show the systematic uncertainties. The fully correlated global uncertainty of 4.2% is displayed as a gray box at $ {R_{\mathrm{ p } \mathrm {Pb}}} = $ 1 next to the left axis. |
png pdf |
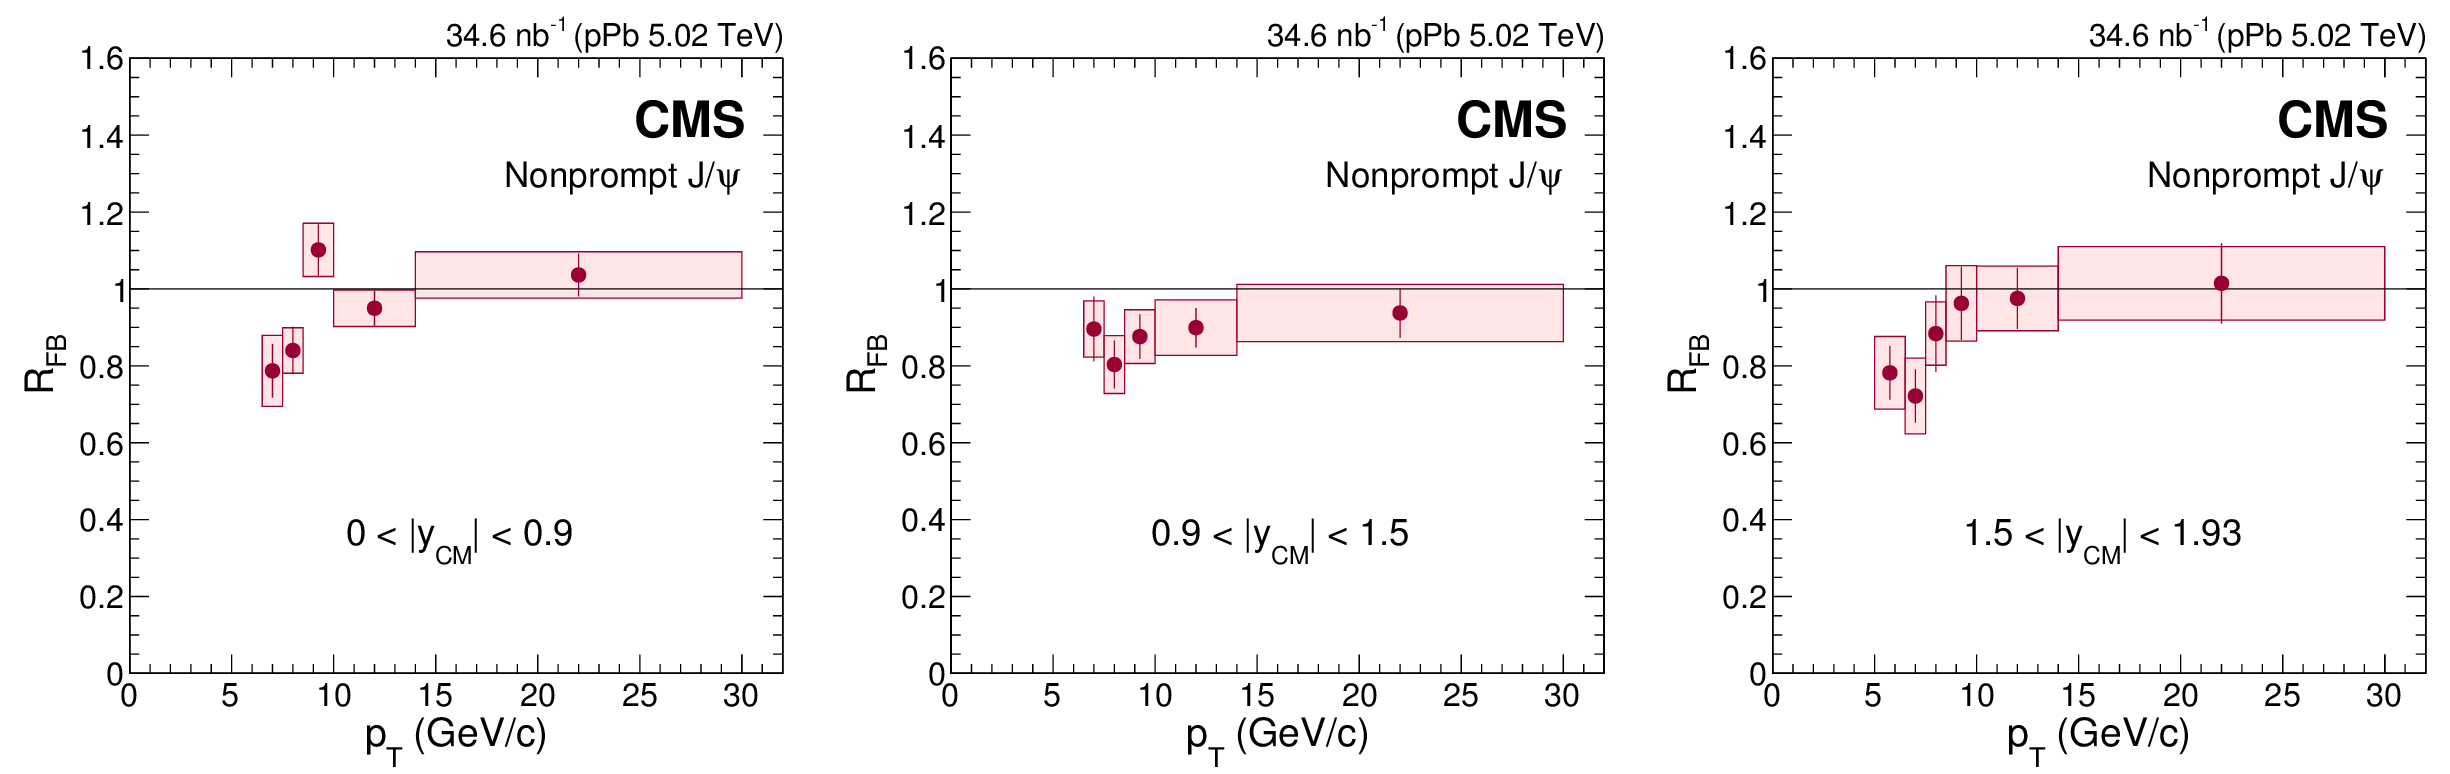
Figure 12:
Transverse momentum dependence of $ {R_{\mathrm {FB}}} $ for nonprompt $ \mathrm{J} / \psi $ mesons in three ${y_{\mathrm {CM}}}$ regions. The vertical bars represent the statistical uncertainties and the shaded boxes show the systematic uncertainties. |
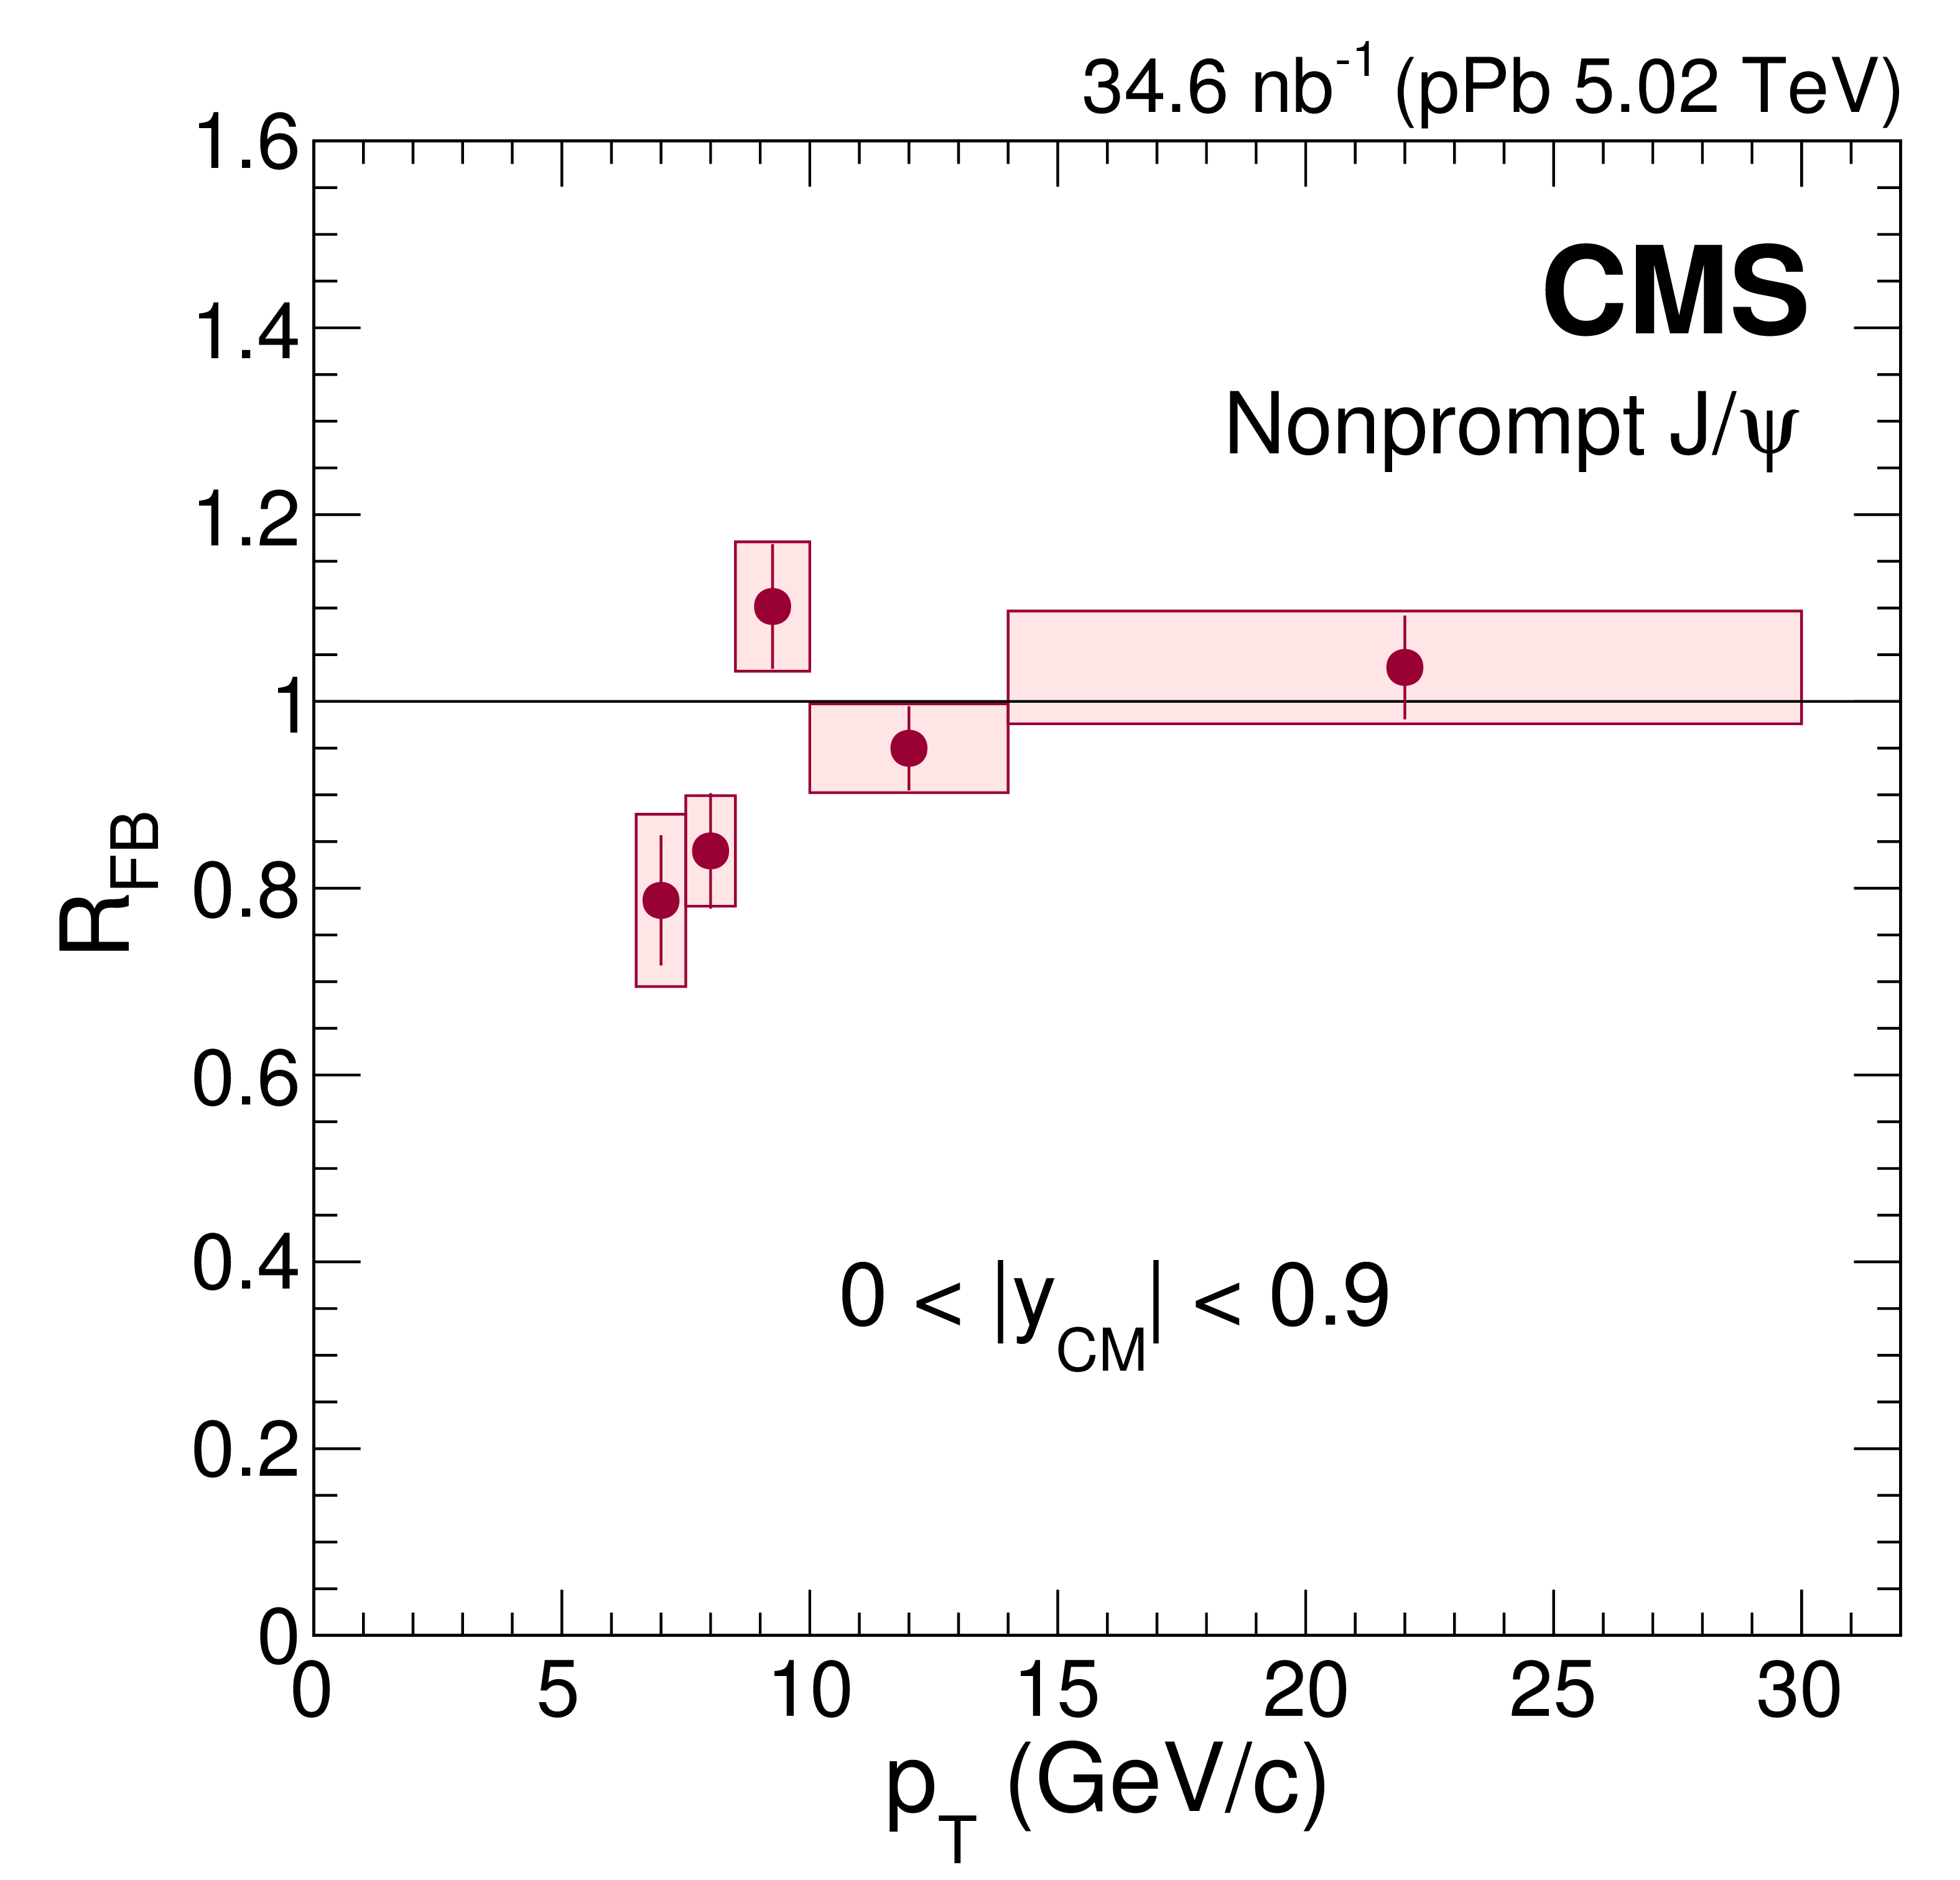
png pdf |
Figure 12-a:
Transverse momentum dependence of $ {R_{\mathrm {FB}}} $ for nonprompt $ \mathrm{J} / \psi $ mesons in the 0 < ${y_{\mathrm {CM}}}$ < 0.9 region. The vertical bars represent the statistical uncertainties and the shaded boxes show the systematic uncertainties. |
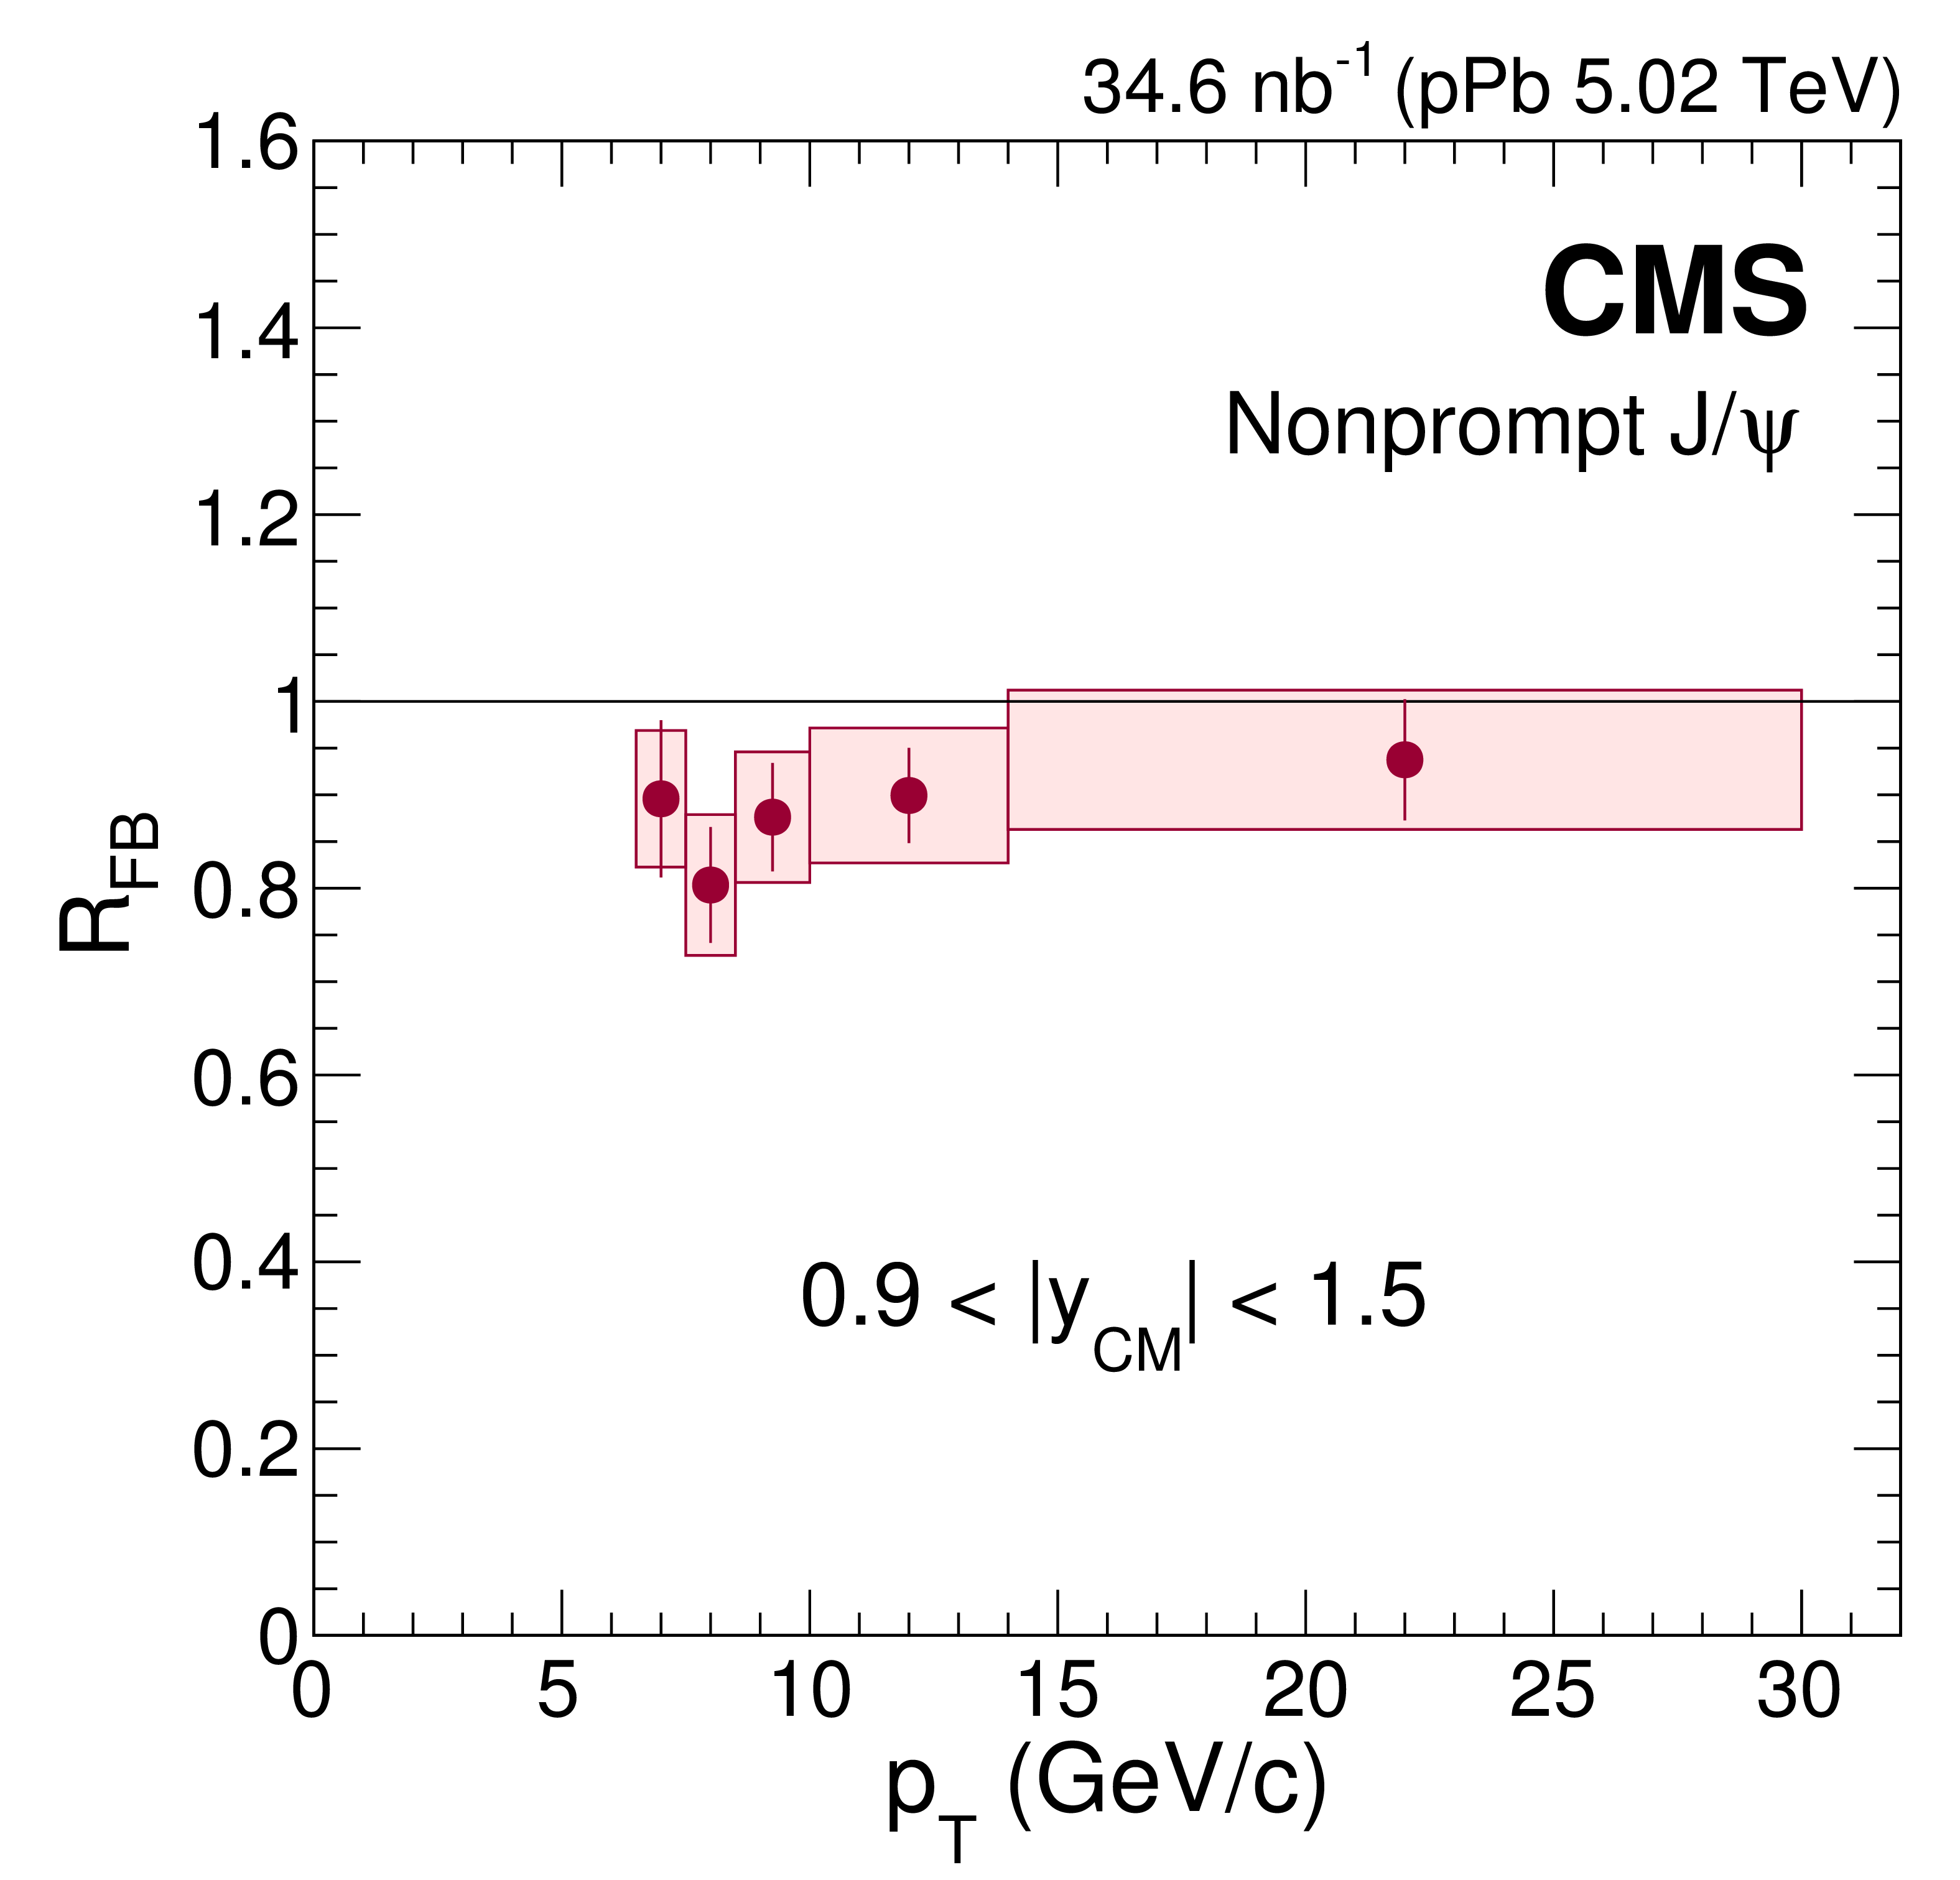
png pdf |
Figure 12-b:
Transverse momentum dependence of $ {R_{\mathrm {FB}}} $ for nonprompt $ \mathrm{J} / \psi $ mesons in the 0.9 < ${y_{\mathrm {CM}}}$ < 1.5 region. The vertical bars represent the statistical uncertainties and the shaded boxes show the systematic uncertainties. |
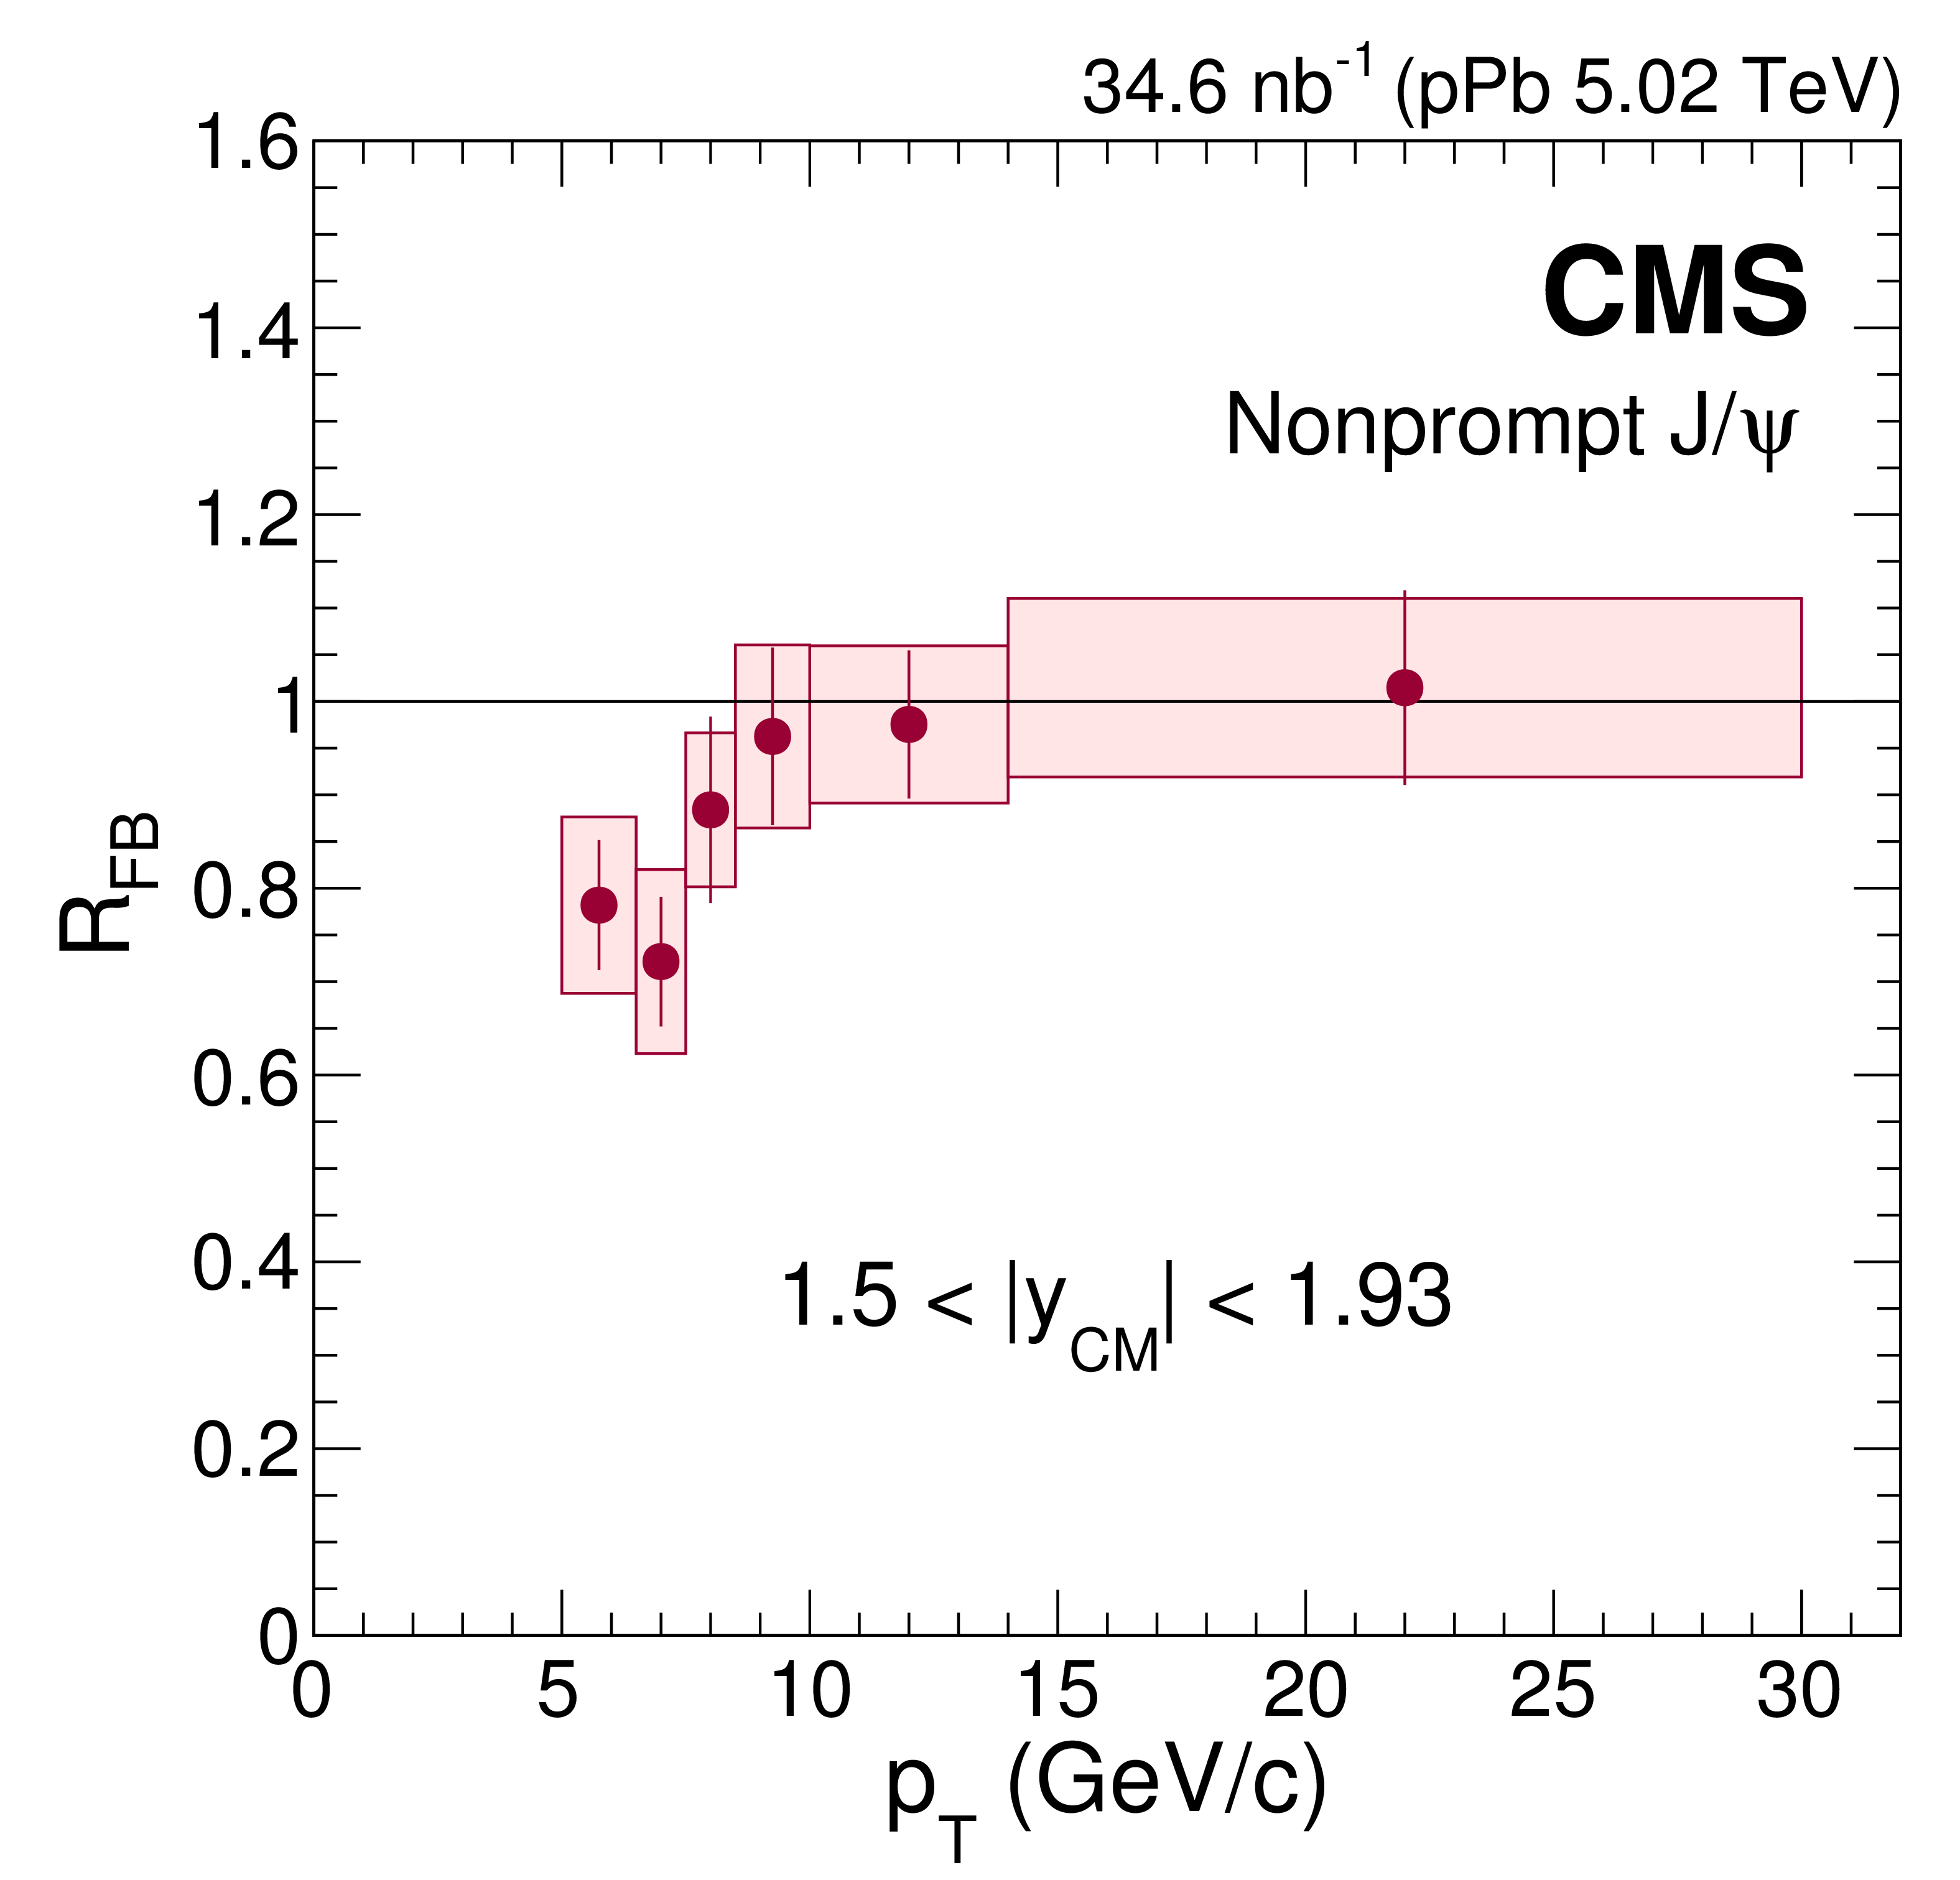
png pdf |
Figure 12-c:
Transverse momentum dependence of $ {R_{\mathrm {FB}}} $ for nonprompt $ \mathrm{J} / \psi $ mesons in the 1.5 < ${y_{\mathrm {CM}}}$ < 1.93 region. The vertical bars represent the statistical uncertainties and the shaded boxes show the systematic uncertainties. |
png pdf |
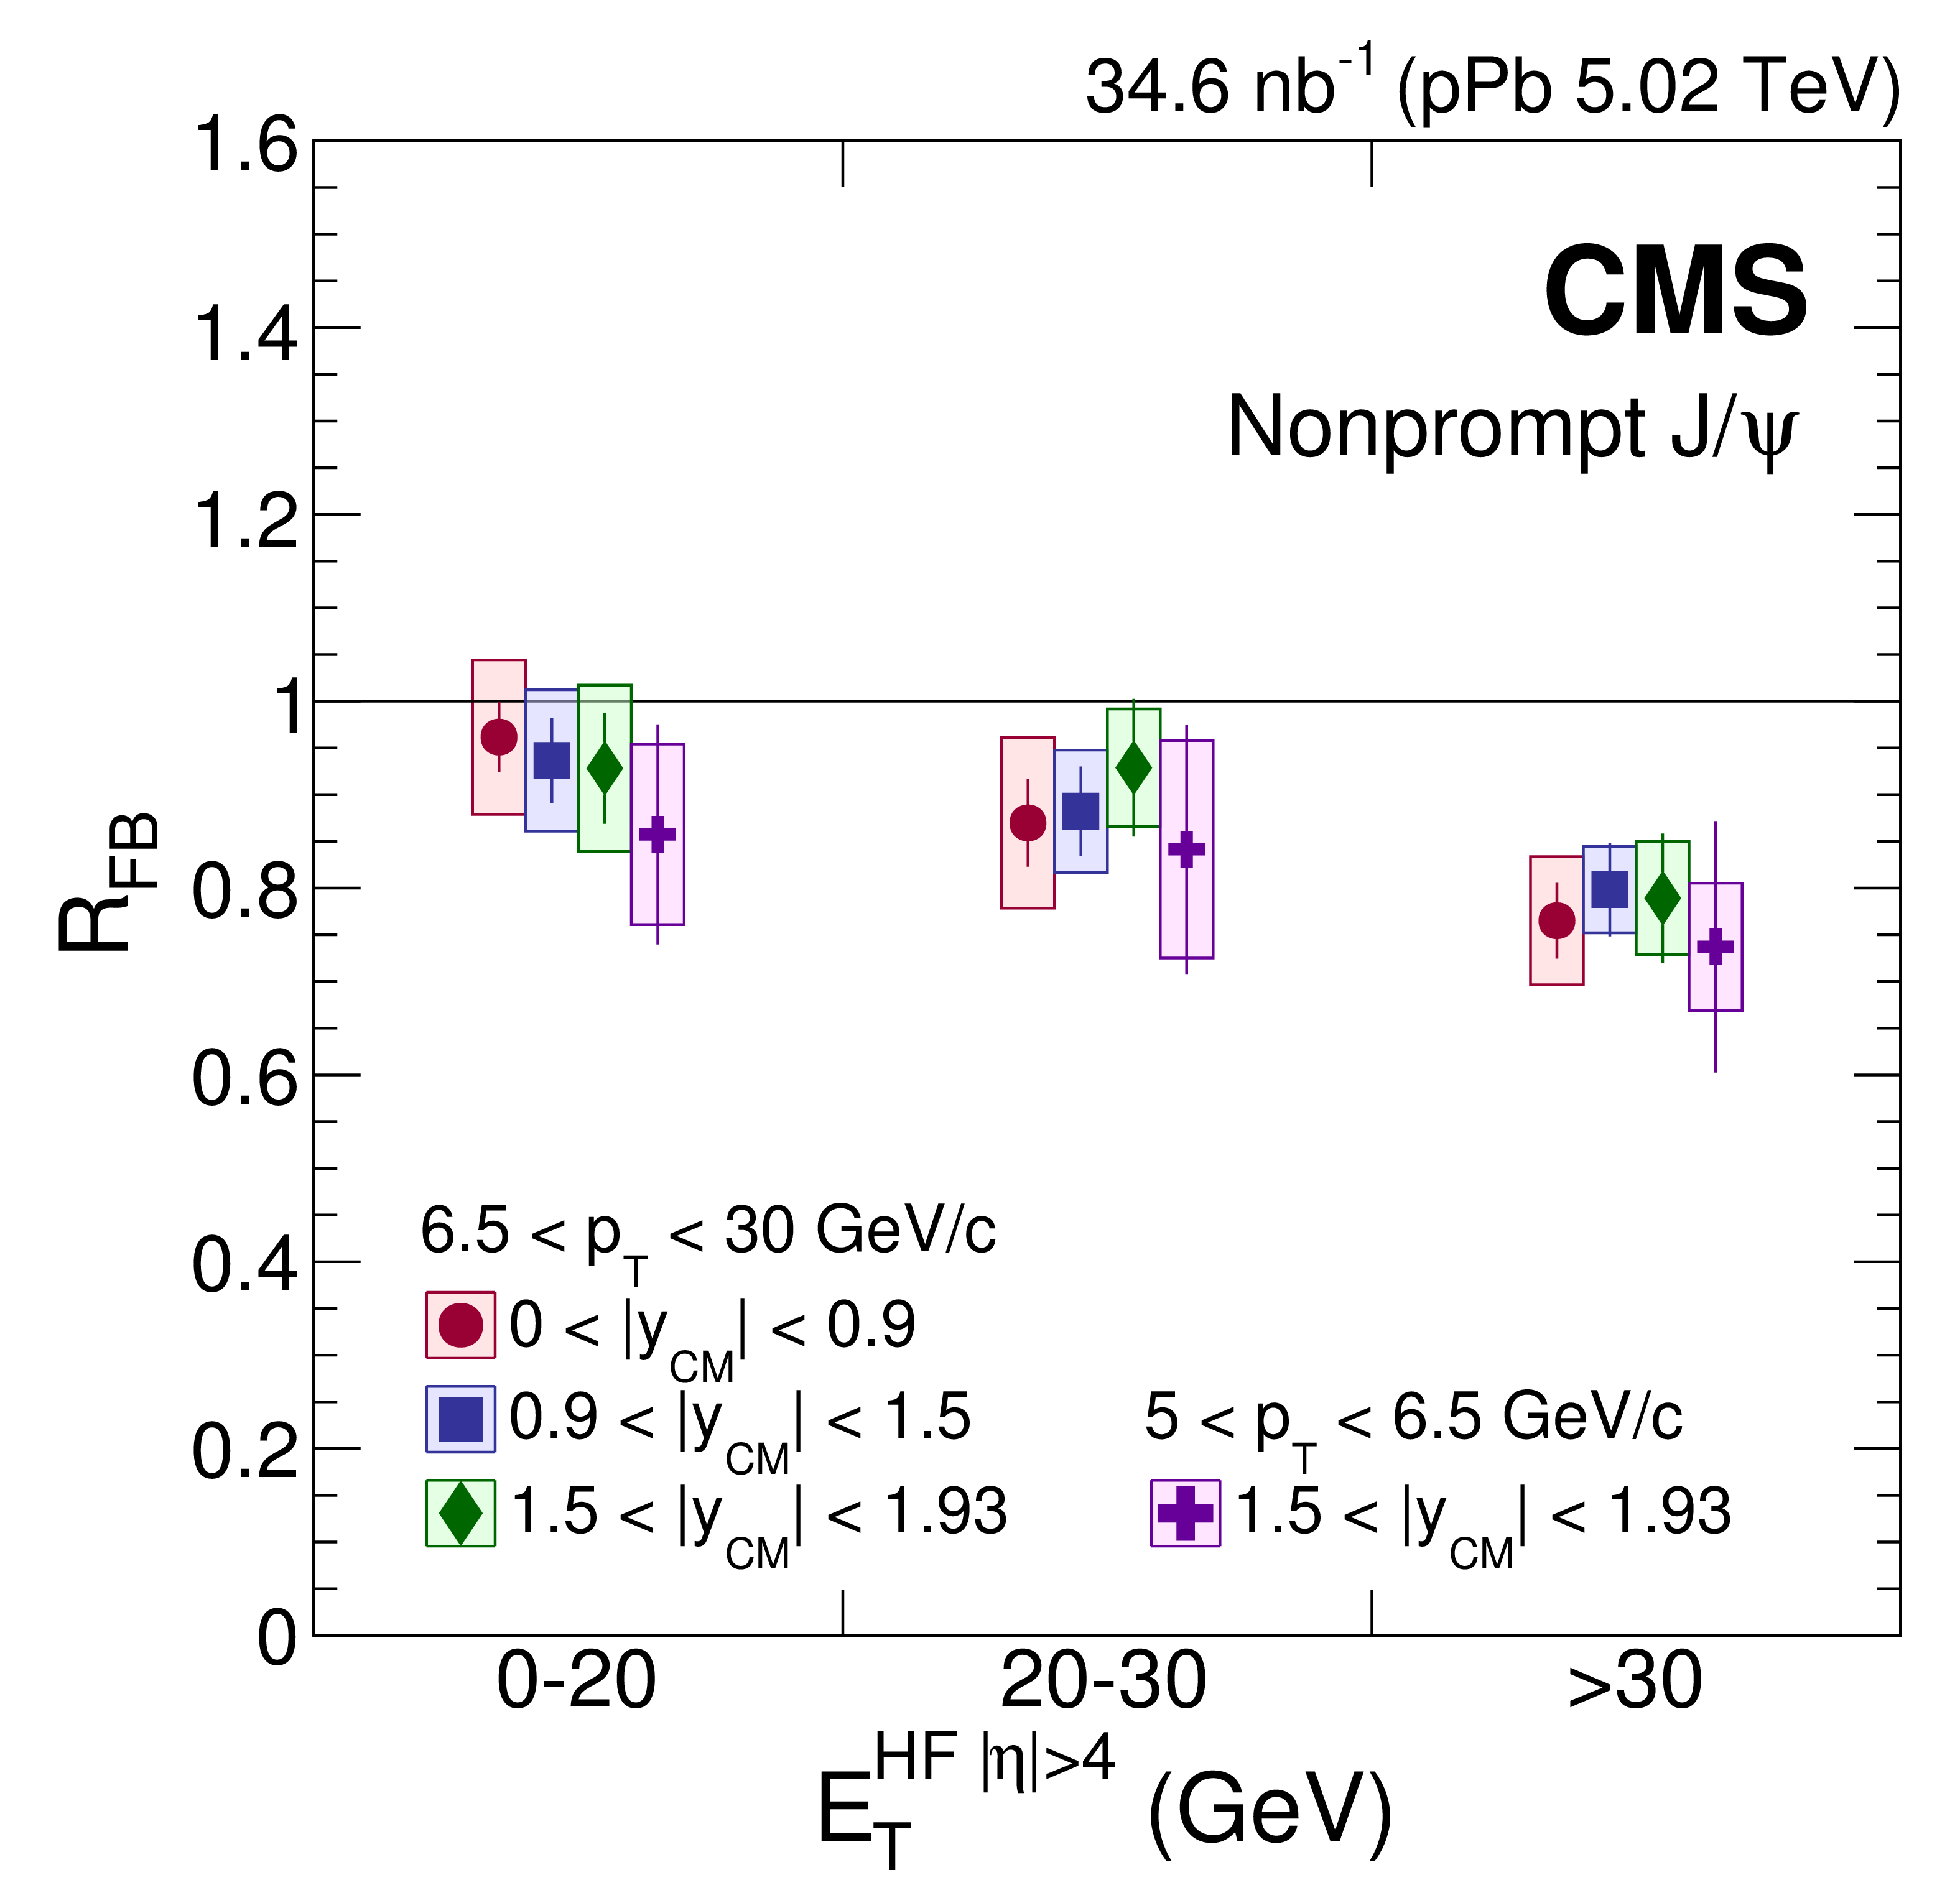
Figure 13:
Dependence of $ {R_{\mathrm {FB}}} $ for nonprompt $ \mathrm{J} / \psi $ mesons on the hadronic activity in the event, given by the transverse energy deposited in the CMS detector at large pseudorapidities ${E_{\mathrm {T}}^{{\mathrm {HF}} {| \eta | }>4}} $. Data points are slightly shifted horizontally so that they do not overlap. The vertical bars represent the statistical uncertainties and the shaded boxes show the systematic uncertainties. |
| Tables | |
png pdf |
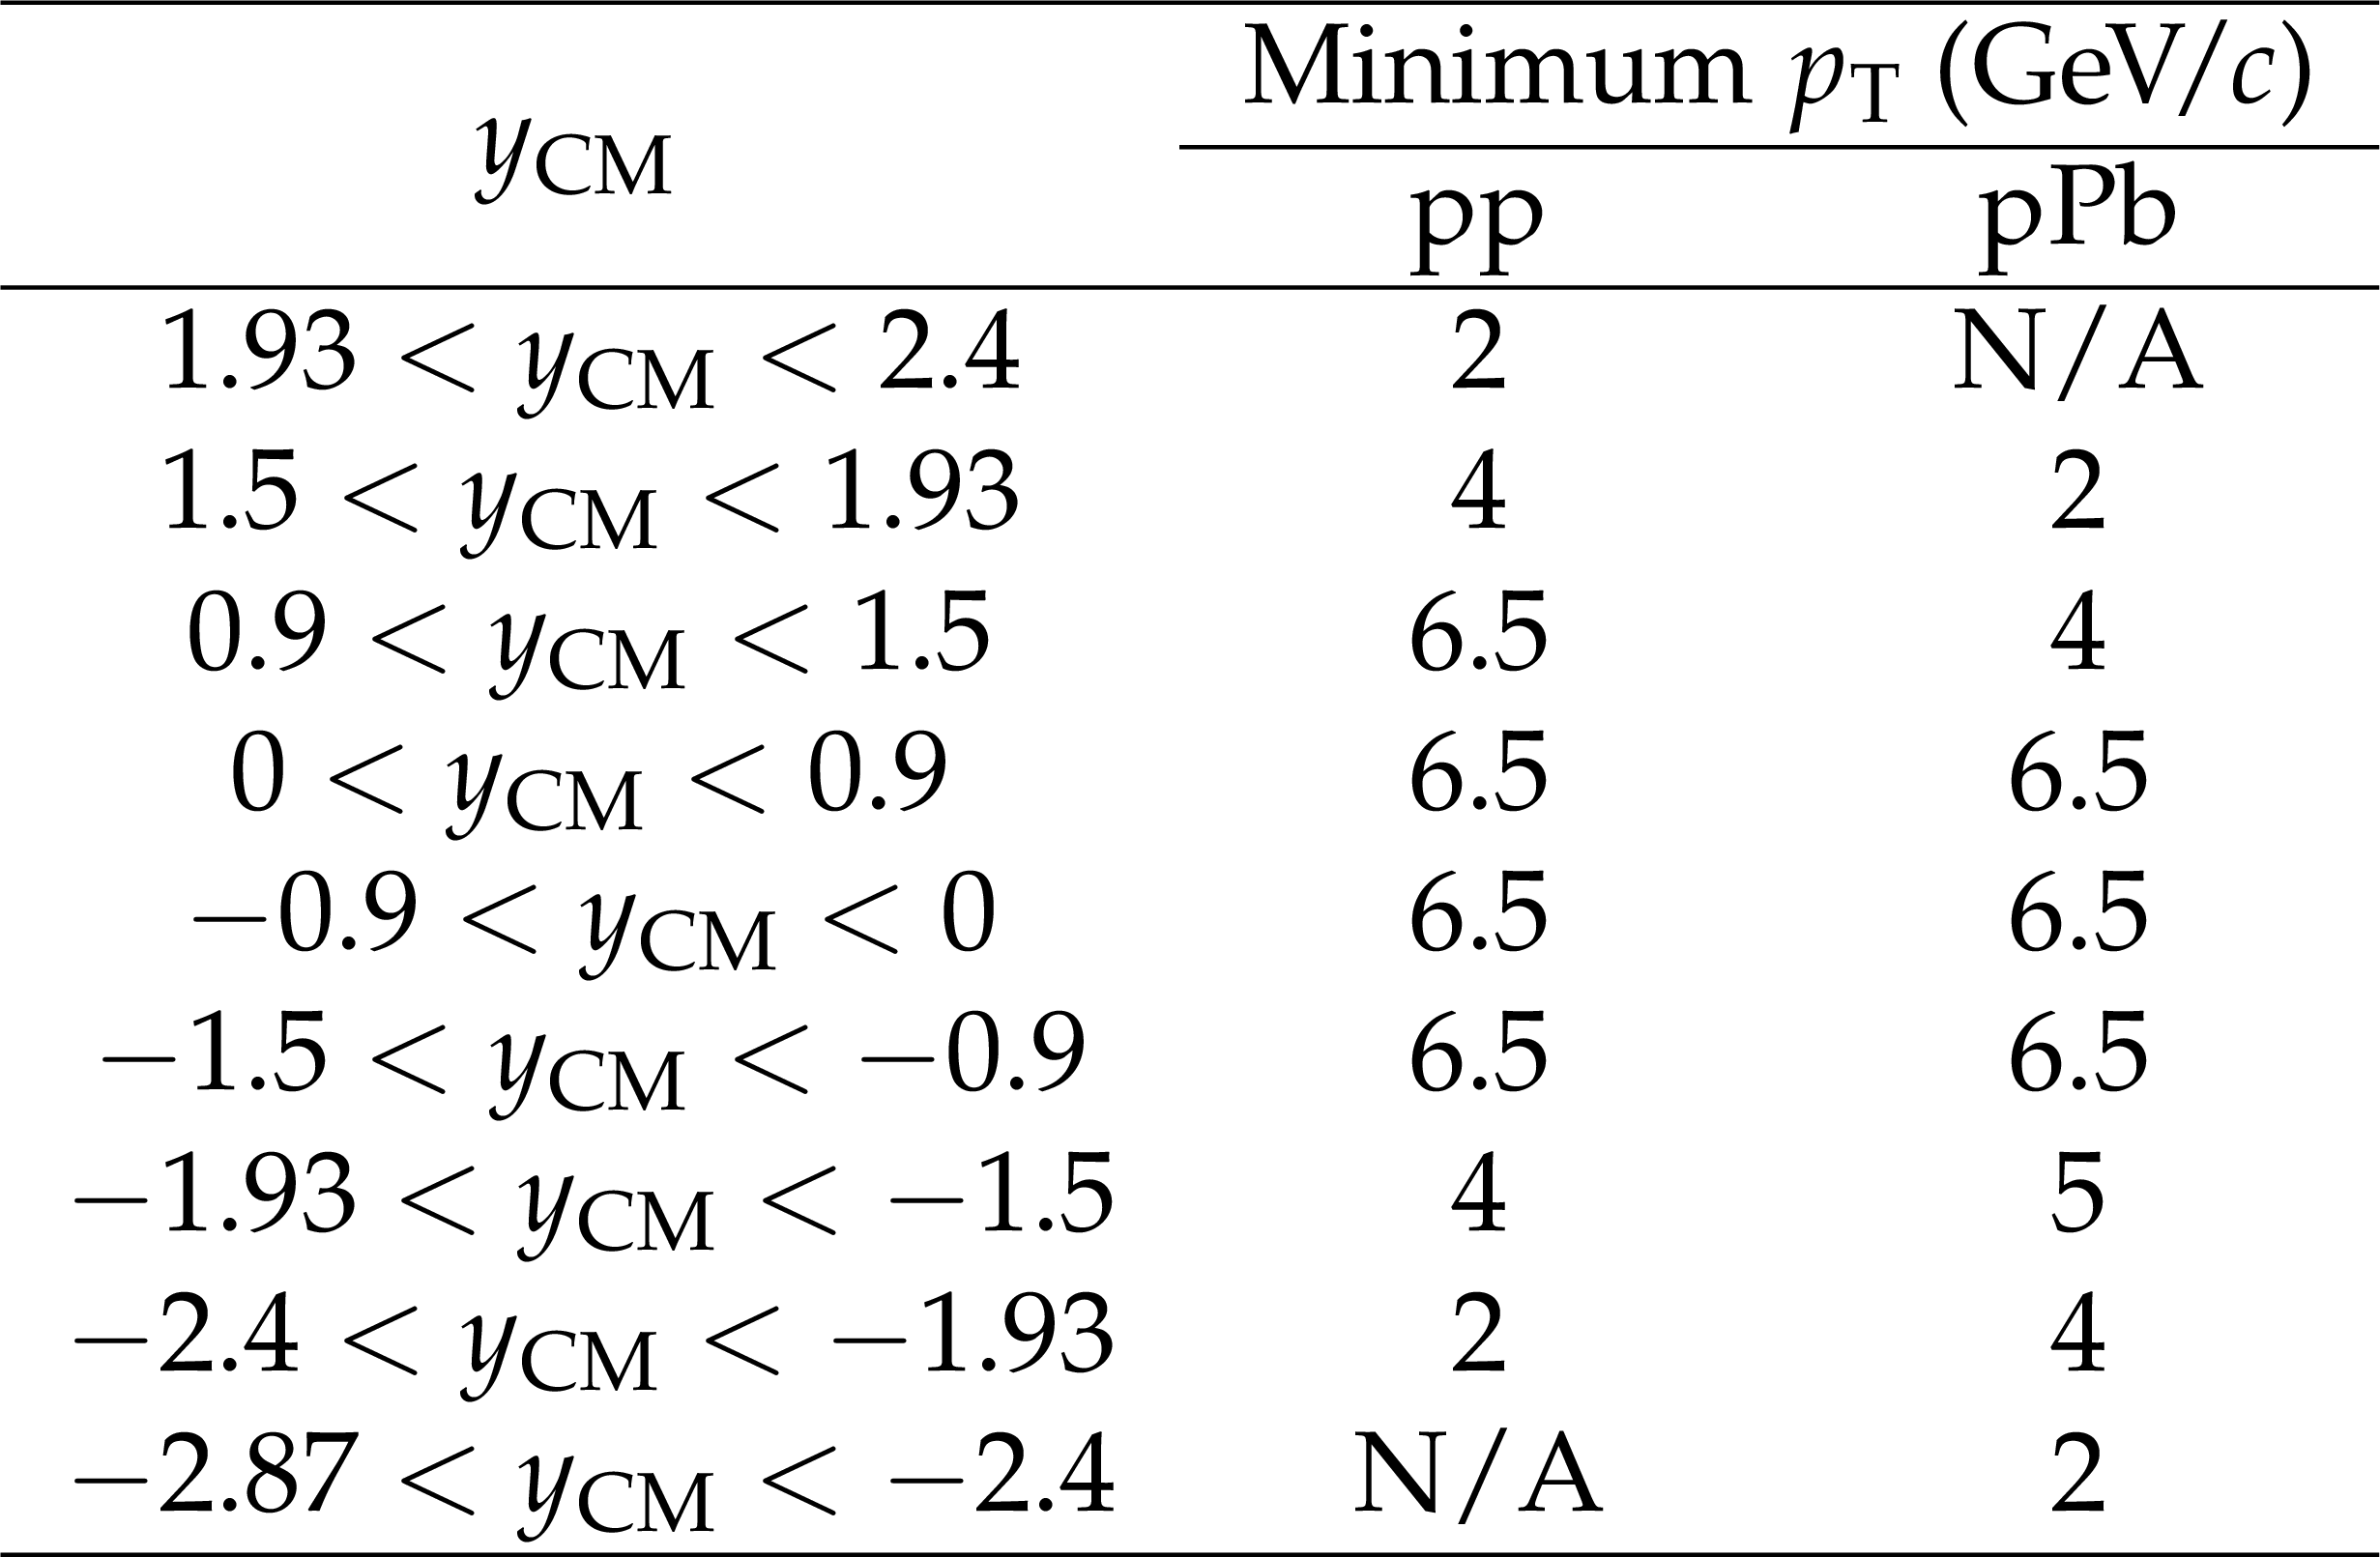
Table 1:
Rapidity intervals and associated minimum $ {p_{\mathrm {T}}} $ values for the $ \mathrm{J} / \psi $ cross section measurements in pp and pPb collisions. |
png pdf |
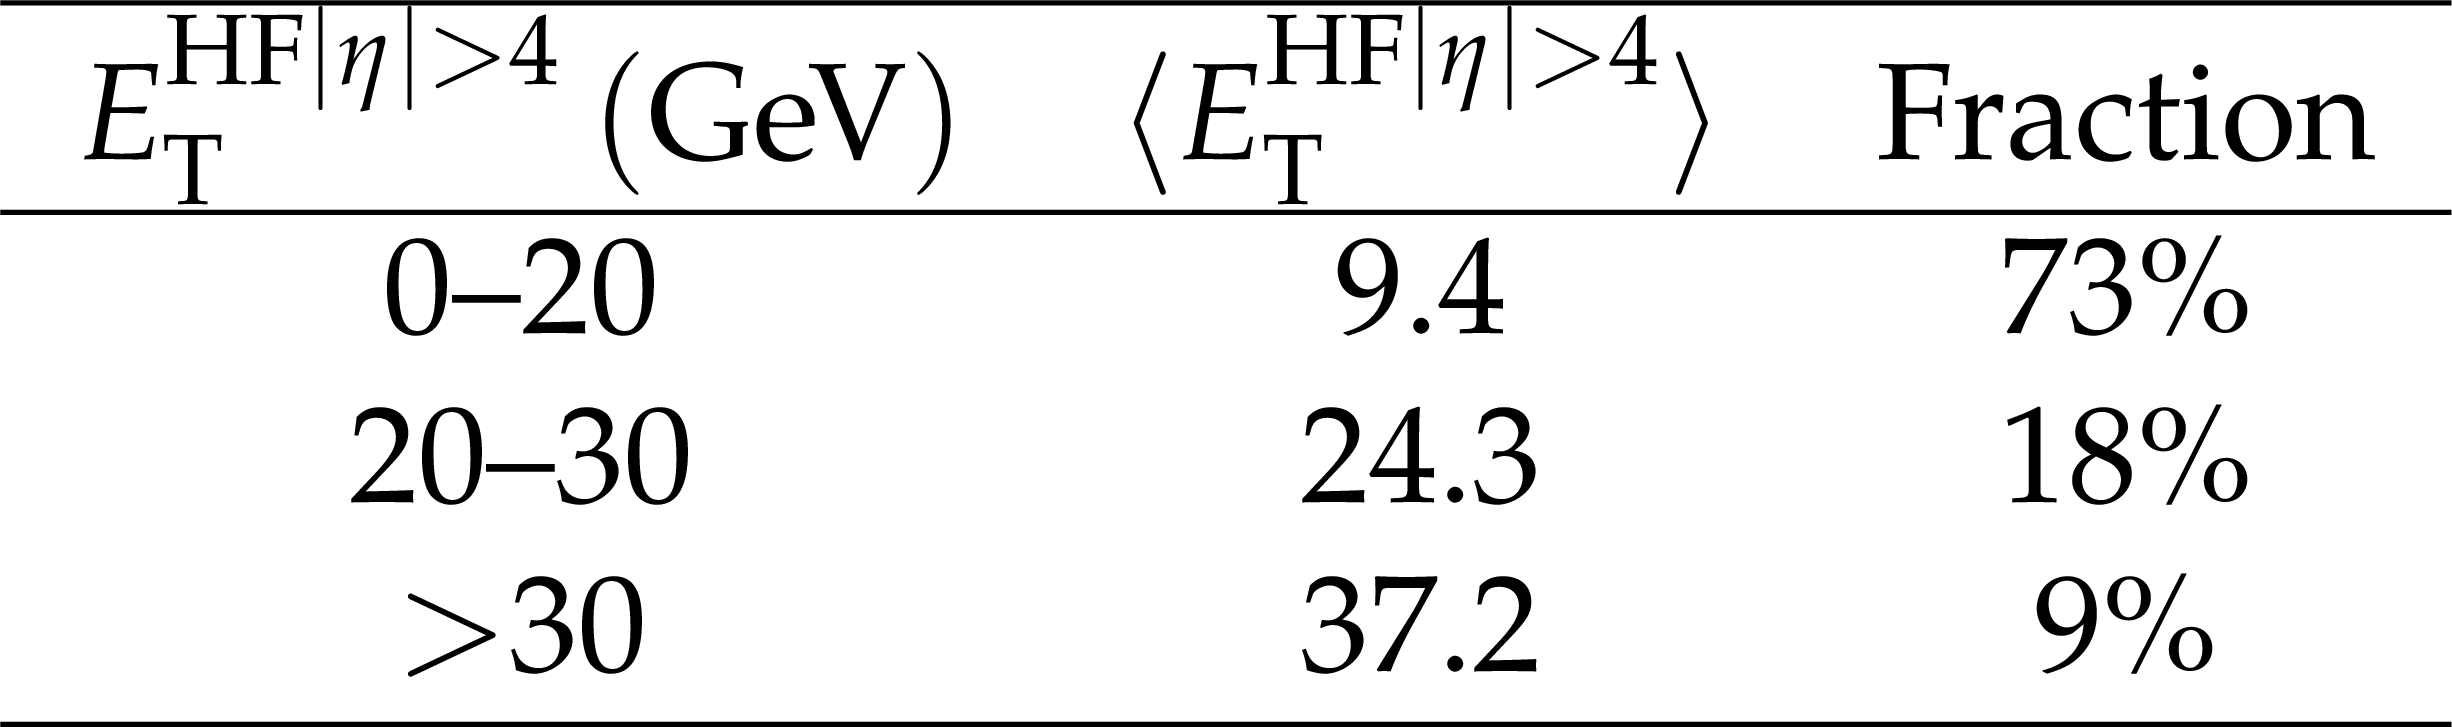
Table 2:
Ranges of forward transverse energy, ${E_{\mathrm {T}}^{{\mathrm {HF}} {| \eta | } > 4}} $, their mean values, and associated fractions of pPb events that fall into each category. |
png pdf |
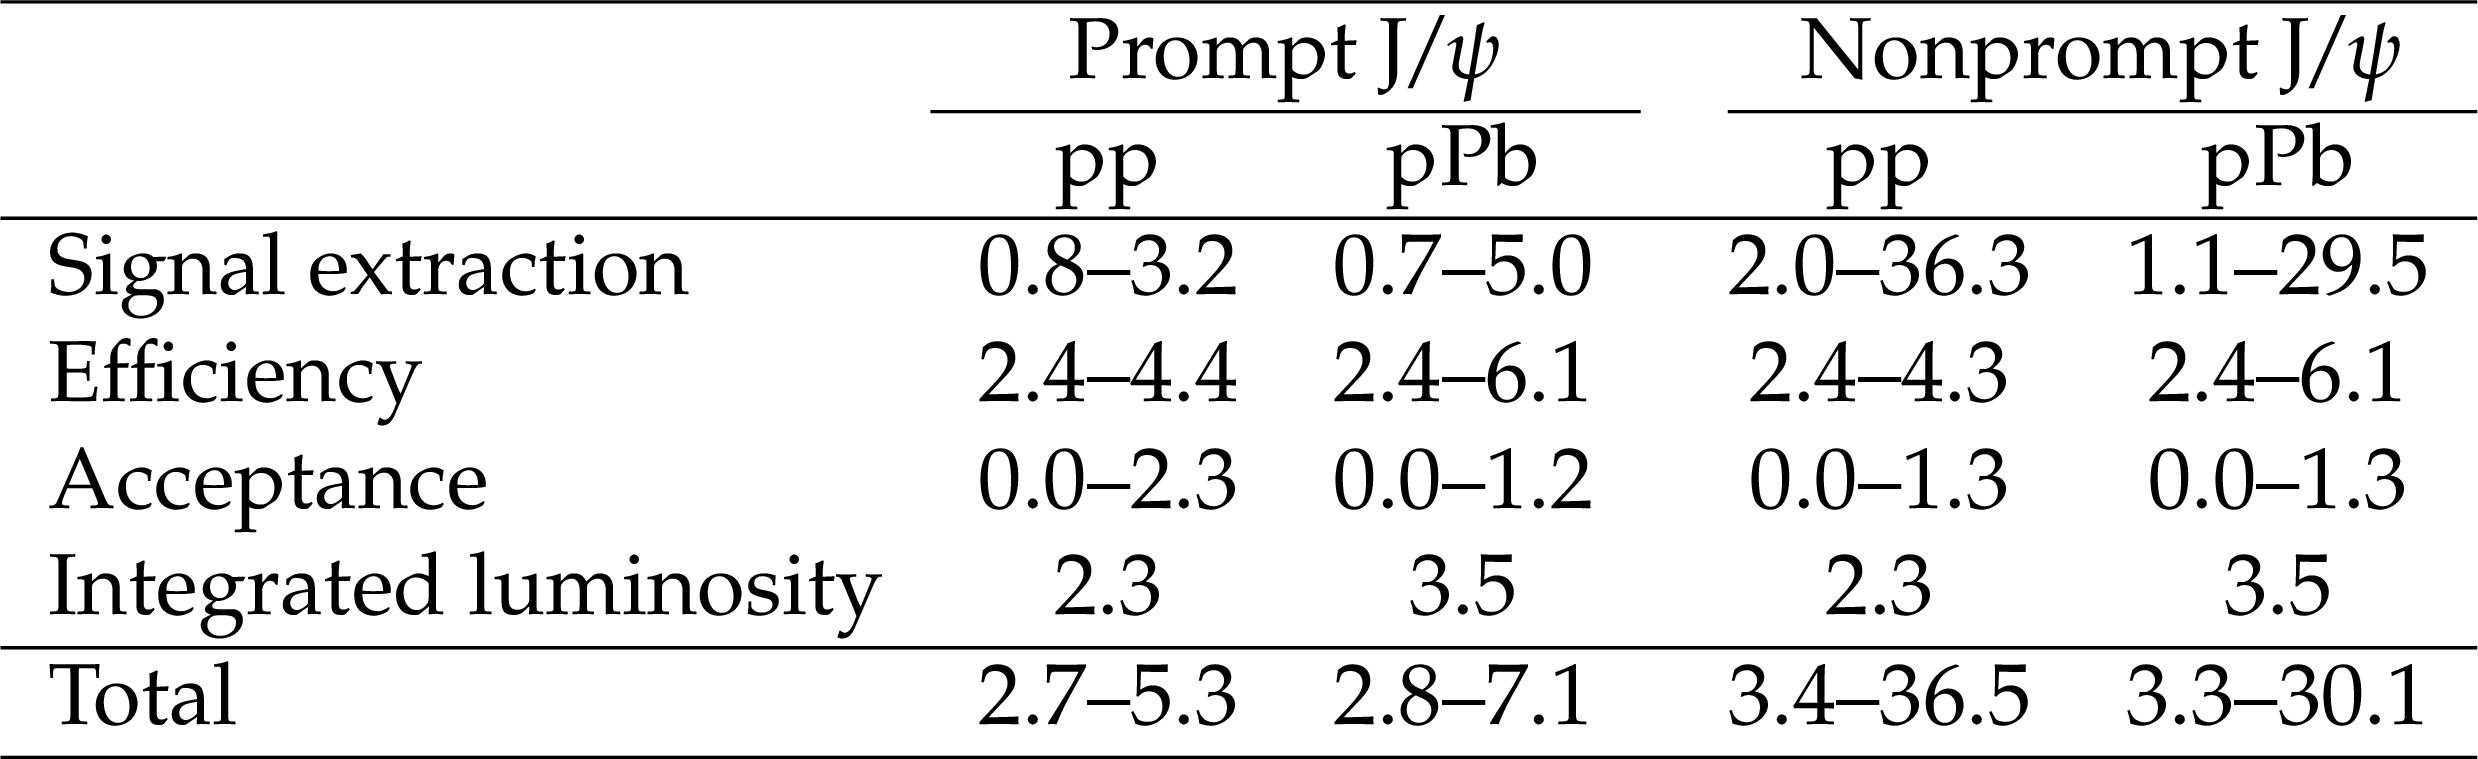
Table 3:
Summary of the relative systematic uncertainties for the cross section measurements, given in percentages, for prompt and nonprompt $ \mathrm{J} / \psi $ mesons in pp and pPb collisions. |
| Summary |
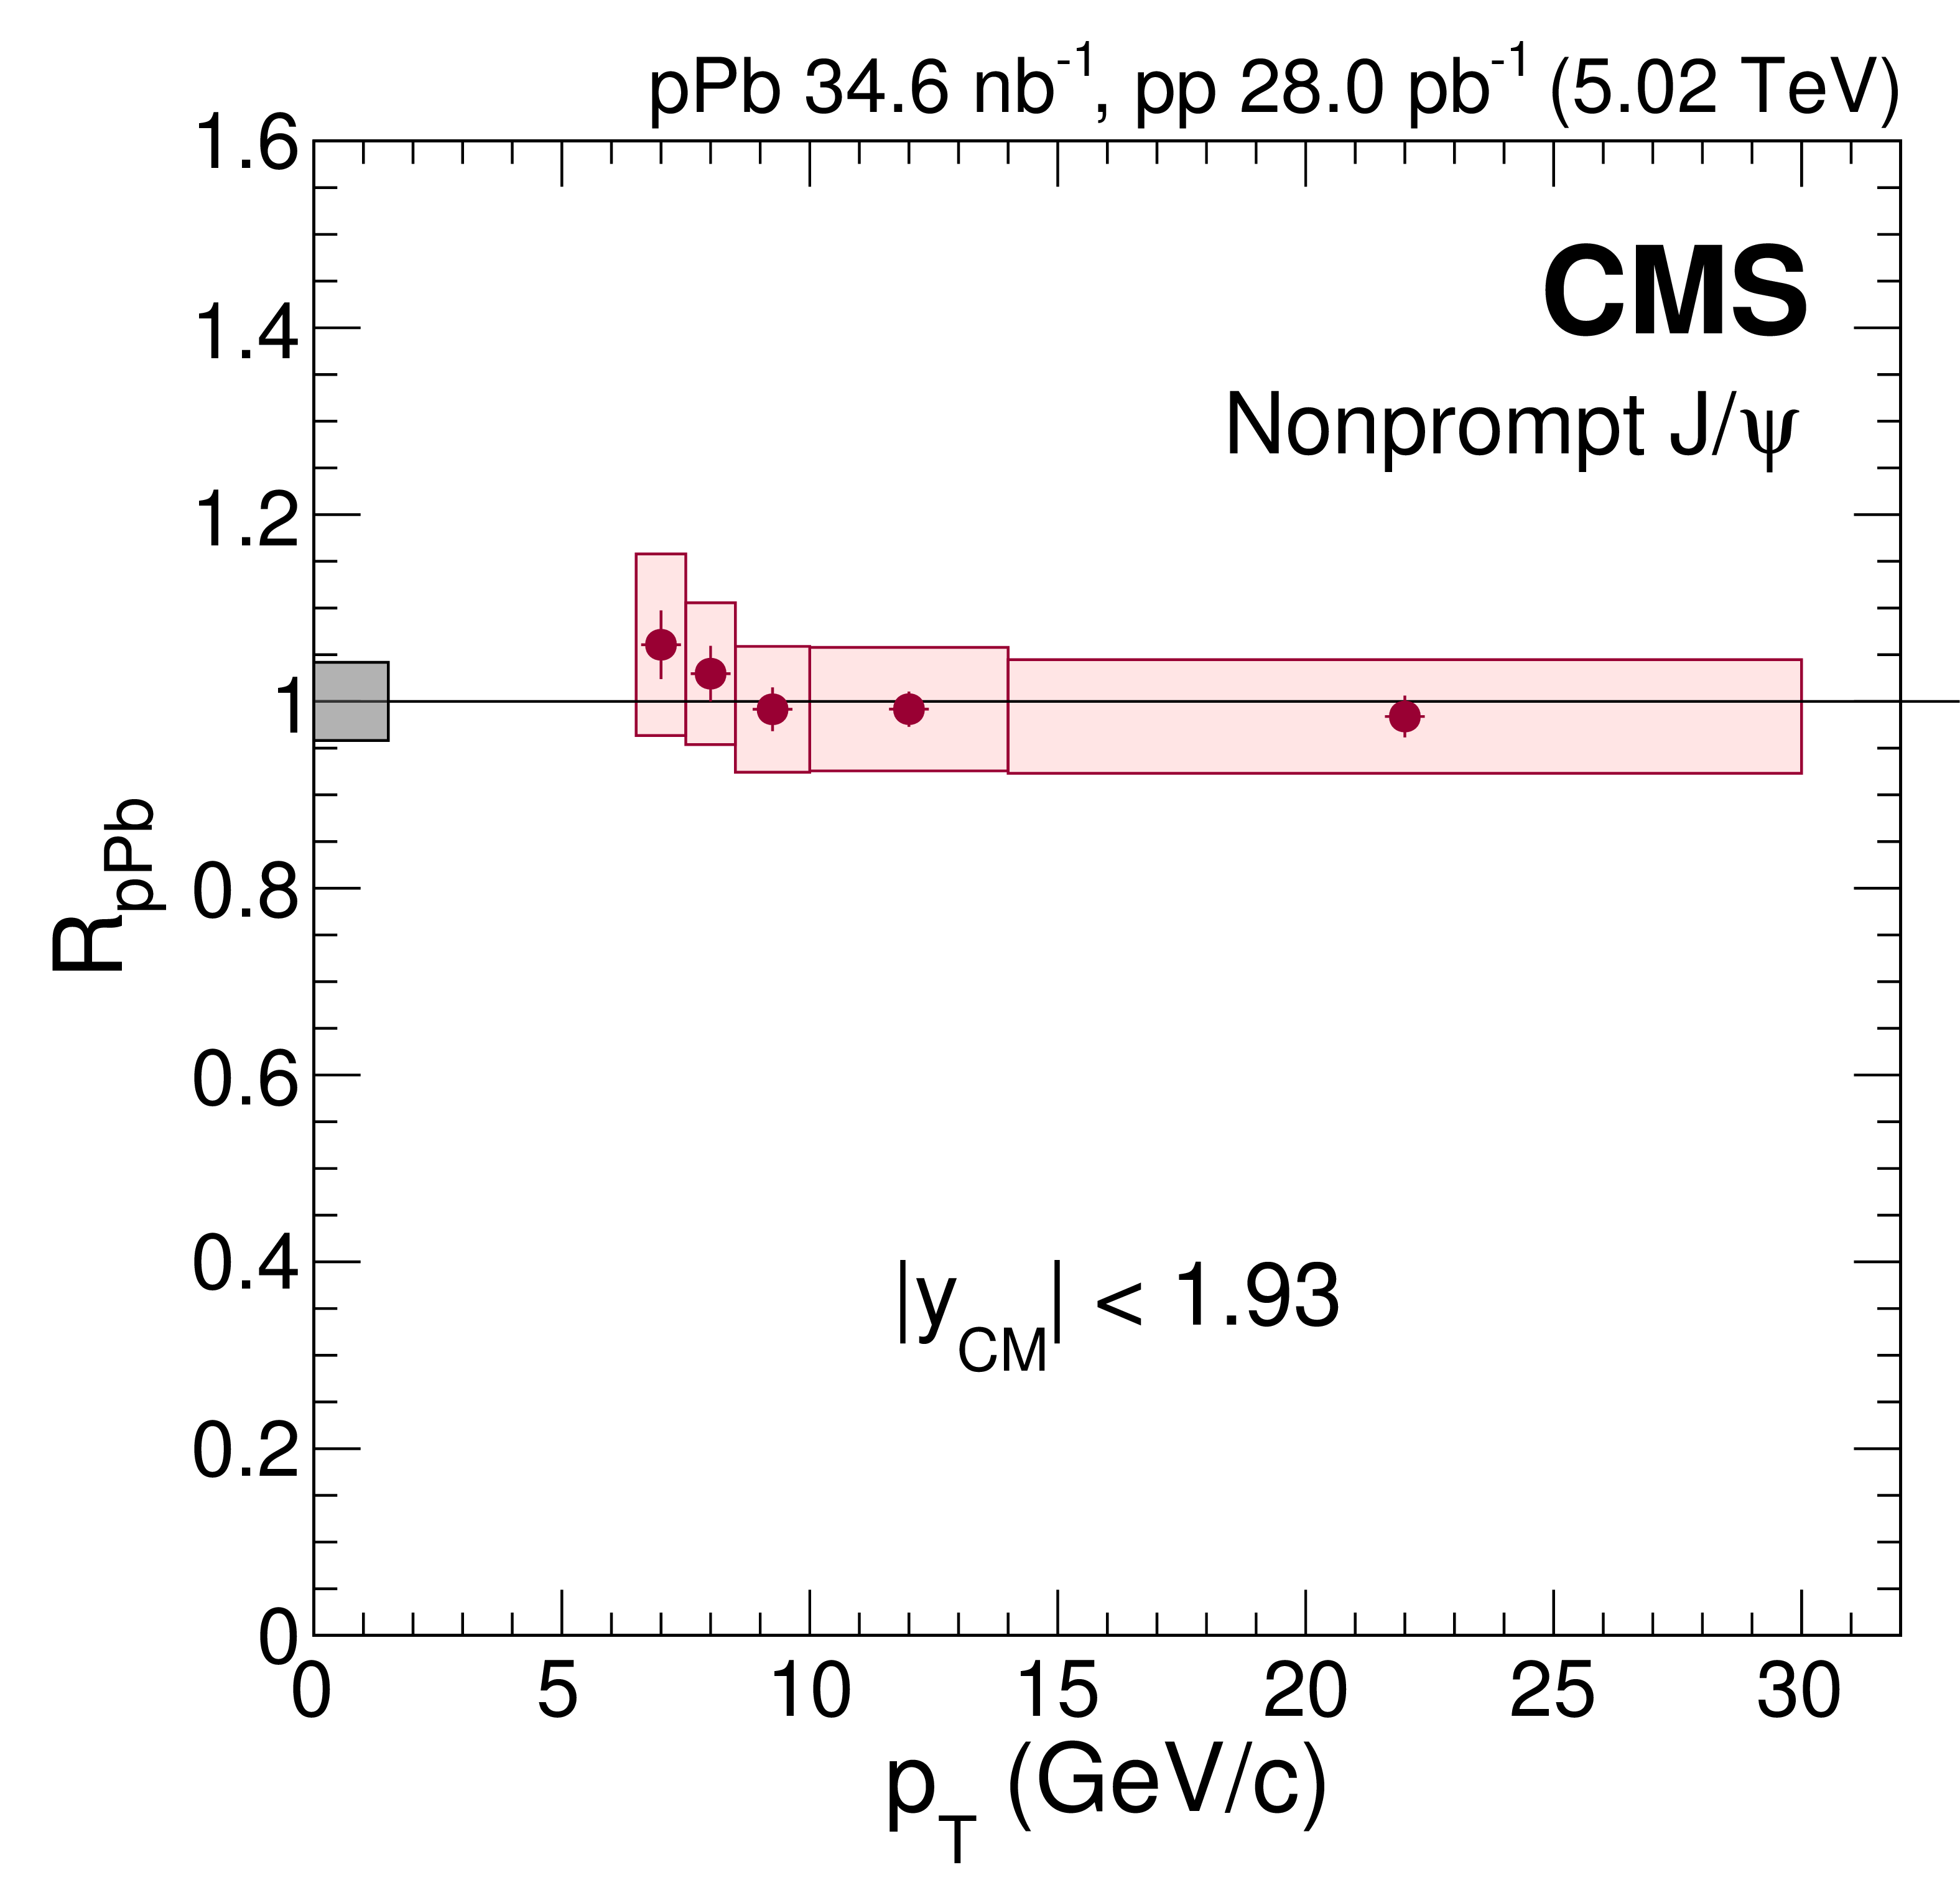
| Proton-proton (pp) and proton-lead (pPb) data at $\sqrt{s_{\mathrm{NN}}} = $ 5.02 TeV collected with the CMS detector are used to investigate the production of prompt and nonprompt $ \mathrm{J} / \psi $ mesons and their possible modifications due to cold nuclear matter effects. Double-differential cross sections, as well as the nuclear modification factor ${R_{\mathrm{ p }\mathrm{Pb}}}$ and forward-to-backward production ratio ${R_{\mathrm{FB}}} $, are reported as functions of the $ \mathrm{J} / \psi $ $ p_{\mathrm{T}} $ and $ {y_{\mathrm{CM}}} $. The ${R_{\mathrm{ p }\mathrm{Pb}}}$ values for prompt $ \mathrm{J} / \psi $ mesons are above unity in mid- and backward $ {y_{\mathrm{CM}}} $ intervals analyzed ($-2.4<{y_{\mathrm{CM}}} <0.9$), with a possible depletion in the most forward bin at low $p_{\mathrm{T}} \lesssim $ 7.5 GeV/$c$. In the case of nonprompt $ \mathrm{J} / \psi $ meson production, ${R_{\mathrm{ p }\mathrm{Pb}}}$ is compatible with unity in all $ {y_{\mathrm{CM}}} $ bins. The prompt $ \mathrm{J} / \psi $ ${R_{\mathrm{FB}}}$ is below unity for $p_{\mathrm{T}}\lesssim $ 7.5 GeV/$c$ and forward $| {{y_{\mathrm{CM}}} }| > $ 0.9, but is consistent with unity for $p_{\mathrm{T}} \gtrsim $ 10 GeV/$c$. For nonprompt $ \mathrm{J} / \psi $ mesons, ${R_{\mathrm{FB}}}$ tends to be below unity at $p_{\mathrm{T}} \lesssim $ 7.5 GeV/$c$ and increases for higher $ p_{\mathrm{T}} $, but with slightly larger uncertainties. The dependence of ${R_{\mathrm{FB}}}$ on the hadronic activity in pPb events has been studied through the variable ${E_{\mathrm{T}}^{{\mathrm{HF}}| {\eta} | > 4}} $, characterizing the transverse energy deposited in the CMS detector at large pseudorapidities 4 $ < | {\eta} | < $ 5.2. The ${R_{\mathrm{FB}}}$ ratio is observed to decrease with increasing event activity for both prompt and nonprompt $ \mathrm{J} / \psi $ mesons, indicating enhanced nuclear matter effects for increasingly central pPb collisions. A depletion of prompt $ \mathrm{J} / \psi $ mesons in pPb collisions (as compared to pp collisions) is expected in the forward $ {y_{\mathrm{CM}}} $ region because of the shadowing of nuclear parton distributions and/or coherent energy loss effects. Such a suppression is seen in the present data at ${y_{\mathrm{CM}}} > $ 1.5 and $p_{\mathrm{T}} \lesssim $ 7.5 GeV/$c$, but not at larger $ p_{\mathrm{T}} $, consistent with the expected reduced impact of nuclear parton distributions and coherent energy loss effects for increasing $ \mathrm{J} / \psi $ $ p_{\mathrm{T}} $. At negative $ {y_{\mathrm{CM}}} $, both shadowing and energy loss effects are known to lead to small nuclear modifications, as confirmed by the present measurements. Such processes are also expected to affect the nuclear dependence of B meson production and thereby, through its decays, the nonprompt $ \mathrm{J} / \psi $ production. The measurements presented here provide new constraints on cold nuclear matter effects on prompt and nonprompt $ \mathrm{J} / \psi $ production over a wide kinematic range. |
| Additional Figures | |

png pdf |
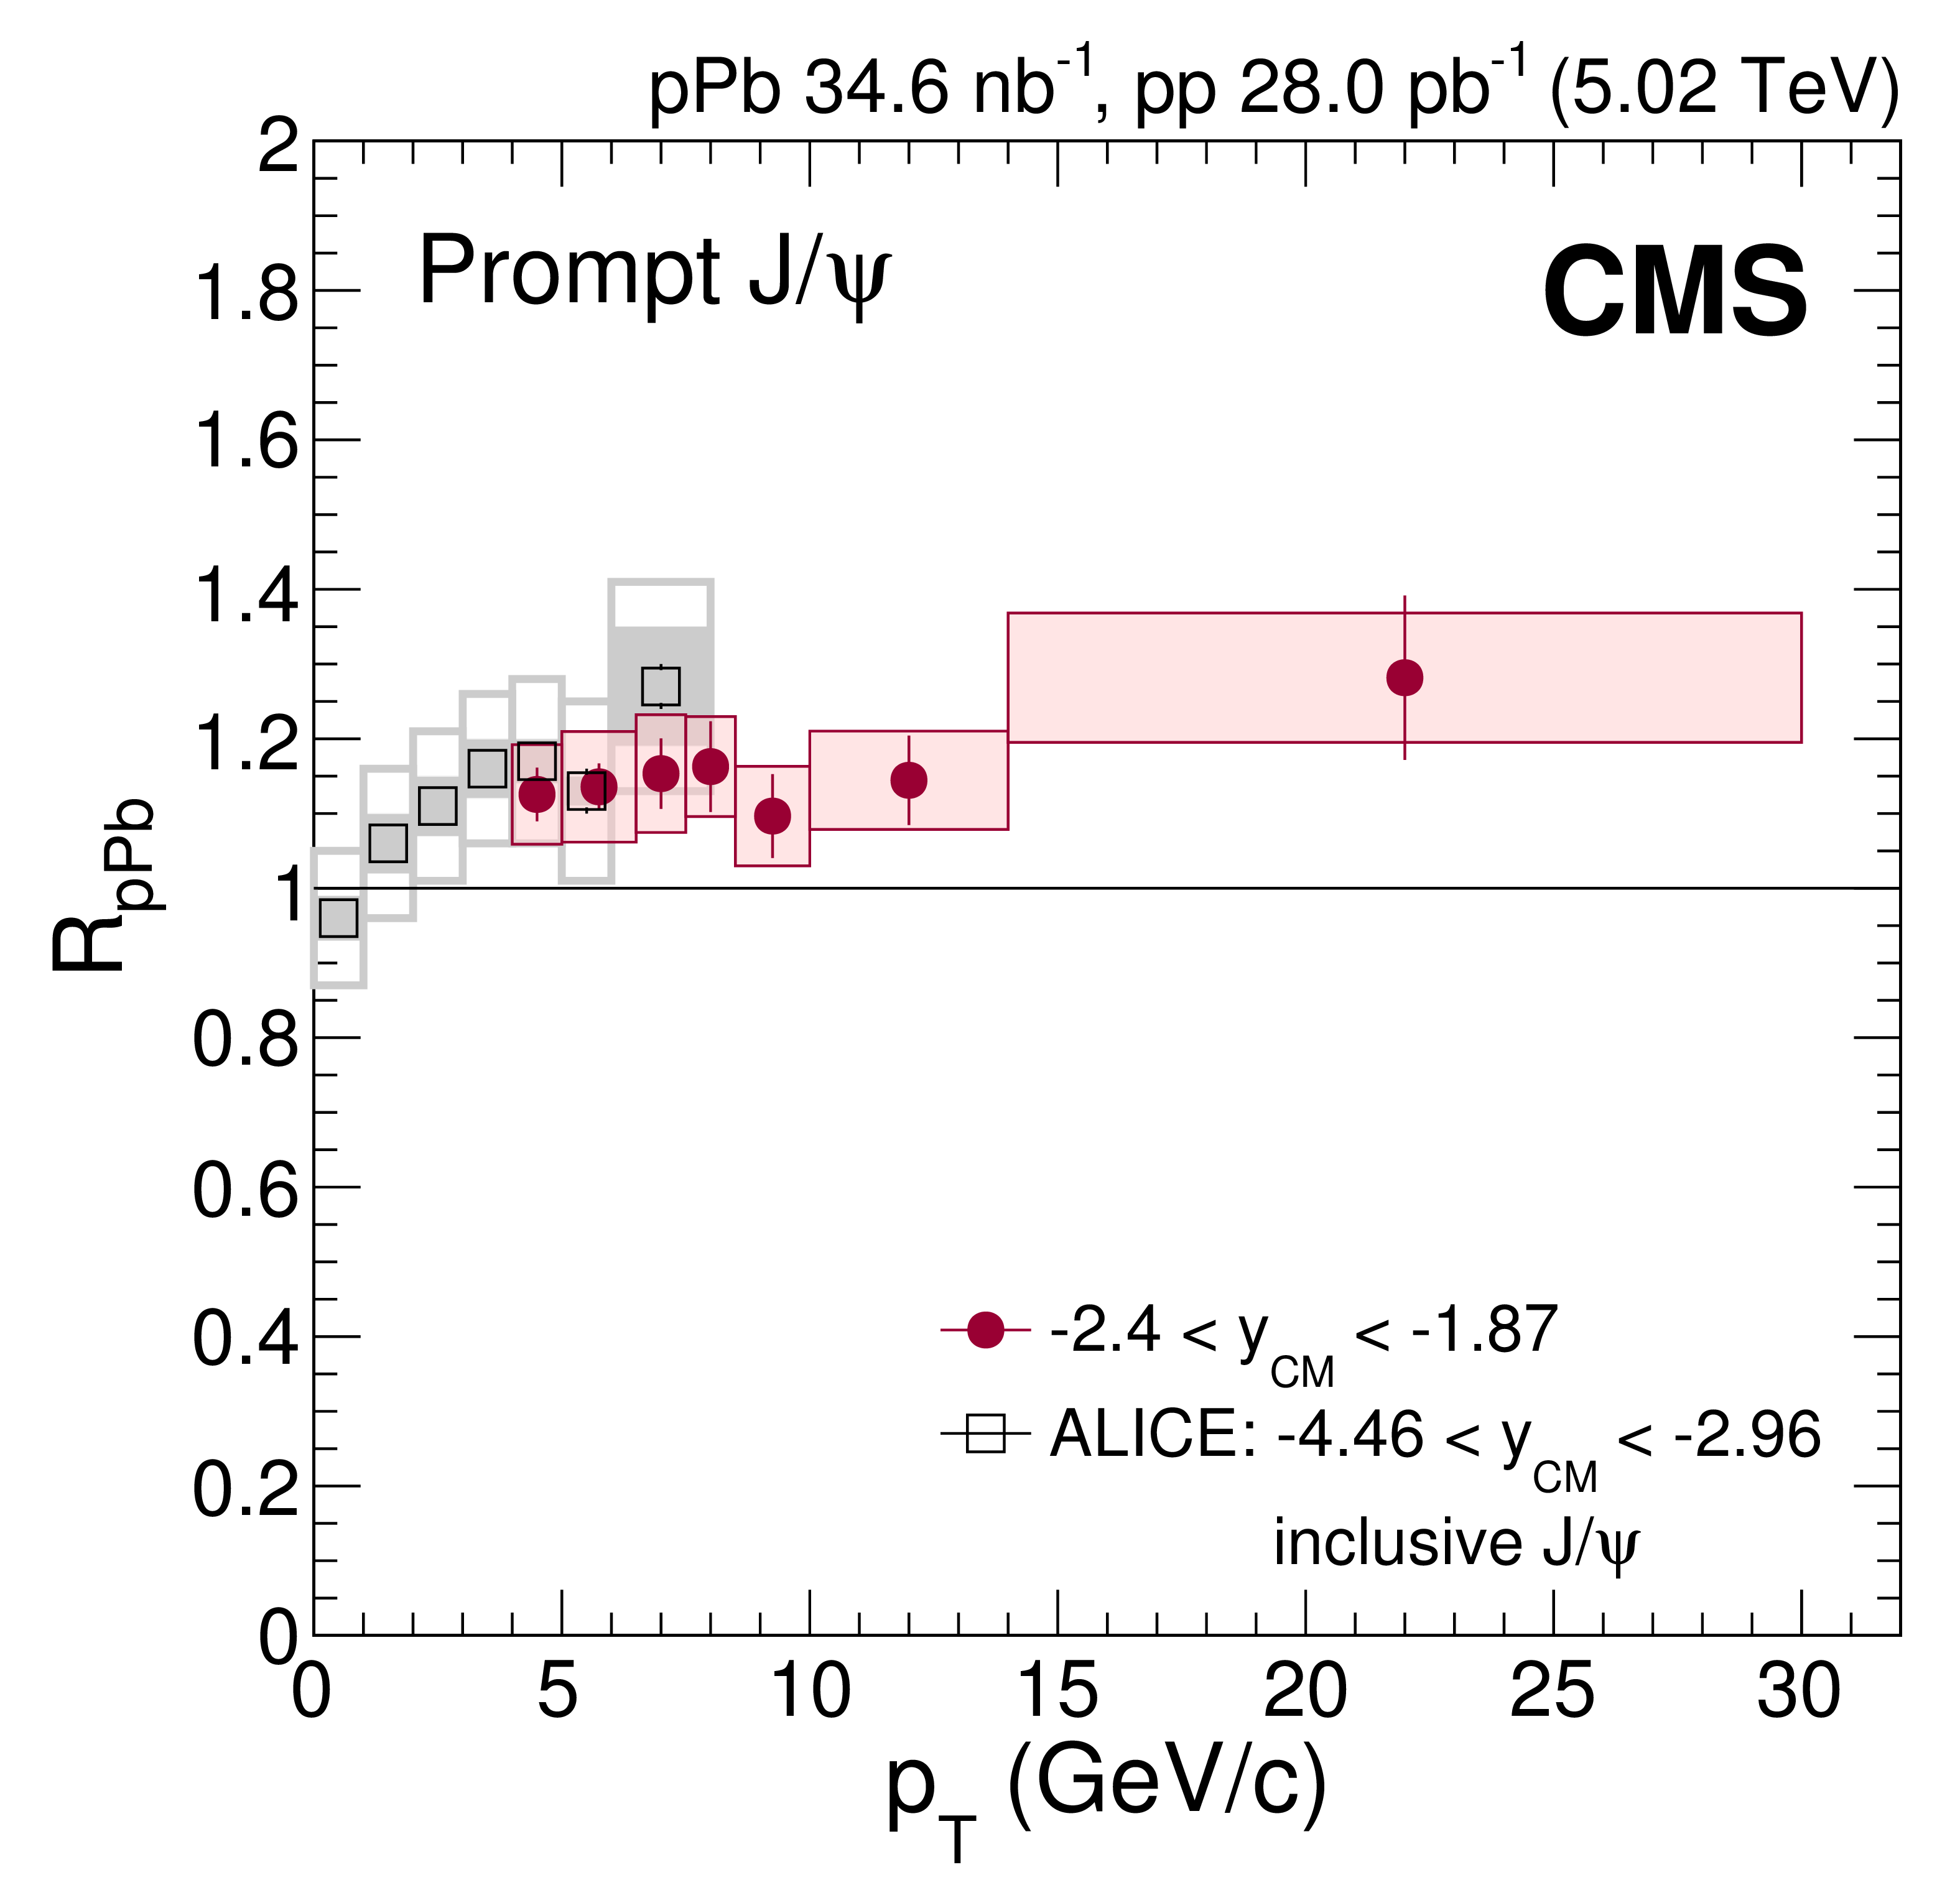
Additional Figure 1:
$R_{\text {pPb}}$ vs. transverse momentum for $\mathrm{J}/\psi $ mesons measured in the forward rapidity region by the CMS (filled circles) and ALICE (open squares) [1] collaborations. The vertical bars represent the statistical uncertainties and the shaded boxes show the systematic uncertainties. The fully correlated global uncertainties, 4% for the CMS and 6% for the ALICE results, are not included in the point-by-point uncertainties. |
png pdf |
Additional Figure 2:
$R_{\text {pPb}}$ vs. transverse momentum for $\mathrm{J}/\psi $ mesons measured in the backward rapidity region by the CMS (filled circles) and ALICE (open squares) [1] collaborations. The vertical bars represent the statistical uncertainties and the shaded boxes show the systematic uncertainties. The fully correlated global uncertainties, 4% for the CMS and 6% for the ALICE results, are not included in the point-by-point uncertainties. |
png pdf |
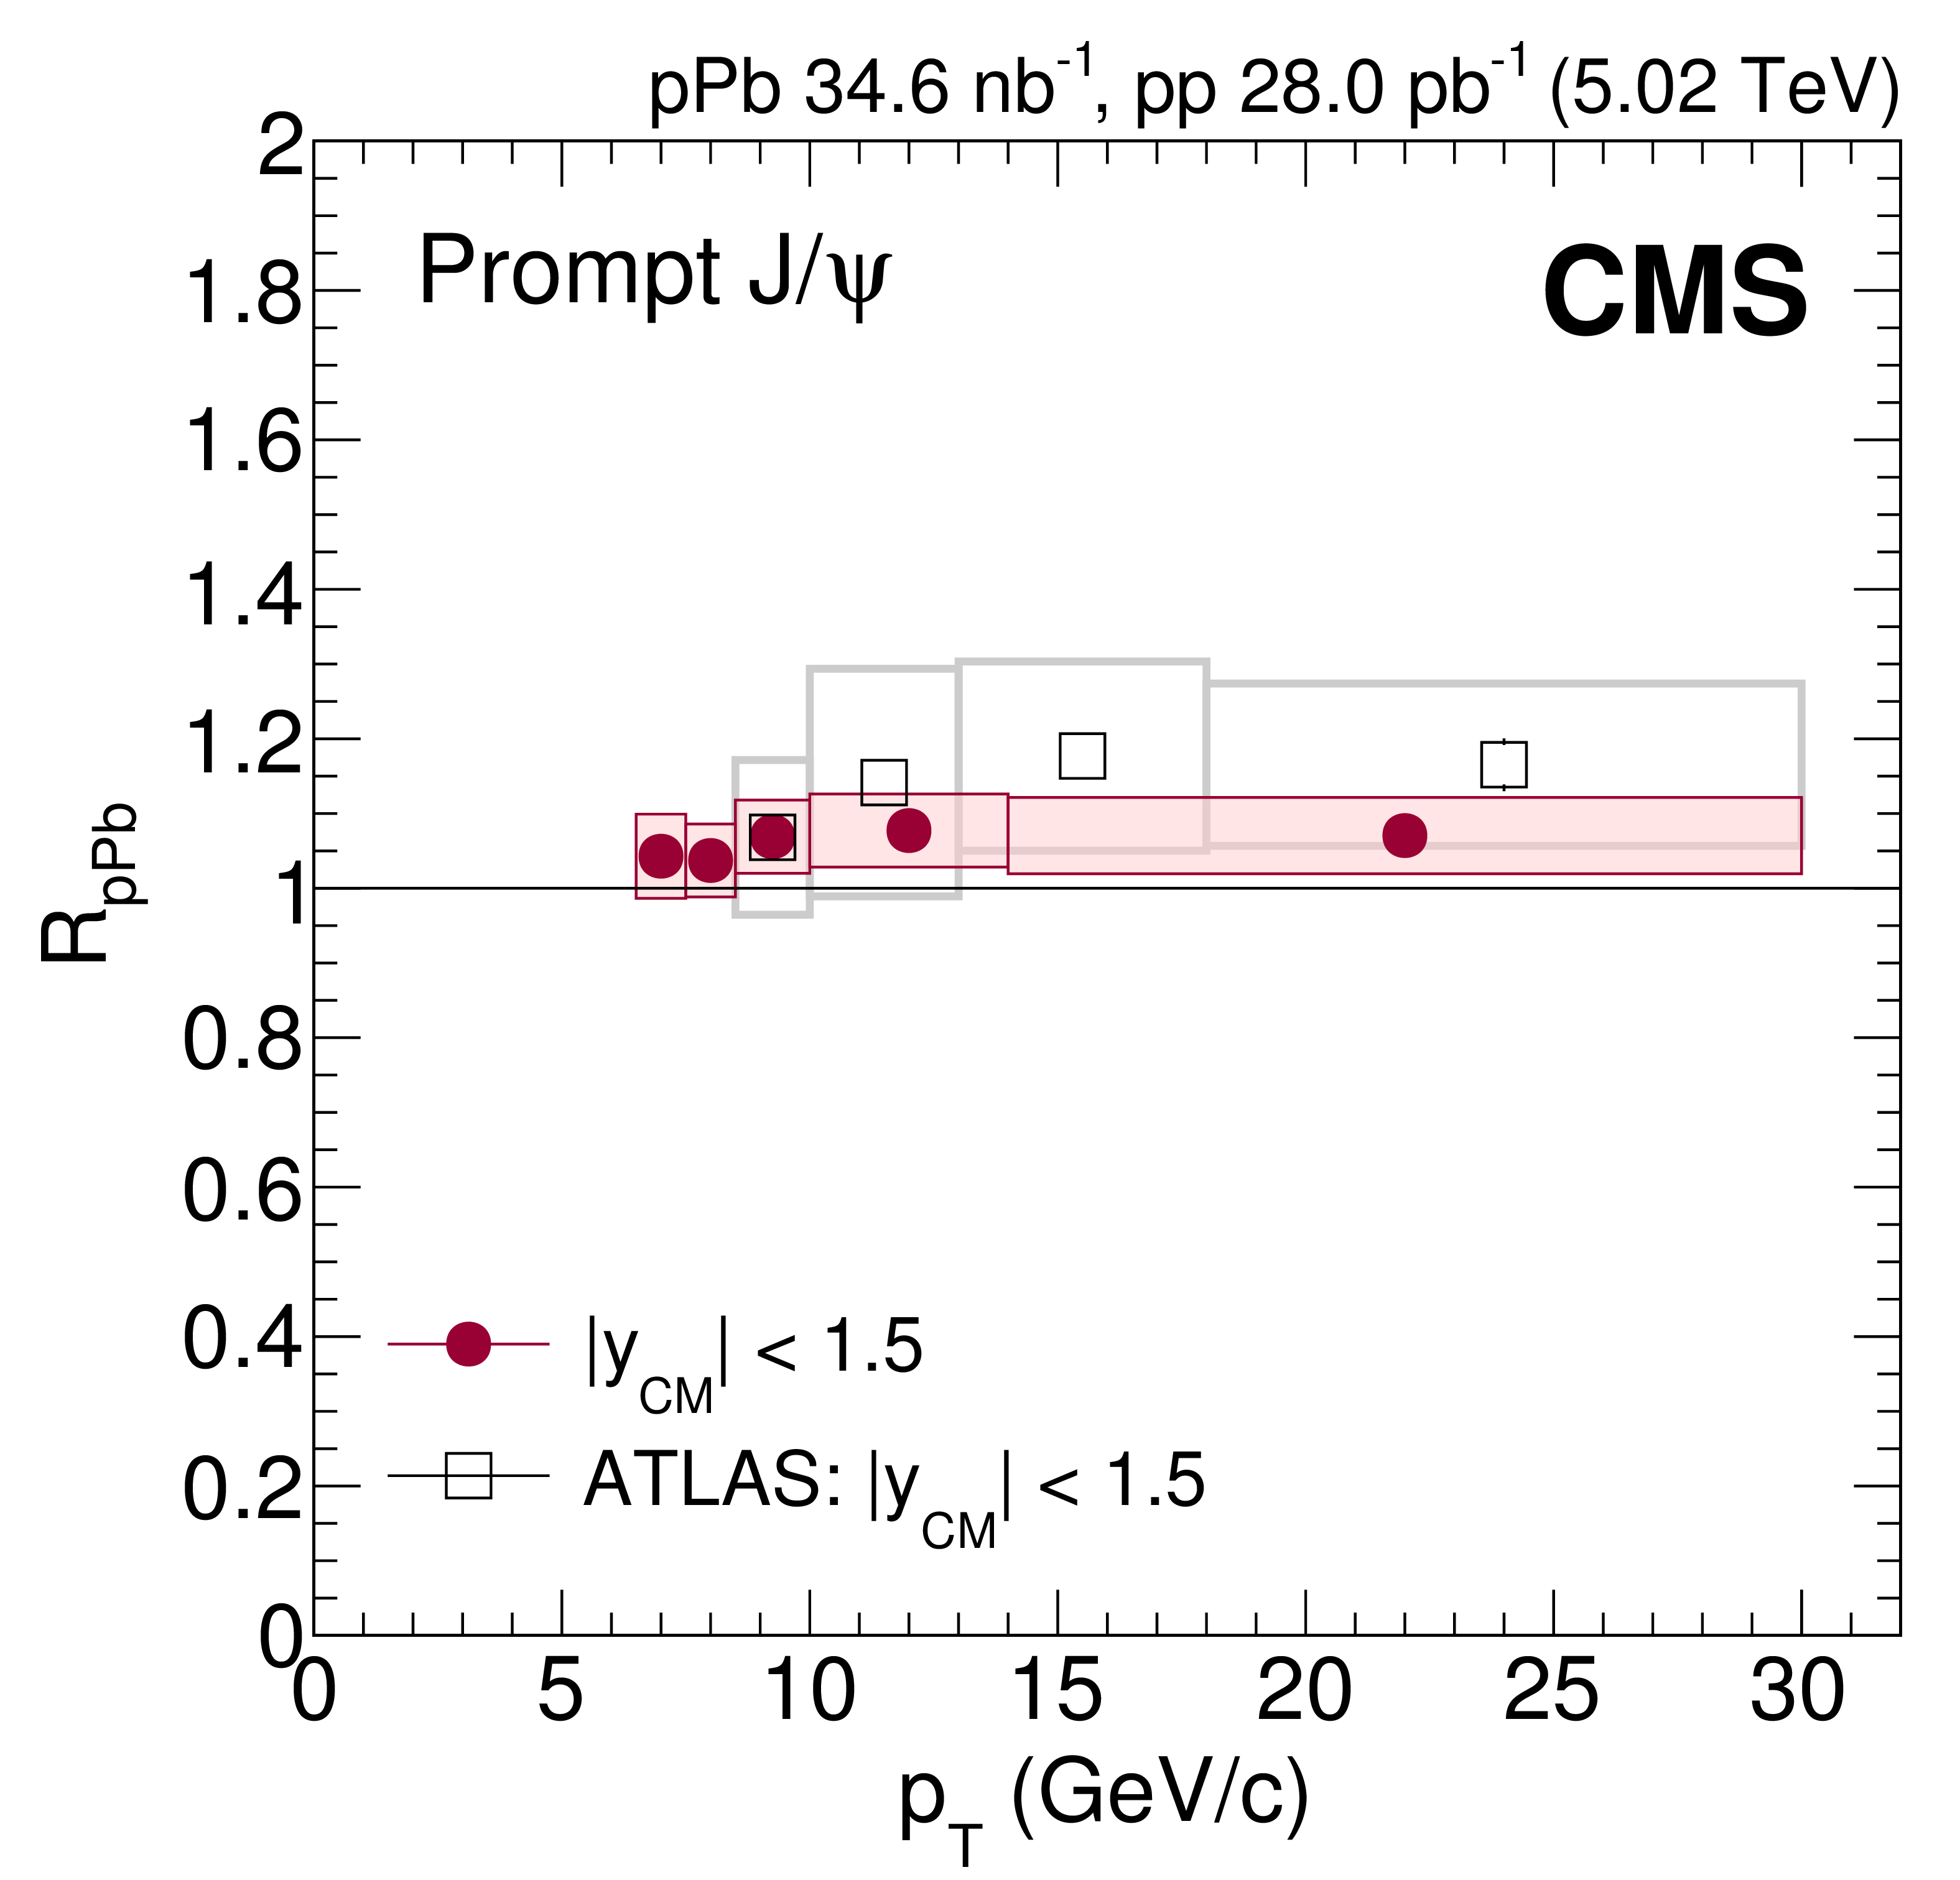
Additional Figure 3:
$R_{\text {pPb}}$ vs. transverse momentum for prompt $\mathrm{J}/\psi $ mesons measured by the CMS (filled circles) and ATLAS (open squares) [2] collaborations. The vertical bars represent the statistical uncertainties and the shaded boxes show the systematic uncertainties. The fully correlated global uncertainties of 4.2% for the CMS results is not included in the point-by-point uncertainties. |
png pdf |
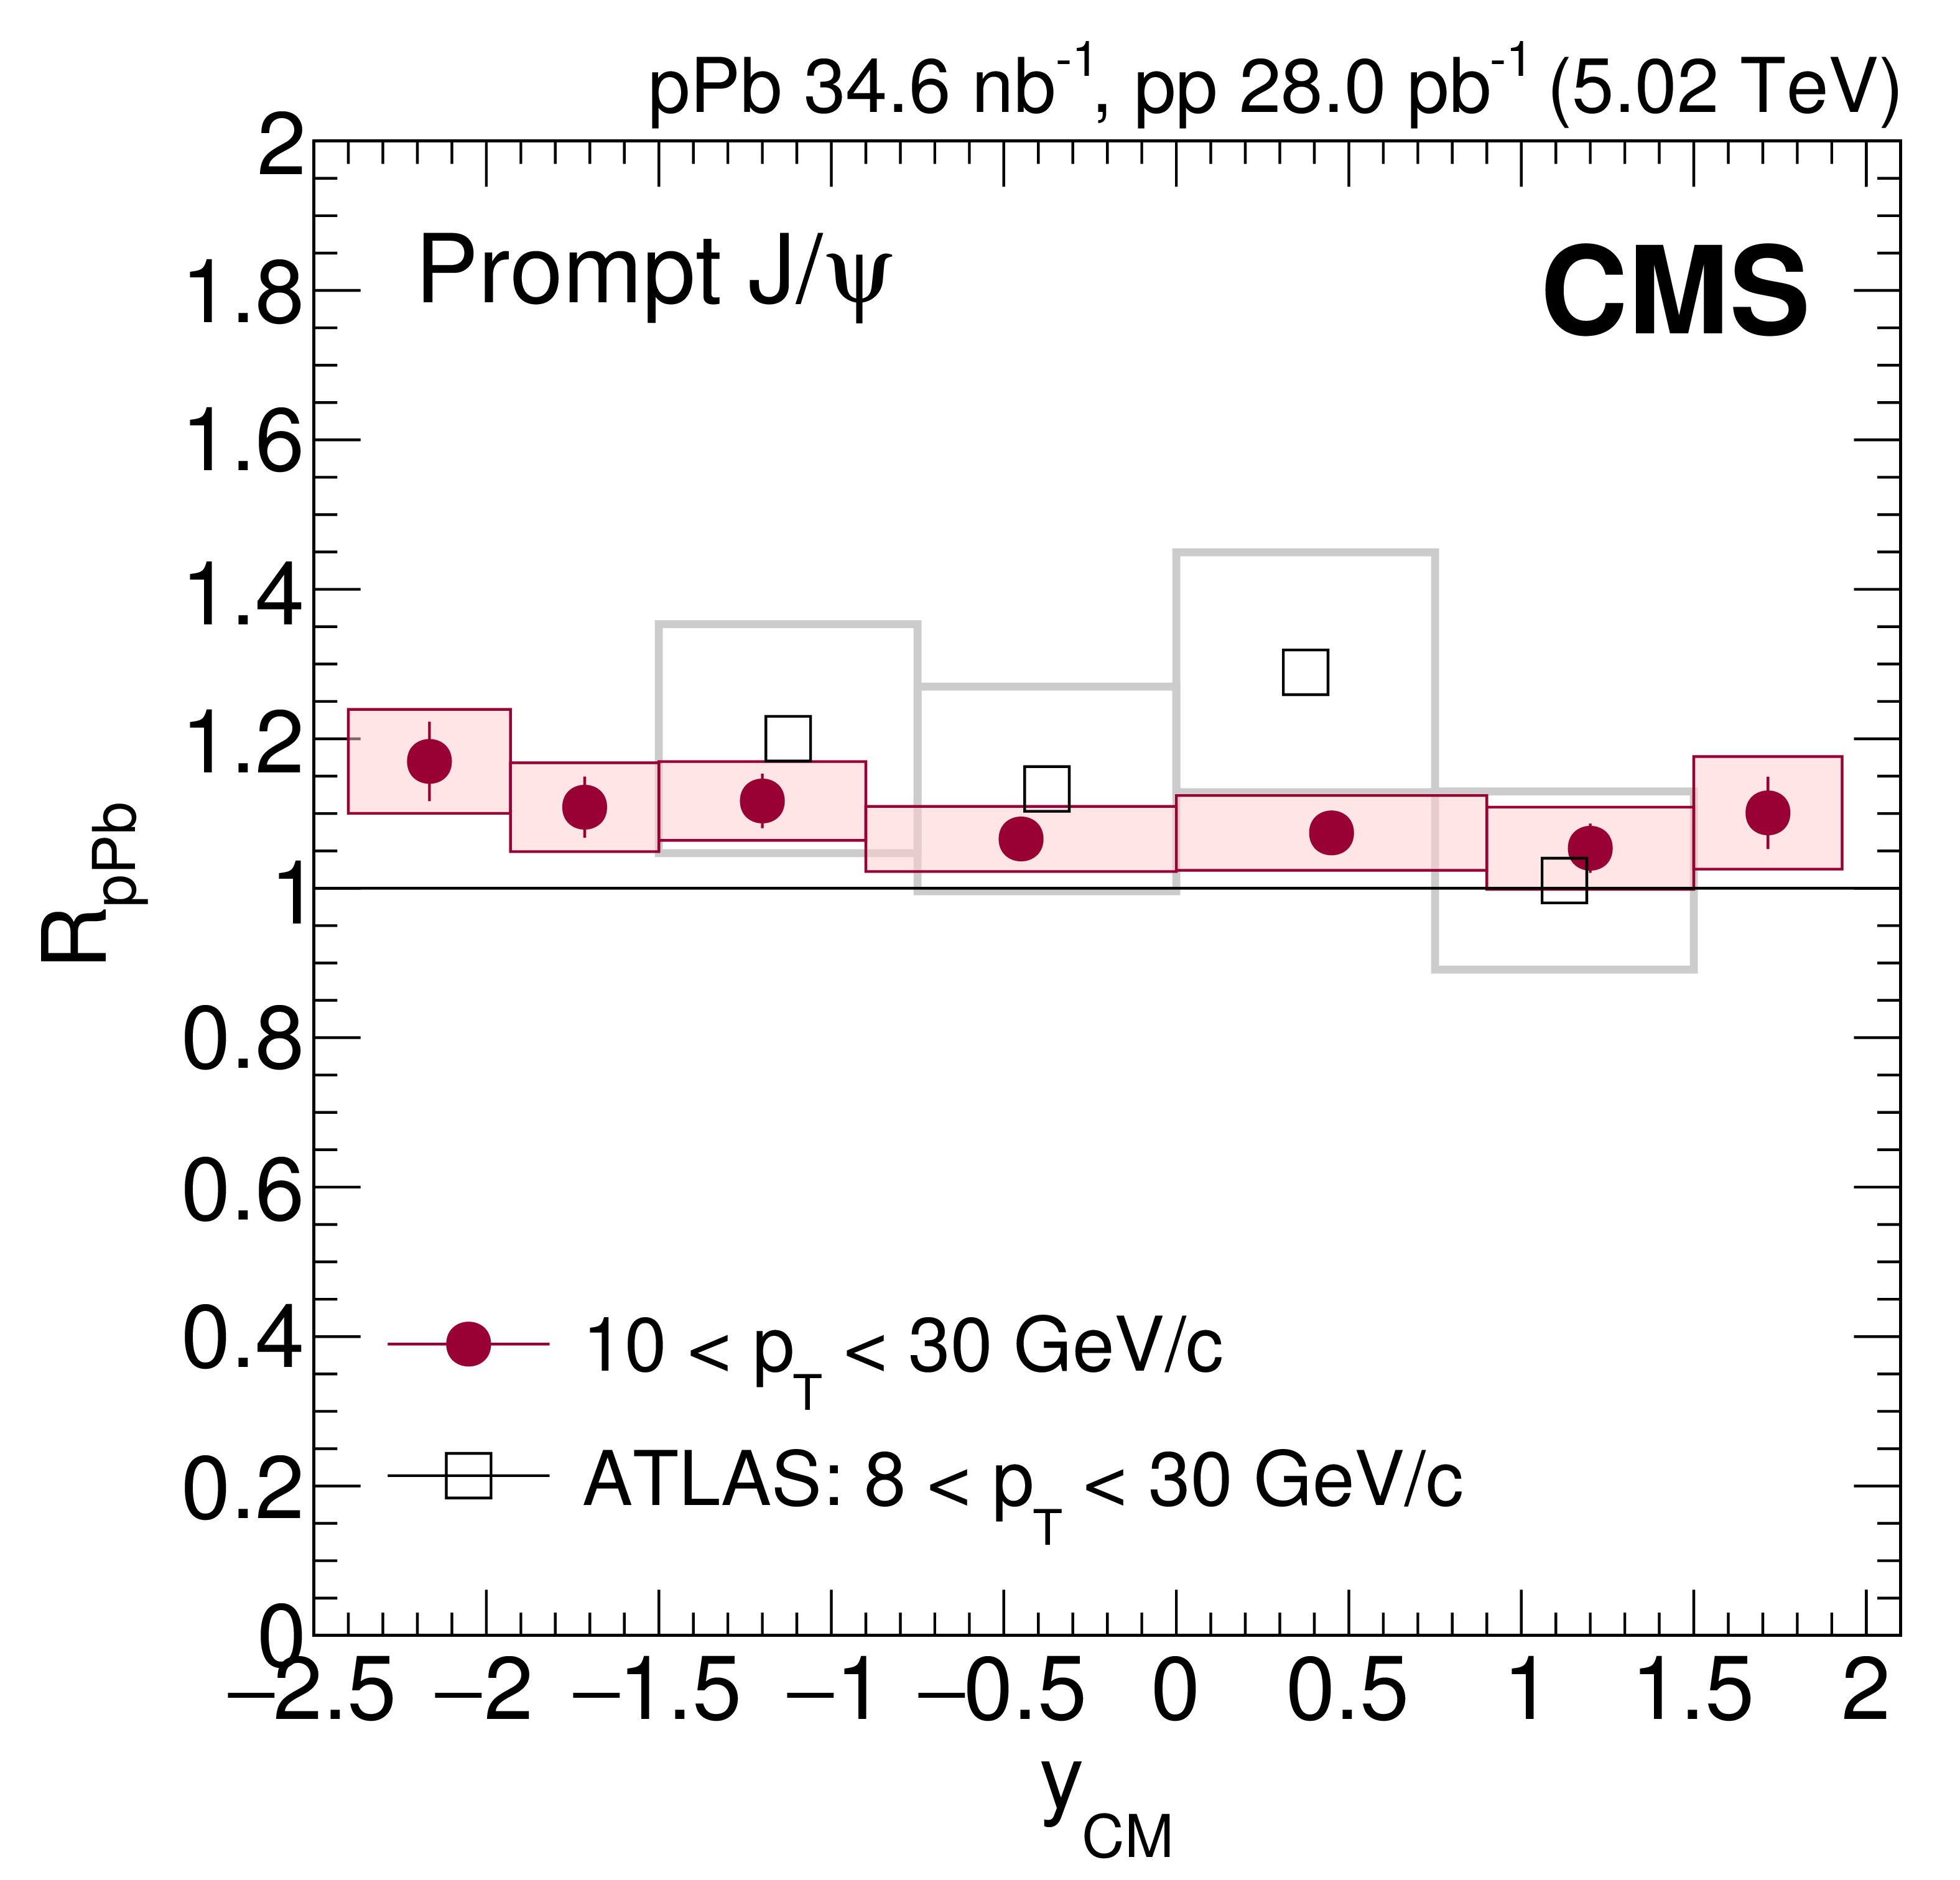
Additional Figure 4:
$R_{\text {pPb}}$ vs. rapidity for prompt $\mathrm{J}/\psi $ mesons measured by the CMS (filled circles) and ATLAS (open squares) [2] collaborations. The vertical bars represent the statistical uncertainties and the shaded boxes show the systematic uncertainties. The fully correlated global uncertainties of 4.2% for the CMS results is not included in the point-by-point uncertainties. |

png pdf |
Additional Figure 5:
$R_{\text {pPb}}$ vs. transverse momentum for nonprompt $\mathrm{J}/\psi $ mesons measured by the CMS (filled circles) and ATLAS (open squares) [2] collaborations. The vertical bars represent the statistical uncertainties and the shaded boxes show the systematic uncertainties. The fully correlated global uncertainties of 4.2% for the CMS results is not included in the point-by-point uncertainties. |
png pdf |
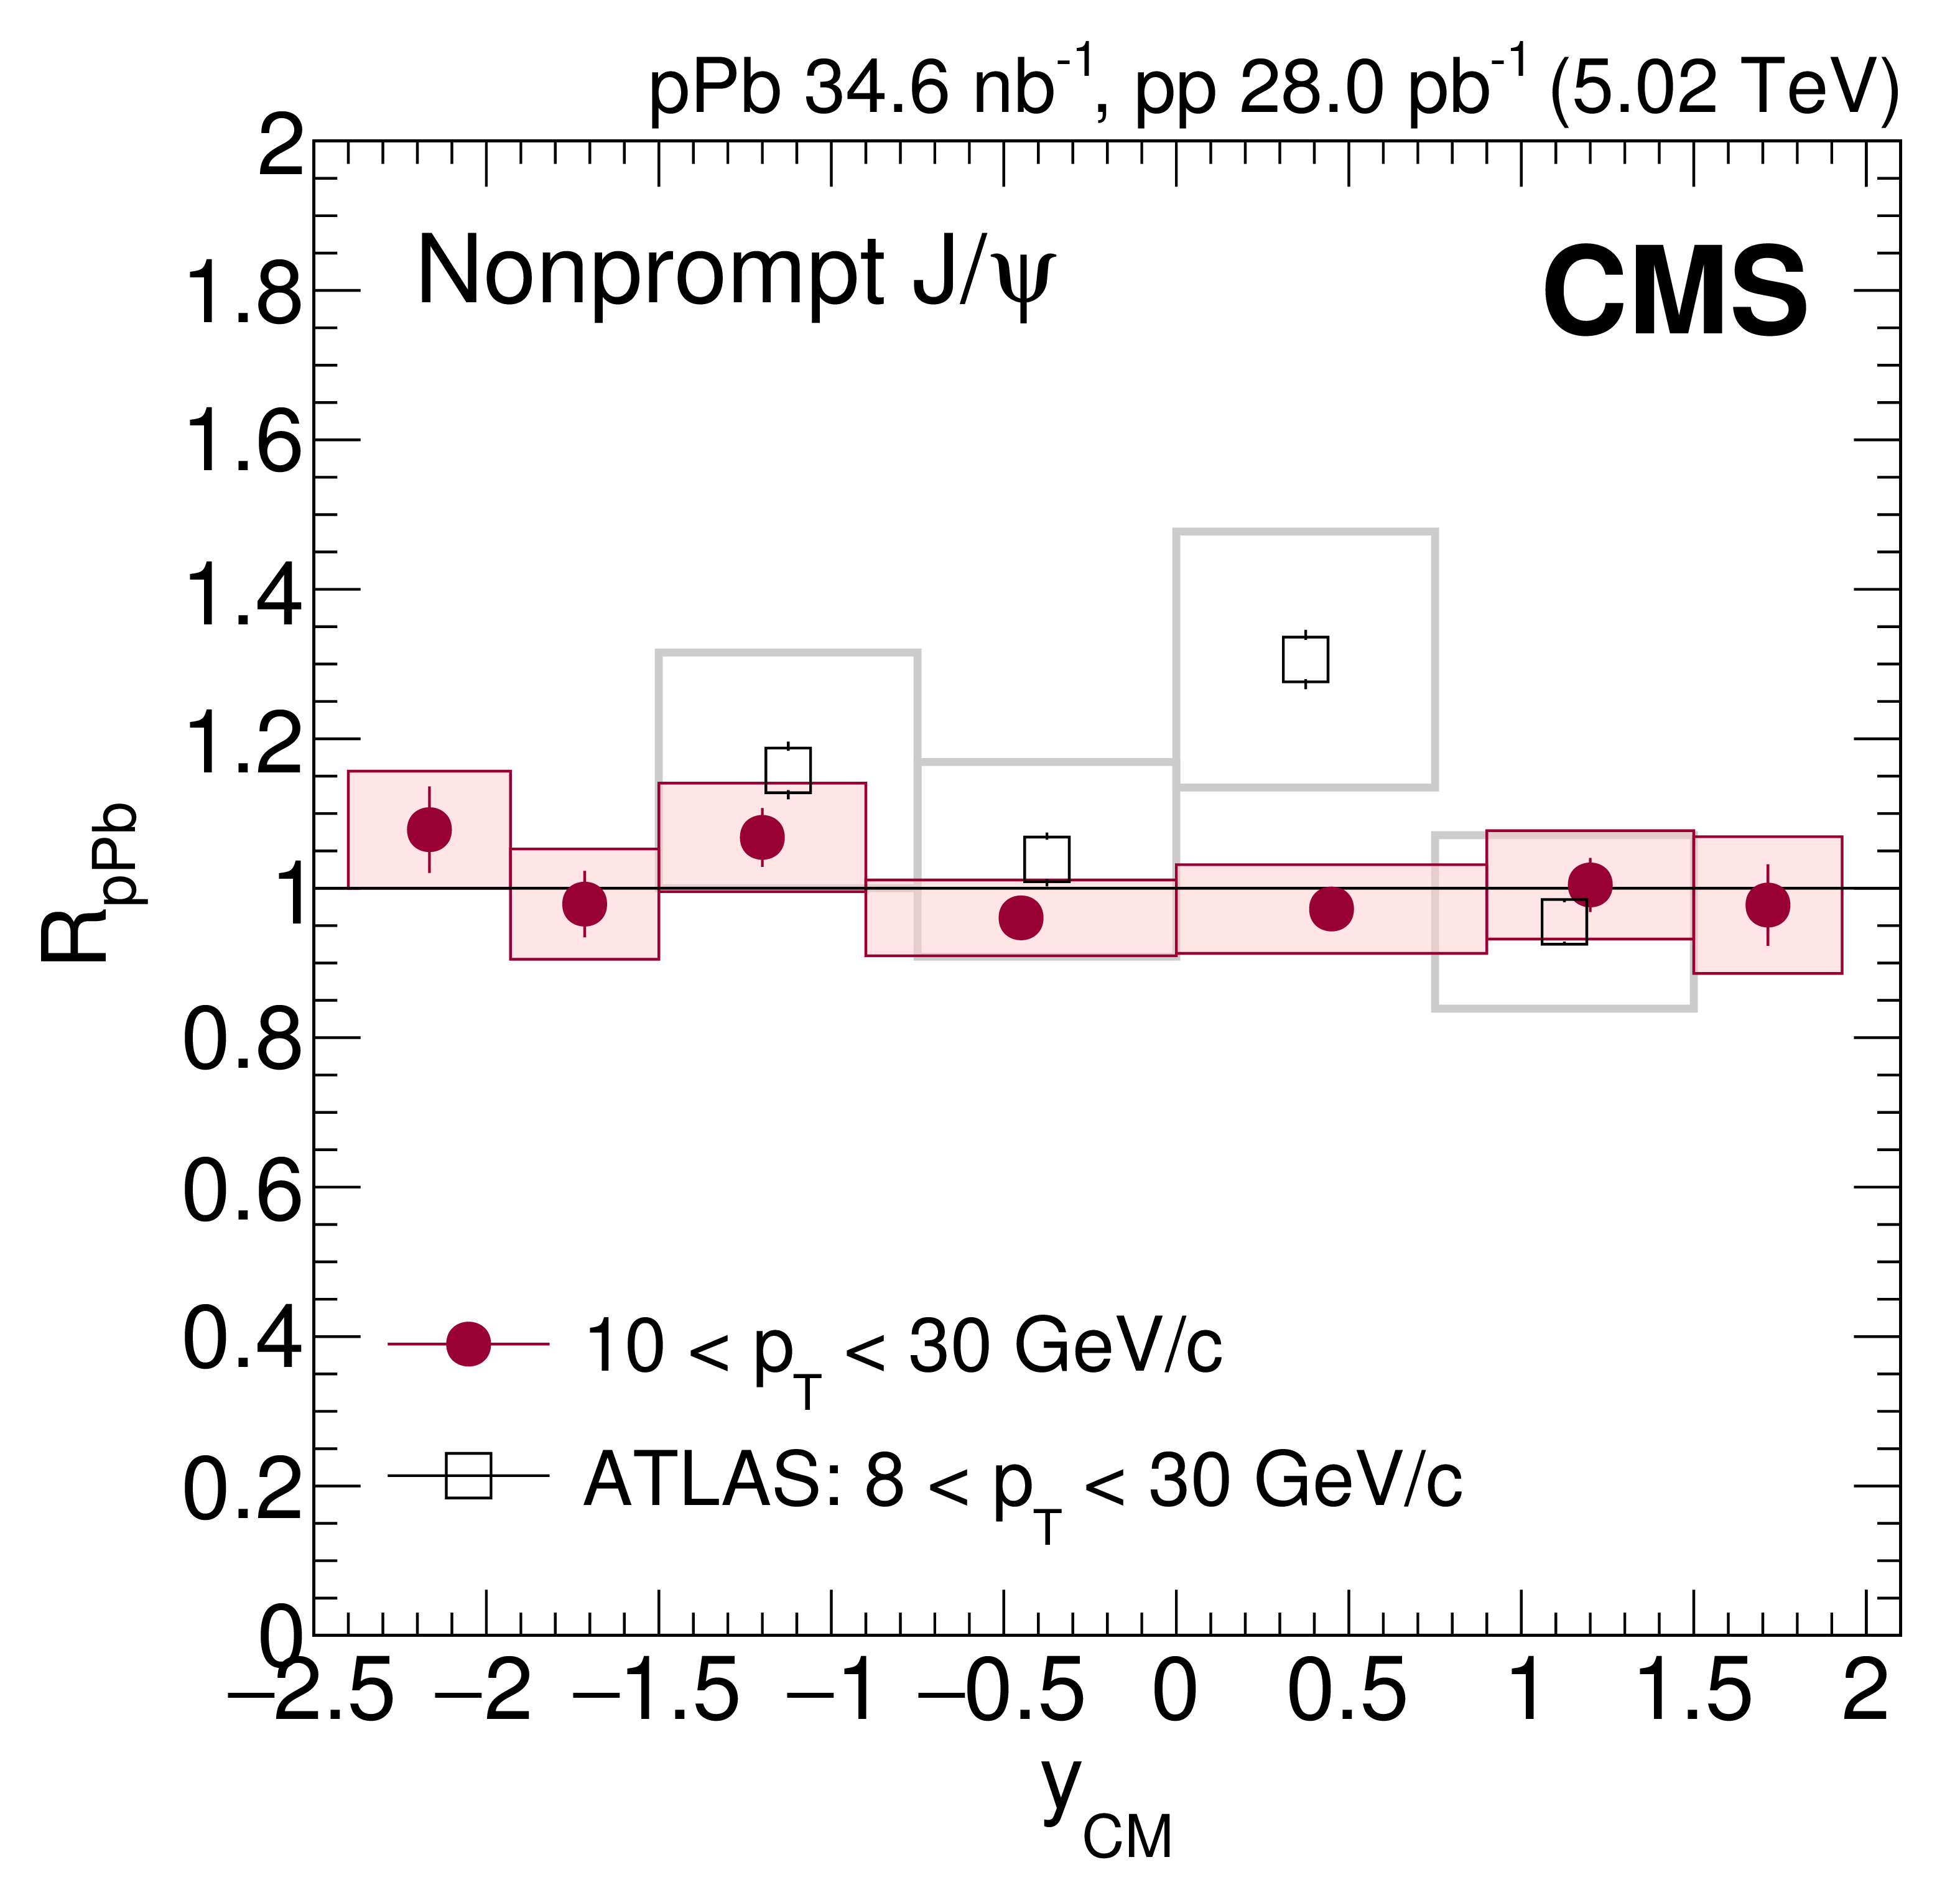
Additional Figure 6:
$R_{\text {pPb}}$ vs. rapidity for nonprompt $\mathrm{J}/\psi $ mesons measured by the CMS (filled circles) and ATLAS (open squares) [2] collaborations. The vertical bars represent the statistical uncertainties and the shaded boxes show the systematic uncertainties. The fully correlated global uncertainties of 4.2% for the CMS results is not included in the point-by-point uncertainties. |

png pdf |
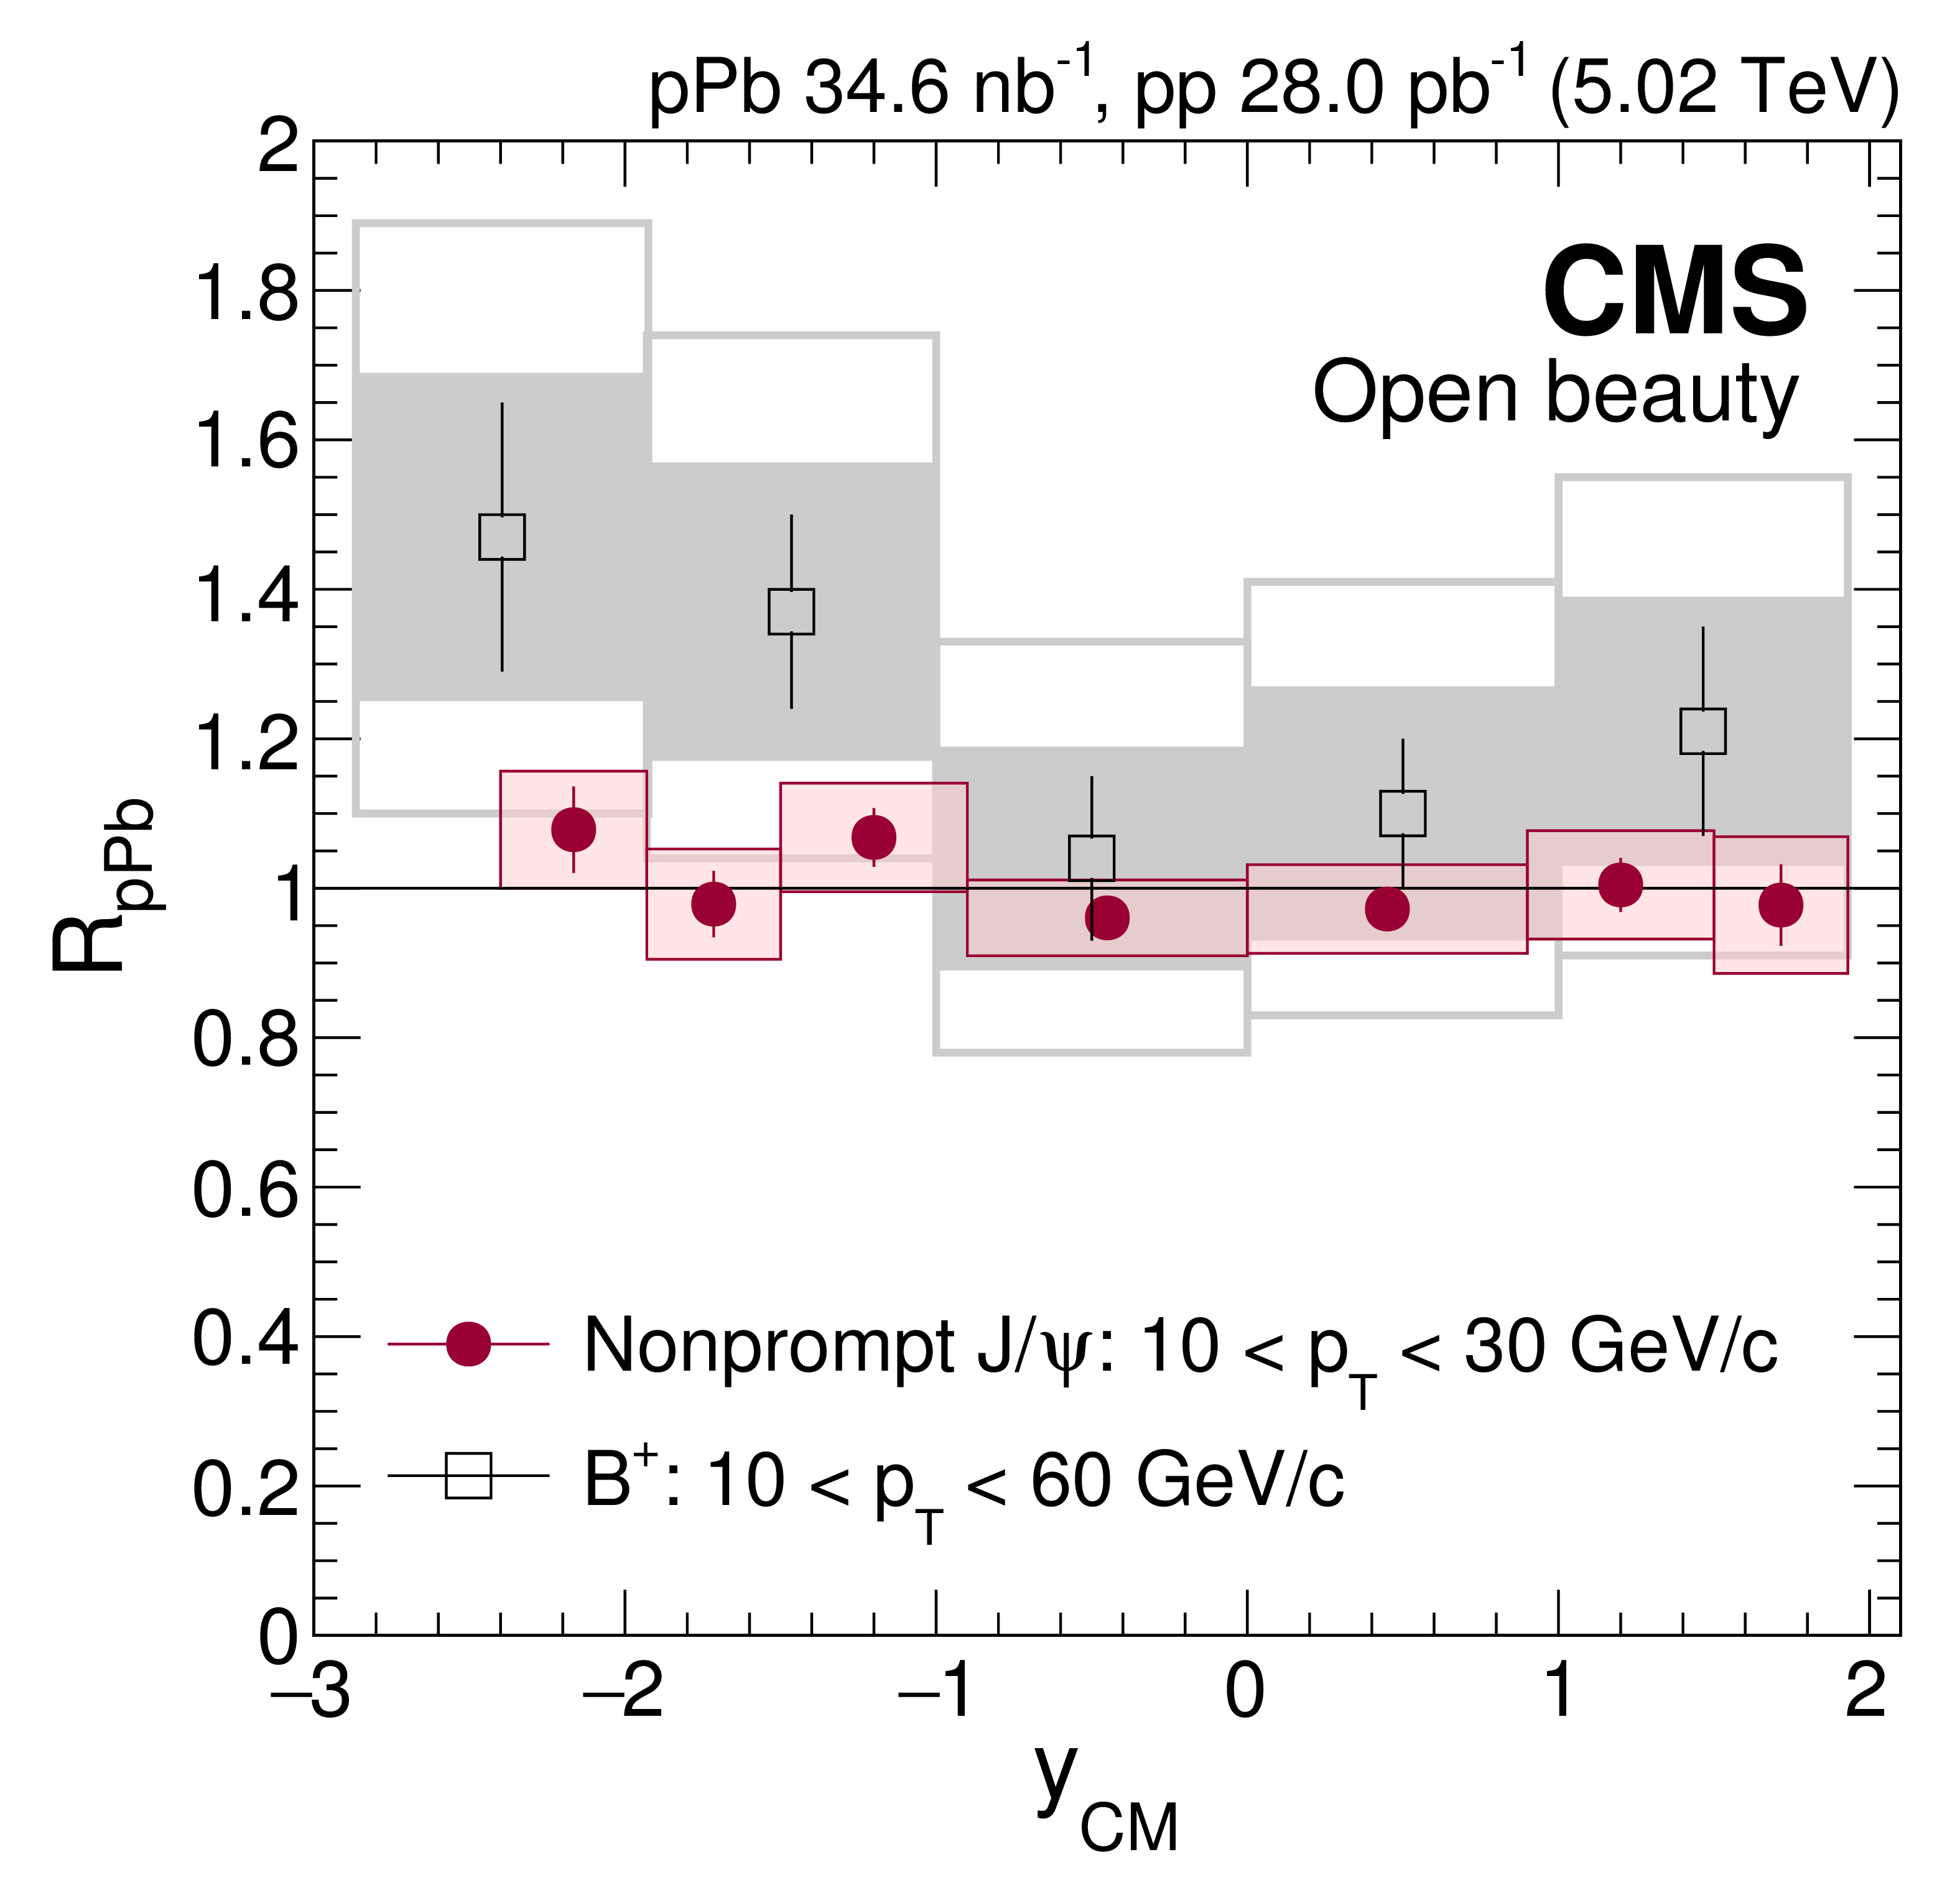
Additional Figure 7:
$R_{\text {pPb}}$ vs. transverse momentum for nonprompt $\mathrm{J}/\psi $ (filled circles) and B$^+$ mesons (open squares) [3] measured by the CMS collaboration. The vertical bars represent the statistical uncertainties and the shaded boxes show the systematic uncertainties. The fully correlated global uncertainties, 2.3% from pp integrated luminosity determination for nonprompt $\mathrm{J}/\psi $ results, 3.5% from pPb integrated luminosity determination, and 3.1% from B$^{+}$ meson branching fraction, are not included in the point-by-point uncertainties. |
png pdf |
Additional Figure 8:
$R_{\text {pPb}}$ vs. rapidity for nonprompt $\mathrm{J}/\psi $ (filled circles) and B$^+$ mesons (open squares) [3] measured by the CMS collaboration. The vertical bars represent the statistical uncertainties and the shaded boxes show the systematic uncertainties. The fully correlated global uncertainties, 2.3% from pp integrated luminosity determination for nonprompt $\mathrm{J}/\psi $ results, 3.5% from pPb integrated luminosity determination, and 3.1% from B$^{+}$ meson branching fraction, are not included in the point-by-point uncertainties. |

png pdf |
Additional Figure 9:
$ {R_{\text {FB}}} $ vs. transverse momentum for $\mathrm{J}/\psi $ mesons measured in the forward rapidity region by the CMS (filled circles), LHCb (open squares) [4], and ALICE (open diamonds) [5] collaborations. The vertical bars represent the statistical uncertainties and the shaded boxes show the systematic uncertainties. |
png pdf |
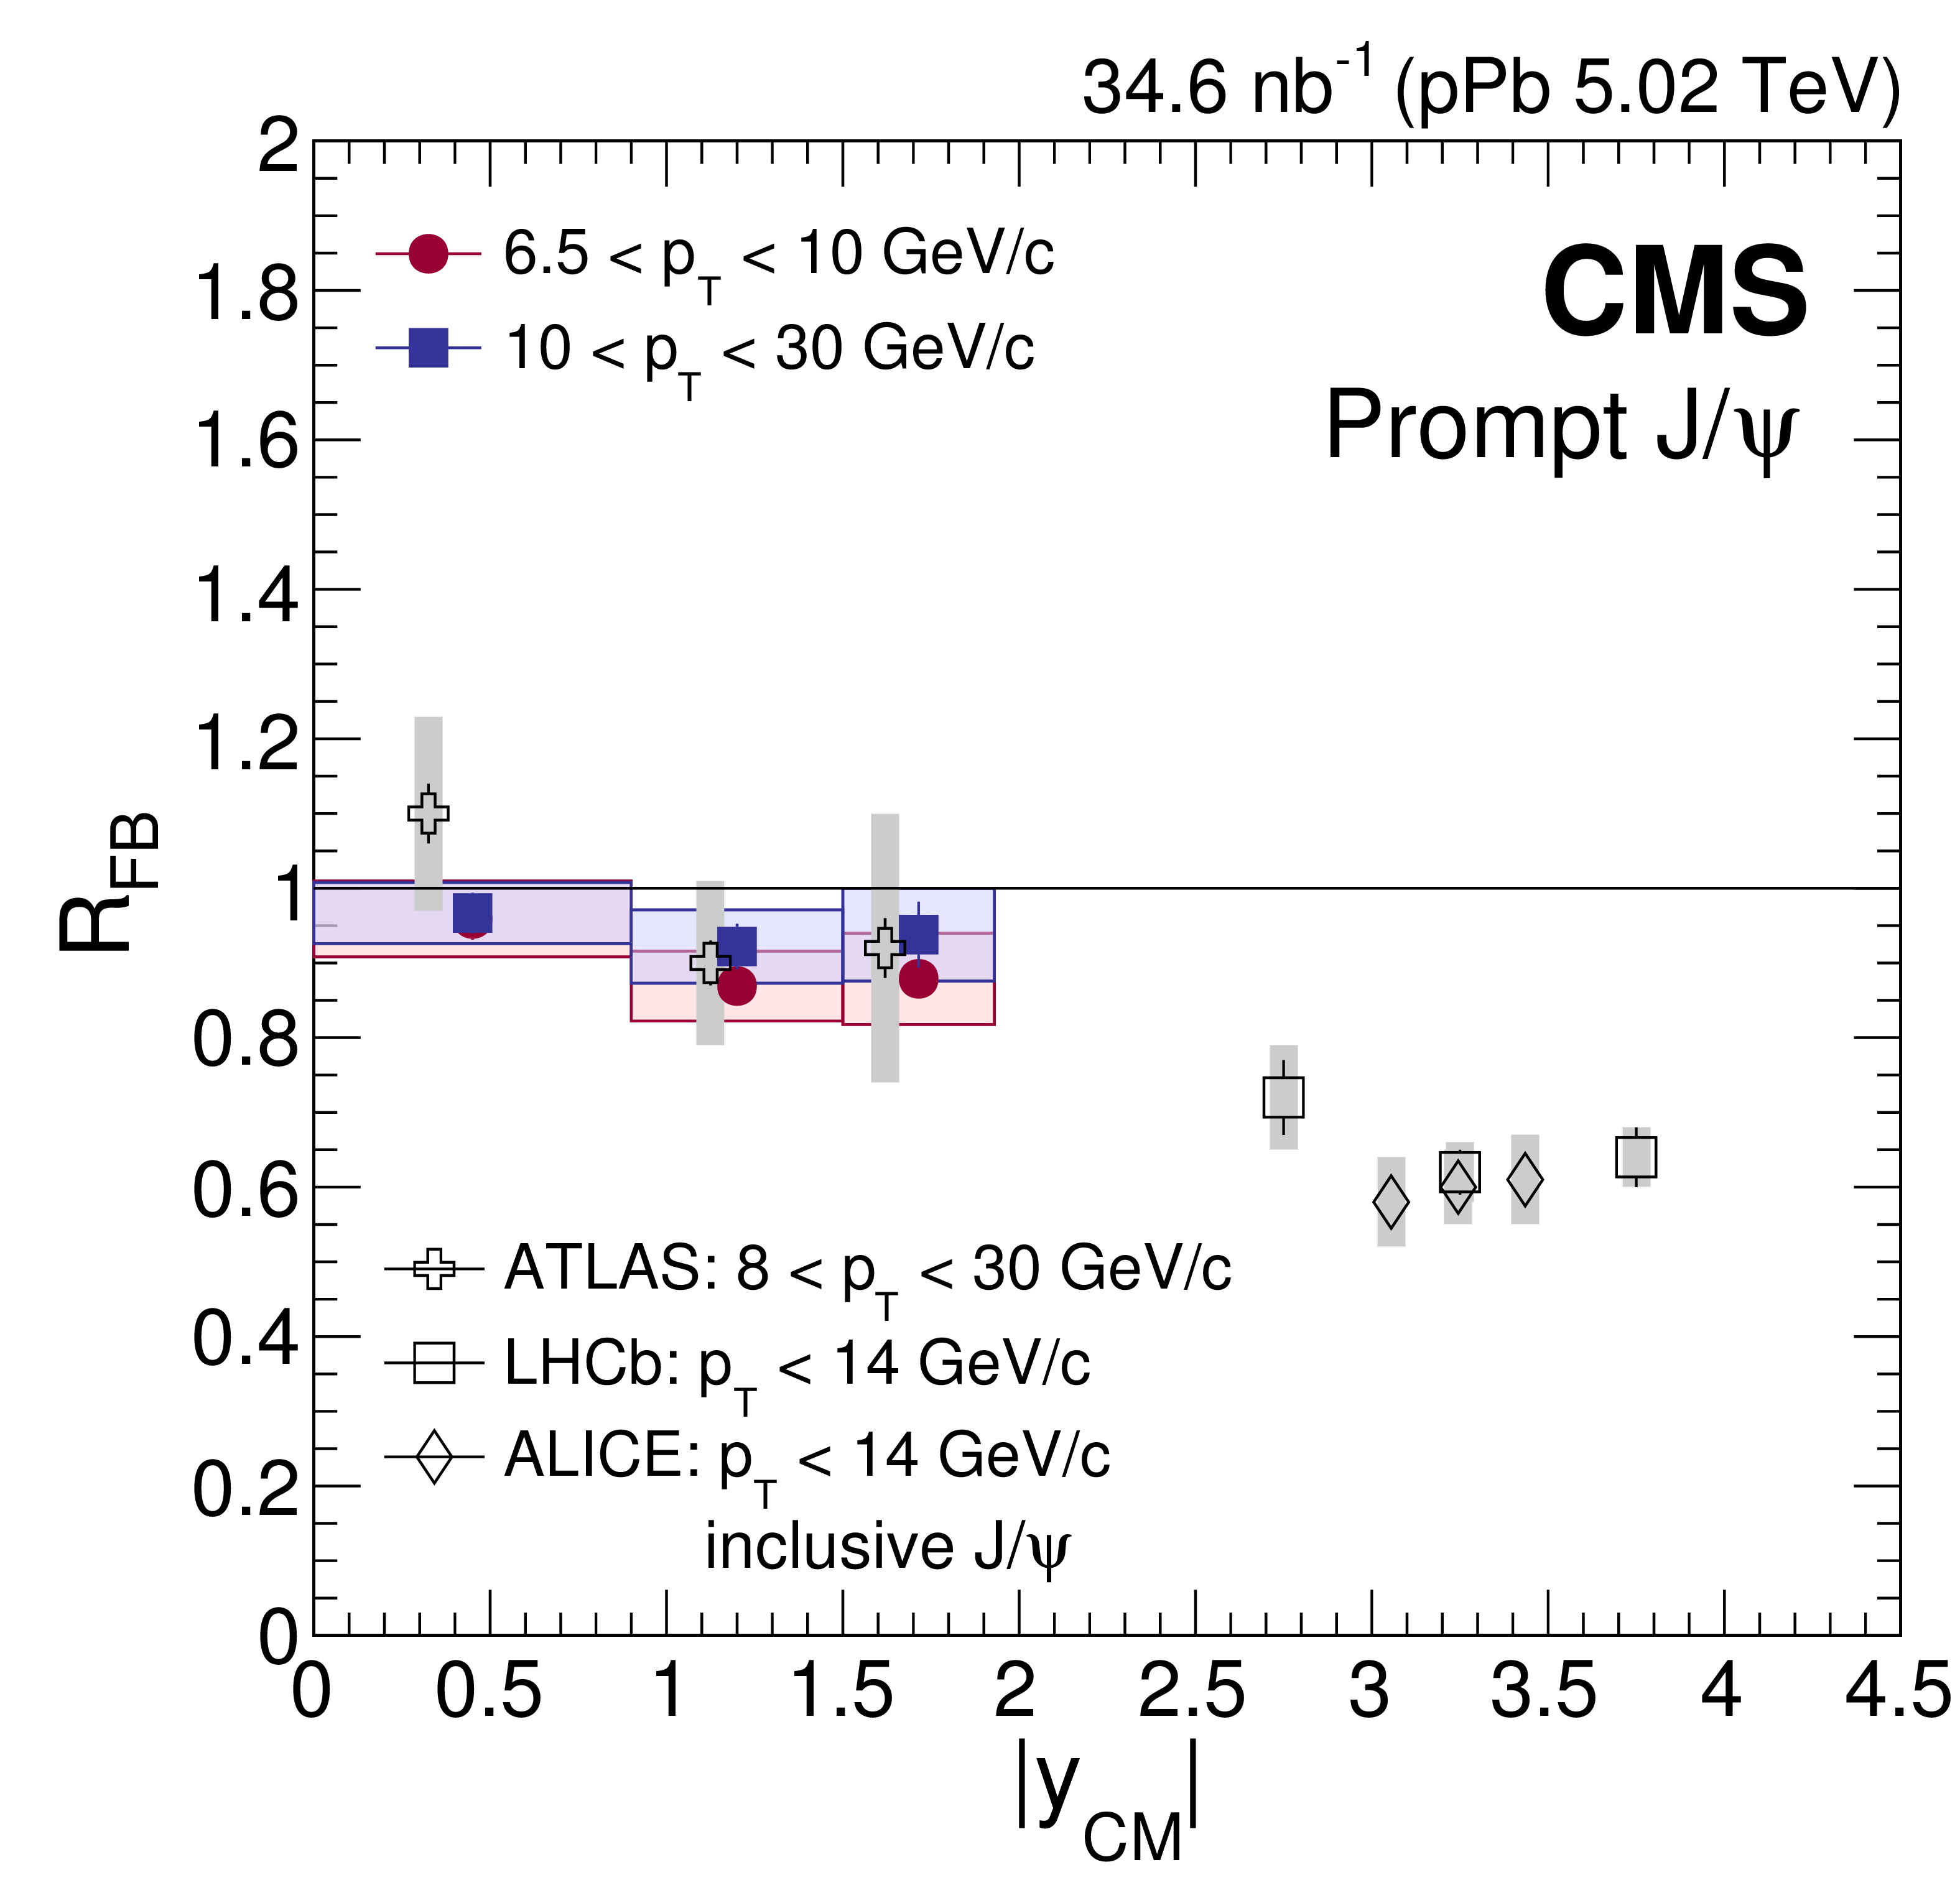
Additional Figure 10:
$ {R_{\text {FB}}} $ vs. rapidity for $\mathrm{J}/\psi $ mesons measured by the CMS (filled circles and squares), ATLAS (open crosses) [6], LHCb (open squares) [4], and ALICE (open diamonds) [5] collaborations. The vertical bars represent the statistical uncertainties and the shaded boxes show the systematic uncertainties. |
png pdf |
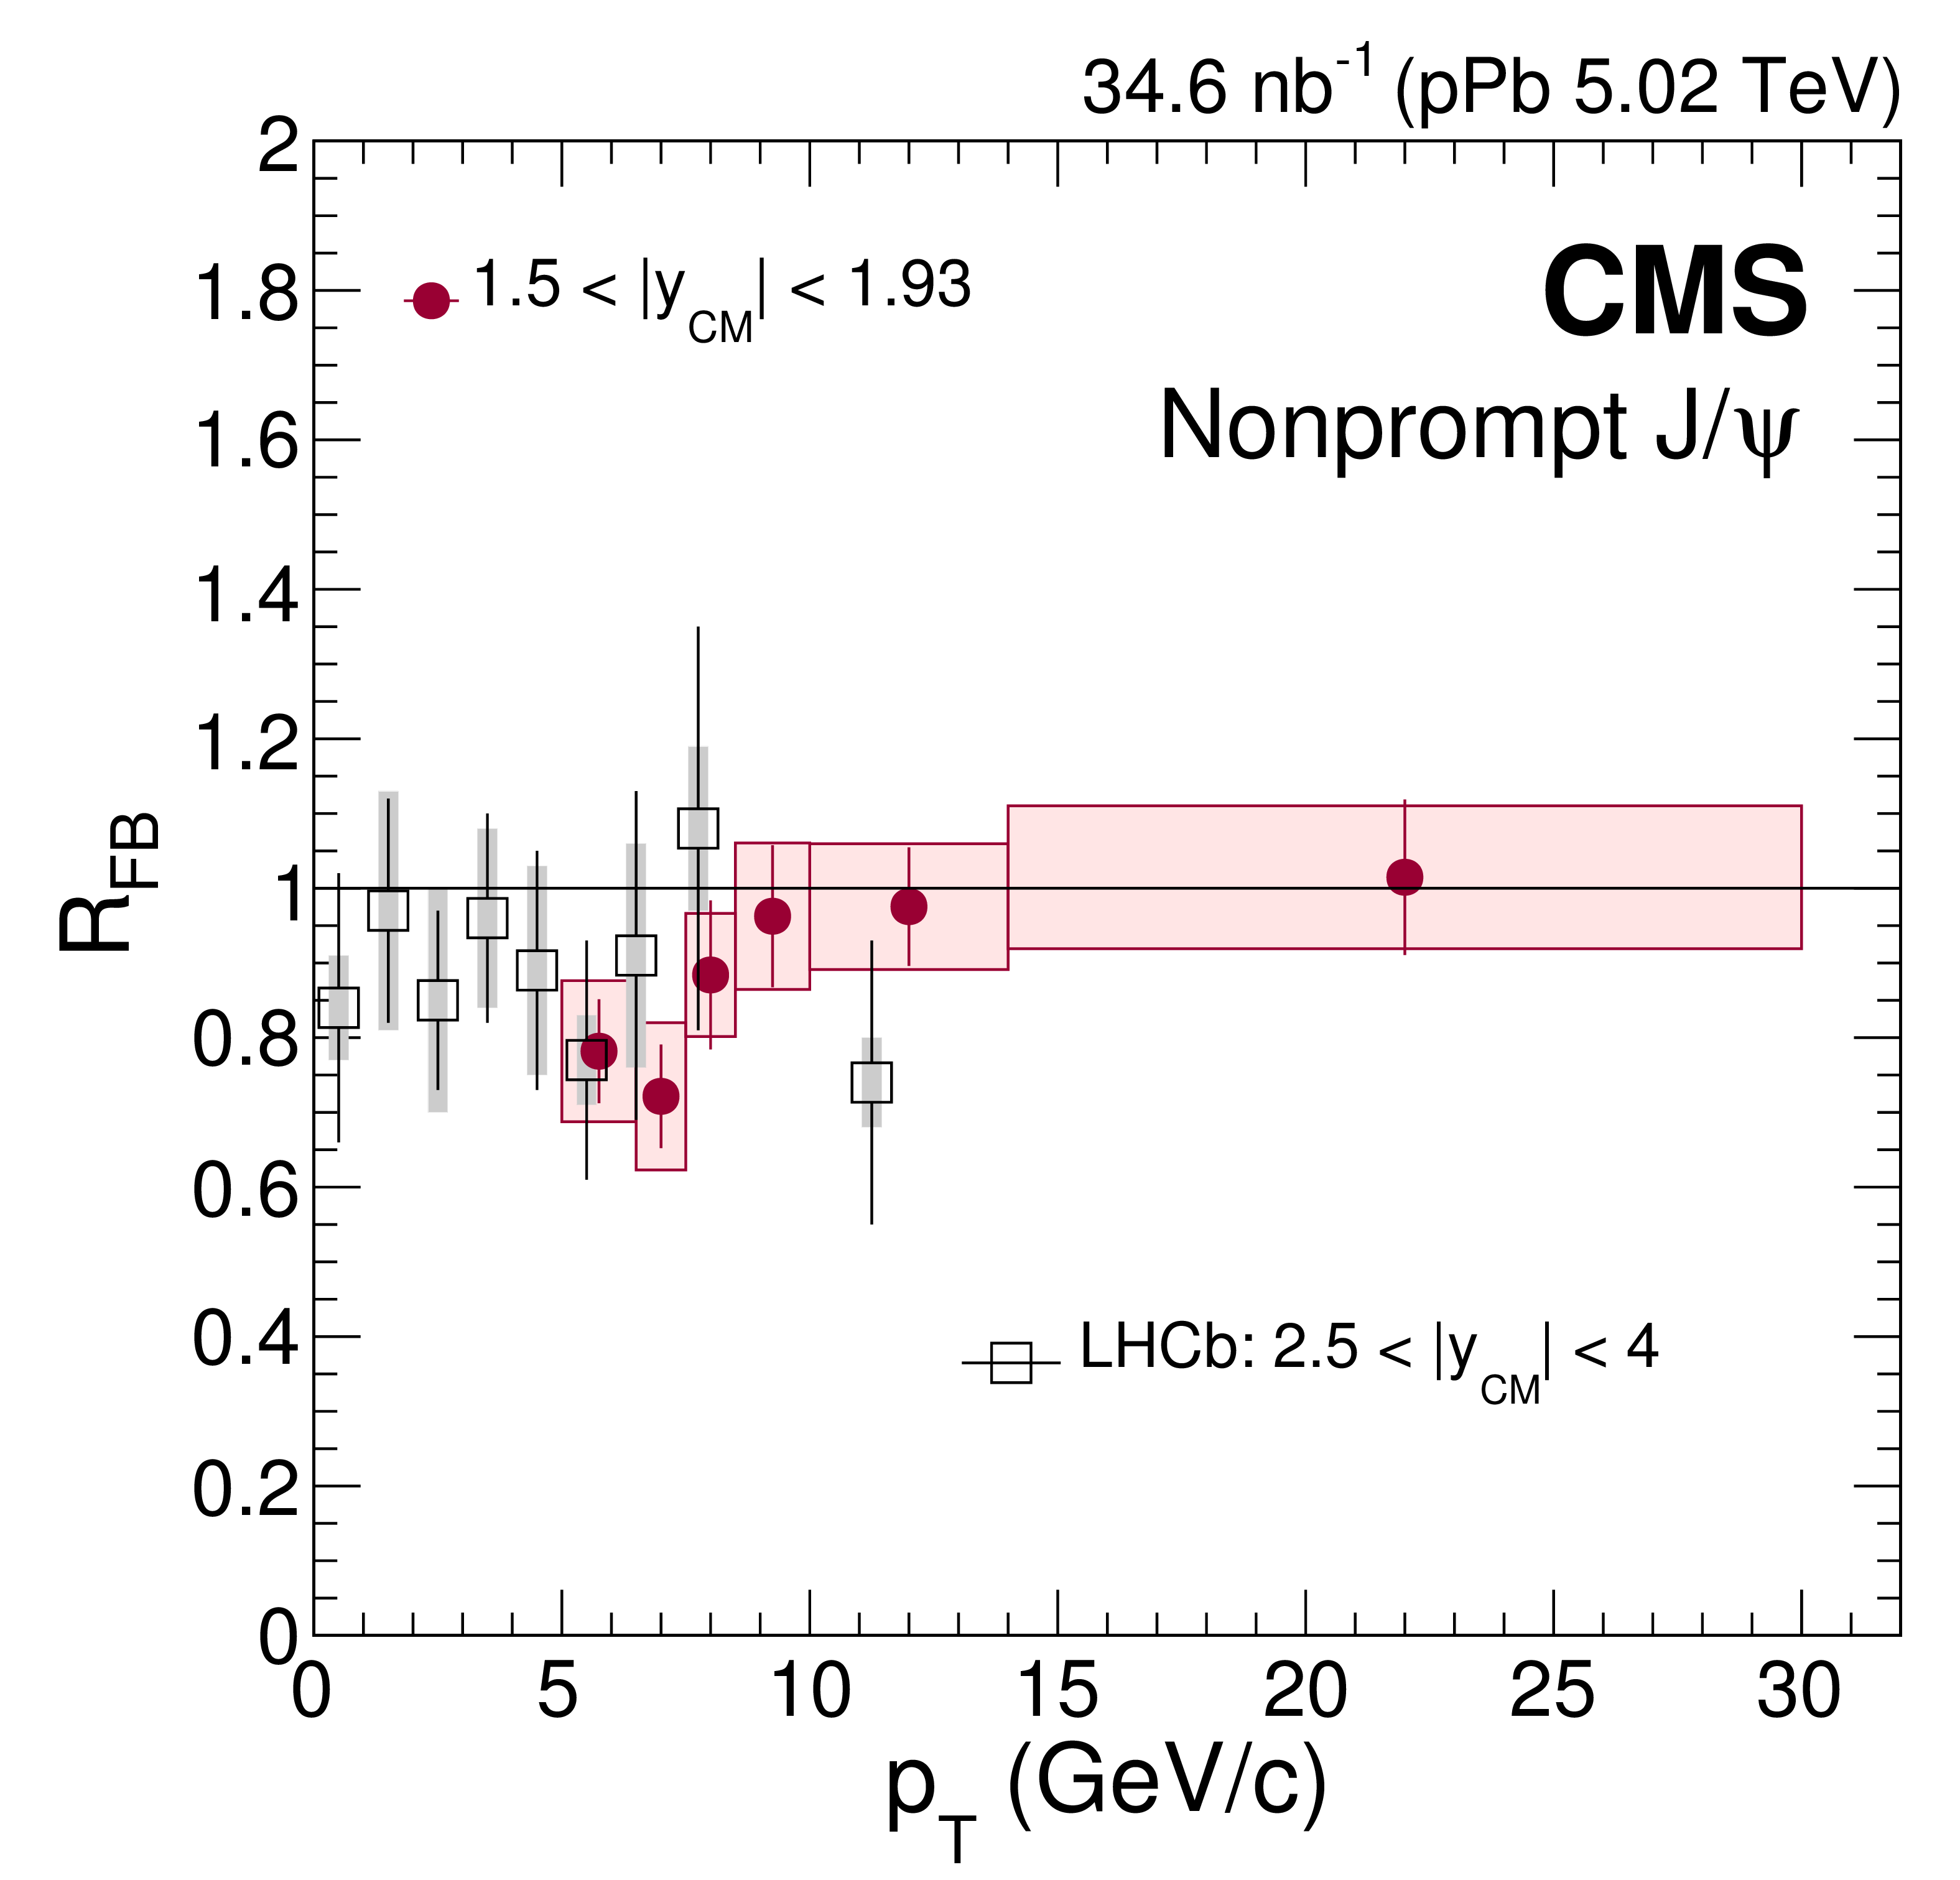
Additional Figure 11:
$ {R_{\text {FB}}} $ vs. transverse momentum for nonprompt $\mathrm{J}/\psi $ mesons measured in the forward rapidity region by the CMS (filled circles) and LHCb (open squares) [4] collaborations. The vertical bars represent the statistical uncertainties and the shaded boxes show the systematic uncertainties. |
png pdf |
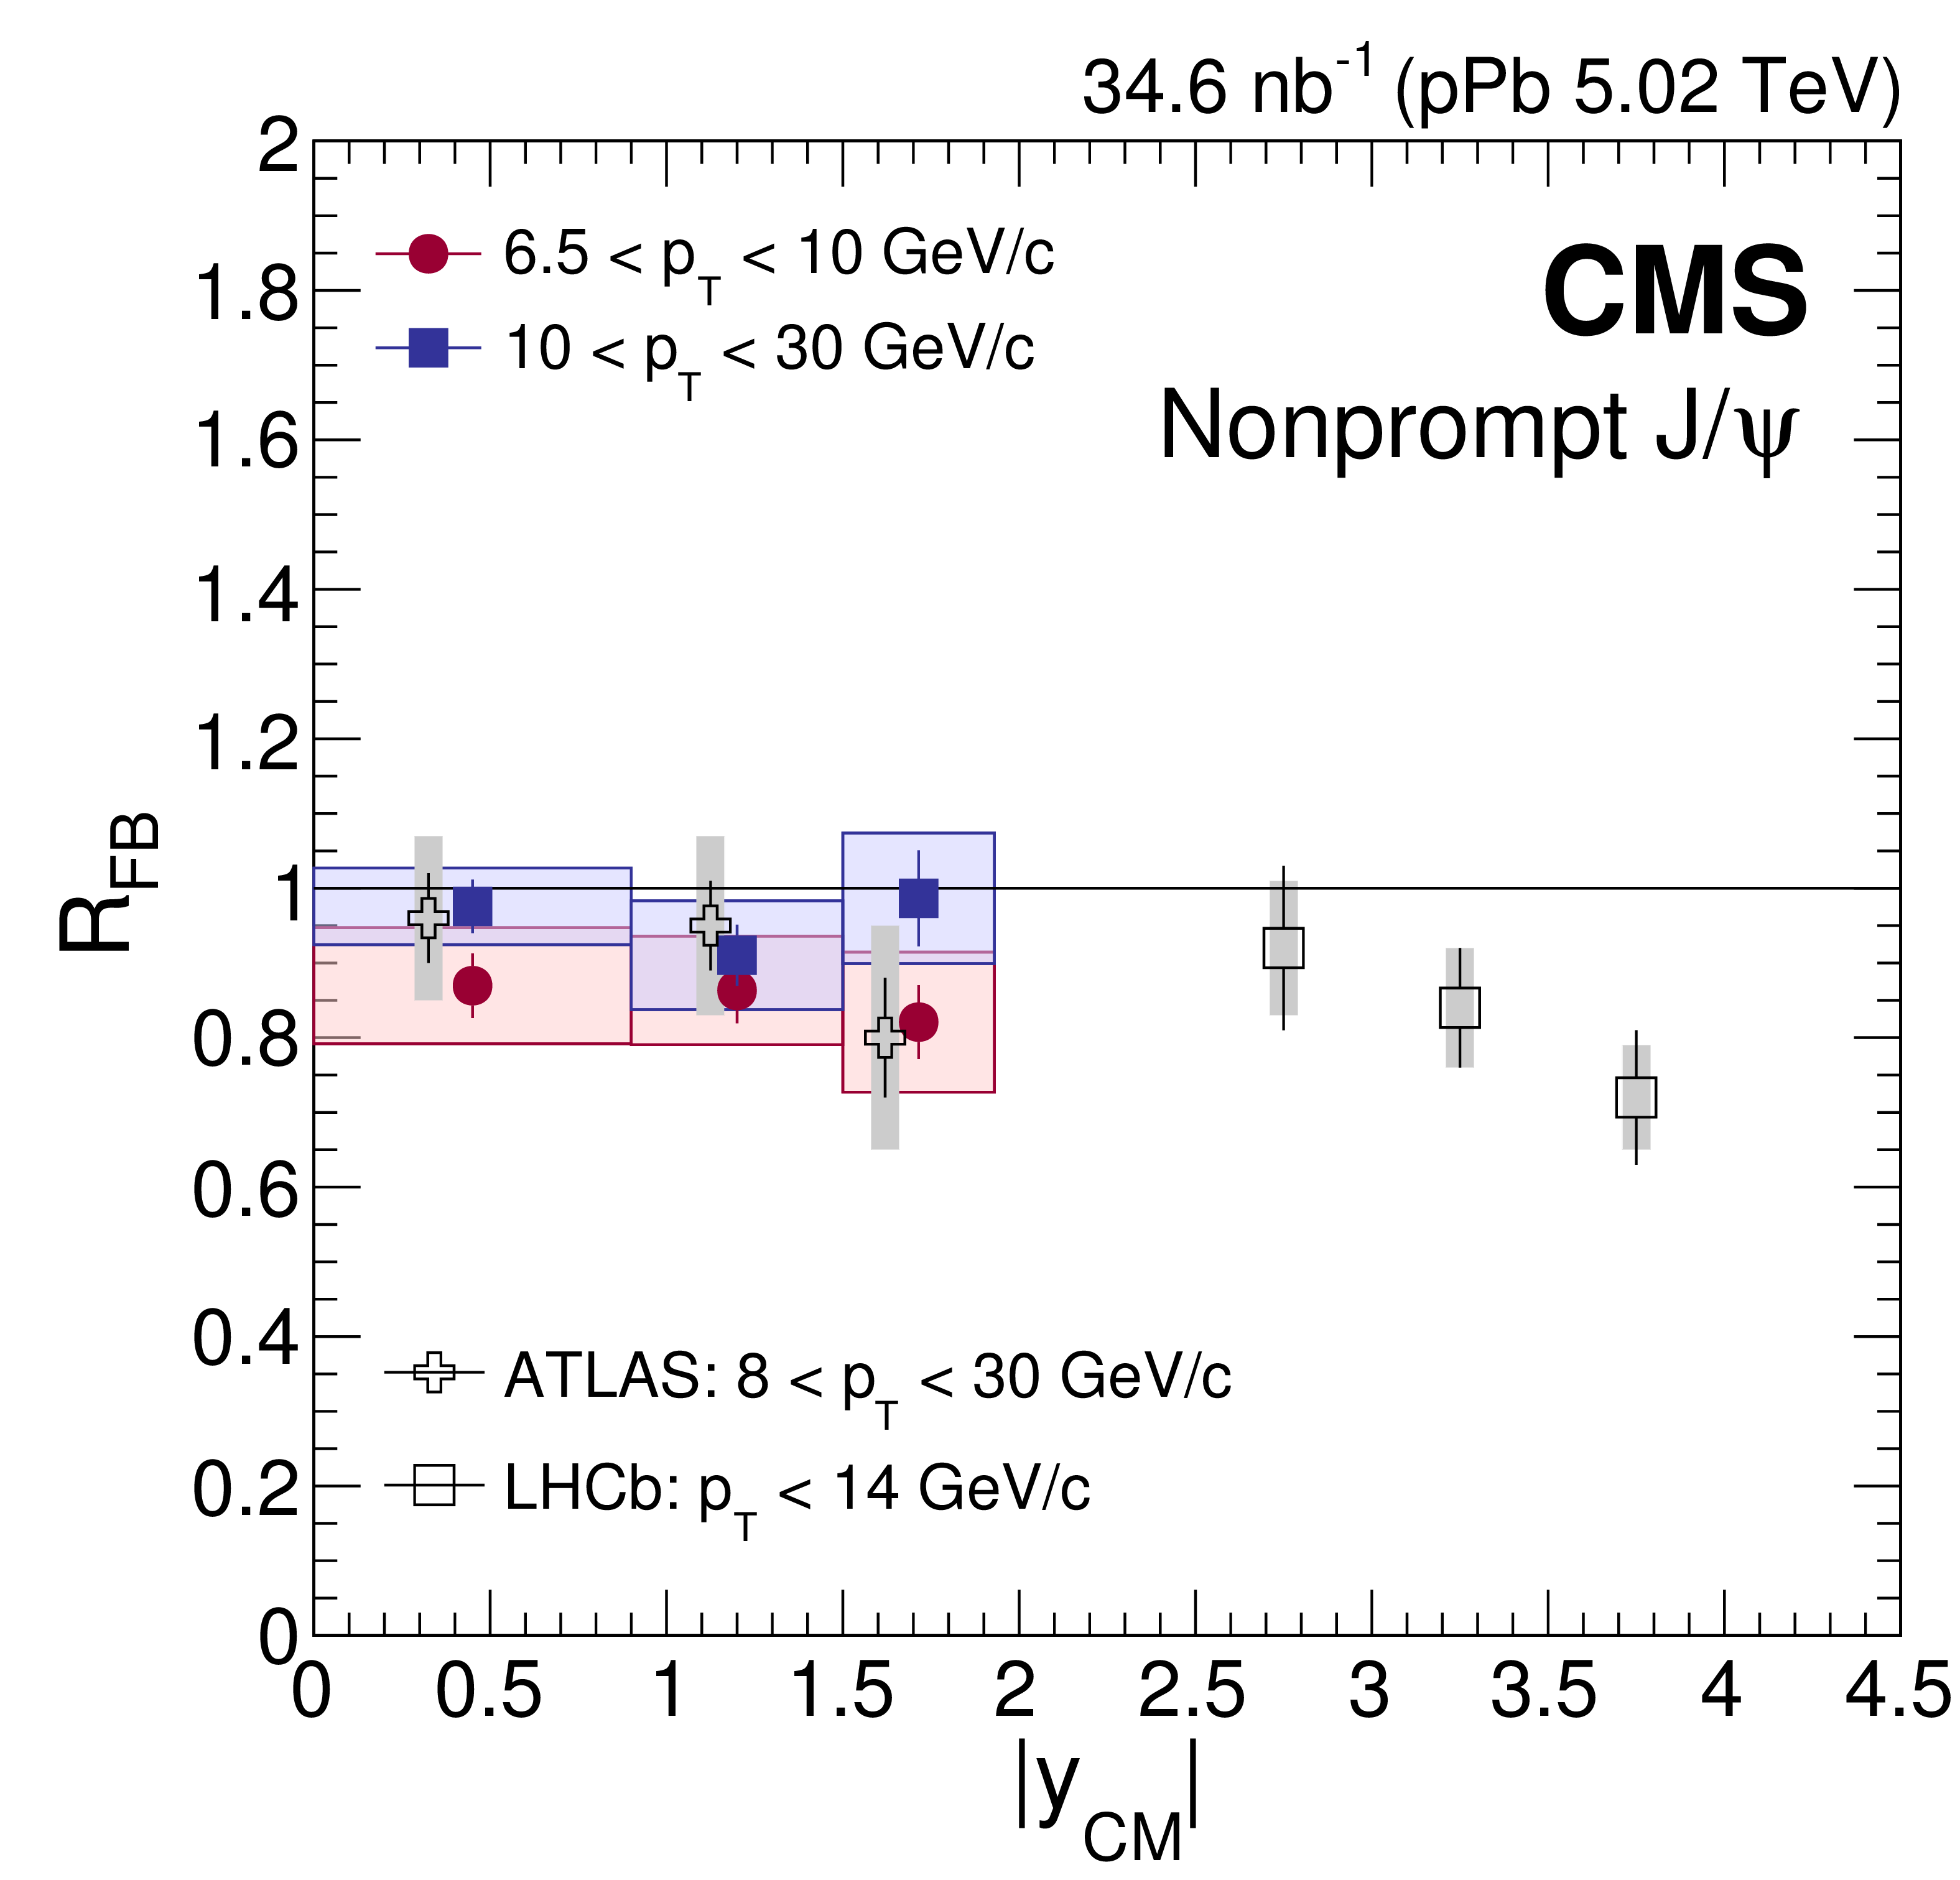
Additional Figure 12:
$ {R_{\text {FB}}} $ vs. rapidity for nonprompt $\mathrm{J}/\psi $ mesons measured the CMS (filled circles and squares), ATLAS (open crosses) [6], and LHCb (open squares) [4] collaborations. The vertical bars represent the statistical uncertainties and the shaded boxes show the systematic uncertainties. |
png pdf |
Additional Figure 13:
$R_{\text {pPb}}$ vs. transverse momentum for prompt $\mathrm{J}/\psi $ mesons. The vertical bars represent the statistical uncertainties and the shaded boxes show the systematic uncertainties. The fully correlated global uncertainty of 4.2% is displayed as a gray box at $R_{\text {pPb}}=$ 1 next to the left axis. |
png pdf |
Additional Figure 14:
$R_{\text {pPb}}$ vs. rapidity for prompt $\mathrm{J}/\psi $ mesons in 6.5 $ < p_{\mathrm {T}} < $ 10 GeV/$c$. The vertical bars represent the statistical uncertainties and the shaded boxes show the systematic uncertainties. The fully correlated global uncertainty of 4.2% is displayed as a gray box at $R_{\text {pPb}}=$ 1 next to the left axis. |
png pdf |
Additional Figure 15:
$R_{\text {pPb}}$ vs. rapidity for prompt $\mathrm{J}/\psi $ mesons in 10 $ < p_{\mathrm {T}} < $ 30 GeV/$c$. The vertical bars represent the statistical uncertainties and the shaded boxes show the systematic uncertainties. The fully correlated global uncertainty of 4.2% is displayed as a gray box at $R_{\text {pPb}}= $ 1 next to the left axis. |

png pdf |
Additional Figure 16:
$R_{\text {pPb}}$ vs. transverse momentum for prompt $\mathrm{J}/\psi $ mesons integrated over $|y_{\text {CM}}|< $ 1.93. The vertical bars represent the statistical uncertainties and the shaded boxes show the systematic uncertainties. The fully correlated global uncertainty of 4.2% is displayed as a gray box at $R_{\text {pPb}}= $ 1 next to the left axis. |
png pdf |
Additional Figure 17:
$R_{\text {pPb}}$ vs. transverse momentum for nonprompt $\mathrm{J}/\psi $ mesons integrated over $|y_{\text {CM}}|< $ 1.93. The vertical bars represent the statistical uncertainties and the shaded boxes show the systematic uncertainties. The fully correlated global uncertainty of 4.2% is displayed as a gray box at $R_{\text {pPb}}= $ 1 next to the left axis. |
| References | ||||
| 1 | T. Matsui and H. Satz | $ \mathrm{J}/\psi $ suppression by quark-gluon plasma formation | PLB 178 (1986) 416 | |
| 2 | NA50 Collaboration | Evidence for deconfinement of quarks and gluons from the $ \mathrm{J}/\psi $ suppression pattern measured in Pb-Pb collisions at the CERN-SPS | PLB 477 (2000) 28 | |
| 3 | NA60 Collaboration | $ \mathrm{J}/\psi $ Production in Indium-Indium Collisions at 158 GeV/Nucleon | PRL 99 (2007) 132302 | 0706.4361 |
| 4 | PHENIX Collaboration | $ \mathrm{J}/\psi $ Production vs. Centrality, Transverse Momentum, and Rapidity in Au+Au Collisions at $ \sqrt{s}_{\mathrm{NN}}= $ 200 GeV | PRL 98 (2007) 232301 | nucl-ex/0611020 |
| 5 | STAR Collaboration | $ \mathrm{J}/\psi $ production at low $ p_{\mathrm{T}} $ in Au+Au and Cu+Cu collisions at $ \sqrt{s}_{\mathrm{NN}}= $ 200 GeV with the STAR detector | PRC 90 (2014) 024906 | 1310.3563 |
| 6 | CMS Collaboration | Suppression and azimuthal anisotropy of prompt and nonprompt $ \mathrm{J}/\psi $ production in PbPb collisions at $ \sqrt{s}_{\mathrm{NN}}= $ 2.76 TeV | Submitted to EPJC | CMS-HIN-14-005 1610.00613 |
| 7 | ALICE Collaboration | Centrality, rapidity and transverse momentum dependence of $ \mathrm{J}/\psi $ suppression in Pb-Pb collisions at $ \sqrt{s}_{\mathrm{NN}}= $ 2.76 TeV | PLB 734 (2014) 314 | 1311.0214 |
| 8 | CMS Collaboration | Observation of Sequential $ \Upsilon$ Suppression in PbPb Collisions | PRL 109 (2012) 222301 | CMS-HIN-11-011 1208.2826 |
| 9 | CMS Collaboration | Suppression of $ \Upsilon(1\text{S}) $, $ \Upsilon(2\text{S}) $ and $ \Upsilon(3\text{S}) $ production in PbPb collisions at $ \sqrt{s}_{\mathrm{NN}}= $ 2.76 TeV | Submitted to PLB | CMS-HIN-15-001 1611.01510 |
| 10 | ALICE Collaboration | Suppression of $ \Upsilon(1\text{S}) $ at forward rapidity in Pb-Pb collisions at $ \sqrt{s}_{\mathrm{NN}}= $ 2.76 TeV | PLB 738 (2014) 361 | 1405.4493 |
| 11 | A. Emerick, X. Zhao, and R. Rapp | Bottomonia in the quark-gluon plasma and their production at RHIC and LHC | EPJA 48 (2012) 72 | 1111.6537 |
| 12 | M. Strickland and D. Bazow | Thermal bottomonium suppression at RHIC and LHC | Nucl. Phys. A 879 (2012) 25 | 1112.2761 |
| 13 | E. G. Ferreiro, F. Fleuret, J. P. Lansberg, and A. Rakotozafindrabe | Impact of the nuclear modification of the gluon densities on $ \mathrm{J}/\psi $ production in pPb collisions at $ \sqrt{s}_{\mathrm{NN}}= $ 5 TeV | PRC 88 (2013) 047901 | 1305.4569 |
| 14 | R. Vogt | Shadowing effects on $ \mathrm{J}/\psi $ and $ \Upsilon$ production at energies available at the CERN Large Hadron Collider | PRC 92 (2015) 034909 | 1507.04418 |
| 15 | F. Arleo and S. Peigne | $ \mathrm{J}/\psi $ Suppression in p-A Collisions from Parton Energy Loss in Cold QCD Matter | PRL 109 (2012) 122301 | 1204.4609 |
| 16 | F. Arleo, R. Kolevatov, S. Peigne, and M. Rustamova | Centrality and $ p_{\bot} $ dependence of $ \mathrm{J}/\psi $ suppression in proton-nucleus collisions from parton energy loss | JHEP 05 (2013) 155 | 1304.0901 |
| 17 | Z.-B. Kang et al. | Multiple scattering effects on heavy meson production in p+A collisions at backward rapidity | PLB 740 (2015) 23 | 1409.2494 |
| 18 | A. M. Sickles | Possible evidence for radial flow of heavy mesons in d + Au collisions | PLB 731 (2014) 51 | 1309.6924 |
| 19 | CMS Collaboration | Study of $ B $ Meson Production in pPb Collisions at $ \sqrt{s}_{\mathrm{NN}}= $ 5.02 TeV using Exclusive Hadronic Decays | PRL 116 (2016) 032301 | CMS-HIN-14-004 1508.06678 |
| 20 | CMS Collaboration | Transverse momentum spectra of inclusive b jets in pPb collisions at $ \sqrt{s}_{\mathrm{NN}}= $ 5.02 TeV | PLB 754 (2016) 59 | CMS-HIN-14-007 1510.03373 |
| 21 | ALICE Collaboration | $ \mathrm{J}/\psi $ production and nuclear effects in p-Pb collisions at $ \sqrt{s}_{\mathrm{NN}}= $ 5.02 TeV | JHEP 02 (2014) 073 | 1308.6726 |
| 22 | ALICE Collaboration | Rapidity and transverse-momentum dependence of the inclusive $ \mathrm{J}/\psi $ nuclear modification factor in p-Pb collisions at $ \sqrt{s}_{\mathrm{NN}}= $ 5.02 TeV | JHEP 06 (2015) 055 | 1503.07179 |
| 23 | ATLAS Collaboration | Measurement of differential $ \mathrm{J}/\psi $ production cross sections and forward-backward ratios in pPb collisions with the ATLAS detectors | PRC 92 (2015) 034904 | 1505.08141 |
| 24 | LHCb Collaboration | Study of $ \mathrm{J}/\psi $ production and cold nuclear matter effects in pPb collisions at $ \sqrt{s}_{\mathrm{NN}}= $ 5 TeV | JHEP 02 (2014) 072 | 1308.6729 |
| 25 | CMS Collaboration | The CMS experiment at the CERN LHC | JINST 3 (2008) S08004 | CMS-00-001 |
| 26 | CMS Collaboration | Multiplicity and transverse momentum dependence of two- and four-particle correlations in pPb and PbPb collisions | PLB 724 (2013) 213 | CMS-HIN-13-002 1305.0609 |
| 27 | CMS Collaboration | Performance of CMS muon reconstruction in pp collision events at $ \sqrt{s} = $ 7 TeV | JINST 7 (2012) P10002 | CMS-MUO-10-004 1206.4071 |
| 28 | T. Sjostrand et al. | An introduction to PYTHIA 8.2 | CPC 191 (2015) 159 | 1410.3012 |
| 29 | T. Sjostrand, S. Mrenna, and P. Skands | PYTHIA 6.4 physics and manual | JHEP 05 (2006) 026 | hep-ph/0603175 |
| 30 | P. Bartalini and L. Fano, eds. | Proceedings of the First International Workshop on Multiple Partonic Interactions at the LHC (MPI08) | 1003.4220 | |
| 31 | R. Field | Early LHC Underlying Event Data --- Findings and Surprises | in Hadron collider physics. Proceedings, 22nd Conference, HCP 2010, Toronto, Canada, August 23-27 2010 | 1010.3558 |
| 32 | CMS Collaboration | Measurement of the prompt $ \mathrm{J}/\psi $ and $ {\psi}(2S) $ polarizations in pp collisions at $ \sqrt{s} = $ 7 TeV | PLB 727 (2013) 381 | CMS-BPH-13-003 1307.6070 |
| 33 | LHCb Collaboration | Measurement of $ \mathrm{J}/\psi $ polarization in pp collisions at $ \sqrt{s} = $ 7 TeV | EPJC 73 (2013) 2631 | 1307.6379 |
| 34 | ALICE Collaboration | $ J/\Psi $ Polarization in pp Collisions at $ \sqrt{s} = $ 7 TeV | PRL 108 (2012) 082001 | 1111.1630 |
| 35 | D. J. Lange | The EvtGen particle decay simulation package | NIMA 462 (2001) 152 | |
| 36 | E. Barberio and Z. W\cas | PHOTOS --- A universal Monte Carlo for QED radiative corrections: version 2.0 | CPC 79 (1994) 291 | |
| 37 | GEANT Collaboration | GEANT4 --- a simulation toolkit | NIMA 506 (2003) 250 | |
| 38 | Particle Data Group, C. Patrignani et al. | Review of Particle Physics | CPC 40 (2016) 100001 | |
| 39 | CMS Collaboration | CMS Luminosity Calibration for the pp Reference Run at $ \sqrt{s} = $ 5.02 TeV | CMS-PAS-LUM-16-001 | CMS-PAS-LUM-16-001 |
| 40 | CMS Collaboration | Luminosity calibration for the 2013 proton-lead and proton-proton data taking | CMS-PAS-LUM-13-002 | CMS-PAS-LUM-13-002 |
| 41 | CMS Collaboration | $ \mathrm{J}/\psi $ and $ {\psi}(2S) $ production in pp collisions at $ \sqrt{s} = $ 7 TeV | JHEP 02 (2012) 011 | CMS-BPH-10-014 1111.1557 |
| 42 | CMS Collaboration | Measurement of $ \mathrm{J}/\psi $ and $ {\psi}(2S) $ Prompt Double-Differential Cross Sections in pp Collisions at $ \sqrt{s} = $ 7 TeV | PRL 114 (2015) 191802 | CMS-BPH-14-001 1502.04155 |
| 43 | M. J. Oreglia | A Study of the Reactions $ \psi' \to \gamma \gamma \psi $ | PhD thesis, Stanford University, 1980 SLAC Report SLAC-R-236 | |
| 44 | CMS Collaboration | Measurements of inclusive W and Z cross sections in pp collisions at $ \sqrt{s} = $ 7 TeV | JHEP 01 (2011) 080 | CMS-EWK-10-002 1012.2466 |
| 45 | X.-N. Wang and M. Gyulassy | HIJING: A Monte Carlo model for multiple jet production in pp, pA and AA collisions | PRD 44 (1991) 3501 | |
| 46 | K. J. Eskola, H. Paukkunen, and C. A. Salgado | EPS09: A new generation of NLO and LO nuclear parton distribution functions | JHEP 04 (2009) 065 | 0902.4154 |
| 47 | K. Kovarik et al. | nCTEQ15: Global analysis of nuclear parton distributions with uncertainties in the CTEQ framework | PRD 93 (2016) 085037 | 1509.00792 |
| 48 | J.-P. Lansberg and H.-S. Shao | Towards an automated tool to evaluate the impact of the nuclear modification of the gluon density on quarkonium, D and B meson production in proton-nucleus collisions | EPJC 77 (2017) 1 | 1610.05382 |
|
|
Compact Muon Solenoid LHC, CERN |
|

|

|

|

|

|