

Compact Muon Solenoid
LHC, CERN
| CMS-HIN-16-025 ; CERN-EP-2017-308 | ||
| Measurement of prompt and nonprompt charmonium suppression in PbPb collisions at 5.02 TeV | ||
| CMS Collaboration | ||
| 24 December 2017 | ||
| Eur. Phys. J. C 78 (2018) 509 | ||
| Abstract: The nuclear modification factors of $ \mathrm{J}/\psi $ and $ {\psi\text{(2S)}} $ mesons are measured in PbPb collisions at a centre-of-mass energy per nucleon pair of ${\sqrt{\smash[b]{s_{_{\text{NN}}}}}} = $ 5.02 TeV. The analysis is based on PbPb and pp data samples collected by CMS at the LHC in 2015, corresponding to integrated luminosities of 464 $\mu$b$^{-1}$ and 28 pb$^{-1}$, respectively. The measurements are performed in the dimuon rapidity range of $| y | < $ 2.4 as a function of centrality, rapidity, and transverse momentum ($ {p_{\mathrm{T}}} $) from ${p_{\mathrm{T}}}= $ 3 GeV/$c$ in the most forward region and up to 50 GeV/$c$. Both prompt and nonprompt (coming from b hadron decays) $ \mathrm{J}/\psi $ mesons are observed to be increasingly suppressed with centrality, with a magnitude similar to the one observed at ${\sqrt{\smash[b]{s_{_{\text{NN}}}}}} = $ 2.76 TeV for the two $ \mathrm{J}/\psi $ meson components. No dependence on rapidity is observed for either prompt or nonprompt $ \mathrm{J}/\psi $ mesons. An indication of a lower prompt $ \mathrm{J}/\psi $ meson suppression at ${p_{\mathrm{T}}} > $ 25 GeV/$c$ is seen with respect to that observed at intermediate ${p_{\mathrm{T}}}$. The prompt $ {\psi\text{(2S)}} $ meson yield is found to be more suppressed than that of the prompt $ \mathrm{J}/\psi $ mesons in the entire ${p_{\mathrm{T}}}$ range. | ||
| Links: e-print arXiv:1712.08959 [nucl-ex] (PDF) ; CDS record ; inSPIRE record ; HepData record ; CADI line (restricted) ; | ||
| Figures | |
png pdf |
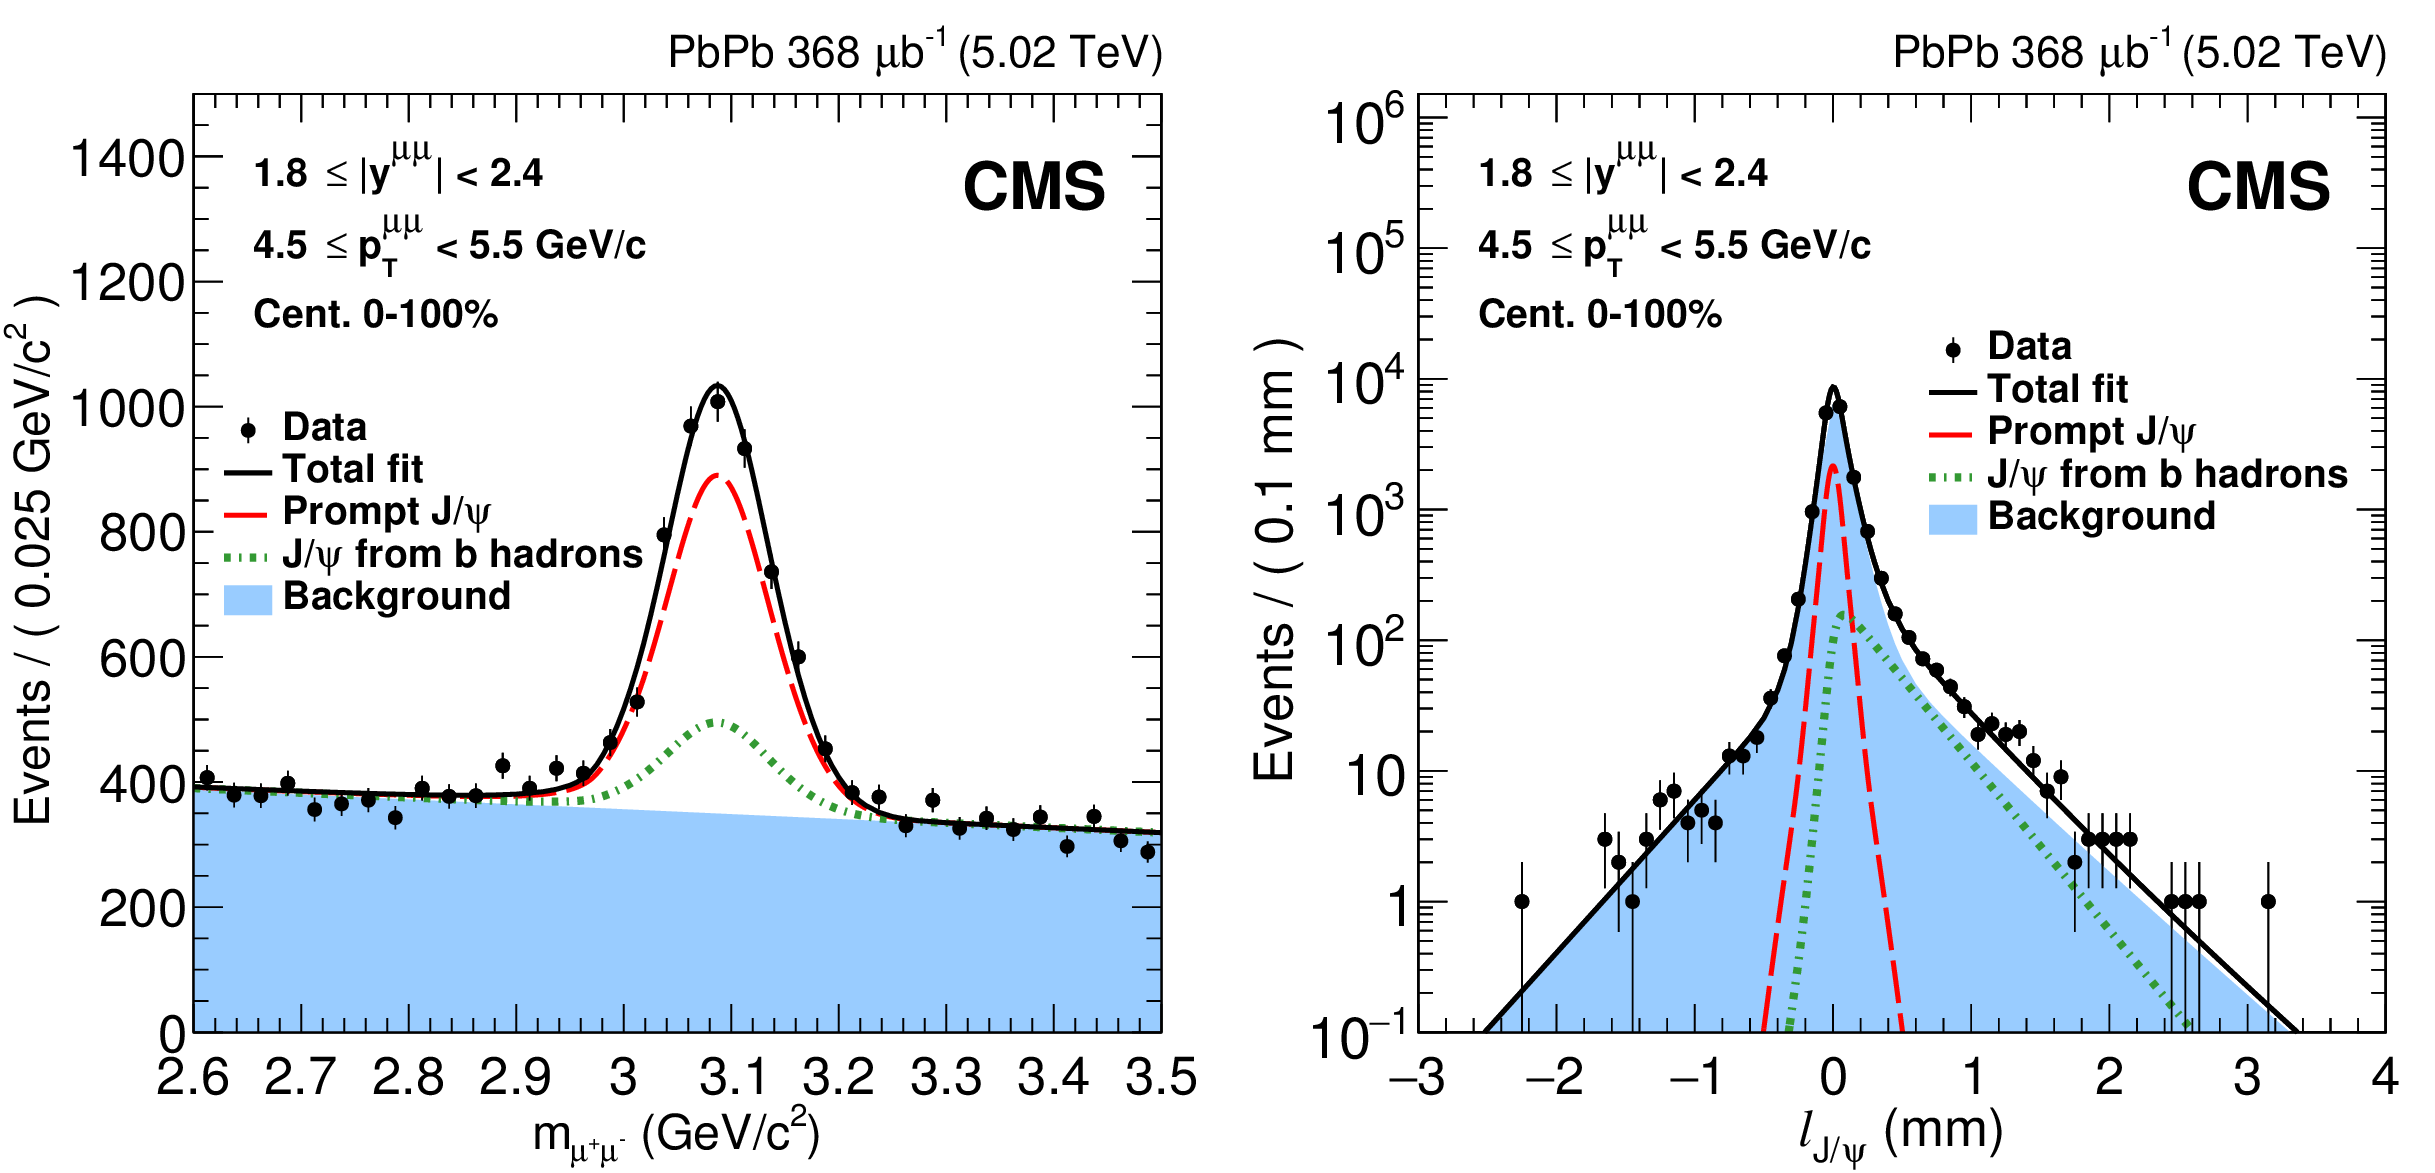
Figure 1:
Invariant mass spectrum of $ {{\mu ^+} {\mu ^-}} $ pairs (left) and pseudo-proper decay length distribution (right) in PbPb collisions for 1.8 $ < | y | < $ 2.4, 4.5 $ < {p_{\mathrm {T}}} < $ 5.5 GeV/$c$, for all centralities. The result of the fit described in the text is also shown. |
png pdf |
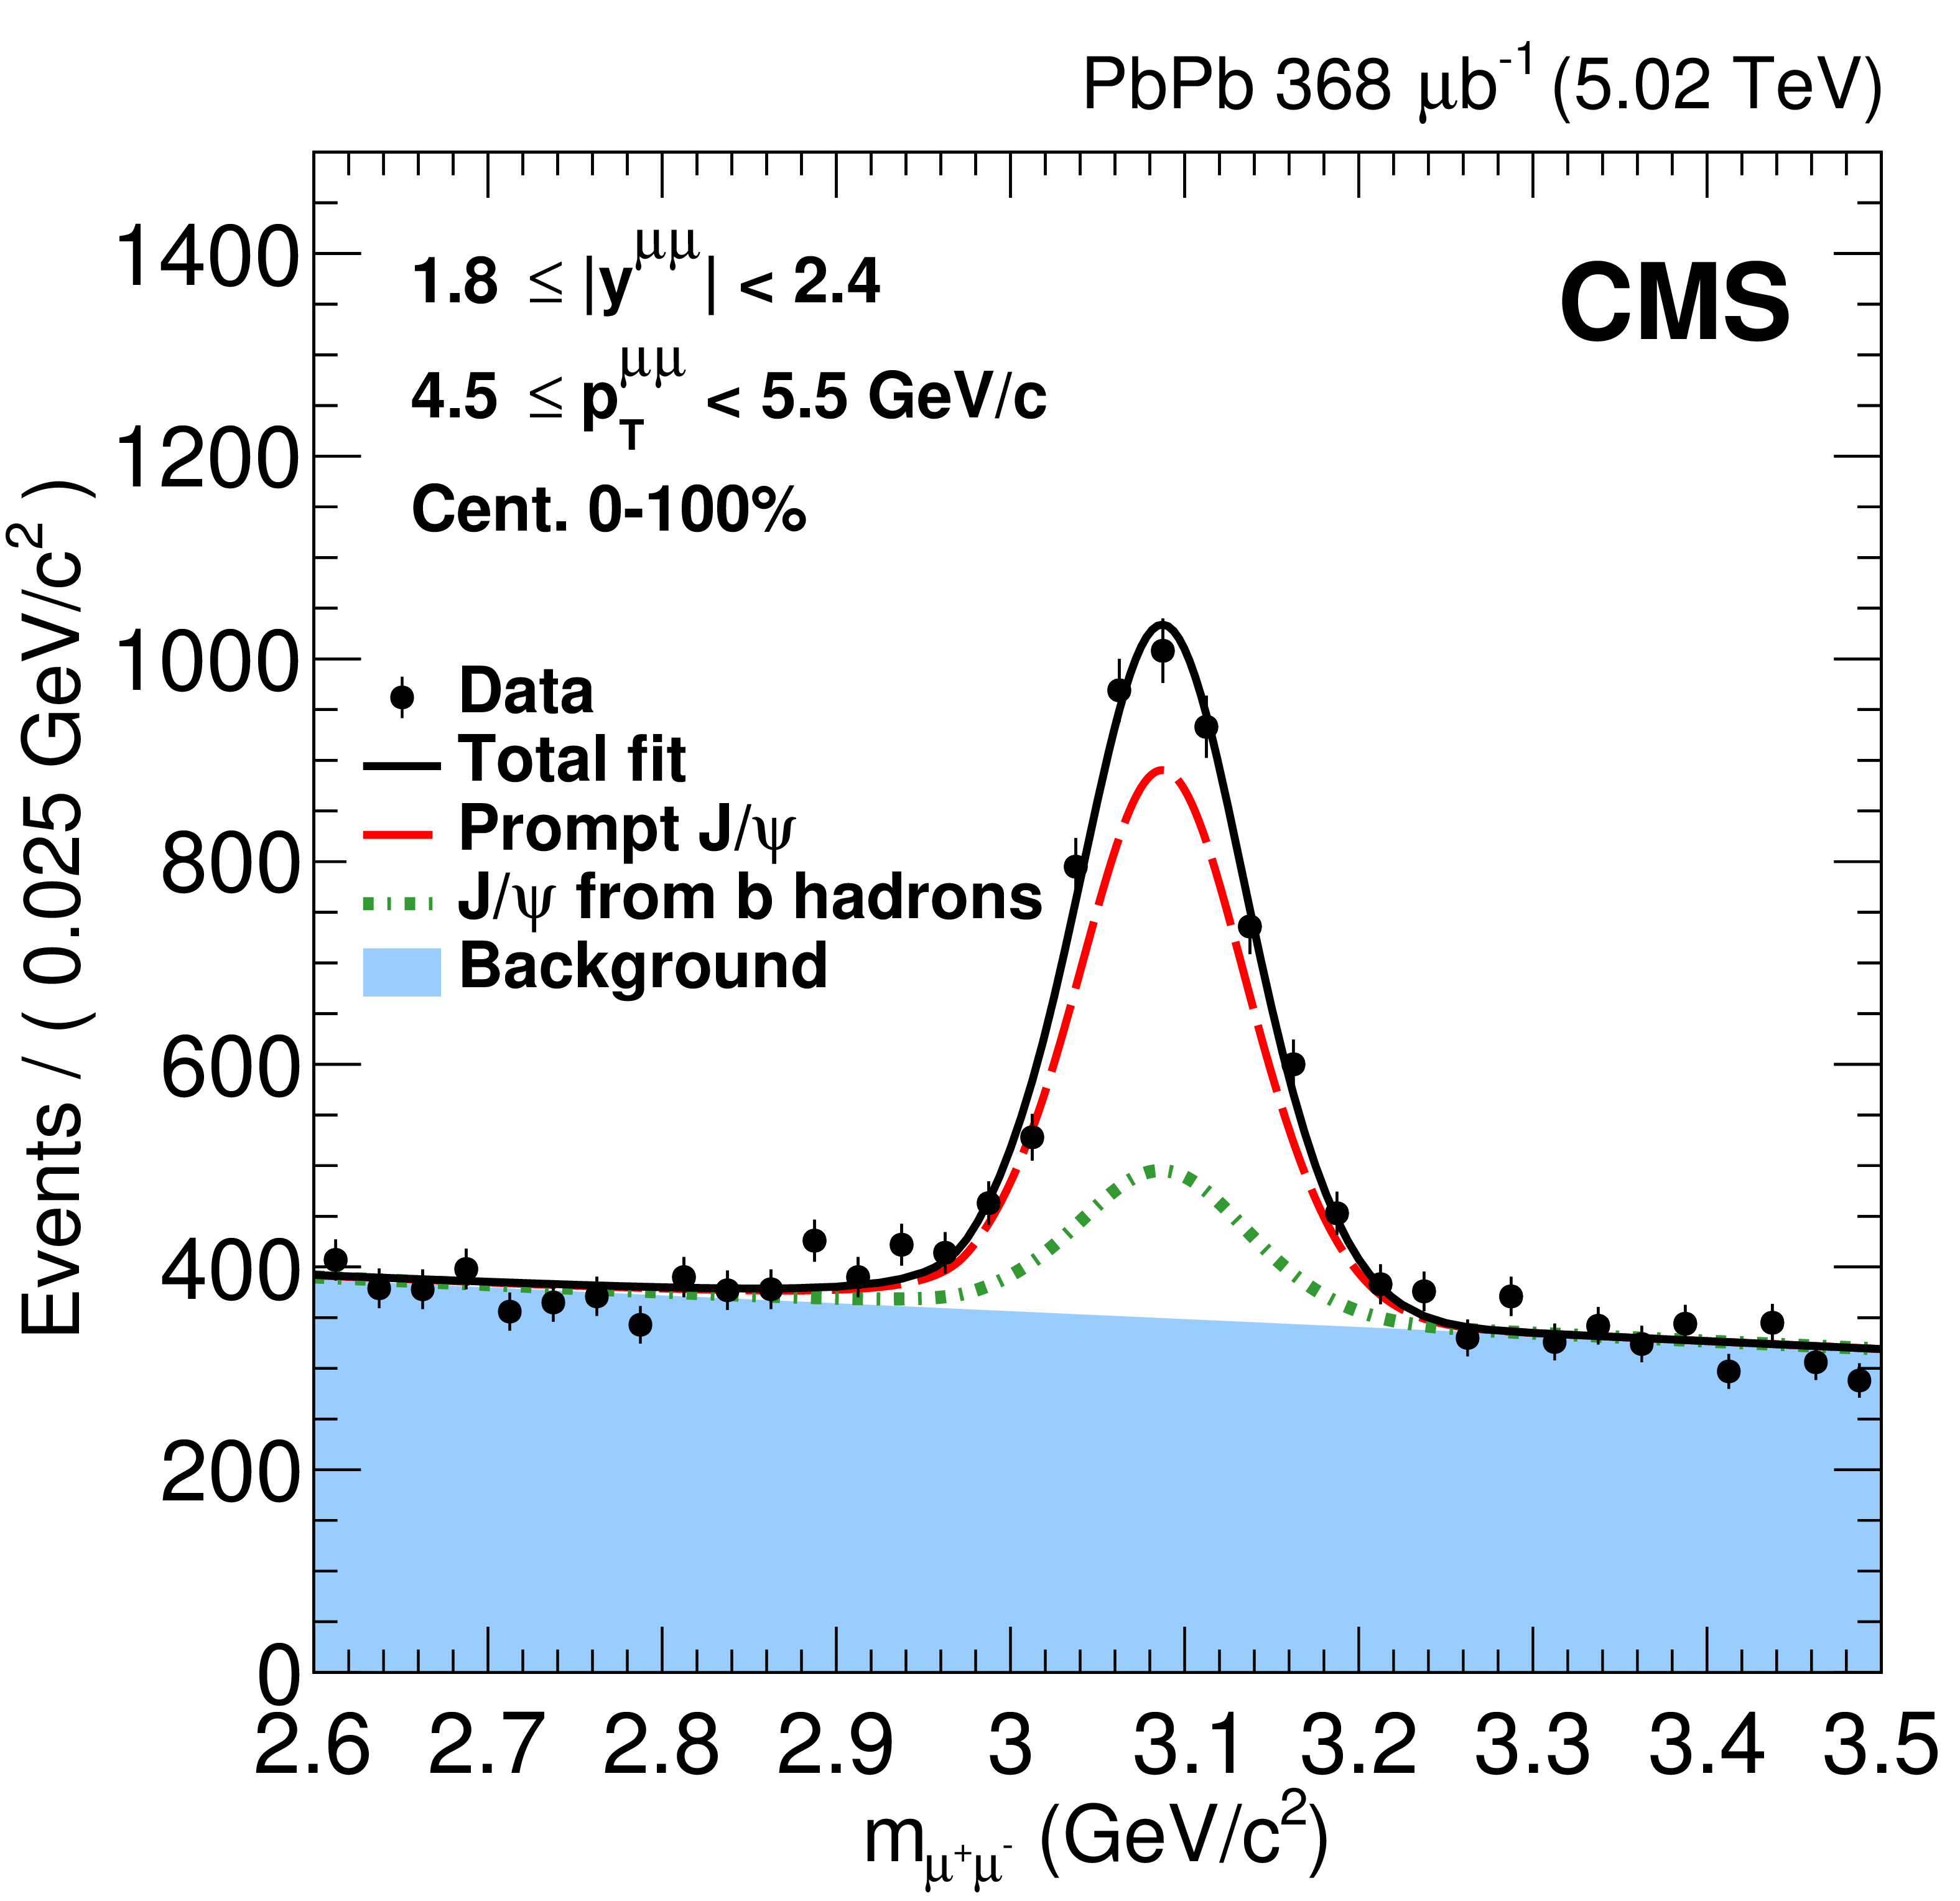
Figure 1-a:
Invariant mass spectrum of $ {{\mu ^+} {\mu ^-}} $ pairs in PbPb collisions for 1.8 $ < | y | < $ 2.4, 4.5 $ < {p_{\mathrm {T}}} < $ 5.5 GeV/$c$, for all centralities. The result of the fit described in the text is also shown. |
png pdf |
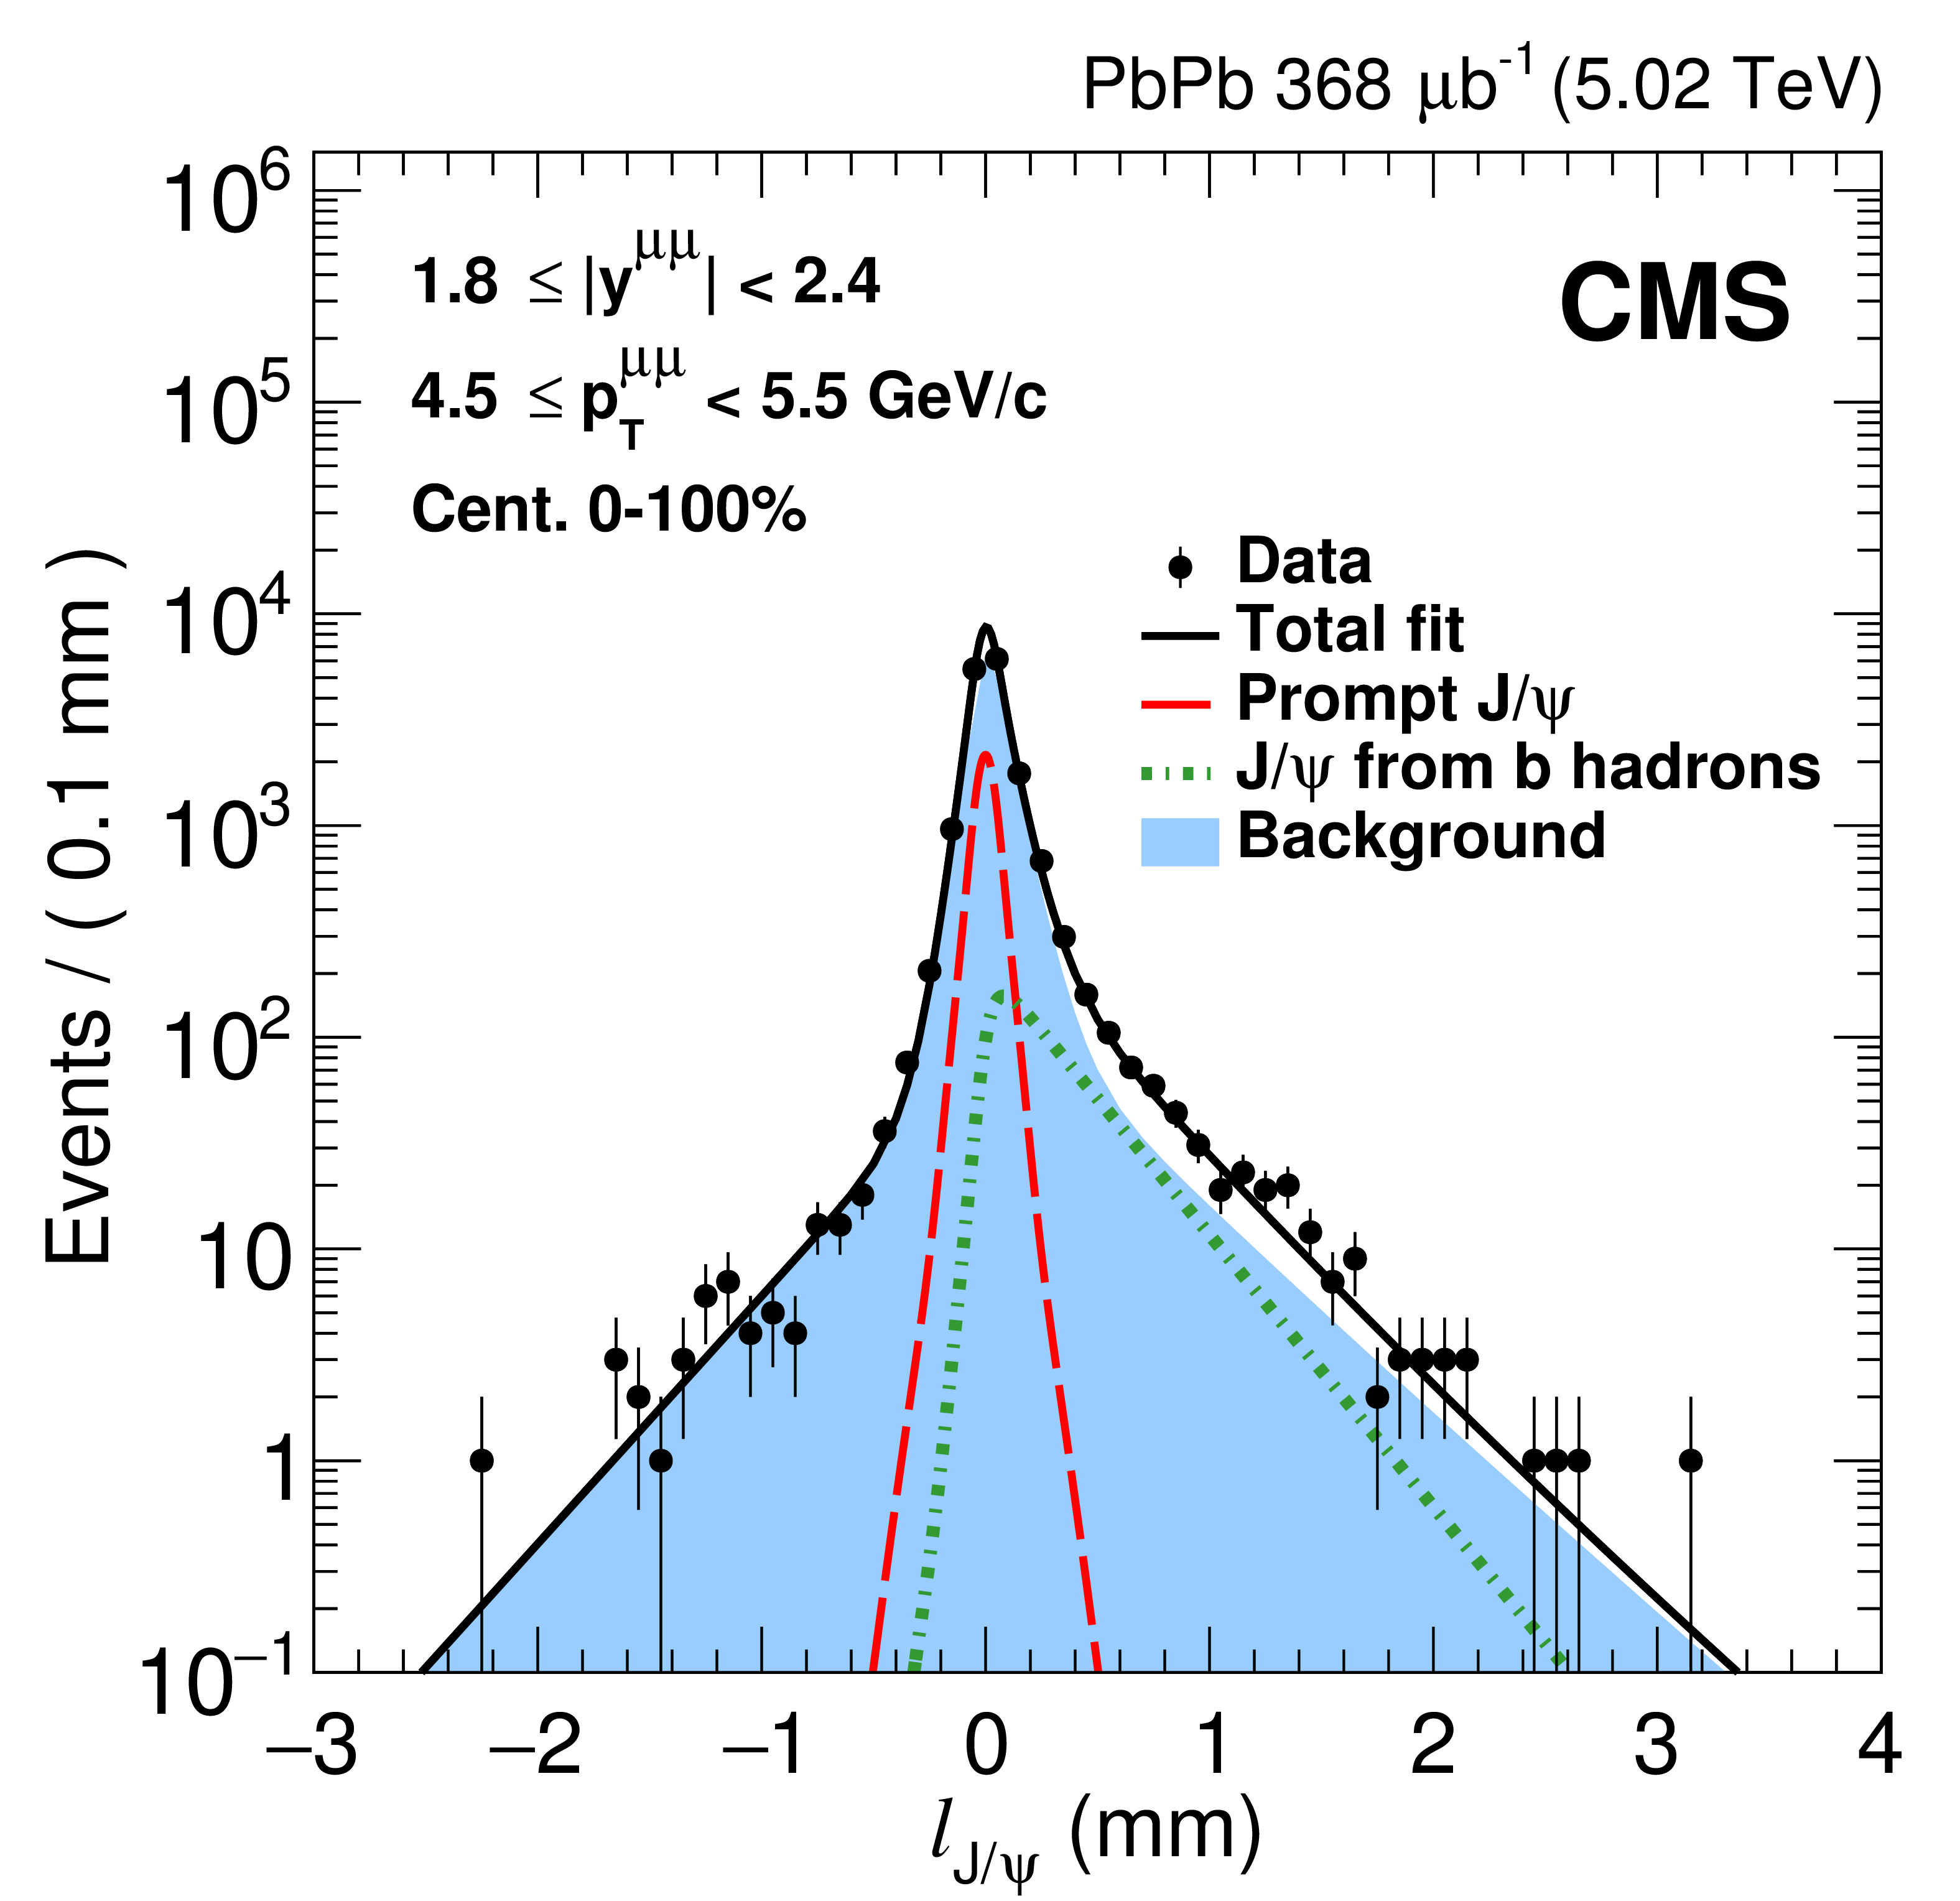
Figure 1-b:
Pseudo-proper decay length distribution in PbPb collisions for 1.8 $ < | y | < $ 2.4, 4.5 $ < {p_{\mathrm {T}}} < $ 5.5 GeV/$c$, for all centralities. The result of the fit described in the text is also shown. |
png pdf |
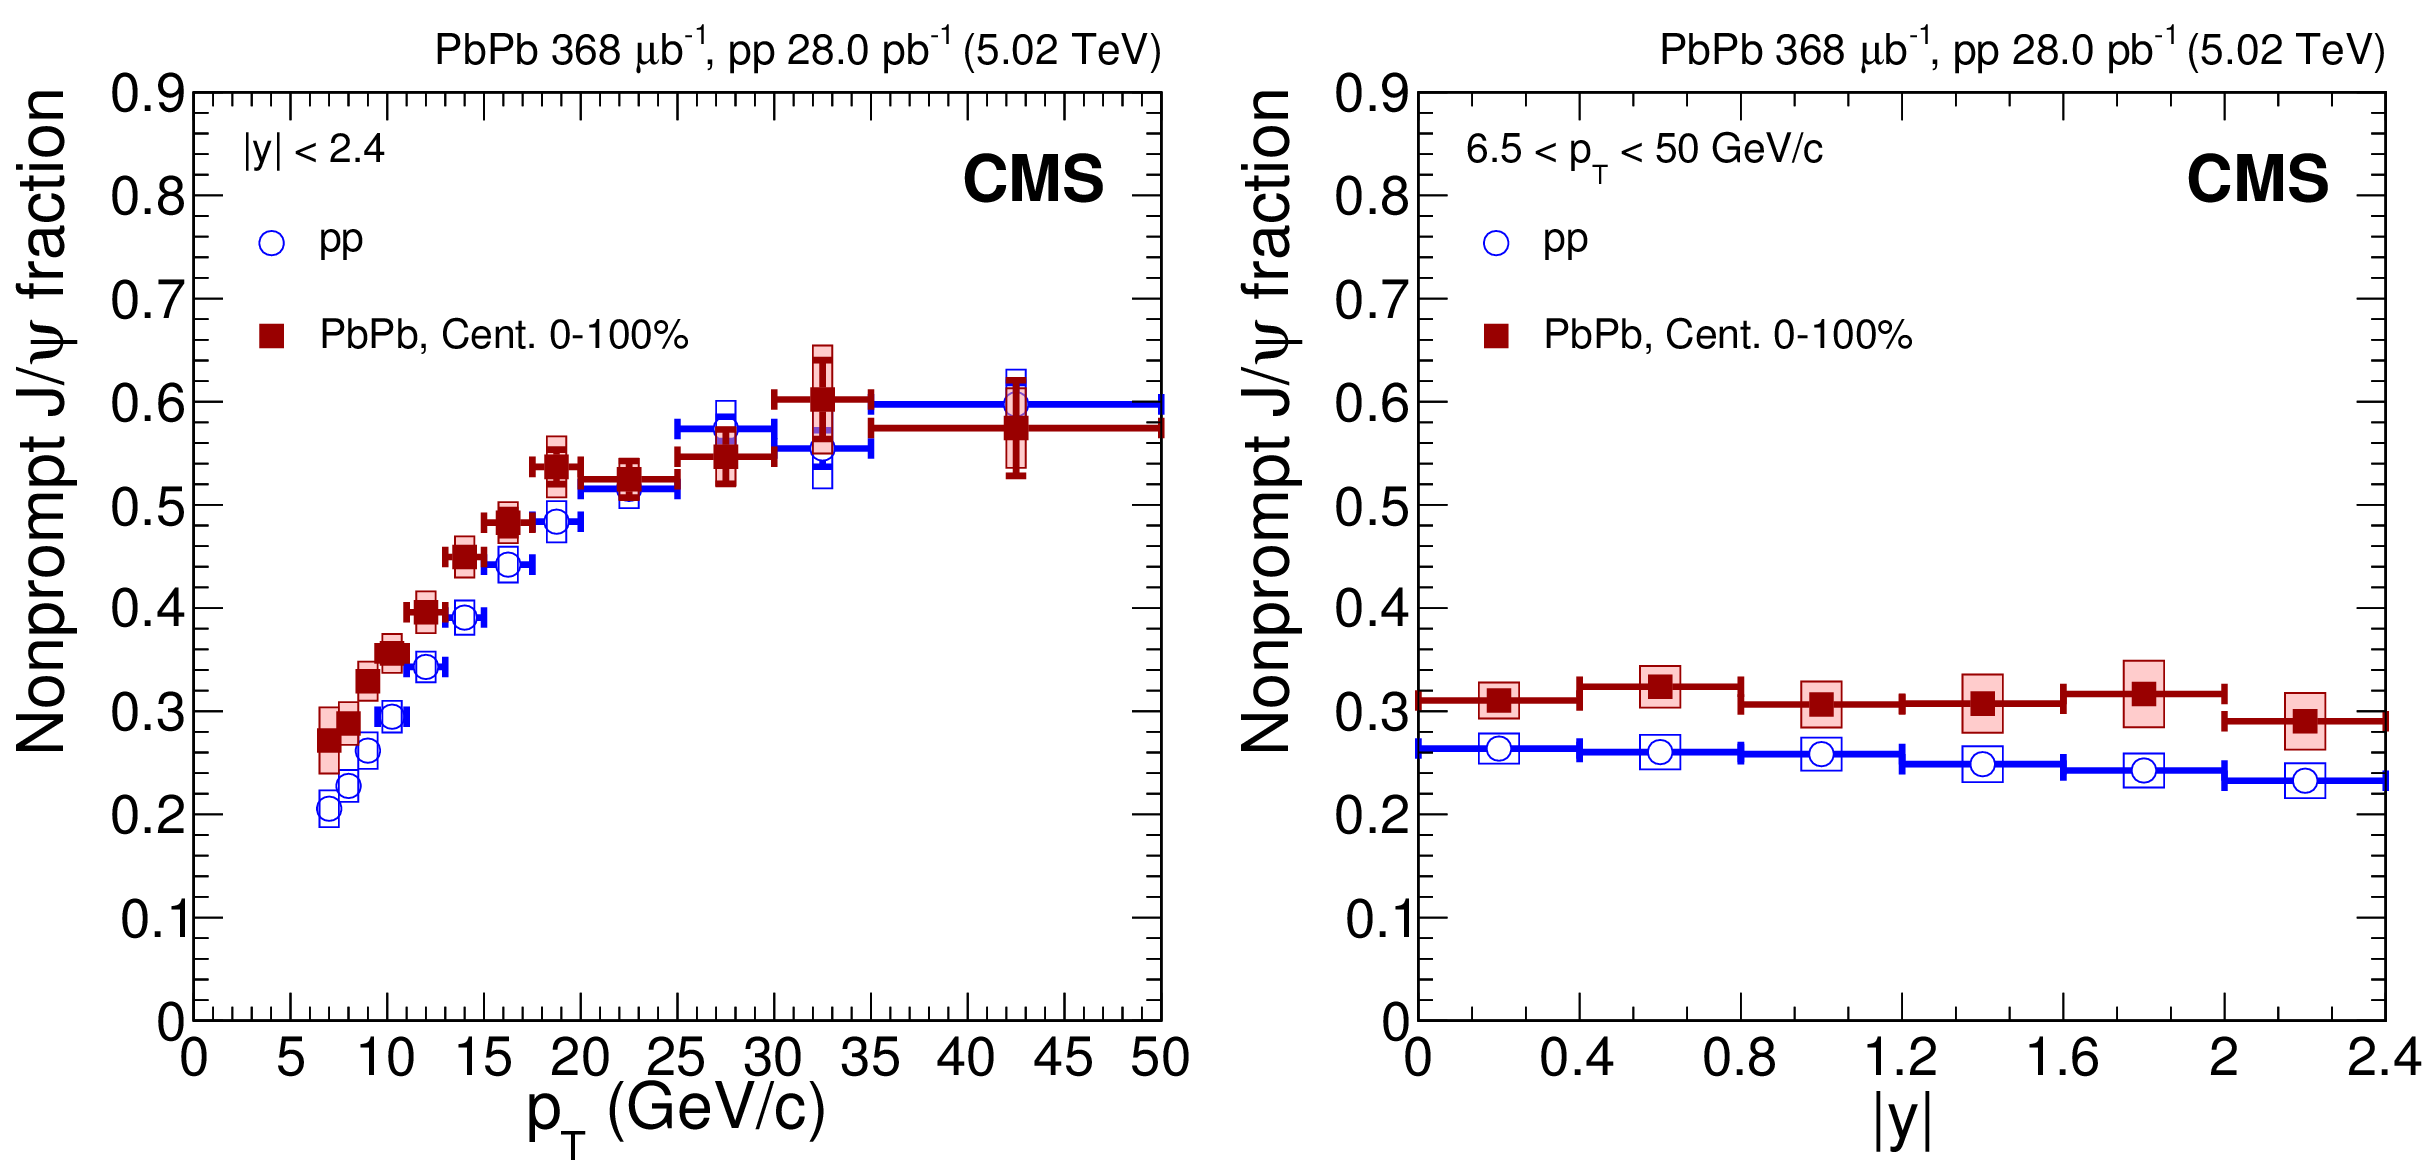
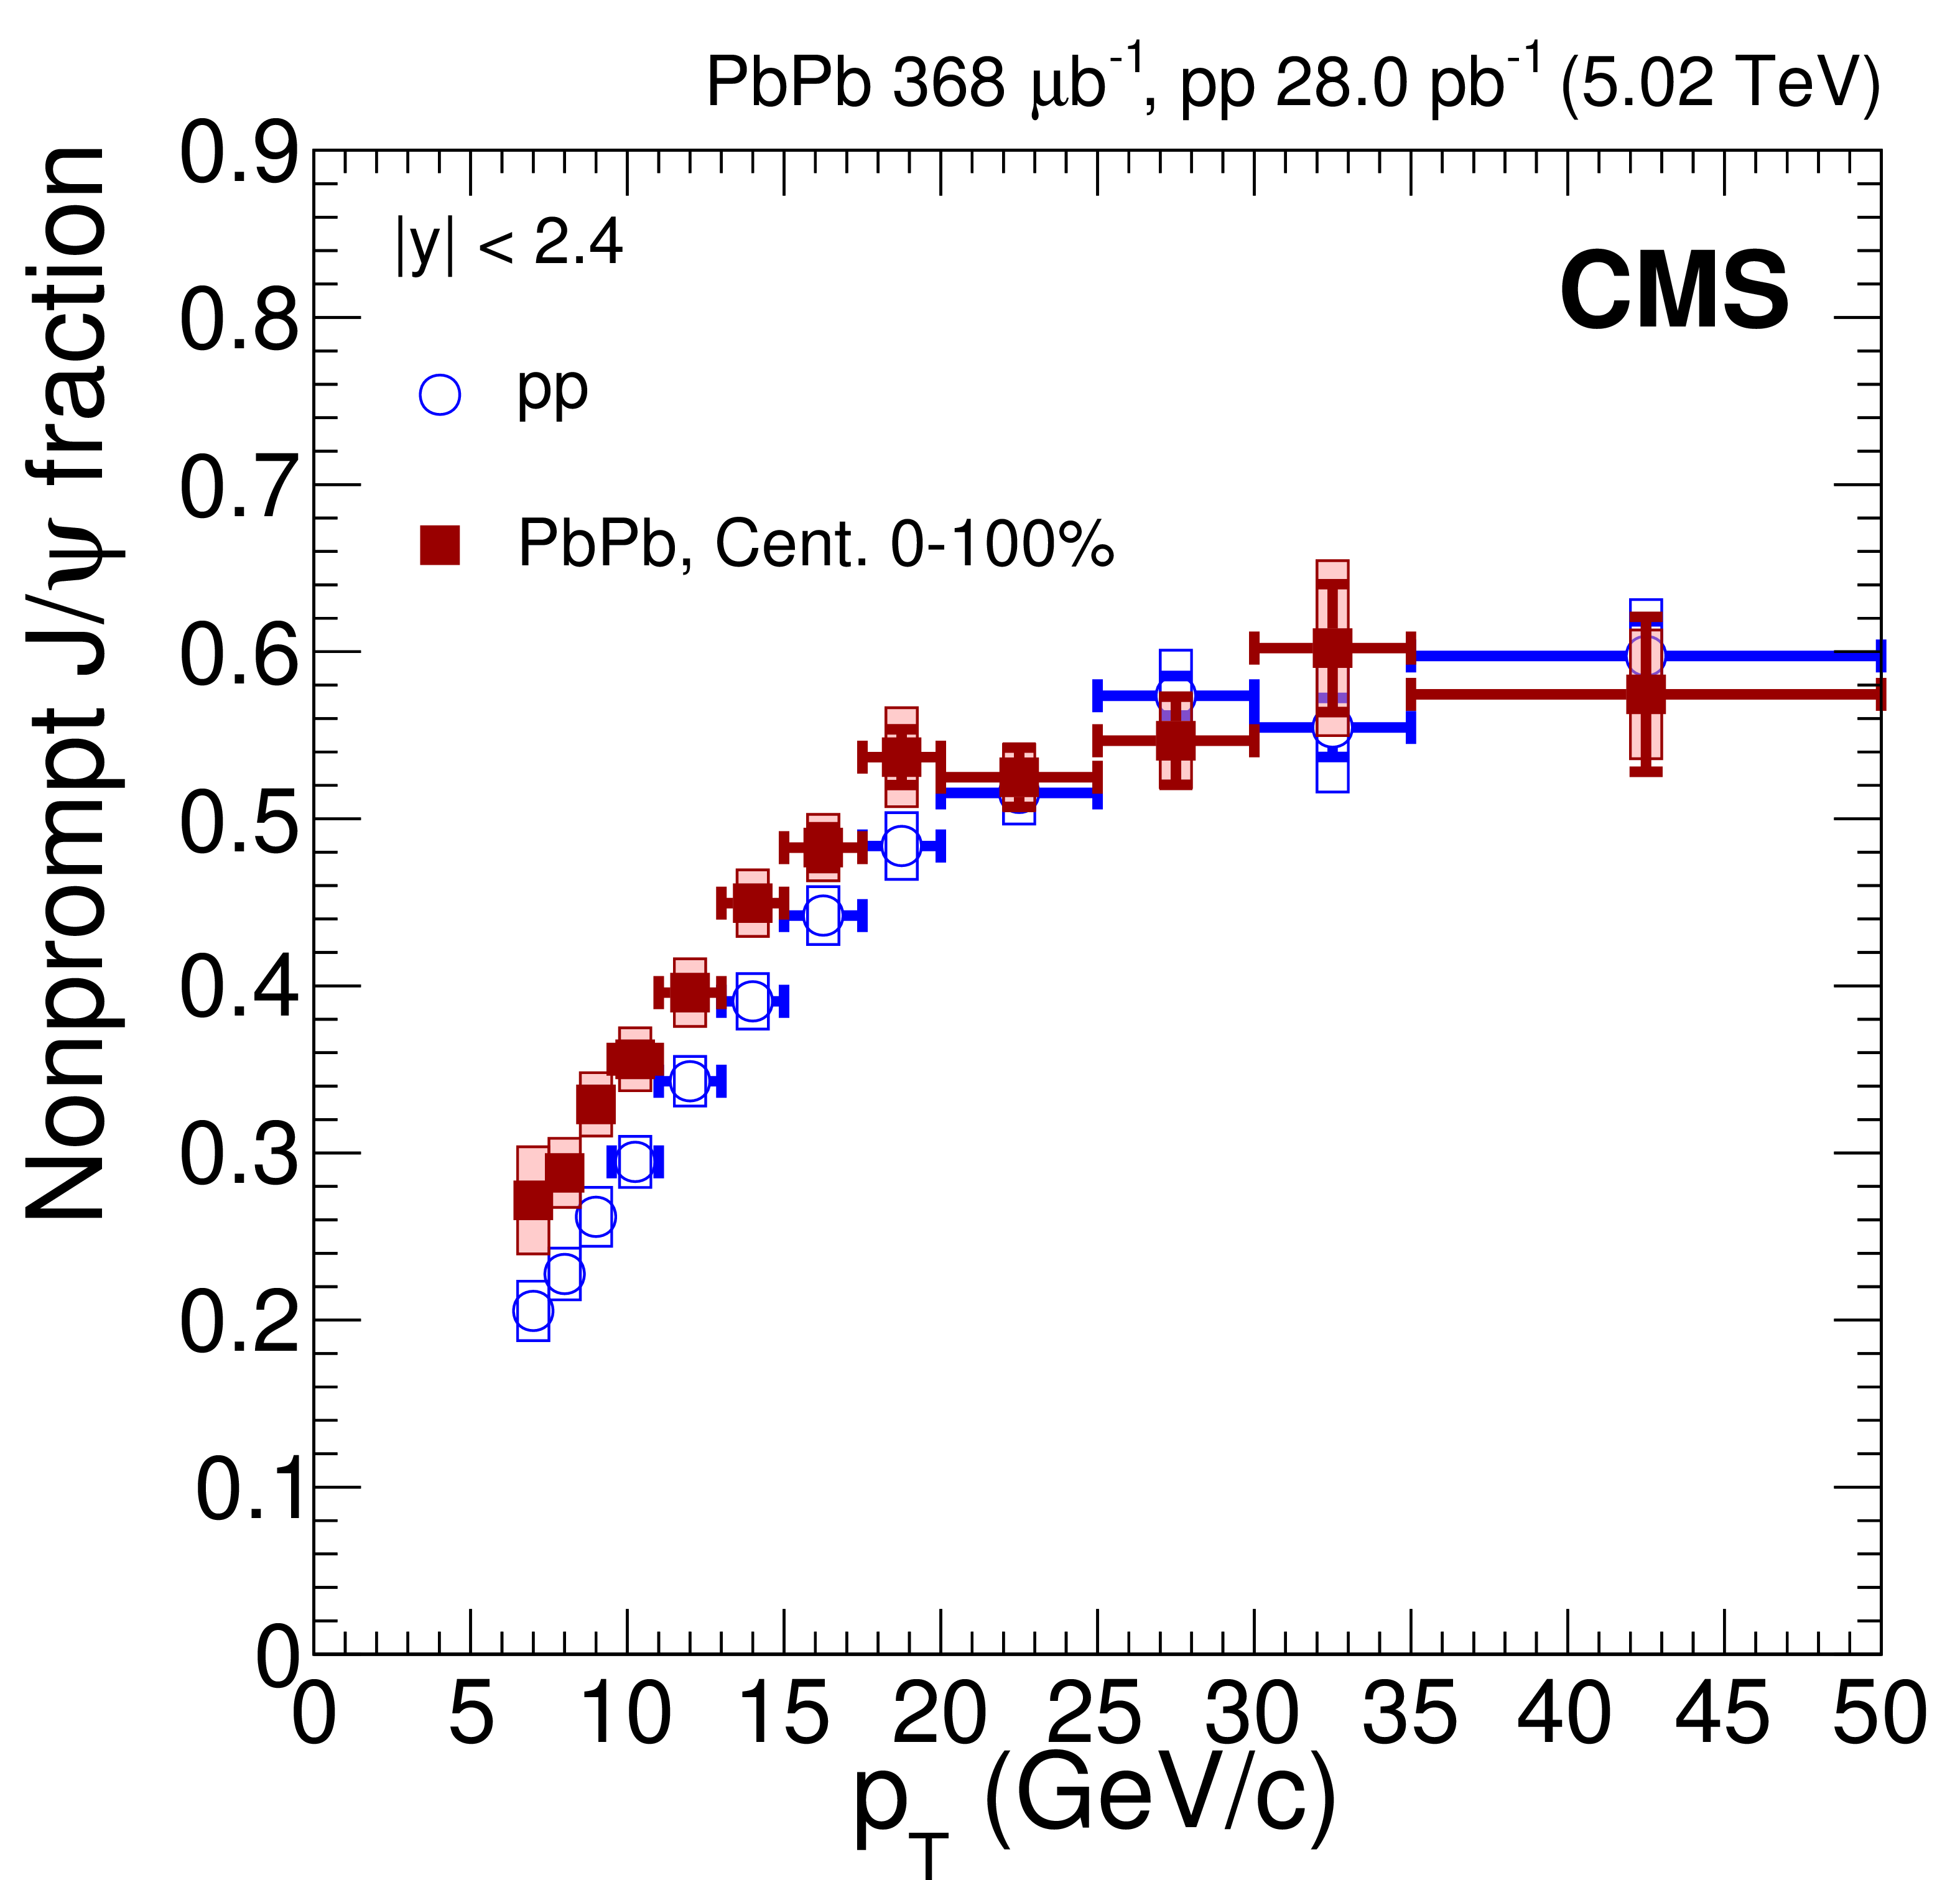
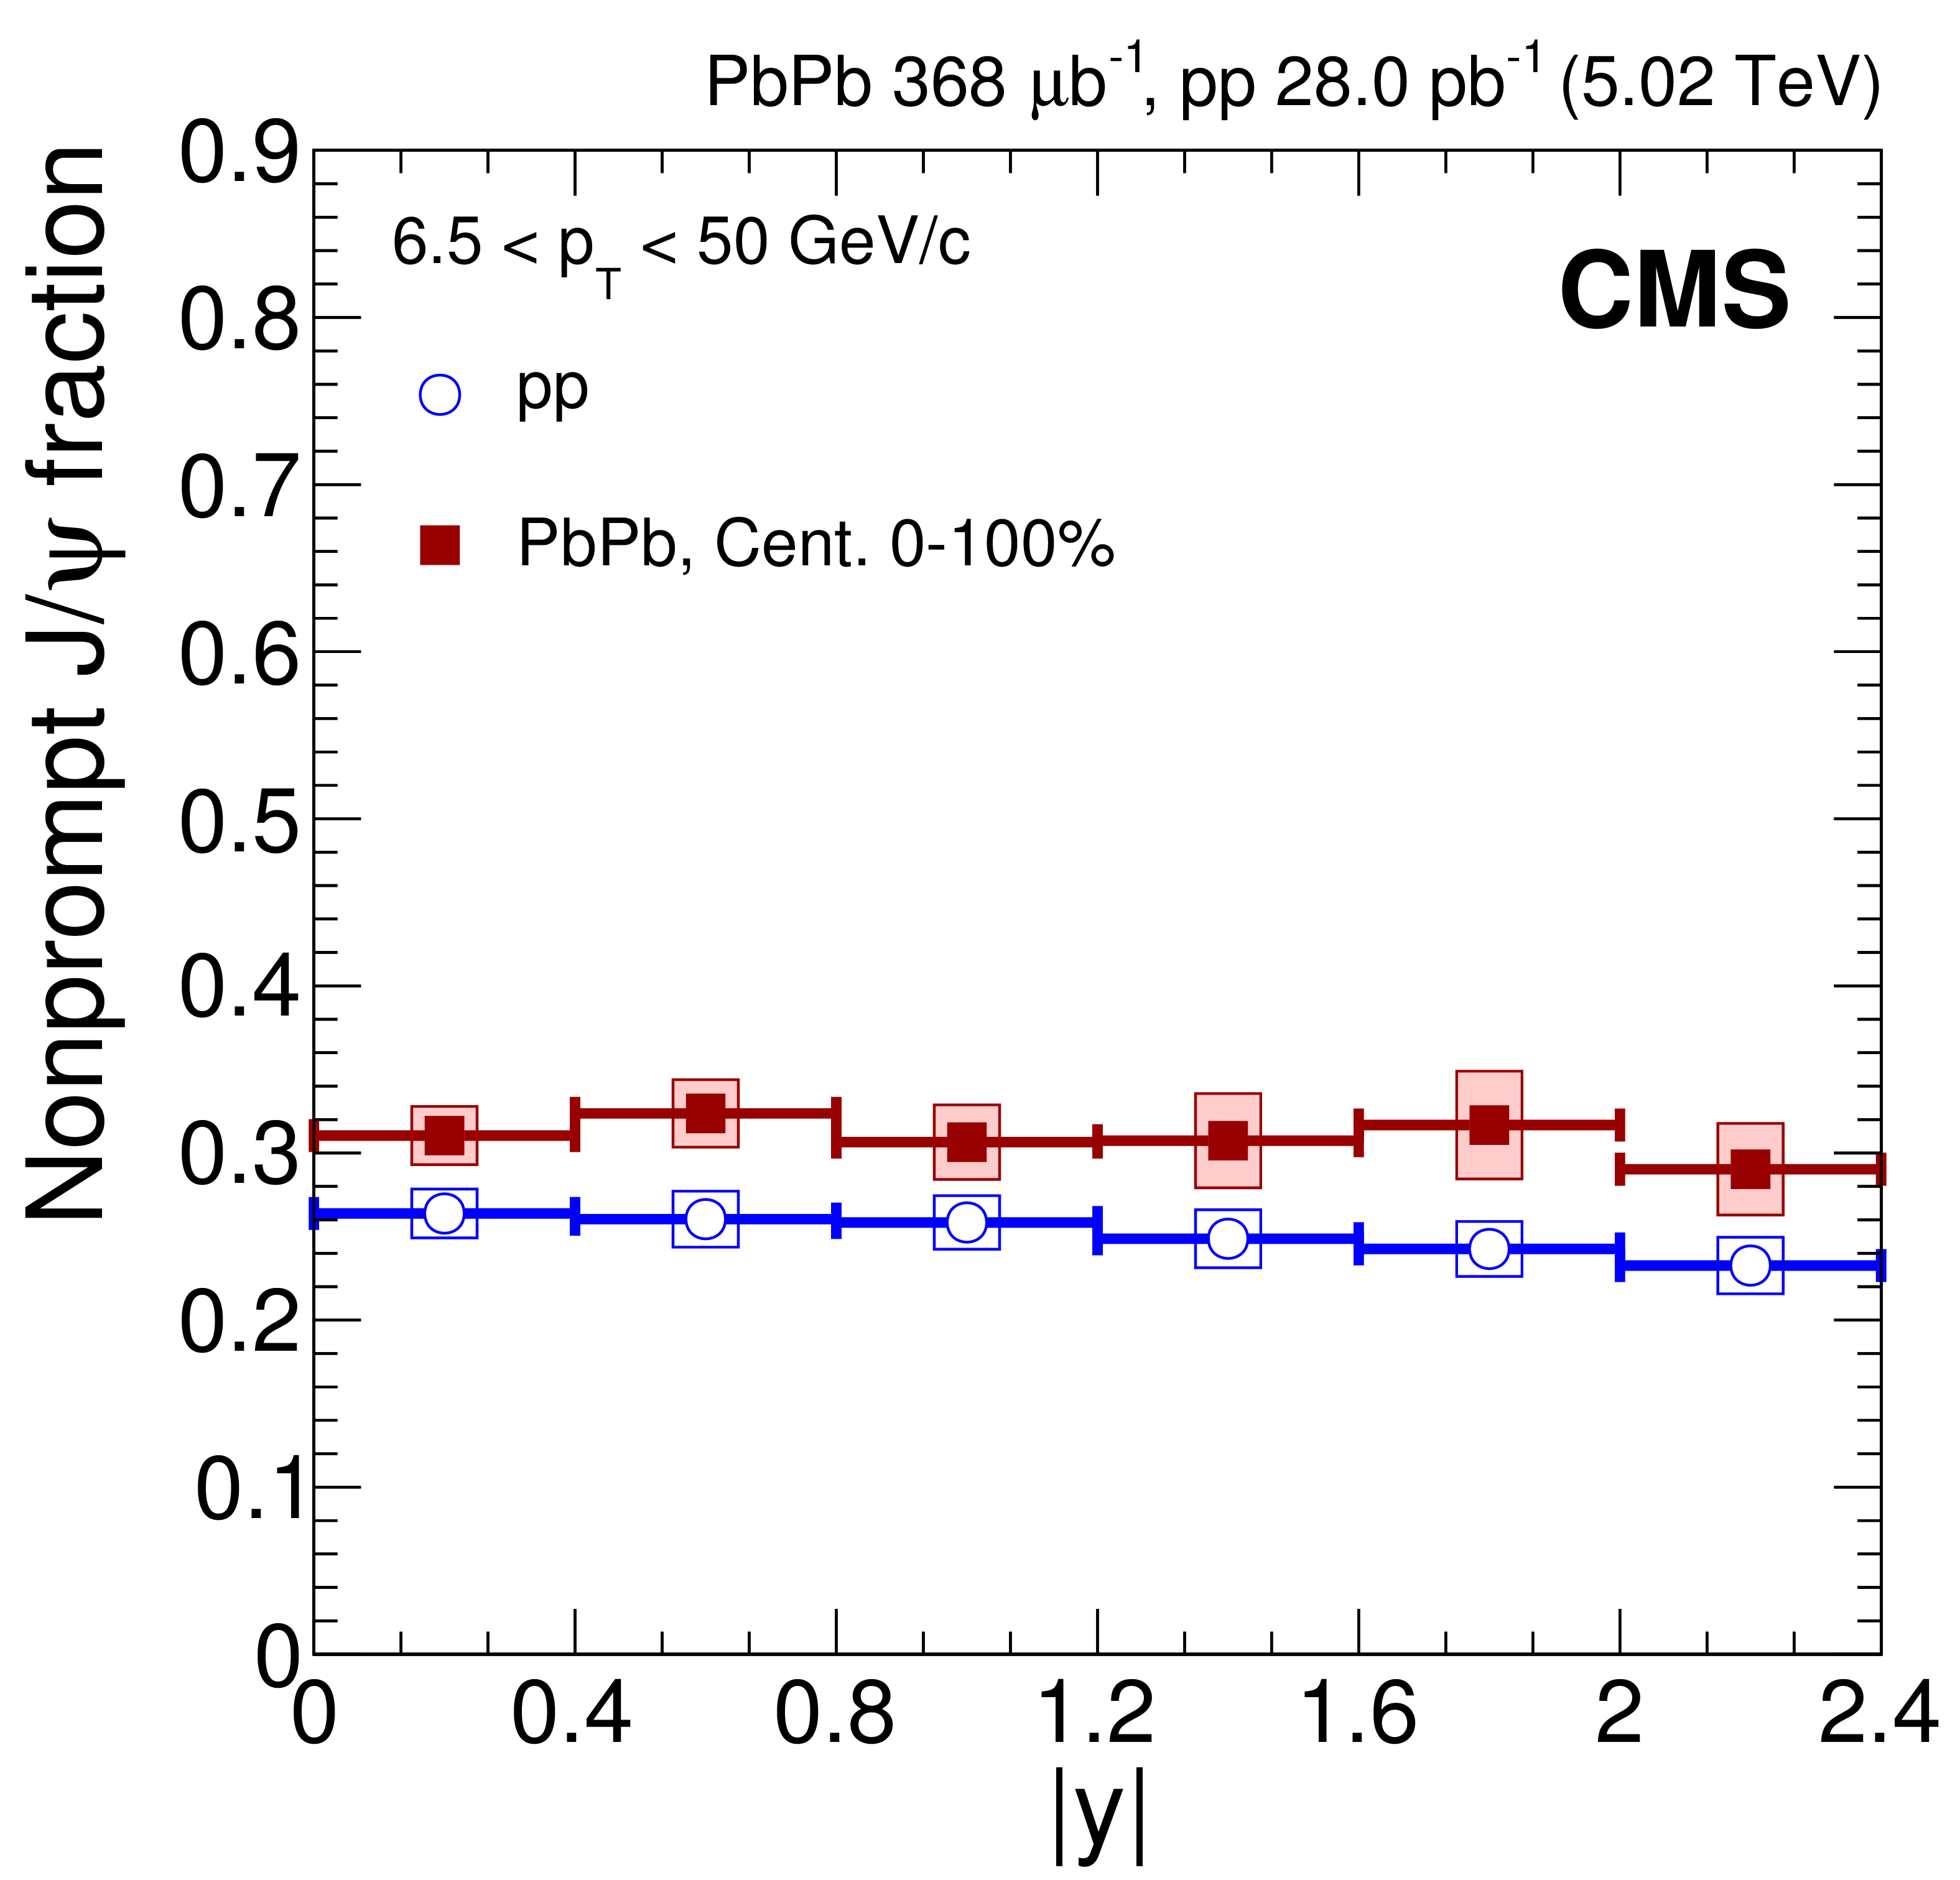
Figure 2:
Fraction of $ \mathrm {J}/\psi $ mesons coming from the decay of b hadrons, i.e. nonprompt $ \mathrm {J}/\psi $ meson fraction, as a function of dimuon $ {p_{\mathrm {T}}} $ (left) and rapidity (right) for pp and PbPb collisions, for all centralities. The bars (boxes) represent statistical (systematic) point-by-point uncertainties. |
png pdf |
Figure 2-a:
Fraction of $ \mathrm {J}/\psi $ mesons coming from the decay of b hadrons, i.e. nonprompt $ \mathrm {J}/\psi $ meson fraction, as a function of dimuon $ {p_{\mathrm {T}}} $ for pp and PbPb collisions, for all centralities. The bars (boxes) represent statistical (systematic) point-by-point uncertainties. |
png pdf |
Figure 2-b:
Fraction of $ \mathrm {J}/\psi $ mesons coming from the decay of b hadrons, i.e. nonprompt $ \mathrm {J}/\psi $ meson fraction, as a function of dimuon rapidity for pp and PbPb collisions, for all centralities. The bars (boxes) represent statistical (systematic) point-by-point uncertainties. |
png pdf |
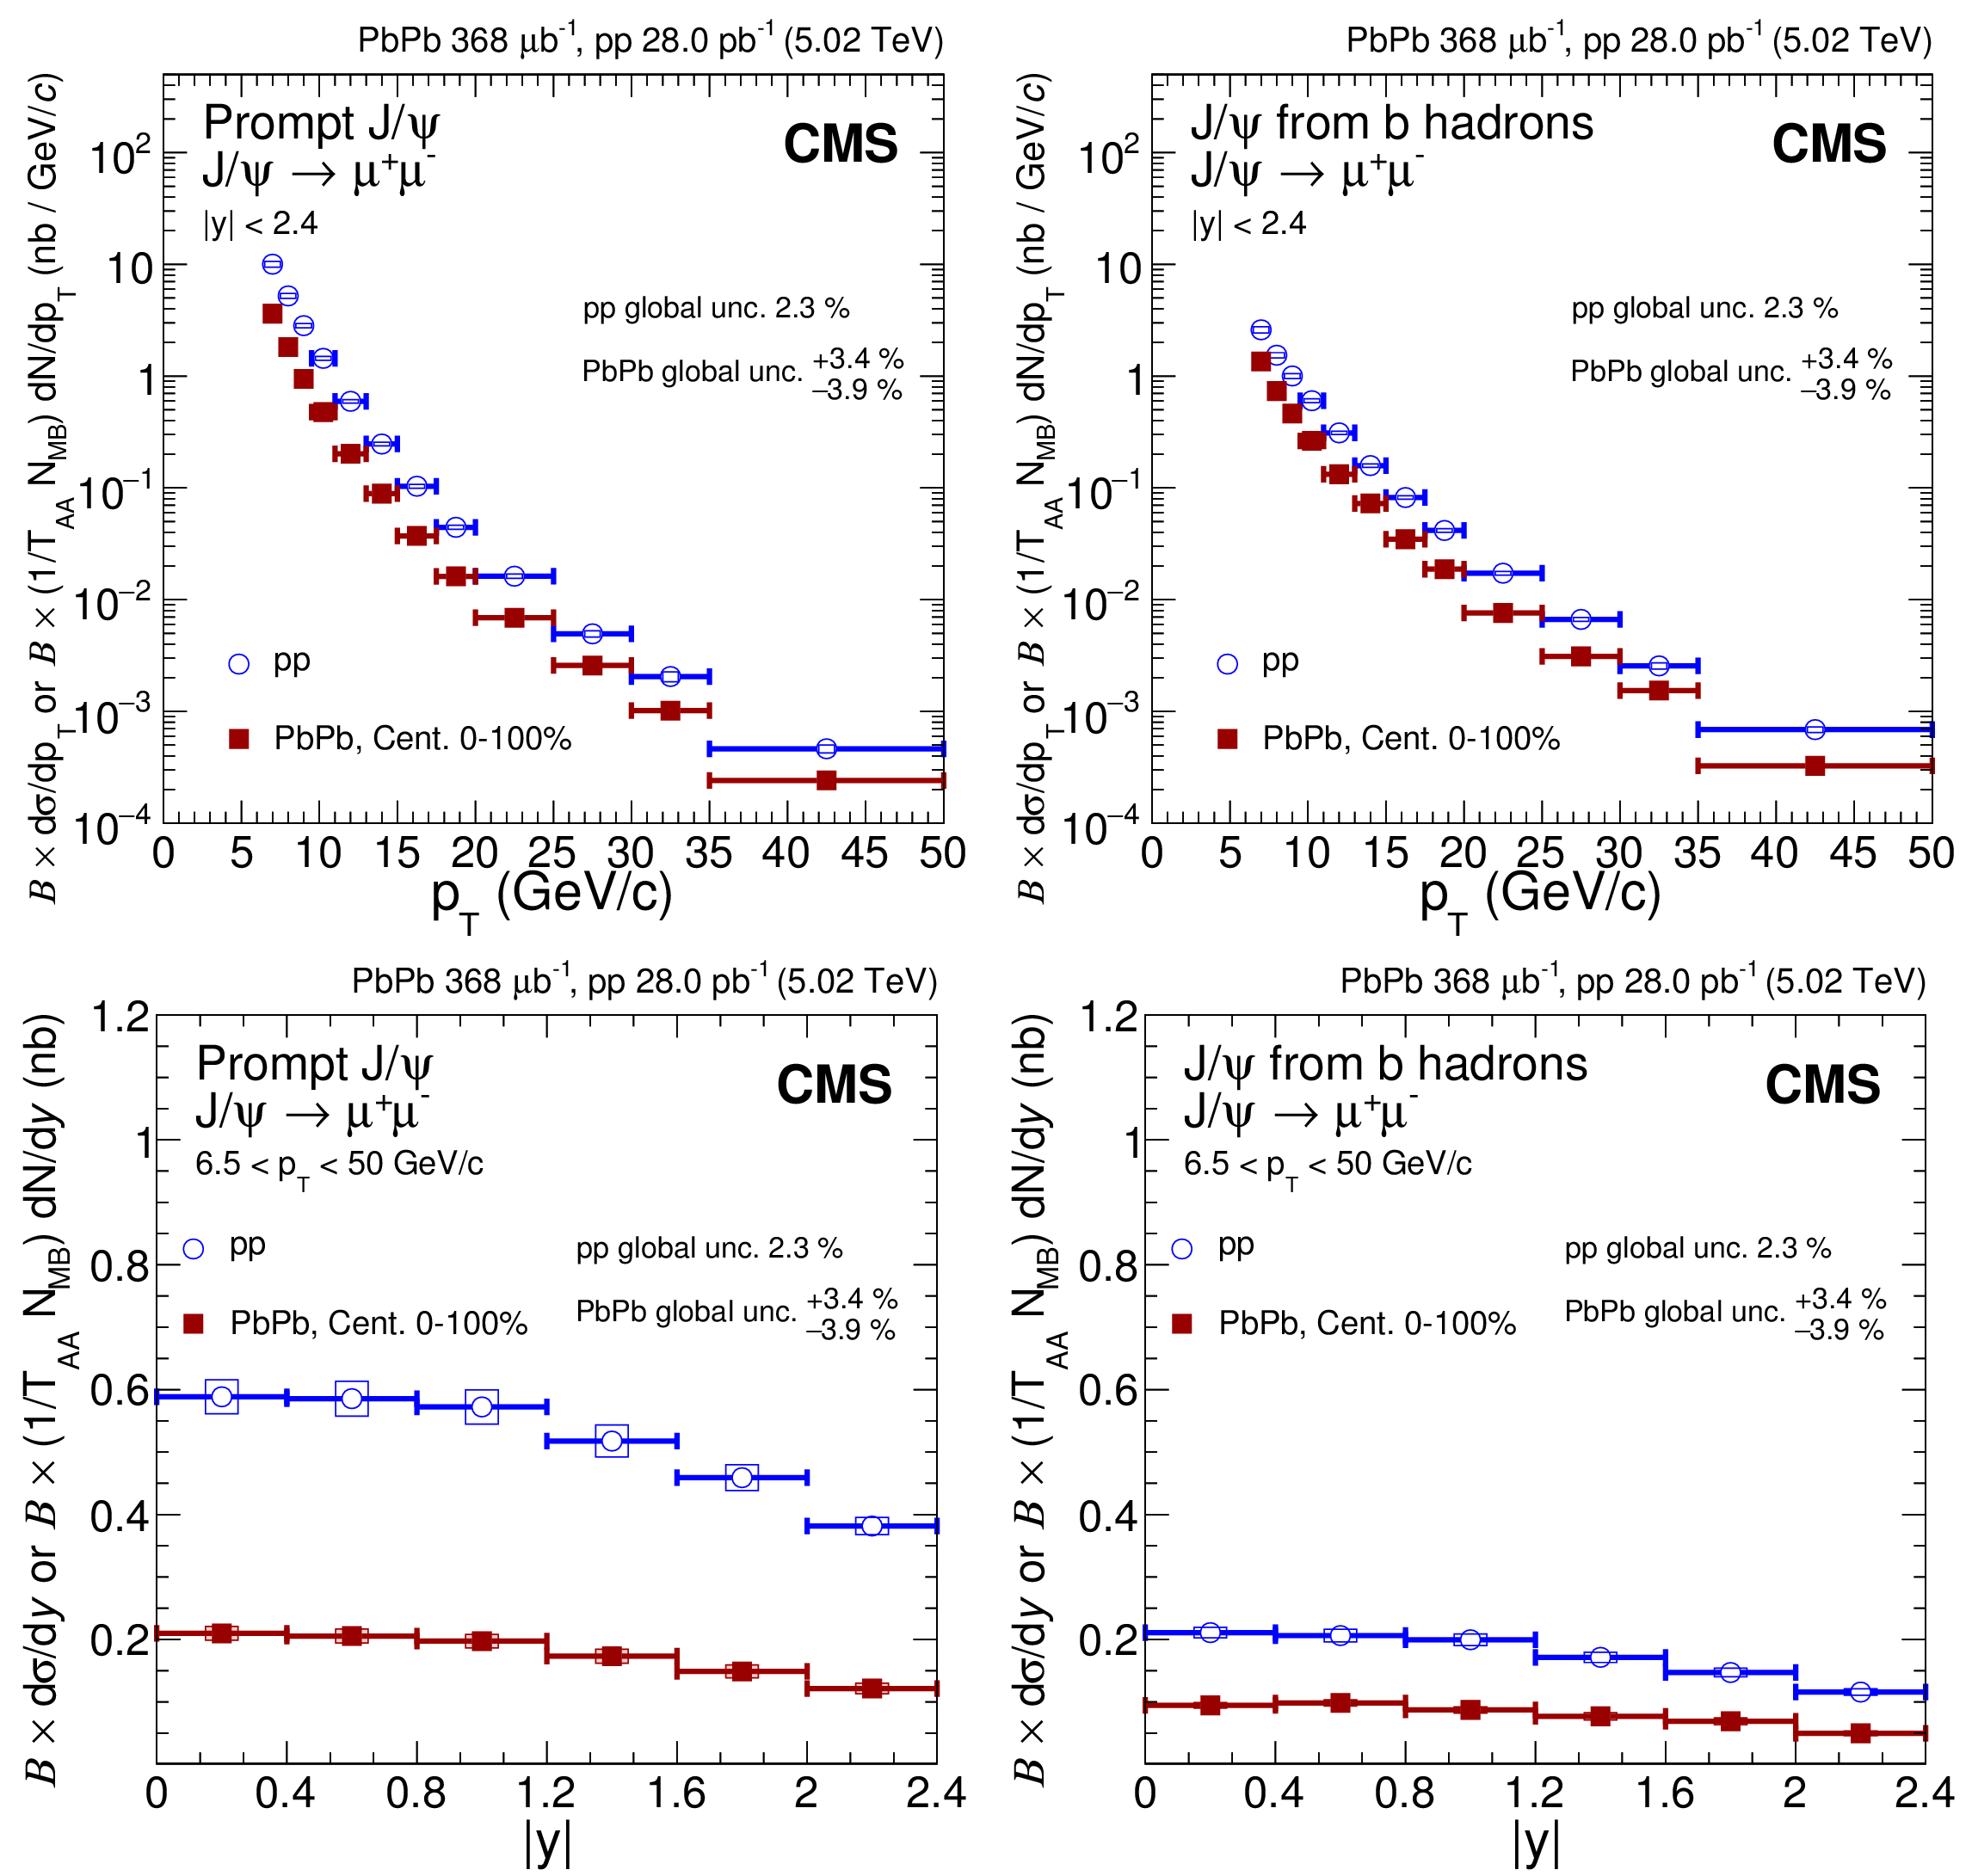
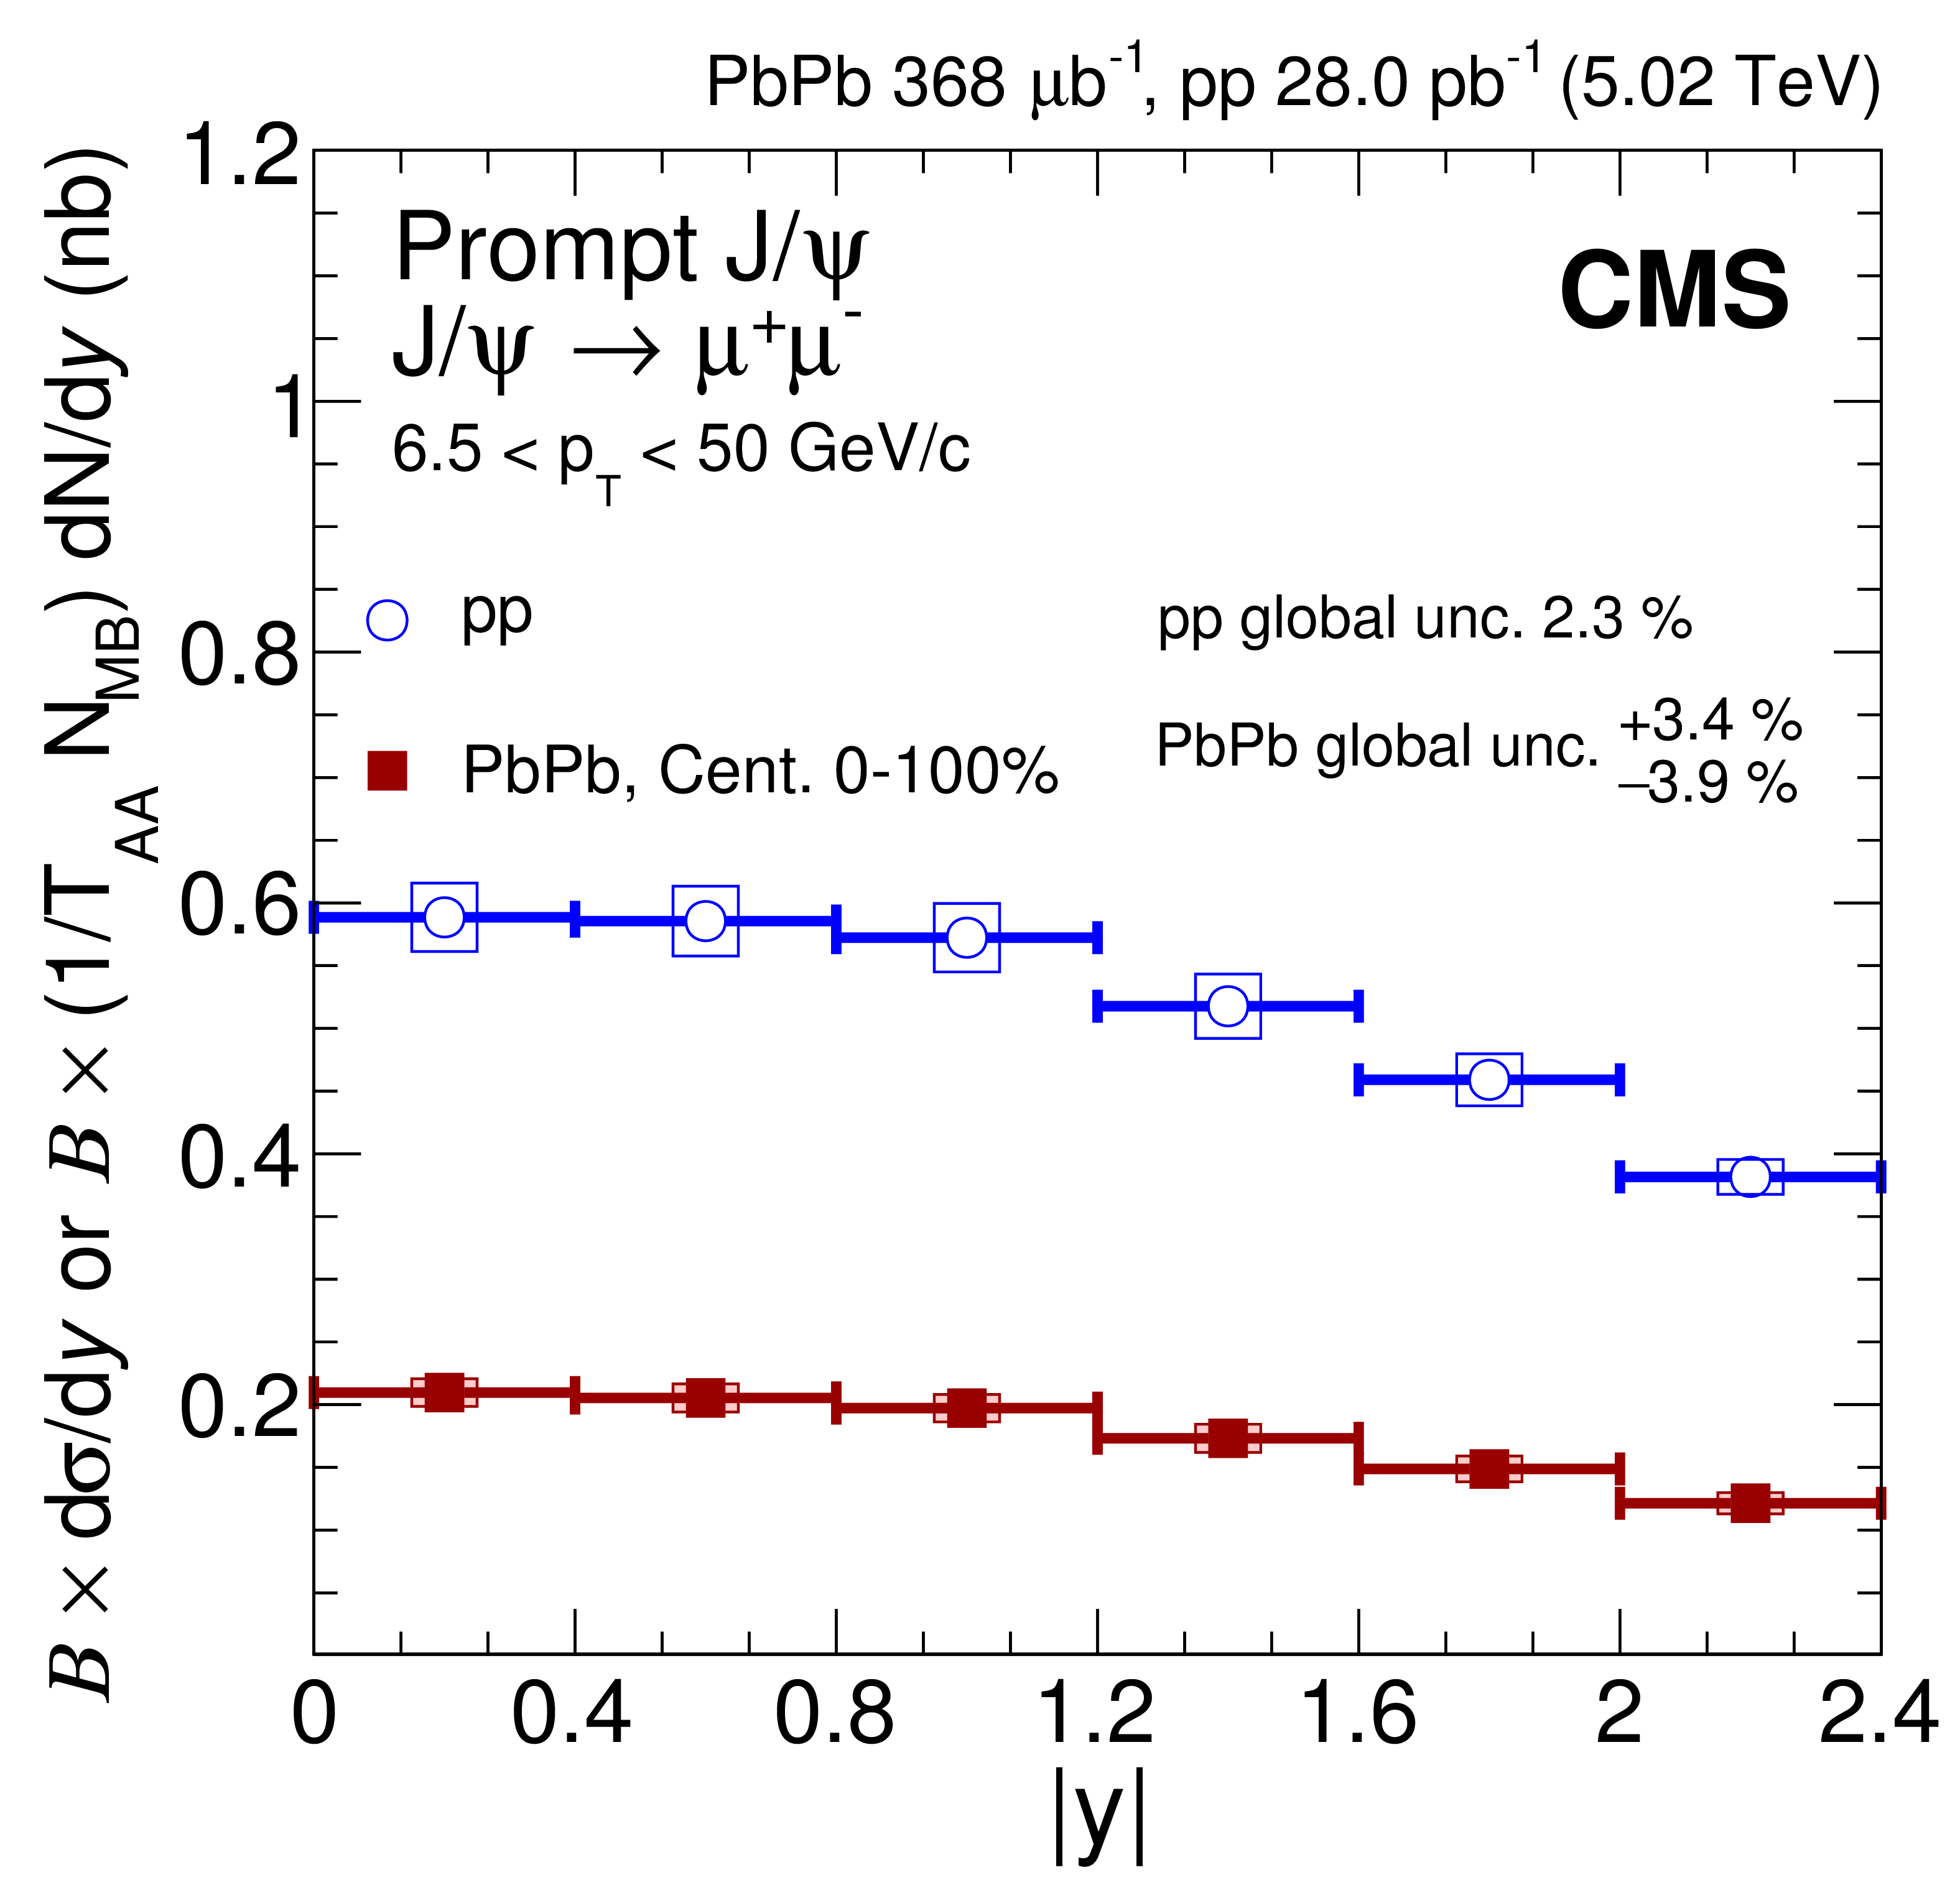
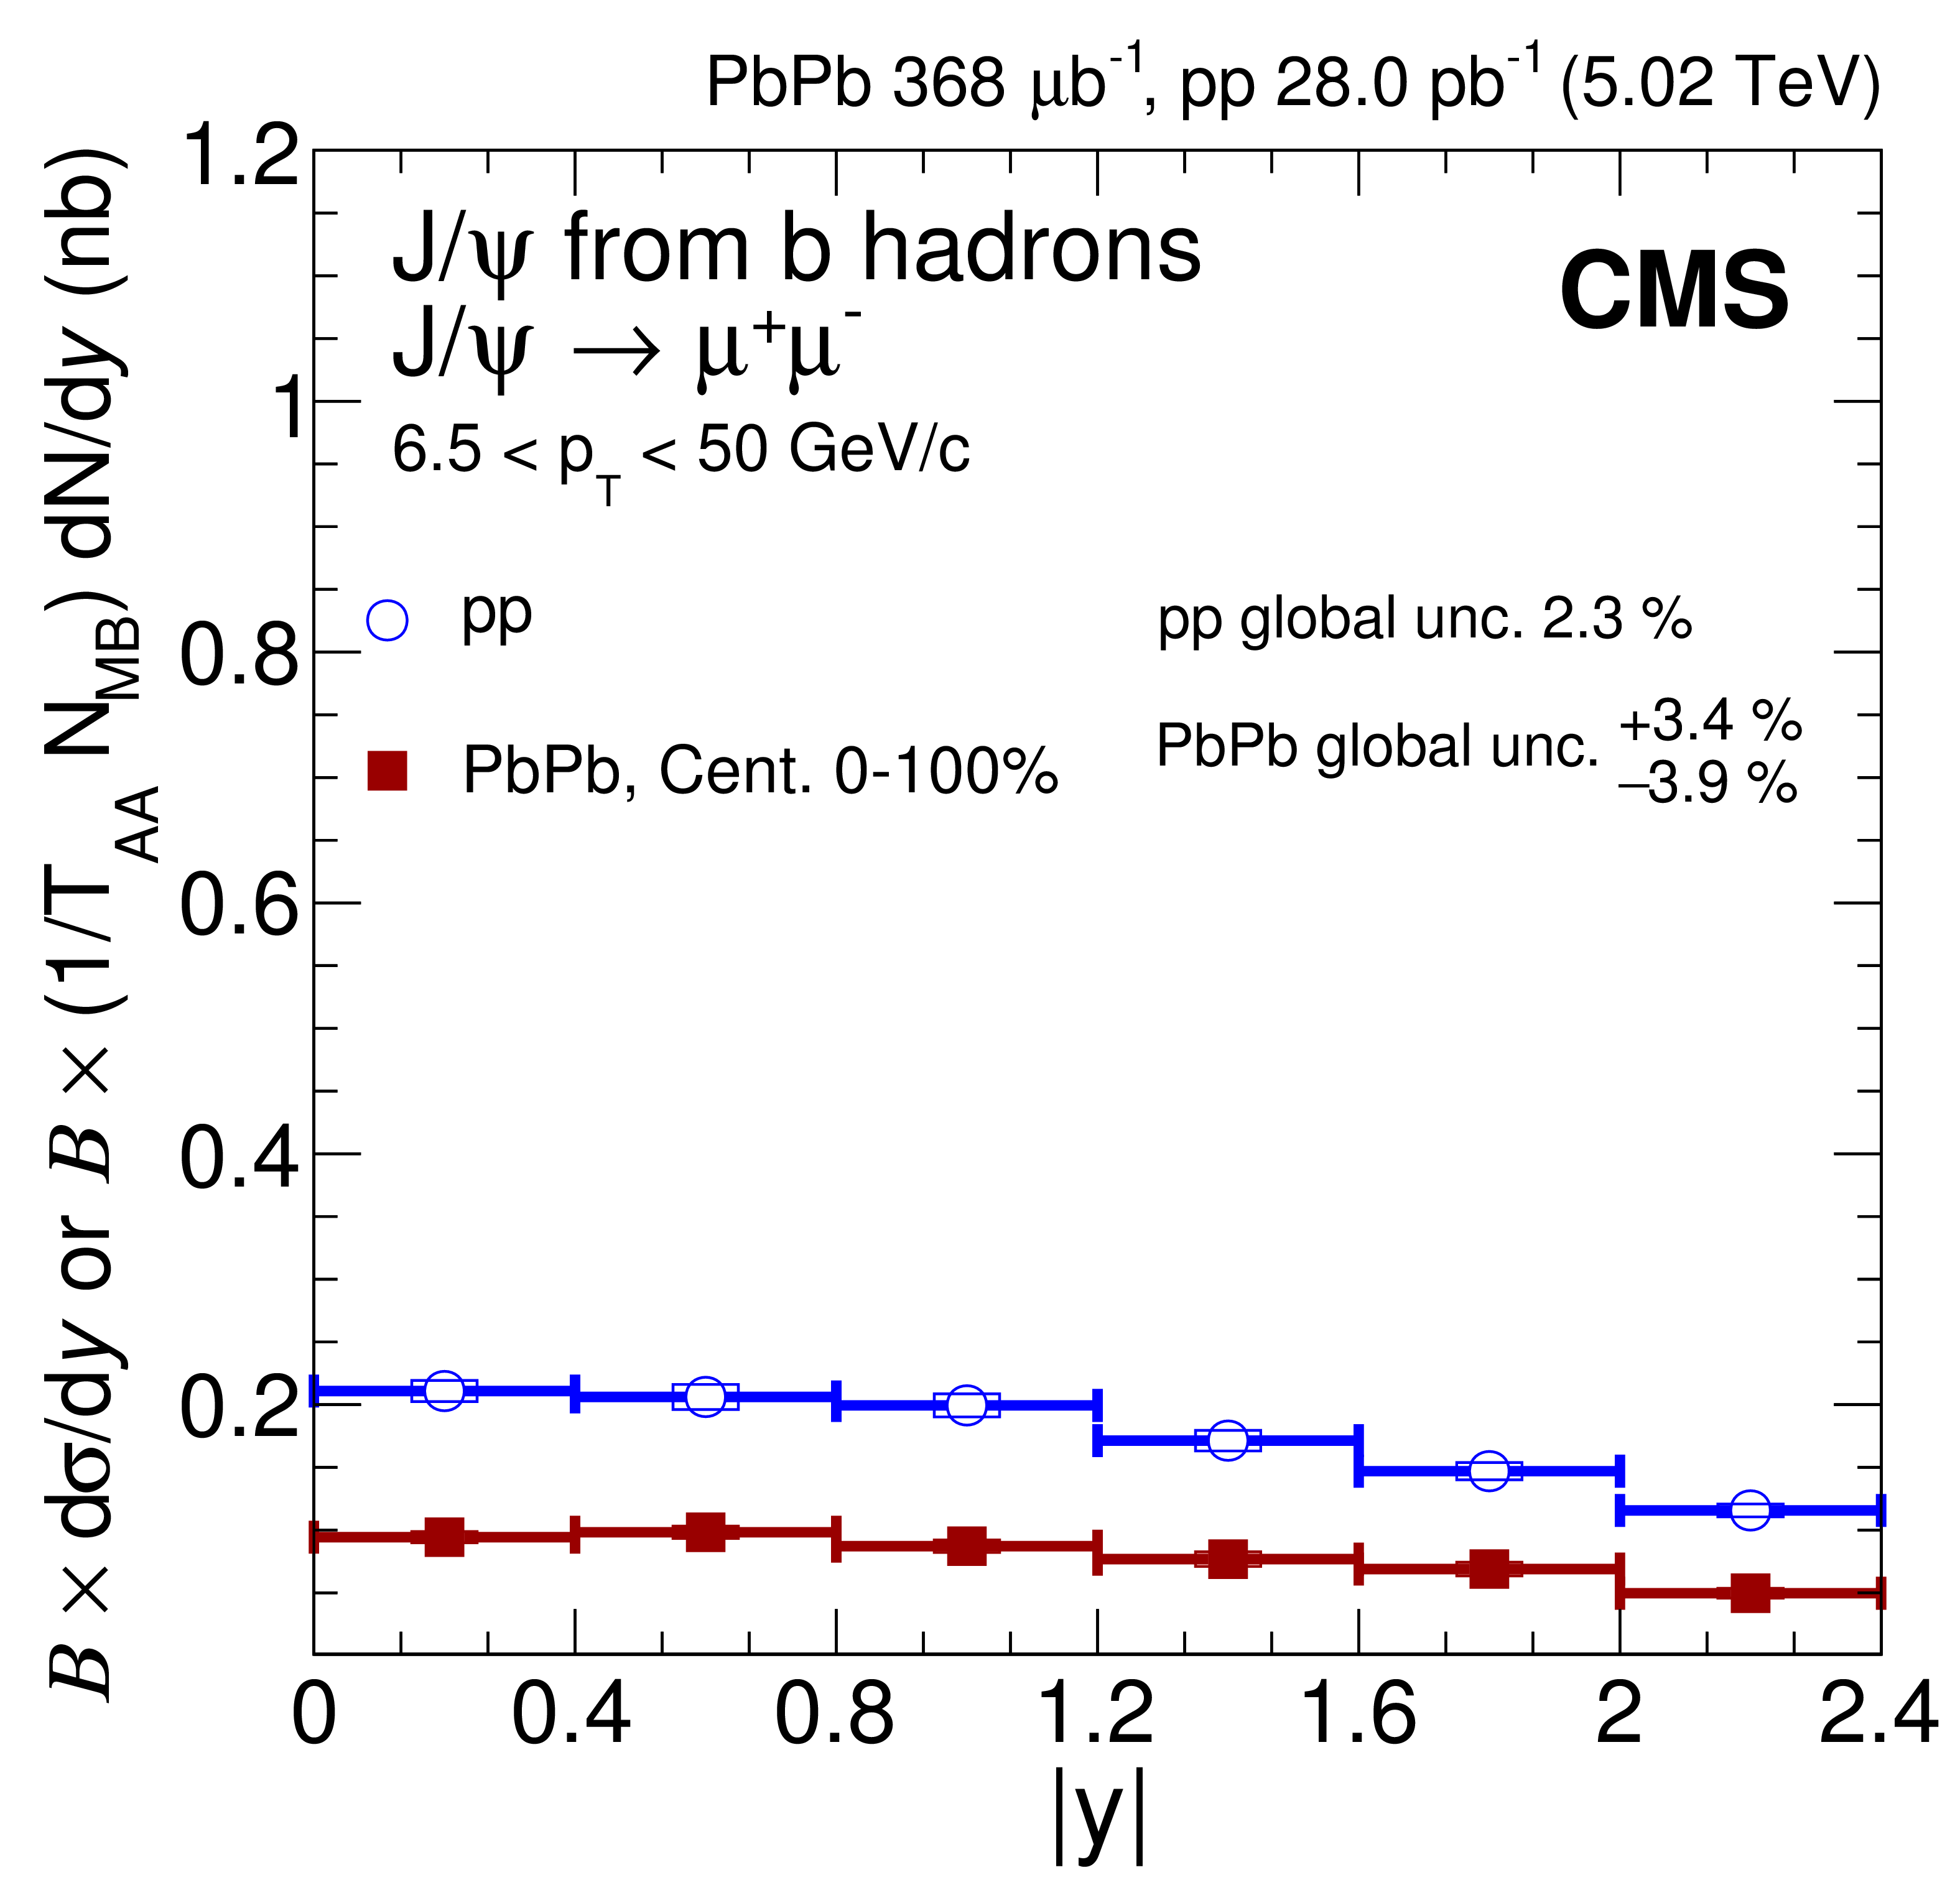
Figure 3:
Differential cross section of prompt $ \mathrm {J}/\psi $ mesons (left) and $ \mathrm {J}/\psi $ mesons from b hadrons (nonprompt $ \mathrm {J}/\psi $) (right) decaying into two muons as a function of dimuon $ {p_{\mathrm {T}}} $ (upper) and rapidity (lower) in pp and PbPb collisions. The PbPb cross sections are normalised by $ {T_{\text {AA}}} $ for direct comparison. The bars (boxes) represent statistical (systematic) point-by-point uncertainties, while global uncertainties are written on the plots. |
png pdf |
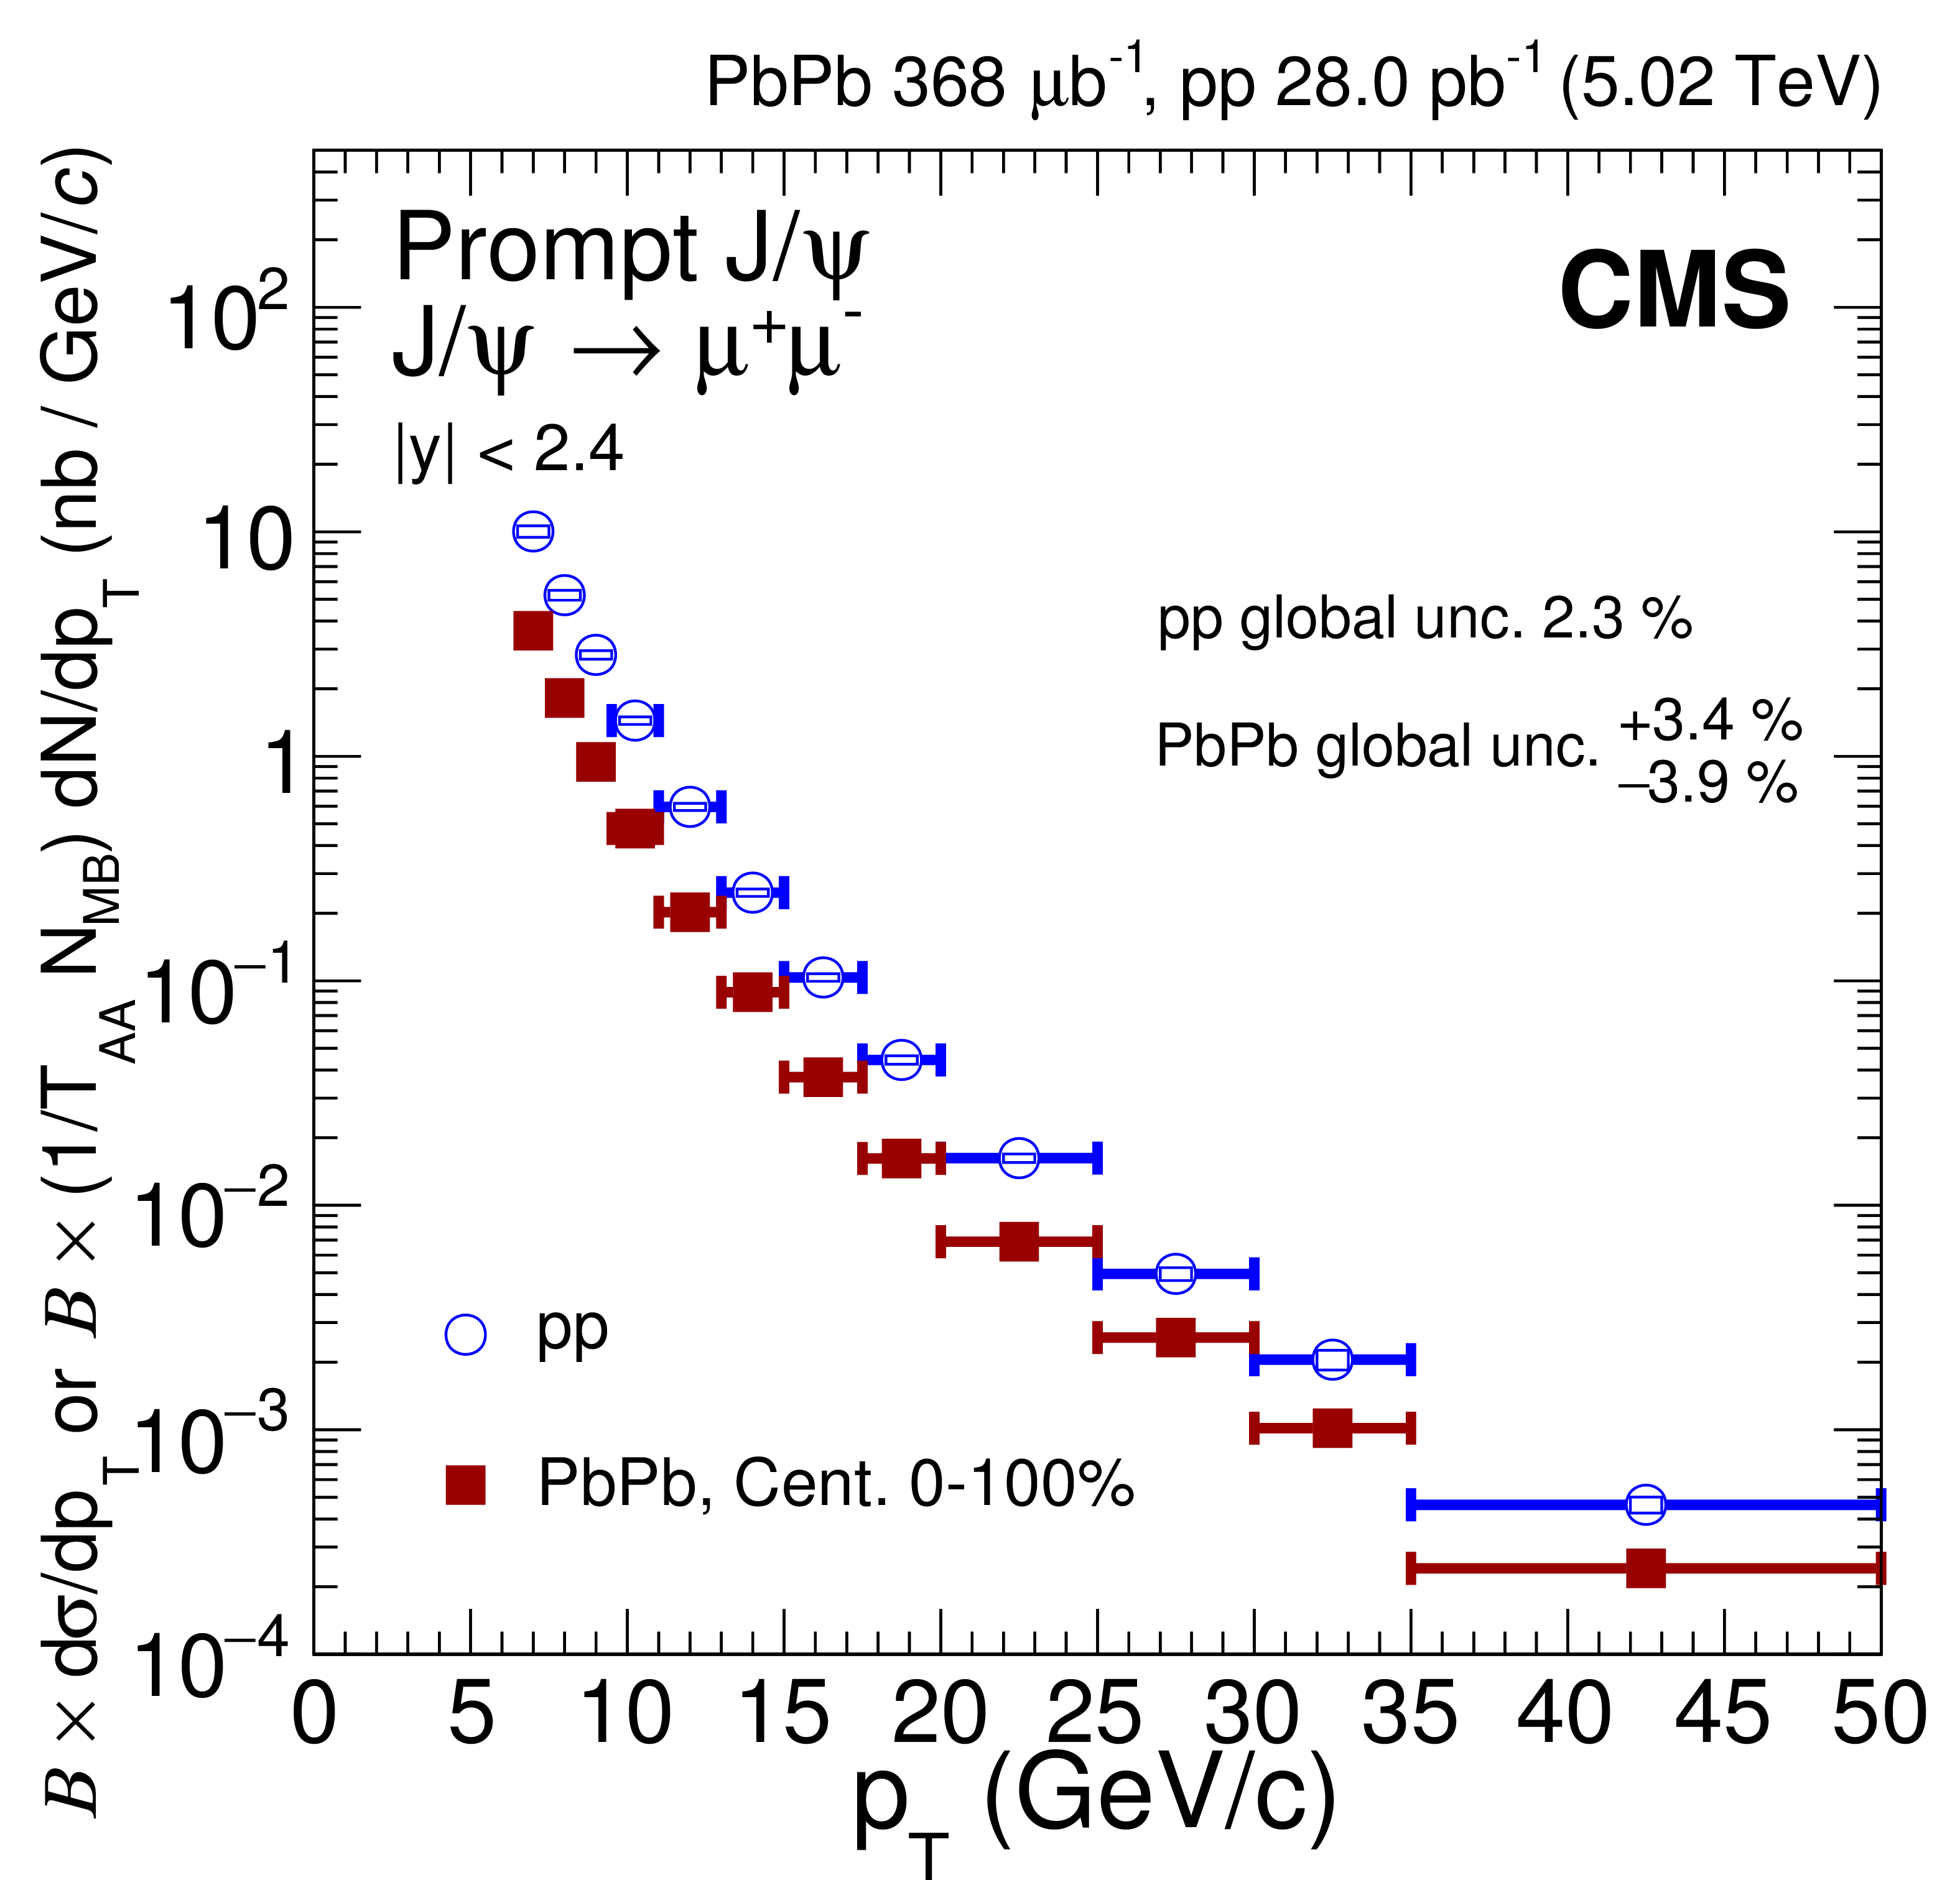
Figure 3-a:
Differential cross section of prompt $ \mathrm {J}/\psi $ mesons decaying into two muons as a function of dimuon $ {p_{\mathrm {T}}} $ in pp and PbPb collisions. The PbPb cross sections are normalised by $ {T_{\text {AA}}} $ for direct comparison. The bars (boxes) represent statistical (systematic) point-by-point uncertainties, while global uncertainties are written on the plots. |

png pdf |
Figure 3-b:
Differential cross section of $ \mathrm {J}/\psi $ mesons from b hadrons (nonprompt $ \mathrm {J}/\psi $) decaying into two muons as a function of dimuon $ {p_{\mathrm {T}}} $ in pp and PbPb collisions. The PbPb cross sections are normalised by $ {T_{\text {AA}}} $ for direct comparison. The bars (boxes) represent statistical (systematic) point-by-point uncertainties, while global uncertainties are written on the plots. |
png pdf |
Figure 3-c:
Differential cross section of prompt $ \mathrm {J}/\psi $ mesons decaying into two muons as a function of dimuon rapidity in pp and PbPb collisions. The PbPb cross sections are normalised by $ {T_{\text {AA}}} $ for direct comparison. The bars (boxes) represent statistical (systematic) point-by-point uncertainties, while global uncertainties are written on the plots. |
png pdf |
Figure 3-d:
Differential cross section of $ \mathrm {J}/\psi $ mesons from b hadrons (nonprompt $ \mathrm {J}/\psi $) decaying into two muons as a function of dimuon rapidity in pp and PbPb collisions. The PbPb cross sections are normalised by $ {T_{\text {AA}}} $ for direct comparison. The bars (boxes) represent statistical (systematic) point-by-point uncertainties, while global uncertainties are written on the plots. |
png pdf |
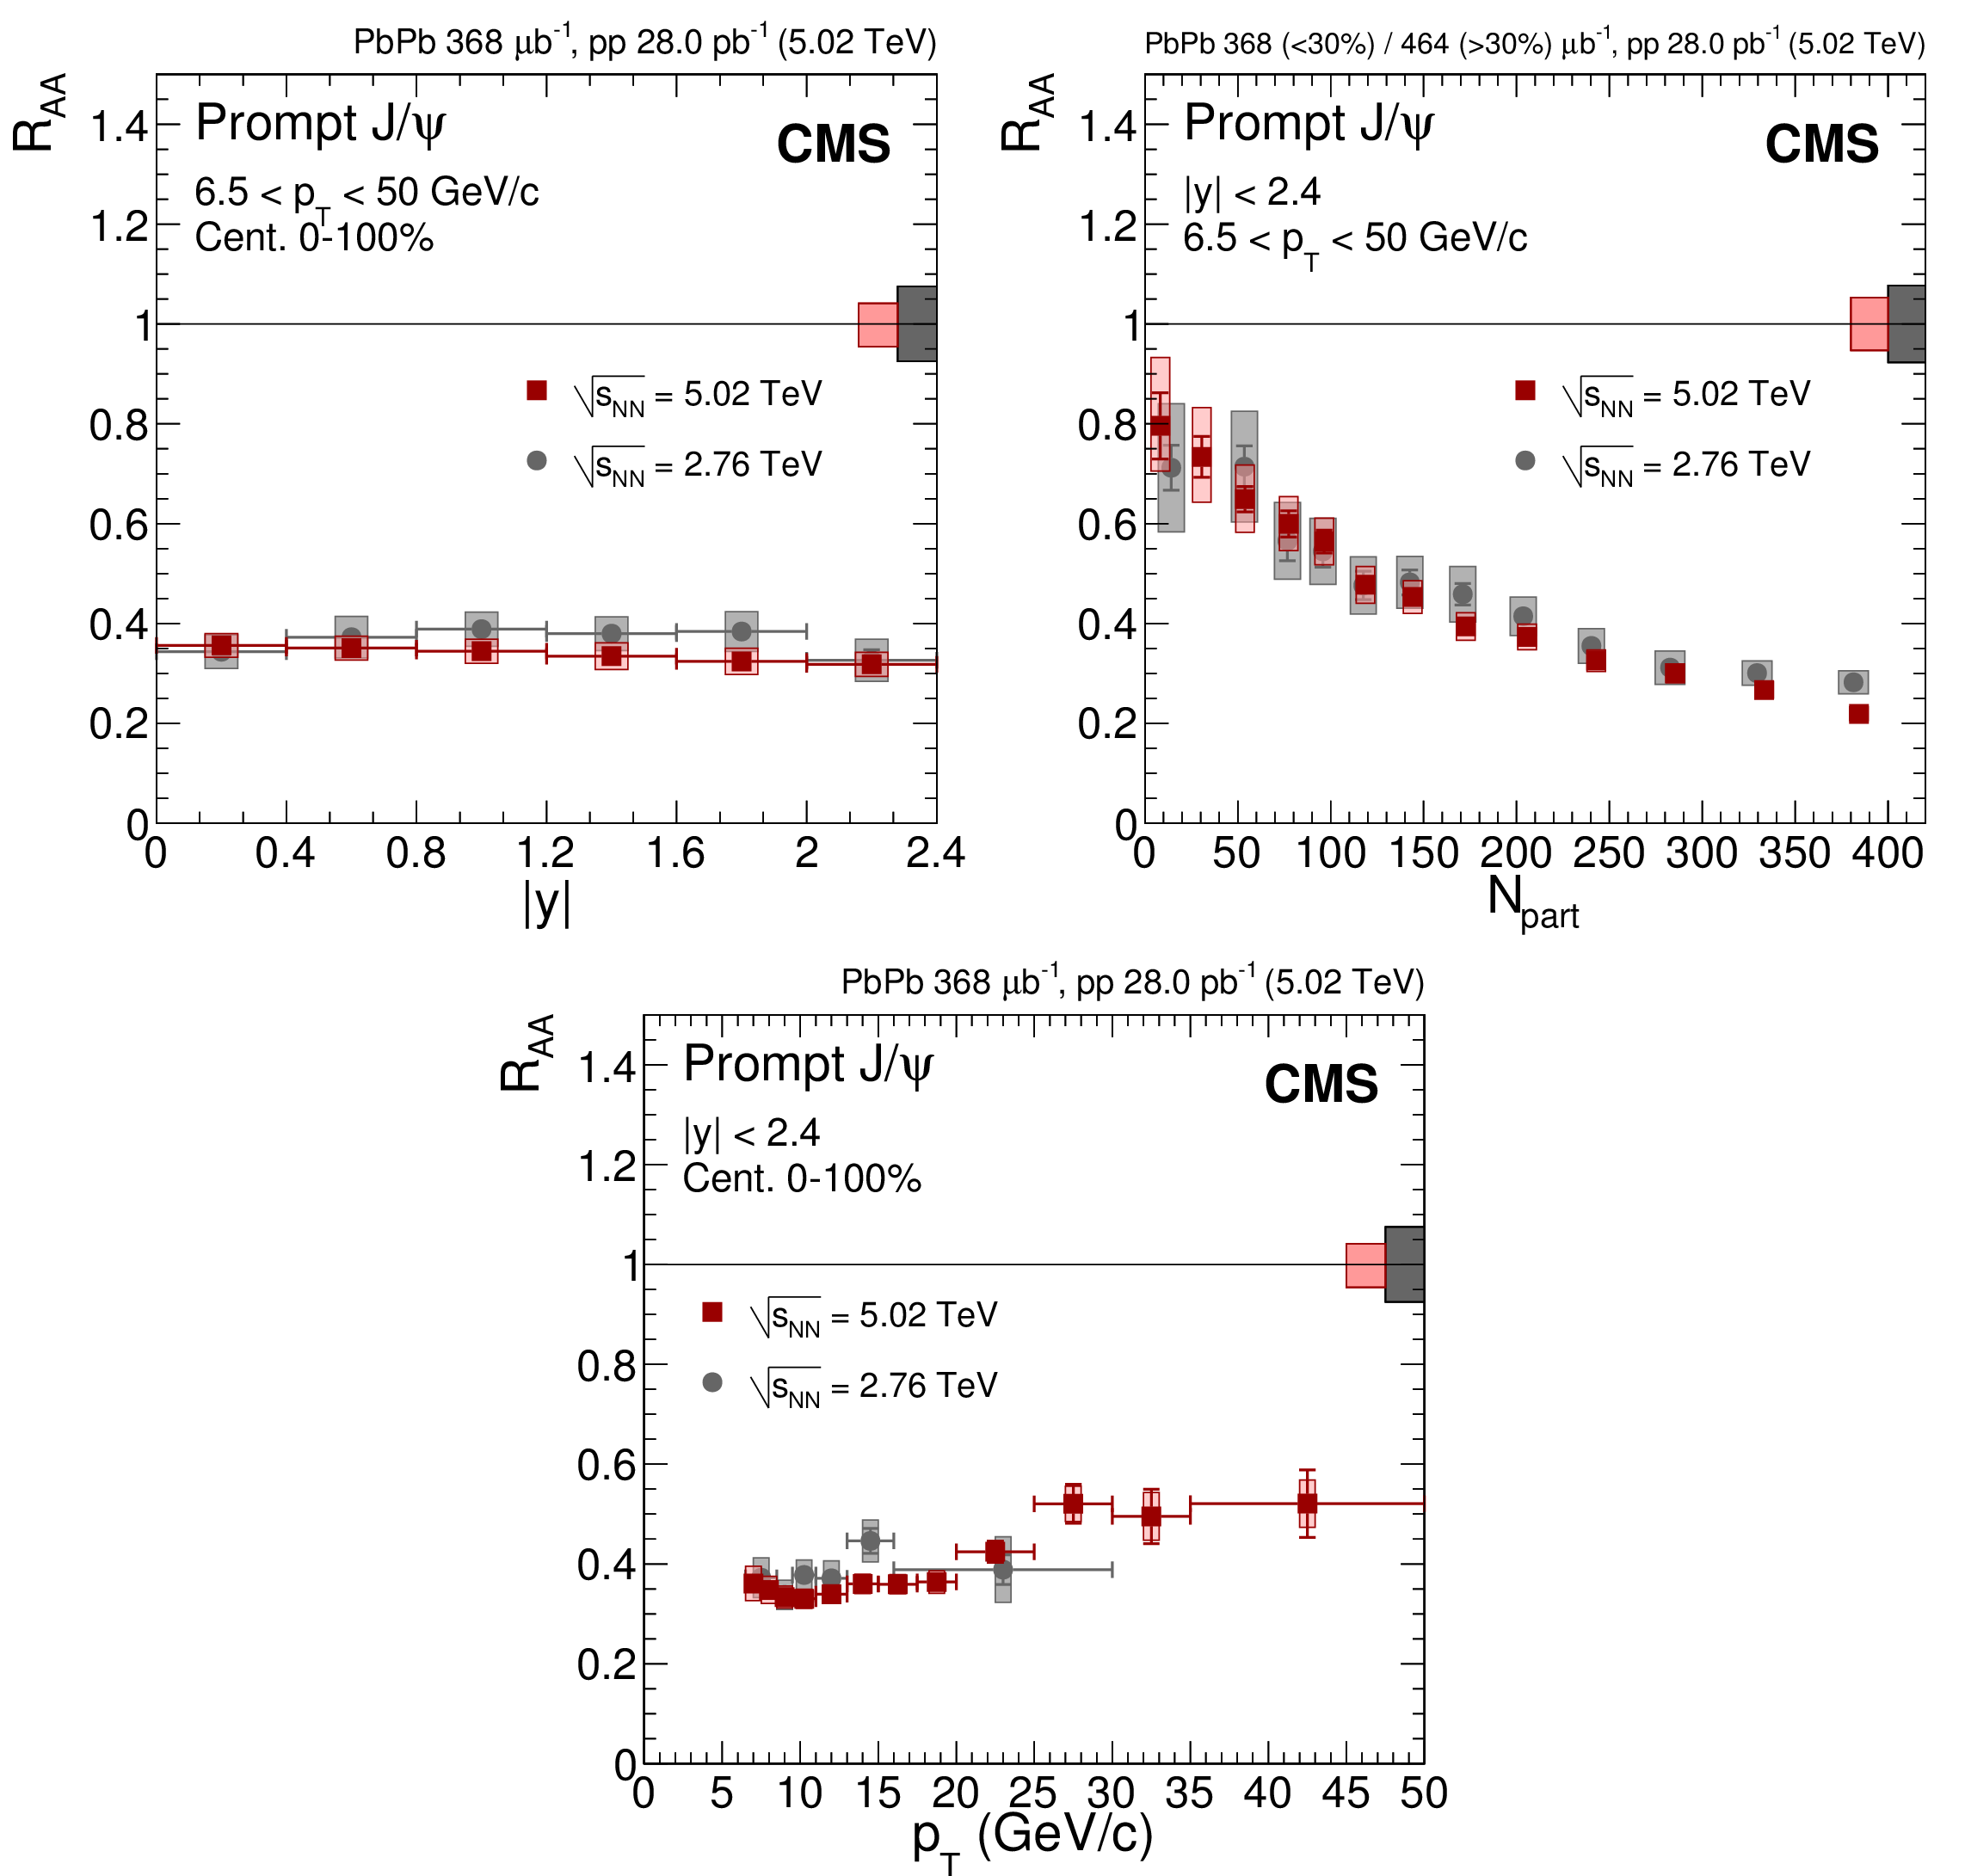
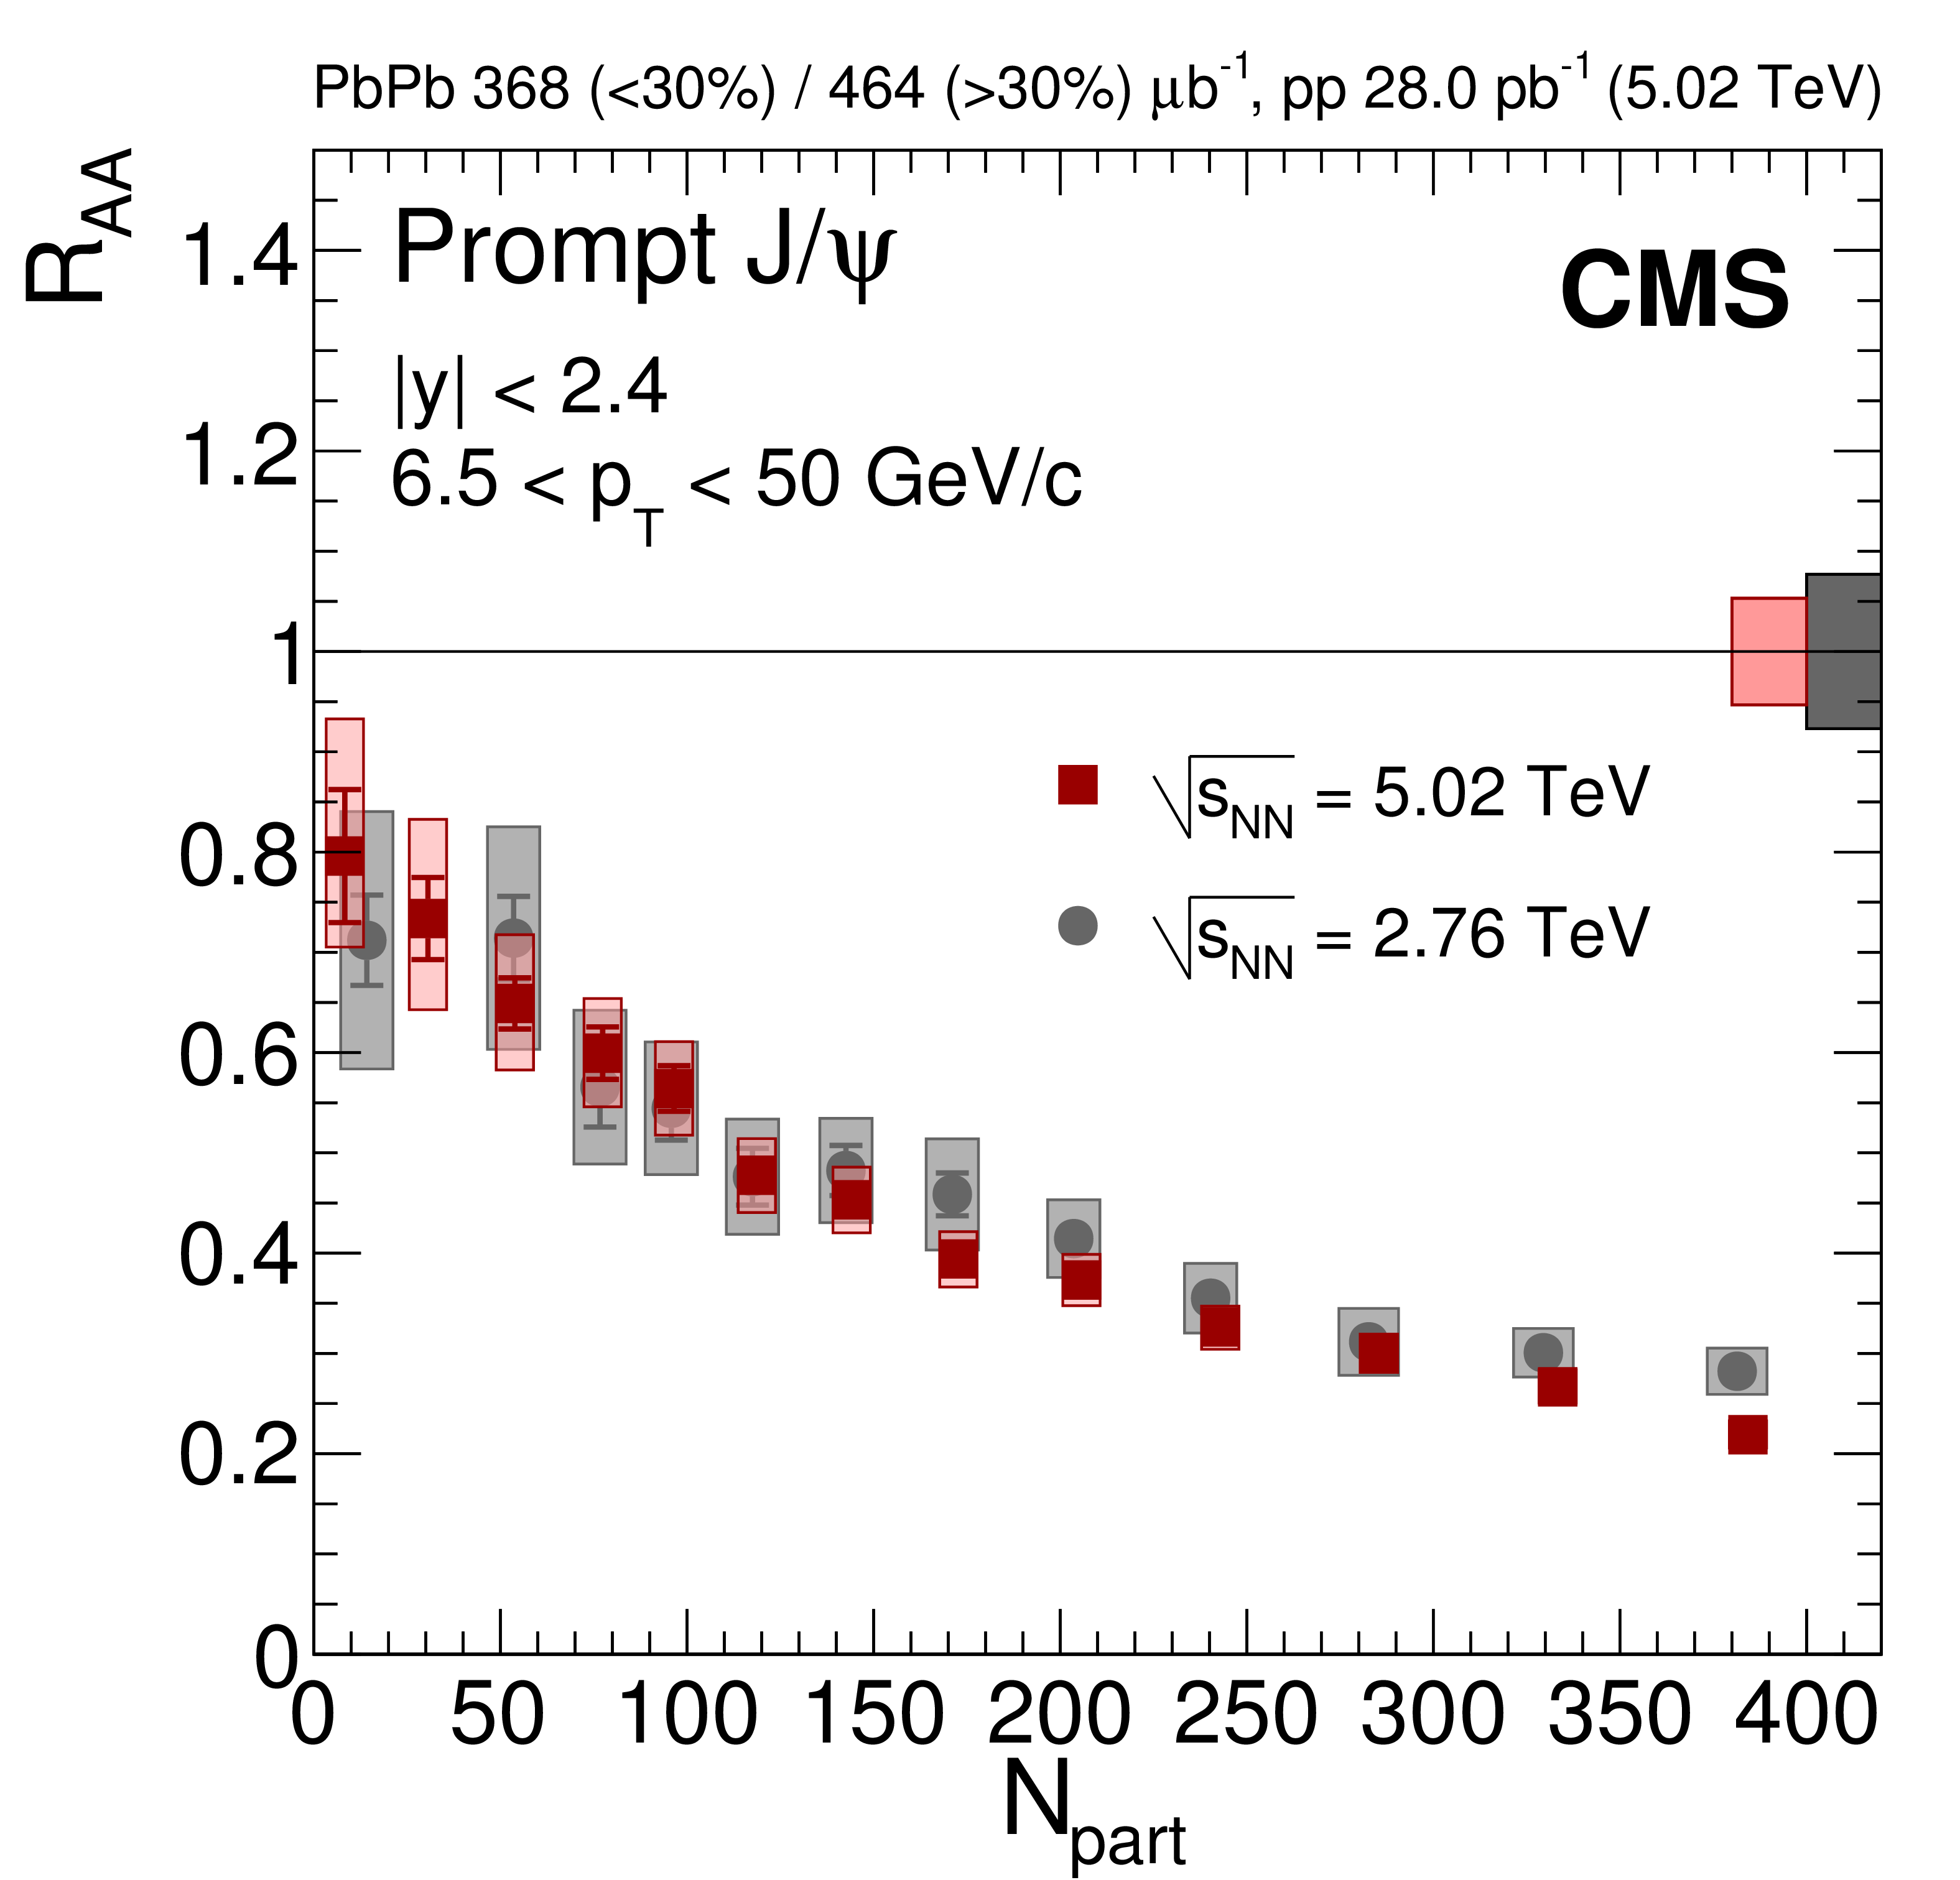
Figure 4:
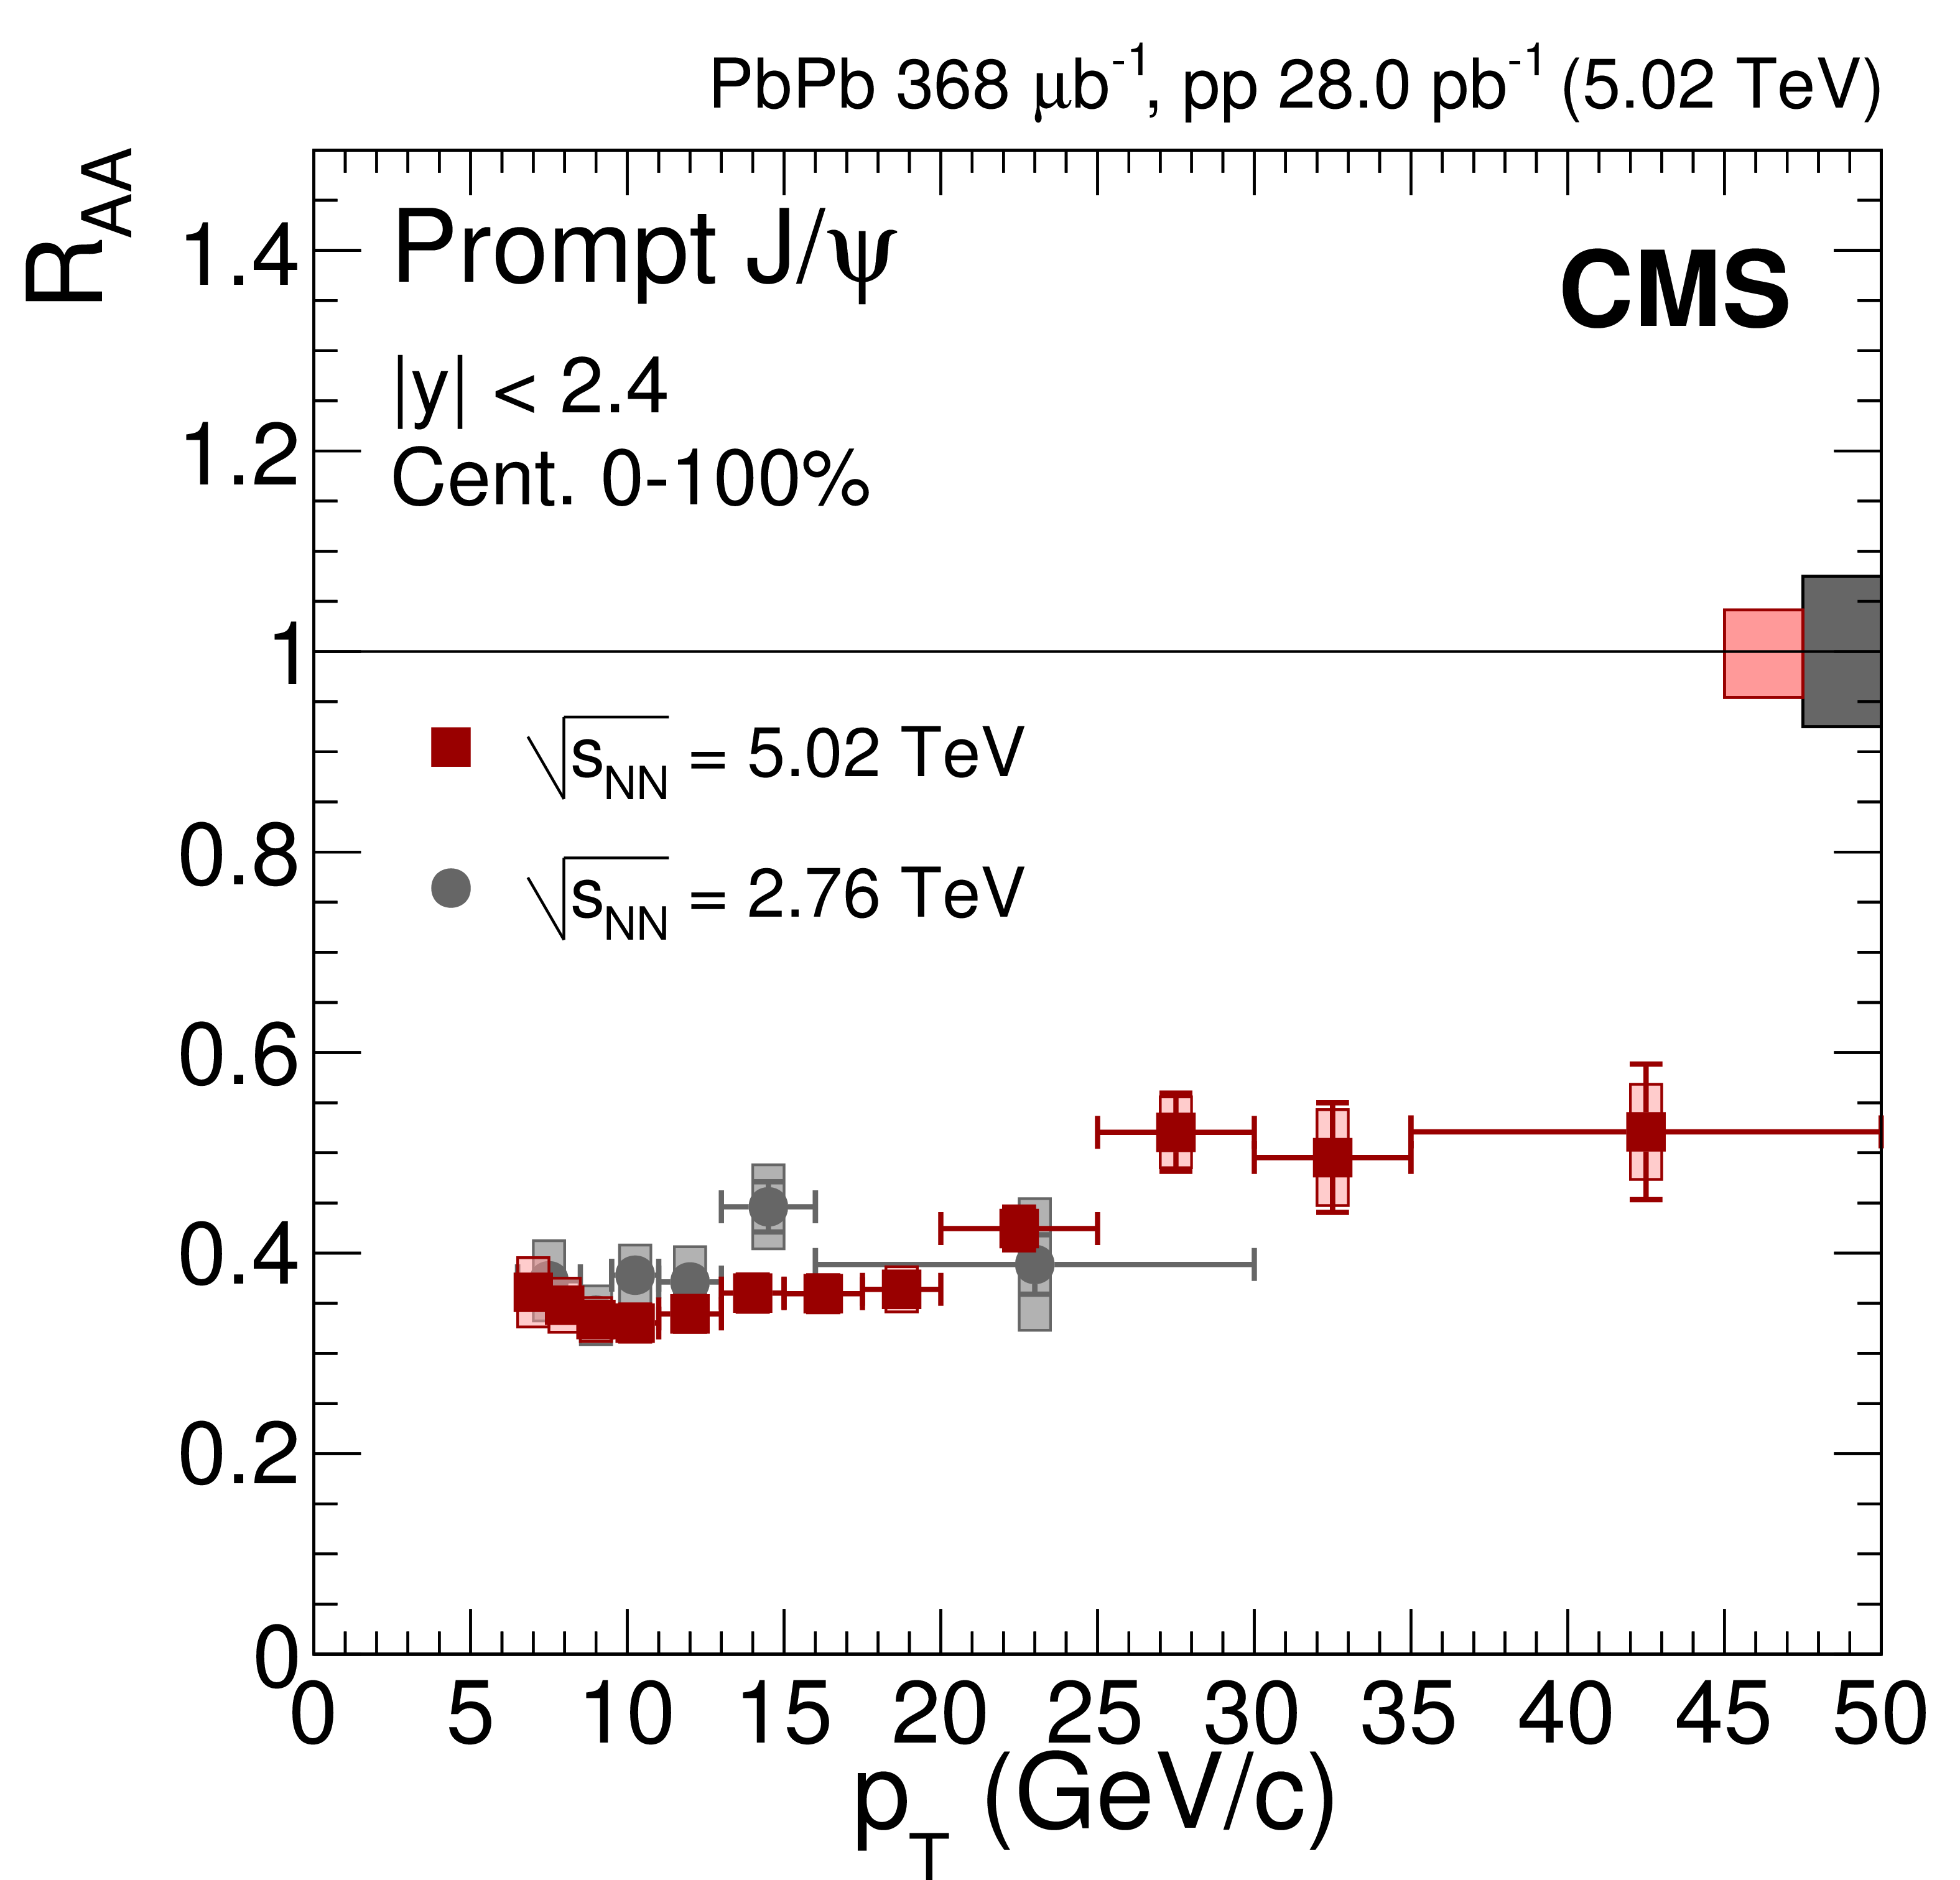
Nuclear modification factor of prompt $ \mathrm {J}/\psi $ mesons as a function of dimuon rapidity (upper left), $ {N_{\text {part}}} $ (upper right) and dimuon $ {p_{\mathrm {T}}} $ (lower) at $ {\sqrt {\smash [b]{s_{_{\text {NN}}}}}} = $ 5.02 TeV. For the results as a function of $ {N_{\text {part}}} $ the most central bin corresponds to 0-5%, and the most peripheral one to 70-100%. Results obtained at 2.76 TeV are overlaid for comparison [11]. The bars (boxes) represent statistical (systematic) point-by-point uncertainties. The boxes plotted at $ {R_{\text {AA}}} =$ 1 indicate the size of the global relative uncertainties. |

png pdf |
Figure 4-a:
Nuclear modification factor of prompt $ \mathrm {J}/\psi $ mesons as a function of dimuon rapidity at $ {\sqrt {\smash [b]{s_{_{\text {NN}}}}}} = $ 5.02 TeV. Results obtained at 2.76 TeV are overlaid for comparison [11]. The bars (boxes) represent statistical (systematic) point-by-point uncertainties. The boxes plotted at $ {R_{\text {AA}}} =$ 1 indicate the size of the global relative uncertainties. |
png pdf |
Figure 4-b:
Nuclear modification factor of prompt $ \mathrm {J}/\psi $ mesons as a function of $ {N_{\text {part}}} $ at $ {\sqrt {\smash [b]{s_{_{\text {NN}}}}}} = $ 5.02 TeV. The most central bin corresponds to 0-5%, and the most peripheral one to 70-100%. Results obtained at 2.76 TeV are overlaid for comparison [11]. The bars (boxes) represent statistical (systematic) point-by-point uncertainties. The boxes plotted at $ {R_{\text {AA}}} =$ 1 indicate the size of the global relative uncertainties. |
png pdf |
Figure 4-c:
Nuclear modification factor of prompt $ \mathrm {J}/\psi $ mesons as a function of dimuon $ {p_{\mathrm {T}}} $ at $ {\sqrt {\smash [b]{s_{_{\text {NN}}}}}} = $ 5.02 TeV. Results obtained at 2.76 TeV are overlaid for comparison [11]. The bars (boxes) represent statistical (systematic) point-by-point uncertainties. The boxes plotted at $ {R_{\text {AA}}} =$ 1 indicate the size of the global relative uncertainties. |
png pdf |
Figure 5:
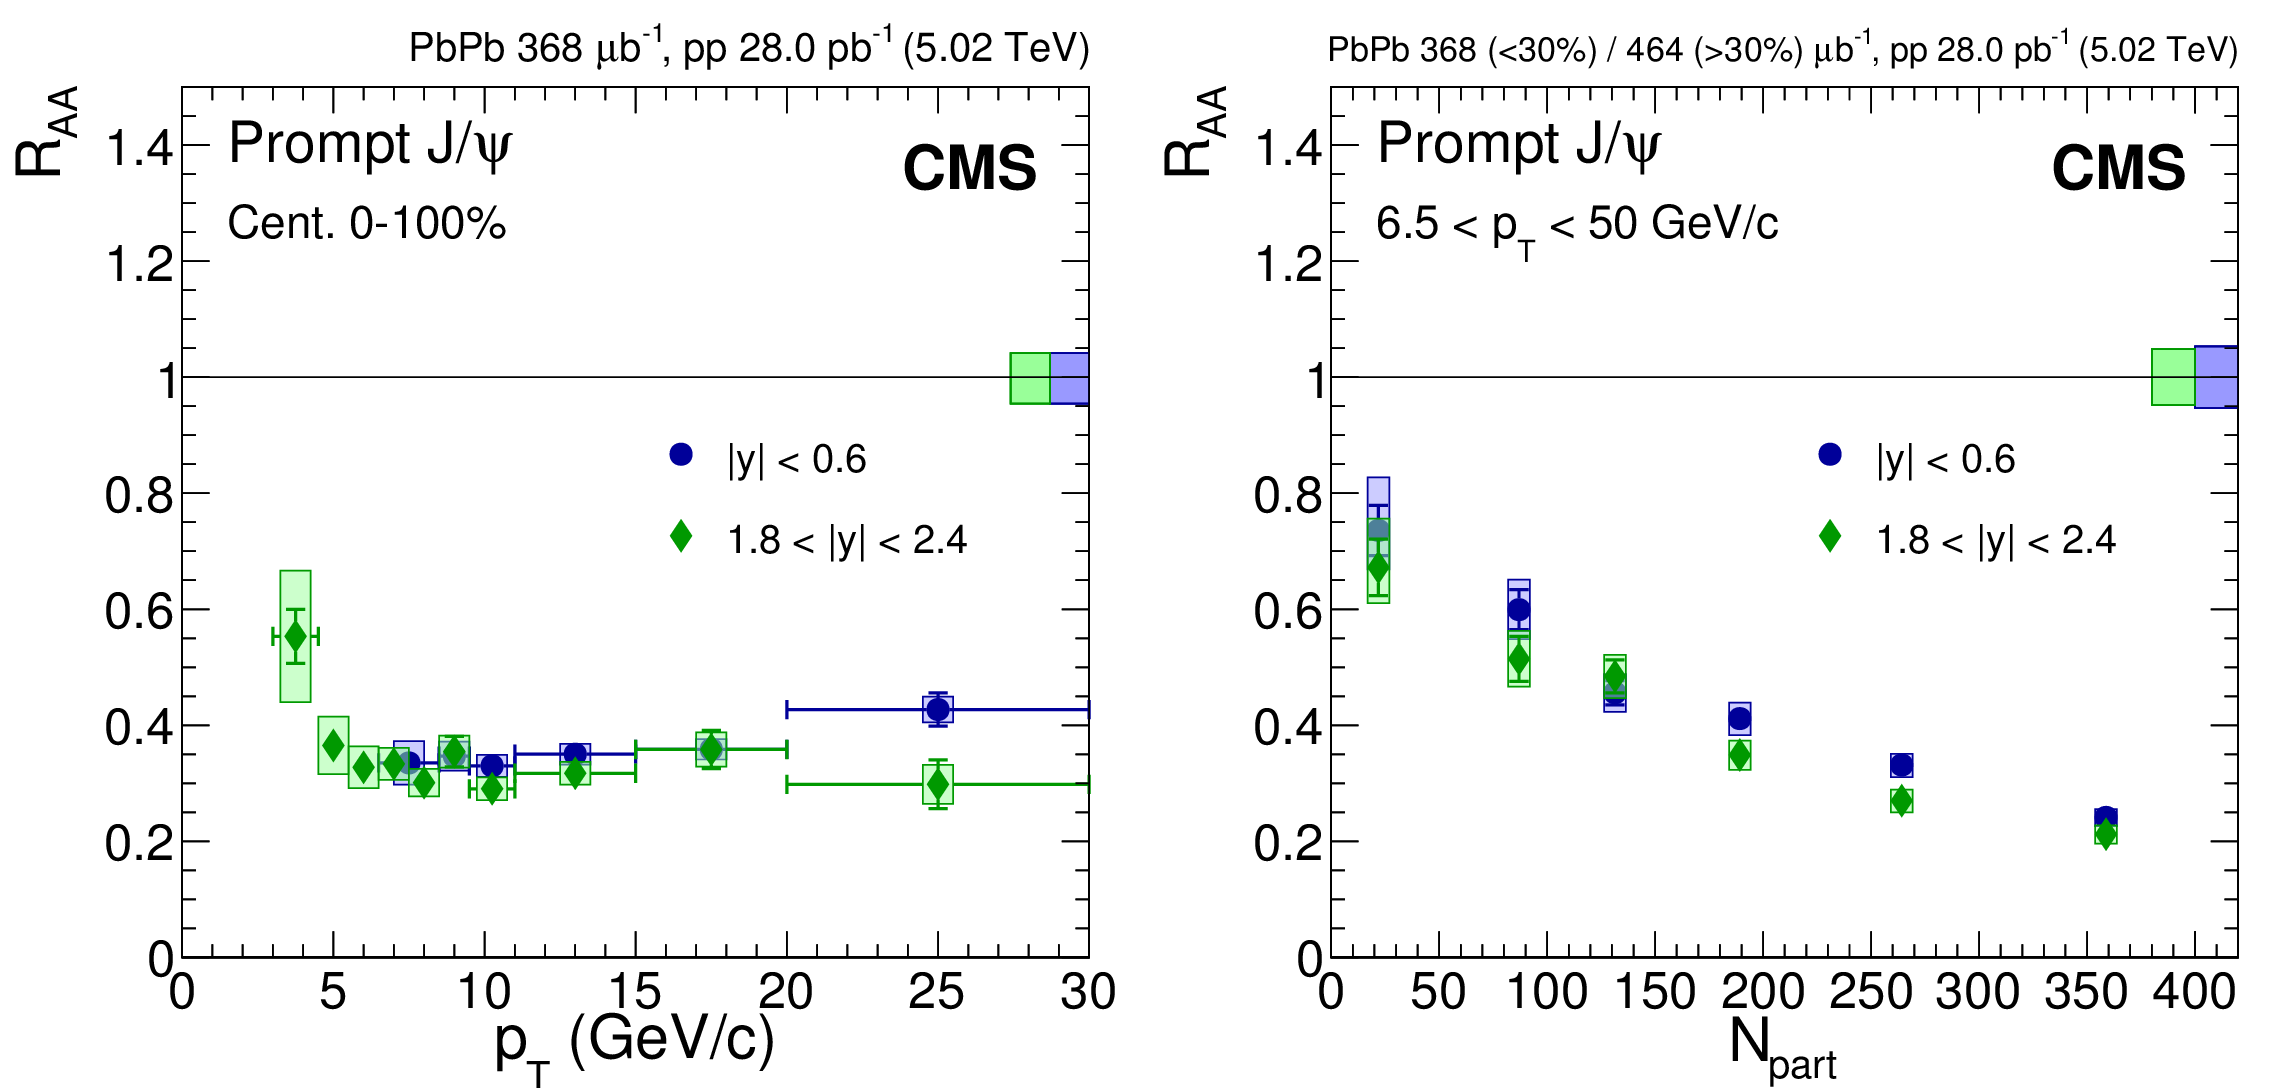
Nuclear modification factor of prompt $ \mathrm {J}/\psi $ meson as a function of dimuon $ {p_{\mathrm {T}}} $ (left) and $ {N_{\text {part}}} $ (right), in the mid- and most forward rapidity intervals. For the results as a function of $ {N_{\text {part}}} $ the most central bin corresponds to 0-10%, and the most peripheral one to 50-100%. The bars (boxes) represent statistical (systematic) point-by-point uncertainties. The boxes plotted at $ {R_{\text {AA}}} =$ 1 indicate the size of the global relative uncertainties. |
png pdf |
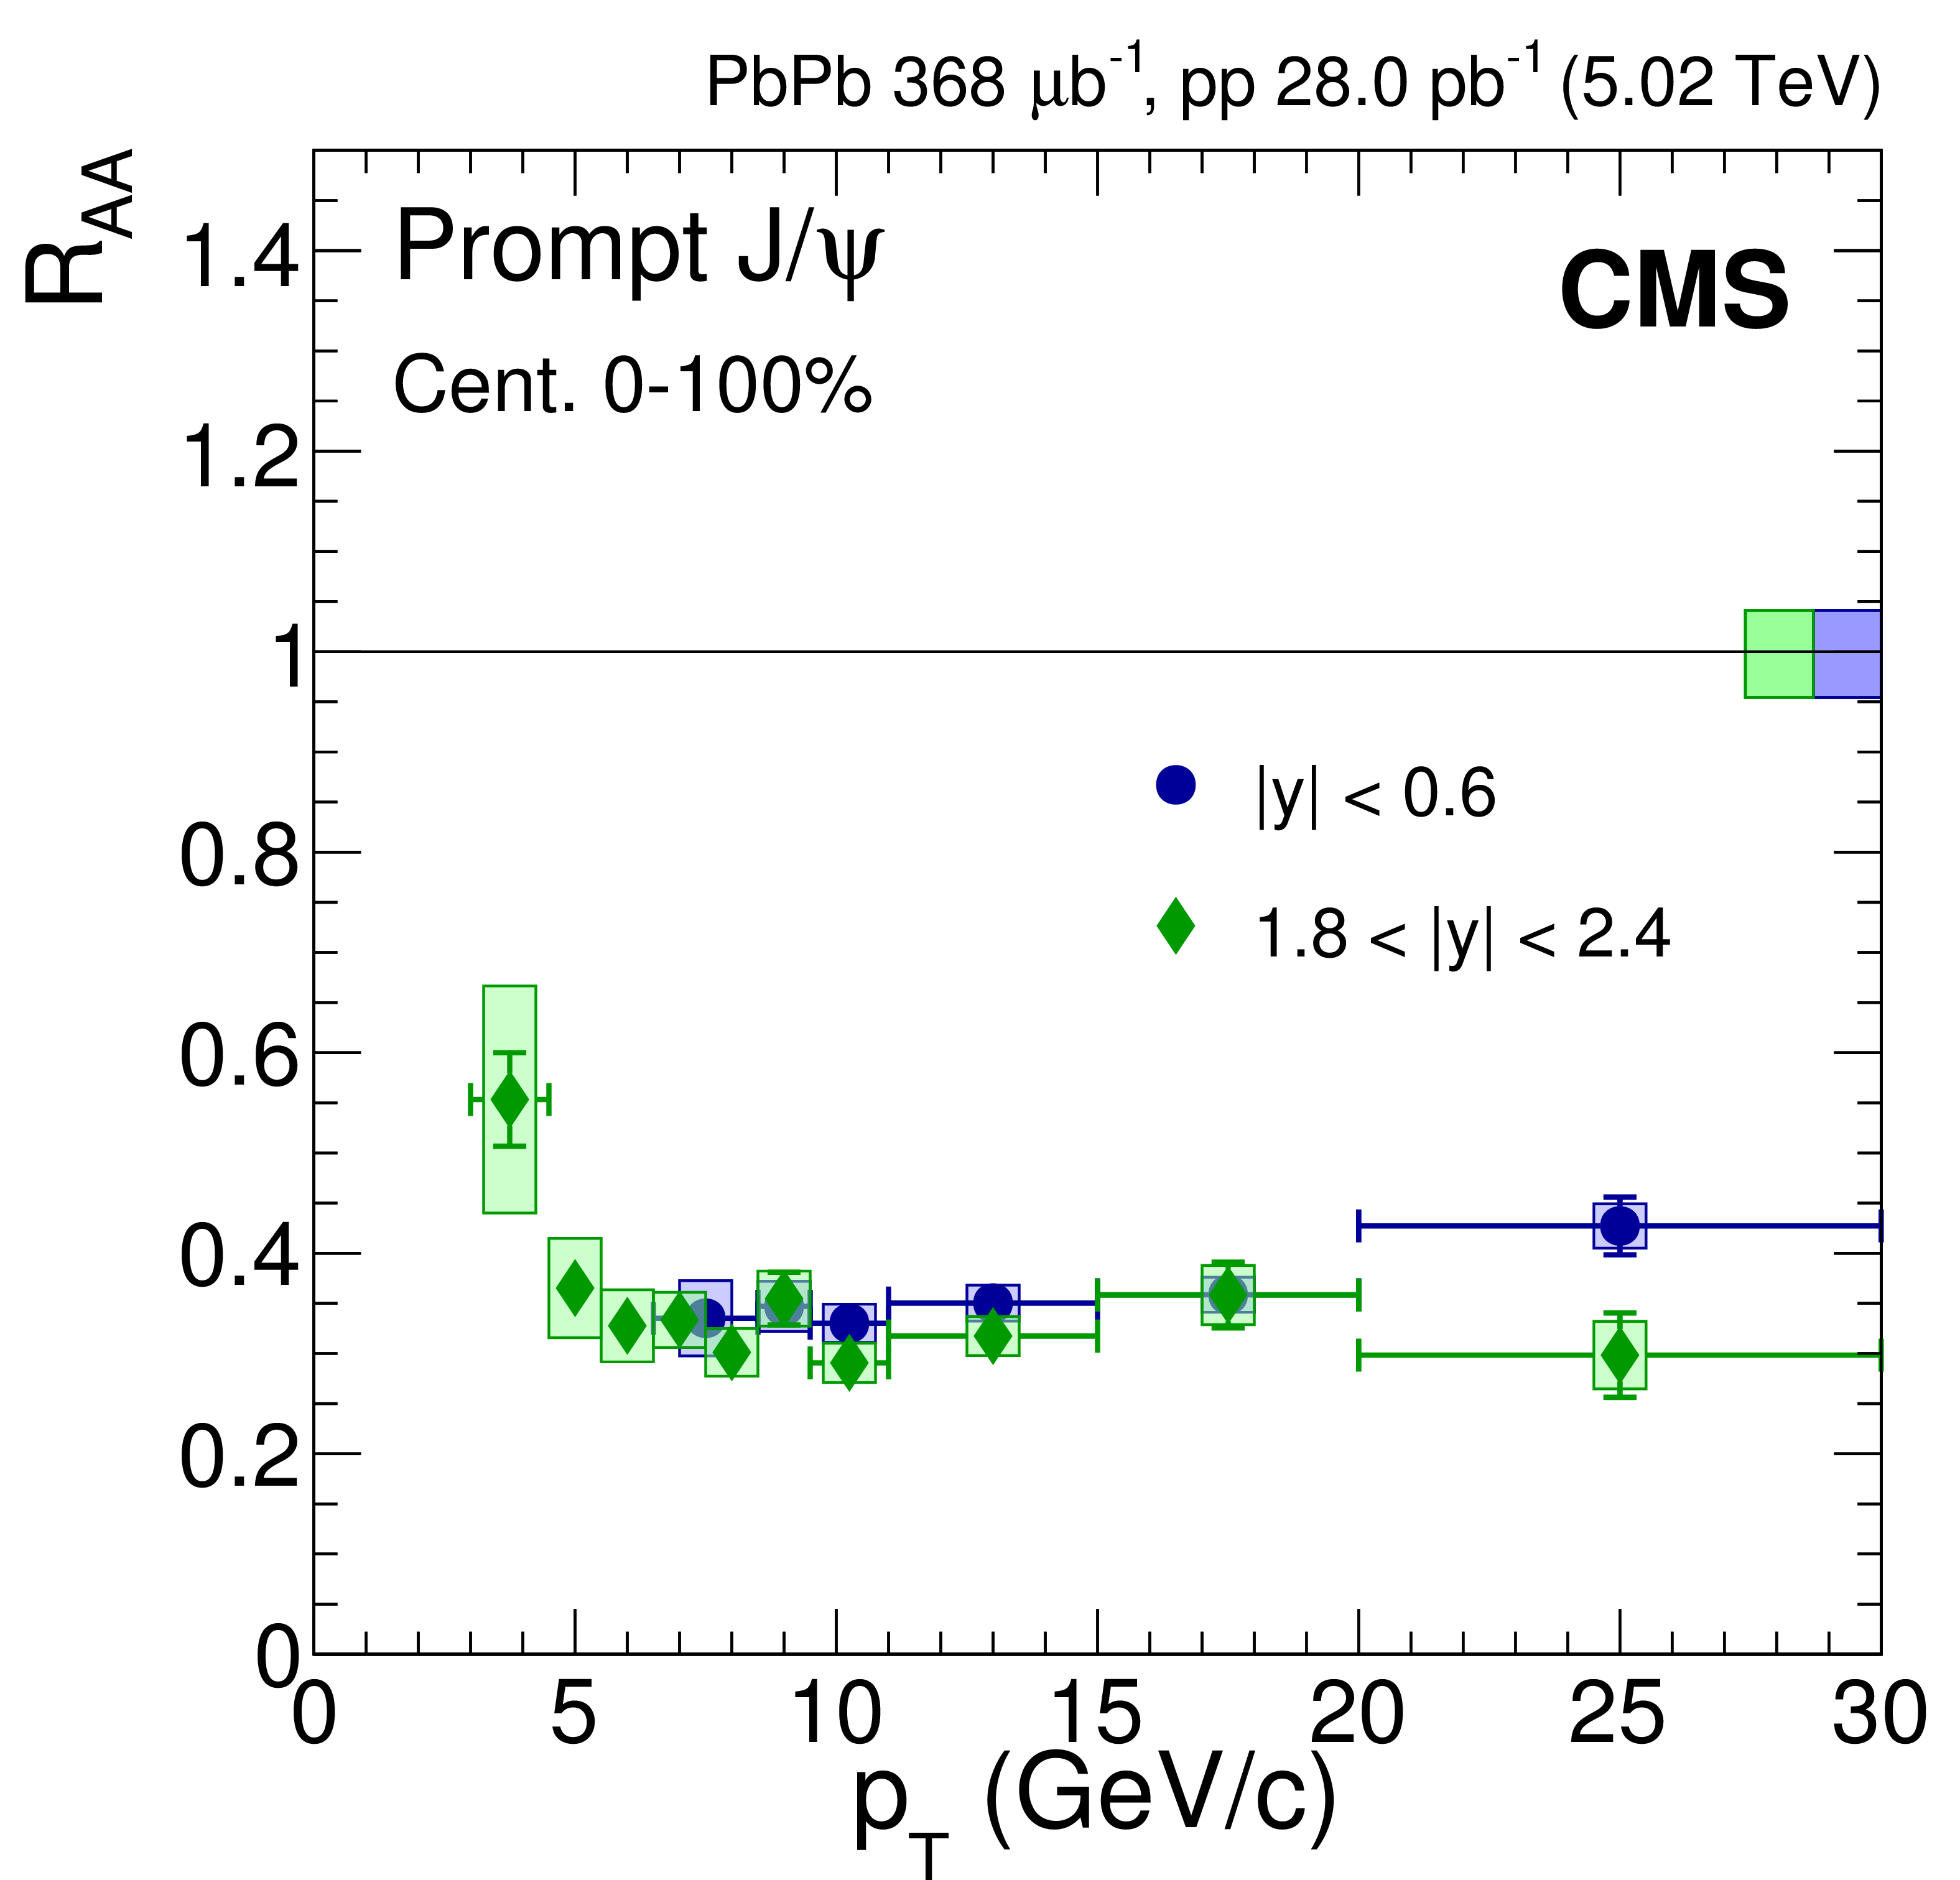
Figure 5-a:
Nuclear modification factor of prompt $ \mathrm {J}/\psi $ meson as a function of dimuon $ {p_{\mathrm {T}}} $, in the mid- and most forward rapidity intervals. For the results as a function of $ {N_{\text {part}}} $ the most central bin corresponds to 0-10%, and the most peripheral one to 50-100%. The bars (boxes) represent statistical (systematic) point-by-point uncertainties. The boxes plotted at $ {R_{\text {AA}}} =$ 1 indicate the size of the global relative uncertainties. |
png pdf |
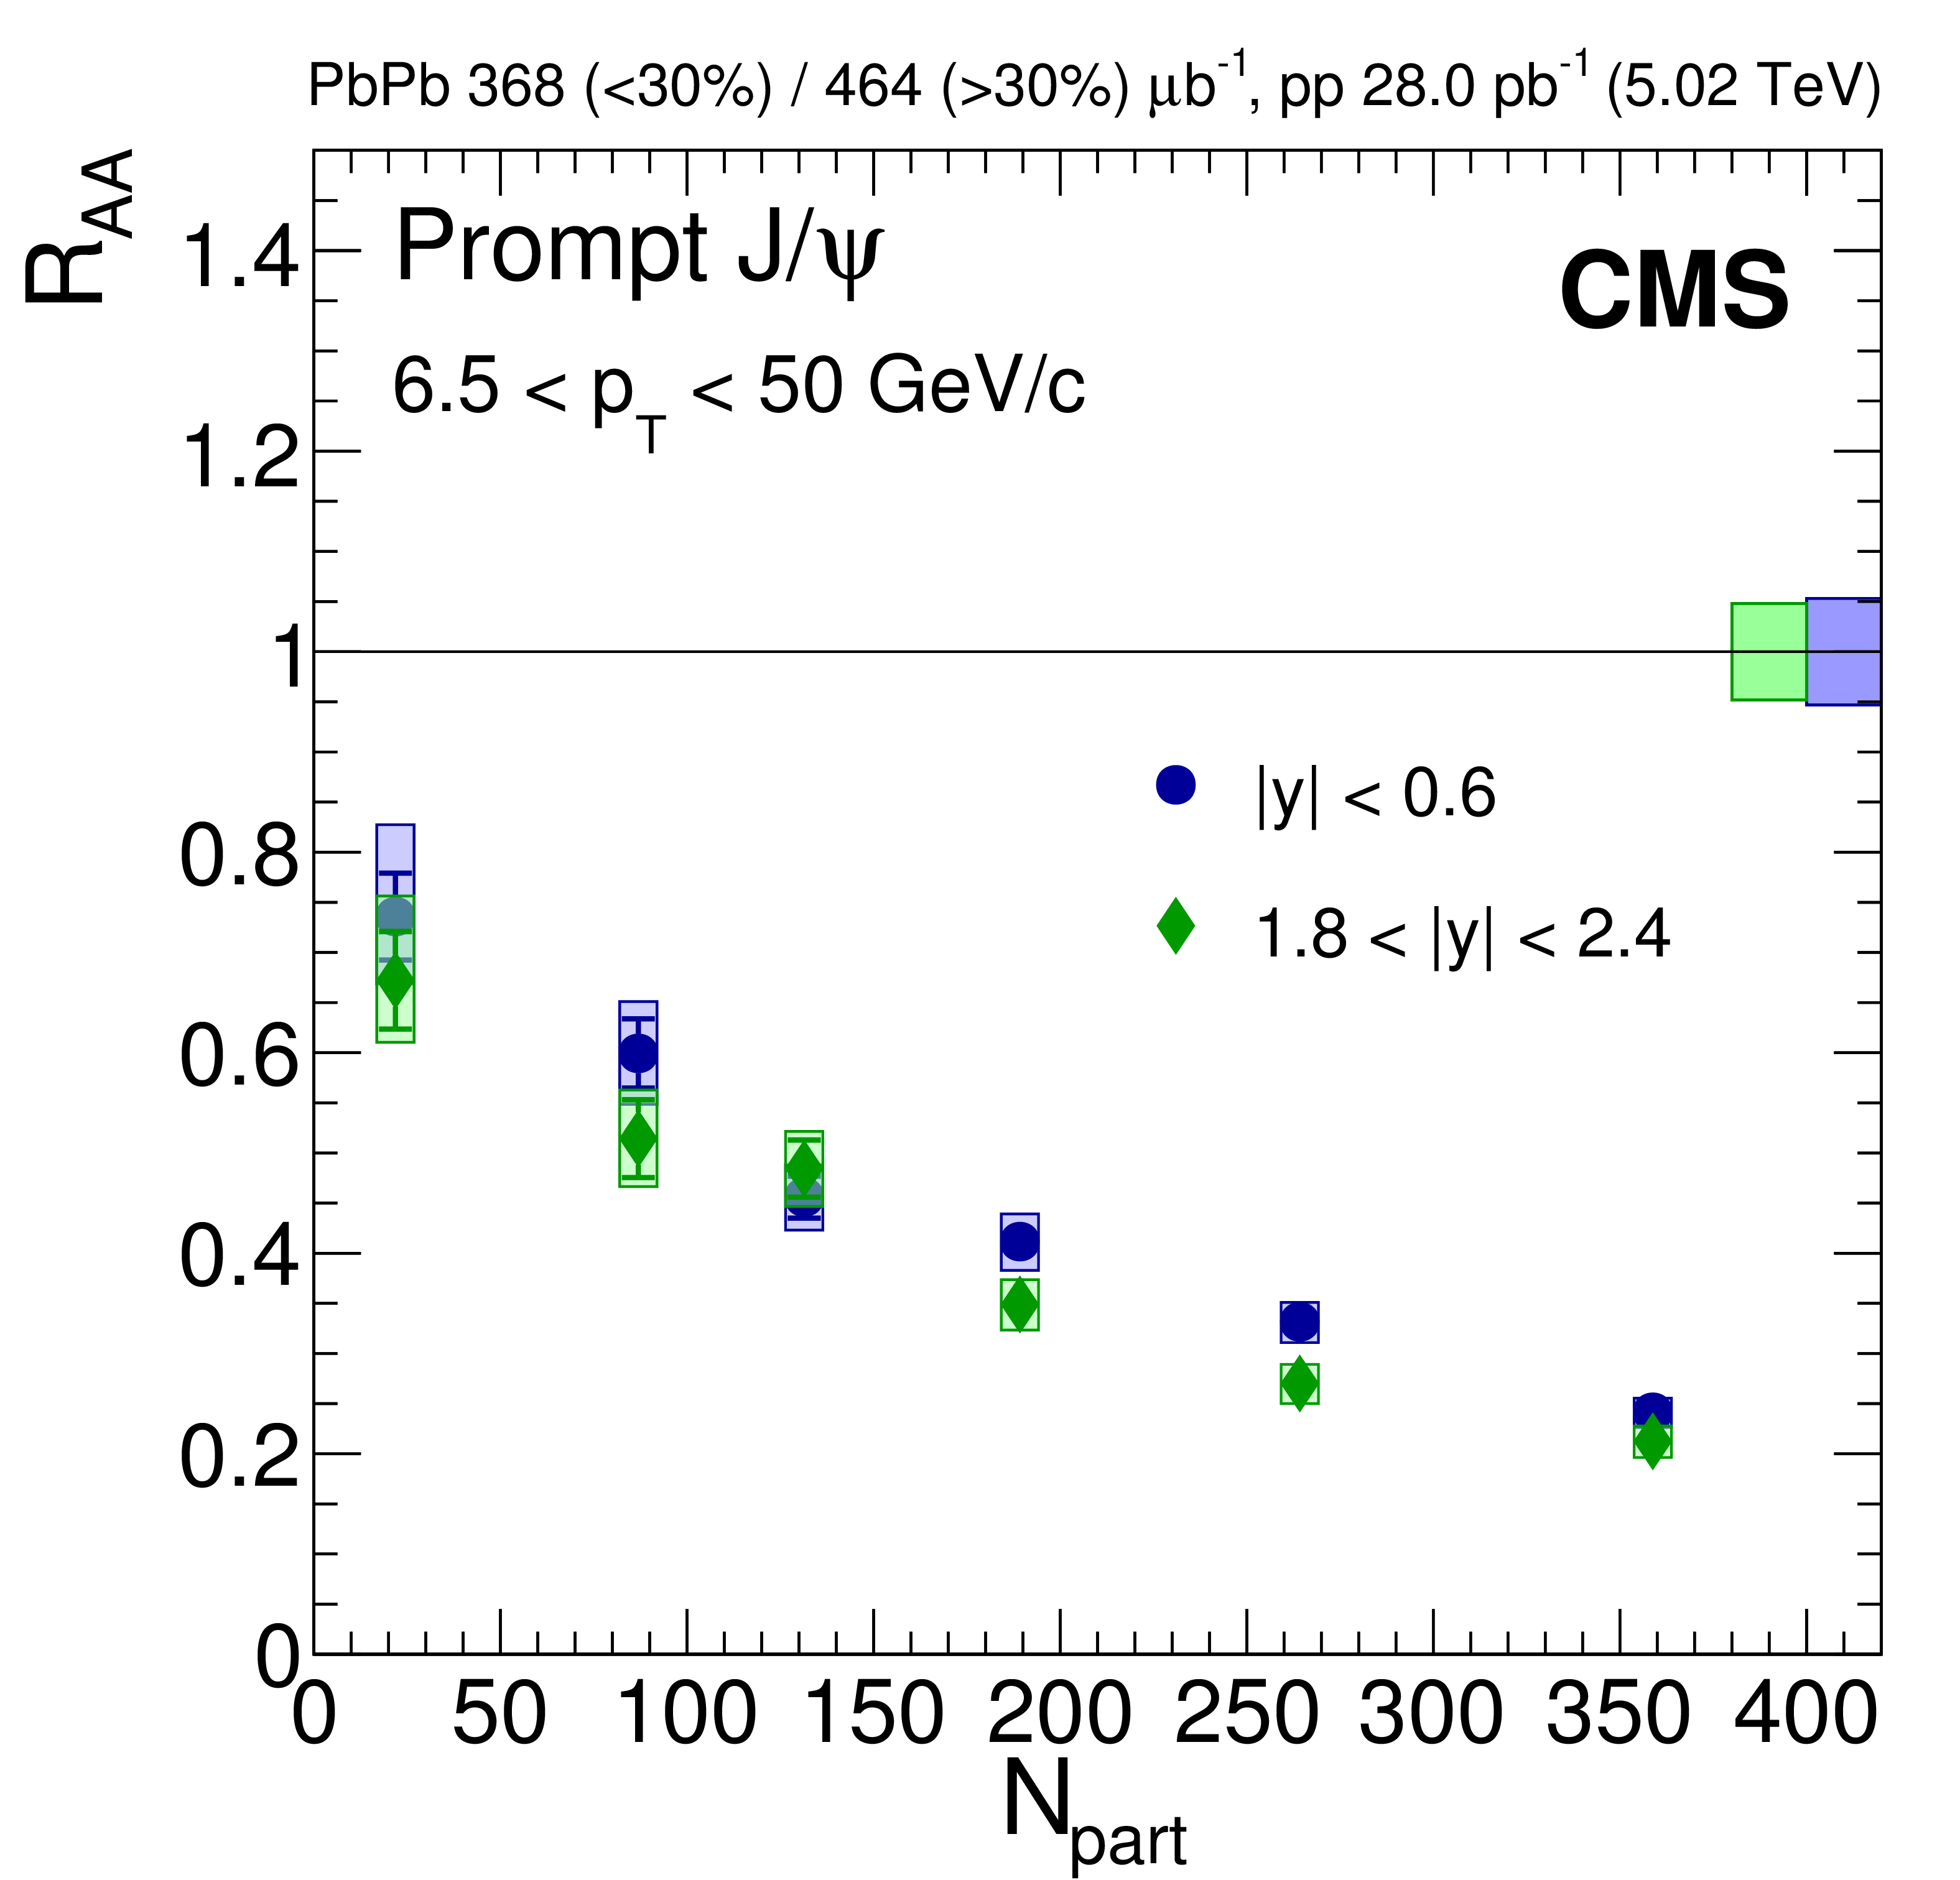
Figure 5-b:
Nuclear modification factor of prompt $ \mathrm {J}/\psi $ meson as a function of $ {N_{\text {part}}} $, in the mid- and most forward rapidity intervals. For the results as a function of $ {N_{\text {part}}} $ the most central bin corresponds to 0-10%, and the most peripheral one to 50-100%. The bars (boxes) represent statistical (systematic) point-by-point uncertainties. The boxes plotted at $ {R_{\text {AA}}} =$ 1 indicate the size of the global relative uncertainties. |
png pdf |
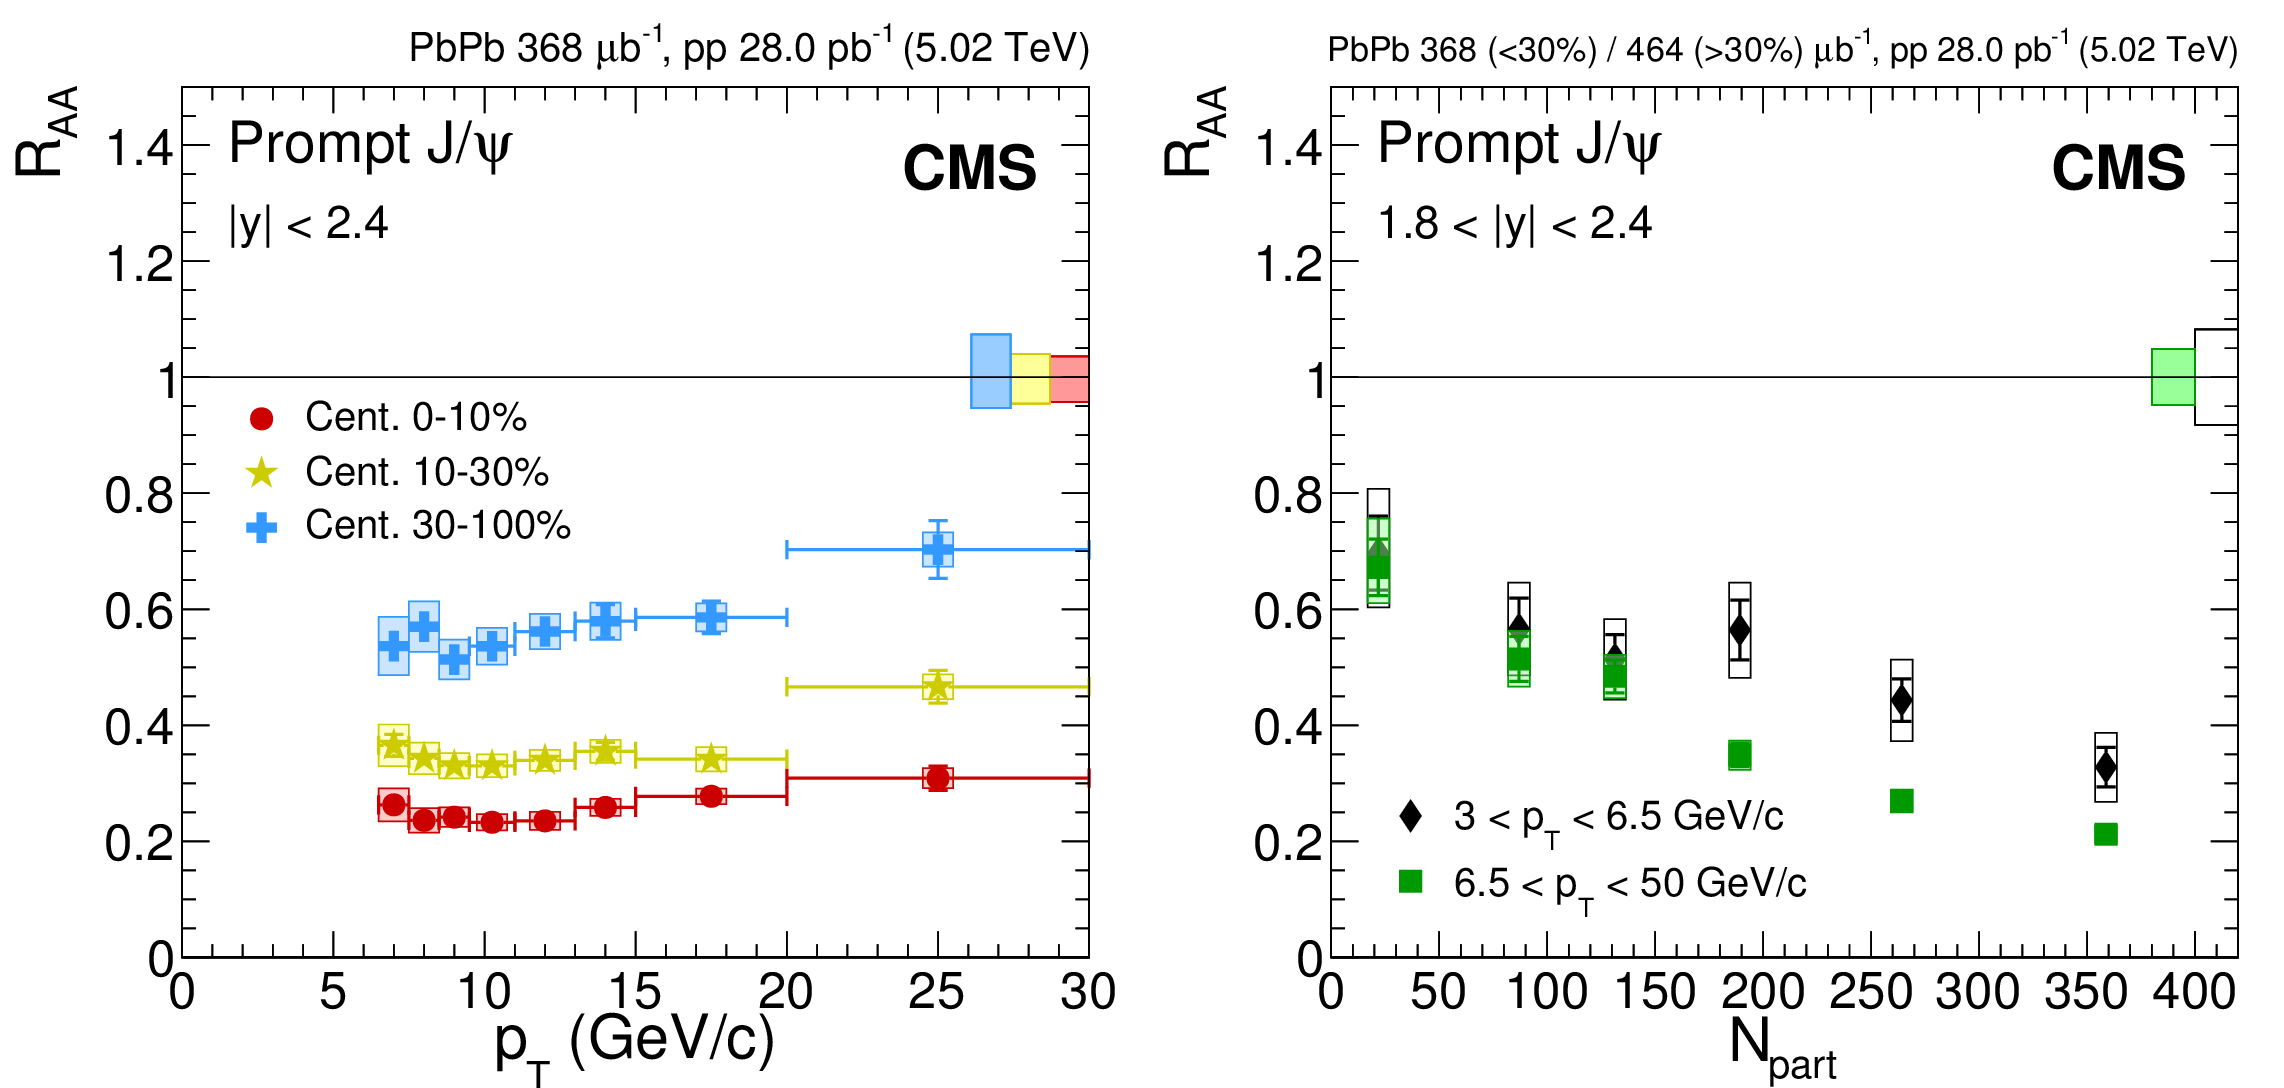
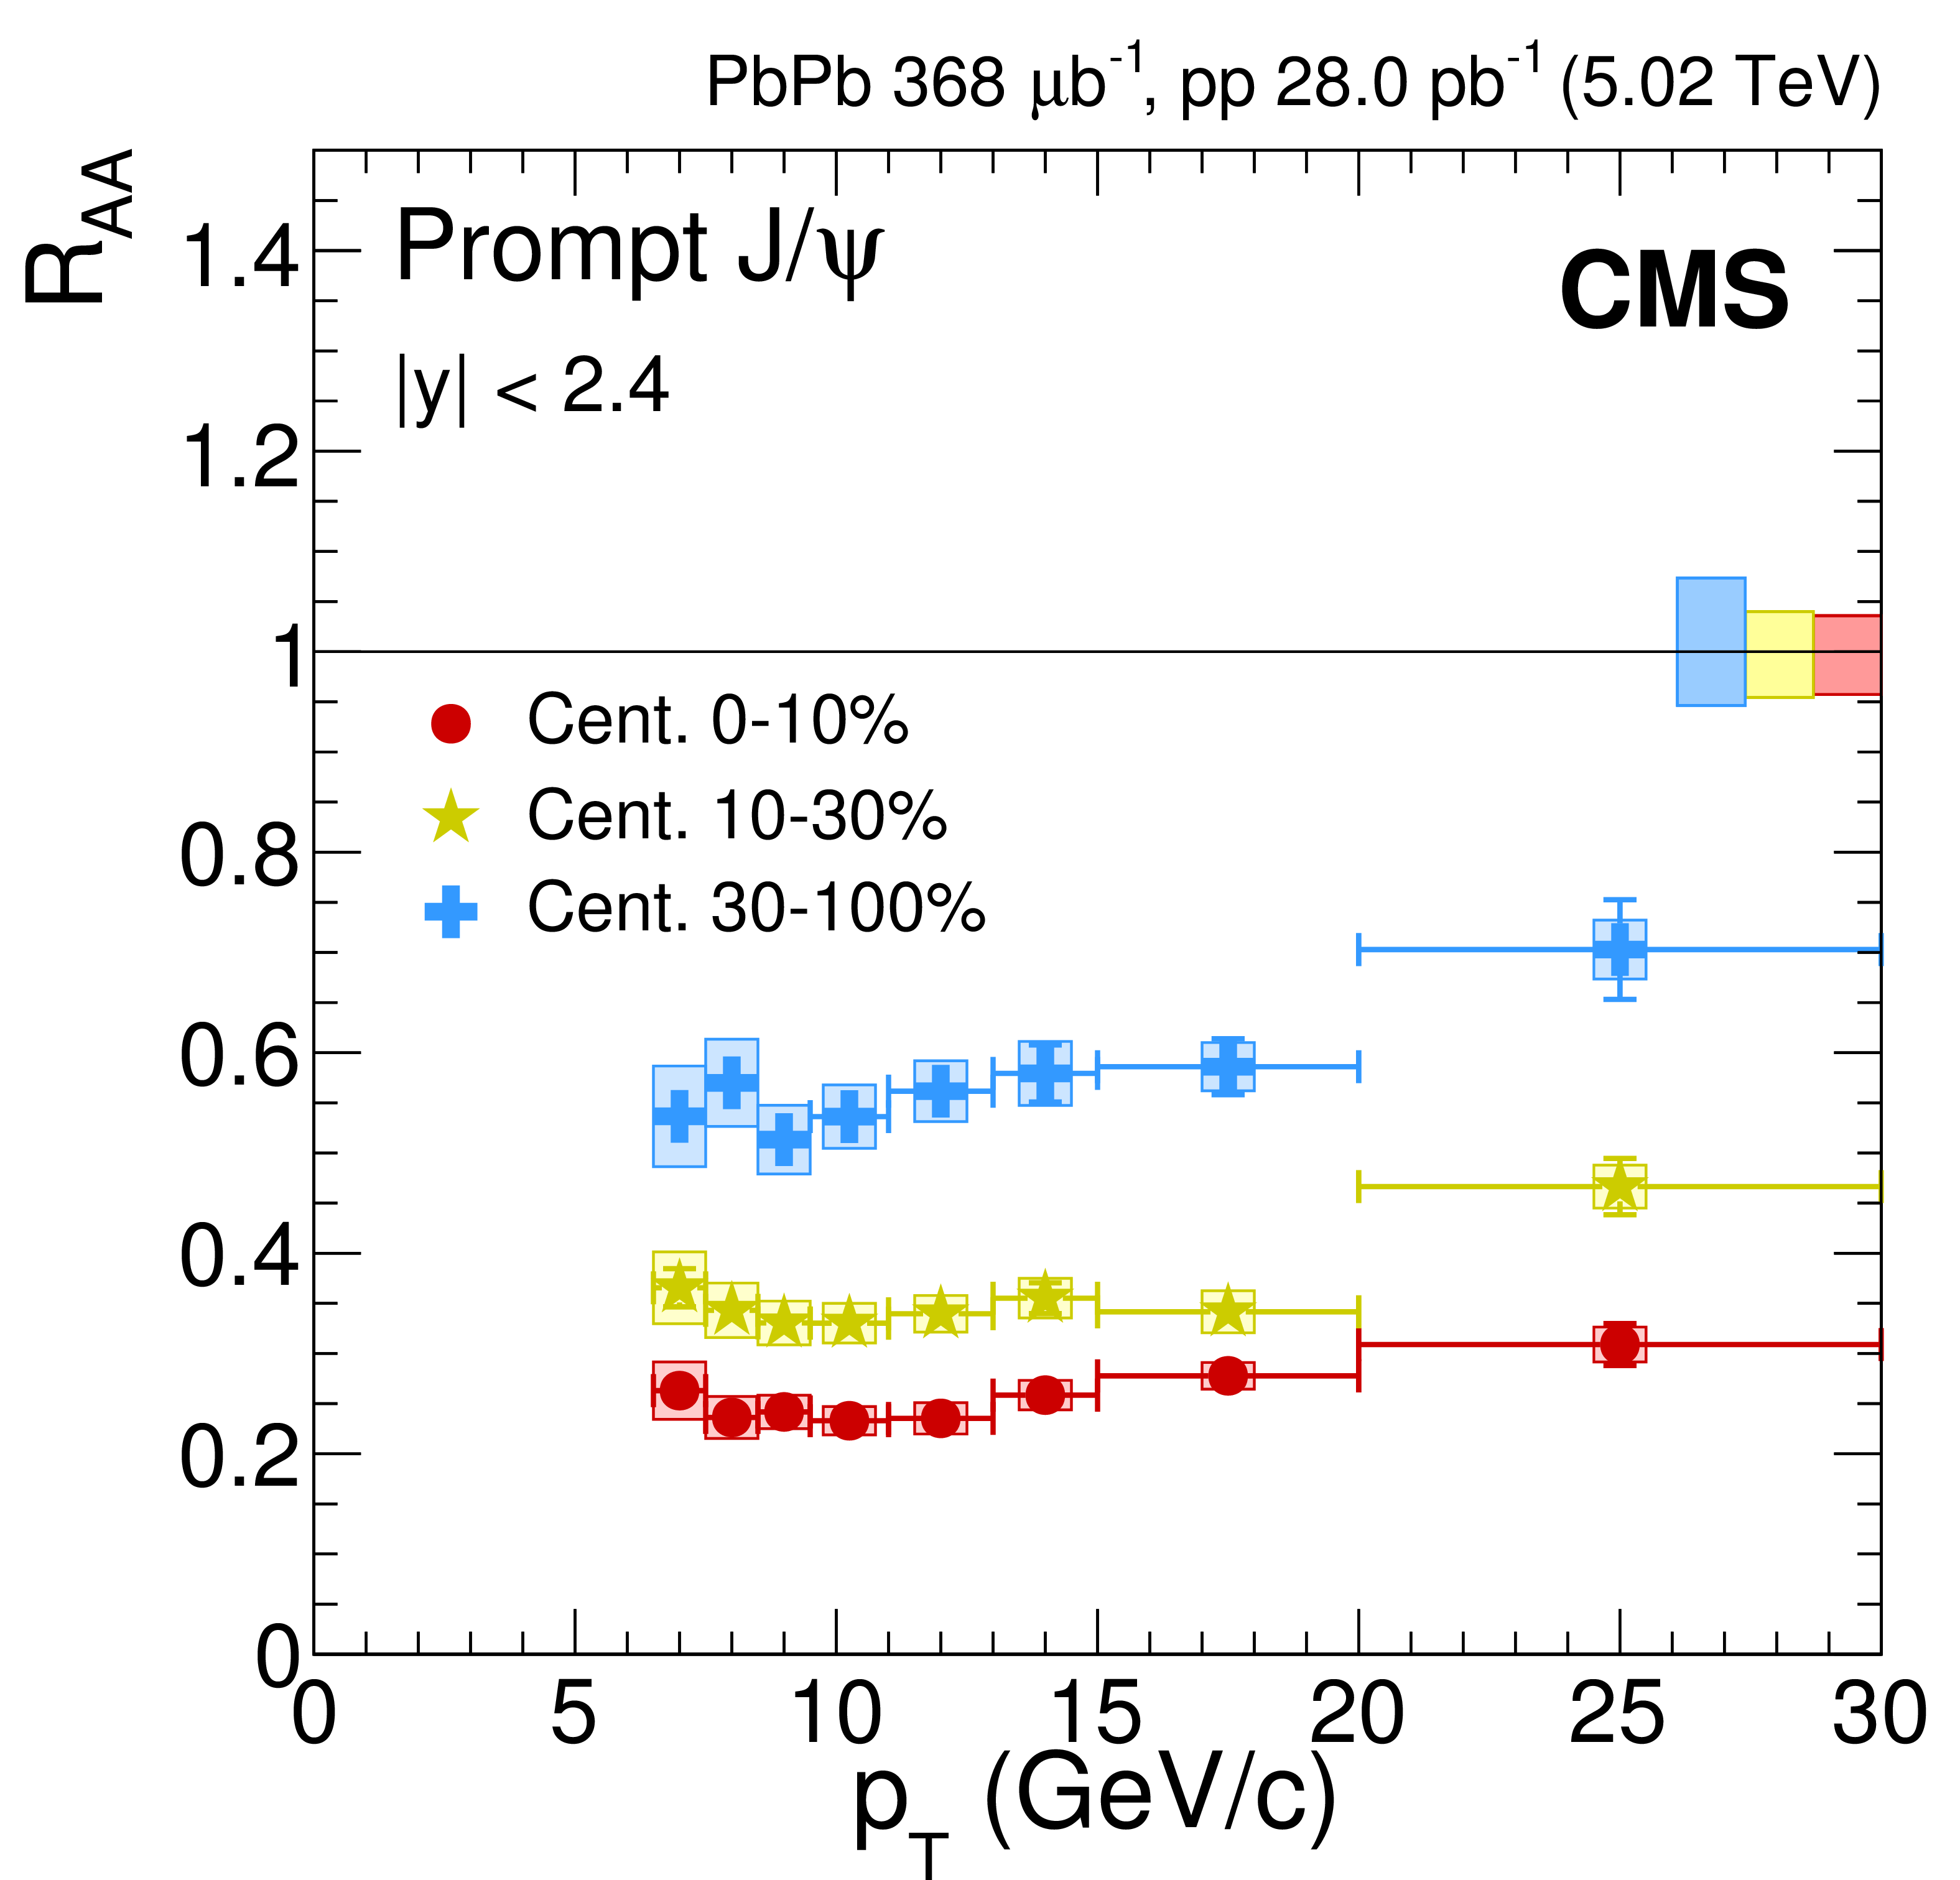
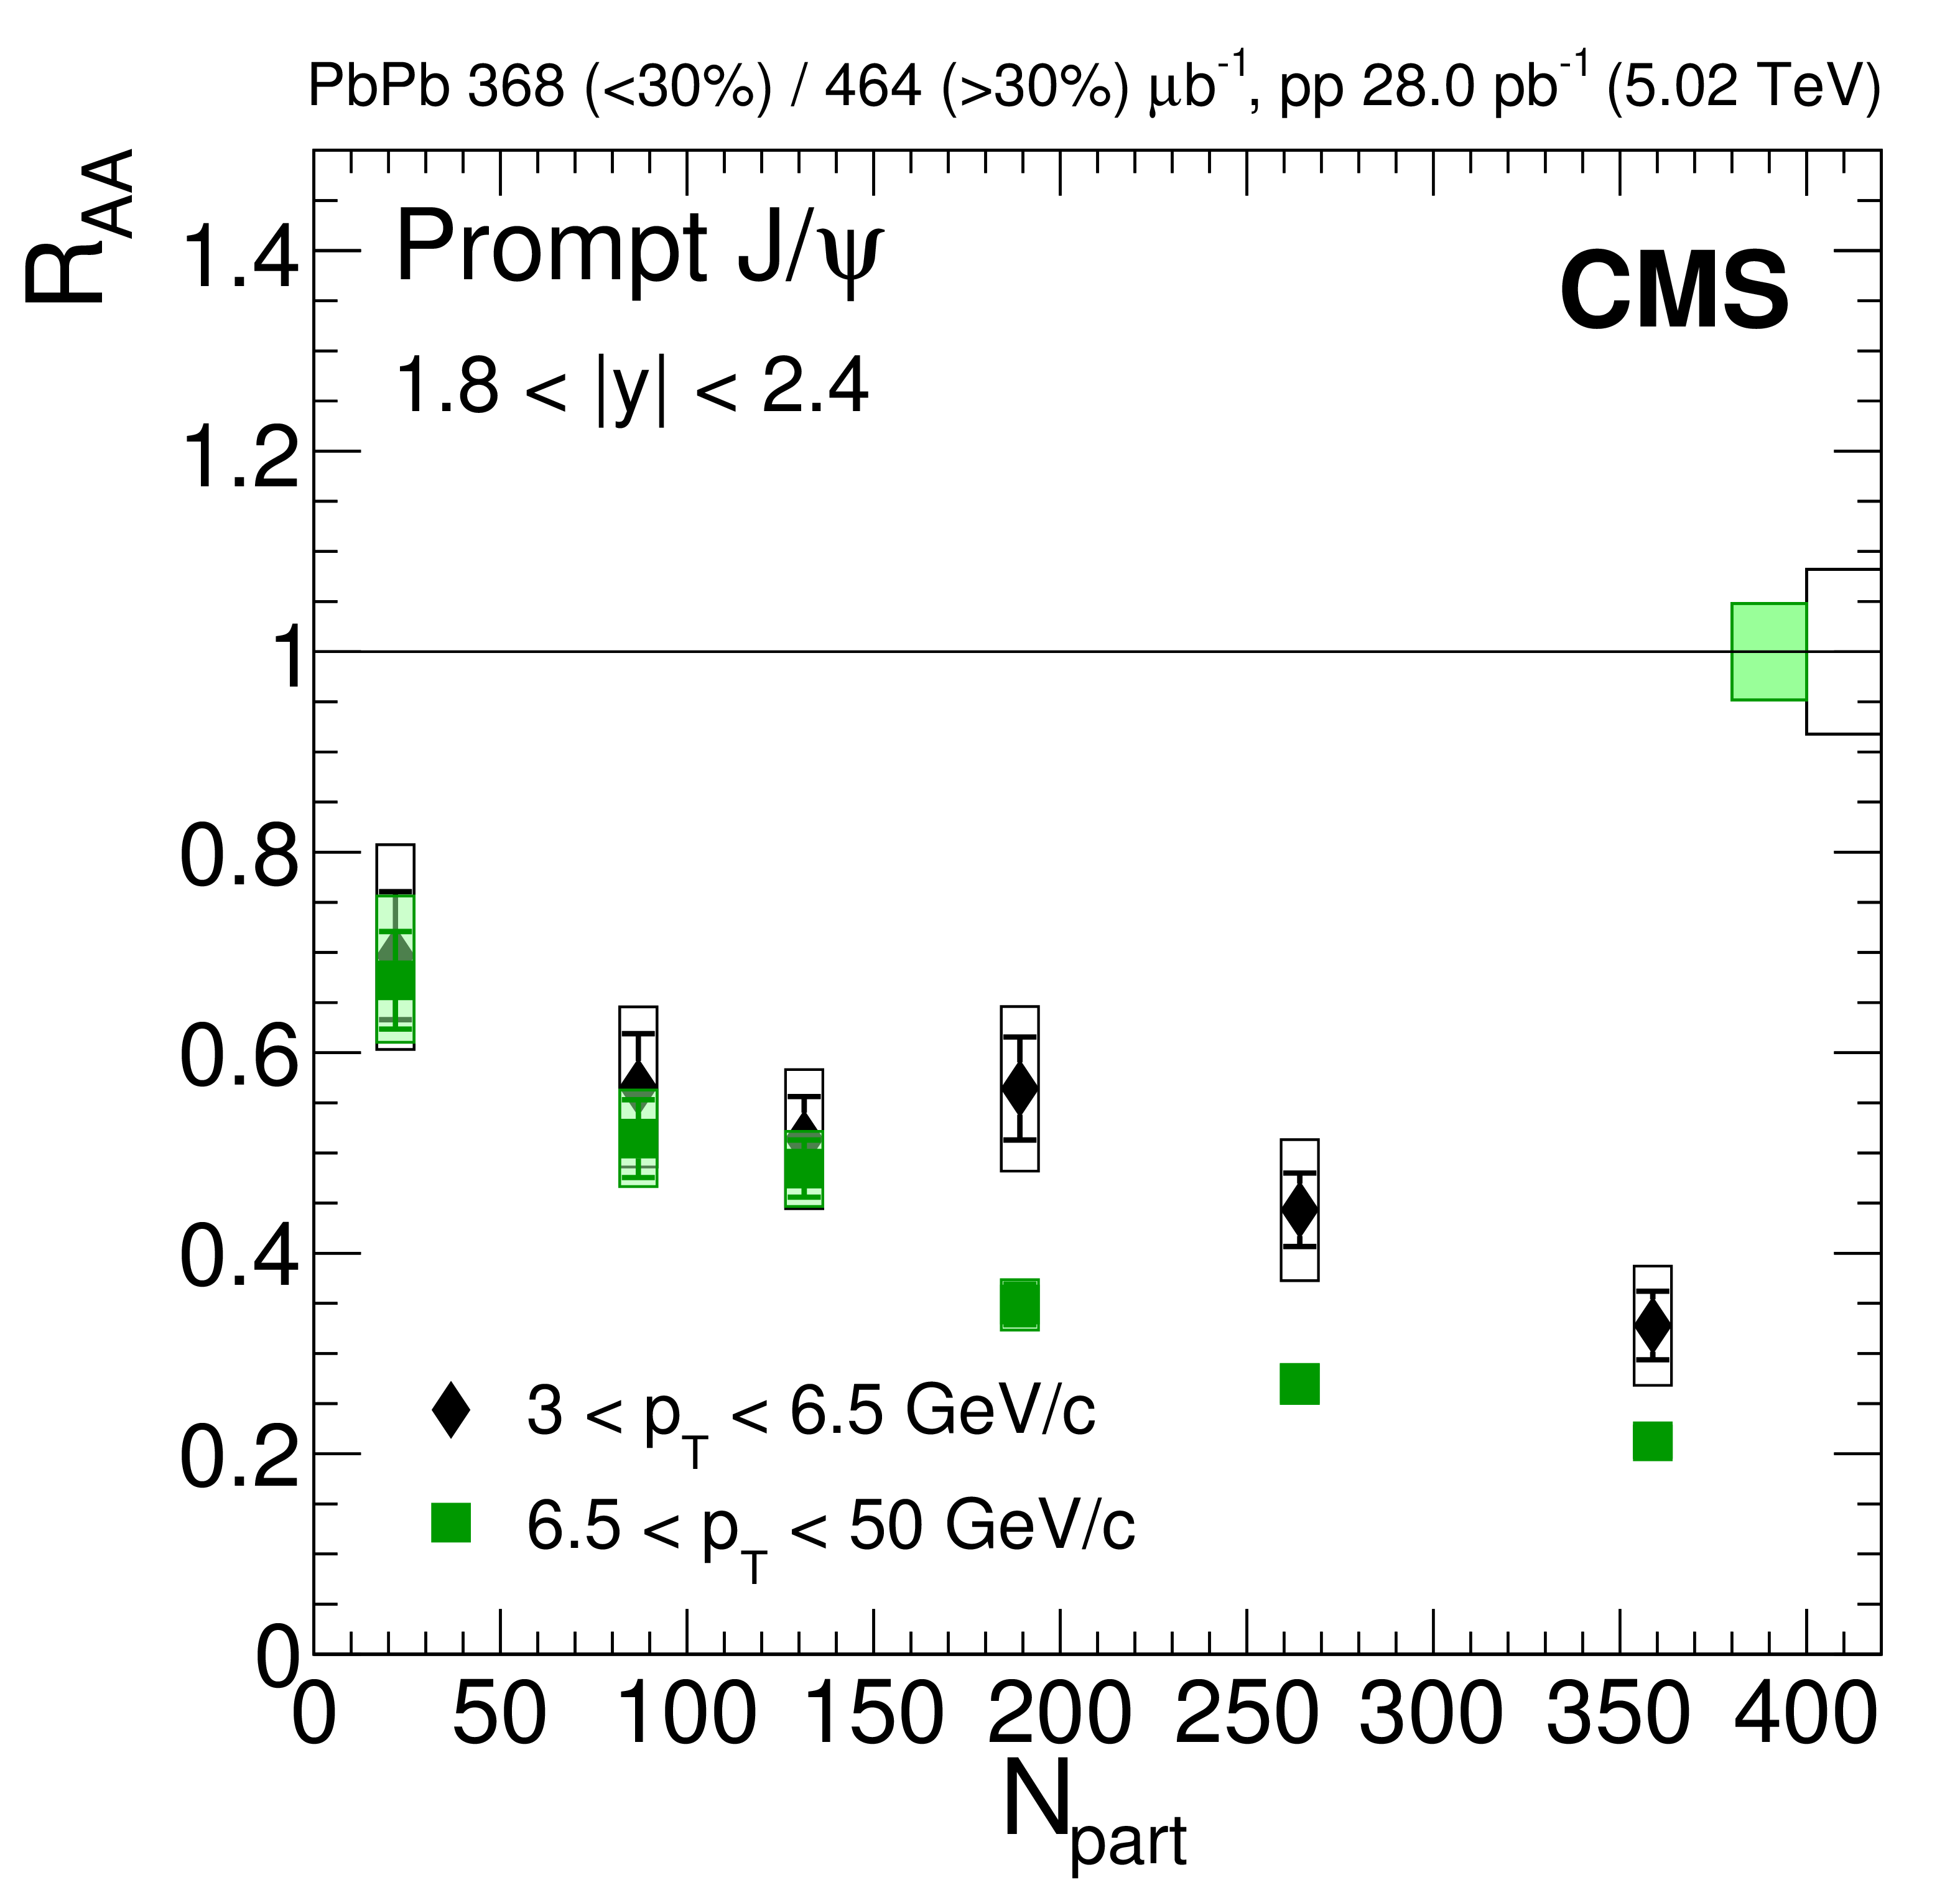
Figure 6:
Nuclear modification factor of prompt $ \mathrm {J}/\psi $ mesons. Left : as a function of dimuon $ {p_{\mathrm {T}}} $ in three centrality bins. Right : as a function of $ {N_{\text {part}}} $ at moderate and high $ {p_{\mathrm {T}}} $, in the forward 1.8 $ < | y | < $ 2.4 range. For the results as a function of $ {N_{\text {part}}} $ the most central bin corresponds to 0-10%, and the most peripheral one to 50-100%. The bars (boxes) represent statistical (systematic) point-by-point uncertainties. The boxes plotted at $ {R_{\text {AA}}} =$ 1 indicate the size of the global relative uncertainties. |
png pdf |
Figure 6-a:
Nuclear modification factor of prompt $ \mathrm {J}/\psi $ mesons as a function of dimuon $ {p_{\mathrm {T}}} $ in three centrality bins. The bars (boxes) represent statistical (systematic) point-by-point uncertainties. The boxes plotted at $ {R_{\text {AA}}} =$ 1 indicate the size of the global relative uncertainties. |
png pdf |
Figure 6-b:
Nuclear modification factor of prompt $ \mathrm {J}/\psi $ mesons as a function of $ {N_{\text {part}}} $ at moderate and high $ {p_{\mathrm {T}}} $, in the forward 1.8 $ < | y | < $ 2.4 range. The most central bin corresponds to 0-10%, and the most peripheral one to 50-100%. The bars (boxes) represent statistical (systematic) point-by-point uncertainties. The boxes plotted at $ {R_{\text {AA}}} =$ 1 indicate the size of the global relative uncertainties. |
png pdf |
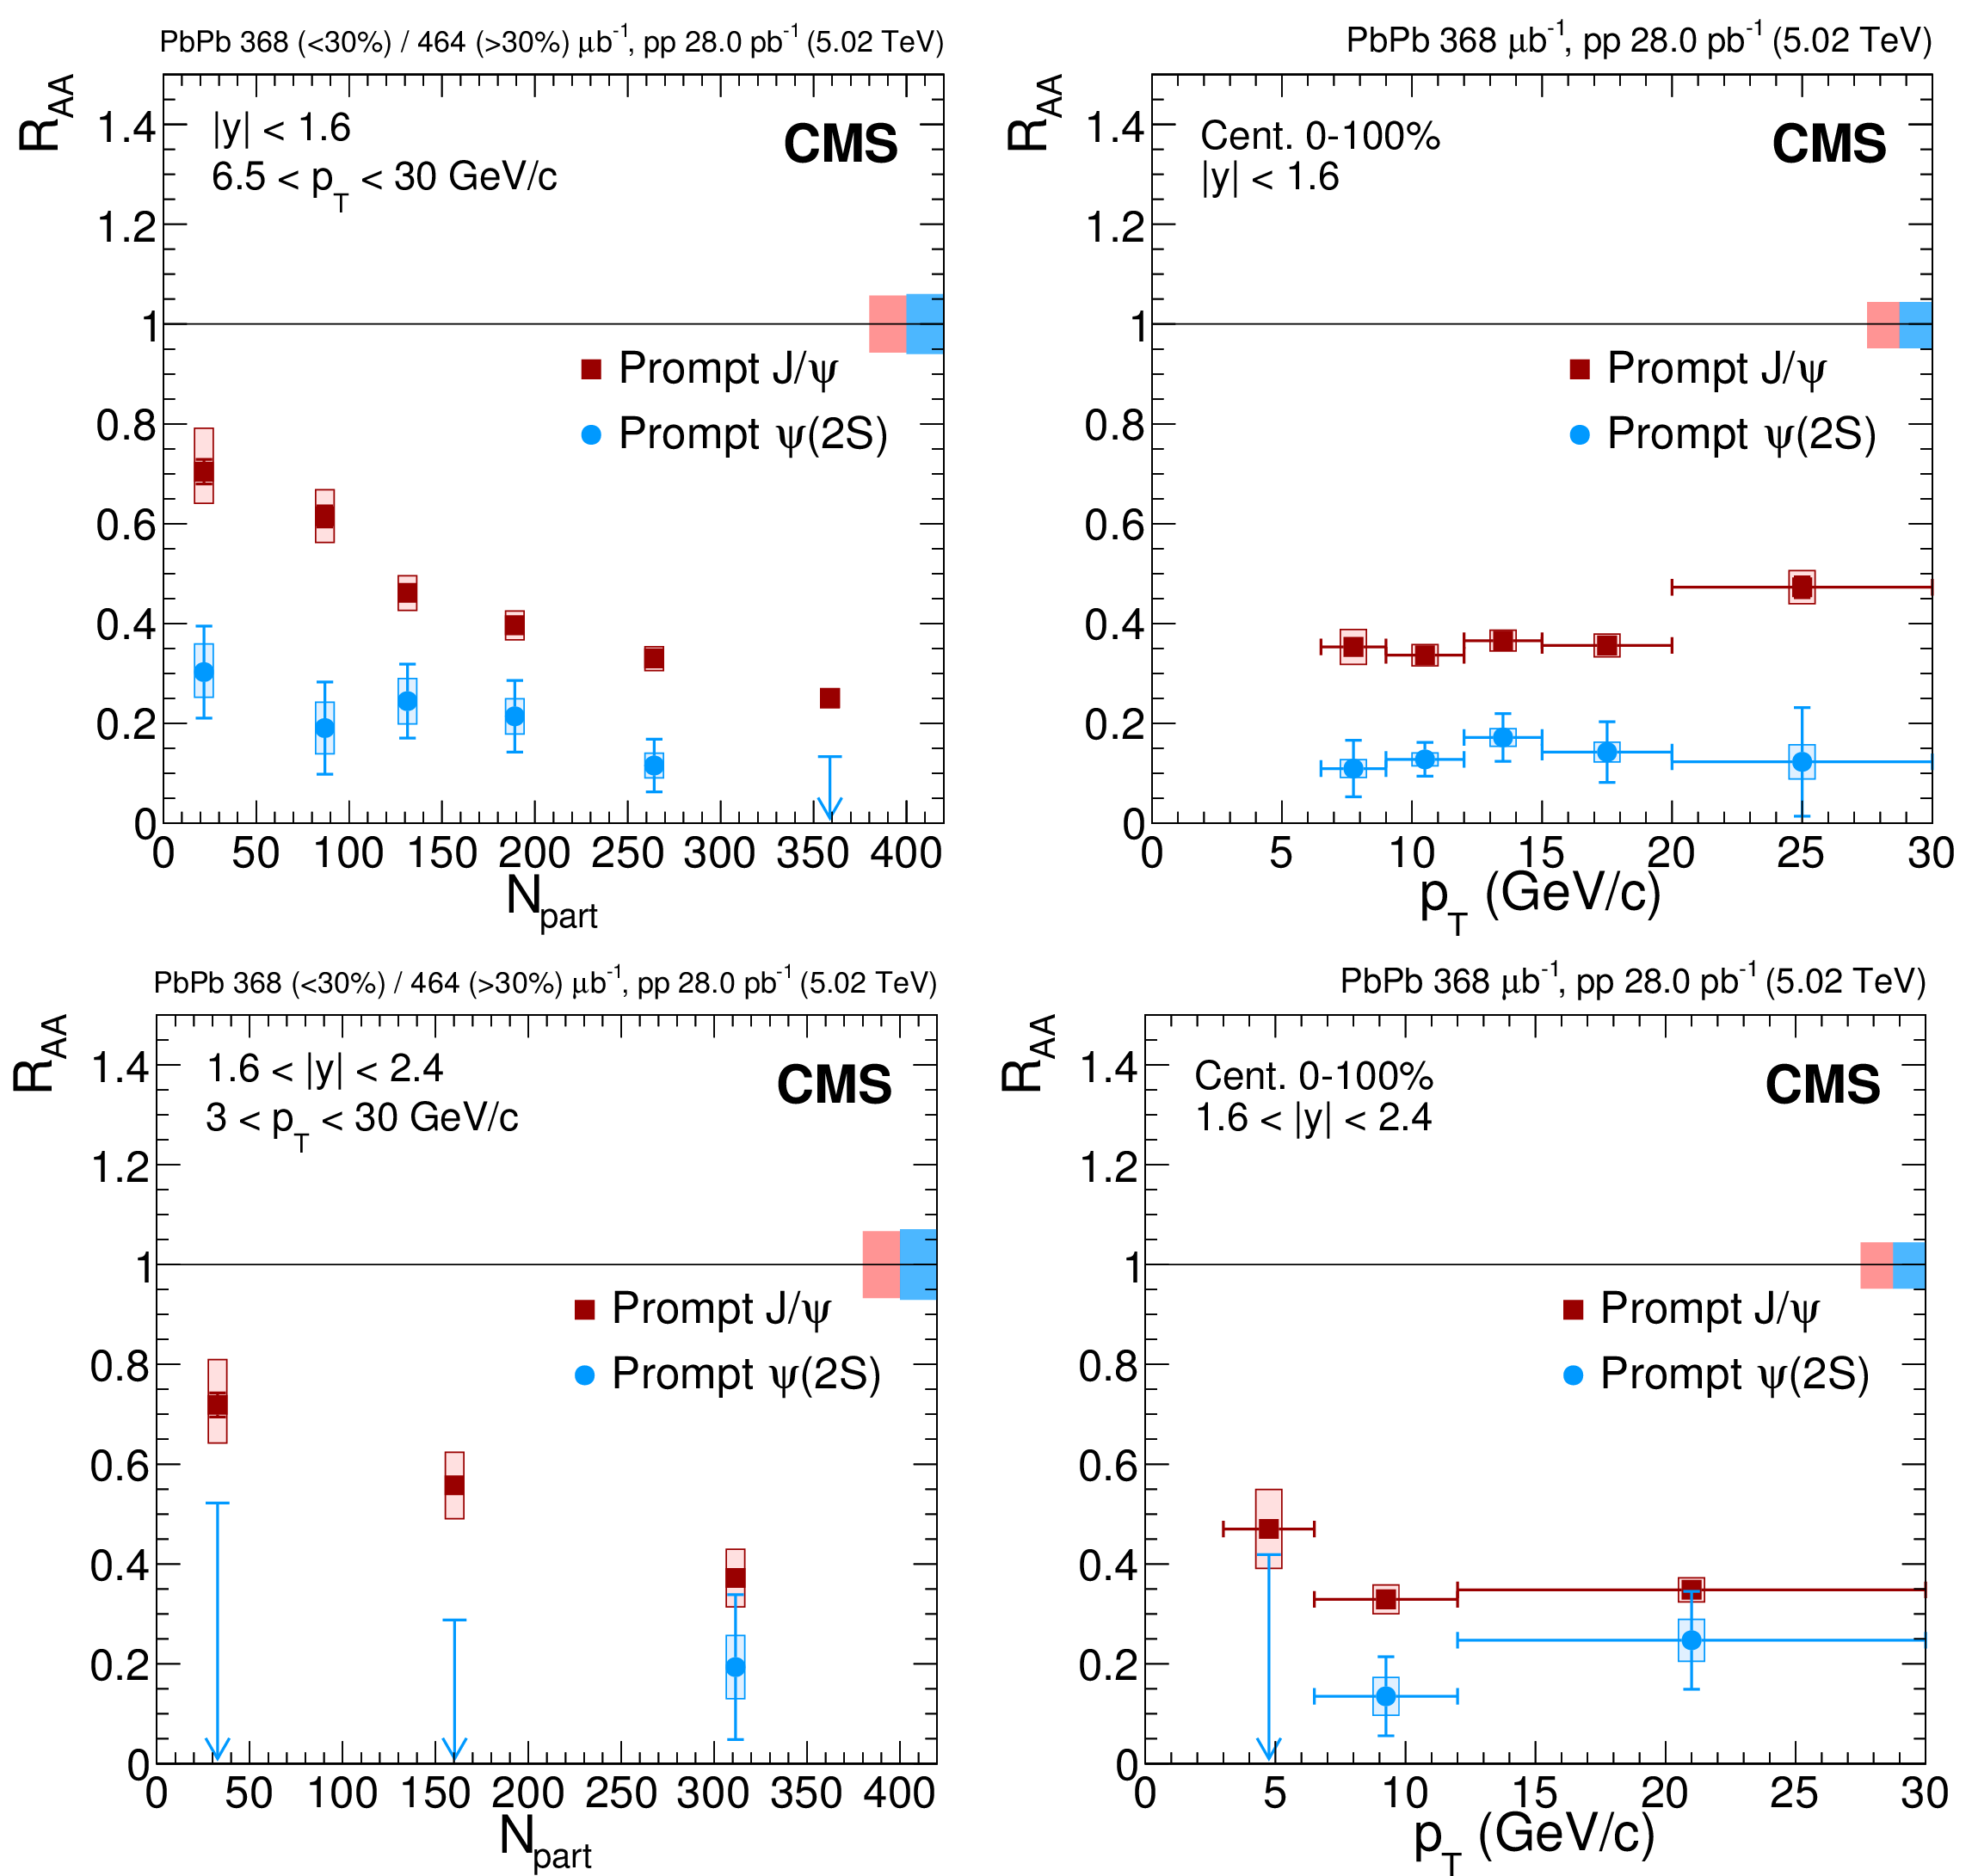
Figure 7:
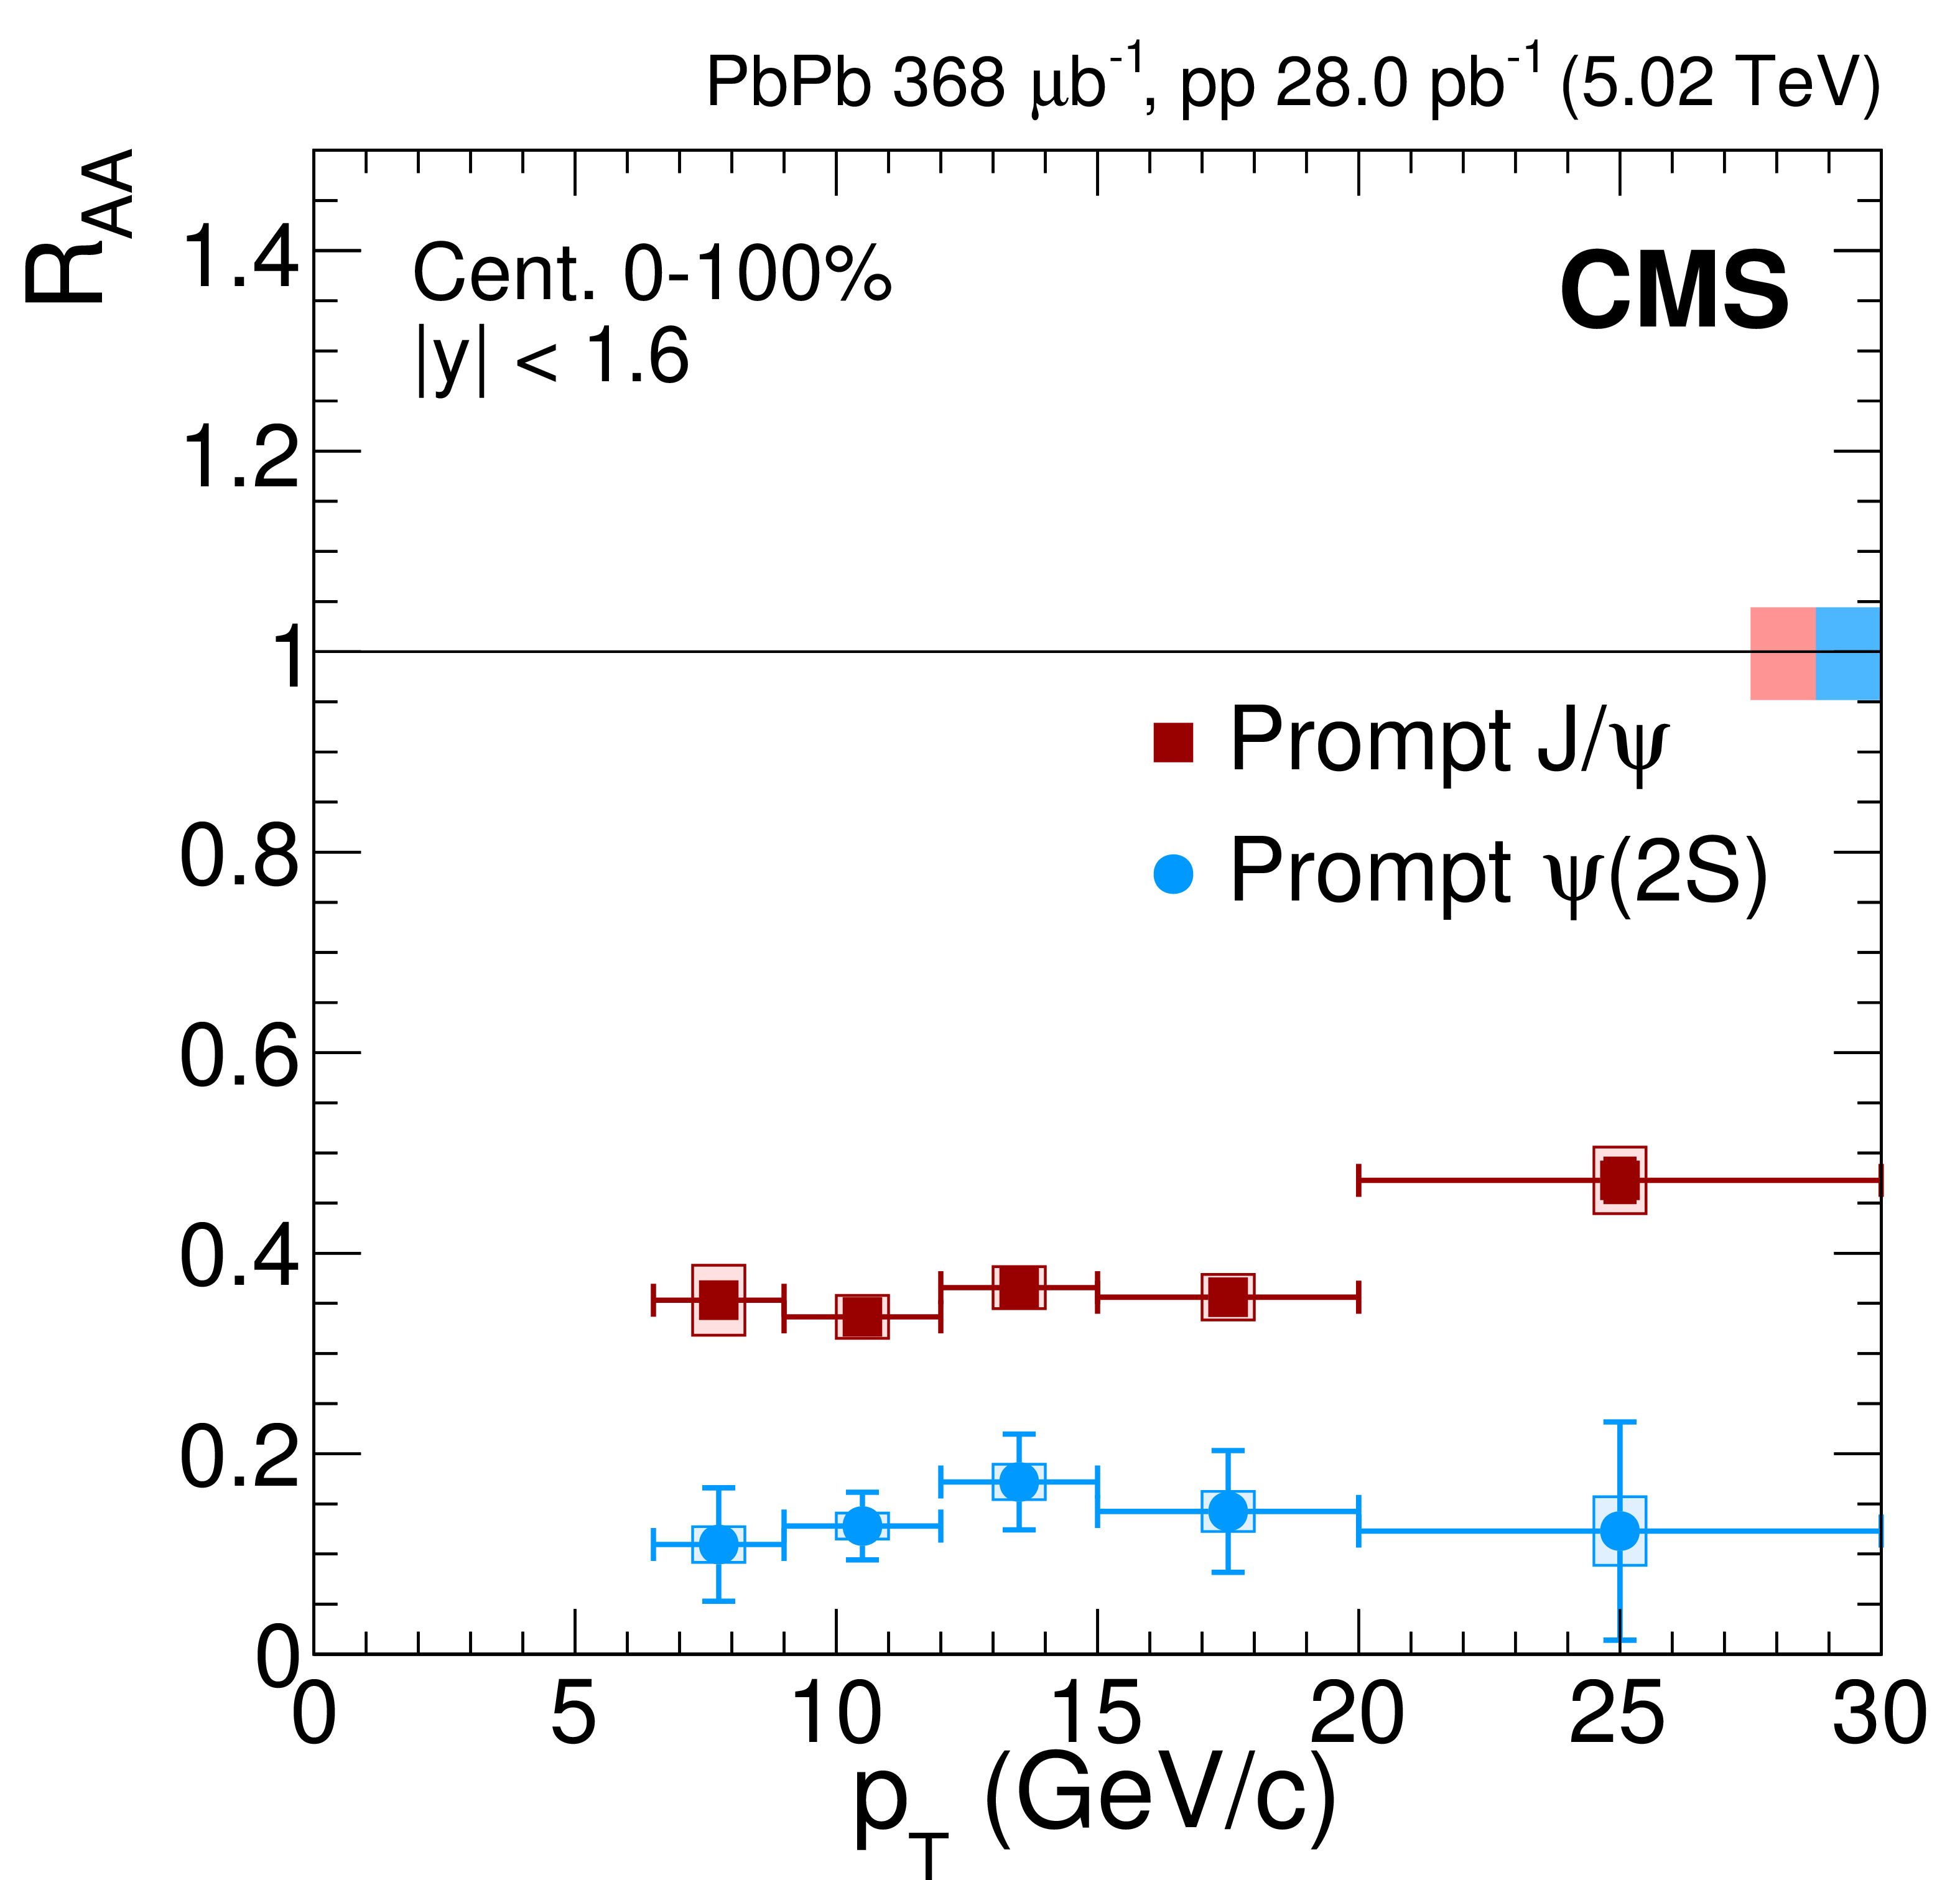
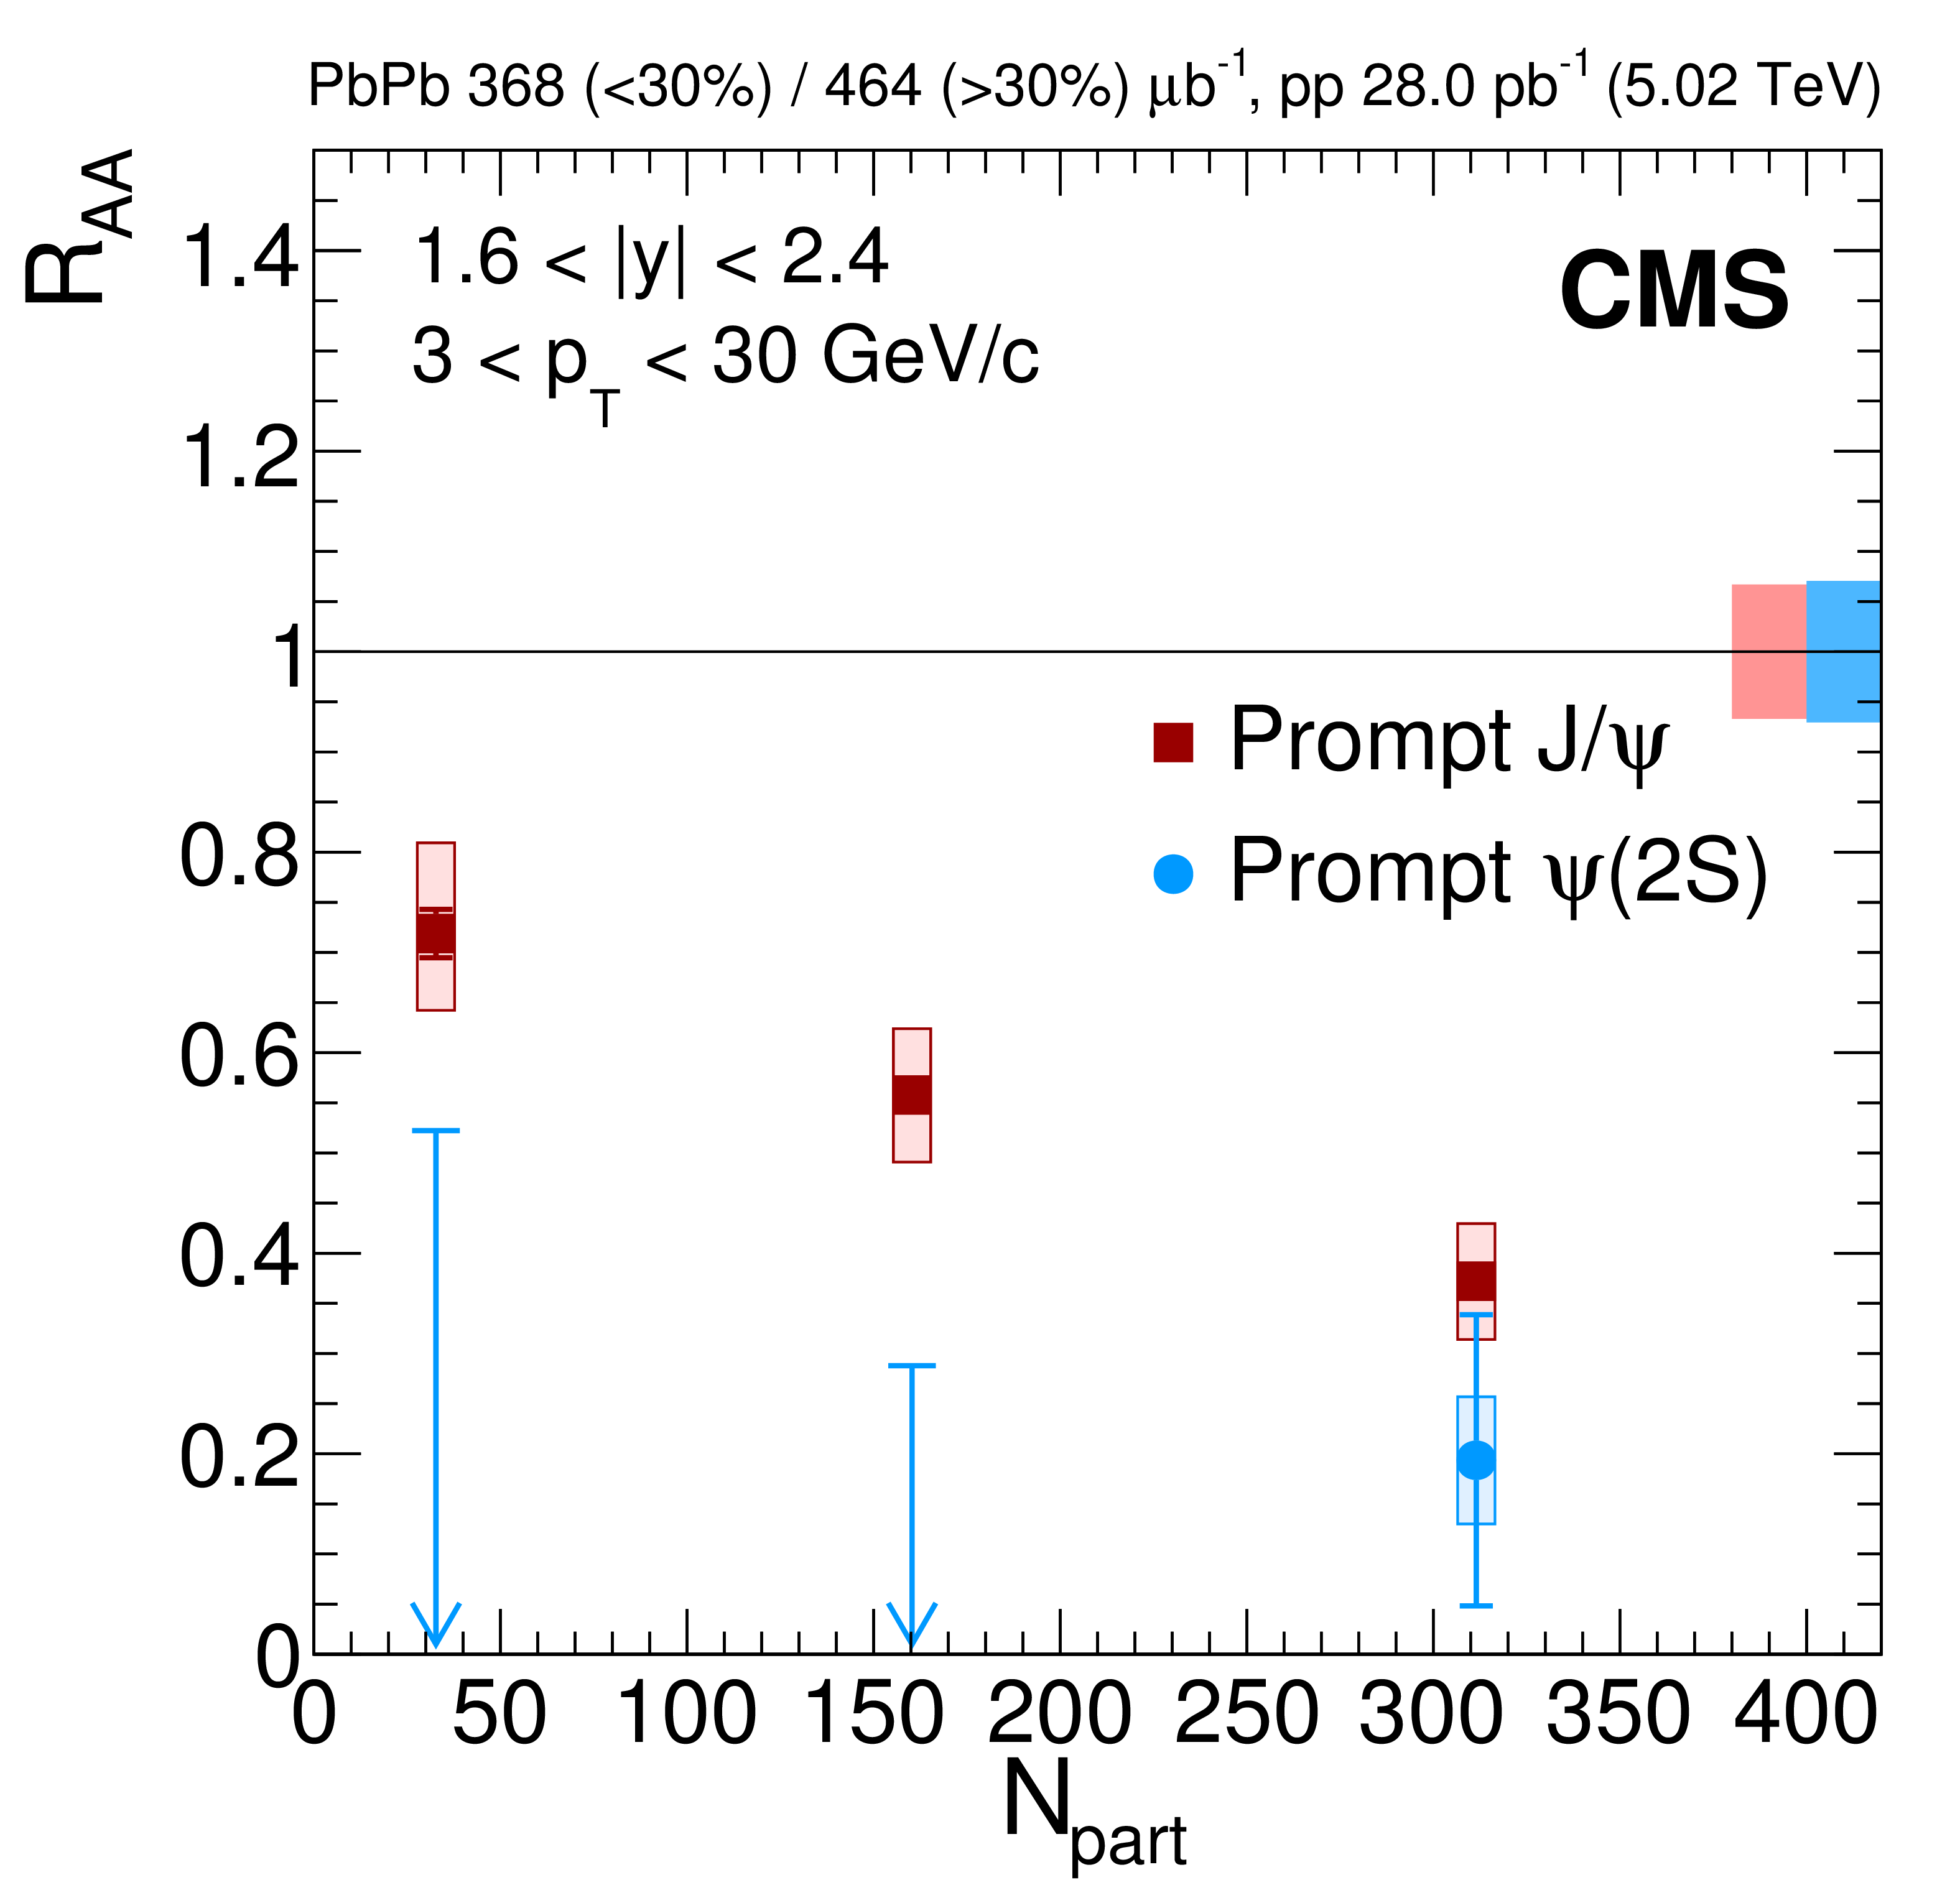
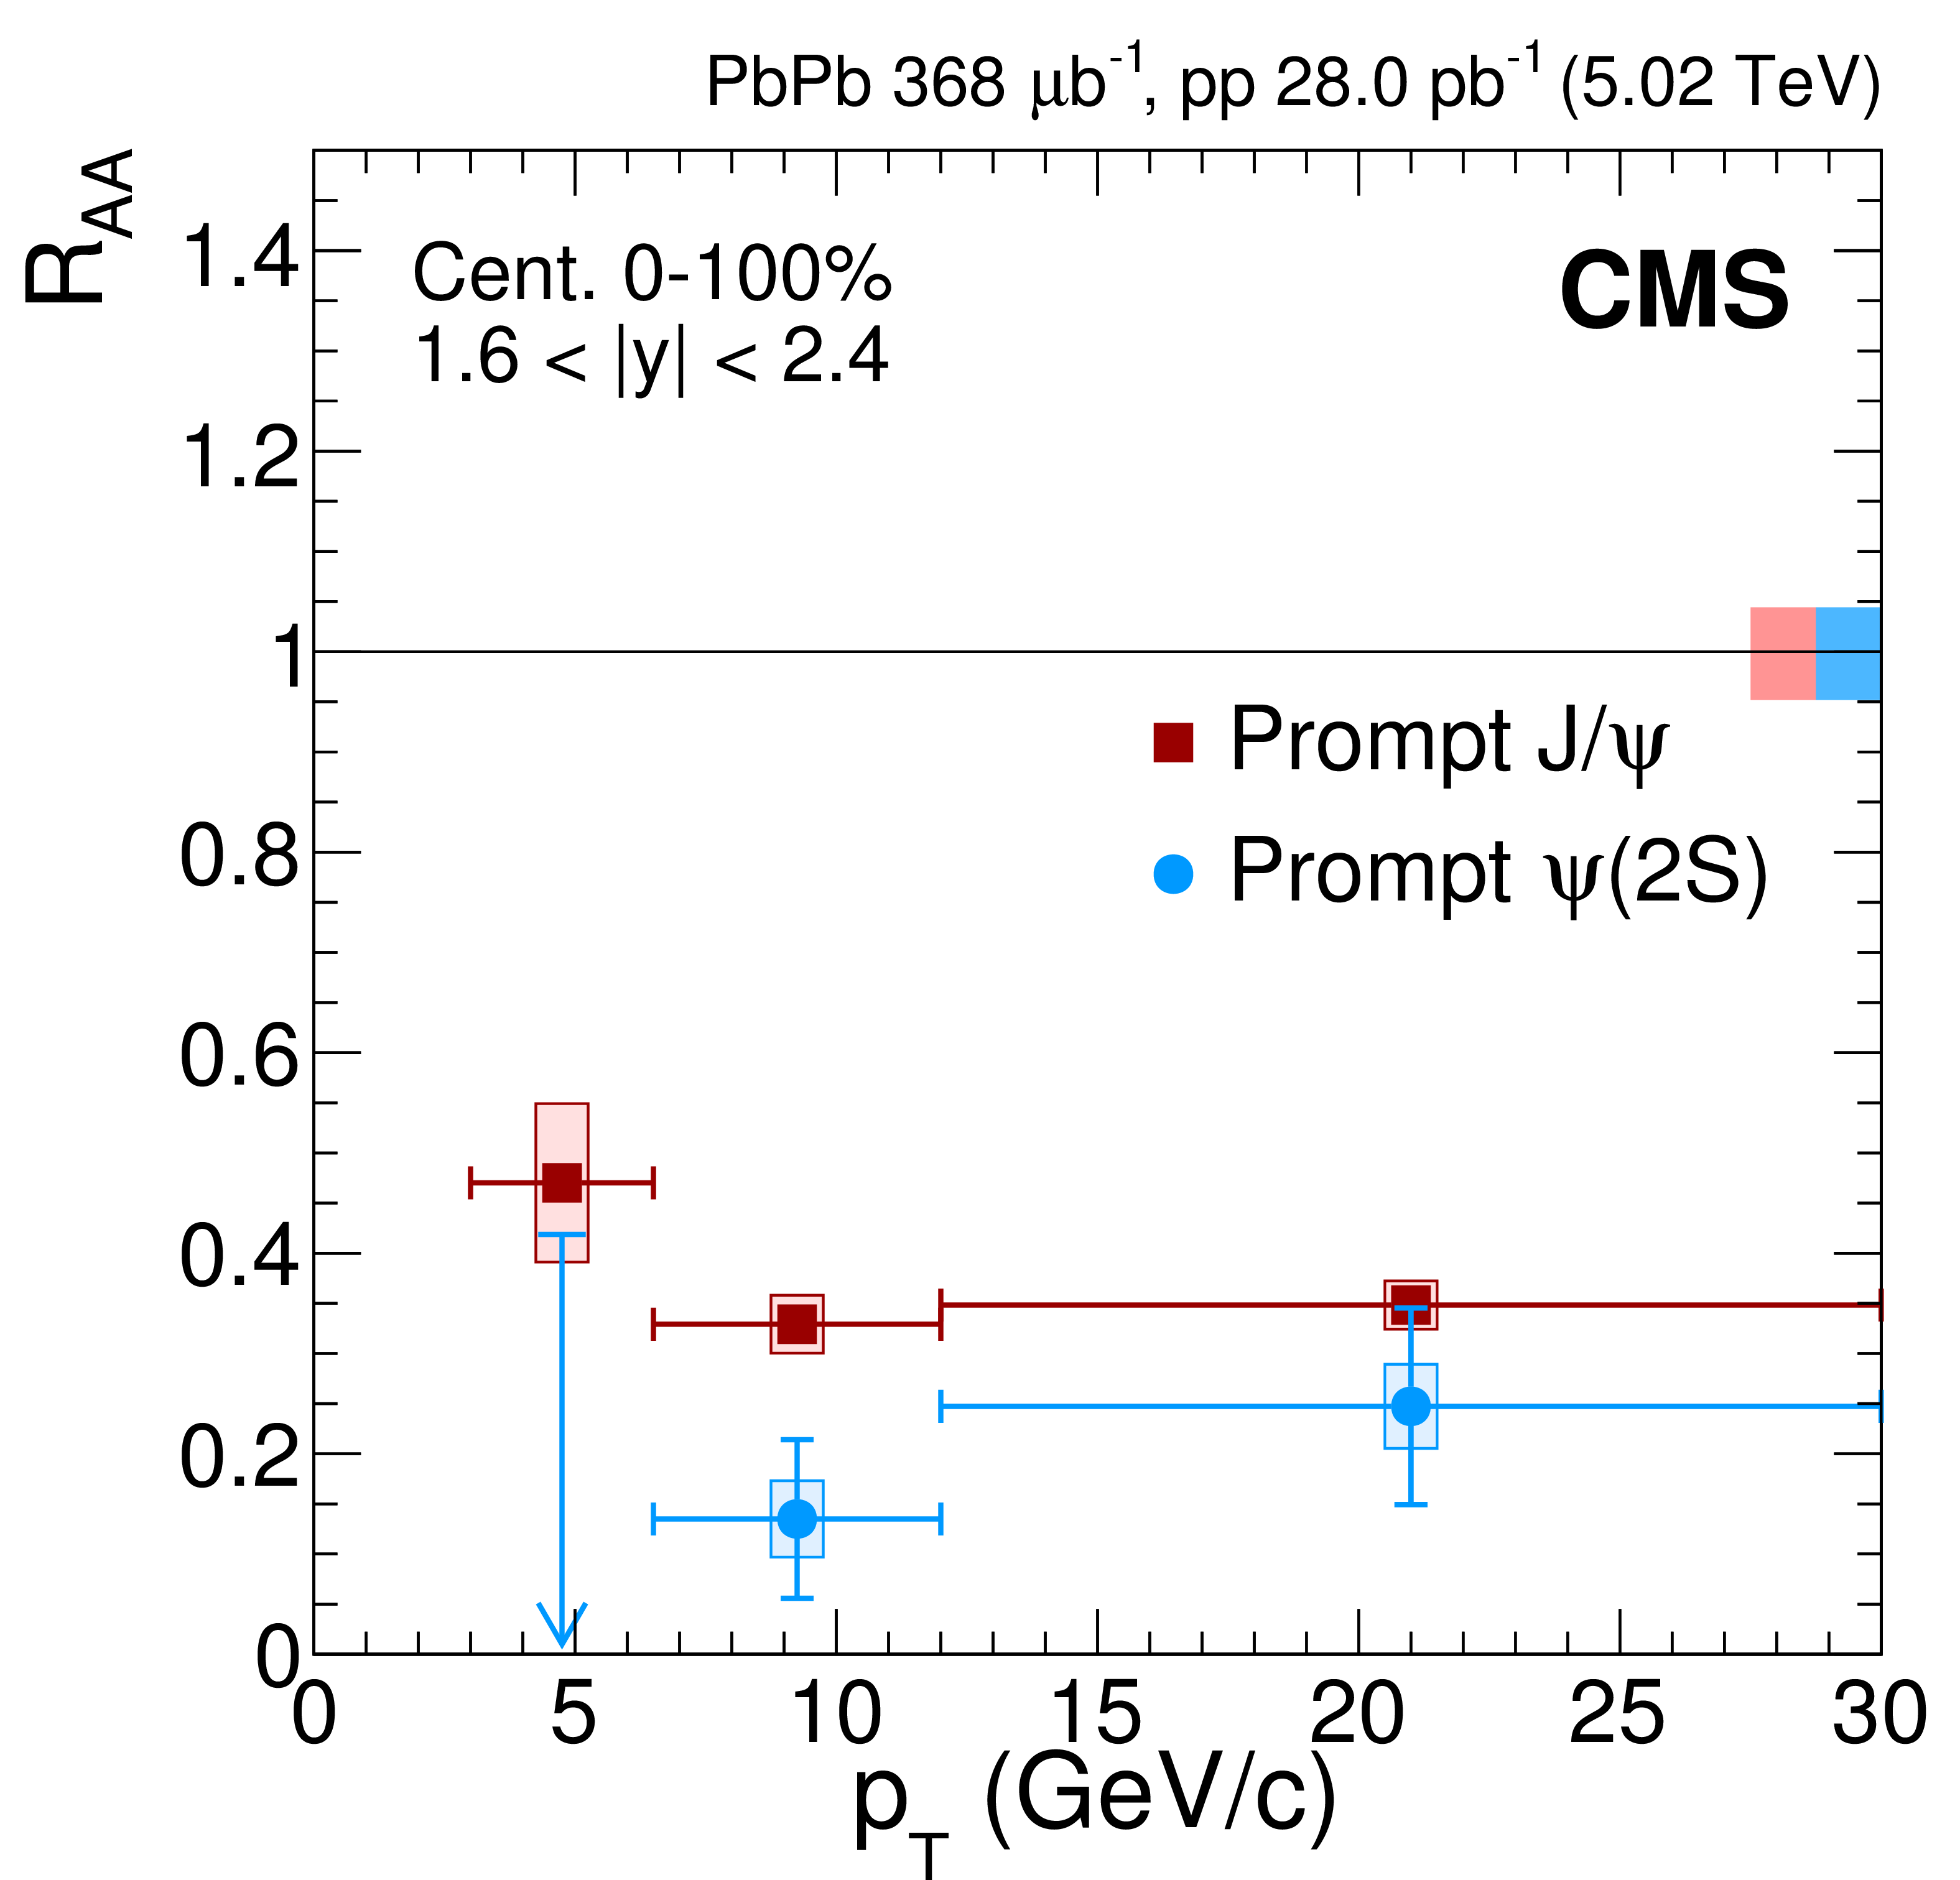
Nuclear modification factor of prompt $ \mathrm {J}/\psi $ and $ {\psi \text {(2S)}} $ mesons as a function of $ {N_{\text {part}}} $ (left) and dimuon $ {p_{\mathrm {T}}} $ (right), at central (upper, starting at $ {p_{\mathrm {T}}} = $ 6.5 GeV/$c$) and forward (lower, starting at $ {p_{\mathrm {T}}} = $ 3.0 GeV/$c$) rapidity. The vertical arrows represent 95% confidence intervals in the bins where the double ratio measurement is consistent with 0 (see text). For the results as a function of $ {N_{\text {part}}} $ the most central bin corresponds to 0-10% (0-20%), and the most peripheral one to 50-100% (40-100%), for $ | y | < $ 1.6 (1.6 $ < | y | < $ 2.4). The bars (boxes) represent statistical (systematic) point-by-point uncertainties. The boxes plotted at $ {R_{\text {AA}}} = $ 1 indicate the size of the global relative uncertainties. |

png pdf |
Figure 7-a:
Nuclear modification factor of prompt $ \mathrm {J}/\psi $ and $ {\psi \text {(2S)}} $ mesons as a function of $ {N_{\text {part}}} $, at central (starting at $ {p_{\mathrm {T}}} = $ 6.5 GeV/$c$) rapidity. The vertical arrows represent 95% confidence intervals in the bins where the double ratio measurement is consistent with 0 (see text). The most central bin corresponds to 0-10% (0-20%), and the most peripheral one to 50-100% (40-100%), for $ | y | < $ 1.6 (1.6 $ < | y | < $ 2.4). The bars (boxes) represent statistical (systematic) point-by-point uncertainties. The boxes plotted at $ {R_{\text {AA}}} = $ 1 indicate the size of the global relative uncertainties. |
png pdf |
Figure 7-b:
Nuclear modification factor of prompt $ \mathrm {J}/\psi $ and $ {\psi \text {(2S)}} $ mesons as a function of dimuon $ {p_{\mathrm {T}}} $, at central (starting at $ {p_{\mathrm {T}}} = $ 6.5 GeV/$c$) rapidity. The vertical arrows represent 95% confidence intervals in the bins where the double ratio measurement is consistent with 0 (see text). The bars (boxes) represent statistical (systematic) point-by-point uncertainties. The boxes plotted at $ {R_{\text {AA}}} = $ 1 indicate the size of the global relative uncertainties. |
png pdf |
Figure 7-c:
Nuclear modification factor of prompt $ \mathrm {J}/\psi $ and $ {\psi \text {(2S)}} $ mesons as a function of $ {N_{\text {part}}} $, at forward (starting at $ {p_{\mathrm {T}}} = $ 3.0 GeV/$c$) rapidity. The vertical arrows represent 95% confidence intervals in the bins where the double ratio measurement is consistent with 0 (see text). The most central bin corresponds to 0-10% (0-20%), and the most peripheral one to 50-100% (40-100%), for $ | y | < $ 1.6 (1.6 $ < | y | < $ 2.4). The bars (boxes) represent statistical (systematic) point-by-point uncertainties. The boxes plotted at $ {R_{\text {AA}}} = $ 1 indicate the size of the global relative uncertainties. |
png pdf |
Figure 7-d:
Nuclear modification factor of prompt $ \mathrm {J}/\psi $ and $ {\psi \text {(2S)}} $ mesons as a function of dimuon $ {p_{\mathrm {T}}} $, at forward (starting at $ {p_{\mathrm {T}}} = $ 3.0 GeV/$c$) rapidity. The vertical arrows represent 95% confidence intervals in the bins where the double ratio measurement is consistent with 0 (see text). The bars (boxes) represent statistical (systematic) point-by-point uncertainties. The boxes plotted at $ {R_{\text {AA}}} = $ 1 indicate the size of the global relative uncertainties. |

png pdf |
Figure 8:
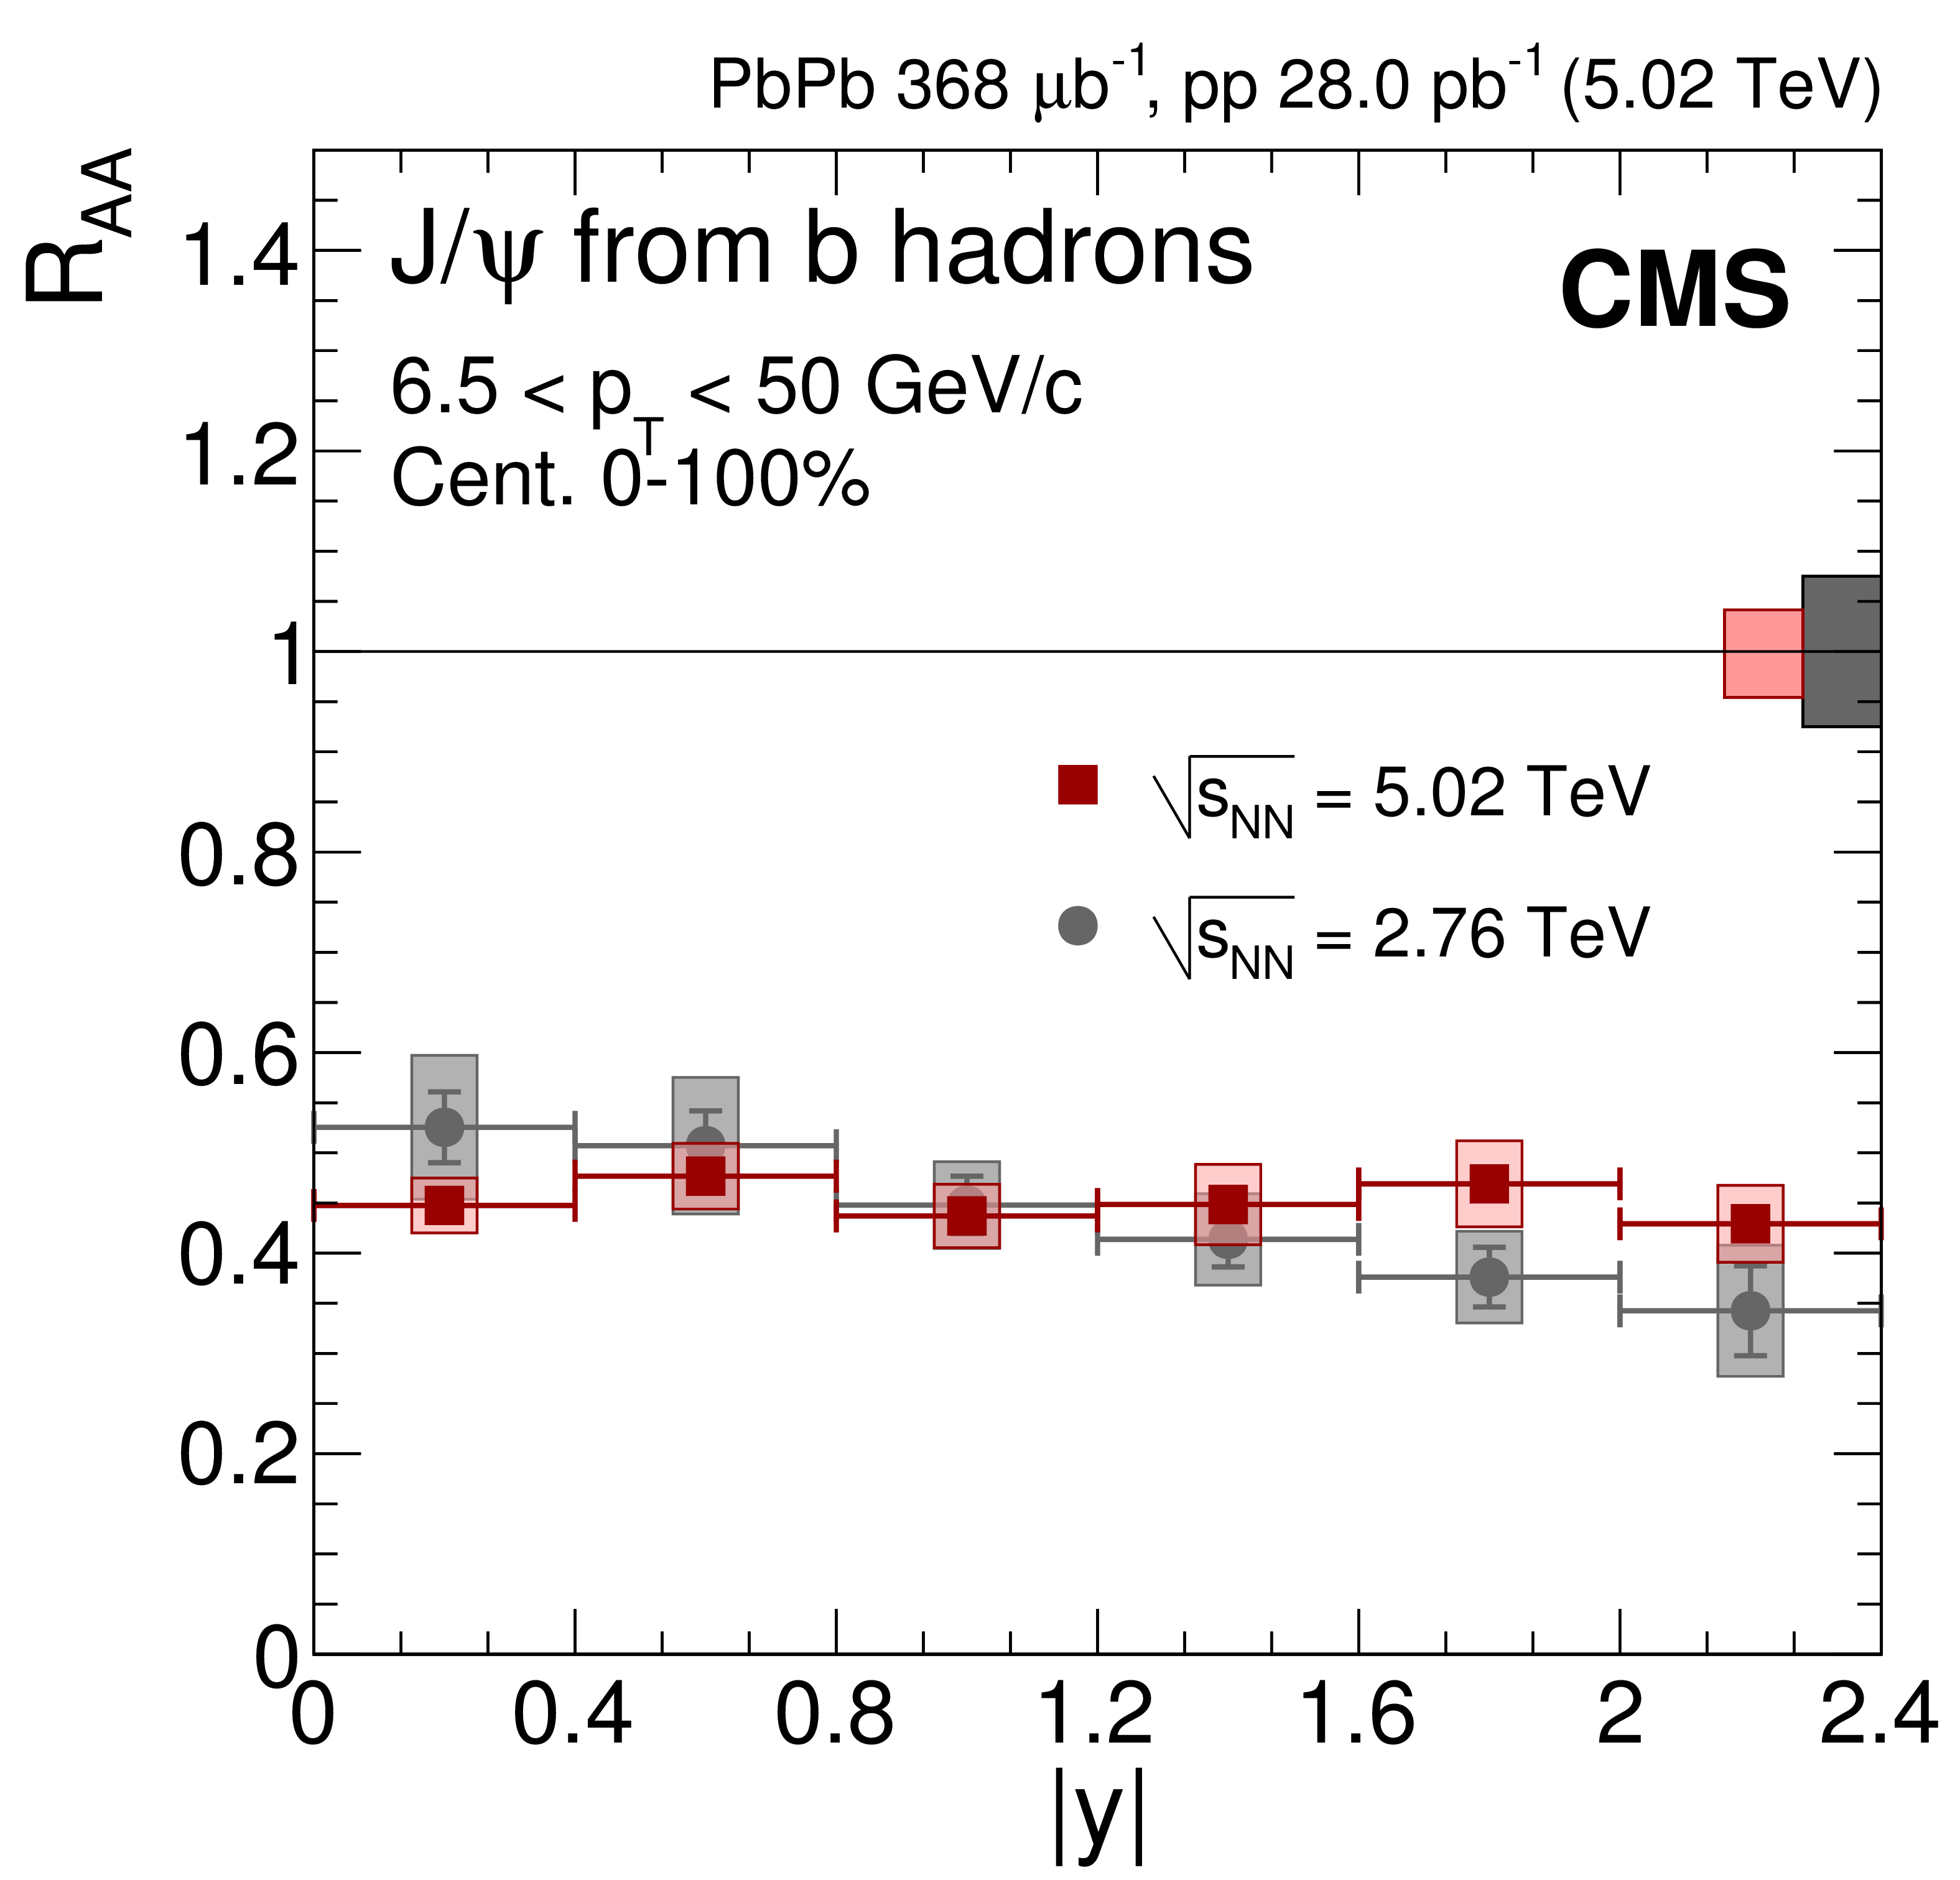
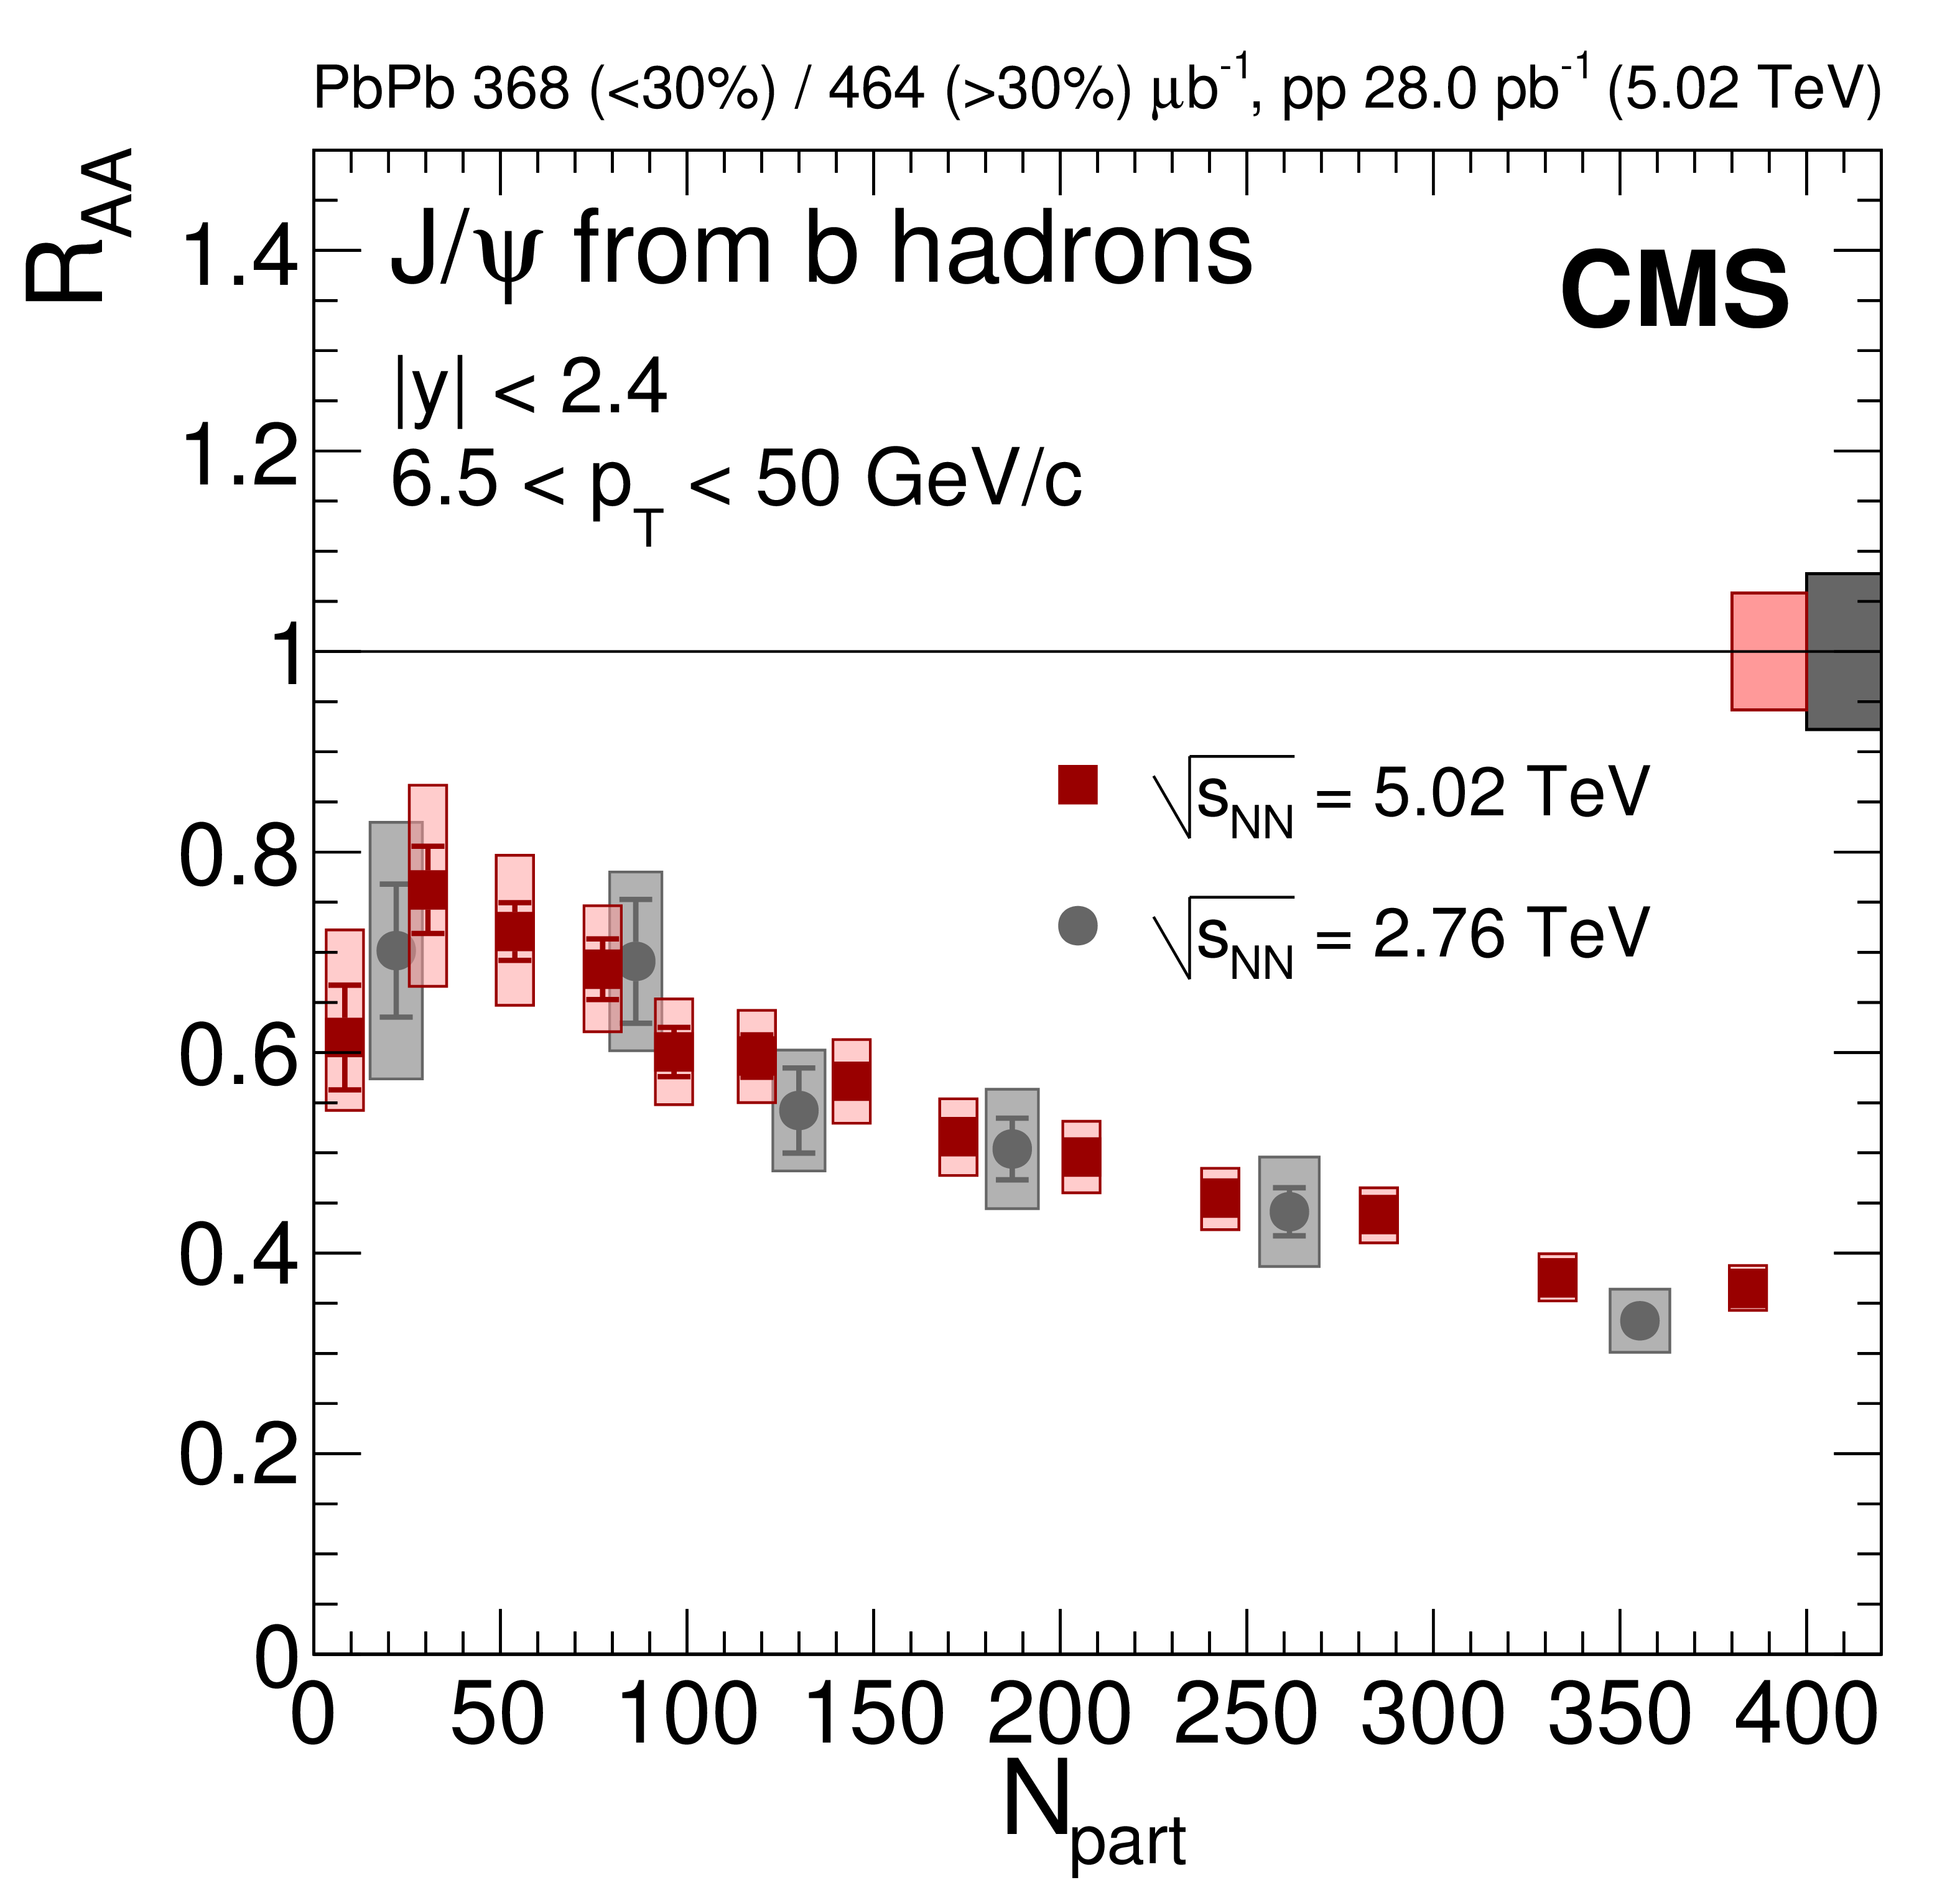
Nuclear modification factor of $ \mathrm {J}/\psi $ mesons from b hadrons (nonprompt $ \mathrm {J}/\psi $) as a function of dimuon rapidity (upper left), $ {N_{\text {part}}} $ (upper right) and dimuon $ {p_{\mathrm {T}}} $ (lower) at $ {\sqrt {\smash [b]{s_{_{\text {NN}}}}}} = $ 5.02 TeV. For the results as a function of $ {N_{\text {part}}} $ the most central bin corresponds to 0-5%, and the most peripheral one to 70-100%. Results obtained at 2.76 TeV are overlaid for comparison [11]. The bars (boxes) represent statistical (systematic) point-by-point uncertainties. The boxes plotted at $ {R_{\text {AA}}} =$ 1 indicate the size of the global relative uncertainties. |
png pdf |
Figure 8-a:
Nuclear modification factor of $ \mathrm {J}/\psi $ mesons from b hadrons (nonprompt $ \mathrm {J}/\psi $) as a function of dimuon rapidity at $ {\sqrt {\smash [b]{s_{_{\text {NN}}}}}} = $ 5.02 TeV. Results obtained at 2.76 TeV are overlaid for comparison [11]. The bars (boxes) represent statistical (systematic) point-by-point uncertainties. The boxes plotted at $ {R_{\text {AA}}} =$ 1 indicate the size of the global relative uncertainties. |
png pdf |
Figure 8-b:
Nuclear modification factor of $ \mathrm {J}/\psi $ mesons from b hadrons (nonprompt $ \mathrm {J}/\psi $) as a function of $ {N_{\text {part}}} $ at $ {\sqrt {\smash [b]{s_{_{\text {NN}}}}}} = $ 5.02 TeV. The most central bin corresponds to 0-5%, and the most peripheral one to 70-100%. Results obtained at 2.76 TeV are overlaid for comparison [11]. The bars (boxes) represent statistical (systematic) point-by-point uncertainties. The boxes plotted at $ {R_{\text {AA}}} =$ 1 indicate the size of the global relative uncertainties. |
png pdf |
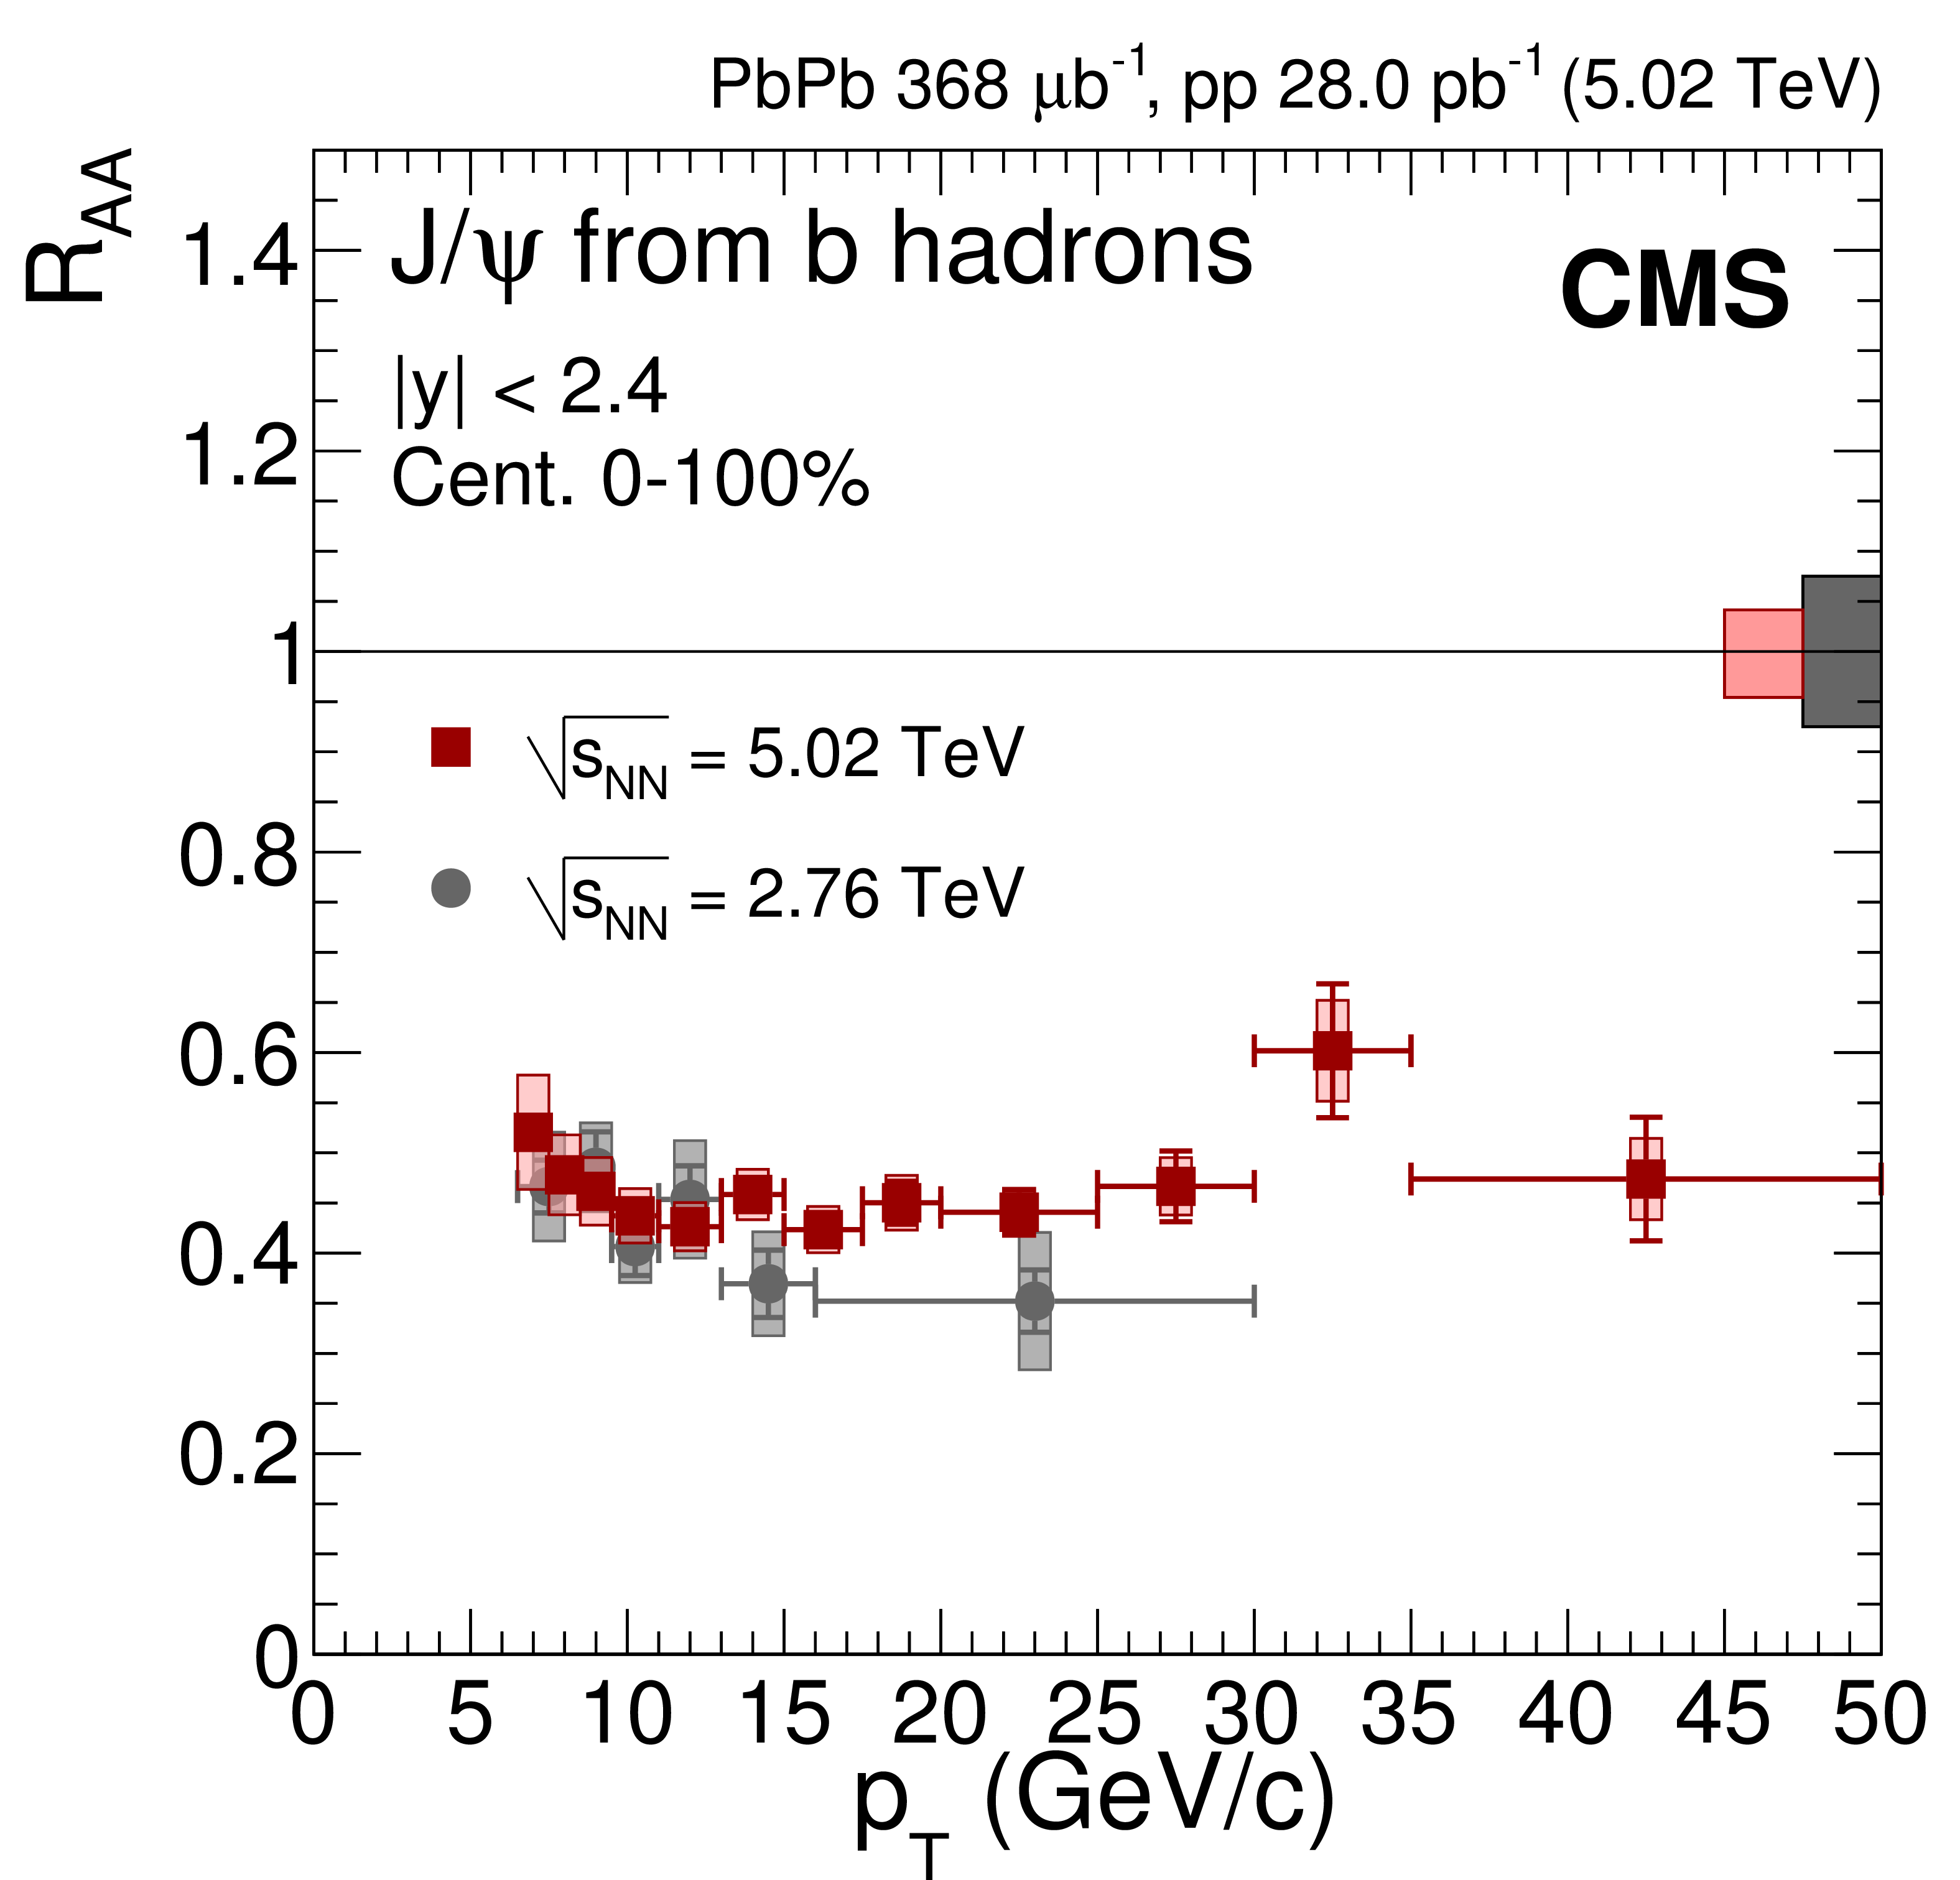
Figure 8-c:
Nuclear modification factor of $ \mathrm {J}/\psi $ mesons from b hadrons (nonprompt $ \mathrm {J}/\psi $) as a function of dimuon $ {p_{\mathrm {T}}} $ at $ {\sqrt {\smash [b]{s_{_{\text {NN}}}}}} = $ 5.02 TeV. Results obtained at 2.76 TeV are overlaid for comparison [11]. The bars (boxes) represent statistical (systematic) point-by-point uncertainties. The boxes plotted at $ {R_{\text {AA}}} =$ 1 indicate the size of the global relative uncertainties. |
png pdf |
Figure 9:
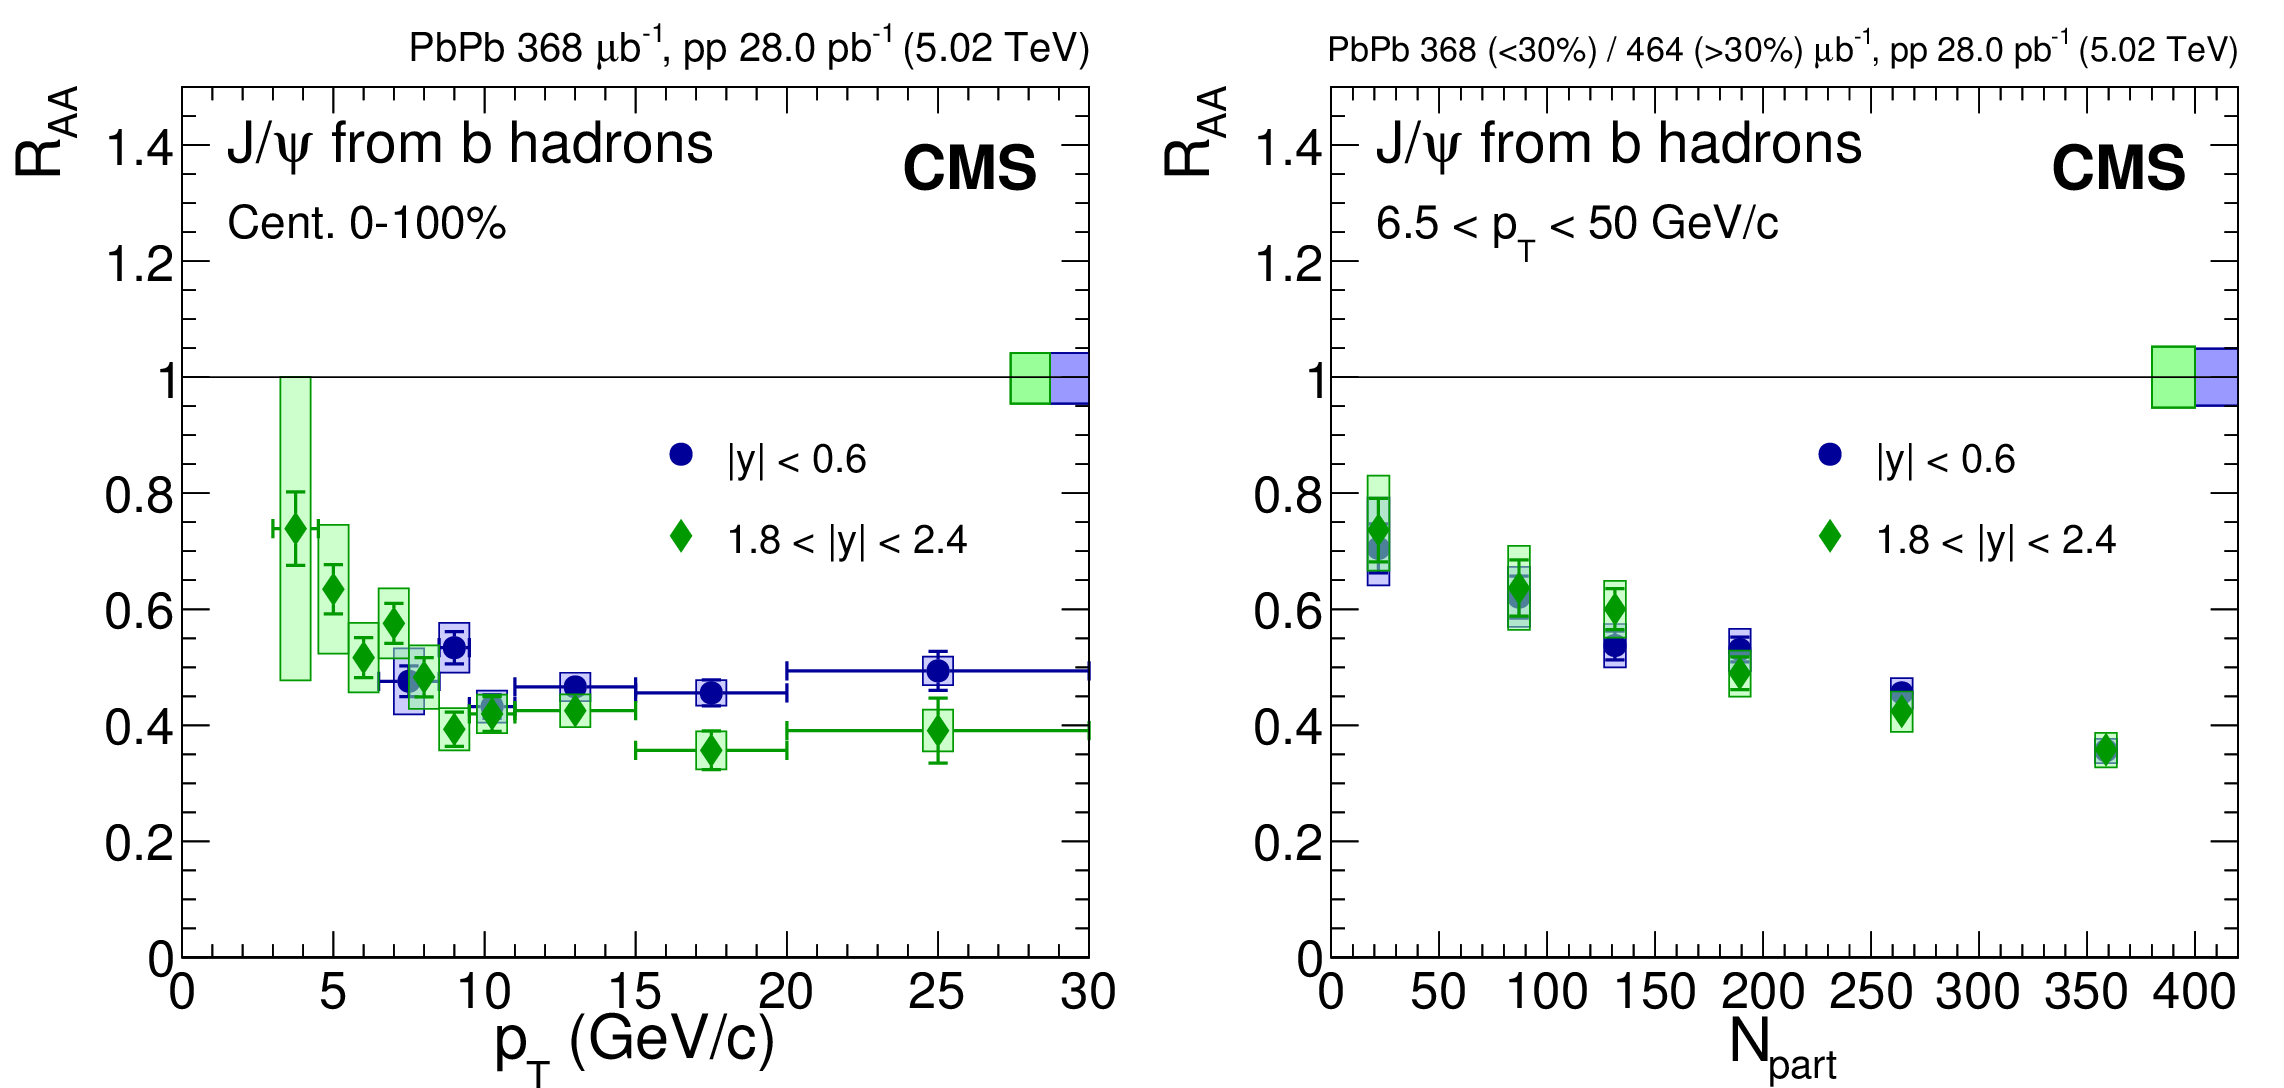
Nuclear modification factor of $ \mathrm {J}/\psi $ mesons from b hadrons (nonprompt $ \mathrm {J}/\psi $) as a function of dimuon $ {p_{\mathrm {T}}} $ (left) and $ {N_{\text {part}}} $ (right) and in the mid- and most forward rapidity intervals. For the results as a function of $ {N_{\text {part}}} $ the most central bin corresponds to 0-10%, and the most peripheral one to 50-100%. The bars (boxes) represent statistical (systematic) point-by-point uncertainties. The boxes plotted at $ {R_{\text {AA}}} =$ 1 indicate the size of the global relative uncertainties. |
png pdf |
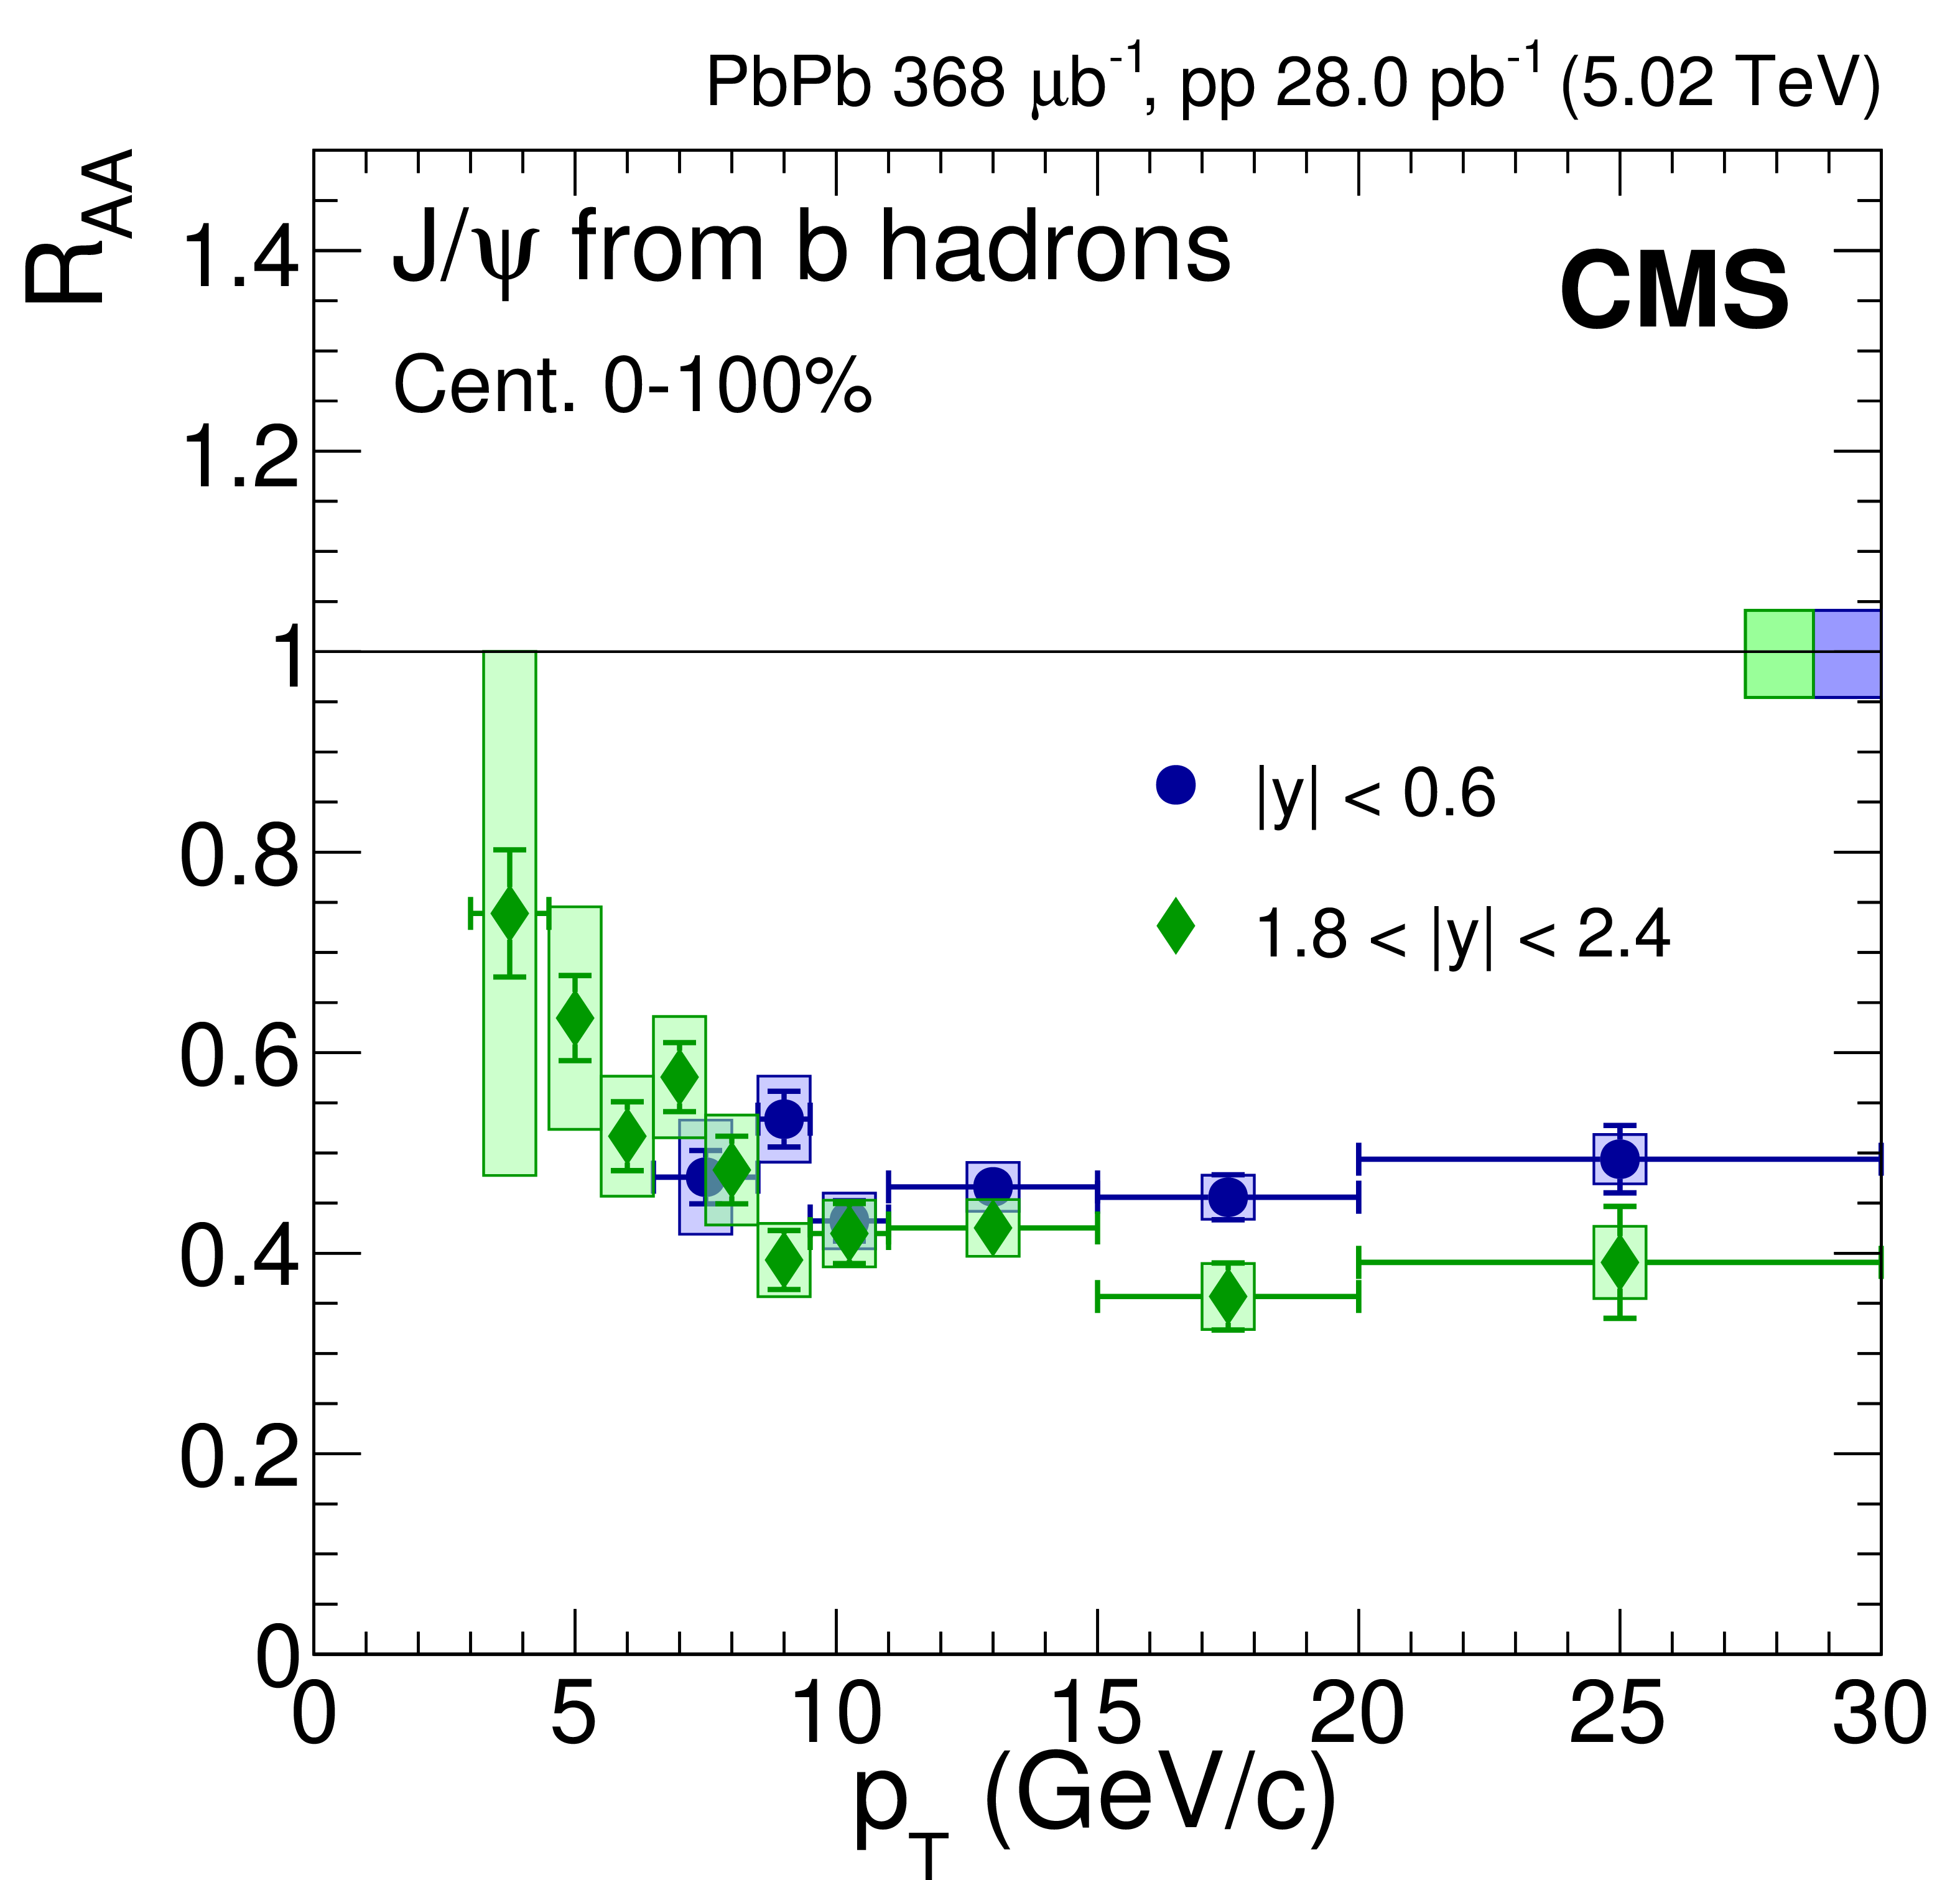
Figure 9-a:
Nuclear modification factor of $ \mathrm {J}/\psi $ mesons from b hadrons (nonprompt $ \mathrm {J}/\psi $) as a function of dimuon $ {p_{\mathrm {T}}} $ and in the mid- and most forward rapidity intervals. The bars (boxes) represent statistical (systematic) point-by-point uncertainties. The boxes plotted at $ {R_{\text {AA}}} =$ 1 indicate the size of the global relative uncertainties. |
png pdf |
Figure 9-b:
Nuclear modification factor of $ \mathrm {J}/\psi $ mesons from b hadrons (nonprompt $ \mathrm {J}/\psi $) as a function of $ {N_{\text {part}}} $ and in the mid- and most forward rapidity intervals. The most central bin corresponds to 0-10%, and the most peripheral one to 50-100%. The bars (boxes) represent statistical (systematic) point-by-point uncertainties. The boxes plotted at $ {R_{\text {AA}}} =$ 1 indicate the size of the global relative uncertainties. |
png pdf |
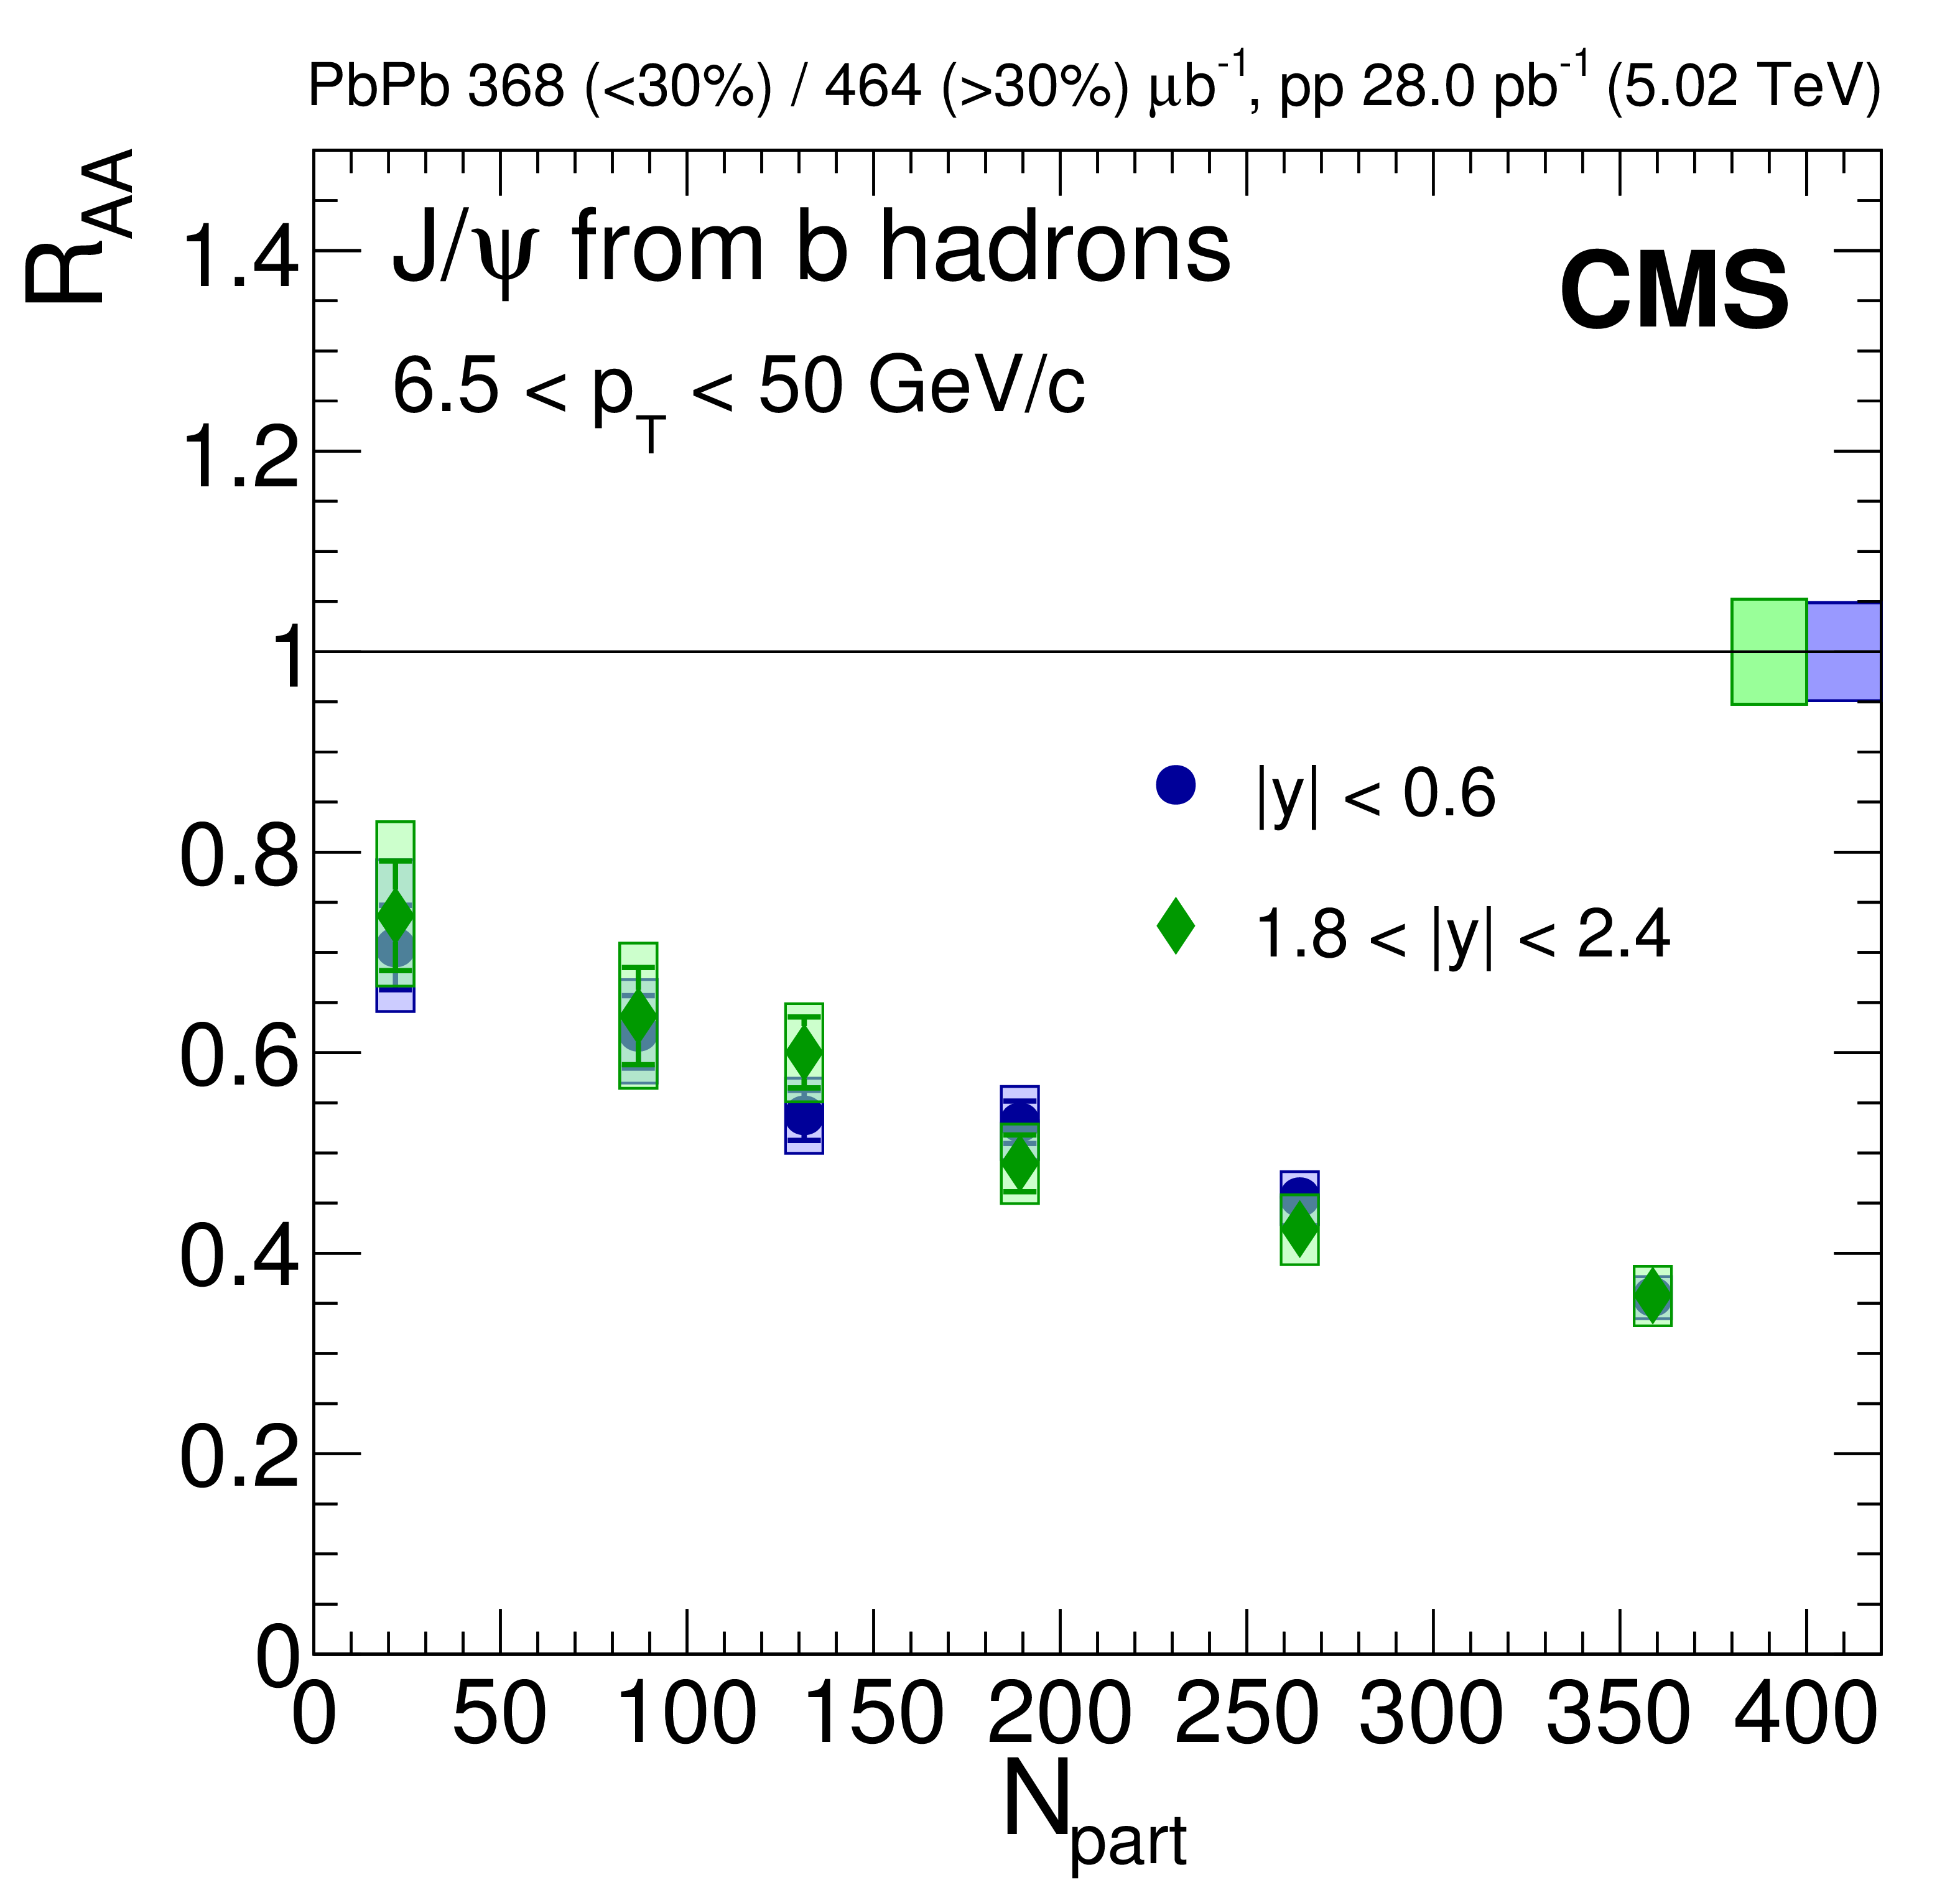
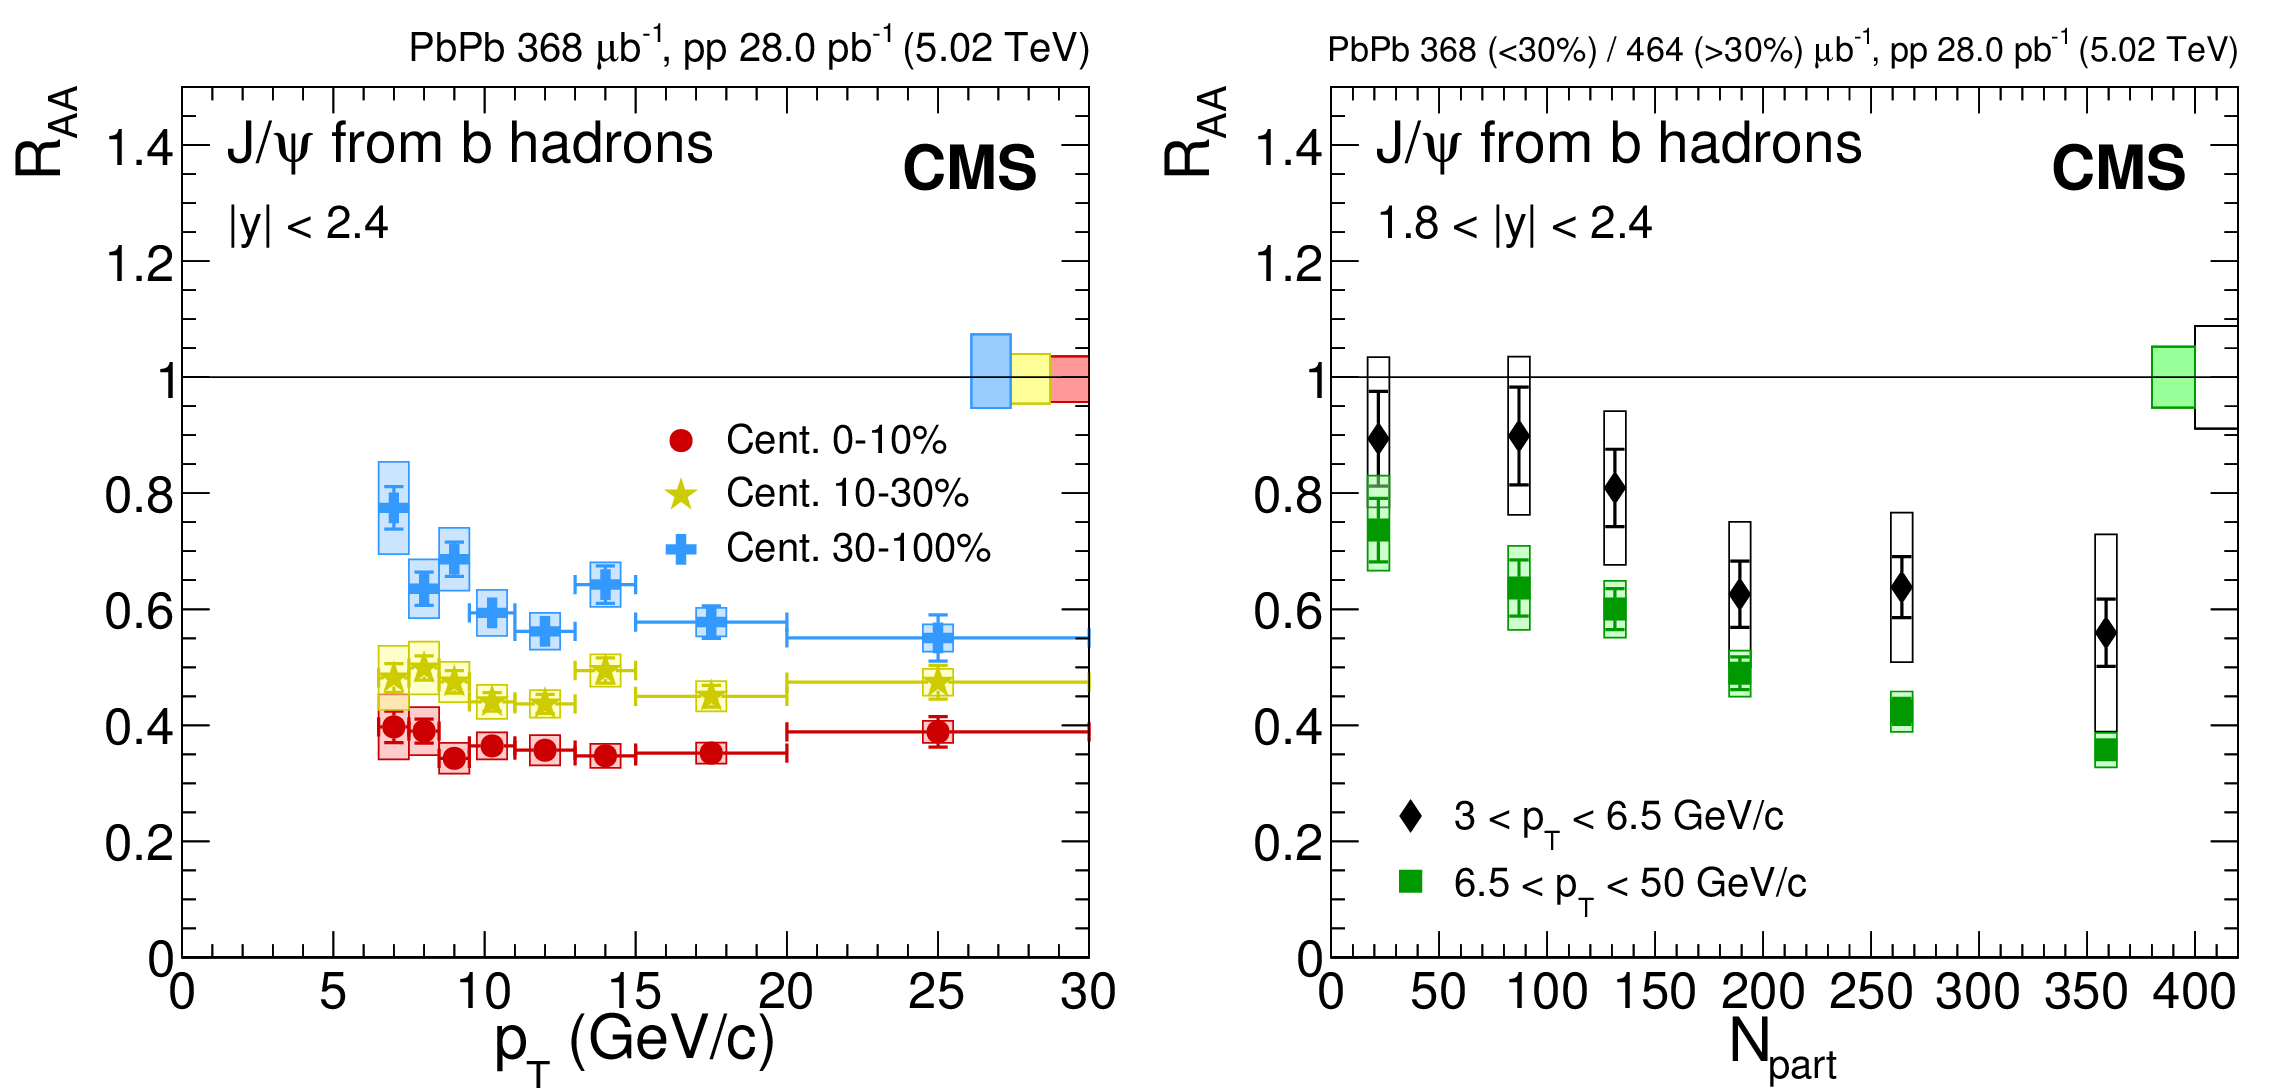
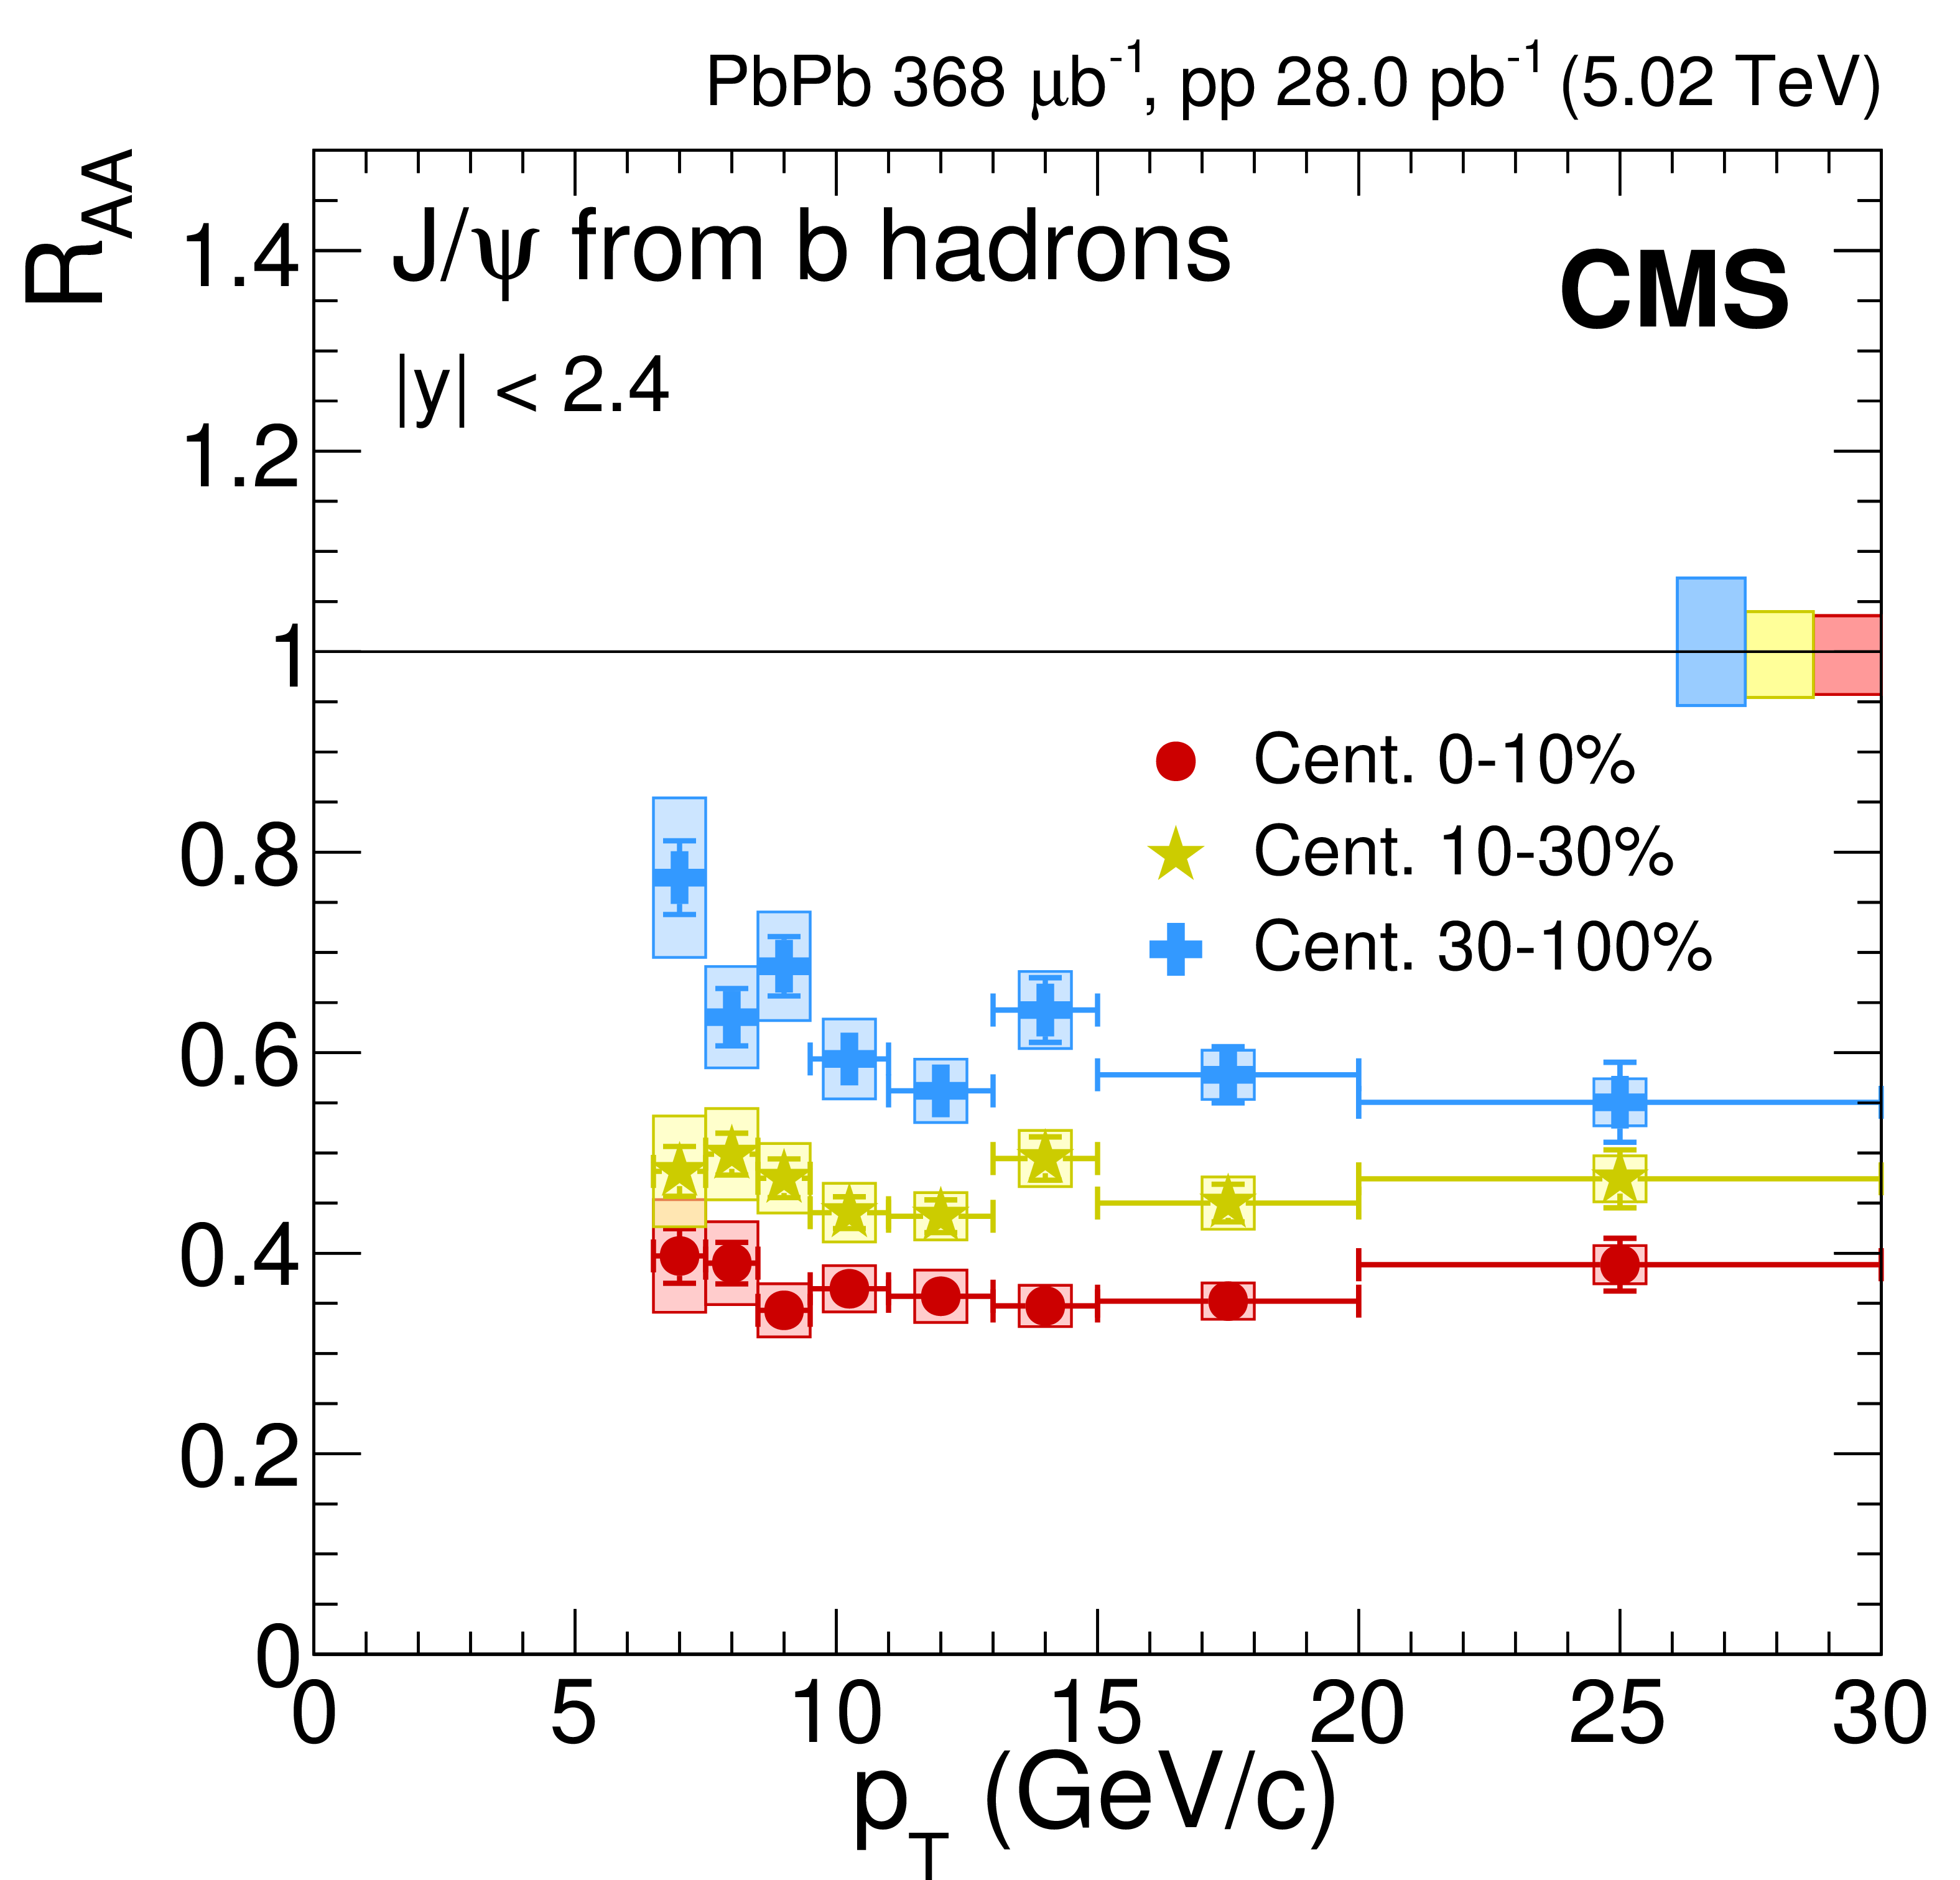
Figure 10:
Nuclear modification factor of $ \mathrm {J}/\psi $ mesons from b hadrons (nonprompt $ \mathrm {J}/\psi $). Left : as a function of dimuon $ {p_{\mathrm {T}}} $ in three centrality bins. Right : as a function of $ {N_{\text {part}}} $ at moderate and high $ {p_{\mathrm {T}}} $, in the forward 1.8 $ < | y | < $ 2.4 range. For the results as a function of $ {N_{\text {part}}} $ the most central bin corresponds to 0-10%, and the most peripheral one to 50-100%. The bars (boxes) represent statistical (systematic) point-by-point uncertainties. The boxes plotted at $ {R_{\text {AA}}} =$ 1 indicate the size of the global relative uncertainties. |
png pdf |
Figure 10-a:
Nuclear modification factor of $ \mathrm {J}/\psi $ mesons from b hadrons (nonprompt $ \mathrm {J}/\psi $) as a function of dimuon $ {p_{\mathrm {T}}} $ in three centrality bins. The bars (boxes) represent statistical (systematic) point-by-point uncertainties. The boxes plotted at $ {R_{\text {AA}}} =$ 1 indicate the size of the global relative uncertainties. |

png pdf |
Figure 10-b:
Nuclear modification factor of $ \mathrm {J}/\psi $ mesons from b hadrons (nonprompt $ \mathrm {J}/\psi $) as a function of $ {N_{\text {part}}} $ at moderate and high $ {p_{\mathrm {T}}} $, in the forward 1.8 $ < | y | < $ 2.4 range. The most central bin corresponds to 0-10%, and the most peripheral one to 50-100%. The bars (boxes) represent statistical (systematic) point-by-point uncertainties. The boxes plotted at $ {R_{\text {AA}}} =$ 1 indicate the size of the global relative uncertainties. |
| Summary |
|
Prompt and nonprompt $ \mathrm{J}/\psi $ meson production has been studied in pp and PbPb collisions at ${\sqrt{\smash[b]{s_{_{\text{NN}}}}}} = $ 5.02 TeV, as a function of rapidity, transverse momentum ($ {p_{\mathrm{T}}} $), and collision centrality, in different kinematic and centrality ranges. Three observables were measured: nonprompt $ \mathrm{J}/\psi $ fractions, prompt and nonprompt $ \mathrm{J}/\psi $ cross sections for each collision system, and nuclear modification factors $ {R_{\text{AA}}} $. The $ {R_{\text{AA}}} $ results show a strong centrality dependence, with an increasing suppression for increasing centrality. For both prompt and nonprompt $ \mathrm{J}/\psi $ mesons no significant dependence on rapidity is observed. An indication of less suppression in the lowest $ {p_{\mathrm{T}}} $ range at forward rapidity is seen for both $ \mathrm{J}/\psi $ components. Double-differential measurements show the same trend, and also suggest a stronger $ {p_{\mathrm{T}}} $ dependence in peripheral events. An indication of less suppression of the prompt $ \mathrm{J}/\psi $ meson at high $ {p_{\mathrm{T}}} $ is seen with respect to that observed at intermediate $ {p_{\mathrm{T}}} $. The measurements are consistent with previous results at ${\sqrt{\smash[b]{s_{_{\text{NN}}}}}} = $ 2.76 TeV. Combined with previous results for the double ratio $(N_{{\psi\text{(2S)}} }/N_{\mathrm{J}/\psi})_{\mathrm{PbPb}}/ (N_{{\psi\text{(2S)}} }/N_{\mathrm{J}/\psi})_{pp}$, the current $ {R_{\text{AA}}} $ values for $ \mathrm{J}/\psi $ mesons are used to derive the prompt $ {\psi\text{(2S)}} $ meson $ {R_{\text{AA}}} $ in PbPb collisions at ${\sqrt{\smash[b]{s_{_{\text{NN}}}}}} = $ 5.02 TeV, as a function of $ {p_{\mathrm{T}}} $ and collision centrality, in two different rapidity ranges. The results show that the $ {\psi\text{(2S)}} $ is more suppressed than the $ \mathrm{J}/\psi $ meson for all the kinematical ranges studied. No $ {p_{\mathrm{T}}} $ dependence is observed within the current uncertainties. Hints of an increase in suppression with increasing collision centrality are also observed. |
| References | ||||
| 1 | T. Matsui and H. Satz | $ \mathrm{J}/\psi $ suppression by quark-gluon plasma formation | PLB 178 (1986) 416 | |
| 2 | NA50 Collaboration | A new measurement of $ \mathrm{J}/\psi $ suppression in PbPb collisions at 158 GeV per nucleon | EPJC 39 (2005) 335 | hep-ex/0412036 |
| 3 | PHENIX Collaboration | $ \mathrm{J}/\psi $ production versus centrality, transverse momentum, and rapidity in AuAu collisions at $ \sqrt{\smash[b]{s_{_{\text{NN}}}}} = $ 200 GeV | PRL 98 (2007) 232301 | nucl-ex/0611020 |
| 4 | CMS Collaboration | Observation of sequential $ \Upsilon\ $ suppression in PbPb collisions | PRL 109 (2012) 222301 | CMS-HIN-11-011 1208.2826 |
| 5 | ALICE Collaboration | Suppression of $ \Upsilon (1S) $ at forward rapidity in Pb-Pb collisions at $ \sqrt{\smash[b]{s_{_{\text{NN}}}}} = $ 2.76 TeV | PLB 738 (2014) 361 | 1405.4493 |
| 6 | P. Braun-Munzinger and J. Stachel | (non)thermal aspects of charmonium production and a new look at J$ /\psi $ suppression | PLB 490 (2000) 196 | nucl-th/0007059 |
| 7 | R. L. Thews, M. Schroedter, and J. Rafelski | Enhanced $ \mathrm{J}/\psi $ production in deconfined quark matter | PRC 63 (2001) 054905 | hep-ph/0007323 |
| 8 | ALICE Collaboration | $ \mathrm{J}/\psi $ suppression at forward rapidity in PbPb collisions at $ \sqrt{\smash[b]{s_{_{\text{NN}}}}} = $ 2.76 TeV | PRL 109 (2012) 072301 | 1202.1383 |
| 9 | ALICE Collaboration | $ \mathrm{J}/\psi $ suppression at forward rapidity in PbPb collisions at $ \sqrt{\smash[b]{s_{_{\text{NN}}}}} = $ 5.02 TeV | PLB 766 (2017) 212 | 1606.08197 |
| 10 | PHENIX Collaboration | $ \mathrm{J}/\psi $ suppression at forward rapidity in AuAu collisions at $ \sqrt{\smash[b]{s_{_{\text{NN}}}}} = $ 200 GeV | PRC 84 (2011) 054912 | 1103.6269 |
| 11 | CMS Collaboration | Suppression and azimuthal anisotropy of prompt and nonprompt $ {\mathrm{J}}/\psi $ production in PbPb collisions at $ \sqrt{{s_{_{\text {NN}}}}} = $ 2.76 TeV | EPJC 77 (2017) 252 | CMS-HIN-14-005 1610.00613 |
| 12 | M. Strickland | Thermal $ \Upsilon_{1S} $ and $ \chi_{\mathrm{b}1} $ suppression in $ \sqrt{\smash[b]{s_{_{\text{NN}}}}} = $ 2.76 TeV Pb-Pb collisions at the LHC | PRL 107 (2011) 132301 | 1106.2571 |
| 13 | X. Du and R. Rapp | Sequential regeneration of charmonia in heavy-ion collisions | NP A 943 (2015) 147 | 1504.00670 |
| 14 | M. Spousta | On similarity of jet quenching and charmonia suppression | PLB 767 (2017) 10 | 1606.00903 |
| 15 | F. Arleo | Quenching of hadron spectra in heavy ion collisions at the LHC | PRL 119 (2017) 062302 | 1703.10852 |
| 16 | LHCb Collaboration | Measurement of $ \mathrm{J}/\psi $ production in pp collisions at $ \sqrt{s} = $ 7 TeV | EPJC 71 (2011) 1645 | 1103.0423 |
| 17 | CMS Collaboration | Prompt and non-prompt $ \mathrm{J}/\psi $ production in pp collisions at $ \sqrt{s} = $ 7 TeV | EPJC 71 (2011) 1575 | CMS-BPH-10-002 1011.4193 |
| 18 | ATLAS Collaboration | Measurement of the differential cross-sections of inclusive, prompt and non-prompt $ \mathrm{J}/\psi $ production in pp collisions at $ \sqrt{s} = $ 7 TeV | NPB 850 (2011) 387 | 1104.3038 |
| 19 | CMS Collaboration | The CMS trigger system | JINST 12 (2017) P01020 | CMS-TRG-12-001 1609.02366 |
| 20 | CMS Collaboration | The CMS experiment at the CERN LHC | JINST 3 (2008) S08004 | CMS-00-001 |
| 21 | CMS Collaboration | Description and performance of track and primary-vertex reconstruction with the CMS tracker | JINST 9 (2014) P10009 | |
| 22 | M. Cacciari, G. P. Salam, and G. Soyez | The anti-$ k_t $ jet clustering algorithm | JHEP 04 (2008) 063 | 0802.1189 |
| 23 | M. Cacciari, G. P. Salam, and G. Soyez | FastJet user manual | EPJC 72 (2012) 1896 | |
| 24 | CMS Collaboration | Transverse momentum and pseudorapidity distributions of charged hadrons in pp collisions at $ \sqrt{s} = $ 0.9 and 2.36 TeV | JHEP 02 (2010) 041 | CMS-QCD-09-010 1002.0621 |
| 25 | CMS Collaboration | Dependence on pseudorapidity and centrality of charged hadron production in PbPb collisions at $ \sqrt{\smash[b]{s_{_{\text{NN}}}}} = $ 2.76 TeV | JHEP 08 (2011) 141 | CMS-HIN-10-001 1107.4800 |
| 26 | CMS Collaboration | Charged-particle nuclear modification factors in PbPb and pPb collisions at $ \sqrt{\smash[b]{s_{_{\text{NN}}}}} = $ 5.02 TeV | JHEP 04 (2017) 039 | CMS-HIN-15-015 1611.01664 |
| 27 | M. L. Miller, K. Reygers, S. J. Sanders, and P. Steinberg | Glauber modeling in high-energy nuclear collisions | Ann. Rev. Nucl. Part. Sci. 57 (2007) 205 | nucl-ex/0701025 |
| 28 | T. Sjostrand, S. Mrenna, and P. Skands | A brief introduction to PYTHIA 8.1 | Comp. Phys. Comm. 178 (2008) 852 | 0710.3820 |
| 29 | D. J. Lange | The EvtGen particle decay simulation package | NIMA 462 (2001) 152 | |
| 30 | I. P. Lokhtin and A. M. Snigirev | A model of jet quenching in ultrarelativistic heavy ion collisions and high-$ {p_{\mathrm{T}}} $ hadron spectra at RHIC | EPJC 45 (2006) 211 | hep-ph/0506189 |
| 31 | GEANT Collaboration | GEANT4 --- a simulation toolkit | NIMA 506 (2003) 250 | |
| 32 | ALICE Collaboration | $ \mathrm{J}/\psi $ polarization in pp collisions at $ \sqrt{s} = $ 7 TeV | PRL 108 (2011) 082001 | 1111.1630 |
| 33 | CMS Collaboration | Measurement of the prompt $ \mathrm{J}/\psi $ and $ \psi $(2S) polarizations in pp collisions at $ \sqrt{s} = $ 7 TeV | PLB 727 (2013) 381 | CMS-BPH-13-003 1307.6070 |
| 34 | LHCb Collaboration | Measurement of $ \mathrm{J}/\psi $ polarization in pp collisions at $ \sqrt{s} = $ 7 TeV | EPJC 73 (2013) 2631 | 1307.6379 |
| 35 | CMS Collaboration | Performance of CMS muon reconstruction in pp collision events at $ \sqrt{s} = $ 7 TeV | JINST 7 (2012) P10002 | CMS-MUO-10-004 1206.4071 |
| 36 | ALEPH Collaboration | Measurement of the anti-B$ ^{0} $ and B$ ^{-} $ meson lifetimes | PLB 307 (1993) 194, . [Errata: \DOI10.1016/0370-2693(94)90054-X] | |
| 37 | Particle Data Group, C. Patrignani et al. | Review of particle physics | CPC 40 (2016) 100001 | |
| 38 | M. J. Oreglia | A study of the reactions $\psi' \to \gamma\gamma \psi$ | PhD thesis, Stanford University, 1980 SLAC Report SLAC-R-236, see Appendix D | |
| 39 | M. Pivk and F. R. Le Diberder | sPlot: a statistical tool to unfold data distributions | NIMA 555 (2005) 356 | physics/0402083 |
| 40 | CMS Collaboration | Measurements of inclusive $ W $ and $ Z $ cross sections in pp collisions at $ \sqrt{s}= $ 7 TeV | JHEP 01 (2011) 080 | CMS-EWK-10-002 1012.2466 |
| 41 | CMS Collaboration | Suppression of non-prompt $ \mathrm{J}/\psi, $ prompt $ \mathrm{J}/\psi, $ and $ \Upsilon\text{1S} $ in PbPb collisions at $ \sqrt{\smash[b]{s_{_{\text{NN}}}}} = $ 2.76 TeV | JHEP 05 (2012) 063 | CMS-HIN-10-006 1201.5069 |
| 42 | CMS Collaboration | CMS luminosity calibration for the pp reference run at $ \sqrt{s}= $ 5.02 TeV | CMS-PAS-LUM-16-001 | |
| 43 | D. d'Enterria | Jet quenching | in Springer Materials - The Landolt-B\"ornstein Database, R. Stock, ed., volume 23: Relativistic Heavy Ion Physics, p. 99 Springer-Verlag | 0902.2011 |
| 44 | CMS Collaboration | Relative modification of prompt $ \psi $(2S) and $ \mathrm{J}/\psi $ yields from pp to PbPb collisions at $ \sqrt{\smash[b]{s_{_{\text{NN}}}}} = $ 5.02 TeV | PRL 118 (2017) 162301 | CMS-HIN-16-004 1611.01438 |
| 45 | G. J. Feldman and R. D. Cousins | A unified approach to the classical statistical analysis of small signals | PRD 57 (1998) 3873 | physics/9711021 |
|
|
Compact Muon Solenoid LHC, CERN |
|

|

|

|

|

|