

Compact Muon Solenoid
LHC, CERN
| CMS-HIN-17-001 ; CERN-EP-2017-193 | ||
| Constraints on the chiral magnetic effect using charge-dependent azimuthal correlations in pPb and PbPb collisions at the LHC | ||
| CMS Collaboration | ||
| 4 August 2017 | ||
| Phys. Rev. C 97 (2018) 044912 | ||
| Abstract: Charge-dependent azimuthal correlations of same- and opposite-sign pairs with respect to the second- and third-order event planes have been measured in pPb collisions at $\sqrt{s_{\mathrm{NN}}} = $ 8.16 TeV and PbPb collisions at 5.02 TeV with the CMS experiment at the LHC. The measurement is motivated by the search for the charge separation phenomenon predicted by the chiral magnetic effect (CME) in heavy ion collisions. Three- and two-particle azimuthal correlators are extracted as functions of the pseudorapidity difference, the transverse momentum ($ p_{\mathrm{T}} $) difference, and the $ p_{\mathrm{T}} $ average of same- and opposite-charge pairs in various event multiplicity ranges. The data suggest that the charge-dependent three-particle correlators with respect to the second- and third-order event planes share a common origin, predominantly arising from charge-dependent two-particle azimuthal correlations coupled with an anisotropic flow. The CME is expected to lead to a $v_{2}$-independent three-particle correlation when the magnetic field is fixed. Using an event shape engineering technique, upper limits on the $v_{2}$-independent fraction of the three-particle correlator are estimated to be 6.6% for pPb and 3.8% for PbPb collisions at 95% confidence level. The results of this analysis, both the dominance of two-particle correlations as a source of the three-particle results and the similarities seen between PbPb and pPb, provide stringent constraints on the origin of charge-dependent three-particle azimuthal correlations and challenge their interpretation as arising from a chiral magnetic effect in heavy ion collisions. | ||
| Links: e-print arXiv:1708.01602 [nucl-ex] (PDF) ; CDS record ; inSPIRE record ; HepData record ; CADI line (restricted) ; | ||
| Figures | |
png pdf |
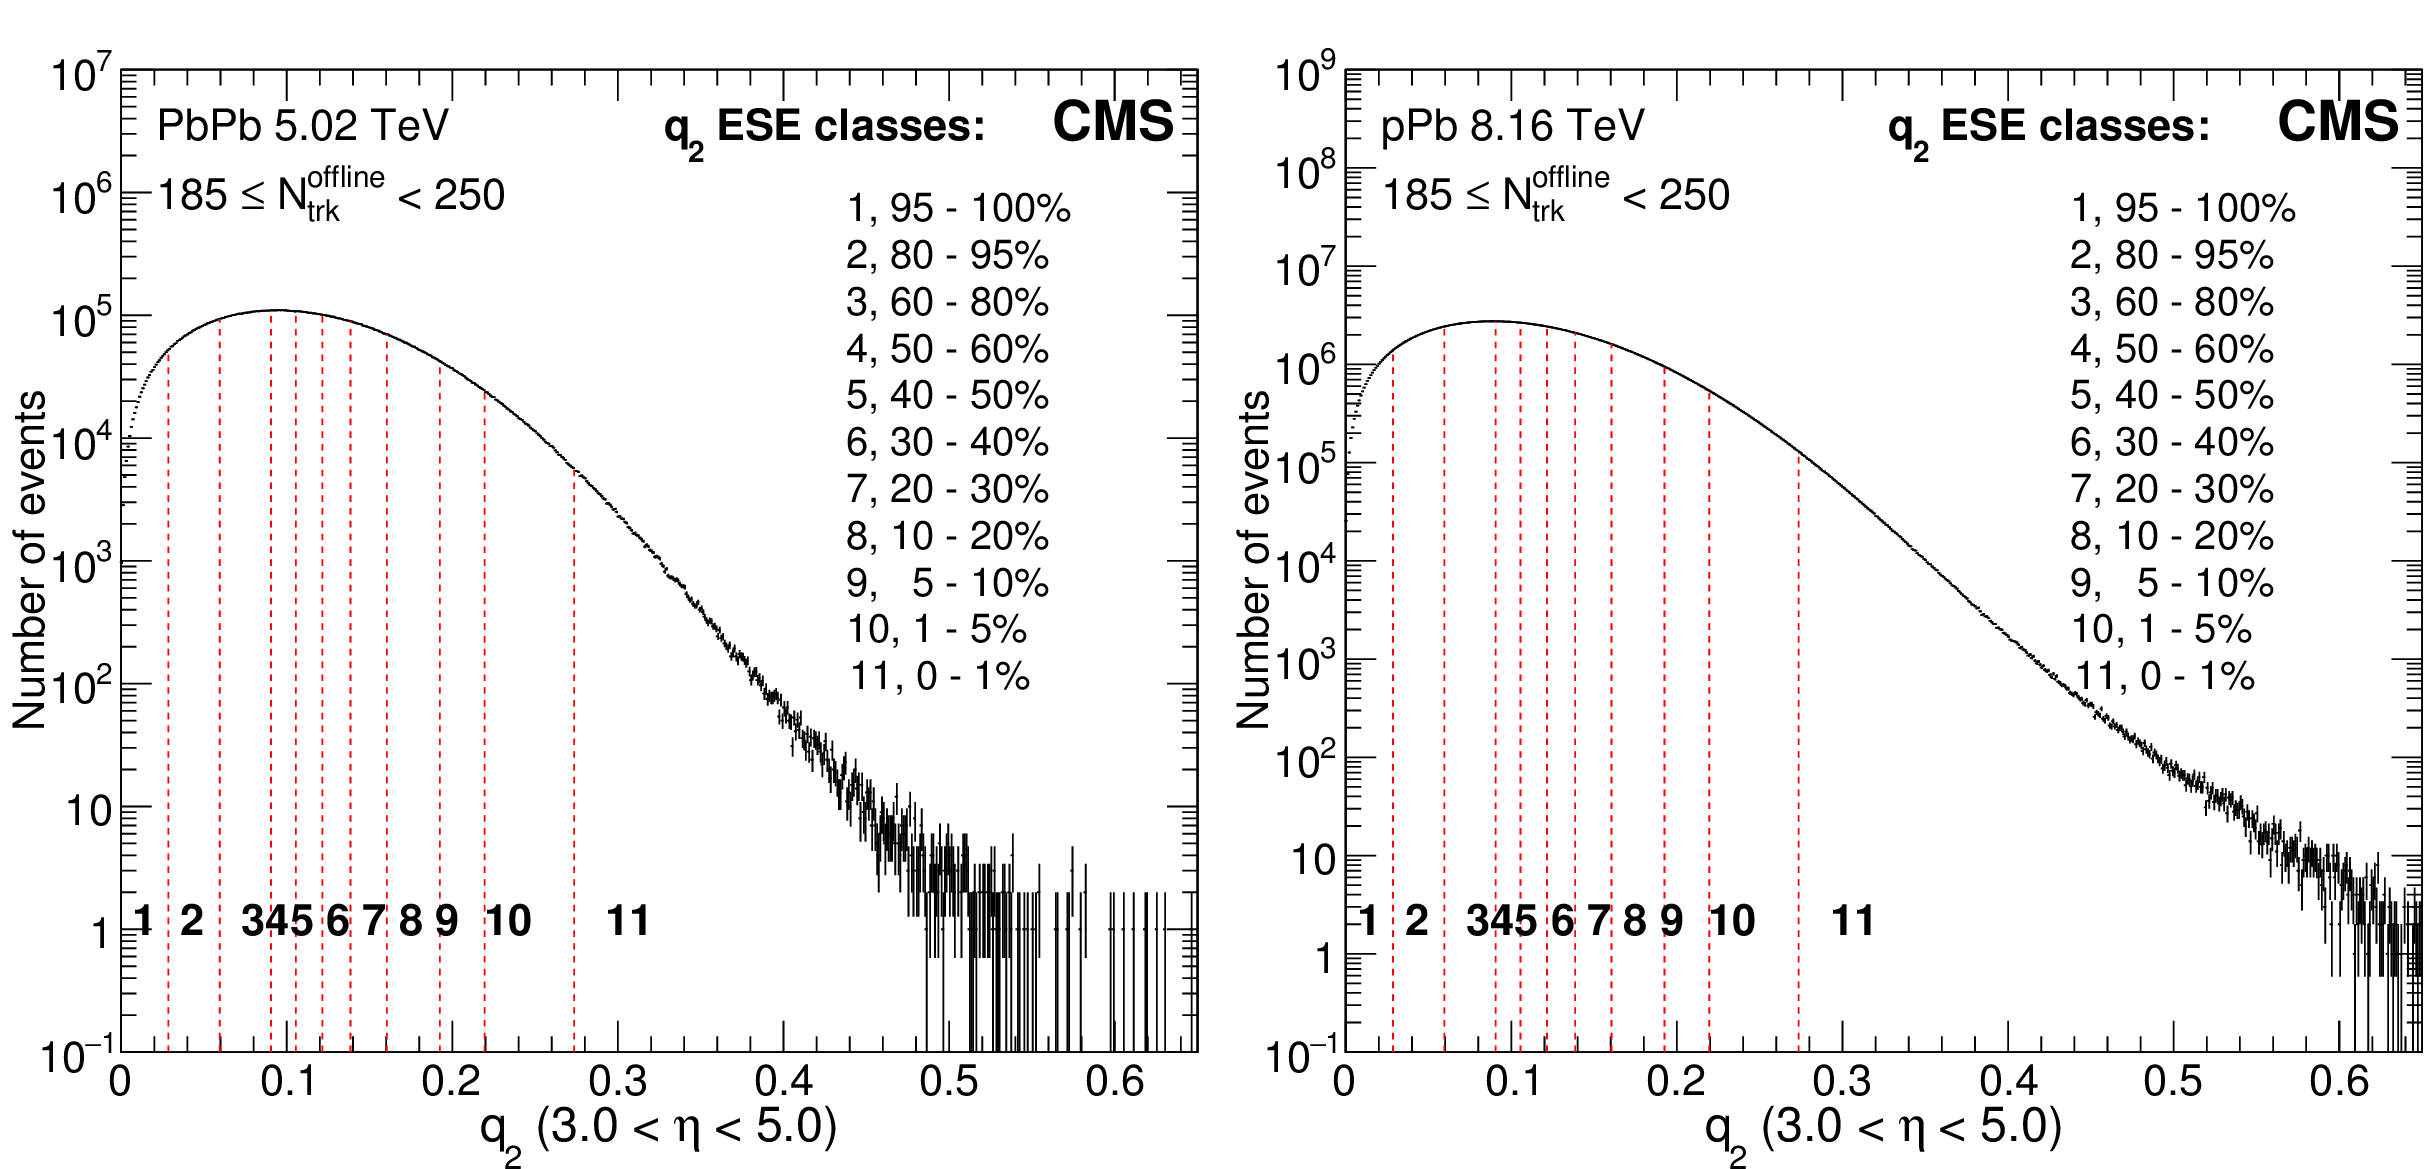
Figure 1:
The $q_{2}$ classes are shown in different fractions with respect to the total number of events in multiplicity range 185 $ \leq {N_\text {trk}^\text {offline}} < $ 250 in PbPb (left) and pPb (right) collisions at $ {\sqrt {{s_{_{\mathrm {NN}}}}}}= $ 5.02 and 8.16 TeV, respectively. |
png pdf |
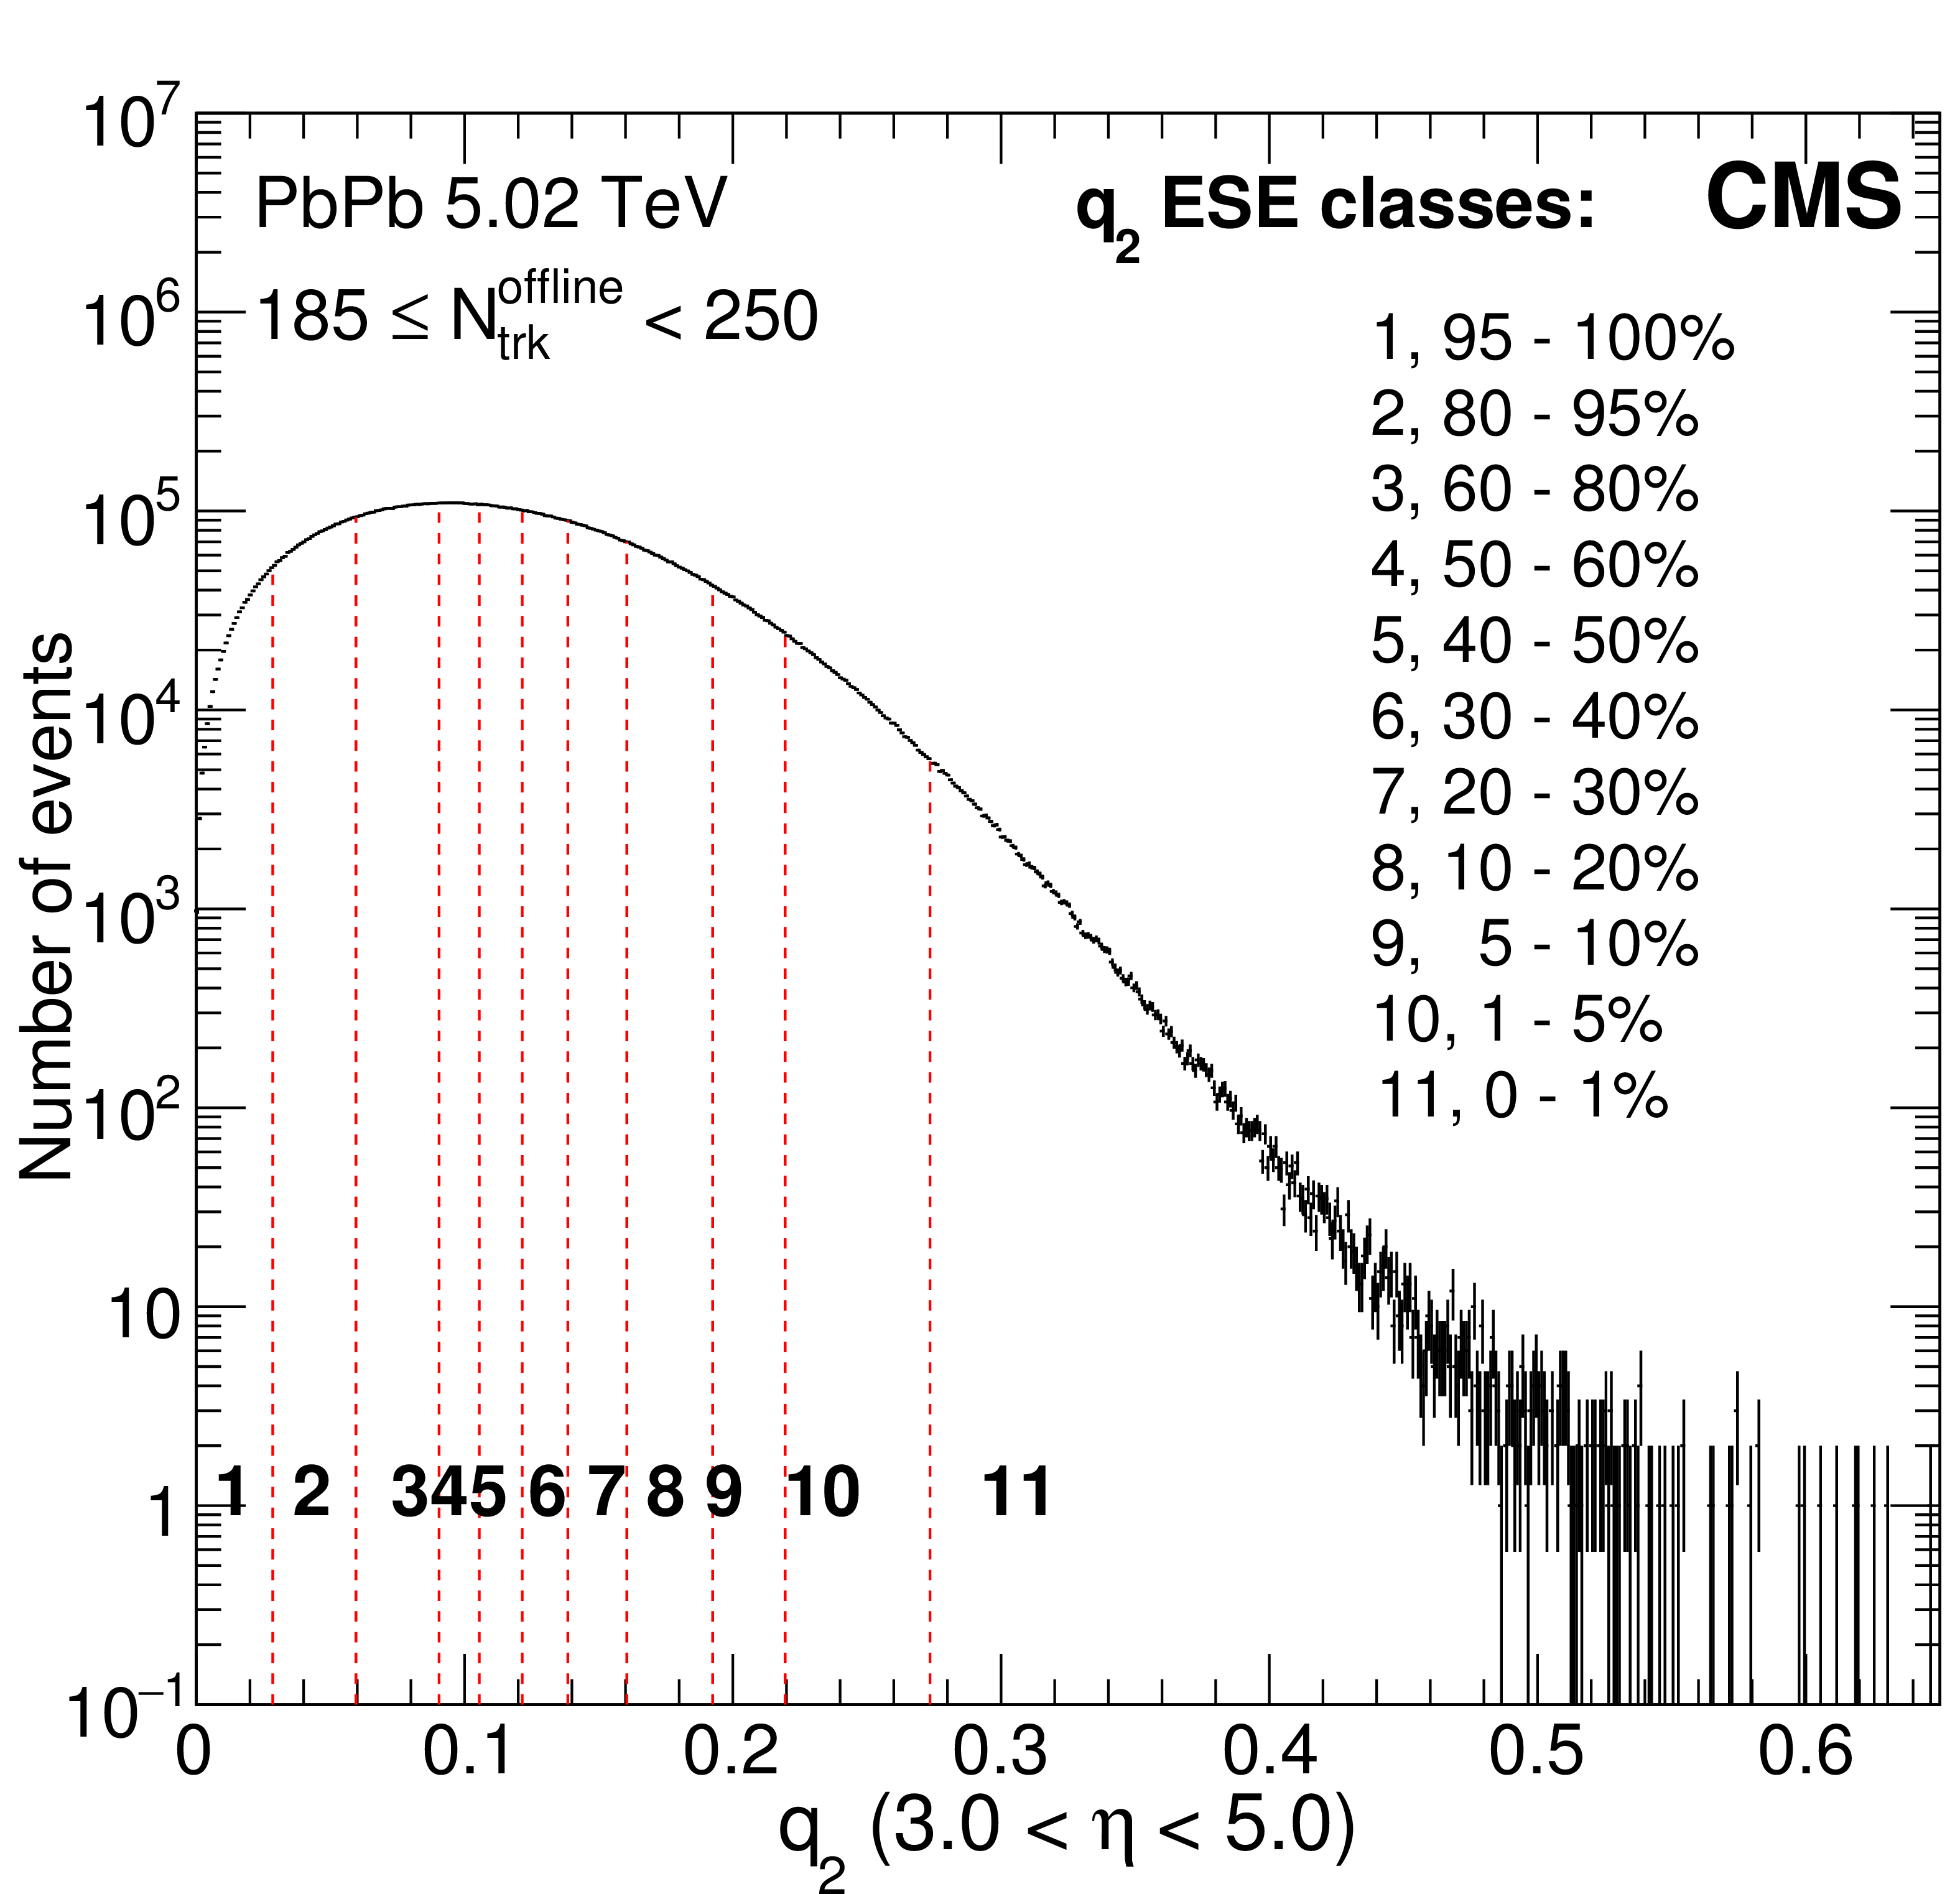
Figure 1-a:
The $q_{2}$ classes are shown in different fractions with respect to the total number of events in multiplicity range 185 $ \leq {N_\text {trk}^\text {offline}} < $ 250 in PbPb collisions at $ {\sqrt {{s_{_{\mathrm {NN}}}}}}= $ 5.02 and 8.16 TeV, respectively. |
png pdf |
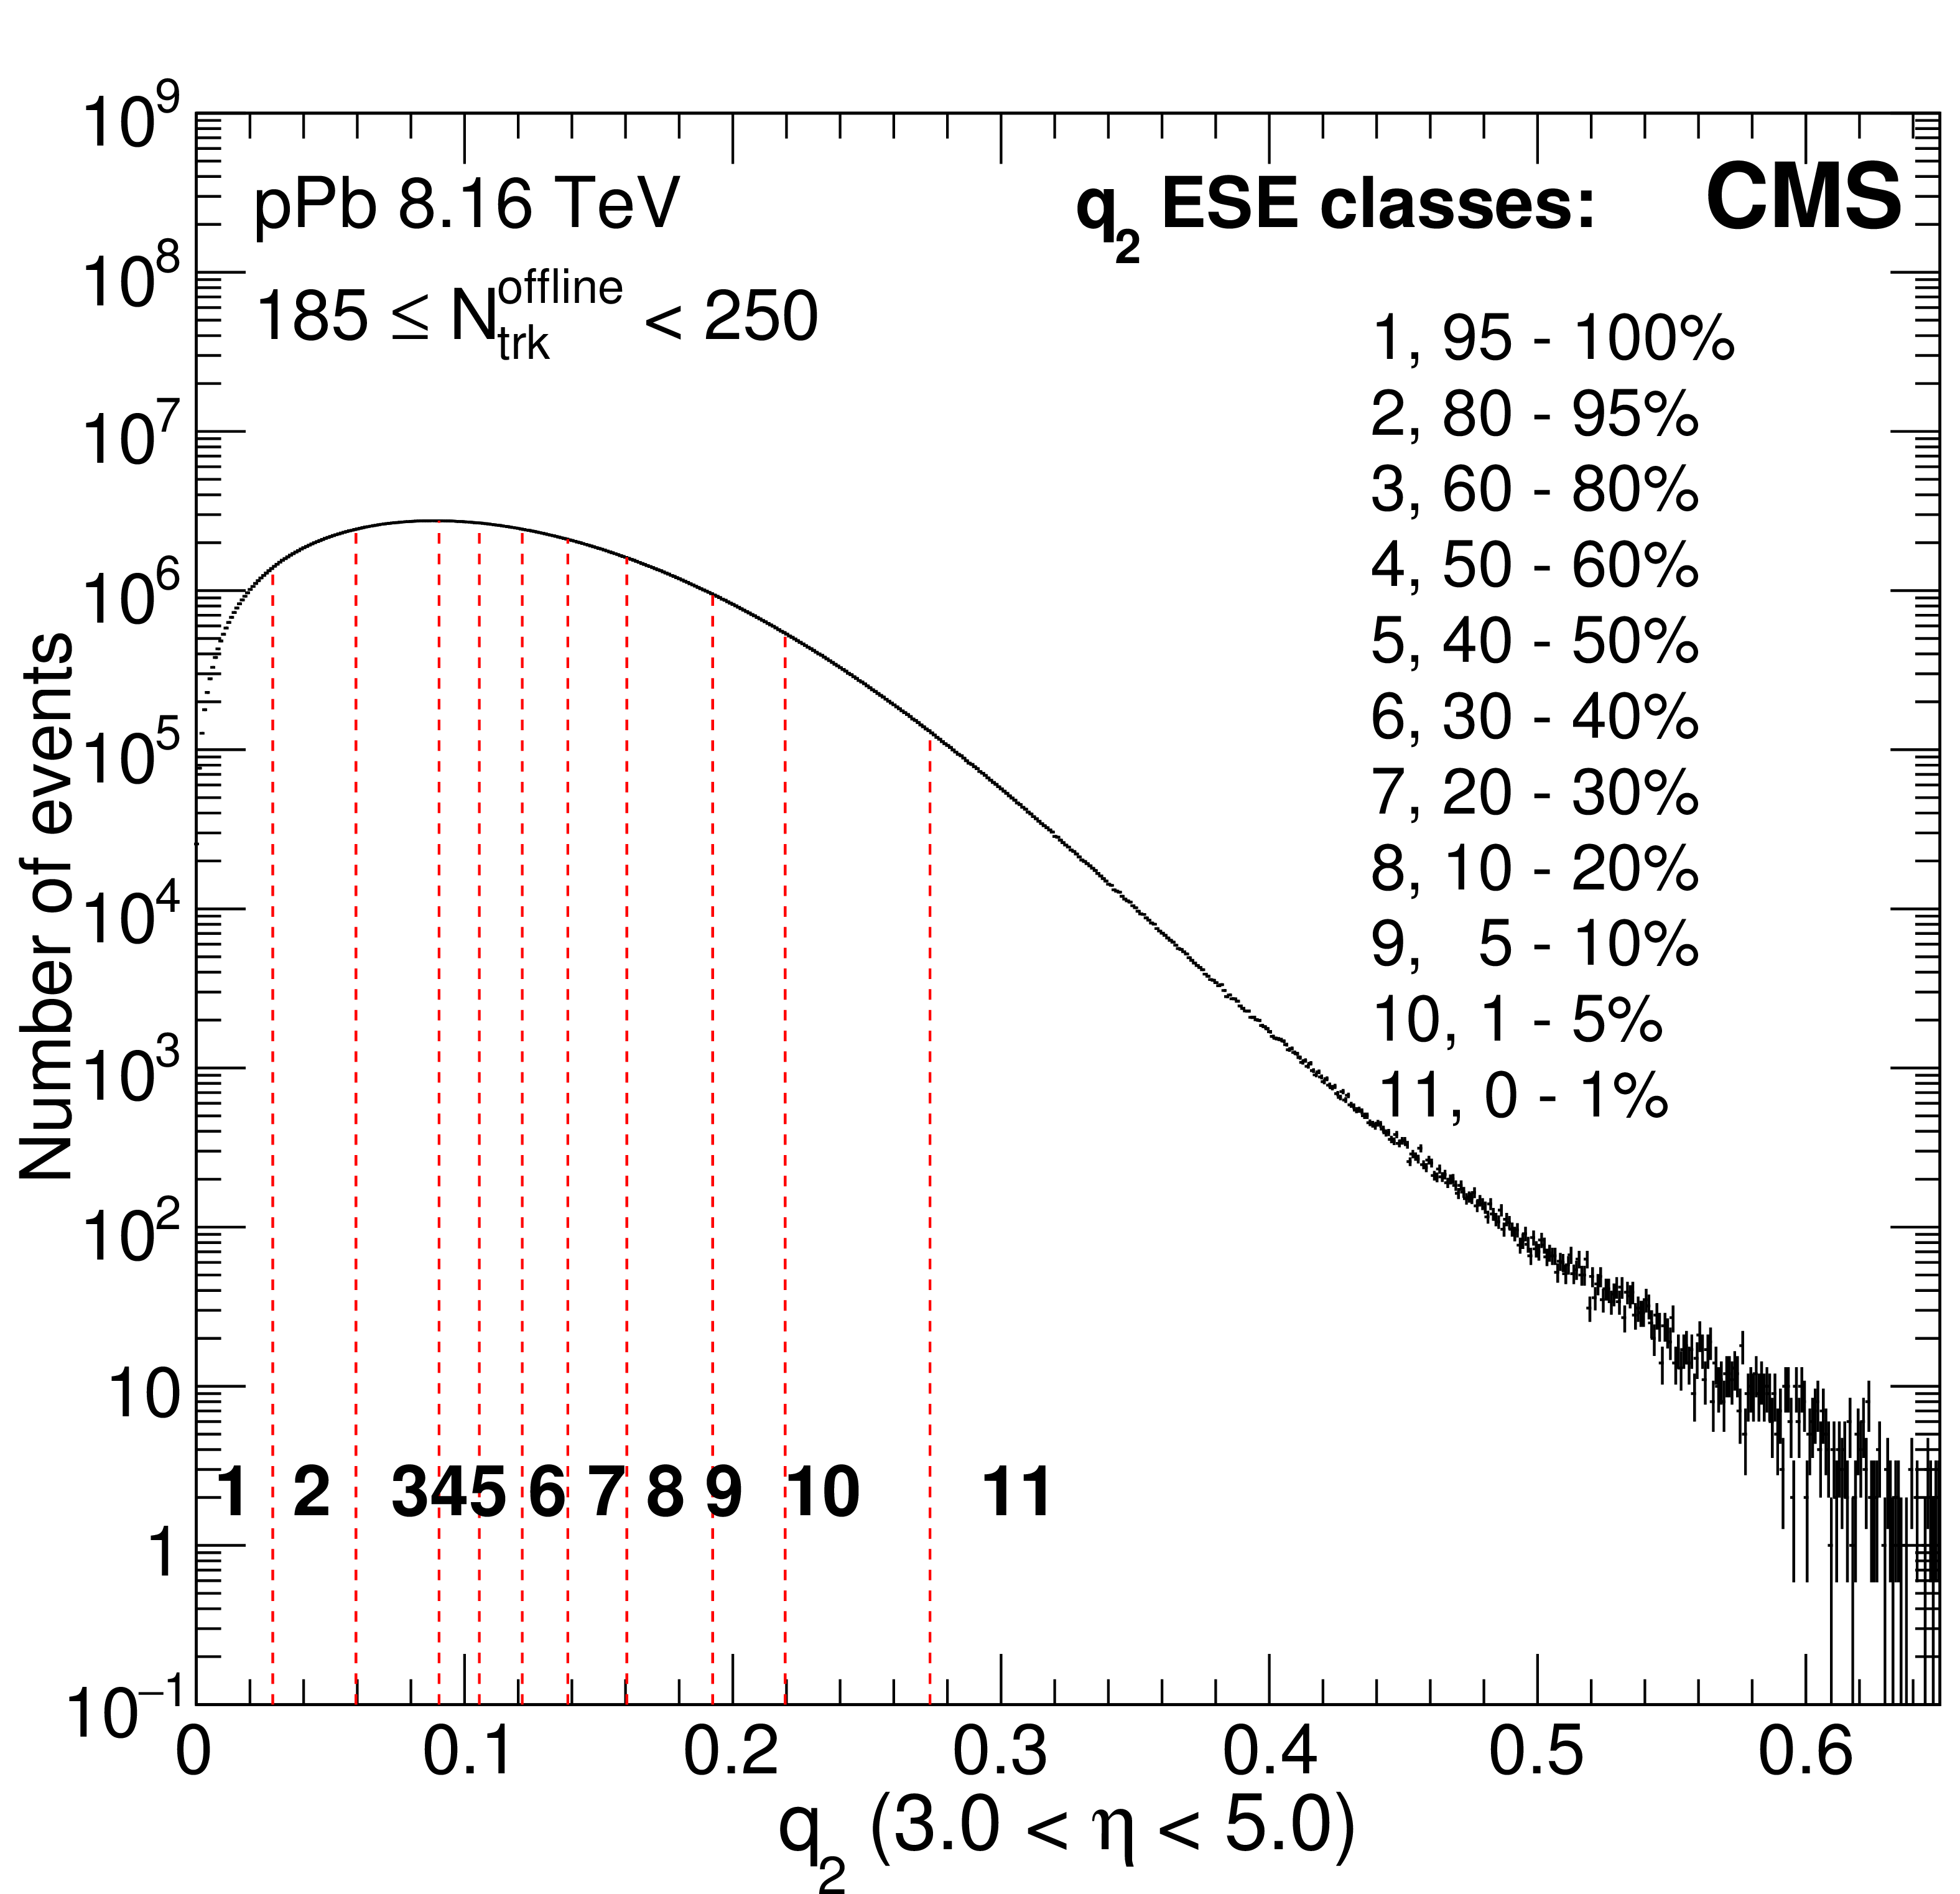
Figure 1-b:
The $q_{2}$ classes are shown in different fractions with respect to the total number of events in multiplicity range 185 $ \leq {N_\text {trk}^\text {offline}} < $ 250 in pPb collisions at $ {\sqrt {{s_{_{\mathrm {NN}}}}}}= $ 5.02 and 8.16 TeV, respectively. |
png pdf |
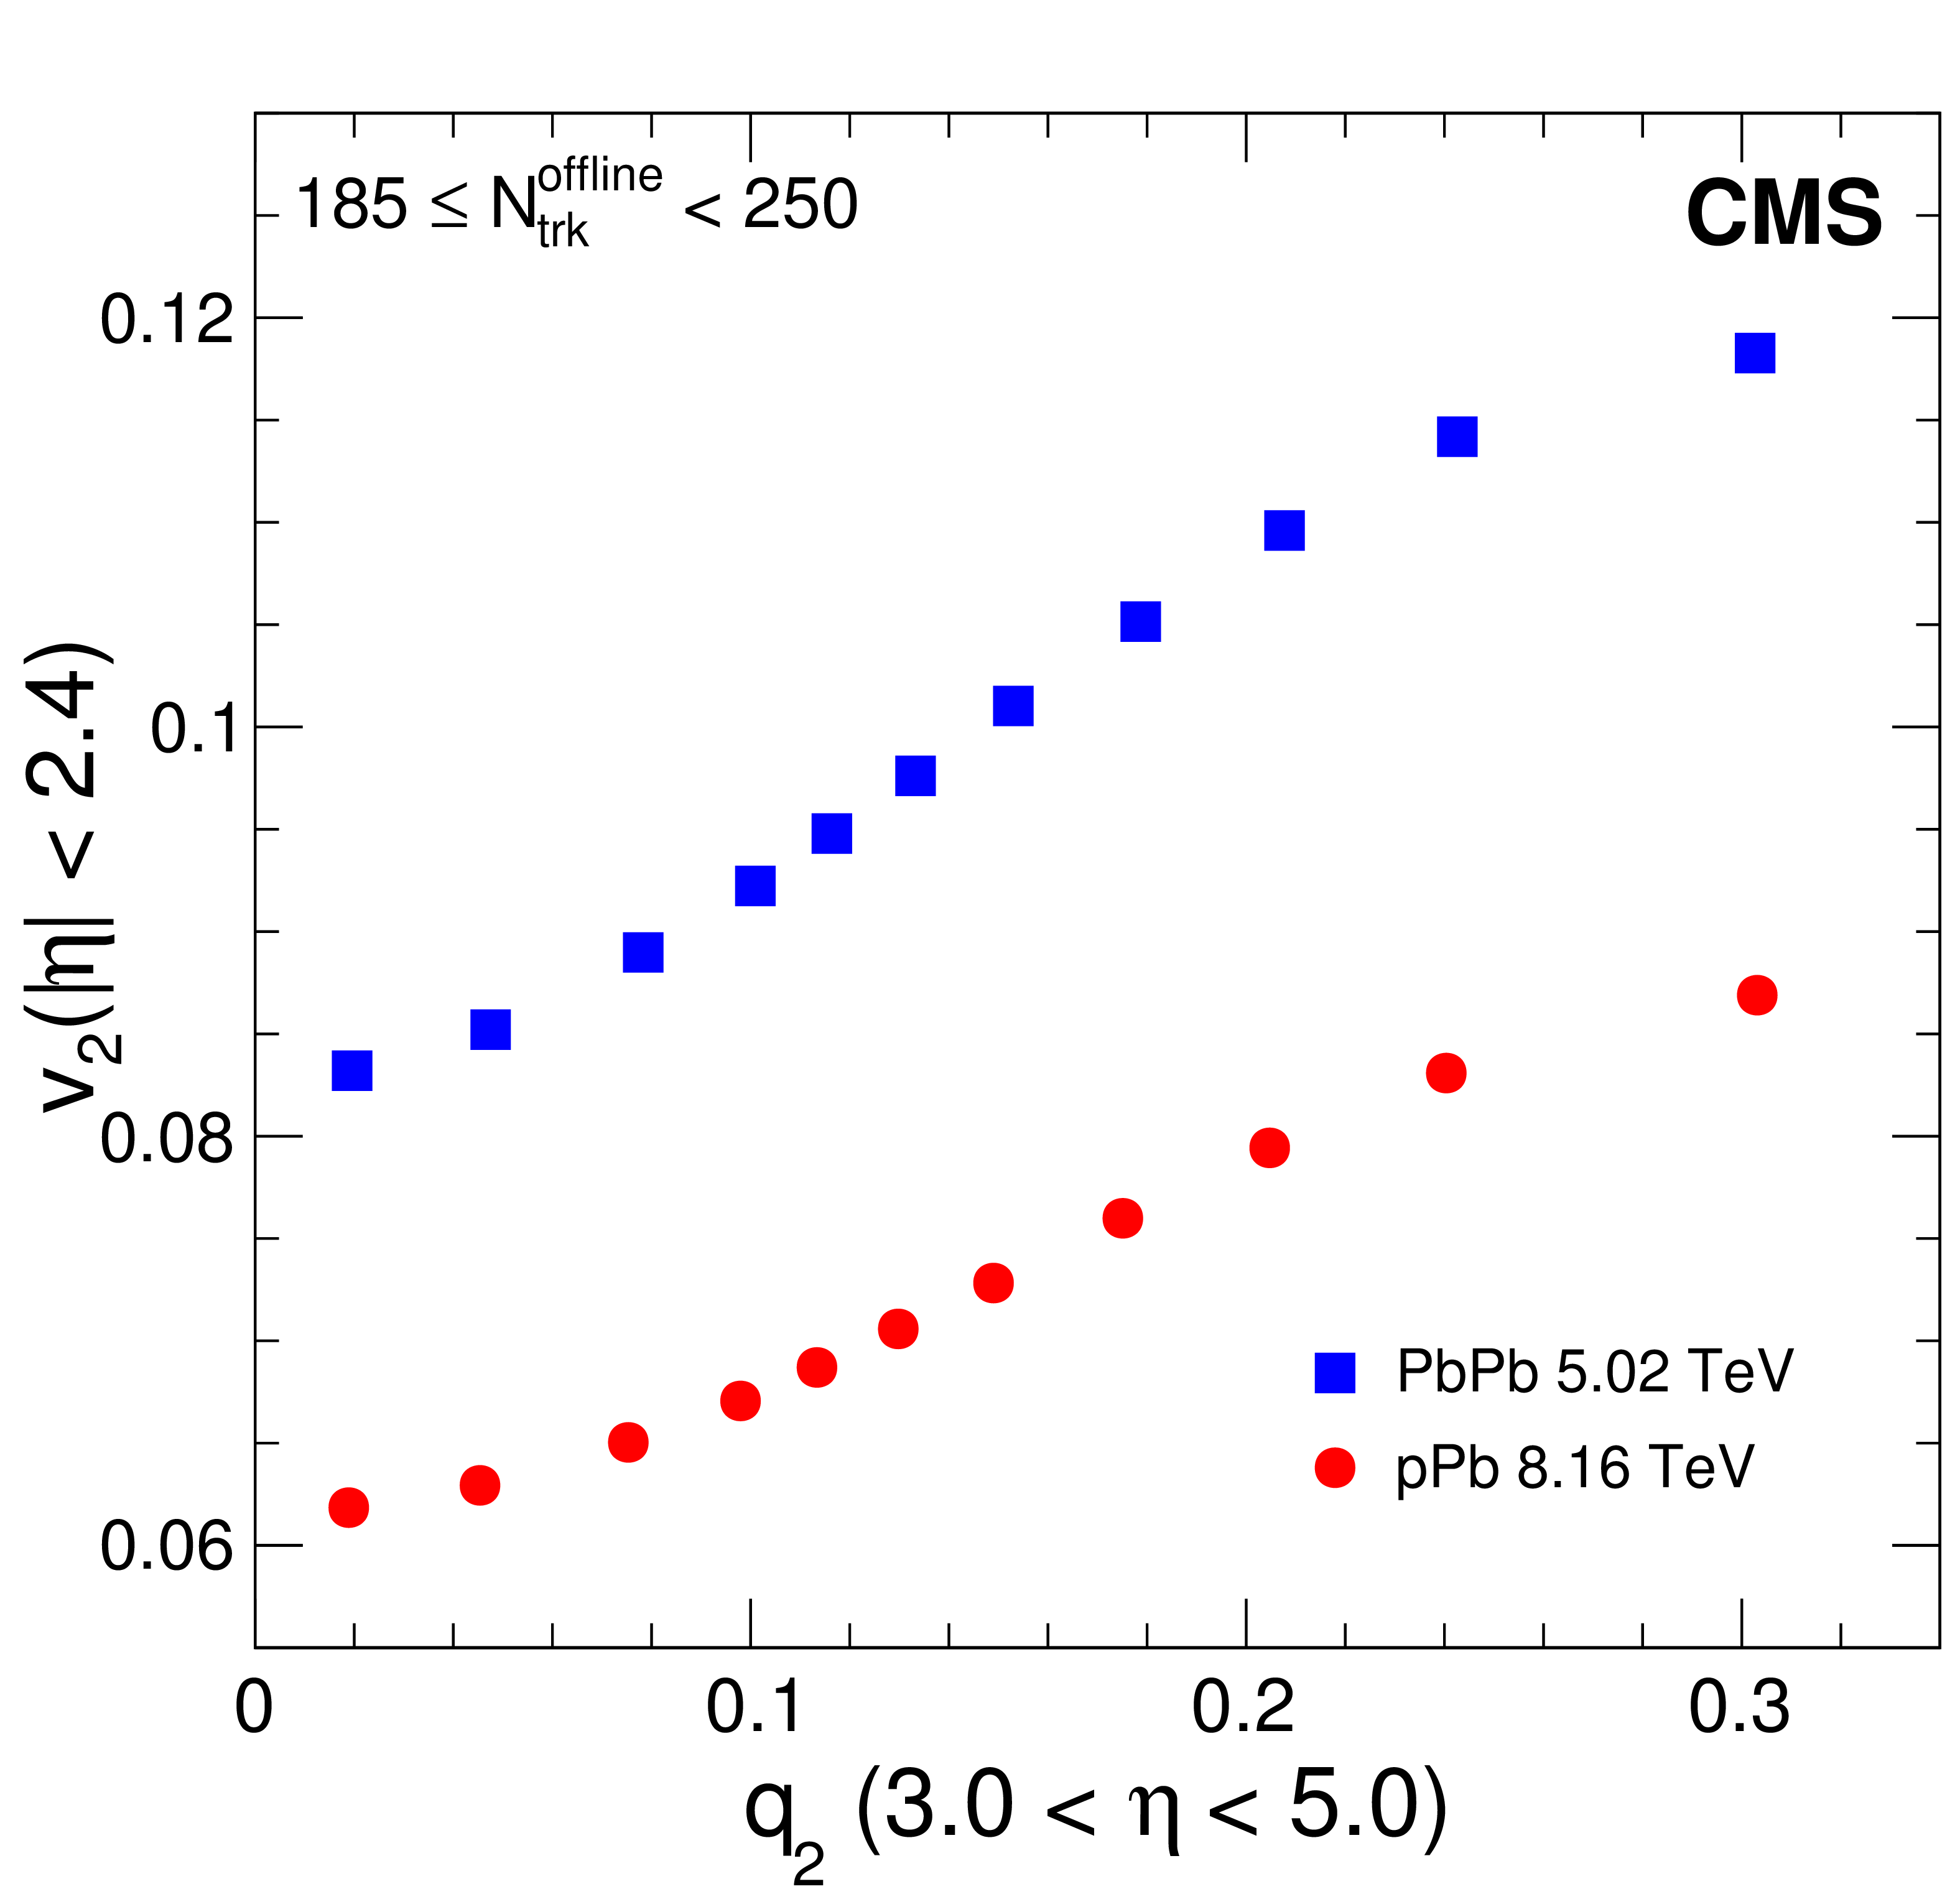
Figure 2:
The correlation between the tracker $v_{2}$ and the HF $q_{2}$ is shown for pPb and PbPb collisions at collisions at $ {\sqrt {{s_{_{\mathrm {NN}}}}}} = $ 8.16 and 5.02 TeV, respectively. |
png pdf |
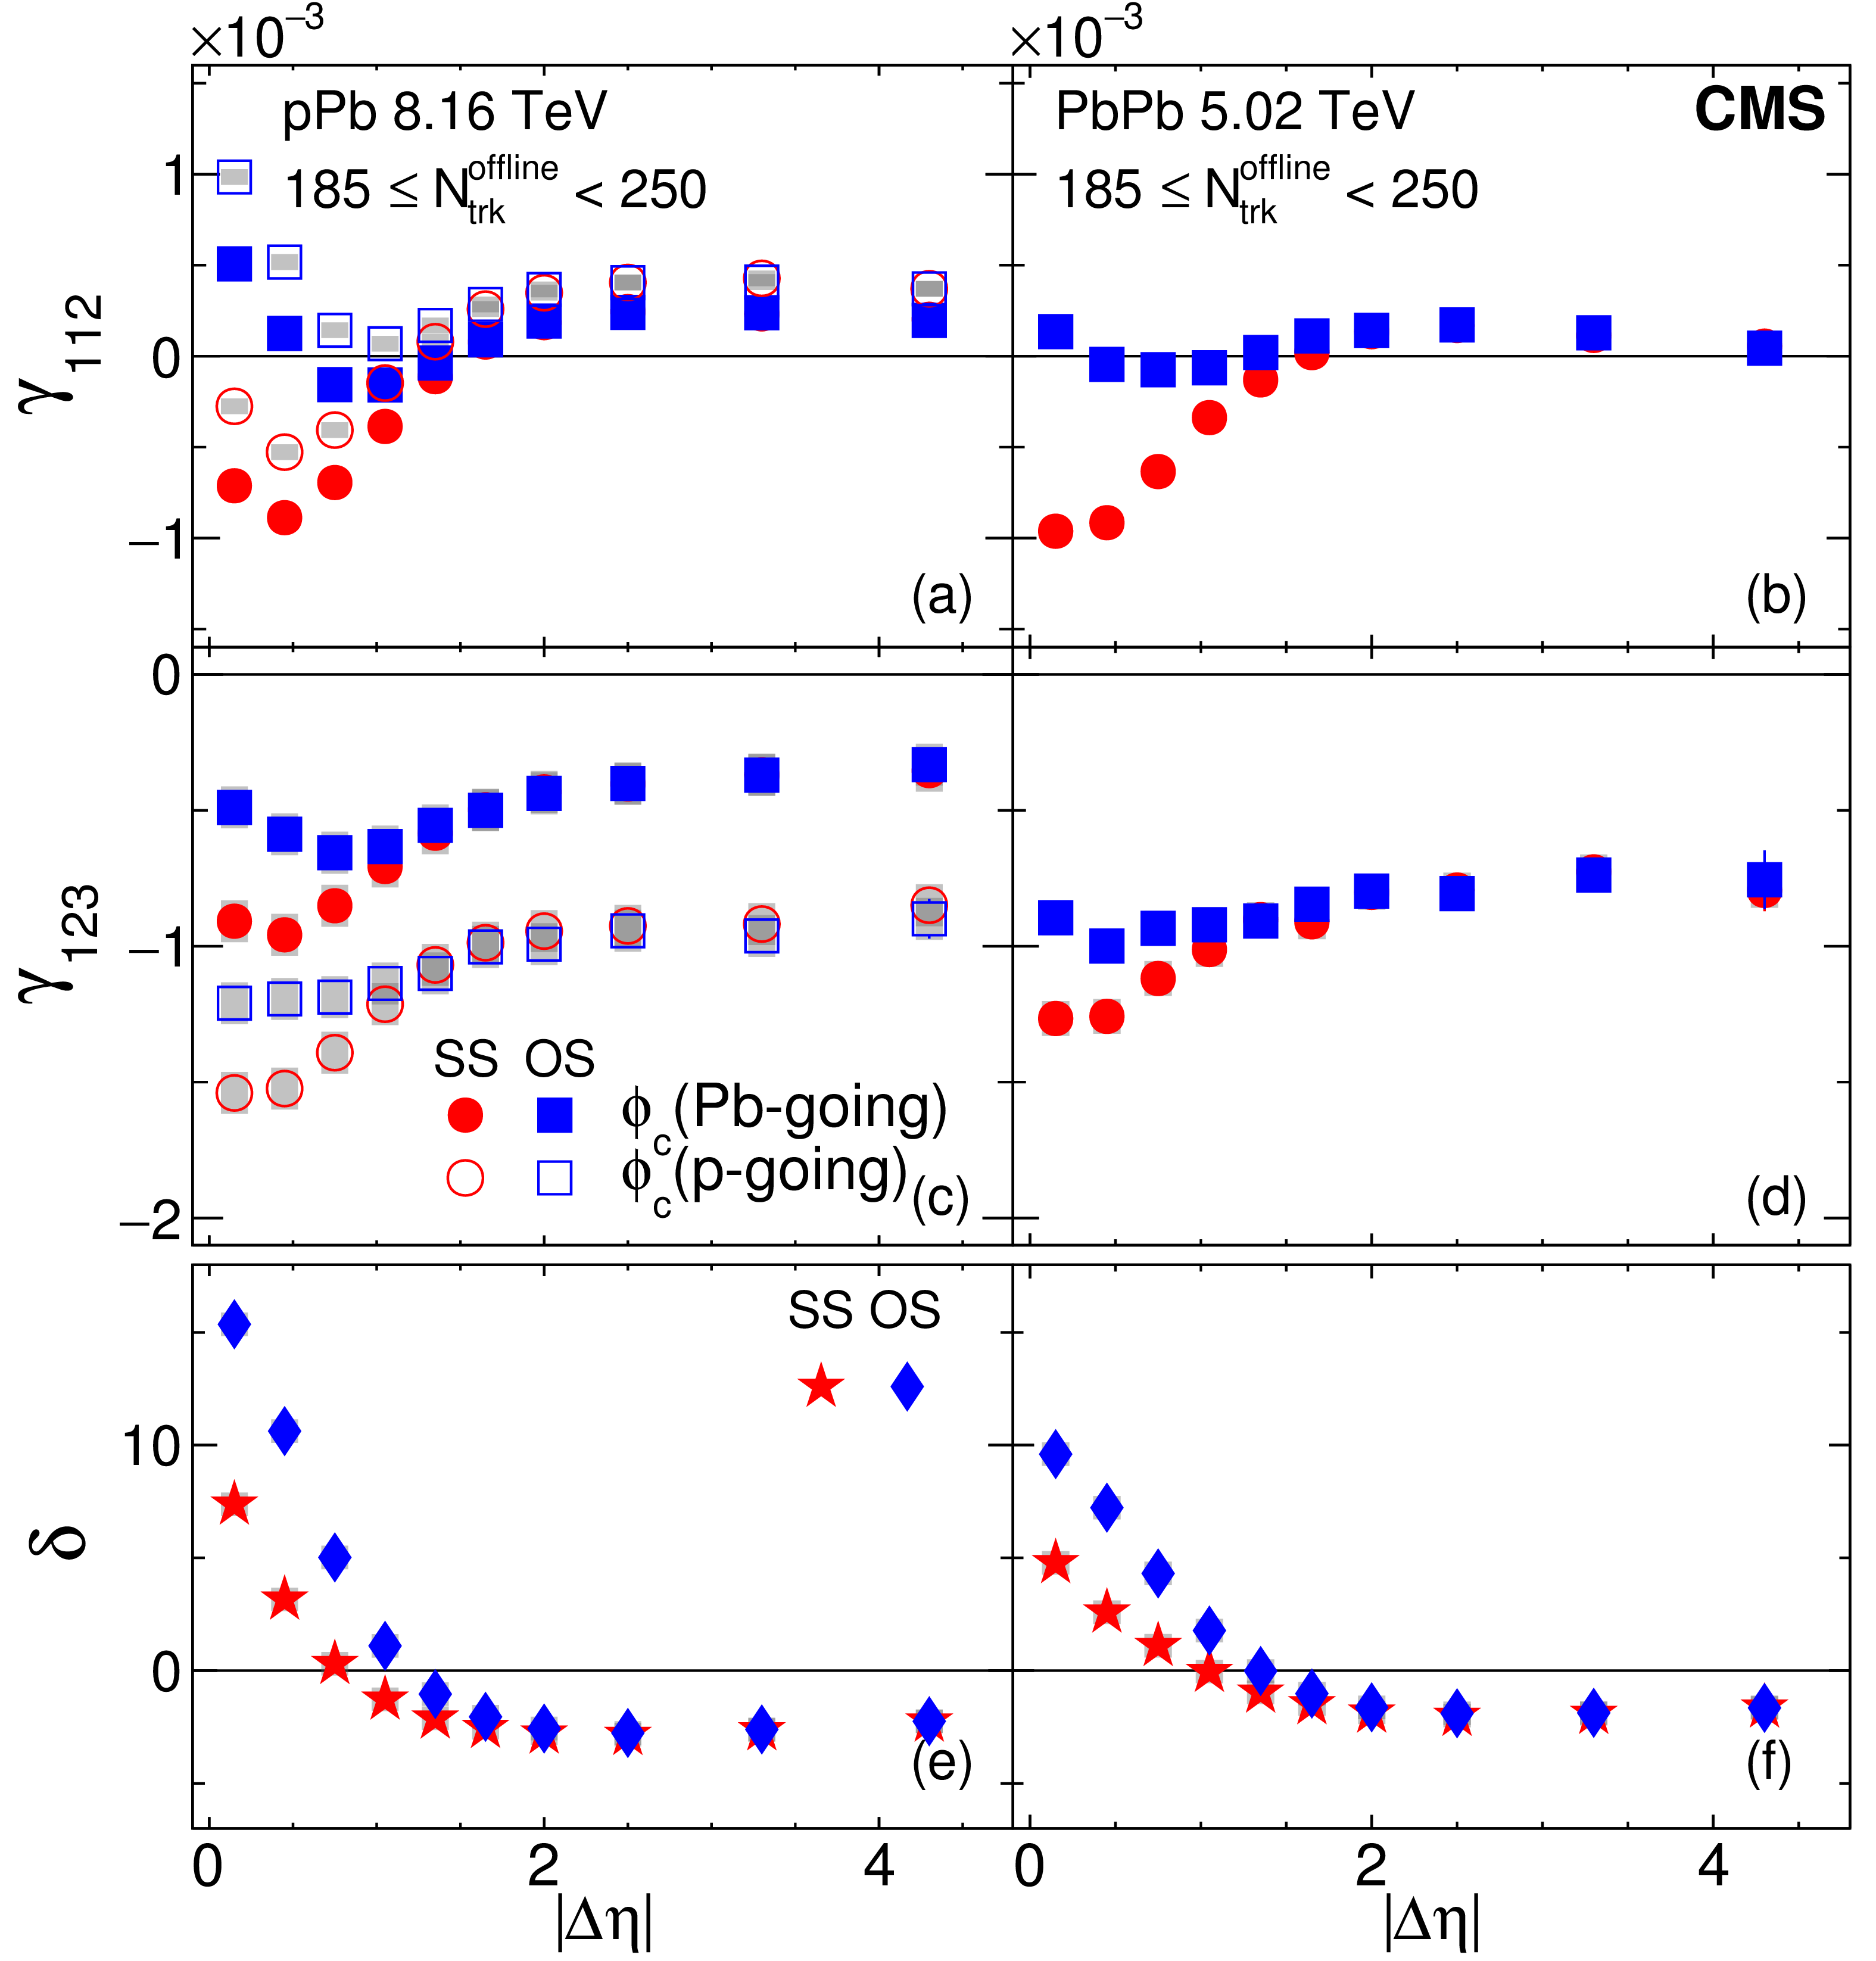
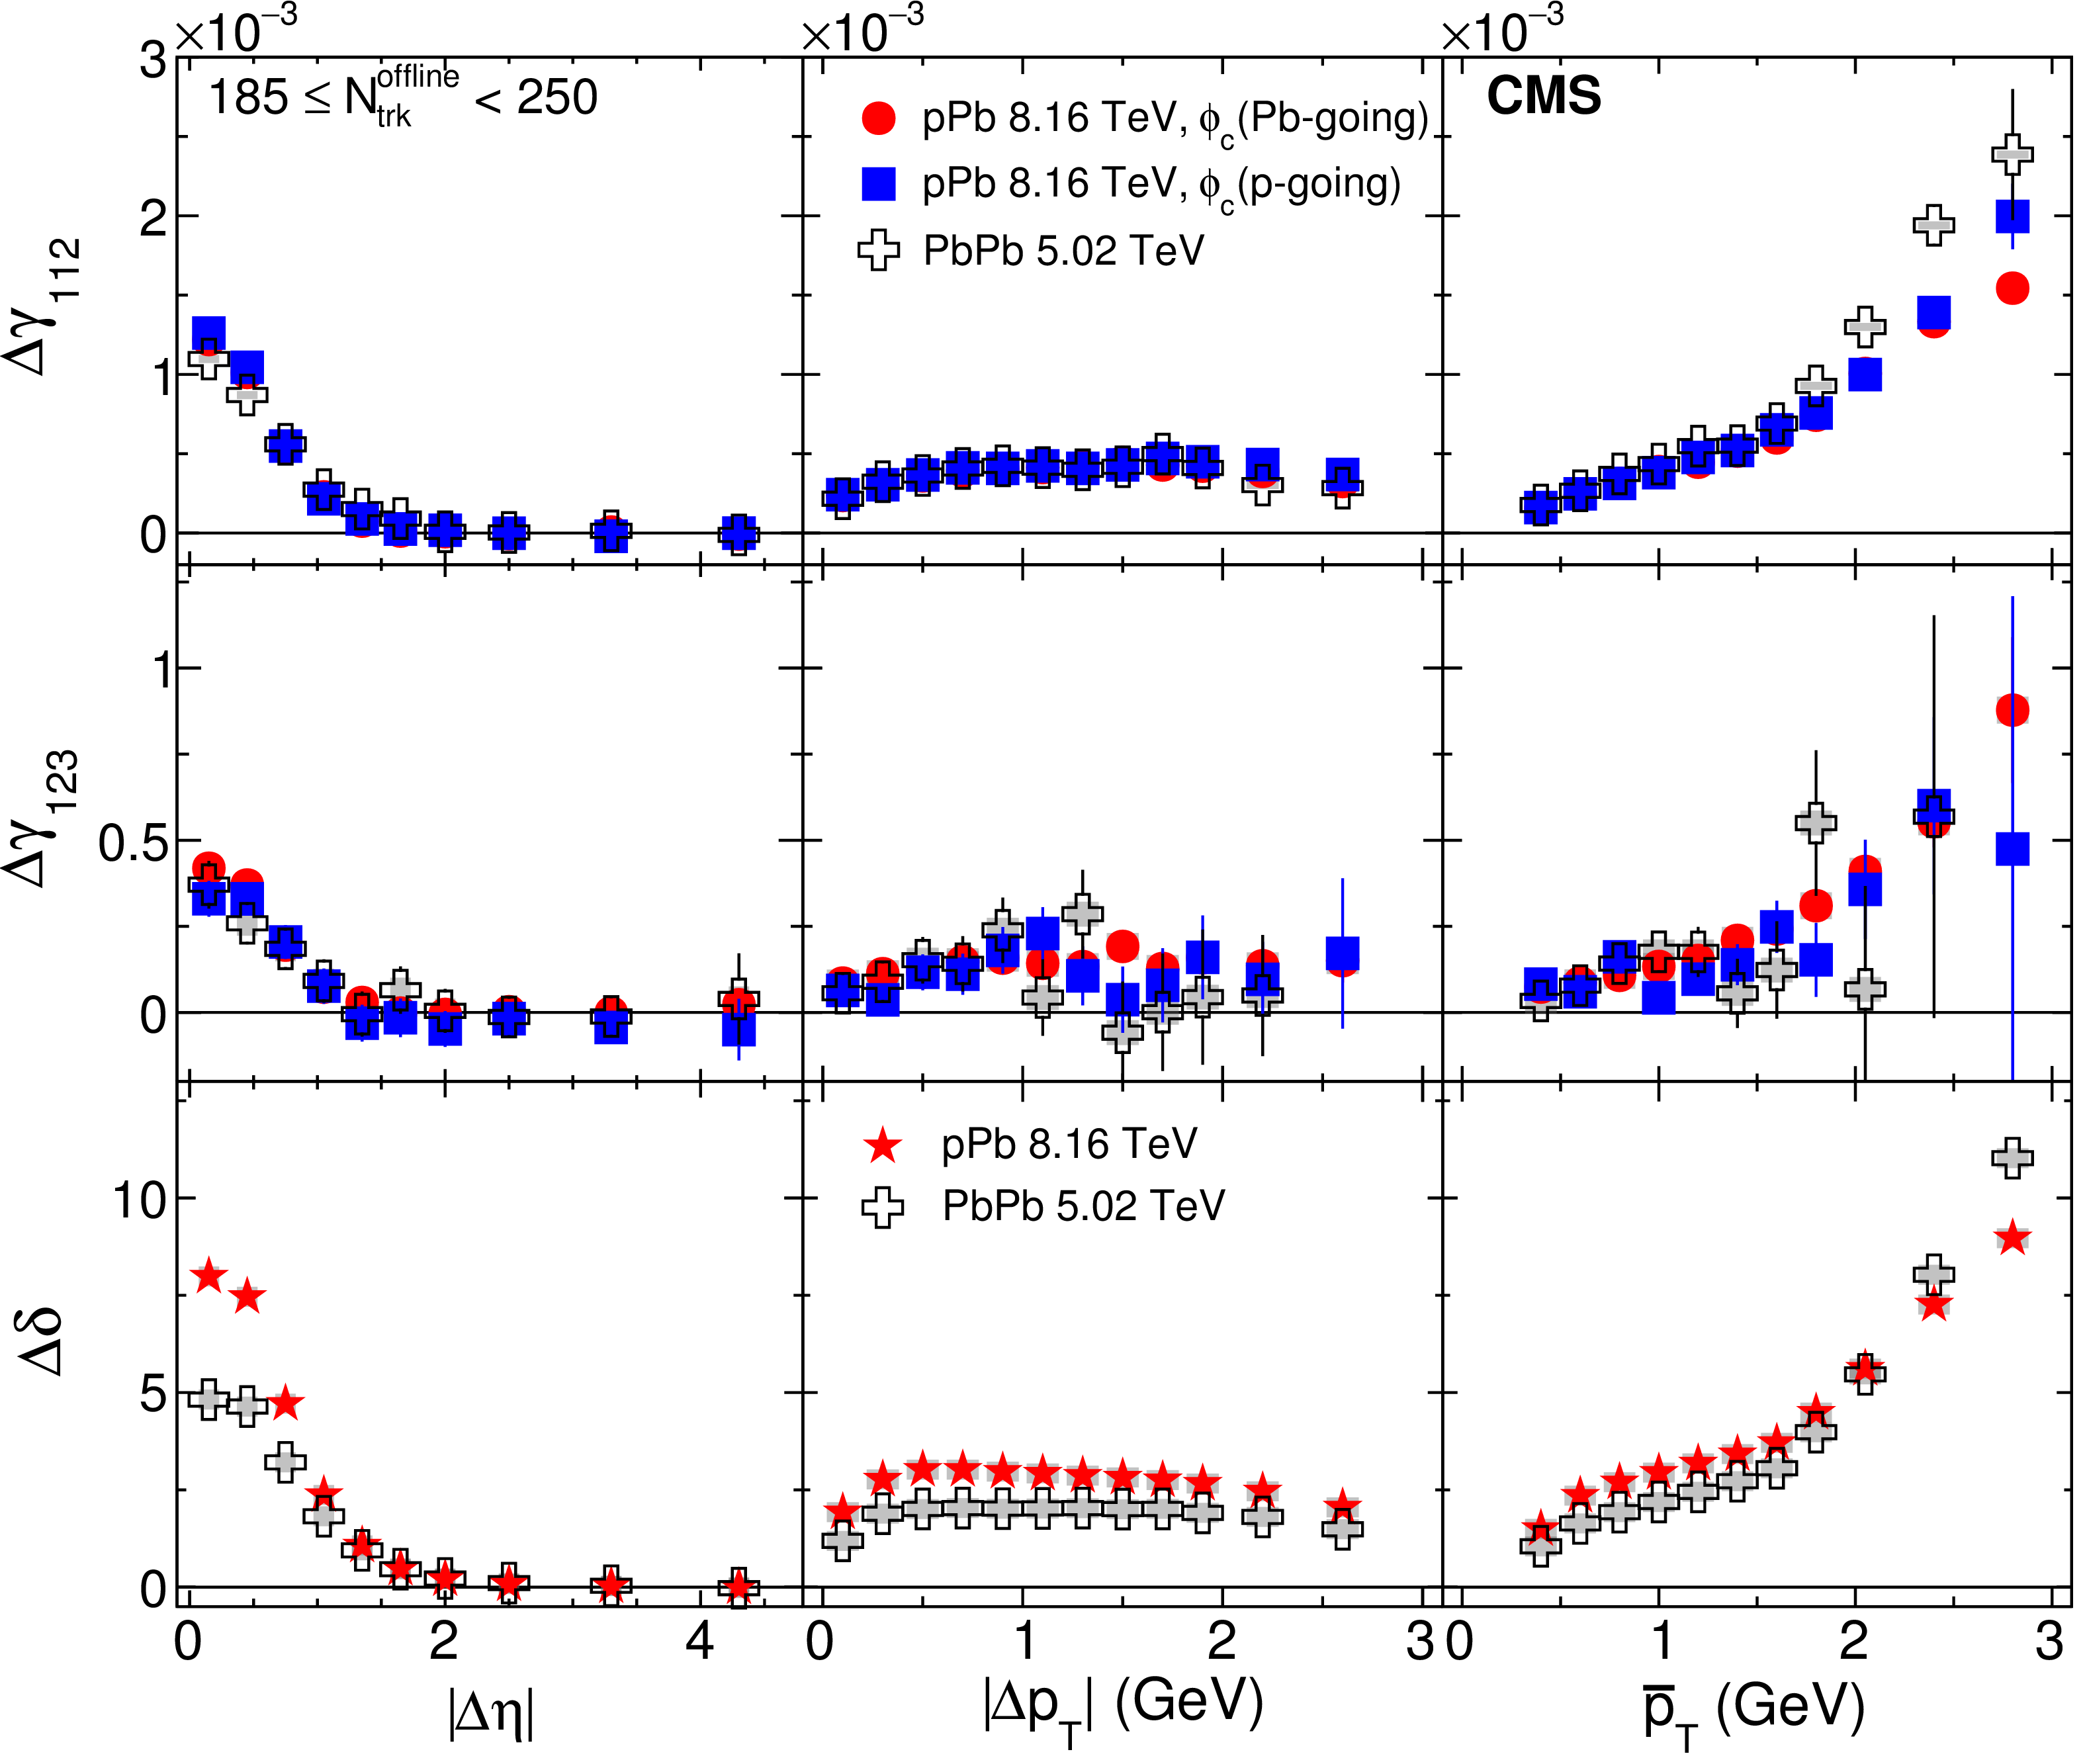
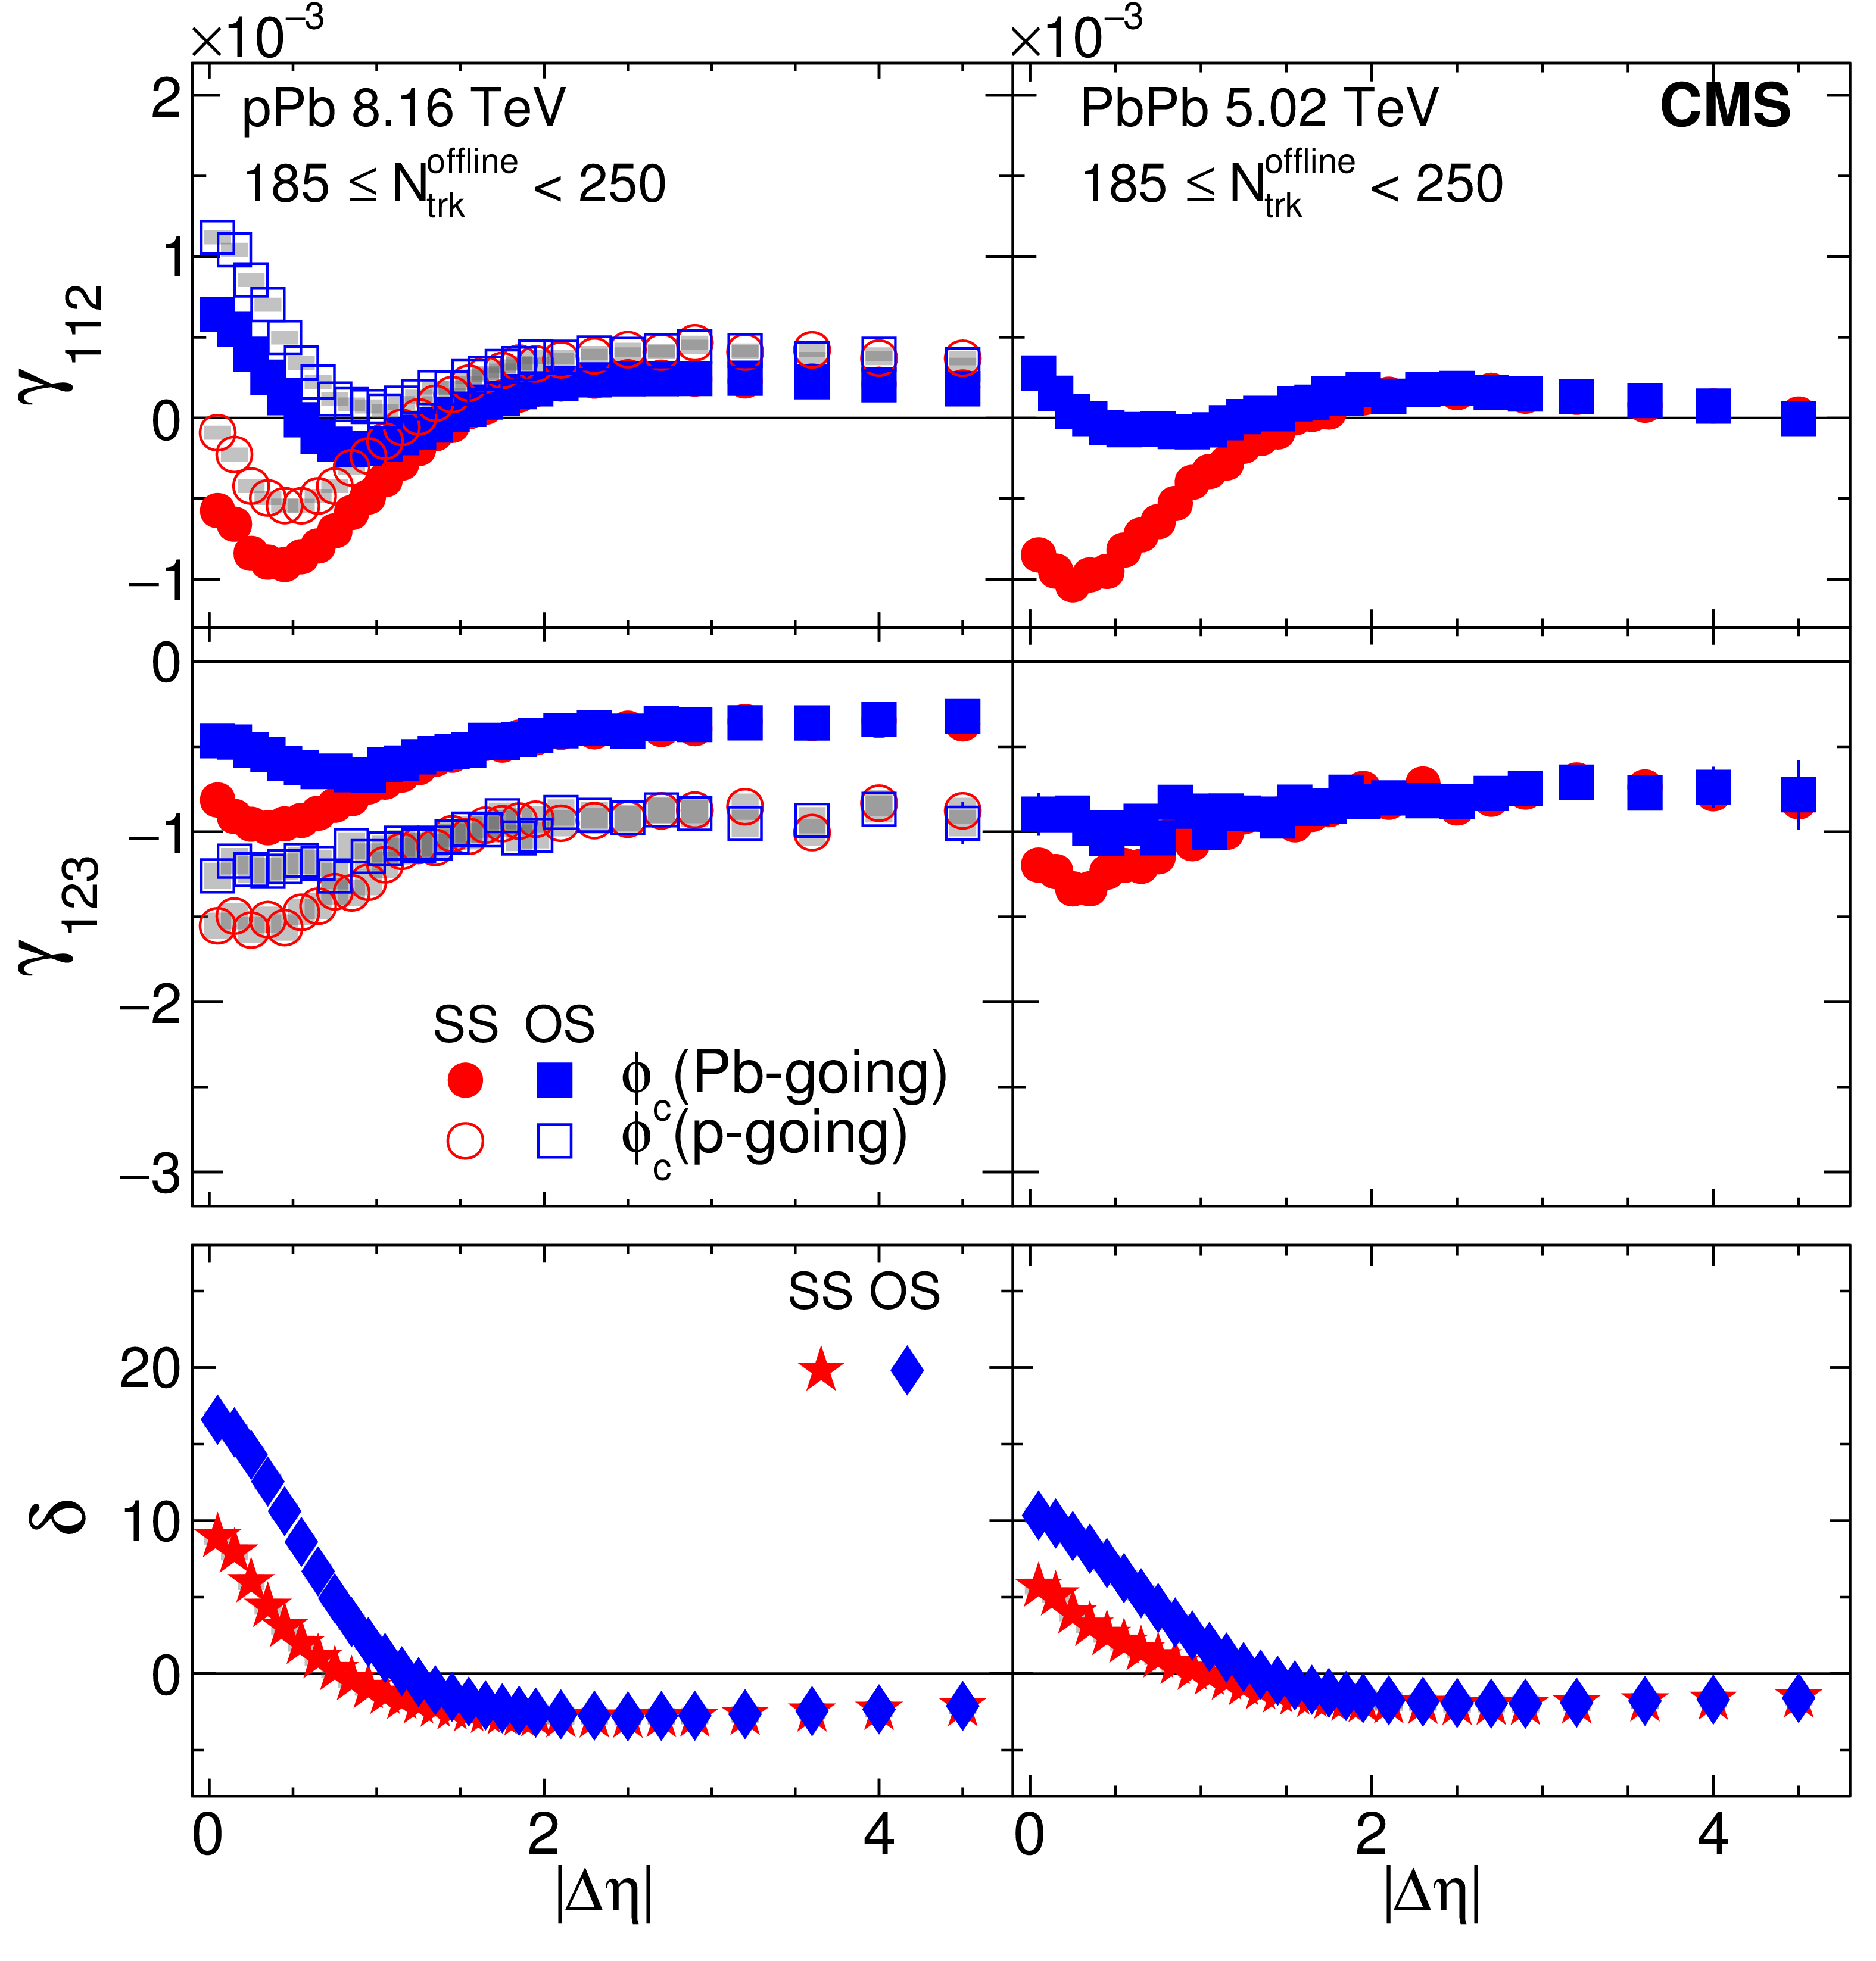
Figure 3:
The SS and OS three-particle correlators, $\gamma _{112}$ (upper) and $\gamma _{123}$ (middle), and two-particle correlator, $\delta $ (lower), as a function of $ {| {\Delta \eta } | }$ for 185 $ \leq {N_\text {trk}^\text {offline}} < $ 250 in pPb collisions at $ {\sqrt {{s_{_{\mathrm {NN}}}}}} = $ 8.16 TeV (left) and PbPb collisions at 5.02 TeV (right). The pPb results obtained with particle $c$ in Pb-going (solid markers) and p-going (open markers) sides are shown separately. The SS and OS two-particle correlators are denoted by different markers for both pPb and PbPb collisions. Statistical and systematic uncertainties are indicated by the error bars and shaded regions, respectively. |
png pdf |
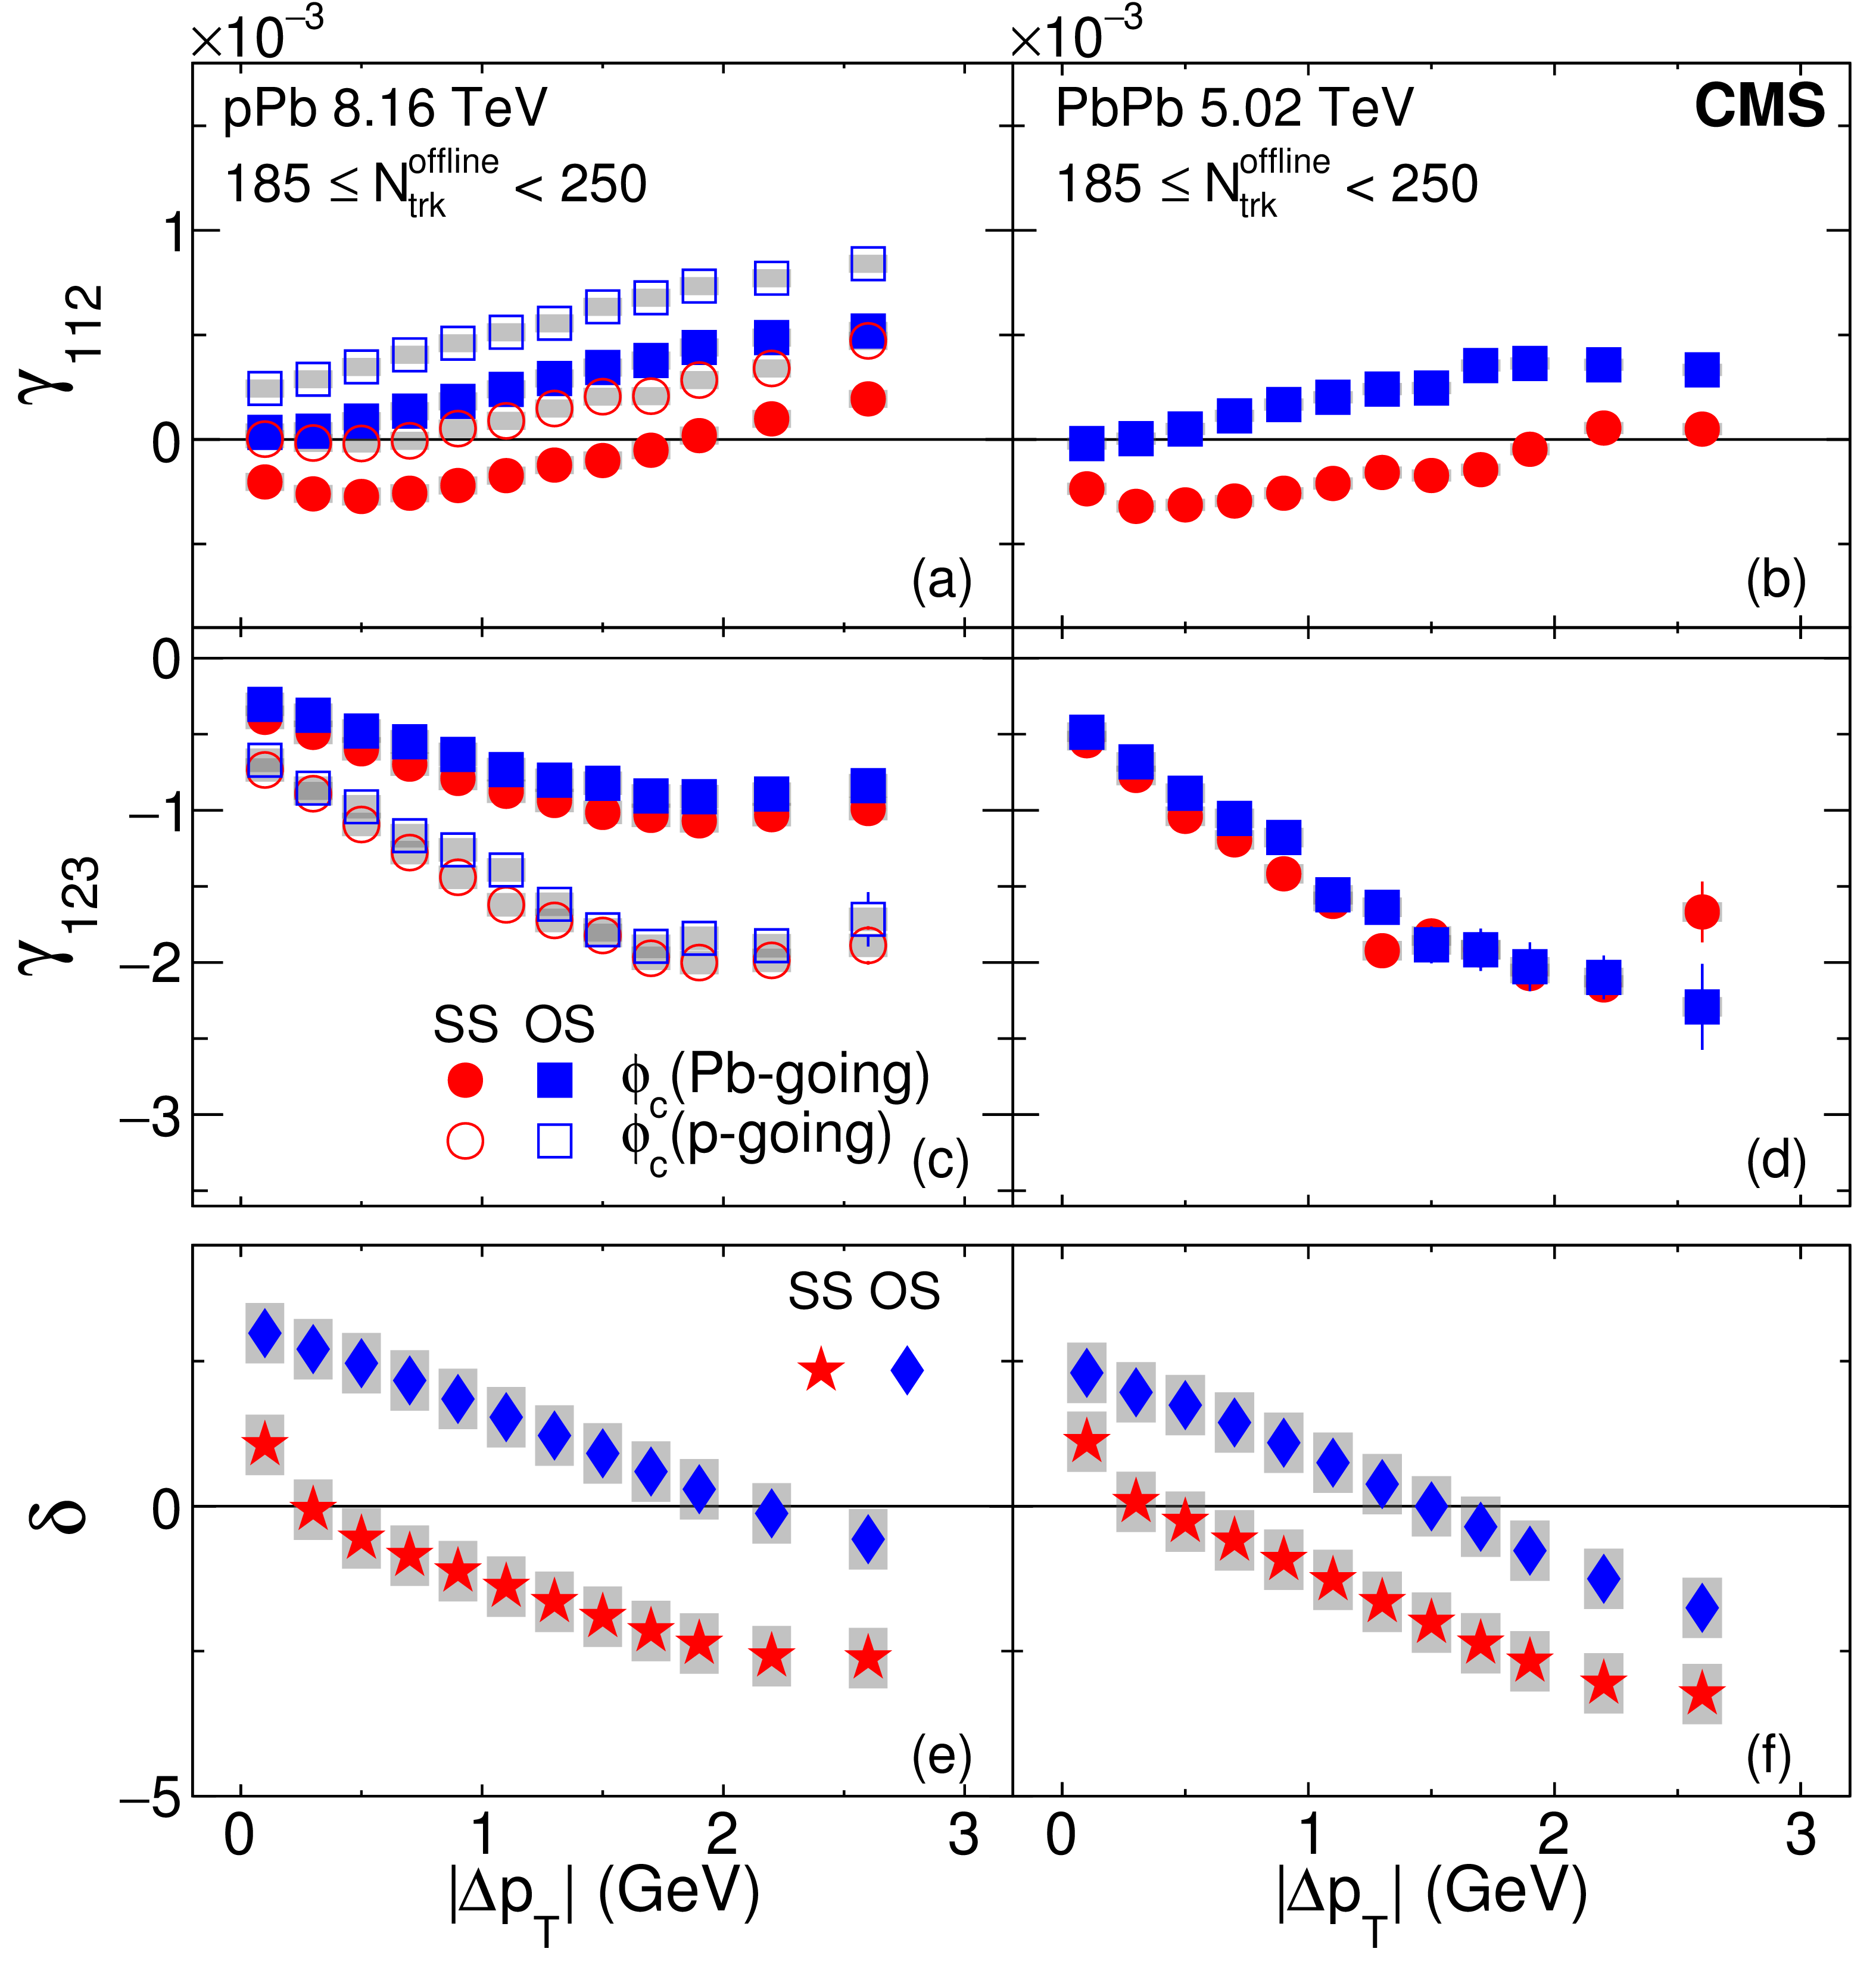
Figure 4:
The SS and OS three-particle correlators, $\gamma _{112}$ (upper) and $\gamma _{123}$ (middle), and two-particle correlator, $\delta $ (lower), as a function of $ {| \Delta {p_{\mathrm {T}}} | }$ for 185 $ \leq {N_\text {trk}^\text {offline}} < $ 250 in pPb collisions at $ {\sqrt {{s_{_{\mathrm {NN}}}}}} = $ 8.16 TeV (left) and PbPb collisions at 5.02 TeV (right) collisions. The pPb results obtained with particle $c$ in Pb-going (solid markers) and p-going (open markers) sides are shown separately. The SS and OS two-particle correlators are denoted by different markers for both pPb and PbPb collisions. Statistical and systematic uncertainties are indicated by the error bars and shaded regions, respectively. |
png pdf |
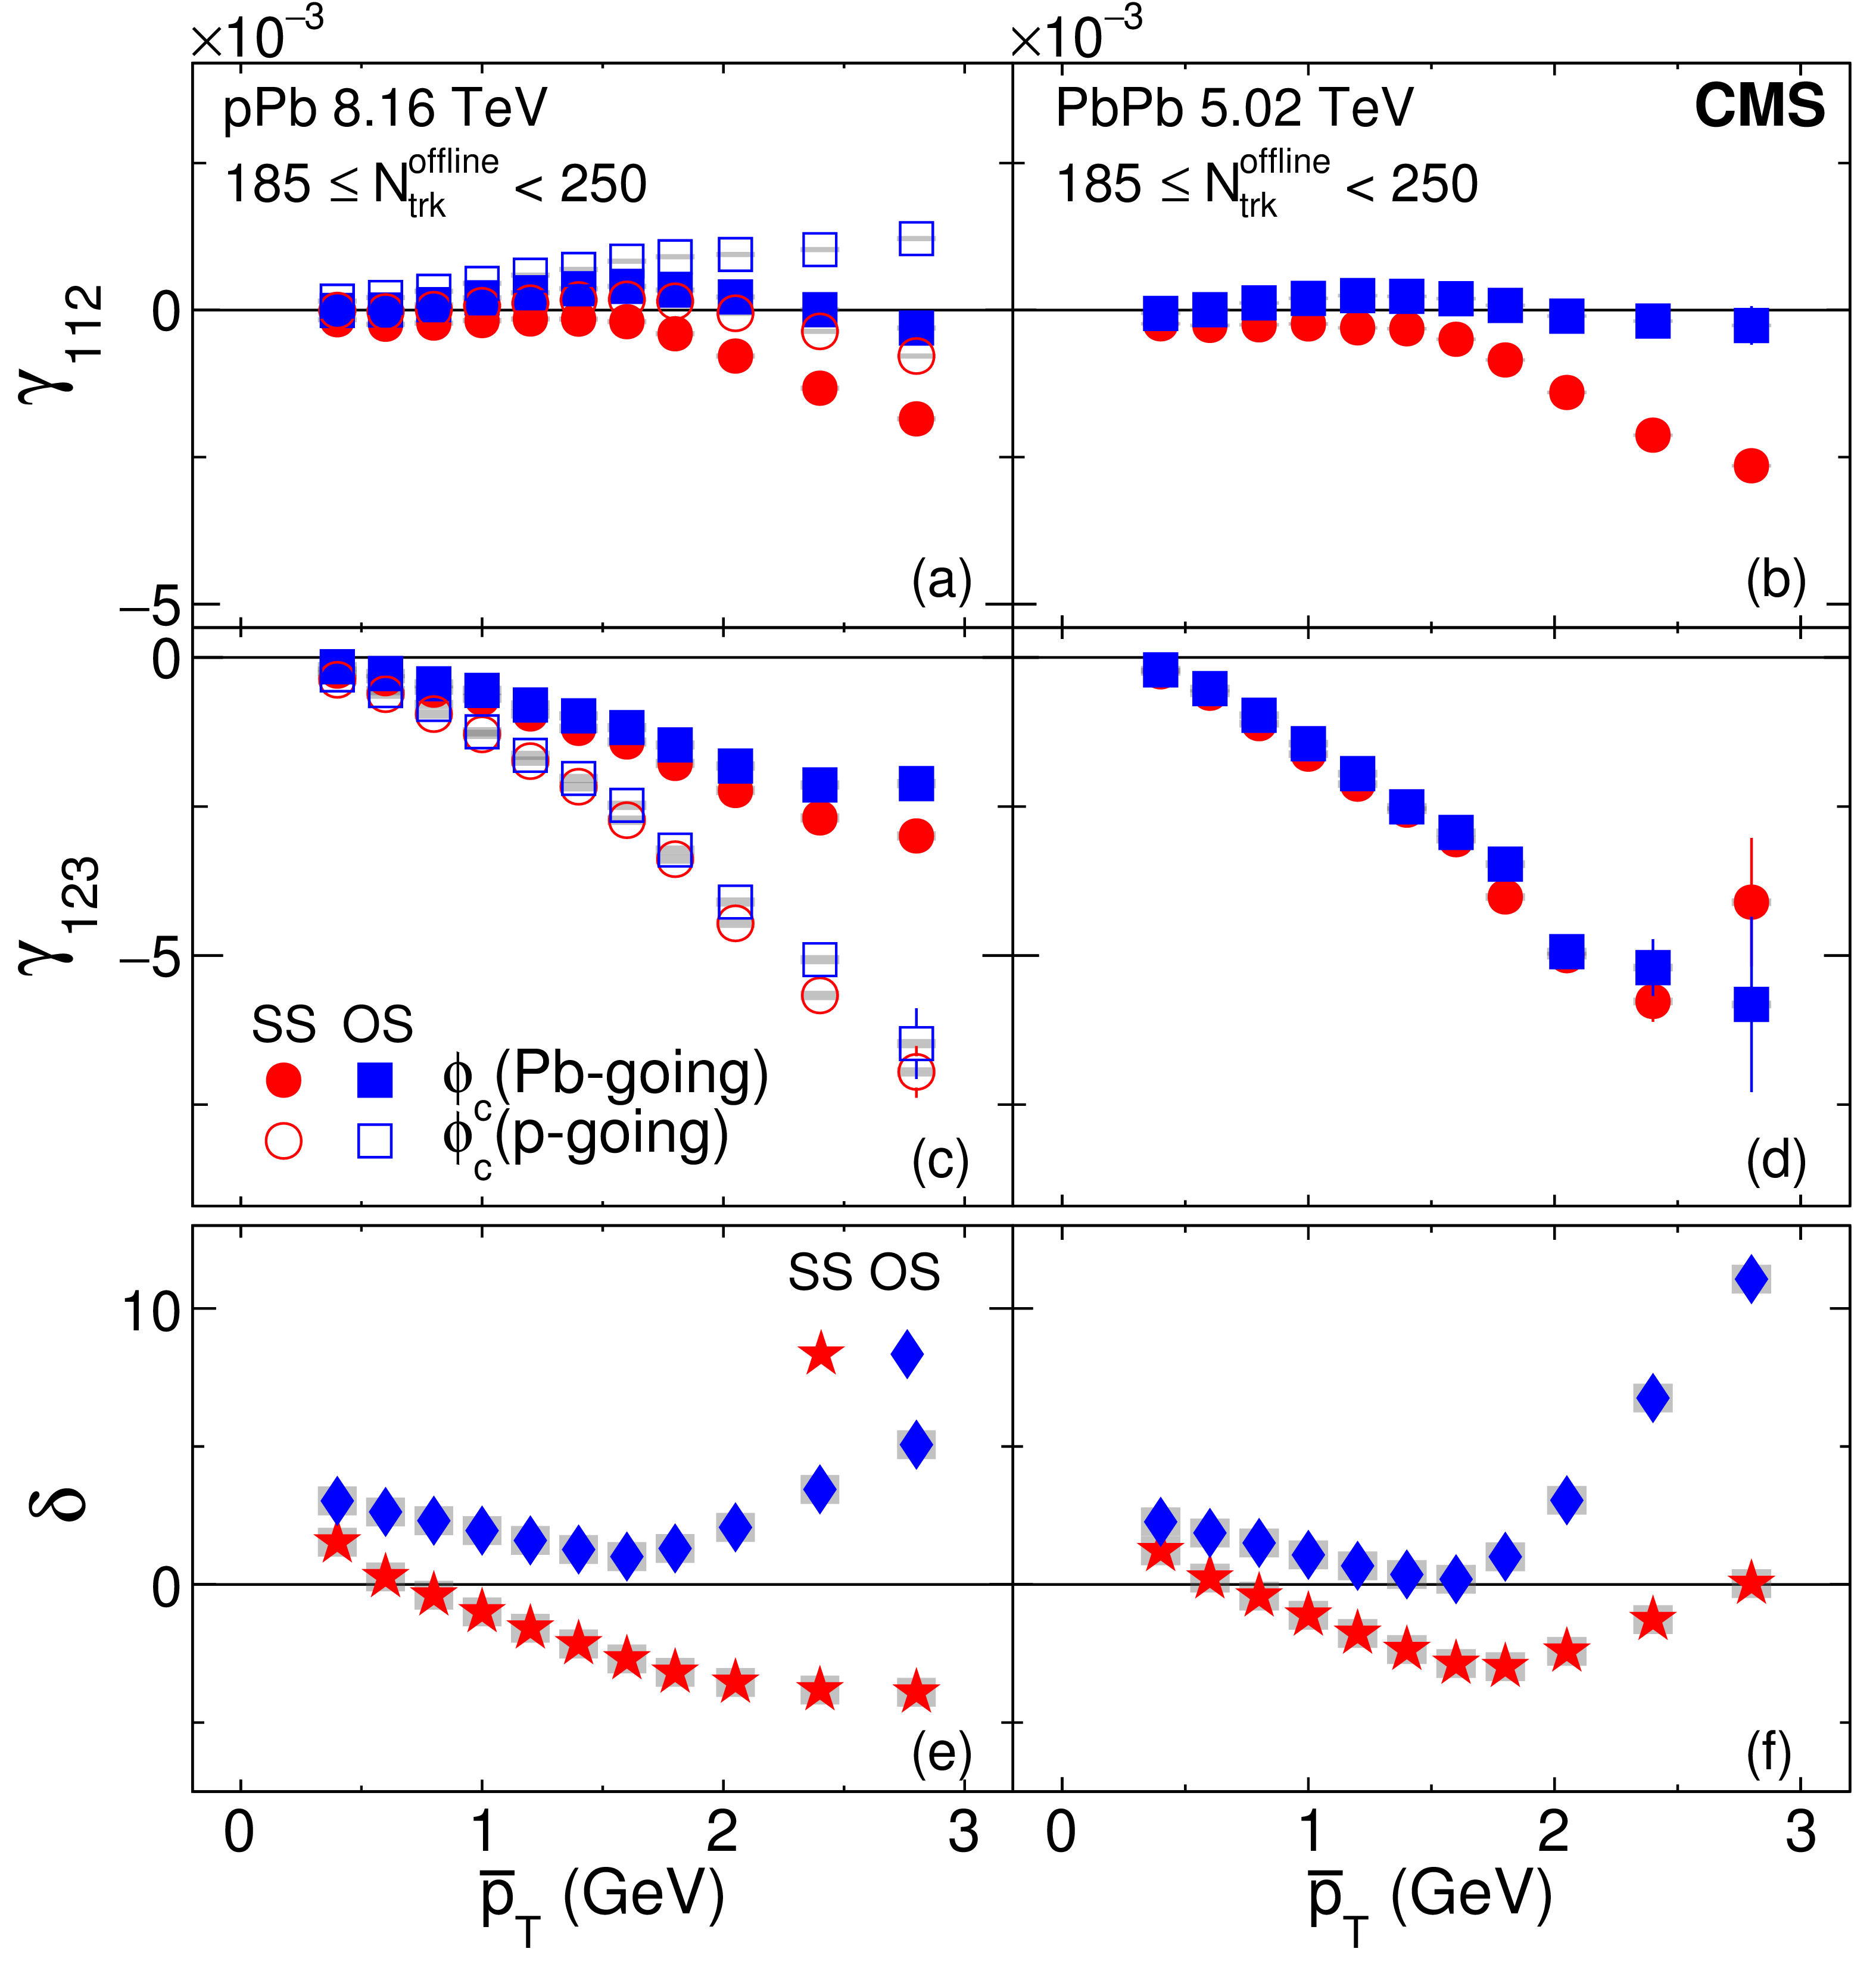
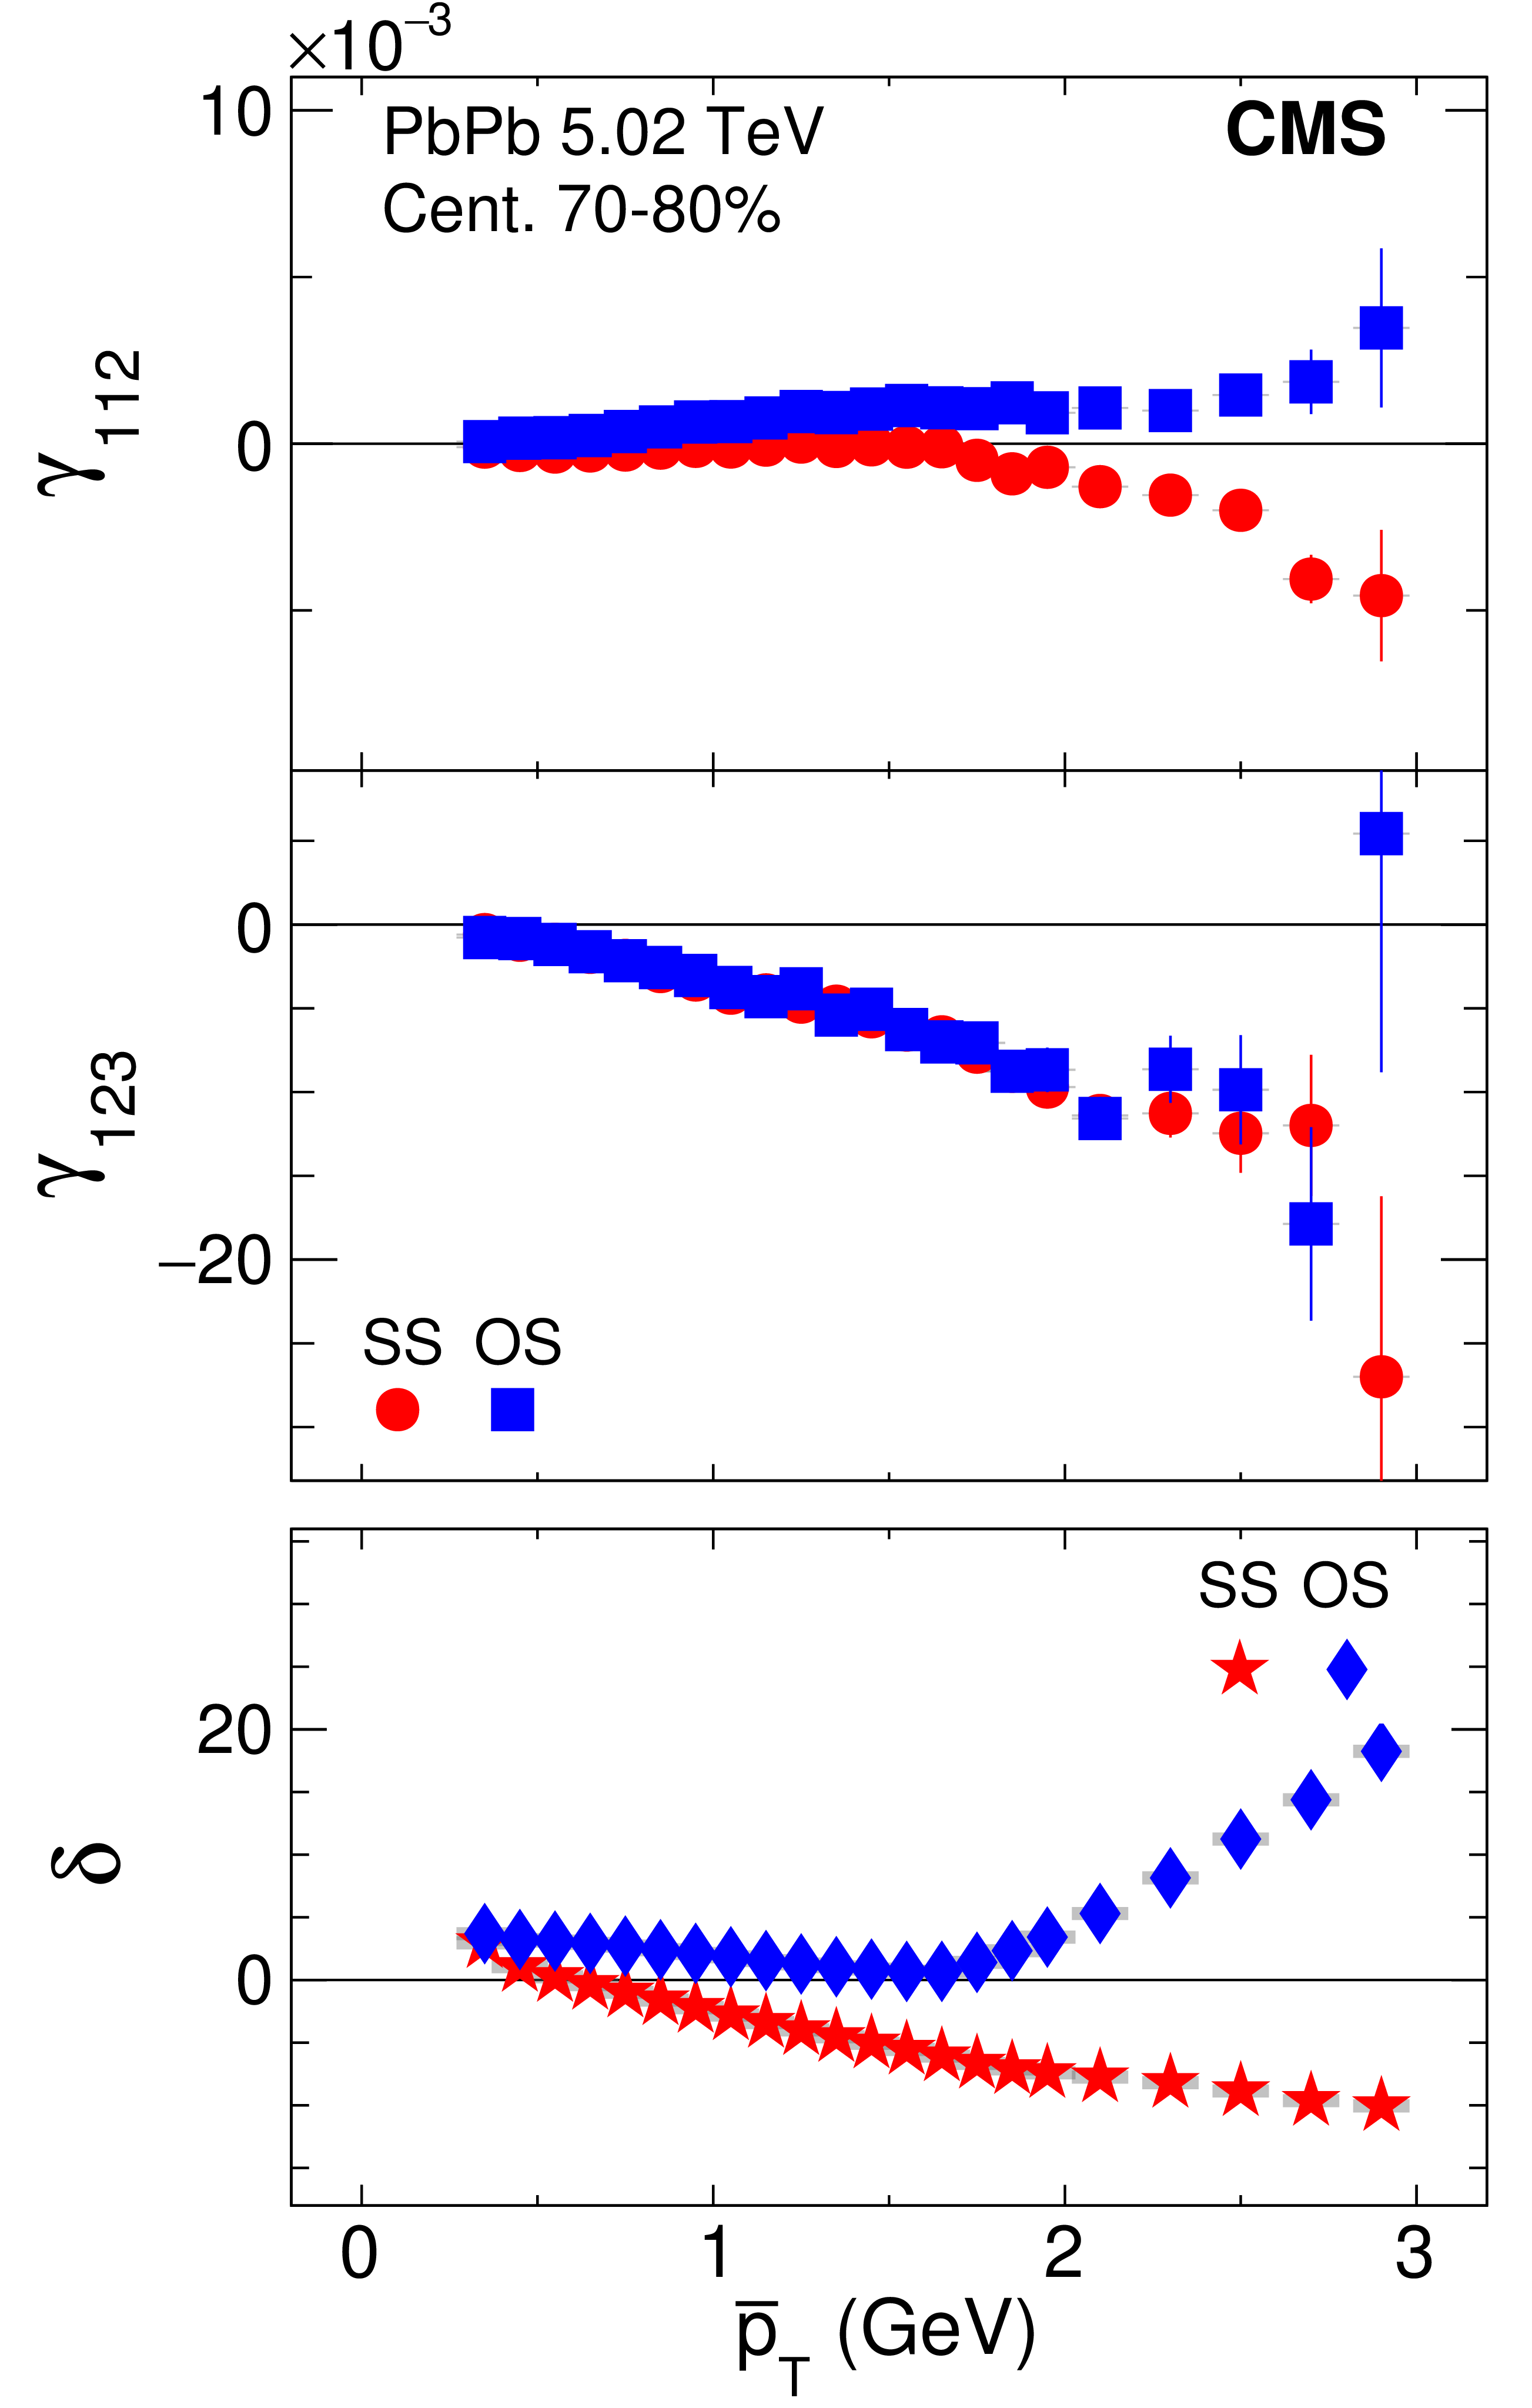
Figure 5:
The SS and OS three-particle correlators, $\gamma _{112}$ (upper) and $\gamma _{123}$ (middle), and two-particle correlator, $\delta $ (lower), as a function of $ {\overline {p}_\mathrm {T}} $ for 185 $ \leq {N_\text {trk}^\text {offline}} < $ 250 in pPb collisions at $ {\sqrt {{s_{_{\mathrm {NN}}}}}} = $ 8.16 TeV (left) and PbPb collisions at 5.02 TeV (right). The pPb results obtained with particle $c$ in Pb-going (solid markers) and p-going (open markers) sides are shown separately. The SS and OS two-particle correlators are denoted by different markers for both pPb and PbPb collisions. Statistical and systematic uncertainties are indicated by the error bars and shaded regions, respectively. |
png pdf |
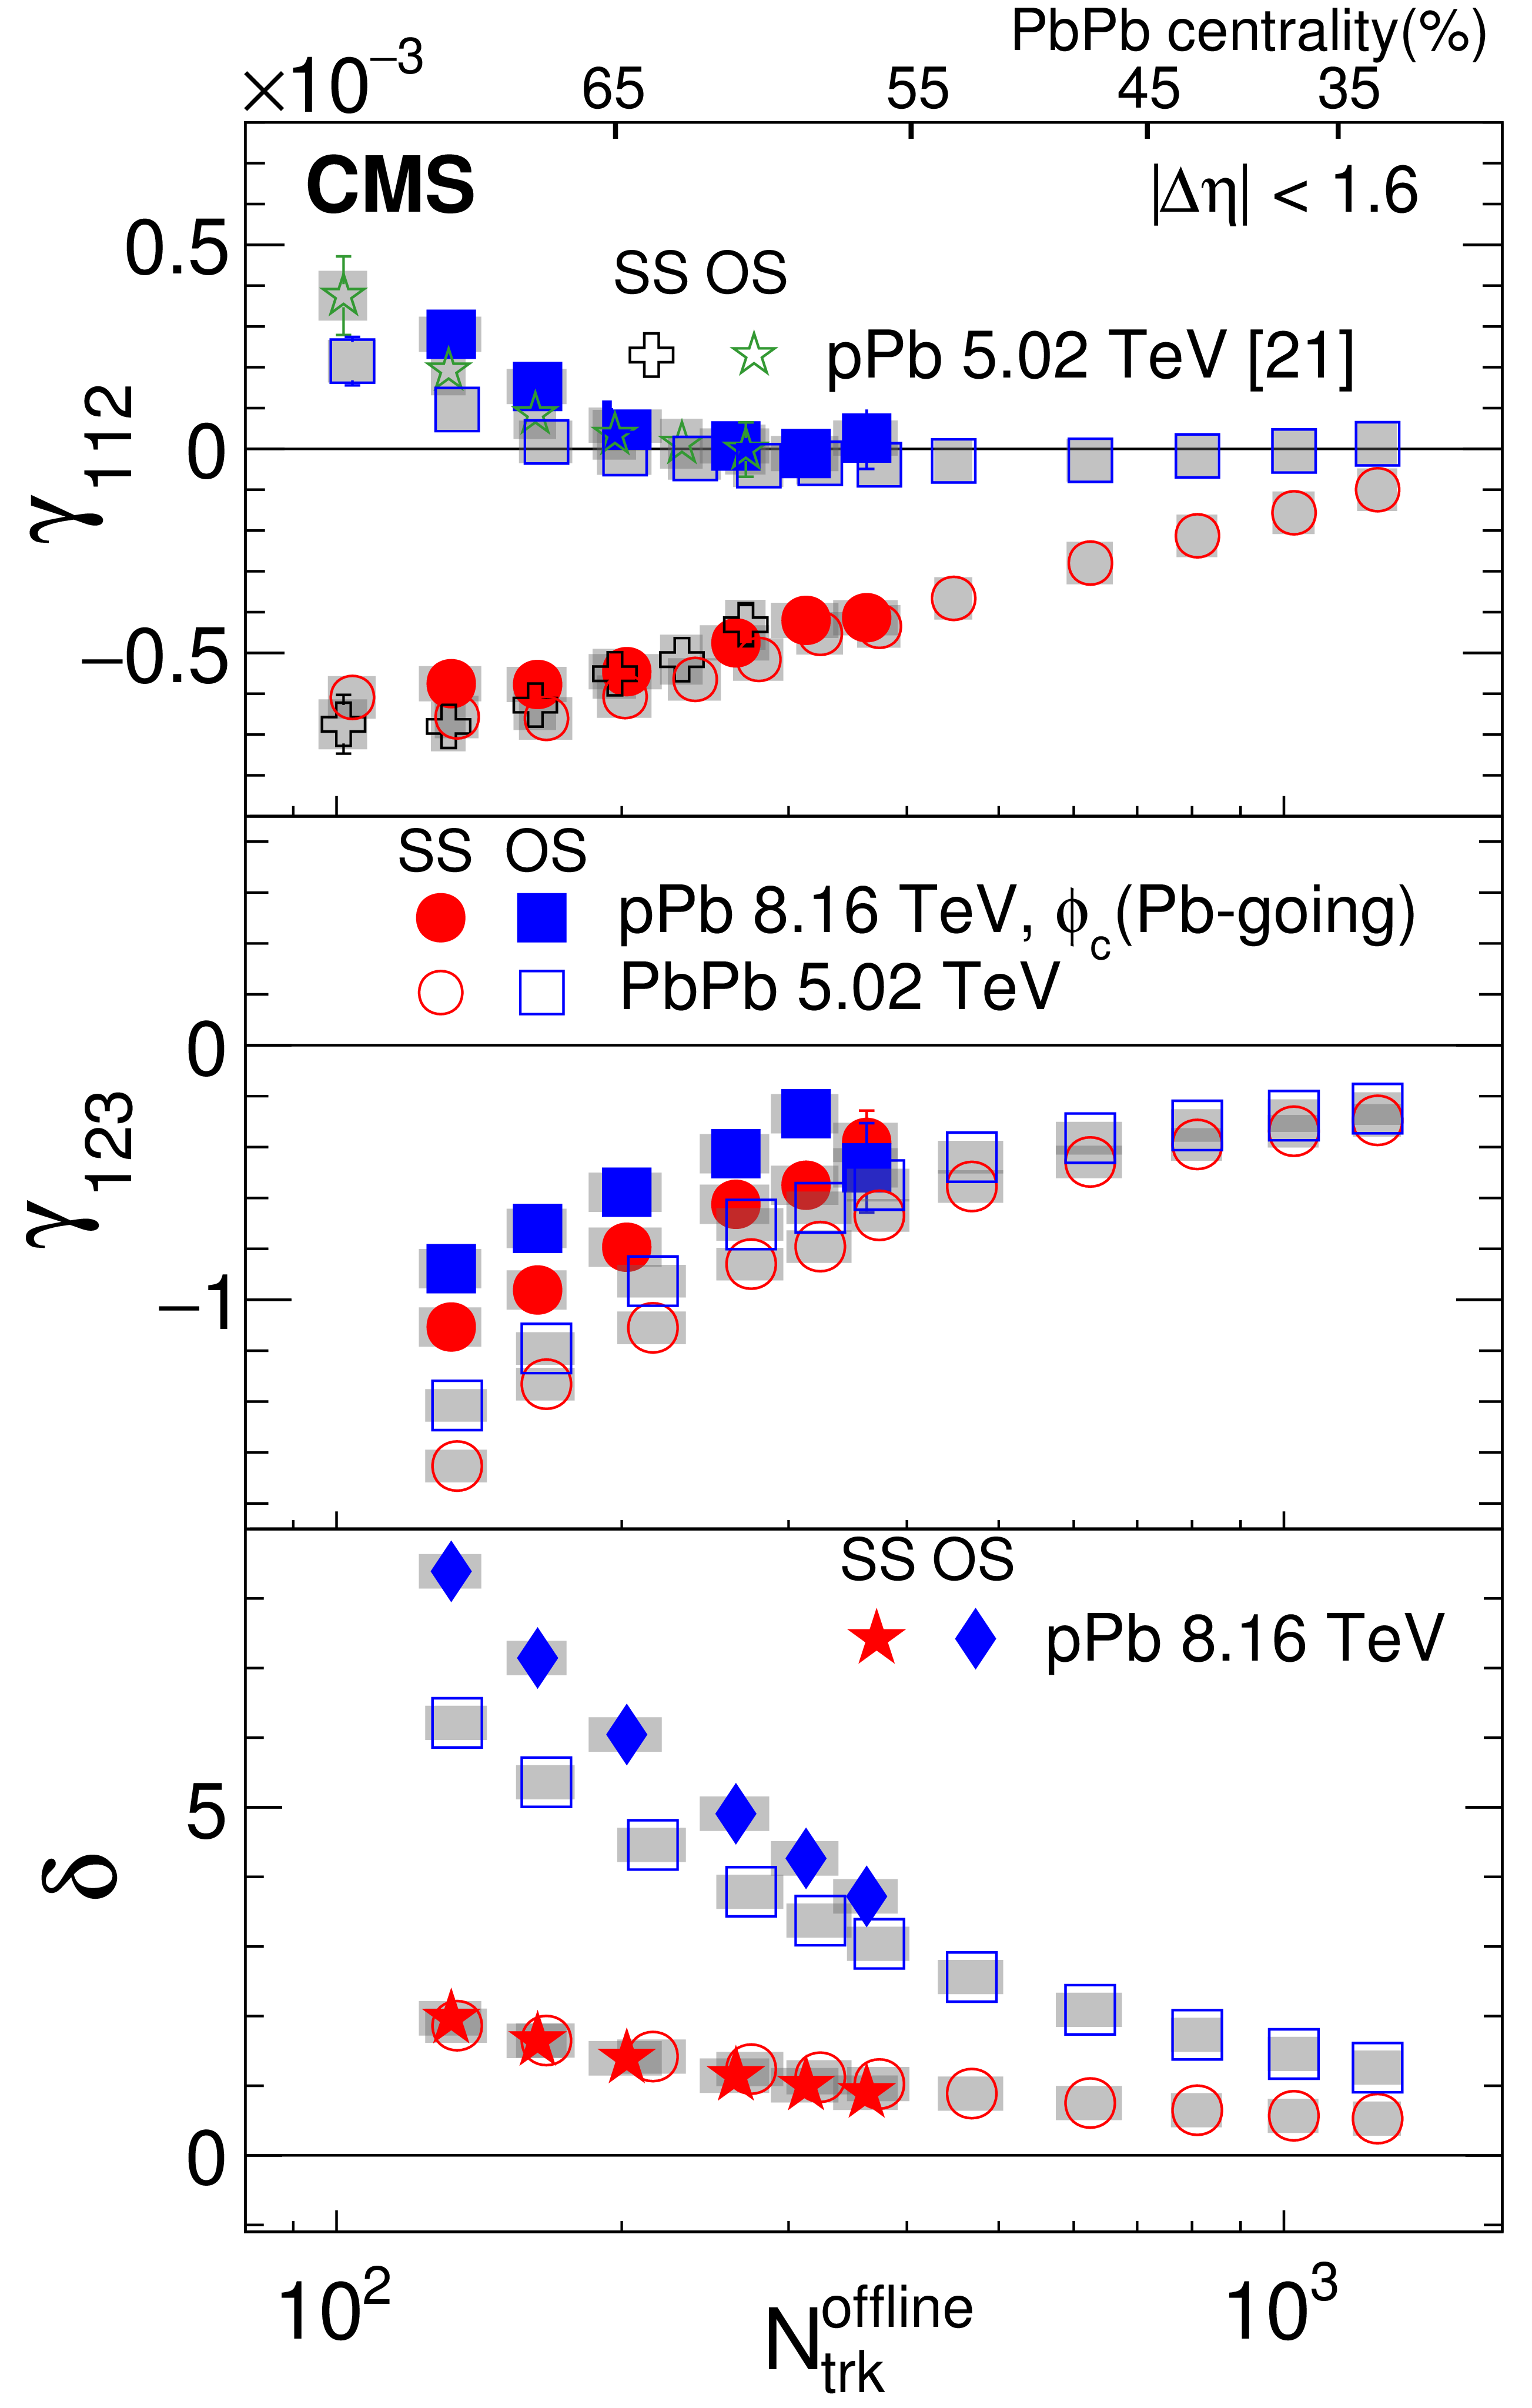
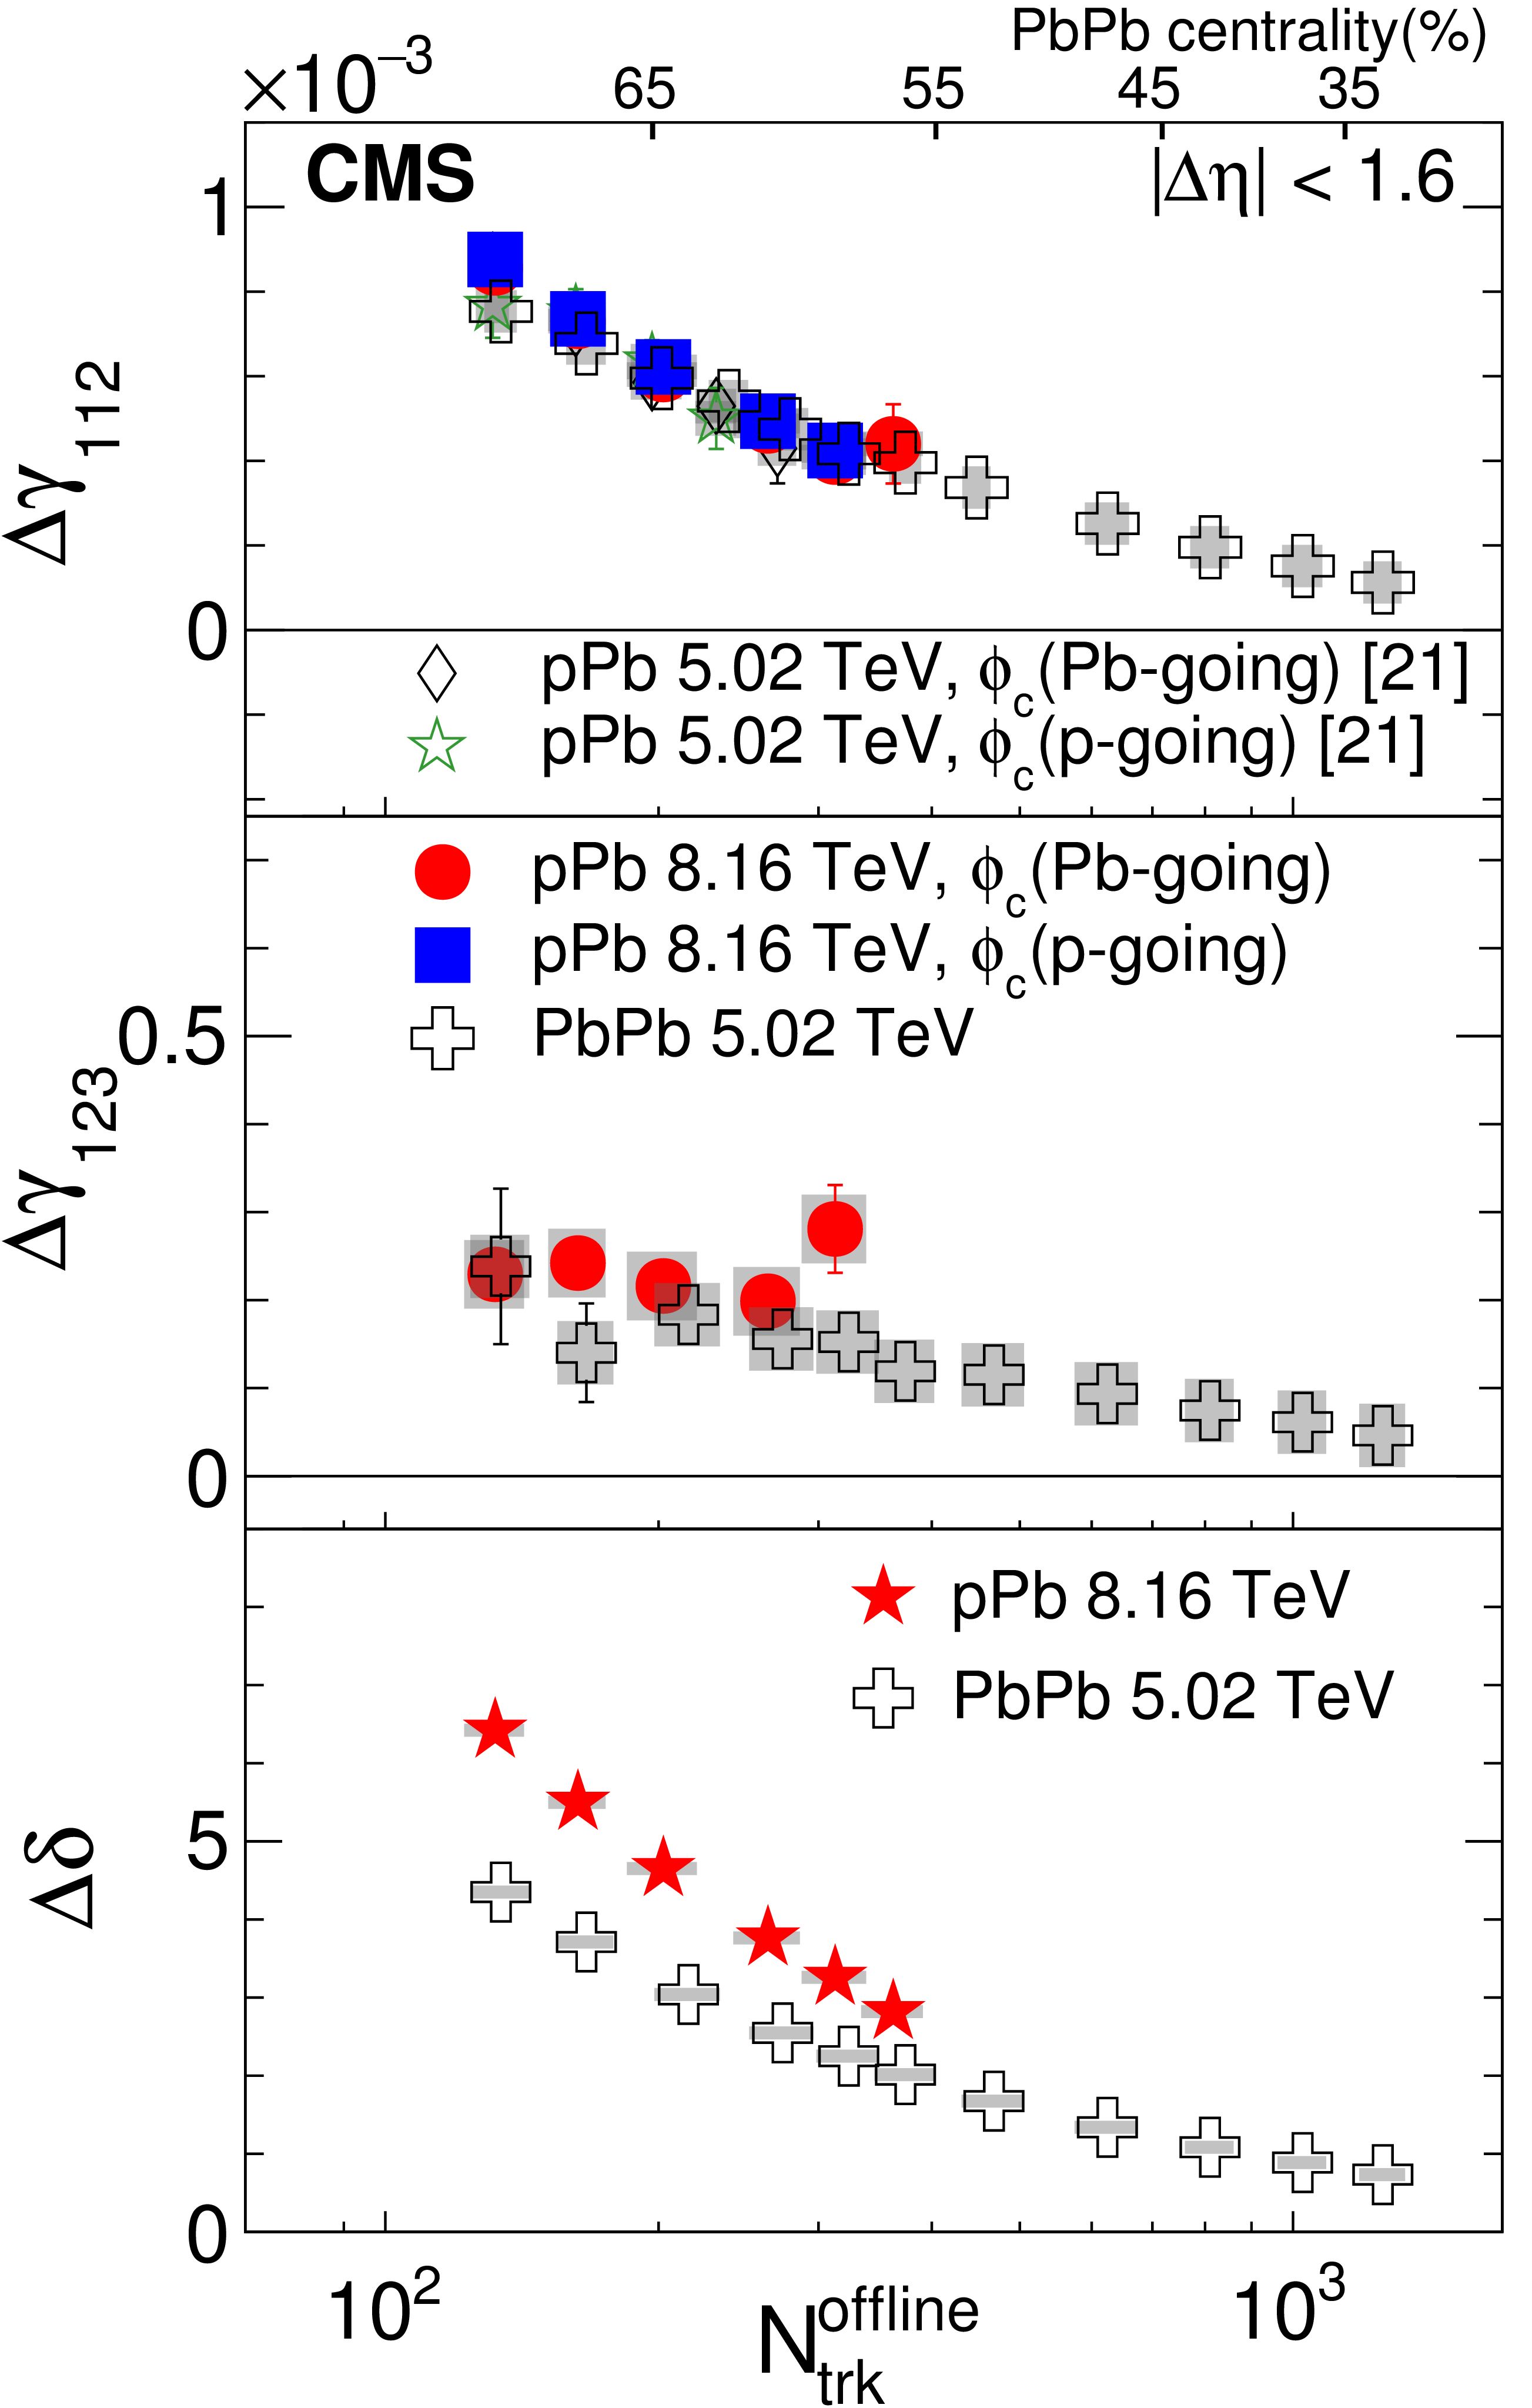
Figure 6:
The SS and OS three-particle correlators, $\gamma _{112}$ (upper) and $\gamma _{123}$ (middle), and two-particle correlator, $\delta $ (lower), averaged over $ {| {\Delta \eta } | }<$ 1.6 as a function of $ {N_\text {trk}^\text {offline}} $ in pPb collisions at $ {\sqrt {{s_{_{\mathrm {NN}}}}}} = $ 8.16 TeV and PbPb collisions at 5.02 TeV. The SS and OS two-particle correlators are denoted by different markers for pPb collisions. The results of $\gamma _{112}$ for pPb collisions at 5.02 TeV from Ref. [21], are also shown for comparison. Statistical and systematic uncertainties are indicated by the error bars and shaded regions, respectively. |
png pdf |
Figure 7:
The difference of the OS and SS three-particle correlators, $\gamma _{112}$ (upper) and $\gamma _{123}$ (middle), and two-particle correlator, $\delta $ (lower) as functions of $\Delta \eta $(left), $\Delta {p_{\mathrm {T}}} $(middle), and $ {\overline {p}_\mathrm {T}} $ (right) for 185 $ \leq {N_\text {trk}^\text {offline}} < $ 250 in pPb collisions at $ {\sqrt {{s_{_{\mathrm {NN}}}}}} = $ 8.16 TeV and PbPb collisions at 5.02 TeV. The $\Delta \delta $ correlator is denoted by a different marker for pPb collisions. The pPb results are obtained with particle $c$ from Pb- and p-going sides separately. Statistical and systematic uncertainties are indicated by the error bars and shaded regions, respectively. |
png pdf |
Figure 8:
The difference of the OS and SS three-particle correlators, $\gamma _{112}$ (upper) and $\gamma _{123}$ (middle), and two-particle correlator, $\delta $ (lower), averaged over $ {| {\Delta \eta } | }<$ 1.6 as a function of $ {N_\text {trk}^\text {offline}} $ in pPb collisions at $ {\sqrt {{s_{_{\mathrm {NN}}}}}} = $ 8.16 TeV and PbPb collisions at 5.02 TeV. The pPb results are obtained with particle $c$ from Pb- and p-going sides separately. The $\Delta \delta $ correlator is denoted by a different marker for pPb collisions. The results of $\gamma _{112}$ for pPb collisions at 5.02 TeV from Ref. [21], are also shown for comparison. Statistical and systematic uncertainties are indicated by the error bars and shaded regions, respectively. |
png pdf |
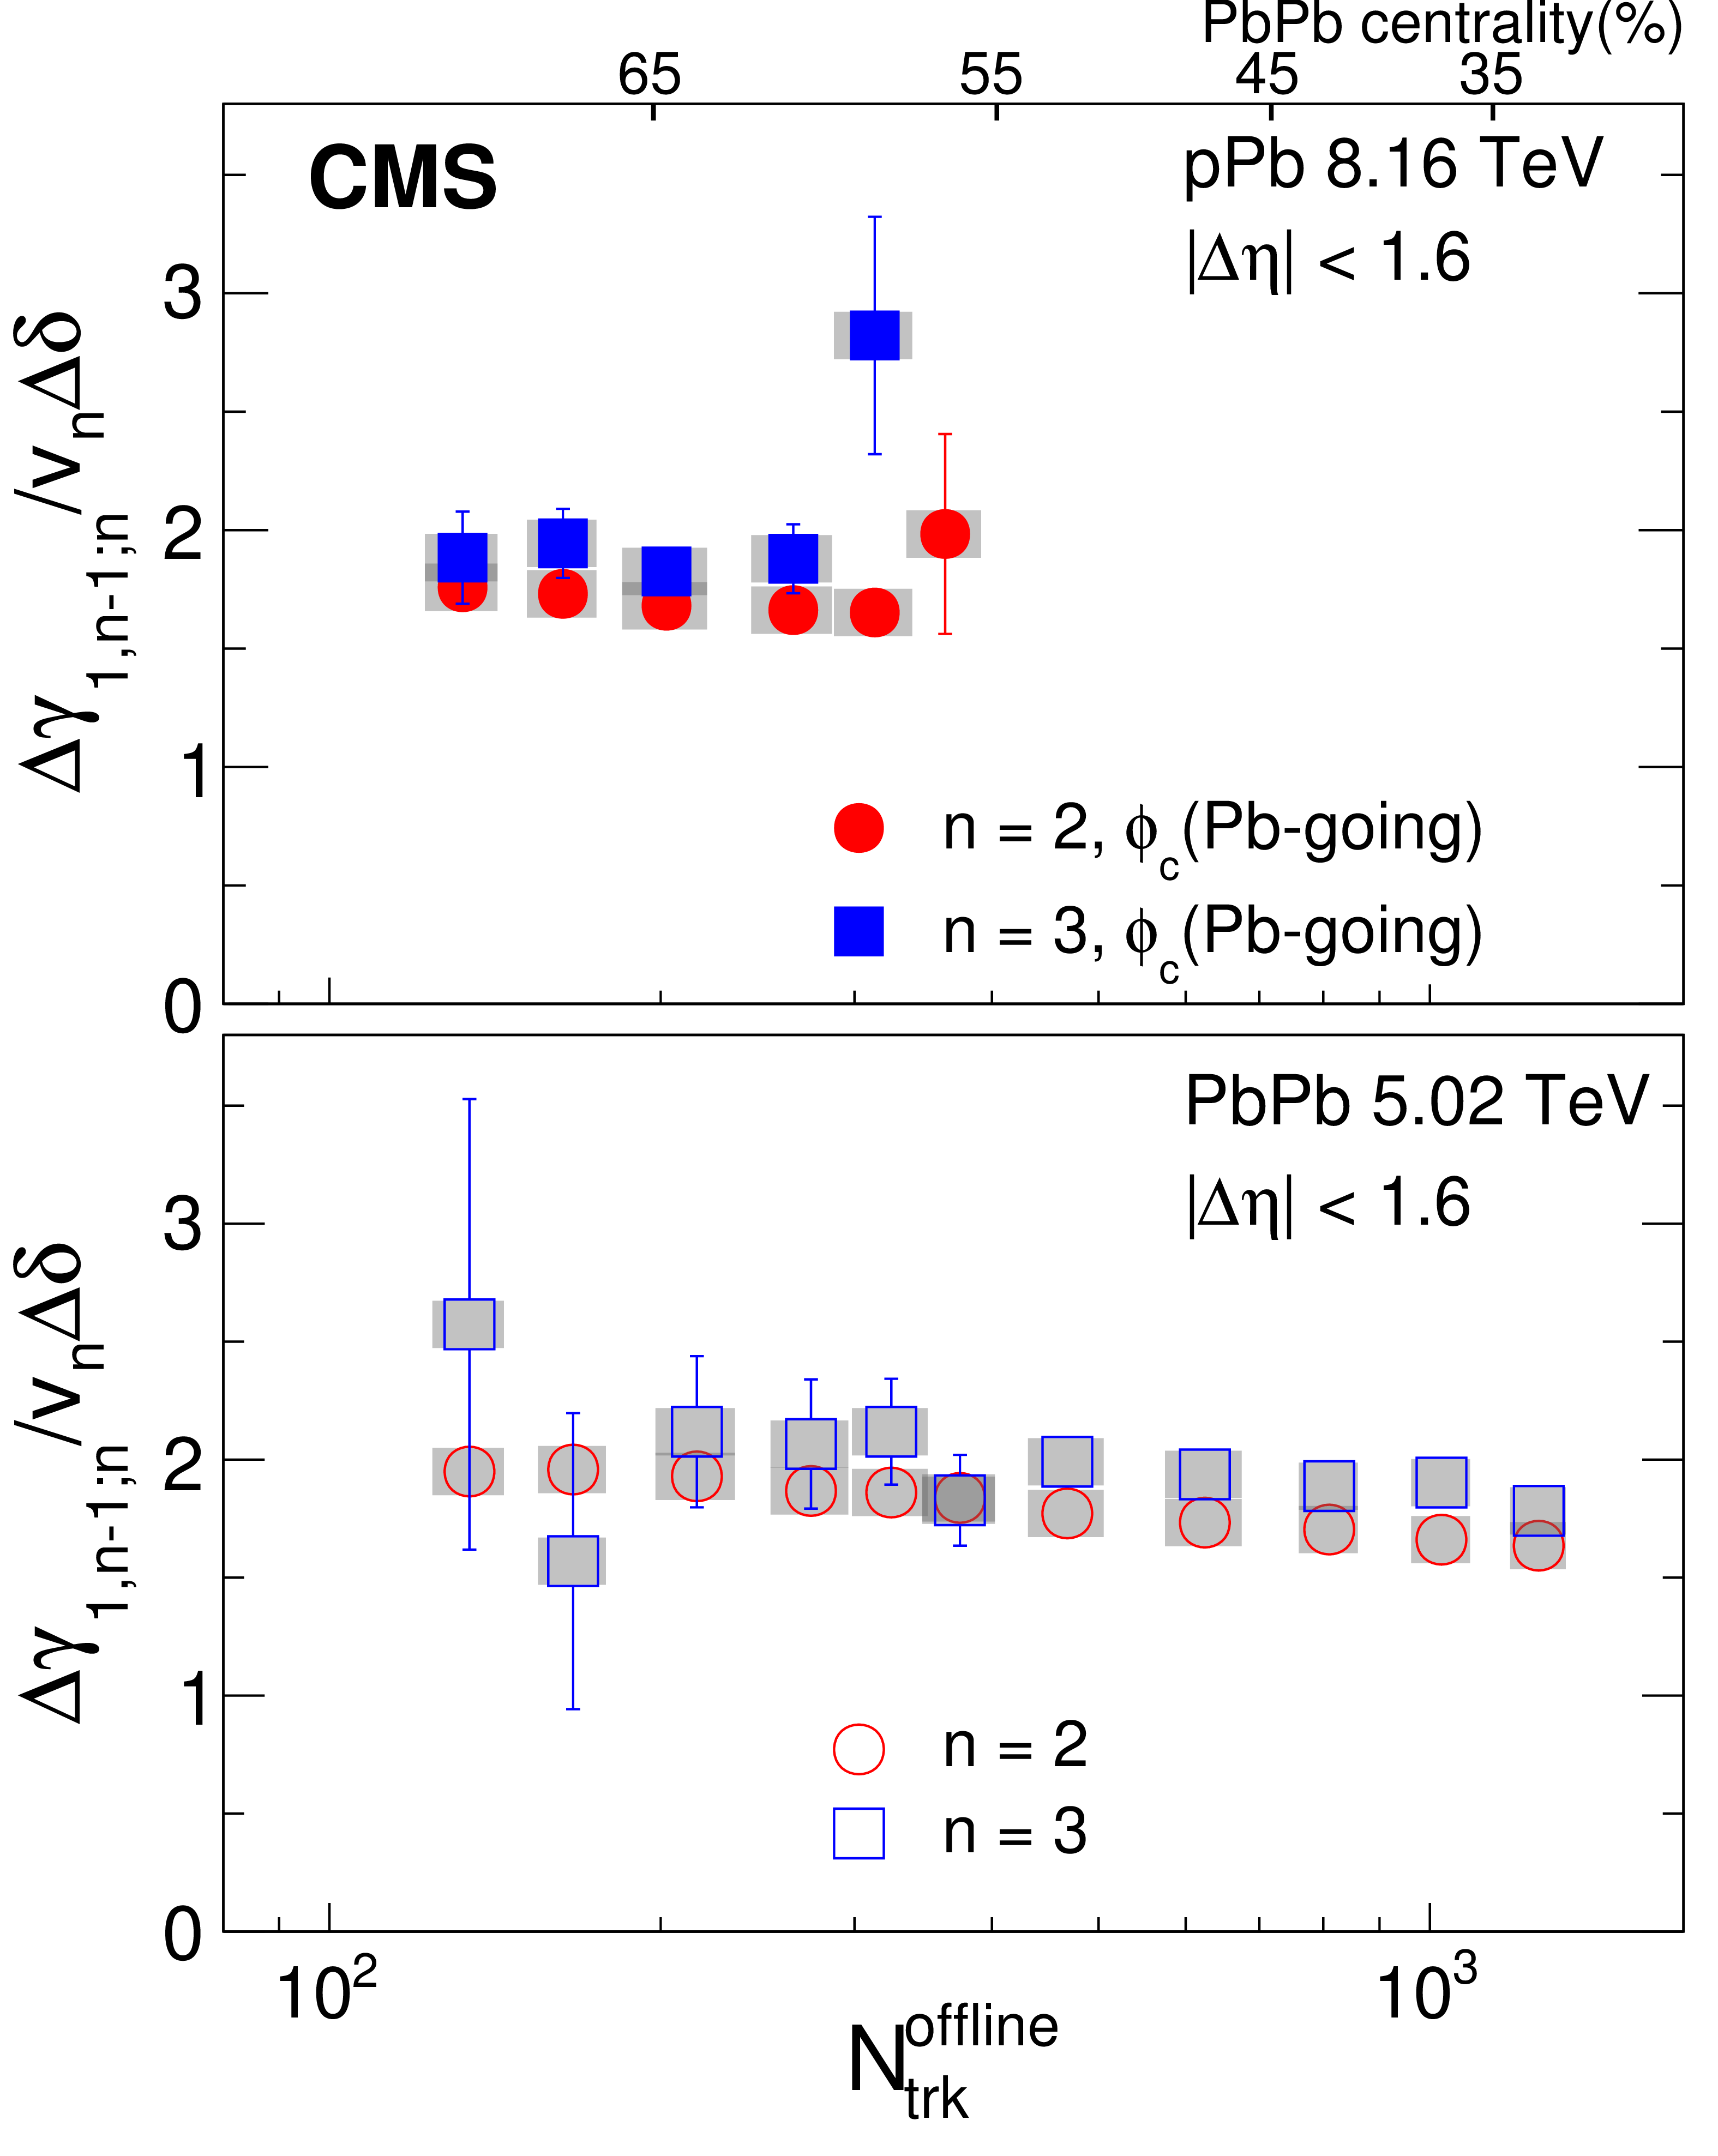
Figure 9:
The ratio of $\Delta \gamma _{112}$ and $\Delta \gamma _{123}$ to the product of $v_{n}$ and $\delta $, averaged over $ {| {\Delta \eta } | }<$ 1.6, in pPb collisions for the Pb-going direction at $ {\sqrt {{s_{_{\mathrm {NN}}}}}} = $ 8.16 TeV (upper) and PbPb collisions at 5.02 TeV (lower). Statistical and systematic uncertainties are indicated by the error bars and shaded regions, respectively. |
png pdf |
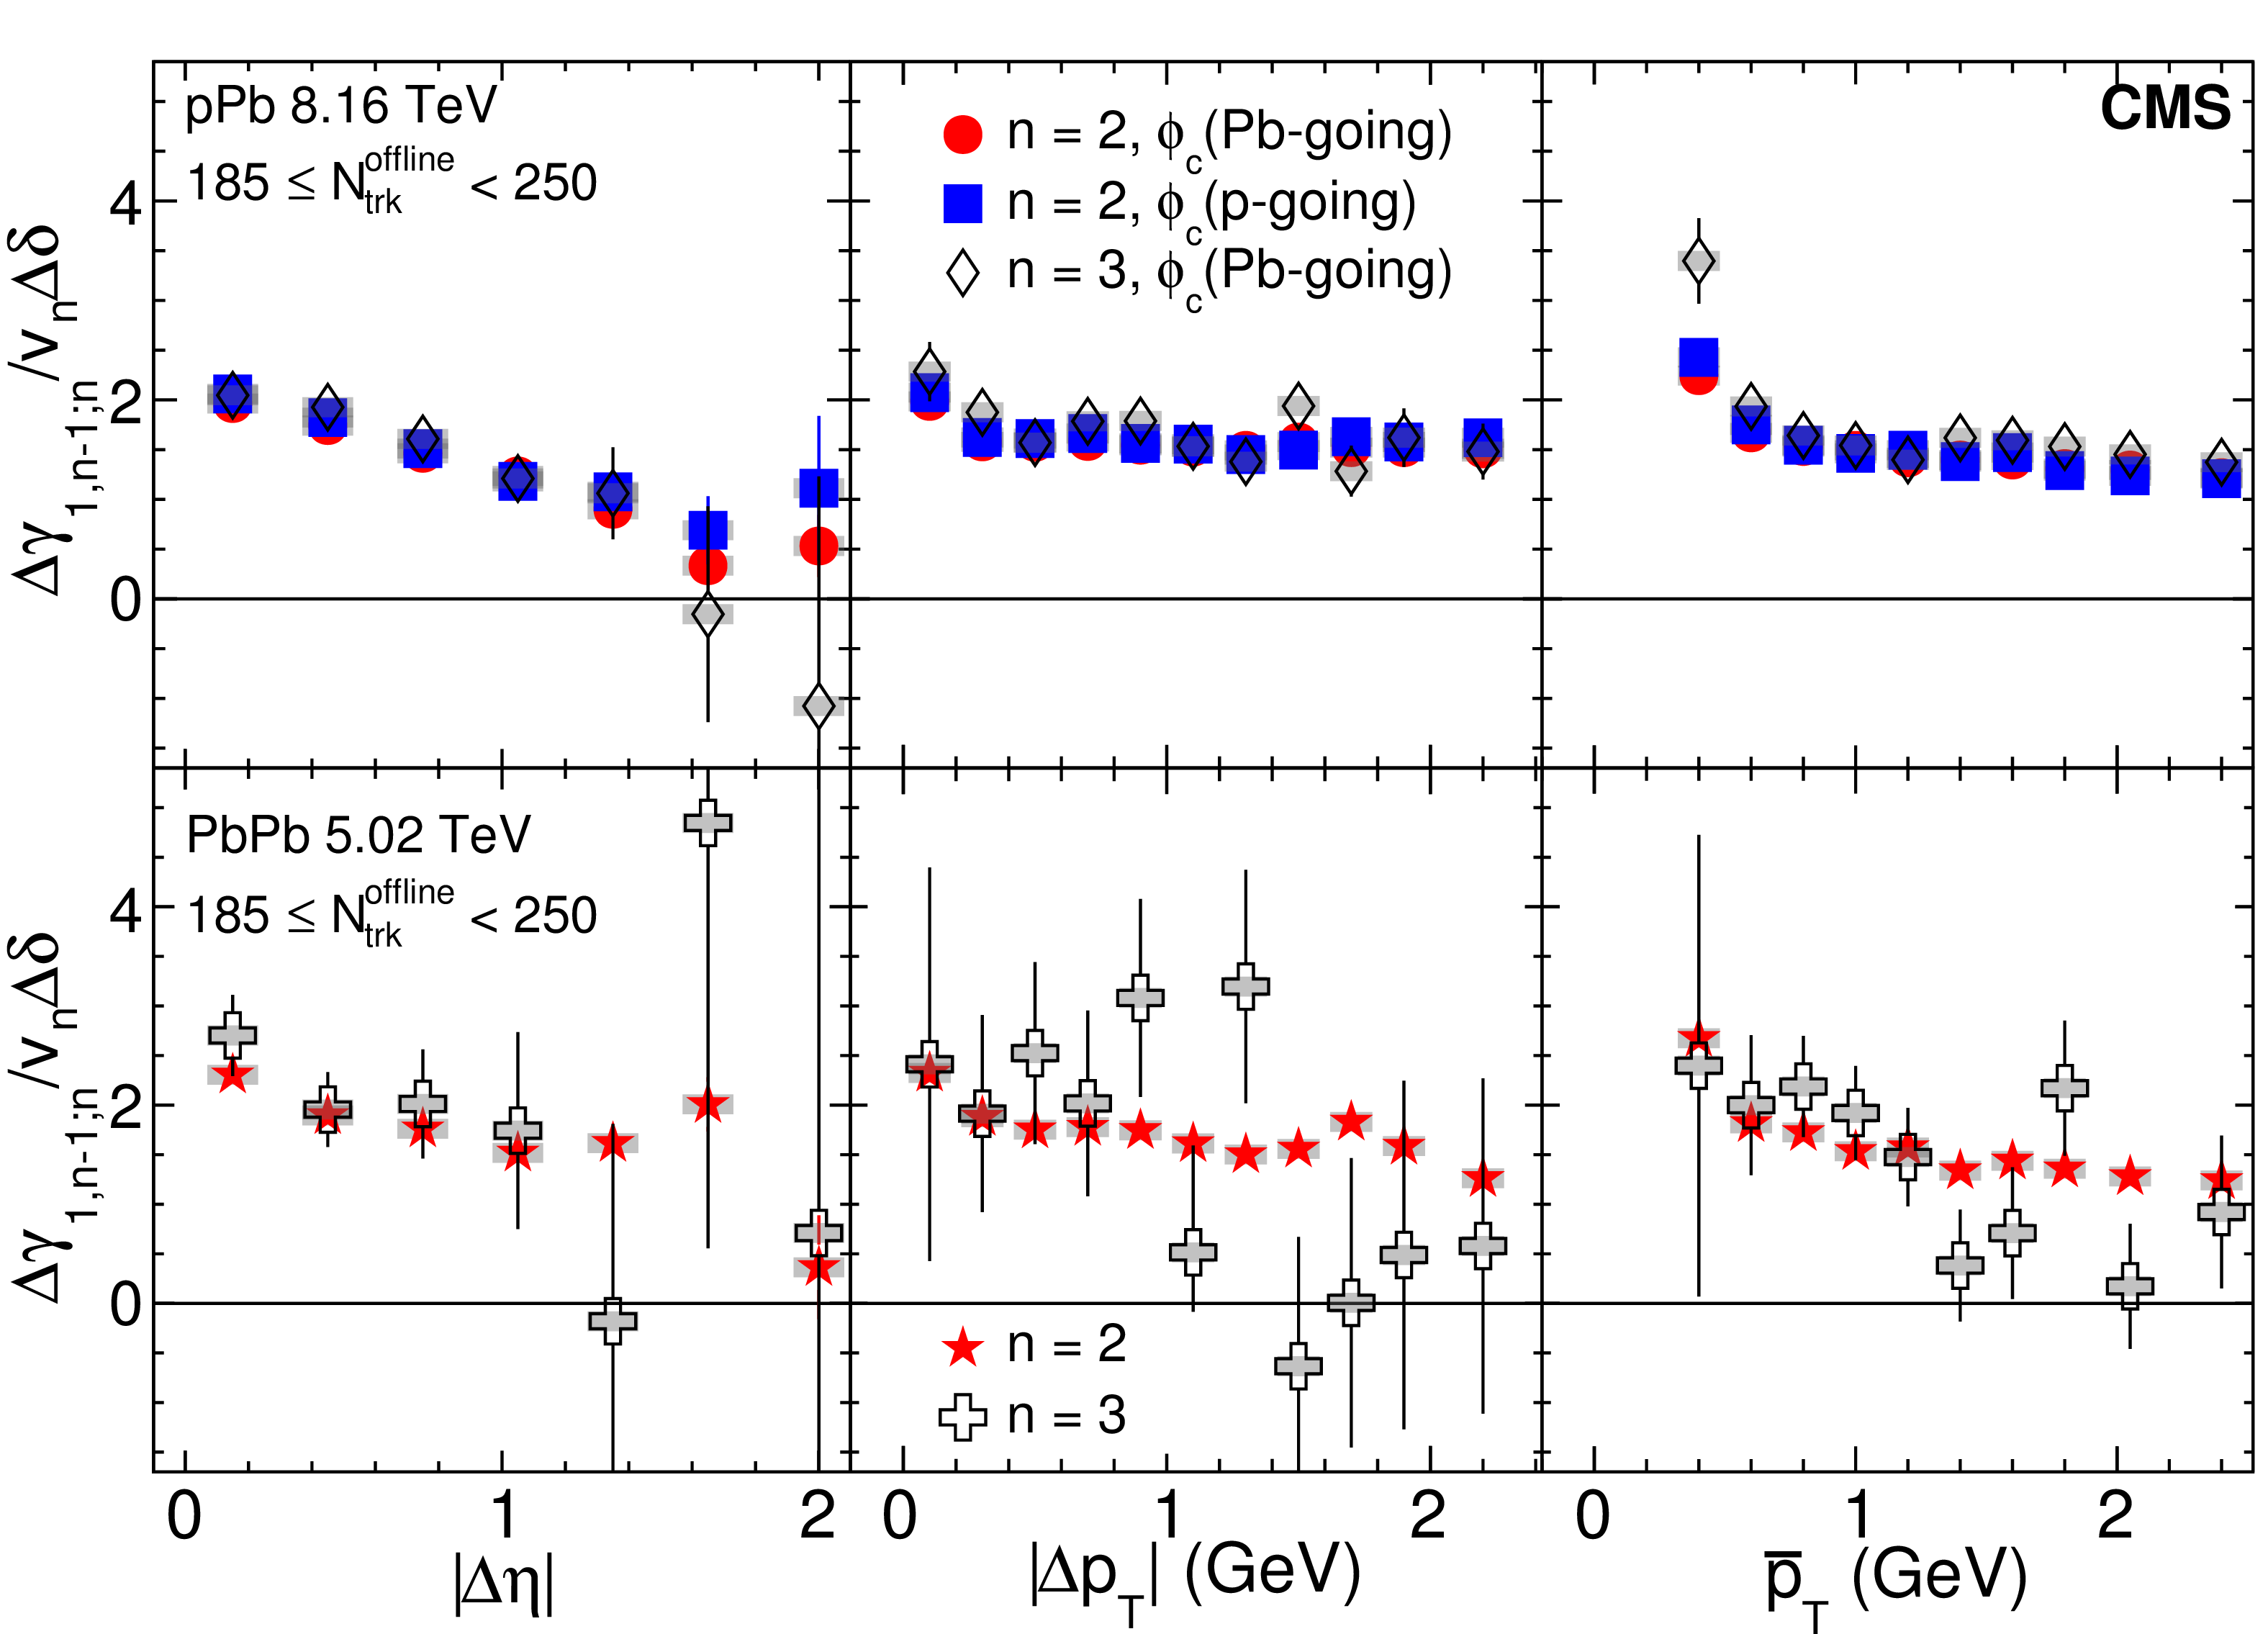
Figure 10:
The ratio of $\Delta \gamma _{112}$ and $\Delta \gamma _{123}$ to the product of $v_{n}$ and $\delta $, as functions of $\Delta \eta $ (left), $\Delta {p_{\mathrm {T}}} $ (middle), and $ {\overline {p}_\mathrm {T}} $ (right) for 185 $ \leq {N_\text {trk}^\text {offline}} < $ 250 in pPb collisions at $ {\sqrt {{s_{_{\mathrm {NN}}}}}} = $ 8.16 TeV (upper) and PbPb collisions at 5.02 TeV (lower). Statistical and systematic uncertainties are indicated by the error bars and shaded regions, respectively. |

png pdf |
Figure 11:
The SS and OS three-particle correlators, $\gamma _{112}$, averaged over $ {| {\Delta \eta } | }<$ 1.6 as a function of $v_2$ evaluated in each $q_2$ class, for the multiplicity range 185 $ \leq {N_\text {trk}^\text {offline}} < $ 250 in pPb collisions at $ {\sqrt {{s_{_{\mathrm {NN}}}}}} = $ 8.16 TeV (left) and PbPb collisions at 5.02 TeV (right). The pPb results are obtained with particle $c$ from Pb- and p-going sides separately. Statistical and systematic uncertainties are indicated by the error bars and shaded regions, respectively. |
png pdf |
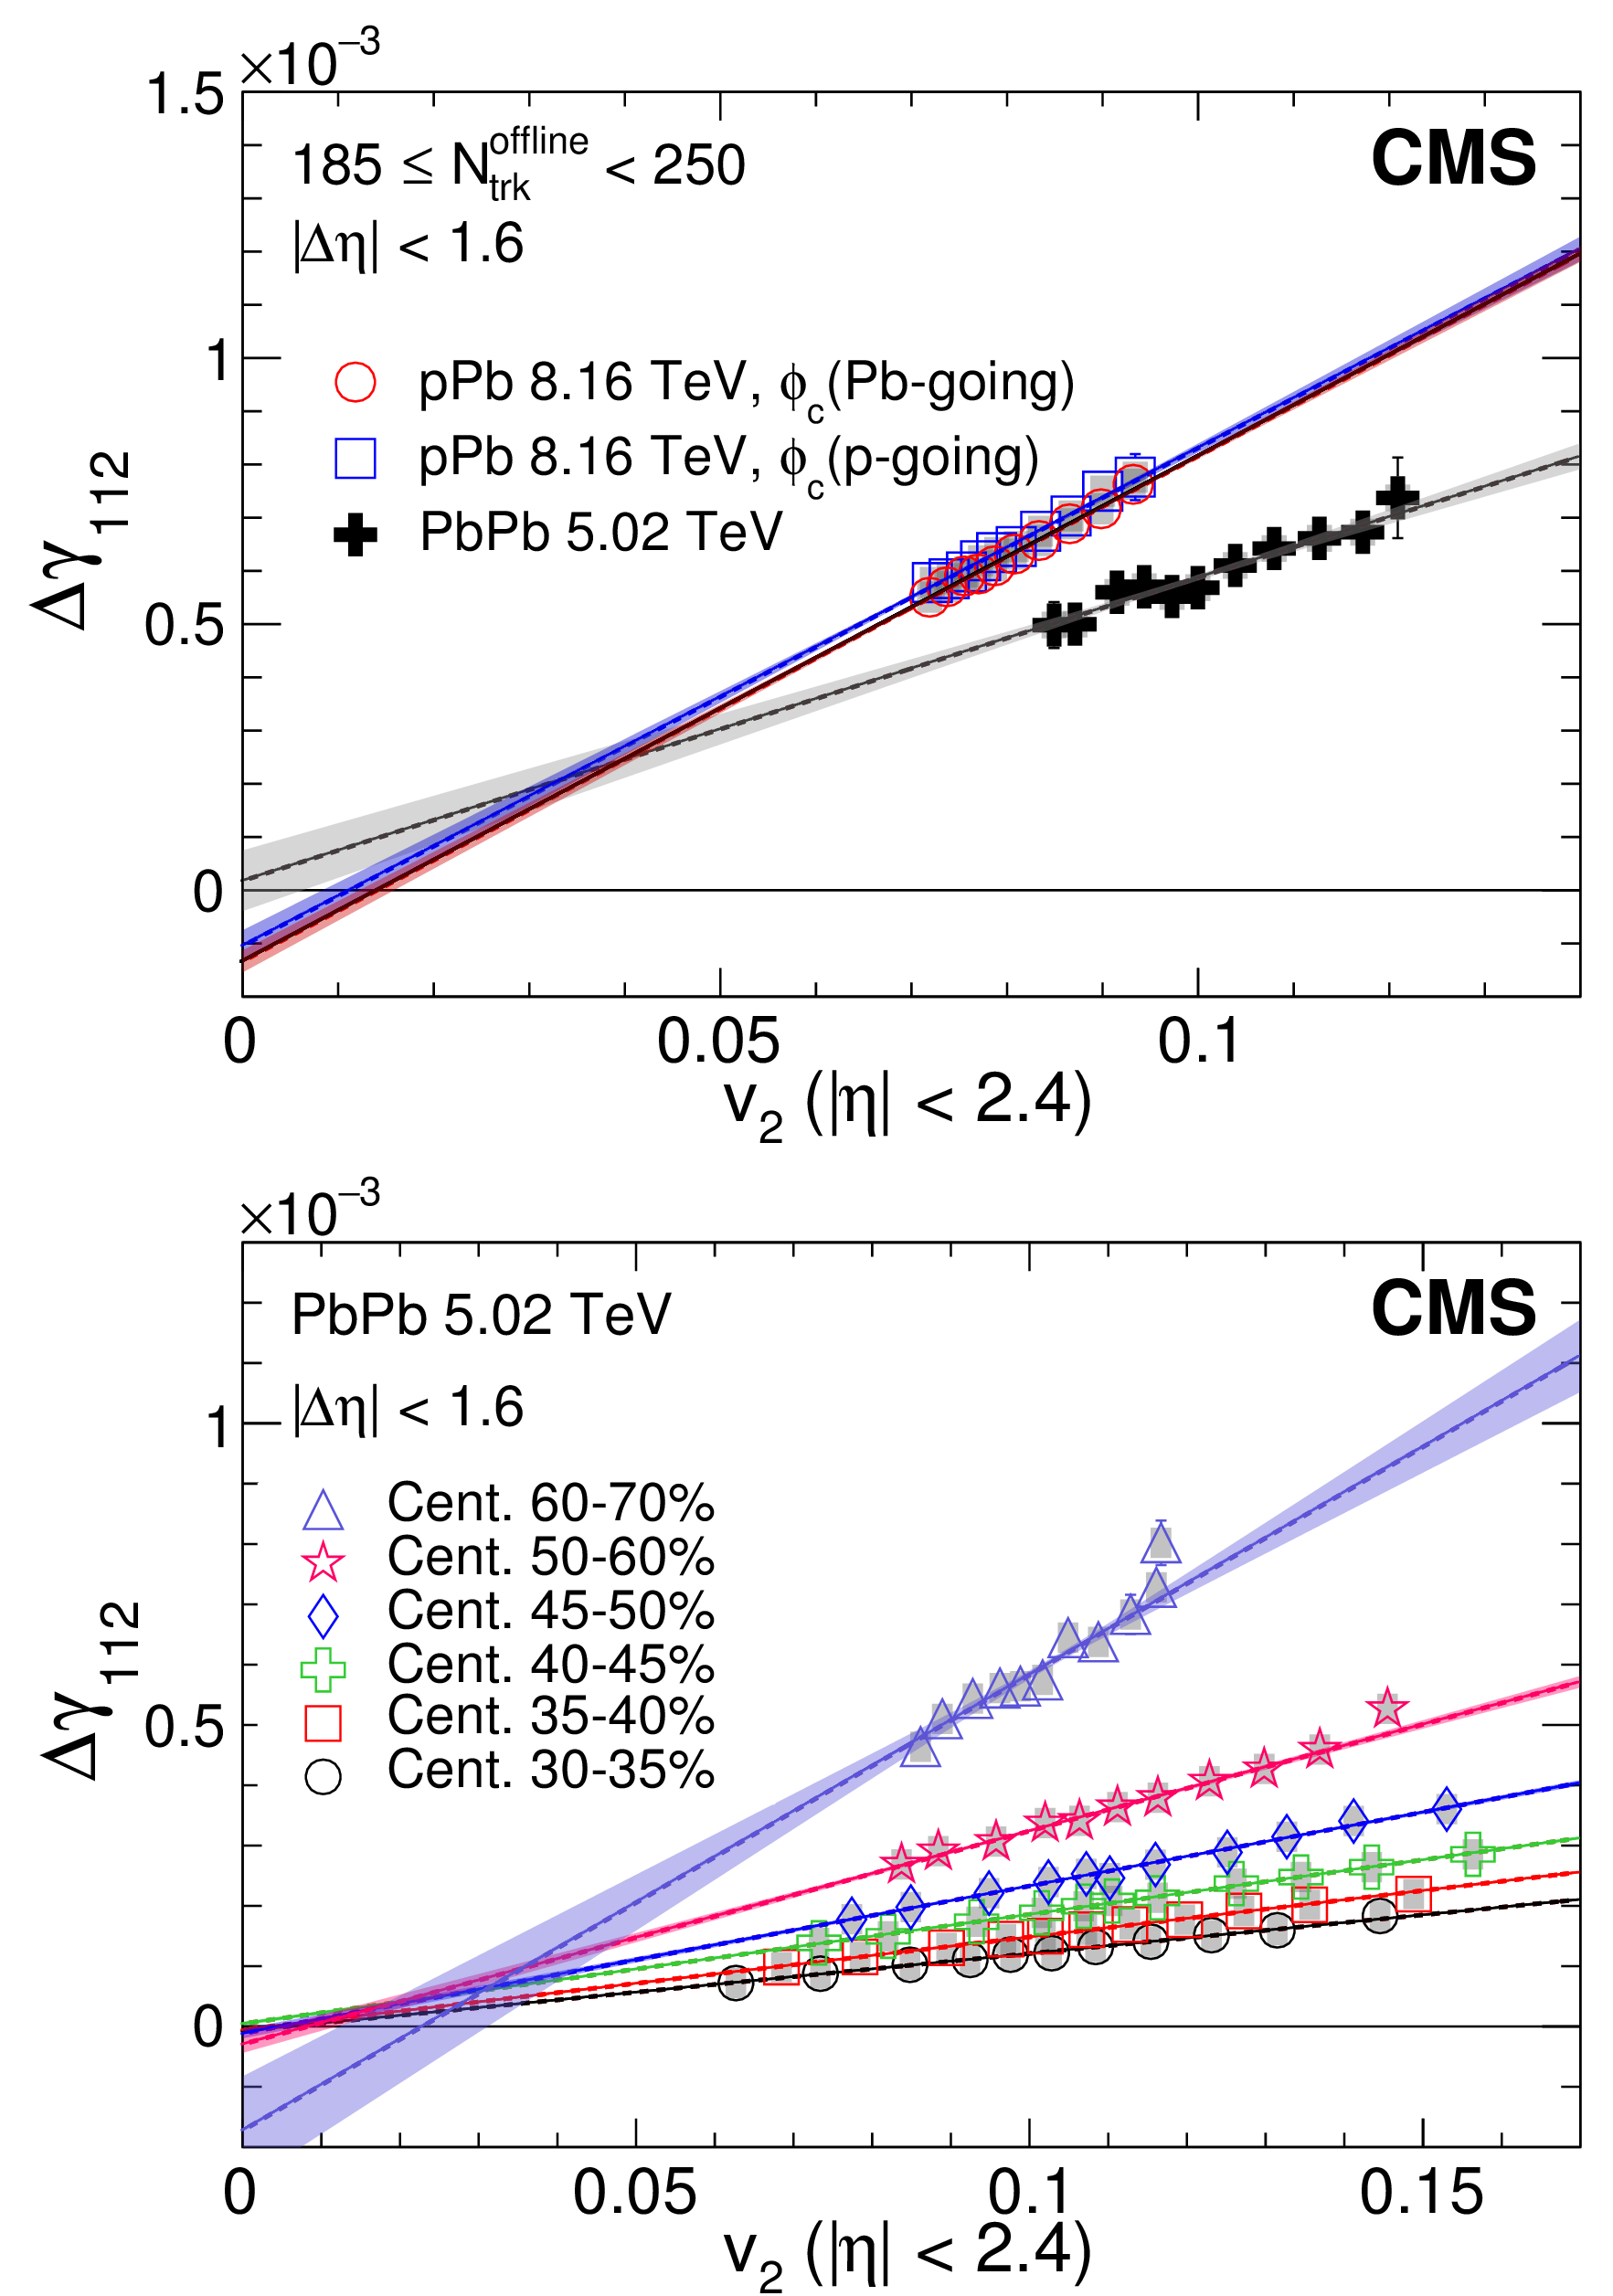
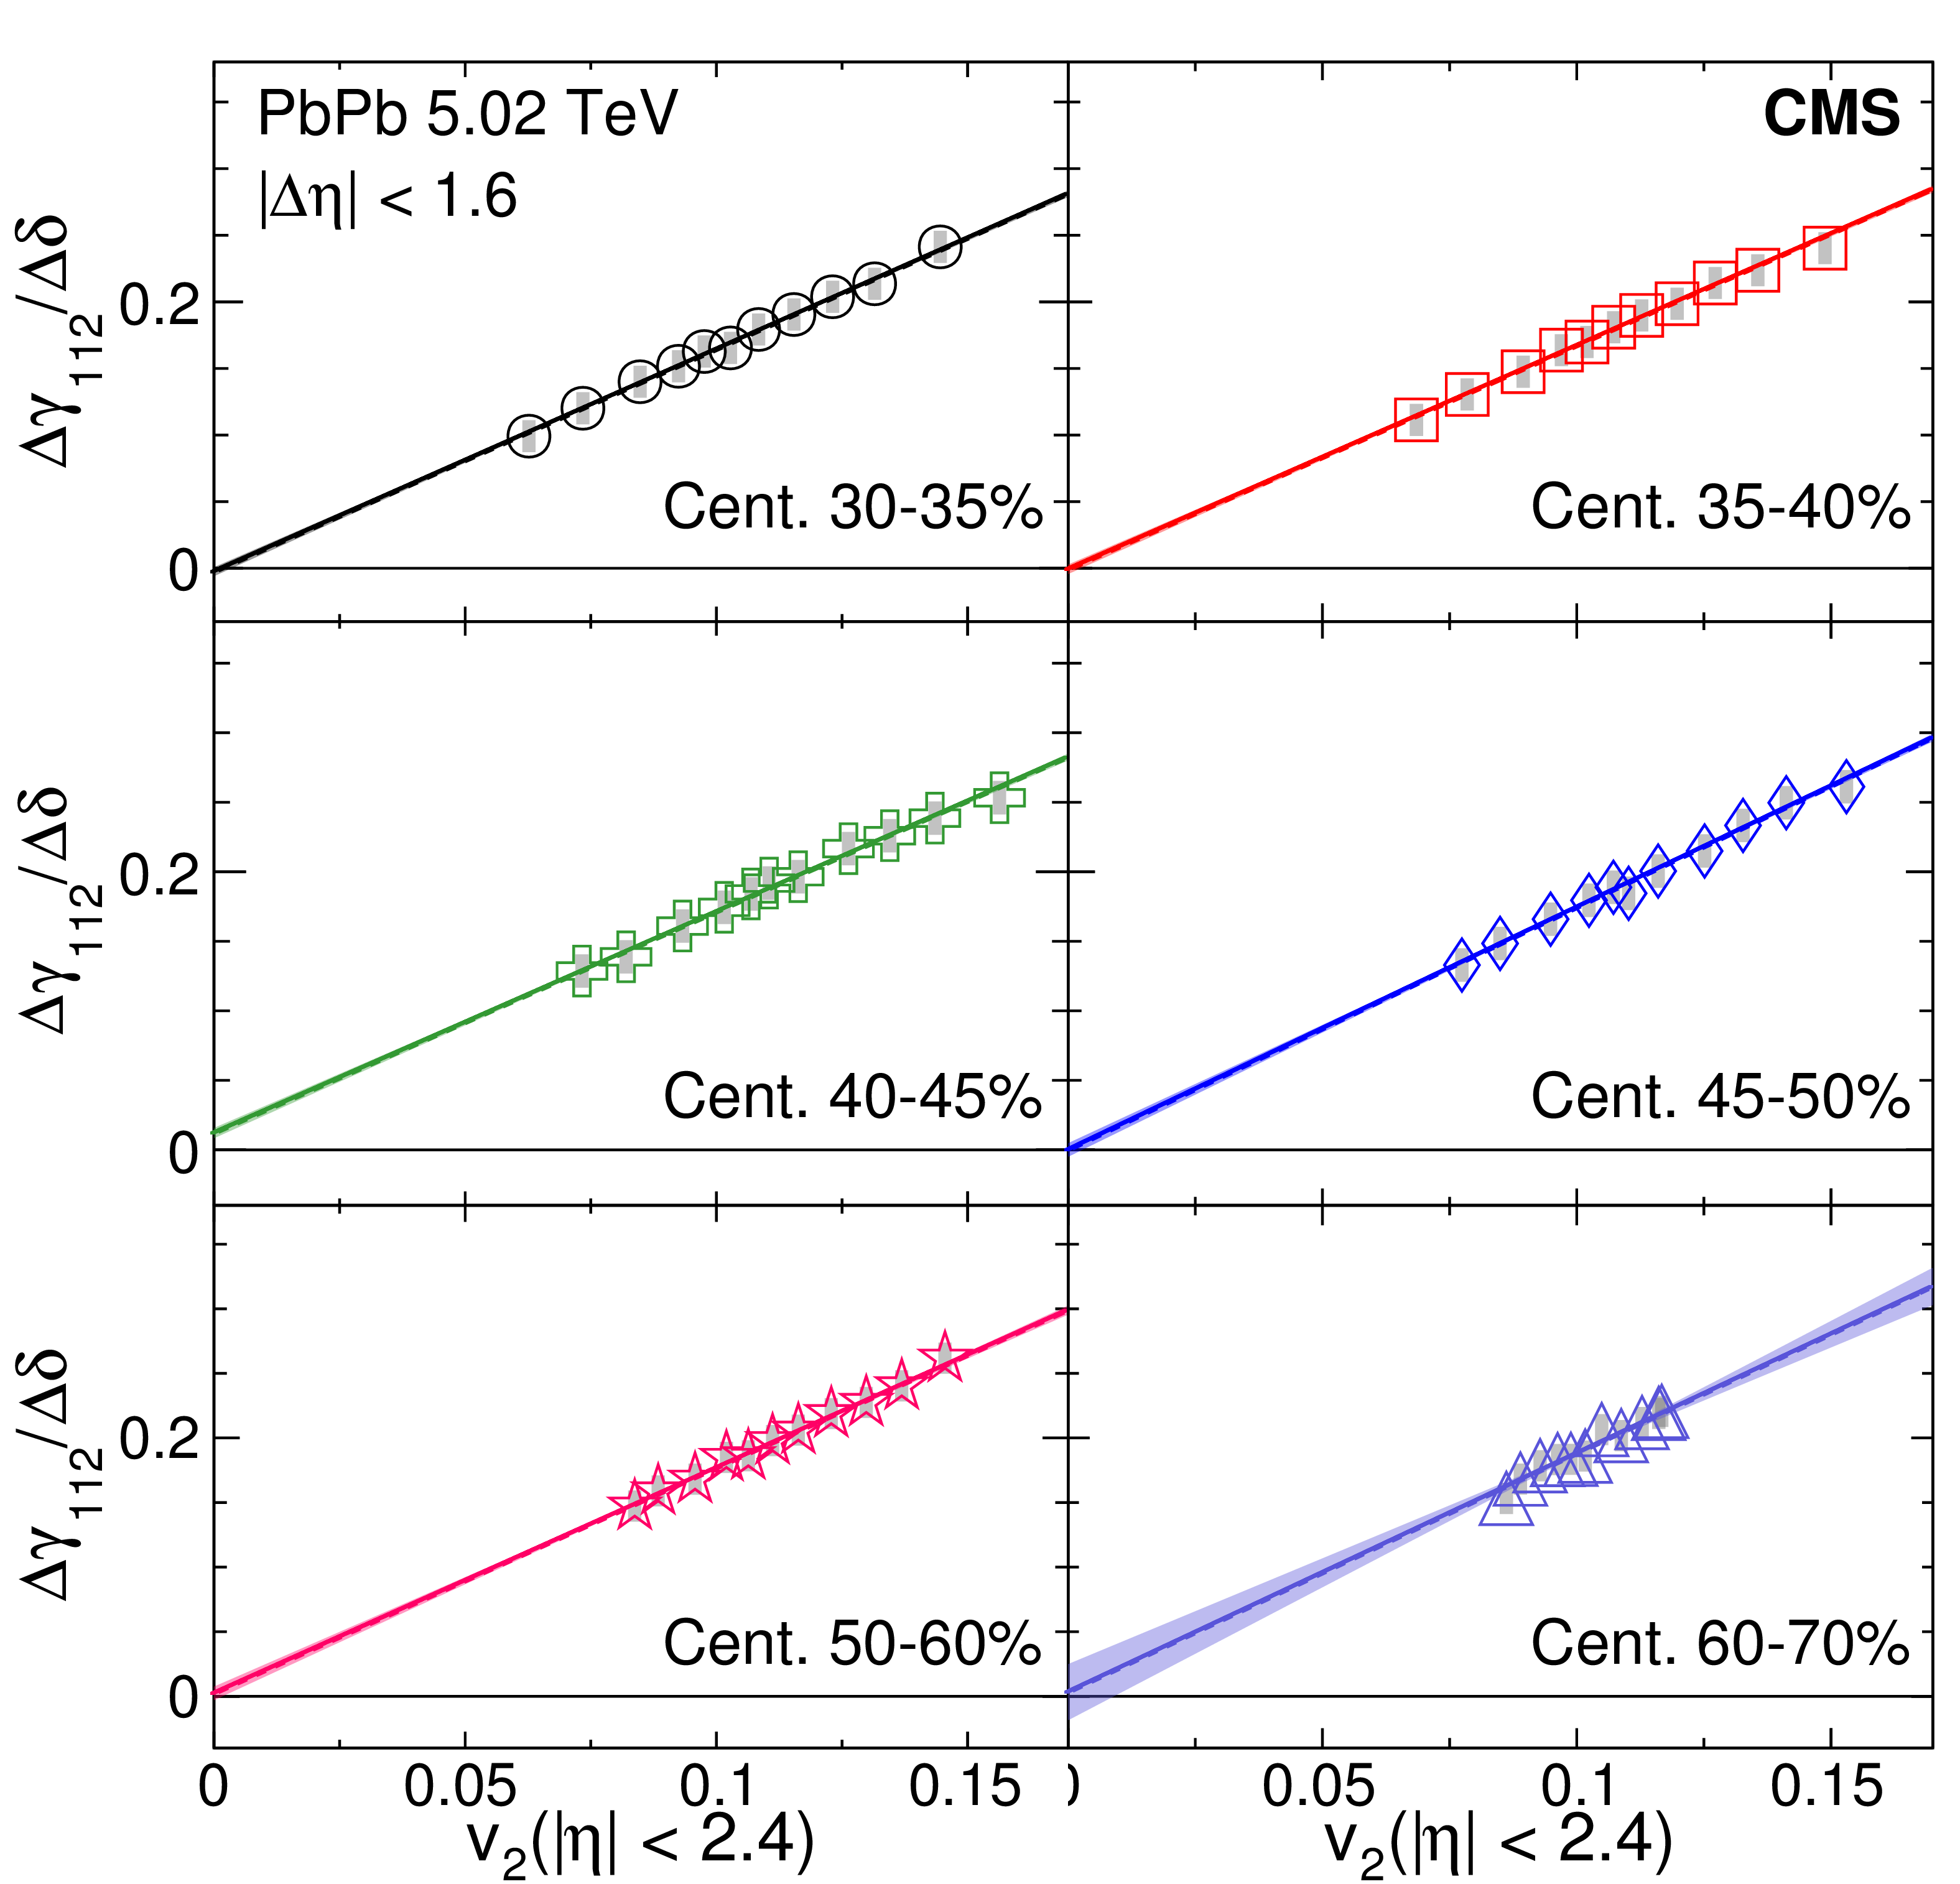
Figure 12:
The difference of the OS and SS three-particle correlators, $\gamma _{112}$, averaged over $ {| {\Delta \eta } | }<$ 1.6 as a function of $v_2$ evaluated in each $q_2$ class, for the multiplicity range 185 $ \leq {N_\text {trk}^\text {offline}} < $ 250 in pPb collisions at $ {\sqrt {{s_{_{\mathrm {NN}}}}}} = $ 8.16 TeV and PbPb collisions at 5.02 TeV (upper), and for different centrality classes in PbPb collisions at 5.02 TeV (lower). Statistical and systematic uncertainties are indicated by the error bars and shaded regions, respectively. A one standard deviation uncertainty from the fit is also shown. |
png pdf |
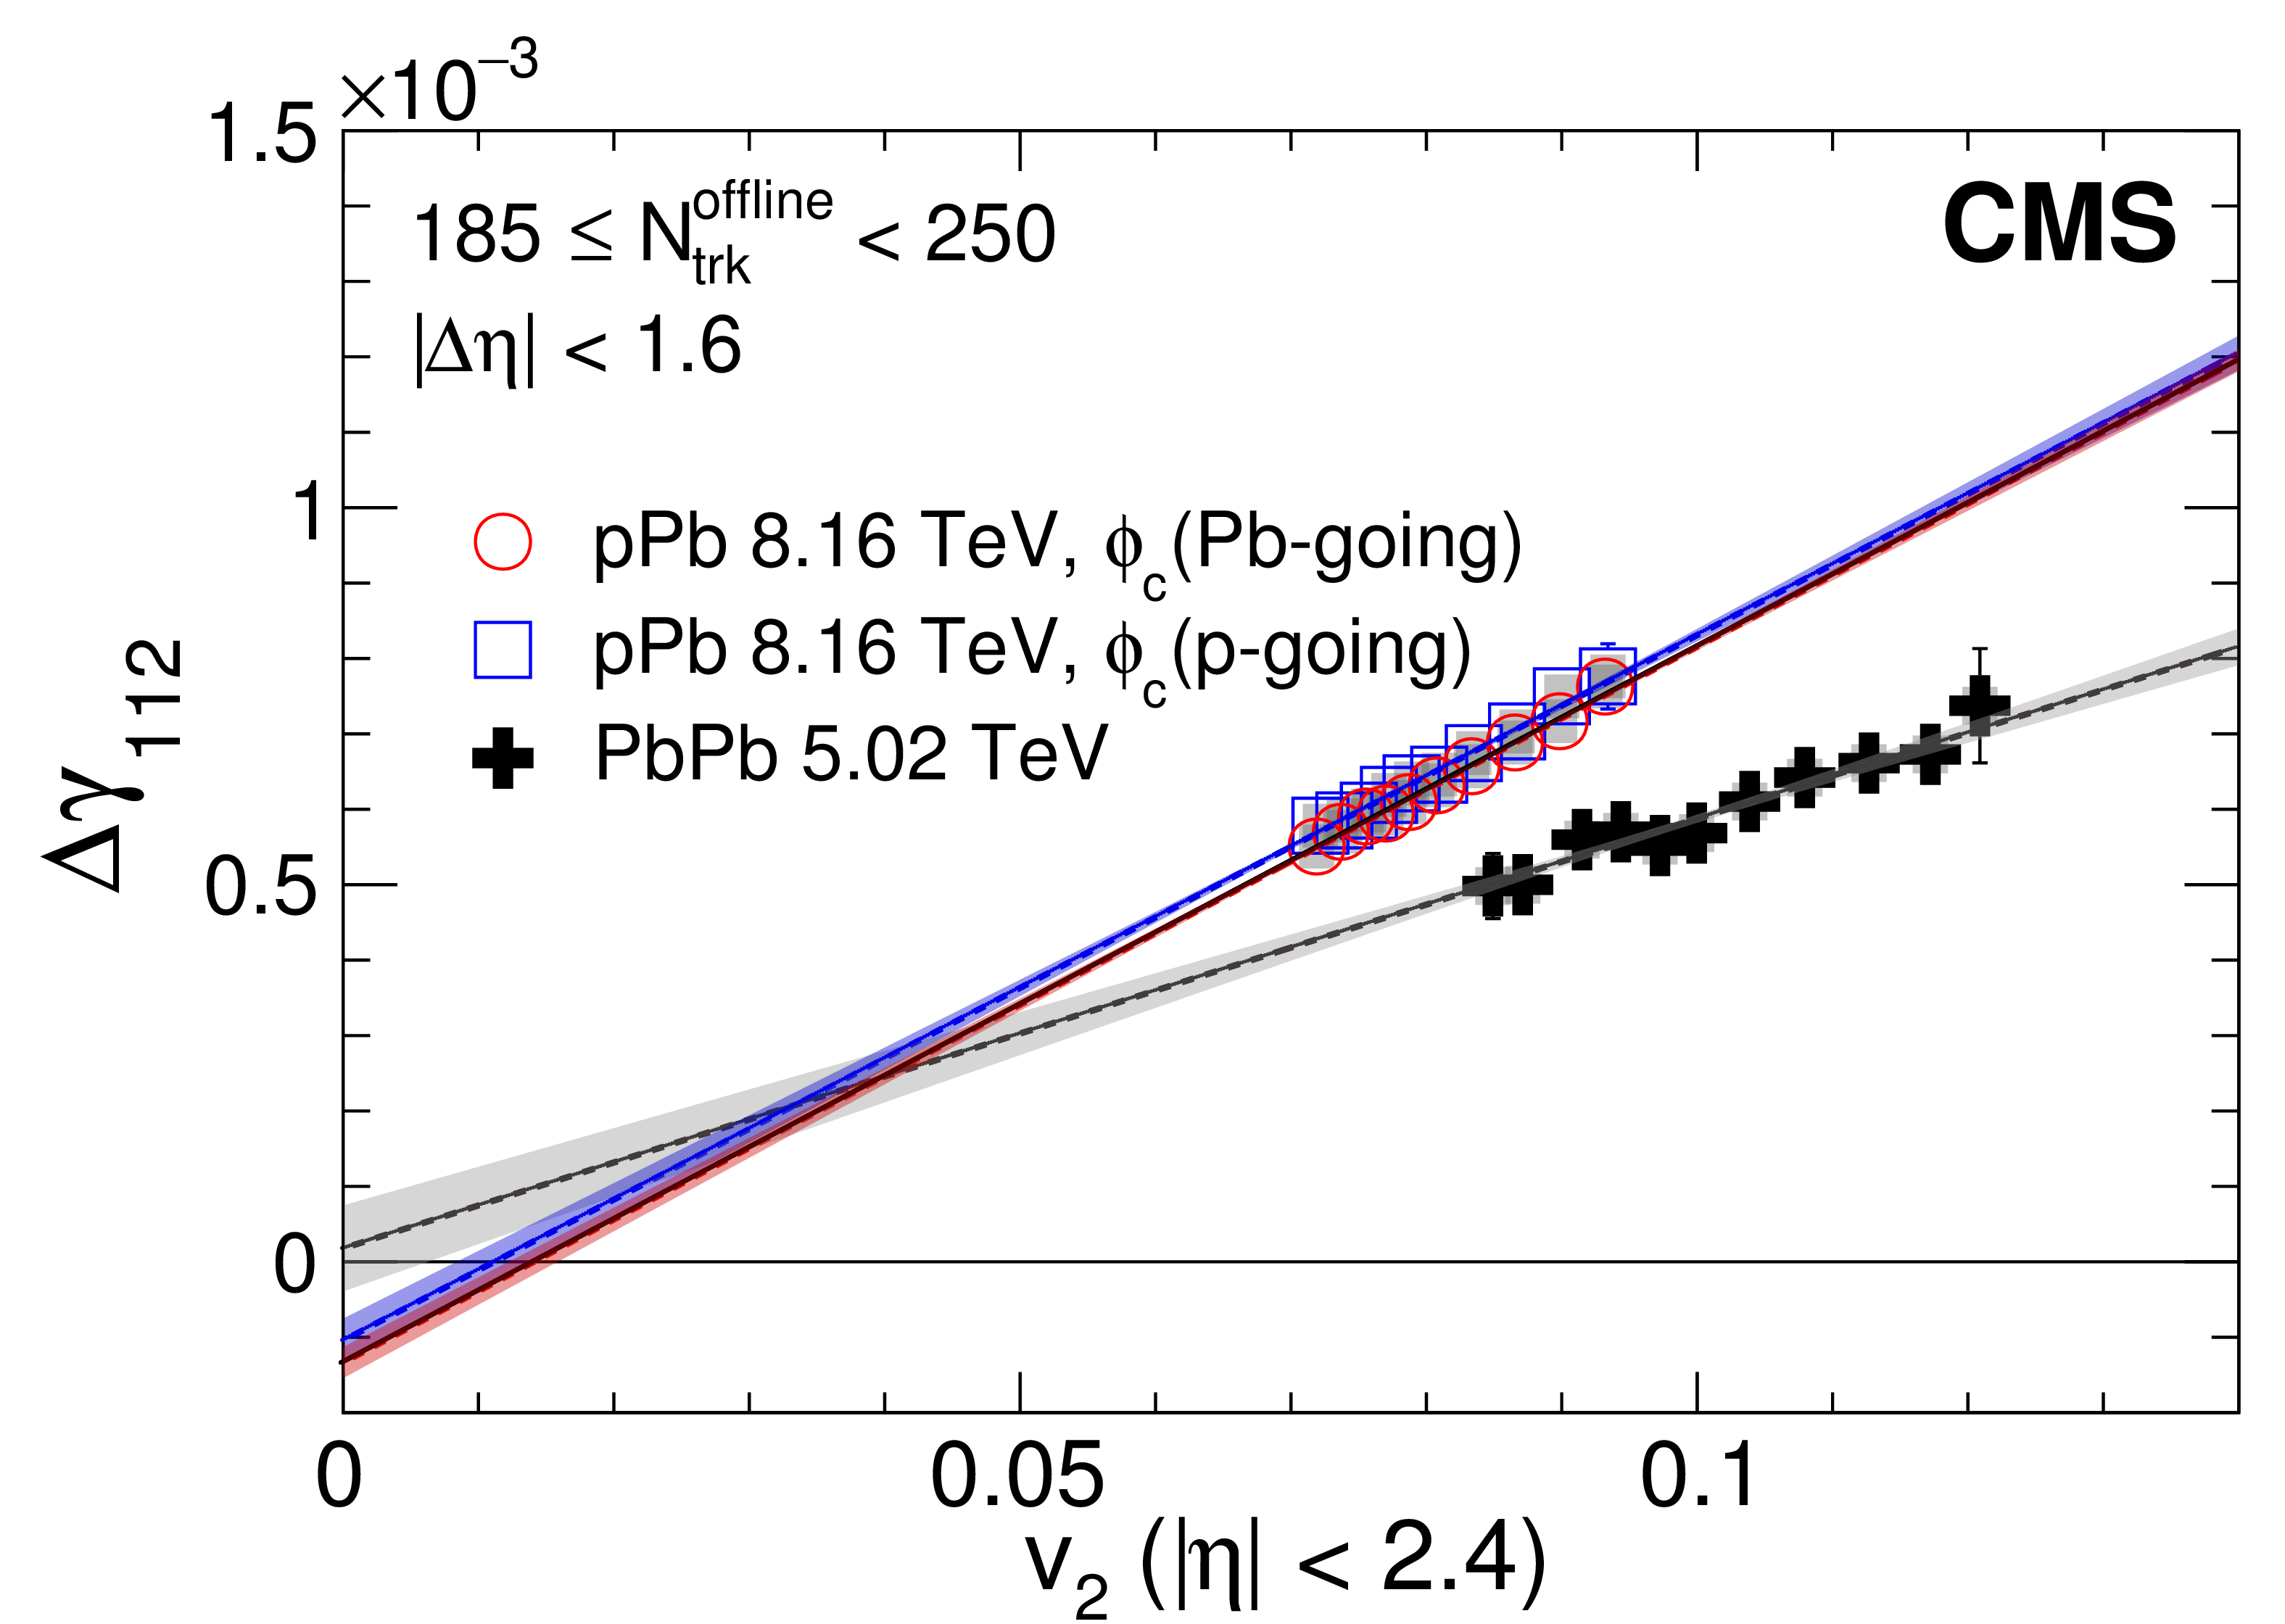
Figure 12-a:
The difference of the OS and SS three-particle correlators, $\gamma _{112}$, averaged over $ {| {\Delta \eta } | }<$ 1.6 as a function of $v_2$ evaluated in each $q_2$ class, for the multiplicity range 185 $ \leq {N_\text {trk}^\text {offline}} < $ 250 in pPb collisions at $ {\sqrt {{s_{_{\mathrm {NN}}}}}} = $ 8.16 TeV and PbPb collisions at 5.02 TeV. Statistical and systematic uncertainties are indicated by the error bars and shaded regions, respectively. A one standard deviation uncertainty from the fit is also shown. |
png pdf |
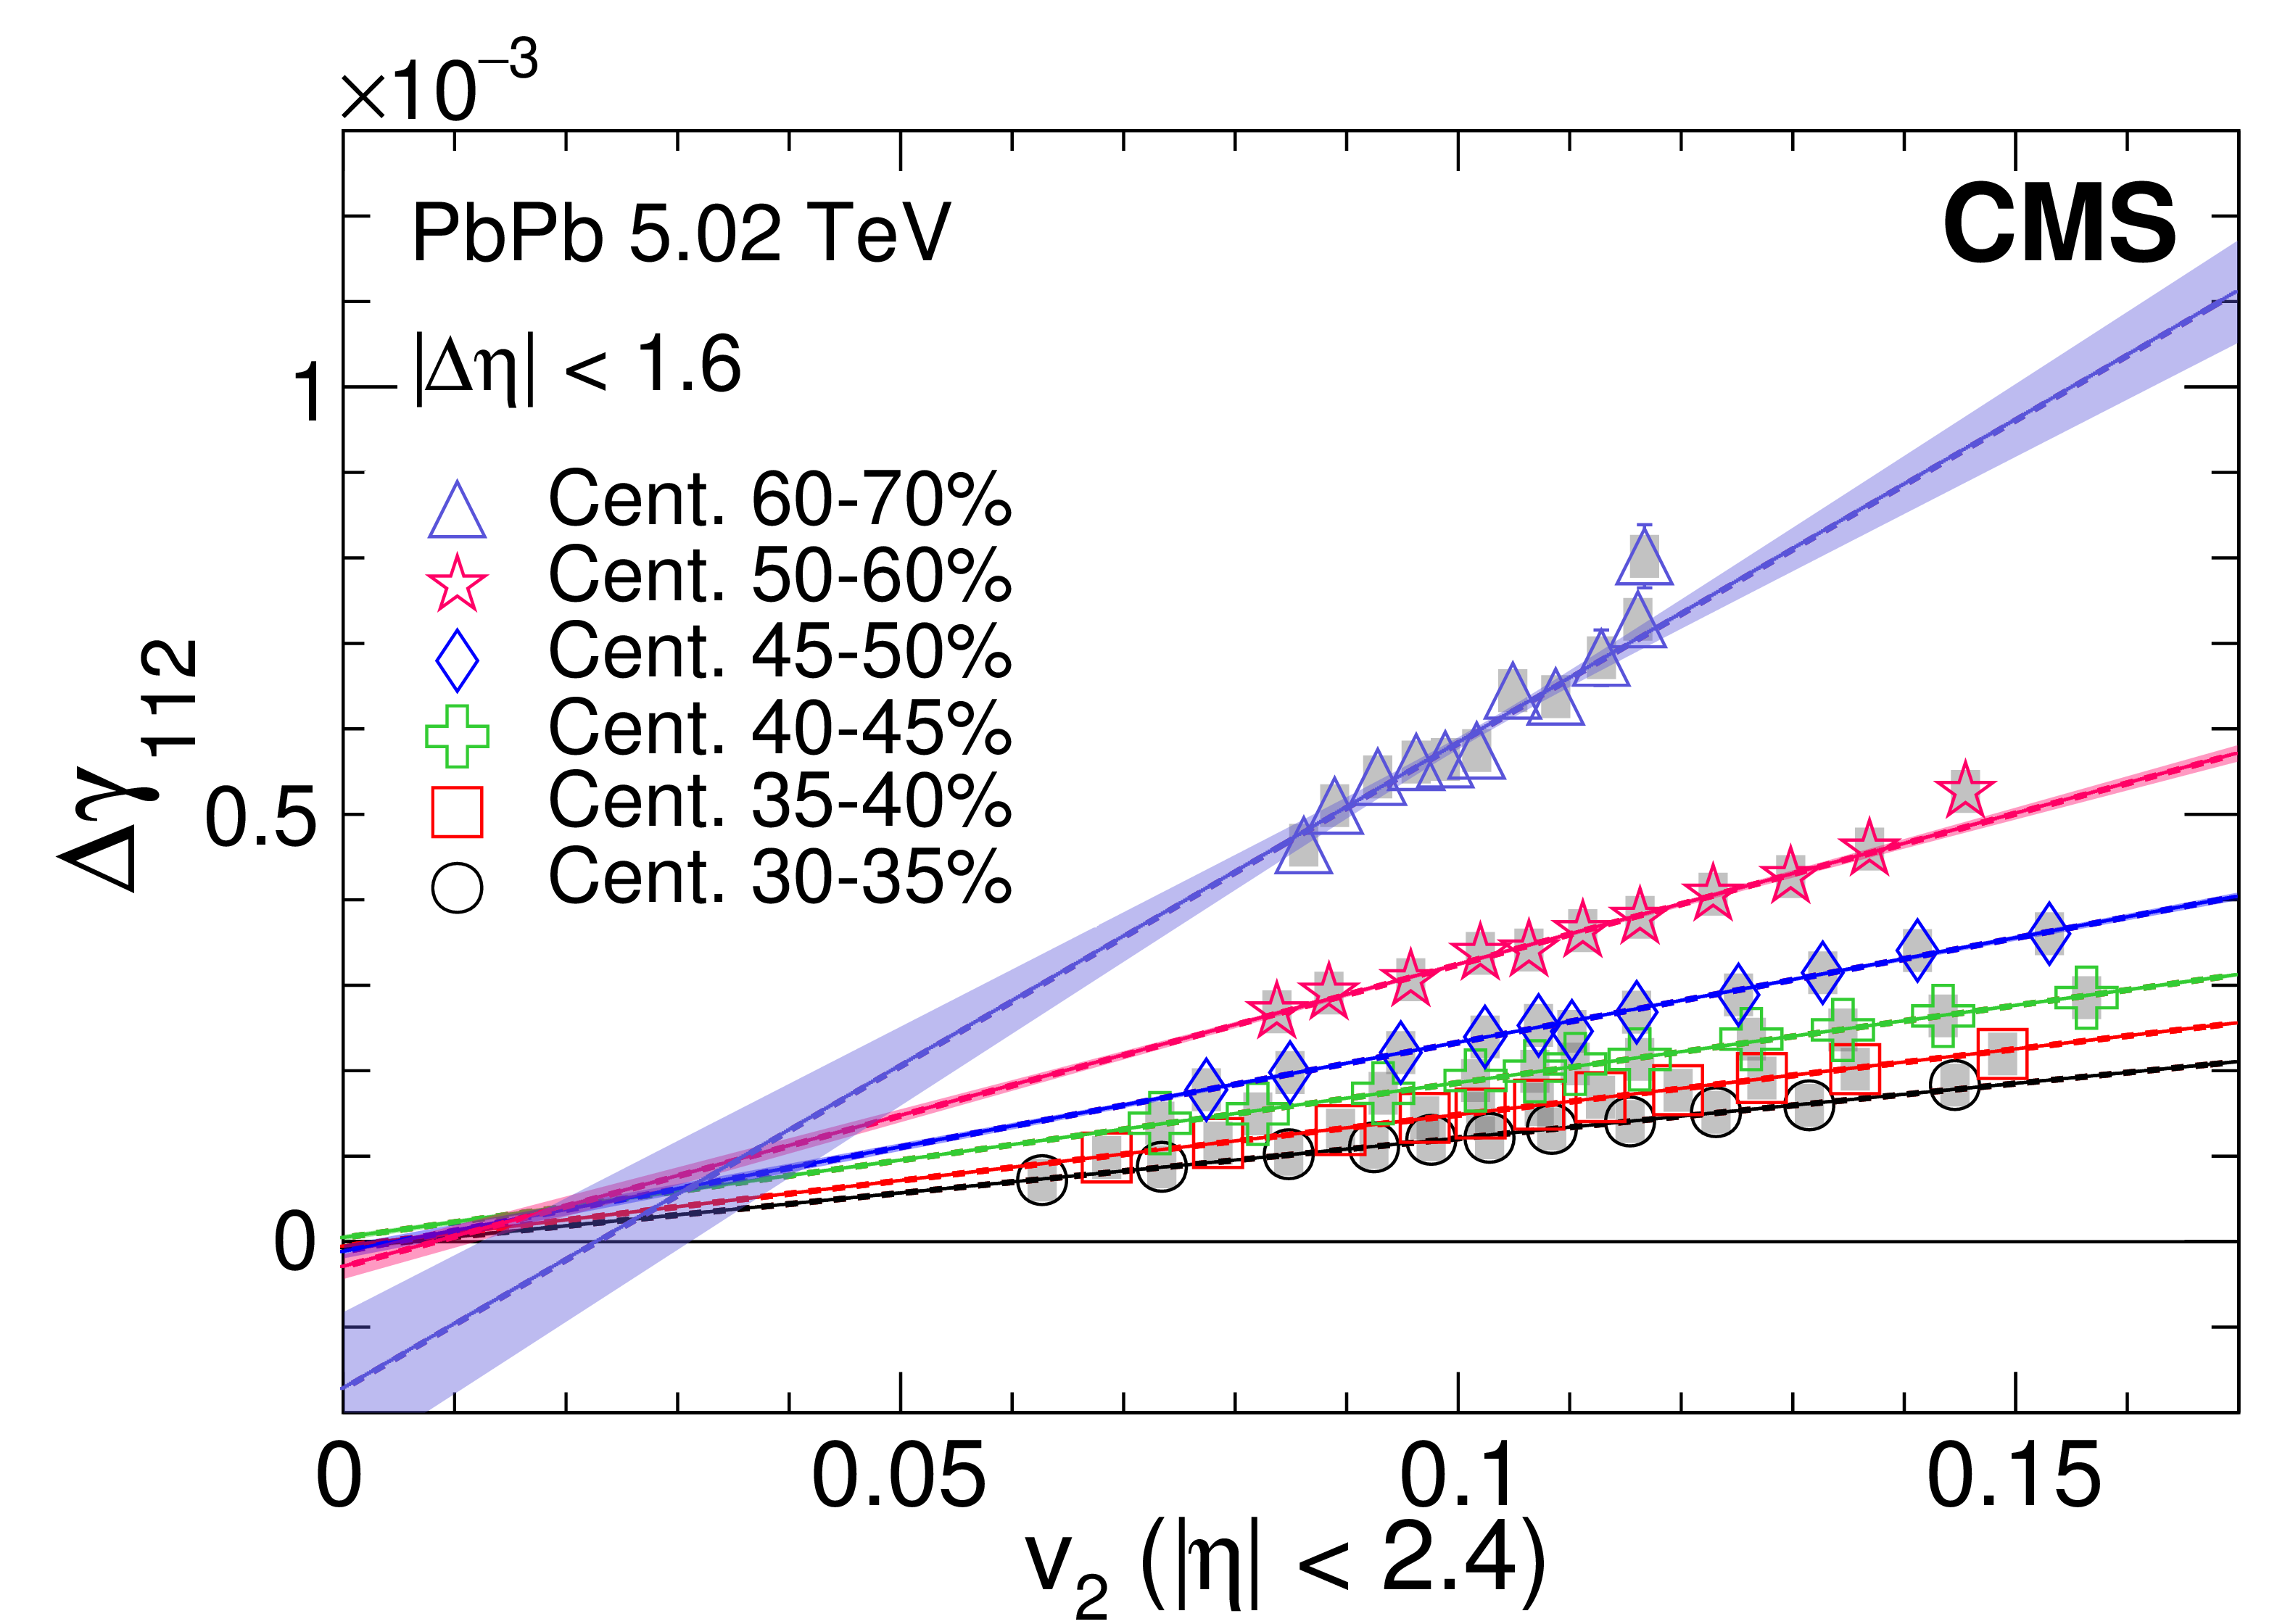
Figure 12-b:
The difference of the OS and SS three-particle correlators, $\gamma _{112}$, averaged over $ {| {\Delta \eta } | }<$ 1.6 as a function of $v_2$ evaluated in each $q_2$ class, for different centrality classes in PbPb collisions at 5.02 TeV. Statistical and systematic uncertainties are indicated by the error bars and shaded regions, respectively. A one standard deviation uncertainty from the fit is also shown. |
png pdf |
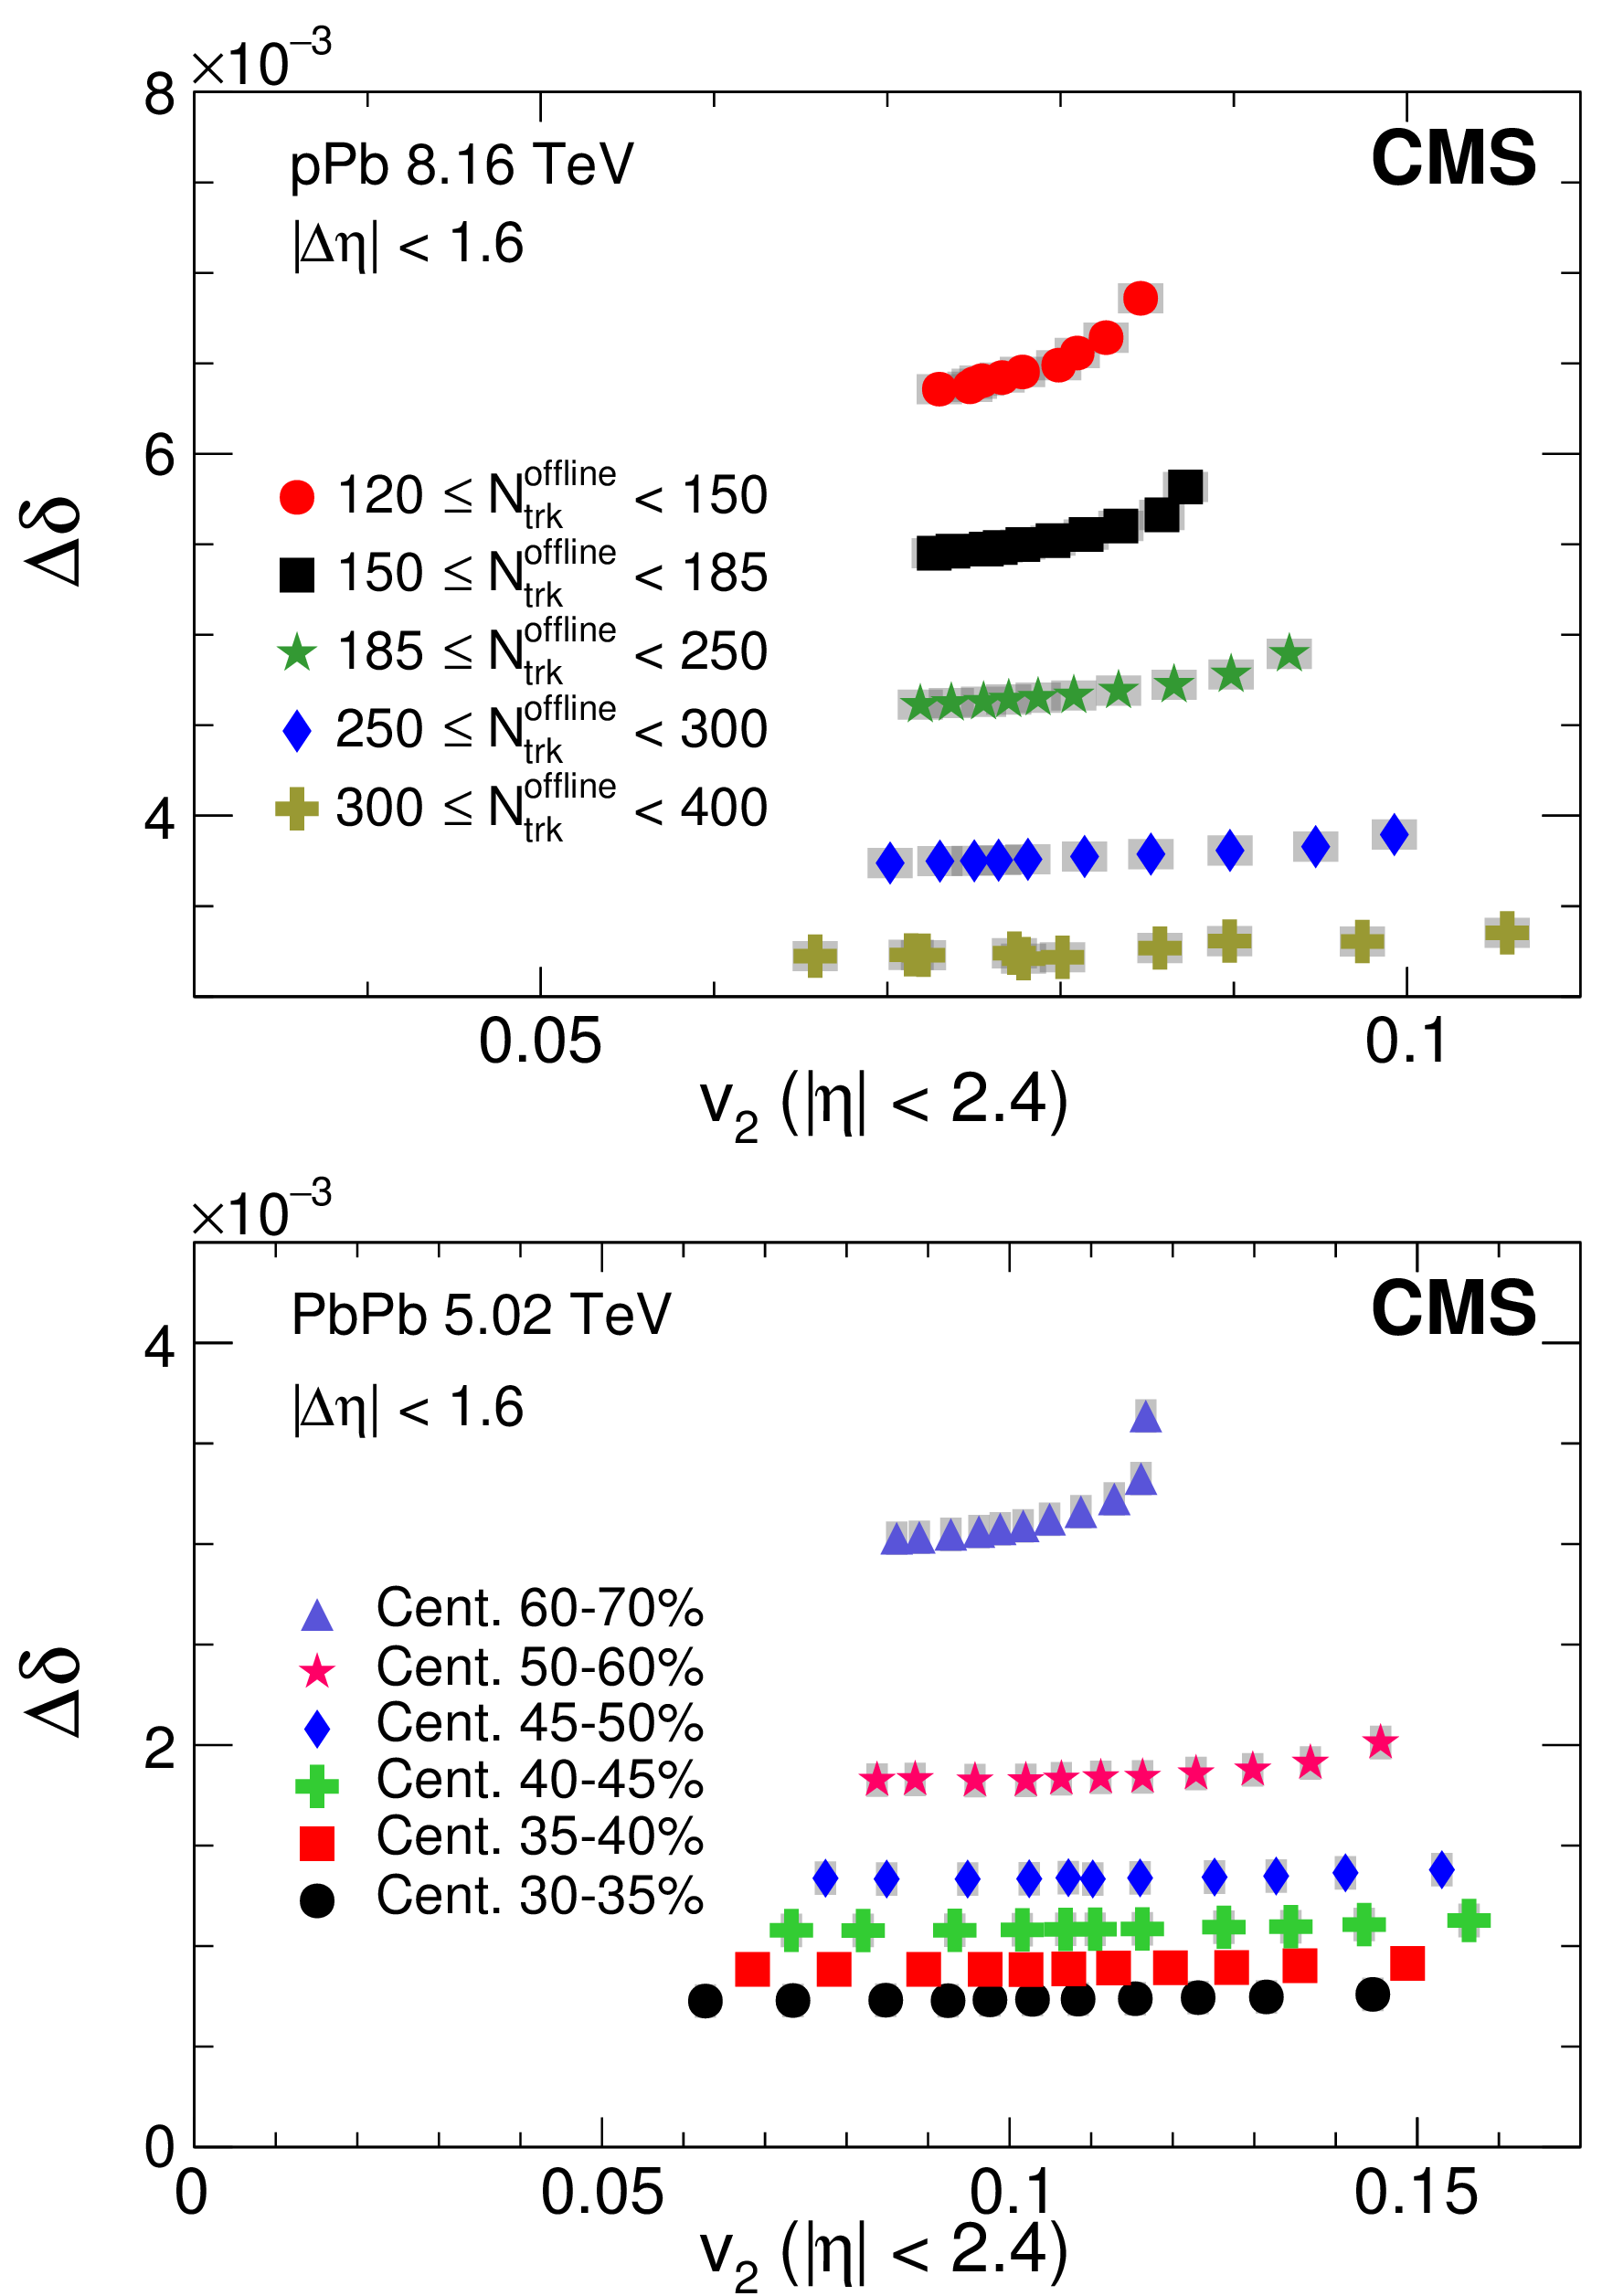
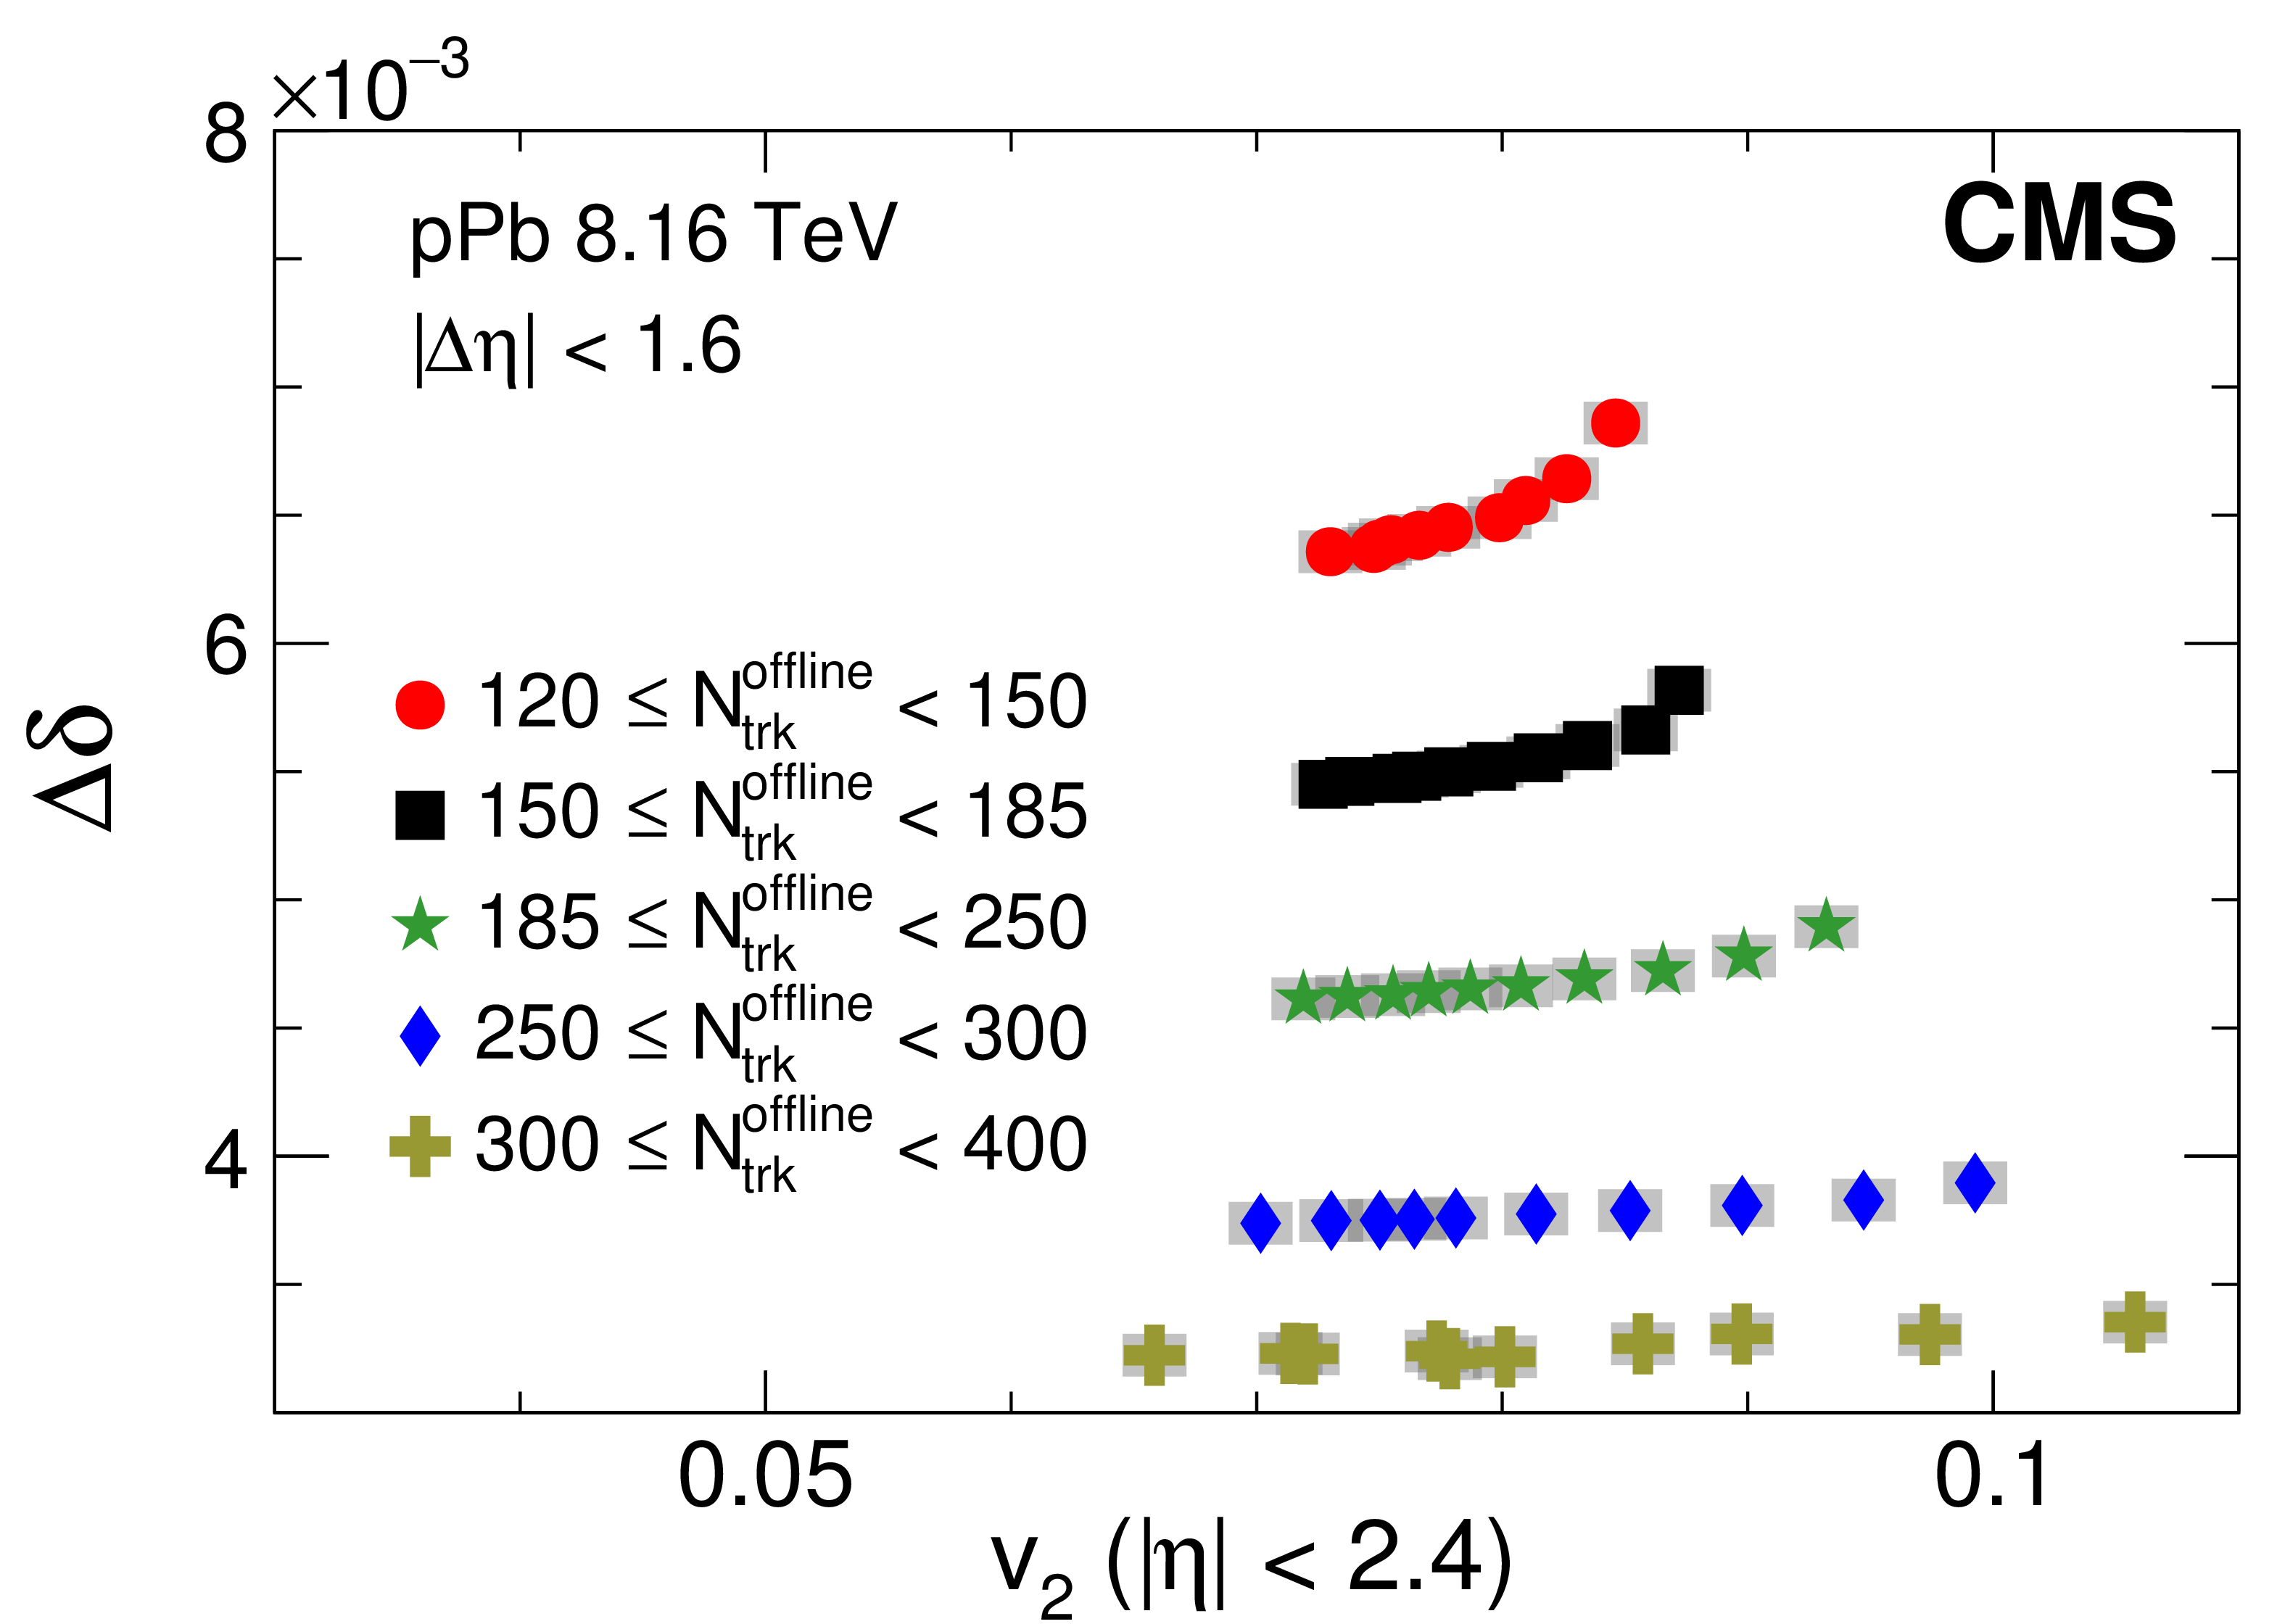
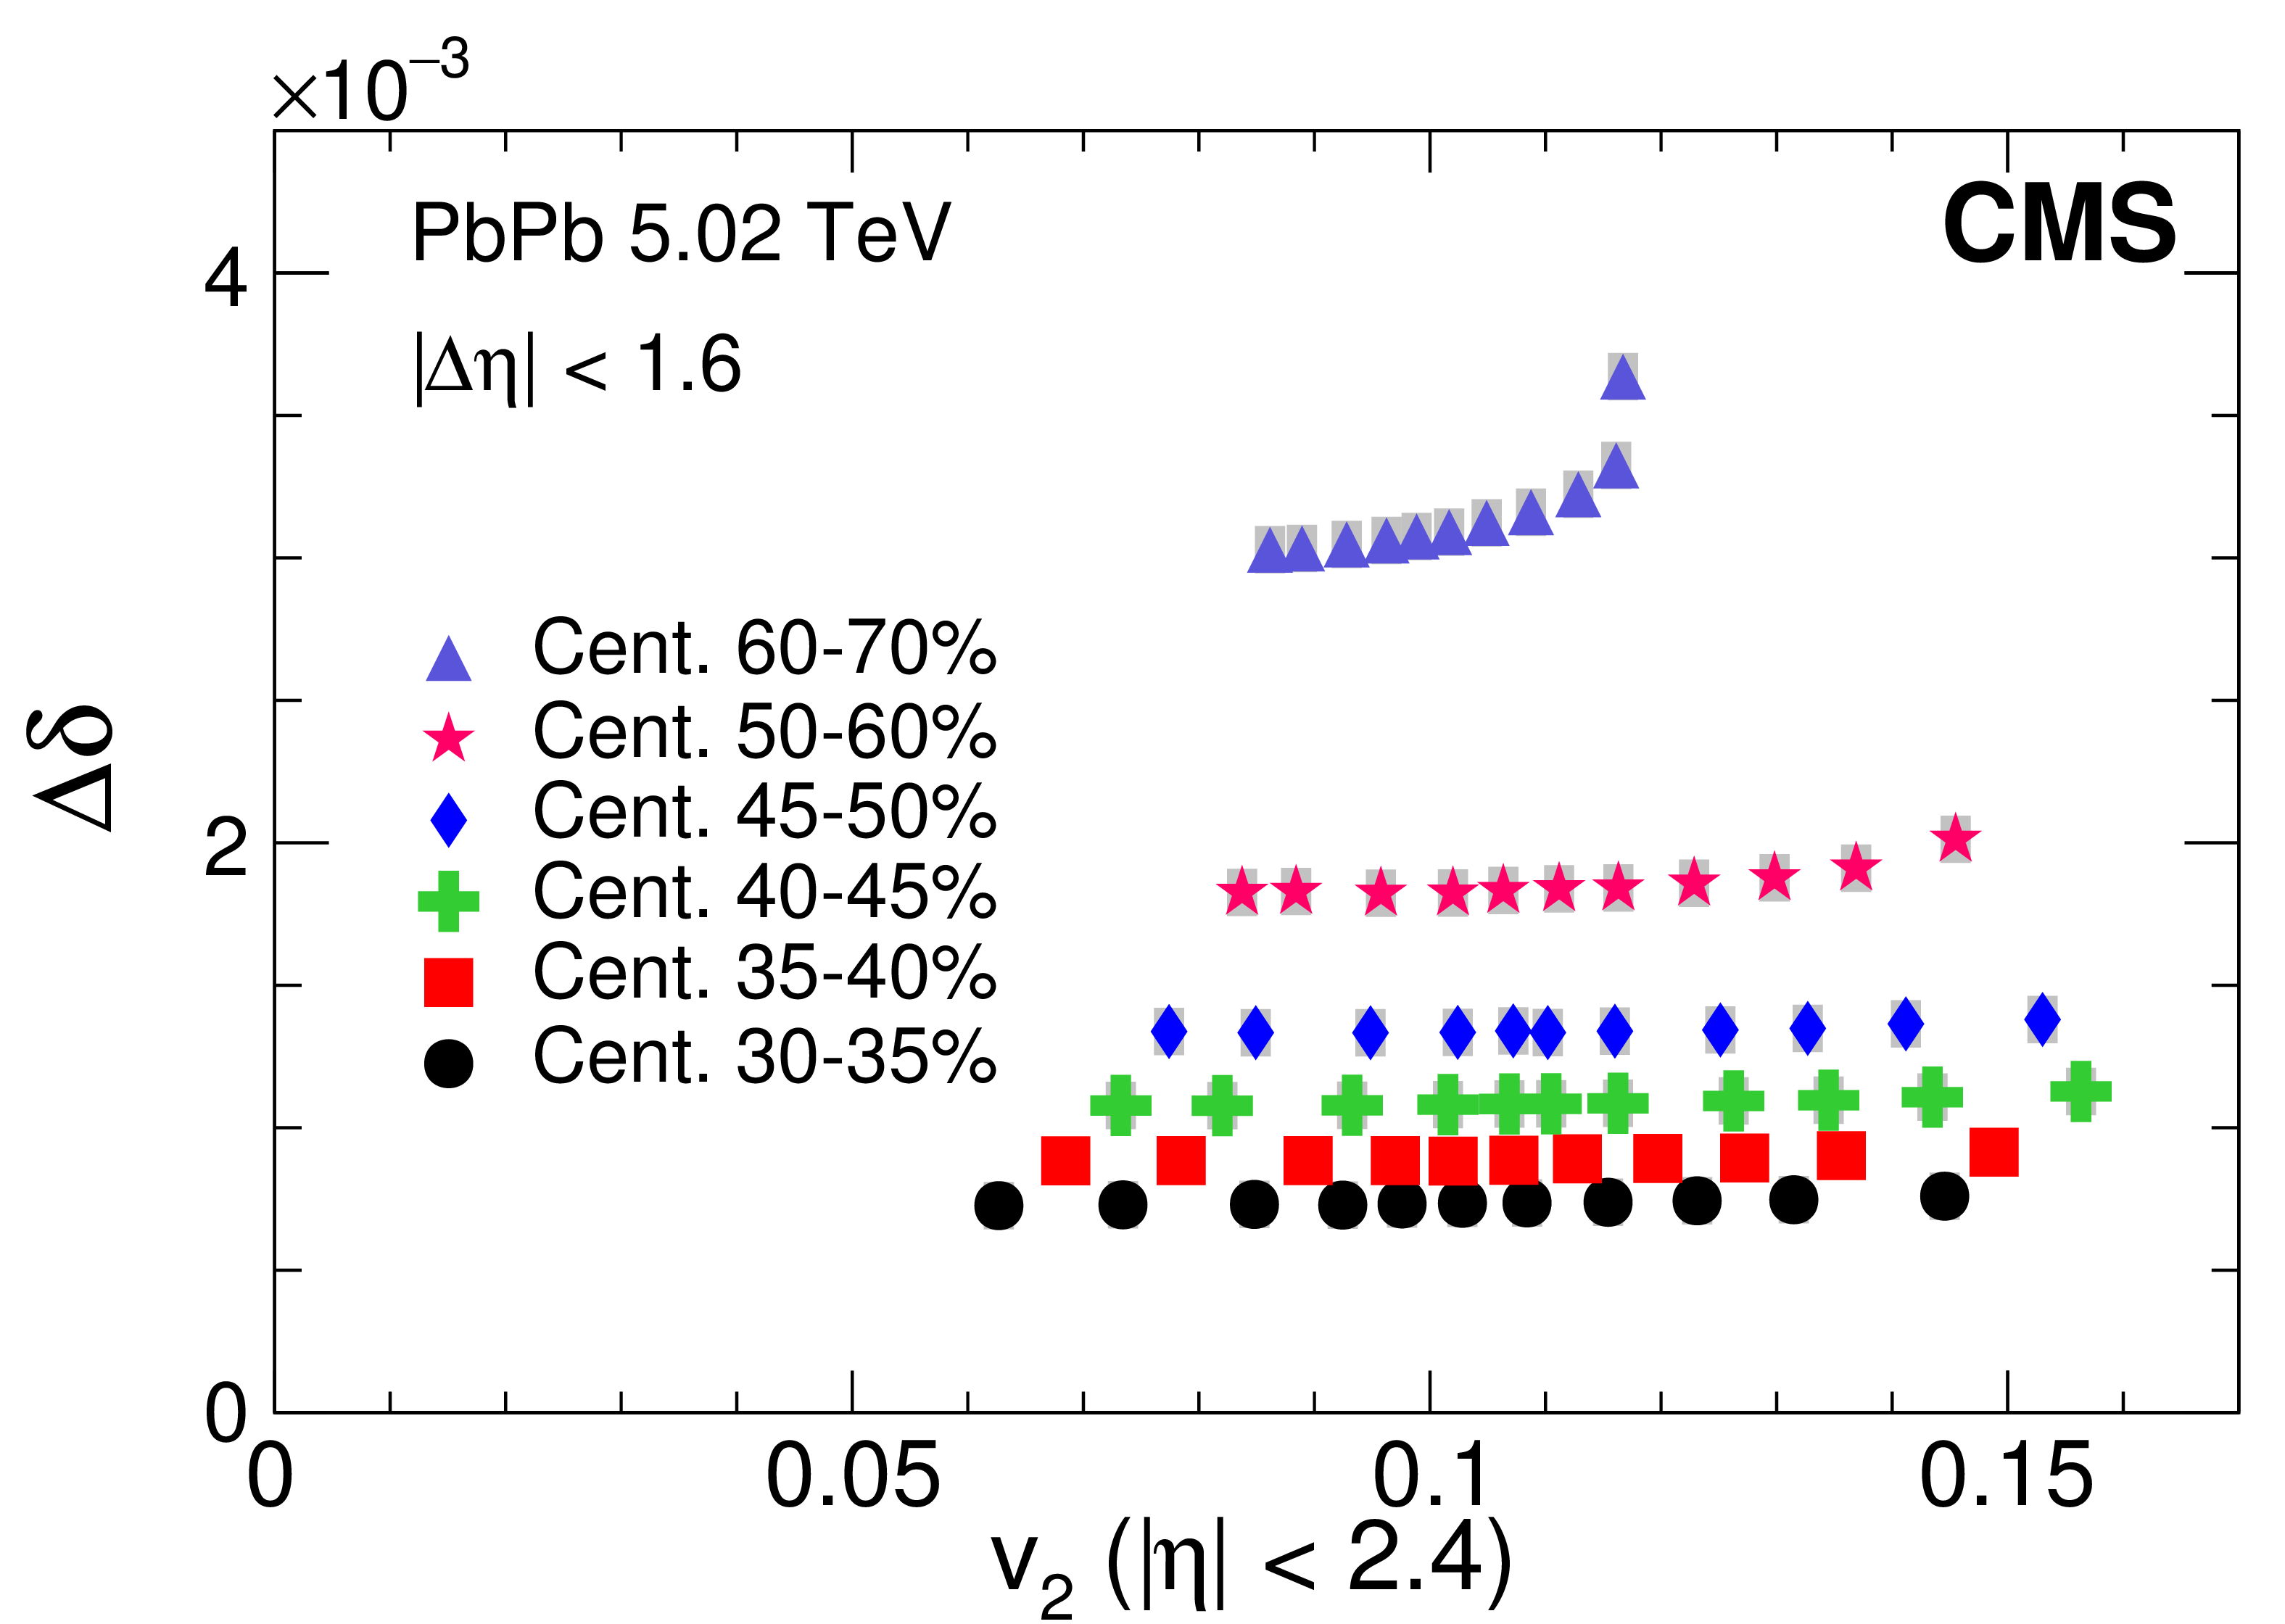
Figure 13:
The difference of the OS and SS two-particle correlators, $\delta $, averaged over $ {| {\Delta \eta } | }<$ 1.6 as a function of $v_2$ evaluated in each $q_2$ class, for different multiplicity ranges in pPb collisions at $ {\sqrt {{s_{_{\mathrm {NN}}}}}} = $ 8.16 TeV (upper), and for different centrality classes in PbPb collisions at 5.02 TeV (lower). Statistical and systematic uncertainties are indicated by the error bars and shaded regions, respectively. |
png pdf |
Figure 13-a:
The difference of the OS and SS two-particle correlators, $\delta $, averaged over $ {| {\Delta \eta } | }<$ 1.6 as a function of $v_2$ evaluated in each $q_2$ class, for different multiplicity ranges in pPb collisions at $ {\sqrt {{s_{_{\mathrm {NN}}}}}} = $ 8.16 TeV. Statistical and systematic uncertainties are indicated by the error bars and shaded regions, respectively. |
png pdf |
Figure 13-b:
The difference of the OS and SS two-particle correlators, $\delta $, averaged over $ {| {\Delta \eta } | }<$ 1.6 as a function of $v_2$ evaluated in each $q_2$ class, for different centrality classes in PbPb collisions at 5.02 TeV. Statistical and systematic uncertainties are indicated by the error bars and shaded regions, respectively. |
png pdf |
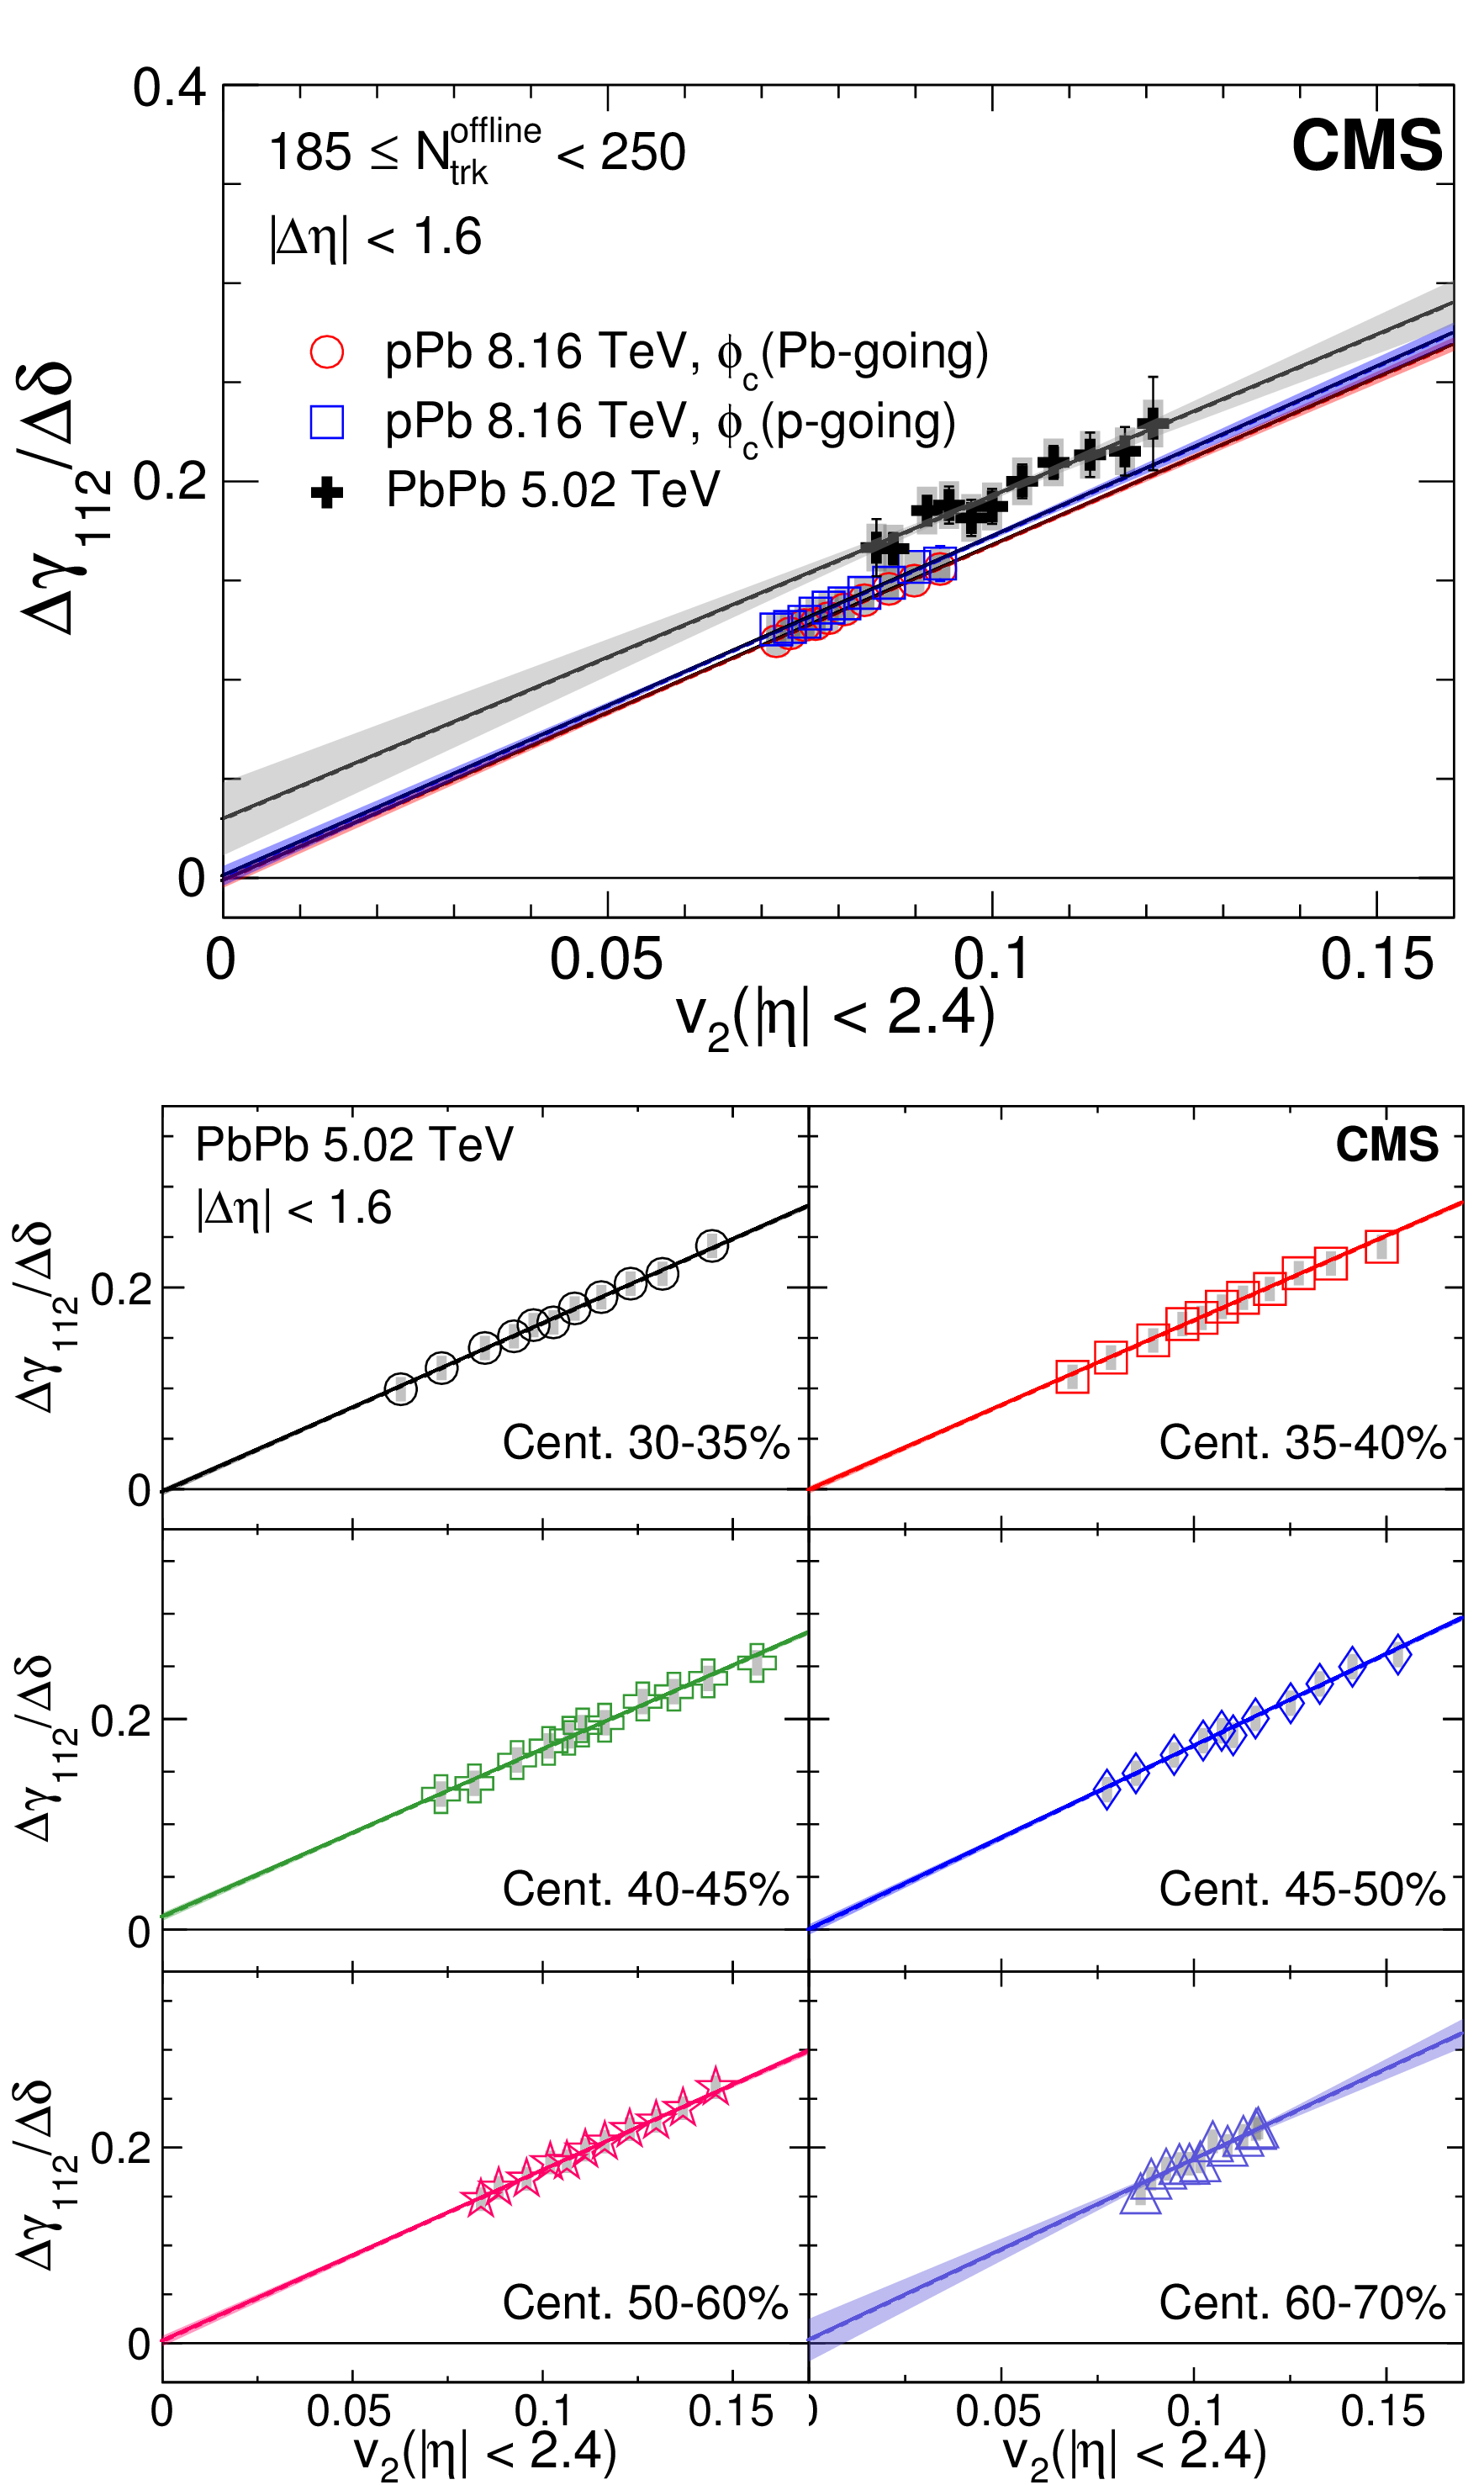
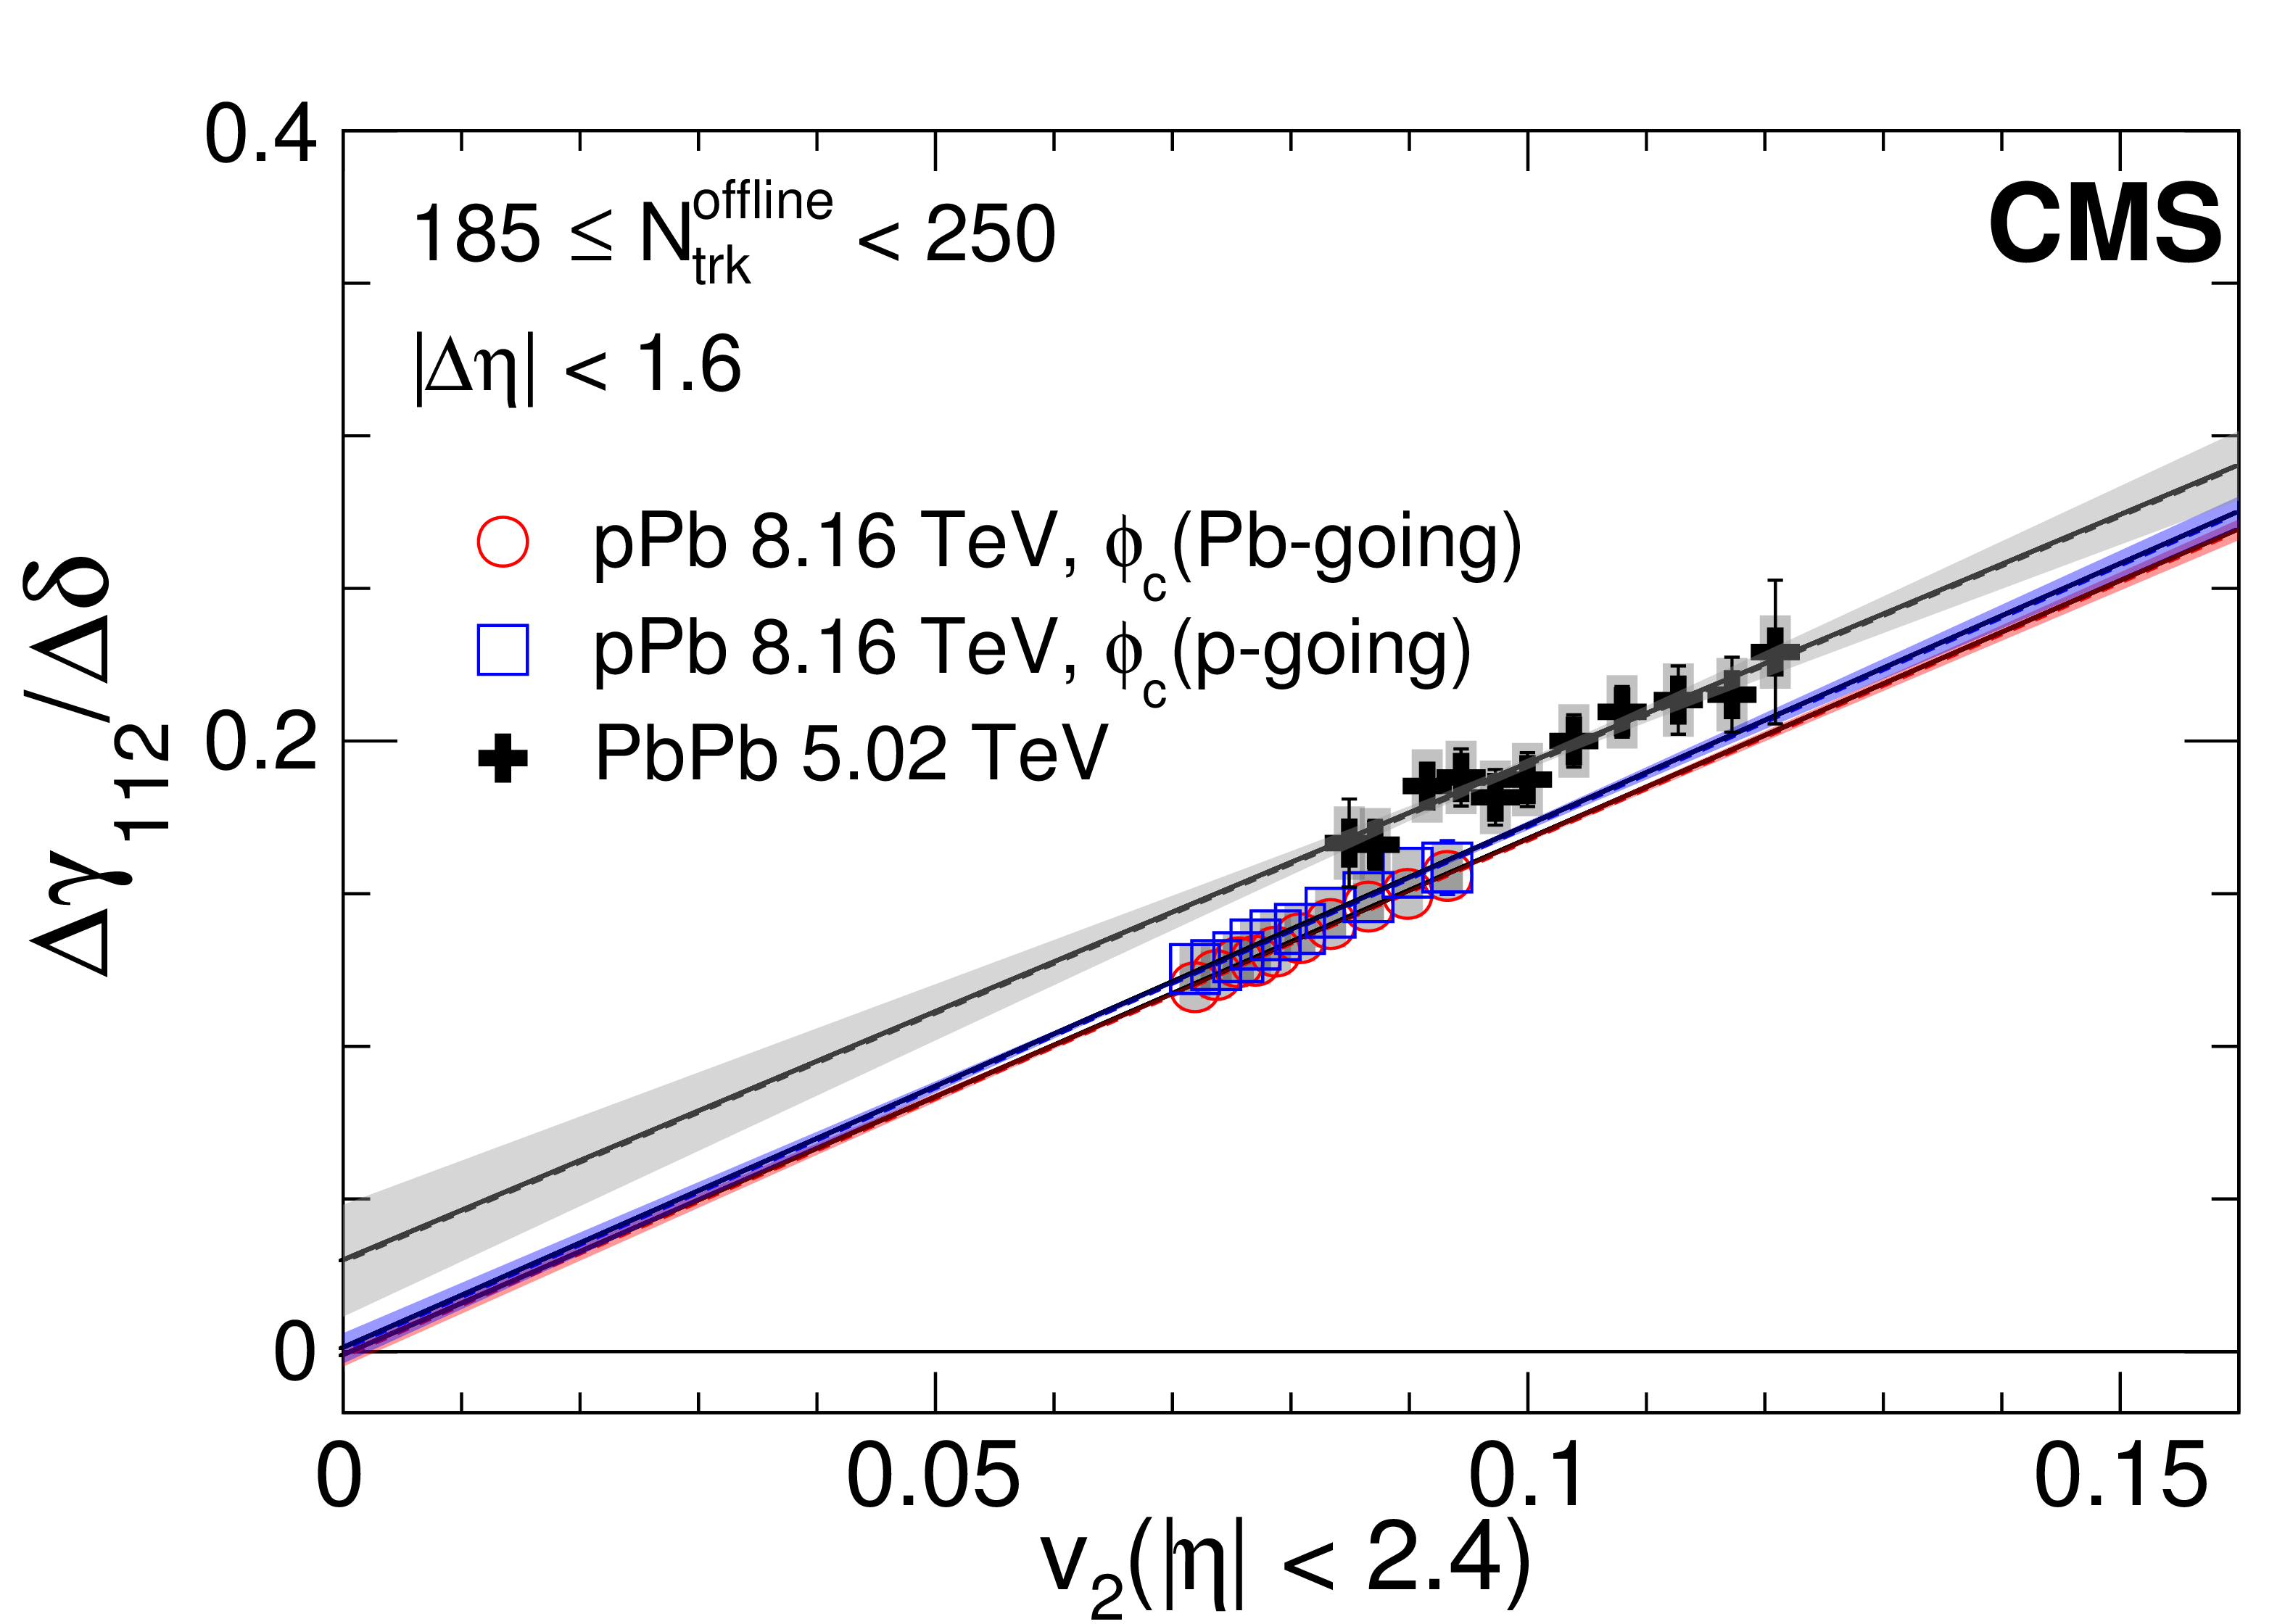
Figure 14:
The ratio between the difference of the OS and SS three-particle correlators and the difference of OS and SS in $\delta $ correlators, $\Delta \gamma _{112}/\Delta \delta $, averaged over $ {| {\Delta \eta } | }<$ 1.6 as a function of $v_2$ evaluated in each $q_2$ class, for the multiplicity range 185 $ \leq {N_\text {trk}^\text {offline}} < $ 250 in pPb collisions at $ {\sqrt {{s_{_{\mathrm {NN}}}}}} = $ 8.16 TeV and PbPb collisions at 5.02 TeV (upper), and for different centrality classes in PbPb collisions at 5.02 TeV (lower). Statistical and systematic uncertainties are indicated by the error bars and shaded regions, respectively. A one standard deviation uncertainty from the fit is also shown. |
png pdf |
Figure 14-a:
The ratio between the difference of the OS and SS three-particle correlators and the difference of OS and SS in $\delta $ correlators, $\Delta \gamma _{112}/\Delta \delta $, averaged over $ {| {\Delta \eta } | }<$ 1.6 as a function of $v_2$ evaluated in each $q_2$ class, for the multiplicity range 185 $ \leq {N_\text {trk}^\text {offline}} < $ 250 in pPb collisions at $ {\sqrt {{s_{_{\mathrm {NN}}}}}} = $ 8.16 TeV and PbPb collisions at 5.02 TeV. Statistical and systematic uncertainties are indicated by the error bars and shaded regions, respectively. A one standard deviation uncertainty from the fit is also shown. |
png pdf |
Figure 14-b:
The ratio between the difference of the OS and SS three-particle correlators and the difference of OS and SS in $\delta $ correlators, $\Delta \gamma _{112}/\Delta \delta $, averaged over $ {| {\Delta \eta } | }<$ 1.6 as a function of $v_2$ evaluated in each $q_2$ class, for different centrality classes in PbPb collisions at 5.02 TeV. Statistical and systematic uncertainties are indicated by the error bars and shaded regions, respectively. A one standard deviation uncertainty from the fit is also shown. |

png pdf |
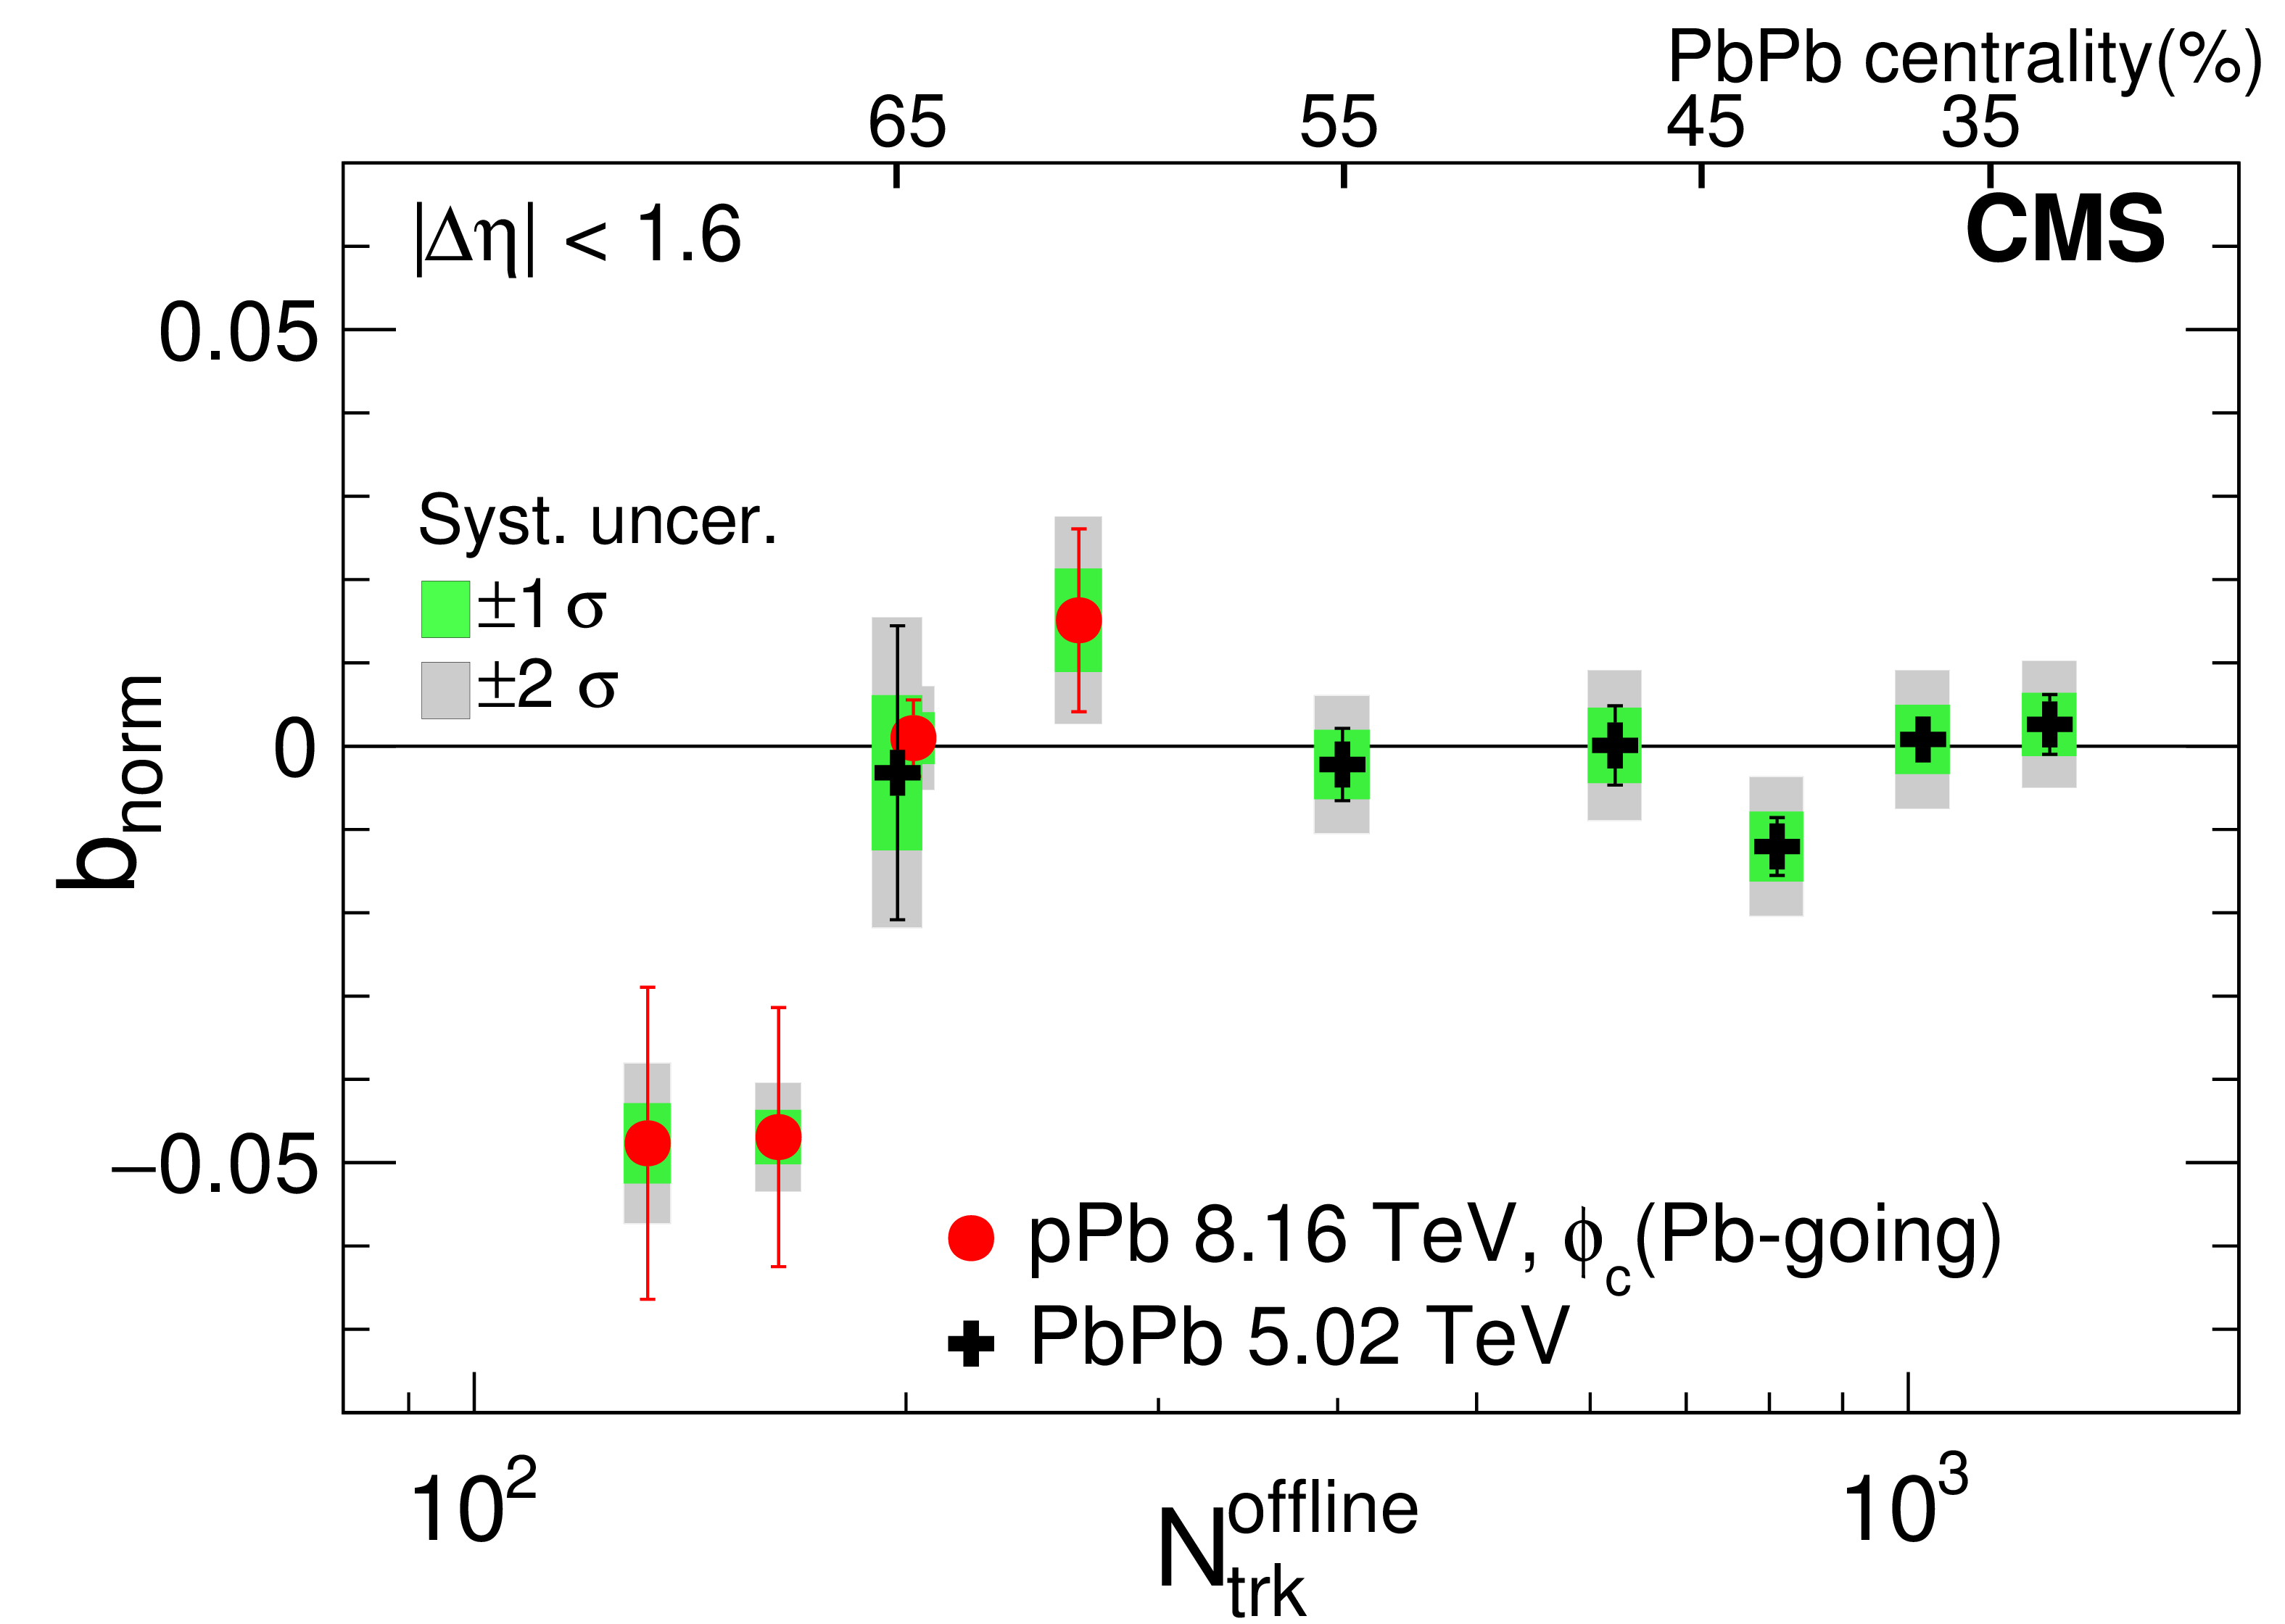
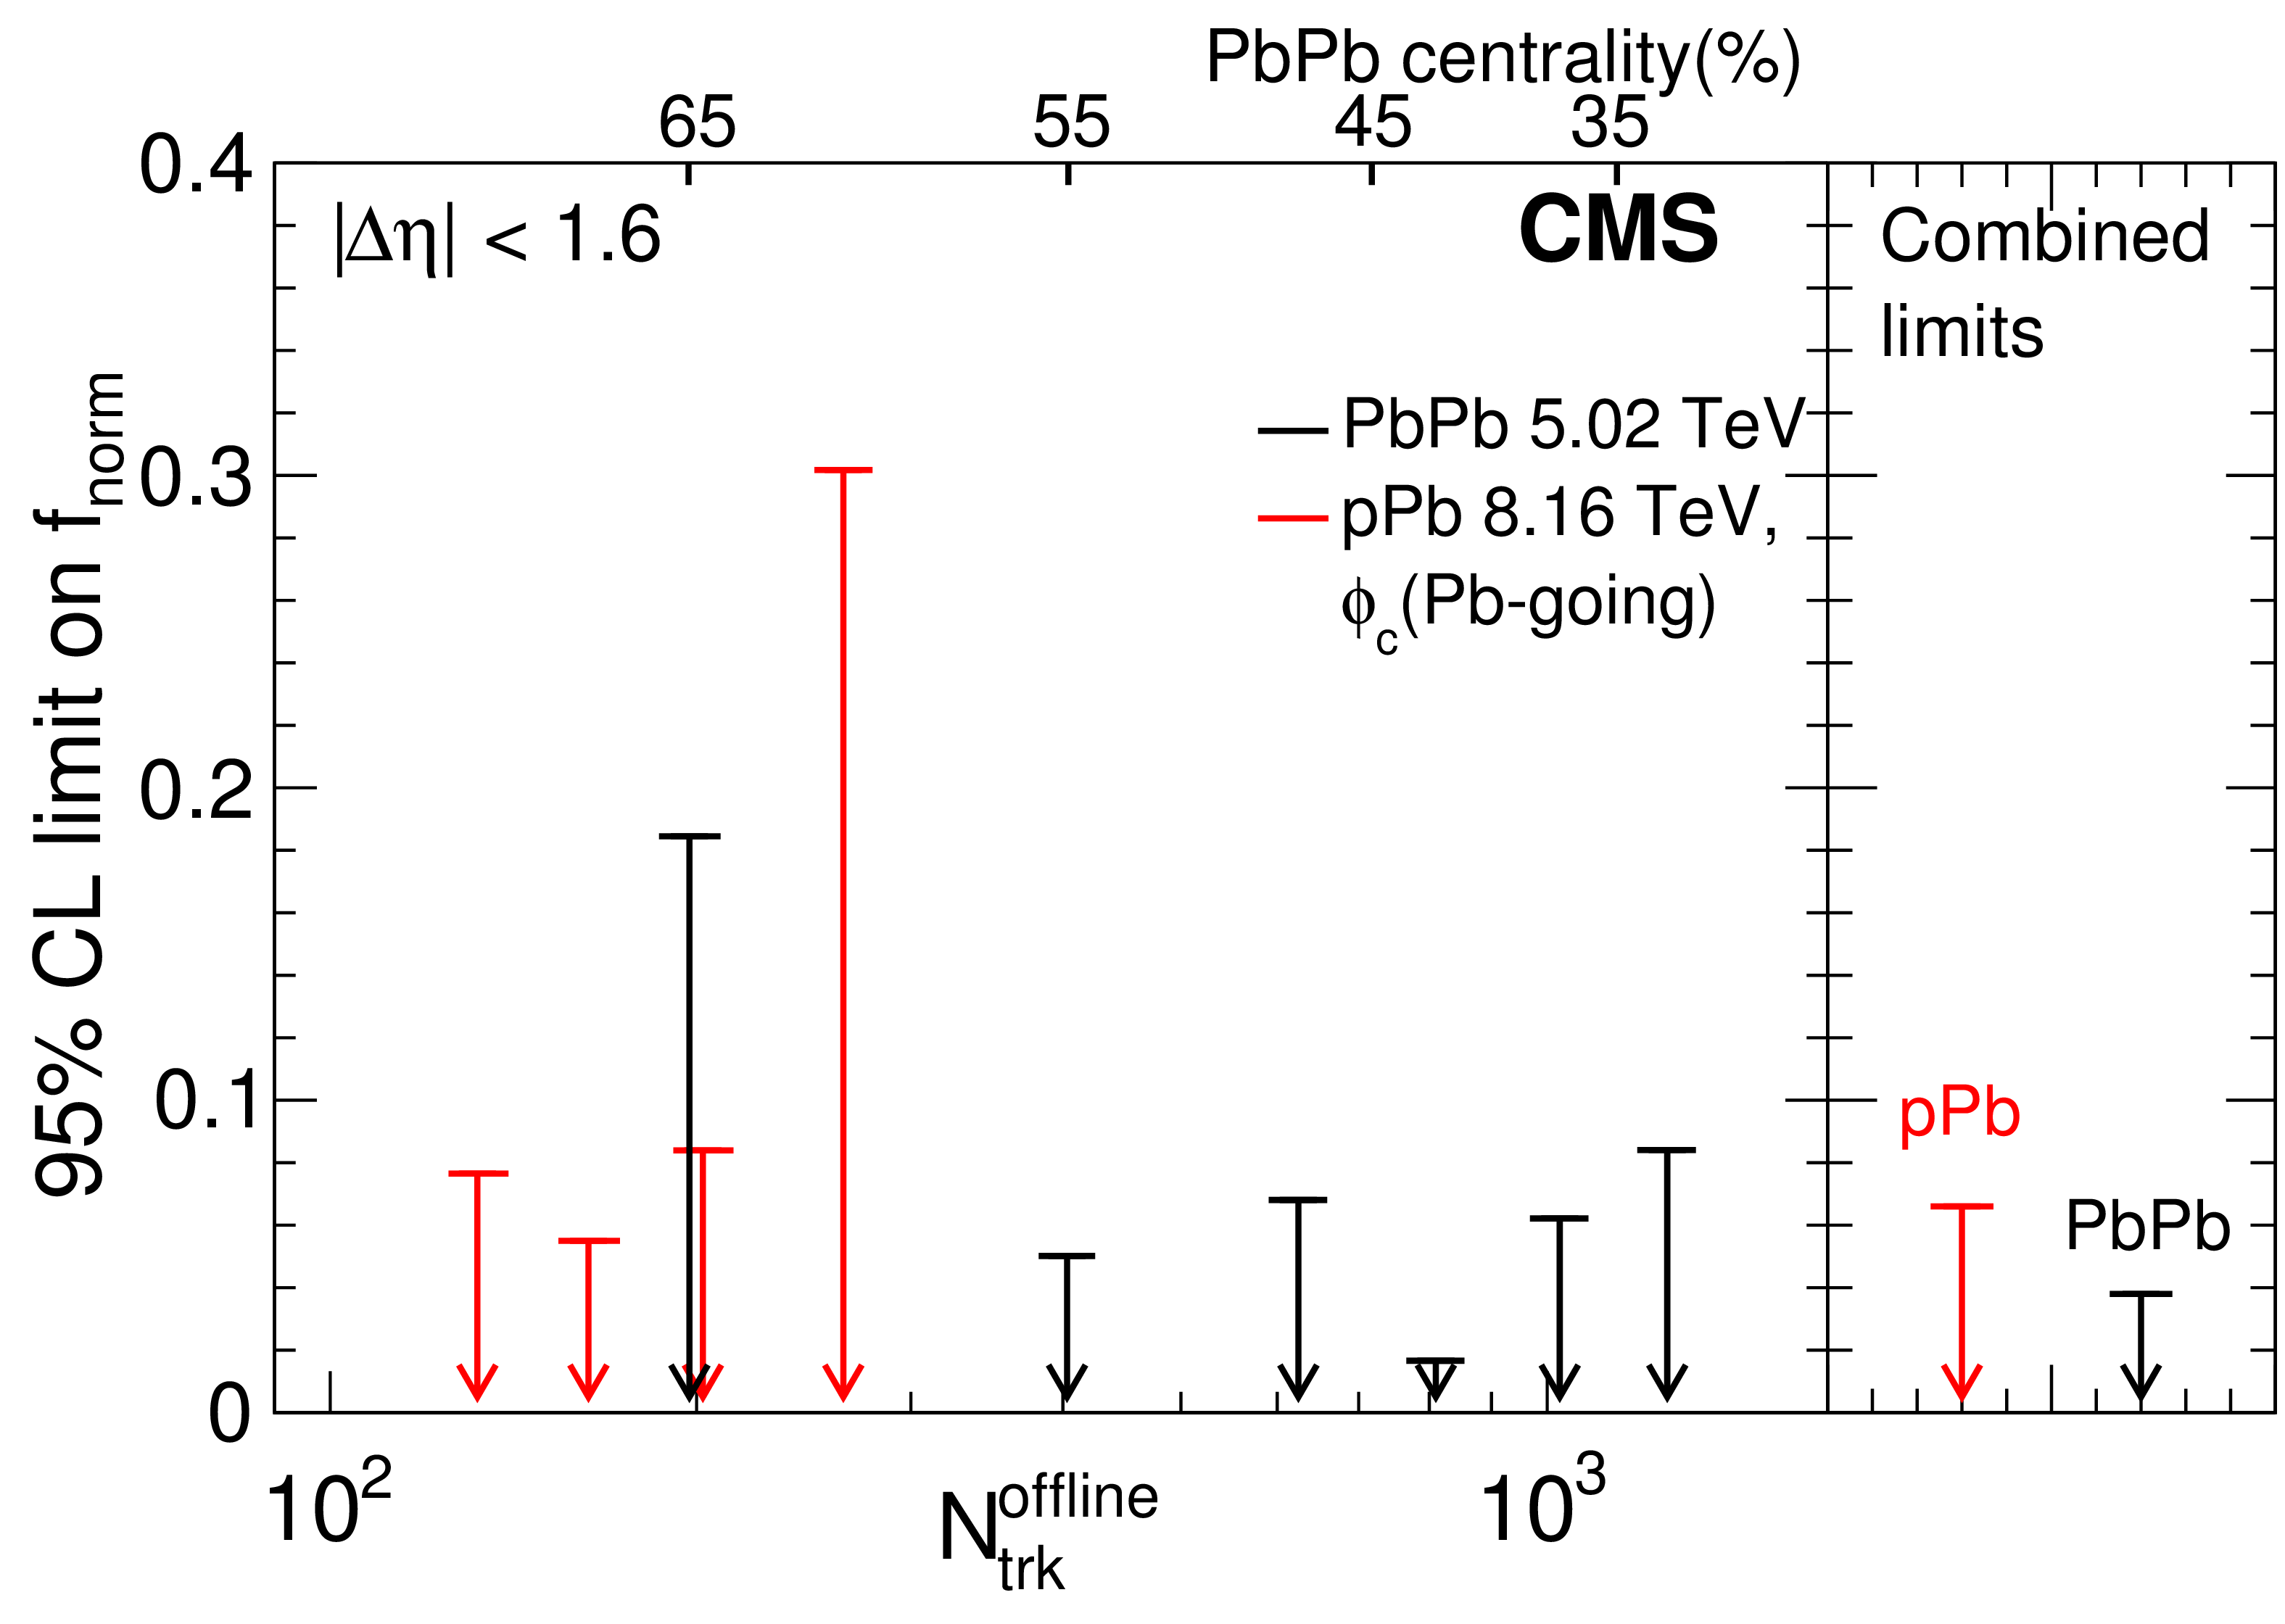
Figure 15:
Extracted intercept parameter $b_{\text {norm}}$ (upper) and corresponding upper limit of the fraction of $v_2$-independent $\gamma _{112}$ correlator component (lower), averaged over $ {| {\Delta \eta } | }<$ 1.6, as a function of $ {N_\text {trk}^\text {offline}} $ in pPb collisions at $ {\sqrt {{s_{_{\mathrm {NN}}}}}} = $ 8.16 TeV and PbPb collisions at 5.02 TeV. Statistical and systematic uncertainties are indicated by the error bars and shaded regions in the top panel, respectively. |
png pdf |
Figure 15-a:
Extracted intercept parameter $b_{\text {norm}}$, averaged over $ {| {\Delta \eta } | }<$ 1.6, as a function of $ {N_\text {trk}^\text {offline}} $ in pPb collisions at $ {\sqrt {{s_{_{\mathrm {NN}}}}}} = $ 8.16 TeV and PbPb collisions at 5.02 TeV. Statistical and systematic uncertainties are indicated by the error bars and shaded regions in the top panel, respectively. |
png pdf |
Figure 15-b:
Upper limit of the fraction of $v_2$-independent $\gamma _{112}$ correlator component, averaged over $ {| {\Delta \eta } | }<$ 1.6, as a function of $ {N_\text {trk}^\text {offline}} $ in pPb collisions at $ {\sqrt {{s_{_{\mathrm {NN}}}}}} = $ 8.16 TeV and PbPb collisions at 5.02 TeV. Statistical and systematic uncertainties are indicated by the error bars and shaded regions in the top panel, respectively. |
png pdf |
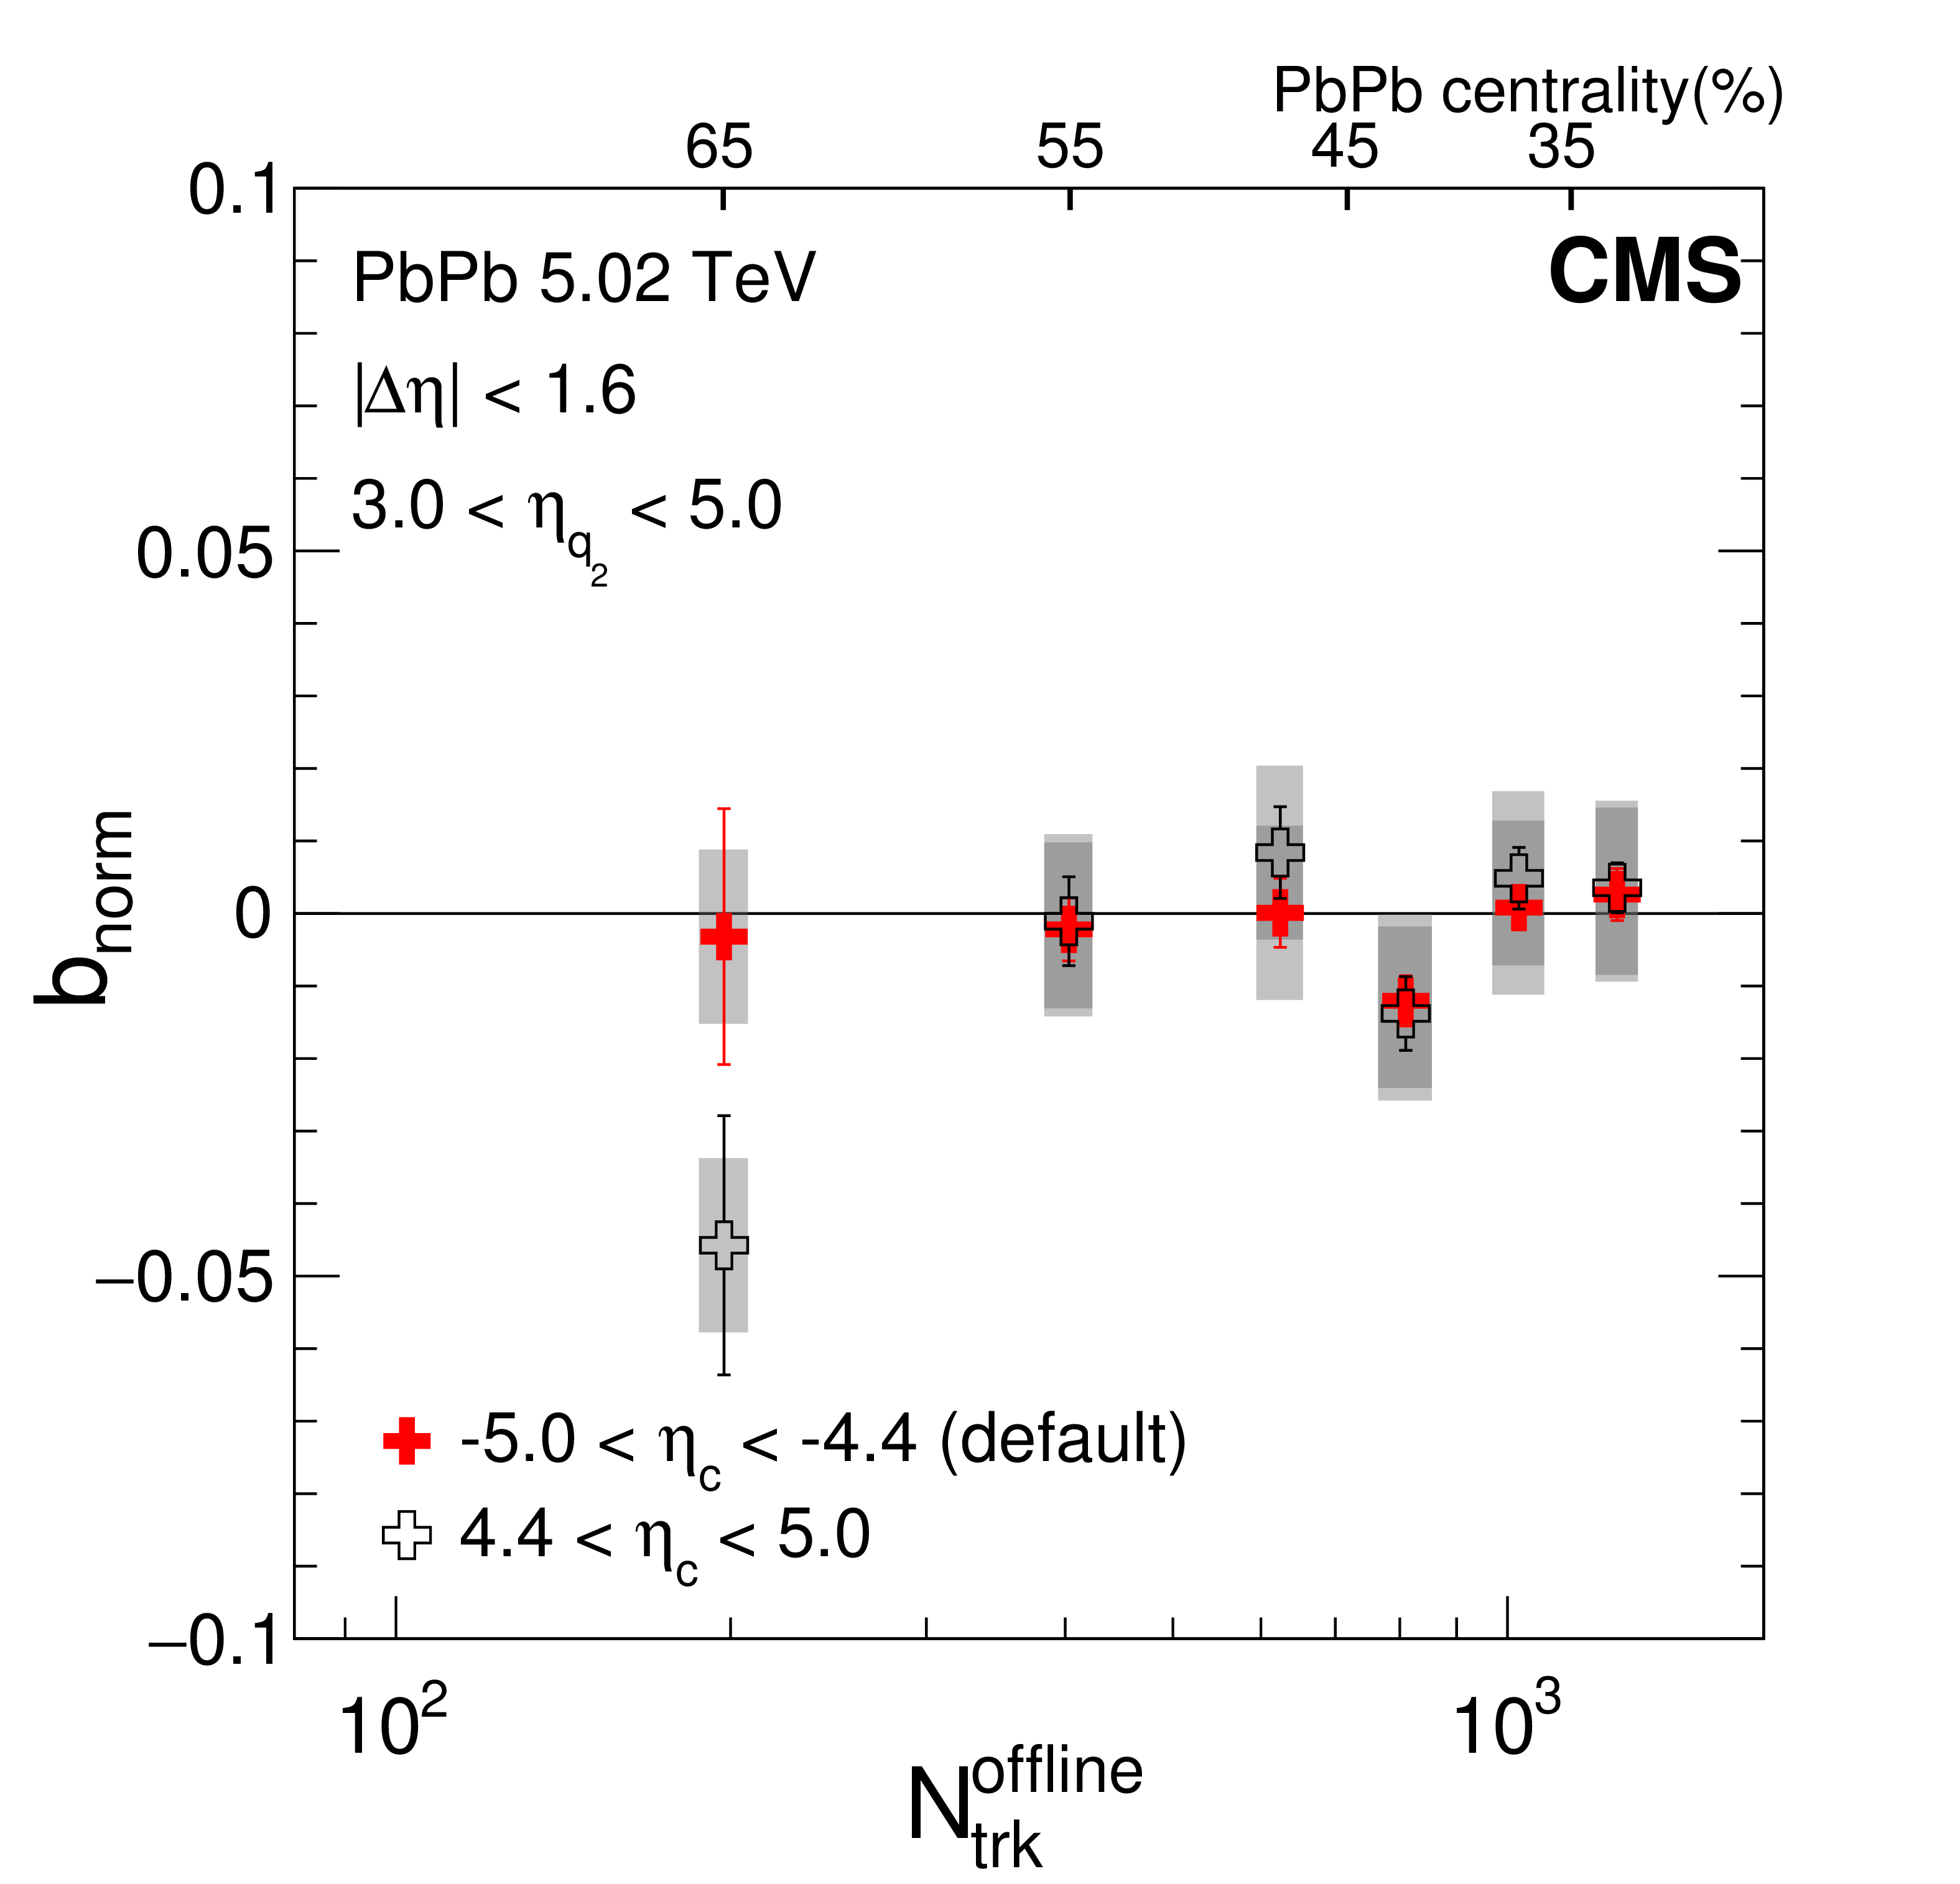
Figure 16:
The intercepts $b_{\text {norm}}$ of $v_2$-independent $\gamma _{112}$ correlator component using particle $c$ from HF$+$ and HF$-$ data, averaged over $|\Delta \eta |<$ 1.6, are shown as a function of $ {N_\text {trk}^\text {offline}} $ in PbPb collisions at $ {\sqrt {{s_{_{\mathrm {NN}}}}}}= $ 5.02 TeV. Statistical and systematic uncertainties are indicated by the error bars and shaded regions, respectively. |

png pdf |
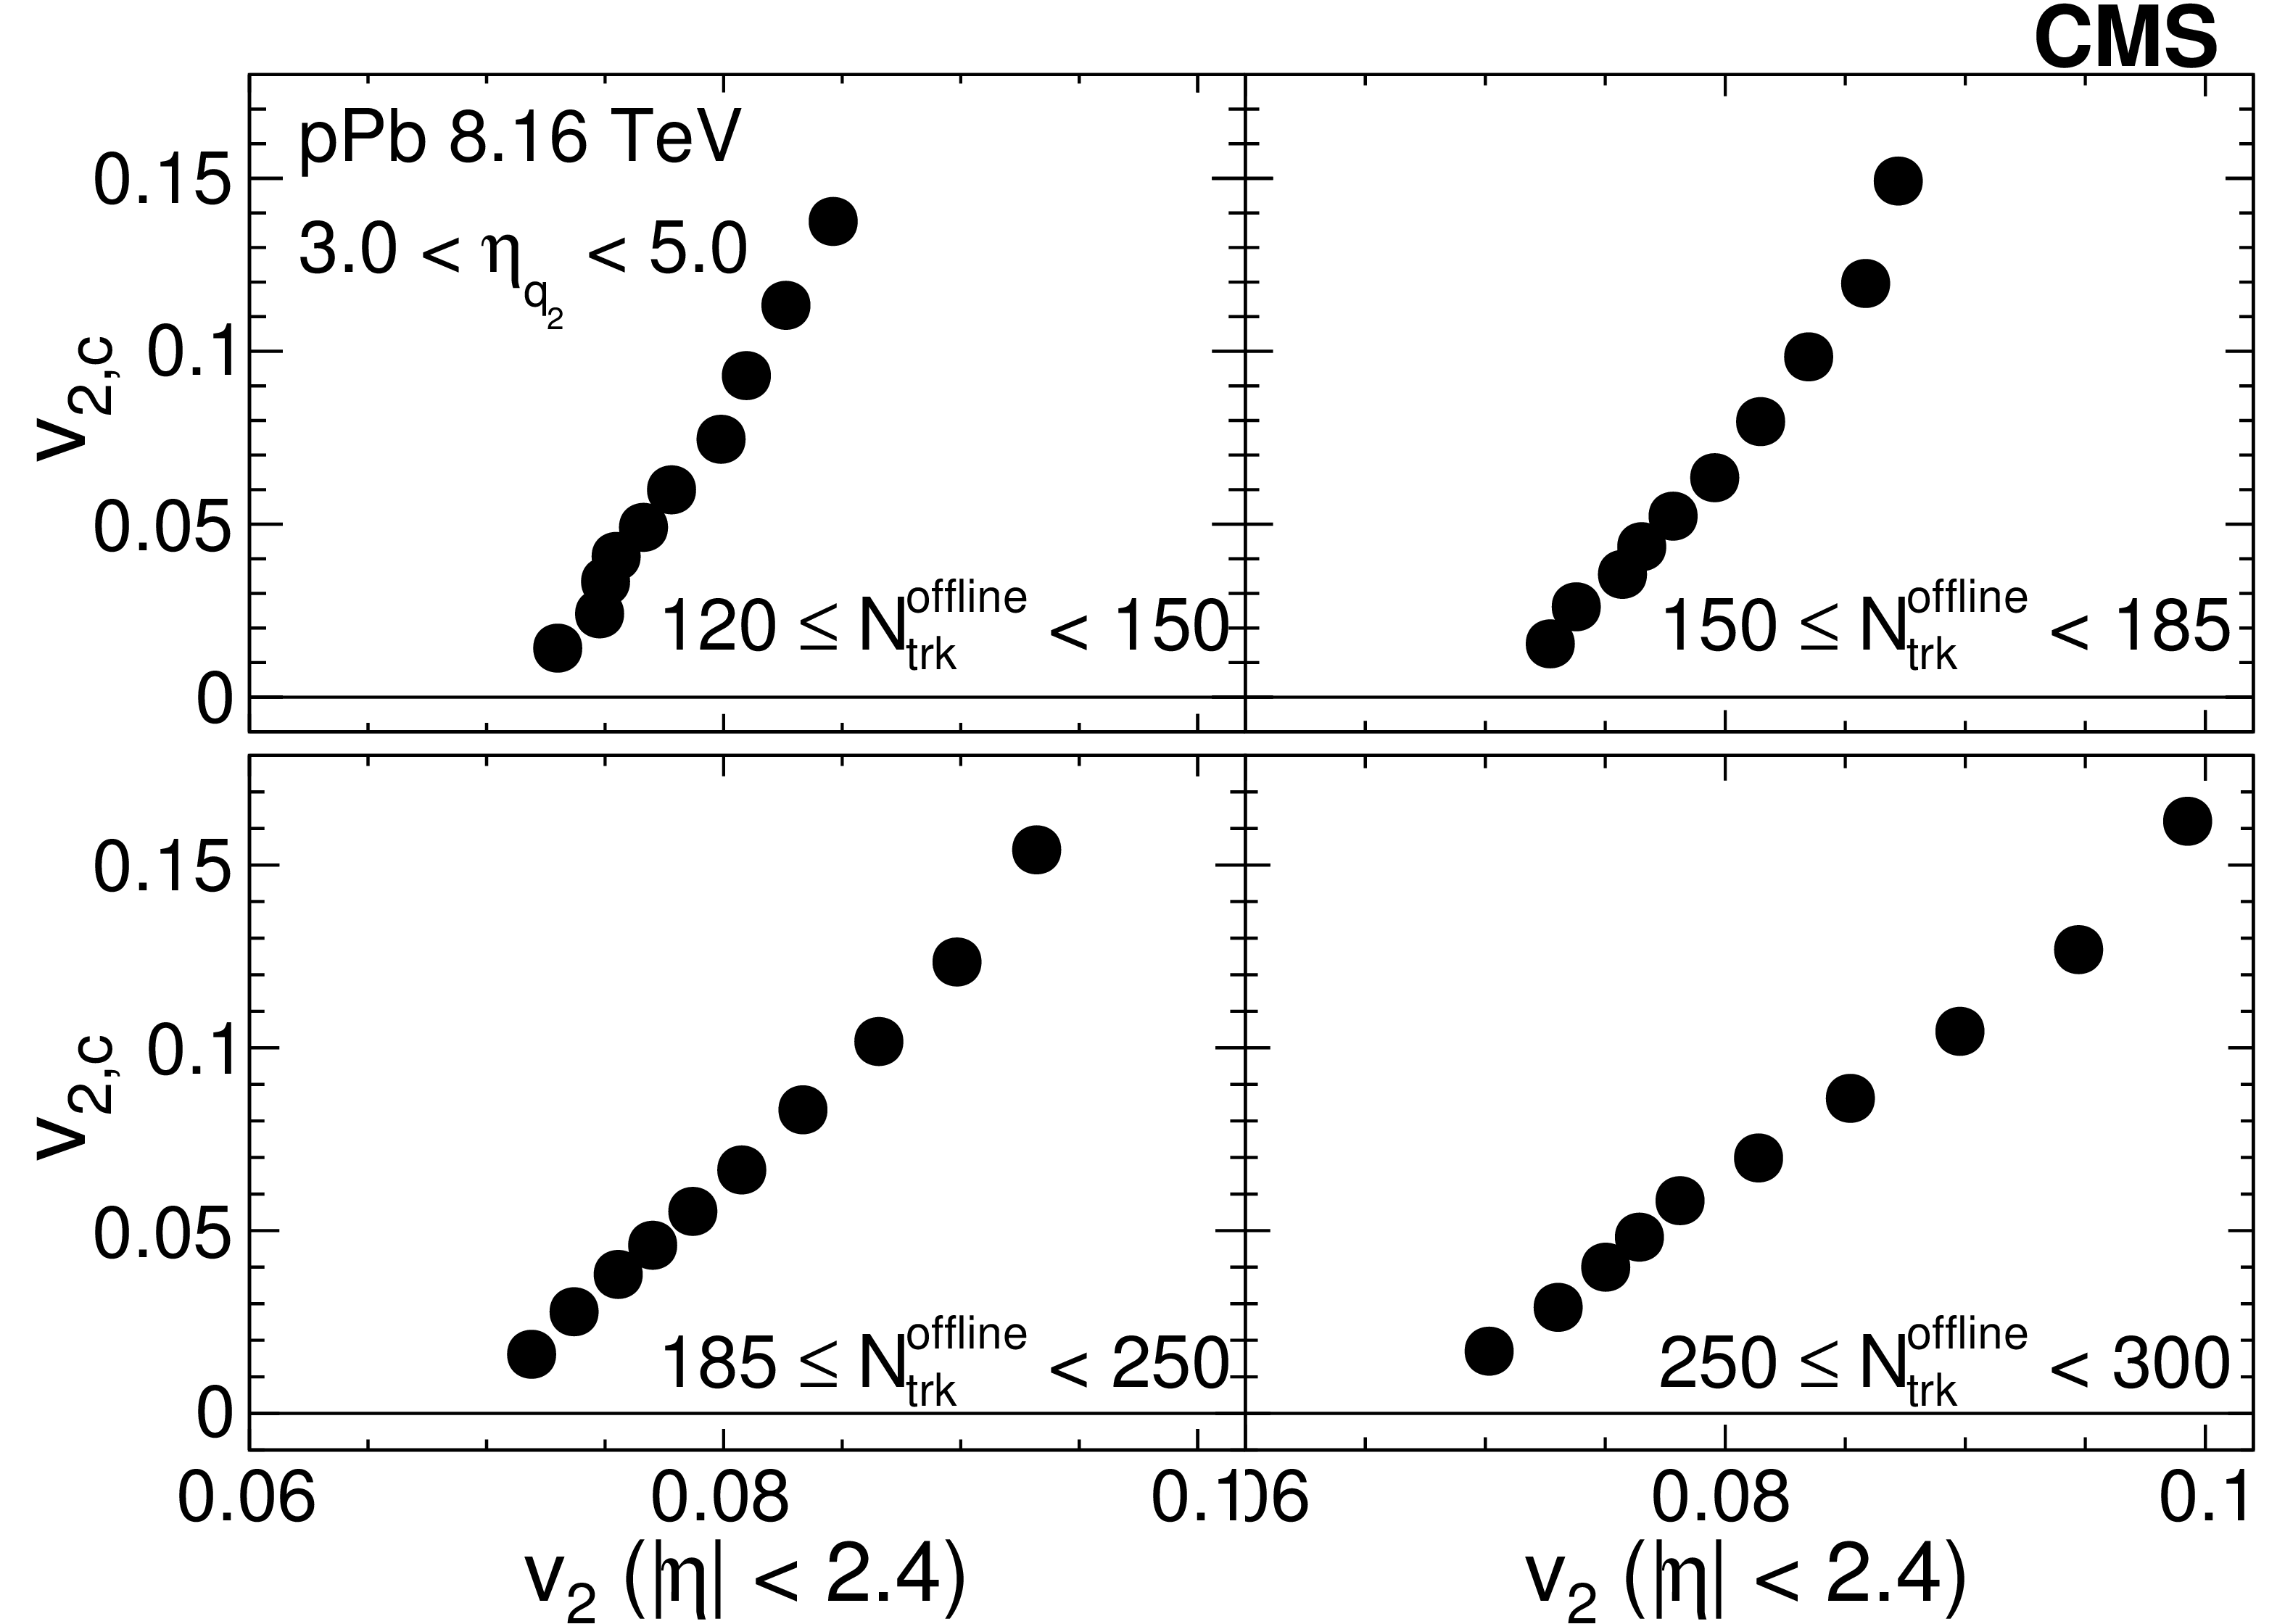
Figure 17:
The $v_{2,c}$ using particle $c$ from HF$+$ and HF$-$ data are shown as a function of $v_{2}$ in the tracker region ($|\eta |<2.4$) in PbPb collisions at $ {\sqrt {{s_{_{\mathrm {NN}}}}}}= $ 5.02 TeV. |
png pdf |
Figure 18:
The $v_{2,c}$ using particle $c$ from the Pb-going side of the HF (4.4 $ < \eta < $ 5.0) data are shown as a function of $v_{2}$ in the tracker region ($|\eta |< $ 2.4) in pPb collisions at $ {\sqrt {{s_{_{\mathrm {NN}}}}}} = $ 8.16 TeV. |

png pdf |
Figure 19:
The average multiplicity $ {N_\text {trk}^\text {offline}} $ as a function of $v_2$ evaluated in each $q_2$ class, for different multiplicity ranges in pPb collisions at $ {\sqrt {{s_{_{\mathrm {NN}}}}}} = $ 8.16 TeV (upper), and for different centrality classes in PbPb collisions at 5.02 TeV (lower). Statistical uncertainties are invisible on the current scale. |

png pdf |
Figure 19-a:
The average multiplicity $ {N_\text {trk}^\text {offline}} $ as a function of $v_2$ evaluated in each $q_2$ class, for different multiplicity ranges in pPb collisions at $ {\sqrt {{s_{_{\mathrm {NN}}}}}} = $ 8.16 TeV. Statistical uncertainties are invisible on the current scale. |

png pdf |
Figure 19-b:
The average multiplicity $ {N_\text {trk}^\text {offline}} $ as a function of $v_2$ evaluated in each $q_2$ class, for different centrality classes in PbPb collisions at 5.02 TeV. Statistical uncertainties are invisible on the current scale. |
png pdf |
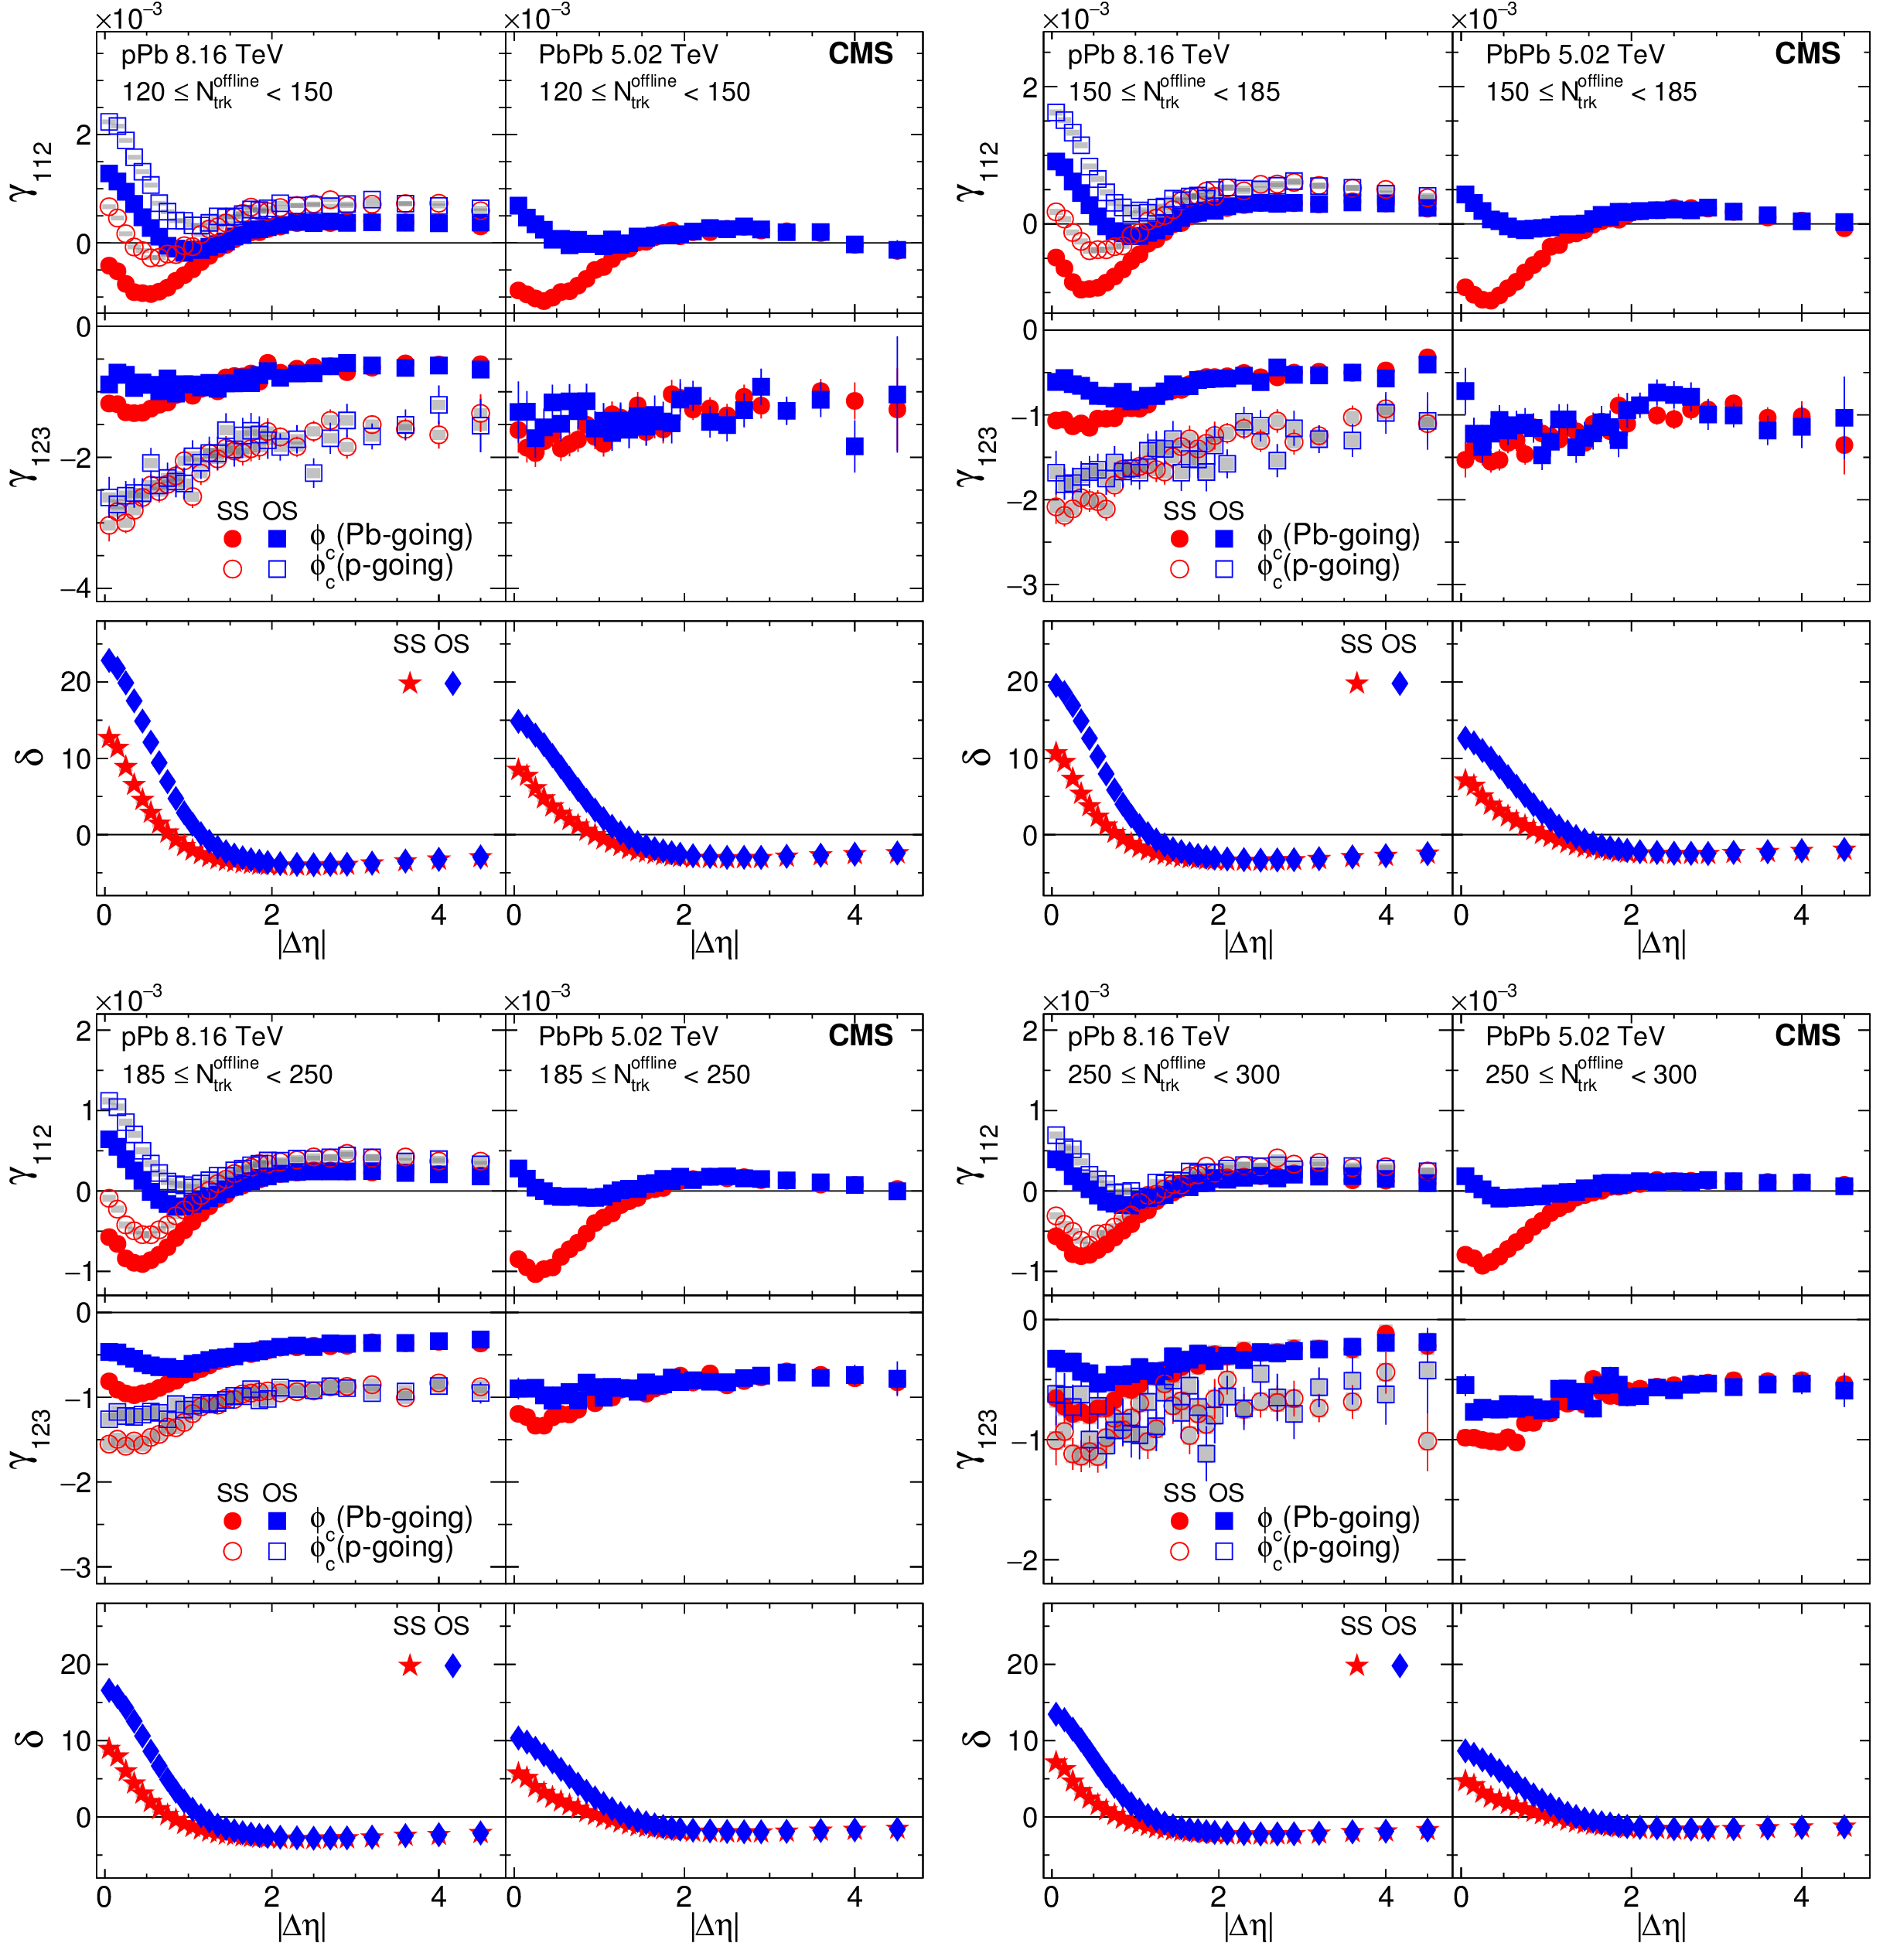
Figure 20:
The SS and OS three-particle correlators, $\gamma _{112}$ (upper) and $\gamma _{123}$ (middle), and two-particle correlator, $\delta $ (lower), as a function of $ {| {\Delta \eta } | }$ for four multiplicity ranges in pPb collisions at $ {\sqrt {{s_{_{\mathrm {NN}}}}}} = $ 8.16 TeV (left) and PbPb collisions at 5.02 TeV (right). The pPb results obtained with particle $c$ in Pb-going (solid markers) and p-going (open markers) sides are shown separately. The SS and OS two-particle correlators are denoted by different markers for both pPb and PbPb collisions. Statistical and systematic uncertainties are indicated by the error bars and shaded regions, respectively. |
png pdf |
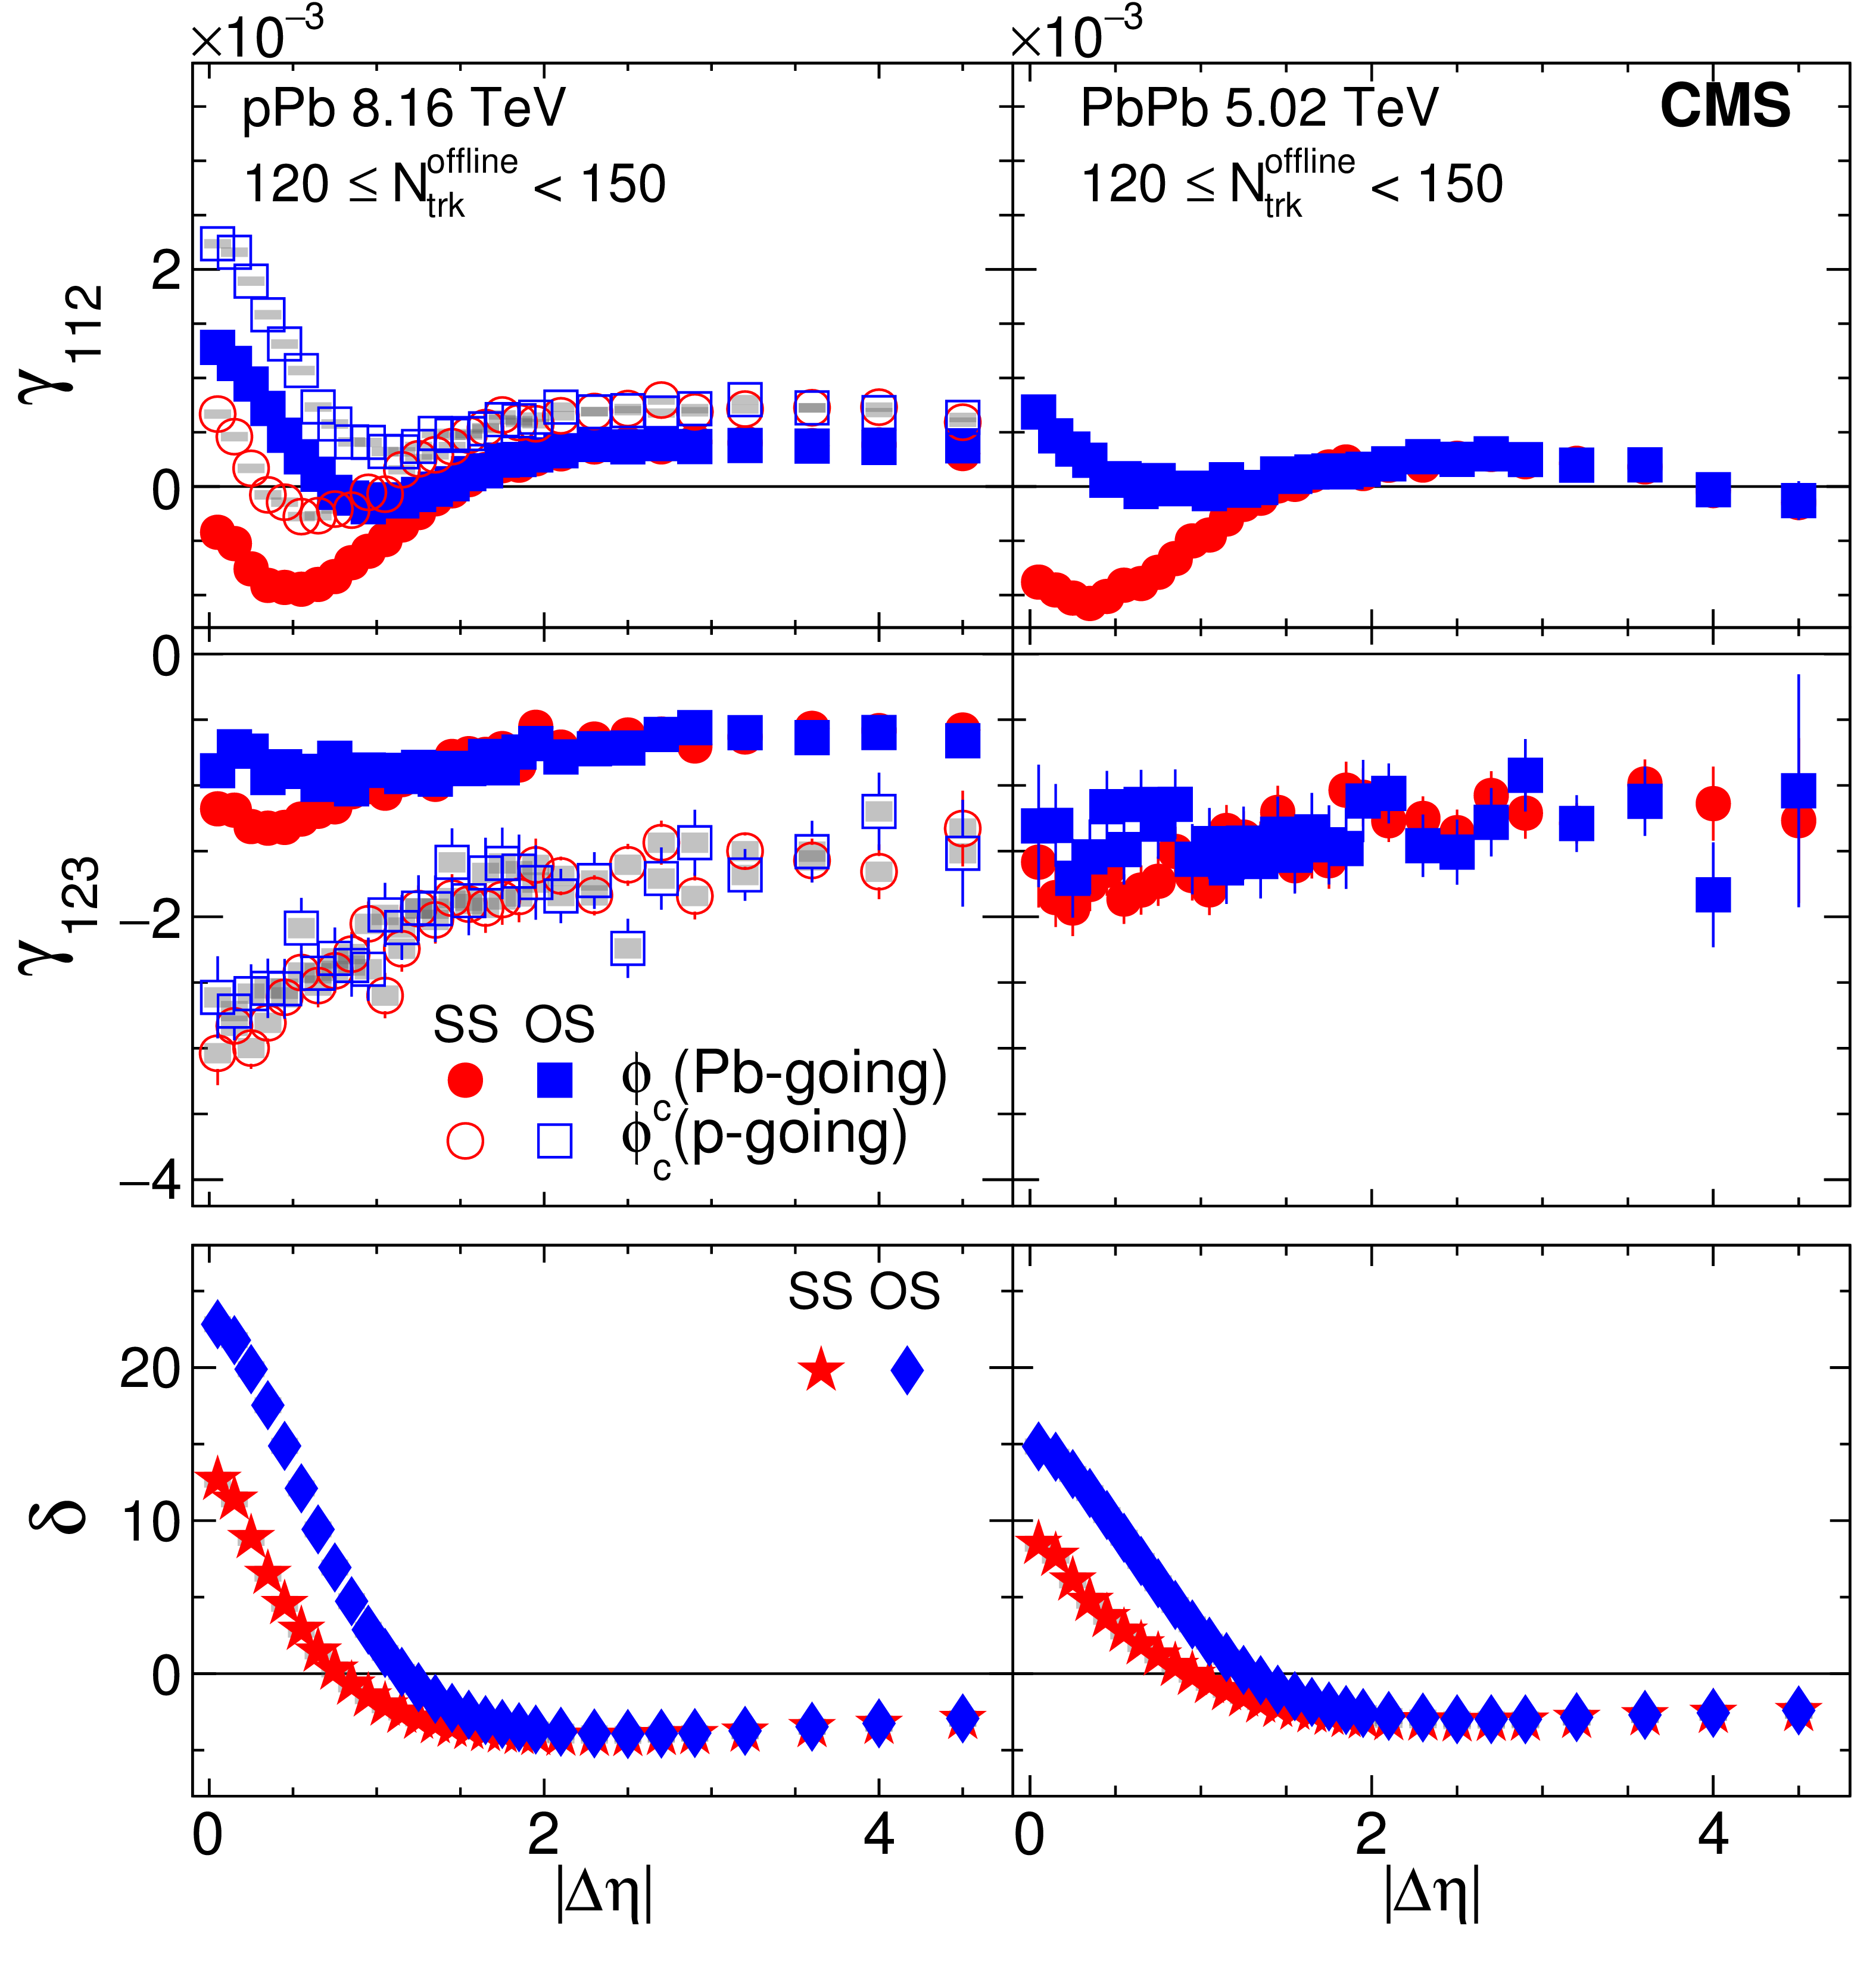
Figure 20-a:
The SS and OS three-particle correlators, $\gamma _{112}$ (upper) and $\gamma _{123}$ (middle), and two-particle correlator, $\delta $ (lower), as a function of $ {| {\Delta \eta } | }$ for 120 $ \leq {N_\text {trk}^\text {offline}} < $ 150 in pPb collisions at $ {\sqrt {{s_{_{\mathrm {NN}}}}}} = $ 8.16 TeV (left) and PbPb collisions at 5.02 TeV (right). The pPb results obtained with particle $c$ in Pb-going (solid markers) and p-going (open markers) sides are shown separately. The SS and OS two-particle correlators are denoted by different markers for both pPb and PbPb collisions. Statistical and systematic uncertainties are indicated by the error bars and shaded regions, respectively. |
png pdf |
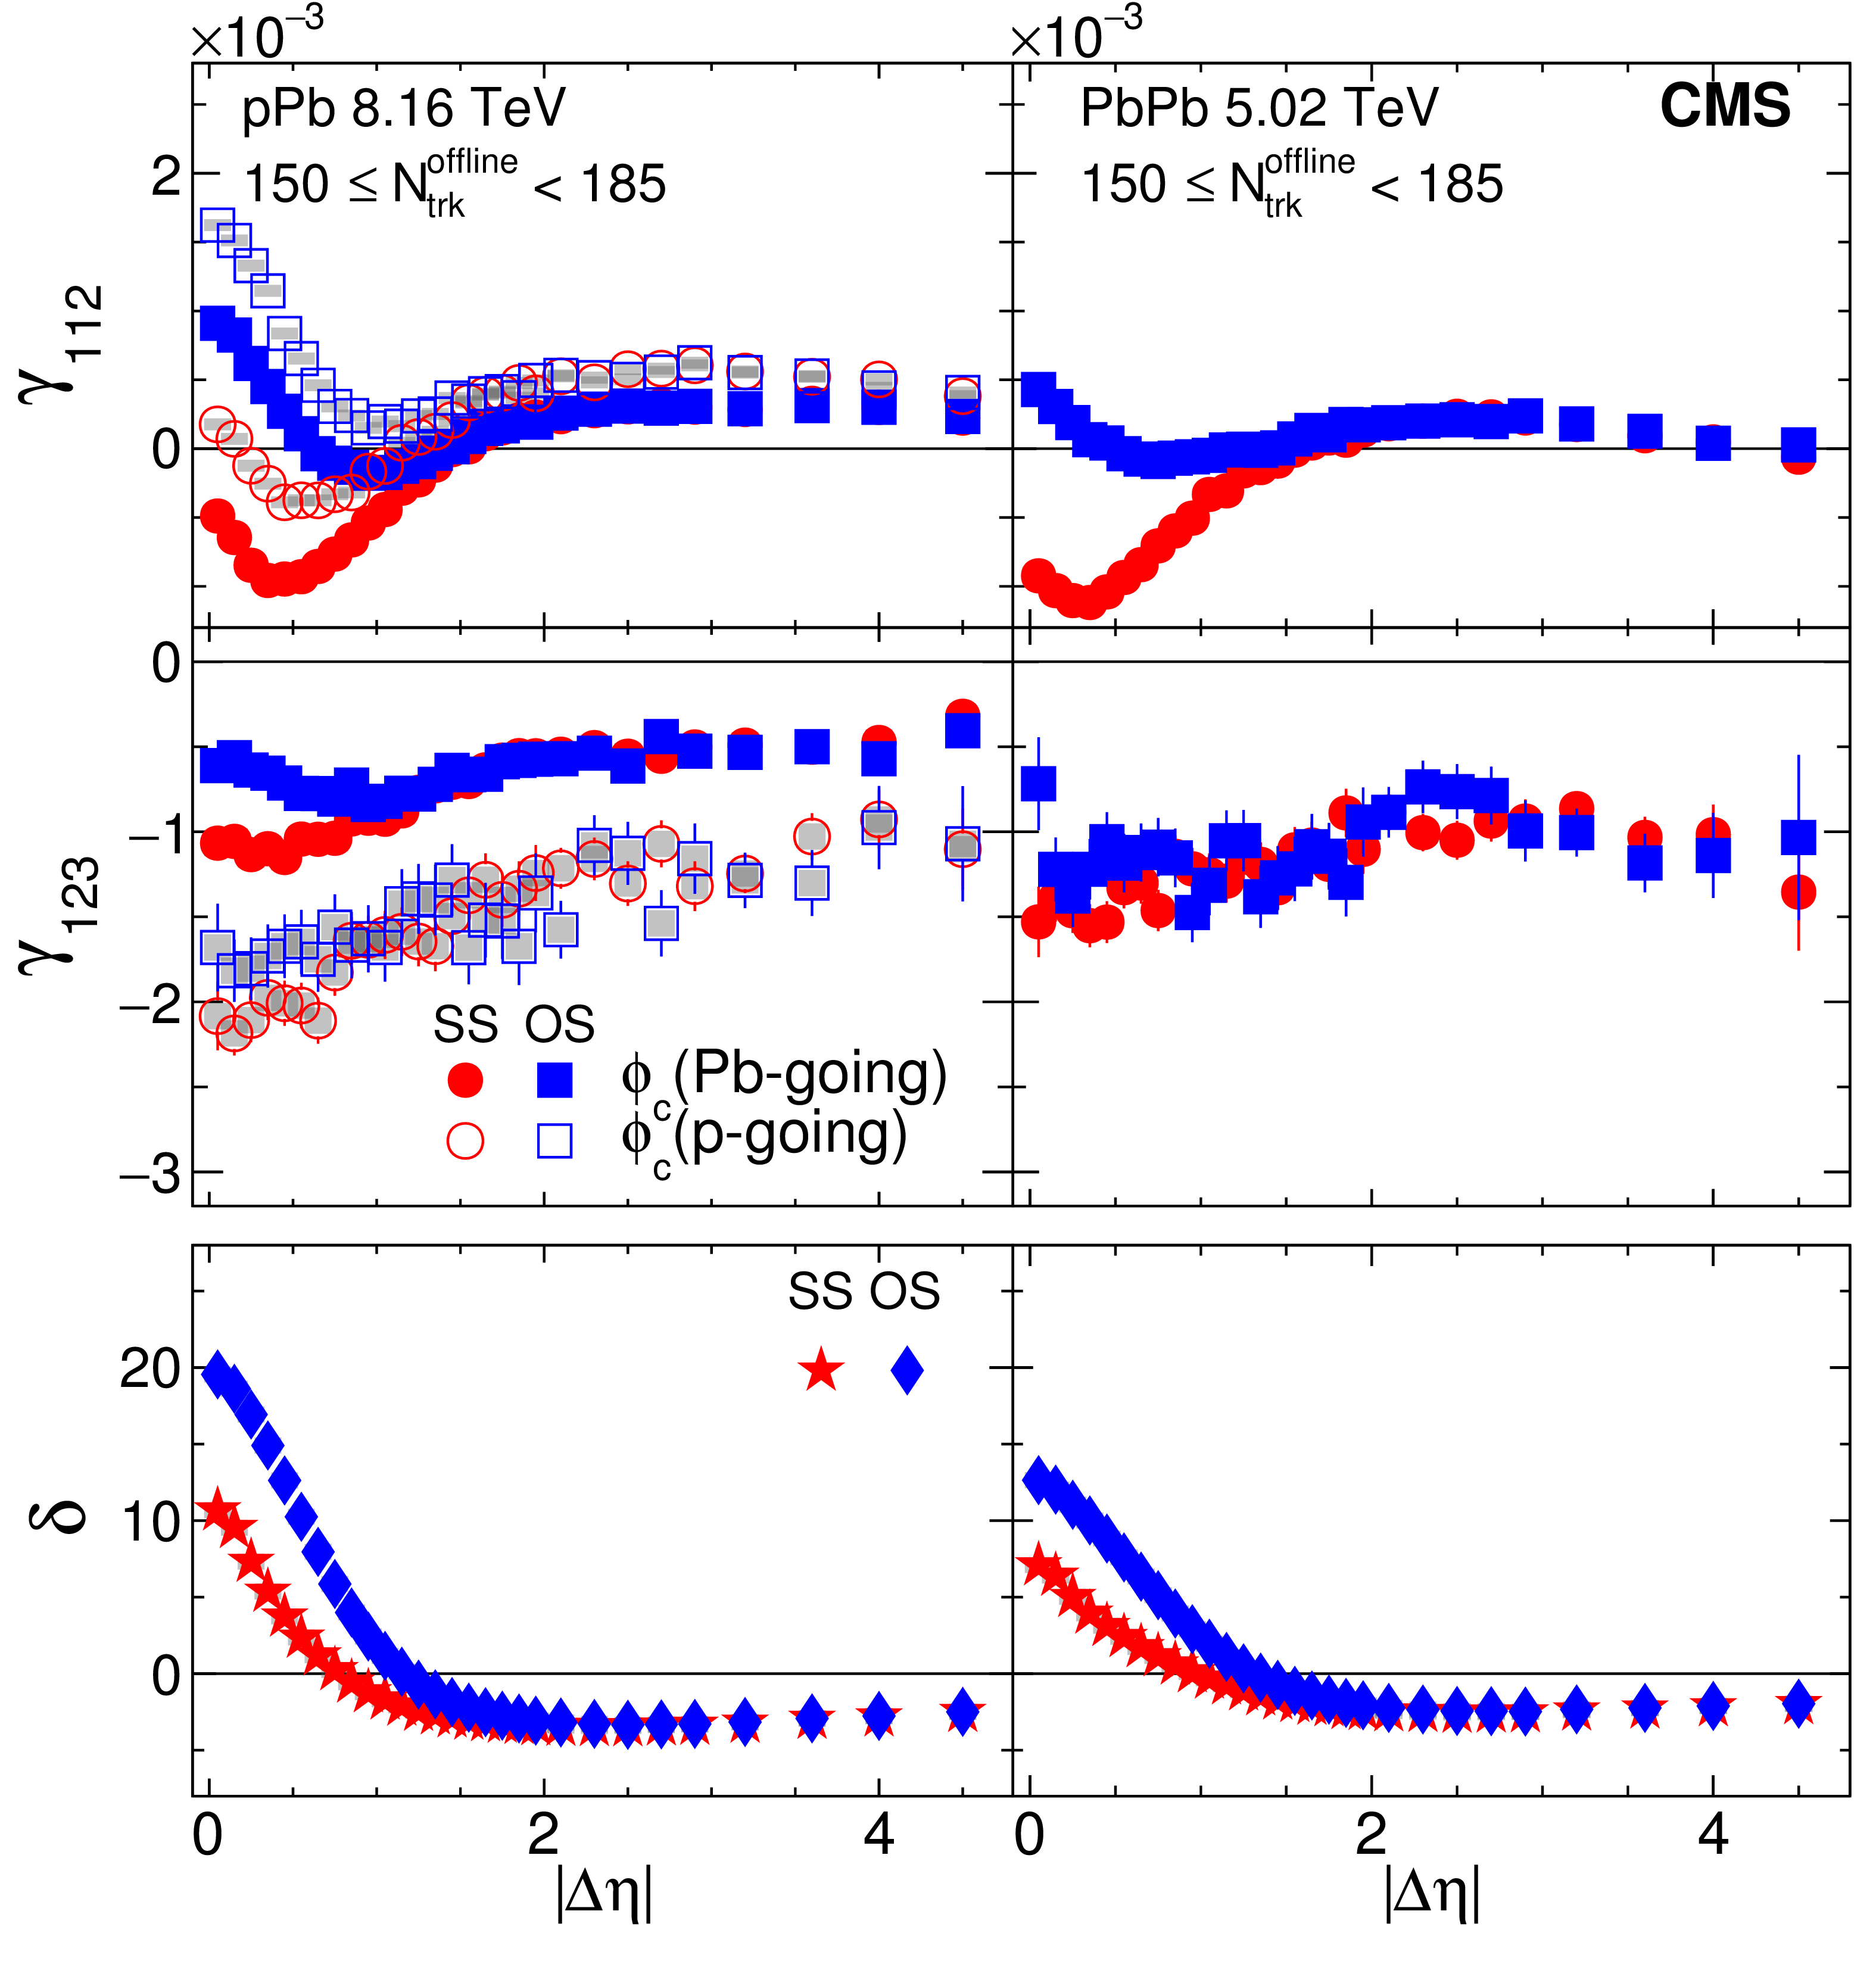
Figure 20-b:
The SS and OS three-particle correlators, $\gamma _{112}$ (upper) and $\gamma _{123}$ (middle), and two-particle correlator, $\delta $ (lower), as a function of $ {| {\Delta \eta } | }$ for 150 $ \leq {N_\text {trk}^\text {offline}} < $ 185 in pPb collisions at $ {\sqrt {{s_{_{\mathrm {NN}}}}}} = $ 8.16 TeV (left) and PbPb collisions at 5.02 TeV (right). The pPb results obtained with particle $c$ in Pb-going (solid markers) and p-going (open markers) sides are shown separately. The SS and OS two-particle correlators are denoted by different markers for both pPb and PbPb collisions. Statistical and systematic uncertainties are indicated by the error bars and shaded regions, respectively. |
png pdf |
Figure 20-c:
The SS and OS three-particle correlators, $\gamma _{112}$ (upper) and $\gamma _{123}$ (middle), and two-particle correlator, $\delta $ (lower), as a function of $ {| {\Delta \eta } | }$ for 185 $ \leq {N_\text {trk}^\text {offline}} < $ 250 in pPb collisions at $ {\sqrt {{s_{_{\mathrm {NN}}}}}} = $ 8.16 TeV (left) and PbPb collisions at 5.02 TeV (right). The pPb results obtained with particle $c$ in Pb-going (solid markers) and p-going (open markers) sides are shown separately. The SS and OS two-particle correlators are denoted by different markers for both pPb and PbPb collisions. Statistical and systematic uncertainties are indicated by the error bars and shaded regions, respectively. |
png pdf |
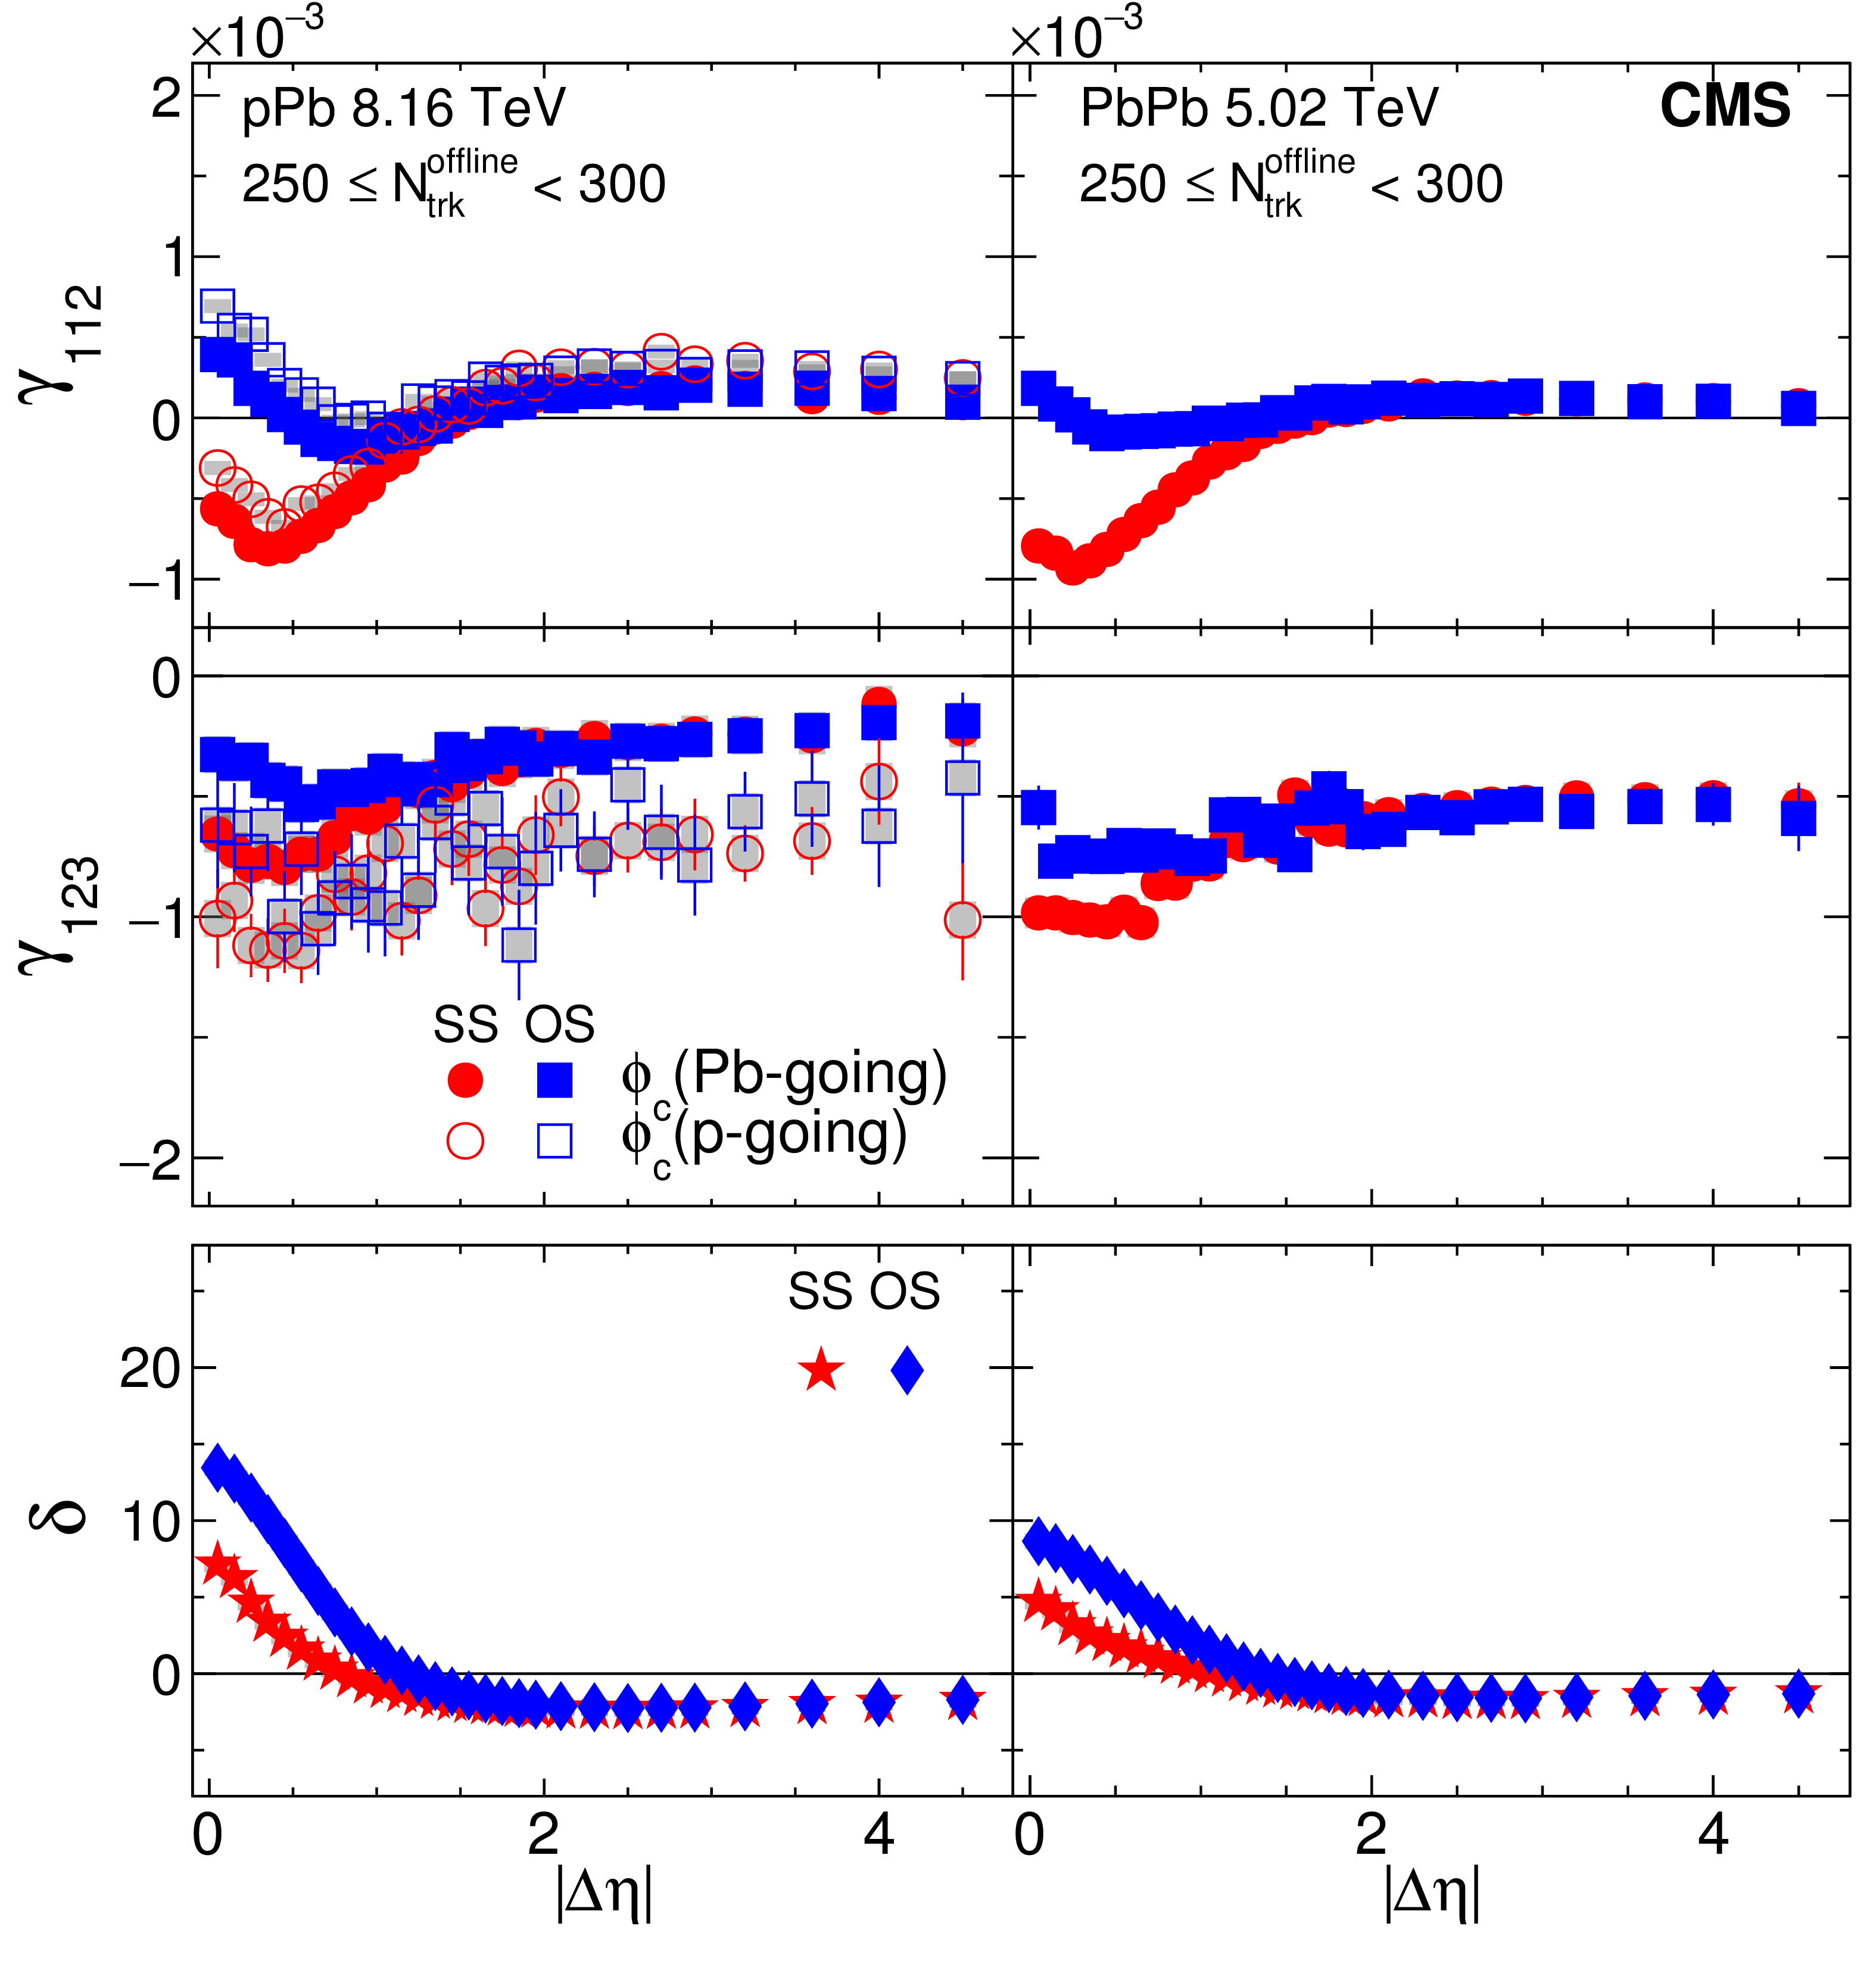
Figure 20-d:
The SS and OS three-particle correlators, $\gamma _{112}$ (upper) and $\gamma _{123}$ (middle), and two-particle correlator, $\delta $ (lower), as a function of $ {| {\Delta \eta } | }$ for 250 $ \leq {N_\text {trk}^\text {offline}} < $ 300 in pPb collisions at $ {\sqrt {{s_{_{\mathrm {NN}}}}}} = $ 8.16 TeV (left) and PbPb collisions at 5.02 TeV (right). The pPb results obtained with particle $c$ in Pb-going (solid markers) and p-going (open markers) sides are shown separately. The SS and OS two-particle correlators are denoted by different markers for both pPb and PbPb collisions. Statistical and systematic uncertainties are indicated by the error bars and shaded regions, respectively. |
png pdf |
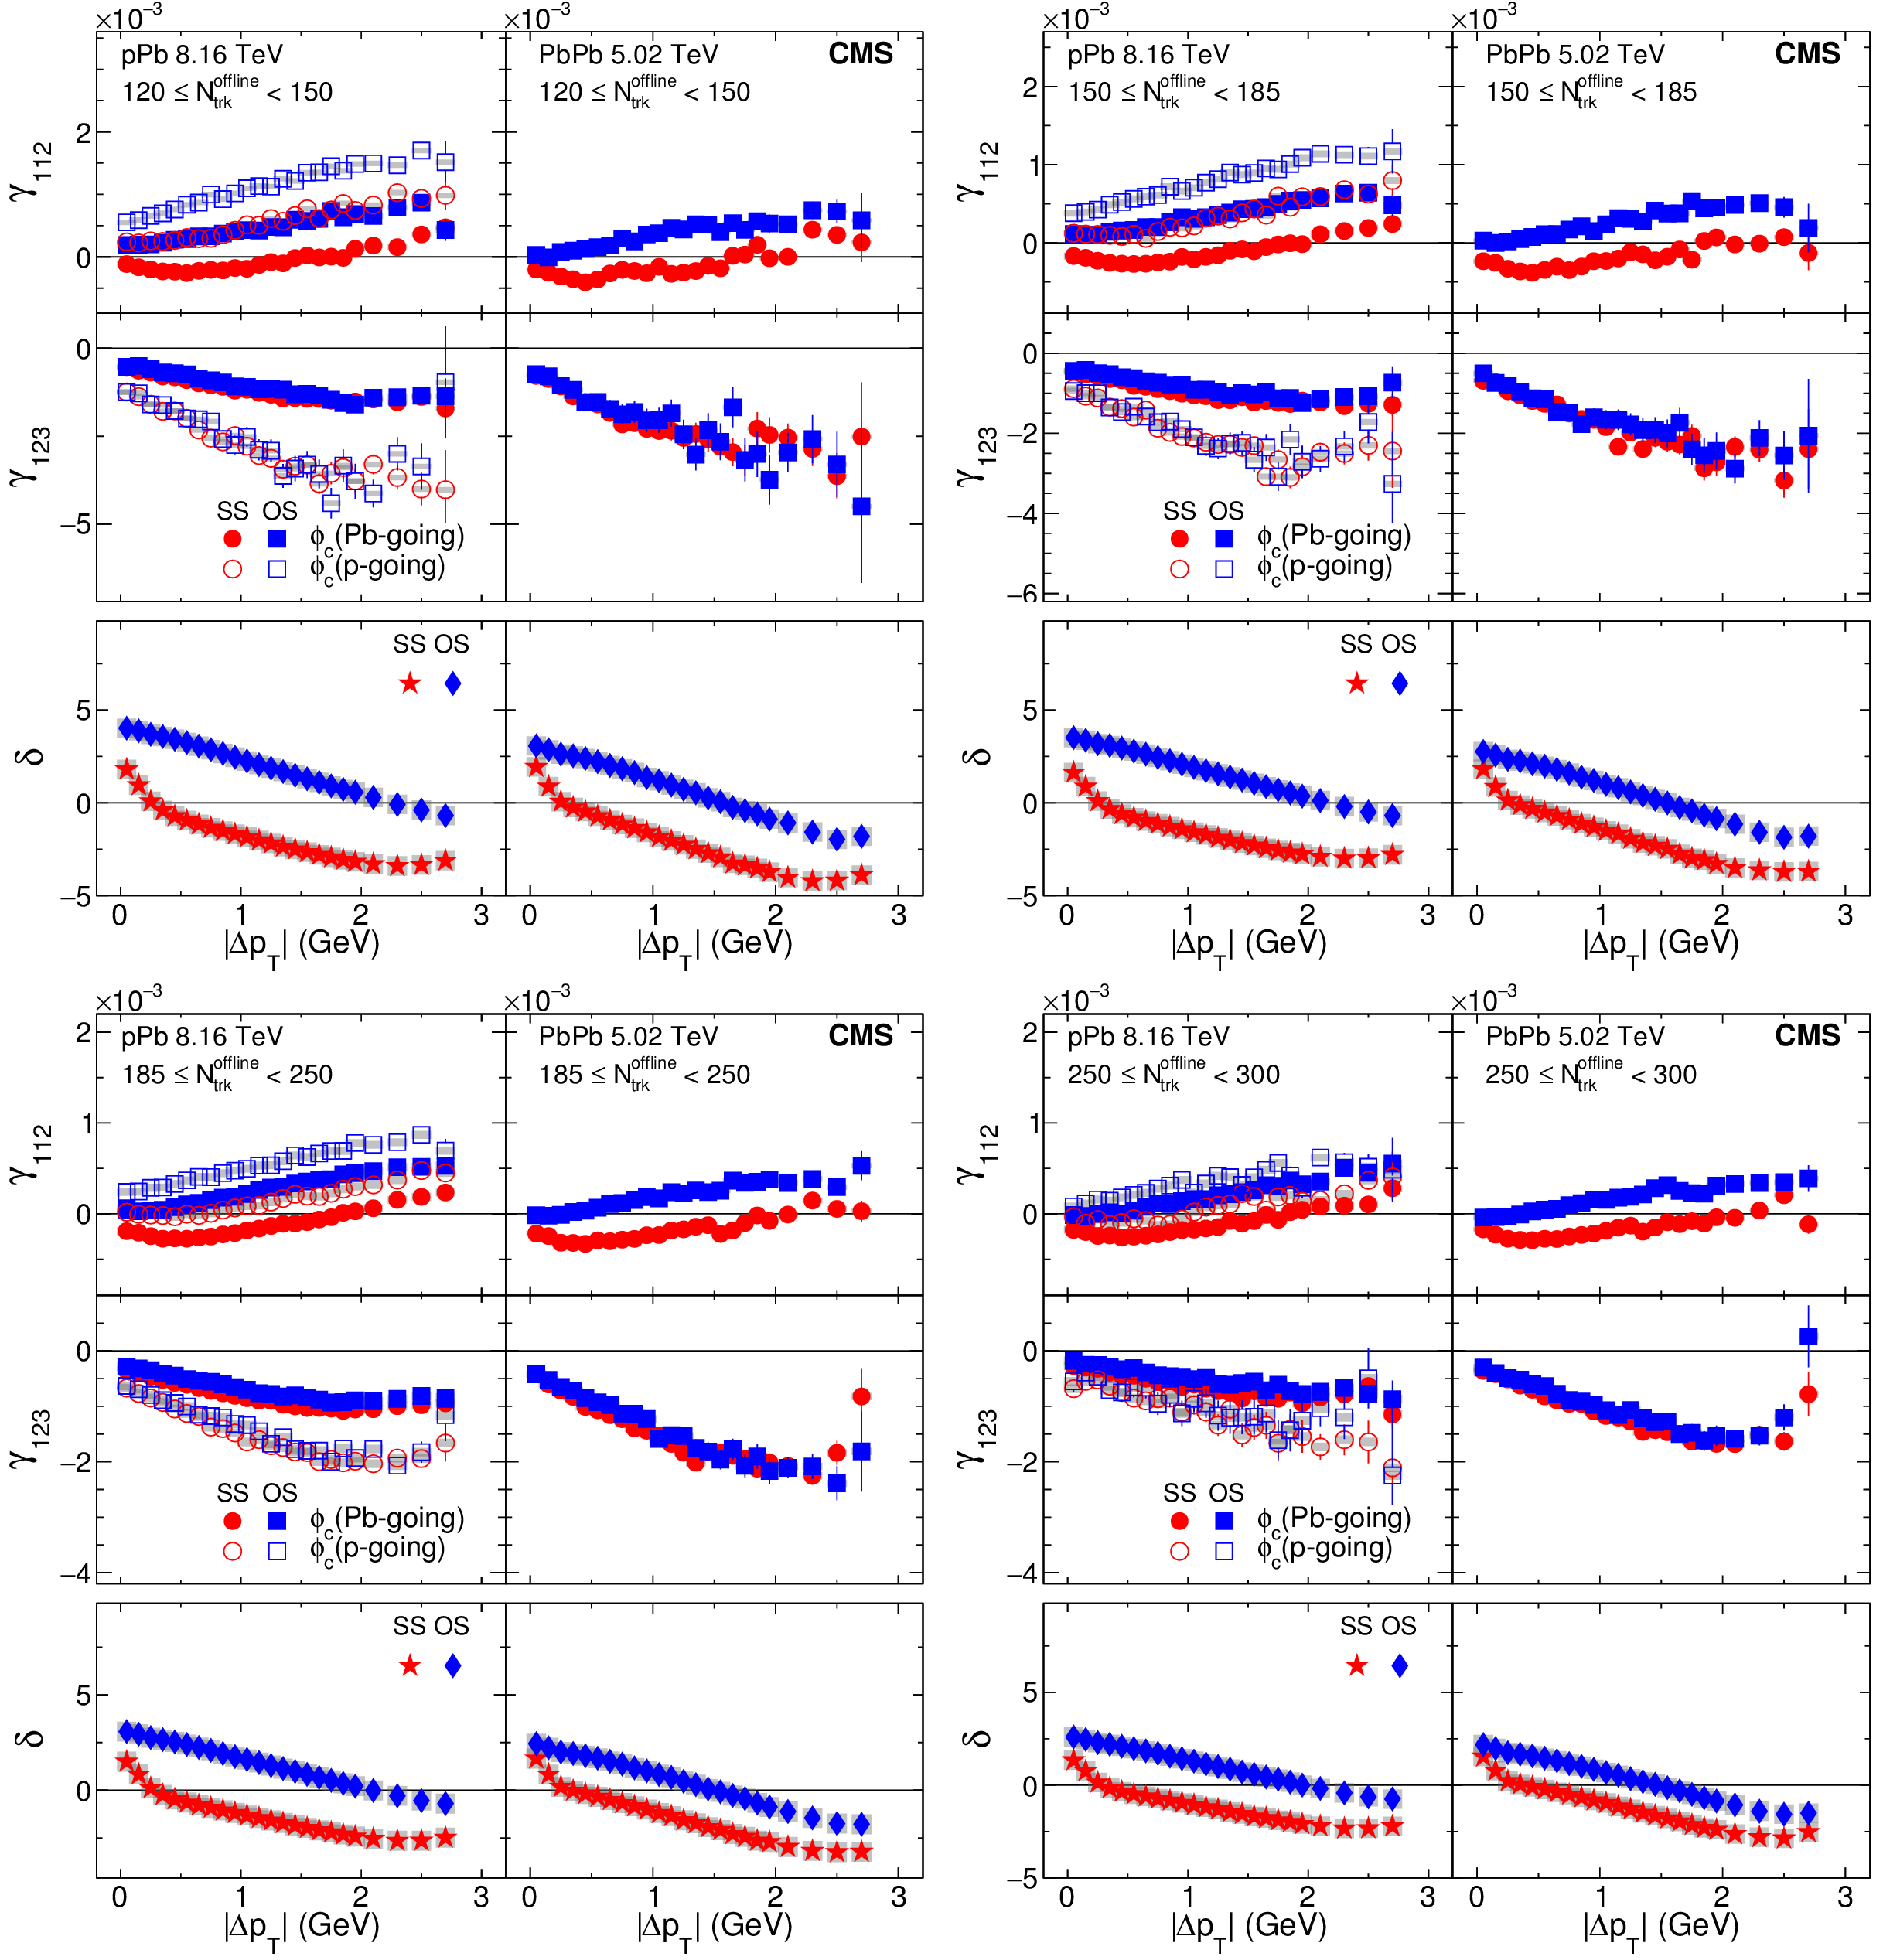
Figure 21:
The SS and OS three-particle correlators, $\gamma _{112}$ (upper) and $\gamma _{123}$ (middle), and two-particle correlator, $\delta $ (lower), as a function of $ {| \Delta {p_{\mathrm {T}}} | } $ for four multiplicity ranges in pPb collisions at $ {\sqrt {{s_{_{\mathrm {NN}}}}}} = $ 8.16 TeV (left) and PbPb collisions at 5.02 TeV (right). The pPb results obtained with particle $c$ in Pb-going (solid markers) and p-going (open markers) sides are shown separately. The SS and OS two-particle correlators are denoted by different markers for both pPb and PbPb collisions. Statistical and systematic uncertainties are indicated by the error bars and shaded regions, respectively. |
png pdf |
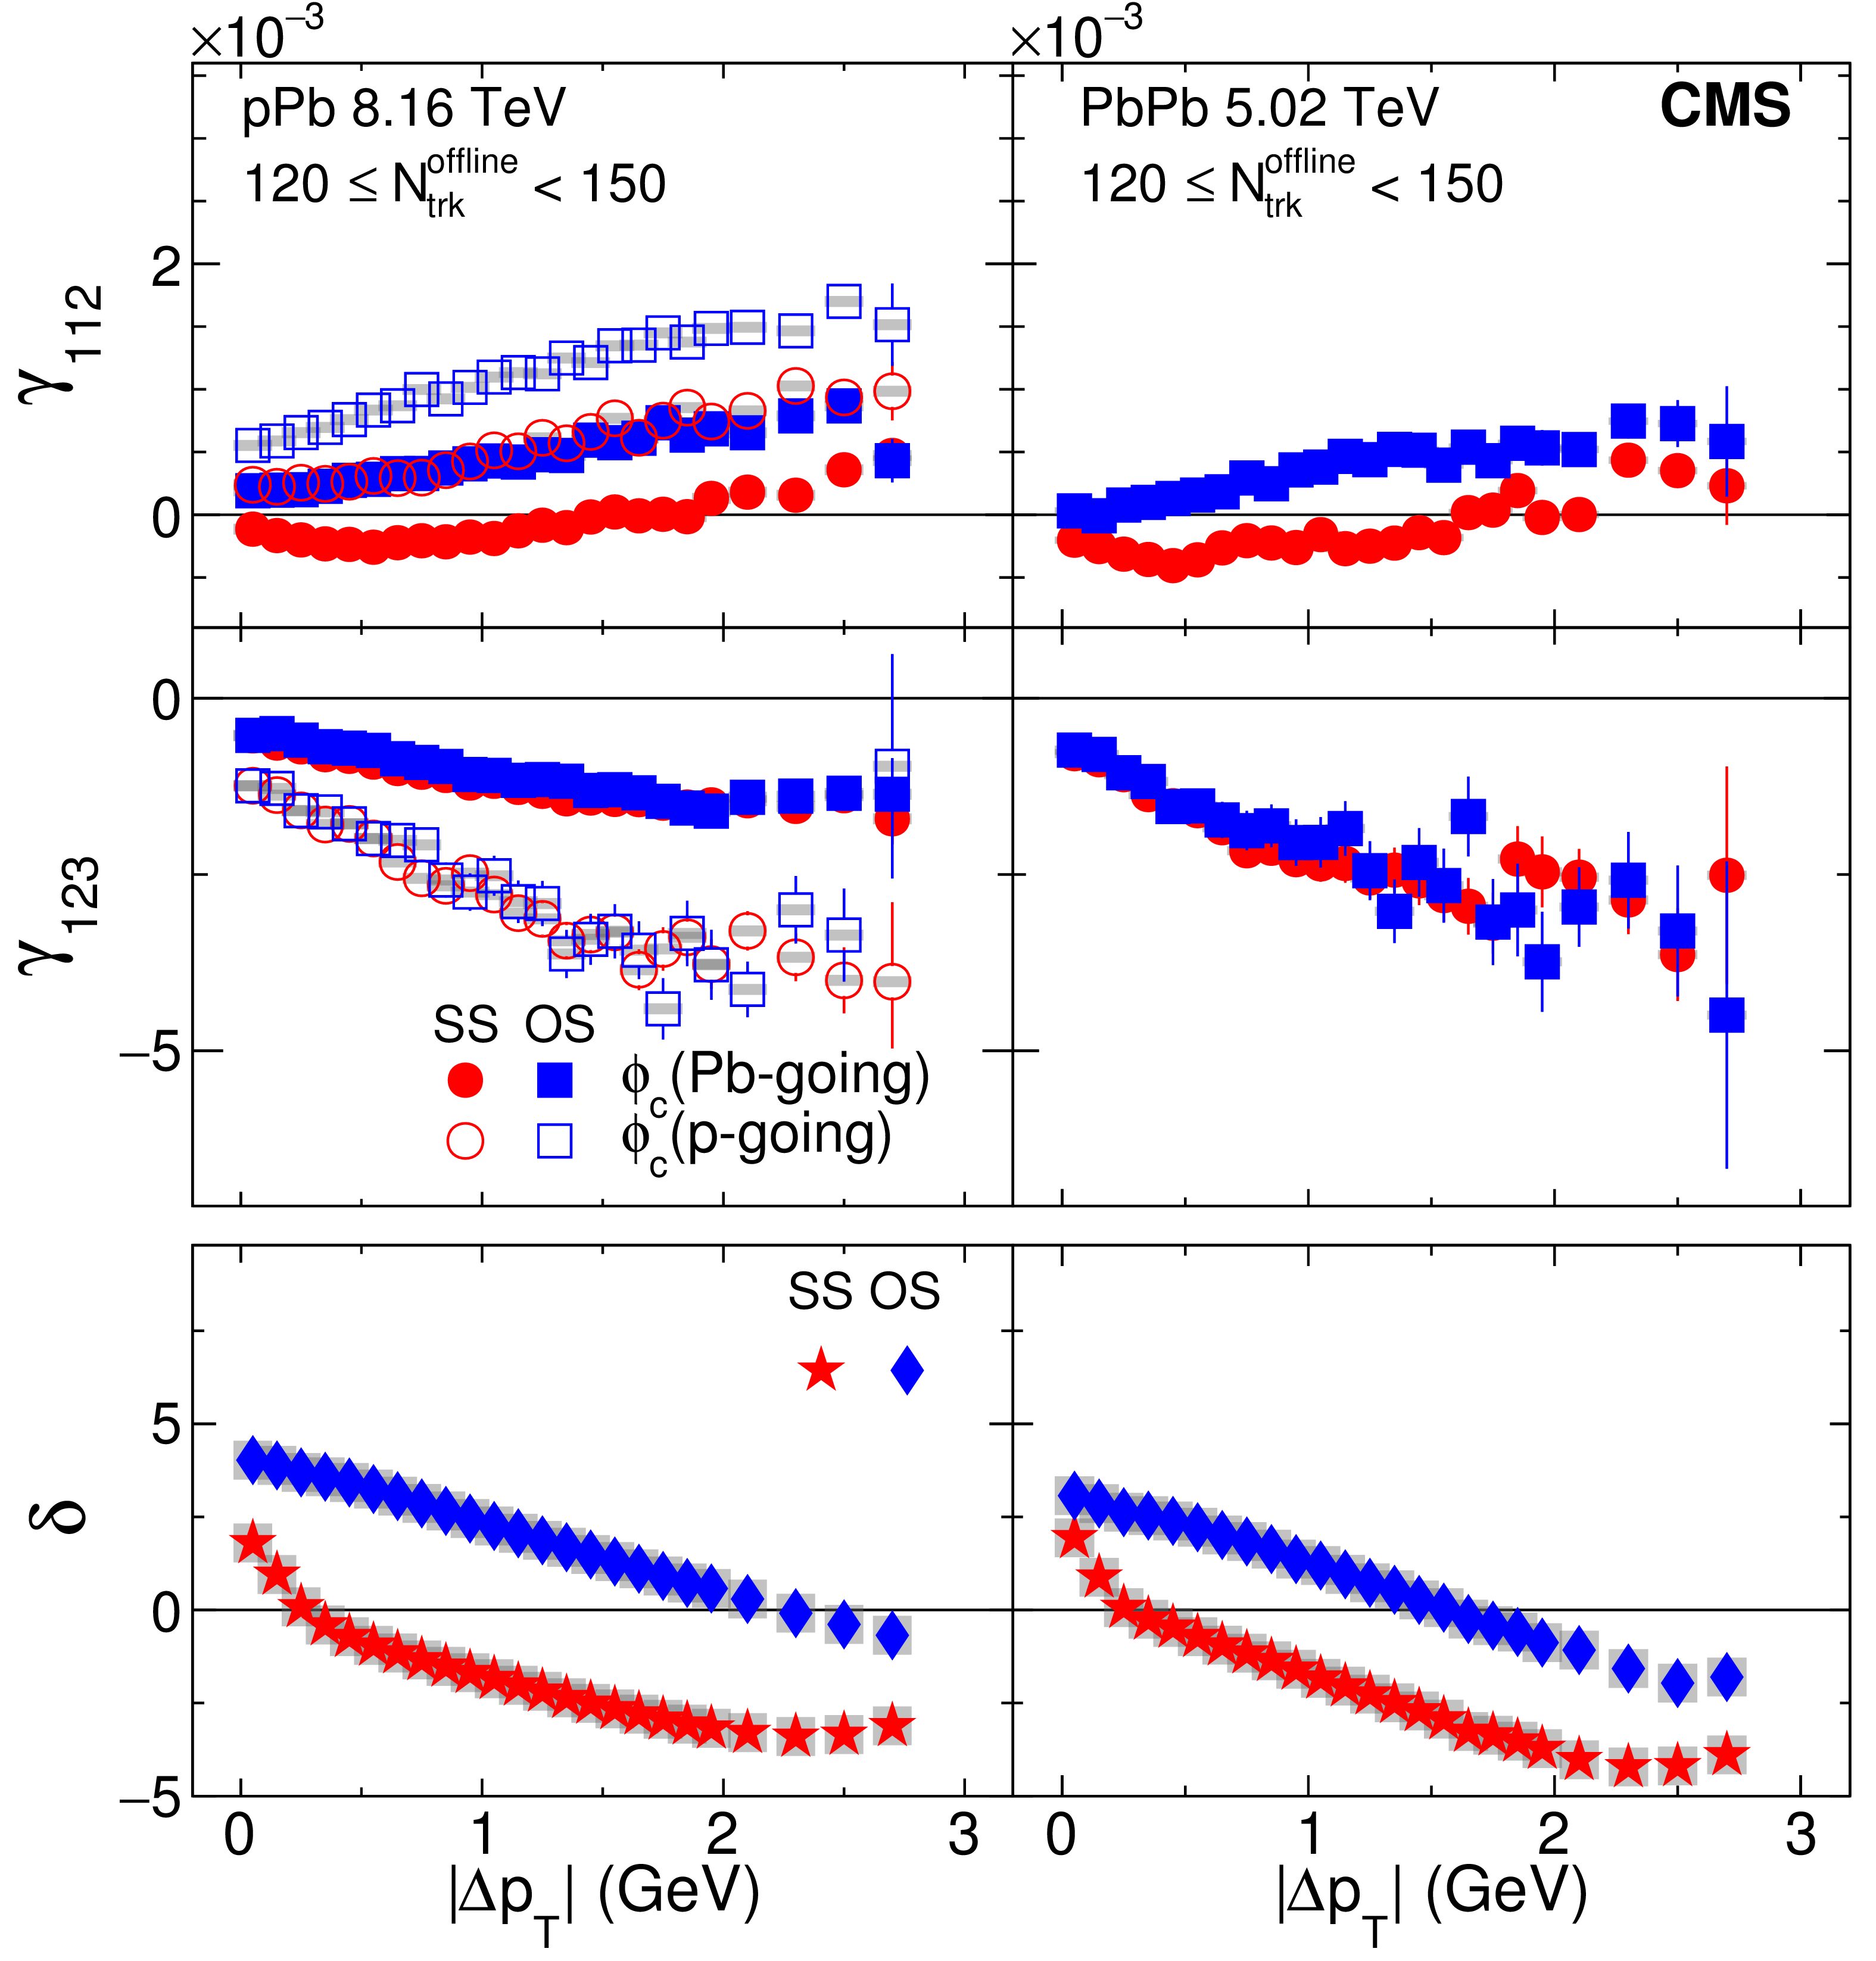
Figure 21-a:
The SS and OS three-particle correlators, $\gamma _{112}$ (upper) and $\gamma _{123}$ (middle), and two-particle correlator, $\delta $ (lower), as a function of $ {| \Delta {p_{\mathrm {T}}} | } $ for 120 $ \leq {N_\text {trk}^\text {offline}} < $ 150 in pPb collisions at $ {\sqrt {{s_{_{\mathrm {NN}}}}}} = $ 8.16 TeV (left) and PbPb collisions at 5.02 TeV (right). The pPb results obtained with particle $c$ in Pb-going (solid markers) and p-going (open markers) sides are shown separately. The SS and OS two-particle correlators are denoted by different markers for both pPb and PbPb collisions. Statistical and systematic uncertainties are indicated by the error bars and shaded regions, respectively. |
png pdf |
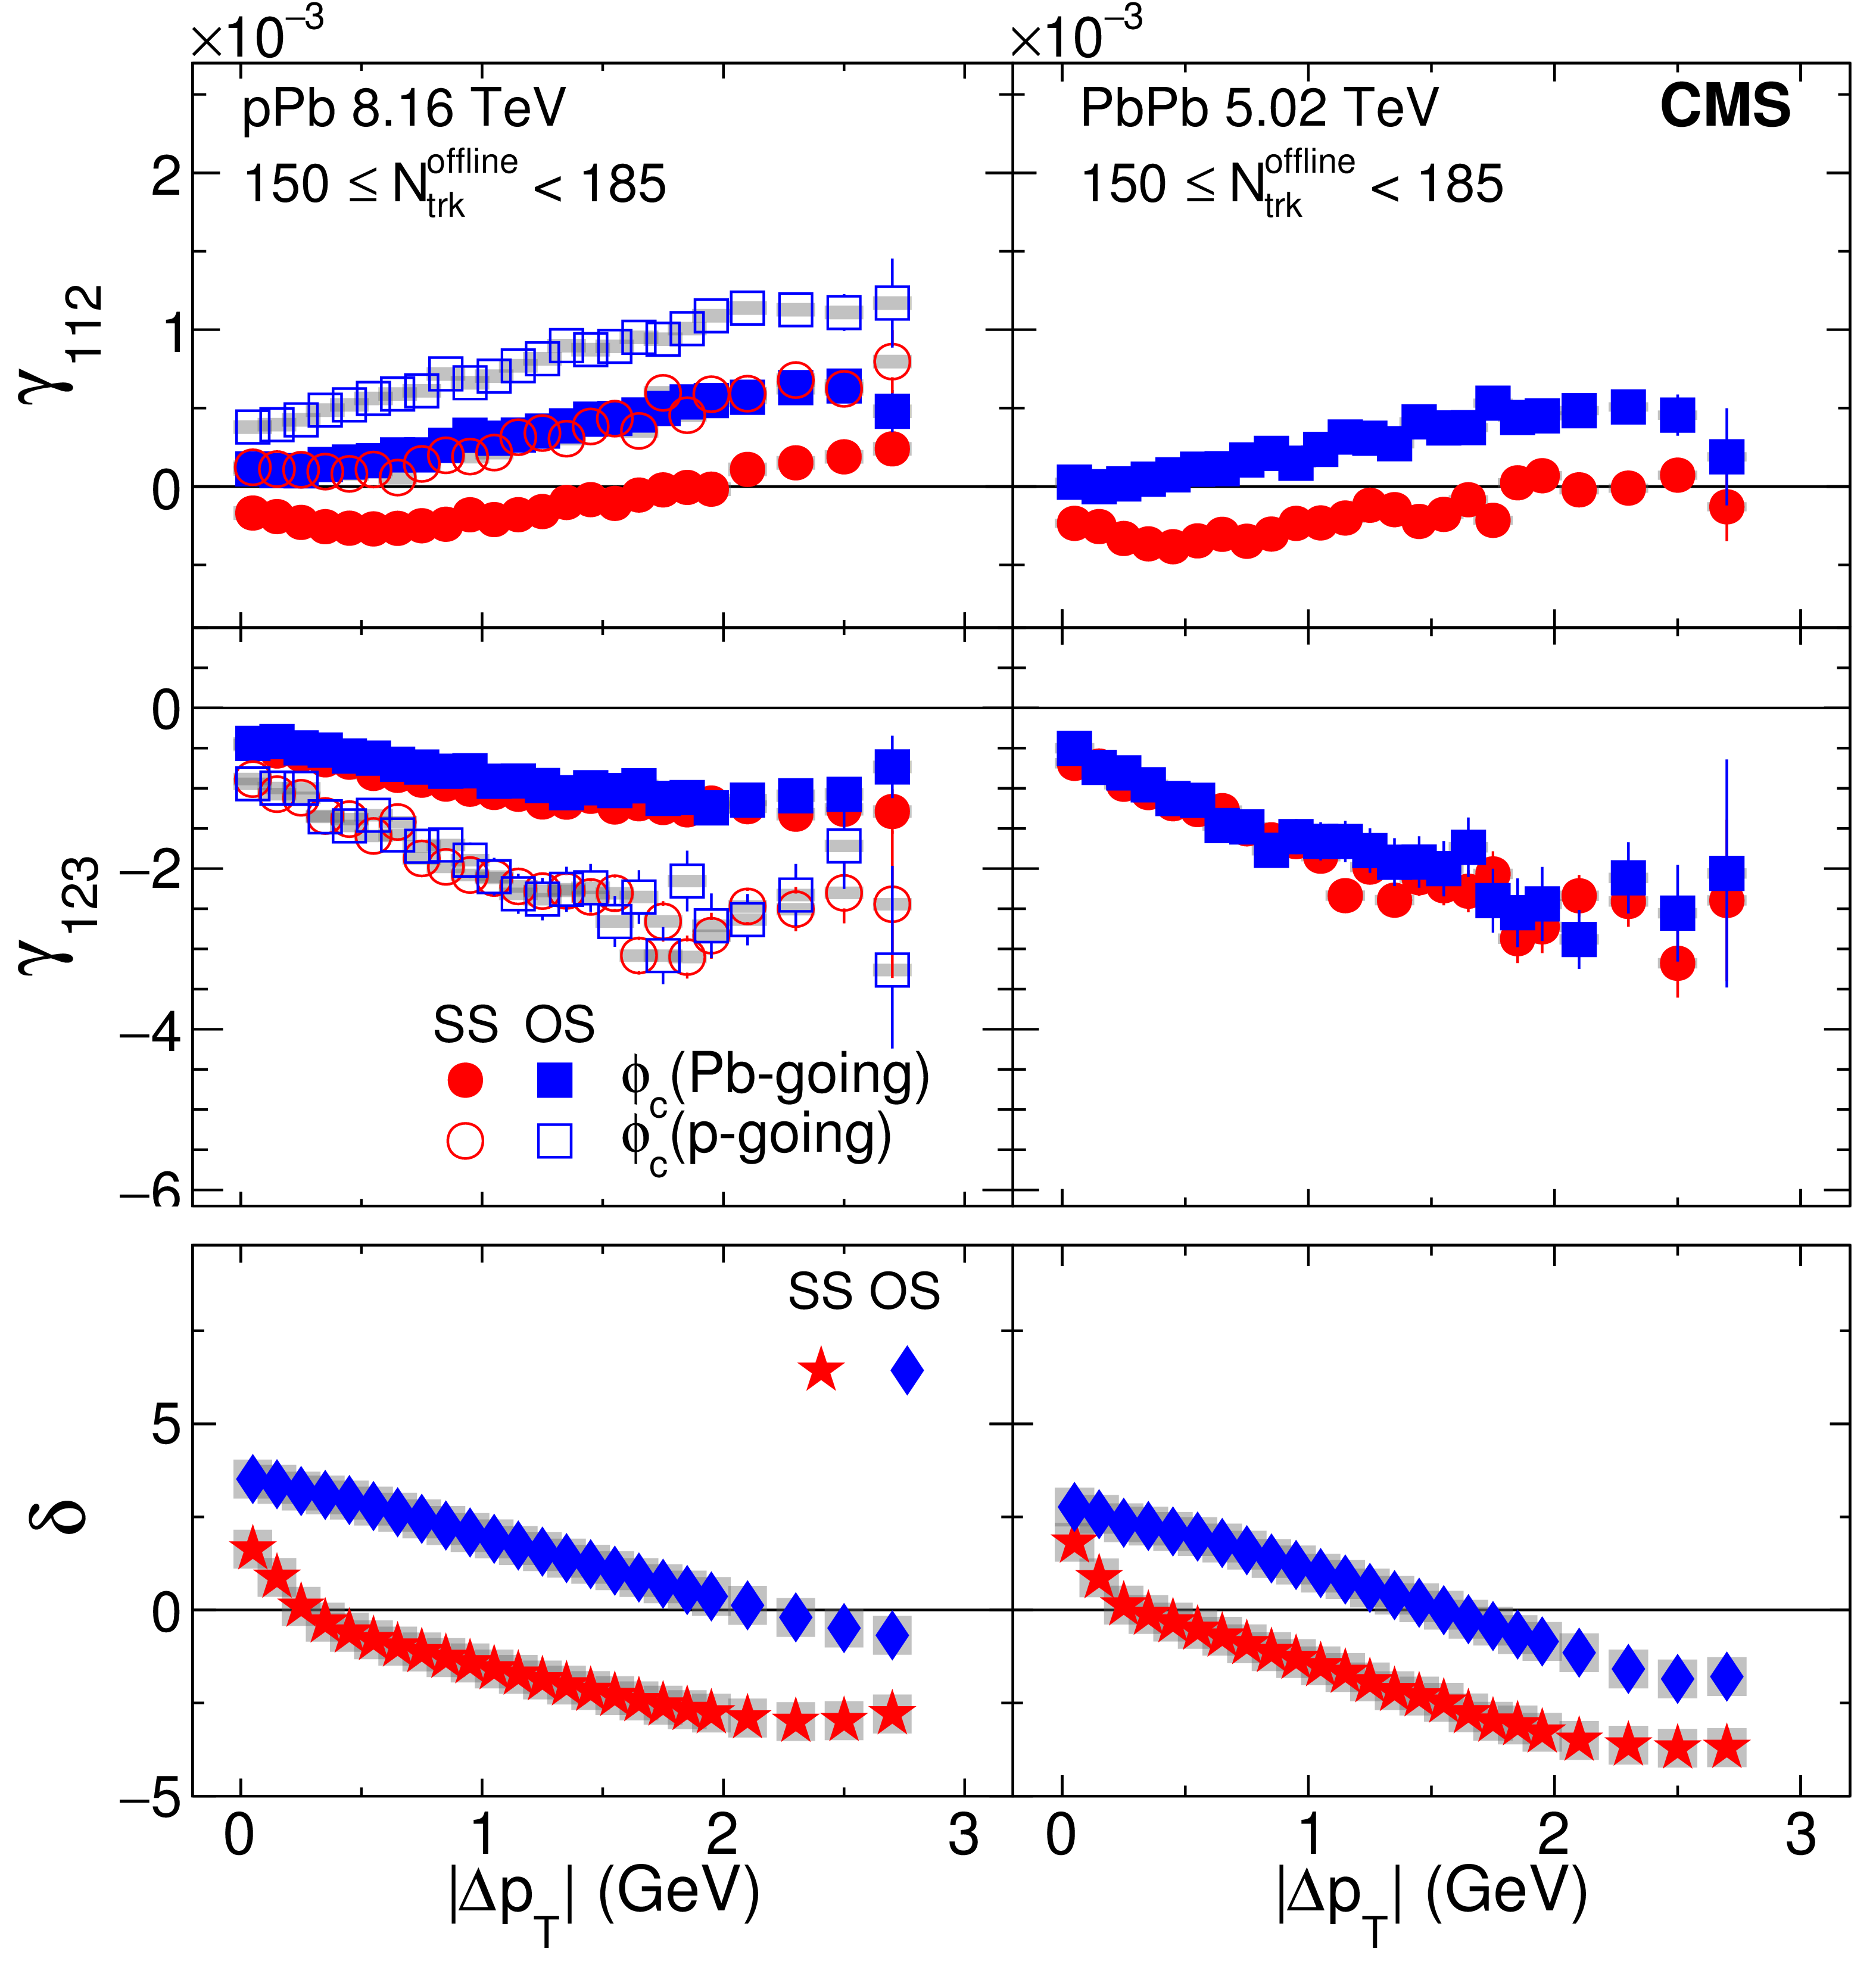
Figure 21-b:
The SS and OS three-particle correlators, $\gamma _{112}$ (upper) and $\gamma _{123}$ (middle), and two-particle correlator, $\delta $ (lower), as a function of $ {| \Delta {p_{\mathrm {T}}} | } $ for 150 $ \leq {N_\text {trk}^\text {offline}} < $ 185 in pPb collisions at $ {\sqrt {{s_{_{\mathrm {NN}}}}}} = $ 8.16 TeV (left) and PbPb collisions at 5.02 TeV (right). The pPb results obtained with particle $c$ in Pb-going (solid markers) and p-going (open markers) sides are shown separately. The SS and OS two-particle correlators are denoted by different markers for both pPb and PbPb collisions. Statistical and systematic uncertainties are indicated by the error bars and shaded regions, respectively. |
png pdf |
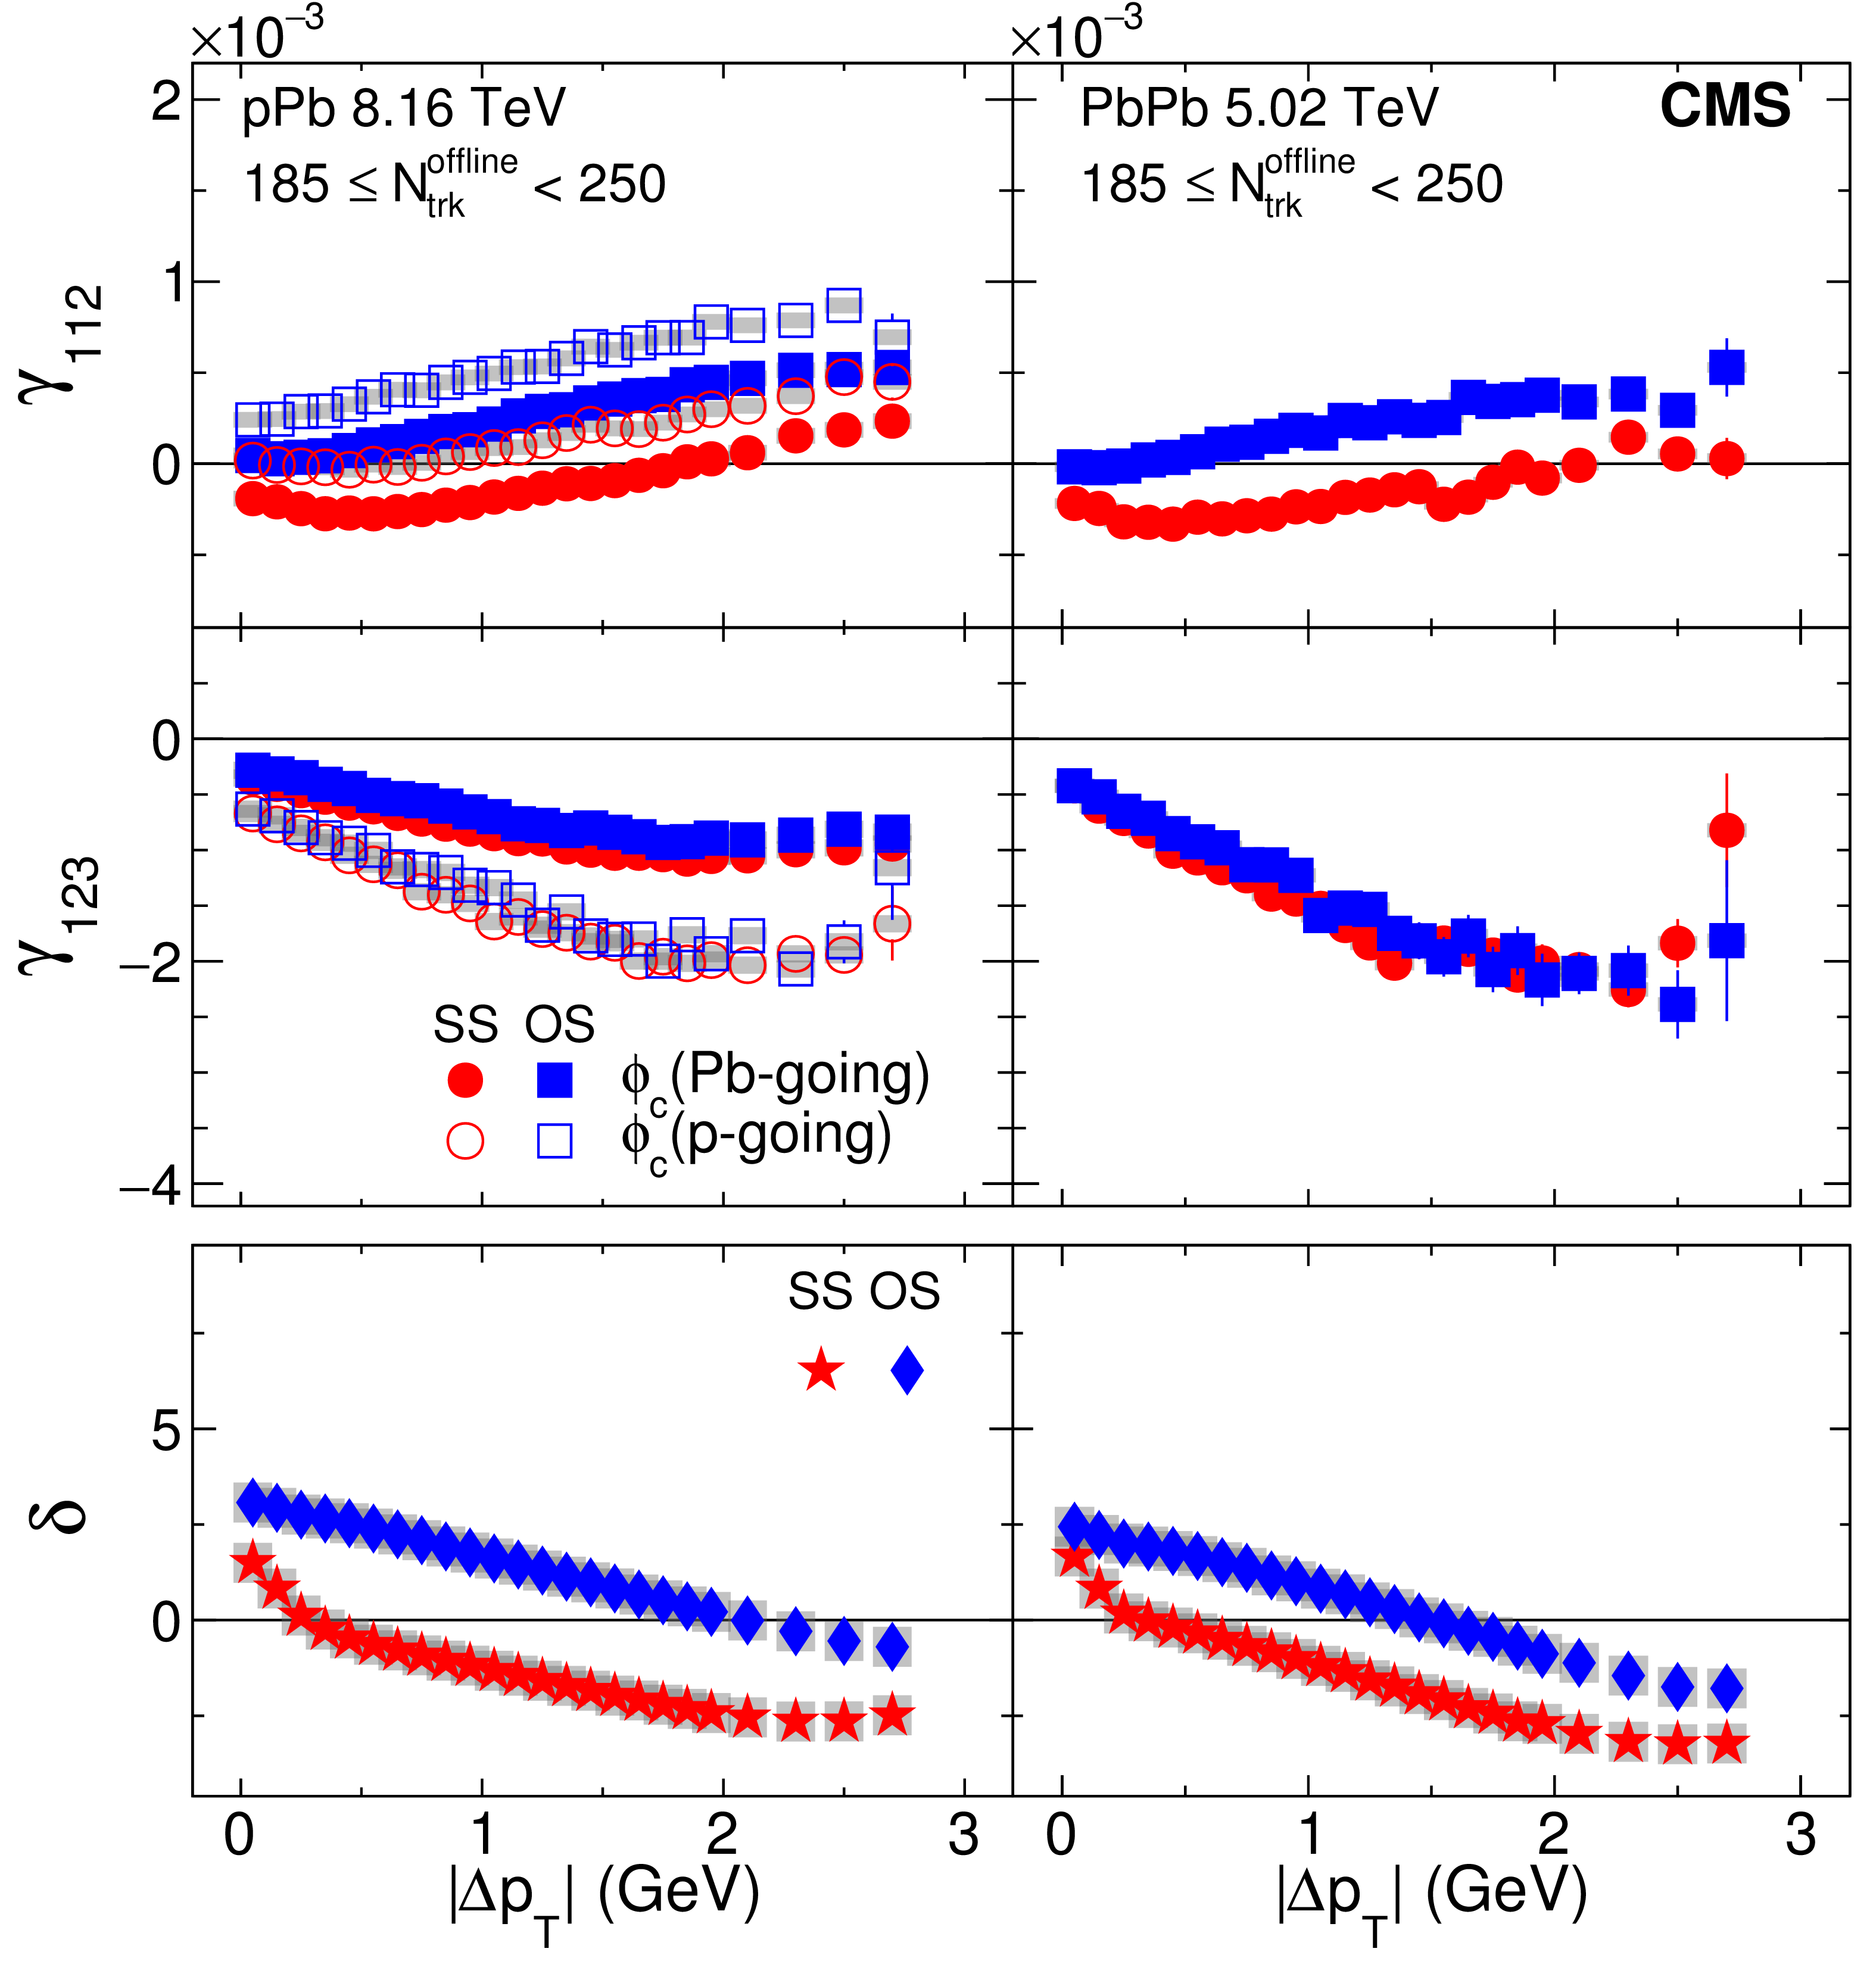
Figure 21-c:
The SS and OS three-particle correlators, $\gamma _{112}$ (upper) and $\gamma _{123}$ (middle), and two-particle correlator, $\delta $ (lower), as a function of $ {| \Delta {p_{\mathrm {T}}} | } $ for 185 $ \leq {N_\text {trk}^\text {offline}} < $ 250 in pPb collisions at $ {\sqrt {{s_{_{\mathrm {NN}}}}}} = $ 8.16 TeV (left) and PbPb collisions at 5.02 TeV (right). The pPb results obtained with particle $c$ in Pb-going (solid markers) and p-going (open markers) sides are shown separately. The SS and OS two-particle correlators are denoted by different markers for both pPb and PbPb collisions. Statistical and systematic uncertainties are indicated by the error bars and shaded regions, respectively. |
png pdf |
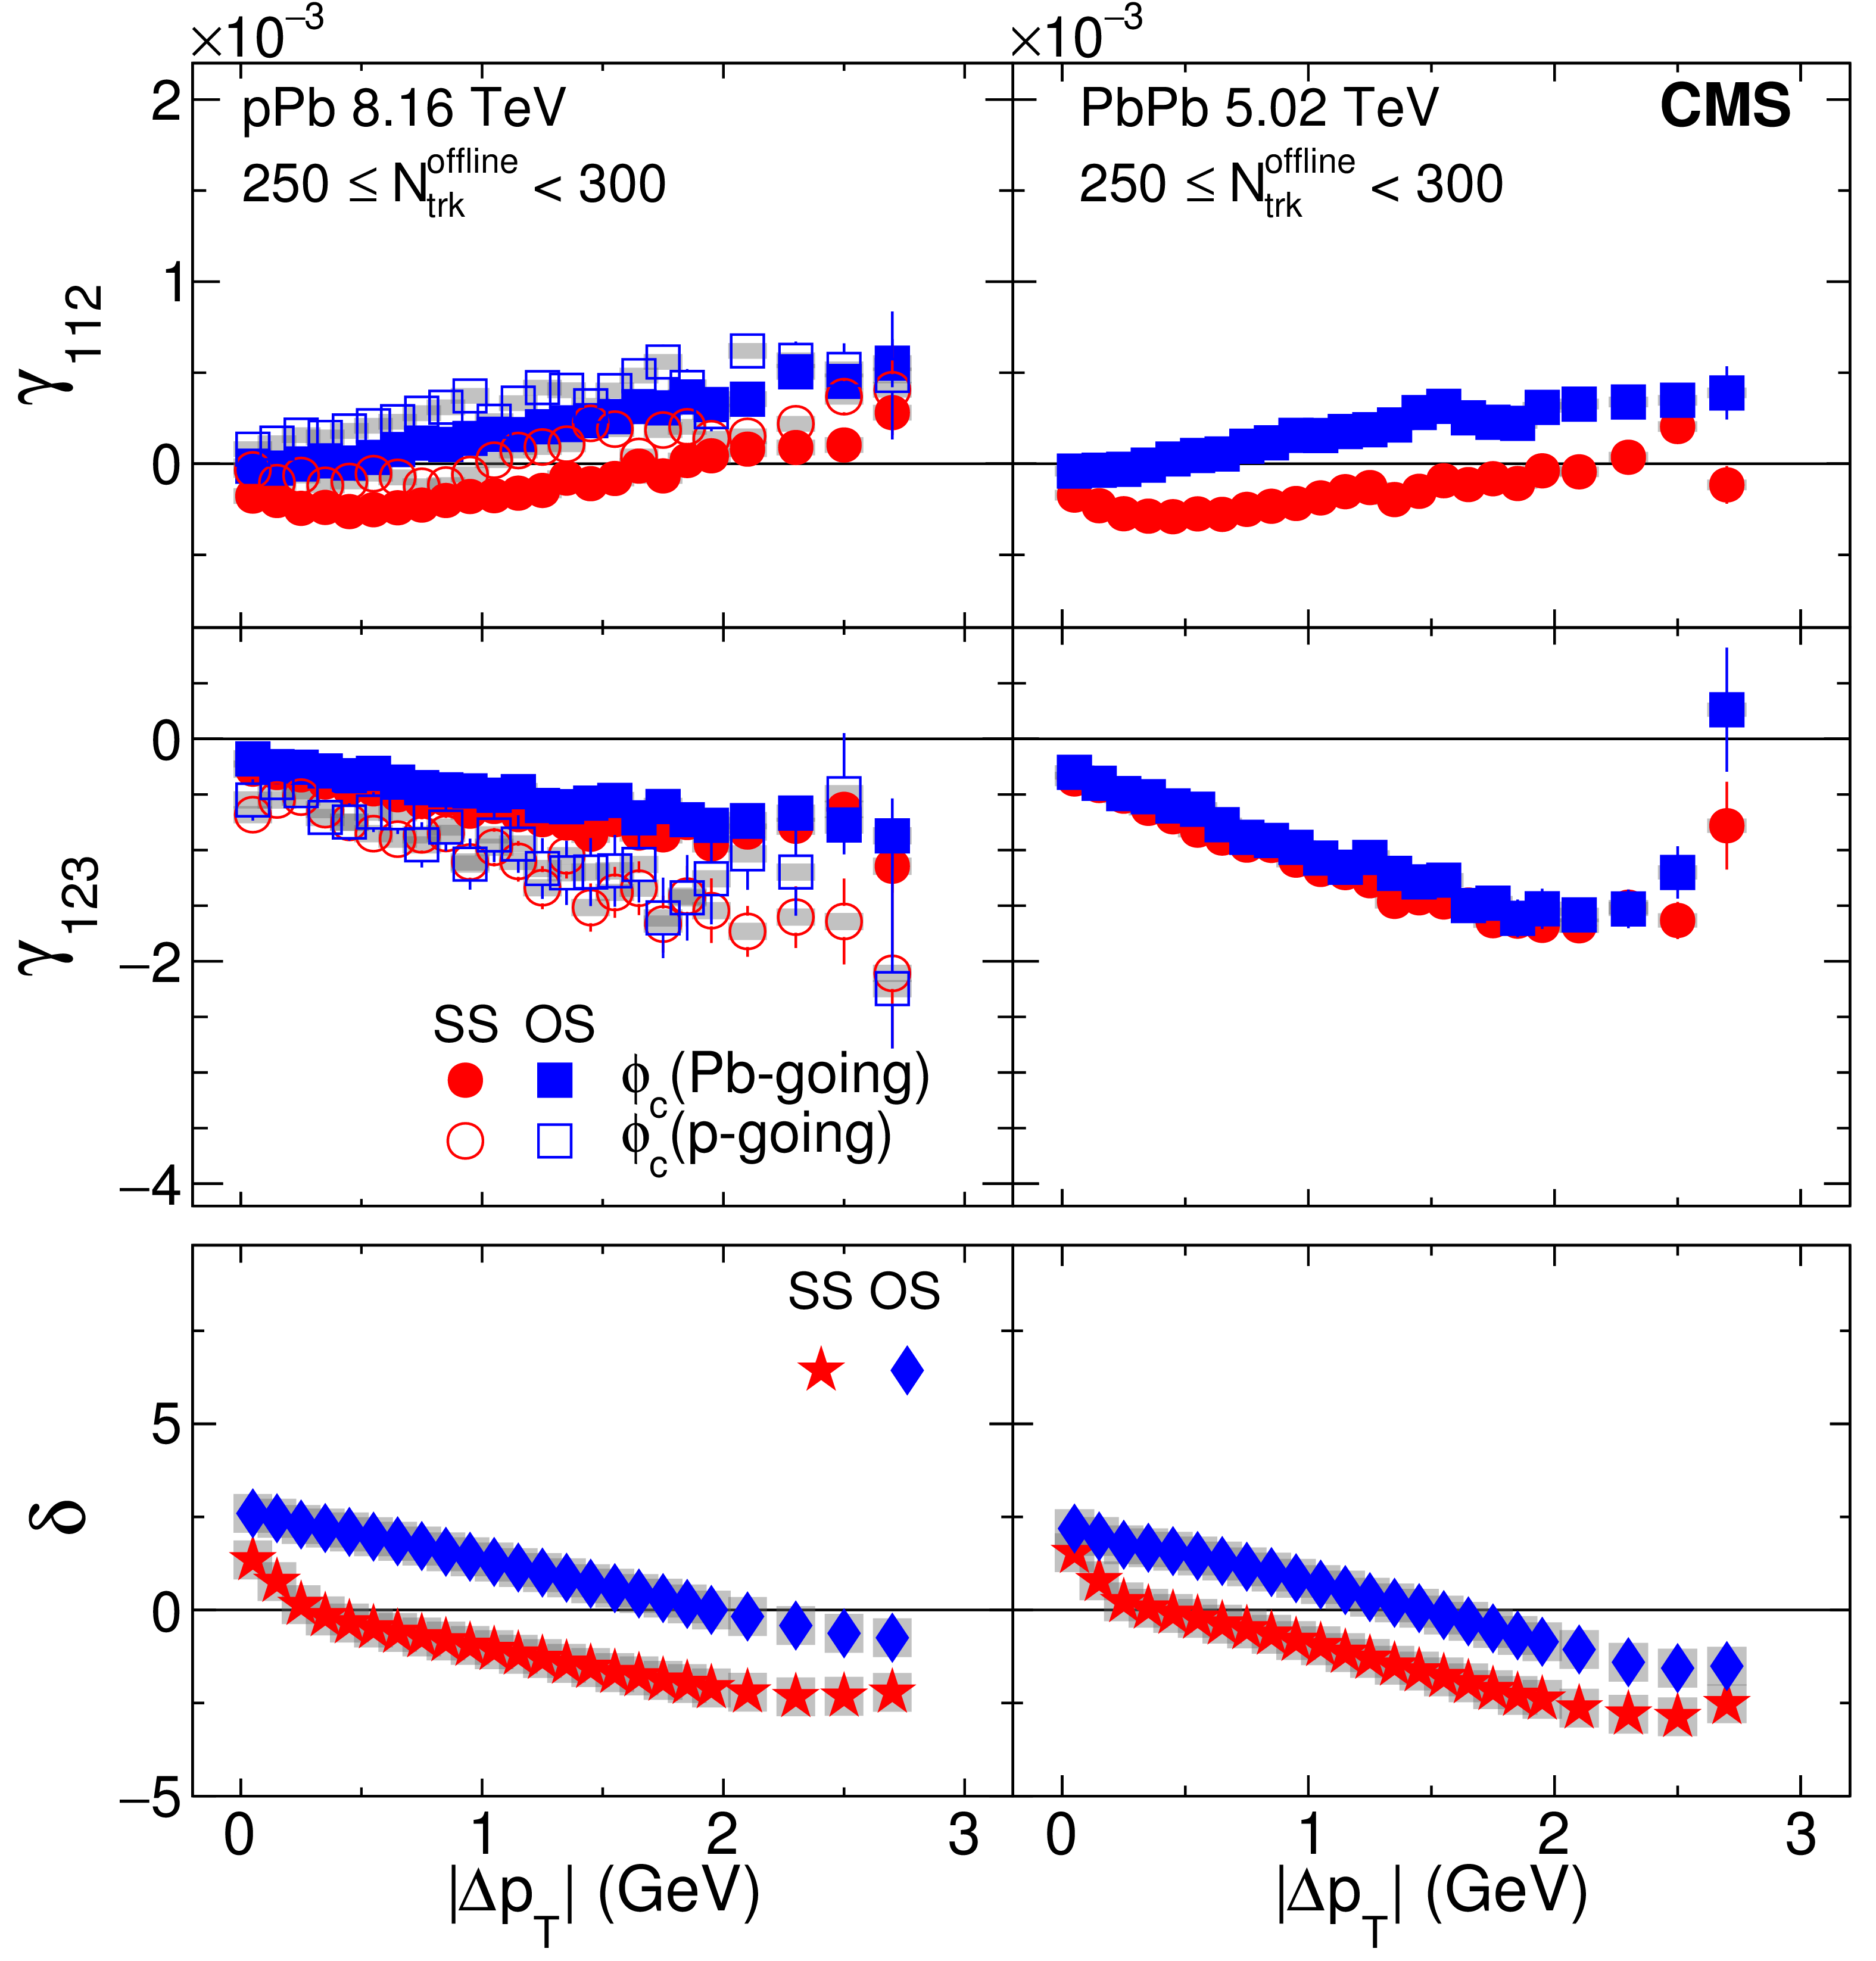
Figure 21-d:
The SS and OS three-particle correlators, $\gamma _{112}$ (upper) and $\gamma _{123}$ (middle), and two-particle correlator, $\delta $ (lower), as a function of $ {| \Delta {p_{\mathrm {T}}} | } $ for 250 $ \leq {N_\text {trk}^\text {offline}} < $ 300 in pPb collisions at $ {\sqrt {{s_{_{\mathrm {NN}}}}}} = $ 8.16 TeV (left) and PbPb collisions at 5.02 TeV (right). The pPb results obtained with particle $c$ in Pb-going (solid markers) and p-going (open markers) sides are shown separately. The SS and OS two-particle correlators are denoted by different markers for both pPb and PbPb collisions. Statistical and systematic uncertainties are indicated by the error bars and shaded regions, respectively. |
png pdf |
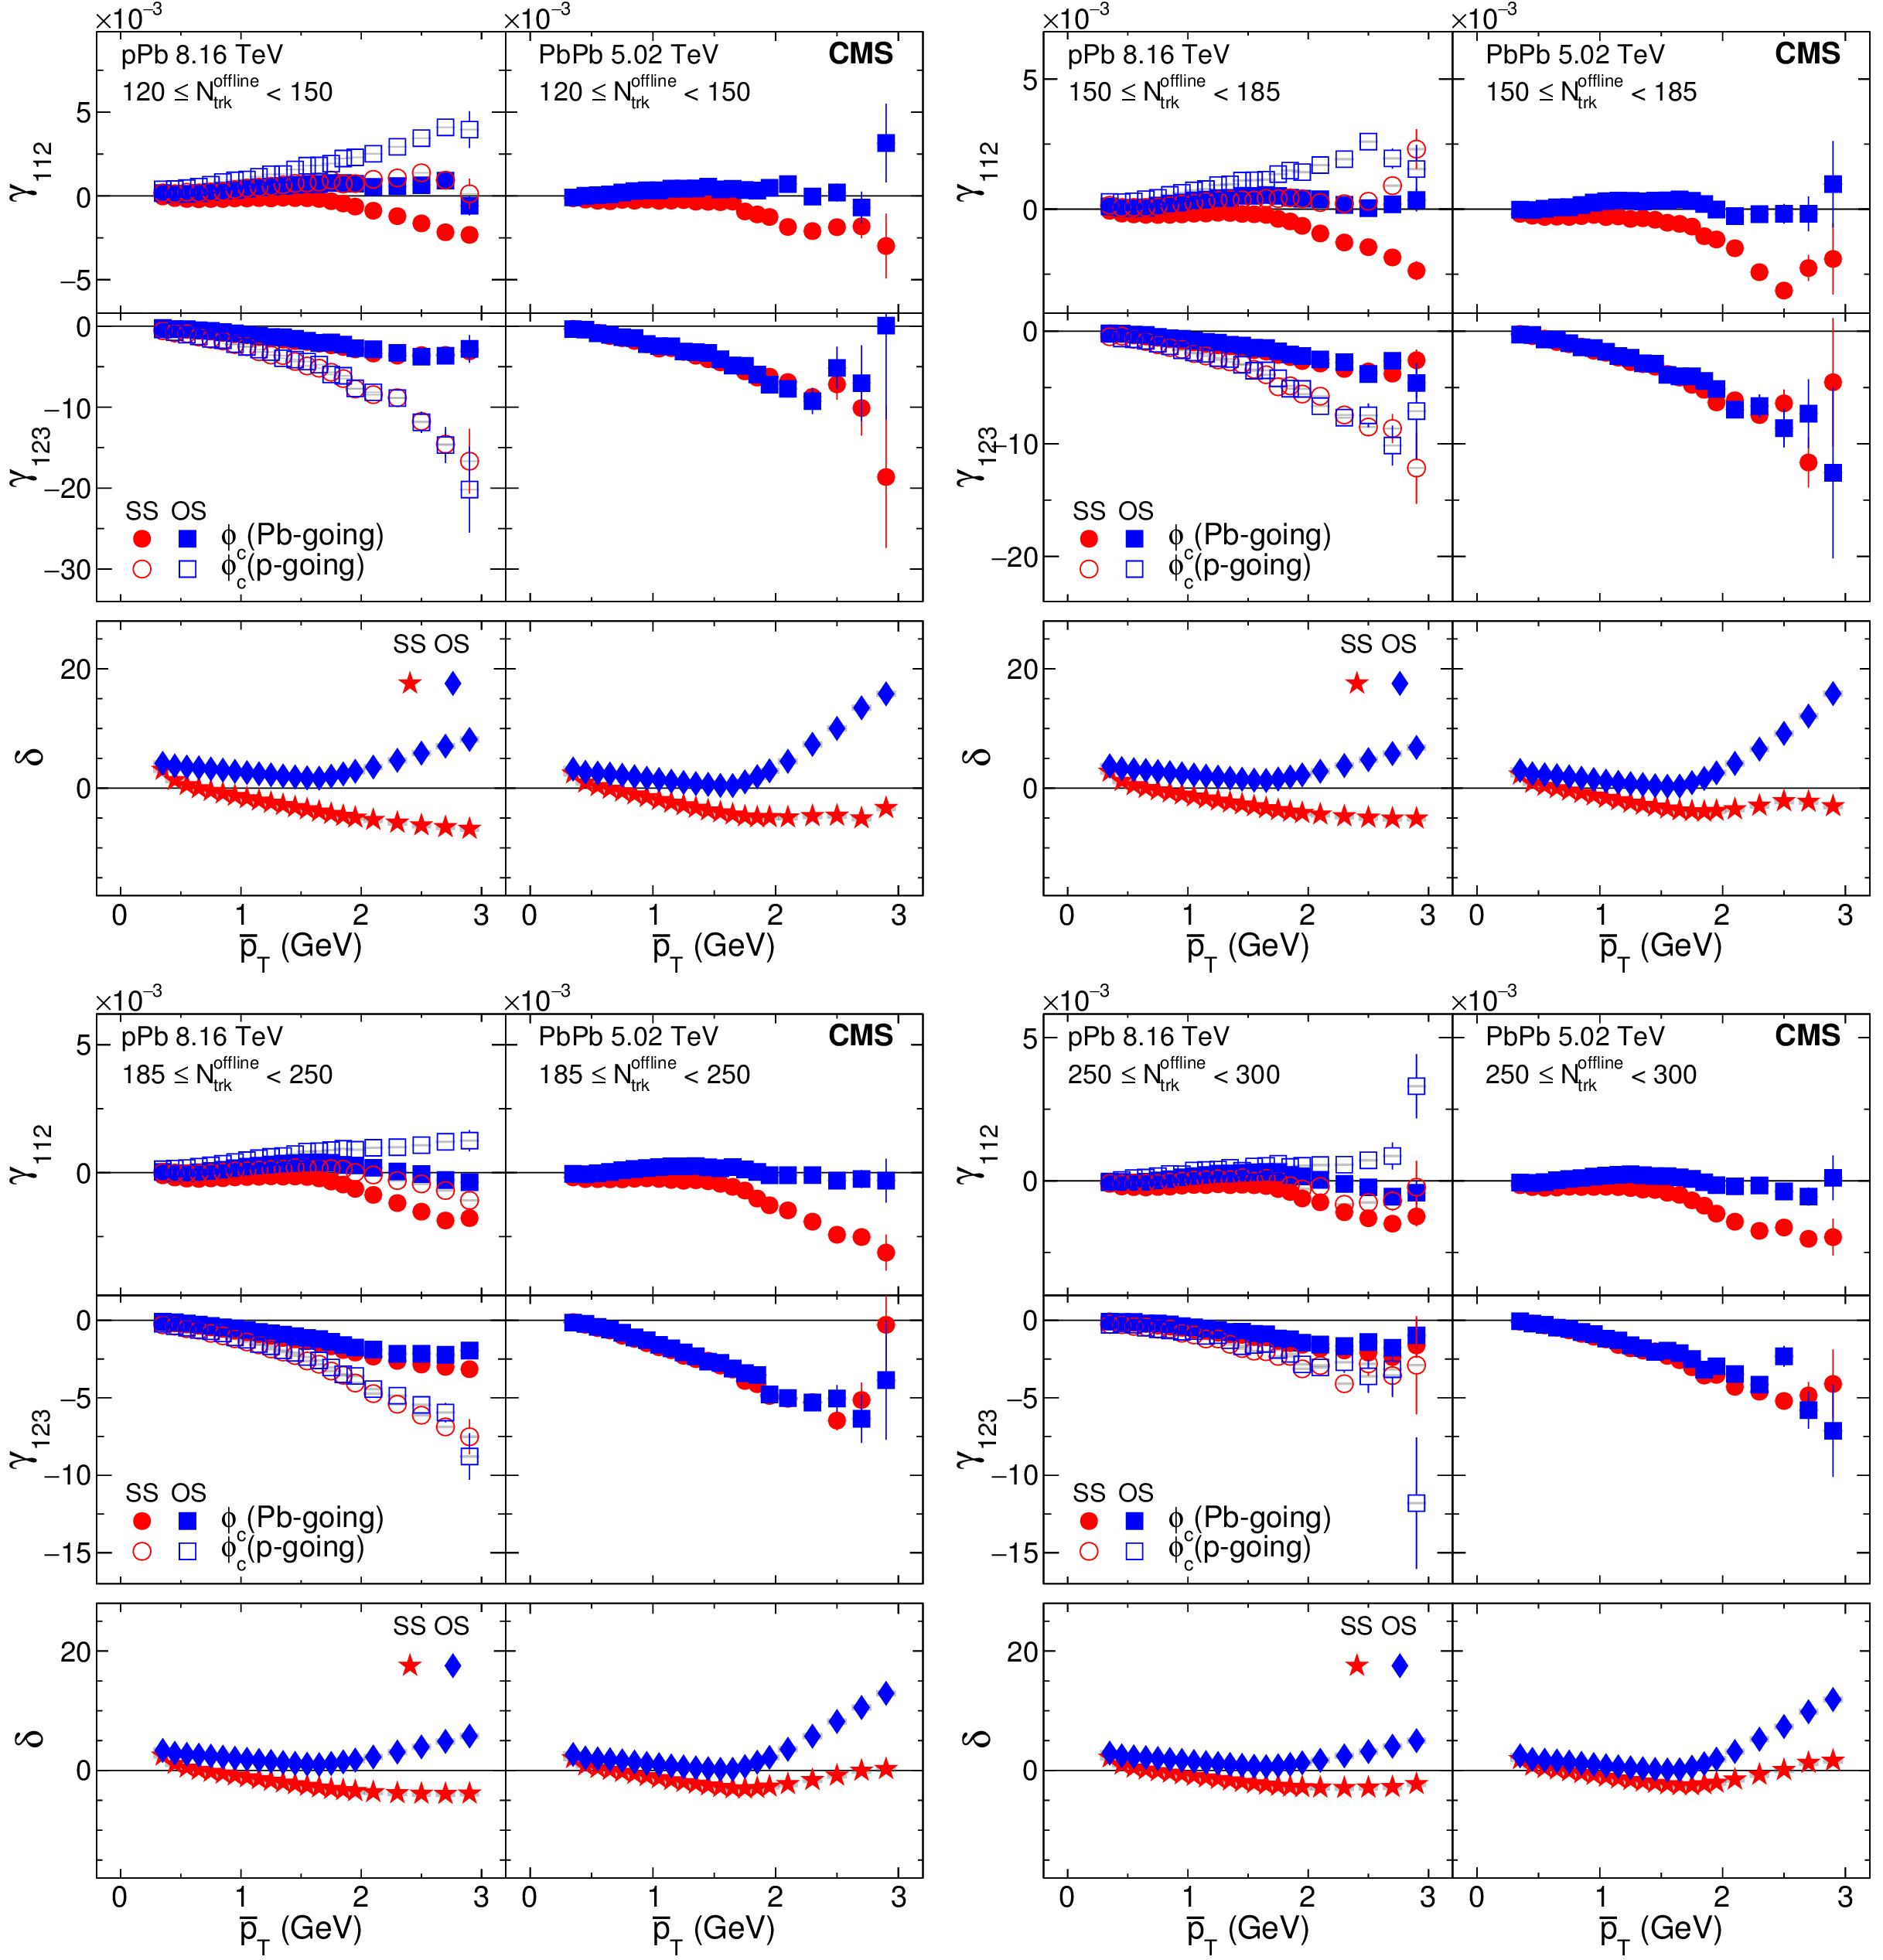
Figure 22:
The SS and OS three-particle correlators, $\gamma _{112}$ (upper) and $\gamma _{123}$ (middle), and two-particle correlator, $\delta $ (lower), as a function of $ {\overline {p}_\mathrm {T}} $ for four multiplicity ranges in pPb collisions at $ {\sqrt {{s_{_{\mathrm {NN}}}}}} = $ 8.16 TeV (left) and PbPb collisions at $ {\sqrt {{s_{_{\mathrm {NN}}}}}}= $ 5.02 TeV (right). The pPb results obtained with particle $c$ in Pb-going (solid markers) and p-going (open markers) sides are shown separately. The SS and OS two-particle correlators are denoted by different markers for both pPb and PbPb collisions. Statistical and systematic uncertainties are indicated by the error bars and shaded regions, respectively. |

png pdf |
Figure 22-a:
The SS and OS three-particle correlators, $\gamma _{112}$ (upper) and $\gamma _{123}$ (middle), and two-particle correlator, $\delta $ (lower), as a function of $ {\overline {p}_\mathrm {T}} $ for 120 $ \leq {N_\text {trk}^\text {offline}} < $ 150 in pPb collisions at $ {\sqrt {{s_{_{\mathrm {NN}}}}}} = $ 8.16 TeV (left) and PbPb collisions at $ {\sqrt {{s_{_{\mathrm {NN}}}}}}= $ 5.02 TeV (right). The pPb results obtained with particle $c$ in Pb-going (solid markers) and p-going (open markers) sides are shown separately. The SS and OS two-particle correlators are denoted by different markers for both pPb and PbPb collisions. Statistical and systematic uncertainties are indicated by the error bars and shaded regions, respectively. |
png pdf |
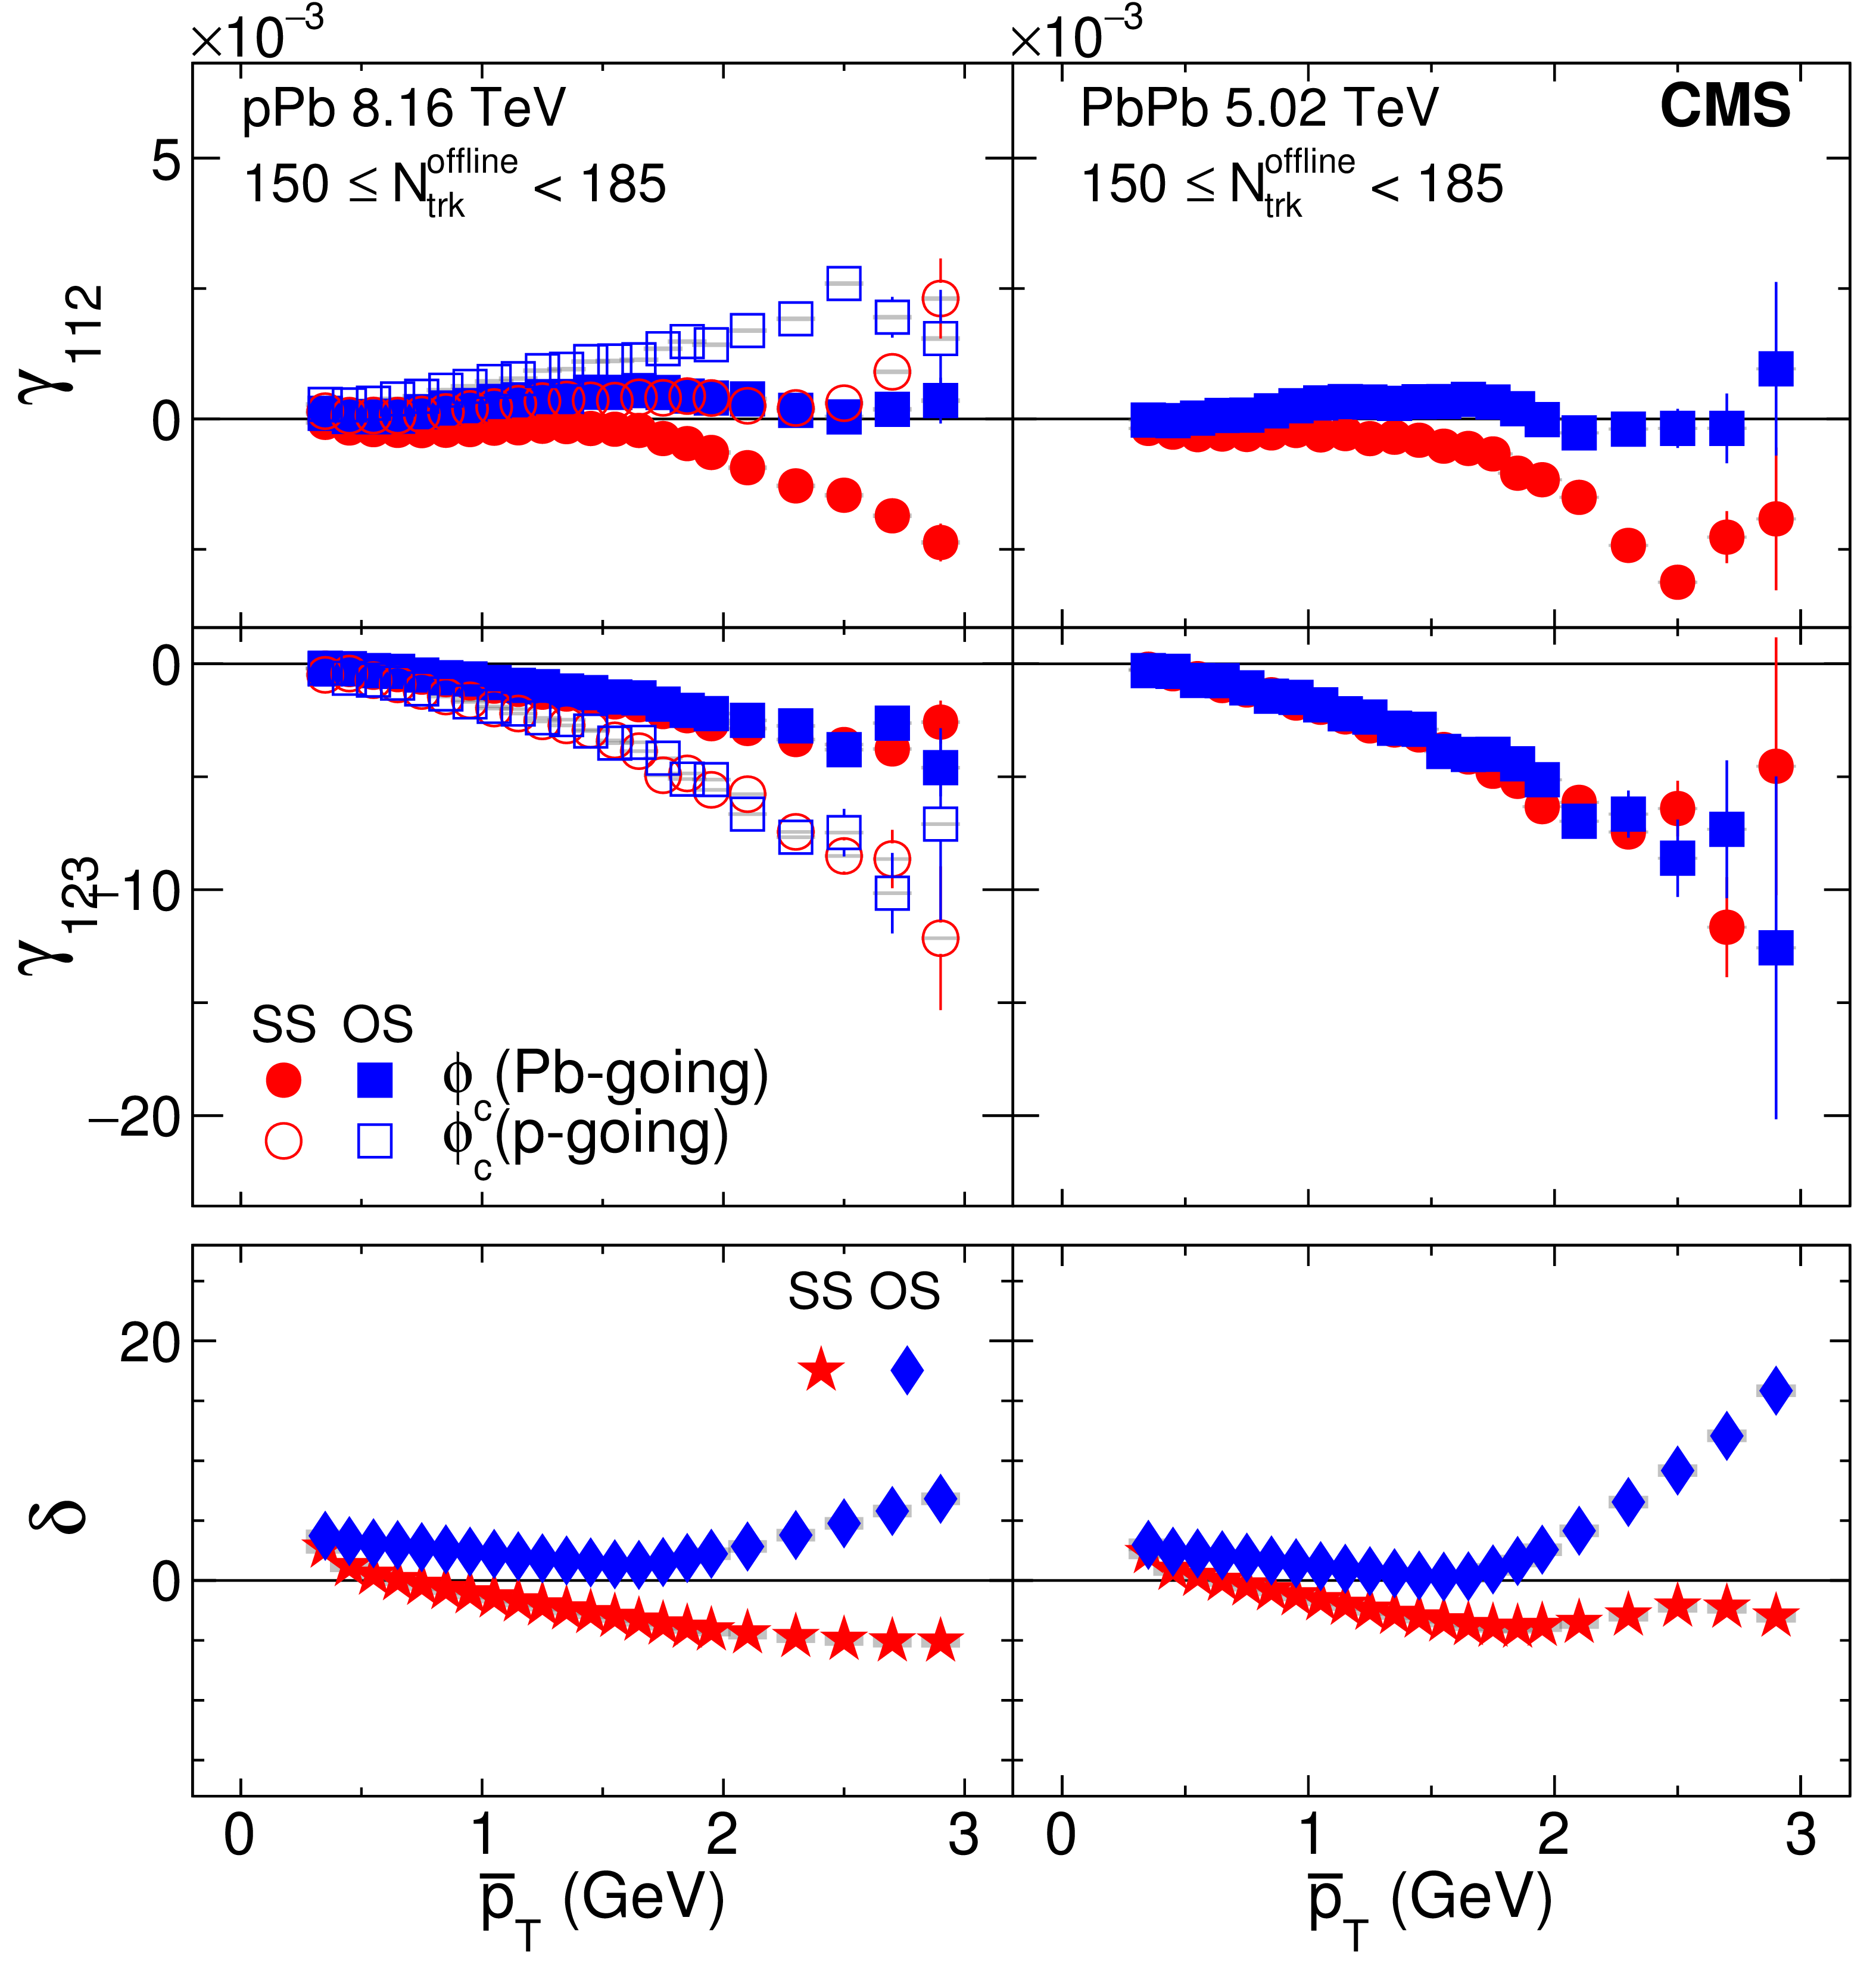
Figure 22-b:
The SS and OS three-particle correlators, $\gamma _{112}$ (upper) and $\gamma _{123}$ (middle), and two-particle correlator, $\delta $ (lower), as a function of $ {\overline {p}_\mathrm {T}} $ for 150 $ \leq {N_\text {trk}^\text {offline}} < $ 185 in pPb collisions at $ {\sqrt {{s_{_{\mathrm {NN}}}}}} = $ 8.16 TeV (left) and PbPb collisions at $ {\sqrt {{s_{_{\mathrm {NN}}}}}}= $ 5.02 TeV (right). The pPb results obtained with particle $c$ in Pb-going (solid markers) and p-going (open markers) sides are shown separately. The SS and OS two-particle correlators are denoted by different markers for both pPb and PbPb collisions. Statistical and systematic uncertainties are indicated by the error bars and shaded regions, respectively. |
png pdf |
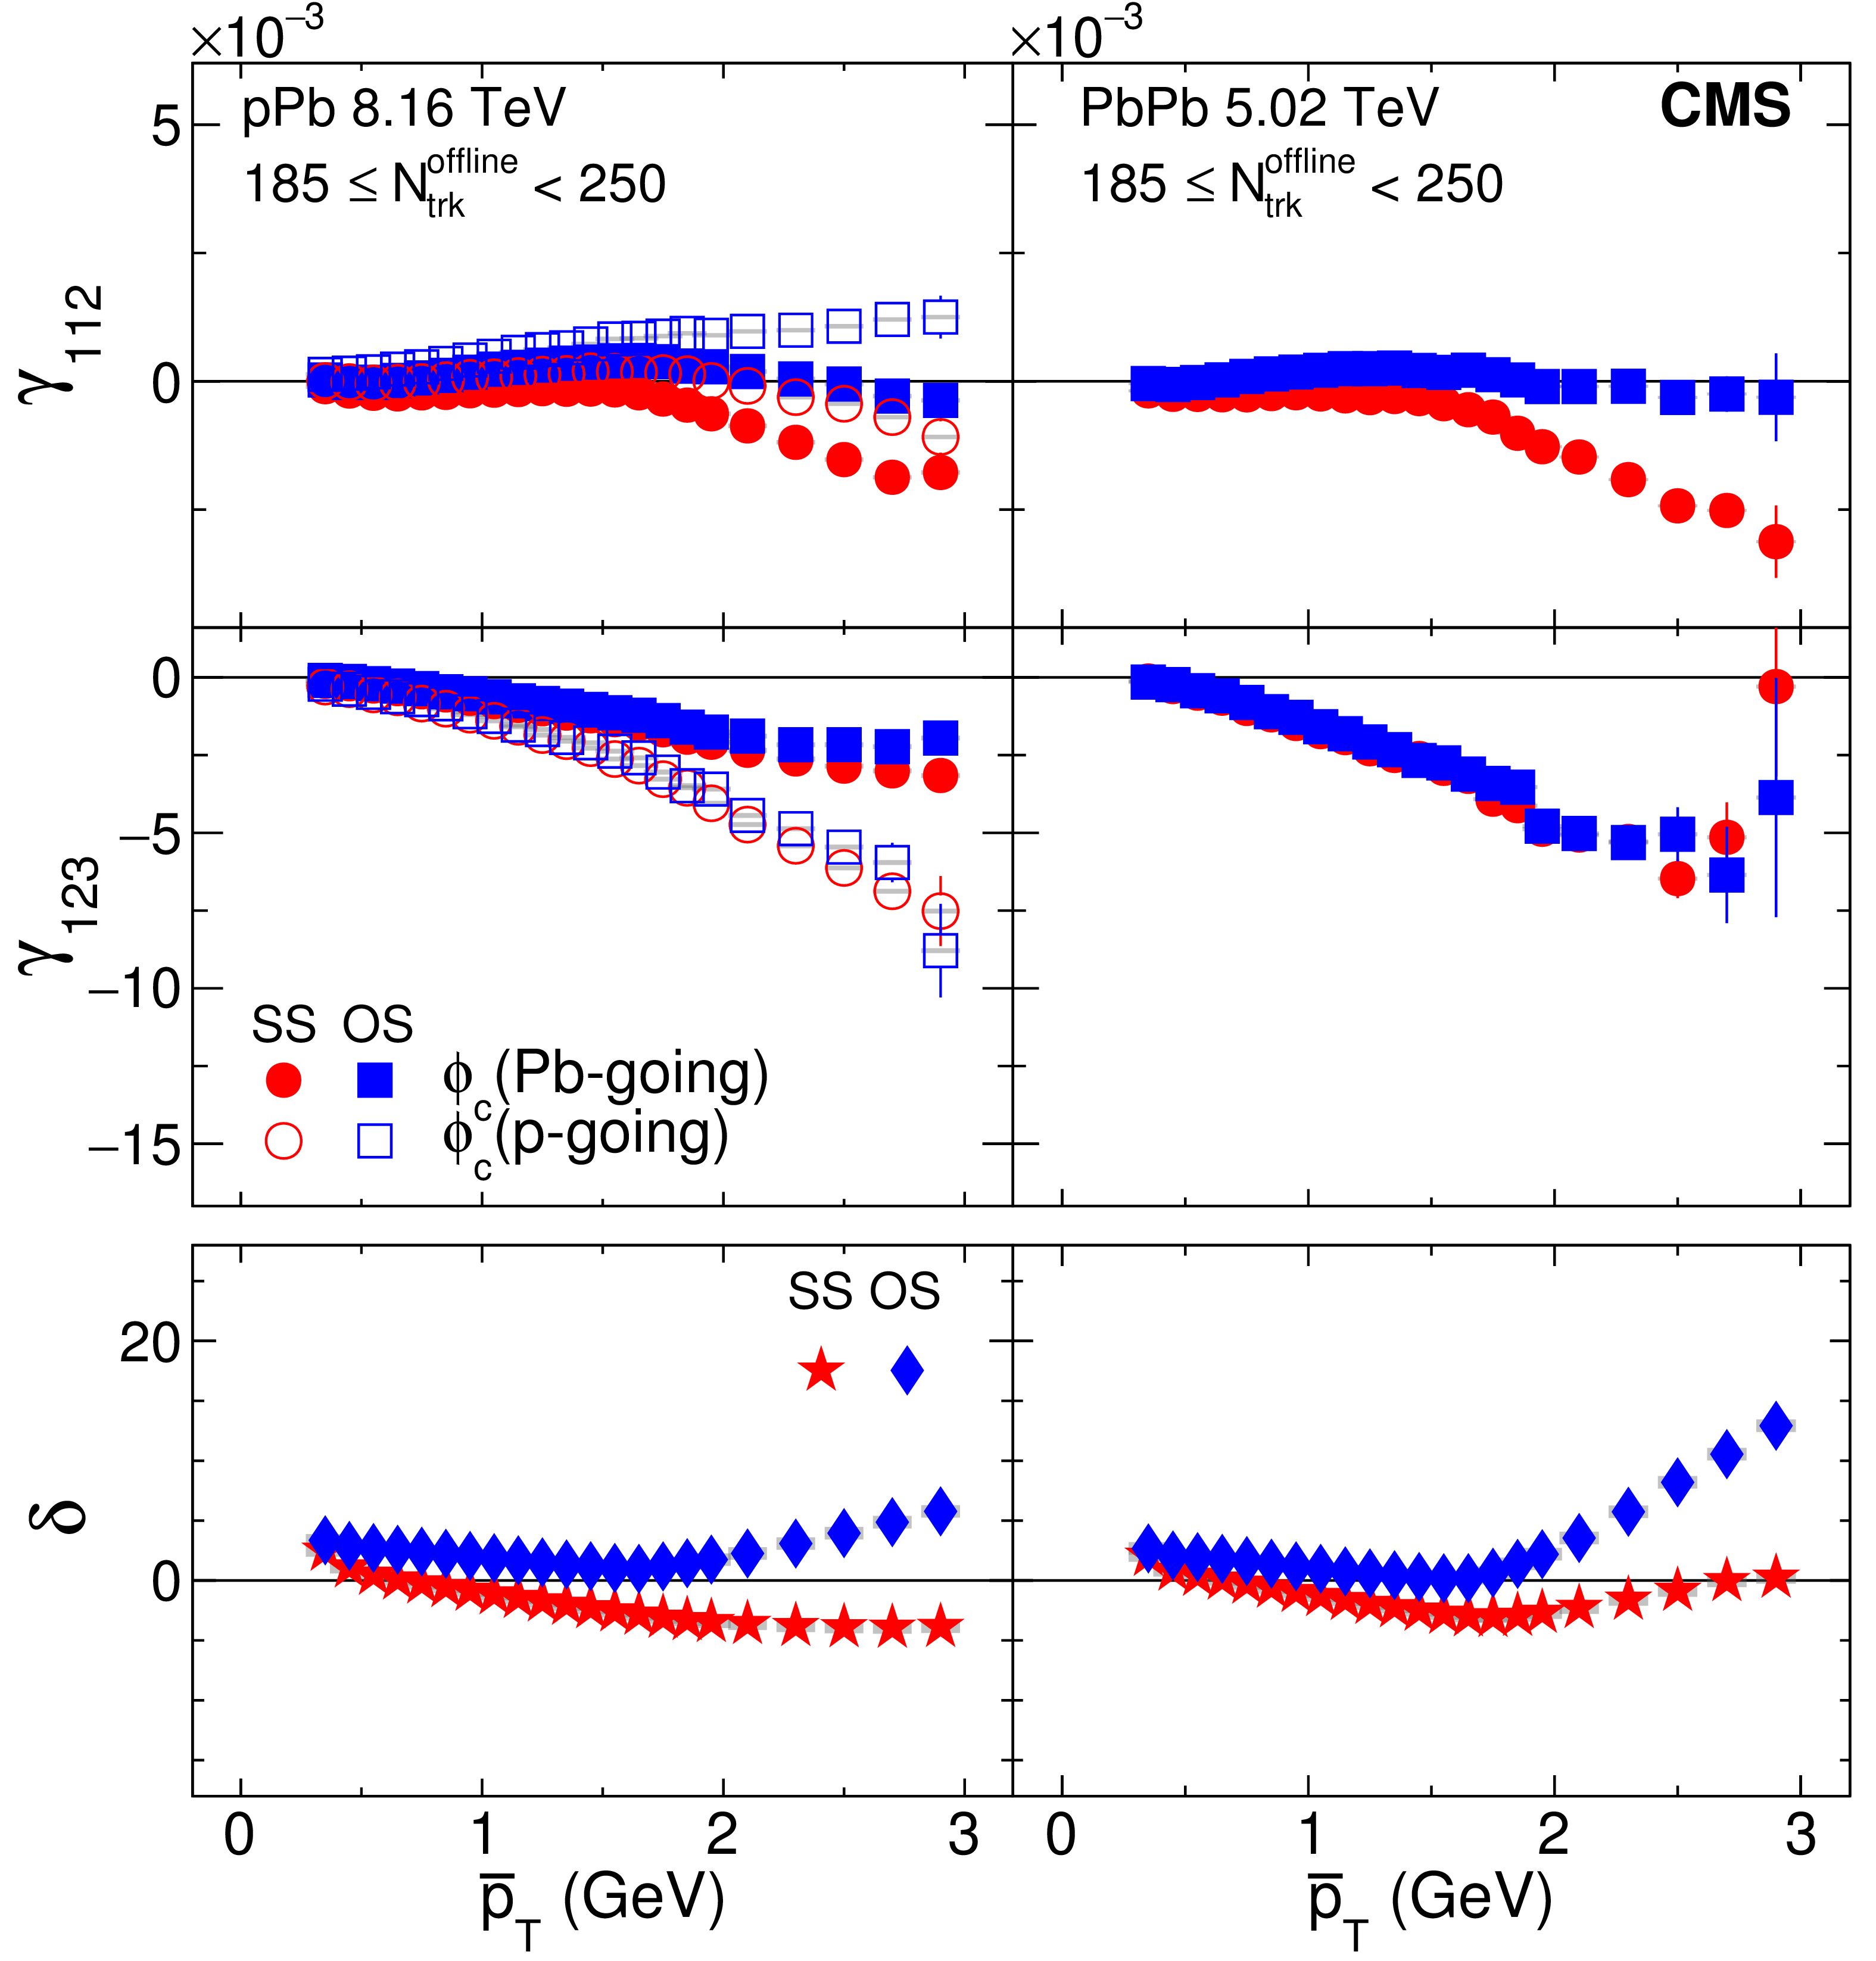
Figure 22-c:
The SS and OS three-particle correlators, $\gamma _{112}$ (upper) and $\gamma _{123}$ (middle), and two-particle correlator, $\delta $ (lower), as a function of $ {\overline {p}_\mathrm {T}} $ for 185 $ \leq {N_\text {trk}^\text {offline}} < $ 250 in pPb collisions at $ {\sqrt {{s_{_{\mathrm {NN}}}}}} = $ 8.16 TeV (left) and PbPb collisions at $ {\sqrt {{s_{_{\mathrm {NN}}}}}}= $ 5.02 TeV (right). The pPb results obtained with particle $c$ in Pb-going (solid markers) and p-going (open markers) sides are shown separately. The SS and OS two-particle correlators are denoted by different markers for both pPb and PbPb collisions. Statistical and systematic uncertainties are indicated by the error bars and shaded regions, respectively. |
png pdf |
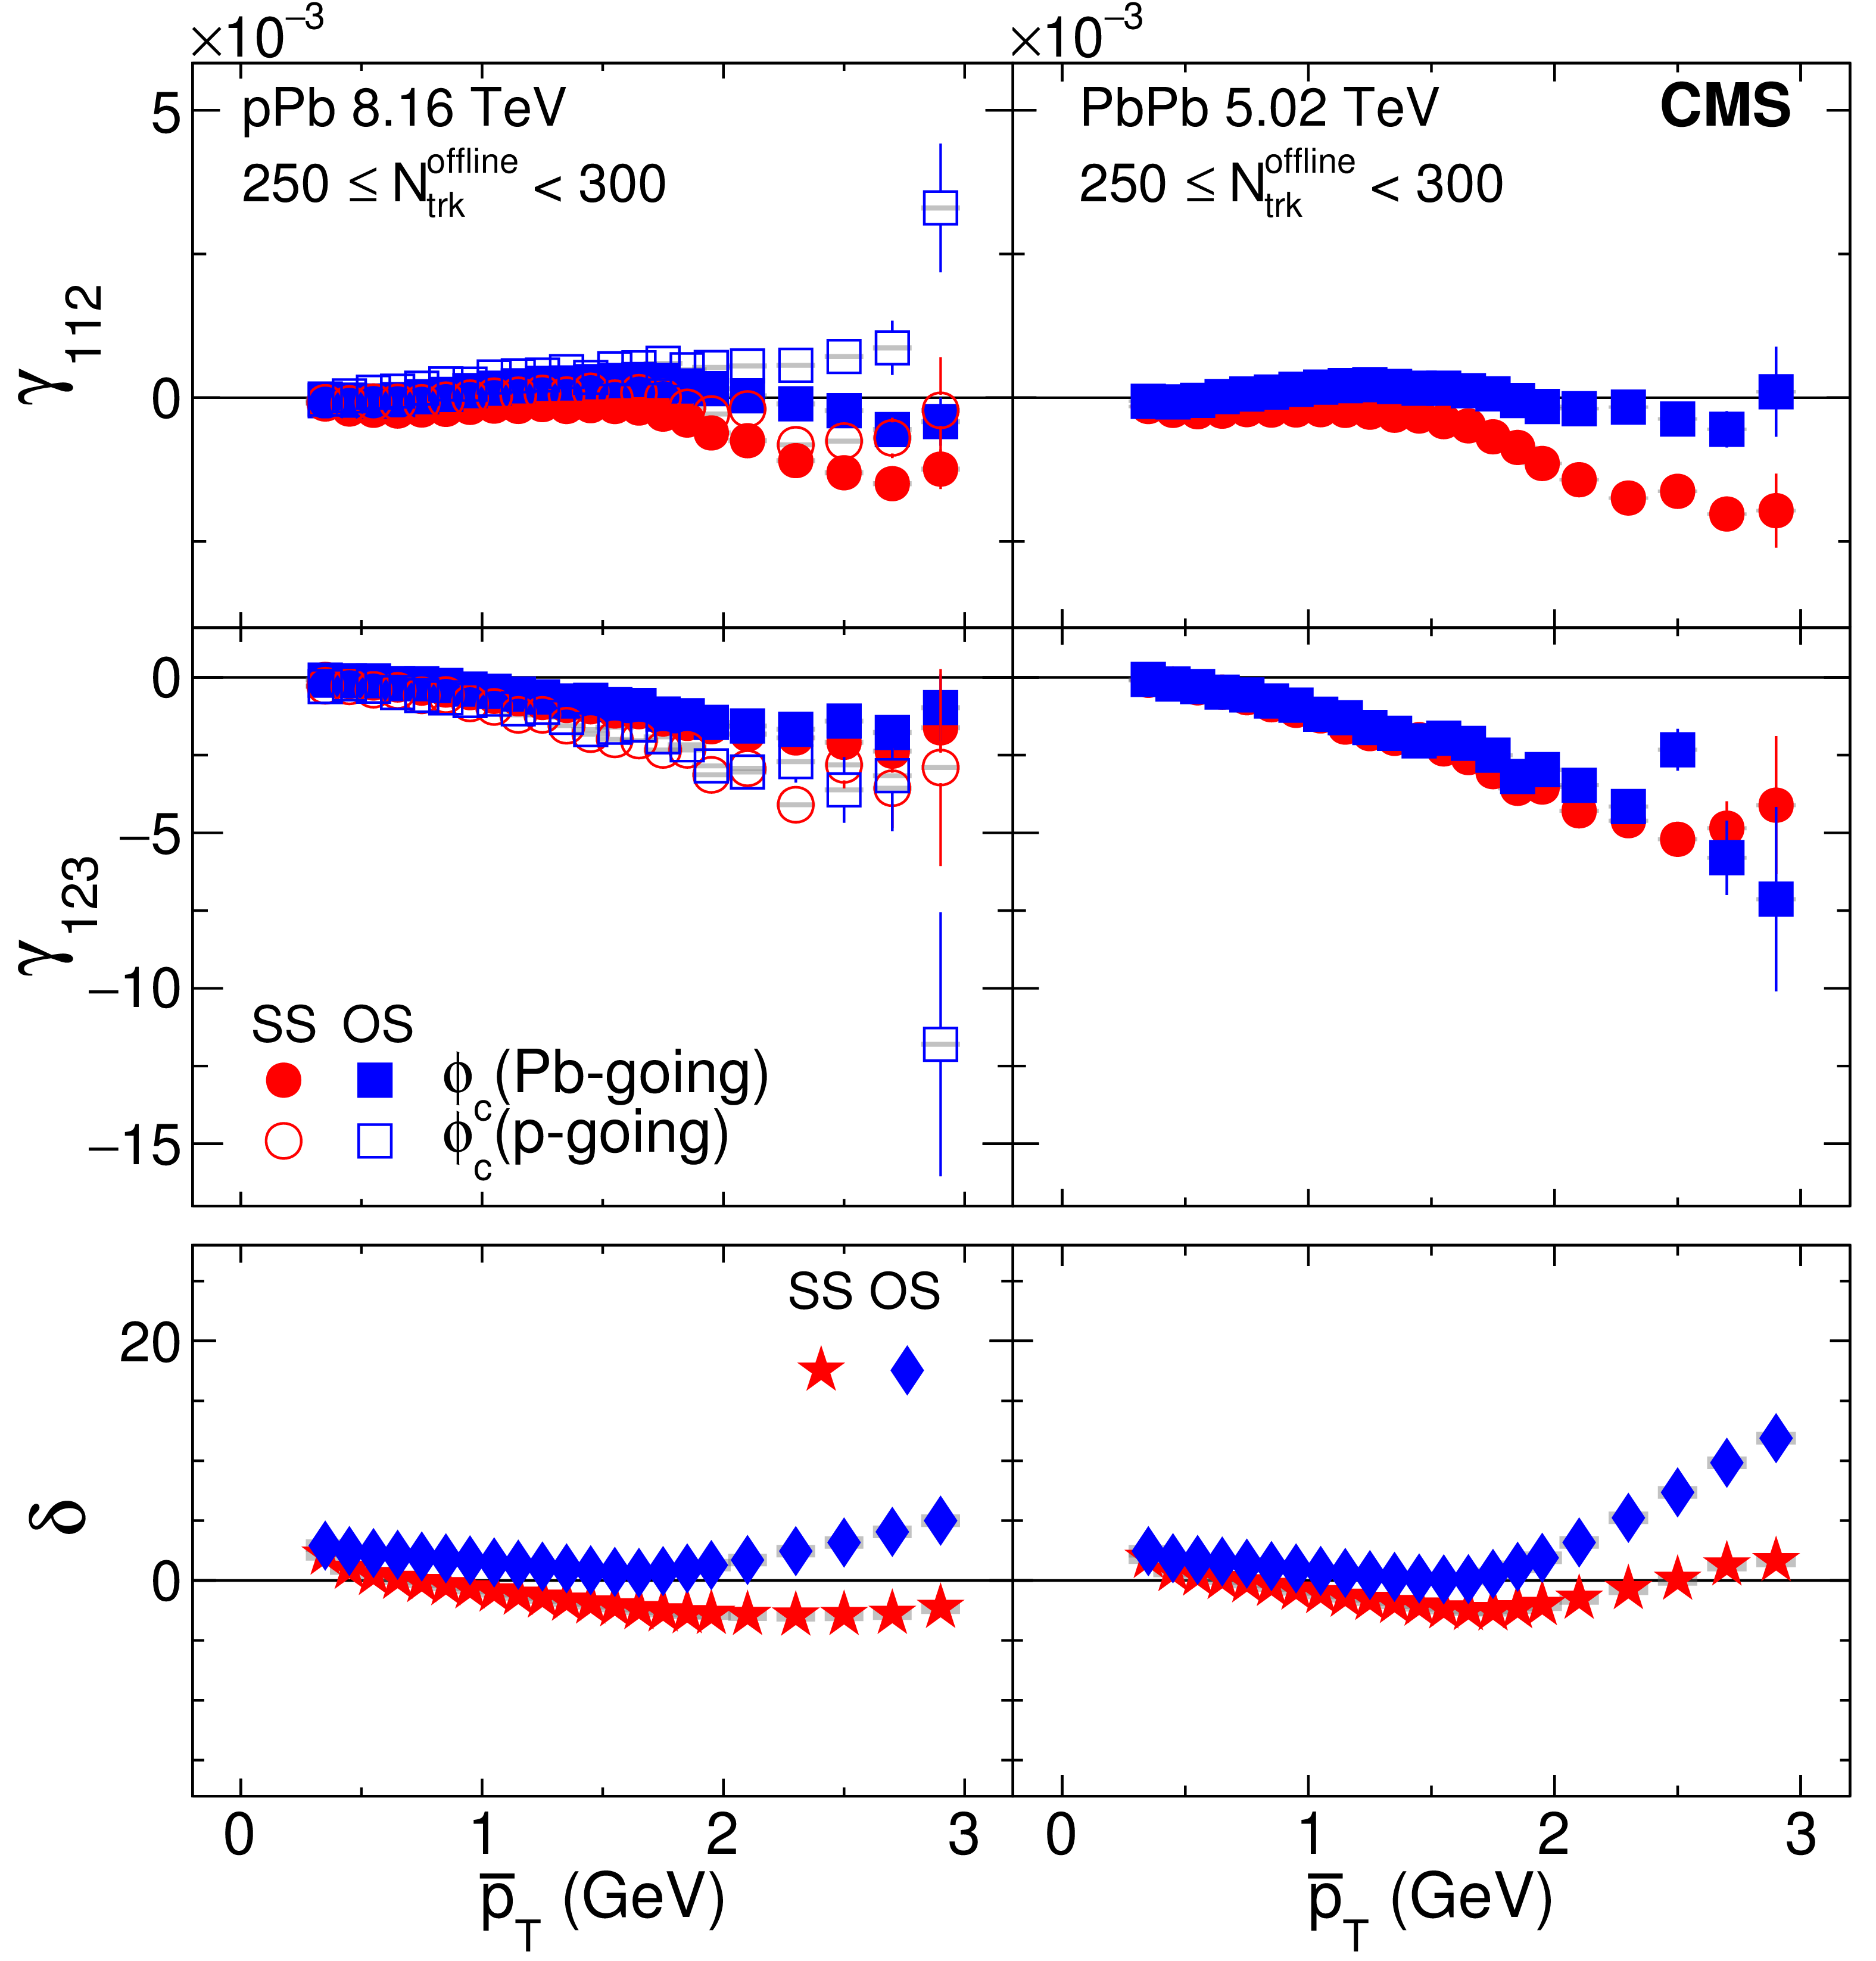
Figure 22-d:
The SS and OS three-particle correlators, $\gamma _{112}$ (upper) and $\gamma _{123}$ (middle), and two-particle correlator, $\delta $ (lower), as a function of $ {\overline {p}_\mathrm {T}} $ for 250 $ \leq {N_\text {trk}^\text {offline}} < $ 300 in pPb collisions at $ {\sqrt {{s_{_{\mathrm {NN}}}}}} = $ 8.16 TeV (left) and PbPb collisions at $ {\sqrt {{s_{_{\mathrm {NN}}}}}}= $ 5.02 TeV (right). The pPb results obtained with particle $c$ in Pb-going (solid markers) and p-going (open markers) sides are shown separately. The SS and OS two-particle correlators are denoted by different markers for both pPb and PbPb collisions. Statistical and systematic uncertainties are indicated by the error bars and shaded regions, respectively. |
png pdf |
Figure 23:
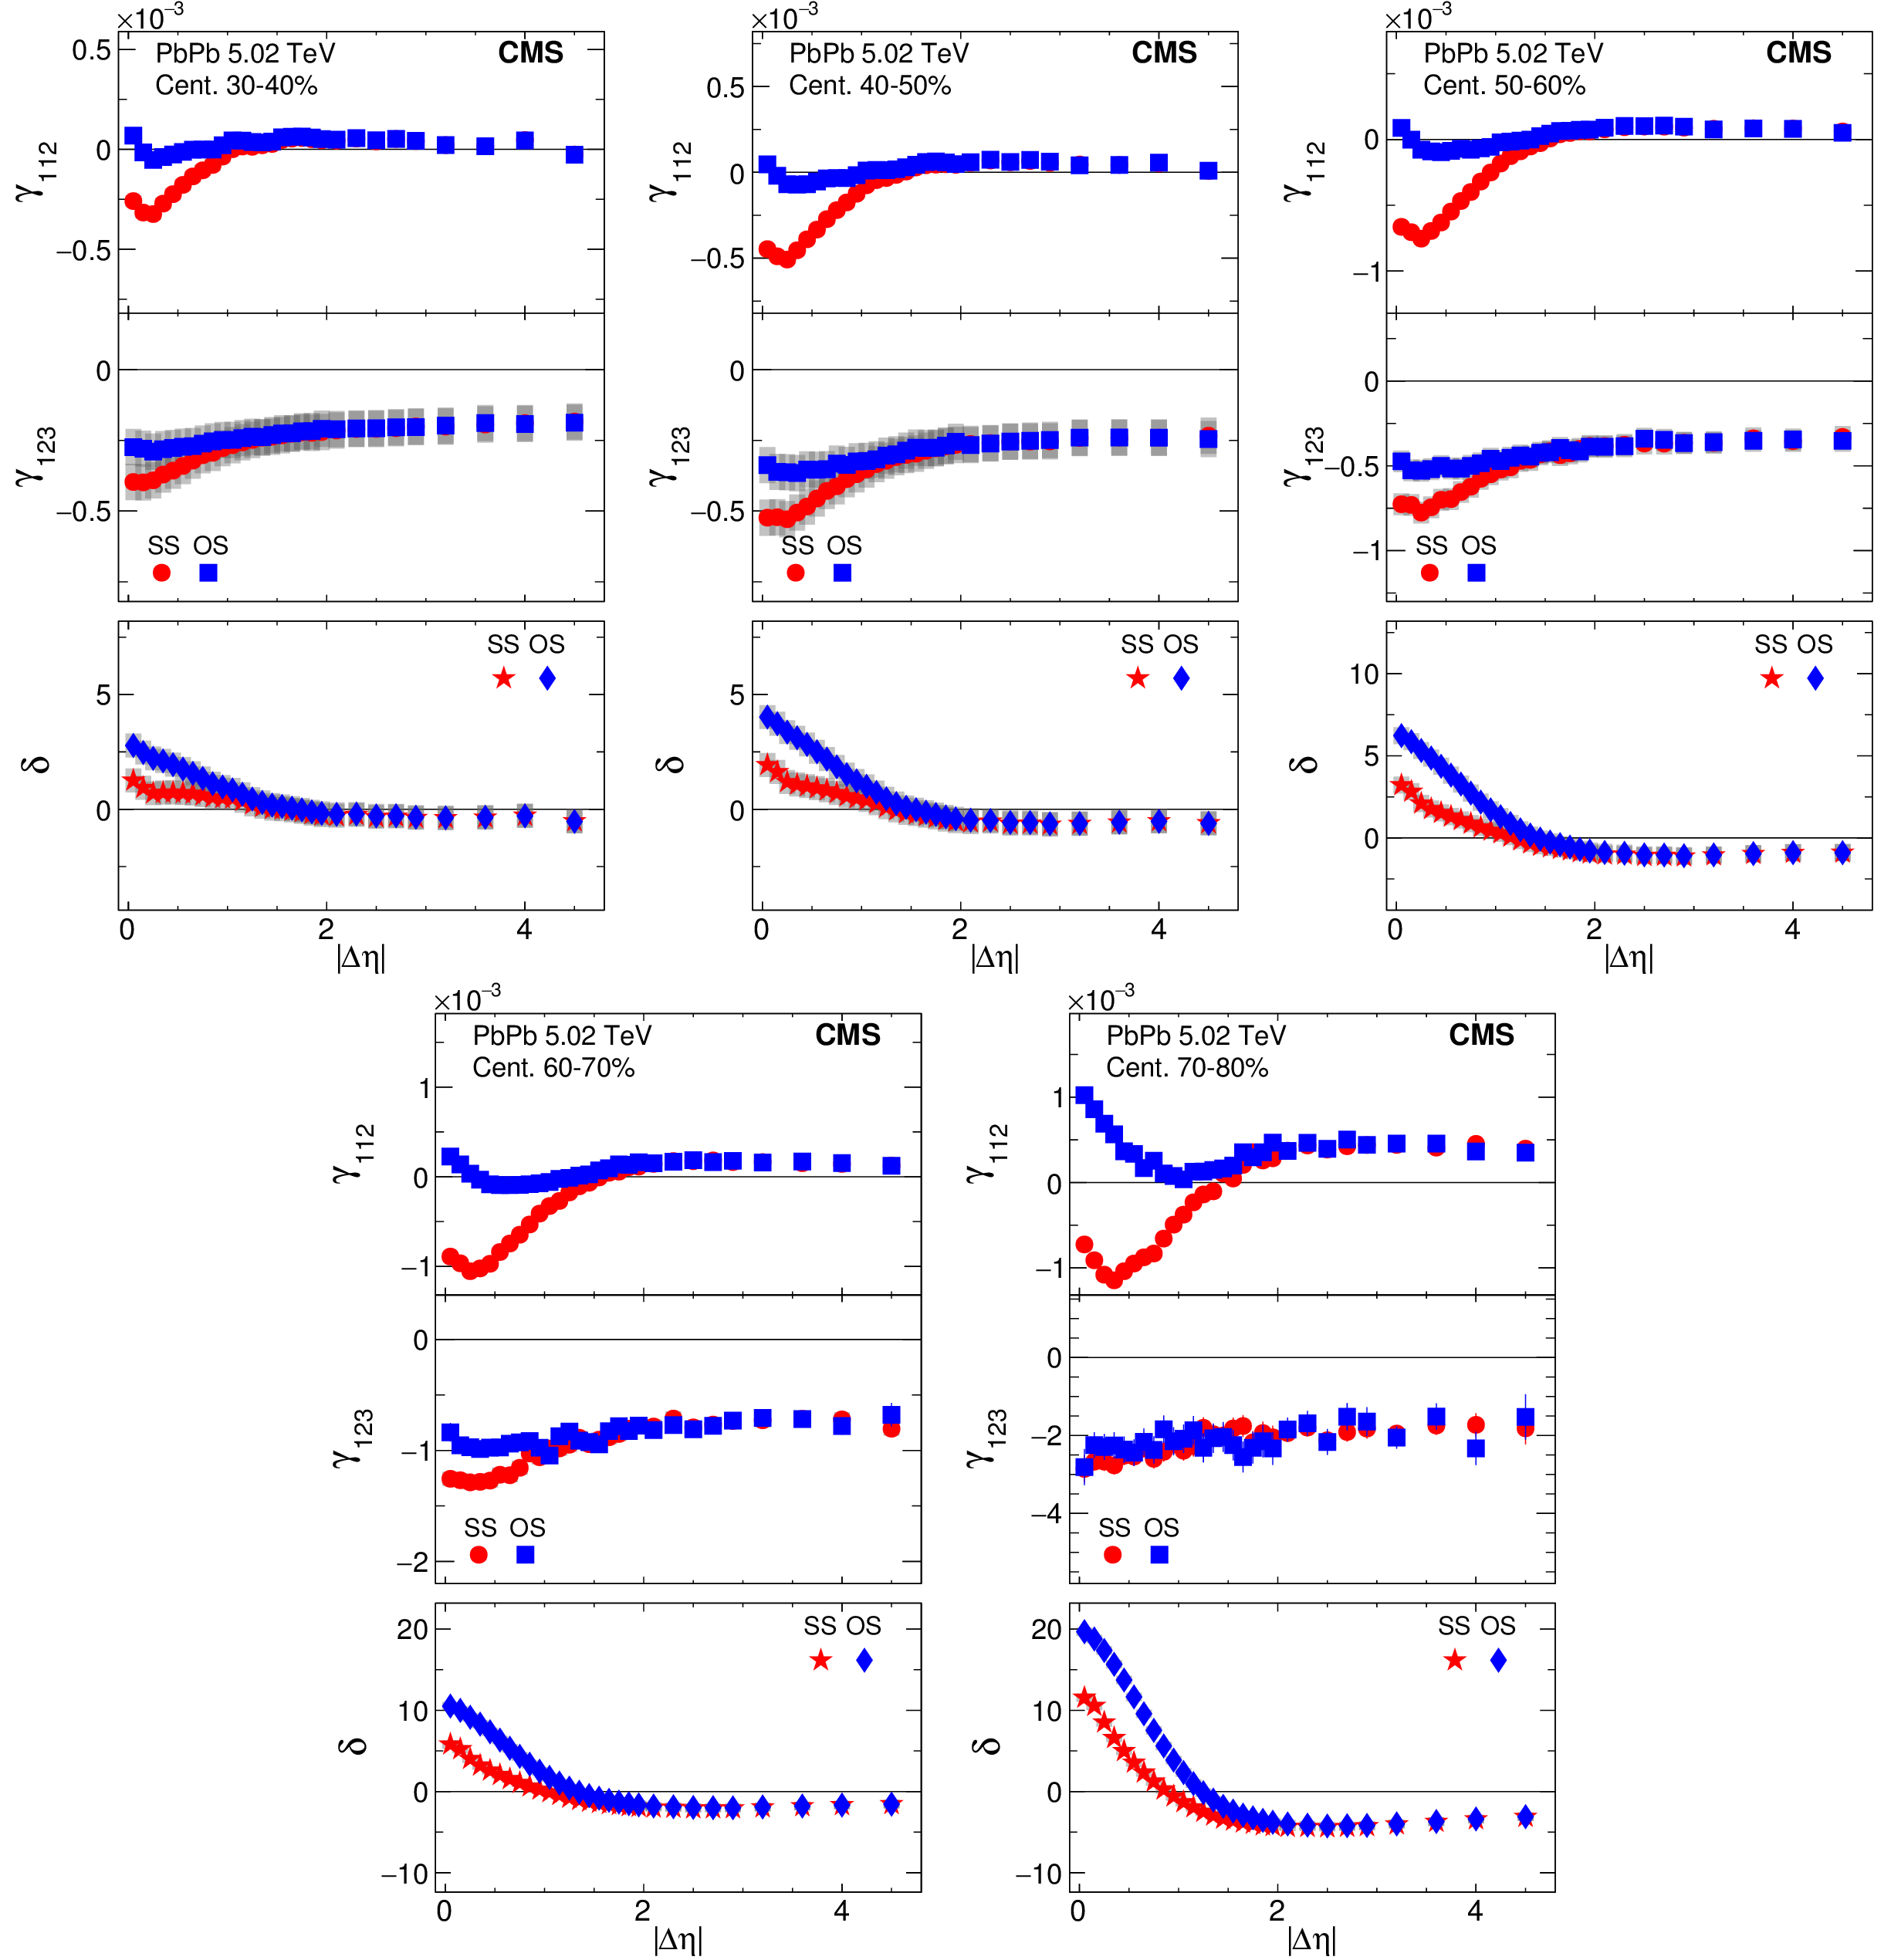
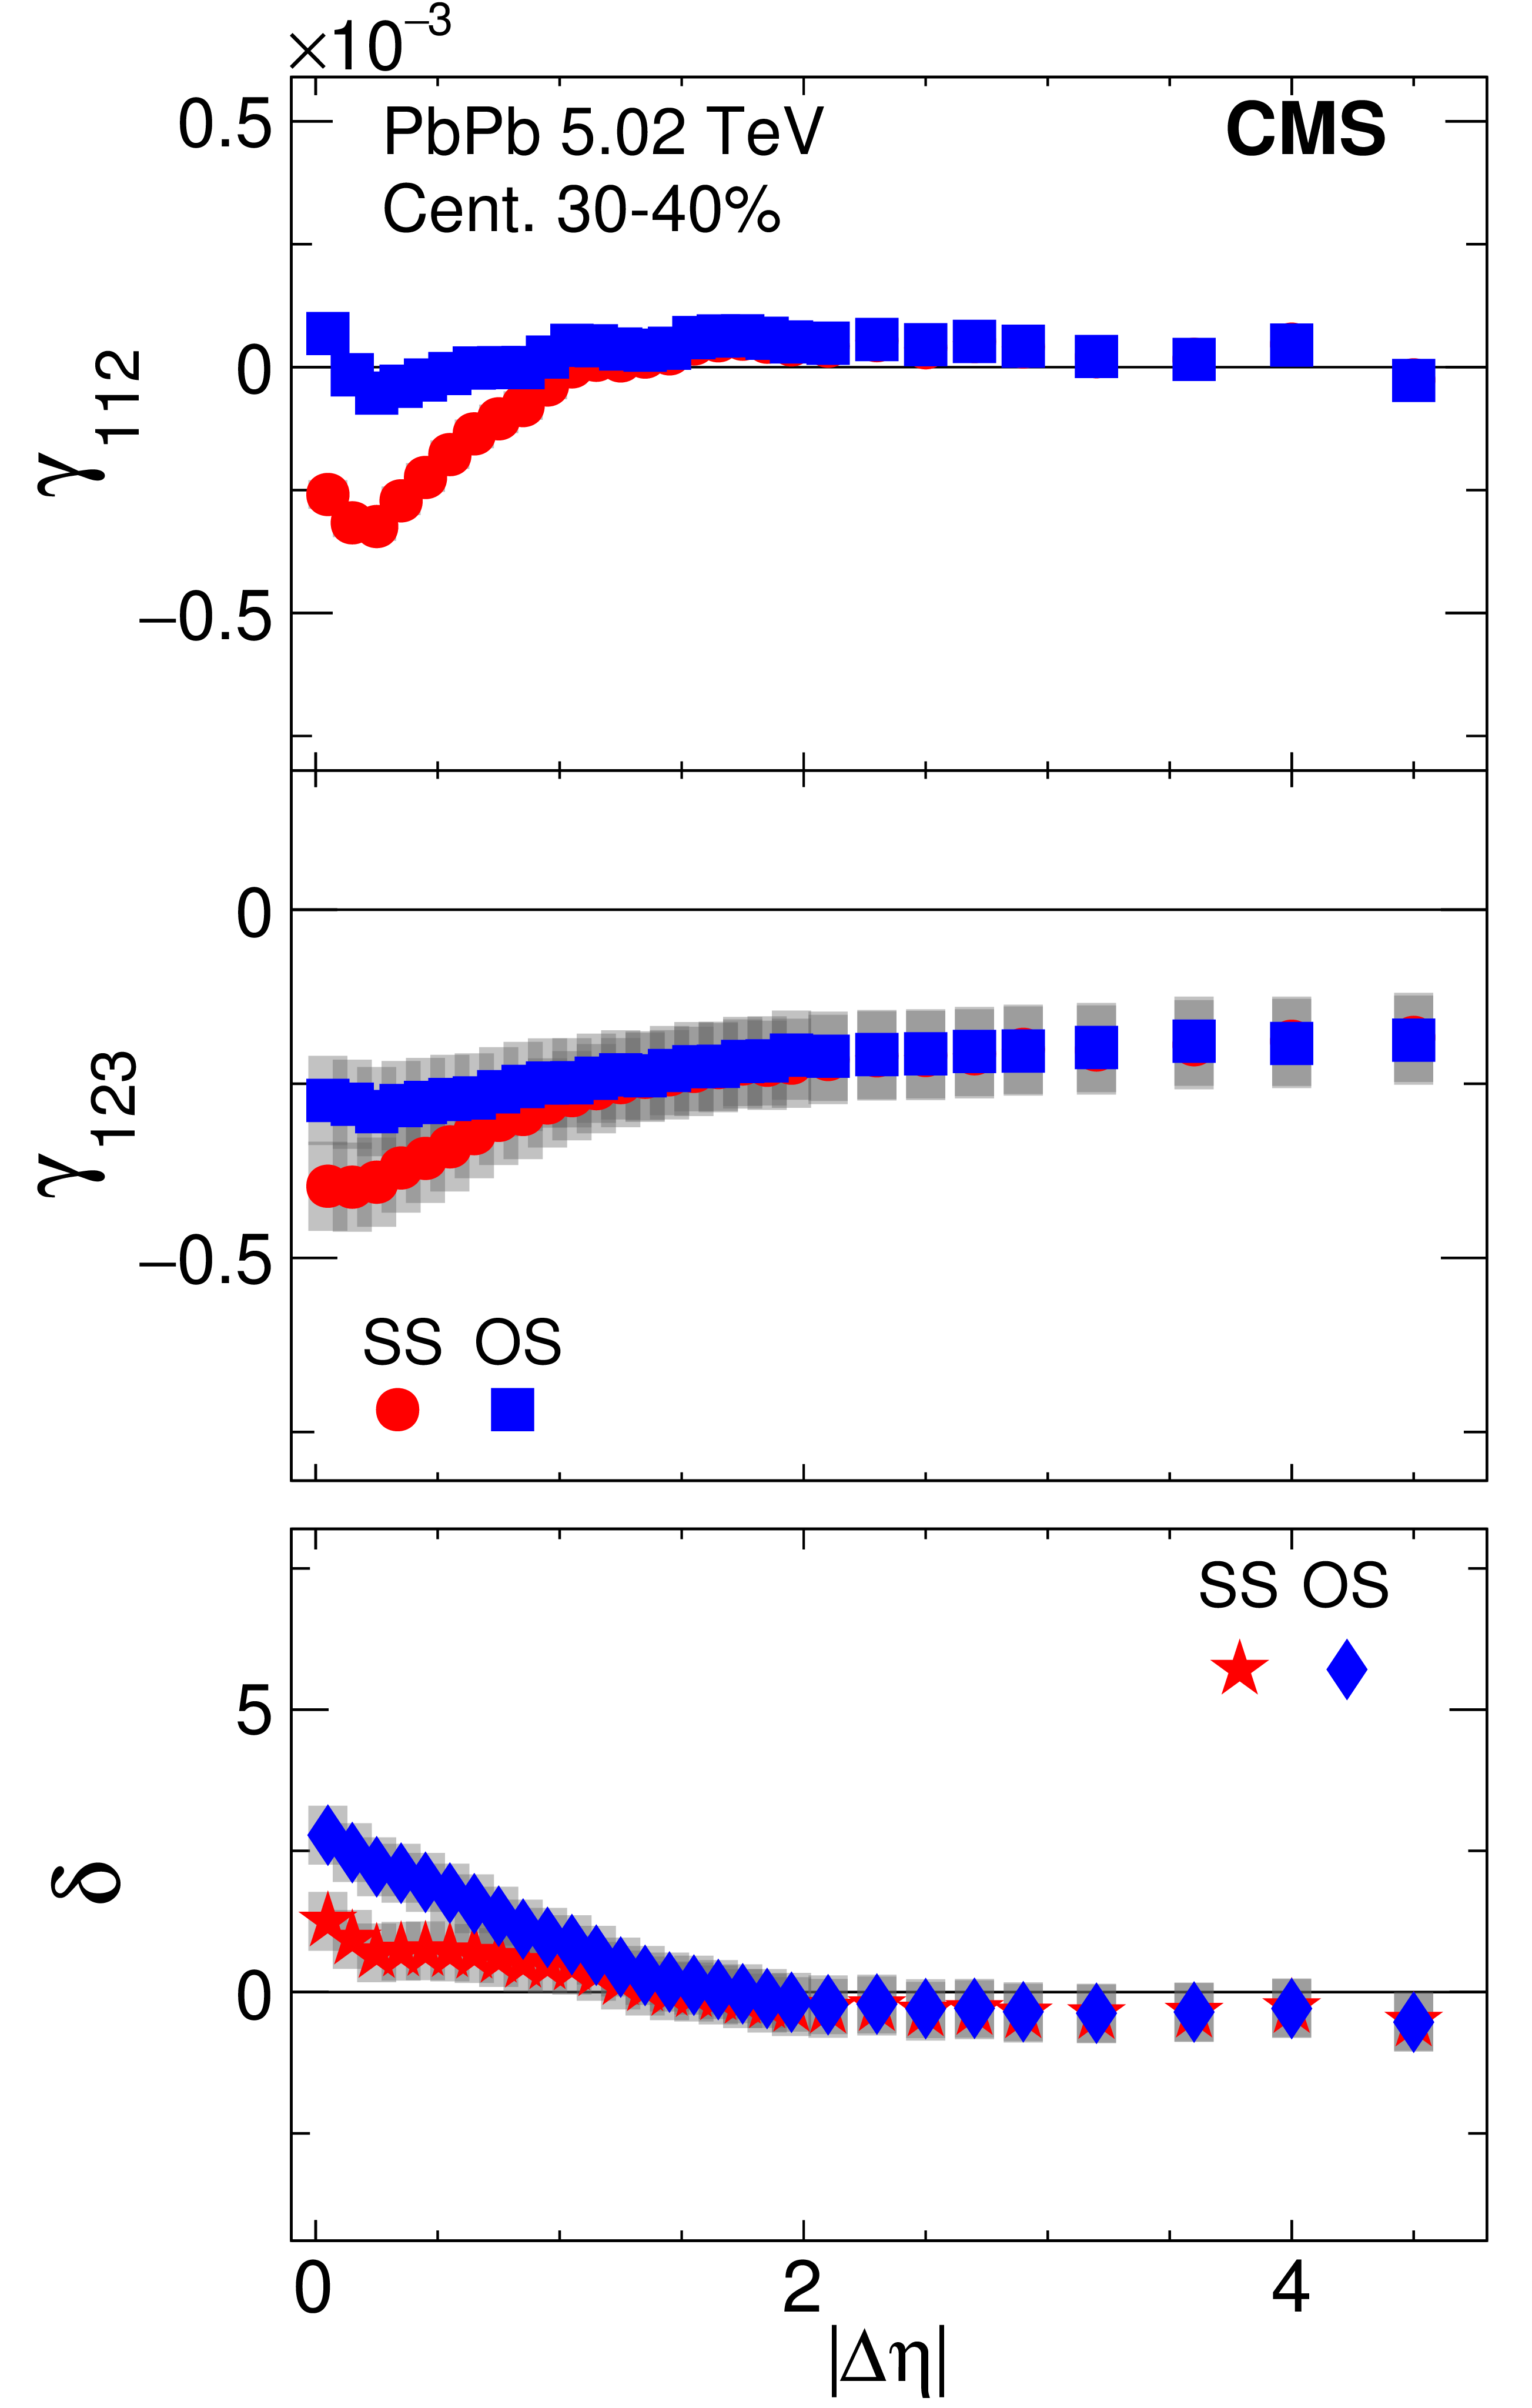
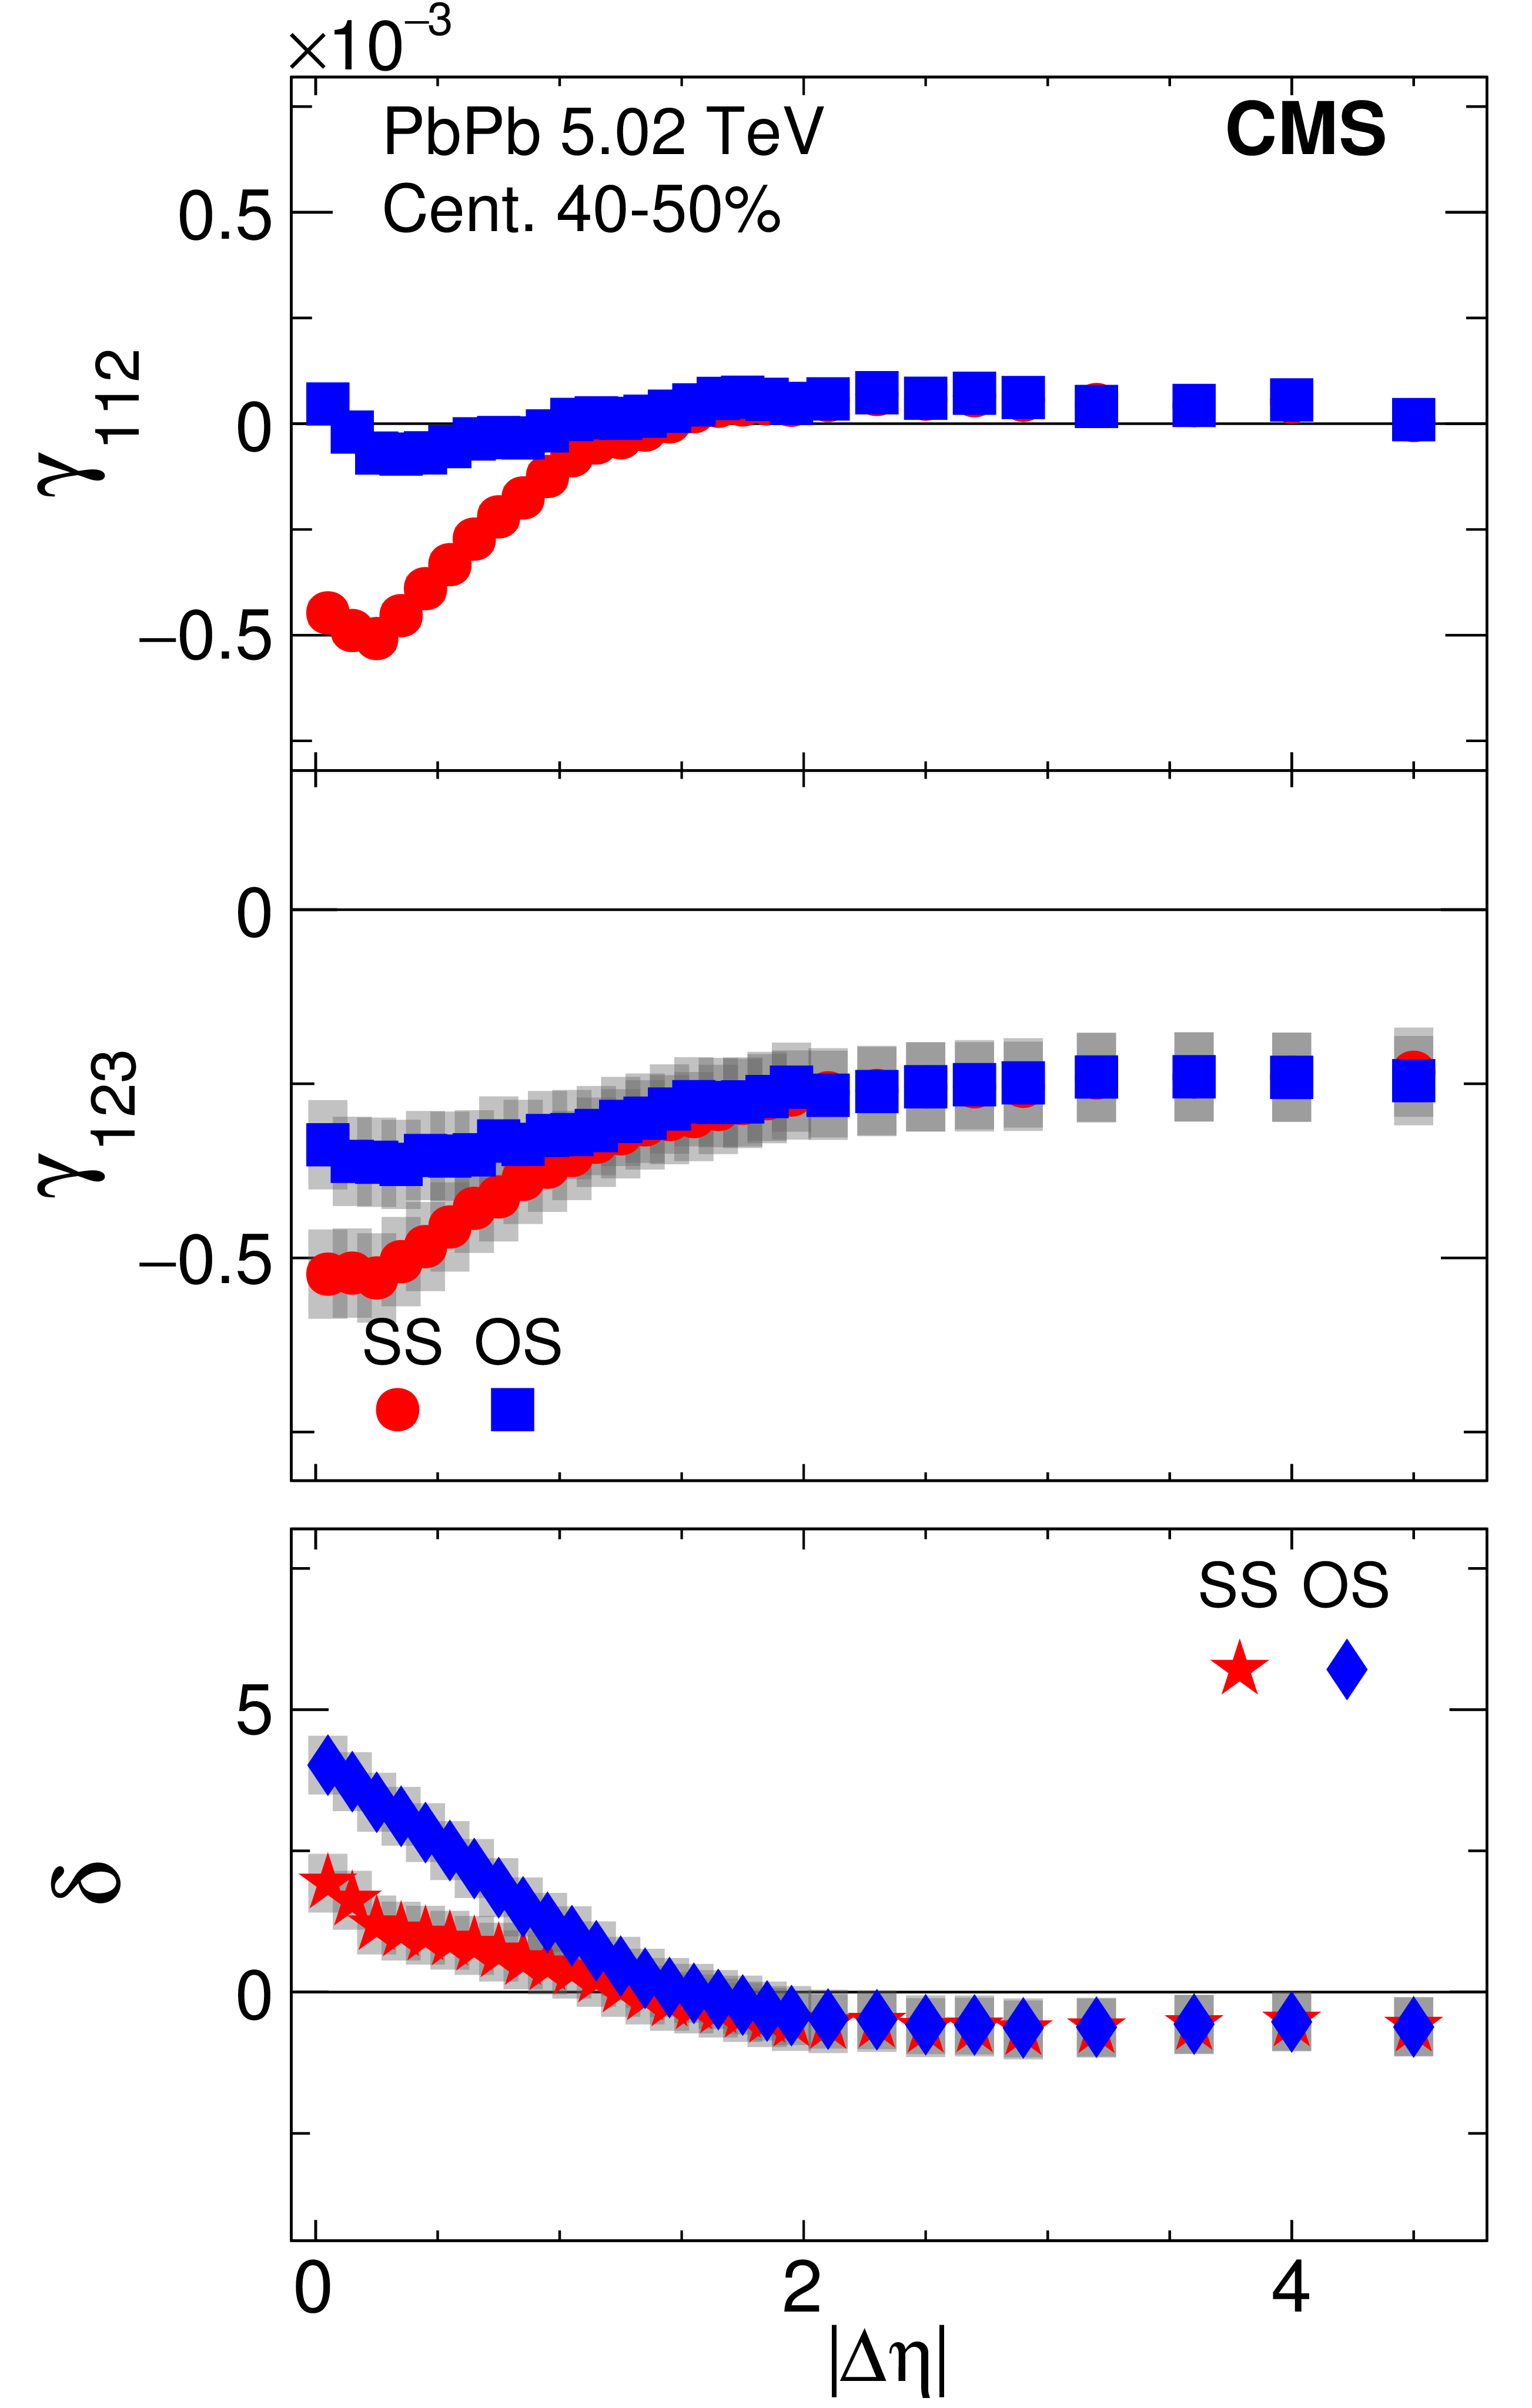
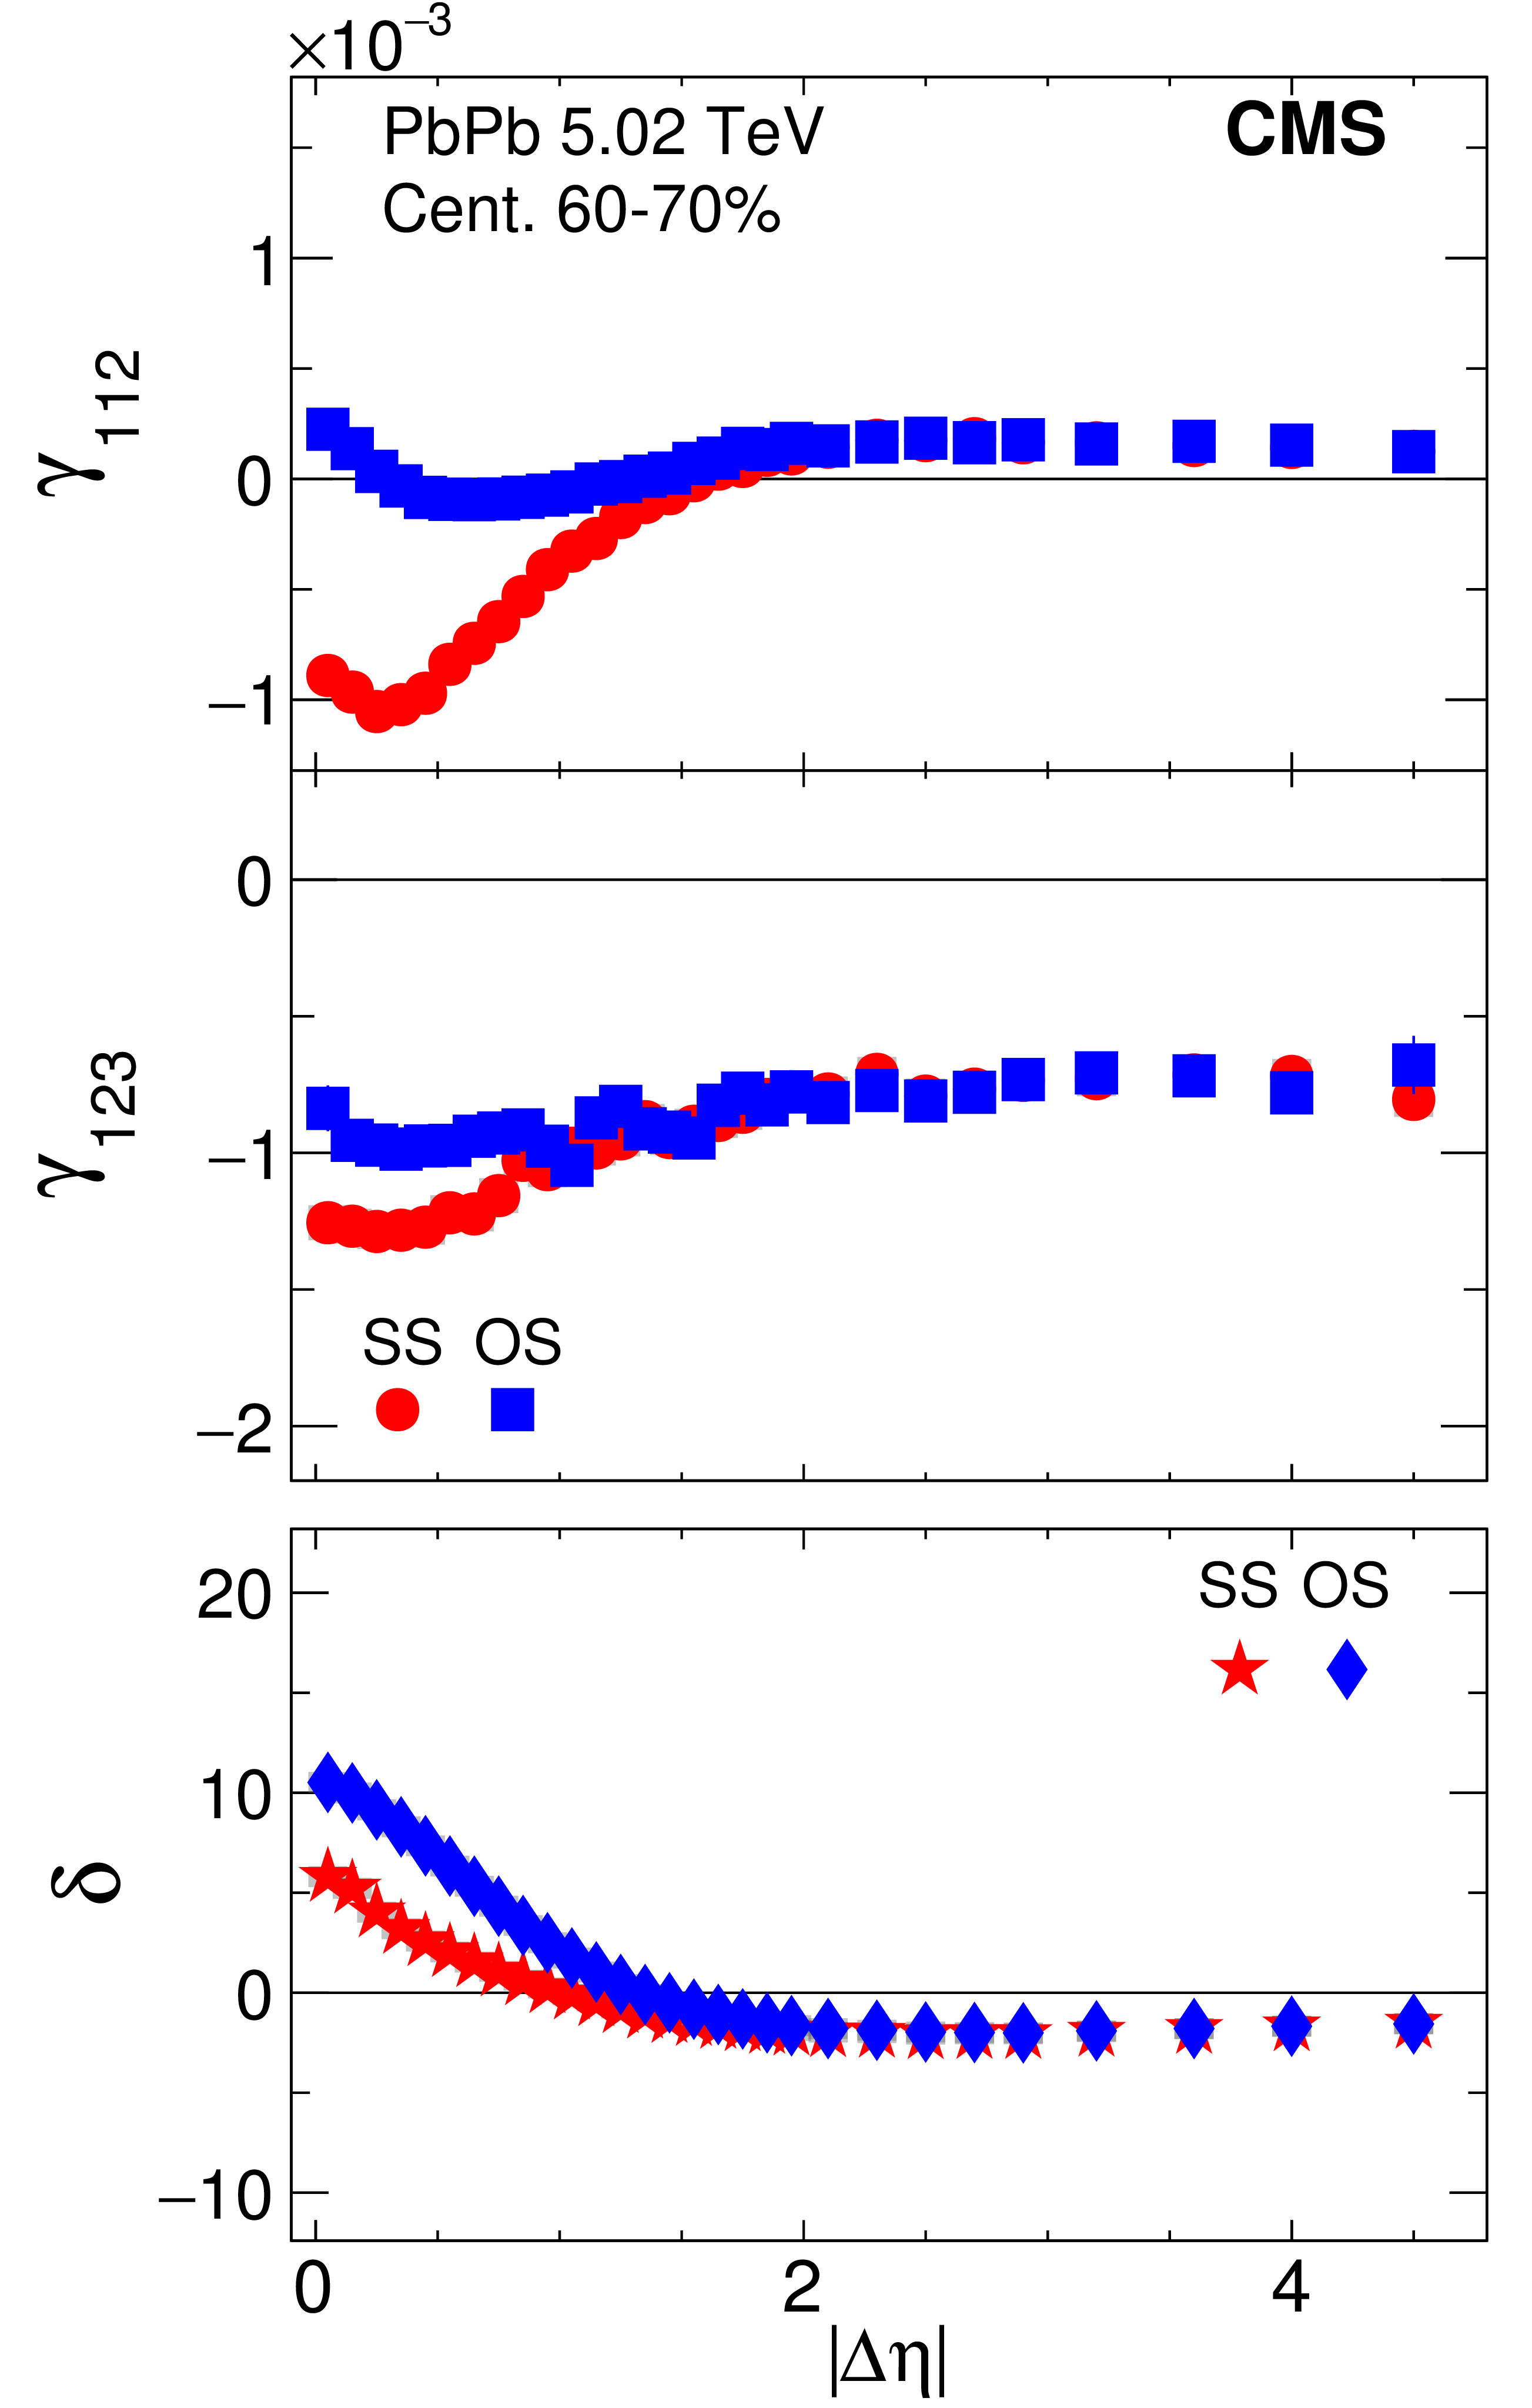
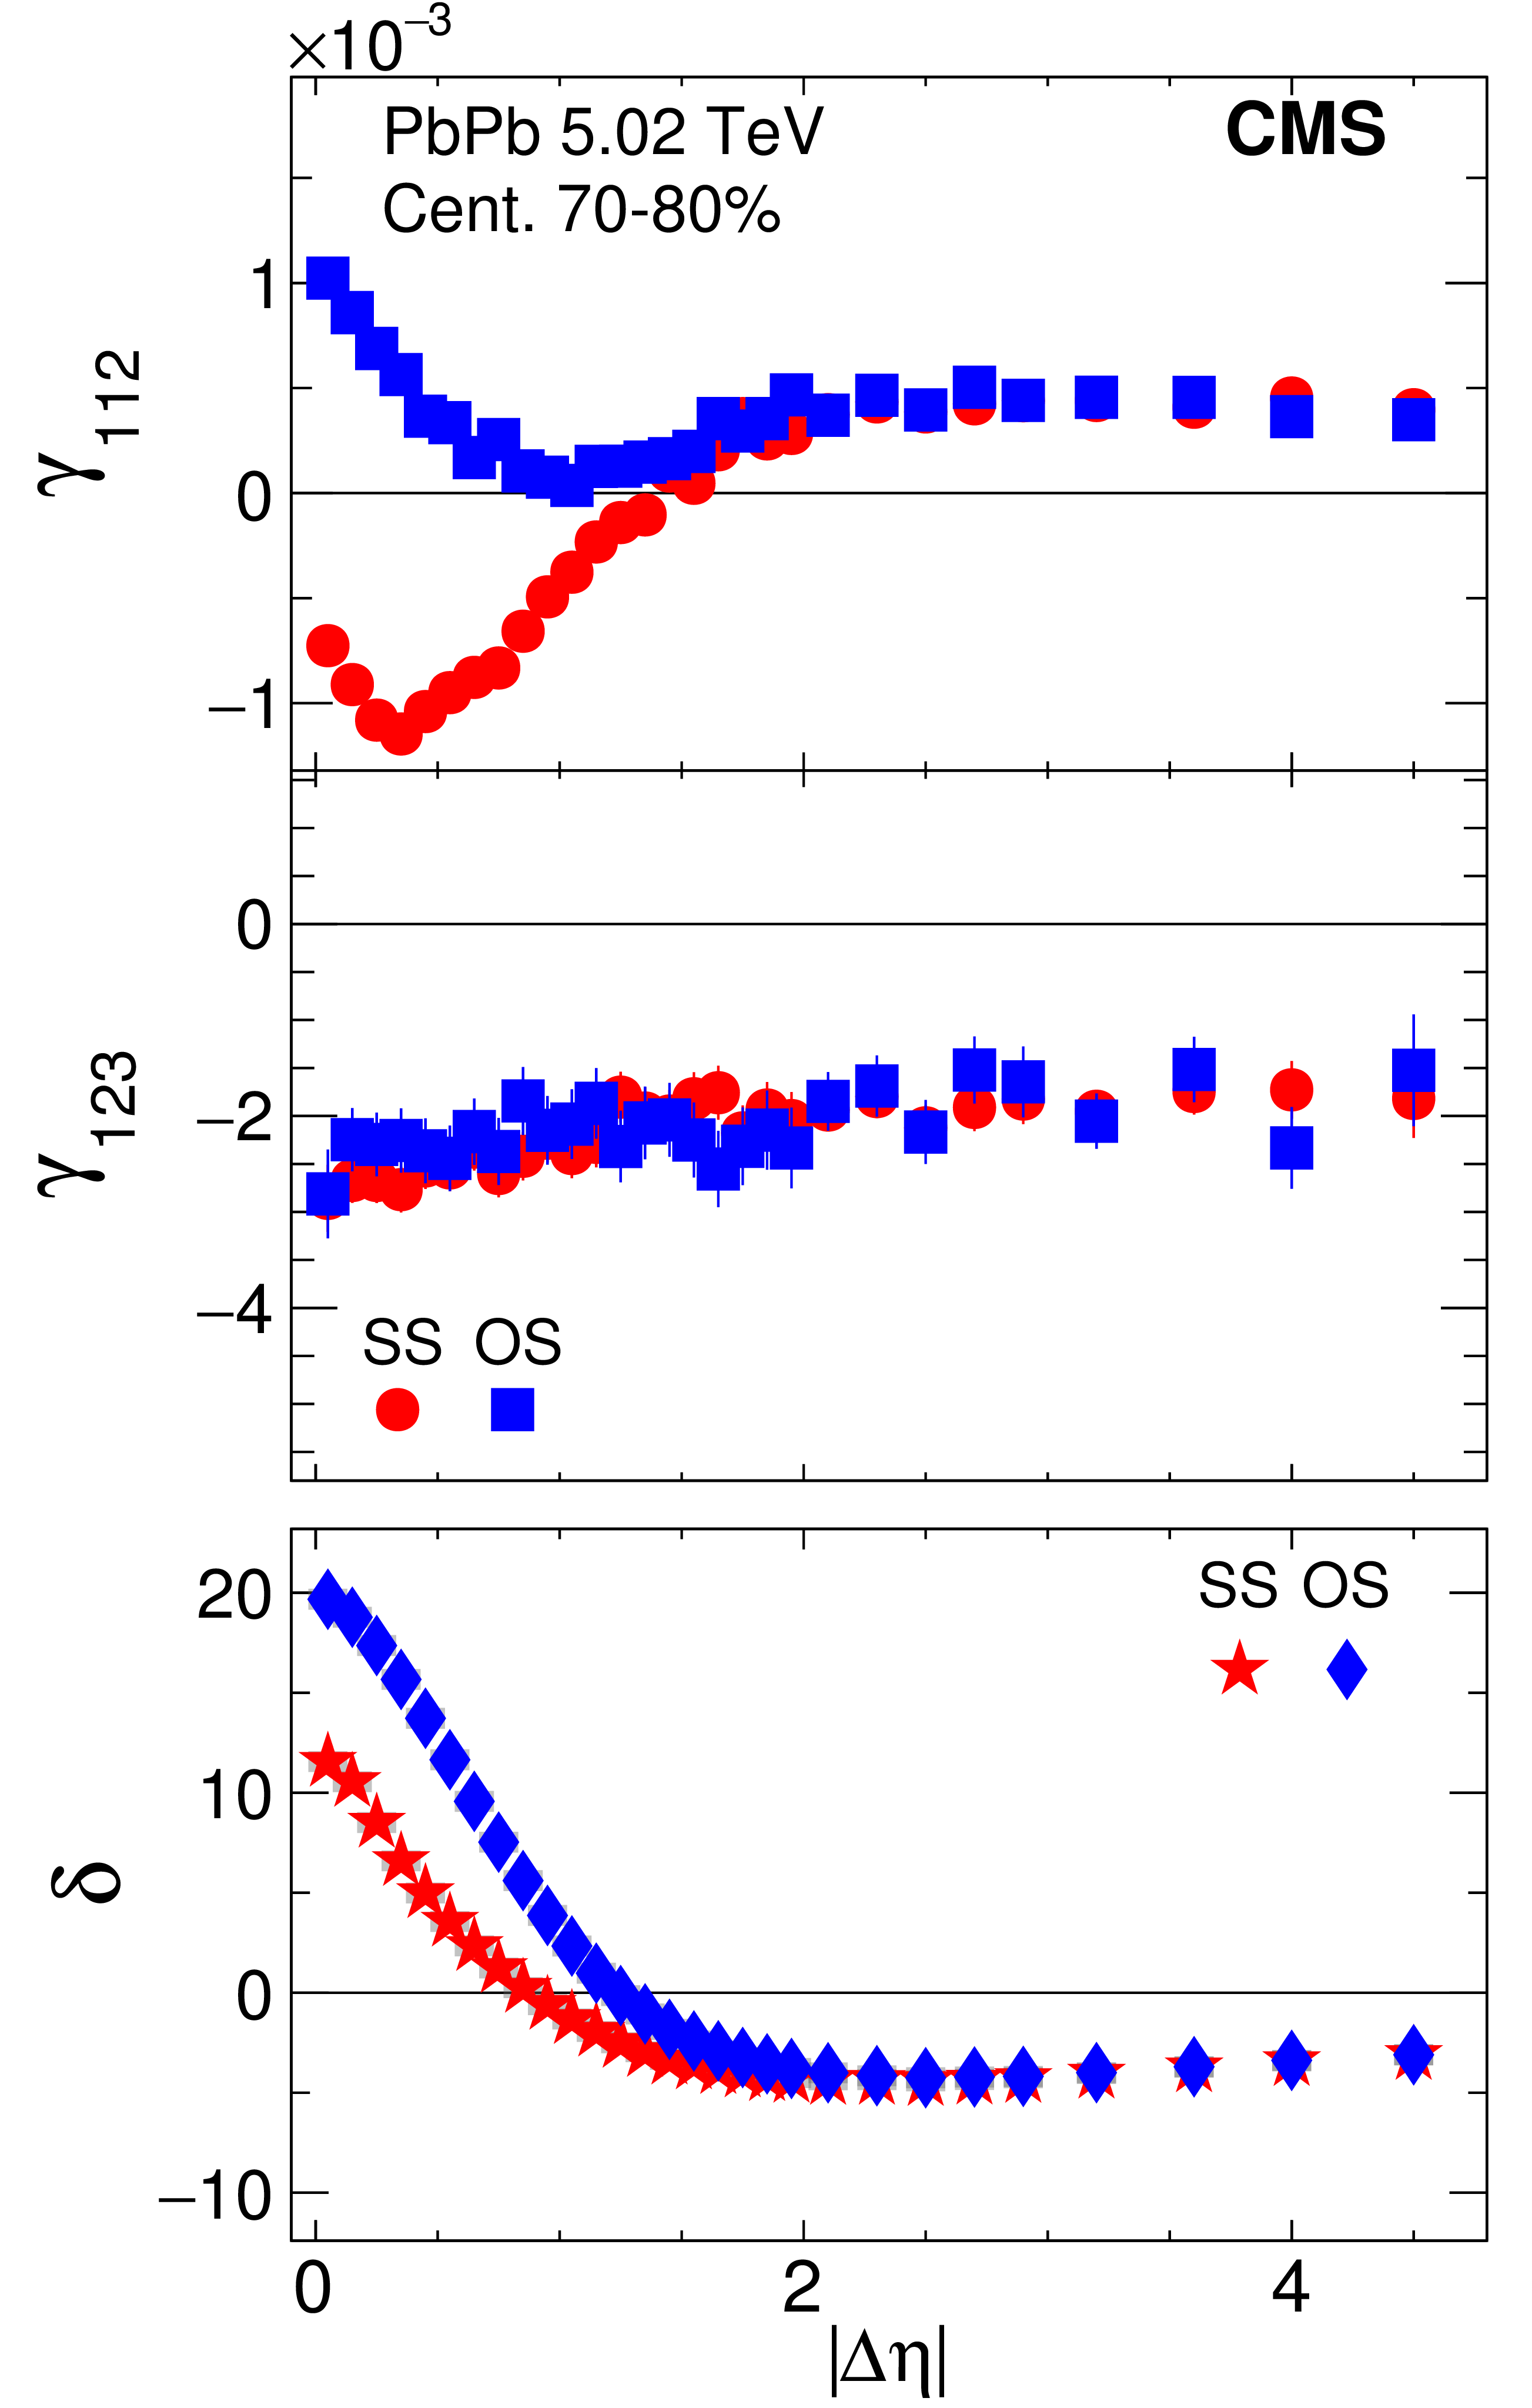
The SS and OS three-particle correlators, $\gamma _{112}$ (upper) and $\gamma _{123}$ (middle), and two-particle correlator, $\delta $ (lower), as a function of $ {| {\Delta \eta } | }$ for five centrality classes in PbPb collisions at 5.02 TeV. The SS and OS two-particle correlators are denoted by different markers. Statistical and systematic uncertainties are indicated by the error bars and shaded regions, respectively. |
png pdf |
Figure 23-a:
The SS and OS three-particle correlators, $\gamma _{112}$ (upper) and $\gamma _{123}$ (middle), and two-particle correlator, $\delta $ (lower), as a function of $ {| {\Delta \eta } | }$ for centrality class 30-40% in PbPb collisions at 5.02 TeV. The SS and OS two-particle correlators are denoted by different markers. Statistical and systematic uncertainties are indicated by the error bars and shaded regions, respectively. |
png pdf |
Figure 23-b:
The SS and OS three-particle correlators, $\gamma _{112}$ (upper) and $\gamma _{123}$ (middle), and two-particle correlator, $\delta $ (lower), as a function of $ {| {\Delta \eta } | }$ for centrality class 40-50% in PbPb collisions at 5.02 TeV. The SS and OS two-particle correlators are denoted by different markers. Statistical and systematic uncertainties are indicated by the error bars and shaded regions, respectively. |

png pdf |
Figure 23-c:
The SS and OS three-particle correlators, $\gamma _{112}$ (upper) and $\gamma _{123}$ (middle), and two-particle correlator, $\delta $ (lower), as a function of $ {| {\Delta \eta } | }$ for centrality class 50-60% in PbPb collisions at 5.02 TeV. The SS and OS two-particle correlators are denoted by different markers. Statistical and systematic uncertainties are indicated by the error bars and shaded regions, respectively. |
png pdf |
Figure 23-d:
The SS and OS three-particle correlators, $\gamma _{112}$ (upper) and $\gamma _{123}$ (middle), and two-particle correlator, $\delta $ (lower), as a function of $ {| {\Delta \eta } | }$ for centrality class 60-70% in PbPb collisions at 5.02 TeV. The SS and OS two-particle correlators are denoted by different markers. Statistical and systematic uncertainties are indicated by the error bars and shaded regions, respectively. |
png pdf |
Figure 23-e:
The SS and OS three-particle correlators, $\gamma _{112}$ (upper) and $\gamma _{123}$ (middle), and two-particle correlator, $\delta $ (lower), as a function of $ {| {\Delta \eta } | }$ for centrality class 70-80% in PbPb collisions at 5.02 TeV. The SS and OS two-particle correlators are denoted by different markers. Statistical and systematic uncertainties are indicated by the error bars and shaded regions, respectively. |
png pdf |
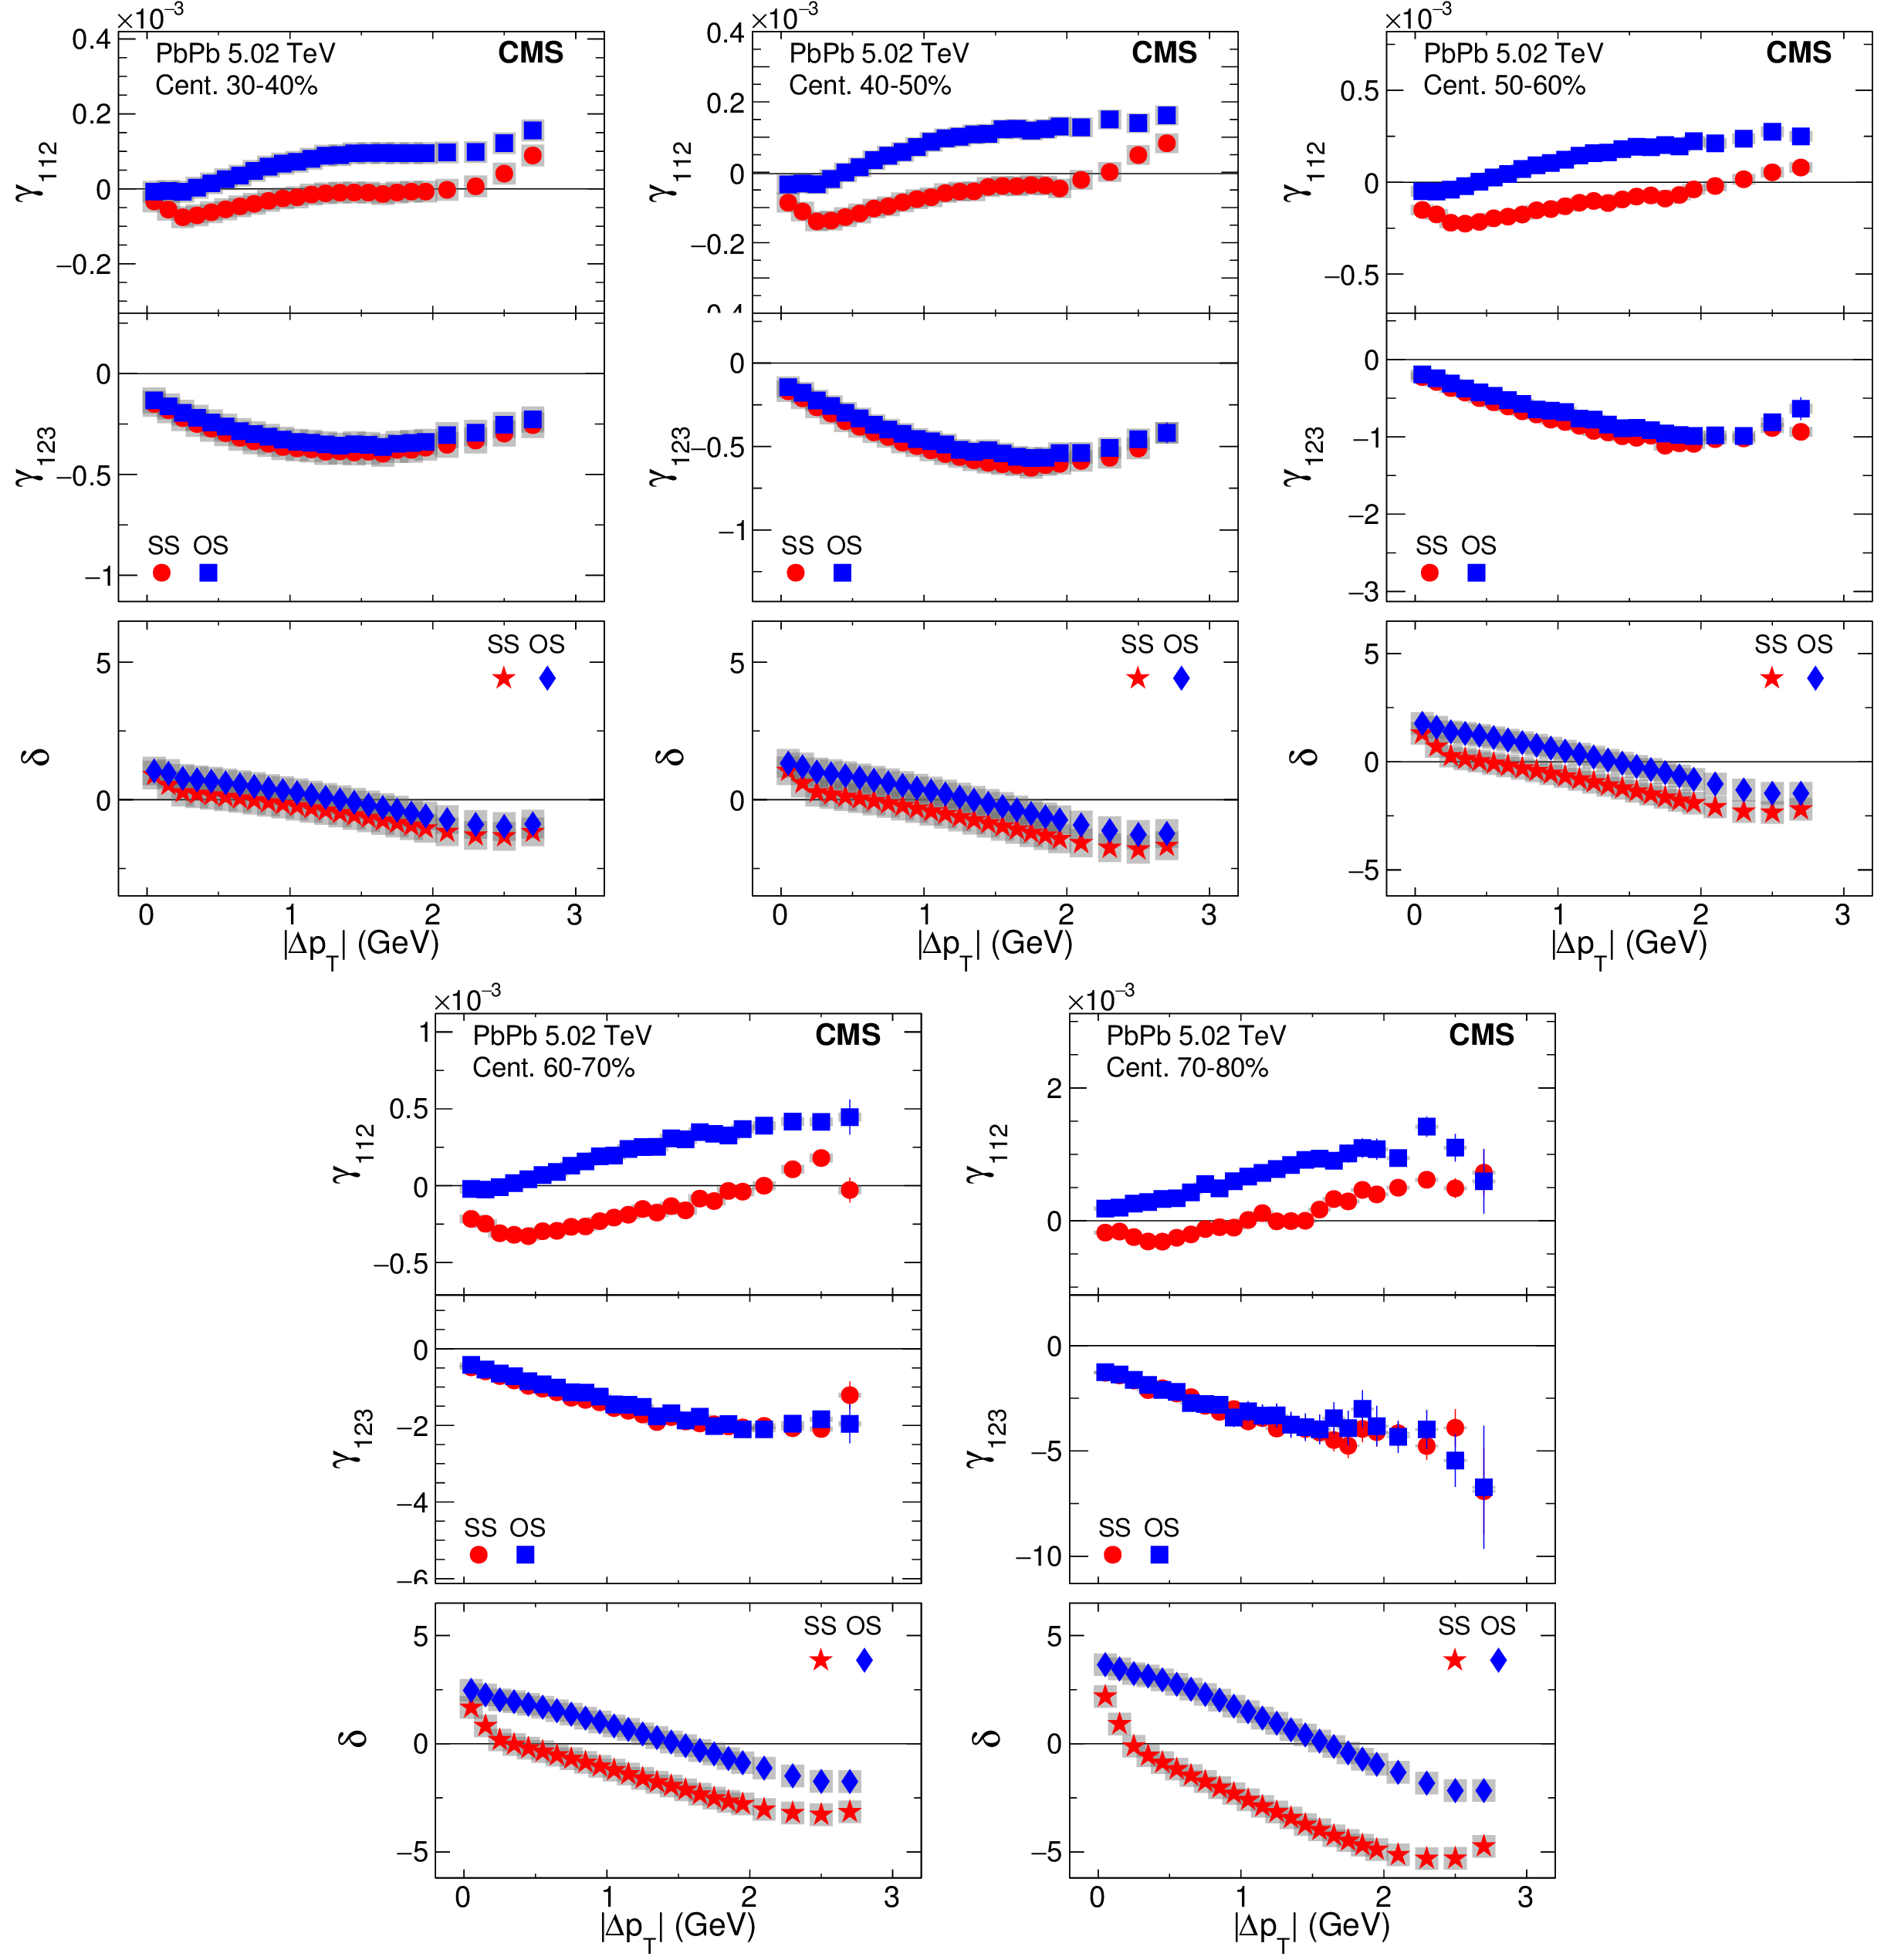
Figure 24:
The SS and OS three-particle correlators, $\gamma _{112}$ (upper) and $\gamma _{123}$ (middle), and two-particle correlator, $\delta $ (lower), as a function of $ {| \Delta {p_{\mathrm {T}}} | }$ for five centrality classes in PbPb collisions at $ {\sqrt {{s_{_{\mathrm {NN}}}}}}= $ 5.02 TeV. The SS and OS two-particle correlators are denoted by different markers. Statistical and systematic uncertainties are indicated by the error bars and shaded regions, respectively. |
png pdf |
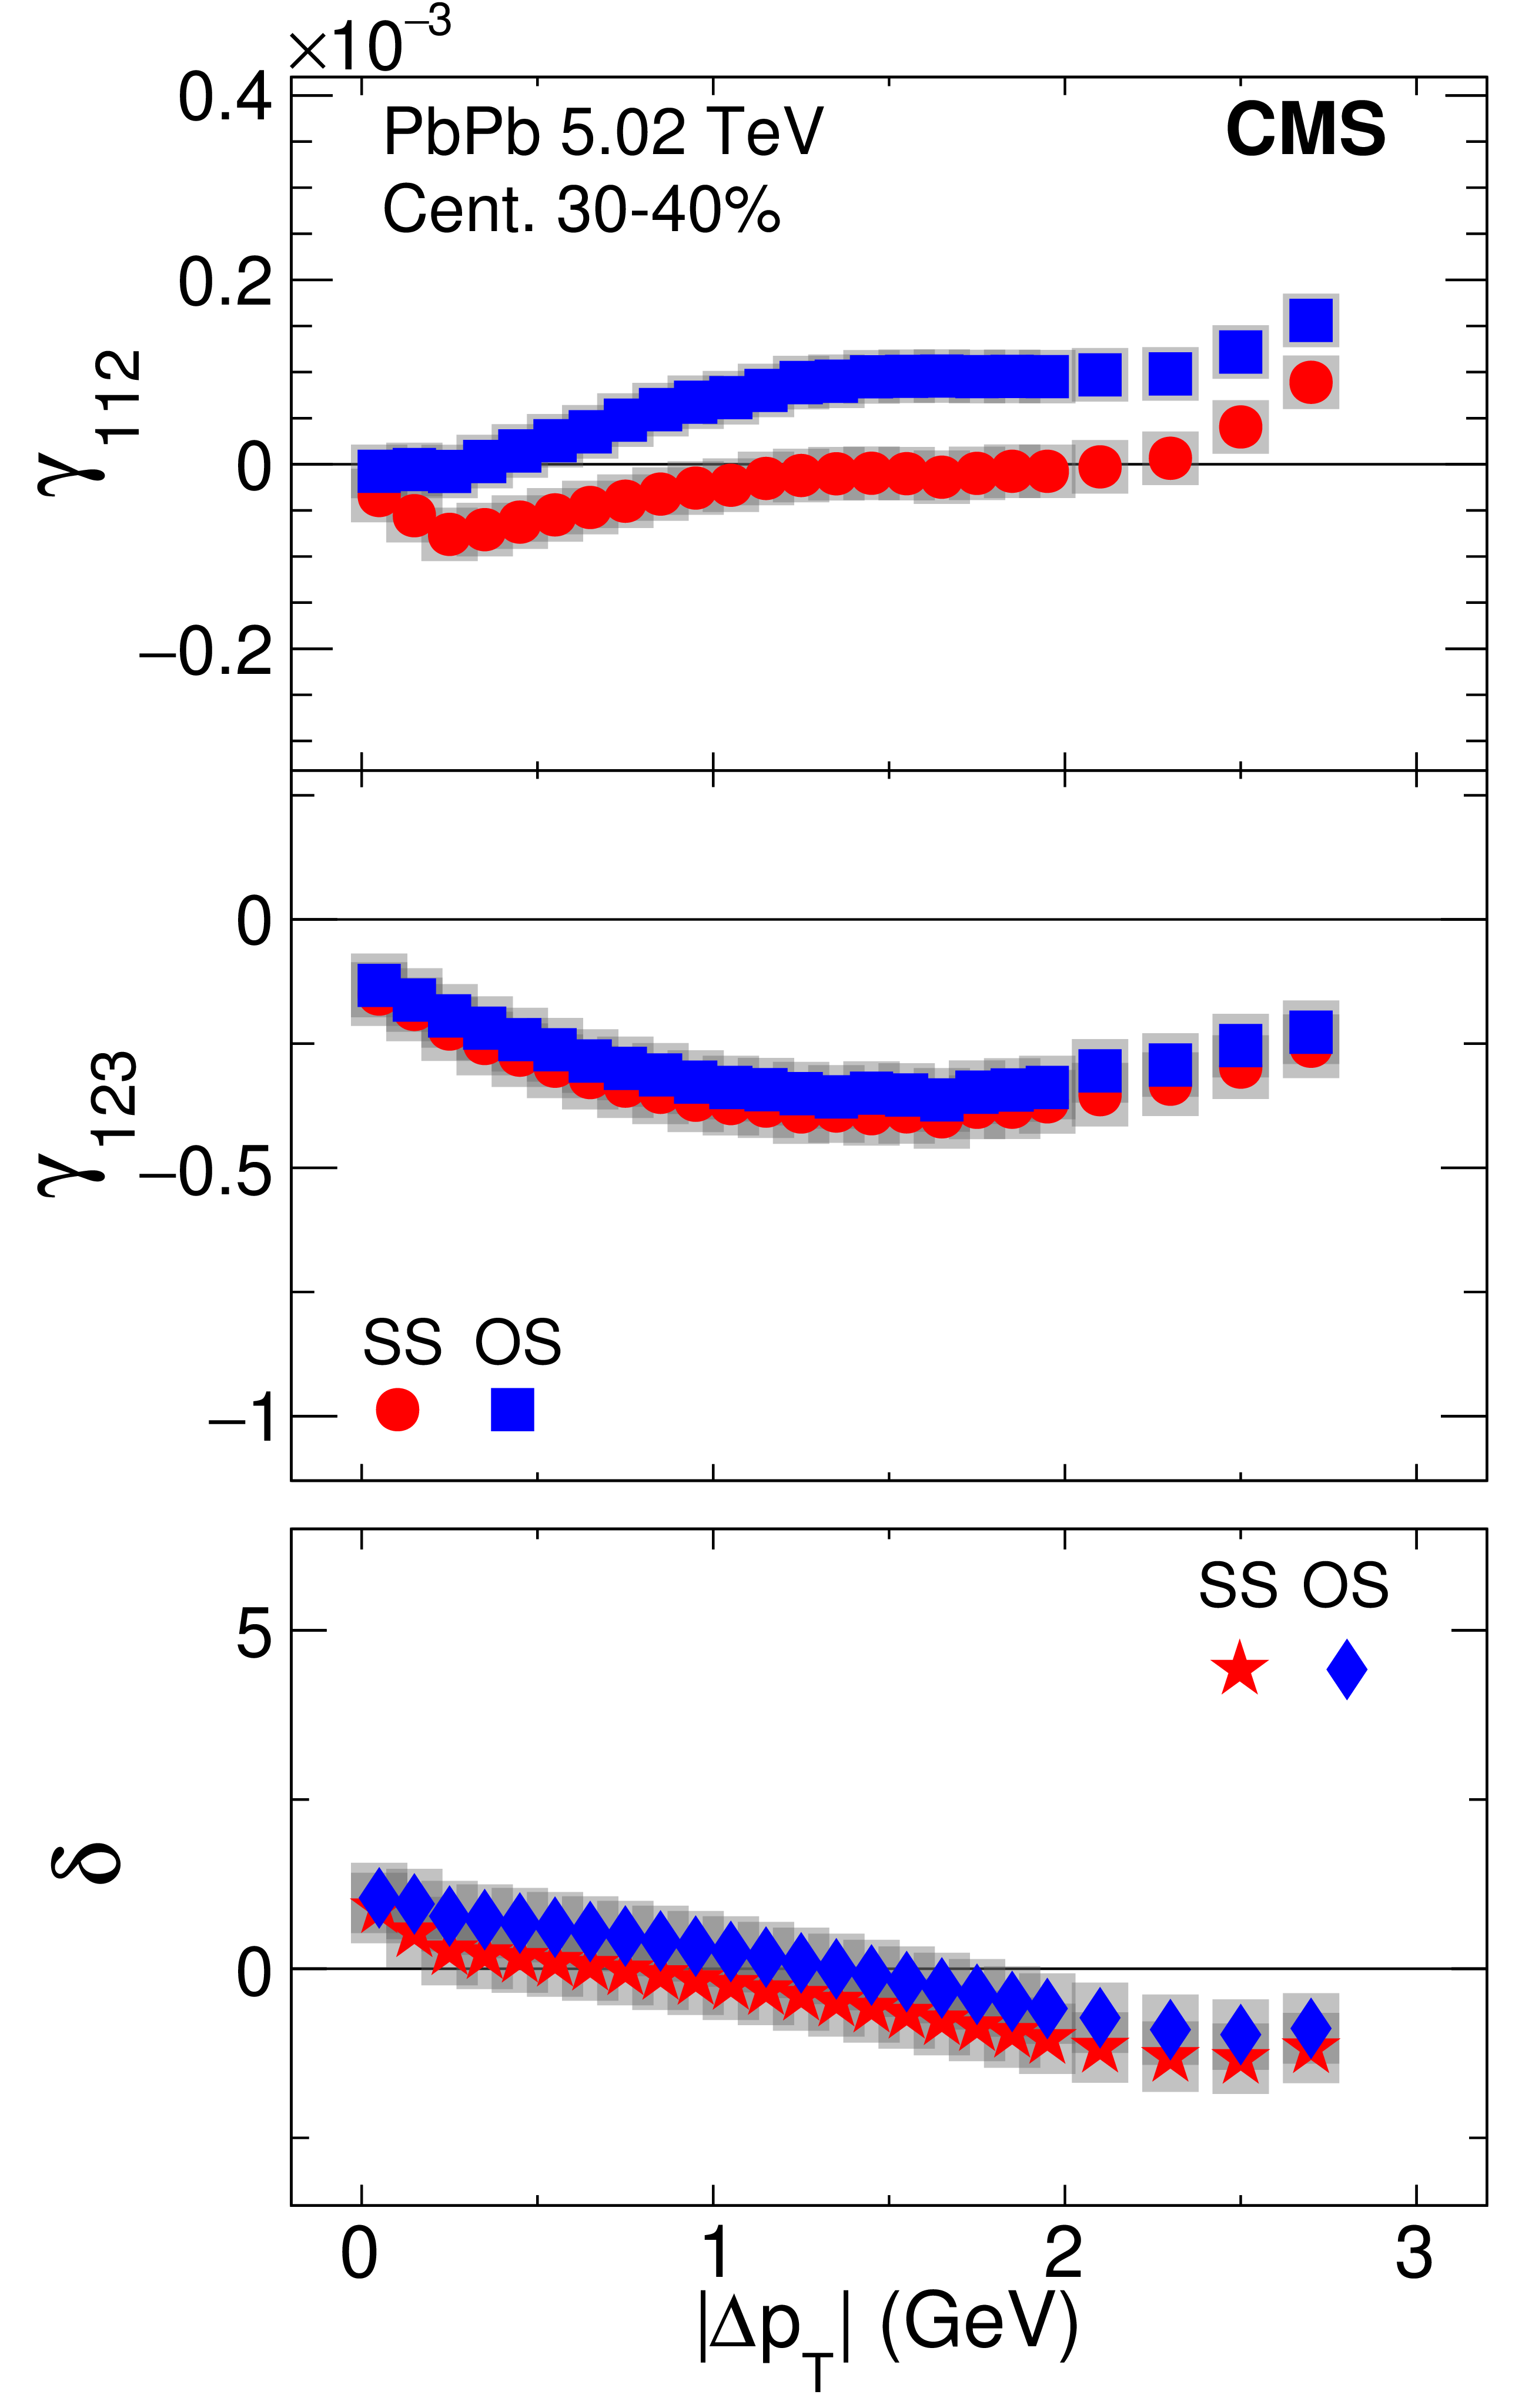
Figure 24-a:
The SS and OS three-particle correlators, $\gamma _{112}$ (upper) and $\gamma _{123}$ (middle), and two-particle correlator, $\delta $ (lower), as a function of $ {| \Delta {p_{\mathrm {T}}} | }$ for centrality class 30-40% in PbPb collisions at $ {\sqrt {{s_{_{\mathrm {NN}}}}}}= $ 5.02 TeV. The SS and OS two-particle correlators are denoted by different markers. Statistical and systematic uncertainties are indicated by the error bars and shaded regions, respectively. |

png pdf |
Figure 24-b:
The SS and OS three-particle correlators, $\gamma _{112}$ (upper) and $\gamma _{123}$ (middle), and two-particle correlator, $\delta $ (lower), as a function of $ {| \Delta {p_{\mathrm {T}}} | }$ for centrality class 40-50% in PbPb collisions at $ {\sqrt {{s_{_{\mathrm {NN}}}}}}= $ 5.02 TeV. The SS and OS two-particle correlators are denoted by different markers. Statistical and systematic uncertainties are indicated by the error bars and shaded regions, respectively. |

png pdf |
Figure 24-c:
The SS and OS three-particle correlators, $\gamma _{112}$ (upper) and $\gamma _{123}$ (middle), and two-particle correlator, $\delta $ (lower), as a function of $ {| \Delta {p_{\mathrm {T}}} | }$ for centrality class 50-60% in PbPb collisions at $ {\sqrt {{s_{_{\mathrm {NN}}}}}}= $ 5.02 TeV. The SS and OS two-particle correlators are denoted by different markers. Statistical and systematic uncertainties are indicated by the error bars and shaded regions, respectively. |
png pdf |
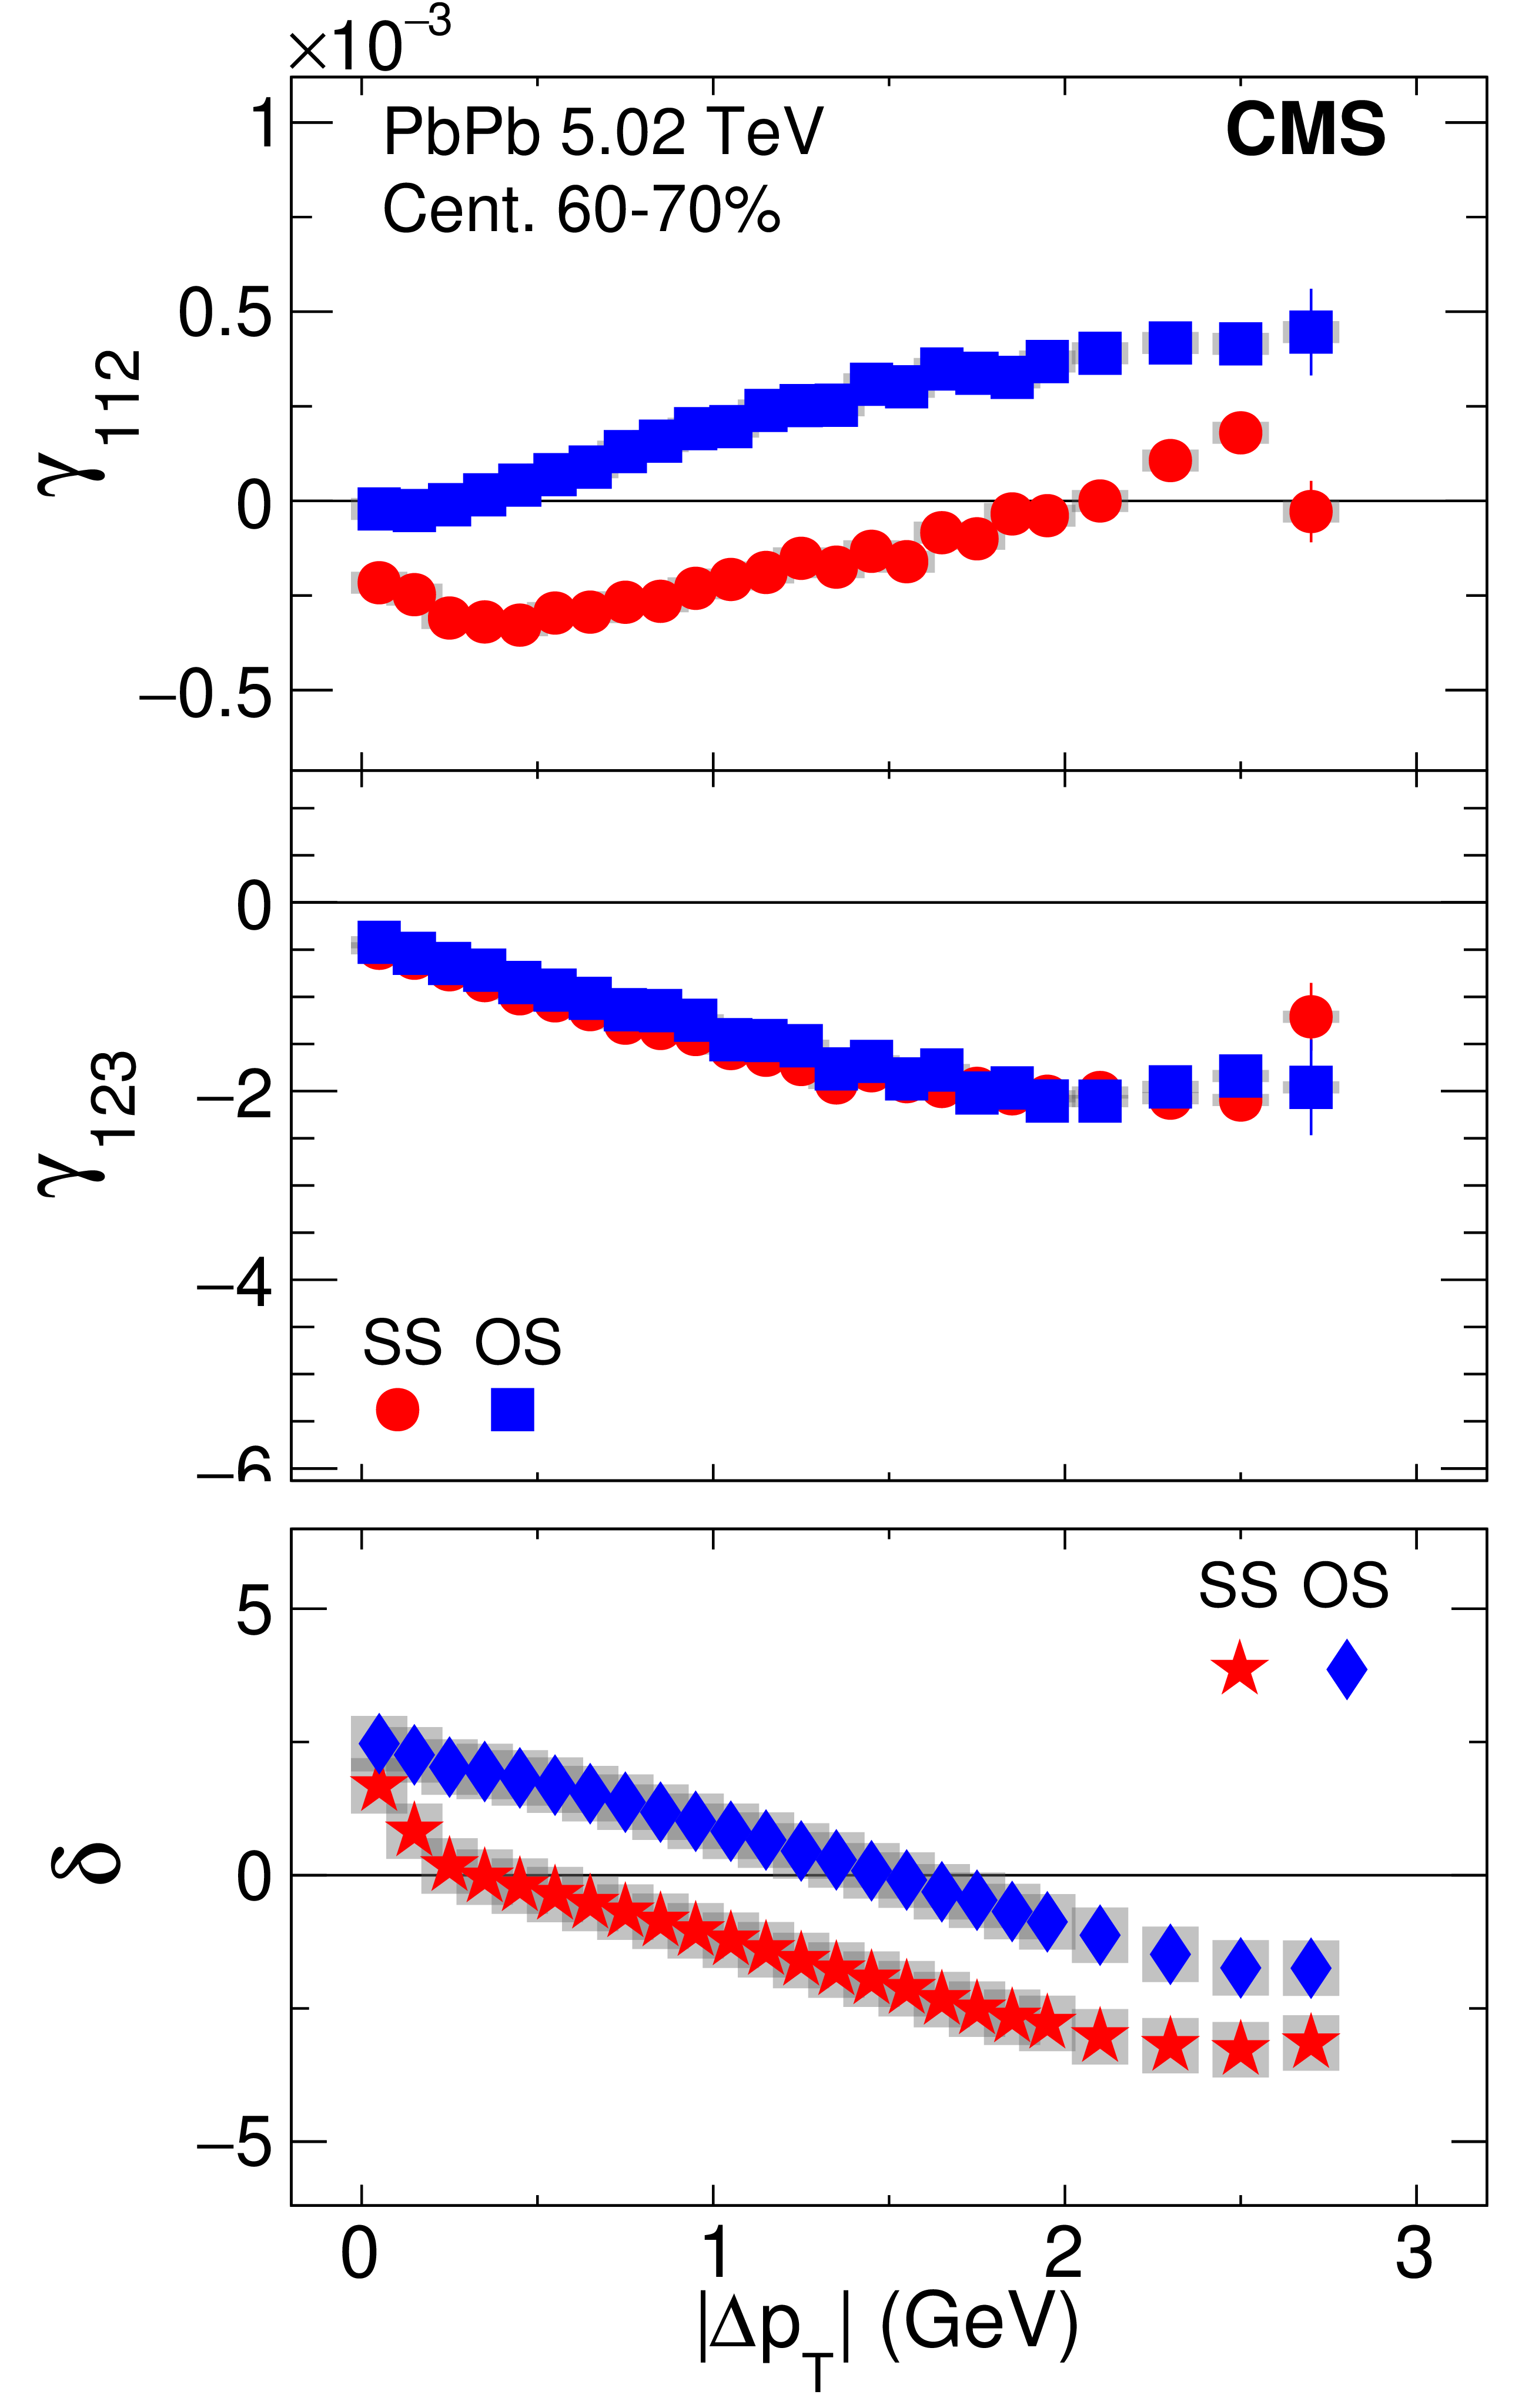
Figure 24-d:
The SS and OS three-particle correlators, $\gamma _{112}$ (upper) and $\gamma _{123}$ (middle), and two-particle correlator, $\delta $ (lower), as a function of $ {| \Delta {p_{\mathrm {T}}} | }$ for centrality class 60-70% in PbPb collisions at $ {\sqrt {{s_{_{\mathrm {NN}}}}}}= $ 5.02 TeV. The SS and OS two-particle correlators are denoted by different markers. Statistical and systematic uncertainties are indicated by the error bars and shaded regions, respectively. |
png pdf |
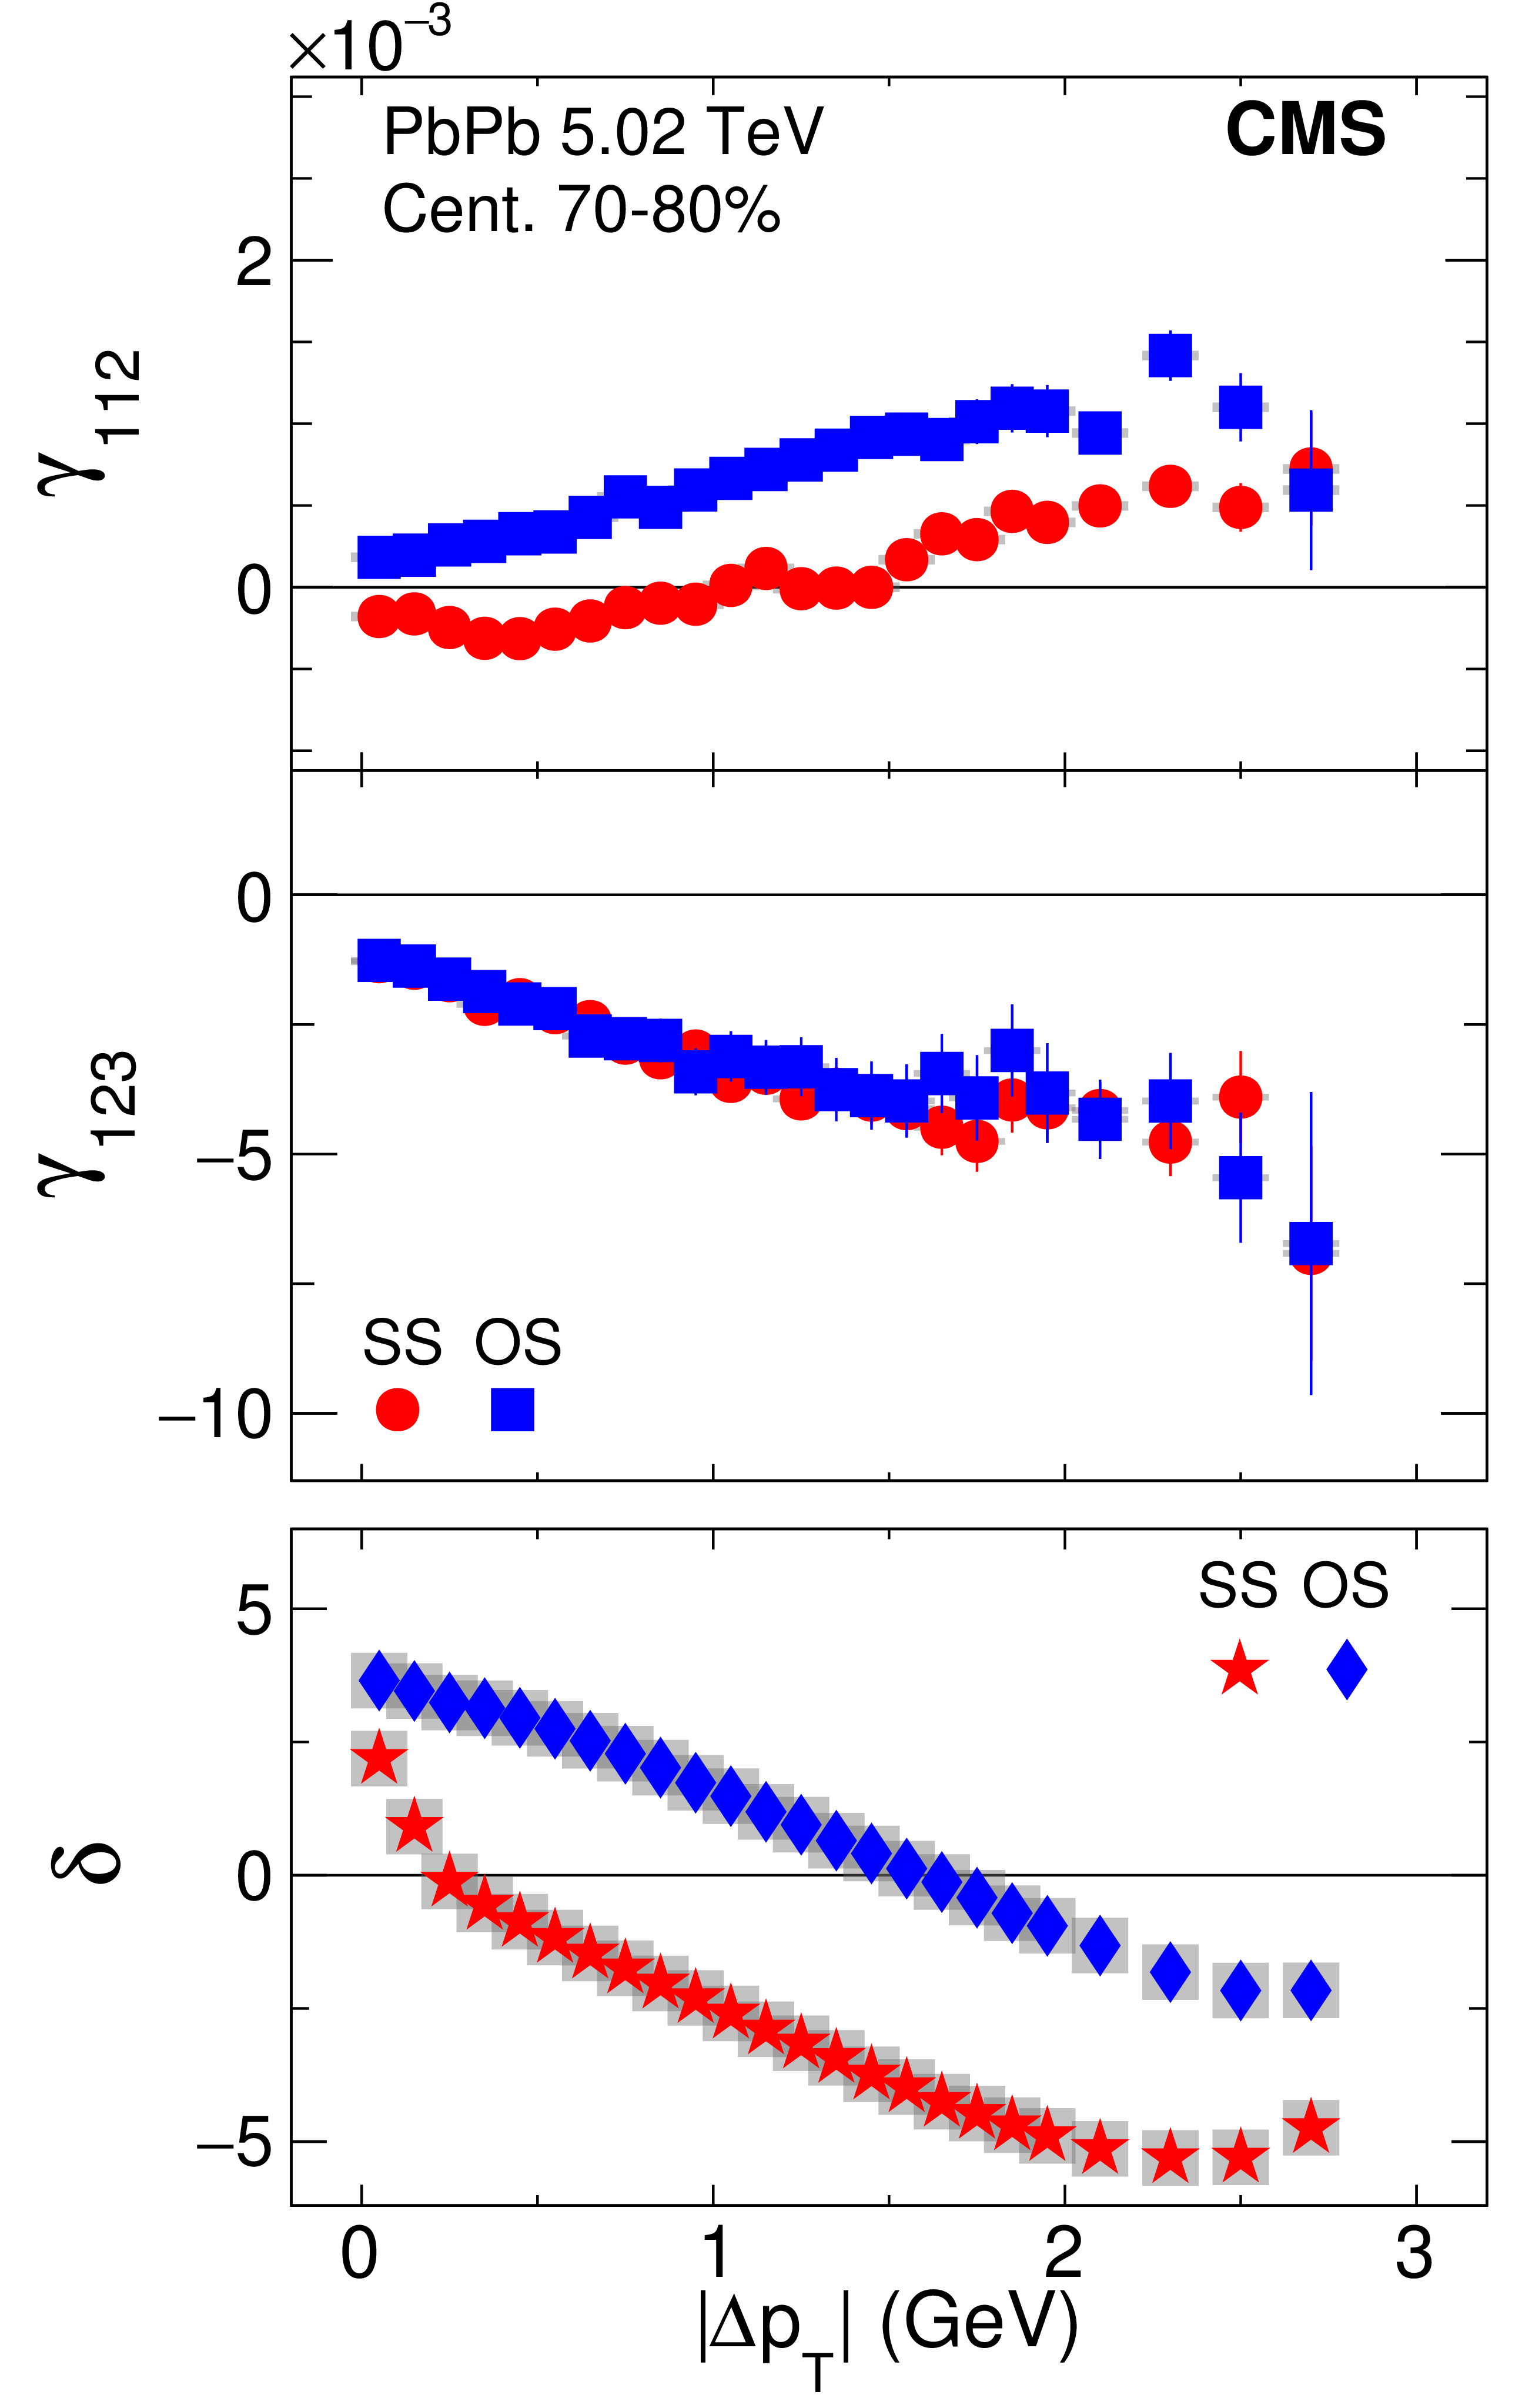
Figure 24-e:
The SS and OS three-particle correlators, $\gamma _{112}$ (upper) and $\gamma _{123}$ (middle), and two-particle correlator, $\delta $ (lower), as a function of $ {| \Delta {p_{\mathrm {T}}} | }$ for centrality class 70-80% in PbPb collisions at $ {\sqrt {{s_{_{\mathrm {NN}}}}}}= $ 5.02 TeV. The SS and OS two-particle correlators are denoted by different markers. Statistical and systematic uncertainties are indicated by the error bars and shaded regions, respectively. |
png pdf |
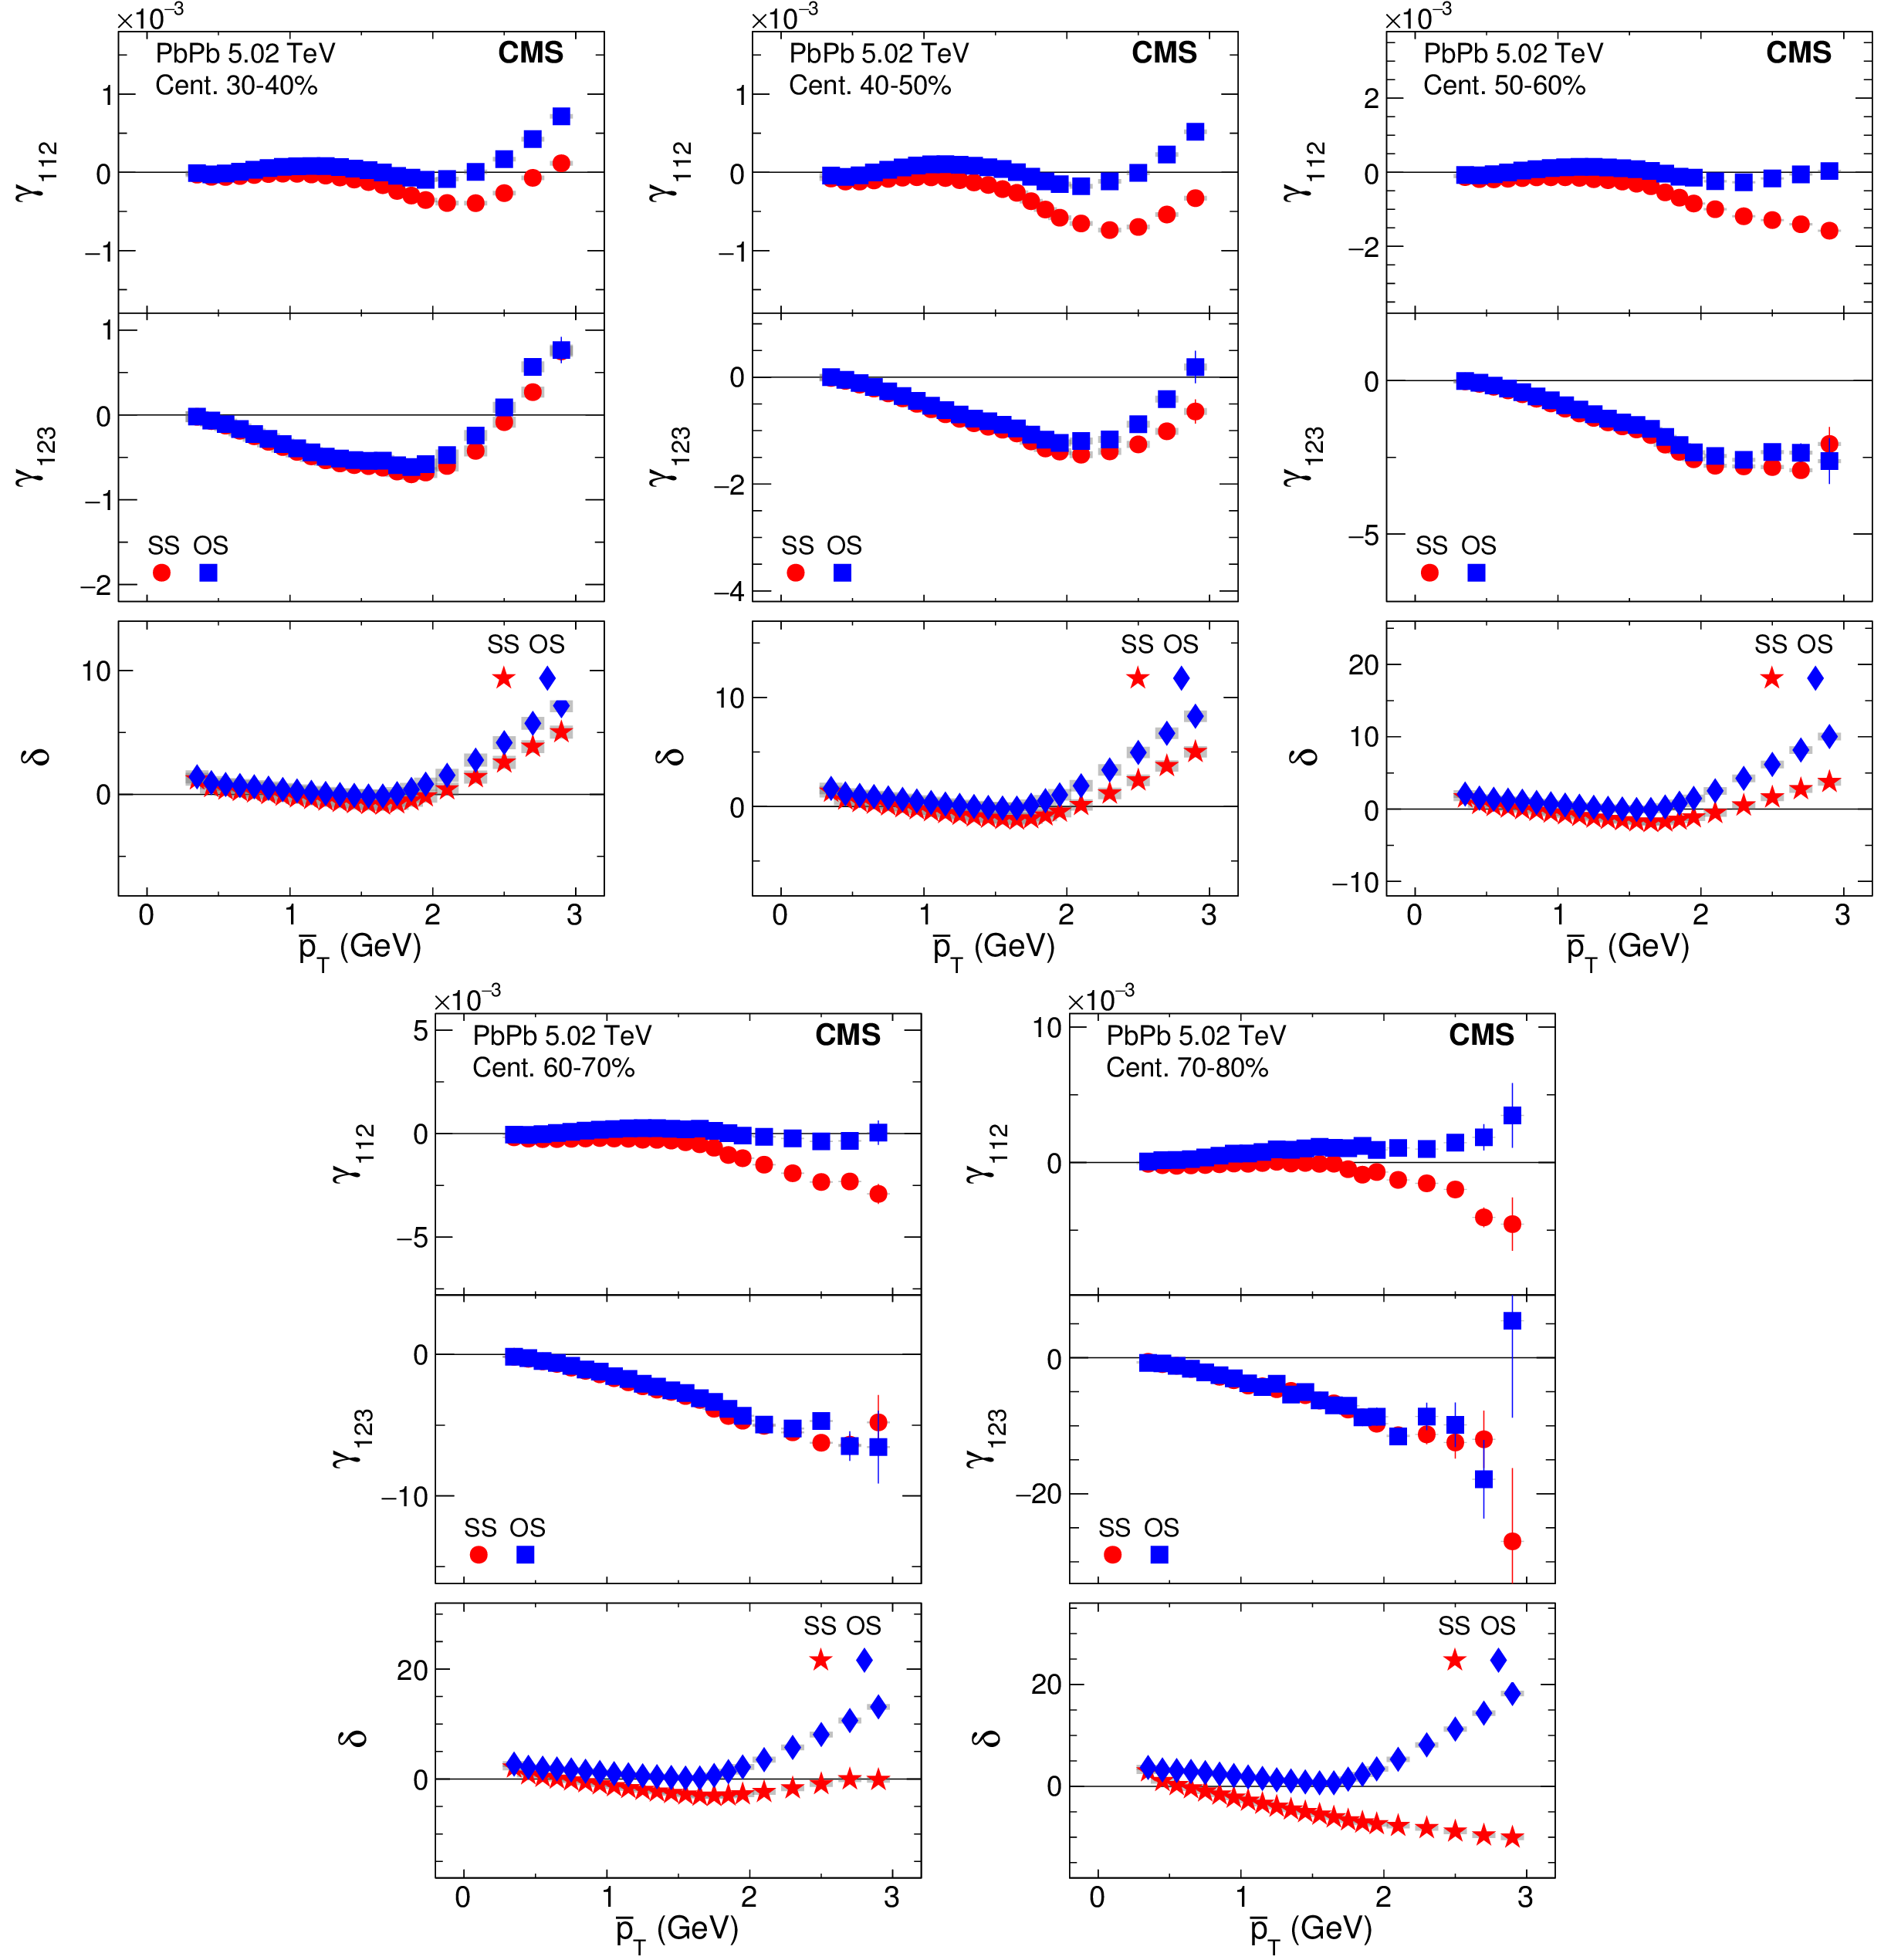
Figure 25:
The SS and OS three-particle correlators, $\gamma _{112}$ (upper) and $\gamma _{123}$ (middle), and two-particle correlator, $\delta $ (lower), as a function of $ {\overline {p}_\mathrm {T}} $ for five centrality classes in PbPb collisions at $ {\sqrt {{s_{_{\mathrm {NN}}}}}}= $ 5.02 TeV. The SS and OS two-particle correlators are denoted by different markers. Statistical and systematic uncertainties are indicated by the error bars and shaded regions, respectively. |

png pdf |
Figure 25-a:
The SS and OS three-particle correlators, $\gamma _{112}$ (upper) and $\gamma _{123}$ (middle), and two-particle correlator, $\delta $ (lower), as a function of $ {\overline {p}_\mathrm {T}} $ for centrality class 30-40% in PbPb collisions at $ {\sqrt {{s_{_{\mathrm {NN}}}}}}= $ 5.02 TeV. The SS and OS two-particle correlators are denoted by different markers. Statistical and systematic uncertainties are indicated by the error bars and shaded regions, respectively. |
png pdf |
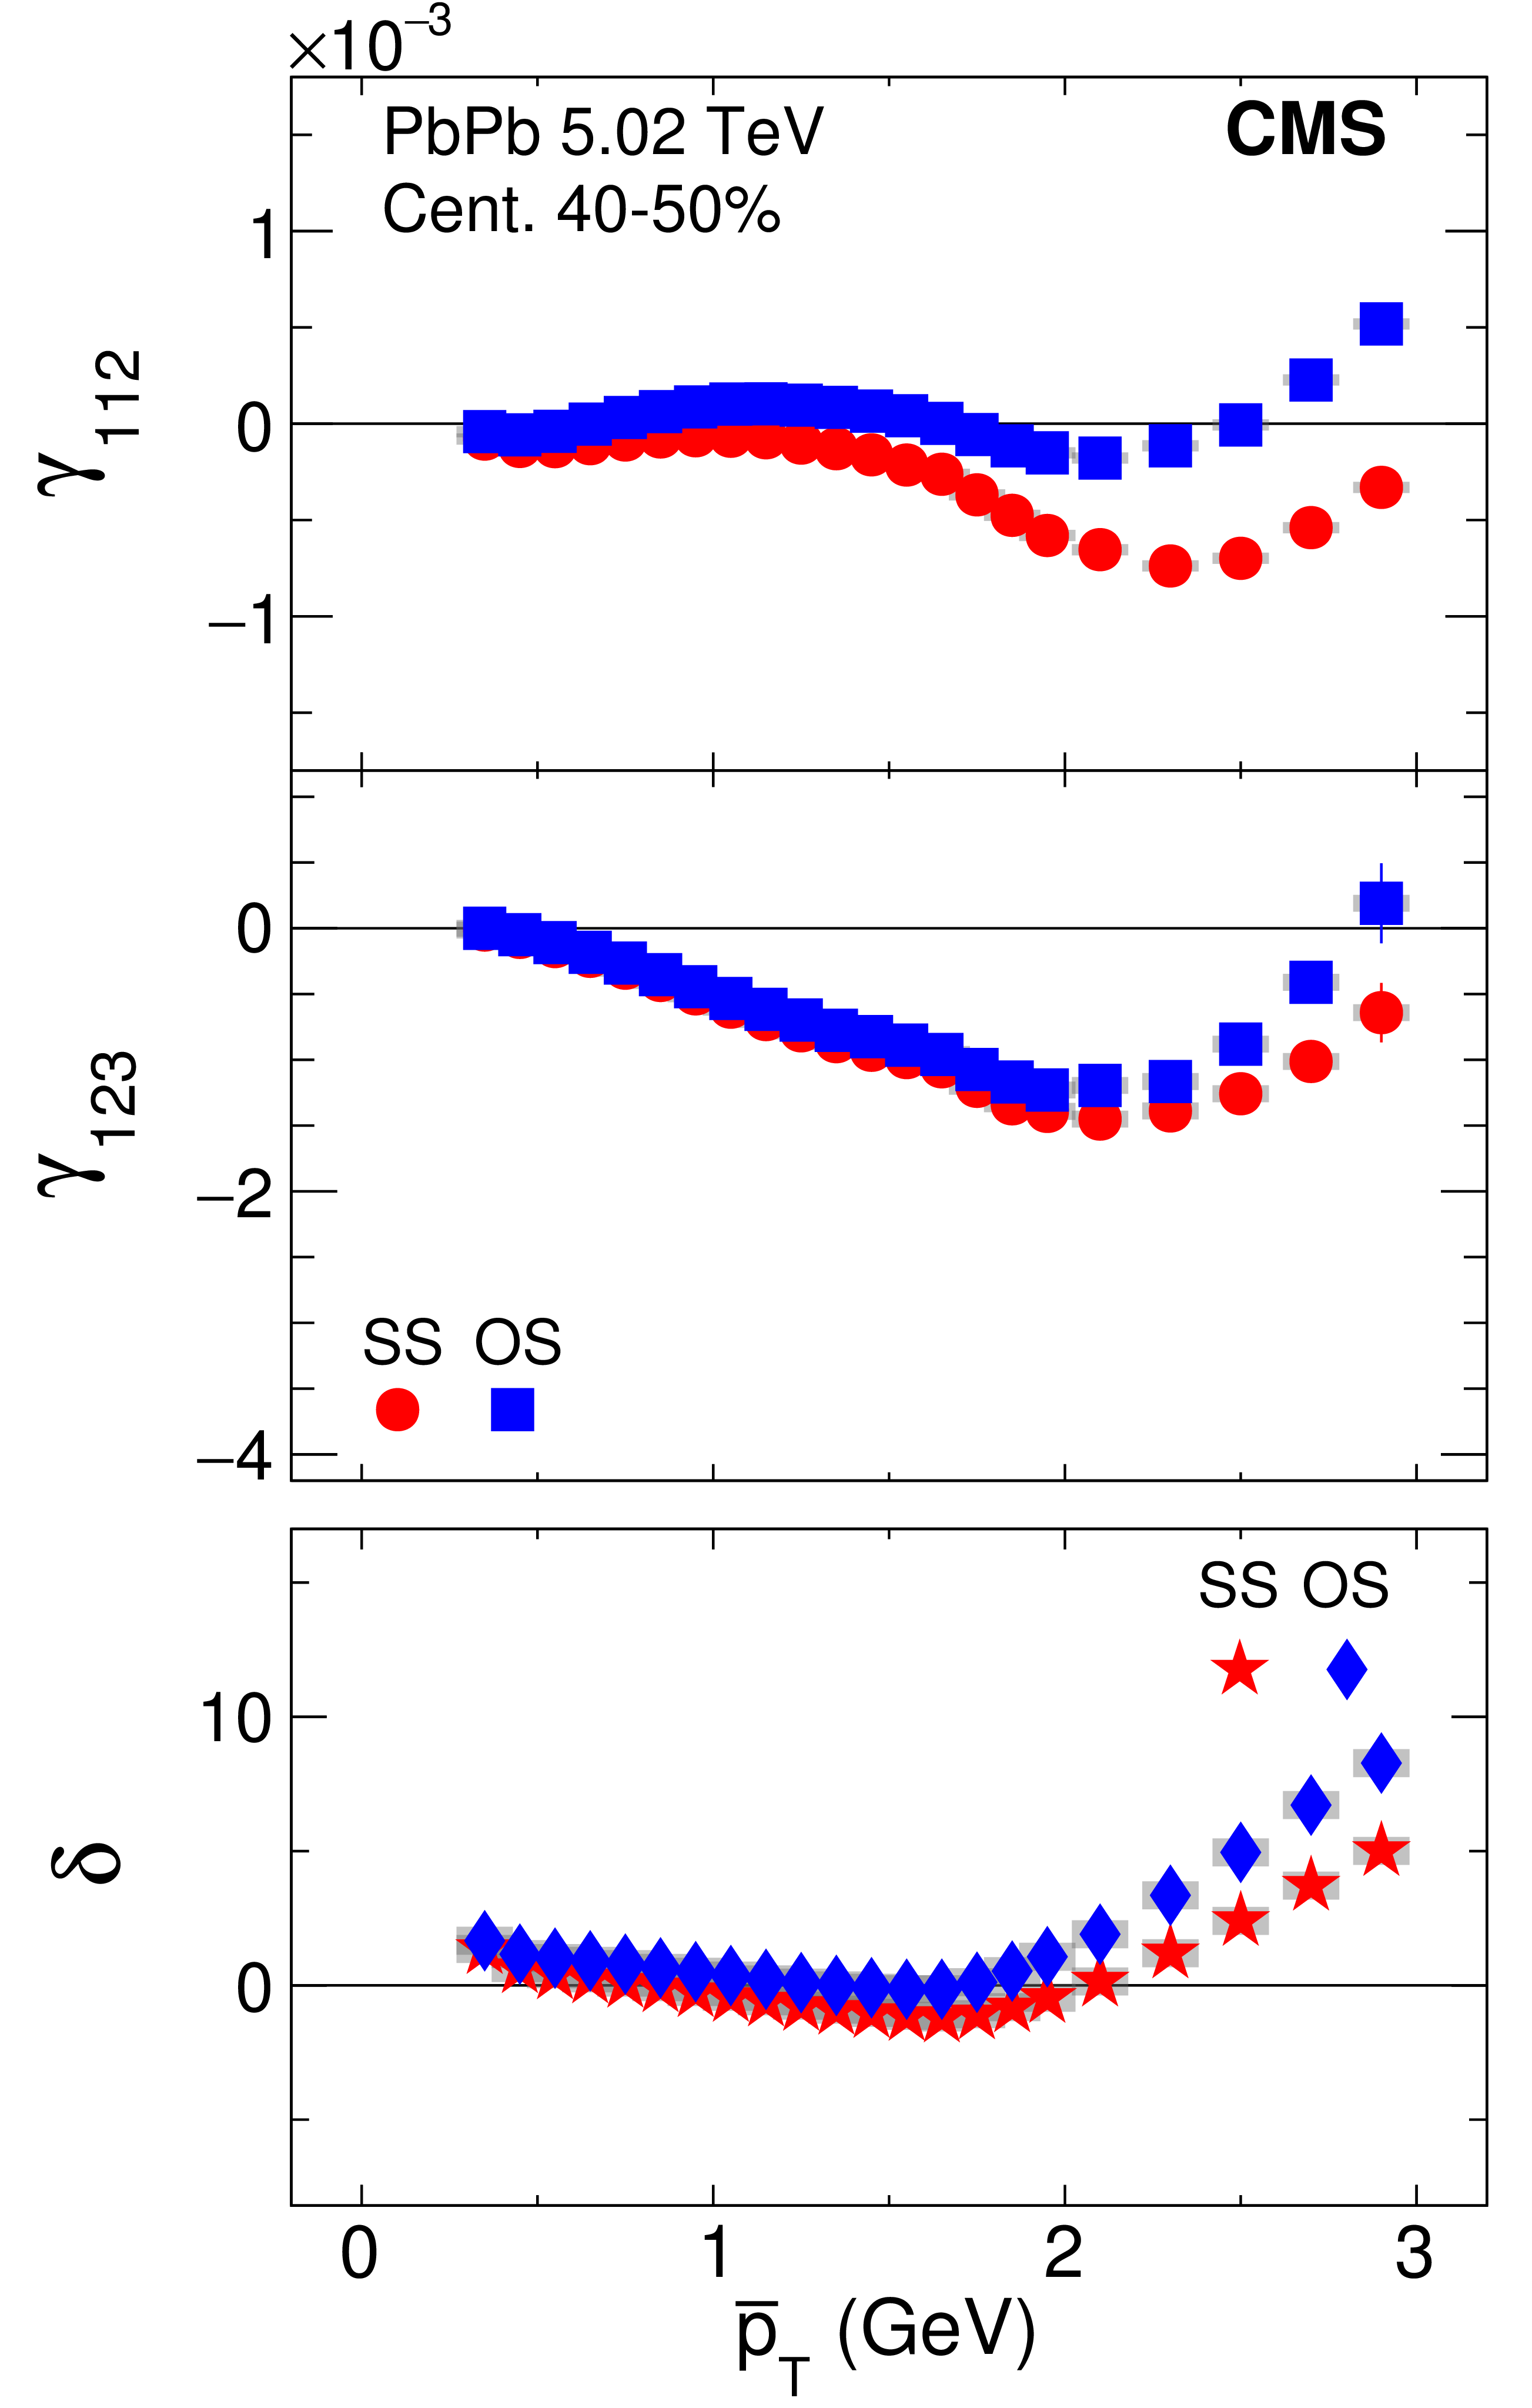
Figure 25-b:
The SS and OS three-particle correlators, $\gamma _{112}$ (upper) and $\gamma _{123}$ (middle), and two-particle correlator, $\delta $ (lower), as a function of $ {\overline {p}_\mathrm {T}} $ for centrality class 40-50% in PbPb collisions at $ {\sqrt {{s_{_{\mathrm {NN}}}}}}= $ 5.02 TeV. The SS and OS two-particle correlators are denoted by different markers. Statistical and systematic uncertainties are indicated by the error bars and shaded regions, respectively. |
png pdf |
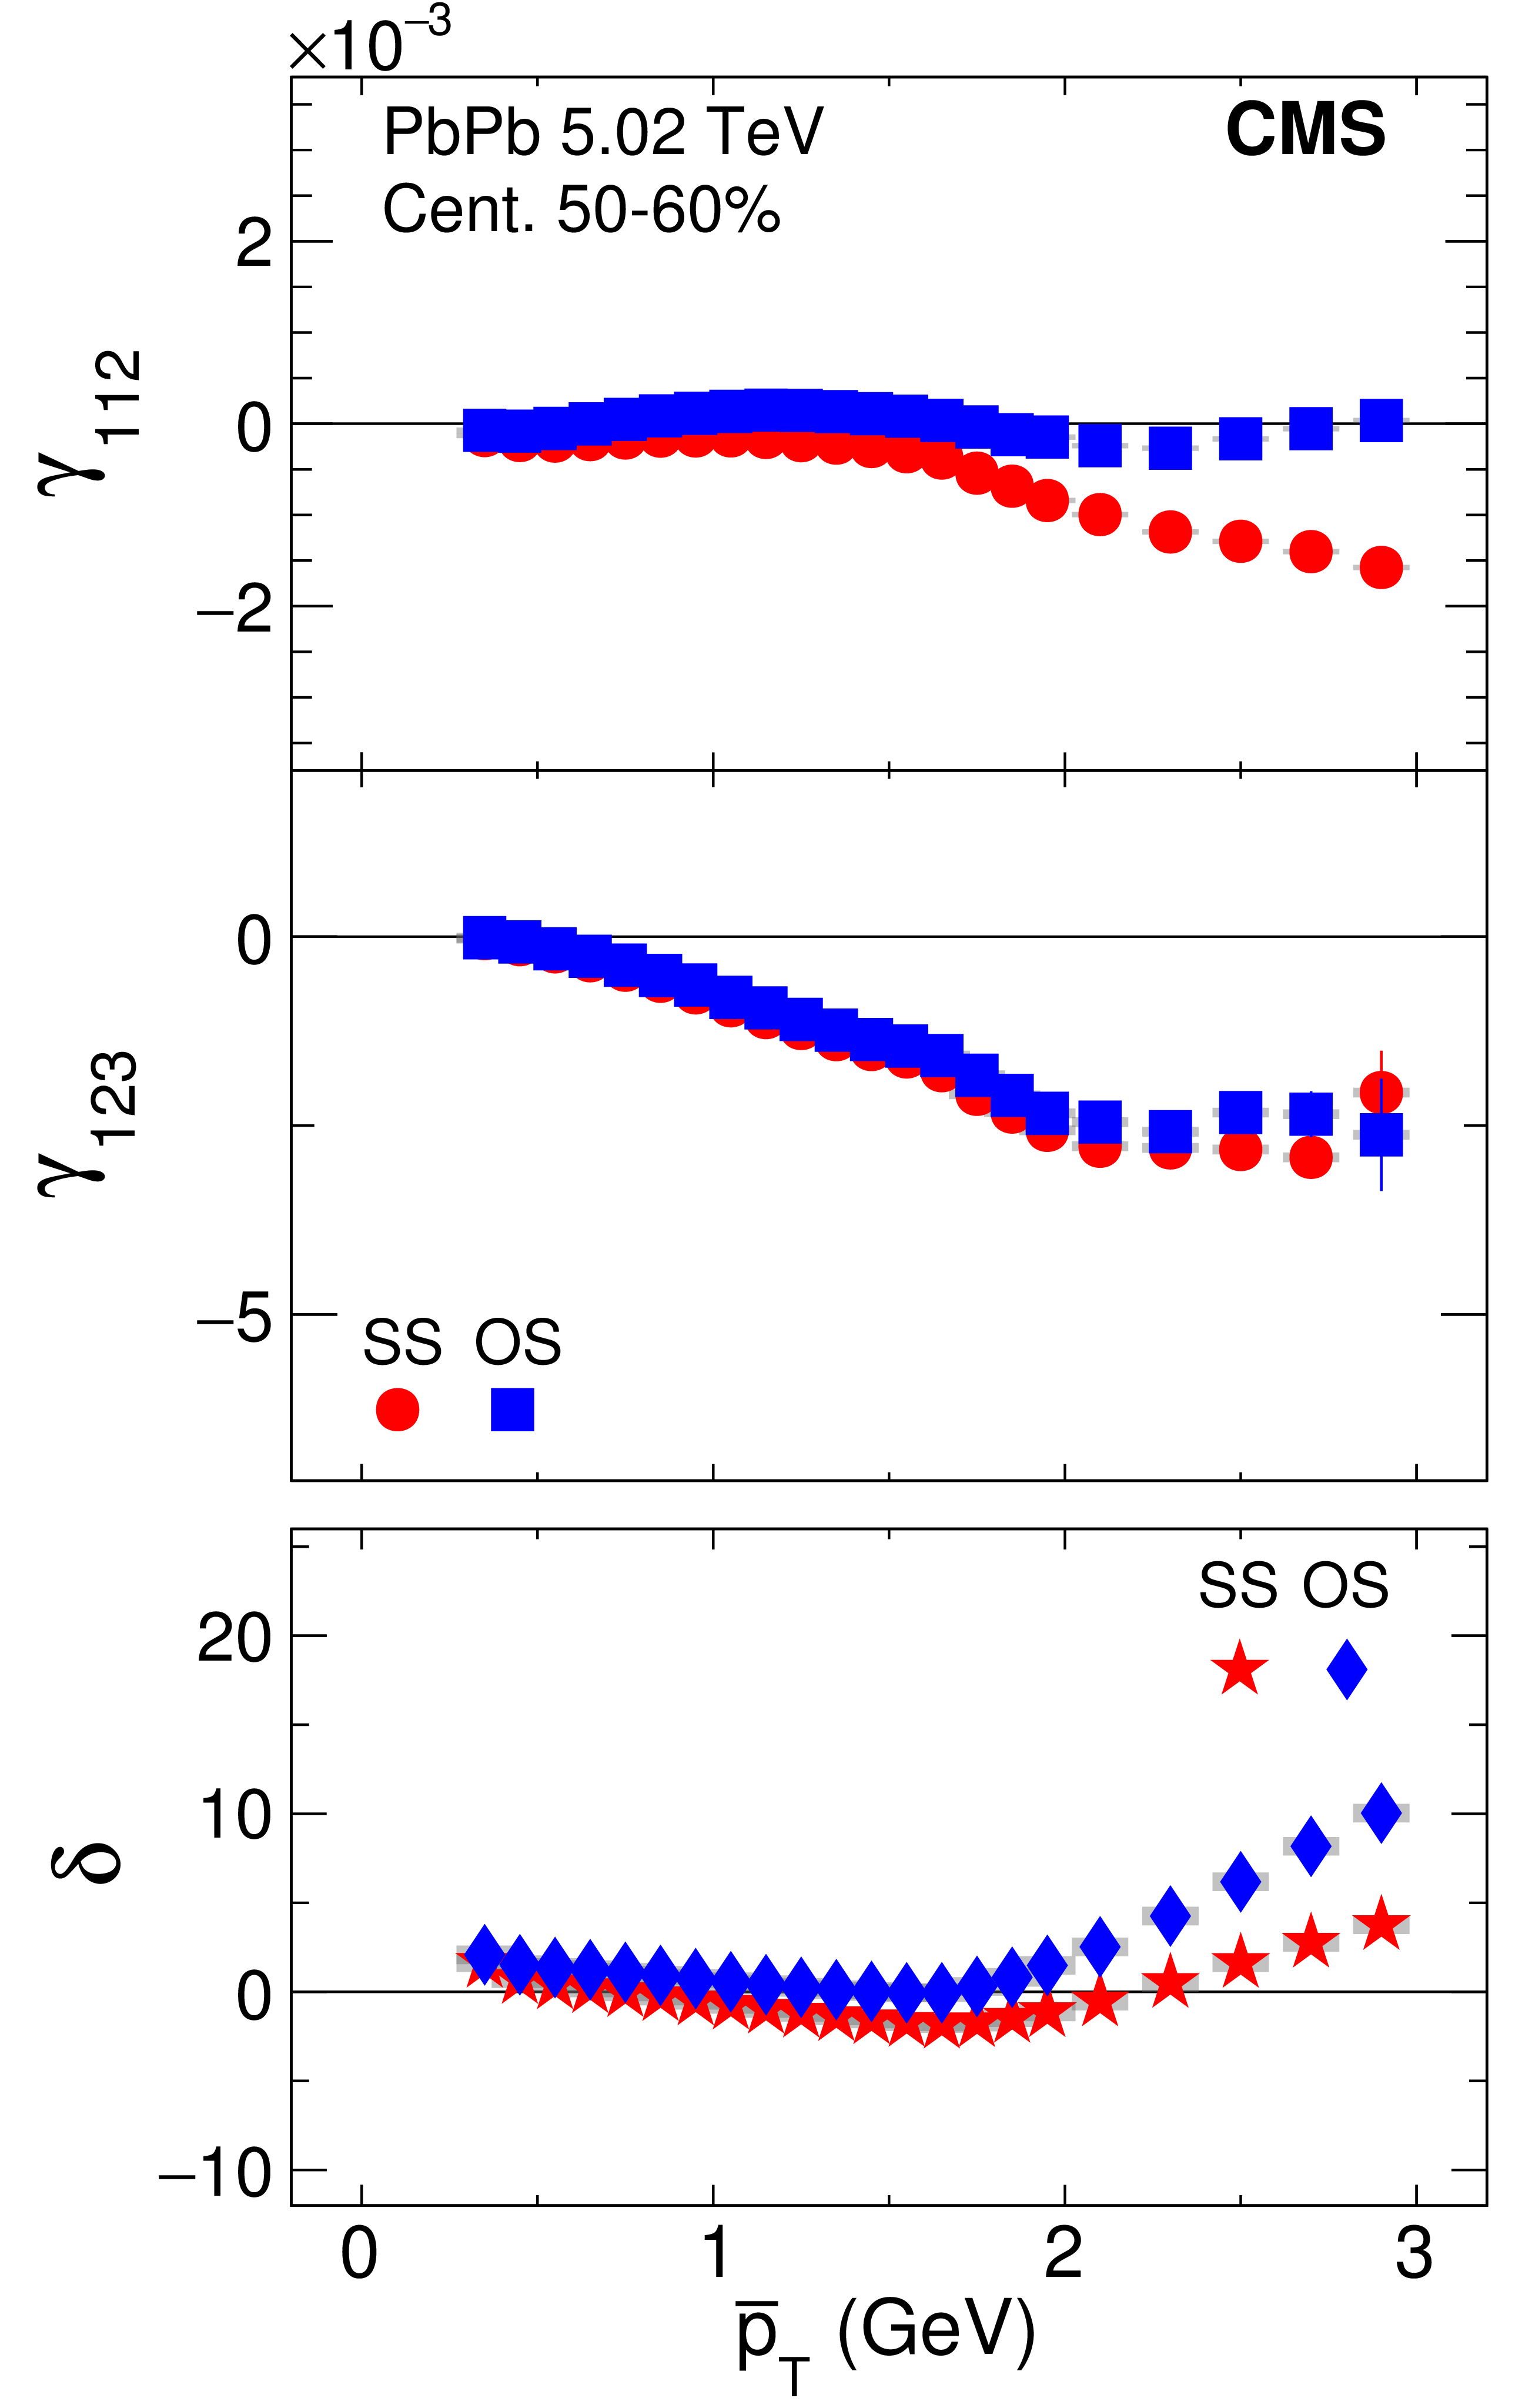
Figure 25-c:
The SS and OS three-particle correlators, $\gamma _{112}$ (upper) and $\gamma _{123}$ (middle), and two-particle correlator, $\delta $ (lower), as a function of $ {\overline {p}_\mathrm {T}} $ for centrality class 50-60% in PbPb collisions at $ {\sqrt {{s_{_{\mathrm {NN}}}}}}= $ 5.02 TeV. The SS and OS two-particle correlators are denoted by different markers. Statistical and systematic uncertainties are indicated by the error bars and shaded regions, respectively. |
png pdf |
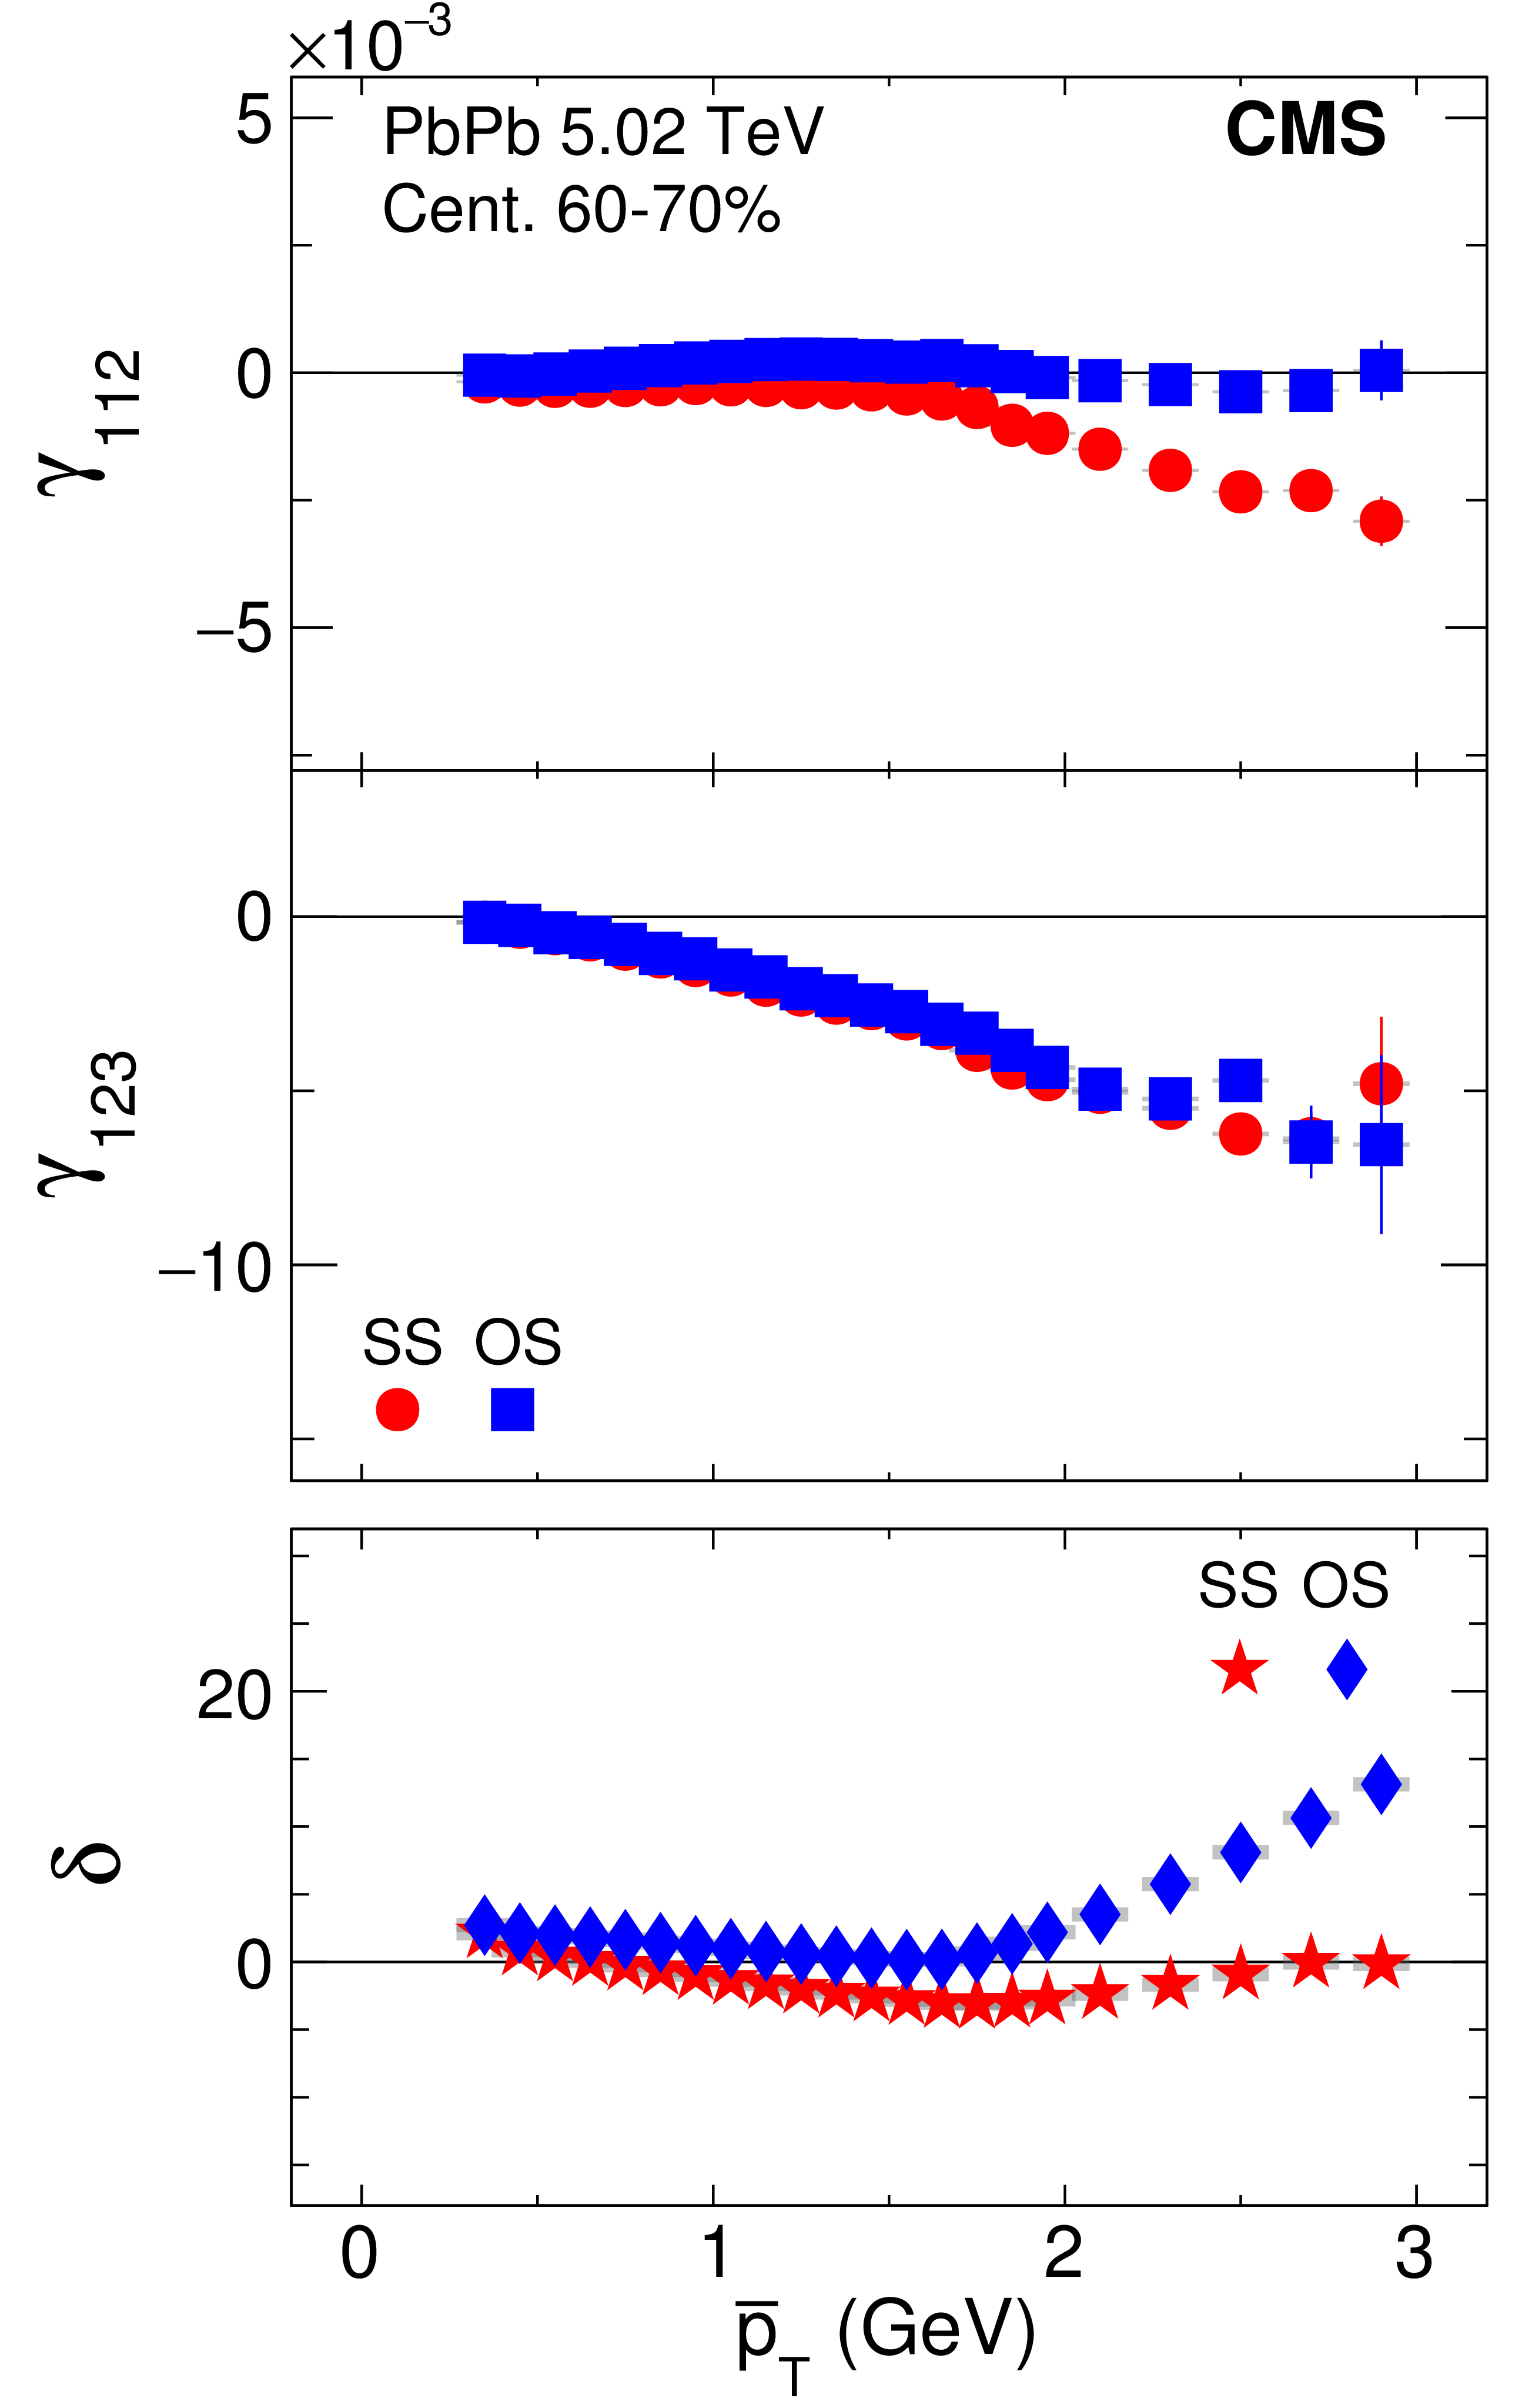
Figure 25-d:
The SS and OS three-particle correlators, $\gamma _{112}$ (upper) and $\gamma _{123}$ (middle), and two-particle correlator, $\delta $ (lower), as a function of $ {\overline {p}_\mathrm {T}} $ for centrality class 60-70% in PbPb collisions at $ {\sqrt {{s_{_{\mathrm {NN}}}}}}= $ 5.02 TeV. The SS and OS two-particle correlators are denoted by different markers. Statistical and systematic uncertainties are indicated by the error bars and shaded regions, respectively. |
png pdf |
Figure 25-e:
The SS and OS three-particle correlators, $\gamma _{112}$ (upper) and $\gamma _{123}$ (middle), and two-particle correlator, $\delta $ (lower), as a function of $ {\overline {p}_\mathrm {T}} $ for centrality class 70-80% in PbPb collisions at $ {\sqrt {{s_{_{\mathrm {NN}}}}}}= $ 5.02 TeV. The SS and OS two-particle correlators are denoted by different markers. Statistical and systematic uncertainties are indicated by the error bars and shaded regions, respectively. |
| Tables | |
png pdf |
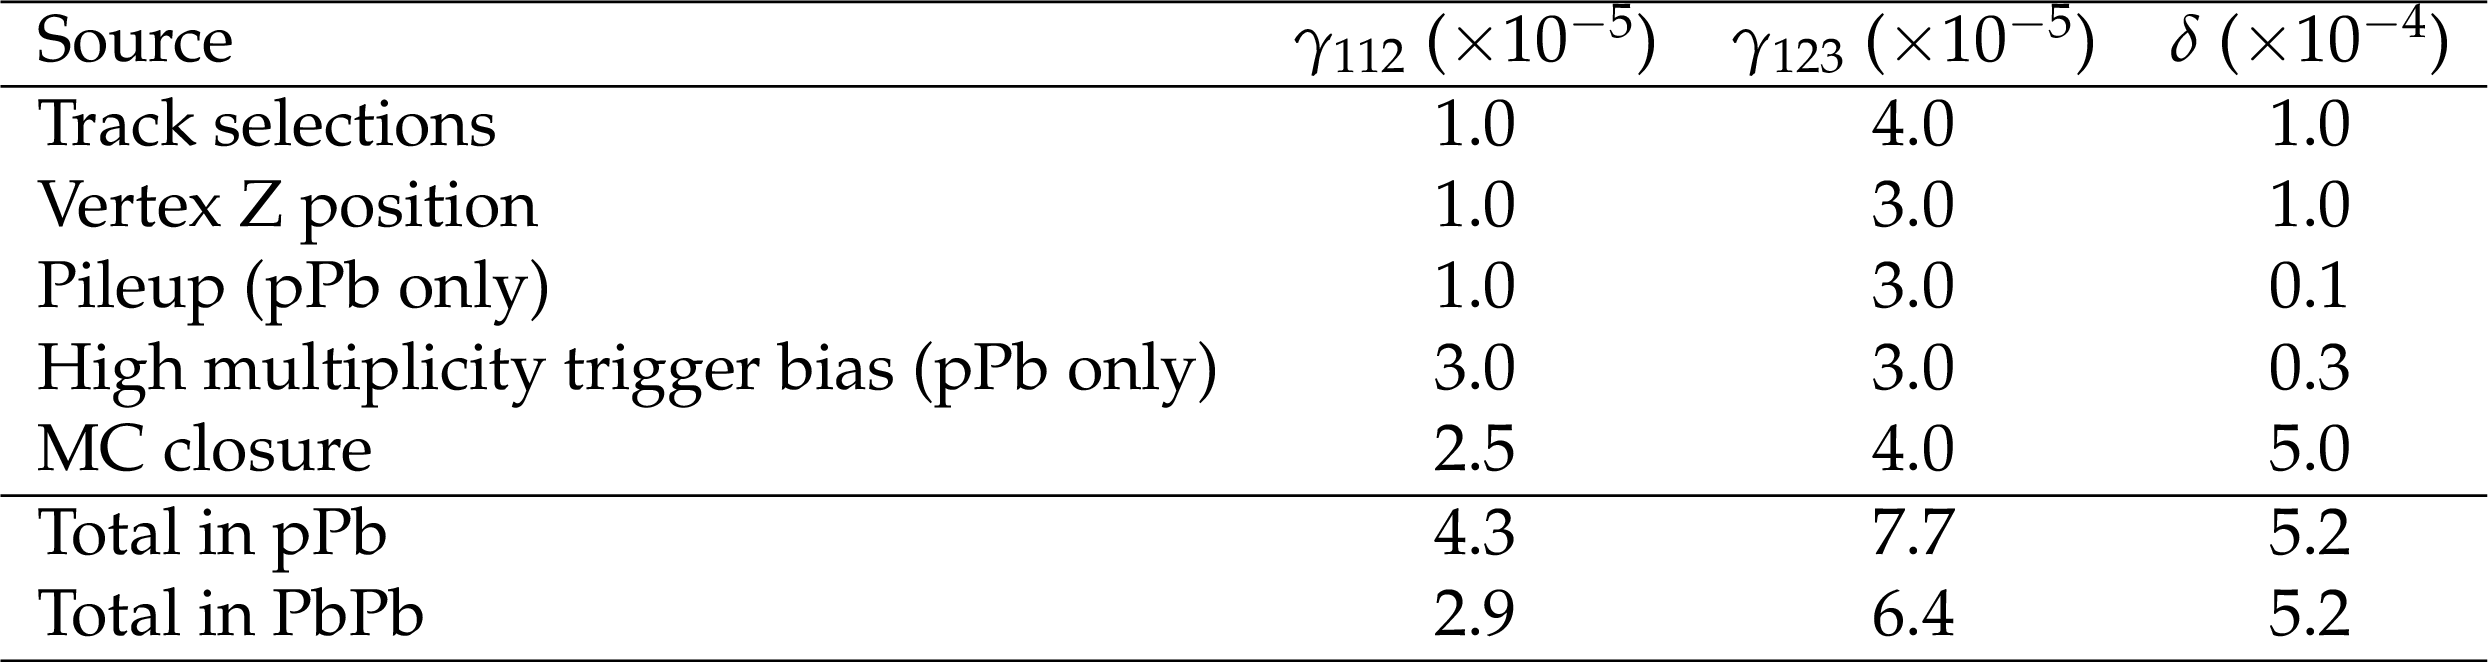
Table 1:
Summary of systematic uncertainties on SS and OS three-particle correlator $\gamma _{112}$ and $\gamma _{123}$, and two-particle correlator $\delta $ in pPb collisions at $ {\sqrt {{s_{_{\mathrm {NN}}}}}}= $ 8.16 TeV and PbPb collisions at 5.02 TeV. |
png pdf |
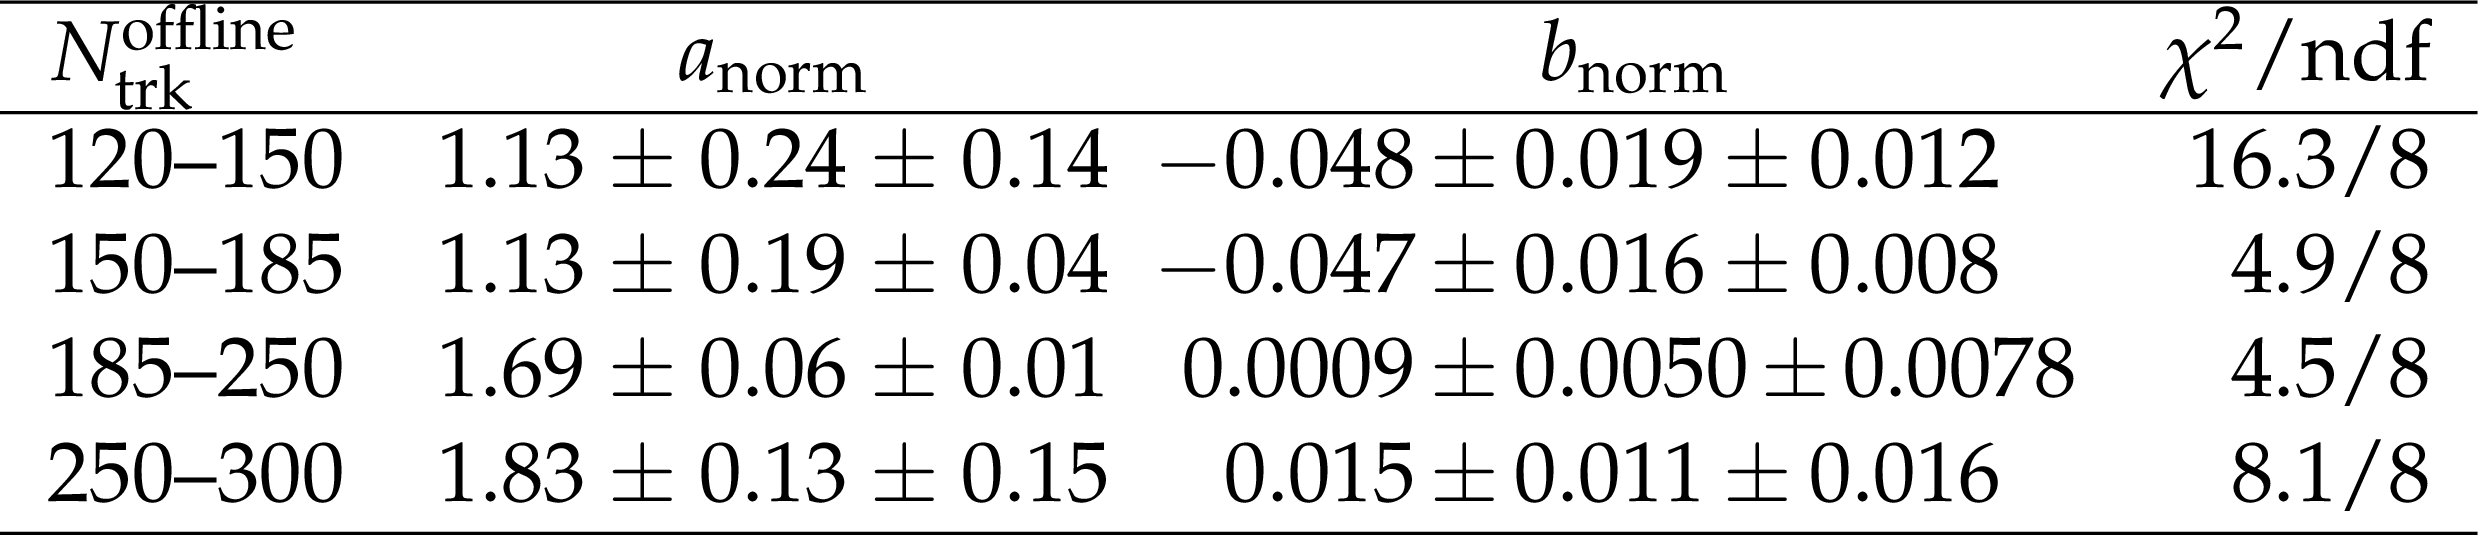
Table 2:
The summary of slope and intercept parameter $a_{\text {norm}}$ and $b_{\text {norm}}$ for different $ {N_\text {trk}^\text {offline}} $ classes in pPb collisions, and the goodness of fit $\chi ^{2}$ per degree of freedom (ndf). The statistical and systematic uncertainties are shown after the central values, respectively. |

png pdf |
Table 3:
The summary of slope and intercept parameter $a_{\text {norm}}$ and $b_{\text {norm}}$ for different centrality classes in PbPb collisions, and the goodness of fit $\chi ^{2}$ per degree of freedom (ndf). The statistical and systematic uncertainties are shown after the central values, respectively. |
| Summary |
|
Charge-dependent azimuthal correlations of same- and opposite-sign (SS and OS) pairs with respect to the second- and third-order event planes have been studied in pPb collisions at $ \sqrt{s_{\mathrm{NN}}} = $ 8.16 TeV and PbPb collisions at 5.02 TeV by the CMS experiment at the LHC. The correlations are extracted via three-particle correlators as functions of pseudorapidity difference, transverse momentum difference, and $ p_{\mathrm{T}} $ average of SS and OS particle pairs, in various multiplicity or centrality ranges of the collisions. The differences in correlations between OS and SS particles with respect to both second- and third-order event planes as functions of $ \Delta \eta $ and multiplicity are found to agree for pPb and PbPb collisions, indicating a common underlying mechanism for the two systems. Dividing the OS and SS difference of the three-particle correlator by the product of $v_n$ harmonic of the corresponding order and the difference of the two-particle correlator, the ratios are found to be similar for the second- and third-order event planes, and show weak dependence on event multiplicity. These observations support a scenario in which the charge-dependent three-particle correlator is predominantly a consequence of charge-dependent two-particle correlations coupled to an anisotropic flow signal. To establish the relation between the three-particle correlator and anisotropic flow harmonic in detail, an event shape engineering technique is applied. A linear relation for the ratio of three- to two-particle correlator difference as a function of $v_2$ is observed, which extrapolates to an intercept that is consistent with zero within uncertainties. This observation in the pPb system is consistent with the expectation of a negligible CME contribution to the charge-dependent three particle correlator. An upper limit on the $v_2$-independent fraction of the three-particle correlator, or the possible CME signal contribution (assumed independent of $v_2$ within the same narrow multiplicity or centrality range), is estimated to be 6.6% for pPb data and 3.8% for PbPb data at a 95% confidence level. The data presented in this paper provide new stringent constraints on the nature of the background contribution to the charge-dependent azimuthal correlations, and establish a new baseline for the search for the chiral magnetic effect in heavy ion collisions. |
| References | ||||
| 1 | T. D. Lee | A theory of spontaneous $ T $ violation | PRD 8 (1973) 1226 | |
| 2 | T. D. Lee and G. C. Wick | Vacuum stability and vacuum excitation in a spin-0 field theory | PRD 9 (1974) 2291 | |
| 3 | P. D. Morley and I. A. Schmidt | Strong P, CP, T violations in heavy-ion collisions | Z. Phys. C 26 (1985) 627 | |
| 4 | D. Kharzeev, R. D. Pisarski, and M. H. G. Tytgat | Possibility of spontaneous parity violation in hot QCD | PRL 81 (1998) 512 | hep-ph/9804221 |
| 5 | D. Kharzeev | Parity violation in hot QCD: Why it can happen, and how to look for it | PLB 633 (2006) 260 | hep-ph/0406125 |
| 6 | D. E. Kharzeev, L. D. McLerran, and H. J. Warringa | The effects of topological charge change in heavy ion collisions: 'Event by event P and CP violation' | NP A 803 (2008) 227 | 0711.0950 |
| 7 | K. Fukushima, D. E. Kharzeev, and H. J. Warringa | The chiral magnetic effect | PRD 78 (2008) 074033 | 0808.3382 |
| 8 | B. Q. Lv et al. | Experimental discovery of Weyl semimetal TaAs | PRX 5 (2015) 031013 | 1502.04684 |
| 9 | X. Huang et al. | Observation of the chiral-anomaly-induced negative magnetoresistance in 3D Weyl semimetal TaAs | PRX 5 (2015) 031023 | 1503.01304 |
| 10 | Q. Li et al. | Observation of the chiral magnetic effect in ZrTe5 | NP 12 (2016) 550 | 1412.6543 |
| 11 | STAR Collaboration | Azimuthal charged-particle correlations and possible local strong parity violation | PRL 103 (2009) 251601 | 0909.1739 |
| 12 | STAR Collaboration | Observation of charge-dependent azimuthal correlations and possible local strong parity violation in heavy ion collisions | PRC 81 (2010) 054908 | 0909.1717 |
| 13 | STAR Collaboration | Measurement of charge multiplicity asymmetry correlations in high-energy nucleus-nucleus collisions at $ \sqrt{s_{\mathrm{NN}}}\ = $ 200 GeV | PRC 89 (2014) 044908 | 1303.0901 |
| 14 | STAR Collaboration | Beam-energy dependence of charge separation along the magnetic field in Au+Au collisions at RHIC | PRL 113 (2014) 052302 | 1404.1433 |
| 15 | STAR Collaboration | Fluctuations of charge separation perpendicular to the event plane and local parity violation in $ \sqrt{s_{\mathrm{NN}}}\ = $ 200 GeV Au+Au collisions at the BNL Relativistic Heavy Ion Collider | PRC 88 (2013) 064911 | 1302.3802 |
| 16 | ALICE Collaboration | Charge separation relative to the reaction plane in Pb-Pb collisions at $ \sqrt{s_{\mathrm{NN}}}\ = $ 2.76 TeV | PRL 110 (2013) 012301 | 1207.0900 |
| 17 | D. E. Kharzeev, J. Liao, S. A. Voloshin, and G. Wang | Chiral magnetic and vortical effects in high-energy nuclear collisions --- a status report | Prog. Part. NP 88 (2016) 1 | 1511.04050 |
| 18 | F. Wang | Effects of cluster particle correlations on local parity violation observables | PRC 81 (2010) 064902 | 0911.1482 |
| 19 | A. Bzdak, V. Koch, and J. Liao | Azimuthal correlations from transverse momentum conservation and possible local parity violation | PRC 83 (2011) 014905 | 1008.4919 |
| 20 | S. Schlichting and S. Pratt | Charge conservation at energies available at the BNL Relativistic Heavy Ion Collider and contributions to local parity violation observables | PRC 83 (2011) 014913 | 1009.4283 |
| 21 | CMS Collaboration | Observation of charge-dependent azimuthal correlations in pPb collisions and its implication for the search for the chiral magnetic effect | PRL 118 (2017) 122301 | CMS-HIN-16-009 1610.00263 |
| 22 | R. Belmont and J. L. Nagle | To CME or not to CME? Implications of p+Pb measurements of the chiral magnetic effect in heavy ion collisions | 1610.07964 | |
| 23 | S. A. Voloshin | Parity violation in hot QCD: How to detect it | PRC 70 (2004) 057901 | hep-ph/0406311 |
| 24 | A. Bzdak, V. Koch, and J. Liao | Charge-dependent correlations in relativistic heavy ion collisions and the chiral magnetic effect | Lect. Notes Phys. 871 (2013) 503 | 1207.7327 |
| 25 | B. Alver and G. Roland | Collision geometry fluctuations and triangular flow in heavy-ion collisions | PRC 81 (2010) 054905 | 1003.0194 |
| 26 | ATLAS Collaboration | Measurement of event-plane correlations in $ \sqrt{s_{\mathrm{NN}}}\ = $ 2.76 TeV lead-lead collisions with the ATLAS detector | PRC 90 (2014) 024905 | 1403.0489 |
| 27 | CMS Collaboration | Measurement of higher-order harmonic azimuthal anisotropy in PbPb collisions at $ \sqrt{s_{\mathrm{NN}}}\ = $ 2.76 TeV | PRC 89 (2014) 044906 | CMS-HIN-11-005 1310.8651 |
| 28 | CMS Collaboration | Multiplicity and transverse momentum dependence of two- and four-particle correlations in $ \mathrm{ p Pb }\ $ and $ \mathrm{ Pp Pb }\ $ collisions | PLB 724 (2013) 213 | CMS-HIN-13-002 1305.0609 |
| 29 | J. Schukraft, A. Timmins, and S. A. Voloshin | Ultra-relativistic nuclear collisions: event shape engineering | PLB 719 (2013) 394 | 1208.4563 |
| 30 | CMS Collaboration | Description and performance of track and primary-vertex reconstruction with the CMS tracker | JINST 9 (2014) P10009 | CMS-TRK-11-001 1405.6569 |
| 31 | CMS Collaboration | The CMS experiment at the CERN LHC | JINST 3 (2008) S08004 | CMS-00-001 |
| 32 | CMS Collaboration | Observation of long-range near-side angular correlations in proton-proton collisions at the LHC | JHEP 09 (2010) 091 | CMS-QCD-10-002 1009.4122 |
| 33 | CMS Collaboration | Observation of long-range, near-side angular correlations in pPb collisions at the LHC | PLB 718 (2013) 795 | CMS-HIN-12-015 1210.5482 |
| 34 | CMS Collaboration | Evidence for collectivity in pp collisions at the LHC | PLB 765 (2017) 193 | CMS-HIN-16-010 1606.06198 |
| 35 | I. Selyuzhenkov and S. Voloshin | Effects of non-uniform acceptance in anisotropic flow measurement | PRC 77 (2008) 034904 | 0707.4672 |
| 36 | A. Bilandzic et al. | Generic framework for anisotropic flow analyses with multiparticle azimuthal correlations | PRC 89 (2014) 064904 | 1312.3572 |
| 37 | ALICE Collaboration | Event shape engineering for inclusive spectra and elliptic flow in Pb-Pb collisions at $ \sqrt{s_{\mathrm{NN}}}\ = $ 2.76 TeV | PRC 93 (2016) 034916 | 1507.06194 |
| 38 | T. Pierog et al. | EPOS LHC: Test of collective hadronization with data measured at the CERN Large Hadron Collider | PRC 92 (2015) 034906 | 1306.0121 |
| 39 | GEANT4 Collaboration | GEANT4 --- a simulation toolkit | NIMA 506 (2003) 250 | |
| 40 | J. Allison et al. | Geant4 developments and applications | IEEE Trans. Nucl. Sci. 53 (2006) 270 | |
| 41 | CMS Collaboration | Centrality dependence of dihadron correlations and azimuthal anisotropy harmonics in PbPb collisions at $ \sqrt{s_{\mathrm{NN}}}\ = $ 2.76 TeV | EPJC 72 (2012) 10052 | CMS-HIN-11-006 1201.3158 |
| 42 | Z.-W. Lin et al. | A multi-phase transport model for relativistic heavy ion collisions | PRC 72 (2005) 064901 | nucl-th/0411110 |
| 43 | G.-L. Ma and B. Zhang | Effects of final state interactions on charge separation in relativistic heavy ion collisions | PLB 700 (2011) 39 | 1101.1701 |
| 44 | G. J. Feldman and R. D. Cousins | A unified approach to the classical statistical analysis of small signals | PRD 57 (1998) 3873 | physics/9711021 |
|
|
Compact Muon Solenoid LHC, CERN |
|

|

|

|

|

|