

Compact Muon Solenoid
LHC, CERN
| CMS-SMP-14-014 ; CERN-EP-2016-205 | ||
| Measurement of the WZ production cross section in pp collisions at $\sqrt{s} = $ 7 and 8 TeV and search for anomalous triple gauge couplings at $ \sqrt{s} = $ 8 TeV | ||
| CMS Collaboration | ||
| 19 September 2016 | ||
| Eur. Phys. J. C 77 (2017) 236 | ||
| Abstract: The WZ production cross section is measured by the CMS experiment at the CERN LHC in proton-proton collision data samples corresponding to integrated luminosities of 4.9 fb$^{-1}$ collected at $ \sqrt{s} = $ 7 TeV, and 19.6 fb$^{-1}$ at $ \sqrt{s} = $ 8 TeV. The measurements are performed using the fully-leptonic WZ decay modes with electrons and muons in the final state. The measured cross sections for 71 $ < m_{\mathrm{ Z }} < $ 111 GeV are $\sigma(\mathrm{ p }\mathrm{ p }\to\mathrm{ W }\mathrm{ Z };\ \sqrt{s} = 7\, \mathrm{TeV}) =$ 20.14 $\pm$ 1.32 (stat) $\pm$ 1.13 (syst) $\pm$ 0.44 (lumi) pb and $\sigma(\mathrm{ p }\mathrm{ p }\to\mathrm{ W }\mathrm{ Z };\ \sqrt{s} = 8\, \mathrm{TeV}) =$ 24.09 $\pm$ 0.87 (stat) $\pm$ 1.62 (syst) $\pm$ 0.63 (lumi) pb. Differential cross sections with respect to the Z boson p$_{\mathrm{T}}$, the leading jet $p_{\mathrm{T}}$, and the number of jets are obtained using the $\sqrt{s} =$ 8 TeV data. The results are consistent with standard model predictions and constraints on anomalous triple gauge couplings are obtained. | ||
| Links: e-print arXiv:1609.05721 [hep-ex] (PDF) ; CDS record ; inSPIRE record ; HepData record ; CADI line (restricted) ; | ||
| Figures & Tables | Summary | Additional Tables | References | CMS Publications |
|---|
| Figures | |

png pdf |
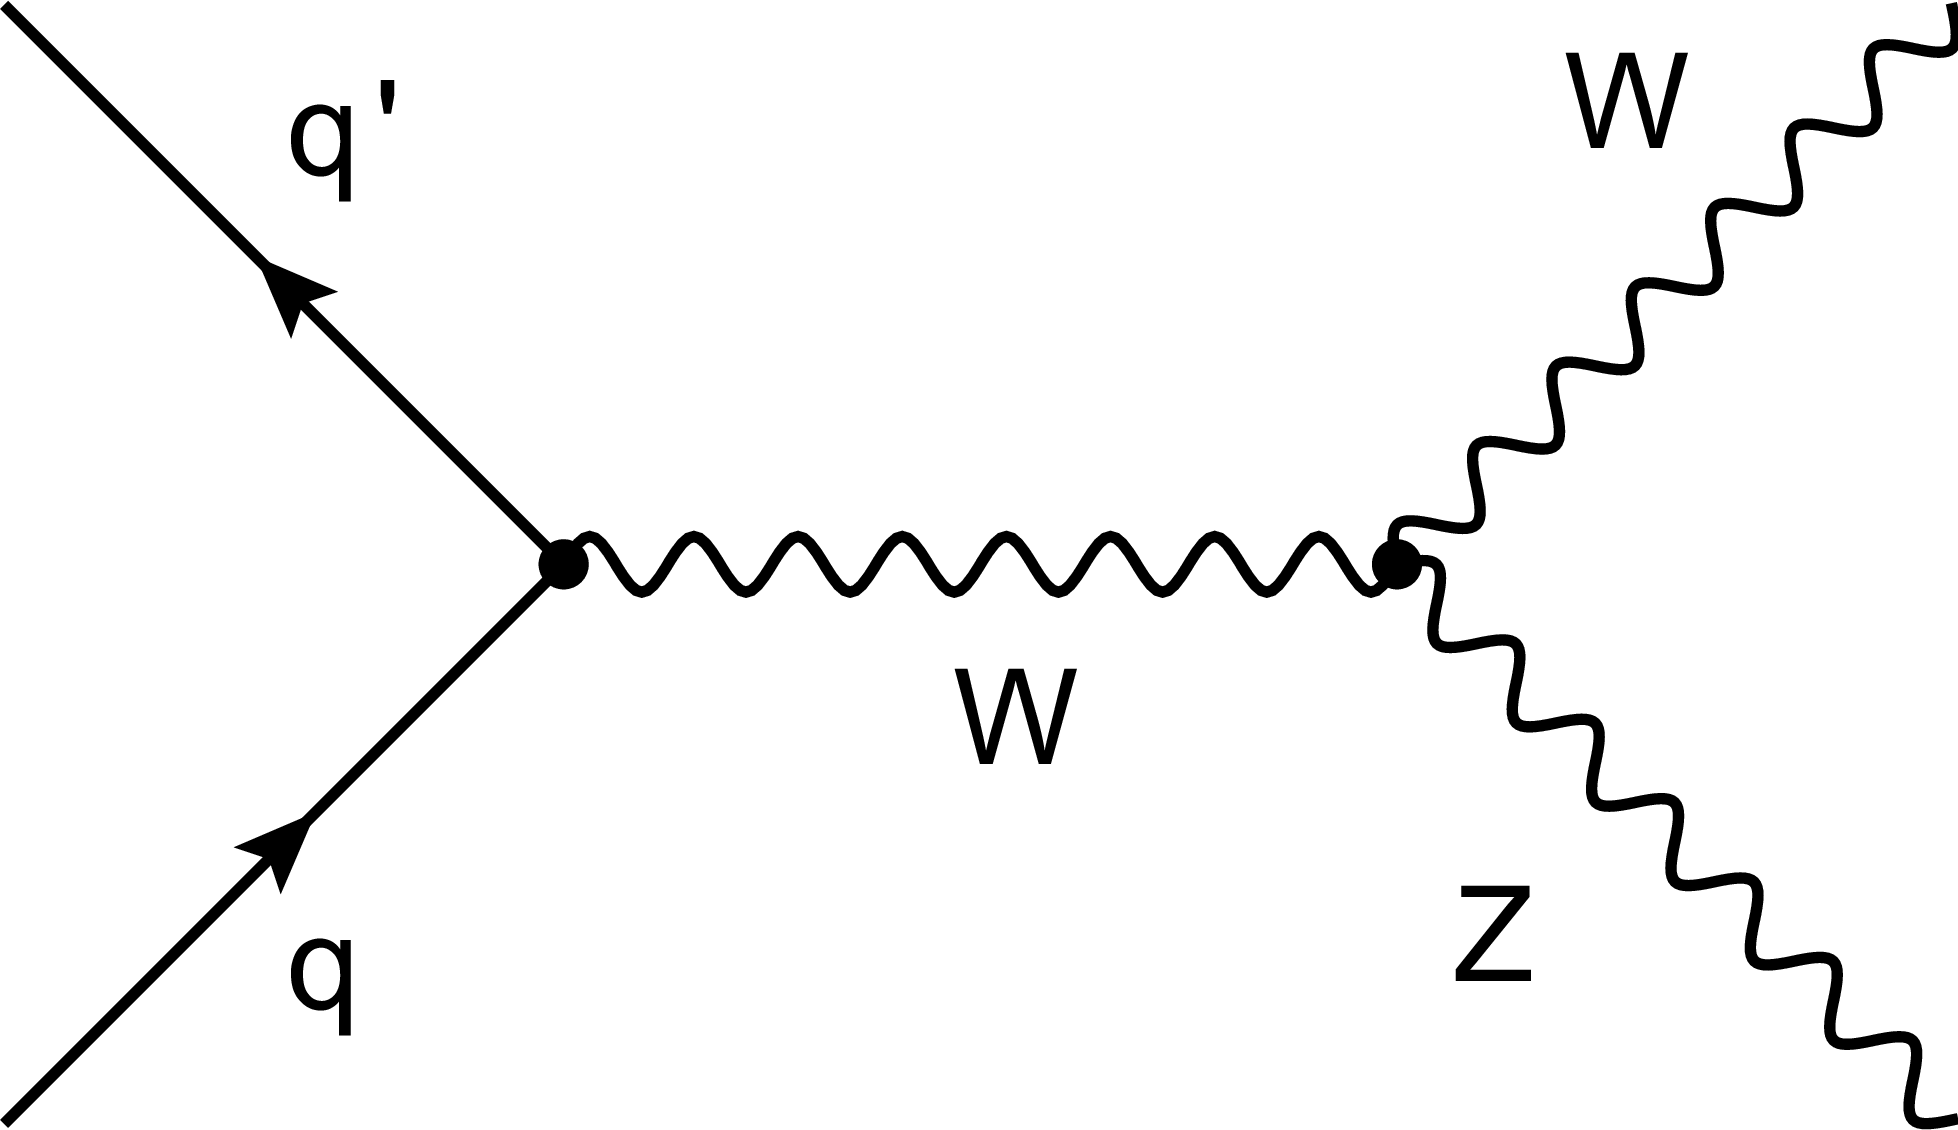
Figure 1:
Leading-order Feynman diagrams for WZ production in proton-proton collisions. The three diagrams represent contributions from (left) $s$-channel through TGC, (middle) $t$-channel, and (right) $u$-channel. |
png pdf |
Figure 1-a:
Leading-order Feynman diagram for WZ production in proton-proton collisions. The diagram represents the contribution from $s$-channel through TGC. |
png pdf |
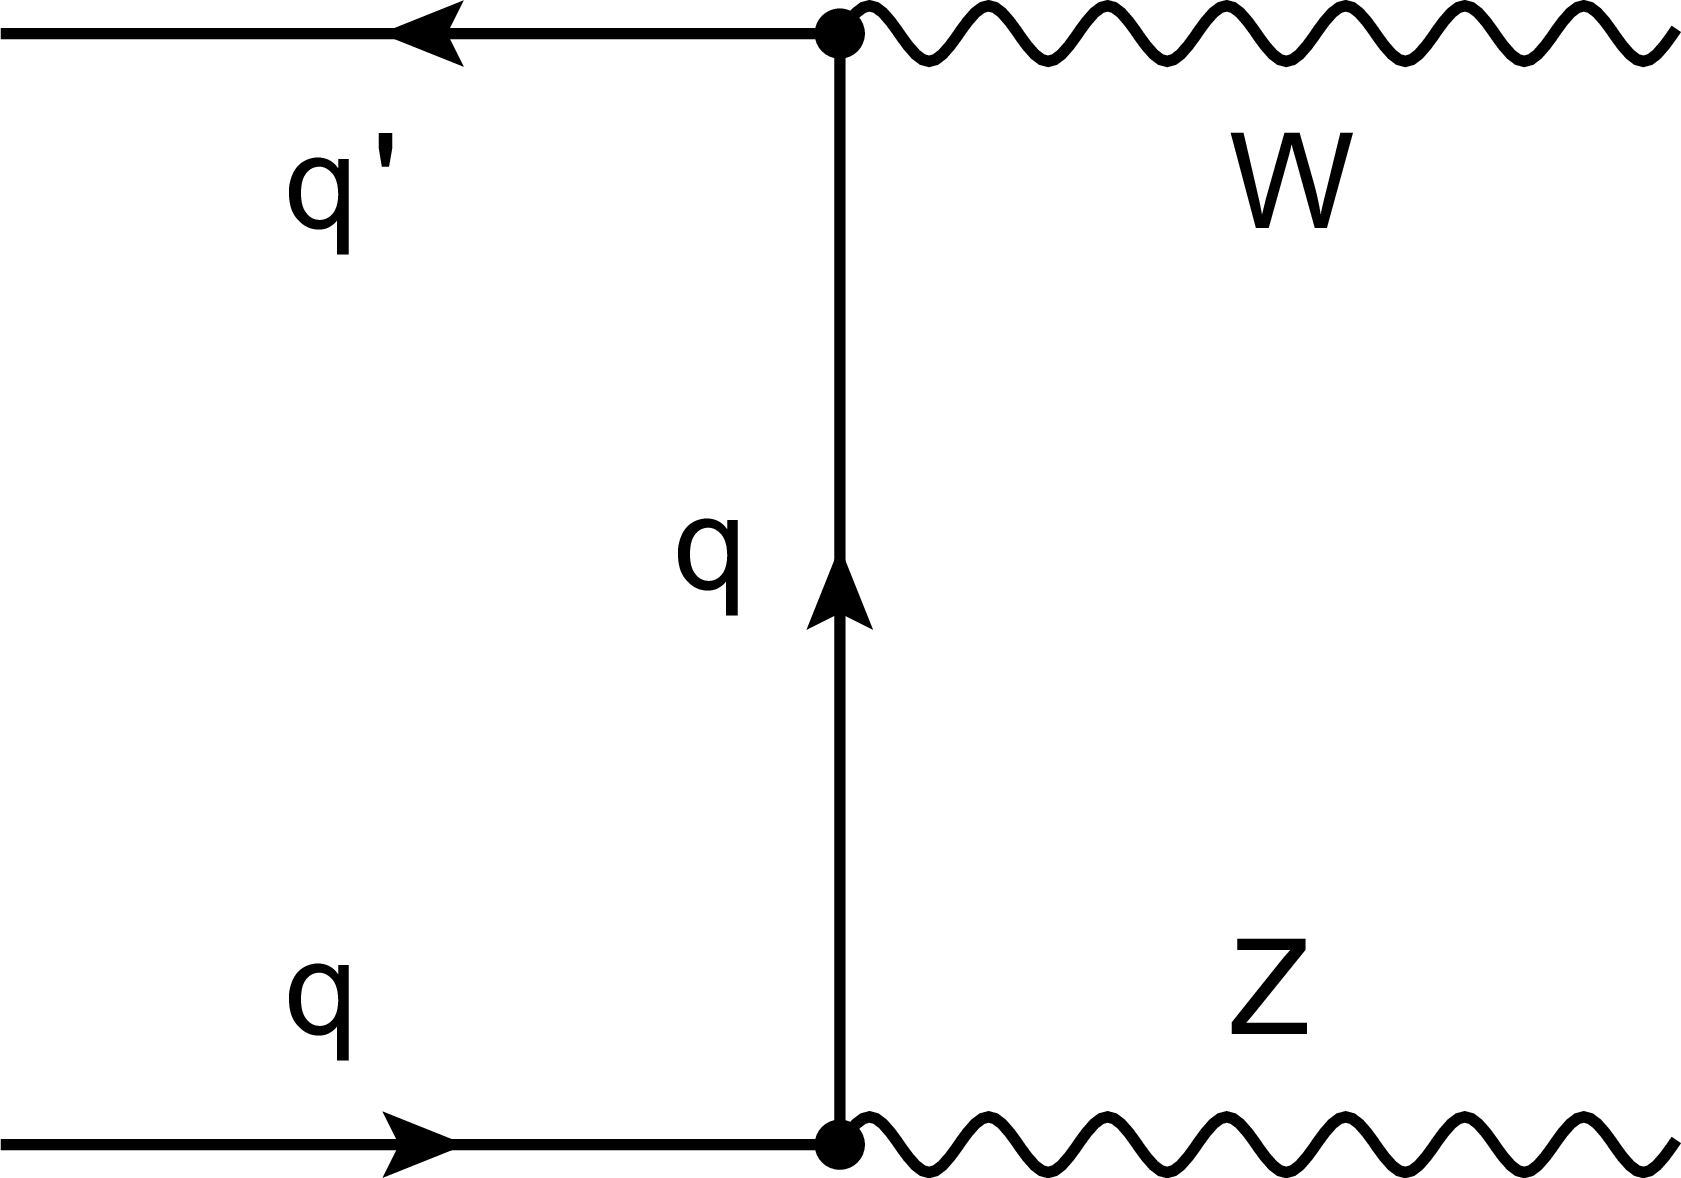
Figure 1-b:
Leading-order Feynman diagram for WZ production in proton-proton collisions. The diagram represents the contribution from $t$-channel. |

png pdf |
Figure 1-c:
Leading-order Feynman diagram for WZ production in proton-proton collisions. The diagram represents the contribution from $u$-channel. |
png pdf |
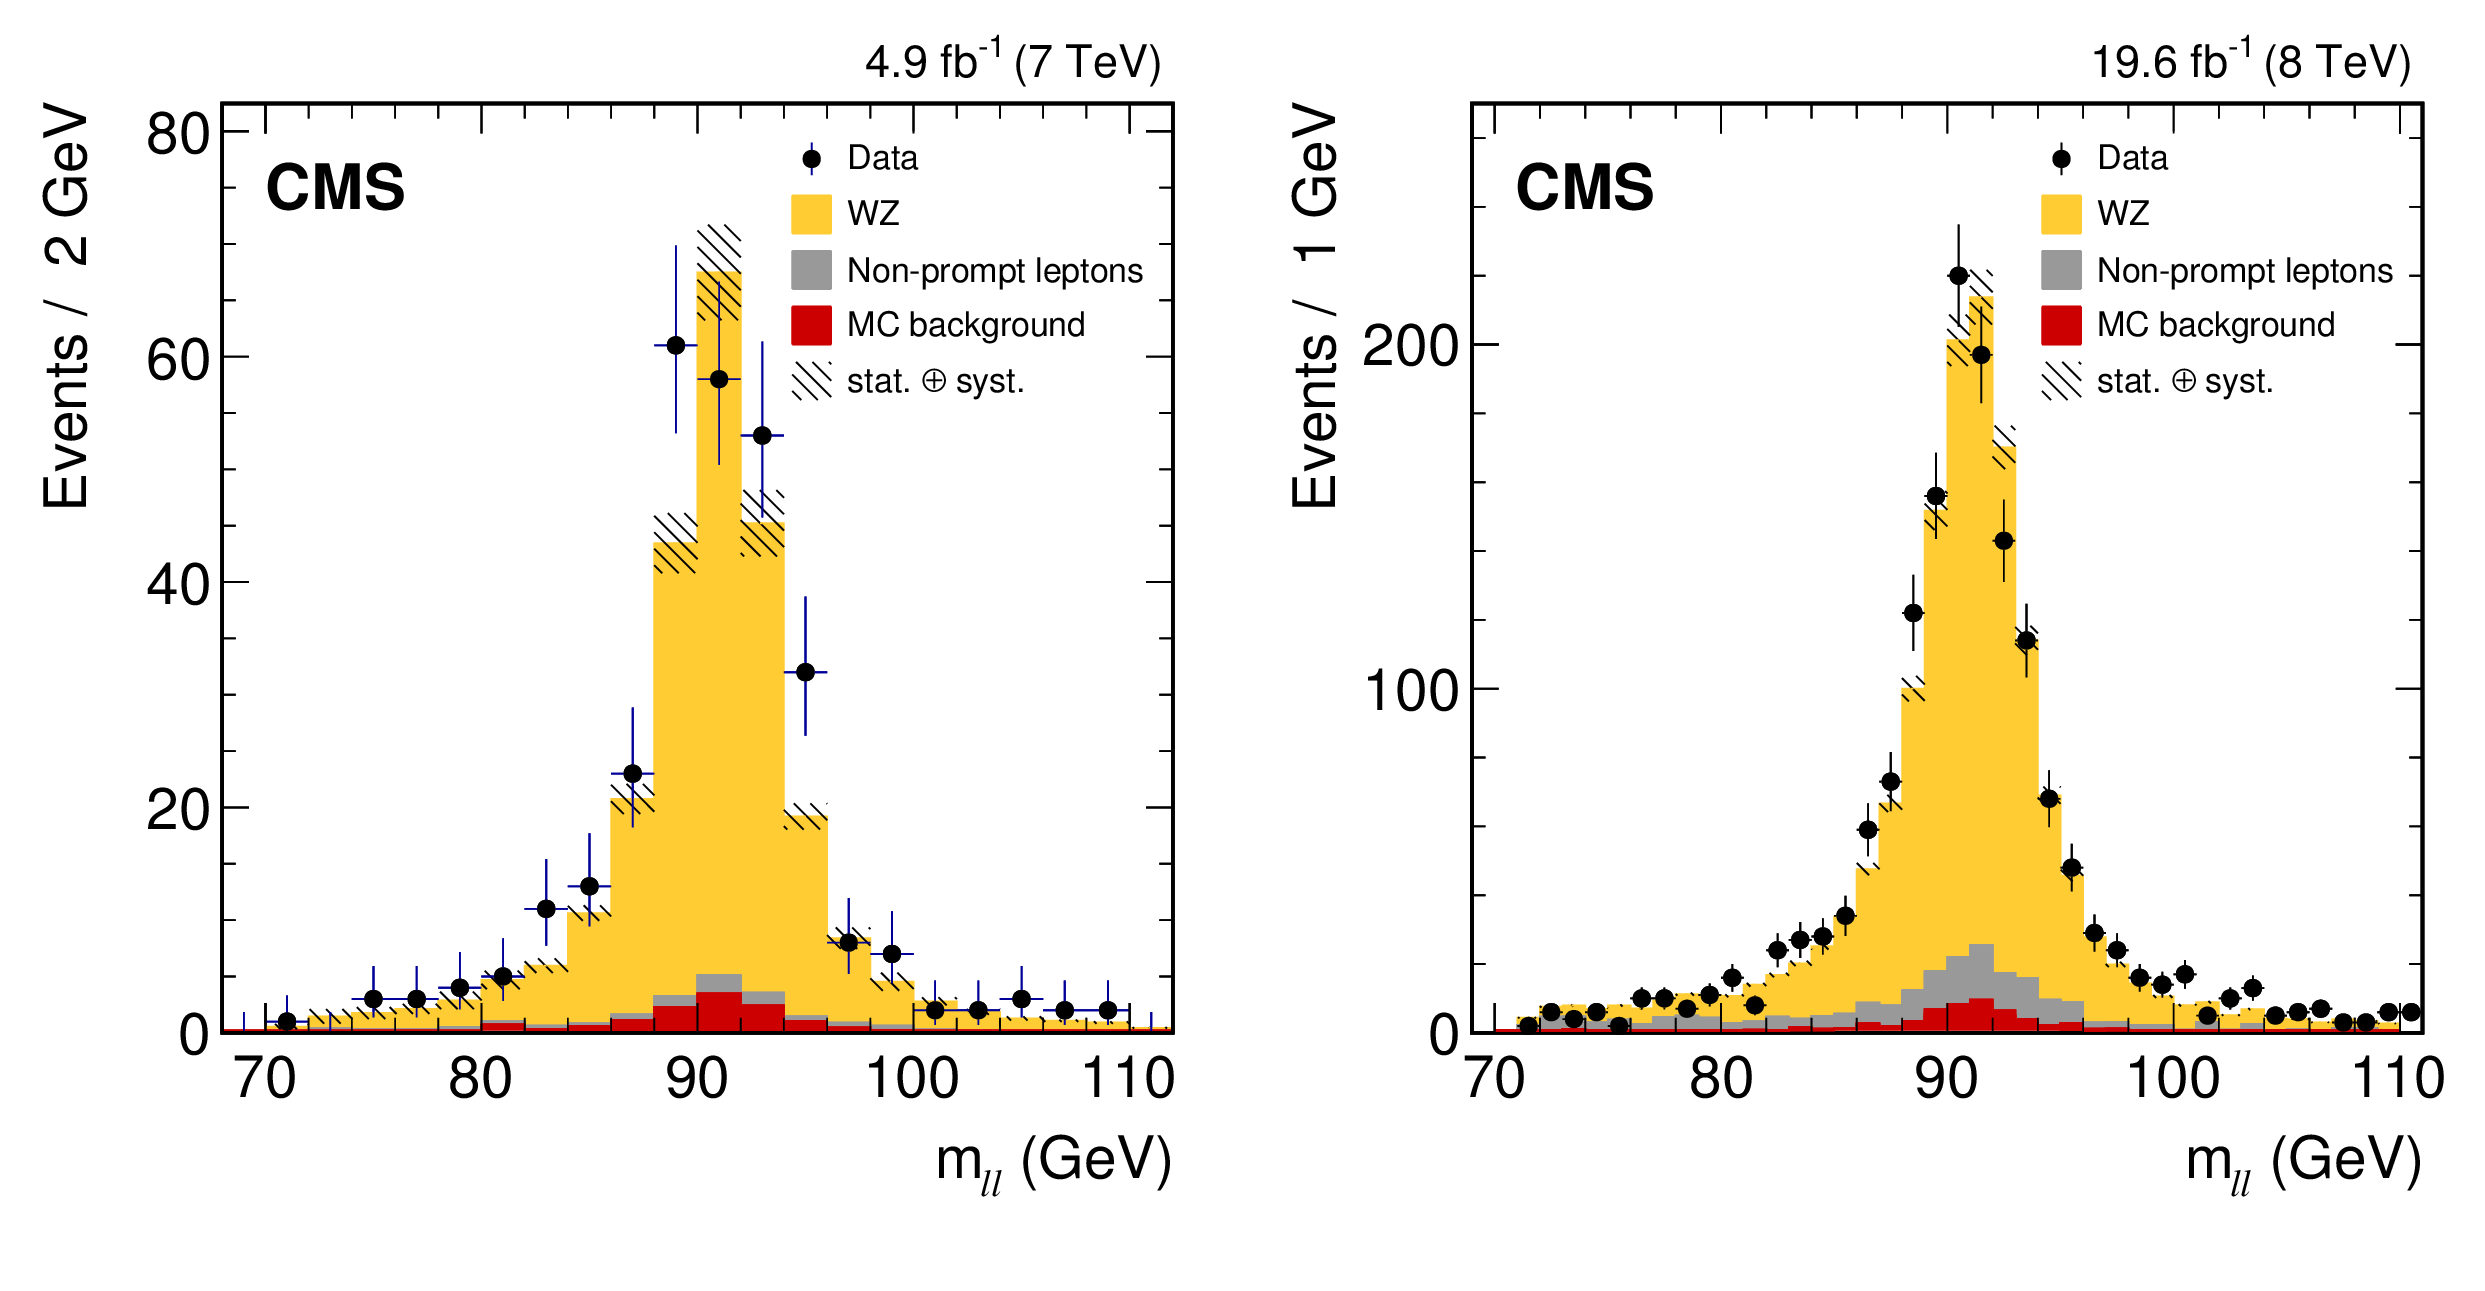
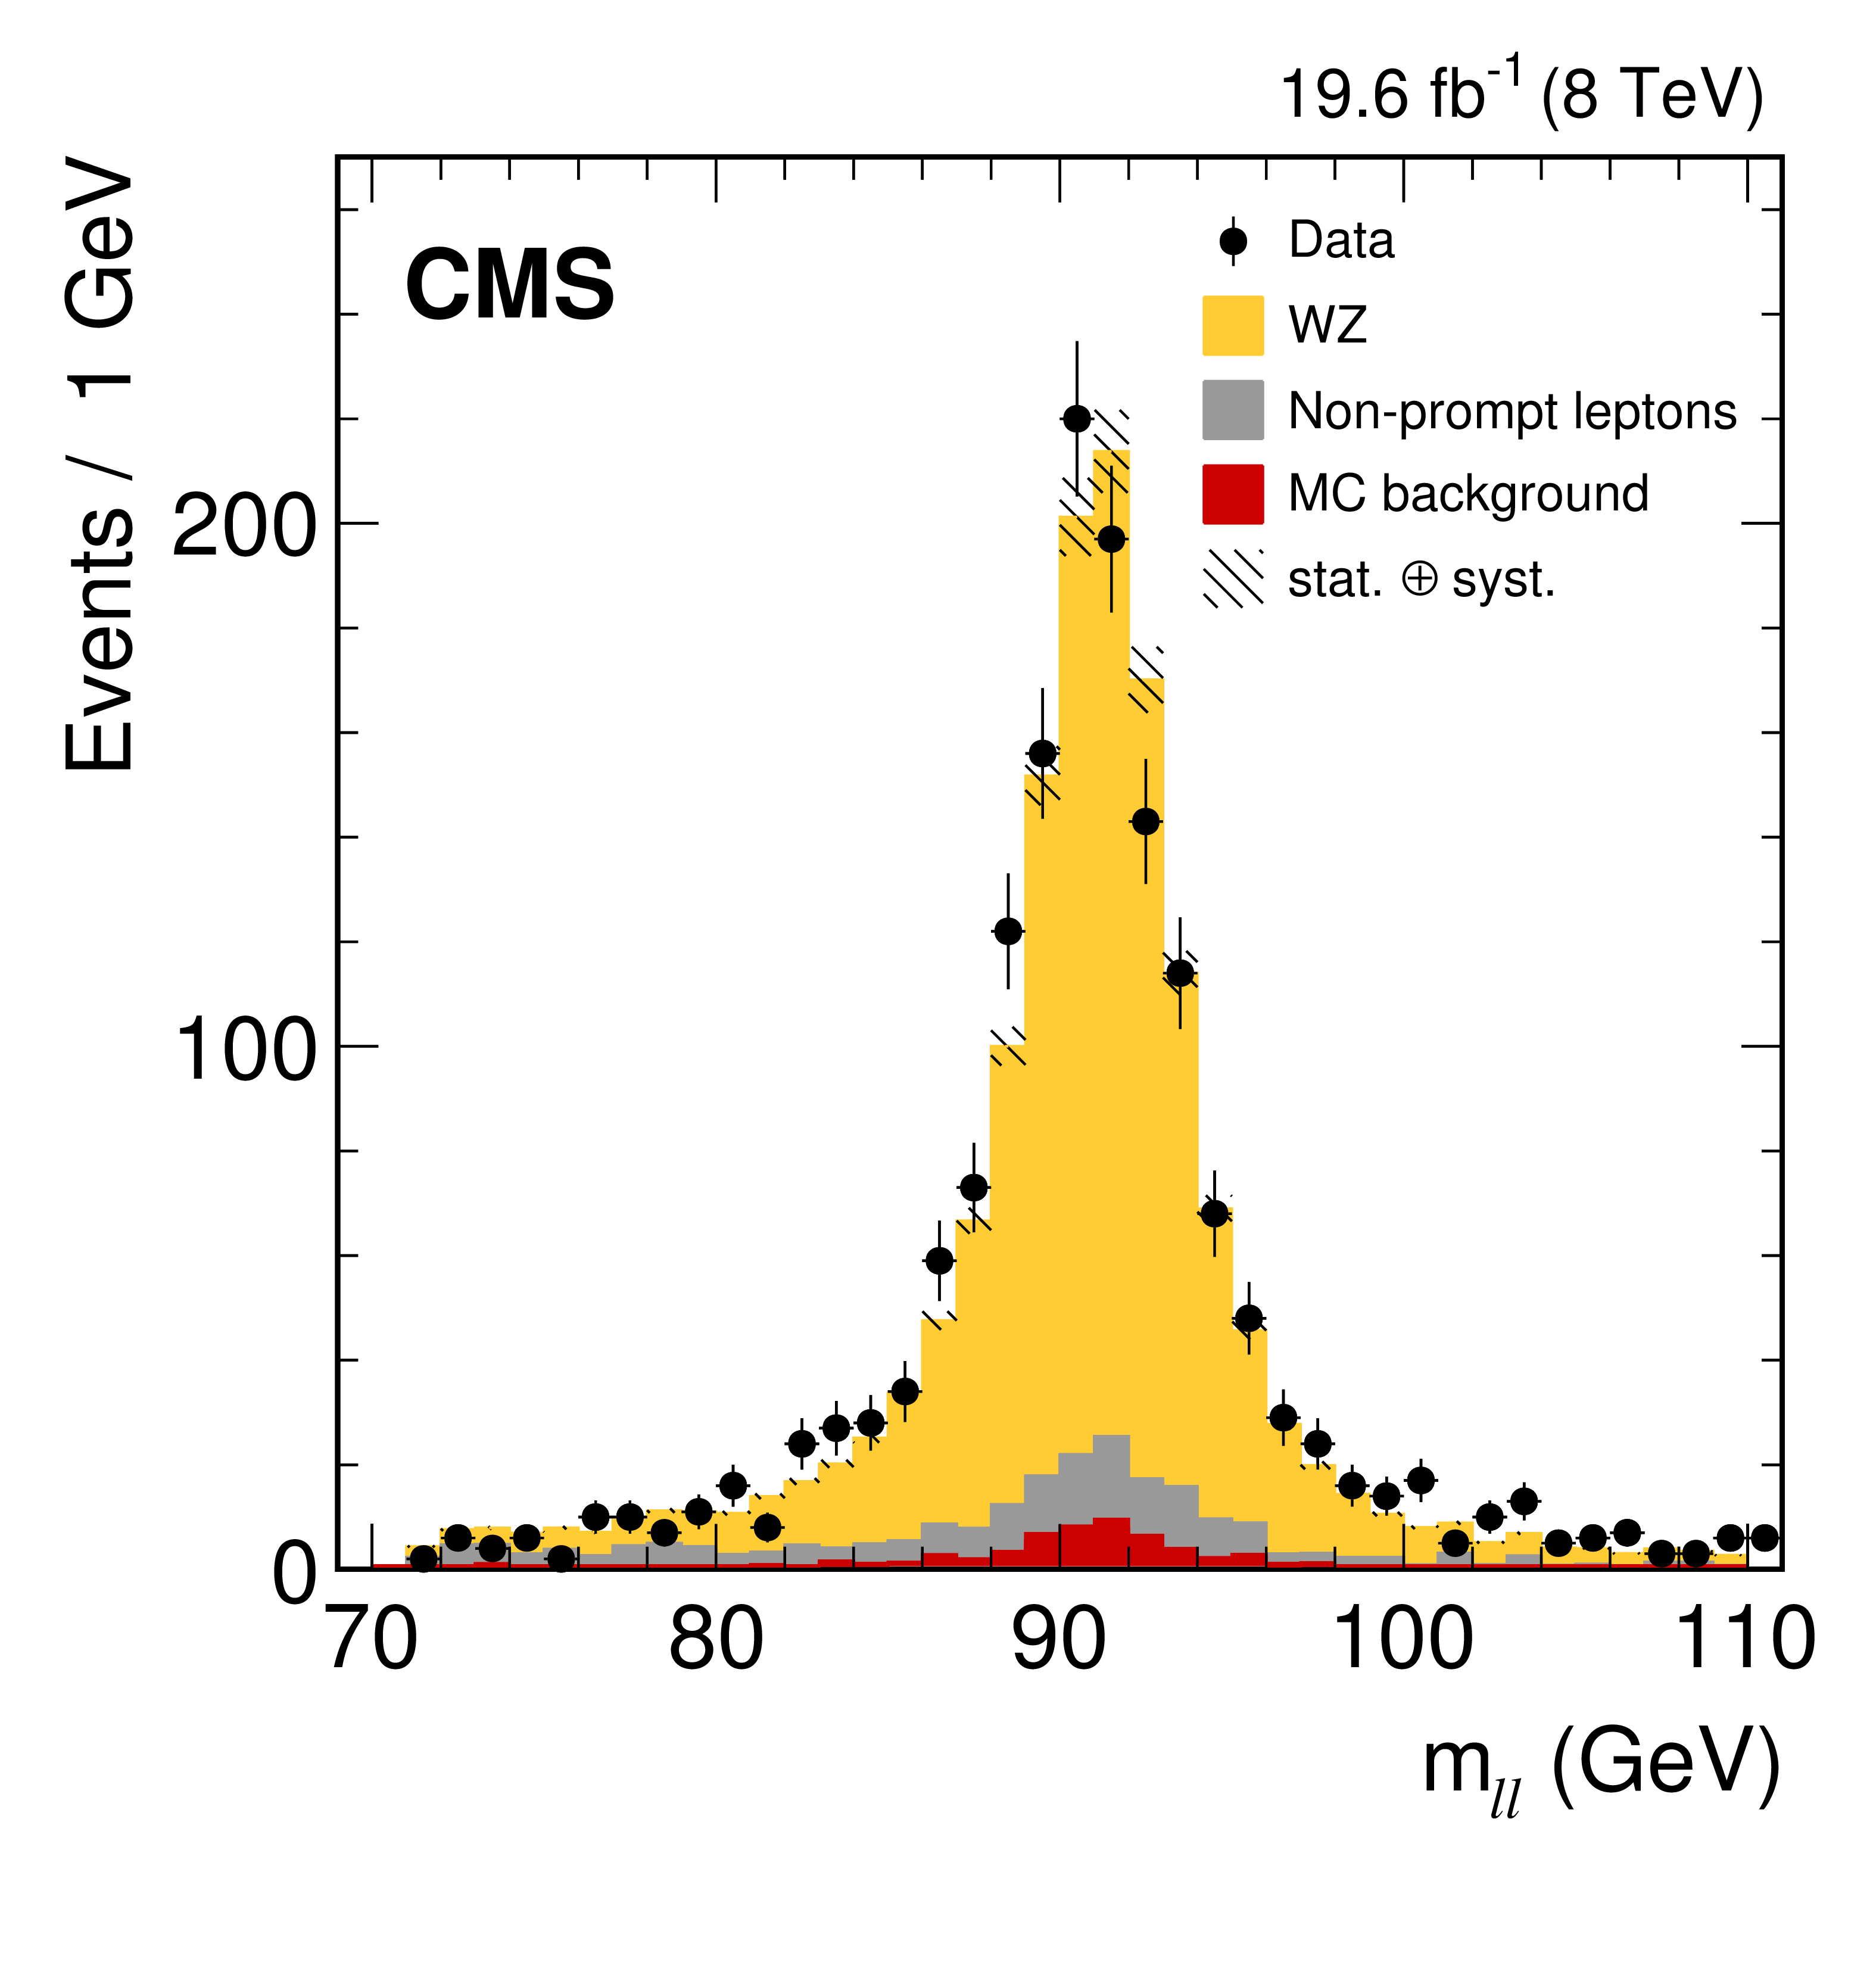
Figure 2:
Distributions of the dilepton invariant mass $m_{\ell \ell }$ in the WZ candidate events in 7 TeV (left) and 8 TeV (right) data. Points represent data and the shaded histograms represent the WZ signal and the background processes. The contribution from non-prompt leptons, dominated by the ${\mathrm{ t } {}\mathrm{ \bar{t} } }$ and Z+jets production, is obtained from data control samples. The contribution from all other backgrounds, labeled `MC background', as well as the signal contribution are determined from simulation. |
png pdf |
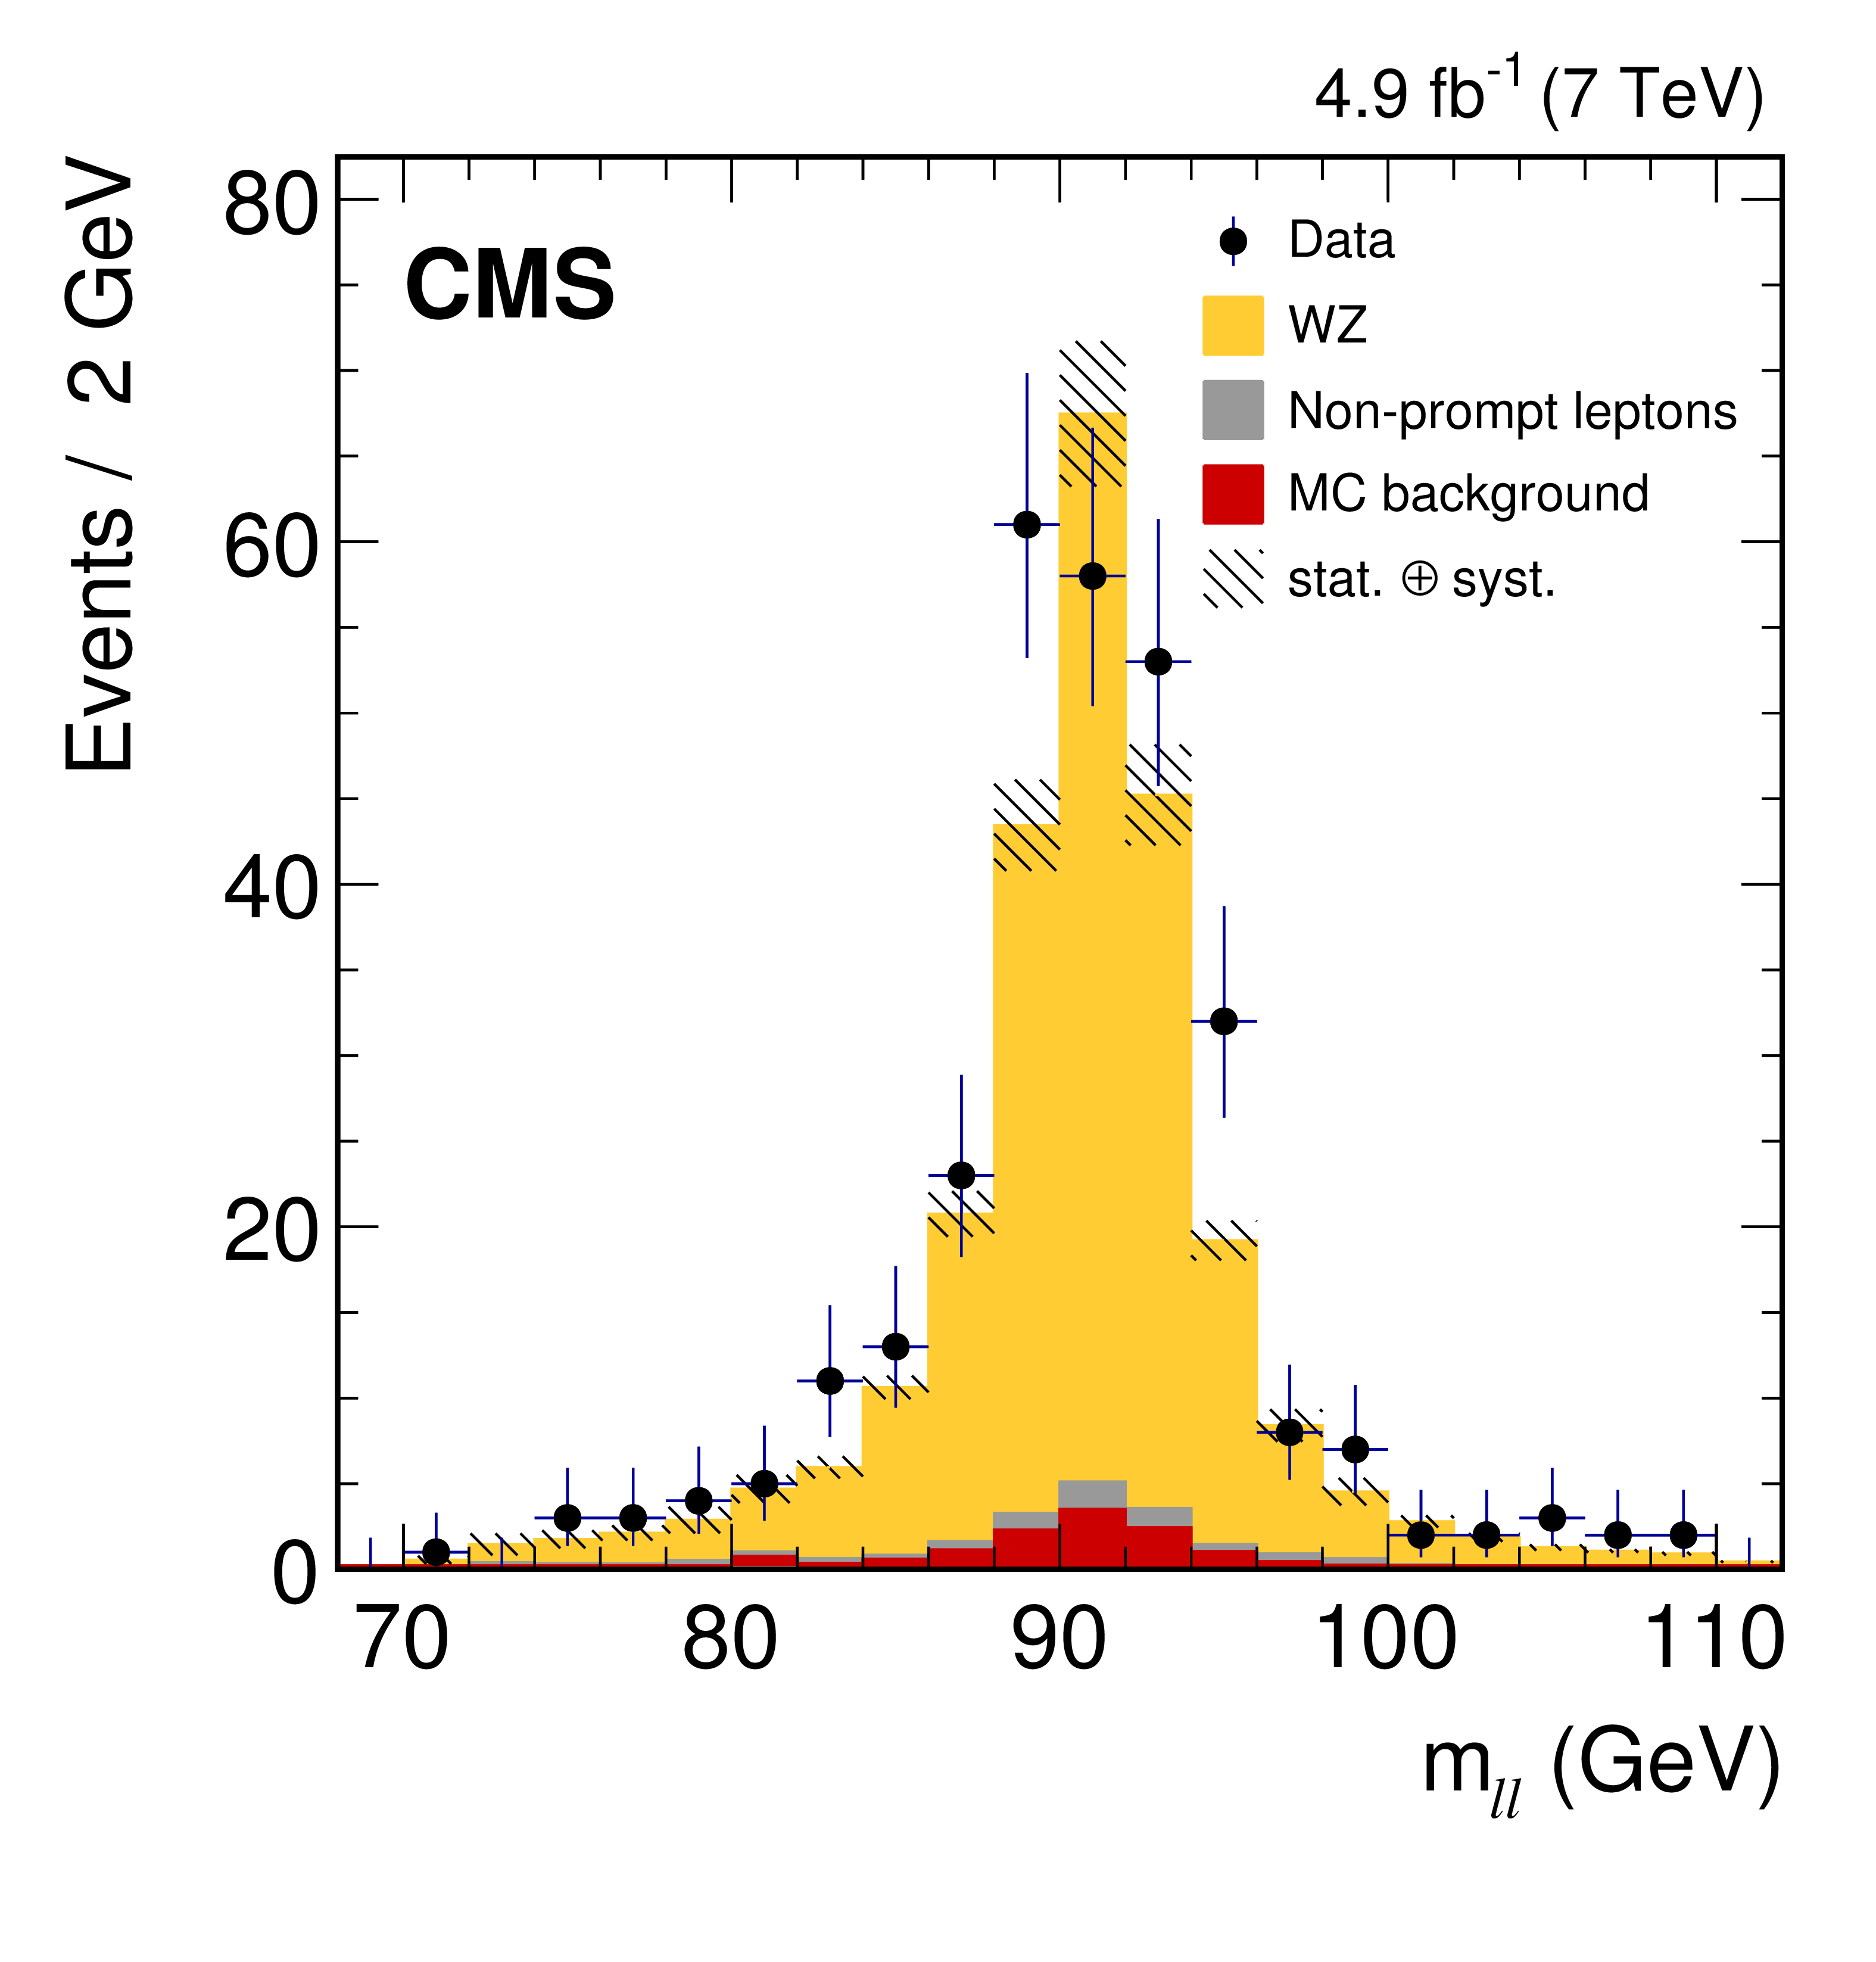
Figure 2-a:
Distributions of the dilepton invariant mass $m_{\ell \ell }$ in the WZ candidate events in 7 TeV data. Points represent data and the shaded histograms represent the WZ signal and the background processes. The contribution from non-prompt leptons, dominated by the ${\mathrm{ t } {}\mathrm{ \bar{t} } }$ and Z+jets production, is obtained from data control samples. The contribution from all other backgrounds, labeled `MC background', as well as the signal contribution are determined from simulation. |
png pdf |
Figure 2-b:
Distributions of the dilepton invariant mass $m_{\ell \ell }$ in the WZ candidate events in 8 TeV data. Points represent data and the shaded histograms represent the WZ signal and the background processes. The contribution from non-prompt leptons, dominated by the ${\mathrm{ t } {}\mathrm{ \bar{t} } }$ and Z+jets production, is obtained from data control samples. The contribution from all other backgrounds, labeled `MC background', as well as the signal contribution are determined from simulation. |

png pdf |
Figure 3:
Ratio of measured inclusive cross sections to NNLO predictions. The vertical gray bands represent the theoretical uncertainties at 7 and 8 TeV. |

png pdf |
Figure 4:
The WZ total cross section as a function of the proton-proton centre-of-mass energy. Results from the CMS and ATLAS experiments are compared to the predictions of MCFM and Matrix. The data uncertainties are statistical (inner bars) and statistical plus systematic added in quadrature (outer bars). The band around the theoretical predictions reflects uncertainties generated by varying the factorization and renormalization scales up and down by a factor of two and also the (PDF+$\alpha _S$) uncertainty of NNPDF3.0 for NLO predictions. The theoretical predictions and the CMS 13 TeV cross section are calculated for the Z boson mass window 60-120 GeV. The CMS 7 and 8 TeV cross sections presented in this paper are calculated for the Z boson mass window 71-111 GeV (estimated correction factor 2%), while all ATLAS measurements are performed with the Z boson mass window 66-116 GeV (1%). |
png pdf |
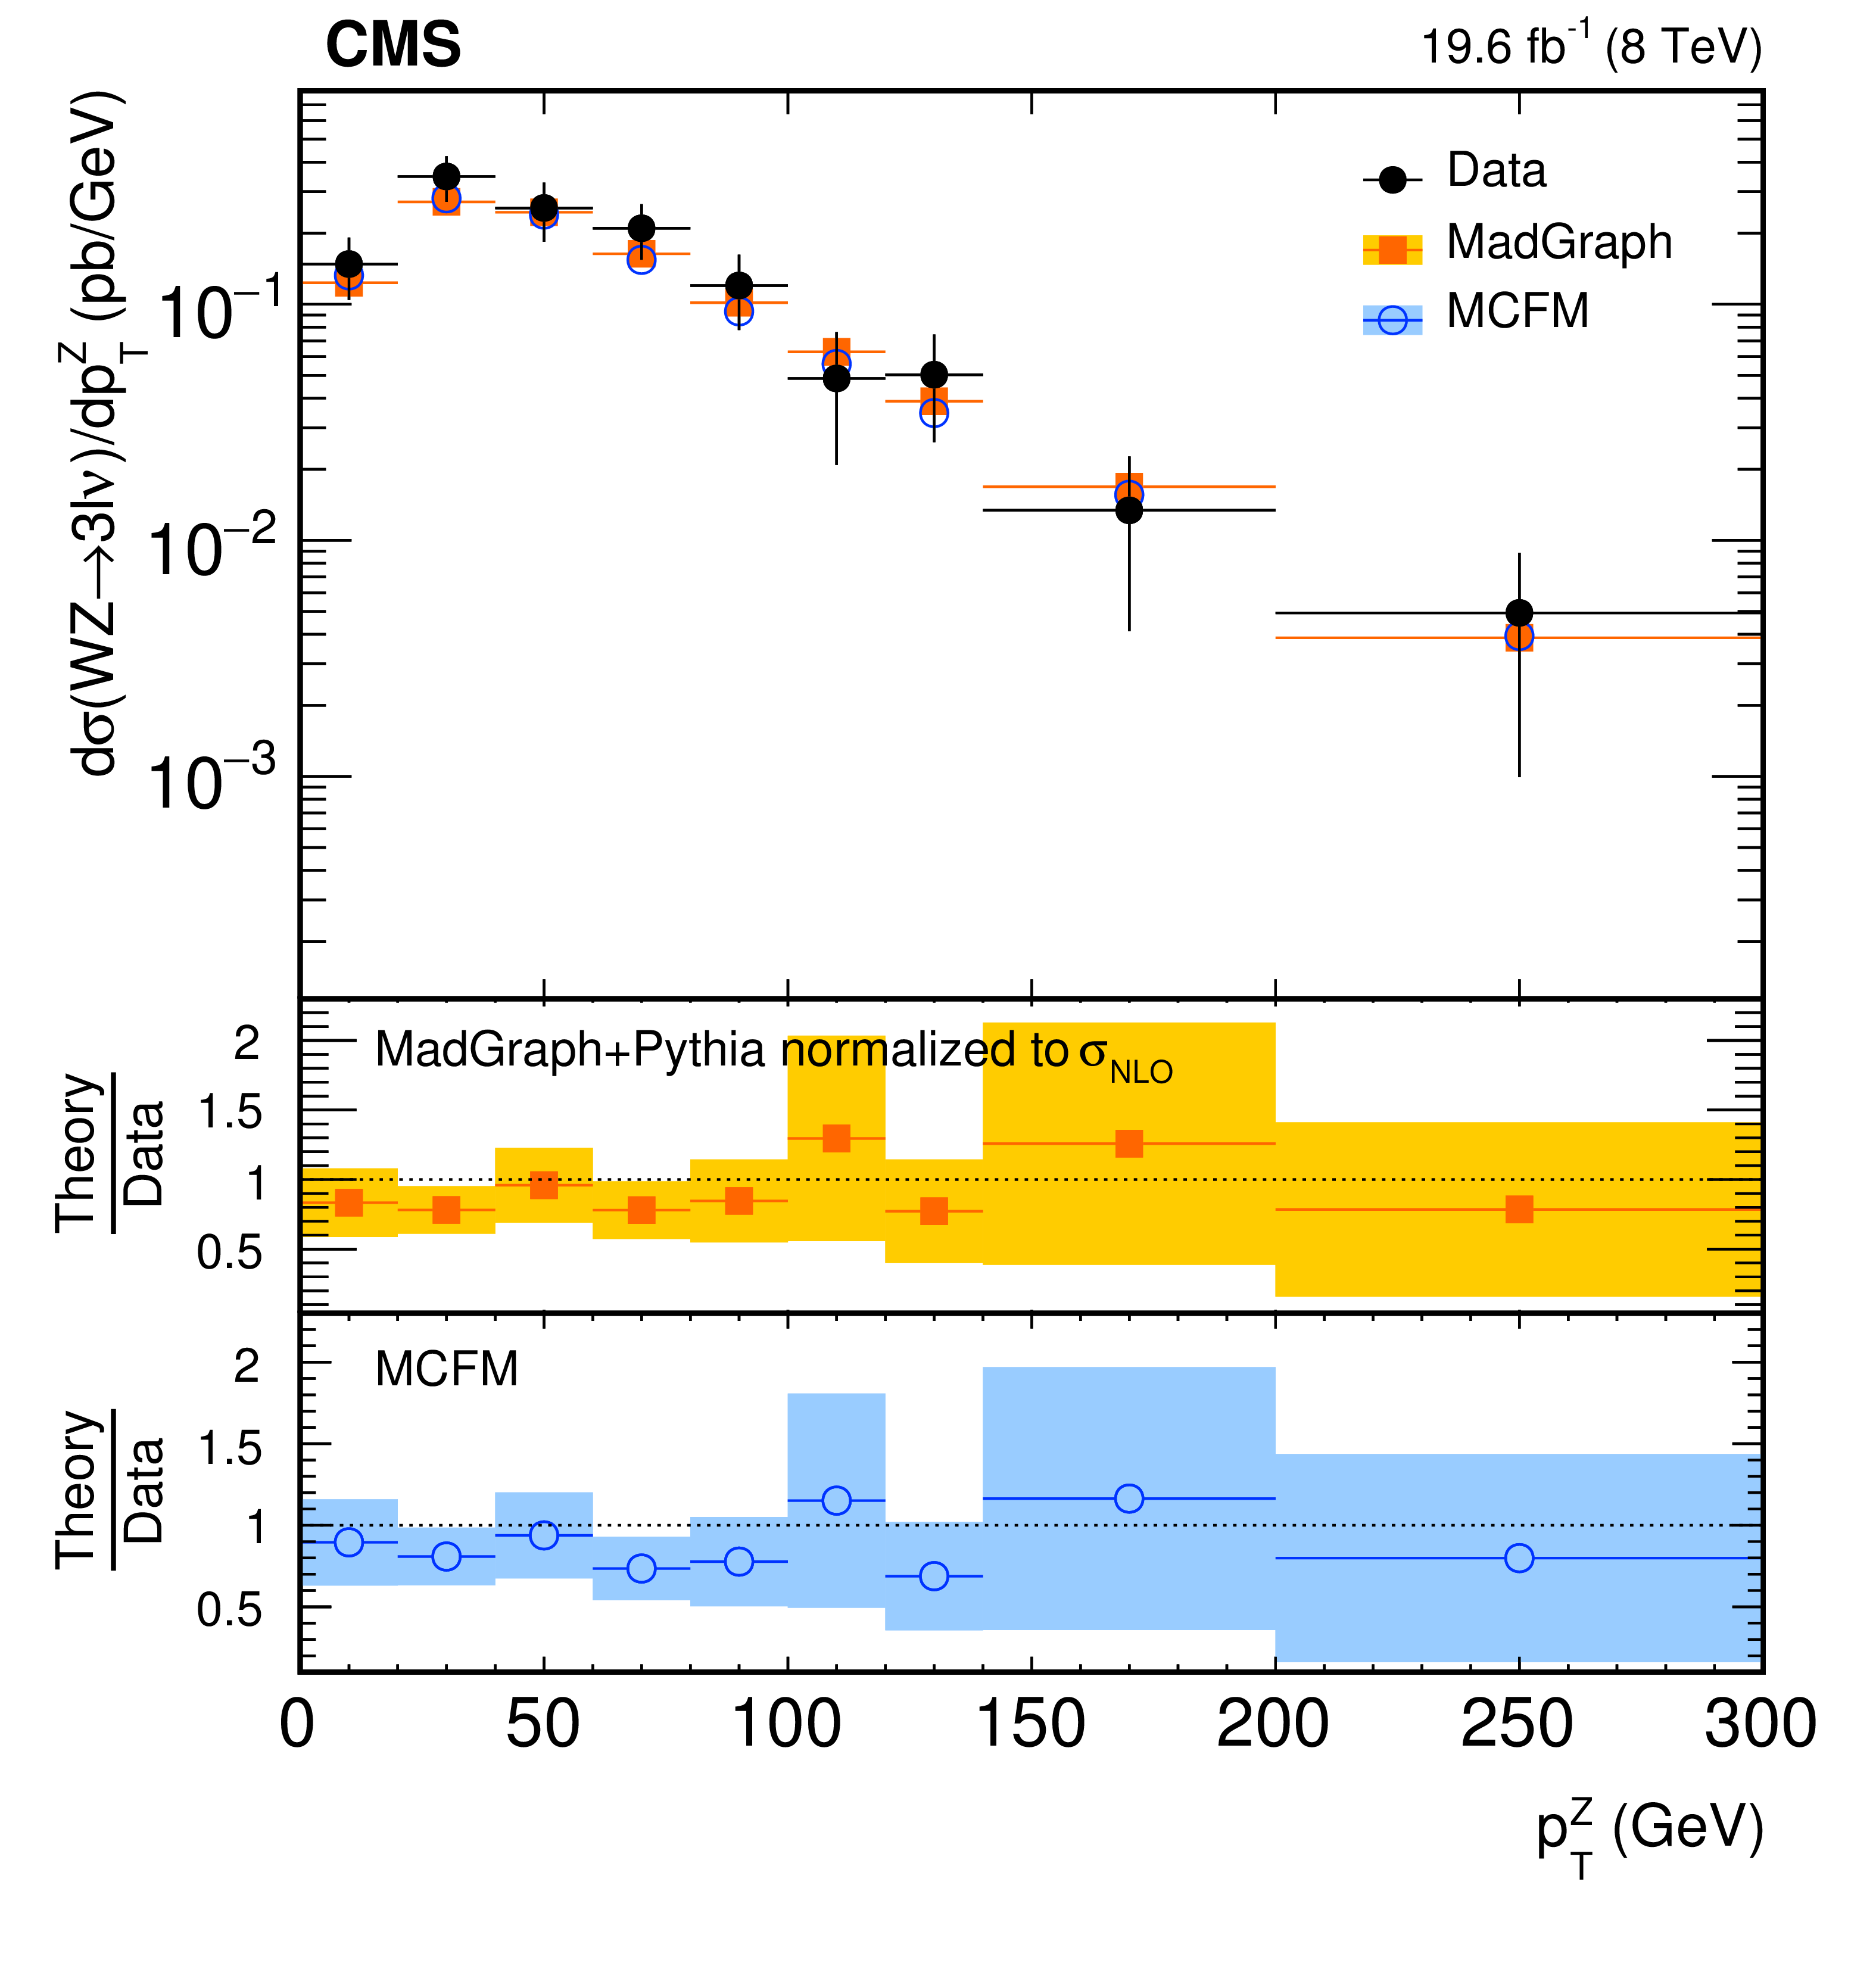
Figure 5:
Differential WZ cross section at $ \sqrt{s} = $ 8 TeV as a function of the Z boson transverse momentum. The measurement is compared with MCFM and MadGraph predictions. The MadGraph prediction is rescaled to the total NLO cross section as predicted by MCFM . The error bands in the ratio plots indicate the relative errors on the data in each bin and contain both statistical and systematic uncertainties. |
png pdf |
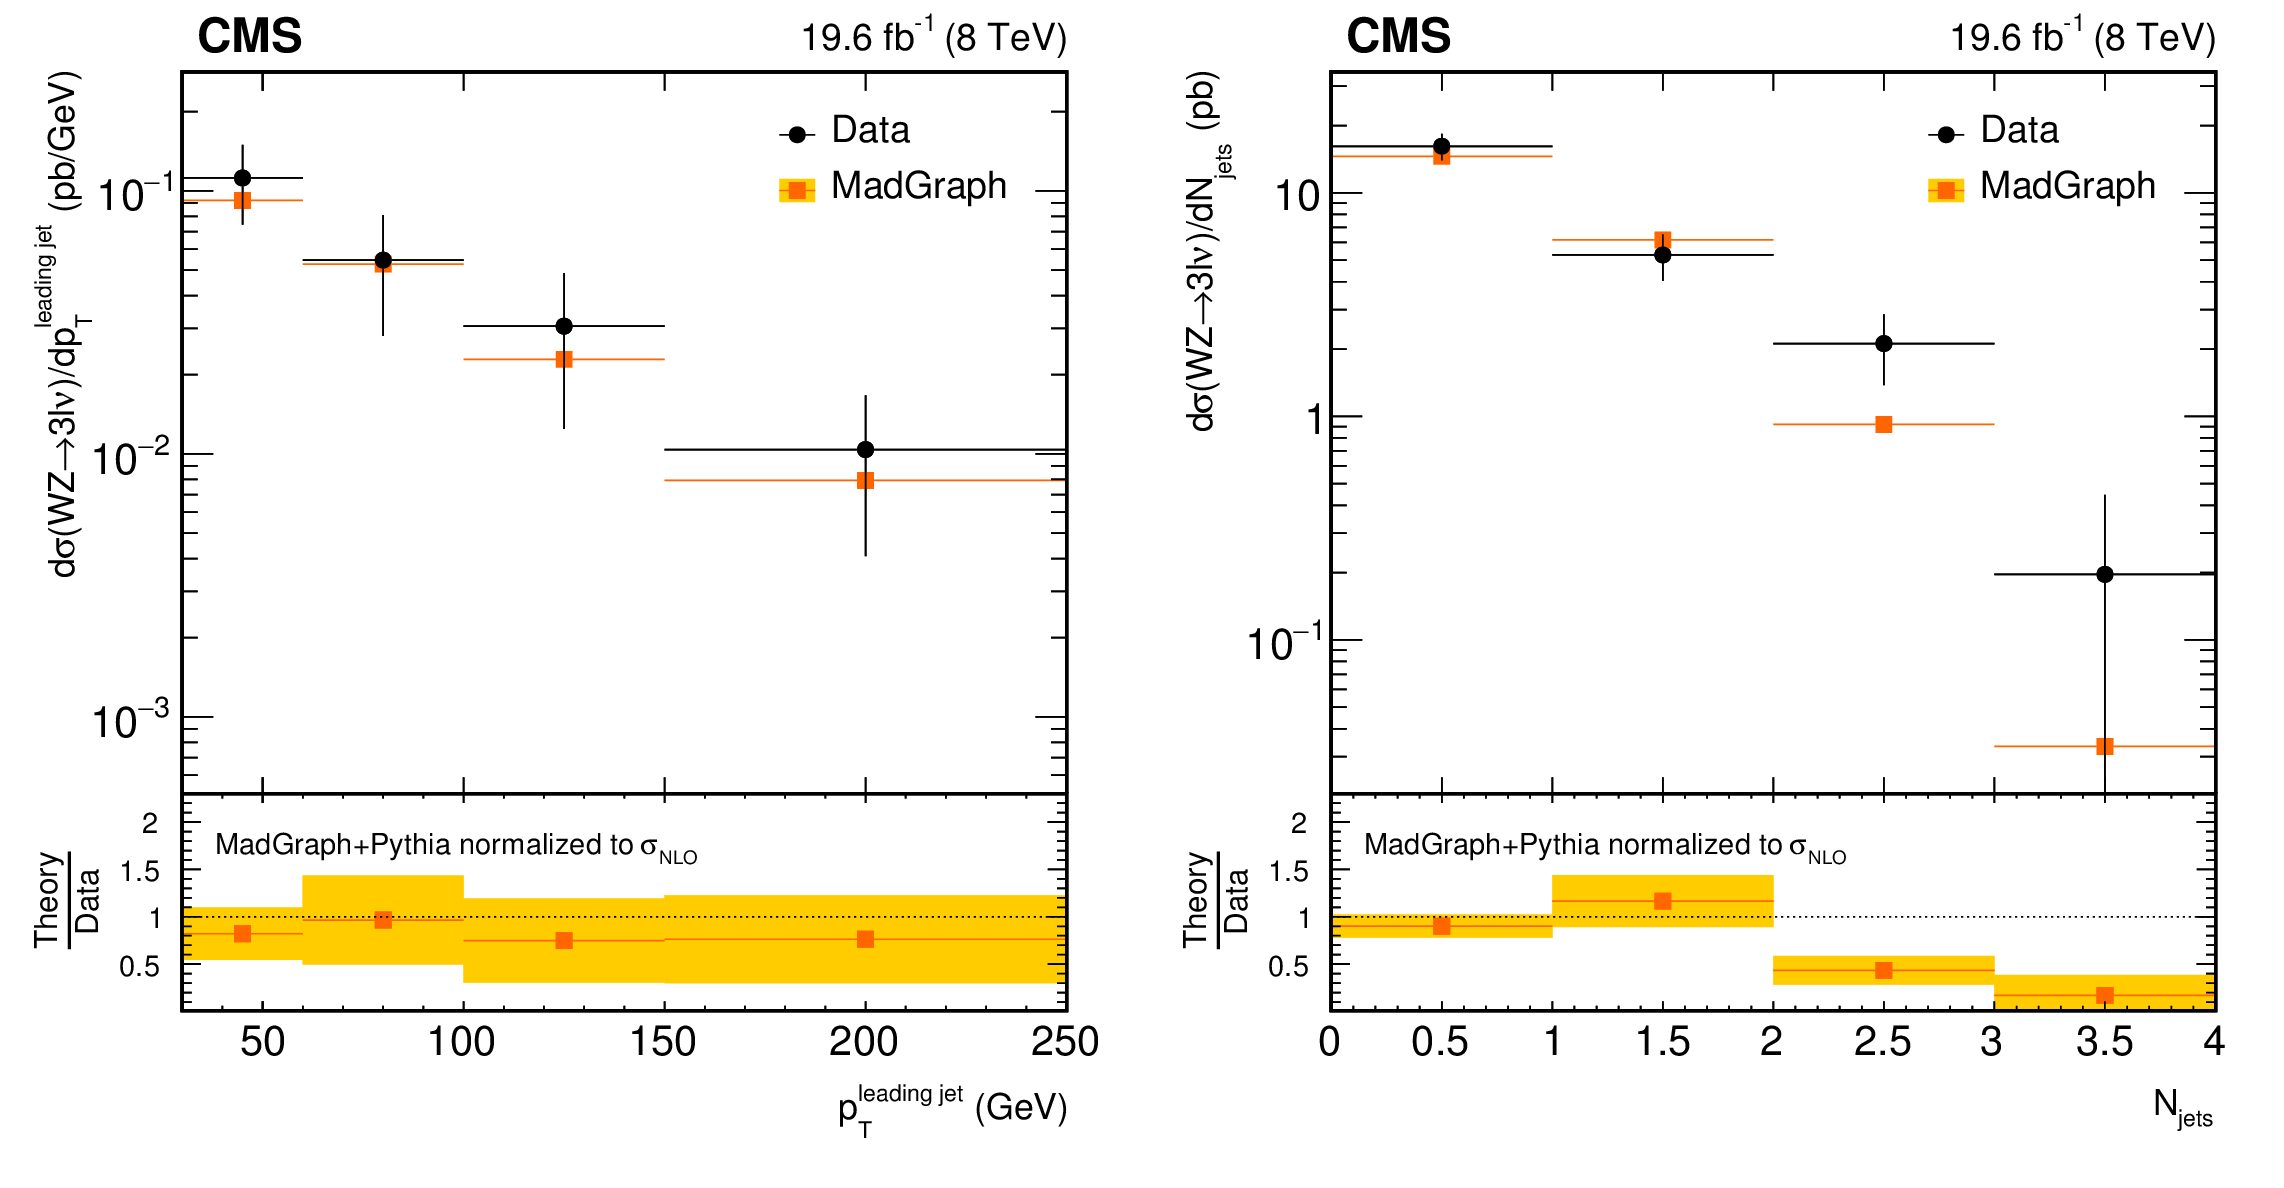
Figure 6:
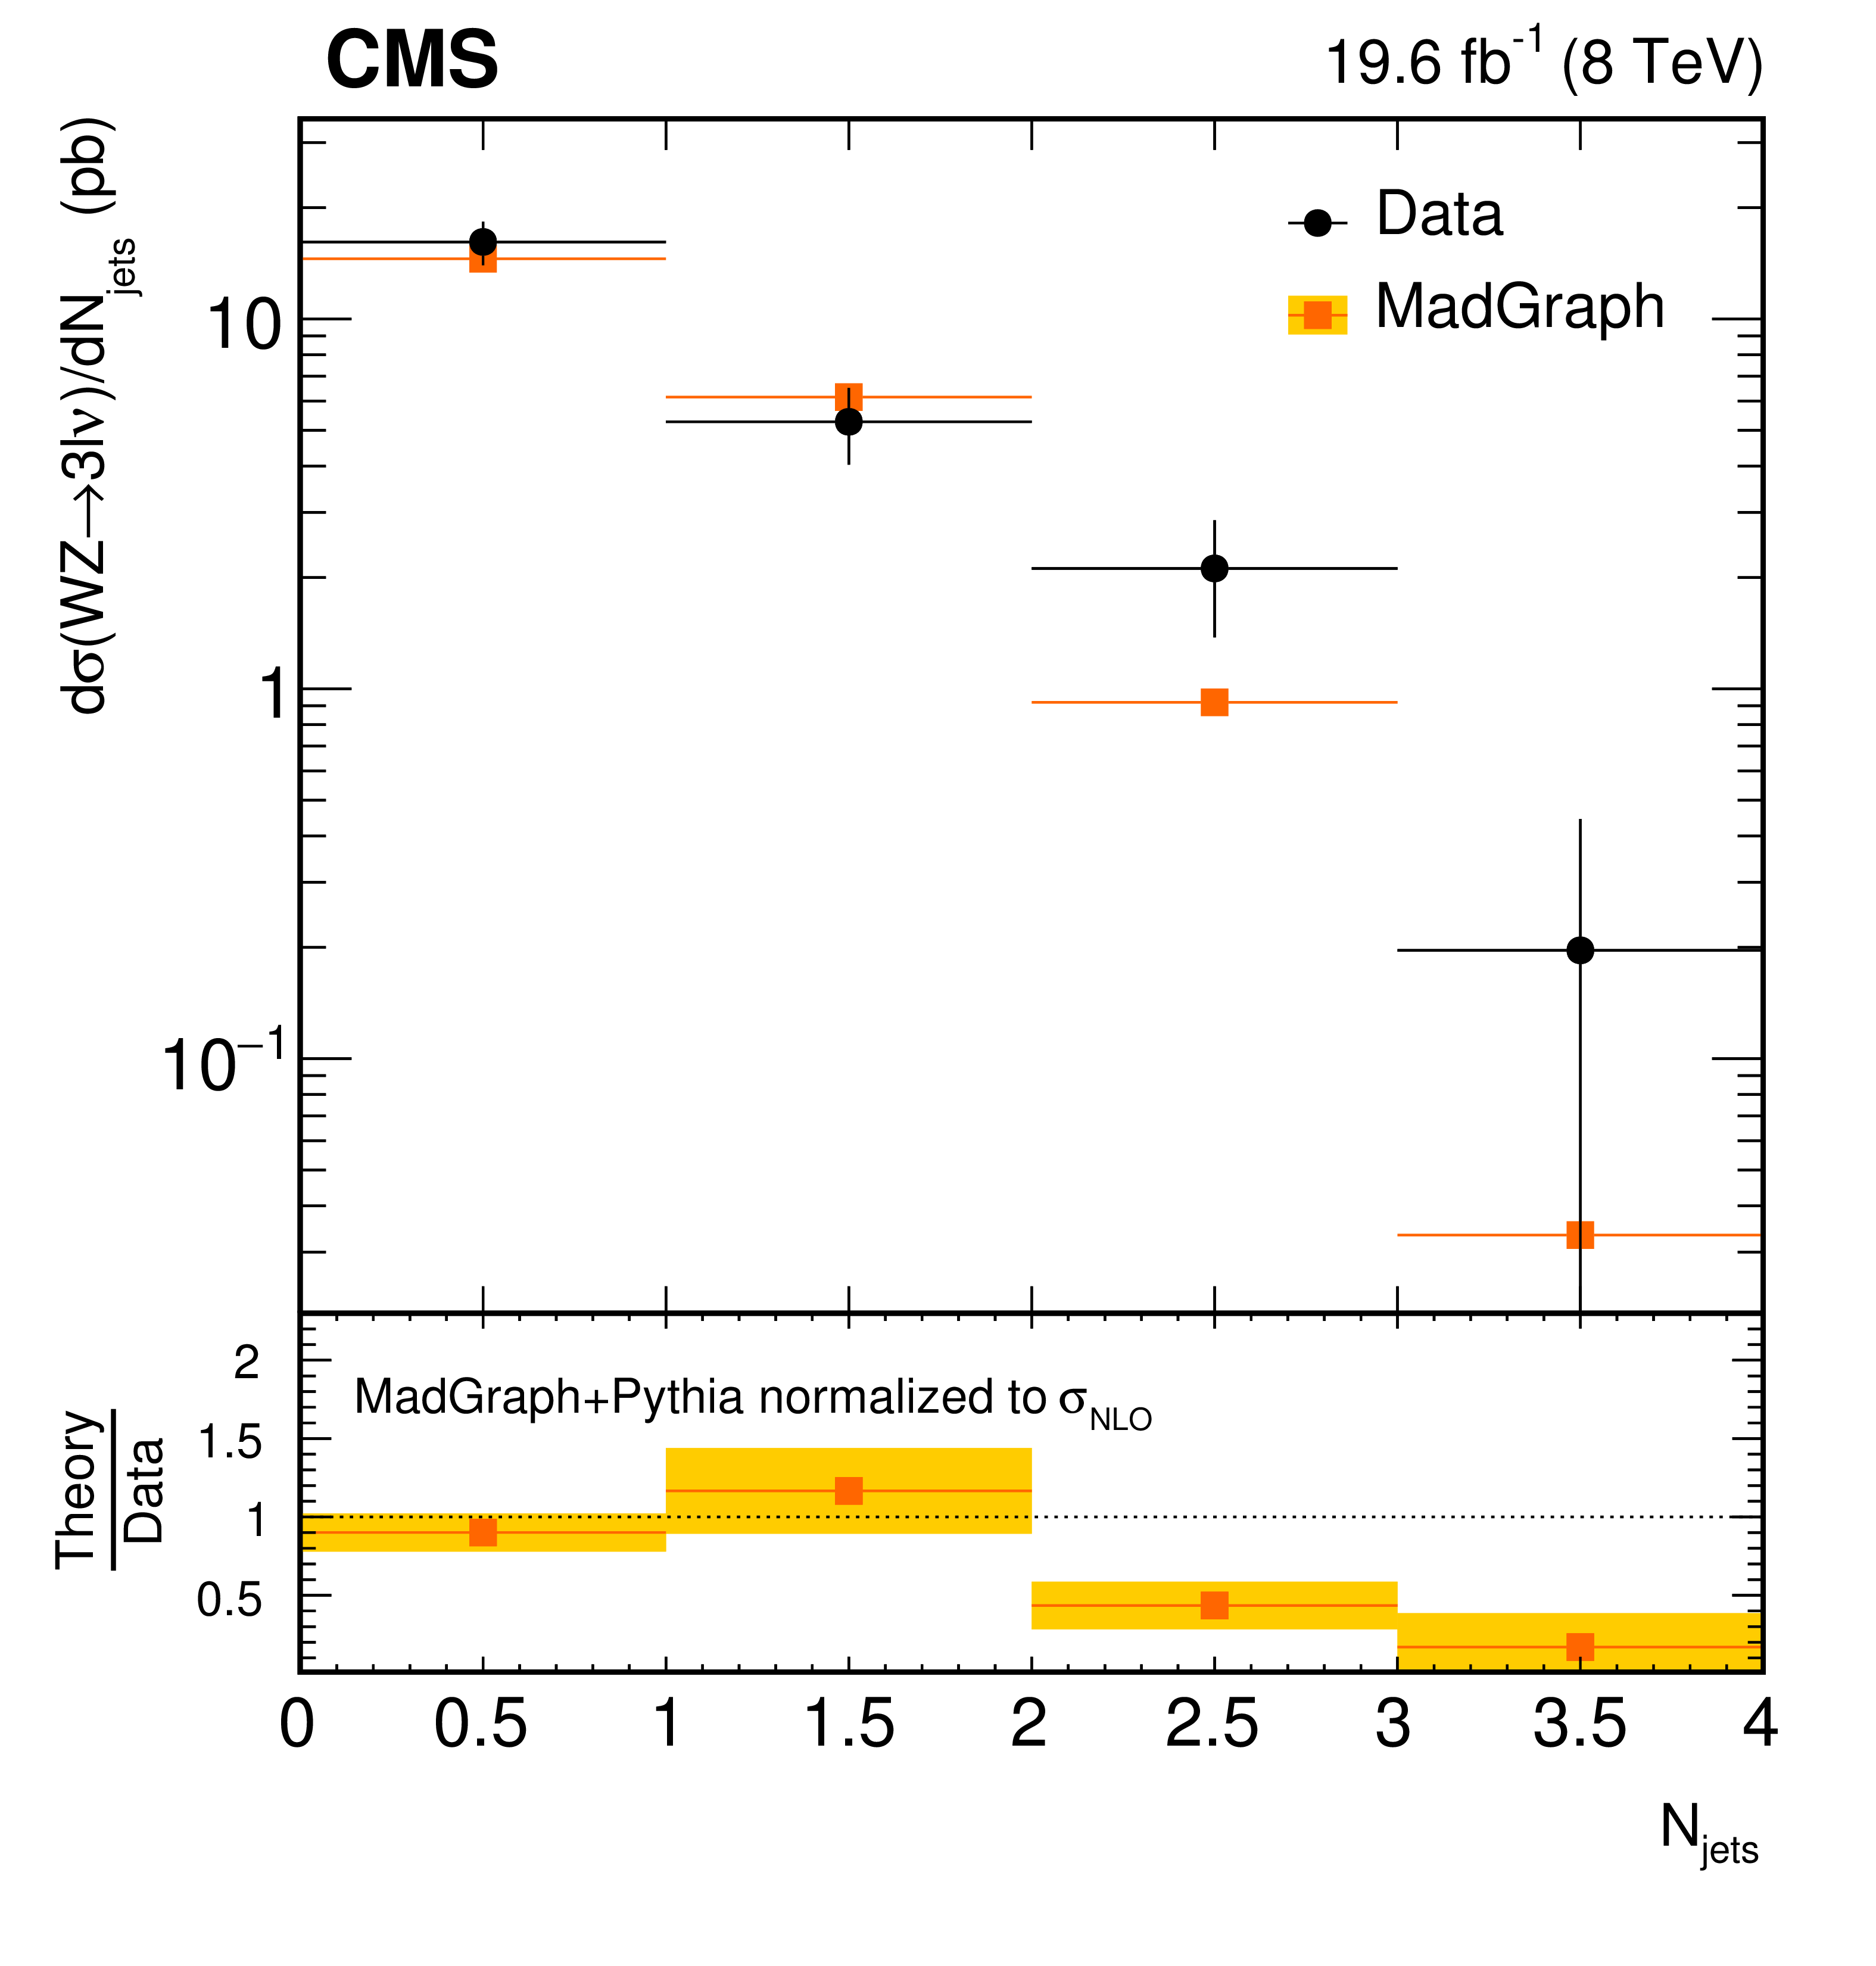
Differential WZ cross section at $ \sqrt{s} = $ 8 TeV as a function of: (left) the leading jet transverse momentum; (right) the number of accompanying jets. The measurements are compared with MadGraph predictions. The MadGraph prediction is rescaled to the total NLO cross section as predicted by MCFM . The error bands in the ratio plots indicate the relative errors on the data in each bin and contain both statistical and systematic uncertainties. |
png pdf |
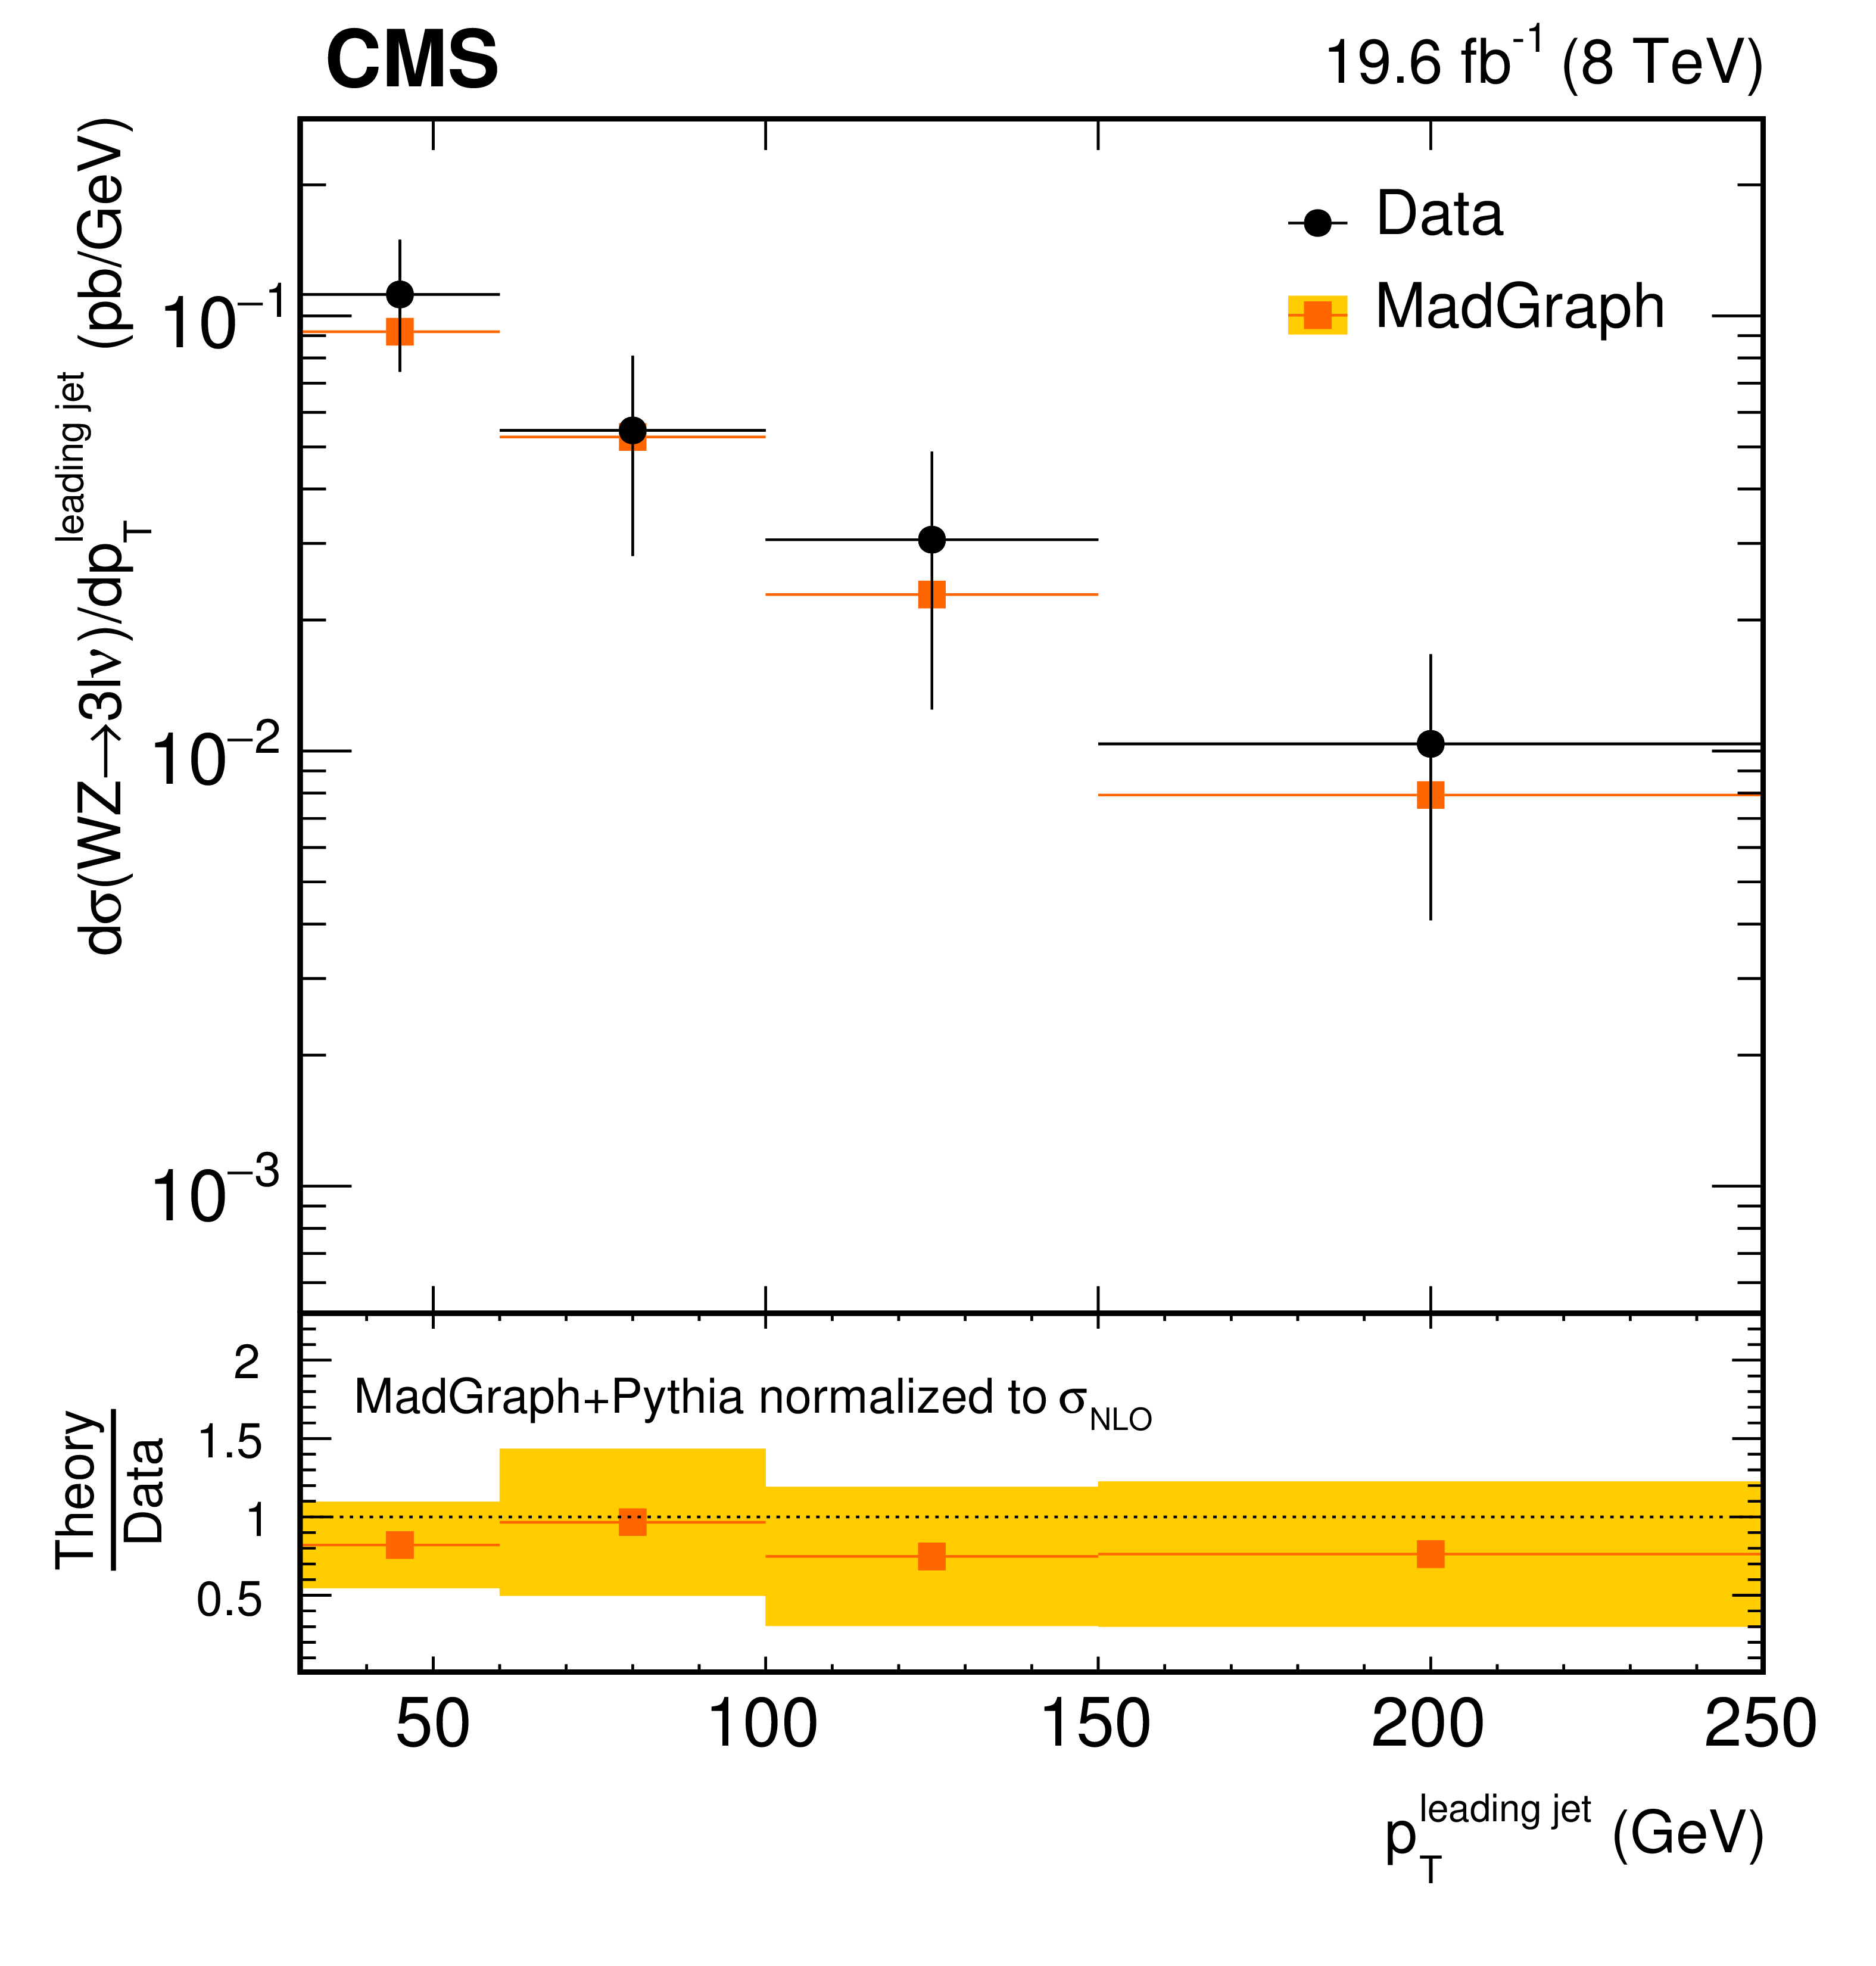
Figure 6-a:
Differential WZ cross section at $ \sqrt{s} = $ 8 TeV as a function of the leading jet transverse momentum. The measurements are compared with MadGraph predictions. The MadGraph prediction is rescaled to the total NLO cross section as predicted by MCFM . The error bands in the ratio plots indicate the relative errors on the data in each bin and contain both statistical and systematic uncertainties. |
png pdf |
Figure 6-b:
Differential WZ cross section at $ \sqrt{s} = $ 8 TeV as a function of the number of accompanying jets. The measurements are compared with MadGraph predictions. The MadGraph prediction is rescaled to the total NLO cross section as predicted by MCFM . The error bands in the ratio plots indicate the relative errors on the data in each bin and contain both statistical and systematic uncertainties. |
png pdf |
Figure 7:
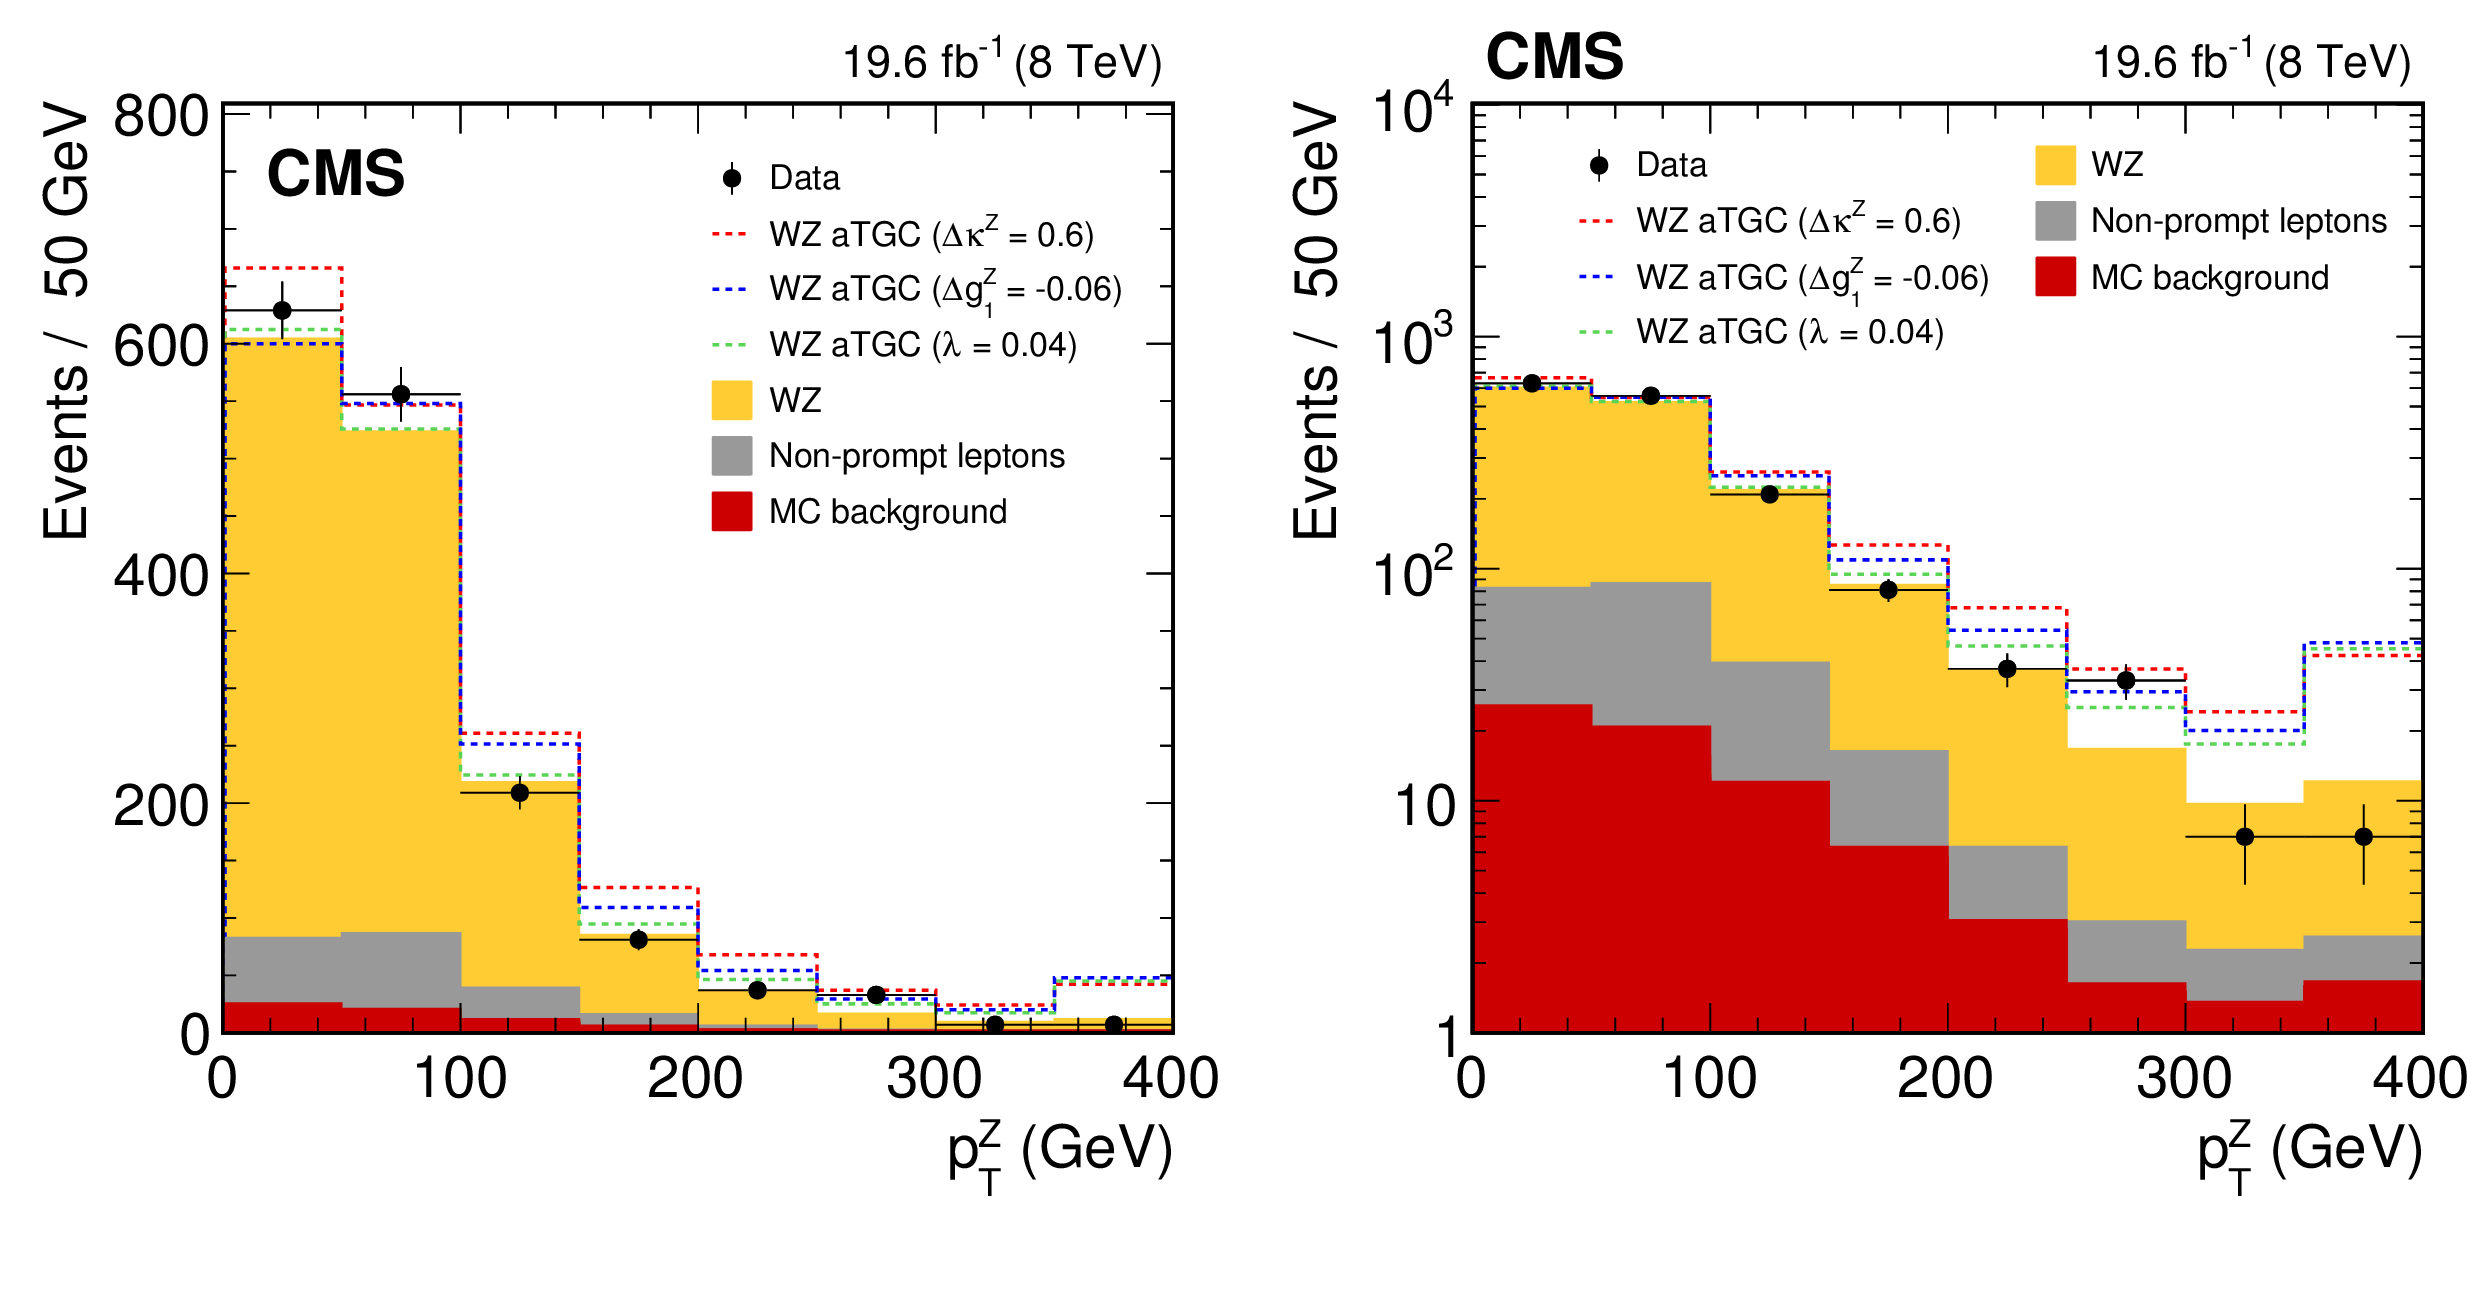
Transverse momentum distribution of the Z boson candidates, in linear scale (left) and log scale (right) for all channels combined. The SM WZ contribution (light orange) is normalized to the predicted cross section from MCFM . Dashed lines correspond to aTGC expectations with different parameter values. The last bin includes the integral of the tail. |

png pdf |
Figure 7-a:
Transverse momentum distribution of the Z boson candidates, in linear scale for all channels combined. The SM WZ contribution (light orange) is normalized to the predicted cross section from MCFM . Dashed lines correspond to aTGC expectations with different parameter values. The last bin includes the integral of the tail. |
png pdf |
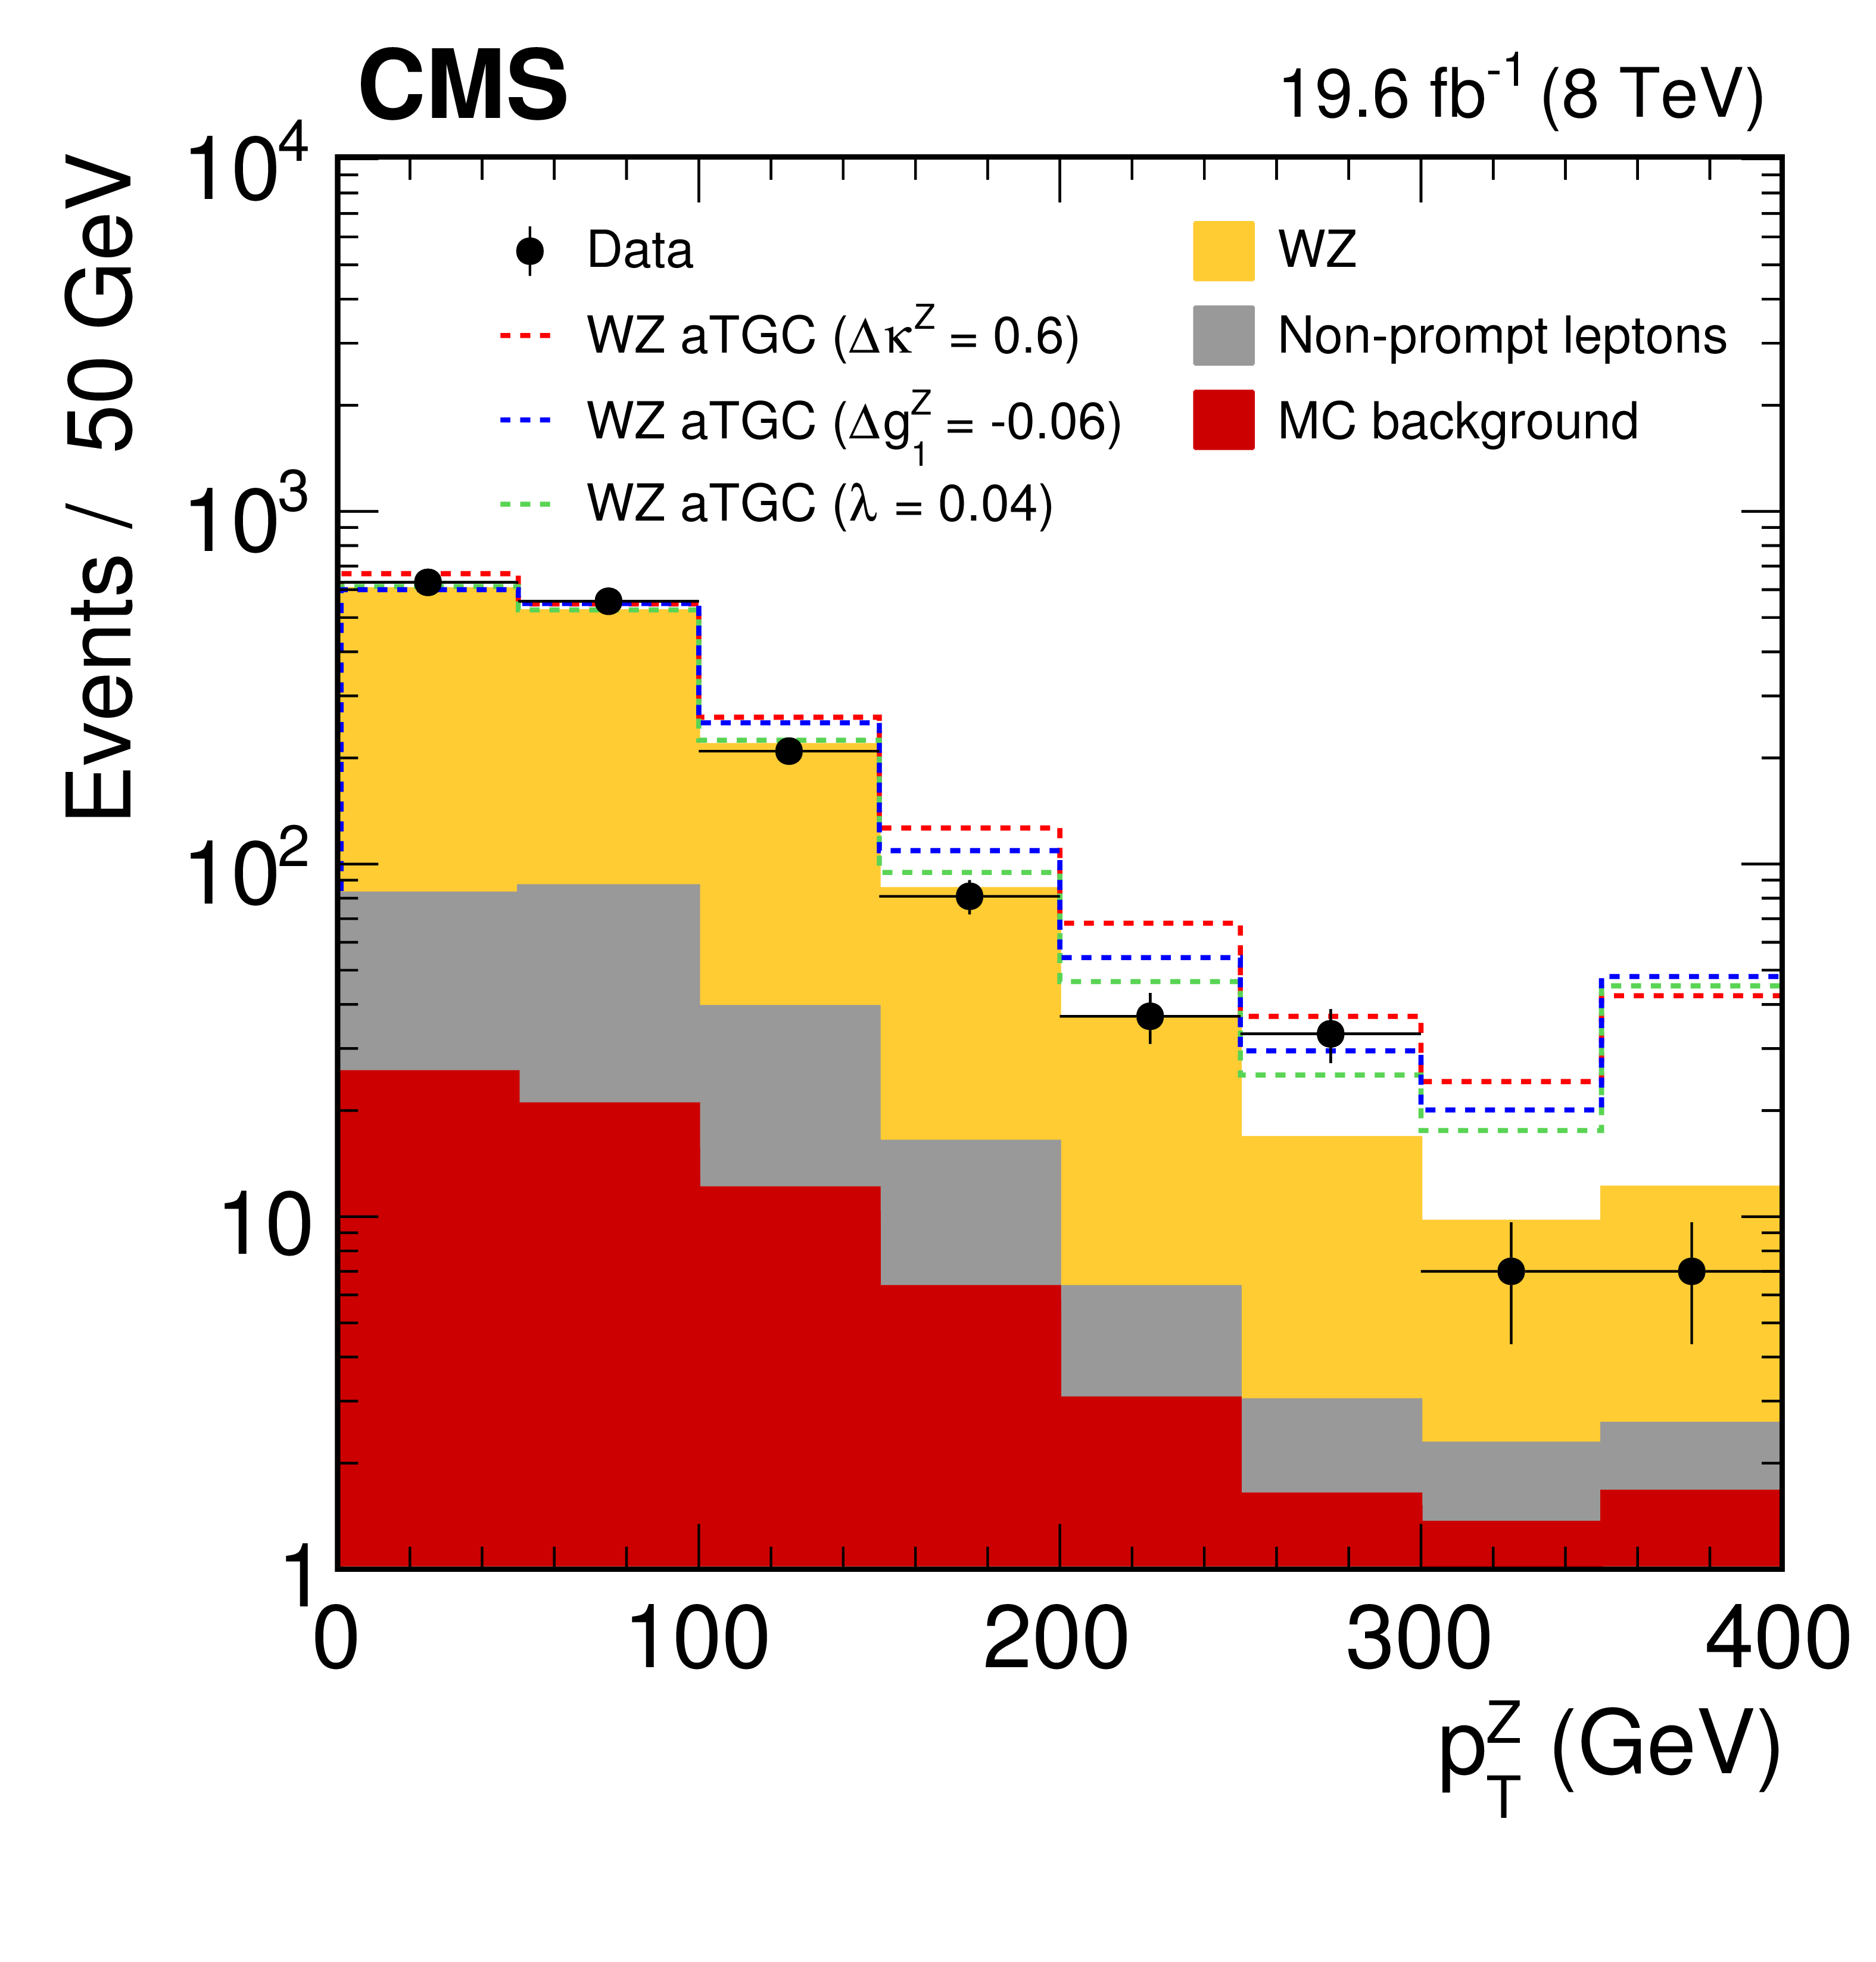
Figure 7-b:
Transverse momentum distribution of the Z boson candidates, in log scale for all channels combined. The SM WZ contribution (light orange) is normalized to the predicted cross section from MCFM . Dashed lines correspond to aTGC expectations with different parameter values. The last bin includes the integral of the tail. |
png pdf |
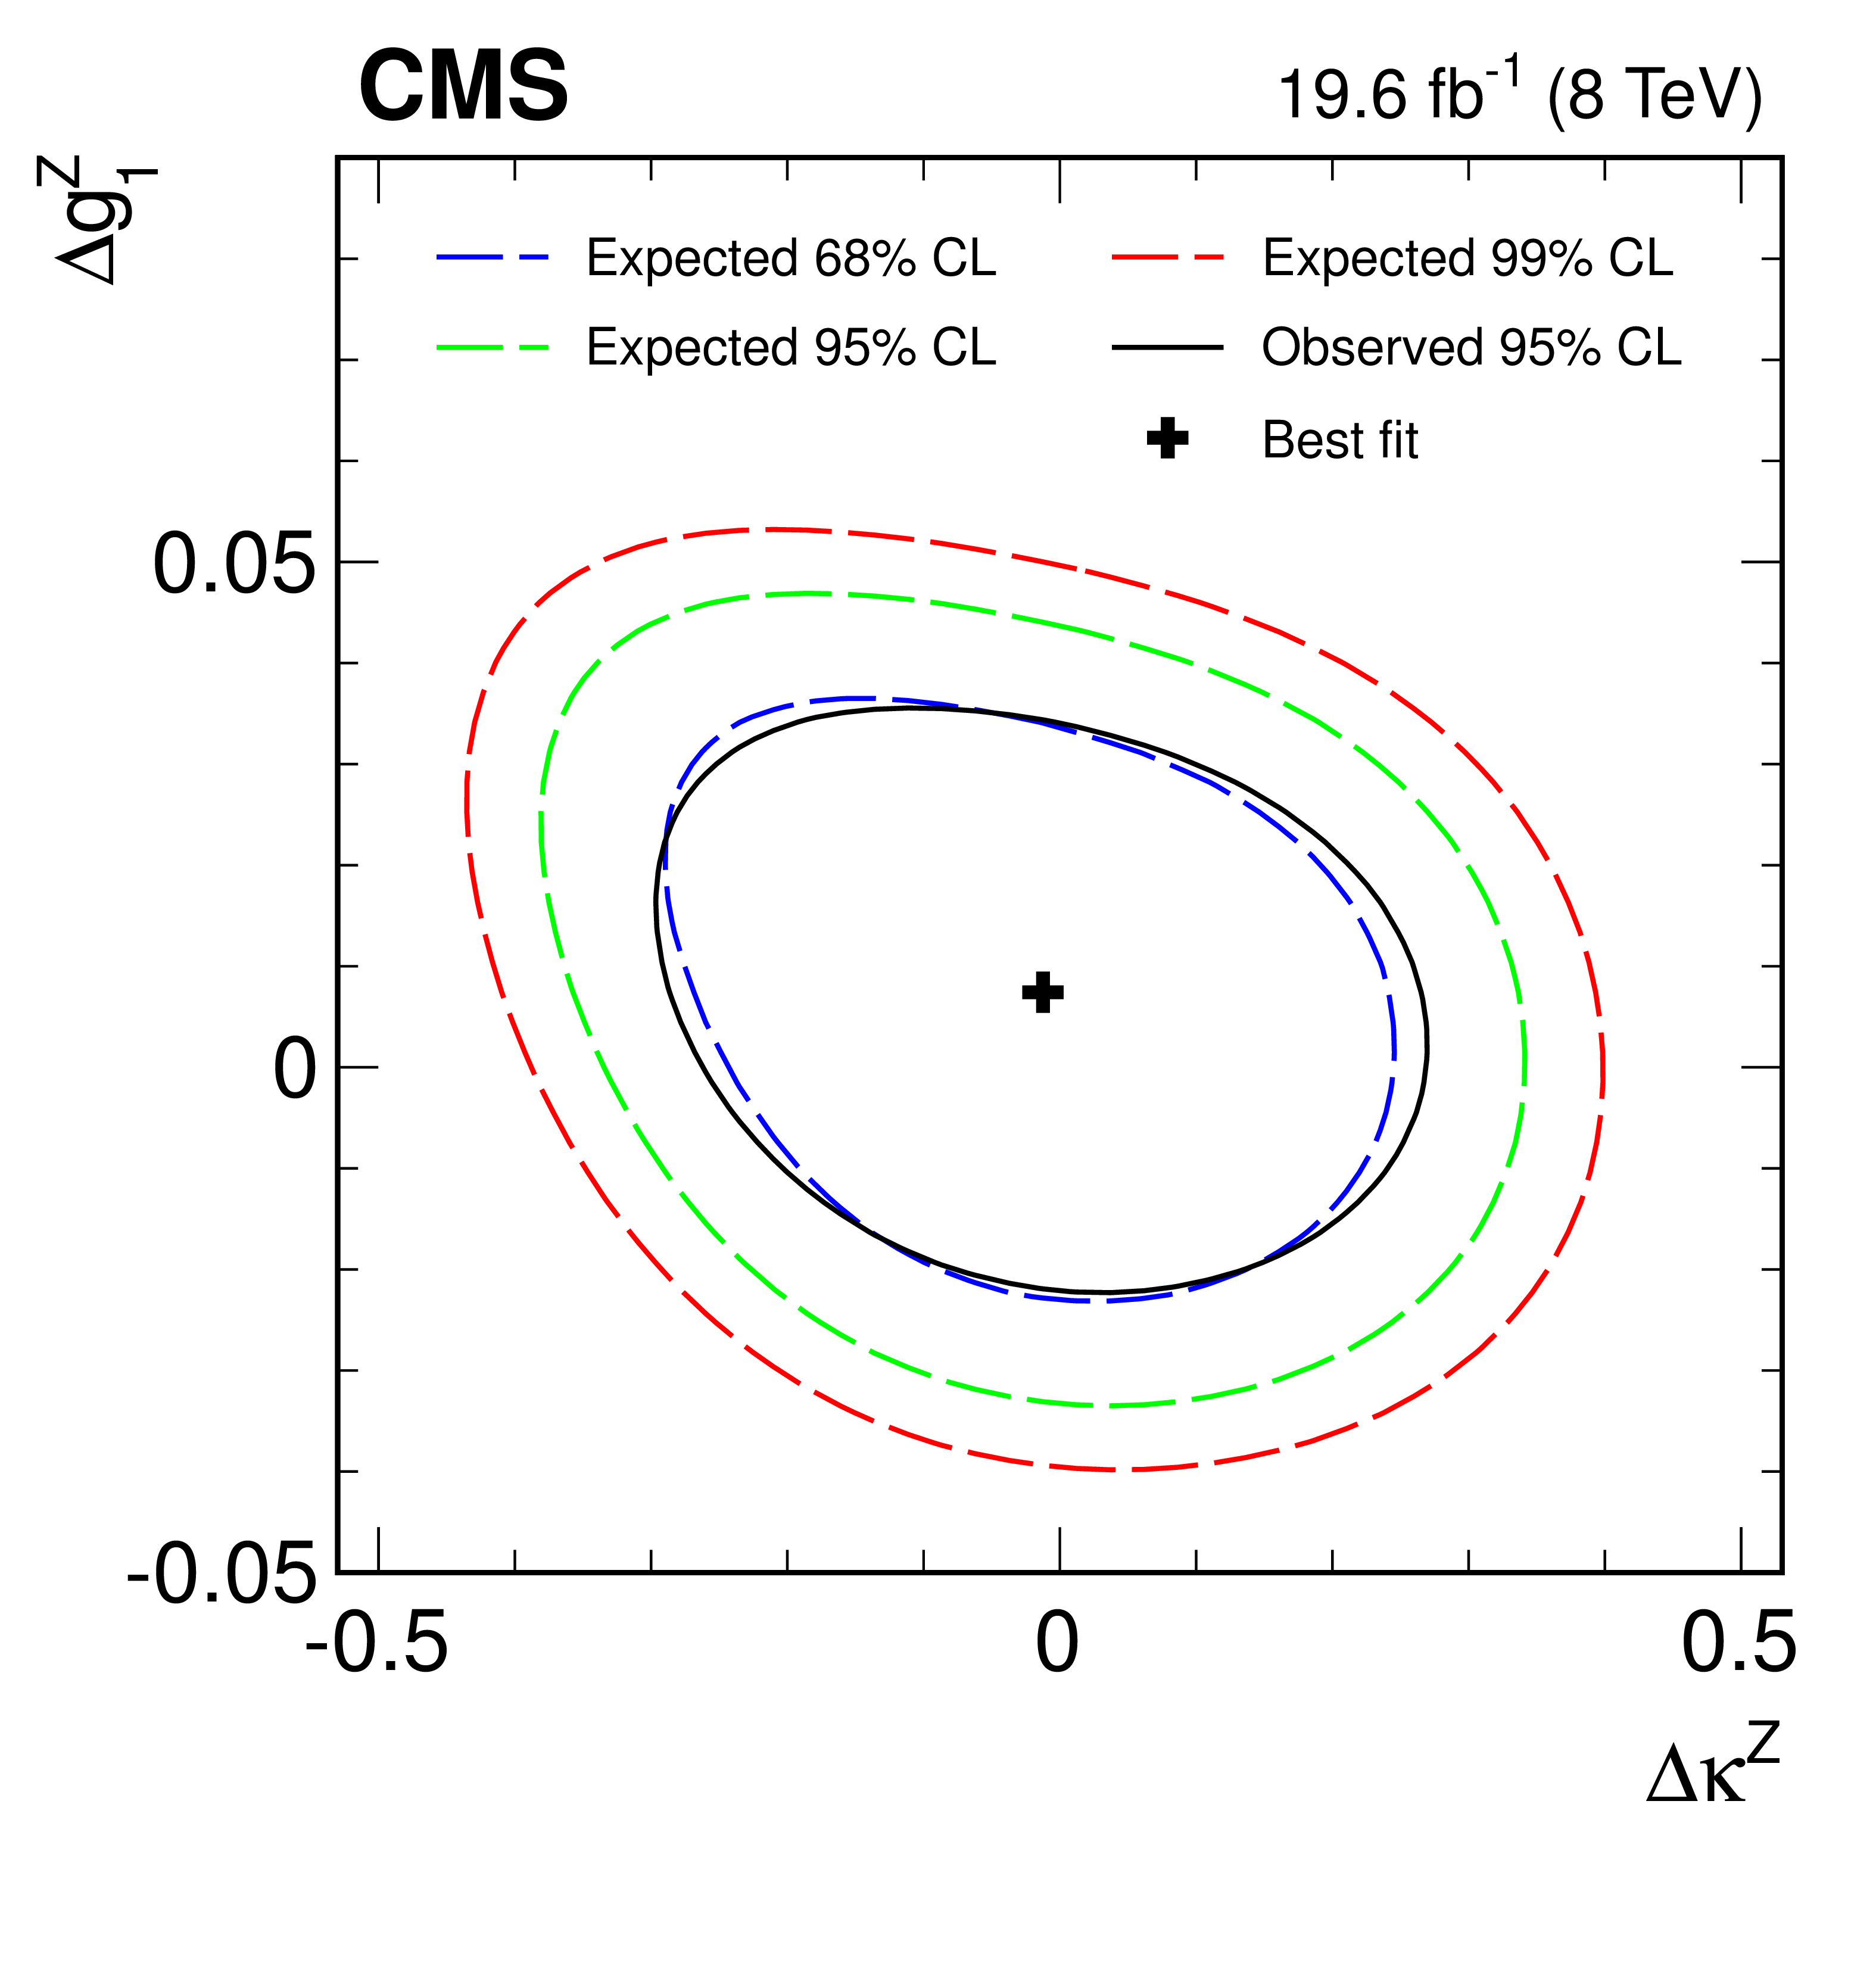
Figure 8:
Two-dimensional observed 95% CL limits and expected 68%, 95% and 99% CL limits on anomalous coupling parameters $\Delta \kappa ^{{\mathrm{ Z } } }$ and $\Delta g_{1}^{{\mathrm{ Z } } }$. |
png pdf |
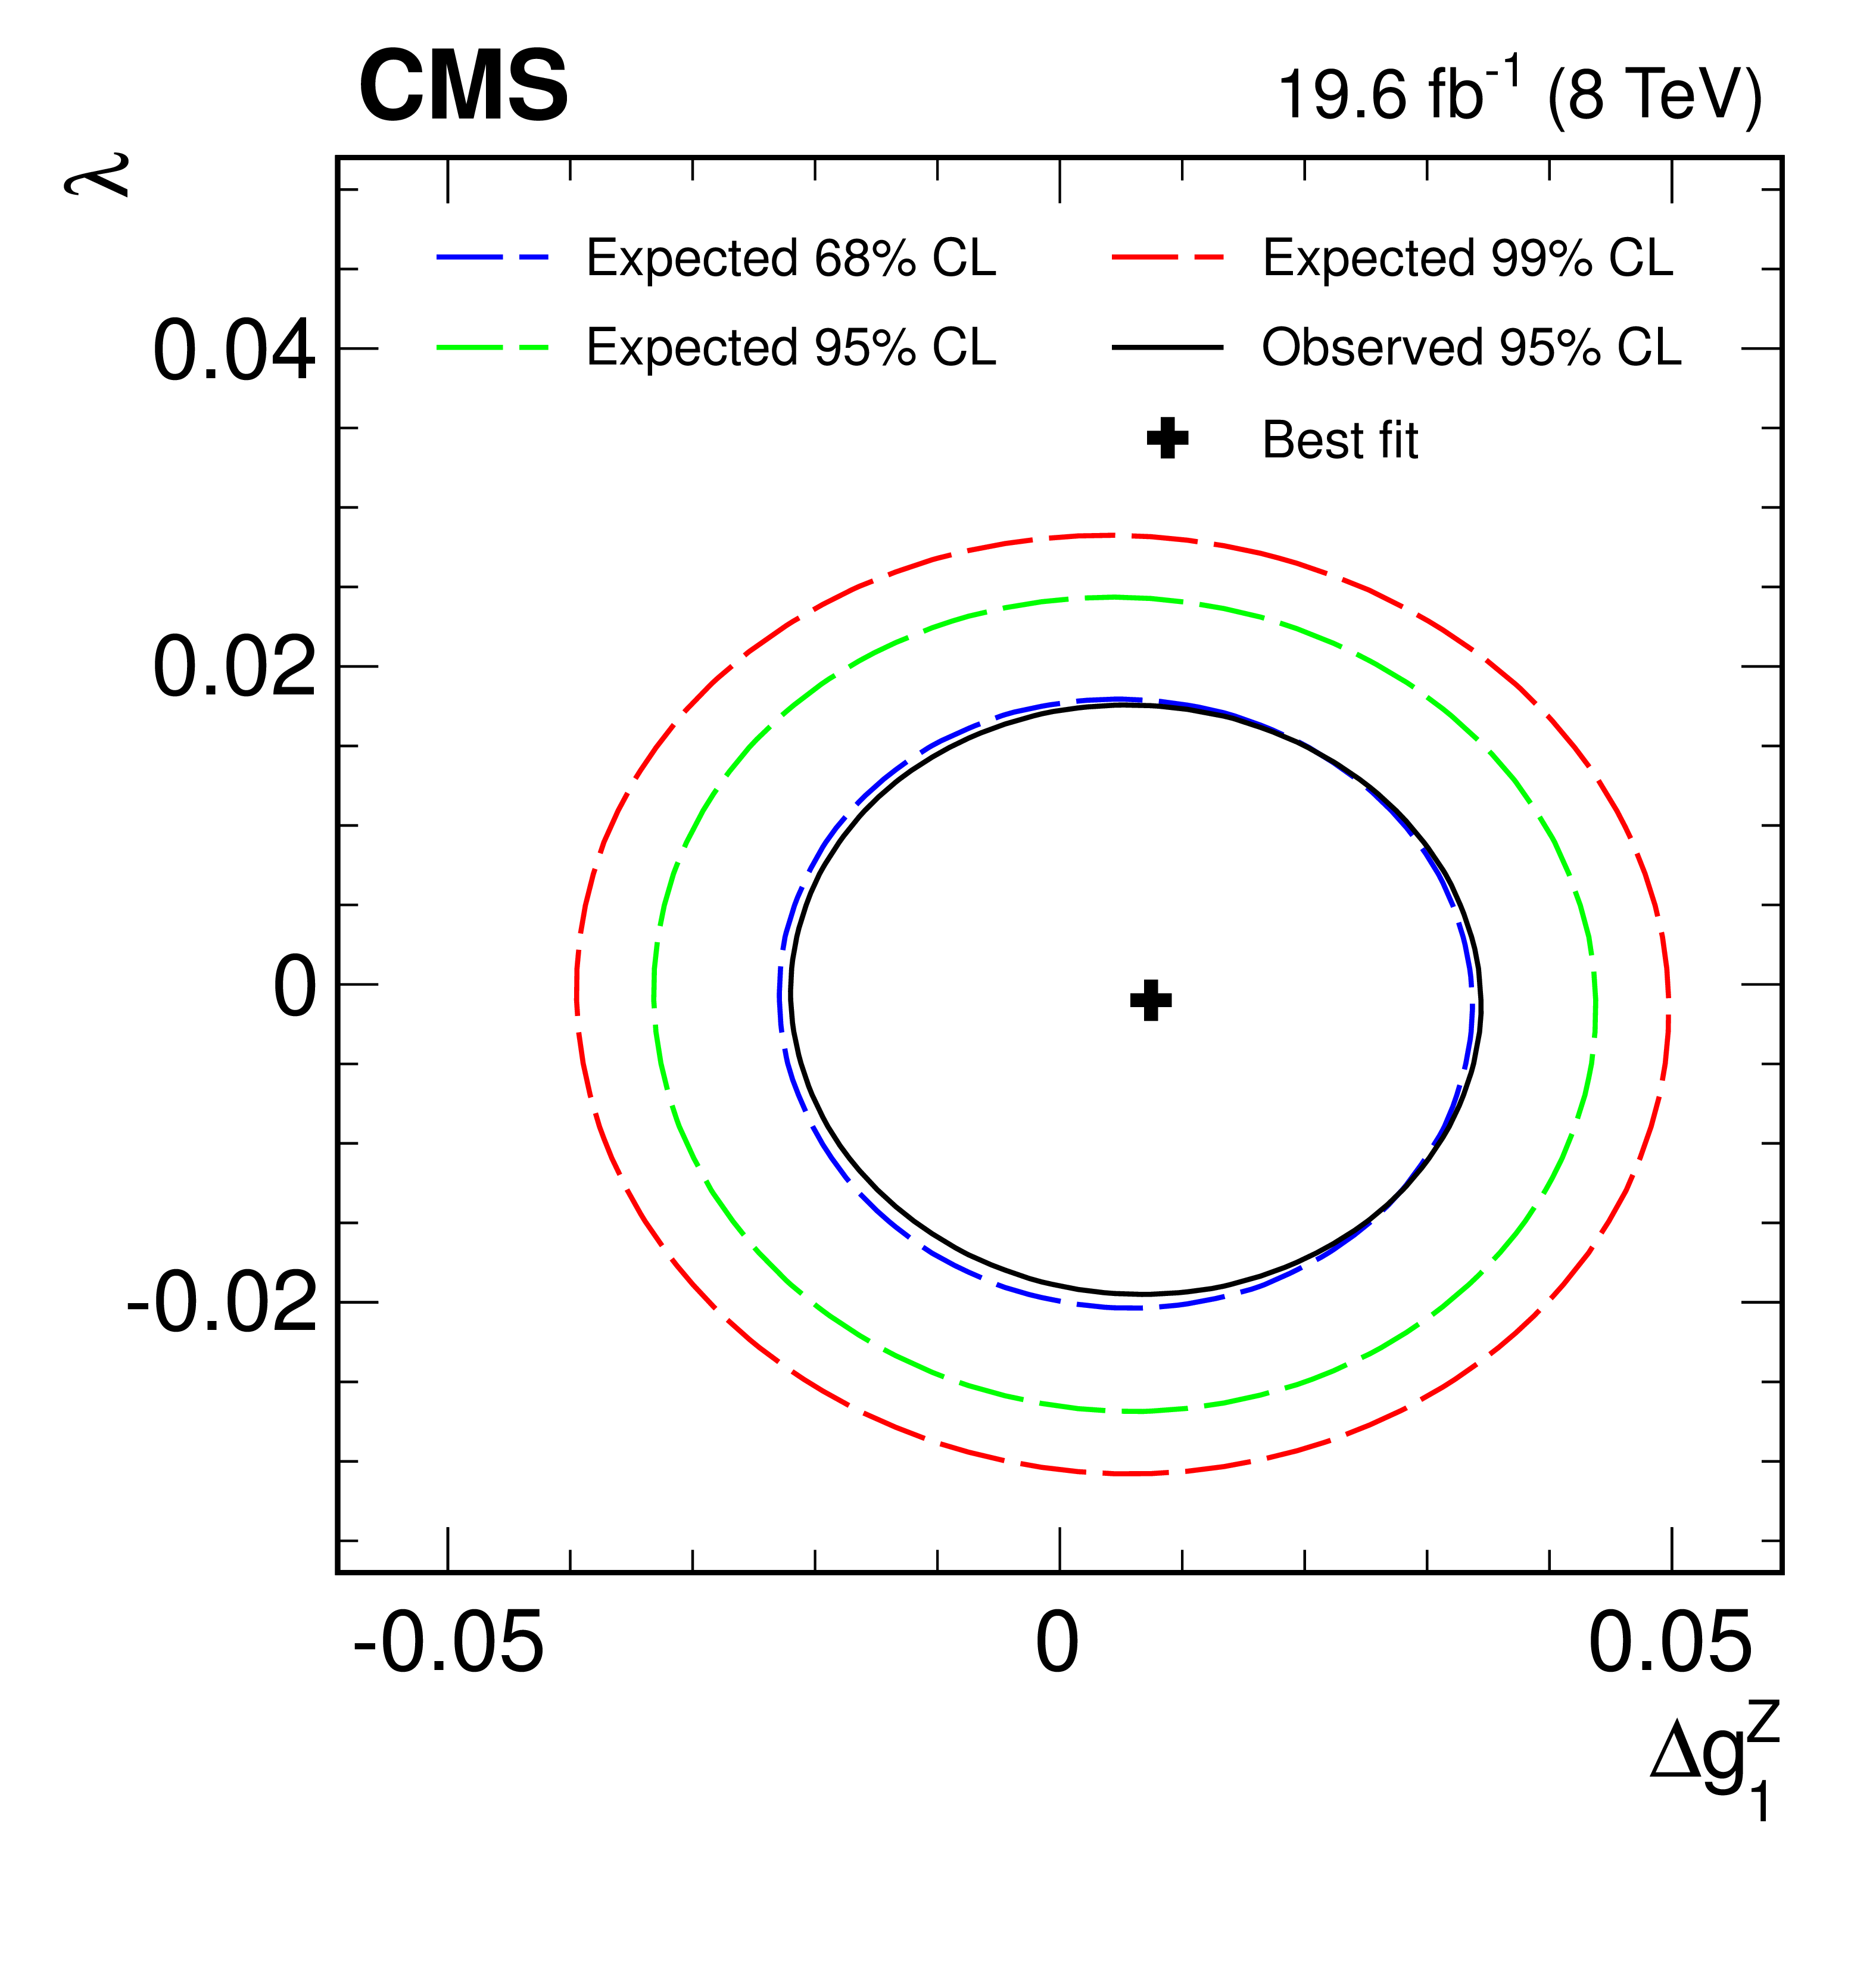
Figure 9:
Two-dimensional observed 95% CL limits and expected 68%, 95% and 99% CL limits on anomalous coupling parameters $\Delta g_{1}^{{\mathrm{ Z } } }$ and $\lambda ^{{\mathrm{ Z } } }$. |

png pdf |
Figure 10:
Two-dimensional observed 95% CL limits and expected 68%, 95% and 99% CL limits on anomalous coupling parameters $\Delta \kappa ^{{\mathrm{ Z } } }$ and $\lambda ^{{\mathrm{ Z } } }$. |
| Tables | |
png pdf |
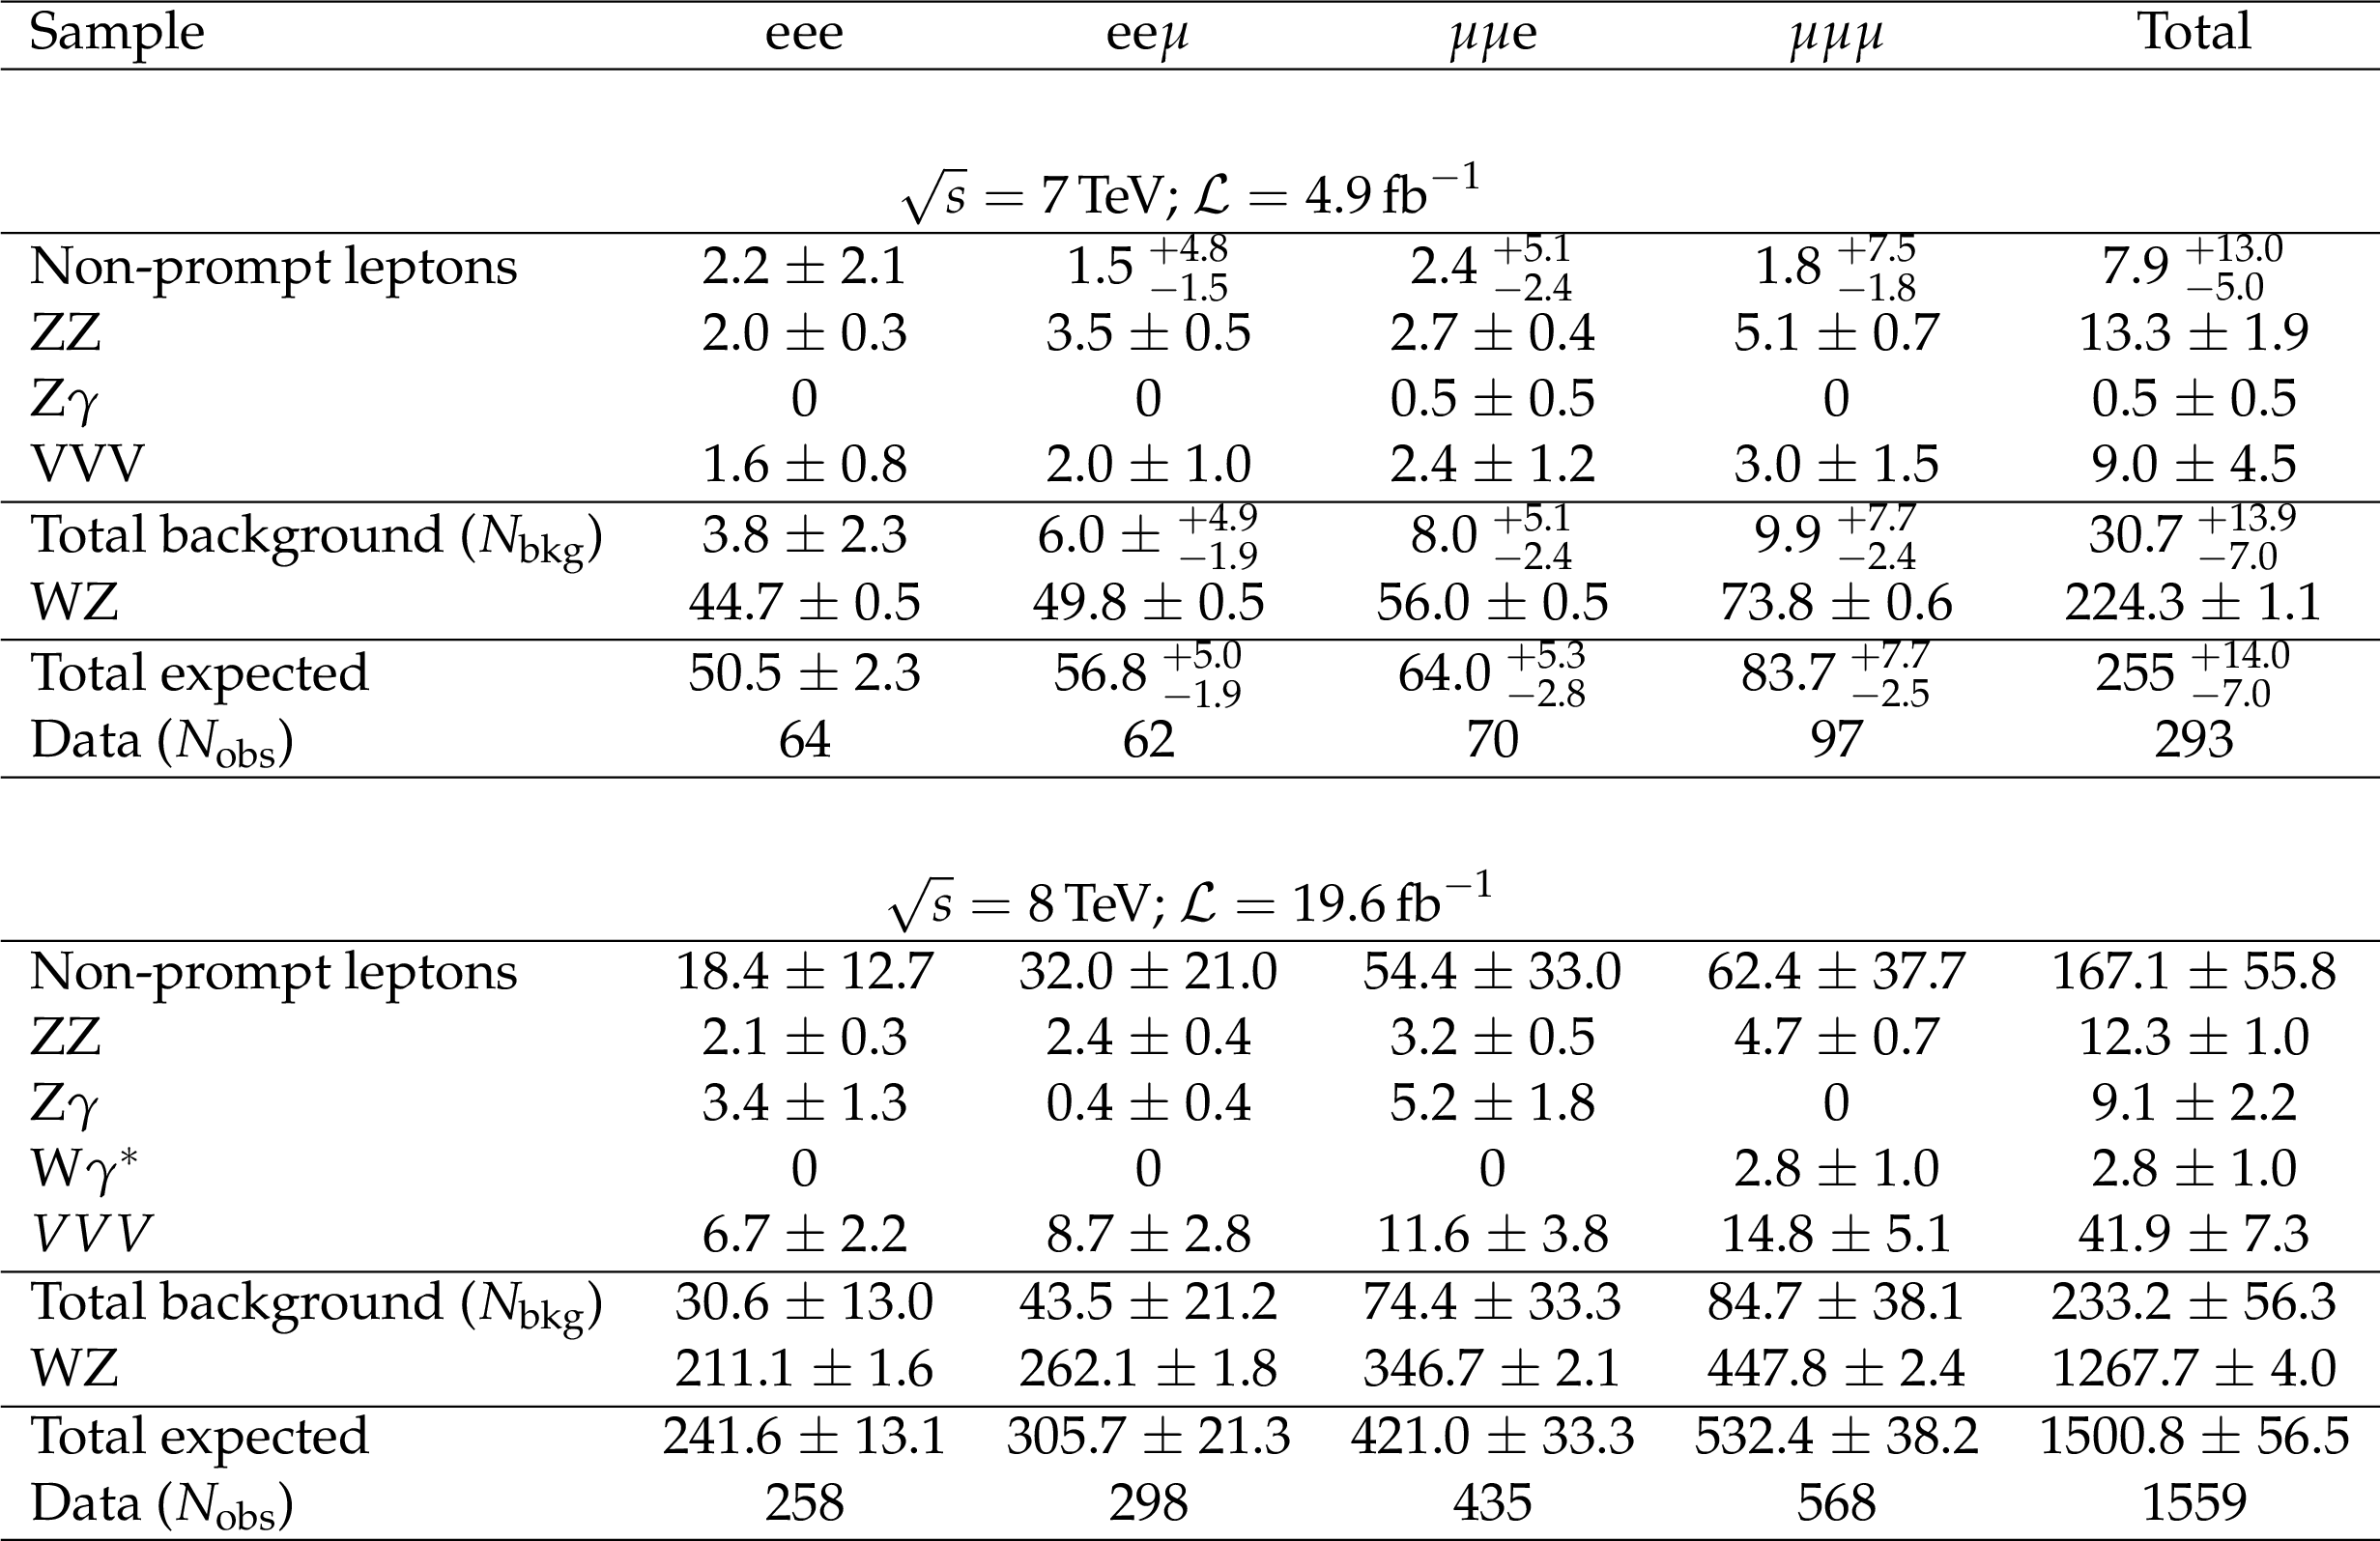
Table 1:
Expected and observed event yields at $\sqrt {s} = $ 7 and 8 TeV . The contributions from ${\mathrm{ t } {}\mathrm{ \bar{t} } } $, Z+jets, and other processes with non-prompt leptons have been determined from data control samples, as described in the text. Backgrounds with at least three bosons in the decay chain comprised of WZZ, ZZZ, WWZ, WWW, ${\mathrm{ t } {}\mathrm{ \bar{t} } } \mathrm{ W } $, ${\mathrm{ t } {}\mathrm{ \bar{t} } } {\mathrm{ Z } } $, ${\mathrm{ t } {}\mathrm{ \bar{t} } } \mathrm{ W } \mathrm{ W } $, ${\mathrm{ t } {}\mathrm{ \bar{t} } } \gamma $ and $\mathrm{ W } \mathrm{ W } \gamma $ events, are referred to as VVV. Combined statistical and systematic uncertainties are shown, except for the WZ signal where only statistical uncertainties are shown. |
png pdf |
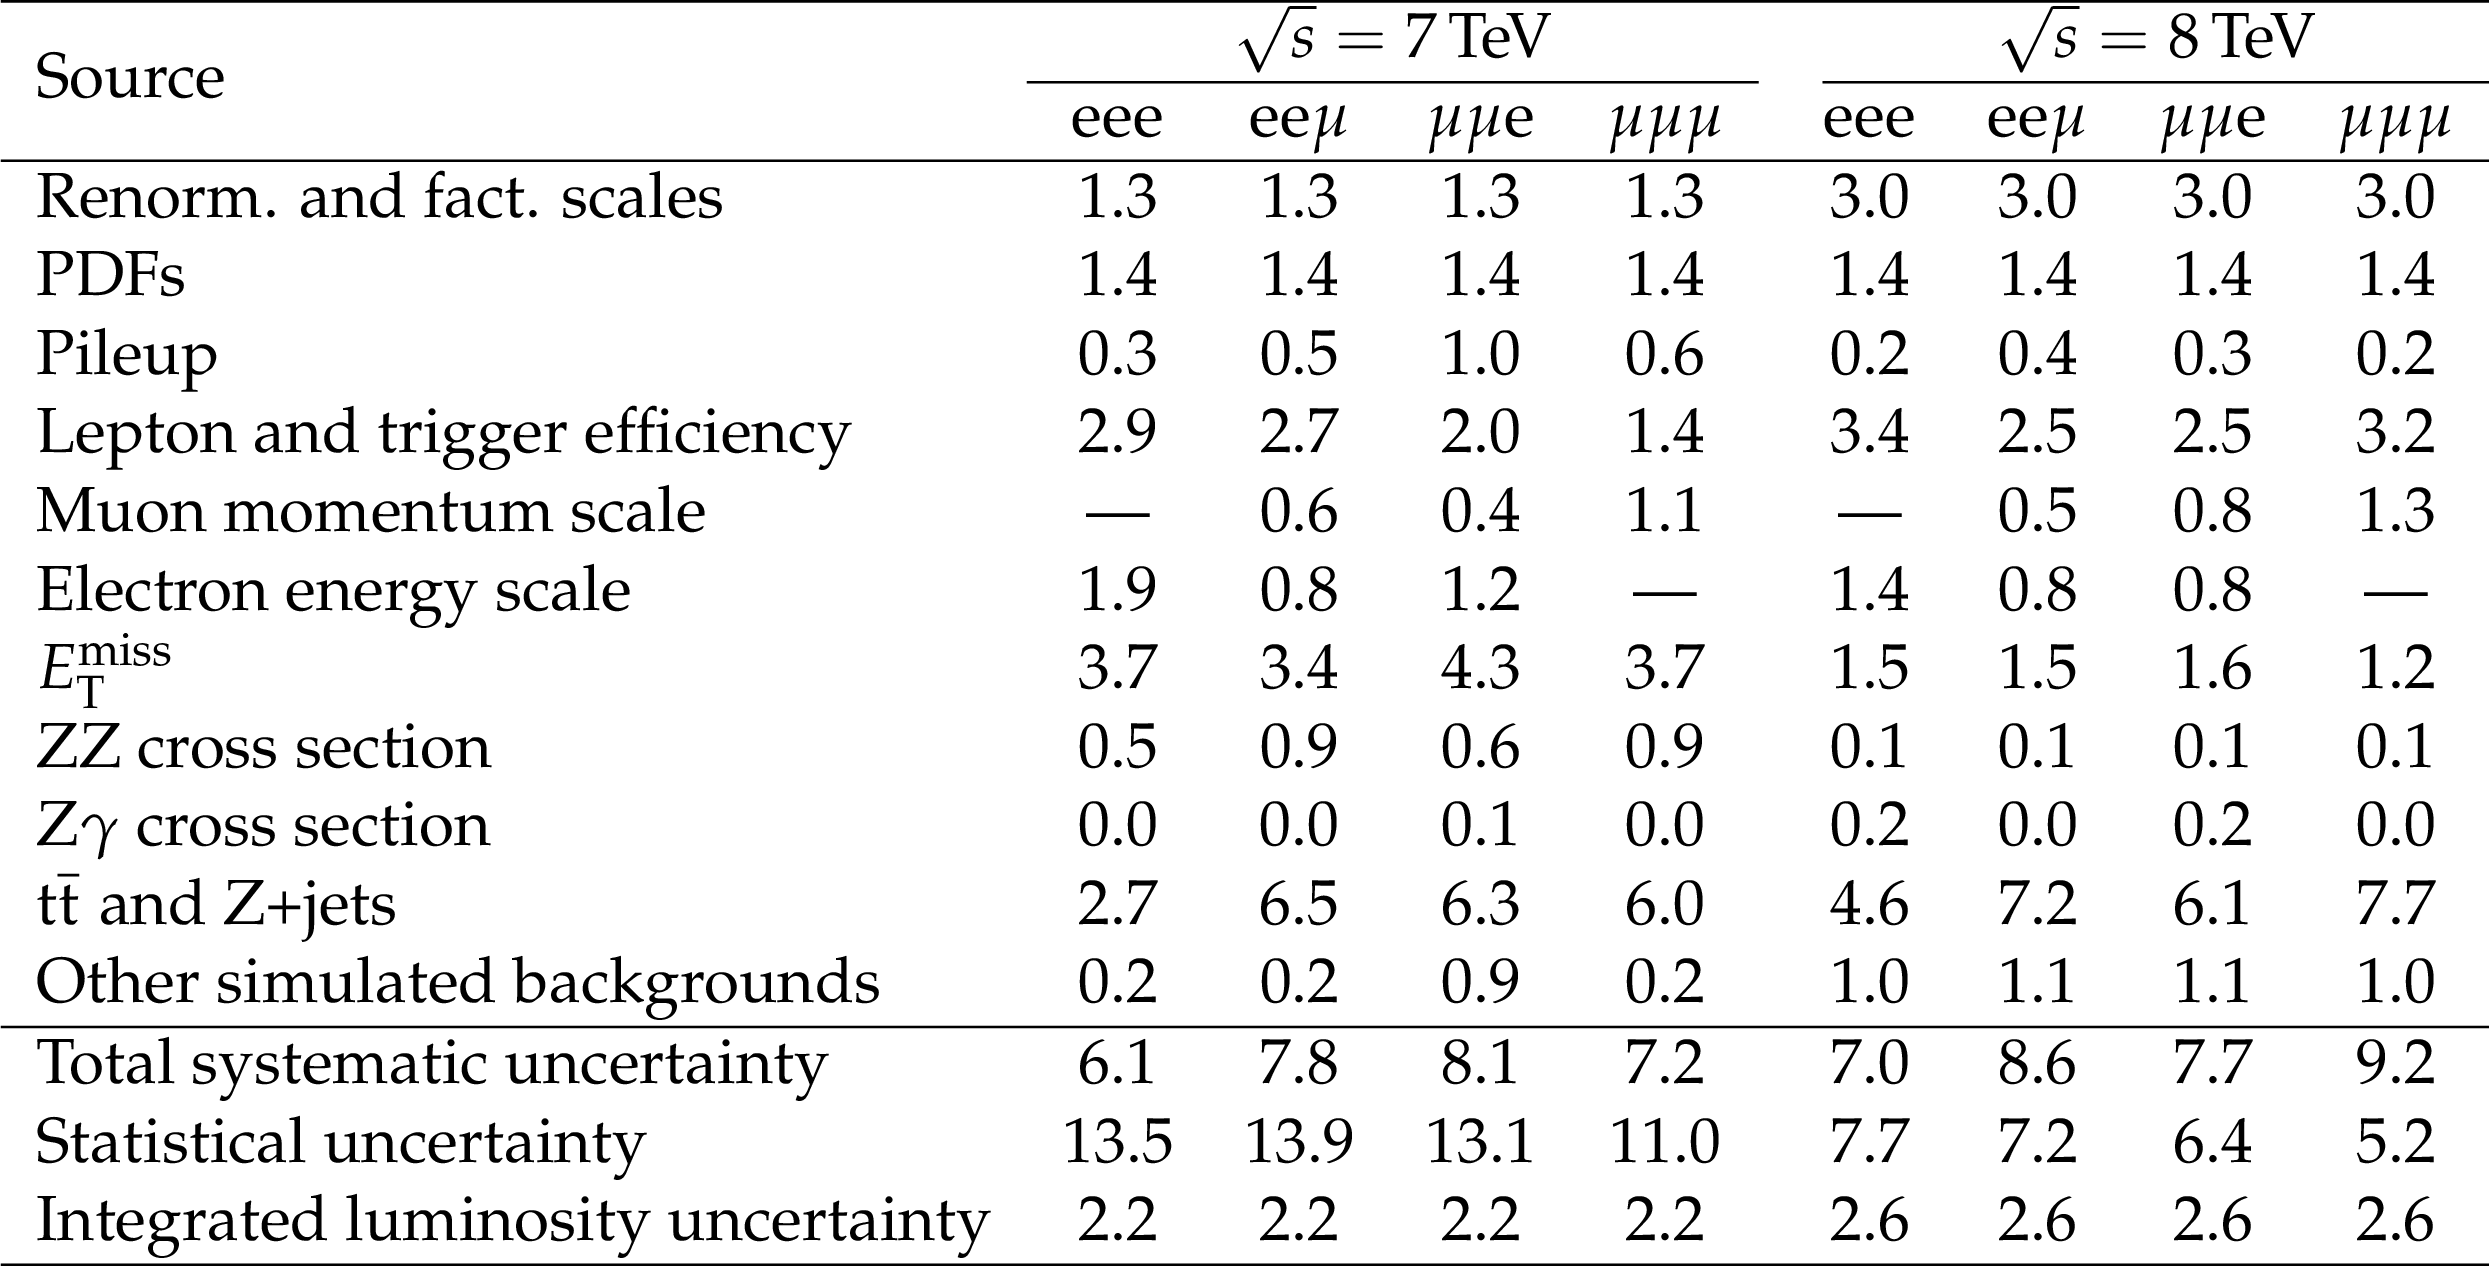
Table 2:
Summary of relative uncertainties, in units of percent, in the WZ cross section measurement at 7 and 8 TeV . |

png pdf |
Table 3:
Measured WZ cross section in the four leptonic channels at $\sqrt {s} = $ 7 and 8 TeV . |

png pdf |
Table 4:
Differential WZ cross section as a function of the Z transverse momentum at $ \sqrt{s} = $ 8 TeV for the four leptonic final states. The first uncertainty is statistical, the second is systematic, and the third is the integrated luminosity. |

png pdf |
Table 5:
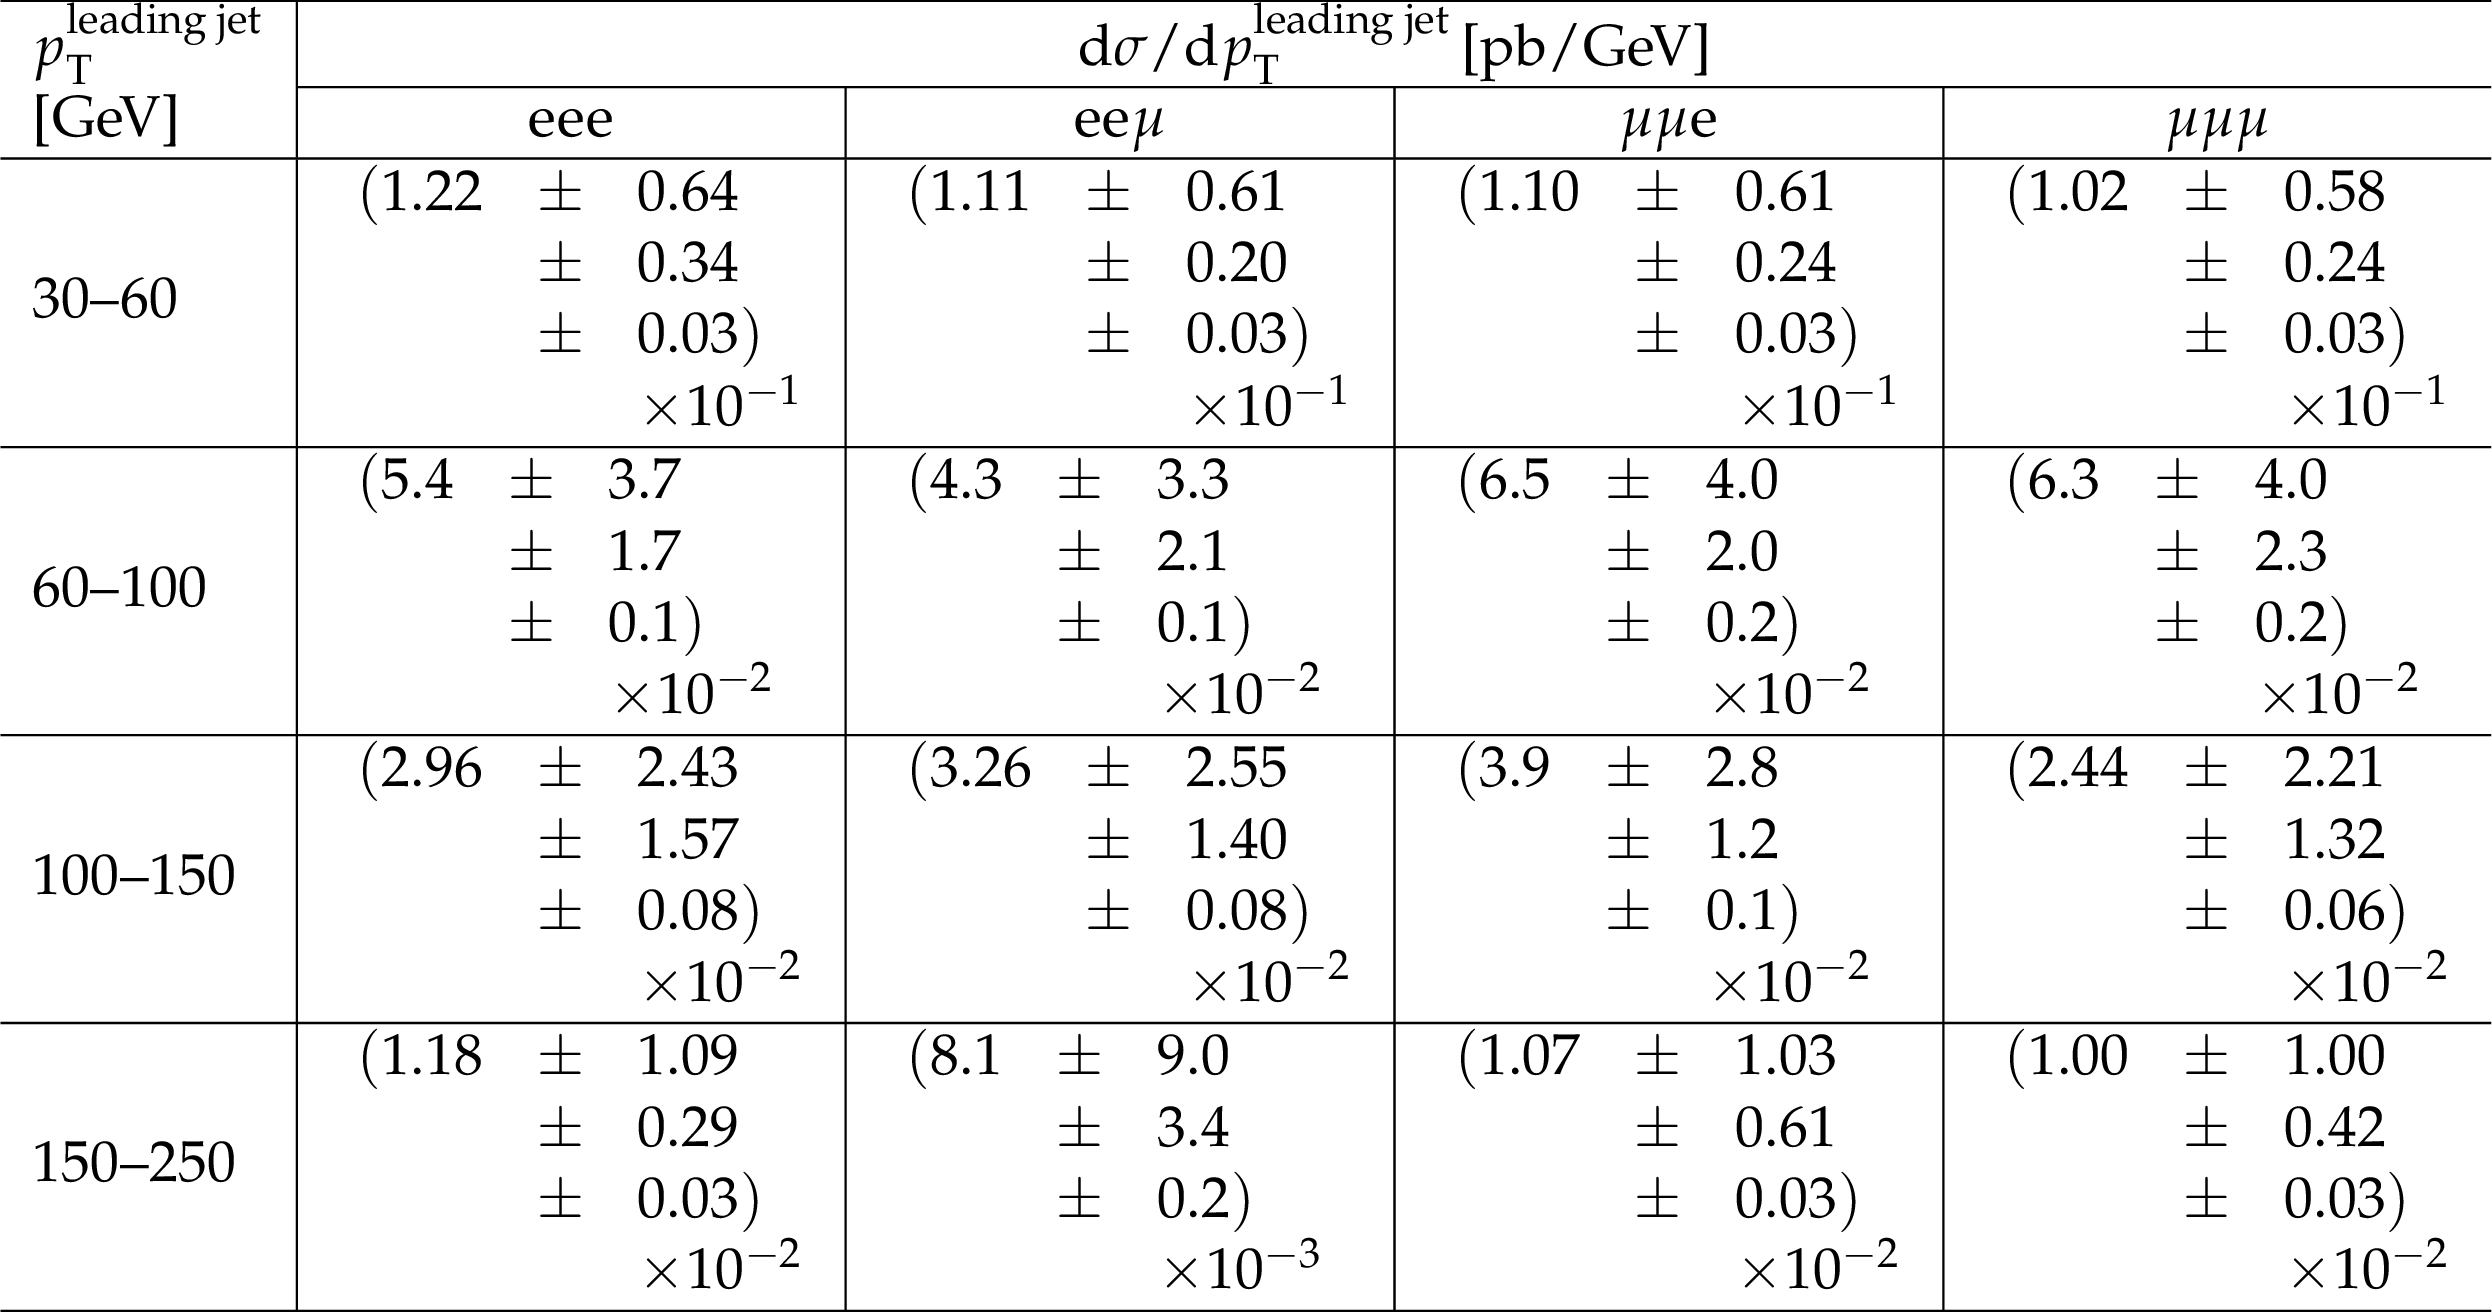
Differential WZ cross section as a function of the jet multiplicity at $ \sqrt{s} = $ 8 TeV for the four leptonic final states. Notations are as in Table 4. |
png pdf |
Table 6:
Differential WZ cross section as a function of the leading jet transverse momentum at $ \sqrt{s} = $ 8 TeV for the four leptonic final states. Notations are as in Table 4. |
png pdf |
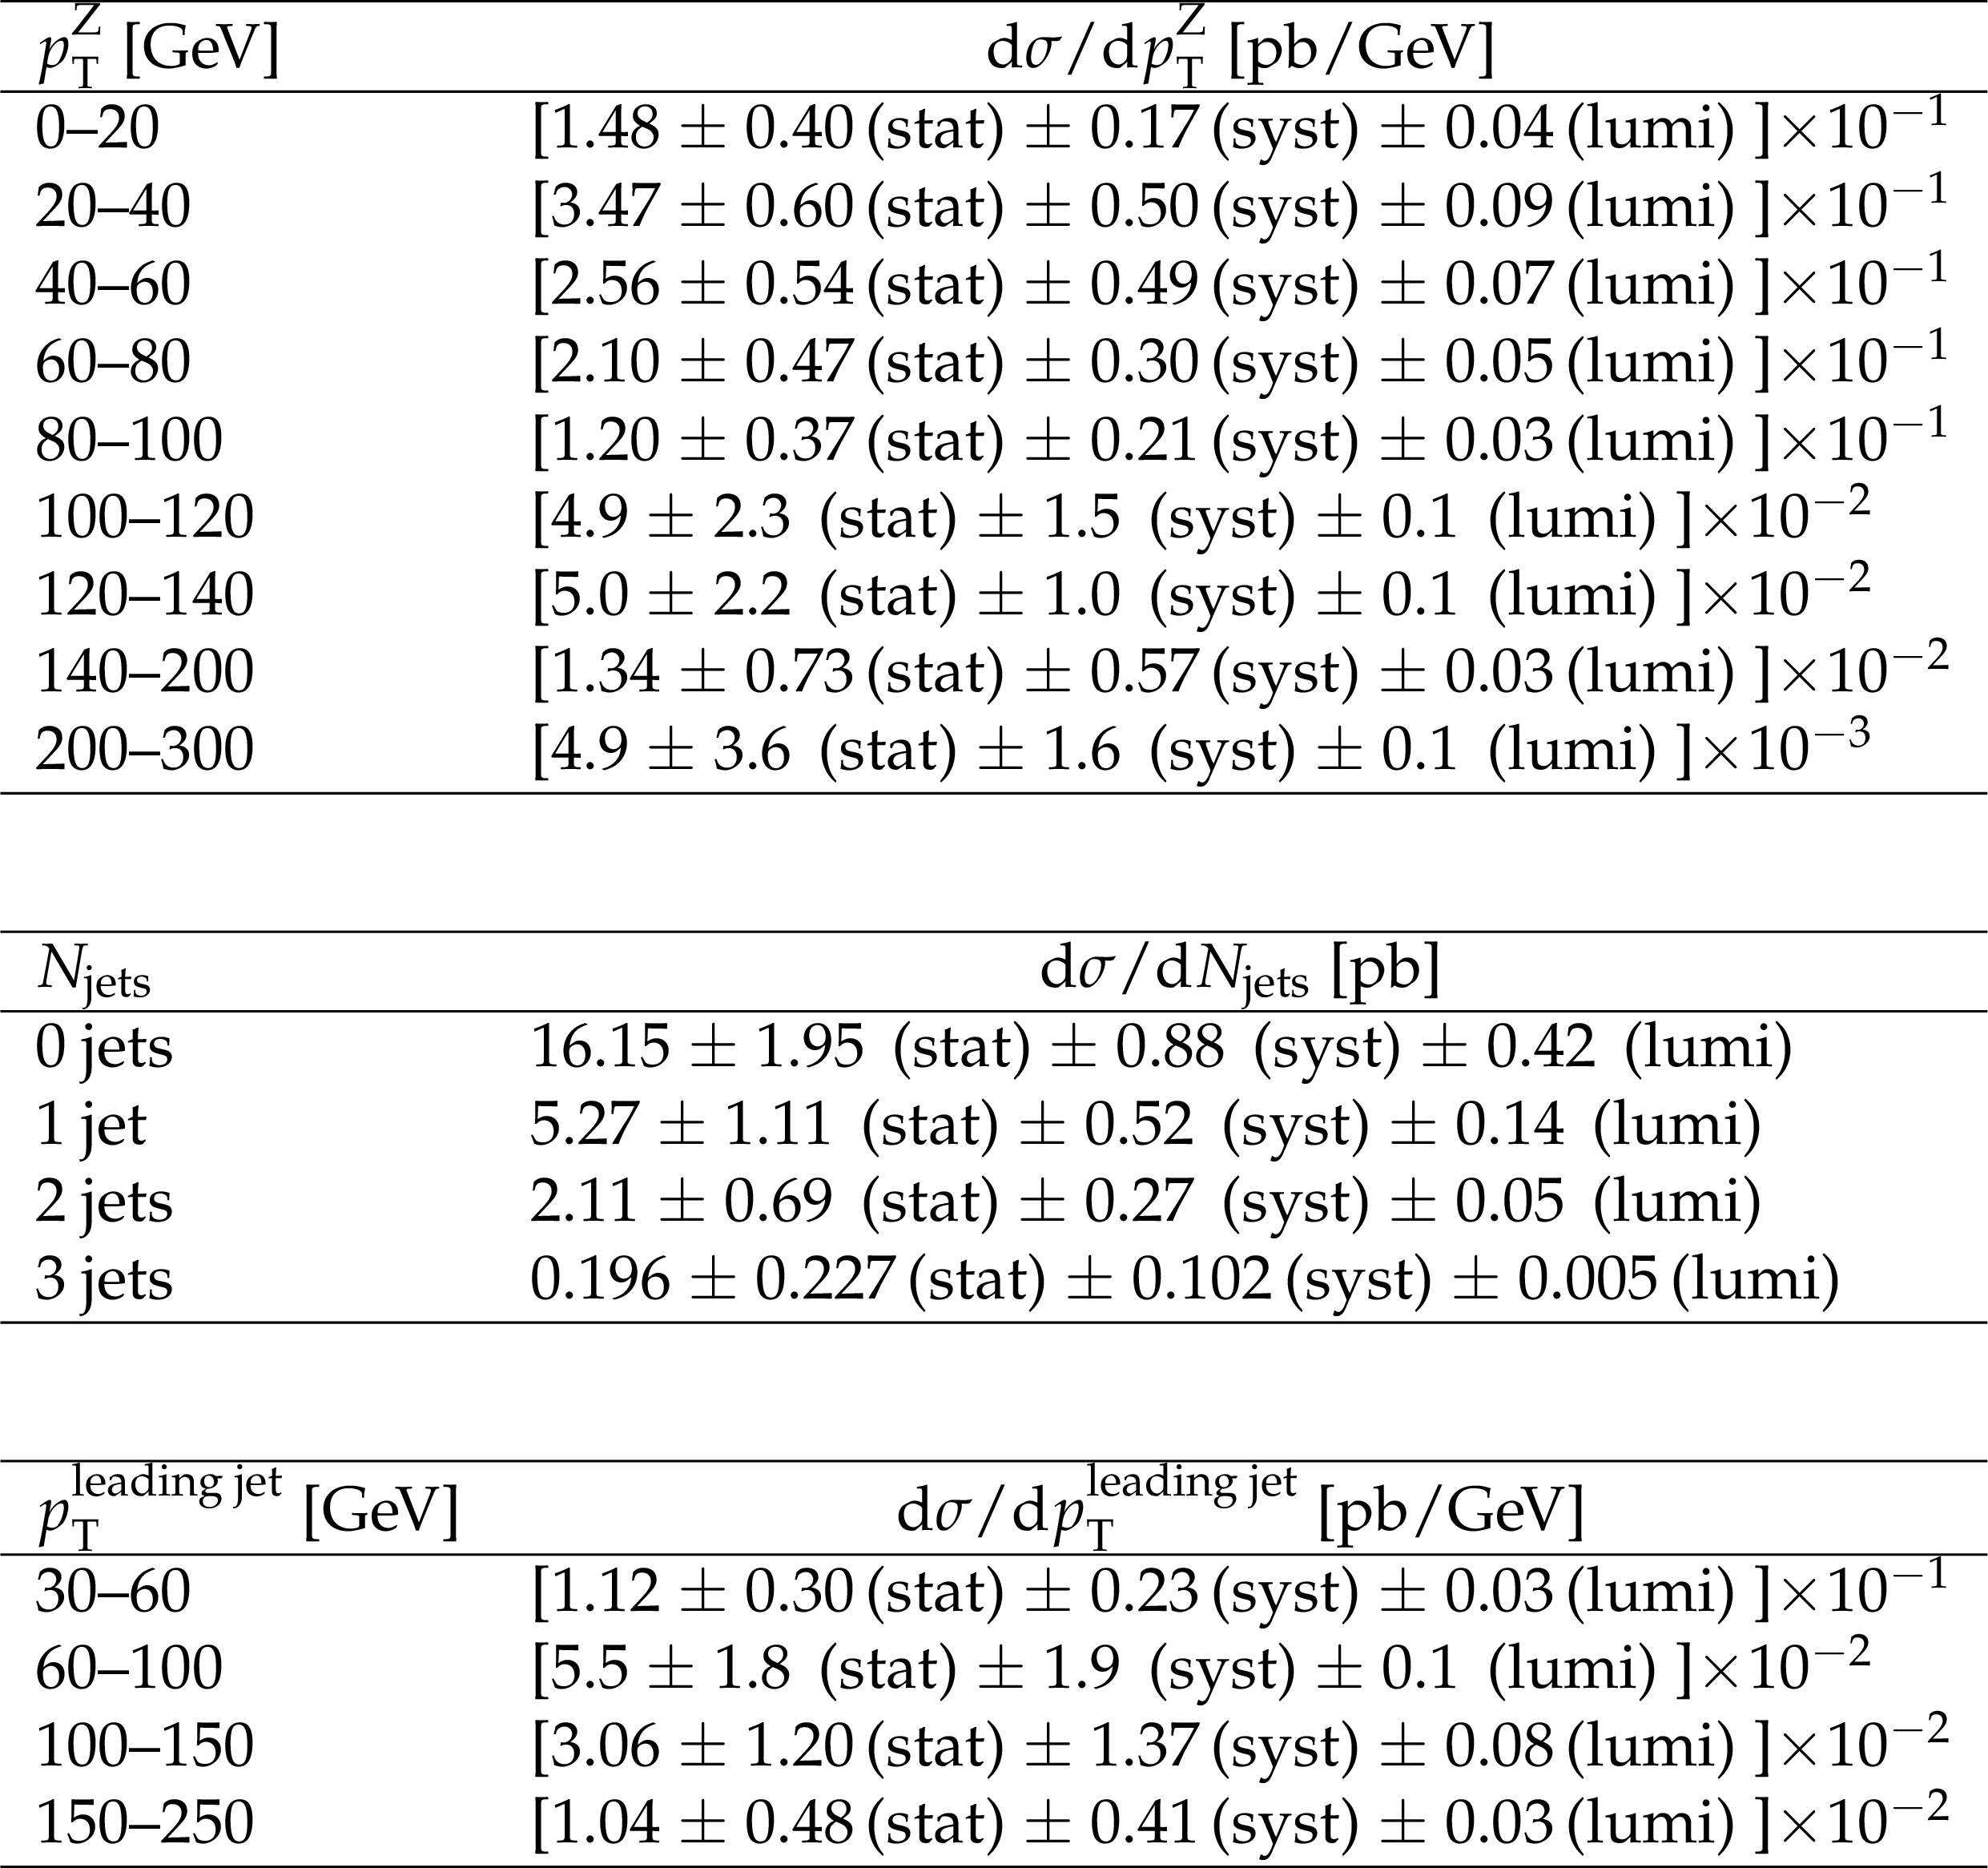
Table 7:
Combined result for the differential WZ cross sections at $ \sqrt{s} = $ 8 TeV. |

png pdf |
Table 8:
One-dimensional limits on the aTGC parameters at a 95% CL for $\mathrm{ W } {\mathrm{ Z } } \to \ell \nu \ell '\ell '$. |
png pdf |
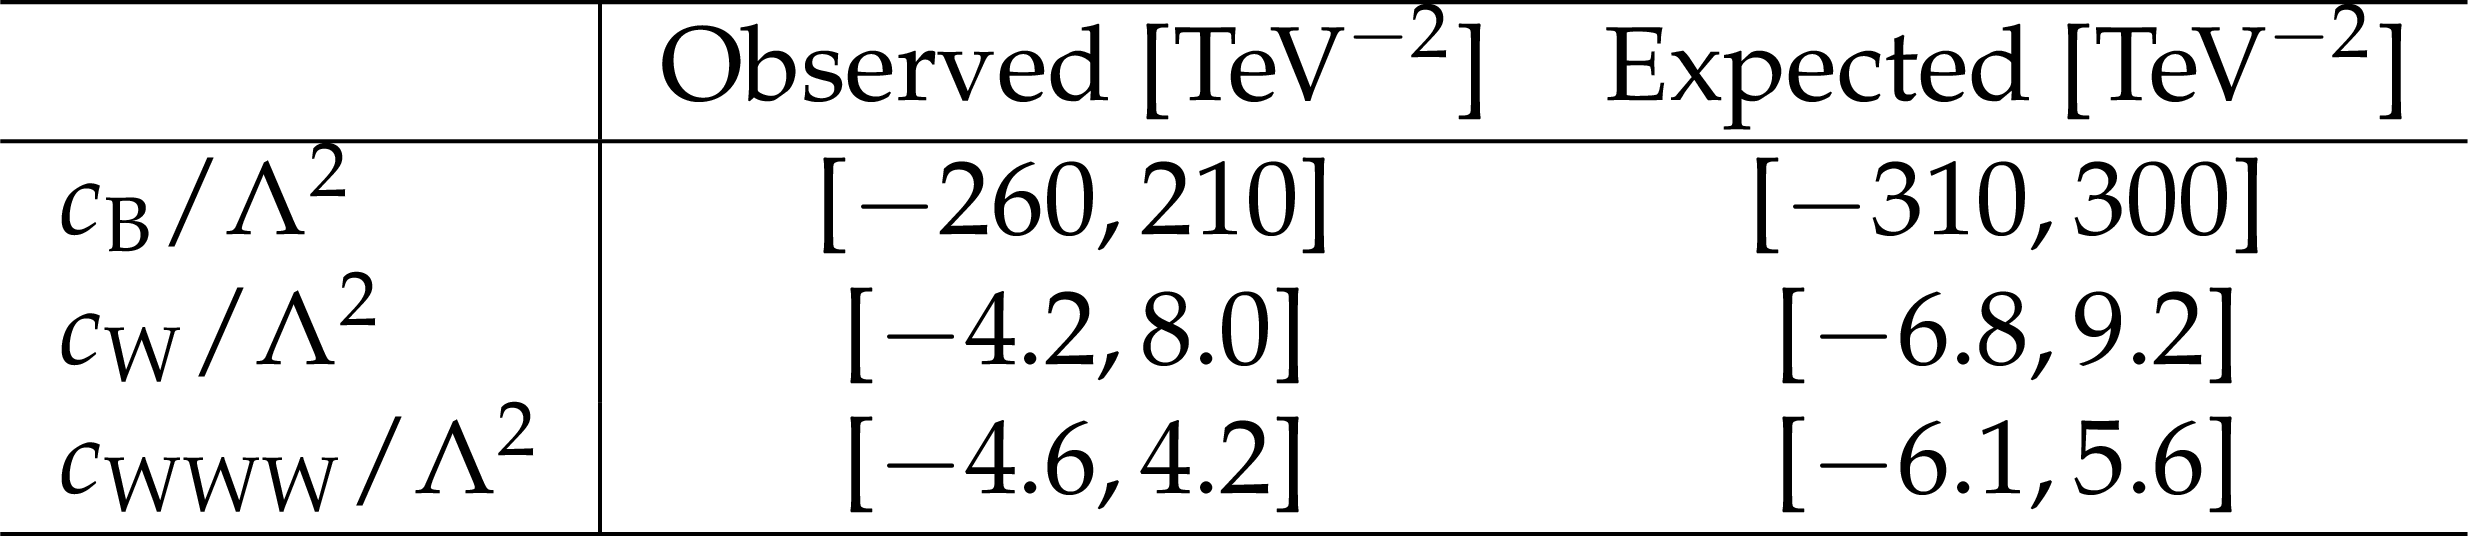
Table 9:
One-dimensional limits on the EFT parameters at a 95% CL for ${\mathrm{ W } {\mathrm{ Z } } }\to \ell \nu \ell '\ell '$. |

png pdf |
Table 10:
Lowest incoming partons energy for which observed limits on the coefficients would lead to unitarity violation. |
| Summary |
| This paper reports measurements of the WZ inclusive cross section in proton-proton collisions at $\sqrt{s} = $ 7 and 8 TeV in the fully-leptonic WZ decay modes with electrons and muons in the final state. The data samples correspond to integrated luminosities of 4.9 fb$^{-1}$ for the 7 TeV measurement and 19.6 fb$^{-1}$ for the 8 TeV measurement. The measured production cross sections for 71 $ < m_{\mathrm{ Z }} < $ 111 GeV are $\sigma(\mathrm{ p }\mathrm{ p }\to\mathrm{ W }\mathrm{ Z };\ \sqrt{s} = 7\, \mathrm{TeV}) =$ 20.14 $\pm$ 1.32 (stat) $\pm$ 1.13 (syst) $\pm$ 0.44 (lumi) pb and $\sigma(\mathrm{ p }\mathrm{ p }\to\mathrm{ W }\mathrm{ Z };\ \sqrt{s} = 8\, \mathrm{TeV}) =$ 24.09 $\pm$ 0.87 (stat) $\pm$ 1.62 (syst) $\pm$ 0.63 (lumi) pb. These results are consistent with standard model predictions. Using the data collected at $ \sqrt{s} = $ 8 TeV, results on differential cross sections are also presented, and a search for anomalous WWZ couplings has been performed. The following one-dimensional limits at 95% CL are obtained: $-0.21 < \Delta\kappa^{\mathrm{ Z }} < 0.25$, $-0.018 < \Delta g_{1}^{\mathrm{ Z }} < 0.035$, and $-0.018 < \lambda^{\mathrm{ Z }} < 0.016$. |
| Additional Tables | |

png pdf |
Additional Table 1:
Expected and observed event yields at $ \sqrt{s} = $ 8 TeV as a function of the number of observed jets. The contributions from ${\mathrm{ t } {}\mathrm{ \bar{t} } } $, Z+jets, and other processes with nonprompt leptons have been determined from data control samples, as described in the publication. Backgrounds with at least three bosons in the decay chain comprised of WZZ, ZZZ, WWZ, WWW, ${\mathrm{ t } {}\mathrm{ \bar{t} } }$W, ${\mathrm{ t } {}\mathrm{ \bar{t} } } $Z, ${\mathrm{ t } {}\mathrm{ \bar{t} } } $WW, ${\mathrm{ t } {}\mathrm{ \bar{t} } } \gamma $ and WW$\gamma $ events, are referred to as VVV. Combined statistical and systematic uncertainties are shown, except for the WZ signal where only statistical uncertainties are shown. |
| References | ||||
| 1 | D0 Collaboration | A measurement of the WZ and ZZ production cross sections using leptonic final states in 8.6 fb$ ^{-1} $ of $ p\bar{p} $ collisions | PRD 85 (2012) 112005 | 1201.5652 |
| 2 | CDF Collaboration | Measurement of the WZ cross section and triple gauge couplings in $ p\bar{p} $ collisions at $ \sqrt{s} = $ 1.96 TeV | PRD 86 (2012) 031104 | 1202.6629 |
| 3 | ATLAS Collaboration | Measurement of $ WZ $ production in proton-proton collisions at $ \sqrt{s}=$ 7 TeV with the ATLAS detector | EPJC 72 (2012) 2173 | 1208.1390 |
| 4 | ATLAS Collaboration | Measurements of $ W^\pm Z $ production cross sections in $ pp $ collisions at $ \sqrt{s}=$ 8 TeV with the ATLAS detector and limits on anomalous gauge boson self-couplings | PRD 93 (2016) 092004 | 1603.02151 |
| 5 | ATLAS Collaboration | Measurement of the $ \rm{W}^{\pm}\rm{Z} $-boson production cross sections in pp collisions at $ \sqrt{s}= $ 13 TeV with the ATLAS detector | PLB 759 (2016) 601 | 1606.04017 |
| 6 | CMS Collaboration | Measurement of the WZ production cross section in pp collisions at $ \sqrt{s}= $ 13 TeV | Submitted to PLB | CMS-SMP-16-002 1607.06943 |
| 7 | ATLAS Collaboration | Measurement of the WW+WZ cross section and limits on anomalous triple gauge couplings using final states with one lepton, missing transverse momentum, and two jets with the ATLAS detector at $ \sqrt{\rm{s}} = 7 $ TeV | JHEP 01 (2015) 049 | 1410.7238 |
| 8 | CMS Collaboration | Measurement of the sum of WW and WZ production with W+dijet events in pp collisions at $ \sqrt{s}= $ 7 TeV | EPJC 73 (2013) 2283 | |
| 9 | Particle Data Group, K. A. Olive et al. | Review of Particle Physics | CPC 38 (2014) 090001 | |
| 10 | CMS Collaboration | The CMS experiment at the CERN LHC | JINST 3 (2008) S08004 | CMS-00-001 |
| 11 | S. Alioli, P. Nason, C. Oleari, and E. Re | NLO vector-boson production matched with shower in POWHEG | JHEP 07 (2008) 060 | 0805.4802 |
| 12 | P. Nason | A new method for combining NLO QCD with shower Monte Carlo algorithms | JHEP 11 (2004) 040 | hep-ph/0409146 |
| 13 | S. Frixione, P. Nason, and C. Oleari | Matching NLO QCD computations with parton shower simulations: the POWHEG method | JHEP 11 (2007) 070 | 0709.2092 |
| 14 | T. Binoth, N. Kauer, and P. Mertsch | Gluon-induced QCD corrections to pp $ \to $ ZZ $ \to \ell\bar{\ell}\ell'\bar{\ell'} $ | in Proceedings, 16th International Workshop on Deep Inelastic Scattering and Related Subjects (DIS 2008) | 0807.0024 |
| 15 | J. Alwall et al. | MadGraph 5: going beyond | JHEP 06 (2011) 128 | 1106.0522 |
| 16 | J. M. Campbell and R. K. Ellis | MCFM for the Tevatron and the LHC | NPPS 205-206 (2010) 10 | 1007.3492 |
| 17 | T. Sjostrand, S. Mrenna, and P. Z. Skands | PYTHIA 6.4 physics and manual | JHEP 05 (2006) 026 | hep-ph/0603175 |
| 18 | R. Field | Early LHC Underlying Event Data -- Findings and Surprises | in Hadron collider physics. Proceedings, 22nd Conference, HCP 2010, Toronto, Canada, August 23-27, 2010 2010 | 1010.3558 |
| 19 | H.-L. Lai et al. | Uncertainty induced by QCD coupling in the CTEQ global analysis of parton distributions | PRD 82 (2010) 054021 | 1004.4624 |
| 20 | H.-L. Lai et al. | New parton distributions for collider physics | PRD 82 (2010) 074024 | 1007.2241 |
| 21 | GEANT4 Collaboration | GEANT4 --- a simulation toolkit | NIMA 506 (2003) 250 | |
| 22 | CMS Collaboration | Measurement of Higgs boson production and properties in the WW decay channel with leptonic final states | JHEP 01 (2014) 096 | CMS-HIG-13-023 1312.1129 |
| 23 | CMS Collaboration | Performance of electron reconstruction and selection with the CMS detector in proton-proton collisions at $ \sqrt{s}= $ 8 TeV | JINST 10 (2015) P06005 | |
| 24 | CMS Collaboration | Performance of CMS muon reconstruction in pp collision events at $ \sqrt{s} = $ 7 TeV | JINST 7 (2012) P10002 | CMS-MUO-10-004 1206.4071 |
| 25 | M. Cacciari and G. P. Salam | Pileup subtraction using jet areas | PLB 659 (2008) 119 | 0707.1378 |
| 26 | CMS Collaboration | Measurements of inclusive W and Z cross sections in pp collisions at $ \sqrt{s} $ = 7 TeV | JHEP 01 (2011) 080 | |
| 27 | M. Cacciari, G. P. Salam, and G. Soyez | The anti-$ k_t $ jet clustering algorithm | JHEP 04 (2008) 063 | 0802.1189 |
| 28 | M. Cacciari, G. P. Salam, and G. Soyez | FastJet user manual | EPJC 72 (2012) 1896 | 1111.6097 |
| 29 | CMS Collaboration | Particle--Flow Event Reconstruction in CMS and Performance for Jets, Taus, and $ \vec{E}_{\rm T}^{\rm miss} $ | CDS | |
| 30 | CMS Collaboration | Commissioning of the Particle-flow Event Reconstruction with the first LHC collisions recorded in the CMS detector | CDS | |
| 31 | CMS Collaboration | Determination of jet energy calibration and transverse momentum resolution in CMS | JINST 6 (2011) P11002 | CMS-JME-10-011 1107.4277 |
| 32 | CMS Collaboration | Measurement of WW production and search for the Higgs boson in pp collisions at $ \sqrt{s} = $ 7 TeV | PLB 699 (2011) 25 | CMS-EWK-10-009 1102.5429 |
| 33 | J. M. Campbell, W. Huston, J, and W. J. Stirling | Hard interactions of quarks and gluons: a primer for LHC physics | Rep. Prog. Phys. 70 (2007) 89 | hep-ph/0611148 |
| 34 | CMS Collaboration | Measurement of the inelastic proton-proton cross section at $ \sqrt{s} = $ 7 TeV | PLB 722 (2013) 5 | |
| 35 | CMS Collaboration | Measurement of the ZZ production cross section and search for anomalous couplings in $ 2\ell2\ell' $ final states in pp collisions at $ \sqrt{s} = $ 7 TeV | JHEP 01 (2013) 063 | |
| 36 | CMS Collaboration | Measurement of the $ \mathrm{W}^+\mathrm{W}^- $ and ZZ production cross sections in pp collisions at $ \sqrt{s} = $ 8 TeV | PLB 721 (2013) 190 | |
| 37 | CMS Collaboration | Measurement of the $ \mathrm{ W }\gamma $ and $ \mathrm{ Z }\gamma $ inclusive cross sections in $ \mathrm{ p }\mathrm{ p } $ collisions at $ \sqrt{s} = $ 7 TeV and limits on anomalous triple gauge boson couplings | PRD 89 (2014) 092005 | |
| 38 | CMS Collaboration | Measurement of the Z$ \gamma $ production cross section in pp collisions at 8 TeV and search for anomalous triple gauge boson couplings | JHEP 04 (2015) 164 | CMS-SMP-13-014 1502.05664 |
| 39 | CMS Collaboration | Measurement of top quark-antiquark pair production in association with a W or Z boson in pp collisions at $ \sqrt{s} = $ 8 TeV | EPJC 74 (2014) 3060 | |
| 40 | CMS Collaboration | Absolute Calibration of the Luminosity Measurement at CMS: Winter 2012 Update | CDS | |
| 41 | CMS Collaboration | CMS Luminosity Based on Pixel Cluster Counting - Summer 2013 Update | CMS-PAS-LUM-13-001 | CMS-PAS-LUM-13-001 |
| 42 | L. Lyons, D. Gibaut, and P. Clifford | How to combine correlated estimates of a single physical quantity | NIMA 270 (1988) 110 | |
| 43 | M. Grazzini, S. Kallweit, D. Rathlev, and M. Wiesemann | $ W^{\pm}Z $ production at hadron colliders in NNLO QCD | PLB 761 (2016) 179 | 1604.08576 |
| 44 | G. D'Agostini | A multidimensional unfolding method based on Bayes' theorem | NIMA 362 (1995) 487 | |
| 45 | T. Adye | Unfolding algorithms and tests using RooUnfold | in PHYSTAT 2011 Workshop on Statistical Issues Related to Discovery Claims in Search Experiments and Unfolding, H. Prosper and L. Lyons, eds., p. 313 Geneva, Switzerland | 1105.1160 |
| 46 | A. Valassi | Combining correlated measurements of several different physical quantities | NIMA 500 (2003) 391 | |
| 47 | K. Hagiwara, R. D. Peccei, and D. Zeppenfeld | Probing the weak boson sector in e$ ^+ $e$ ^-\to {\rm{W}}^+ {\rm{W}}^- $ | Nucl. Phys. B 282 (1987) 253 | |
| 48 | K. Hagiwara, J. Woodside, and D. Zeppenfeld | Measuring the WWZ coupling at the Fermilab Tevatron | PRD 41 (1990) 2113 | |
| 49 | ATLAS and CMS Collaborations and LHC Higgs Combination Group | Procedure for the LHC Higgs boson search combination in Summer 2011 | CMS-NOTE-2011-005 | |
| 50 | G. Cowan, K. Cranmer, E. Gross, and O. Vitells | Asymptotic formulae for likelihood-based tests of new physics | EPJC 71 (2011) 1554 | 1007.1727 |
| 51 | The ALEPH Collaboration, The DELPHI Collaboration, The L3 Collaboration, The OPAL Collaboration, The LEP Electroweak Working Group | Electroweak measurements in electron-positron collisions at W-boson-pair energies at LEP | PR 532 (2013) 119 | 1302.3415 |
| 52 | T. Corbett, O. J. P. Eboli, and M. C. Gonzalez-Garcia | Unitarity constraints on dimension-six operators | PRD 91 (2015) 035014 | 1411.5026 |
|
|
Compact Muon Solenoid LHC, CERN |
|

|

|

|

|

|