

Compact Muon Solenoid
LHC, CERN
| CMS-SMP-14-023 ; CERN-EP-2016-231 | ||
| Measurements of differential cross sections for associated production of a W boson and jets in proton-proton collisions at $ \sqrt{s} = $ 8 TeV | ||
| CMS Collaboration | ||
| 13 October 2016 | ||
| Phys. Rev. D 95 (2017) 052002 | ||
| Abstract: Differential cross sections for a W boson produced in association with jets are measured in a data sample of proton-proton collisions at a center-of-mass energy of 8 TeV recorded with the CMS detector and corresponding to an integrated luminosity of 19.6 fb$^{-1}$. The W bosons are identified through their decay mode $\mathrm{ W }\to \mu\nu$. The cross sections are reported as functions of jet multiplicity, transverse momenta, and the scalar sum of jet transverse momenta ($H_{\mathrm{T}}$) for different jet multiplicities. Distributions of the angular correlations between the jets and the muon are examined, as well as the average number of jets as a function of $H_{\mathrm{T}}$ and as a function of angular variables. The measured differential cross sections are compared with tree-level and higher-order recent event generators, as well as next-to-leading-order and next-to-next-to-leading-order theoretical predictions. The agreement of the generators with the measurements builds confidence in their use for the simulation of W+jets background processes in searches for new physics at the LHC. | ||
| Links: e-print arXiv:1610.04222 [hep-ex] (PDF) ; CDS record ; inSPIRE record ; HepData record ; CADI line (restricted) ; | ||
| Figures | |
png pdf |
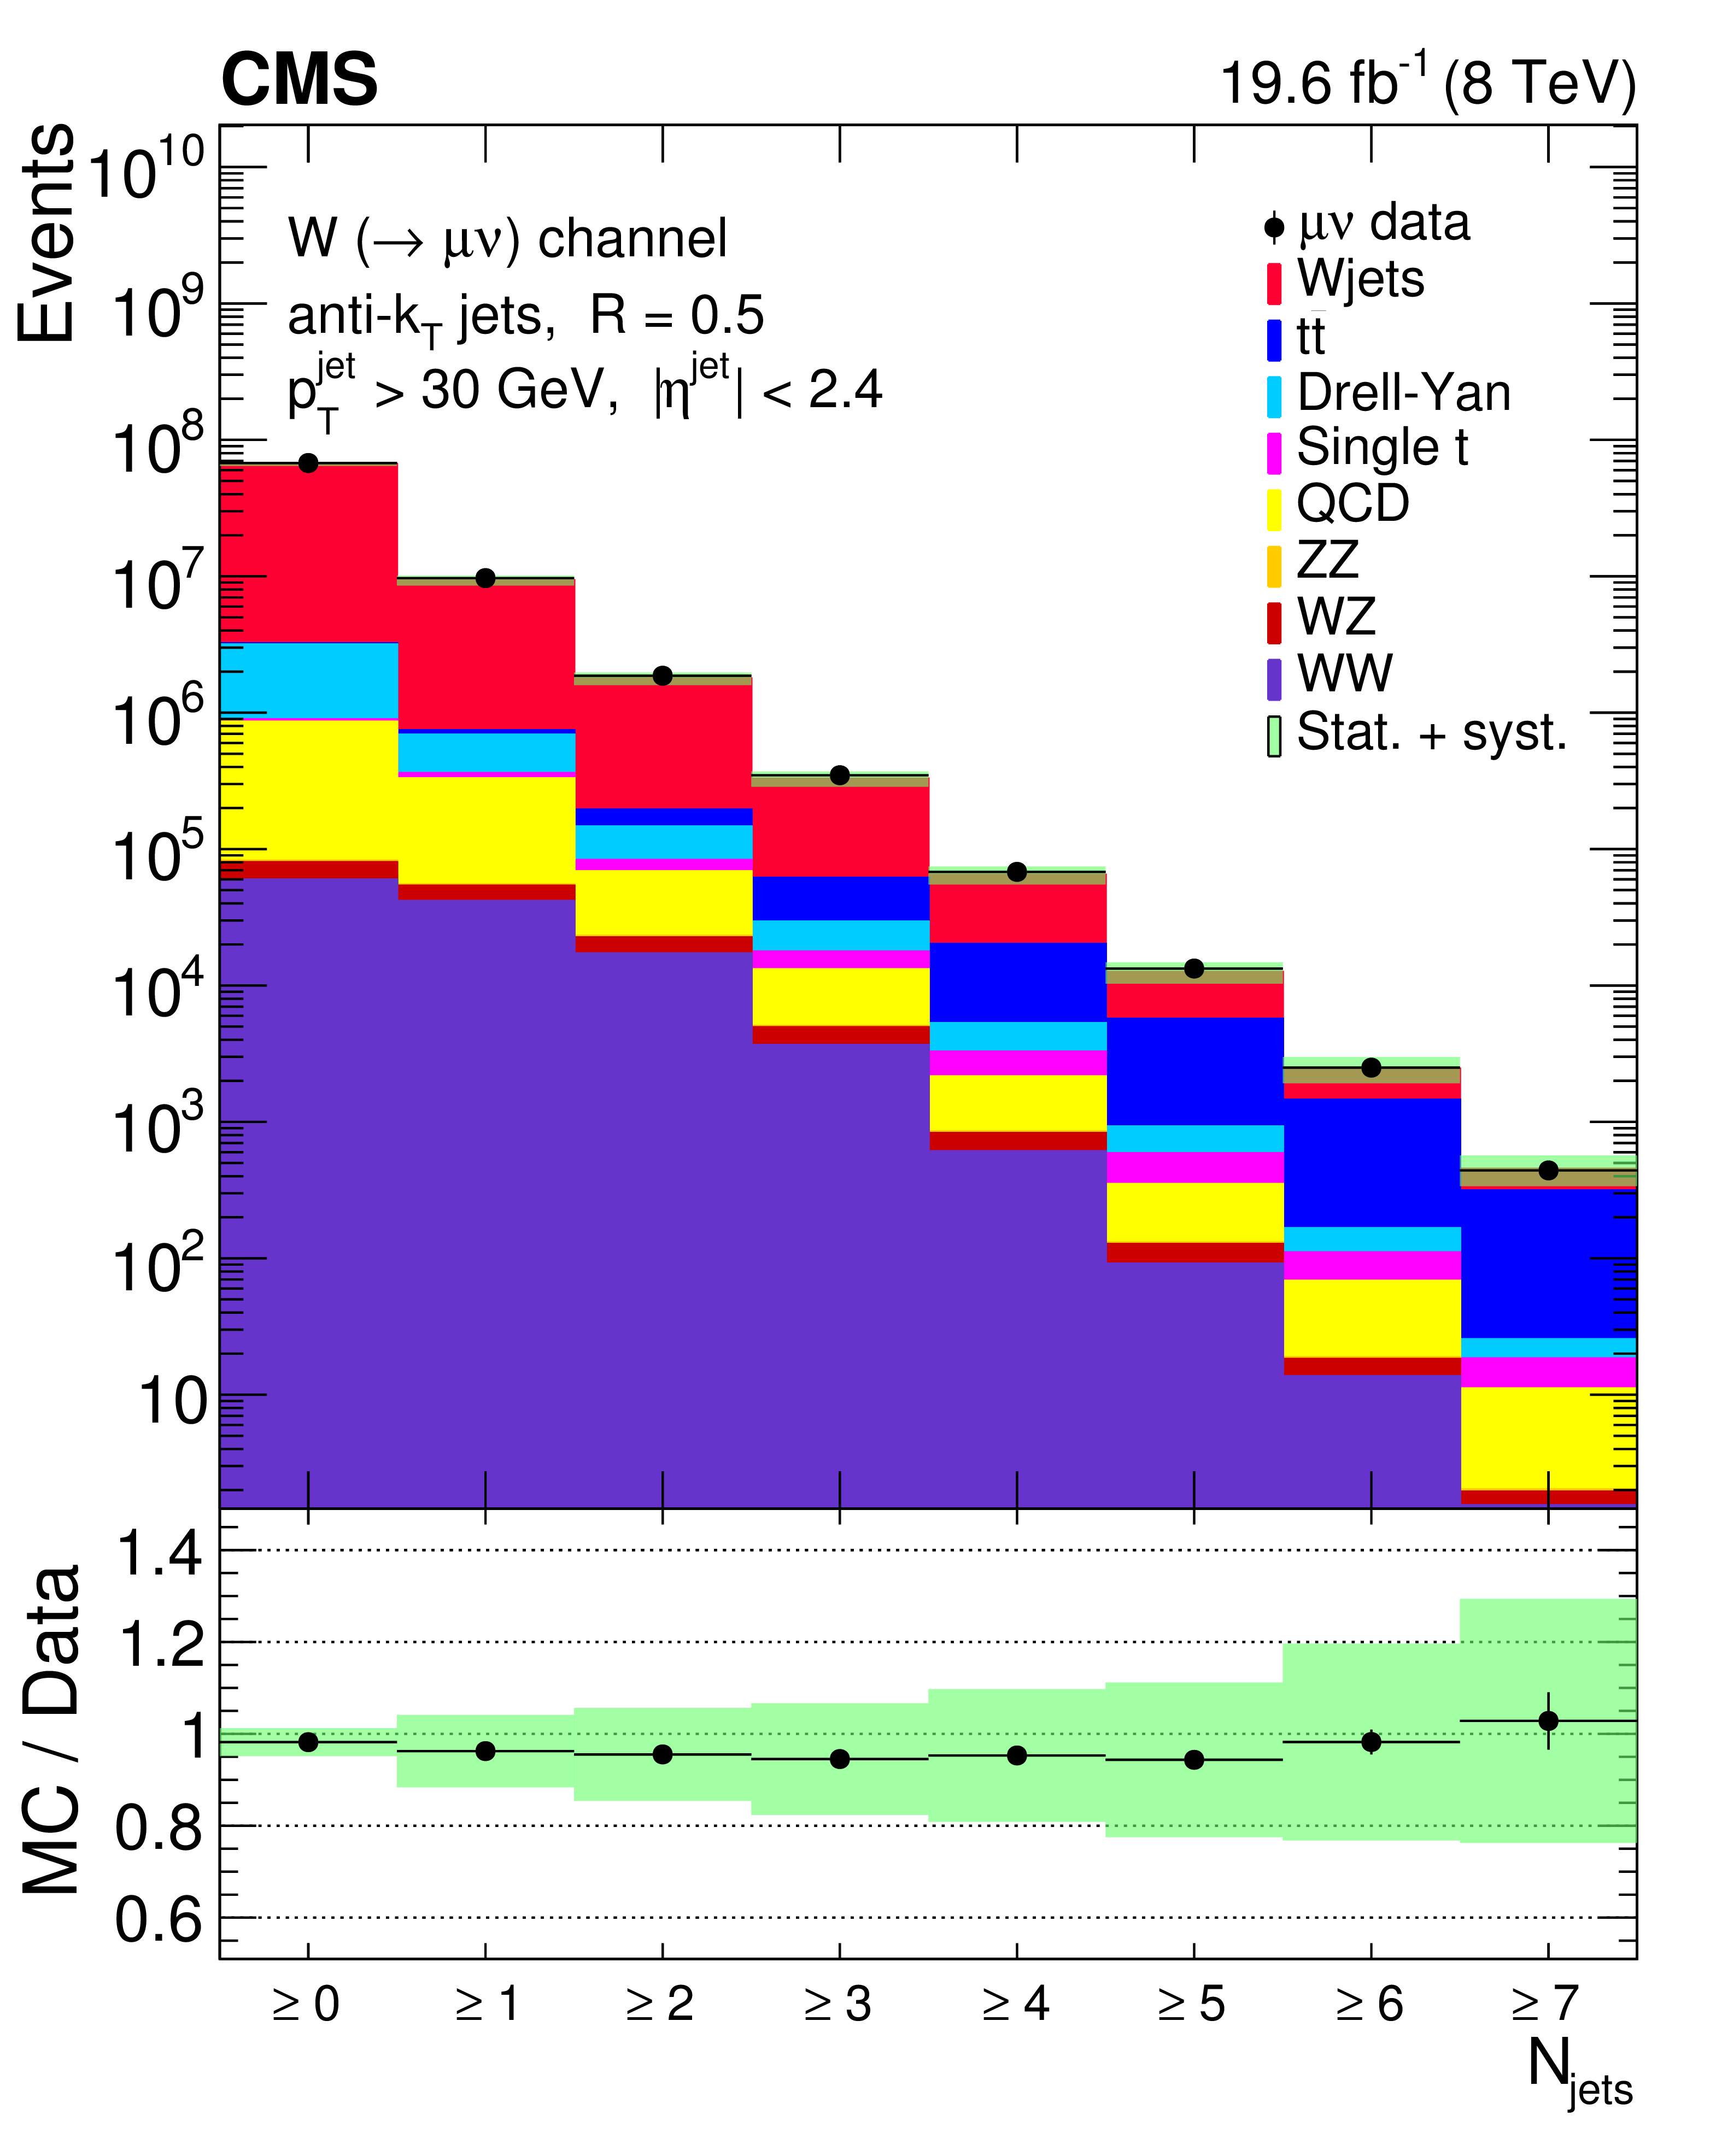
Figure 1:
Distribution of inclusive jet multiplicity, for reconstructed data (points) and simulated signal and backgrounds (histograms). The ratio of simulated and measured data events is shown below the distribution. The data points are shown with statistical error bars. The error band represents the total statistical and systematic uncertainty. |
png pdf |
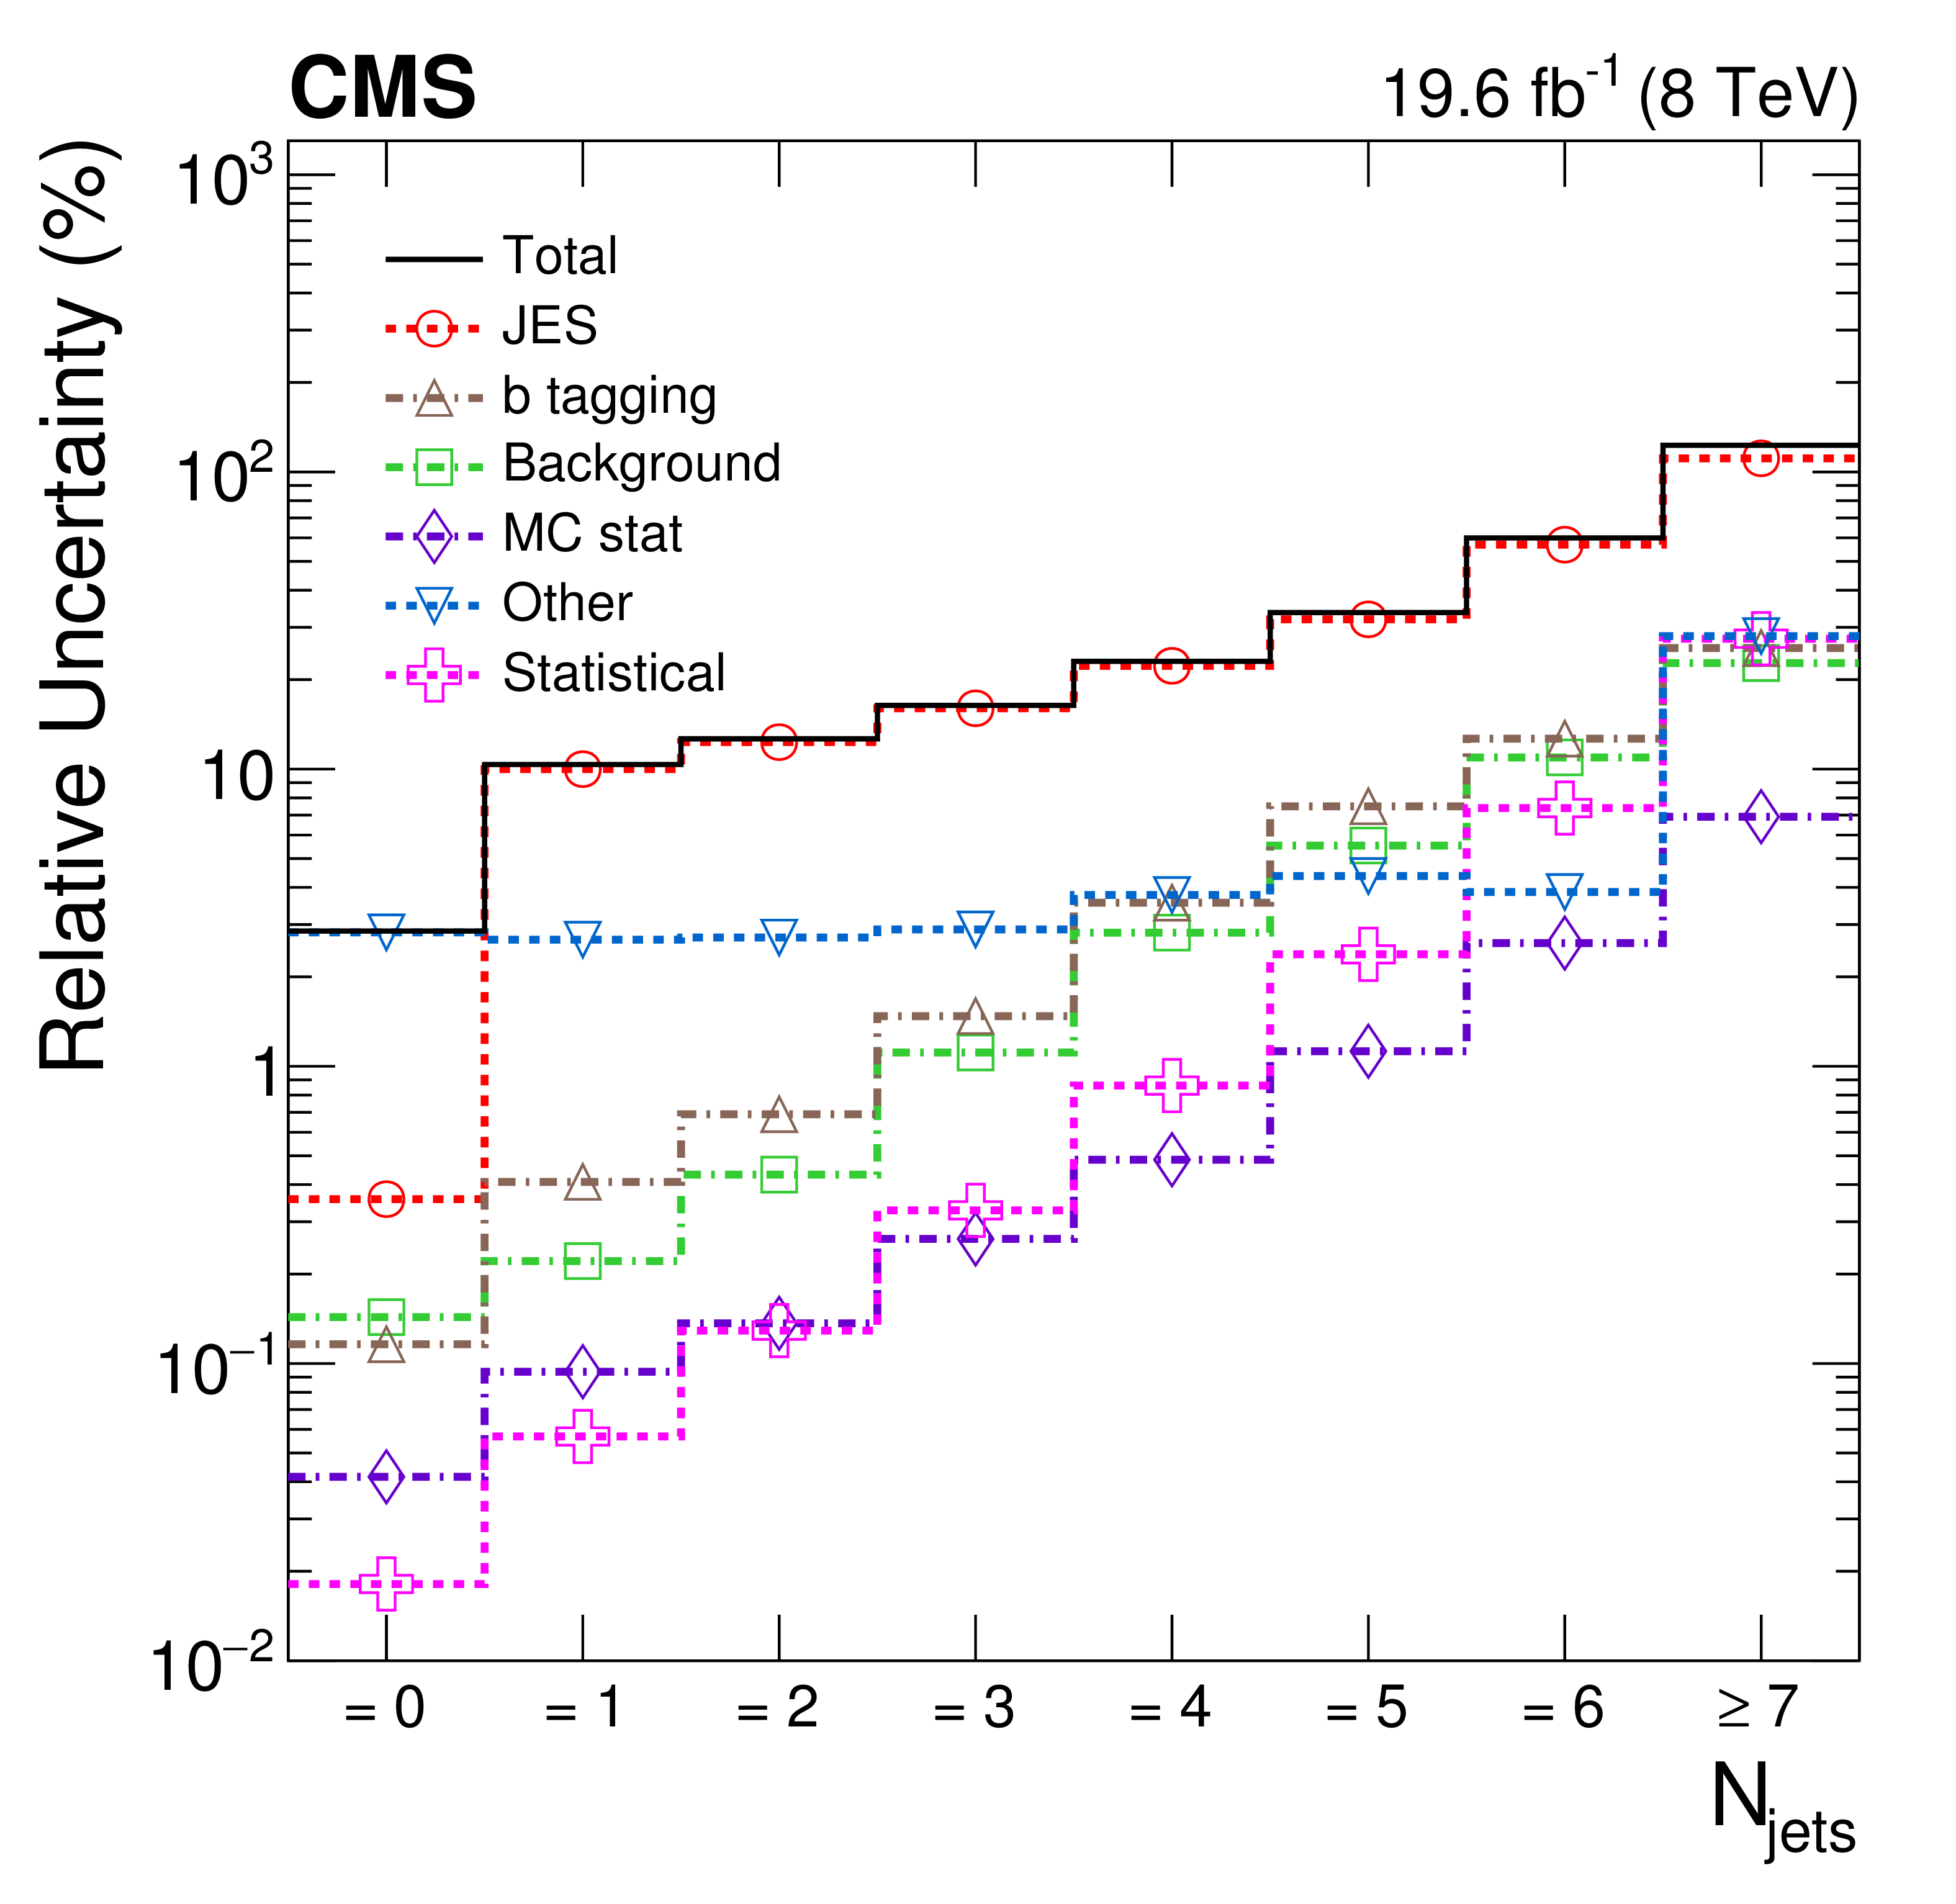
Figure 2:
Systematic uncertainties in the measured cross section as a function of jet multiplicity, including uncertainties due to jet energy scale (JES), background normalization, b tagging efficiency, finite number of simulated events used to construct the response matrix (MC stat), and other systematic uncertainties mentioned in Section {systematics}. Statistical uncertainty of the unfolded data and total uncertainty in the measured cross section are also shown. |
png pdf |
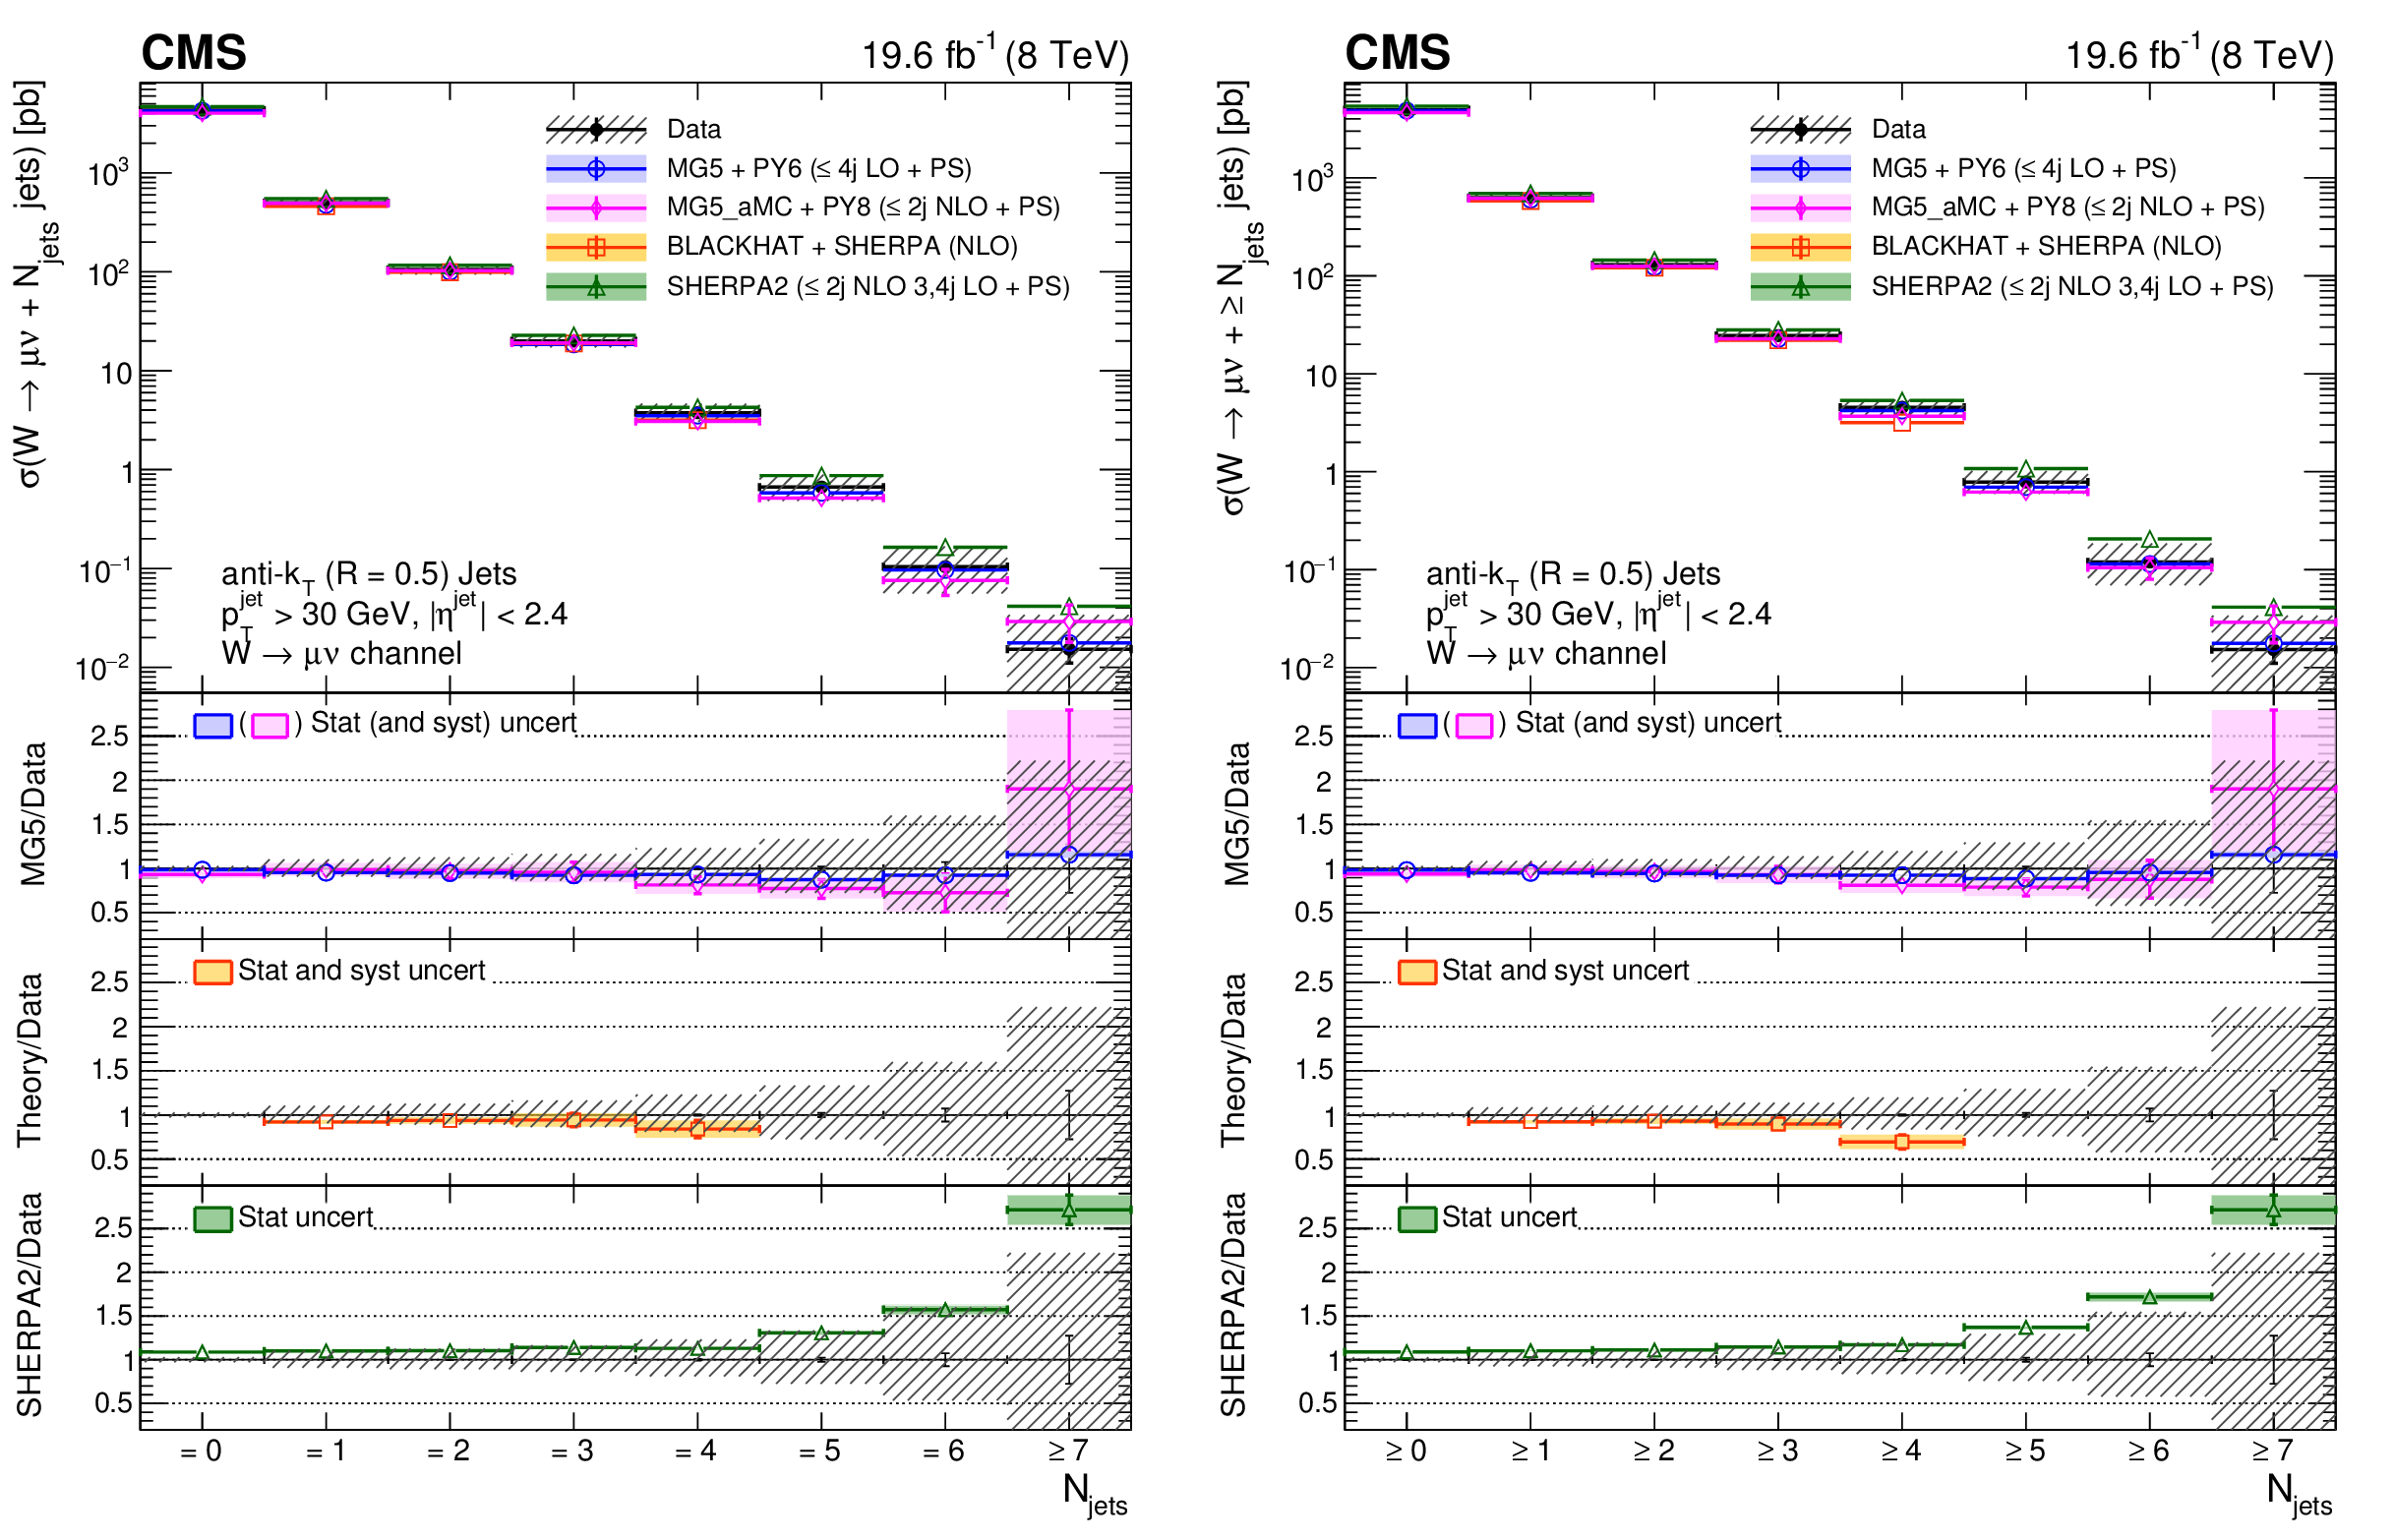
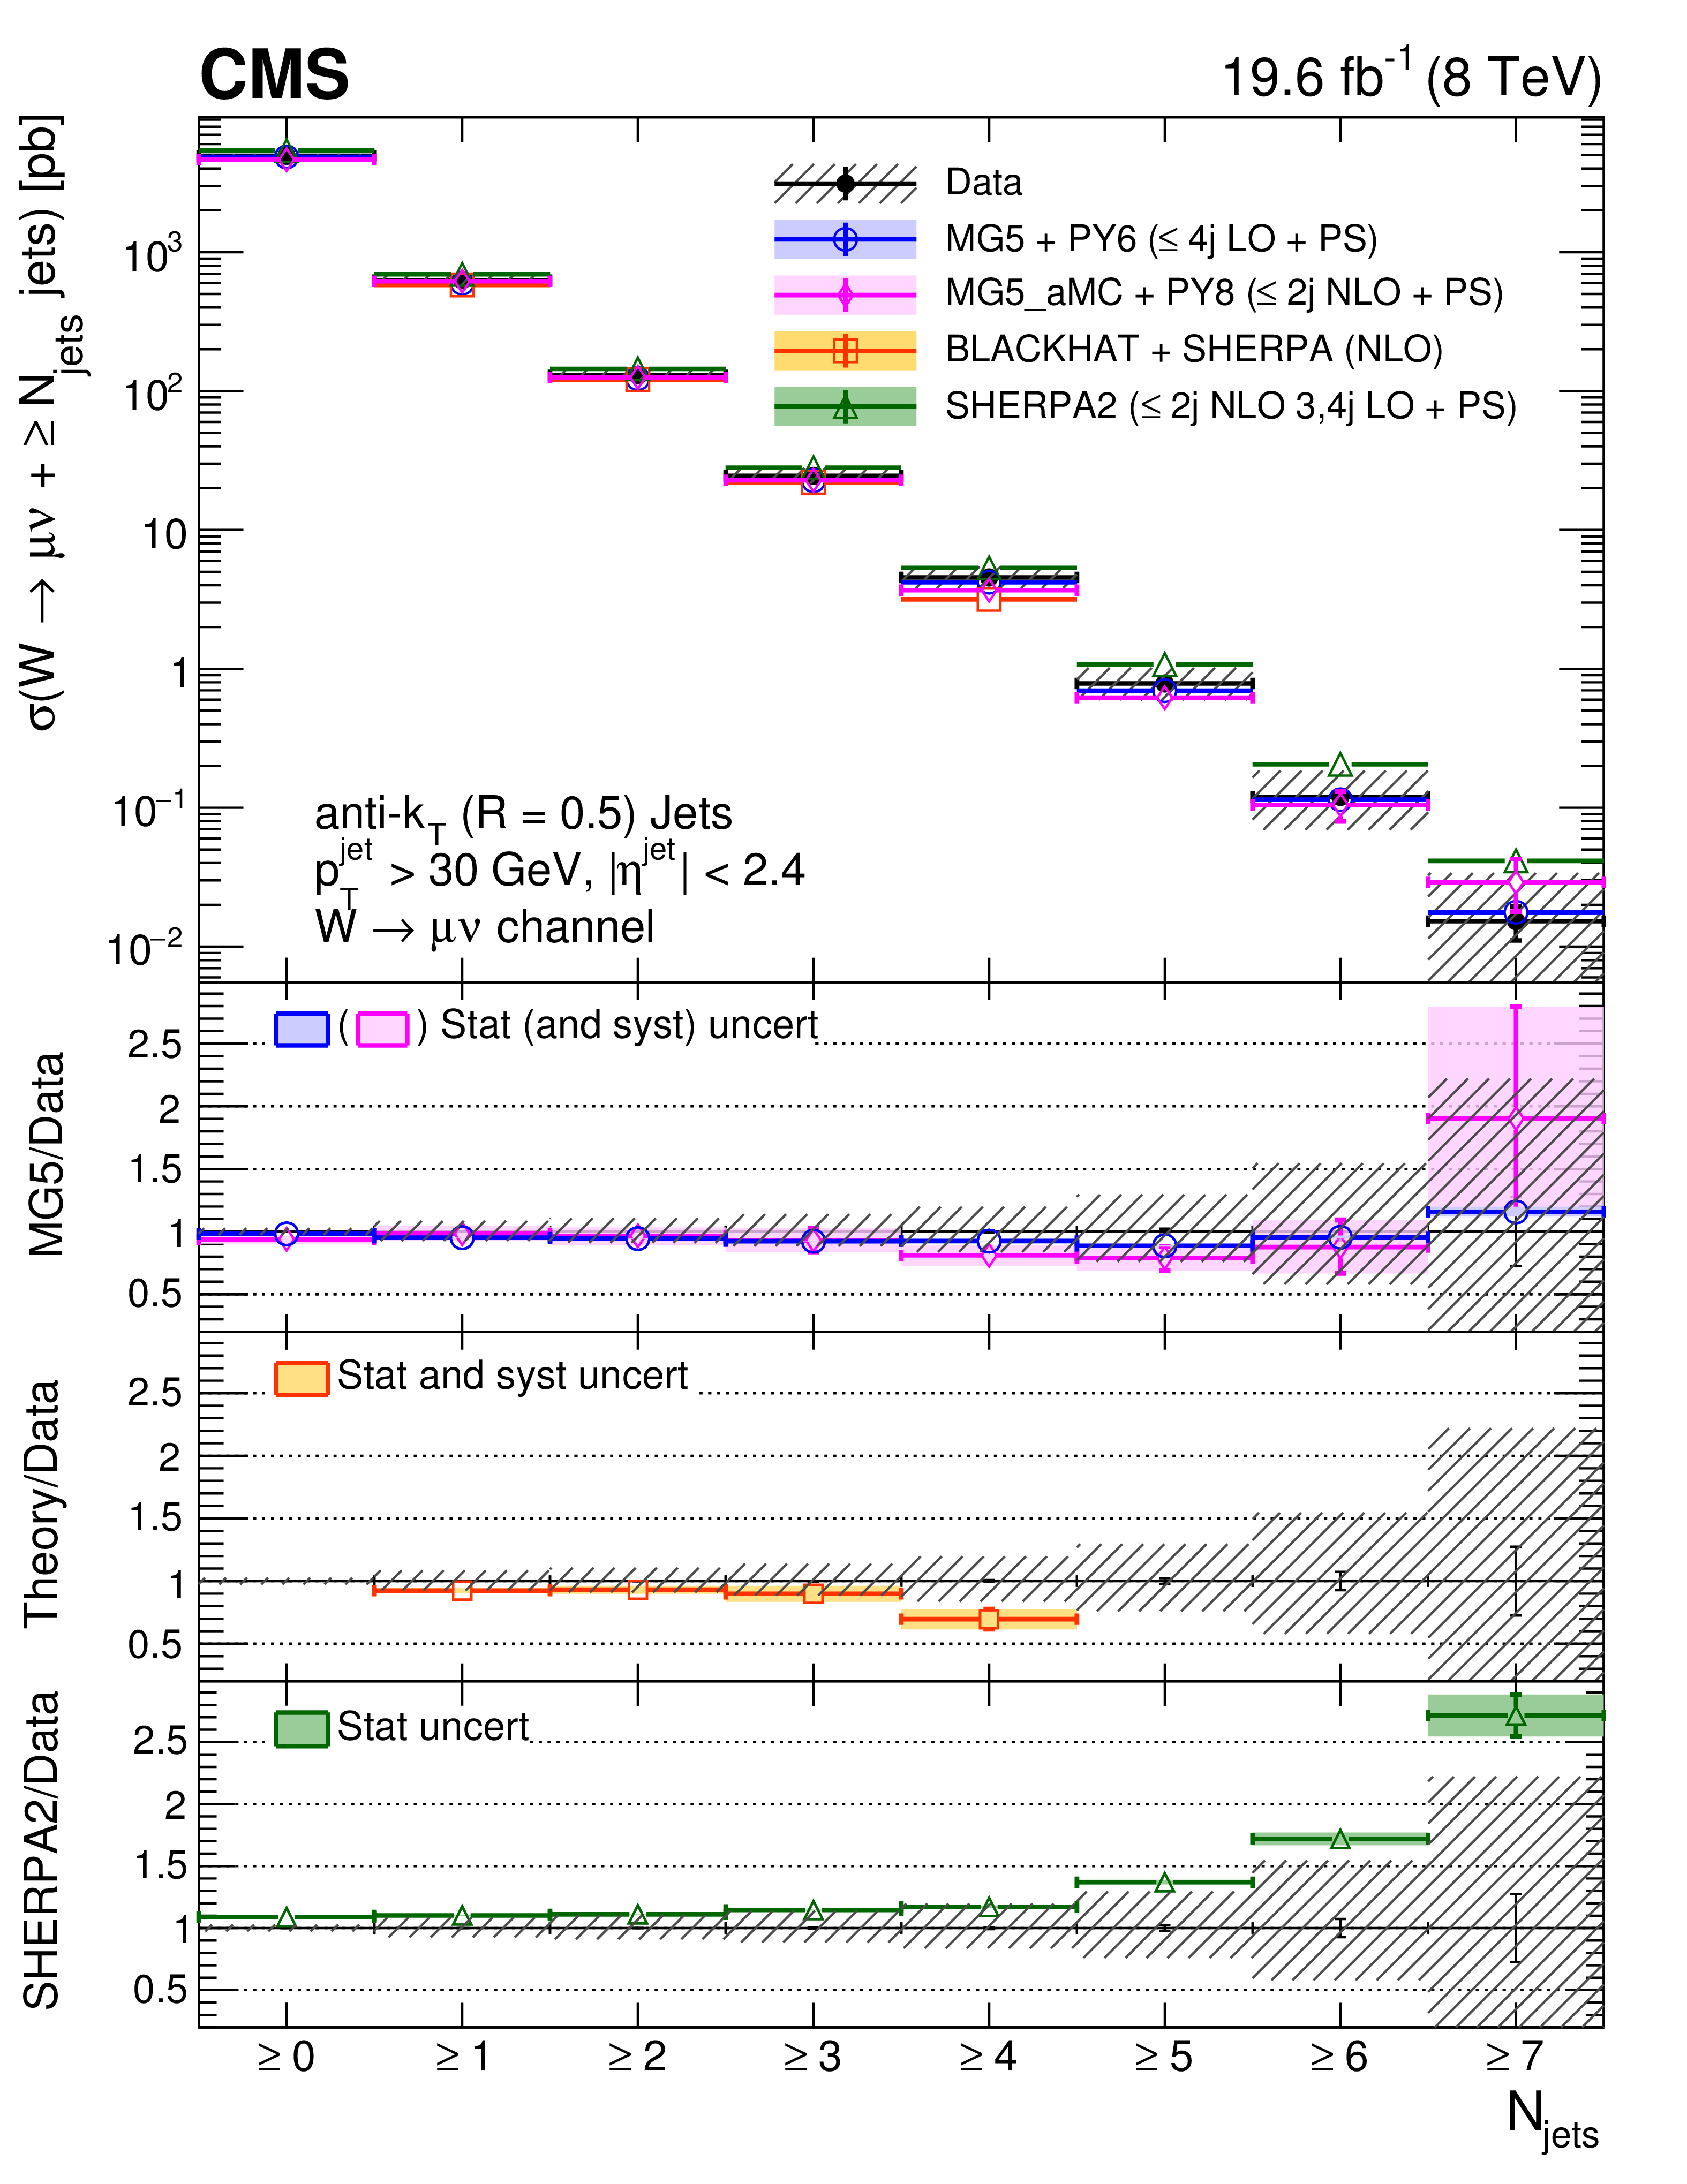
Figure 3:
Measured cross section versus exclusive (left) and inclusive (right) jet multiplicity, compared to the predictions of MadGraph, MadGraph-5-aMC@NLO, SHERPA-2, and BLACKHAT+SHERPA (corrected for hadronization and multiple-parton interactions), for which we currently have predictions only up to W+4 jets. Black circular markers with the gray hatched band represent the unfolded data measurement and its total uncertainty. Overlaid are the predictions together with their uncertainties. The lower plots show the ratio of each prediction to the unfolded data. |
png pdf |
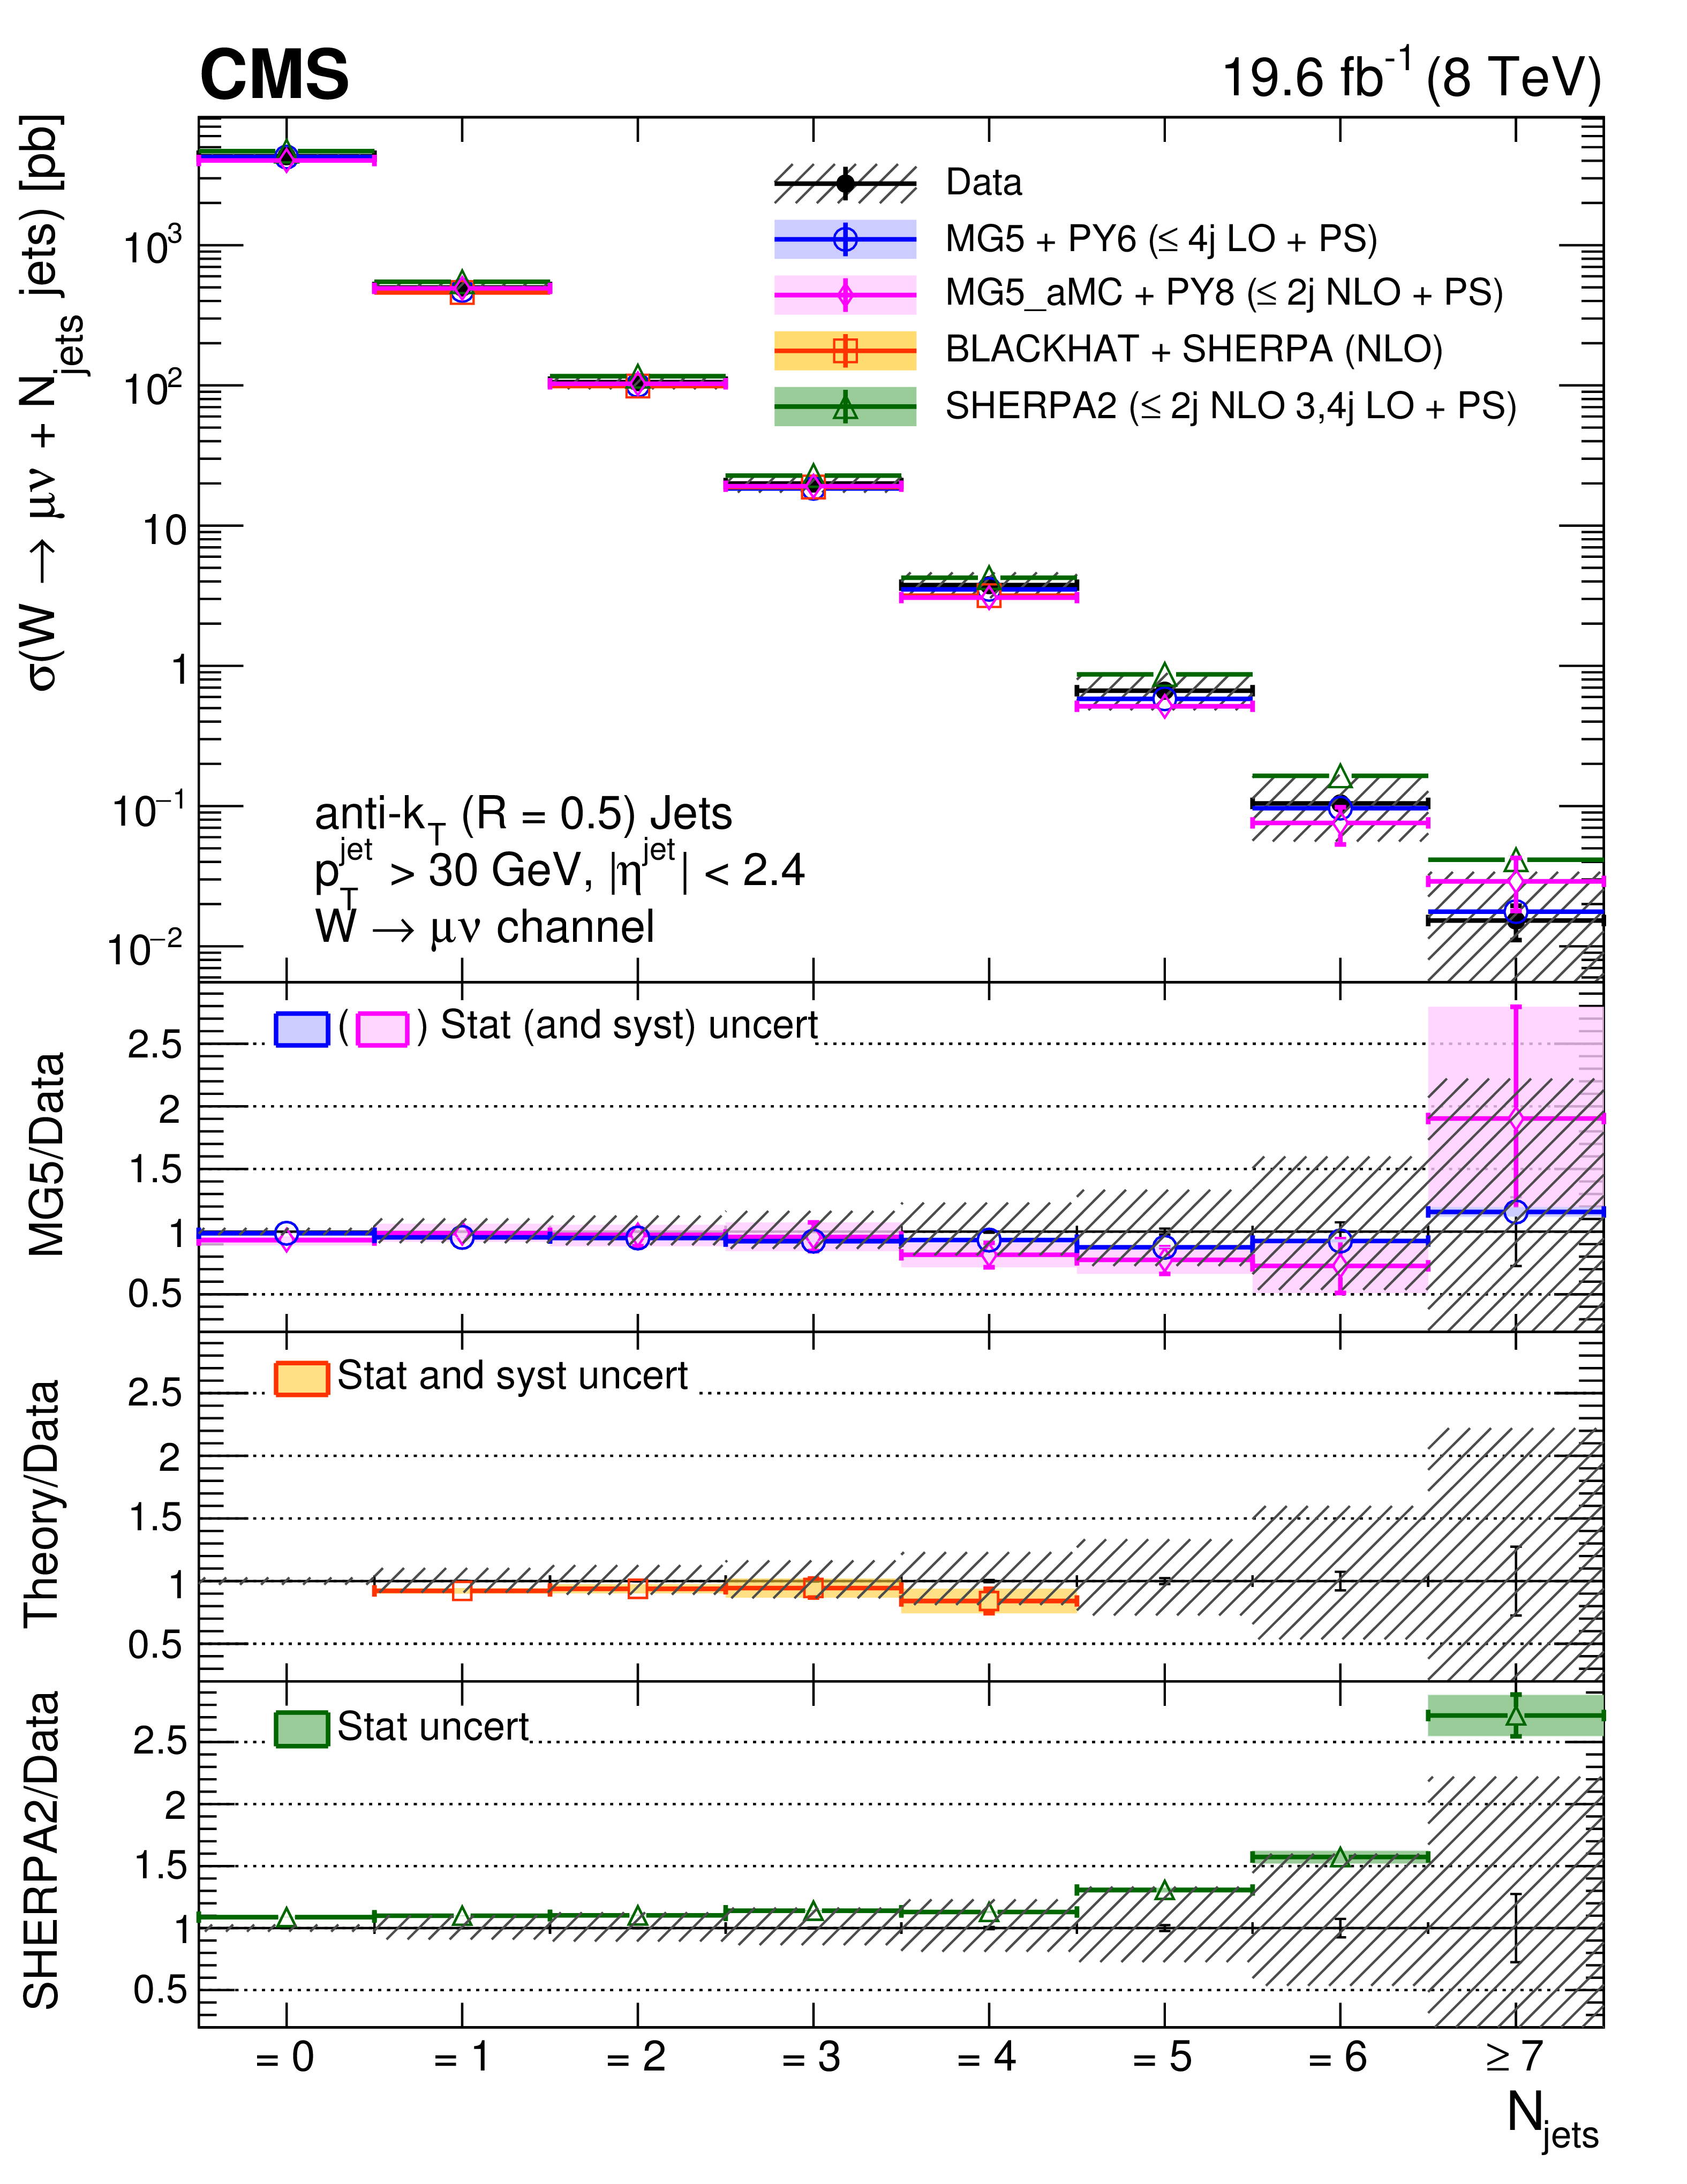
Figure 3-a:
Measured cross section versus exclusive jet multiplicity, compared to the predictions of MadGraph, MadGraph-5-aMC@NLO, SHERPA-2, and BLACKHAT+SHERPA (corrected for hadronization and multiple-parton interactions), for which we currently have predictions only up to W+4 jets. Black circular markers with the gray hatched band represent the unfolded data measurement and its total uncertainty. Overlaid are the predictions together with their uncertainties. The lower plots show the ratio of each prediction to the unfolded data. |
png pdf |
Figure 3-b:
Measured cross section versus inclusive jet multiplicity, compared to the predictions of MadGraph, MadGraph-5-aMC@NLO, SHERPA-2, and BLACKHAT+SHERPA (corrected for hadronization and multiple-parton interactions), for which we currently have predictions only up to W+4 jets. Black circular markers with the gray hatched band represent the unfolded data measurement and its total uncertainty. Overlaid are the predictions together with their uncertainties. The lower plots show the ratio of each prediction to the unfolded data. |
png pdf |
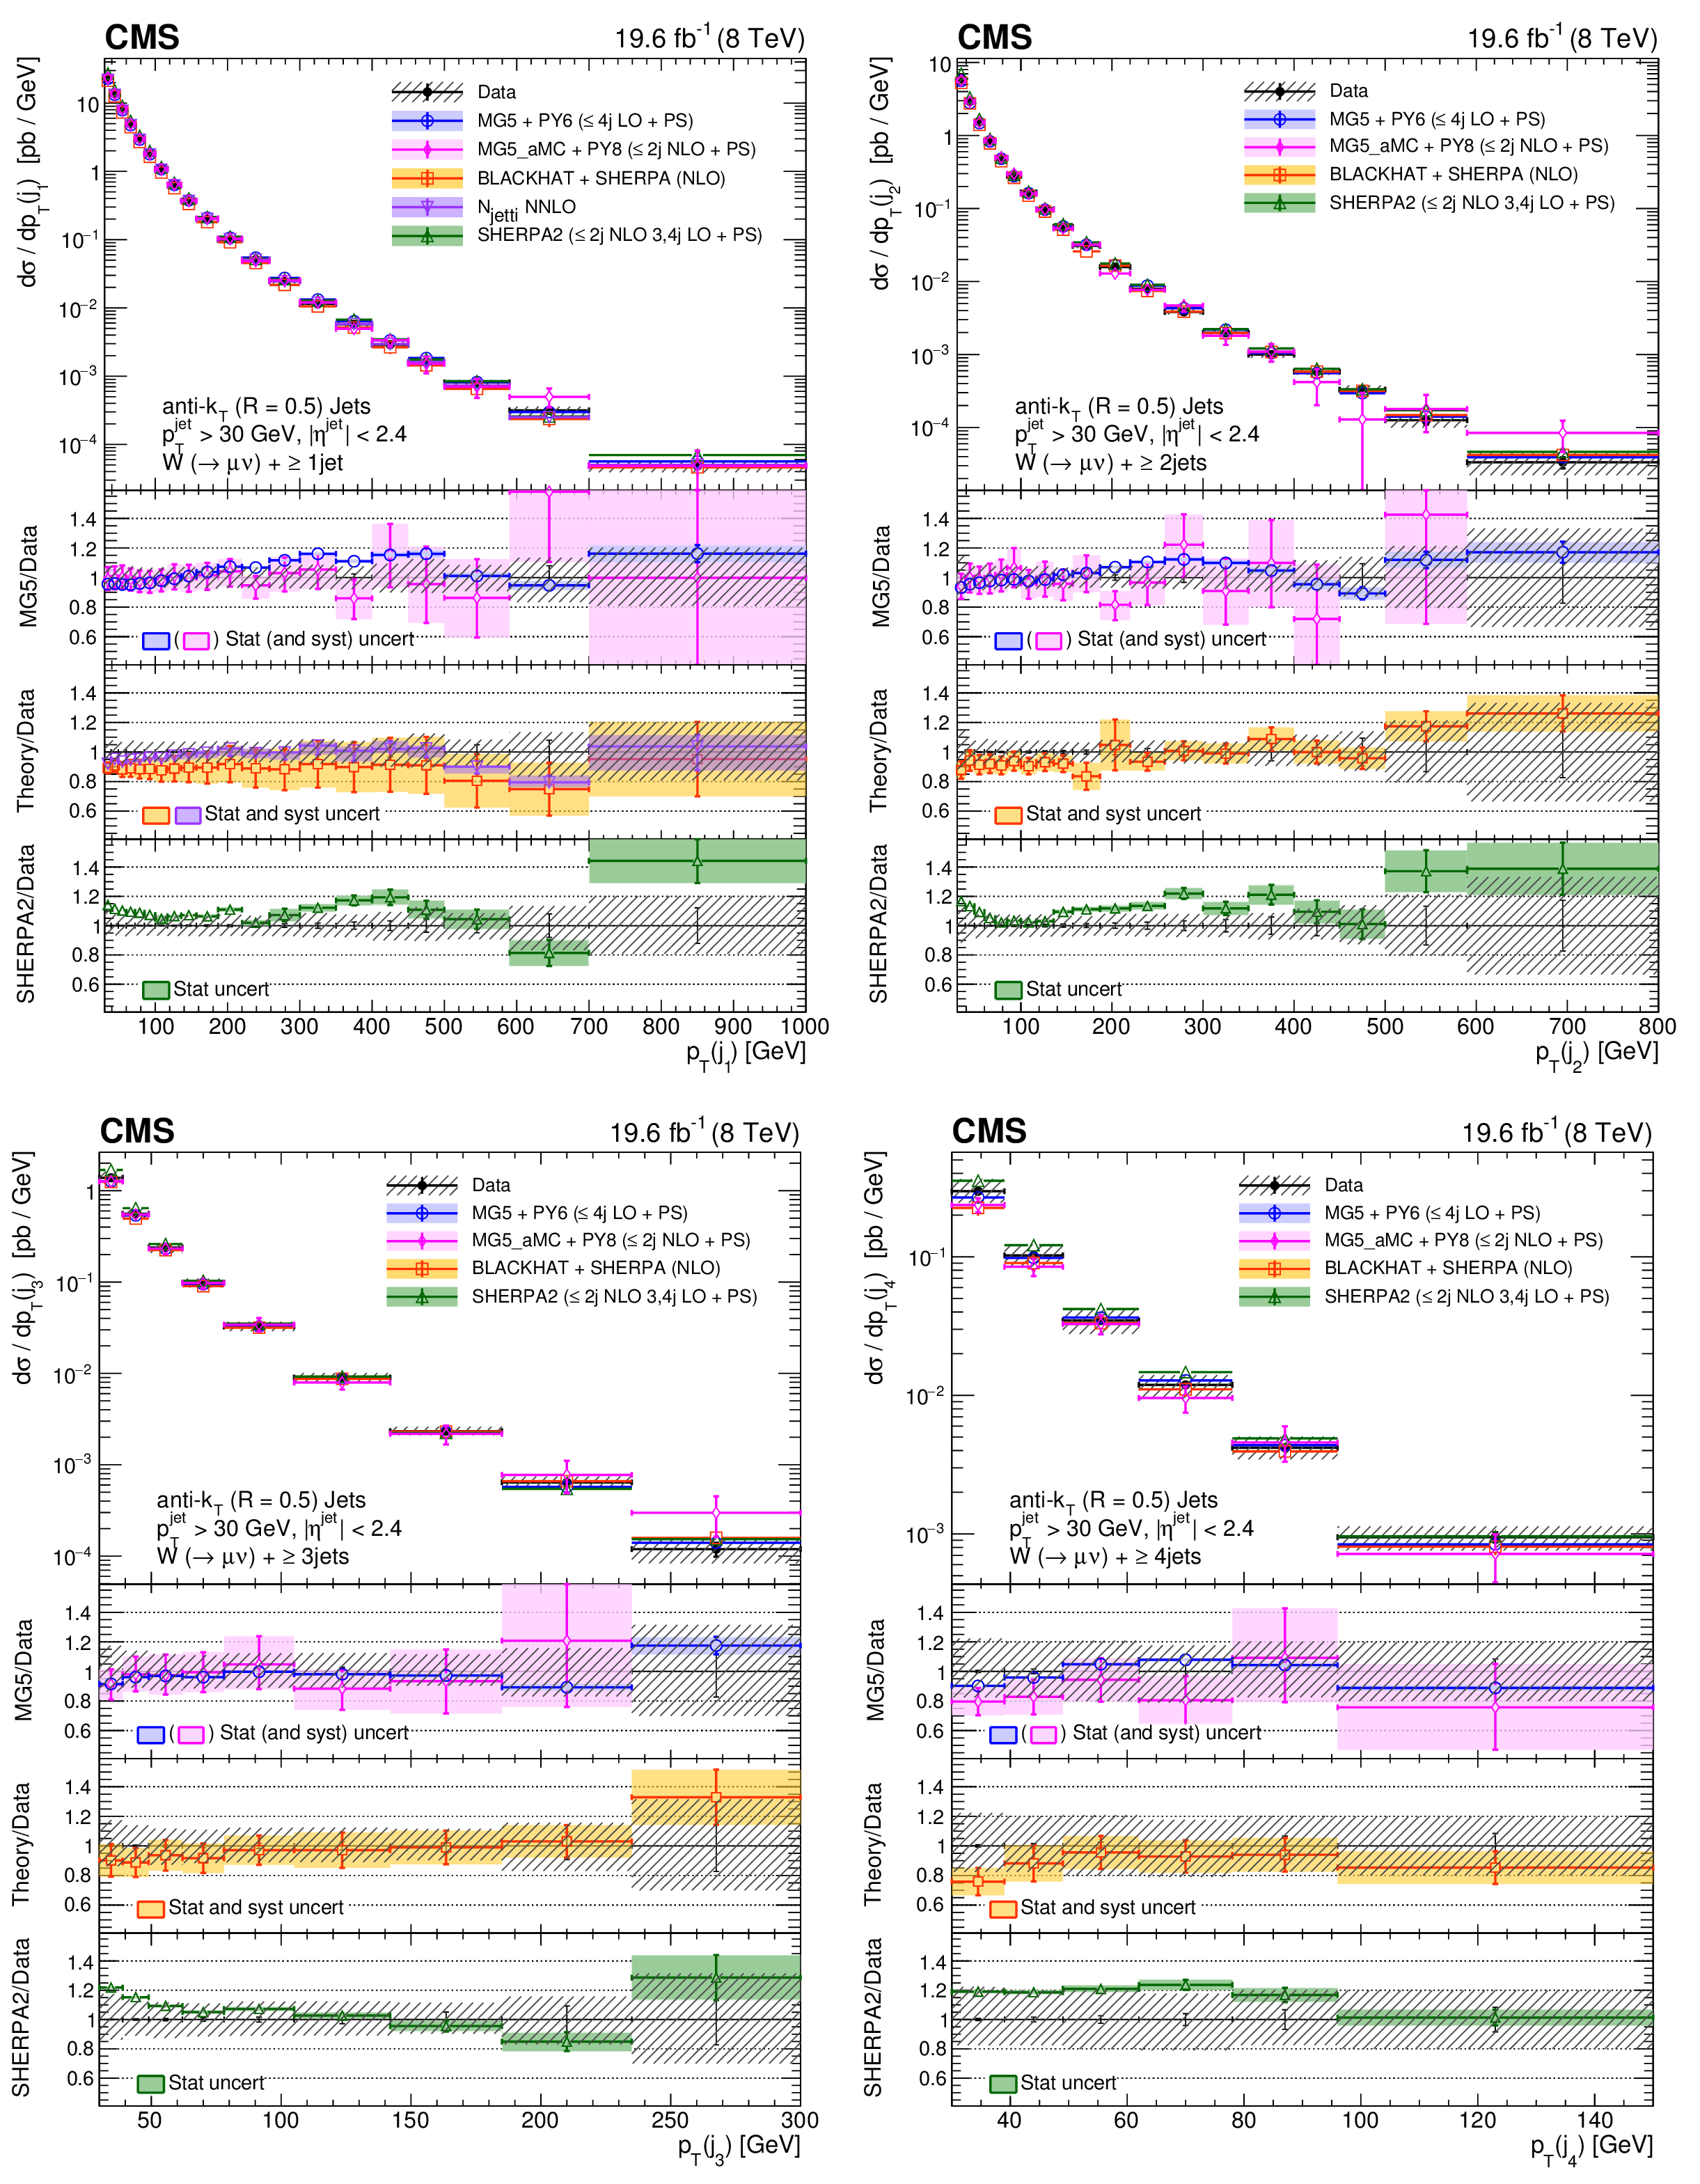
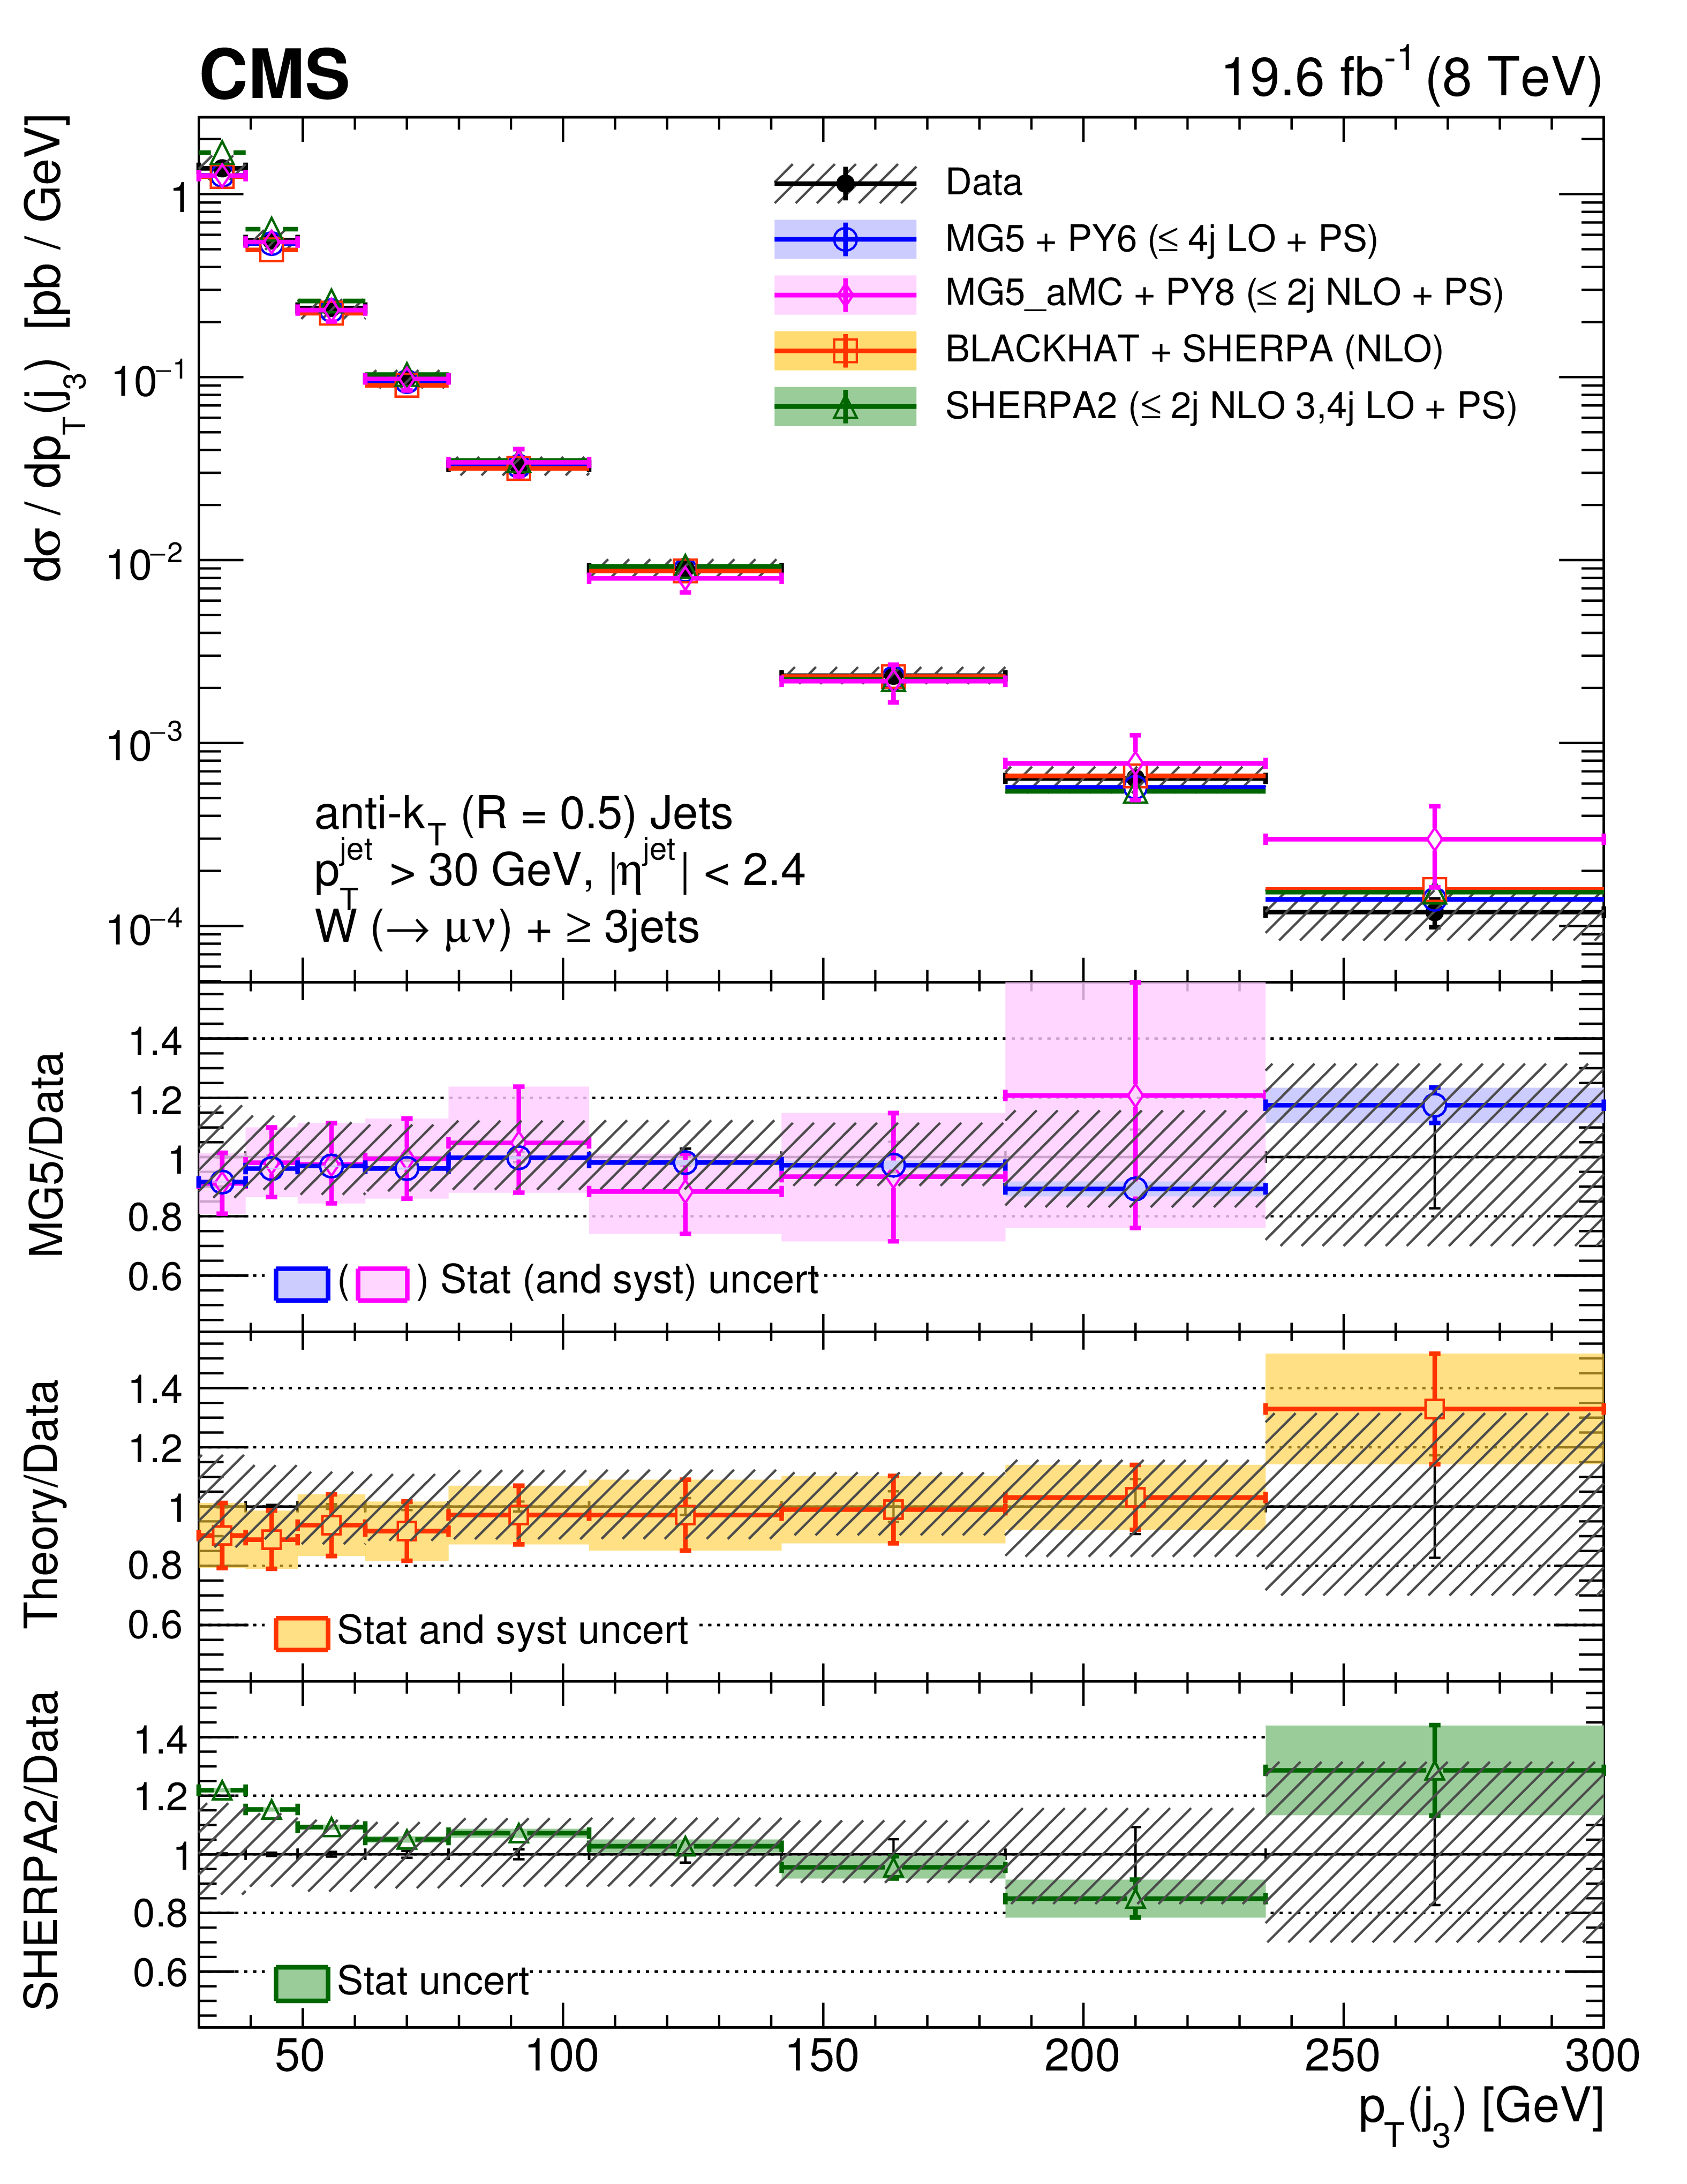
Figure 4:
Cross sections differential in the transverse momenta of the four leading jets, compared to the predictions of MadGraph, MadGraph-5-aMC@NLO, SHERPA-2, BLACKHAT+SHERPA, and NNLO inclusive one-jet production (indicated as $\rm N_{jetti}$ NNLO). The BLACKHAT+SHERPA and NNLO predictions are corrected for hadronization and multiple-parton interaction effects. Black circular markers with the gray hatched band represent the unfolded data measurements and their total uncertainties. Overlaid are the predictions together with their uncertainties. The lower plots show the ratio of each prediction to the unfolded data. |
png pdf |
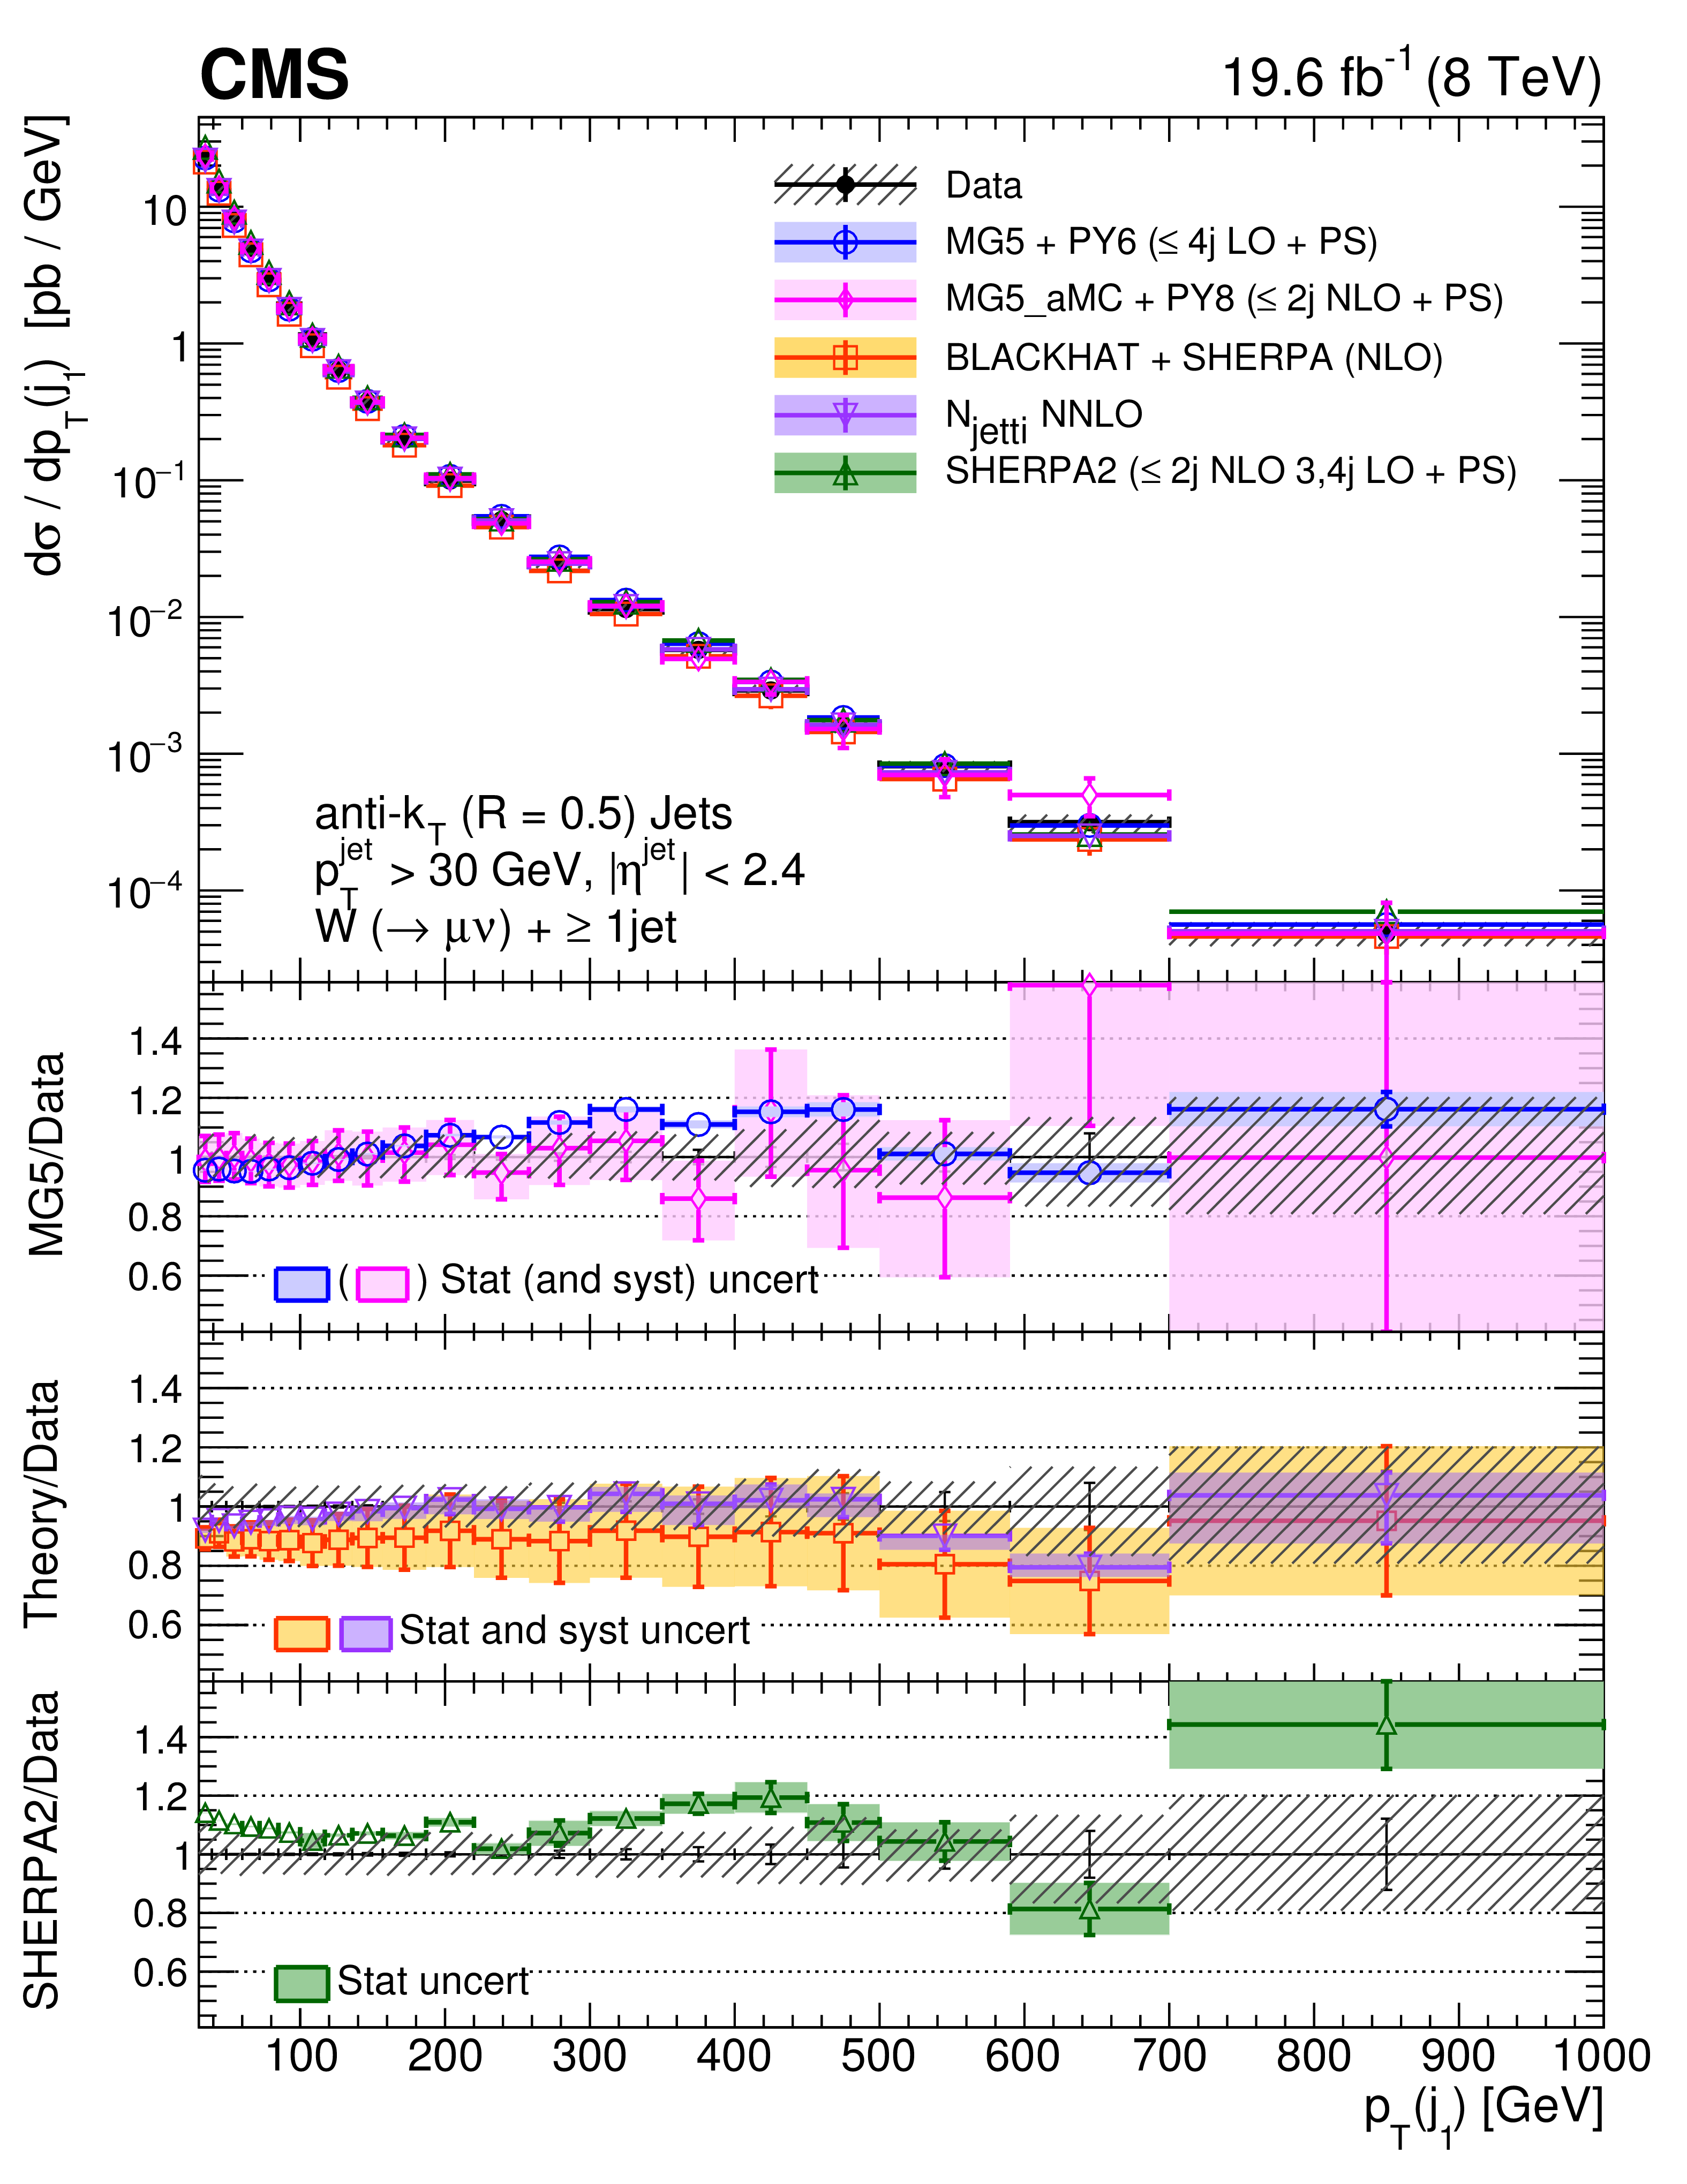
Figure 4-a:
Cross section differential in the transverse momenta of the first leading jet, compared to the predictions of MadGraph, MadGraph-5-aMC@NLO, SHERPA-2, BLACKHAT+SHERPA, and NNLO inclusive one-jet production (indicated as $\rm N_{jetti}$ NNLO). The BLACKHAT+SHERPA and NNLO predictions are corrected for hadronization and multiple-parton interaction effects. Black circular markers with the gray hatched band represent the unfolded data measurements and their total uncertainties. Overlaid are the predictions together with their uncertainties. The lower plots show the ratio of each prediction to the unfolded data. |
png pdf |
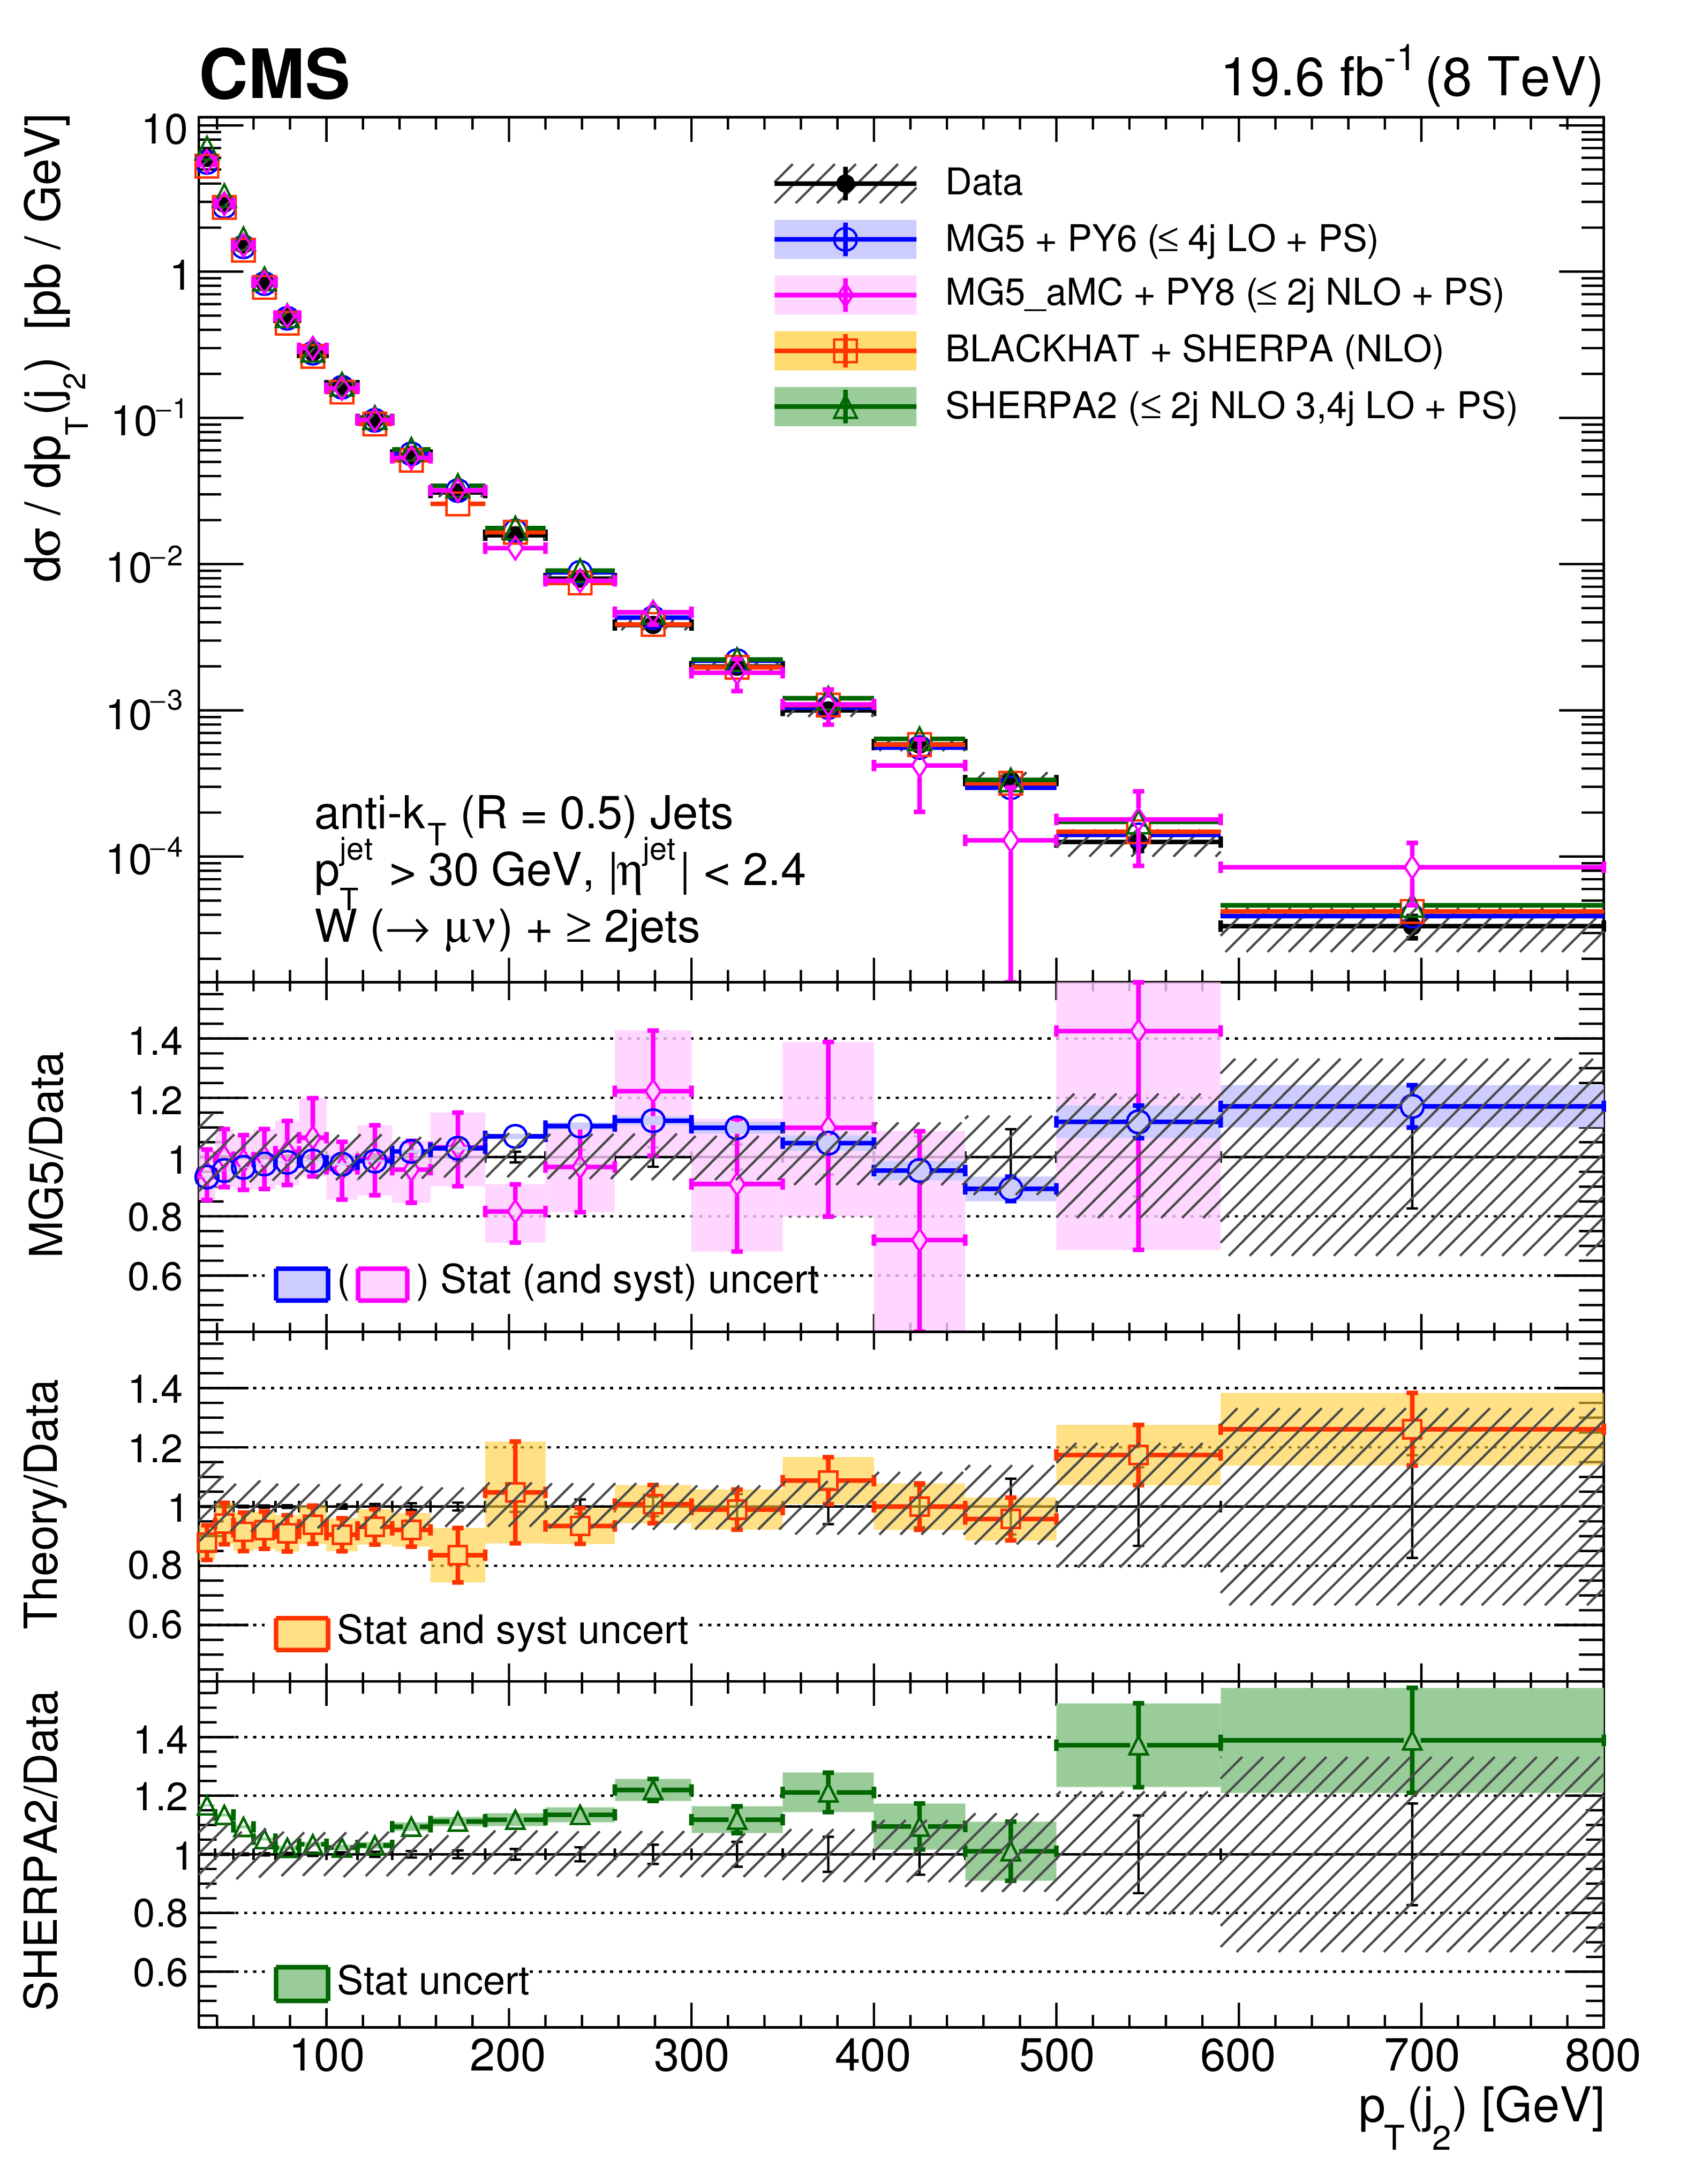
Figure 4-b:
Cross section differential in the transverse momenta of the second leading jet, compared to the predictions of MadGraph, MadGraph-5-aMC@NLO, SHERPA-2, BLACKHAT+SHERPA, and NNLO inclusive one-jet production (indicated as $\rm N_{jetti}$ NNLO). The BLACKHAT+SHERPA and NNLO predictions are corrected for hadronization and multiple-parton interaction effects. Black circular markers with the gray hatched band represent the unfolded data measurements and their total uncertainties. Overlaid are the predictions together with their uncertainties. The lower plots show the ratio of each prediction to the unfolded data. |
png pdf |
Figure 4-c:
Cross section differential in the transverse momenta of the third leading jet, compared to the predictions of MadGraph, MadGraph-5-aMC@NLO, SHERPA-2, BLACKHAT+SHERPA, and NNLO inclusive one-jet production (indicated as $\rm N_{jetti}$ NNLO). The BLACKHAT+SHERPA and NNLO predictions are corrected for hadronization and multiple-parton interaction effects. Black circular markers with the gray hatched band represent the unfolded data measurements and their total uncertainties. Overlaid are the predictions together with their uncertainties. The lower plots show the ratio of each prediction to the unfolded data. |

png pdf |
Figure 4-d:
Cross section differential in the transverse momenta of the fourth leading jet, compared to the predictions of MadGraph, MadGraph-5-aMC@NLO, SHERPA-2, BLACKHAT+SHERPA, and NNLO inclusive one-jet production (indicated as $\rm N_{jetti}$ NNLO). The BLACKHAT+SHERPA and NNLO predictions are corrected for hadronization and multiple-parton interaction effects. Black circular markers with the gray hatched band represent the unfolded data measurements and their total uncertainties. Overlaid are the predictions together with their uncertainties. The lower plots show the ratio of each prediction to the unfolded data. |
png pdf |
Figure 5:
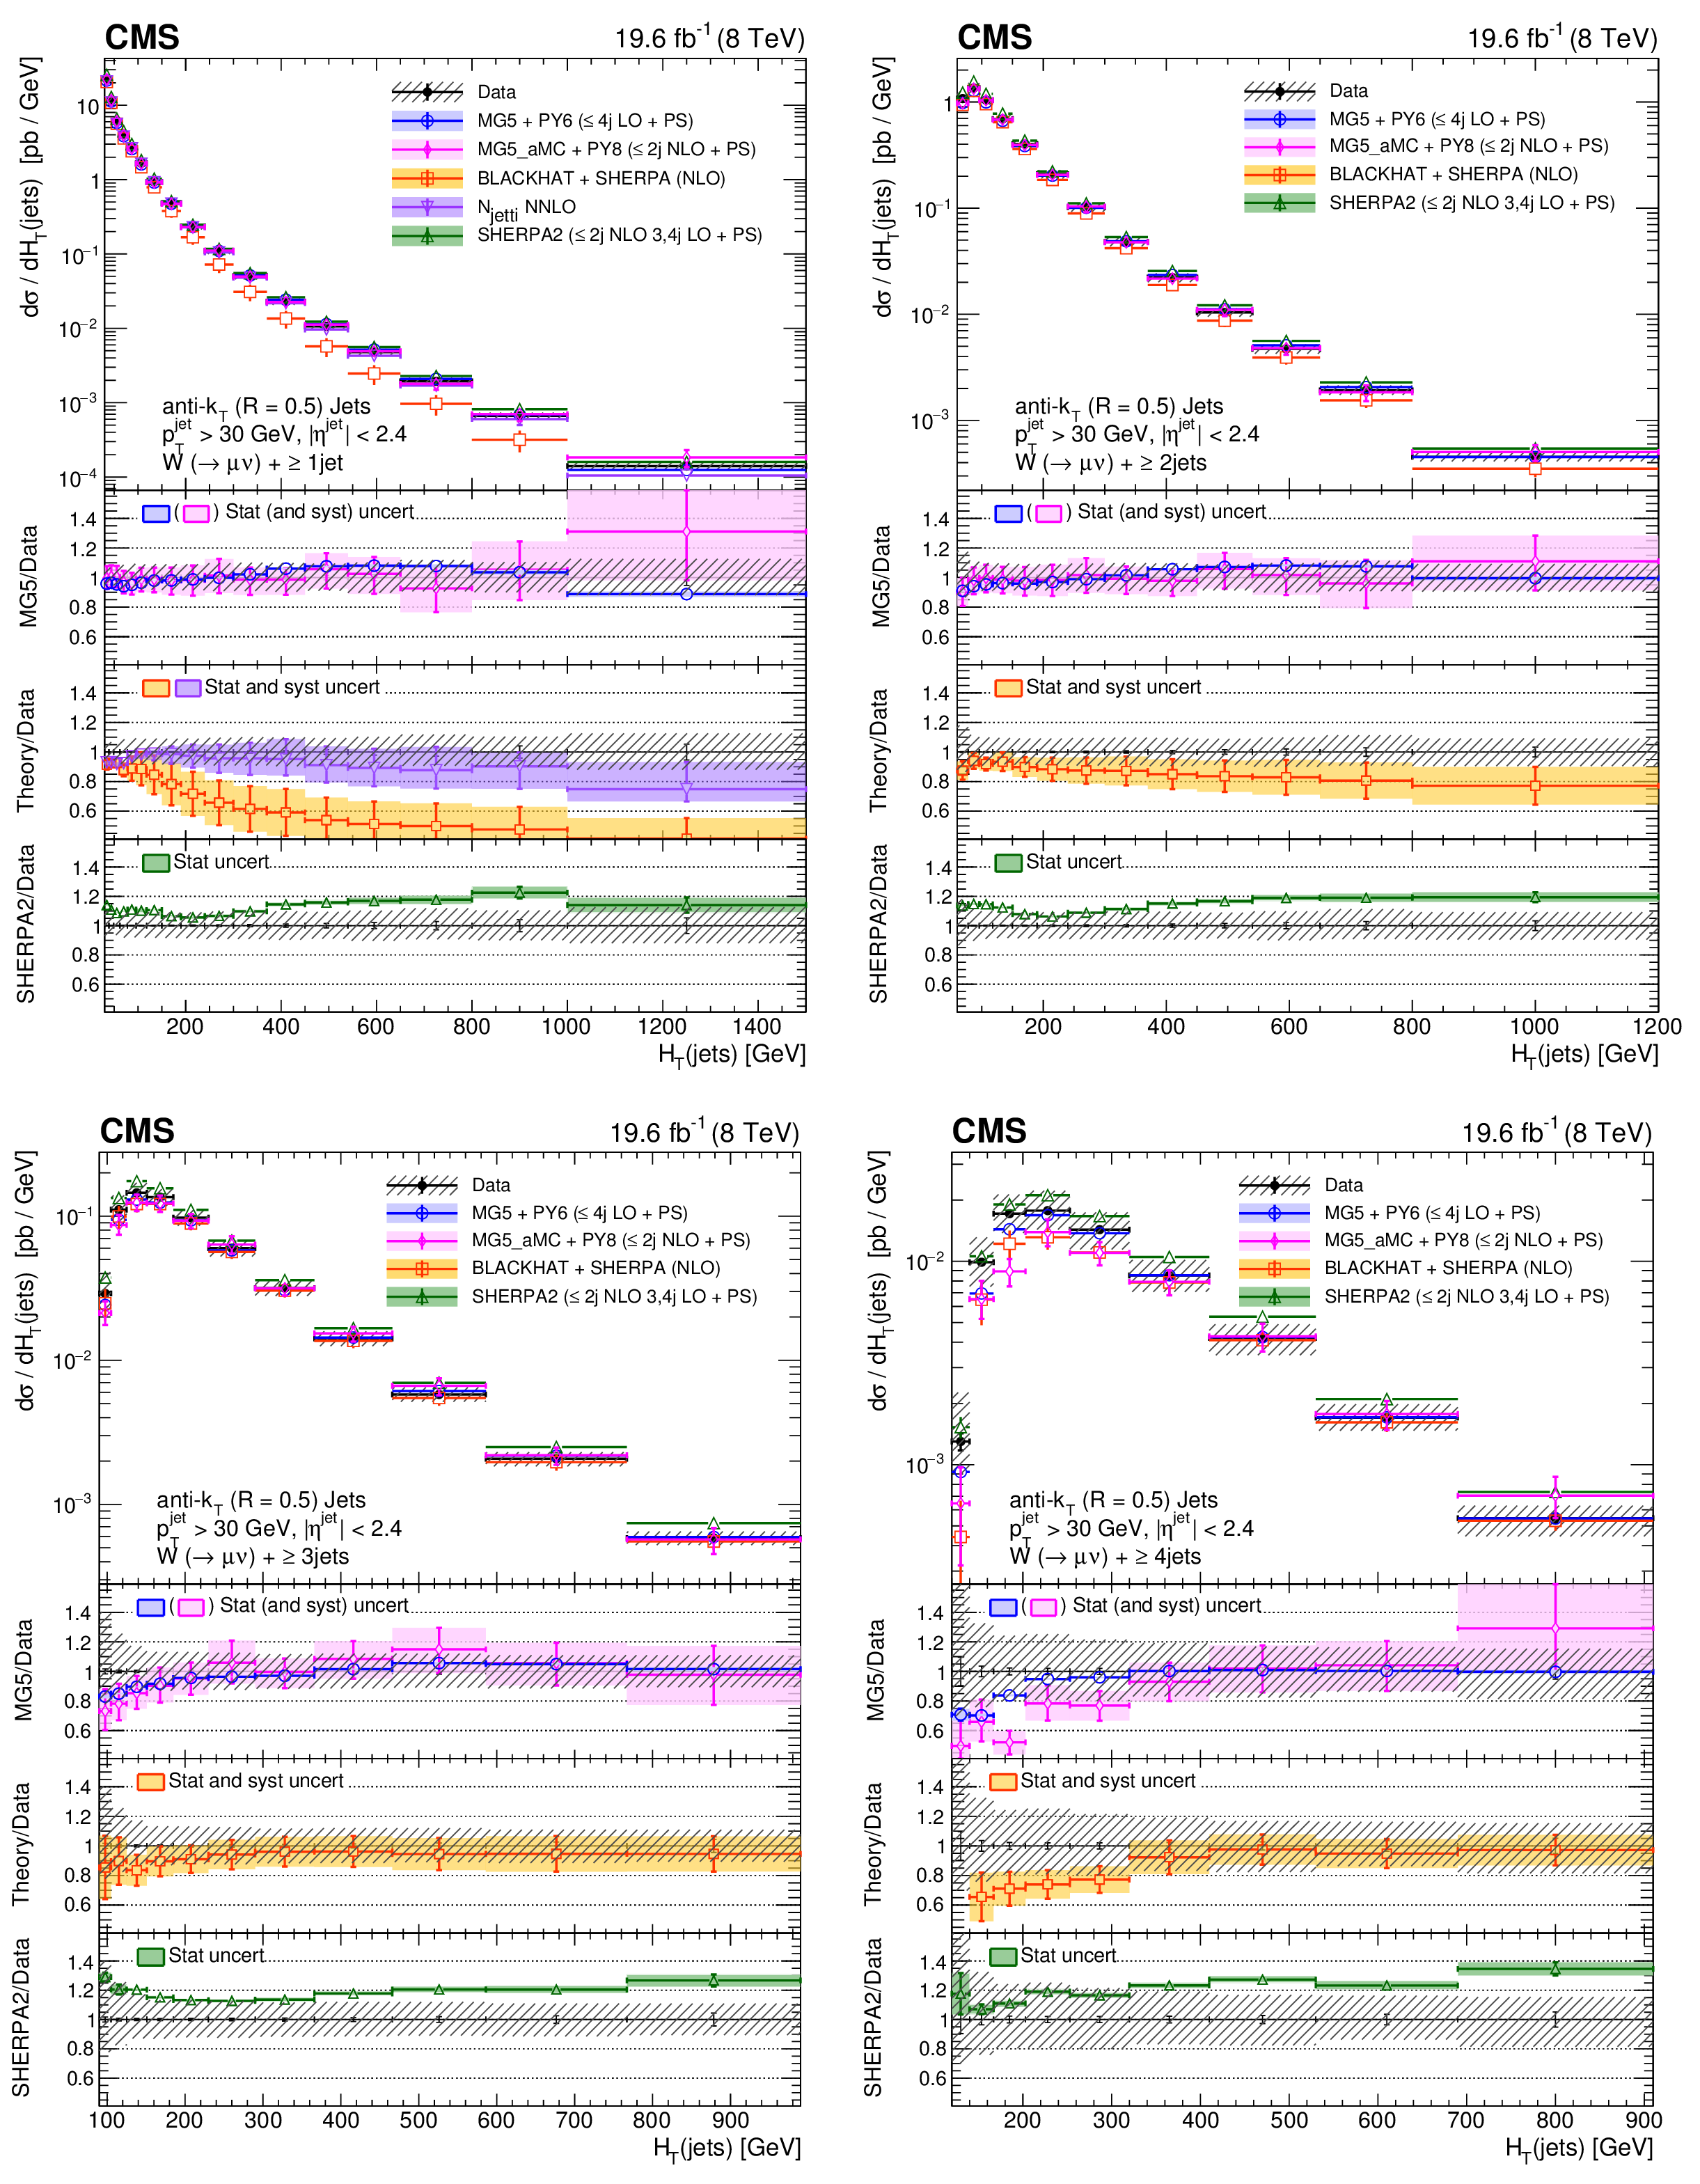
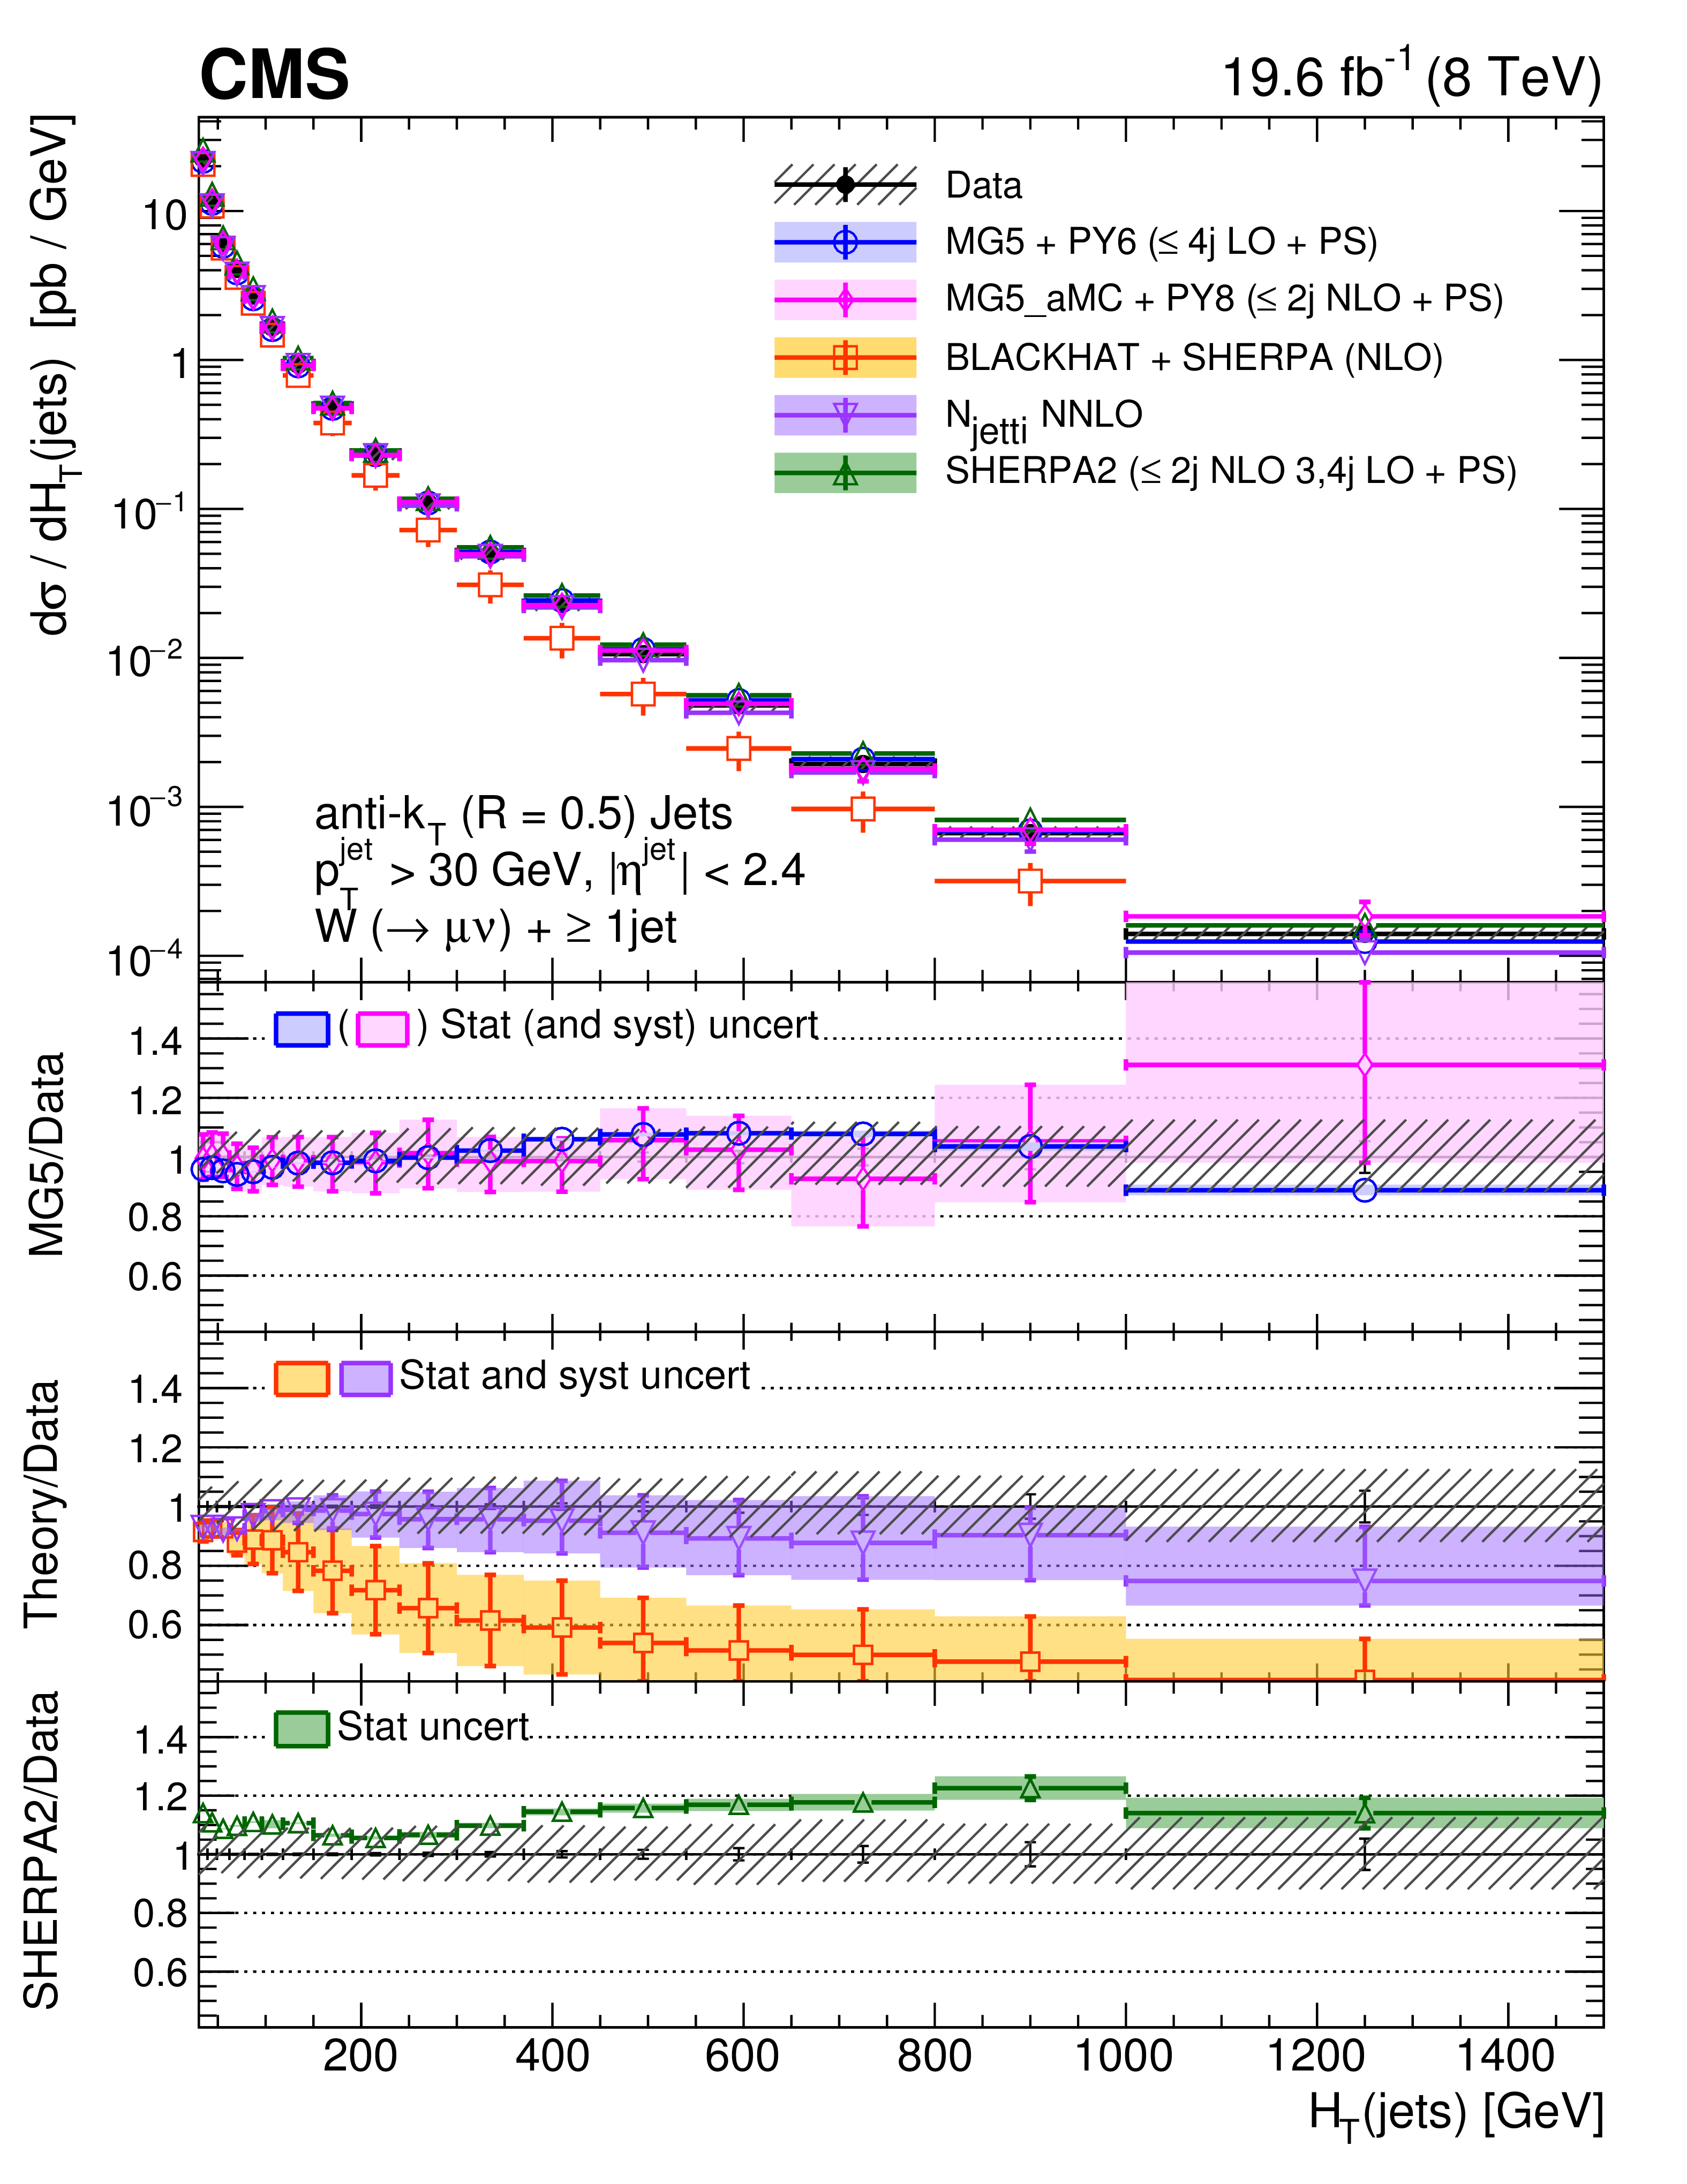
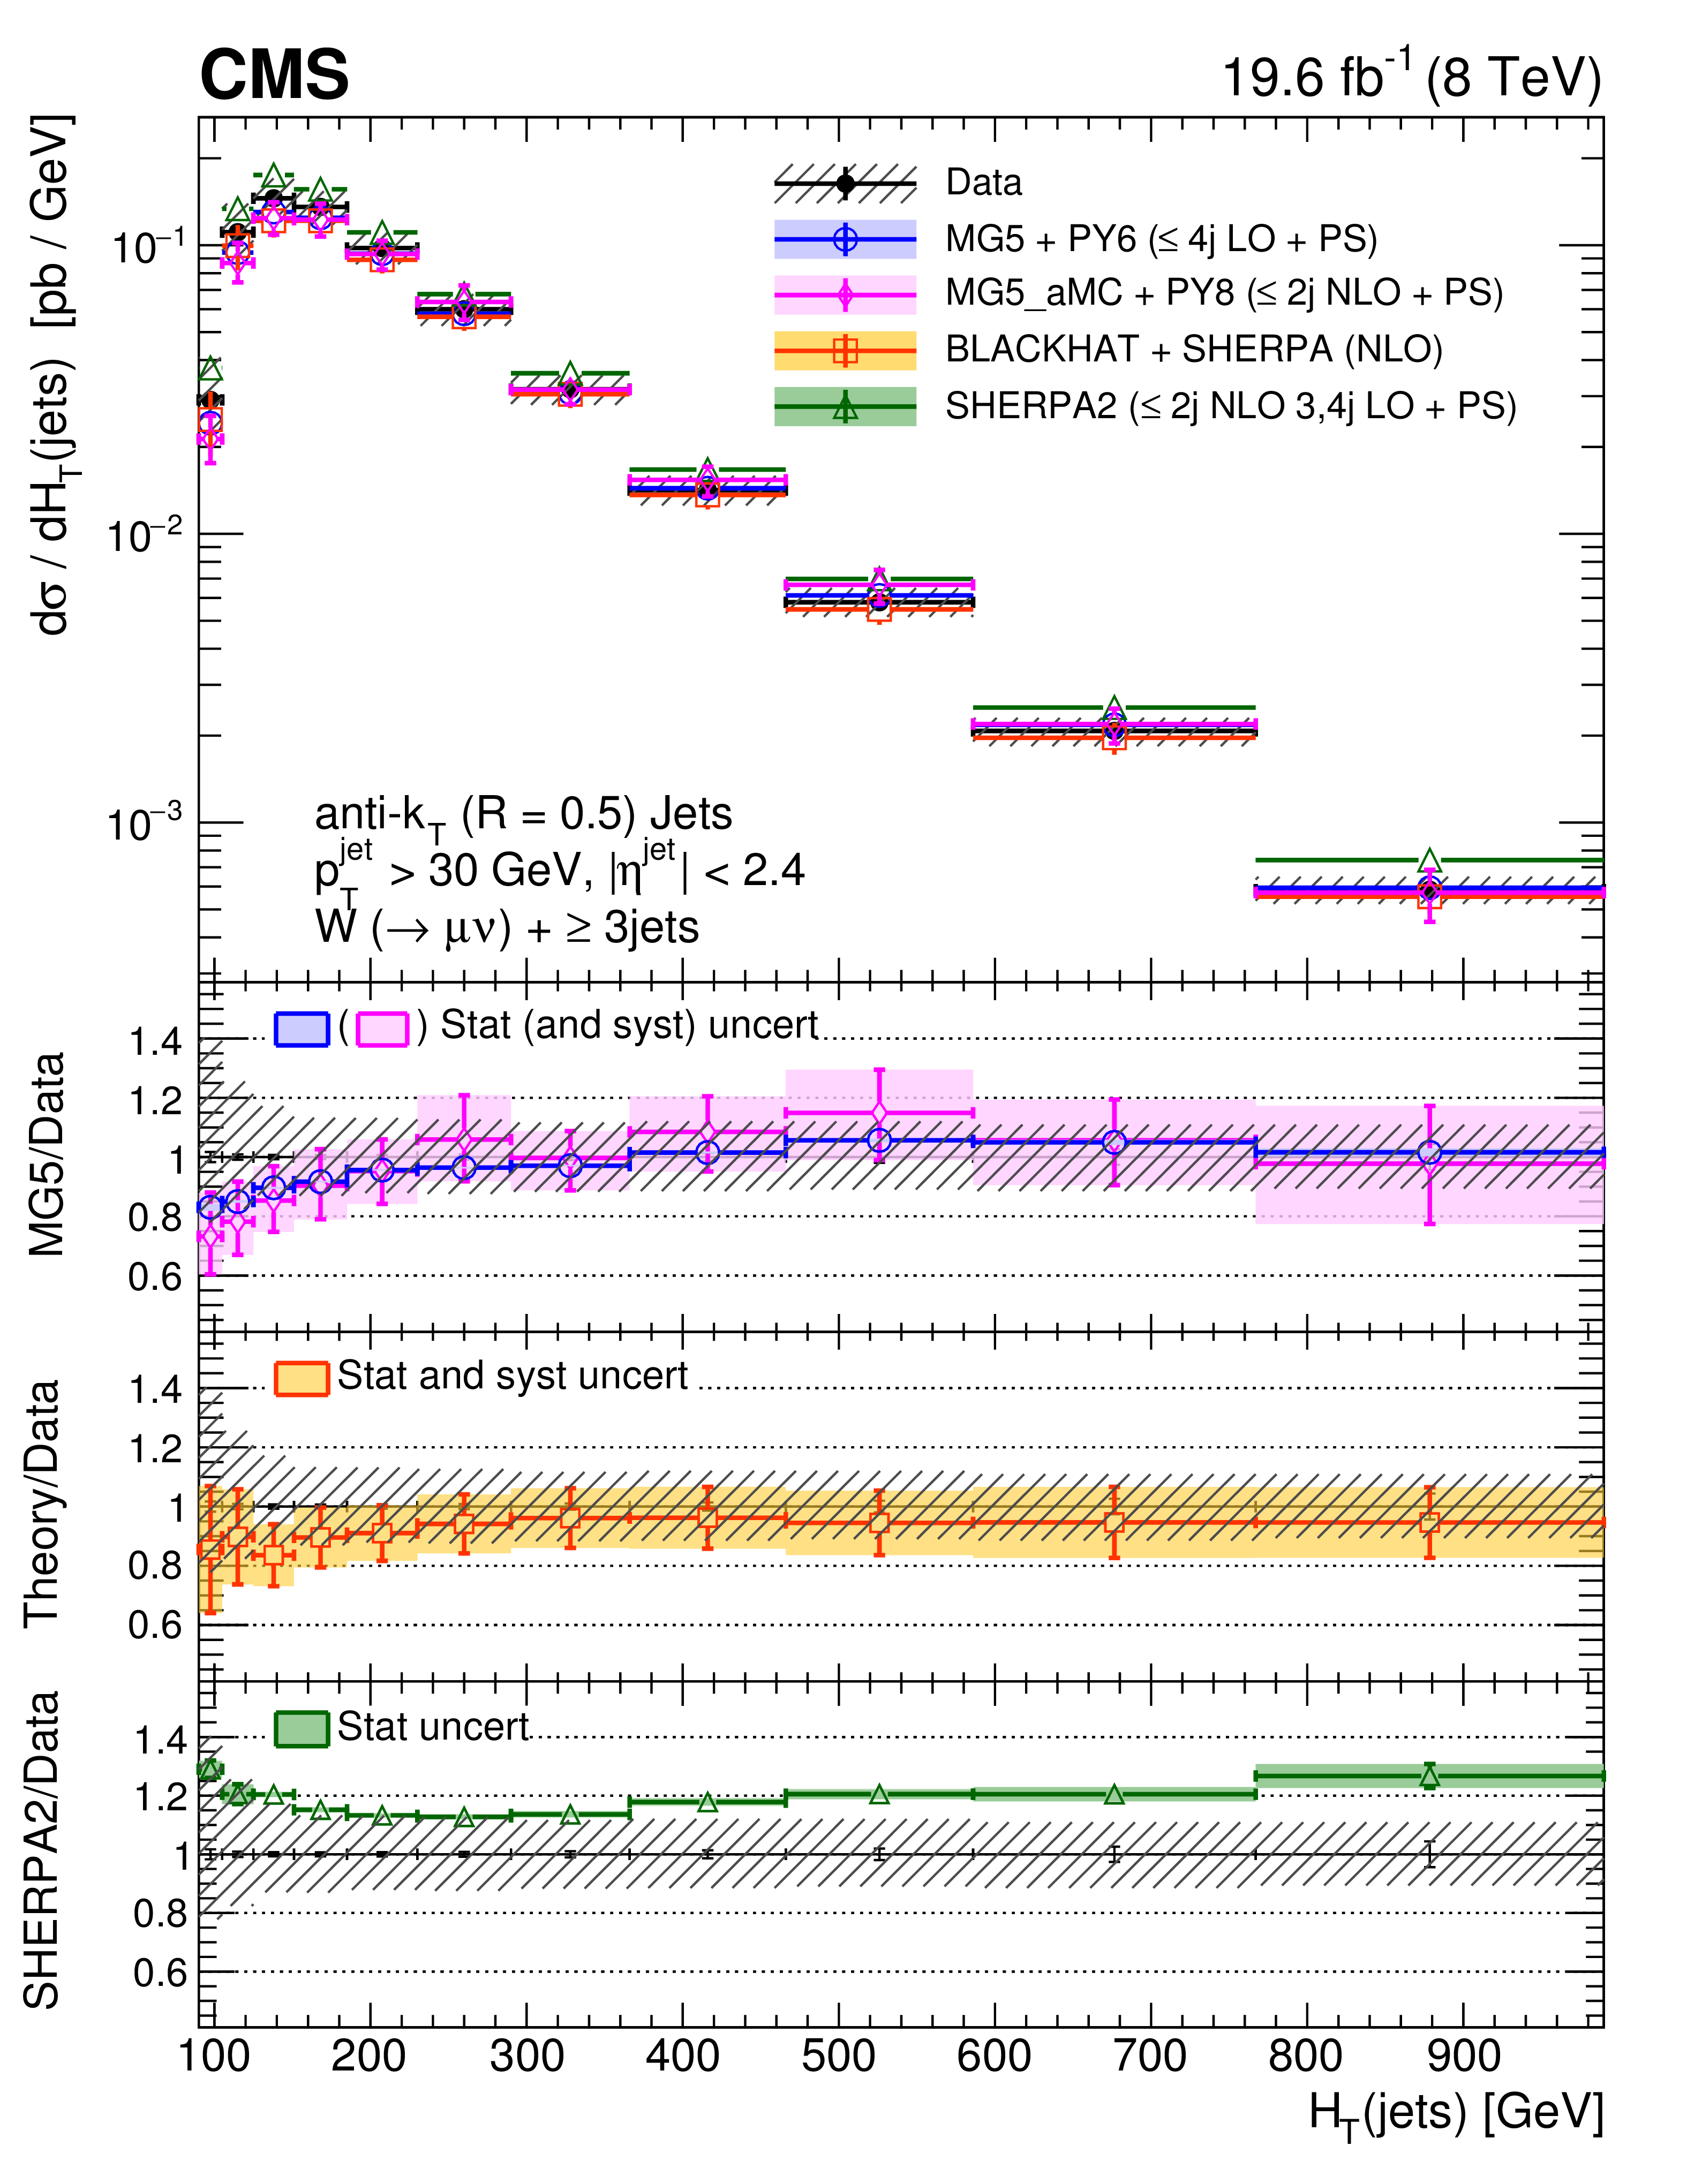
Cross sections differential in $ {H_{\mathrm {T}}} $ for inclusive jet multiplicities 1-4, compared to the predictions of MadGraph, MadGraph-5-aMC@NLO, SHERPA-2, BLACKHAT+SHERPA, and NNLO inclusive one-jet production (indicated as $\rm N_{jetti}$ NNLO). The BLACKHAT+SHERPA and NNLO predictions are corrected for hadronization and multiple-parton interaction effects. Black circular markers with the gray hatched band represent the unfolded data measurements and their total uncertainties. Overlaid are the predictions together with their uncertainties. The lower plots show the ratio of each prediction to the unfolded data. |
png pdf |
Figure 5-a:
Cross section differential in $ {H_{\mathrm {T}}} $ for inclusive jet multiplicity 1, compared to the predictions of MadGraph, MadGraph-5-aMC@NLO, SHERPA-2, BLACKHAT+SHERPA, and NNLO inclusive one-jet production (indicated as $\rm N_{jetti}$ NNLO). The BLACKHAT+SHERPA and NNLO predictions are corrected for hadronization and multiple-parton interaction effects. Black circular markers with the gray hatched band represent the unfolded data measurements and their total uncertainties. Overlaid are the predictions together with their uncertainties. The lower plots show the ratio of each prediction to the unfolded data. |

png pdf |
Figure 5-b:
Cross section differential in $ {H_{\mathrm {T}}} $ for inclusive jet multiplicity 2, compared to the predictions of MadGraph, MadGraph-5-aMC@NLO, SHERPA-2, BLACKHAT+SHERPA, and NNLO inclusive one-jet production (indicated as $\rm N_{jetti}$ NNLO). The BLACKHAT+SHERPA and NNLO predictions are corrected for hadronization and multiple-parton interaction effects. Black circular markers with the gray hatched band represent the unfolded data measurements and their total uncertainties. Overlaid are the predictions together with their uncertainties. The lower plots show the ratio of each prediction to the unfolded data. |
png pdf |
Figure 5-c:
Cross section differential in $ {H_{\mathrm {T}}} $ for inclusive jet multiplicity 3, compared to the predictions of MadGraph, MadGraph-5-aMC@NLO, SHERPA-2, BLACKHAT+SHERPA, and NNLO inclusive one-jet production (indicated as $\rm N_{jetti}$ NNLO). The BLACKHAT+SHERPA and NNLO predictions are corrected for hadronization and multiple-parton interaction effects. Black circular markers with the gray hatched band represent the unfolded data measurements and their total uncertainties. Overlaid are the predictions together with their uncertainties. The lower plots show the ratio of each prediction to the unfolded data. |
png pdf |
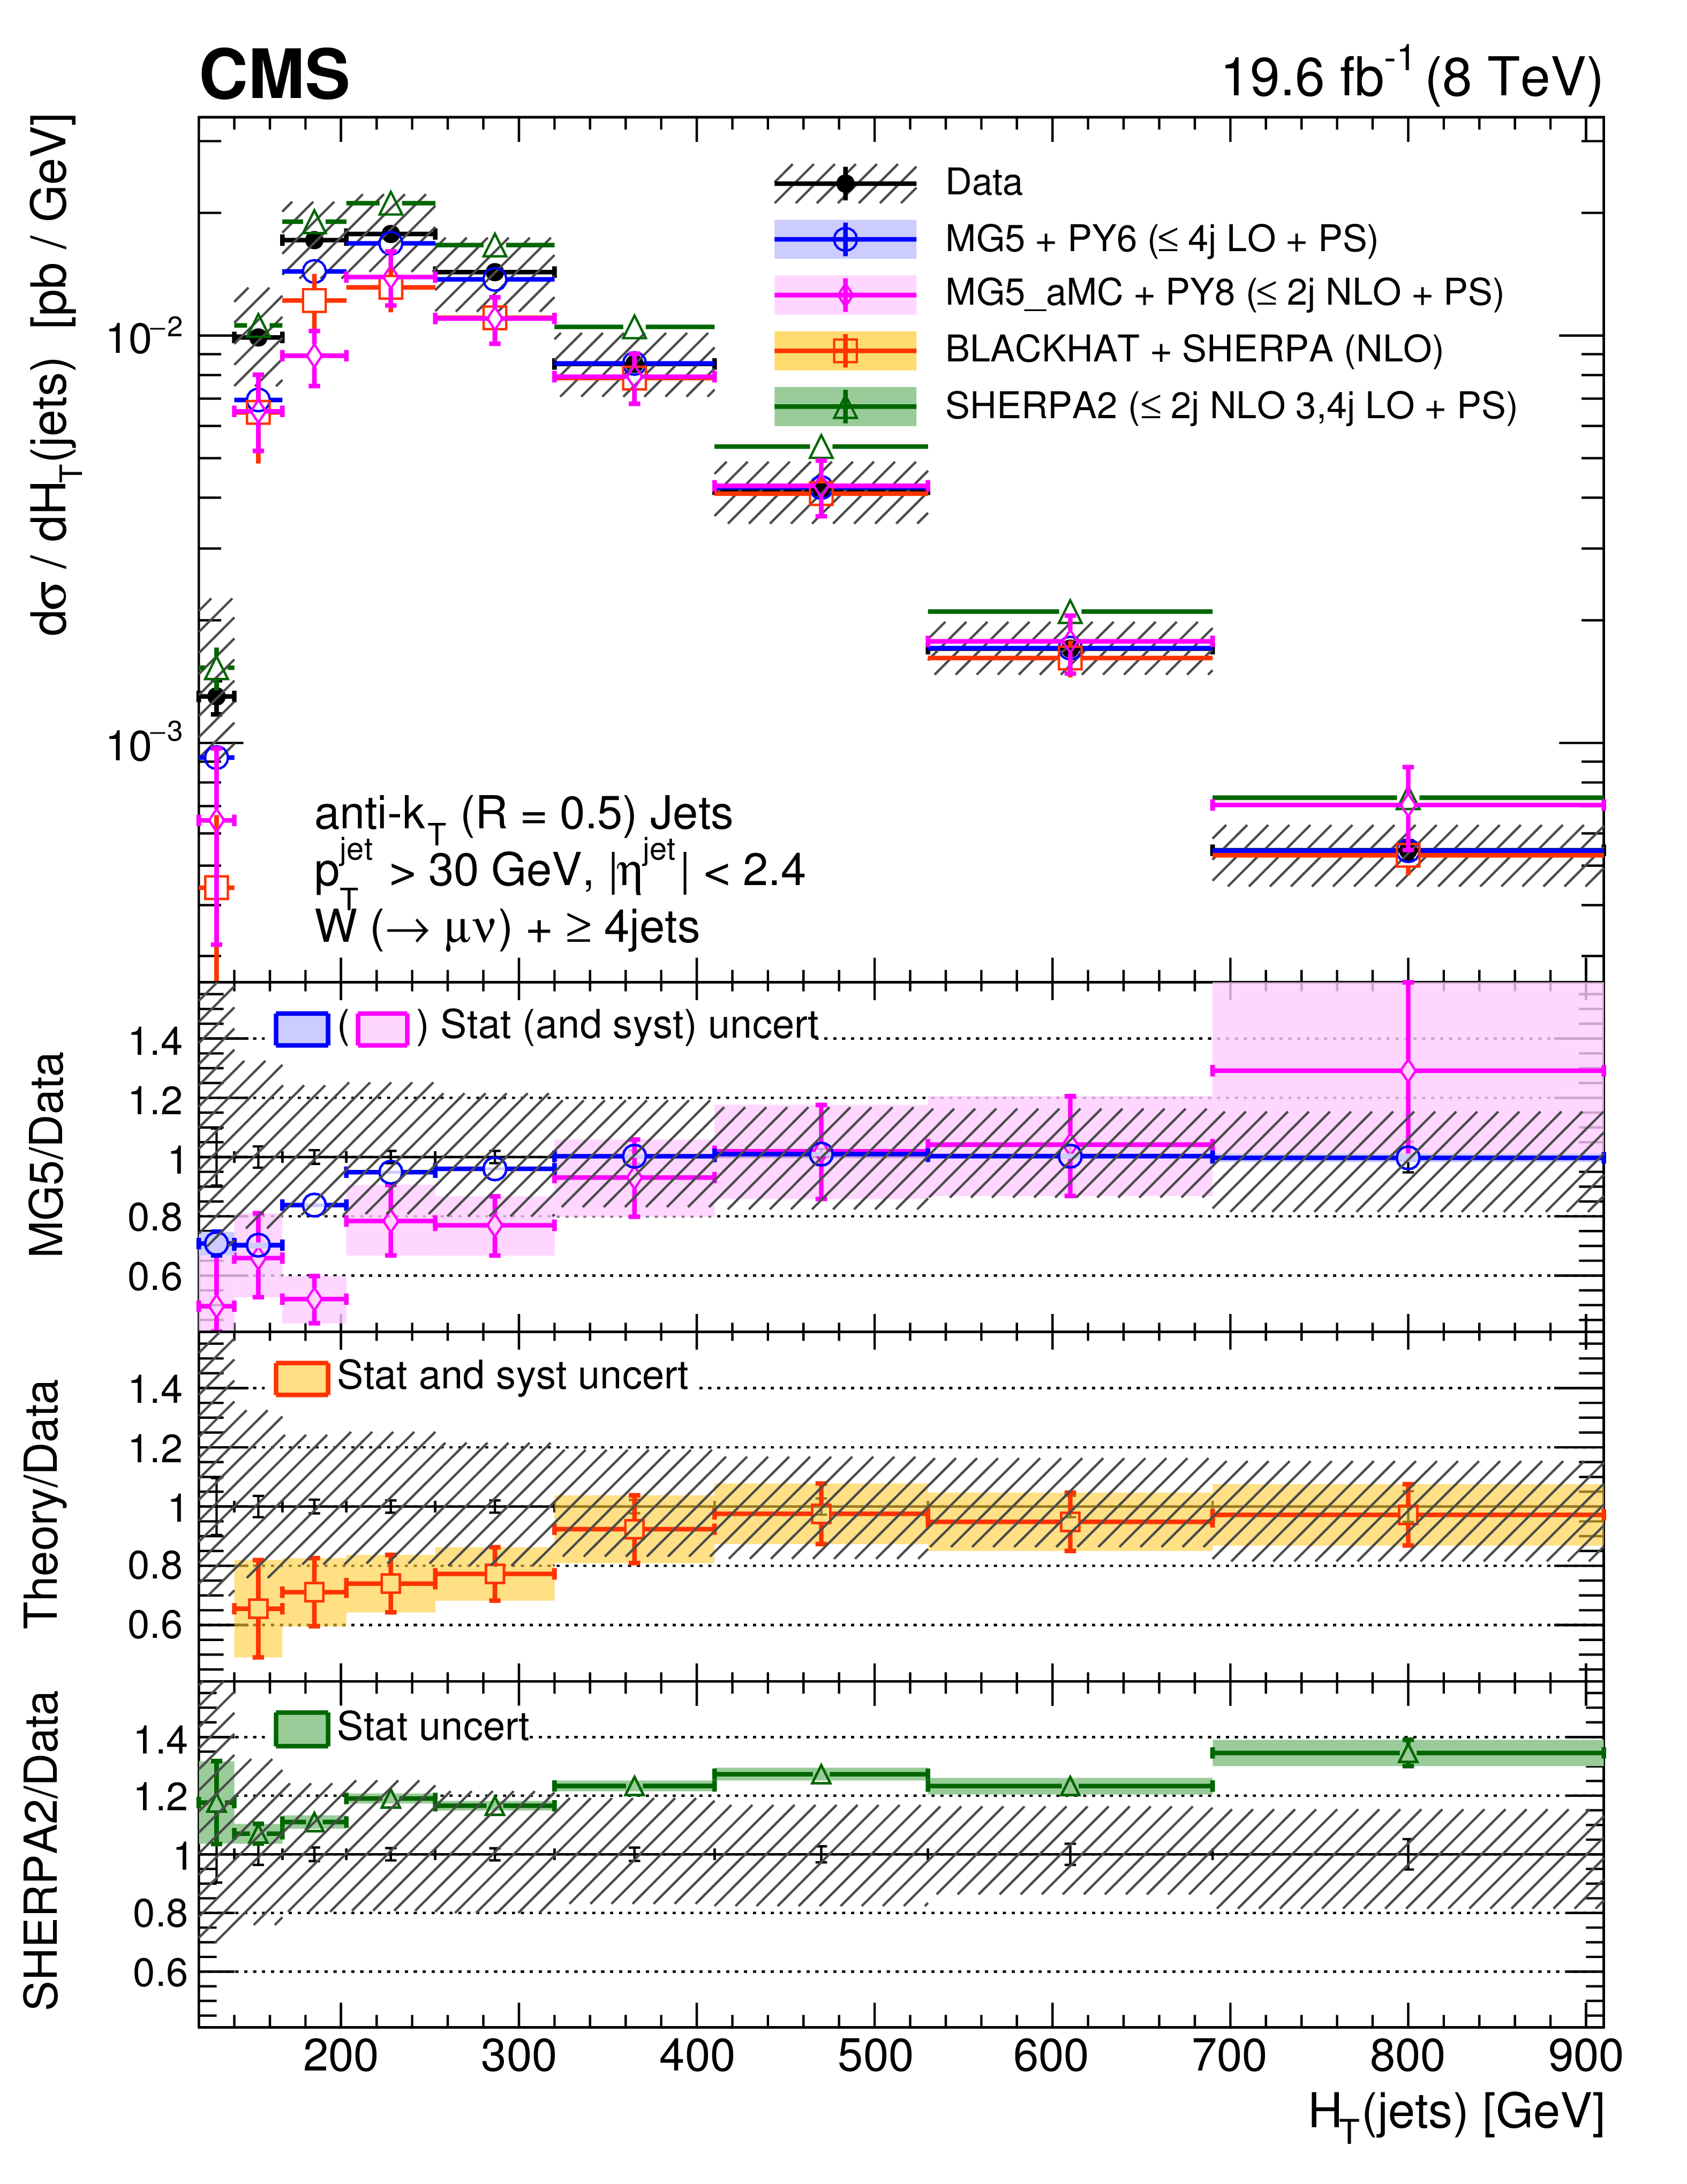
Figure 5-d:
Cross section differential in $ {H_{\mathrm {T}}} $ for inclusive jet multiplicity 4, compared to the predictions of MadGraph, MadGraph-5-aMC@NLO, SHERPA-2, BLACKHAT+SHERPA, and NNLO inclusive one-jet production (indicated as $\rm N_{jetti}$ NNLO). The BLACKHAT+SHERPA and NNLO predictions are corrected for hadronization and multiple-parton interaction effects. Black circular markers with the gray hatched band represent the unfolded data measurements and their total uncertainties. Overlaid are the predictions together with their uncertainties. The lower plots show the ratio of each prediction to the unfolded data. |
png pdf |
Figure 6:
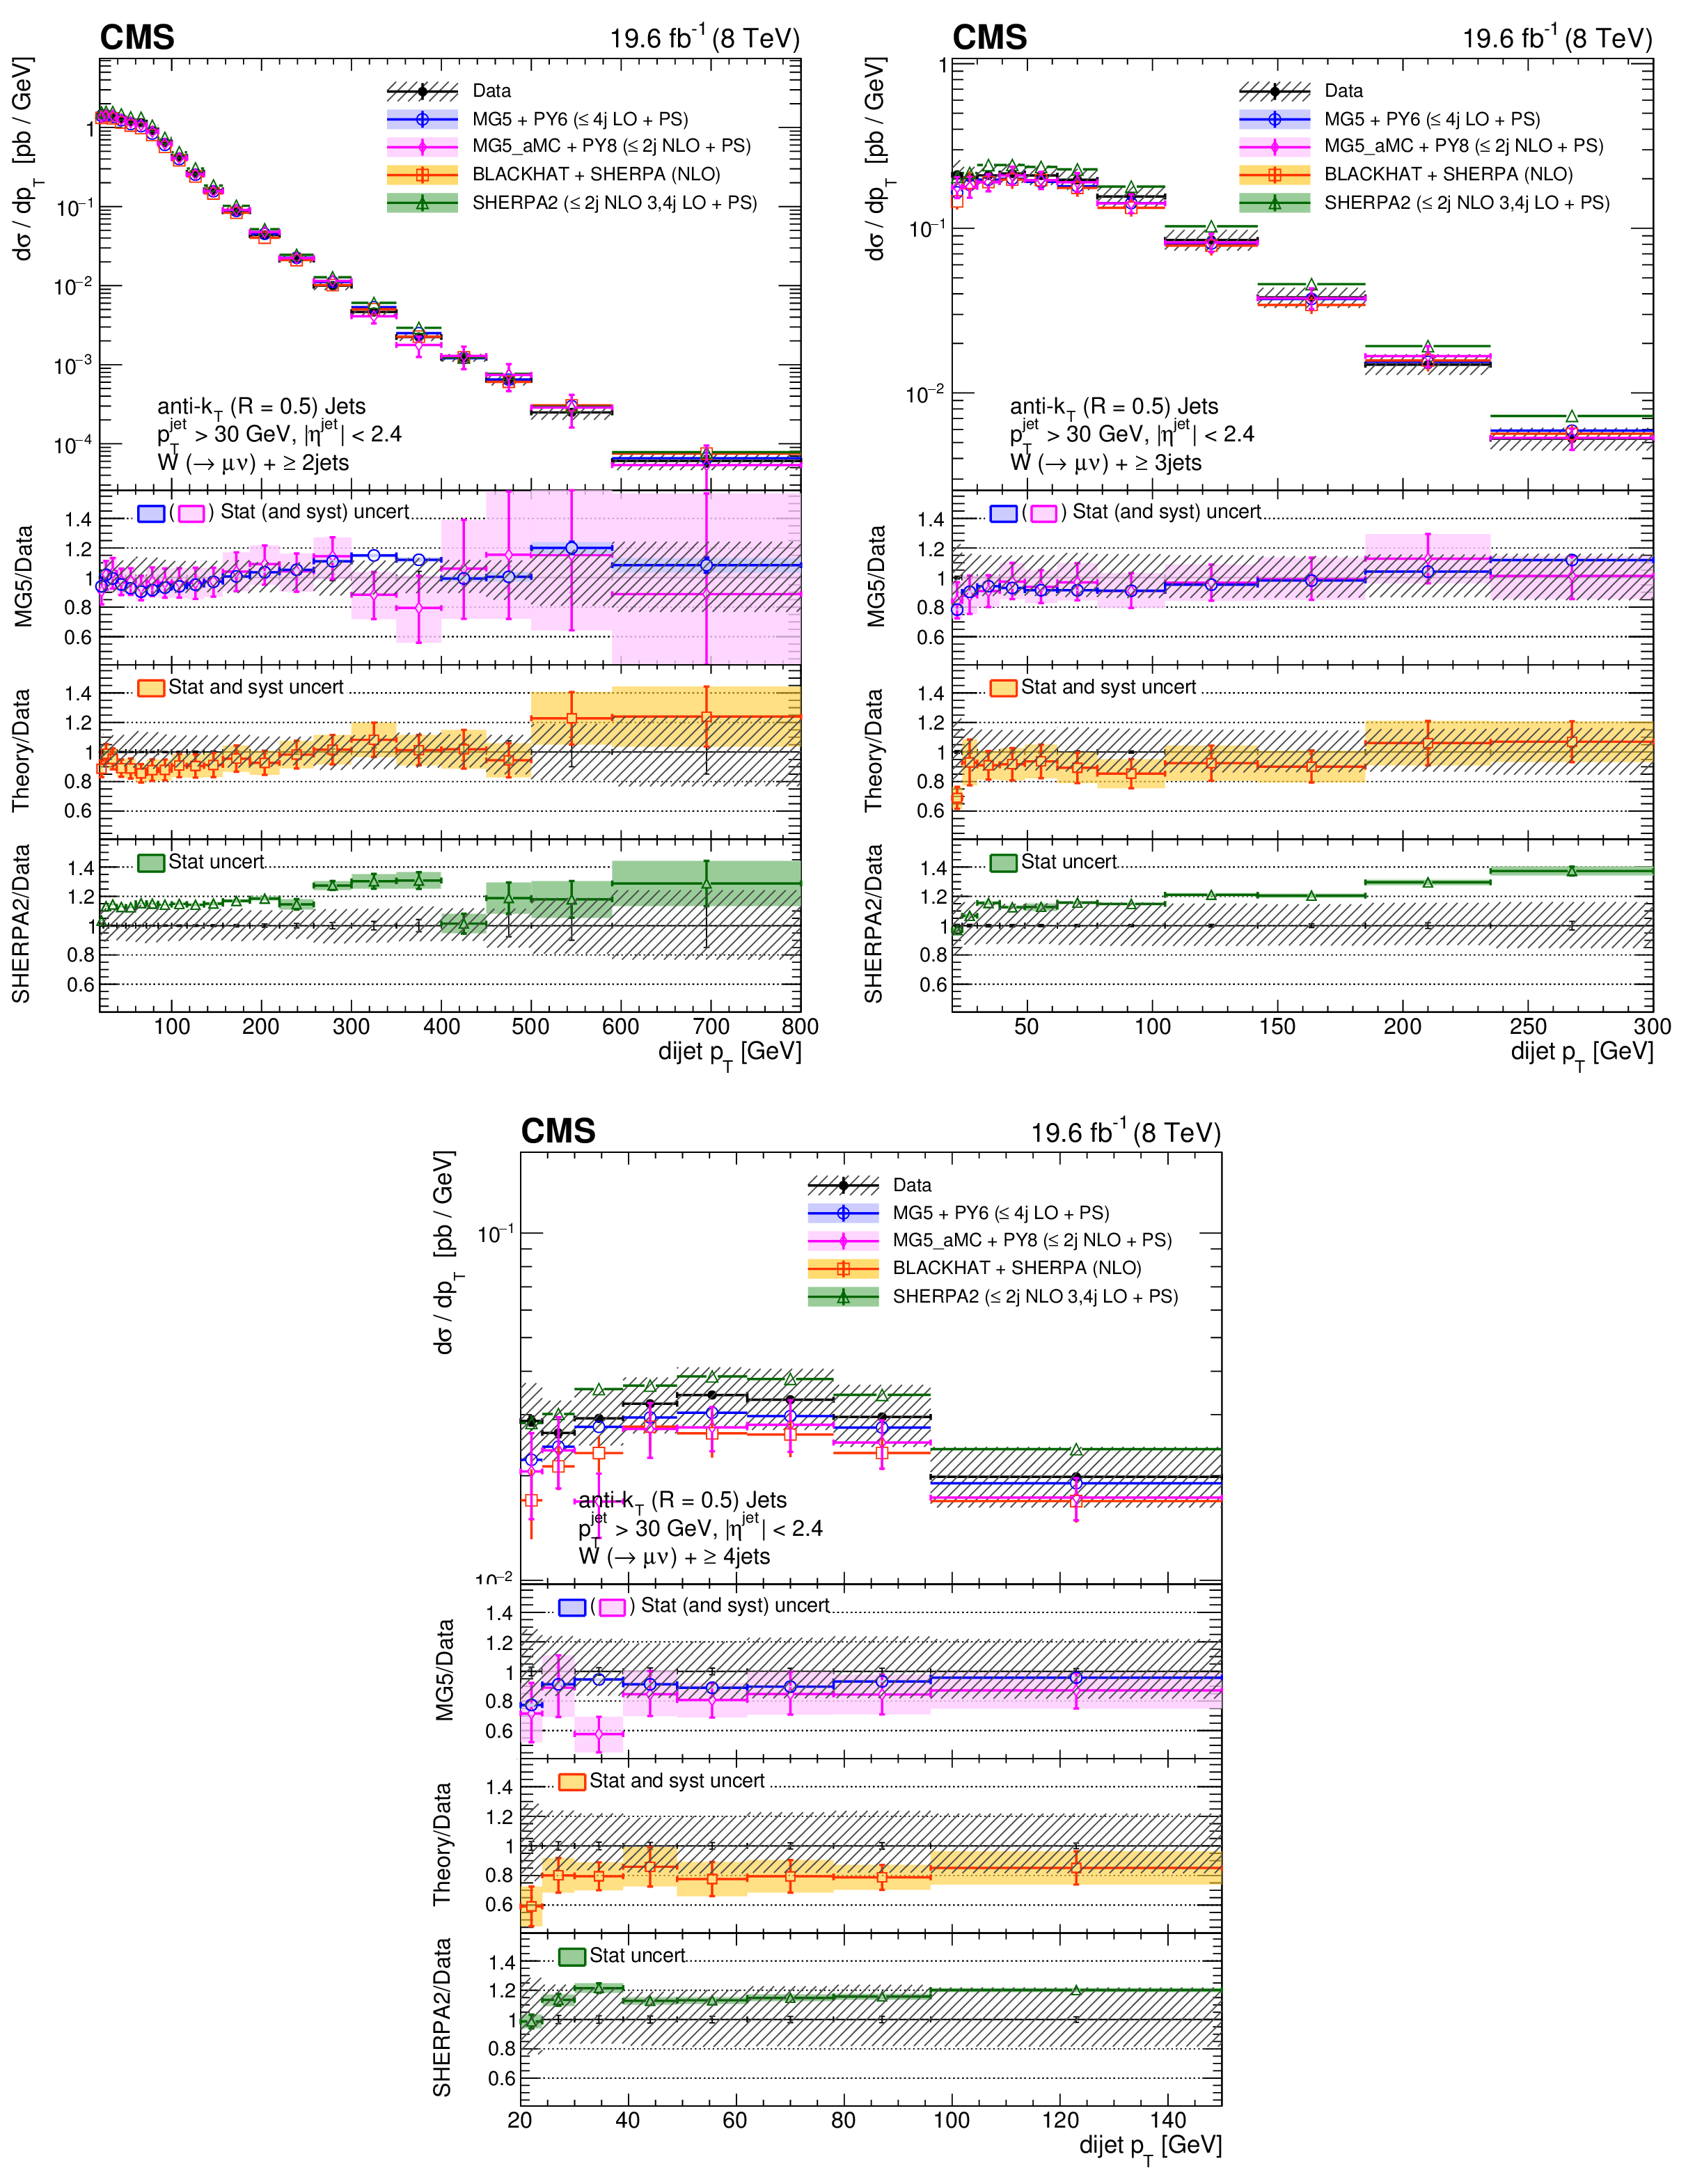
Cross sections differential in dijet ${p_{\mathrm {T}}}$ (calculated from the two leading jets) for inclusive jet multiplicities 2-4, compared to the predictions of MadGraph, MadGraph-5-aMC@NLO, SHERPA-2, and BLACKHAT+SHERPA (corrected for hadronization and multiple-parton interactions). Black circular markers with the gray hatched band represent the unfolded data measurements and their total uncertainties. Overlaid are the predictions together with their uncertainties. The lower plots show the ratio of each prediction to the unfolded data. |

png pdf |
Figure 6-a:
Cross section differential in dijet ${p_{\mathrm {T}}}$ (calculated from the two leading jets) for inclusive jet multiplicity 2, compared to the predictions of MadGraph, MadGraph-5-aMC@NLO, SHERPA-2, and BLACKHAT+SHERPA (corrected for hadronization and multiple-parton interactions). Black circular markers with the gray hatched band represent the unfolded data measurements and their total uncertainties. Overlaid are the predictions together with their uncertainties. The lower plots show the ratio of each prediction to the unfolded data. |
png pdf |
Figure 6-b:
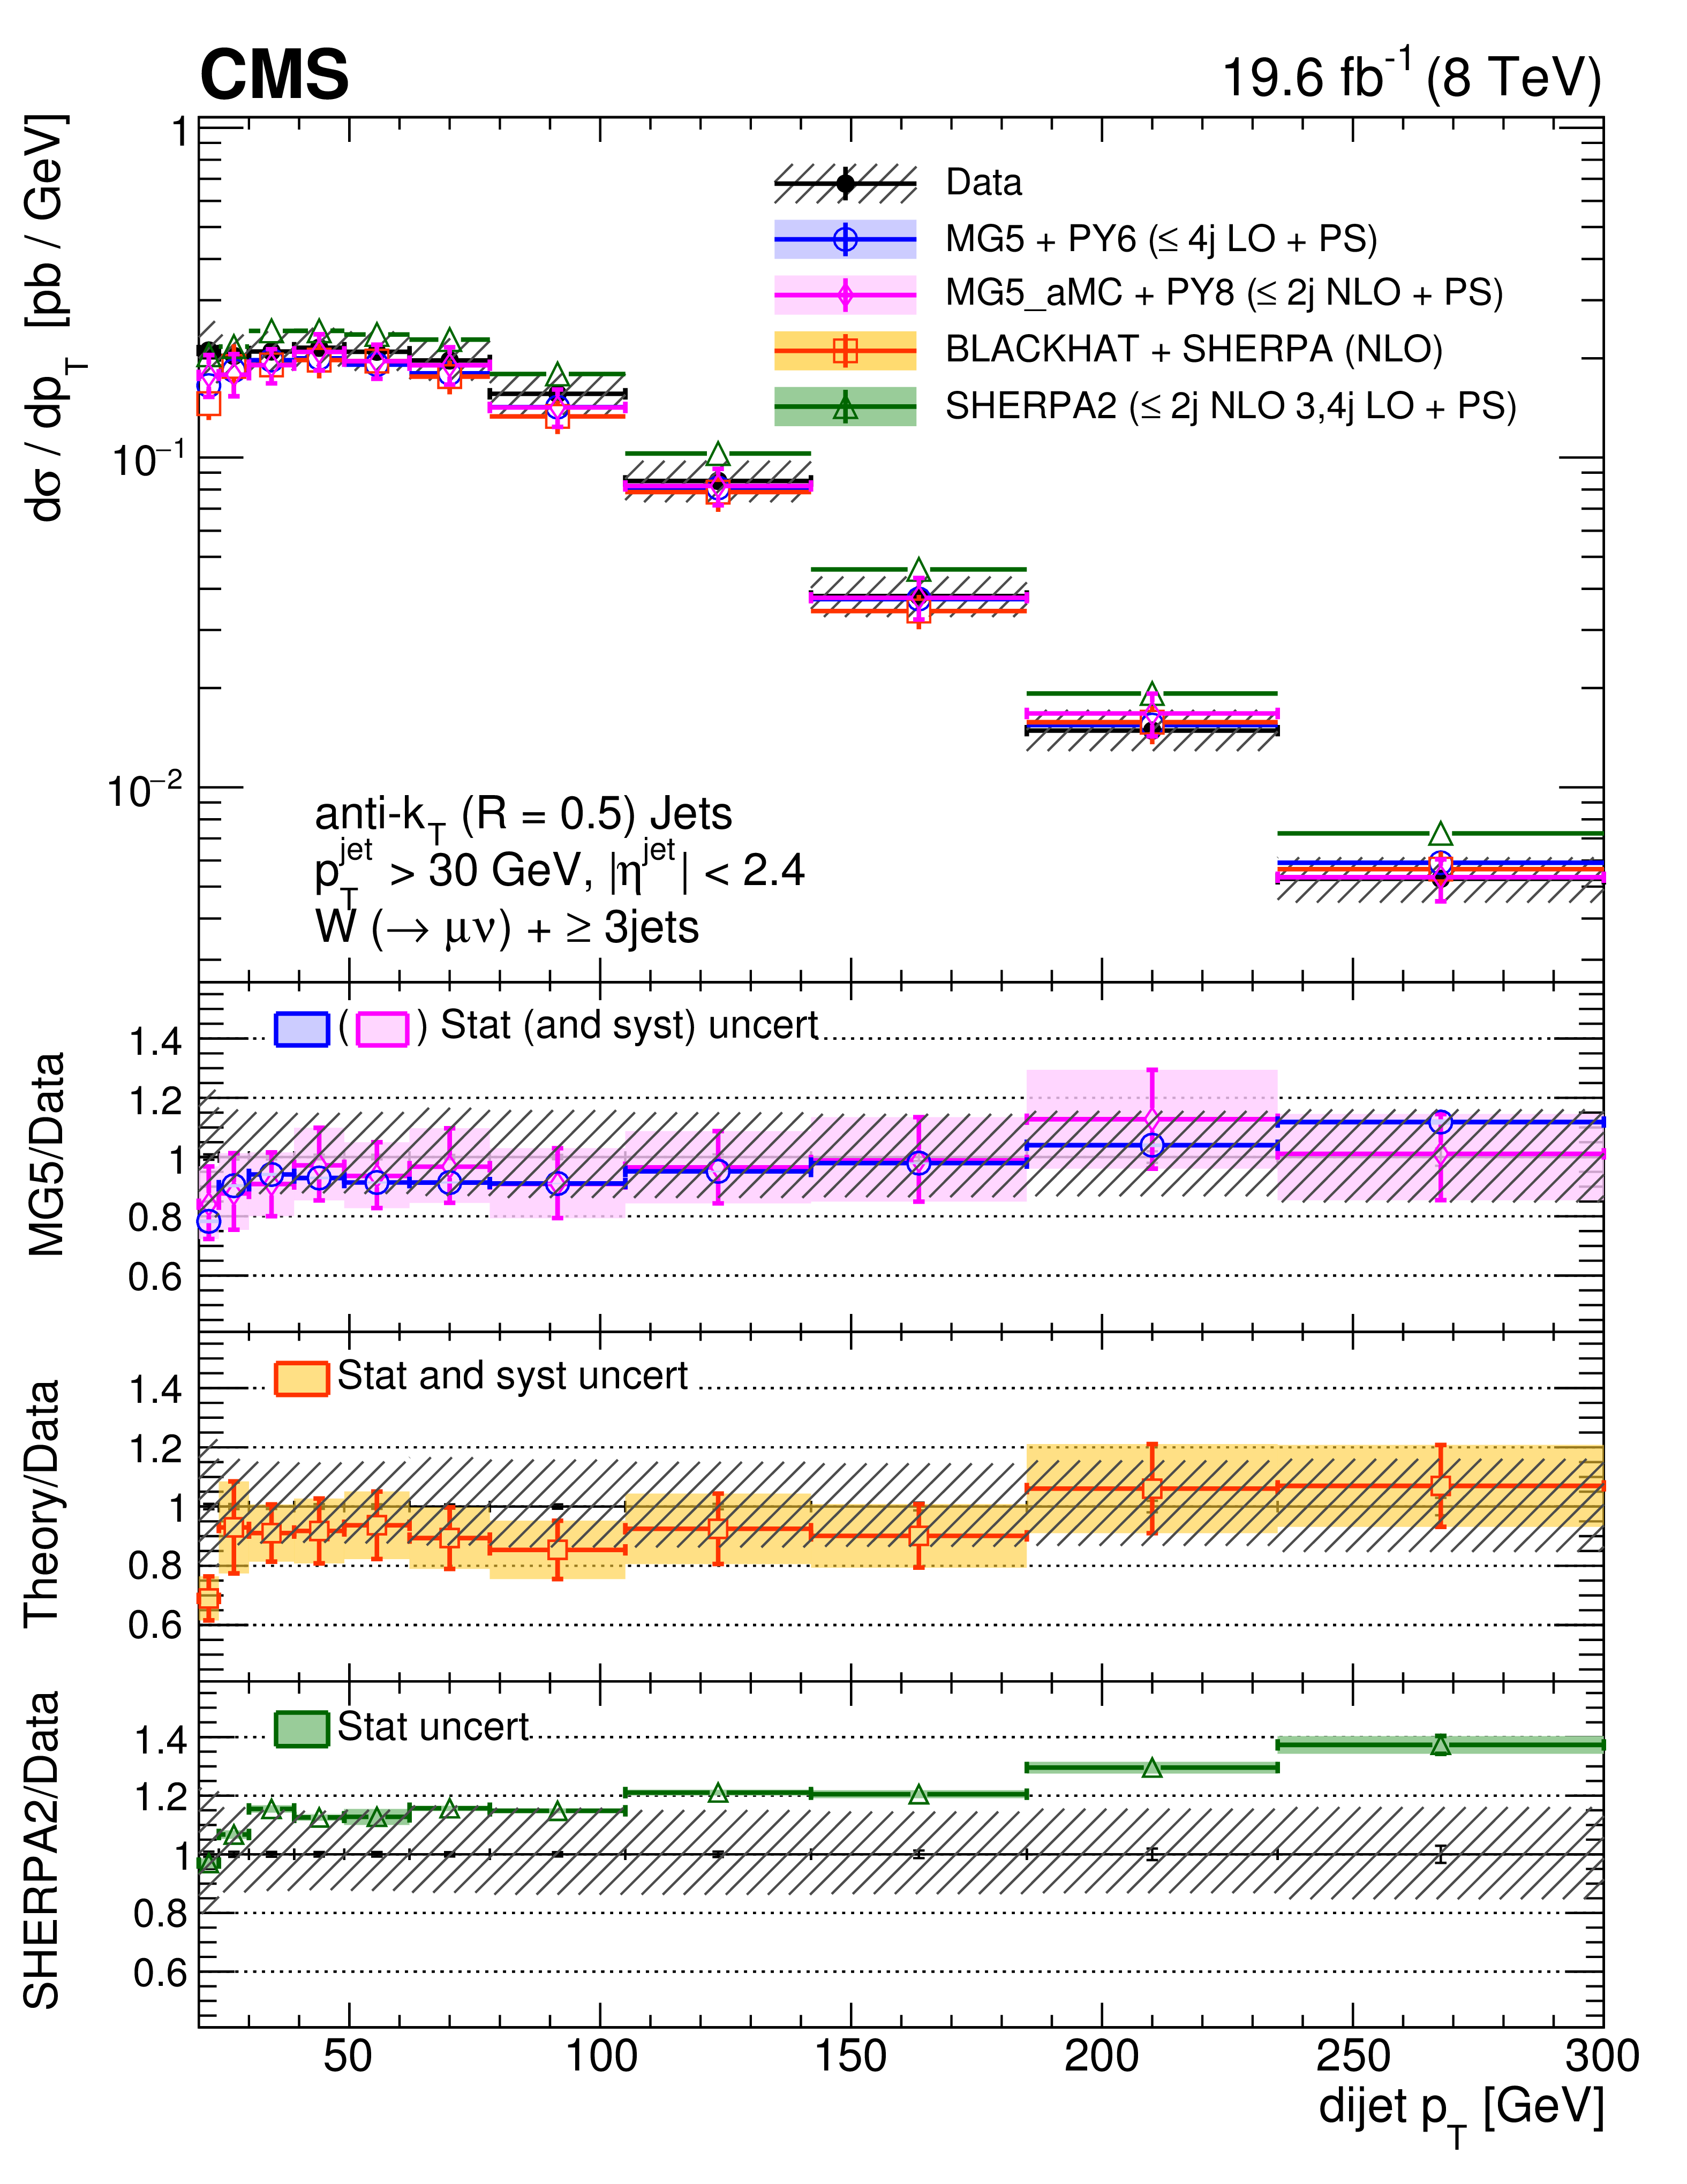
Cross section differential in dijet ${p_{\mathrm {T}}}$ (calculated from the two leading jets) for inclusive jet multiplicity 3, compared to the predictions of MadGraph, MadGraph-5-aMC@NLO, SHERPA-2, and BLACKHAT+SHERPA (corrected for hadronization and multiple-parton interactions). Black circular markers with the gray hatched band represent the unfolded data measurements and their total uncertainties. Overlaid are the predictions together with their uncertainties. The lower plots show the ratio of each prediction to the unfolded data. |

png pdf |
Figure 6-c:
Cross section differential in dijet ${p_{\mathrm {T}}}$ (calculated from the two leading jets) for inclusive jet multiplicity 4, compared to the predictions of MadGraph, MadGraph-5-aMC@NLO, SHERPA-2, and BLACKHAT+SHERPA (corrected for hadronization and multiple-parton interactions). Black circular markers with the gray hatched band represent the unfolded data measurements and their total uncertainties. Overlaid are the predictions together with their uncertainties. The lower plots show the ratio of each prediction to the unfolded data. |
png pdf |
Figure 7:
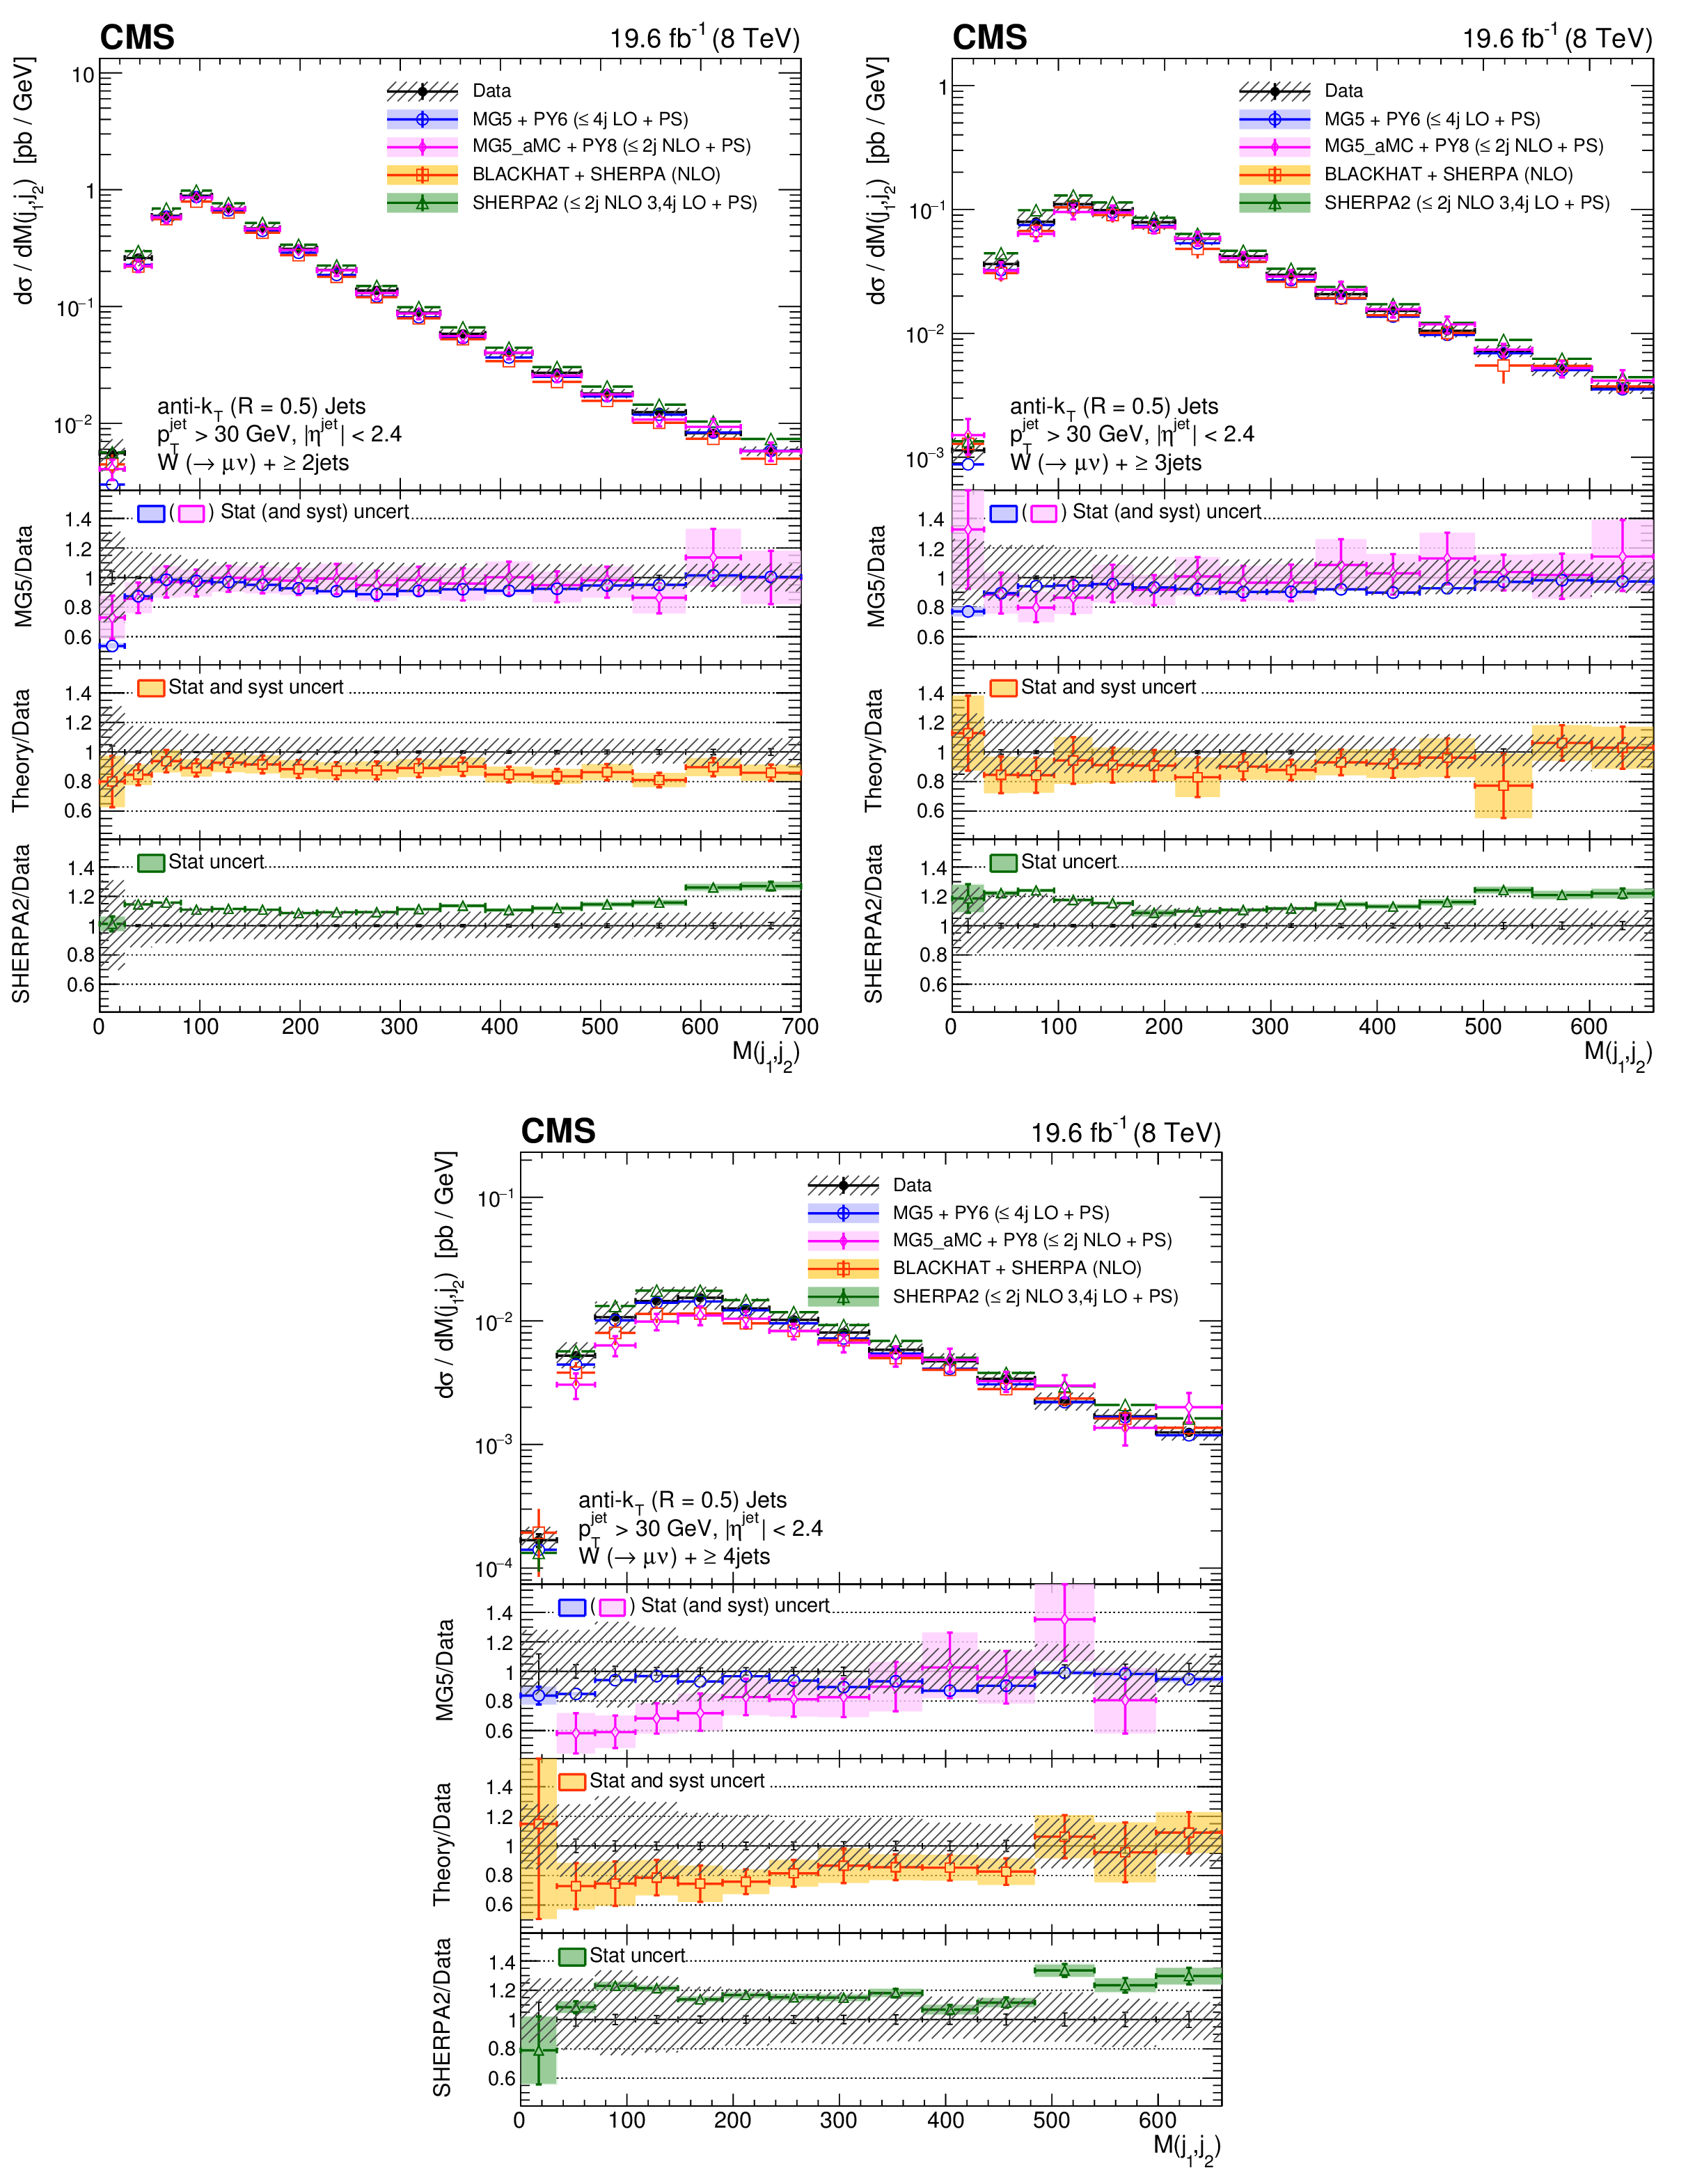
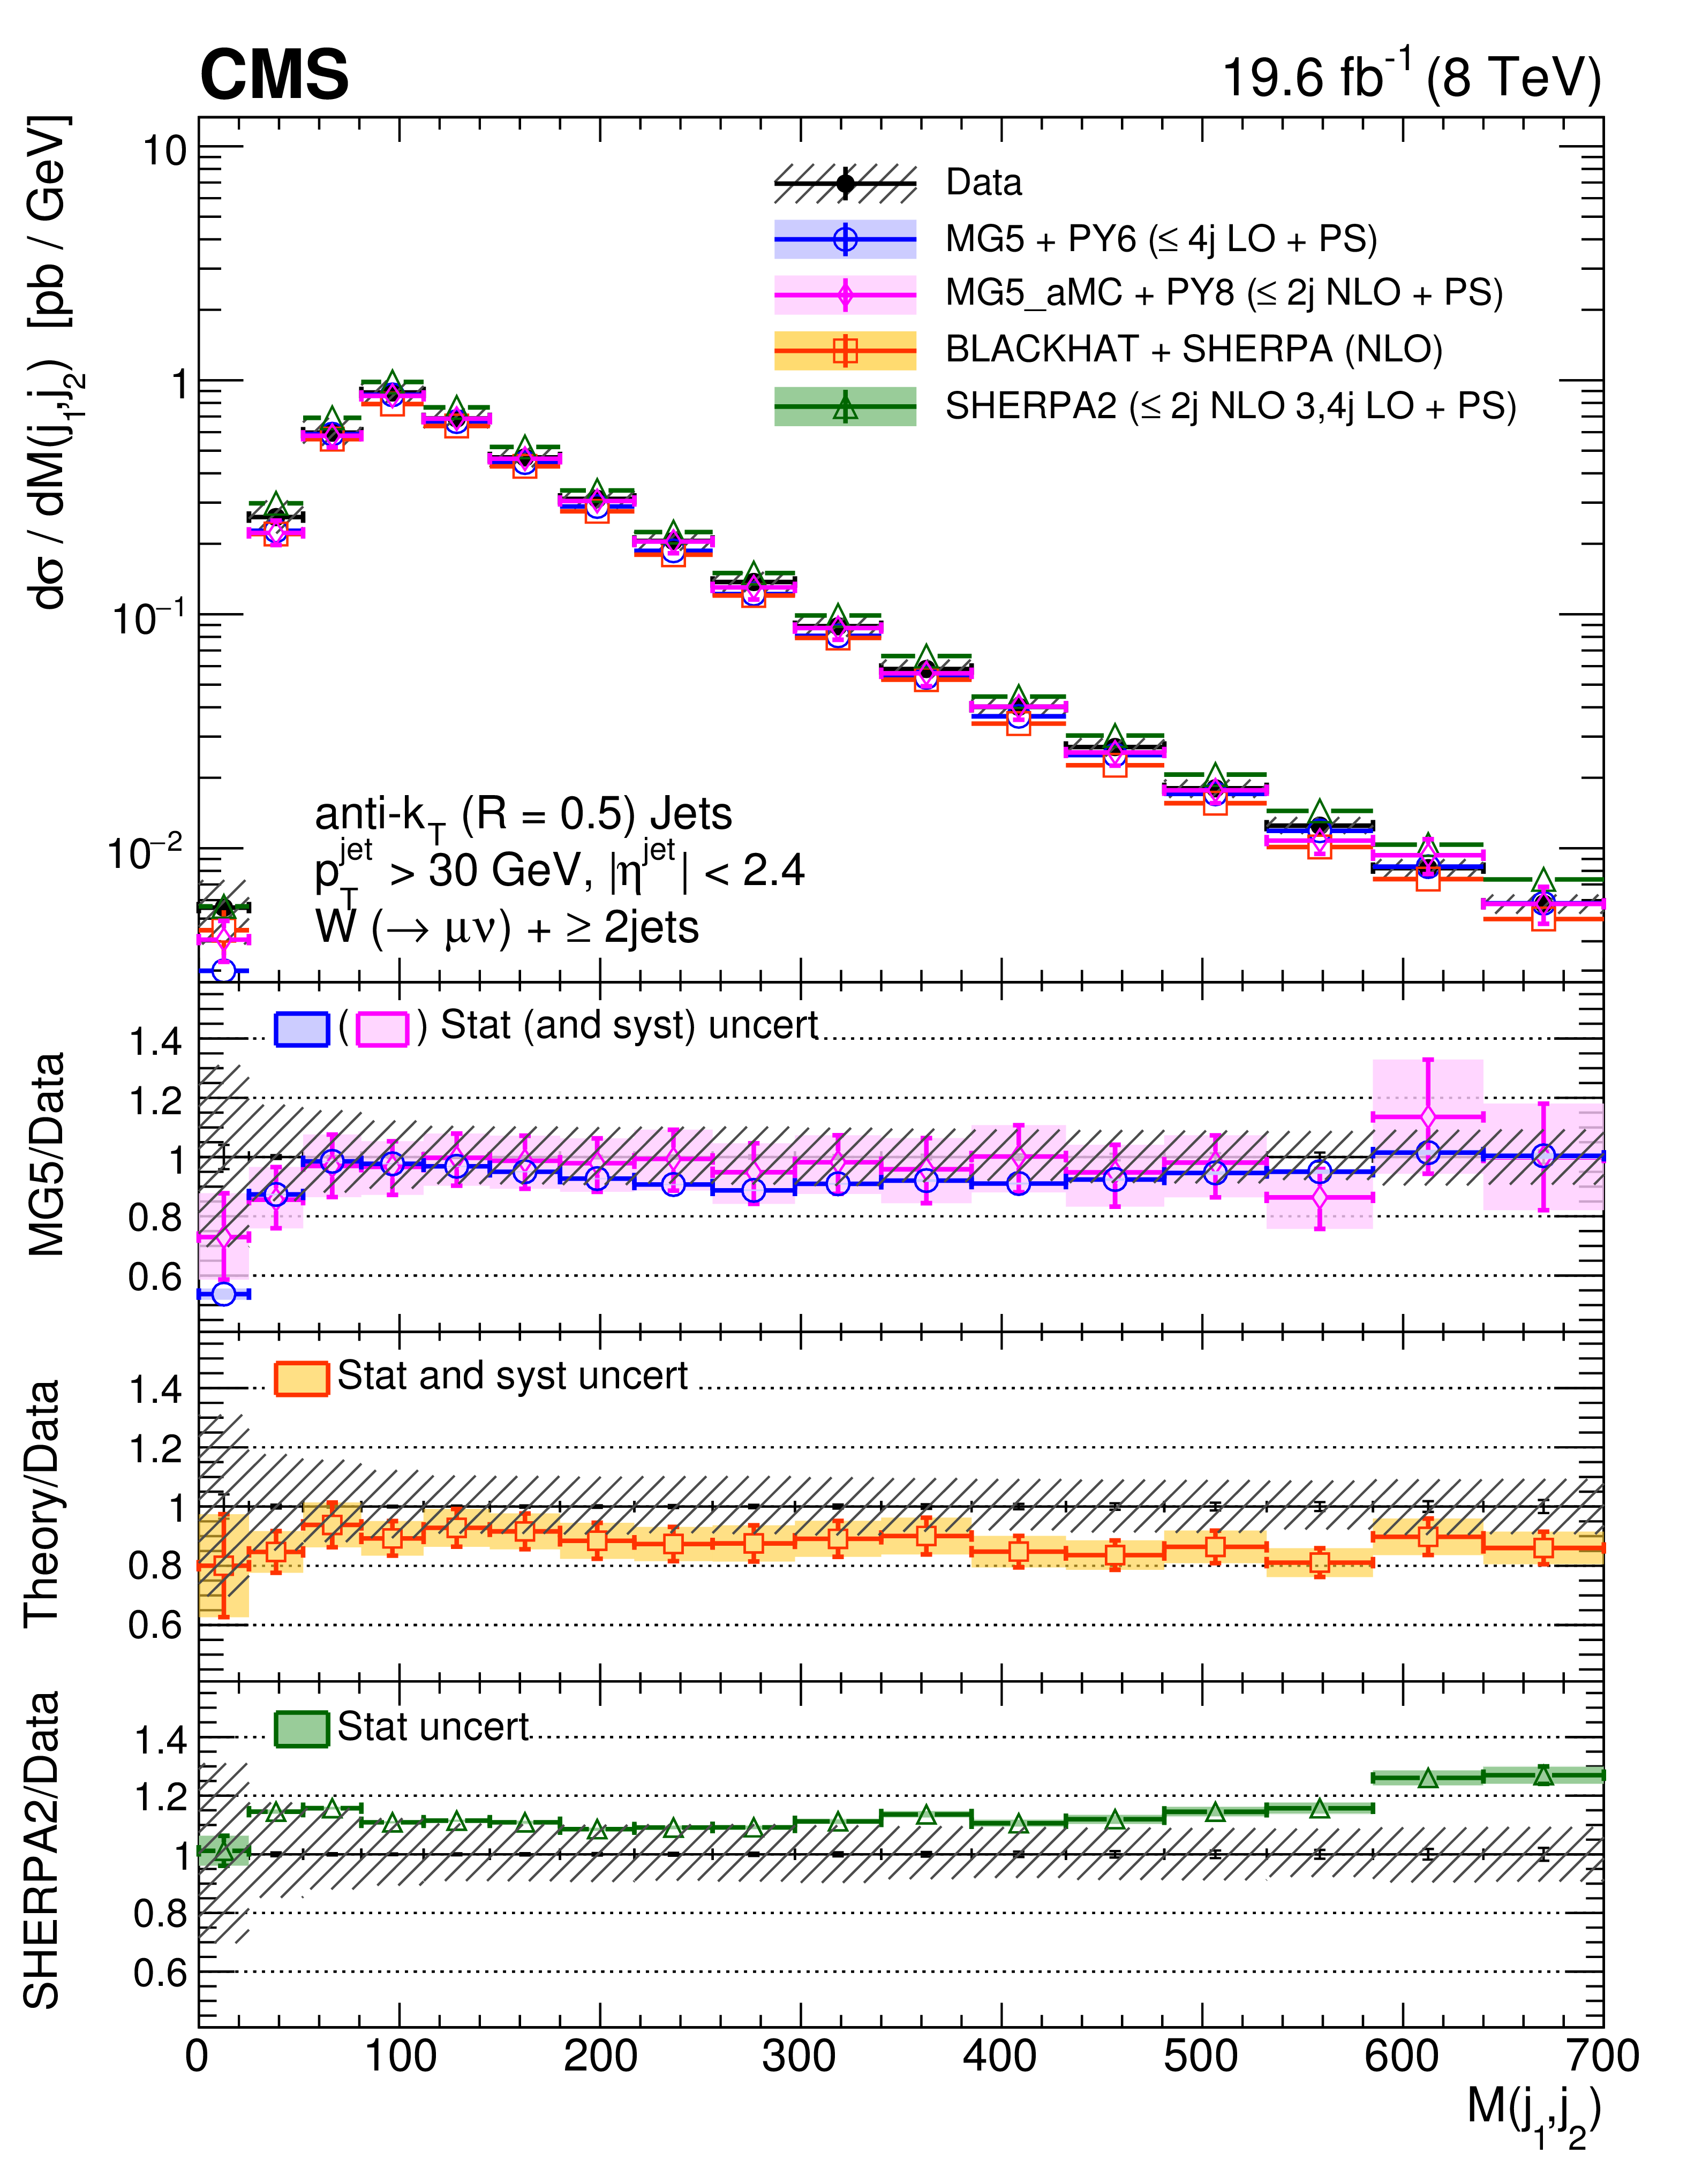
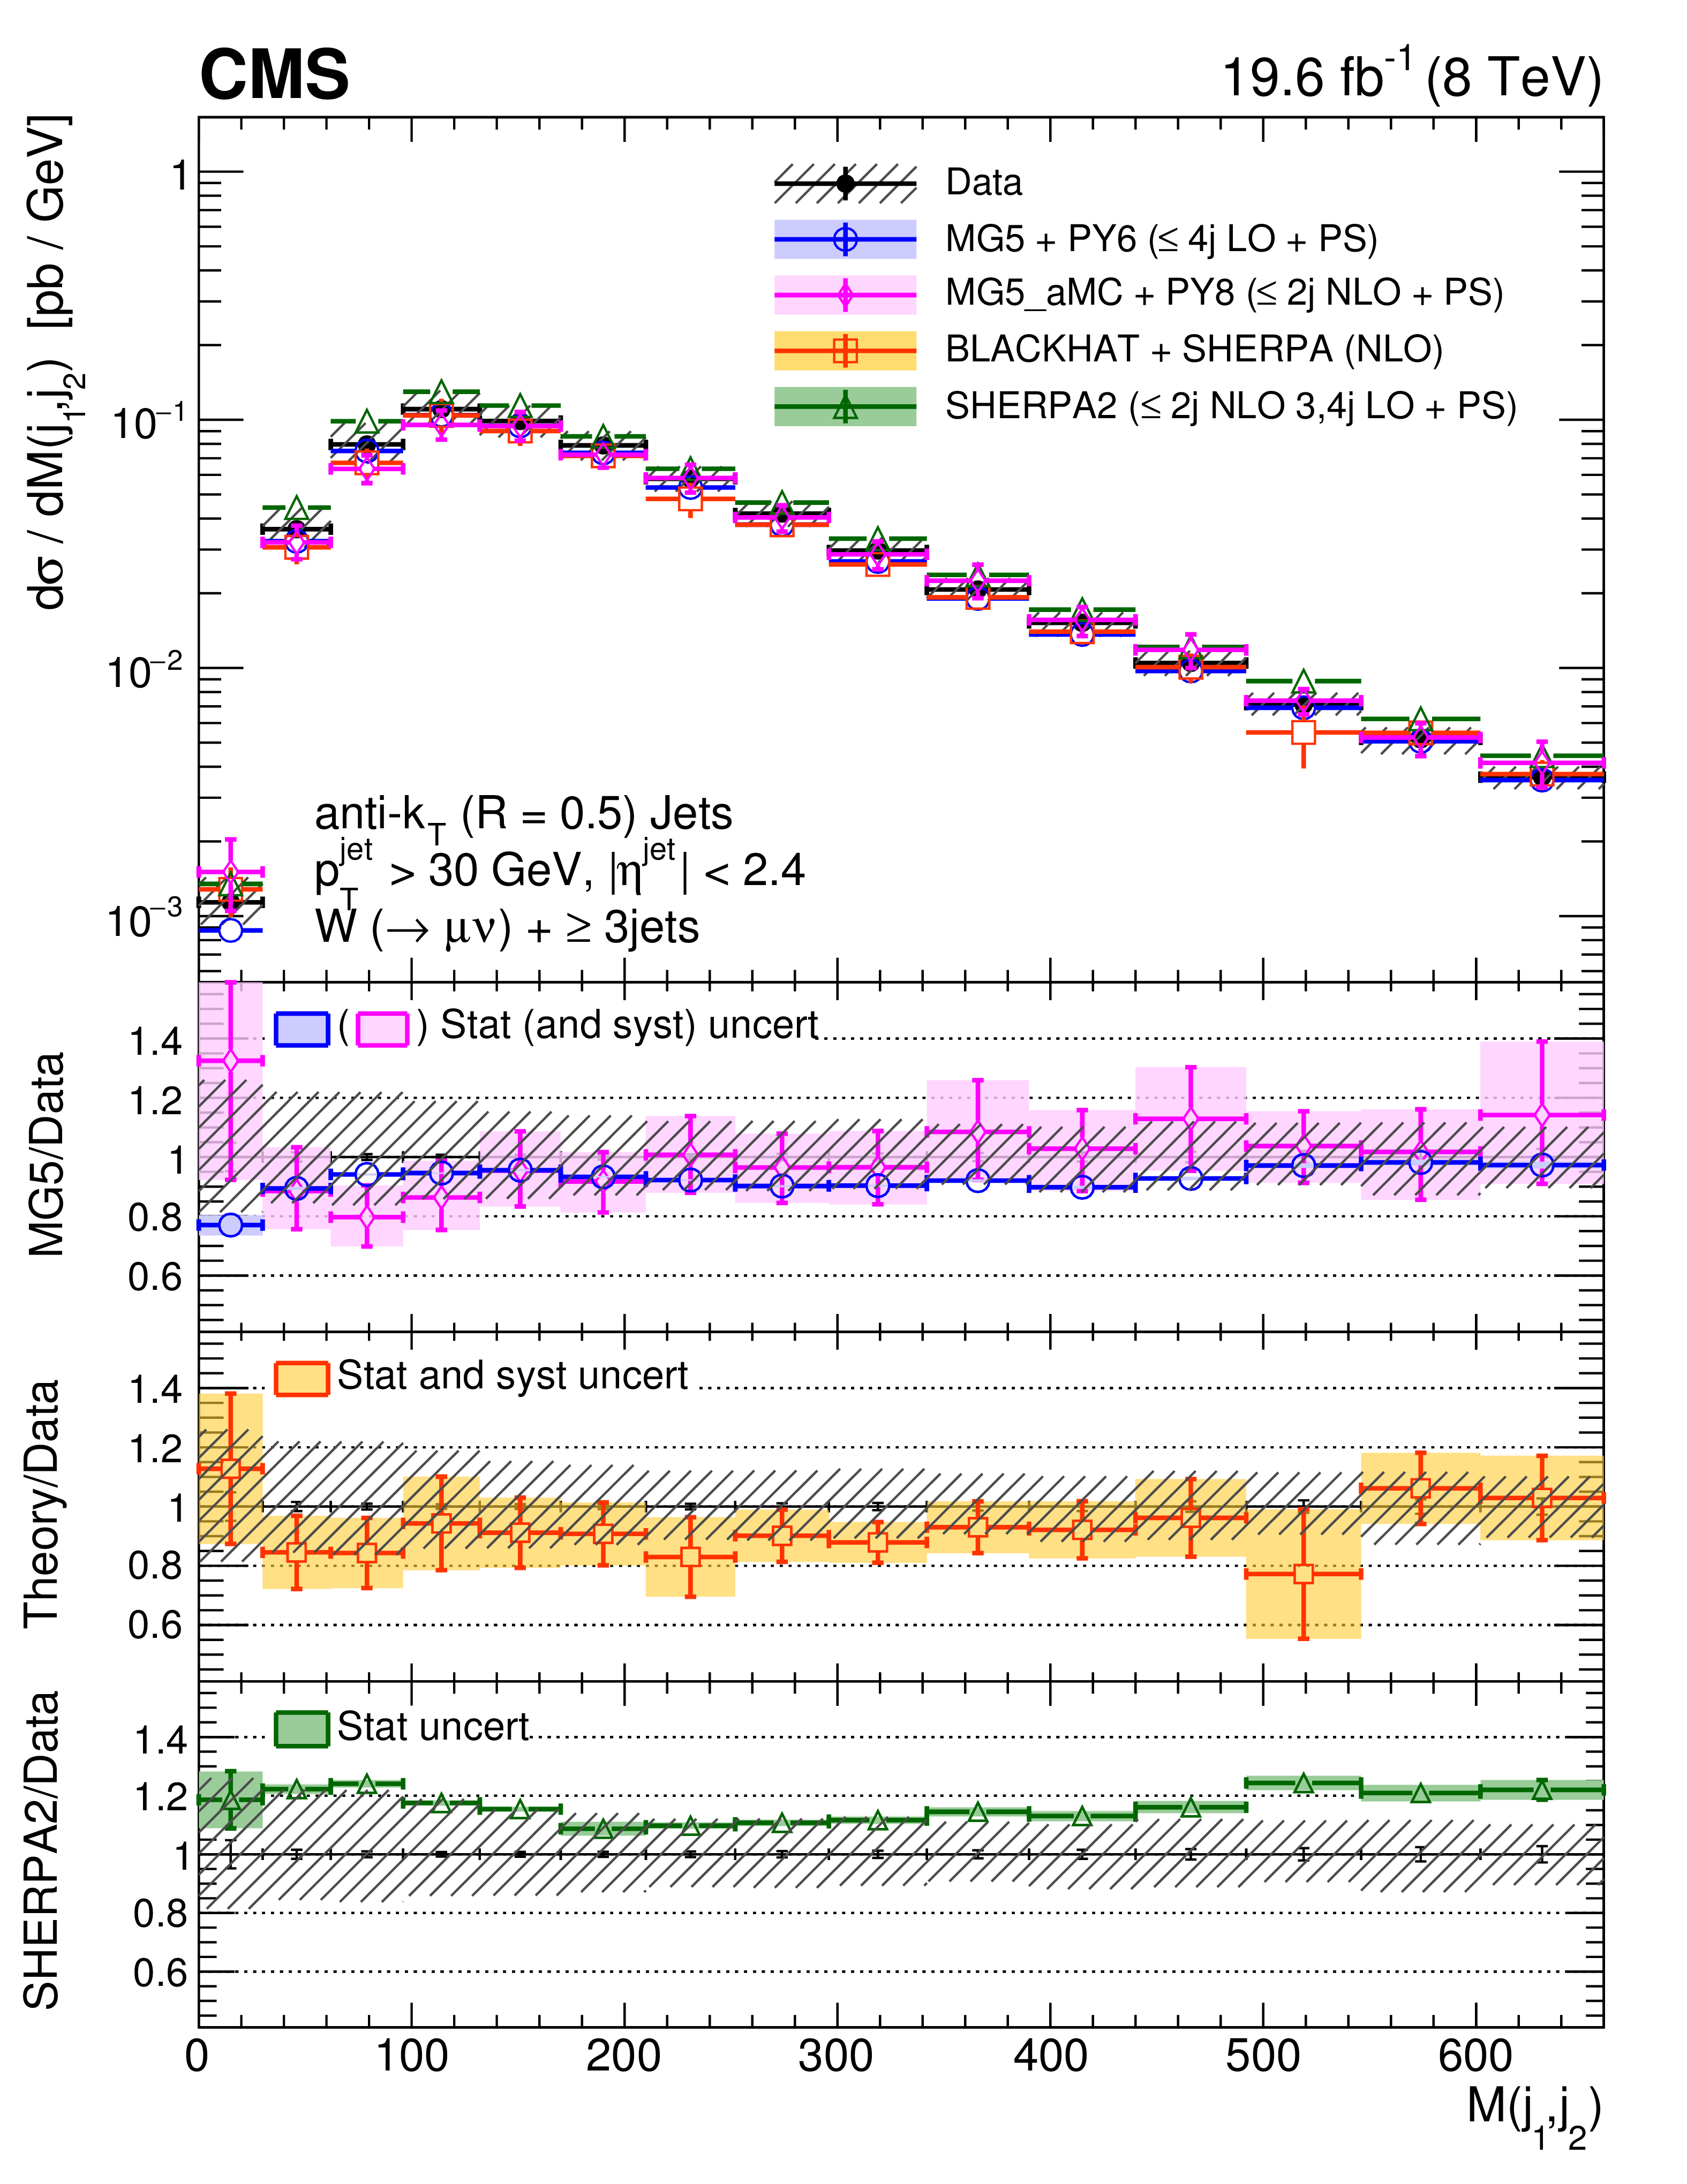
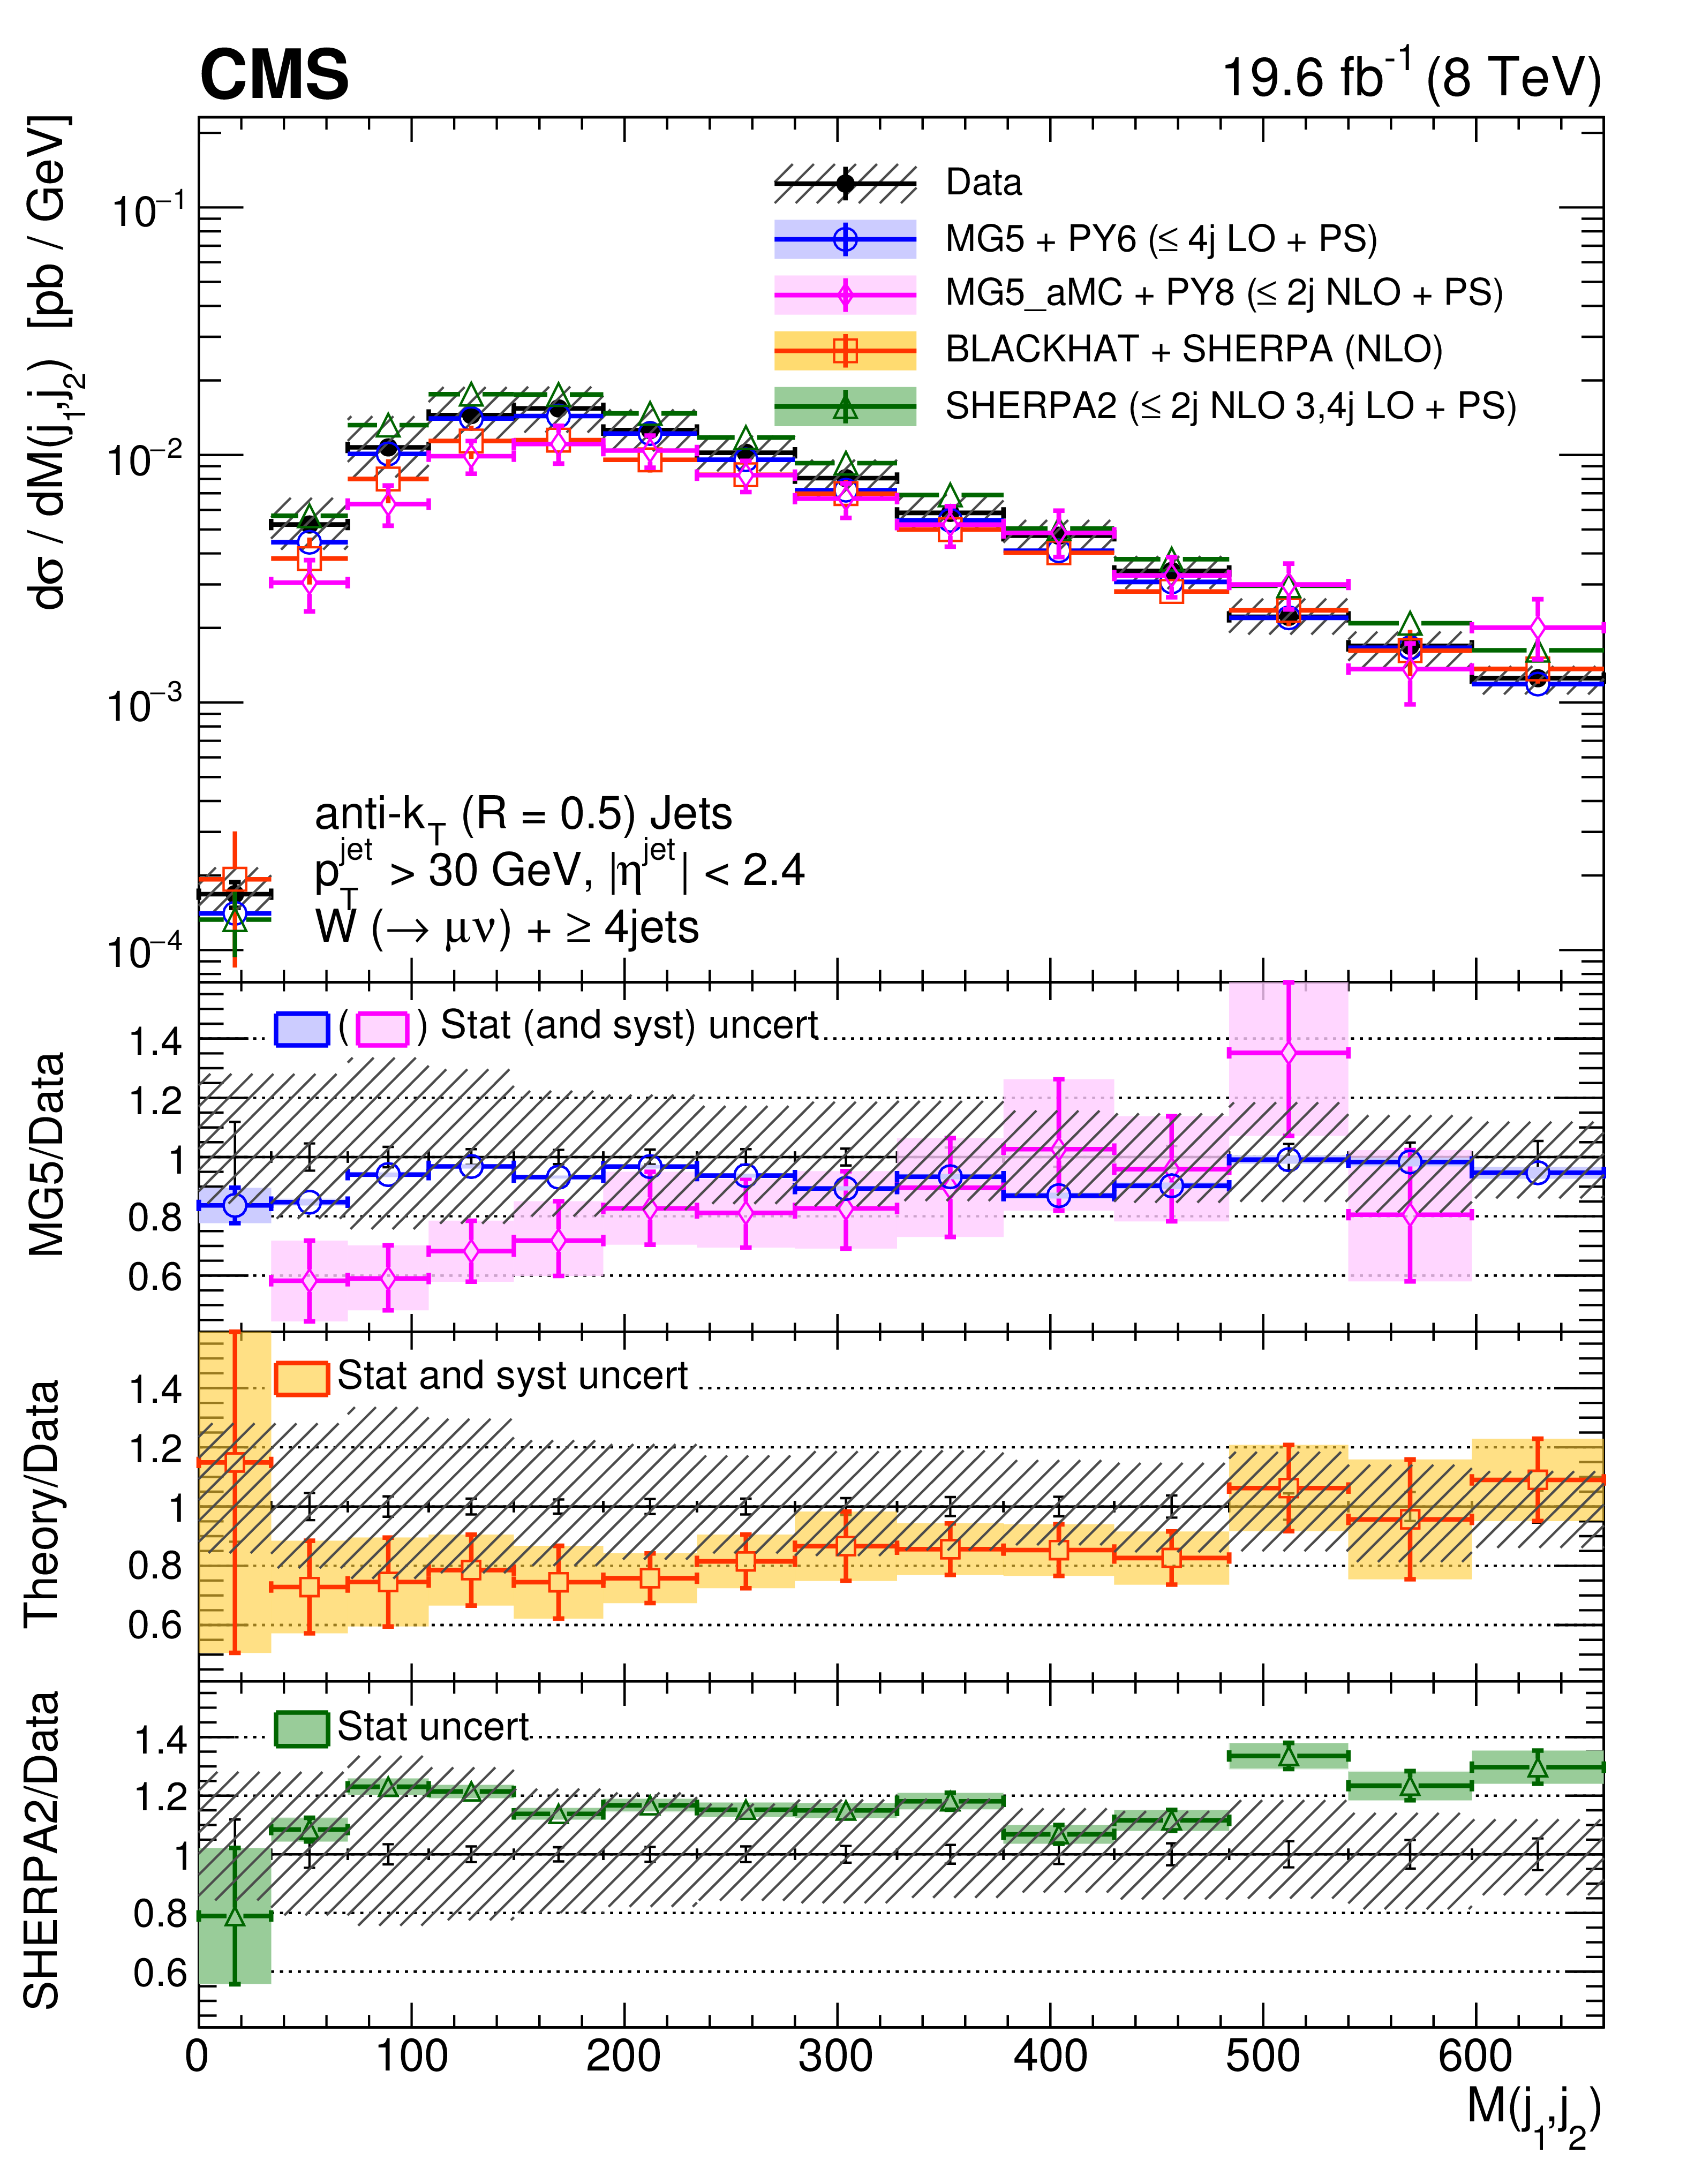
Cross sections differential in dijet invariant mass (calculated from the two leading jets) for inclusive jet multiplicities 2-4, compared to the predictions of MadGraph, MadGraph-5-aMC@NLO, SHERPA-2, and BLACKHAT+SHERPA (corrected for hadronization and multiple-parton interactions). Black circular markers with the gray hatched band represent the unfolded data measurements and their total uncertainties. Overlaid are the predictions together with their uncertainties. The lower plots show the ratio of each prediction to the unfolded data. |
png pdf |
Figure 7-a:
Cross sections differential in dijet invariant mass (calculated from the two leading jets) for inclusive jet multiplicities 2, compared to the predictions of MadGraph, MadGraph-5-aMC@NLO, SHERPA-2, and BLACKHAT+SHERPA (corrected for hadronization and multiple-parton interactions). Black circular markers with the gray hatched band represent the unfolded data measurements and their total uncertainties. Overlaid are the predictions together with their uncertainties. The lower plots show the ratio of each prediction to the unfolded data. |
png pdf |
Figure 7-b:
Cross sections differential in dijet invariant mass (calculated from the two leading jets) for inclusive jet multiplicities 3, compared to the predictions of MadGraph, MadGraph-5-aMC@NLO, SHERPA-2, and BLACKHAT+SHERPA (corrected for hadronization and multiple-parton interactions). Black circular markers with the gray hatched band represent the unfolded data measurements and their total uncertainties. Overlaid are the predictions together with their uncertainties. The lower plots show the ratio of each prediction to the unfolded data. |
png pdf |
Figure 7-c:
Cross sections differential in dijet invariant mass (calculated from the two leading jets) for inclusive jet multiplicities 4, compared to the predictions of MadGraph, MadGraph-5-aMC@NLO, SHERPA-2, and BLACKHAT+SHERPA (corrected for hadronization and multiple-parton interactions). Black circular markers with the gray hatched band represent the unfolded data measurements and their total uncertainties. Overlaid are the predictions together with their uncertainties. The lower plots show the ratio of each prediction to the unfolded data. |
png pdf |
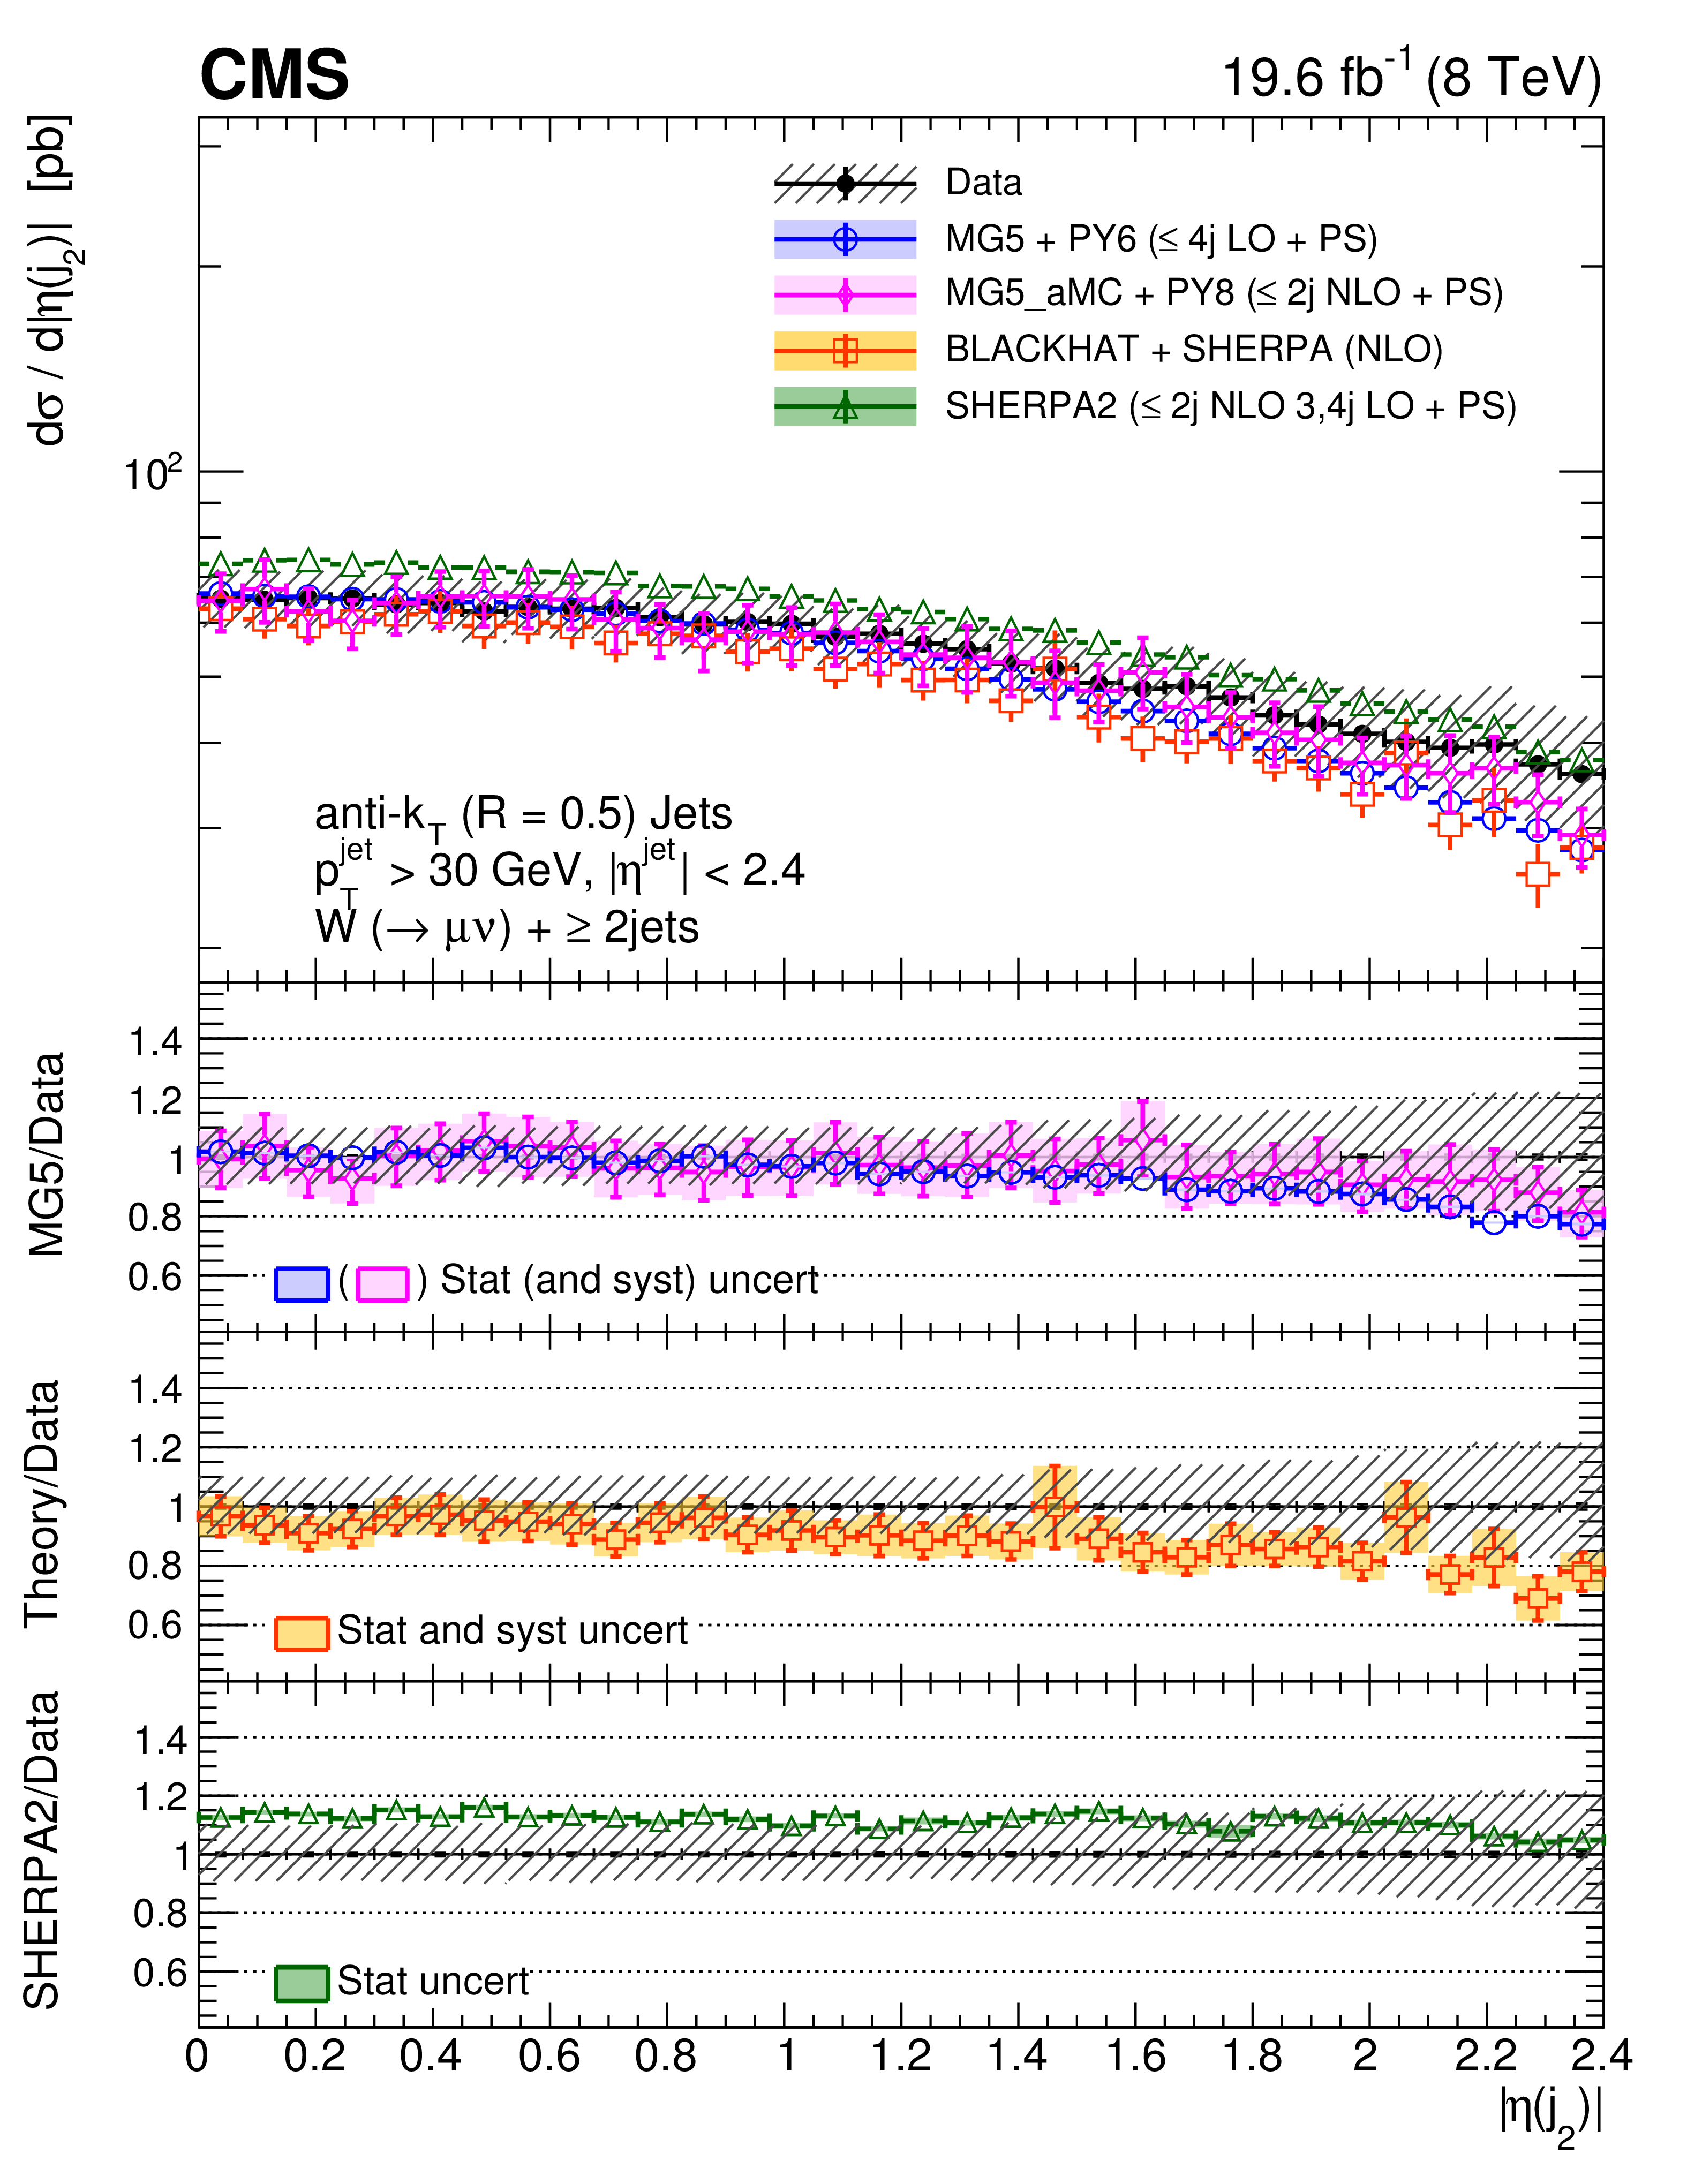
Figure 8:
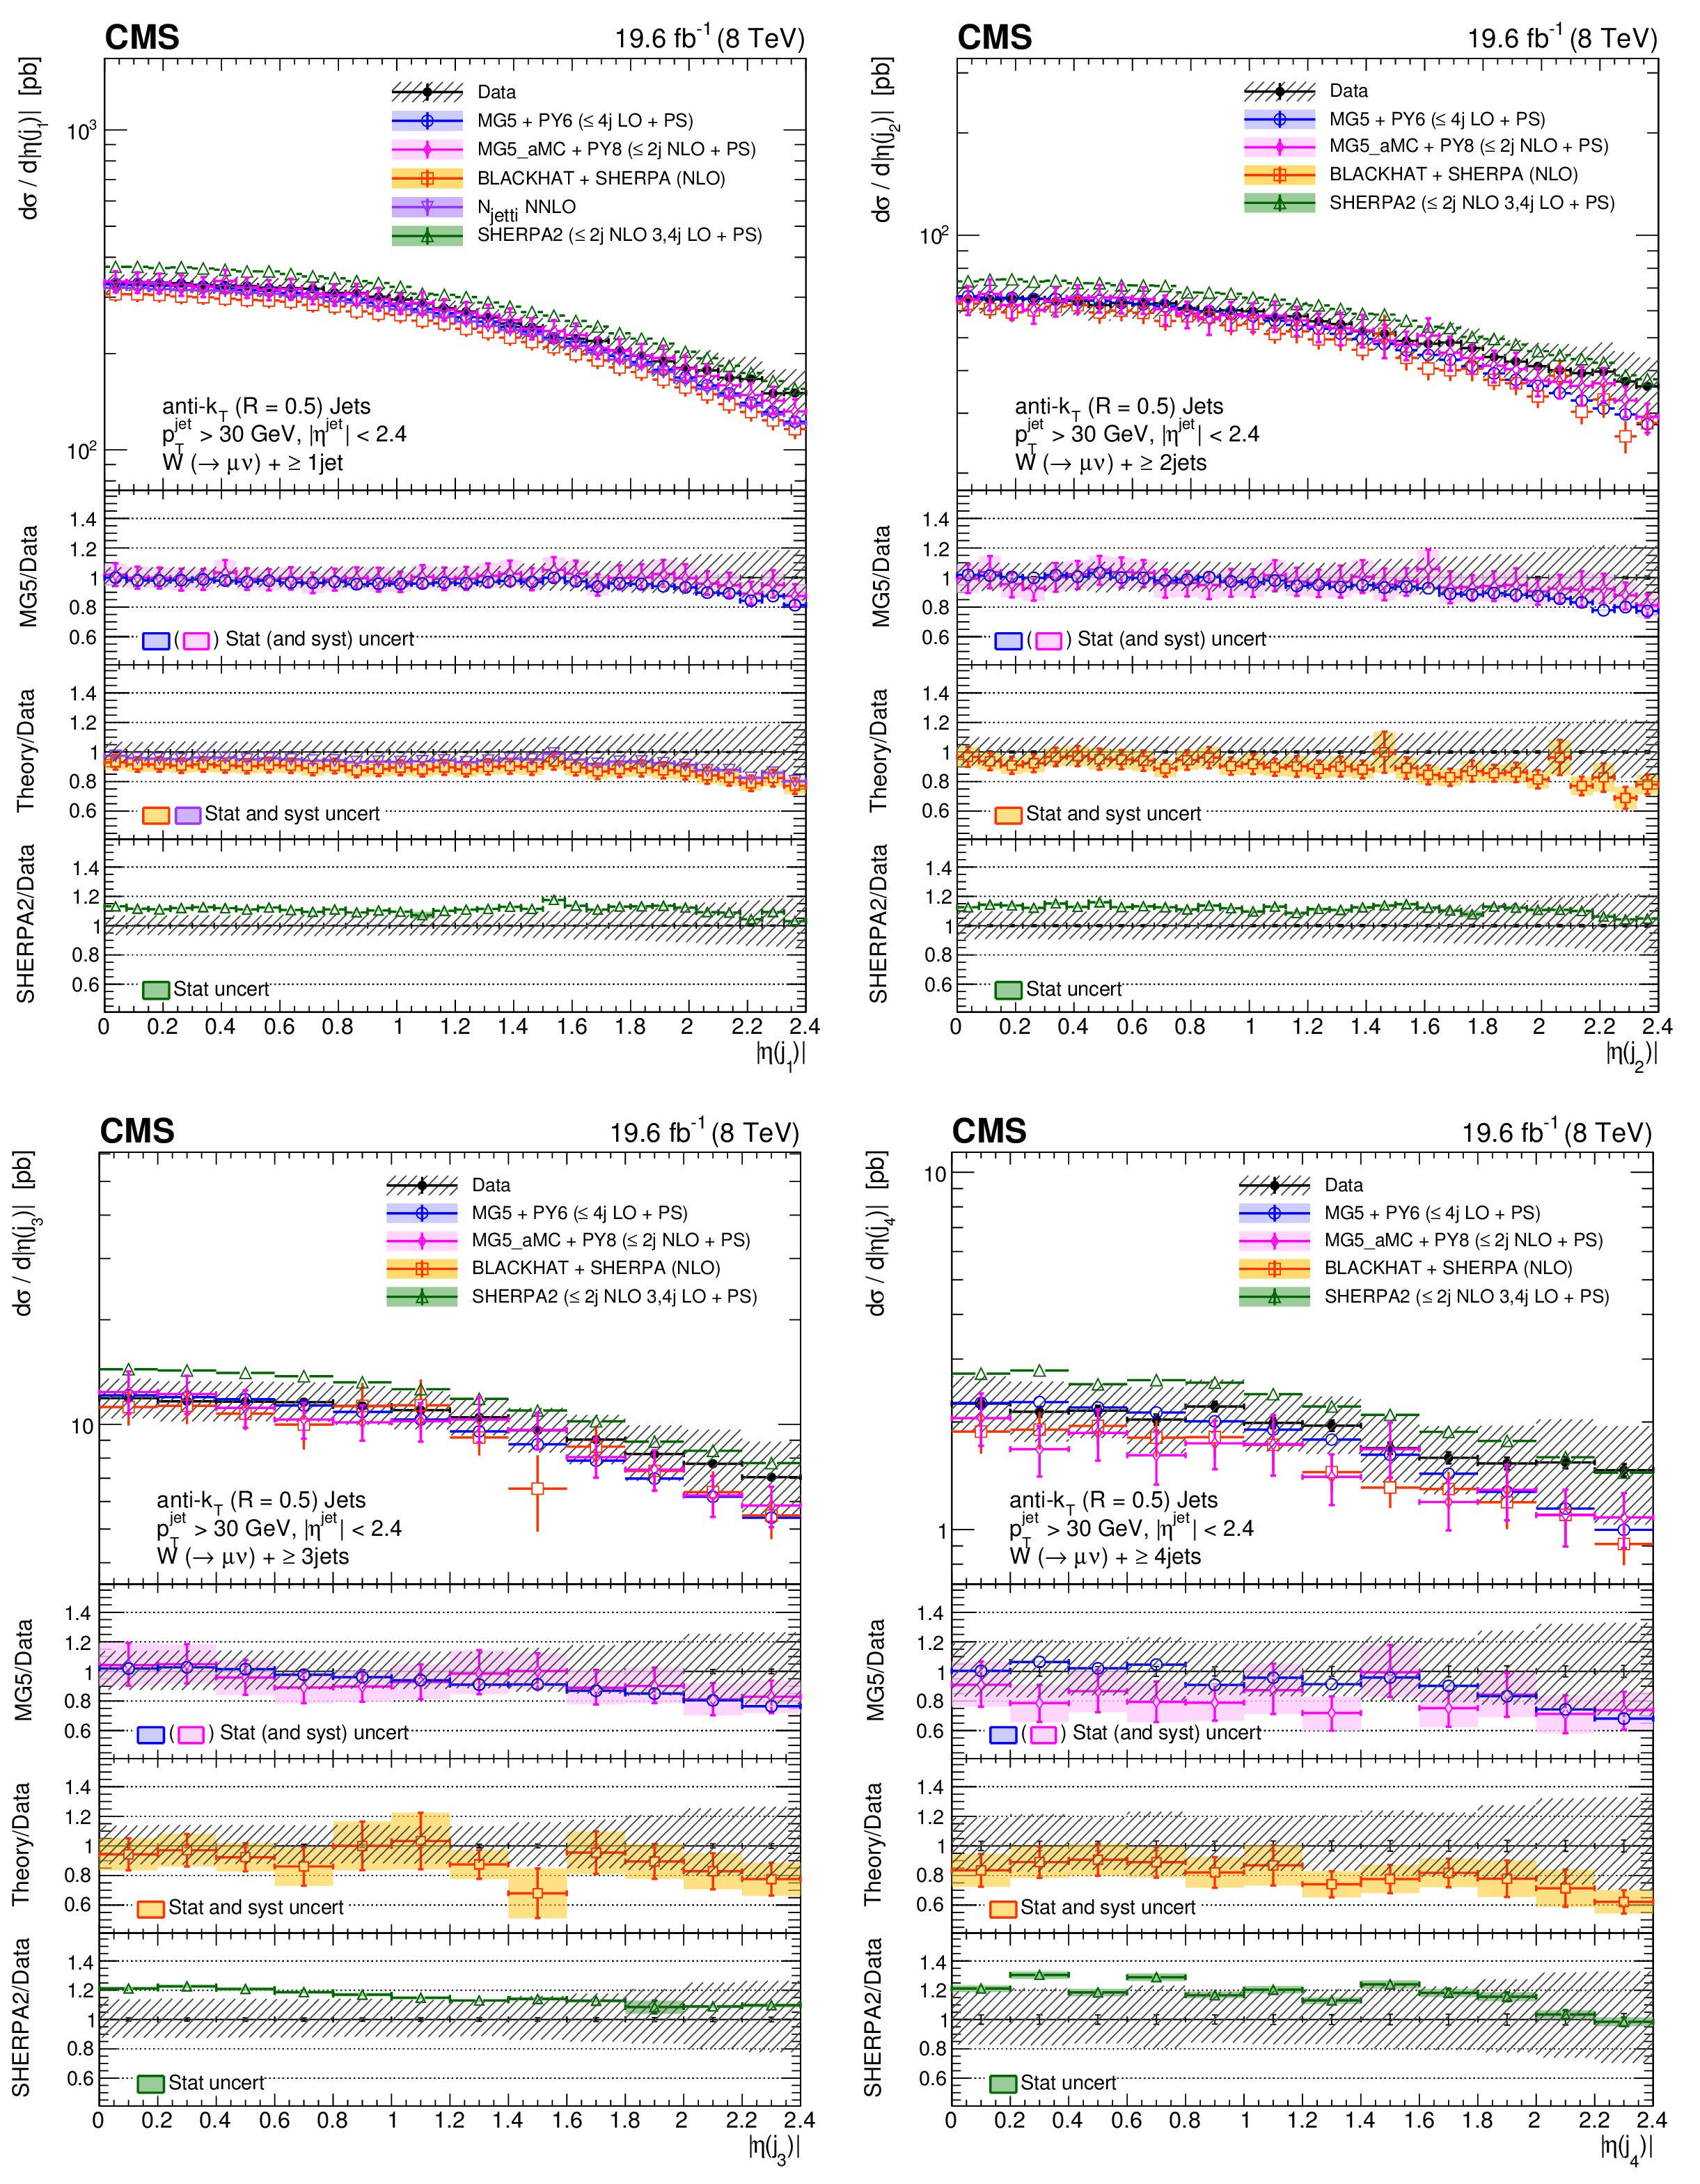
Cross sections differential in the pseudorapidities of the four leading jets, compared to the predictions of MadGraph, MadGraph-5-aMC@NLO, SHERPA-2, BLACKHAT+SHERPA, and NNLO inclusive one-jet production (indicated as $\rm N_{jetti}$ NNLO). The BLACKHAT+SHERPA and NNLO predictions are corrected for hadronization and multiple-parton interaction effects. Black circular markers with the gray hatched band represent the unfolded data measurements and their total uncertainties. Overlaid are the predictions together with their uncertainties. The lower plots show the ratio of each prediction to the unfolded data. |

png pdf |
Figure 8-a:
Cross section differential in the pseudorapidities of the first leading jet, compared to the predictions of MadGraph, MadGraph-5-aMC@NLO, SHERPA-2, BLACKHAT+SHERPA, and NNLO inclusive one-jet production (indicated as $\rm N_{jetti}$ NNLO). The BLACKHAT+SHERPA and NNLO predictions are corrected for hadronization and multiple-parton interaction effects. Black circular markers with the gray hatched band represent the unfolded data measurements and their total uncertainties. Overlaid are the predictions together with their uncertainties. The lower plots show the ratio of each prediction to the unfolded data. |
png pdf |
Figure 8-b:
Cross section differential in the pseudorapidities of the second leading jet, compared to the predictions of MadGraph, MadGraph-5-aMC@NLO, SHERPA-2, BLACKHAT+SHERPA, and NNLO inclusive one-jet production (indicated as $\rm N_{jetti}$ NNLO). The BLACKHAT+SHERPA and NNLO predictions are corrected for hadronization and multiple-parton interaction effects. Black circular markers with the gray hatched band represent the unfolded data measurements and their total uncertainties. Overlaid are the predictions together with their uncertainties. The lower plots show the ratio of each prediction to the unfolded data. |

png pdf |
Figure 8-c:
Cross section differential in the pseudorapidities of the third leading jet, compared to the predictions of MadGraph, MadGraph-5-aMC@NLO, SHERPA-2, BLACKHAT+SHERPA, and NNLO inclusive one-jet production (indicated as $\rm N_{jetti}$ NNLO). The BLACKHAT+SHERPA and NNLO predictions are corrected for hadronization and multiple-parton interaction effects. Black circular markers with the gray hatched band represent the unfolded data measurements and their total uncertainties. Overlaid are the predictions together with their uncertainties. The lower plots show the ratio of each prediction to the unfolded data. |
png pdf |
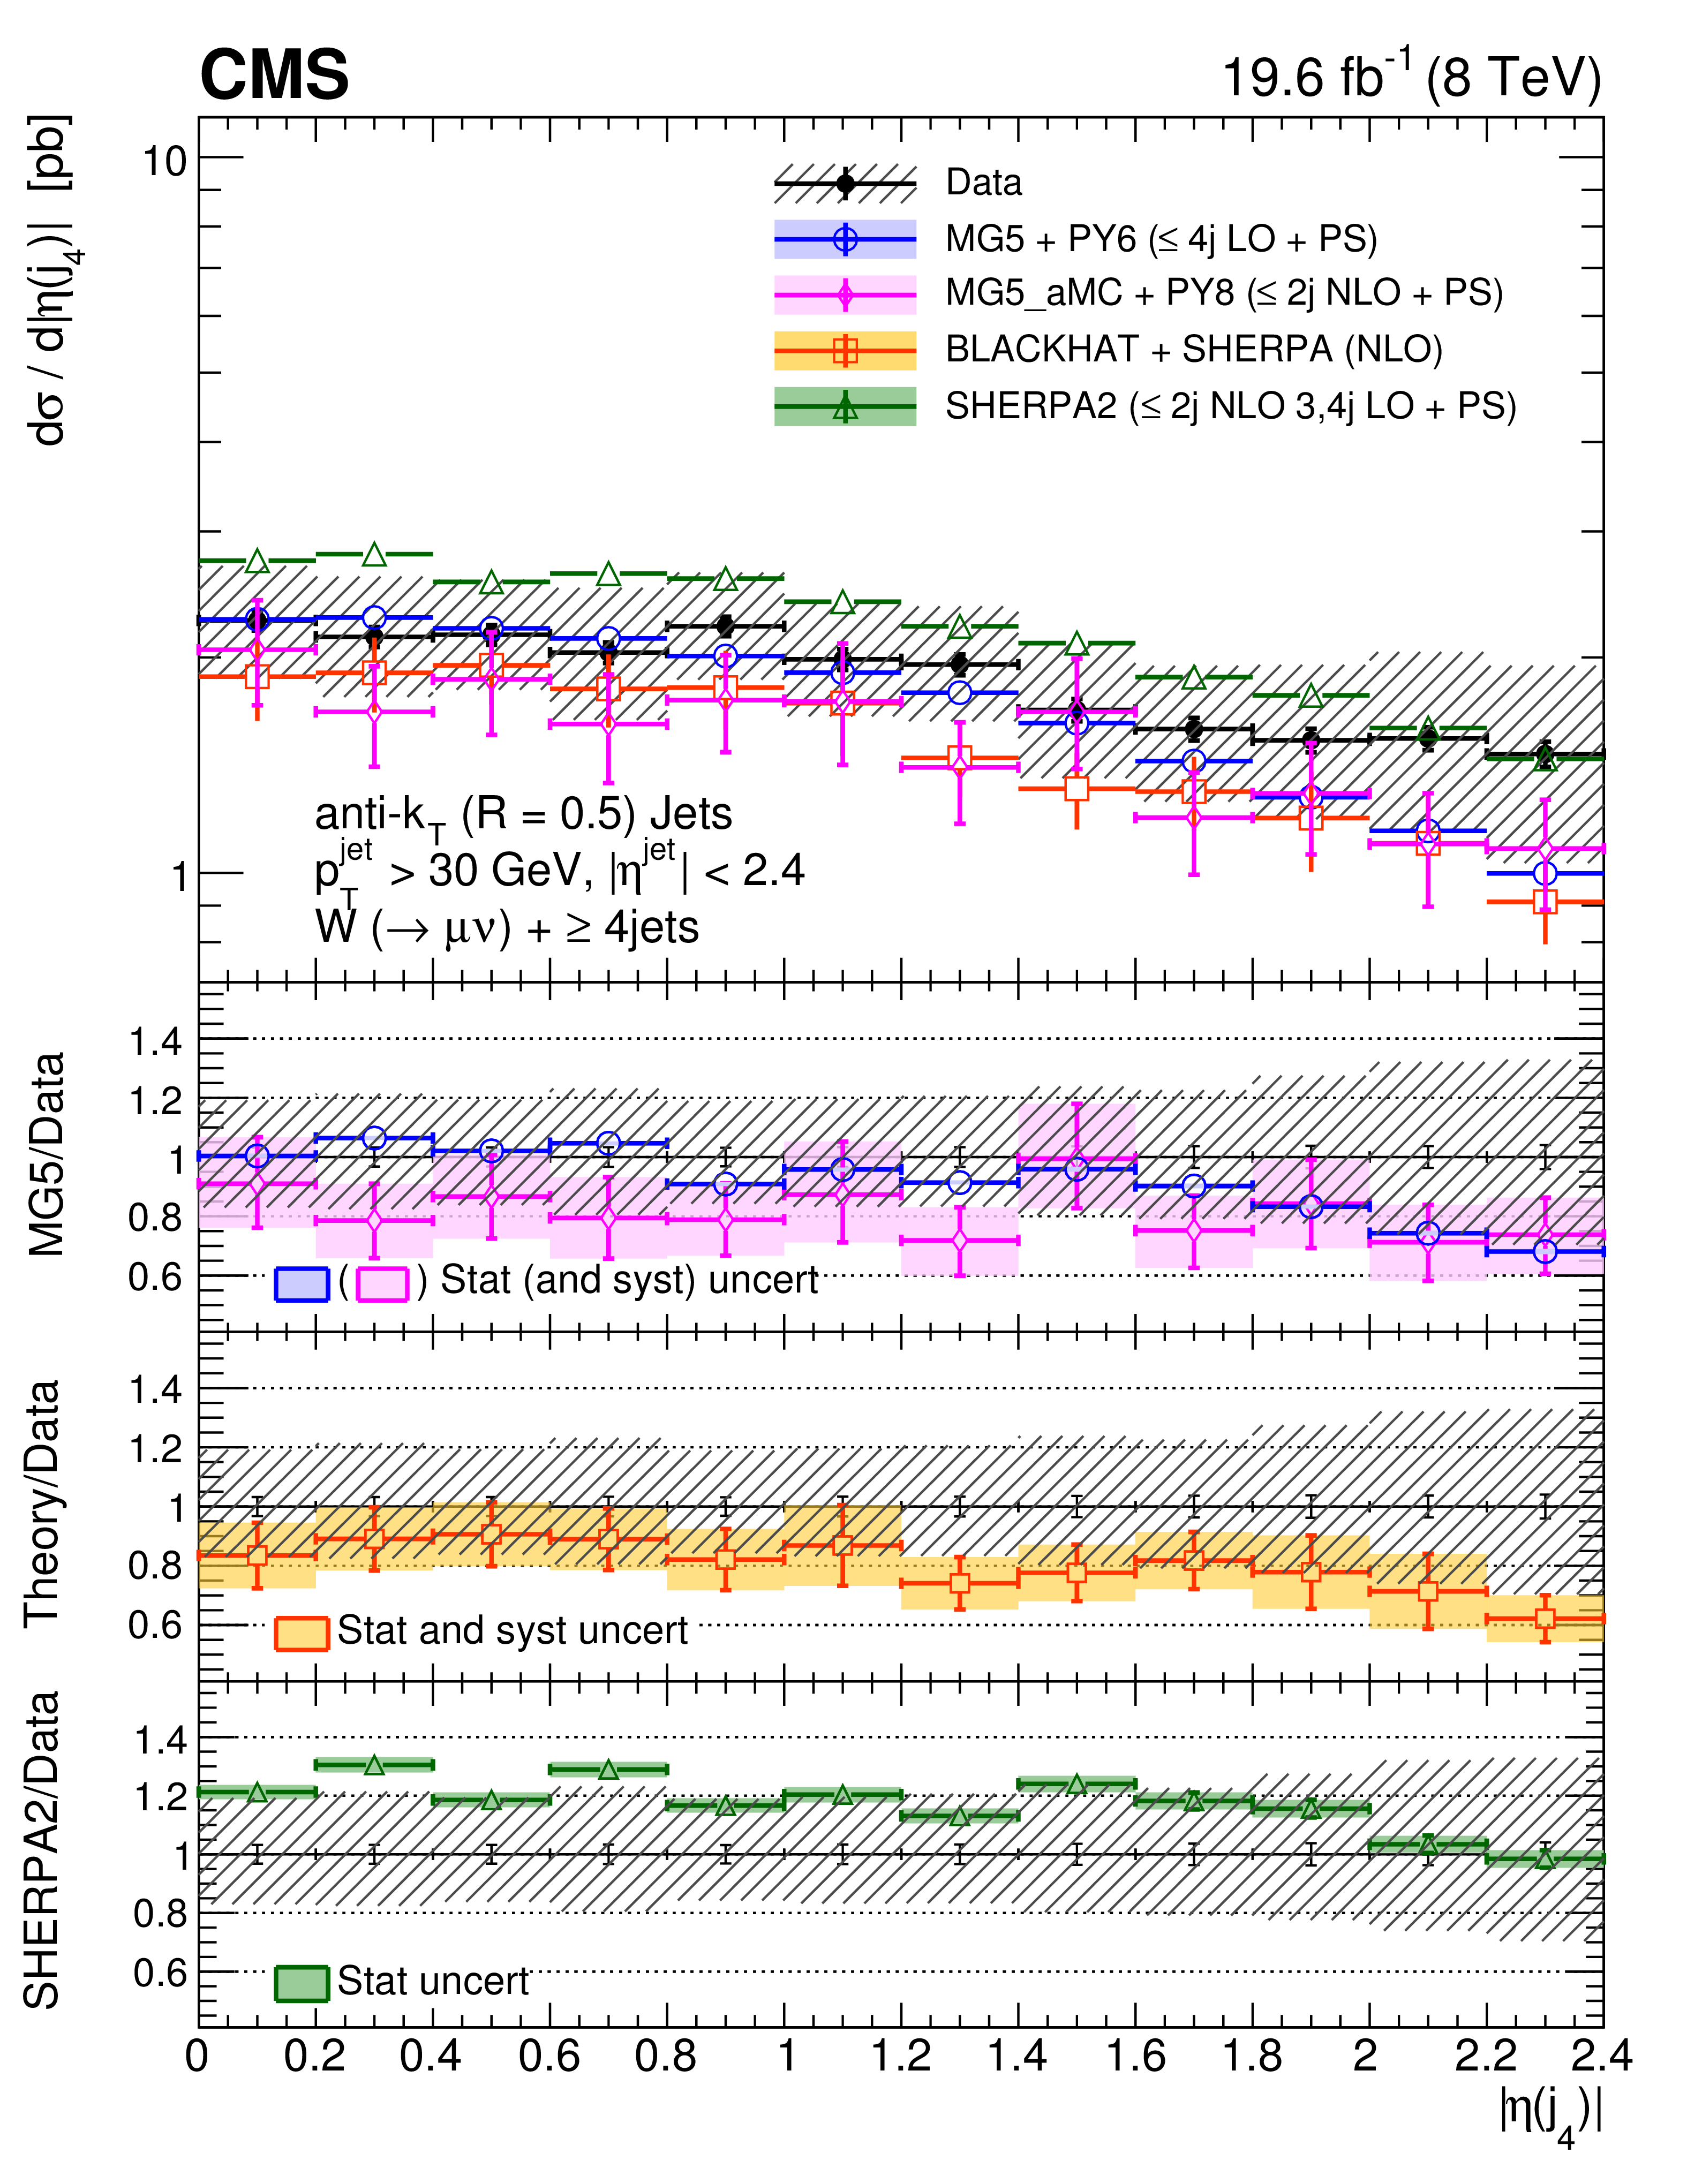
Figure 8-d:
Cross section differential in the pseudorapidities of the fourth leading jet, compared to the predictions of MadGraph, MadGraph-5-aMC@NLO, SHERPA-2, BLACKHAT+SHERPA, and NNLO inclusive one-jet production (indicated as $\rm N_{jetti}$ NNLO). The BLACKHAT+SHERPA and NNLO predictions are corrected for hadronization and multiple-parton interaction effects. Black circular markers with the gray hatched band represent the unfolded data measurements and their total uncertainties. Overlaid are the predictions together with their uncertainties. The lower plots show the ratio of each prediction to the unfolded data. |
png pdf |
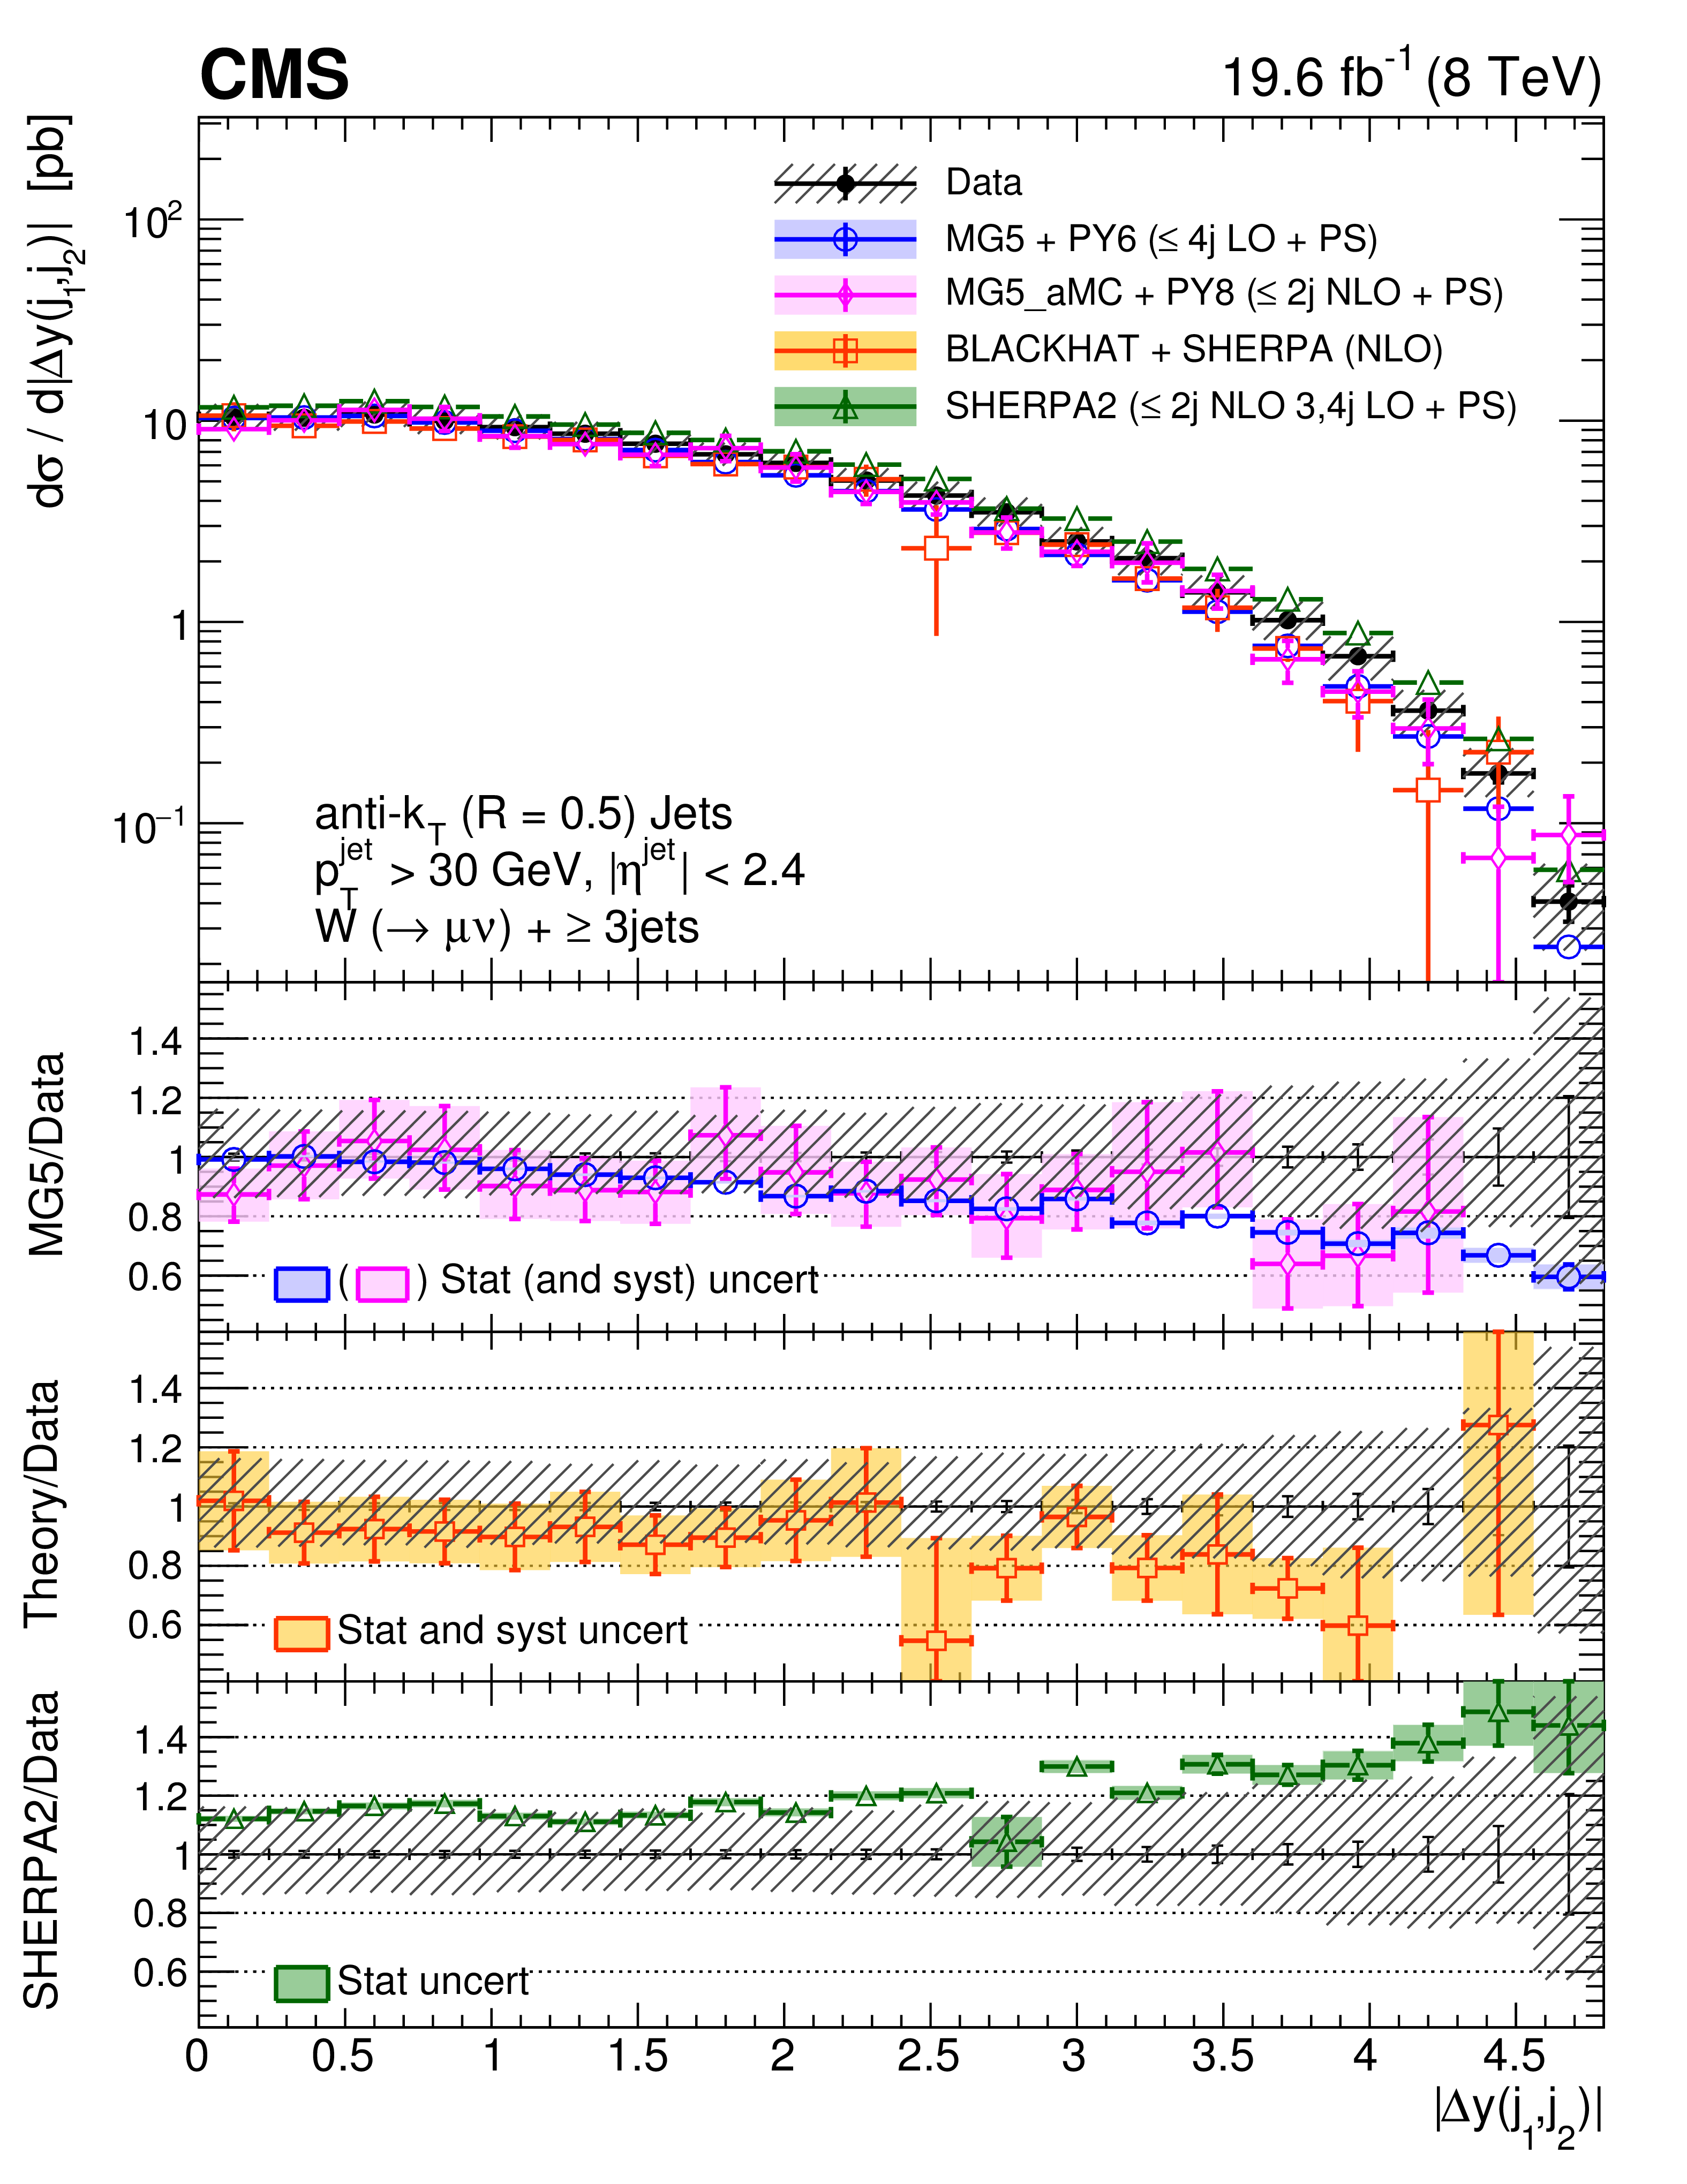
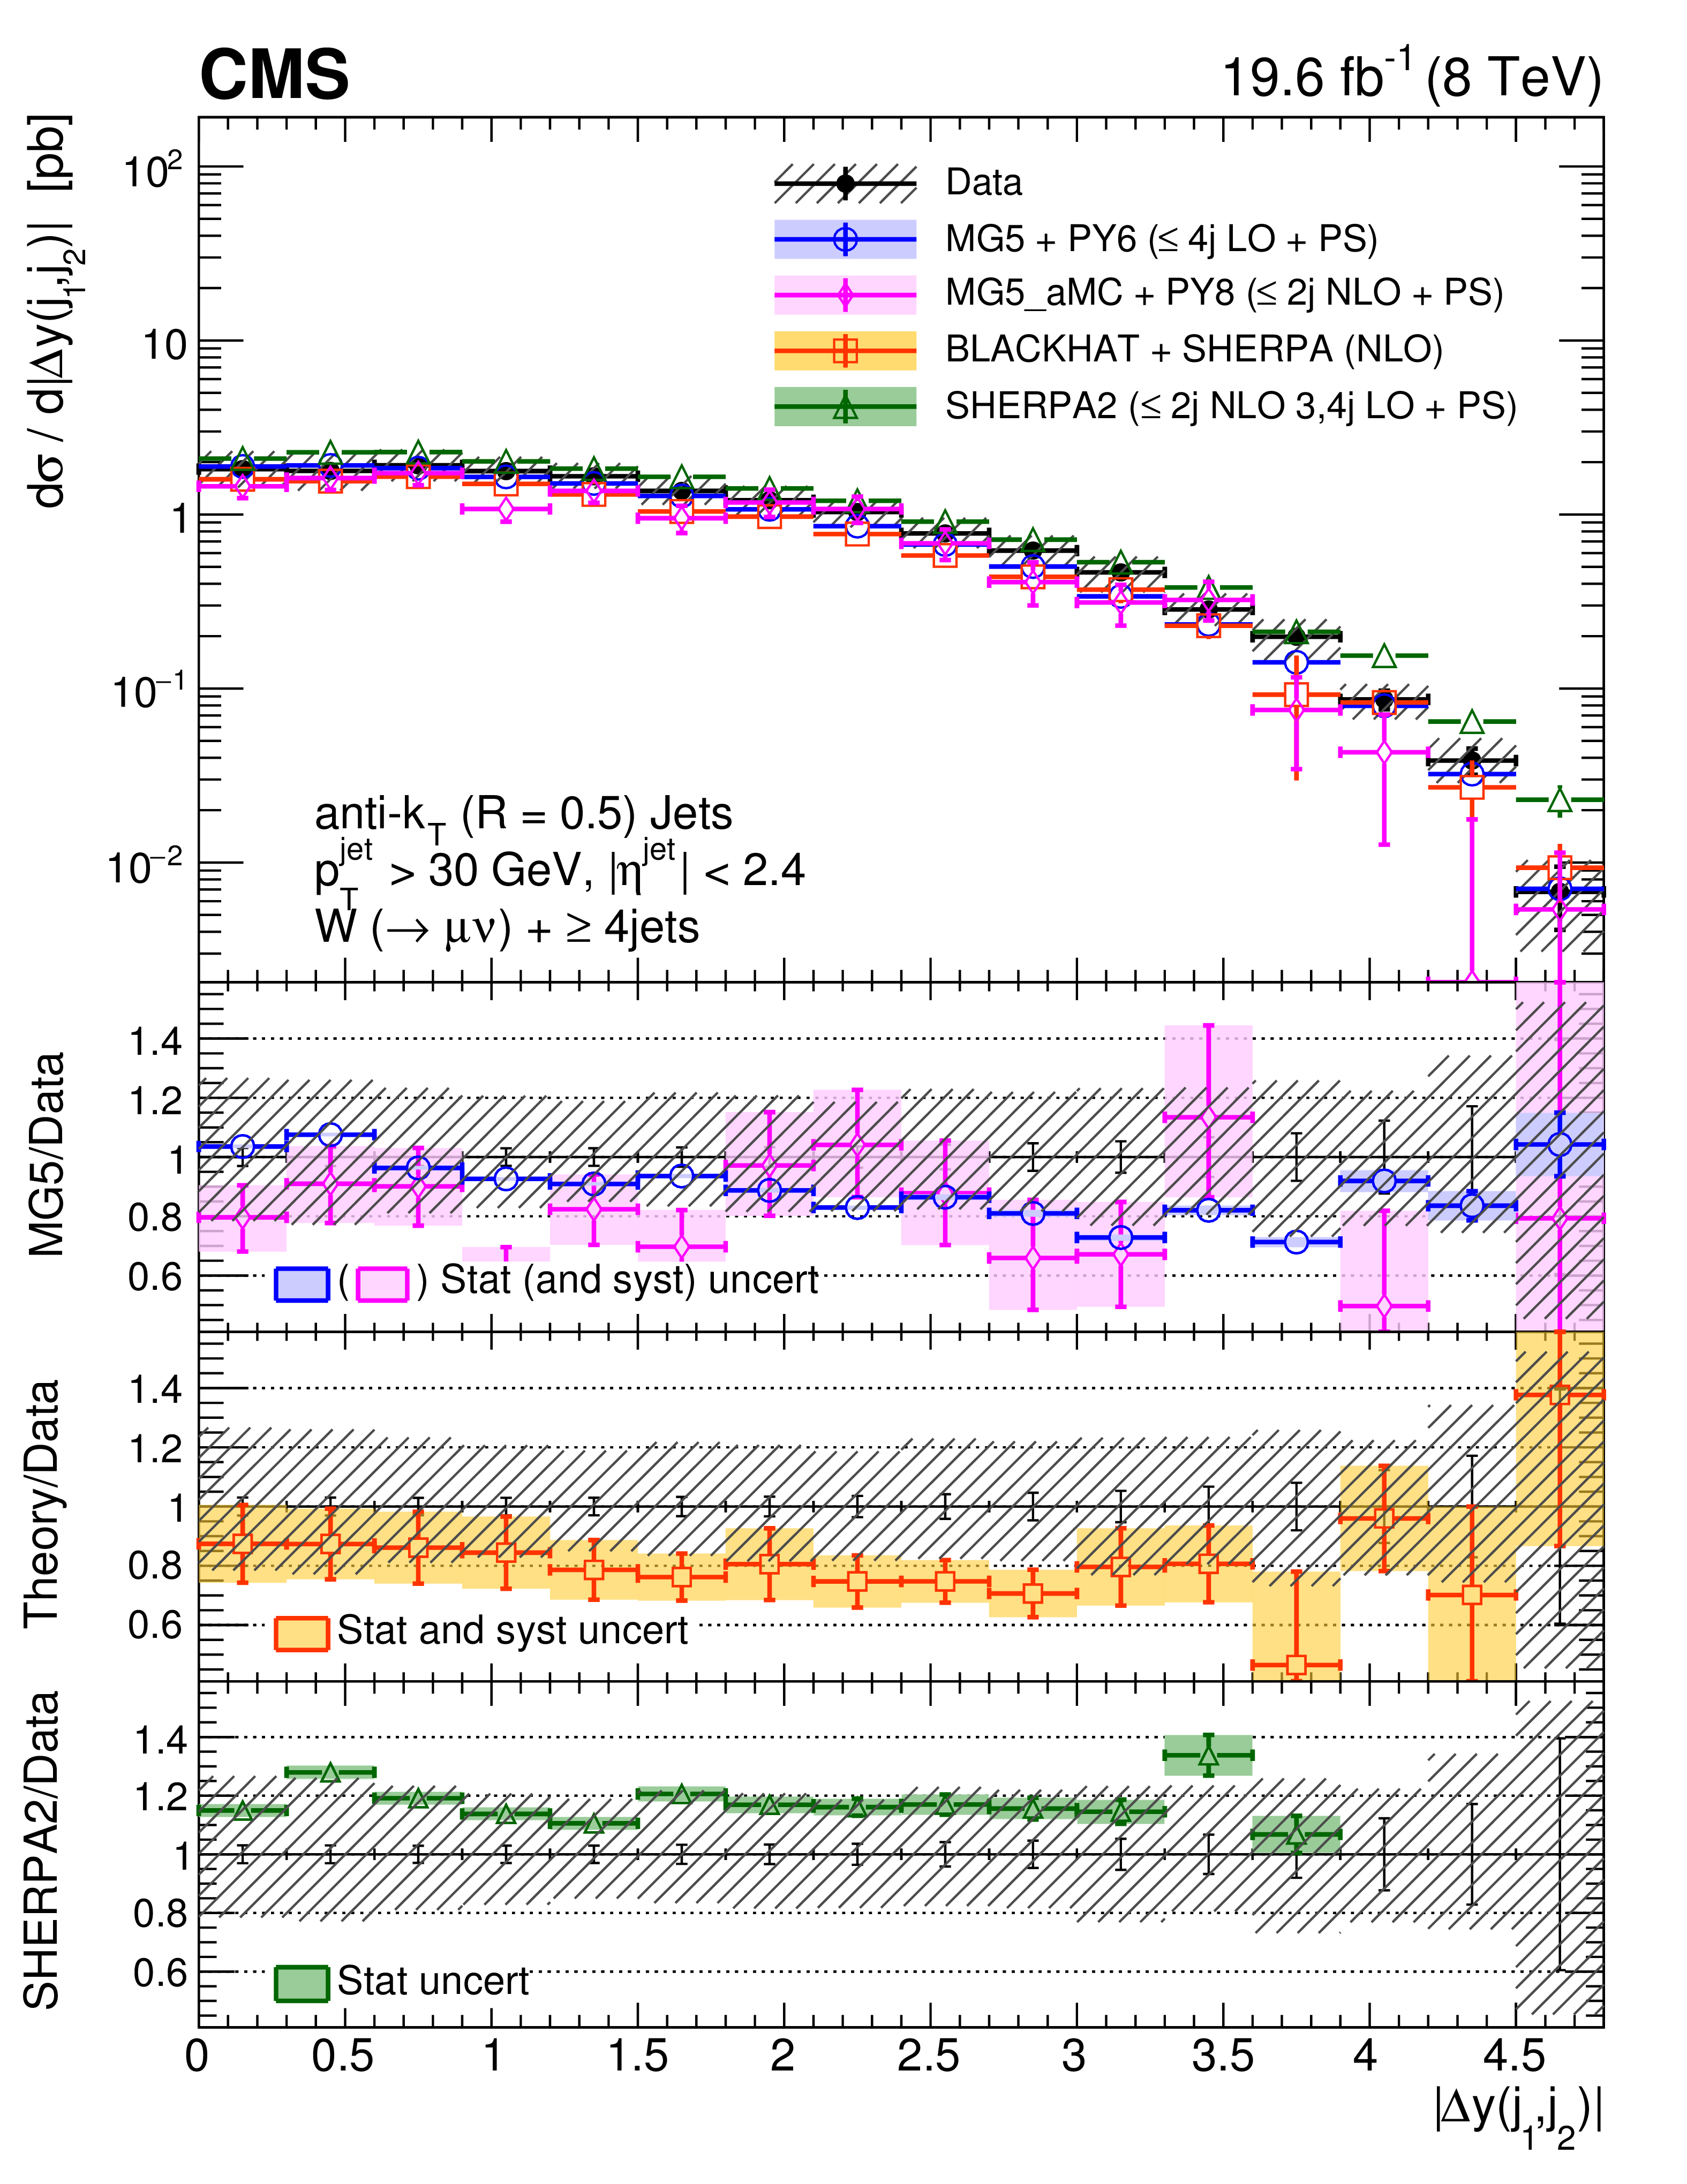
Figure 9:
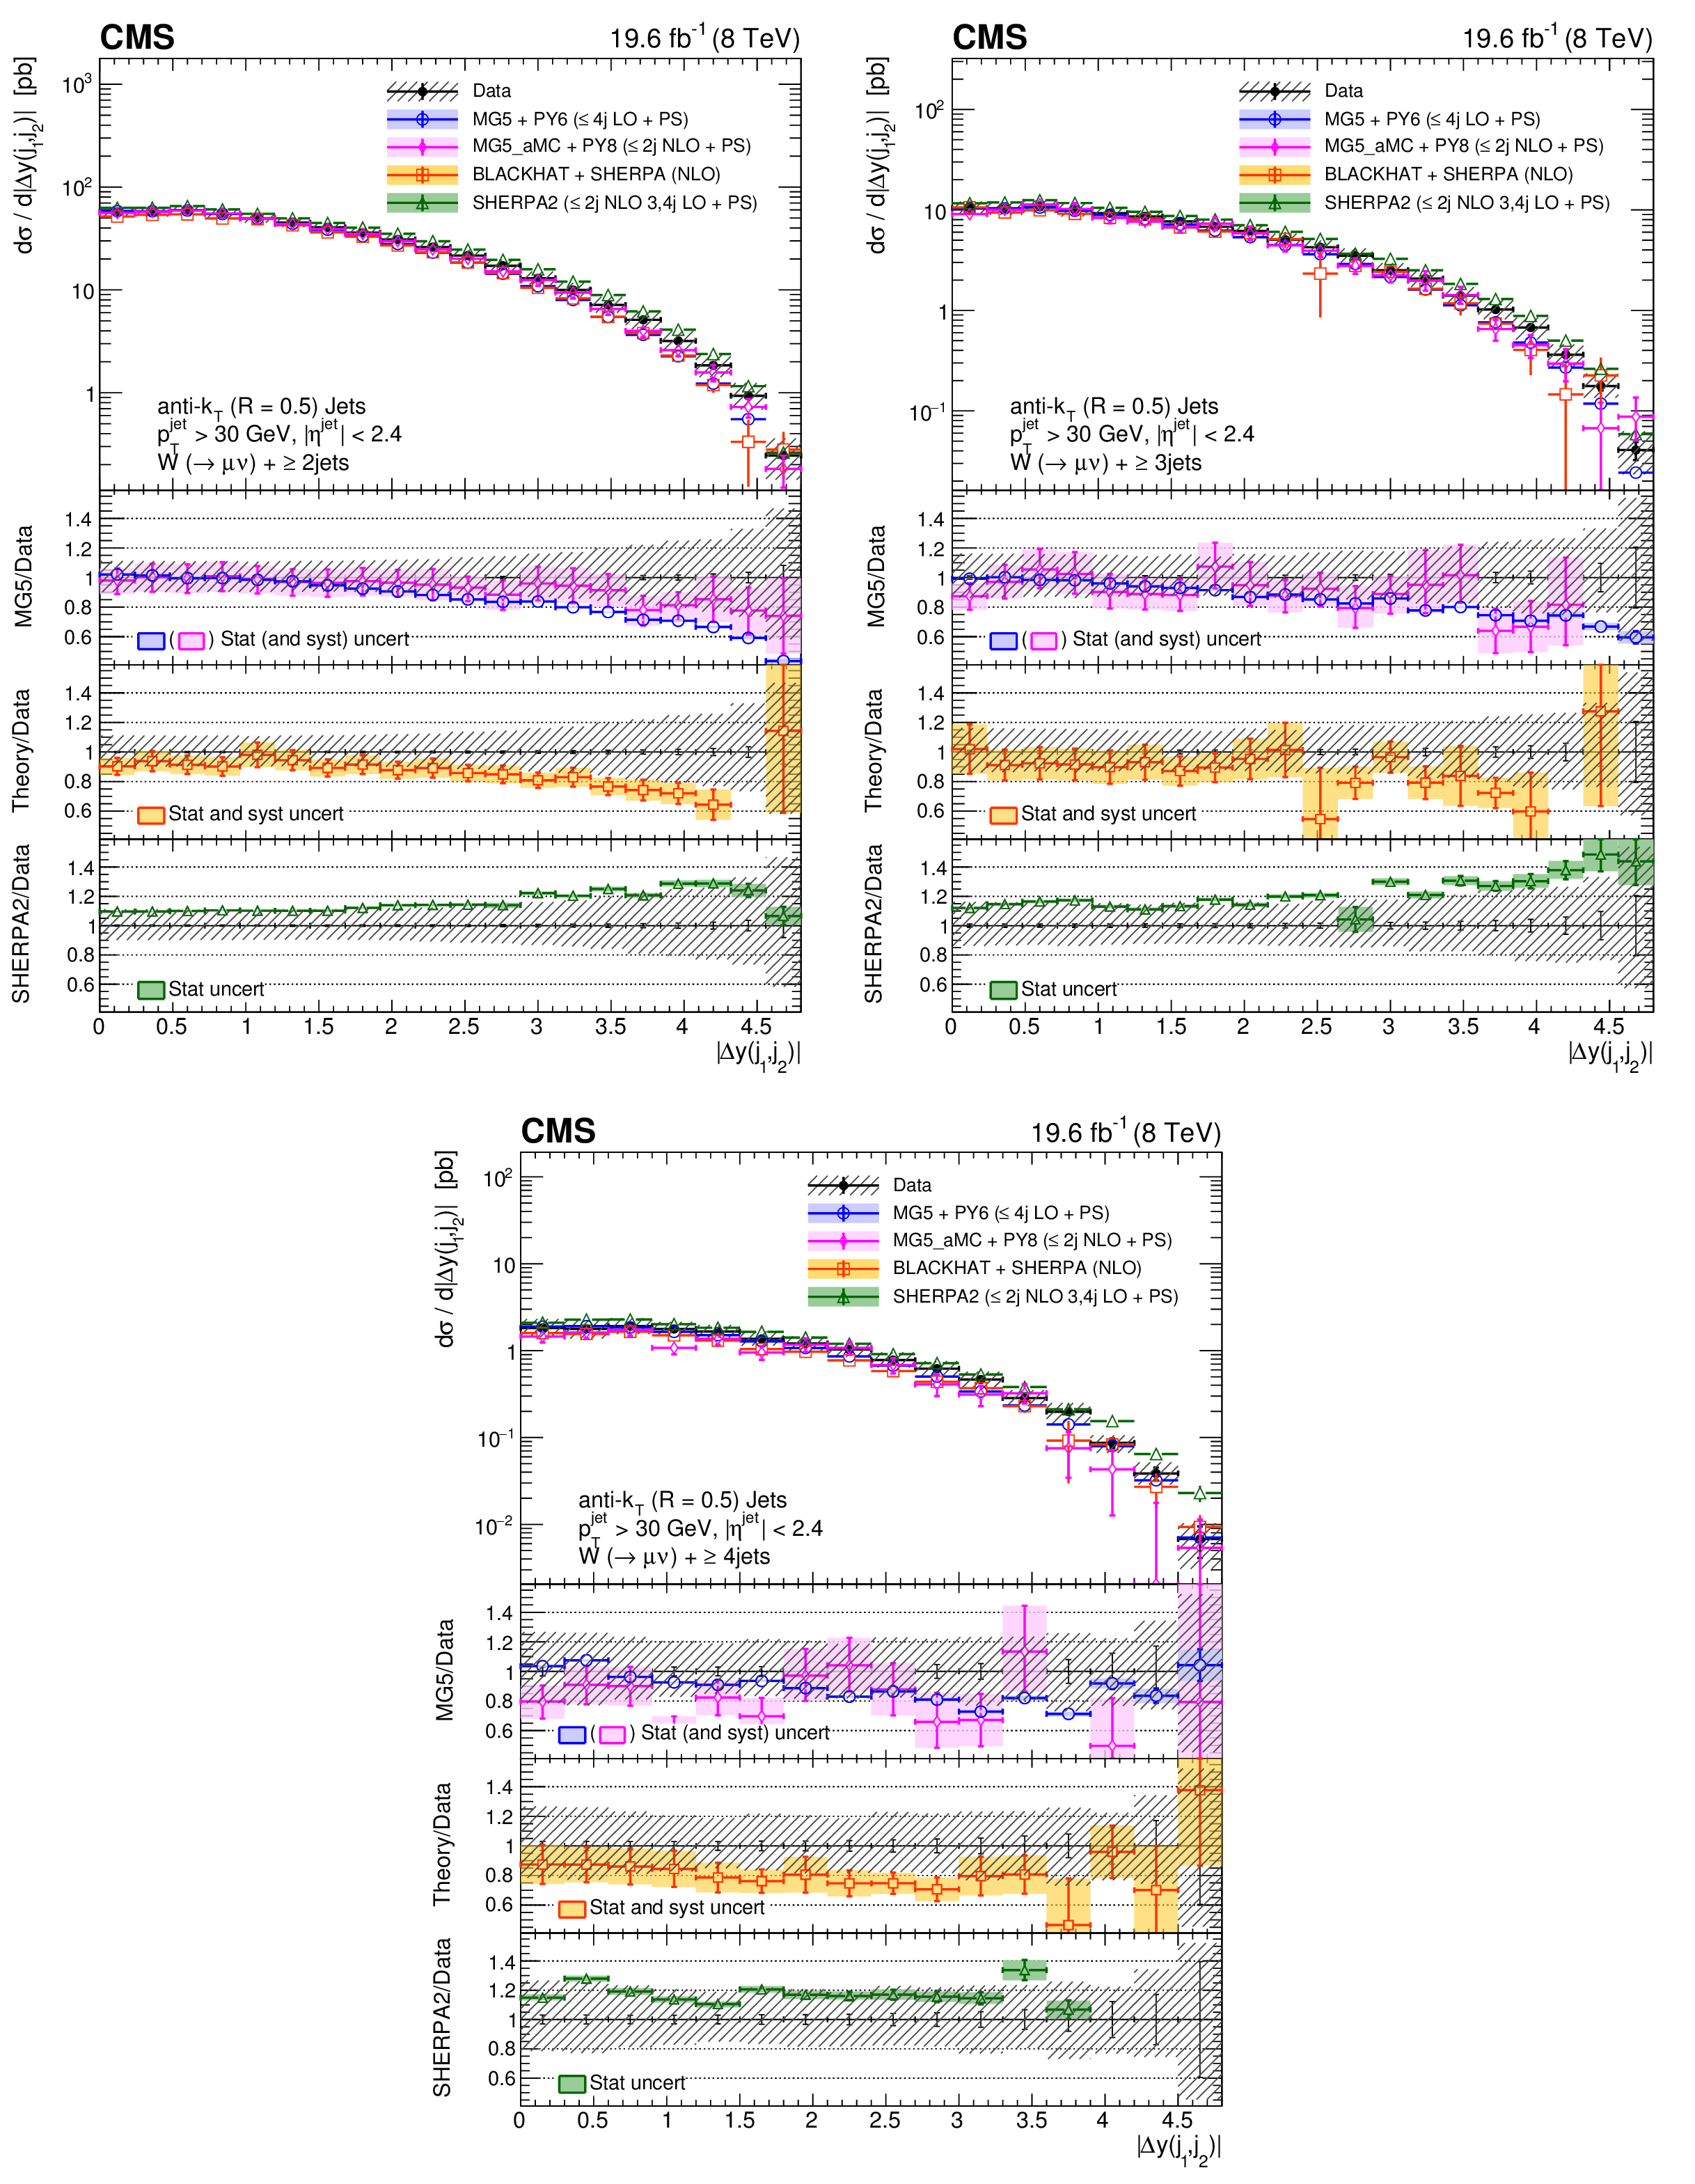
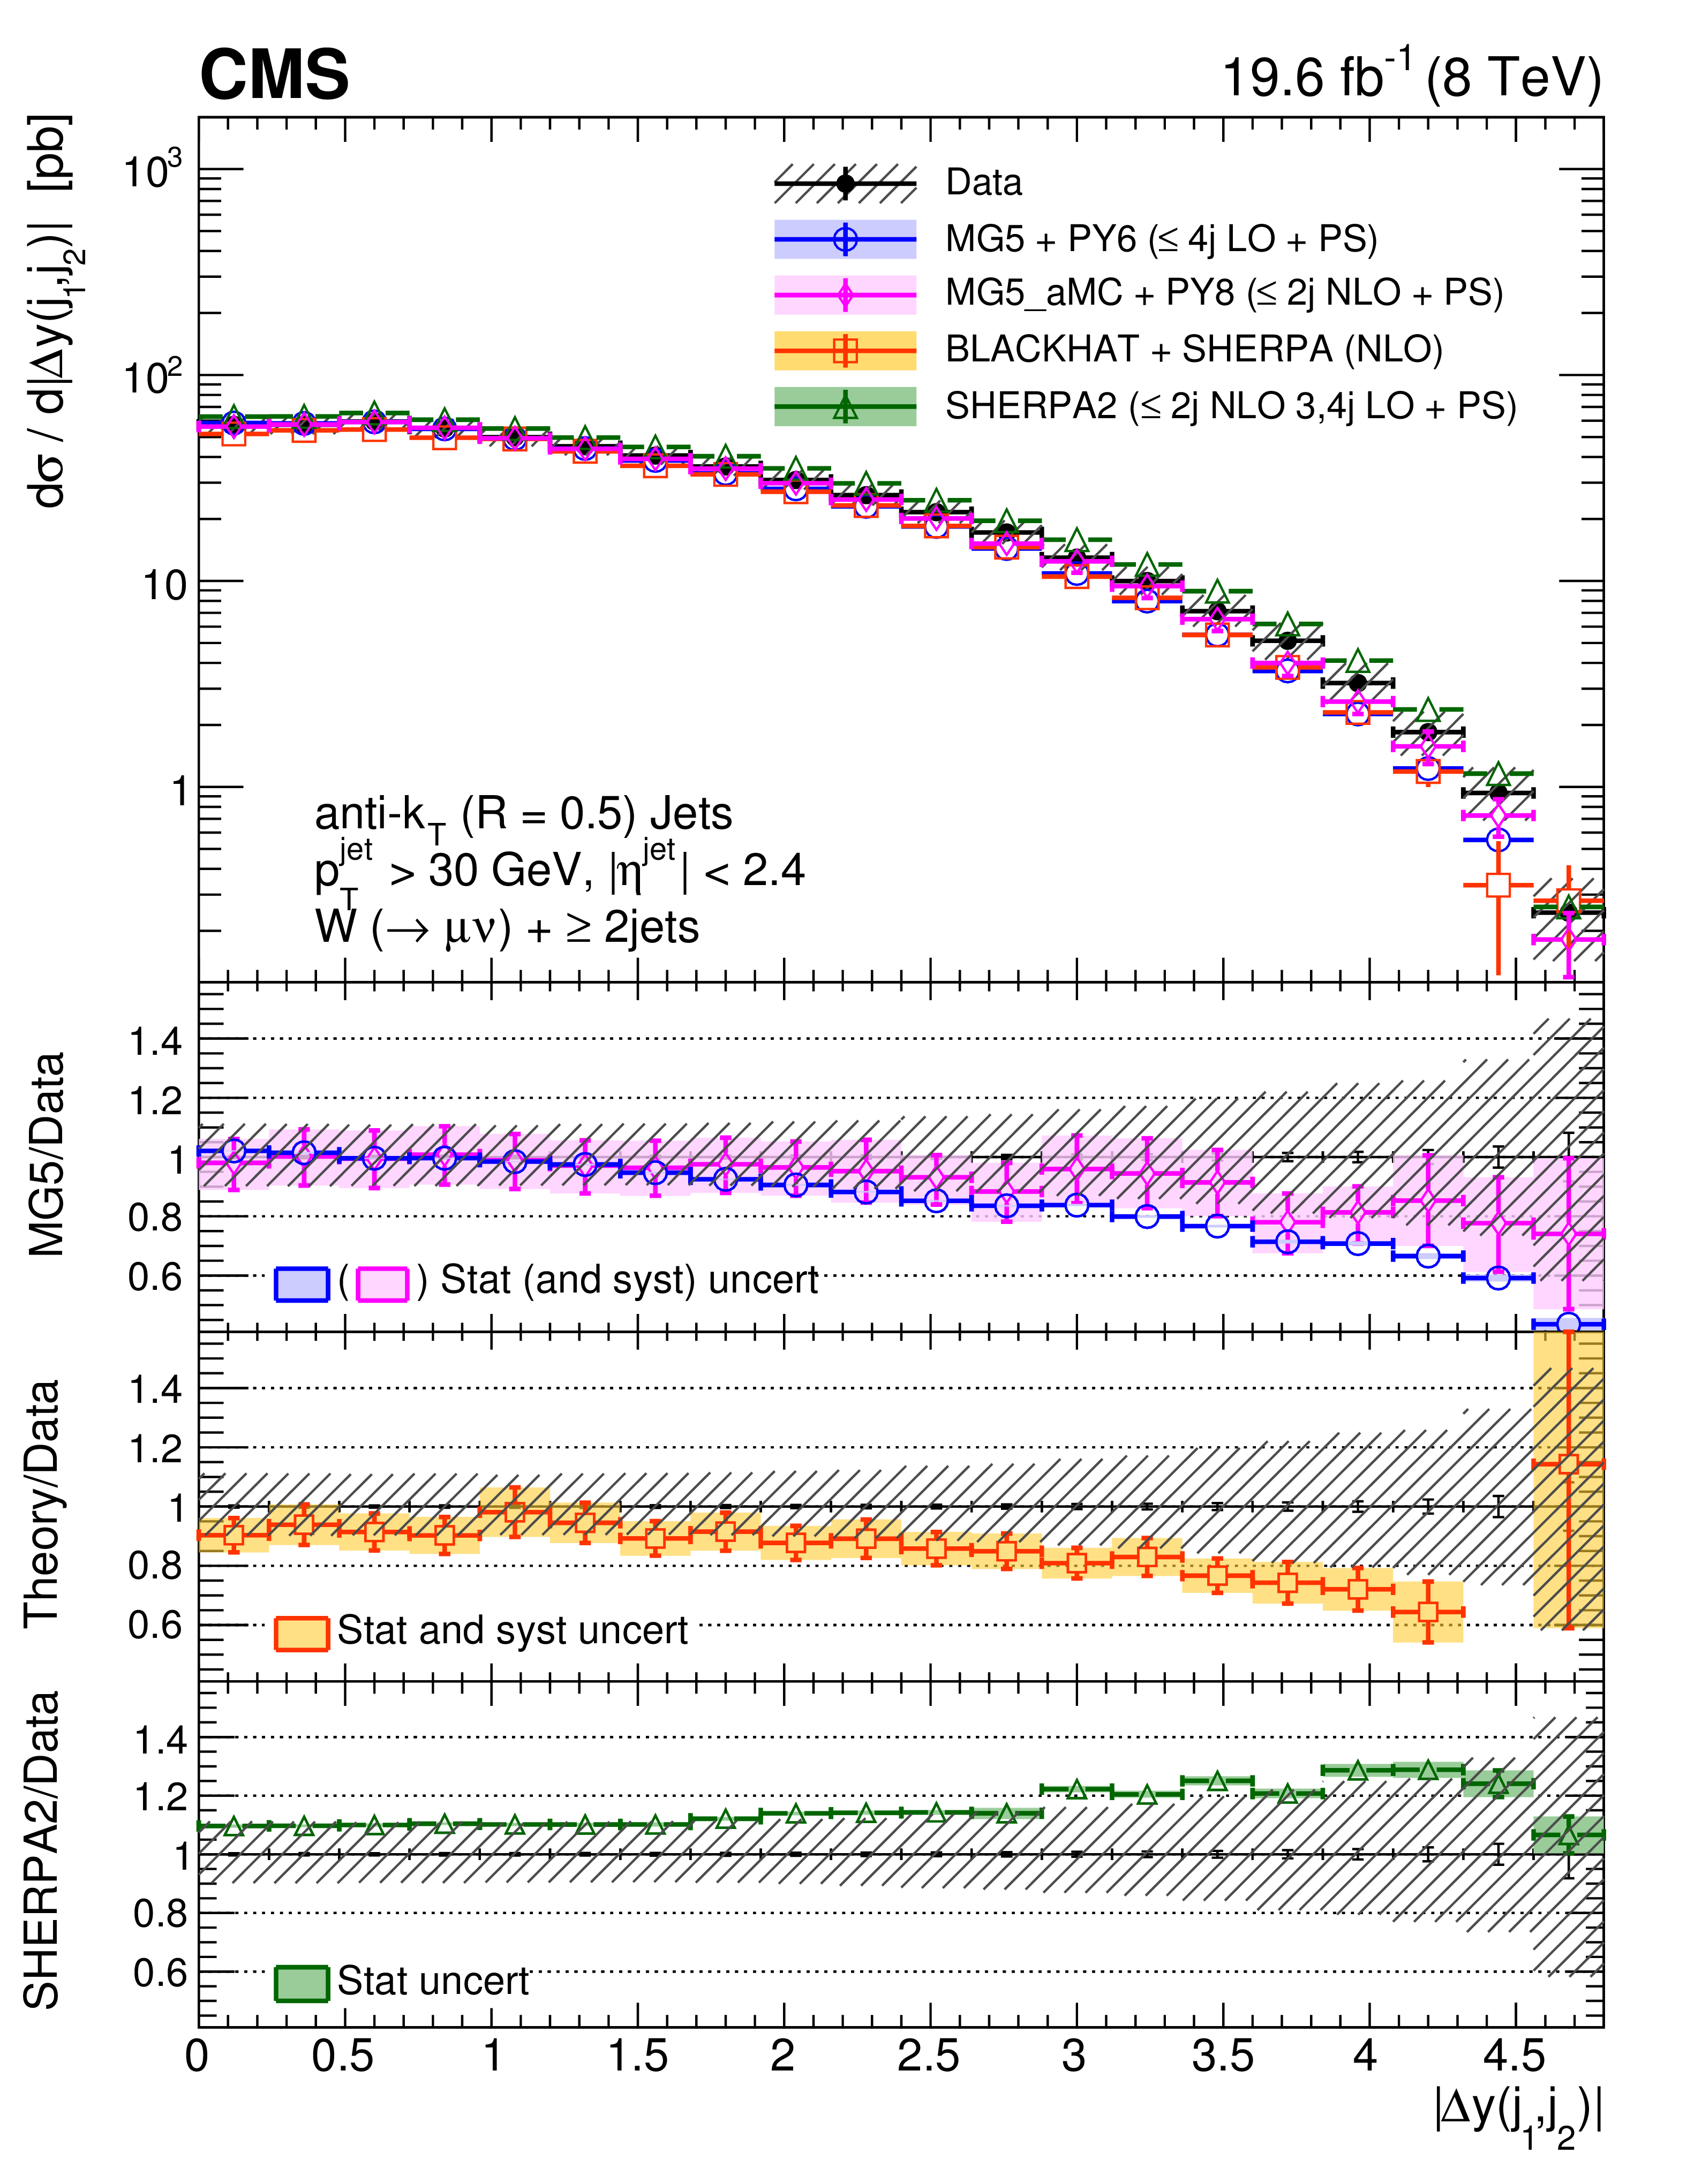
Cross sections differential in $\Delta y(j_1,j_2)$ for inclusive jet multiplicities 2-4, compared to the predictions of MadGraph, MadGraph-5-aMC@NLO, SHERPA-2, and BLACKHAT+SHERPA (corrected for hadronization and multiple-parton interactions). Black circular markers with the gray hatched band represent the unfolded data measurements and their total uncertainties. Overlaid are the predictions together with their uncertainties. The lower plots show the ratio of each prediction to the unfolded data. |
png pdf |
Figure 9-a:
Cross section differential in $\Delta y(j_1,j_2)$ for inclusive jet multiplicities 2, compared to the predictions of MadGraph, MadGraph-5-aMC@NLO, SHERPA-2, and BLACKHAT+SHERPA (corrected for hadronization and multiple-parton interactions). Black circular markers with the gray hatched band represent the unfolded data measurements and their total uncertainties. Overlaid are the predictions together with their uncertainties. The lower plots show the ratio of each prediction to the unfolded data. |
png pdf |
Figure 9-b:
Cross section differential in $\Delta y(j_1,j_2)$ for inclusive jet multiplicities 3, compared to the predictions of MadGraph, MadGraph-5-aMC@NLO, SHERPA-2, and BLACKHAT+SHERPA (corrected for hadronization and multiple-parton interactions). Black circular markers with the gray hatched band represent the unfolded data measurements and their total uncertainties. Overlaid are the predictions together with their uncertainties. The lower plots show the ratio of each prediction to the unfolded data. |
png pdf |
Figure 9-c:
Cross section differential in $\Delta y(j_1,j_2)$ for inclusive jet multiplicities 4, compared to the predictions of MadGraph, MadGraph-5-aMC@NLO, SHERPA-2, and BLACKHAT+SHERPA (corrected for hadronization and multiple-parton interactions). Black circular markers with the gray hatched band represent the unfolded data measurements and their total uncertainties. Overlaid are the predictions together with their uncertainties. The lower plots show the ratio of each prediction to the unfolded data. |
png pdf |
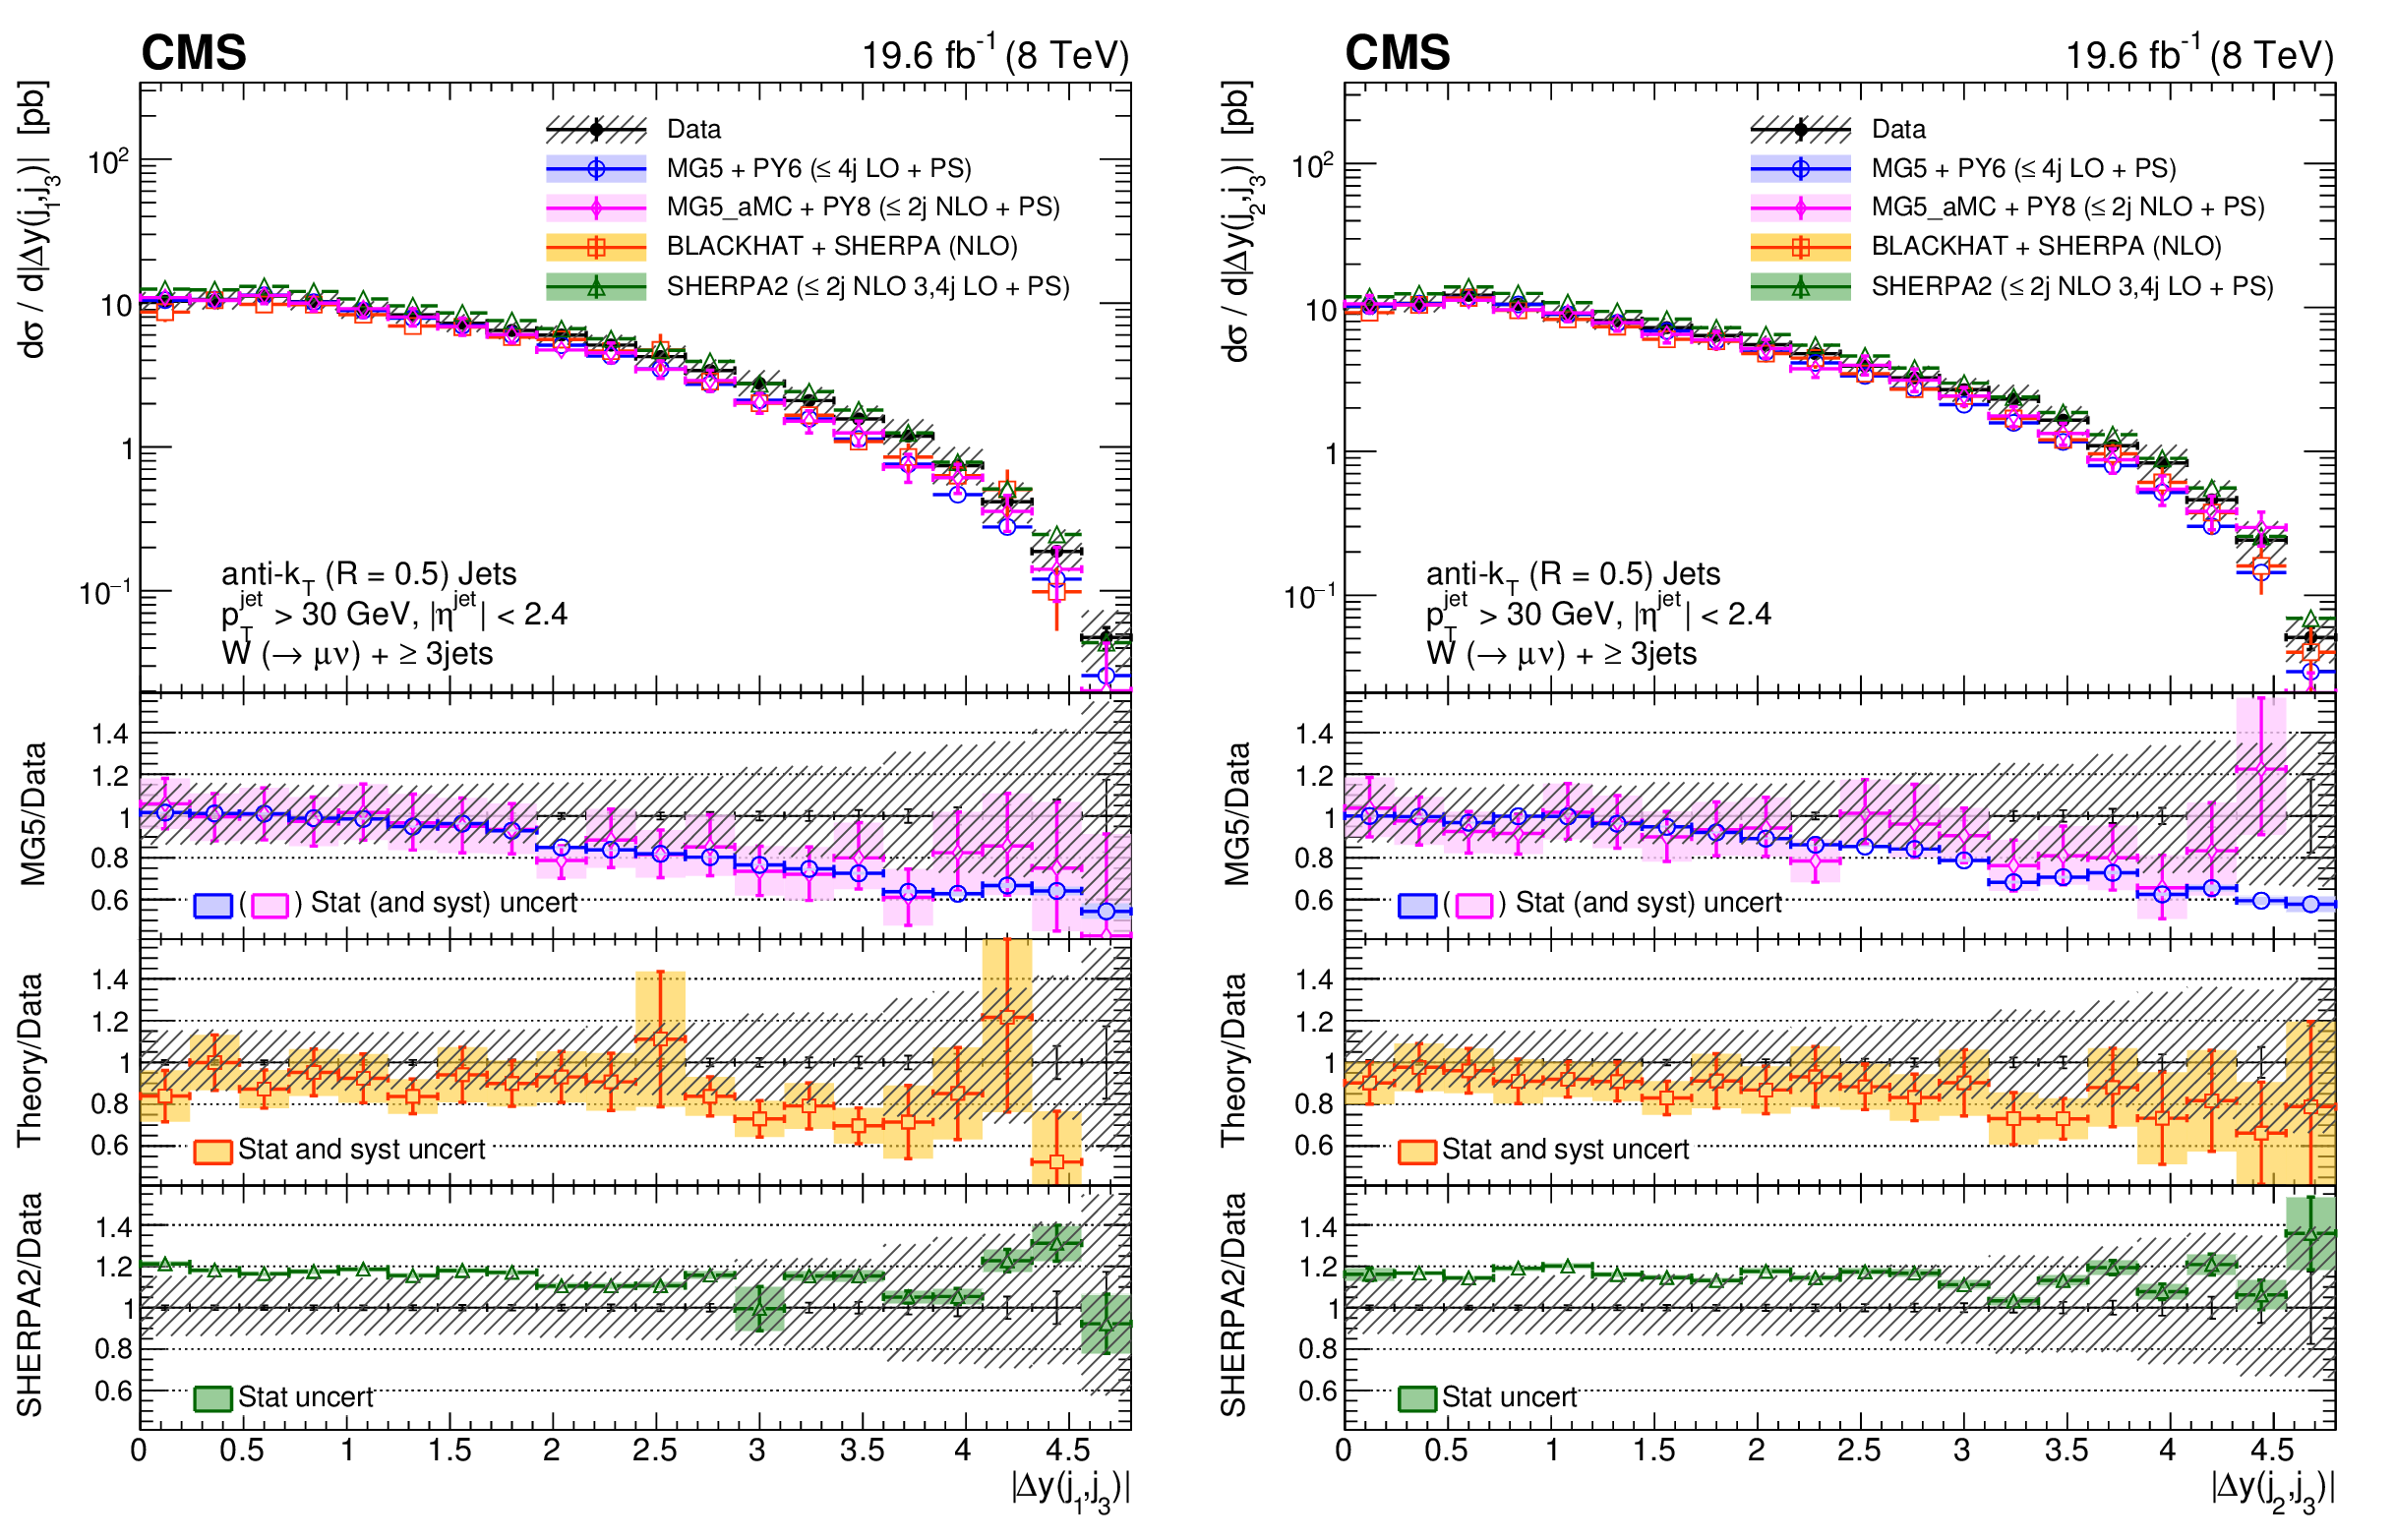
Figure 10:
Cross sections differential in $\Delta y(j_1,j_3)$ (left) and $\Delta y(j_2,j_3)$ (right) for an inclusive jet multiplicity of 3, compared to the predictions of MadGraph, MadGraph-5-aMC@NLO, SHERPA-2, and BLACKHAT+SHERPA (corrected for hadronization and multiple-parton interactions). Black circular markers with the gray hatched band represent the unfolded data measurements and their total uncertainties. Overlaid are the predictions together with their uncertainties. The lower plots show the ratio of each prediction to the unfolded data. |

png pdf |
Figure 10-a:
Cross section differential in $\Delta y(j_1,j_3)$ for an inclusive jet multiplicity of 3, compared to the predictions of MadGraph, MadGraph-5-aMC@NLO, SHERPA-2, and BLACKHAT+SHERPA (corrected for hadronization and multiple-parton interactions). Black circular markers with the gray hatched band represent the unfolded data measurements and their total uncertainties. Overlaid are the predictions together with their uncertainties. The lower plots show the ratio of each prediction to the unfolded data. |
png pdf |
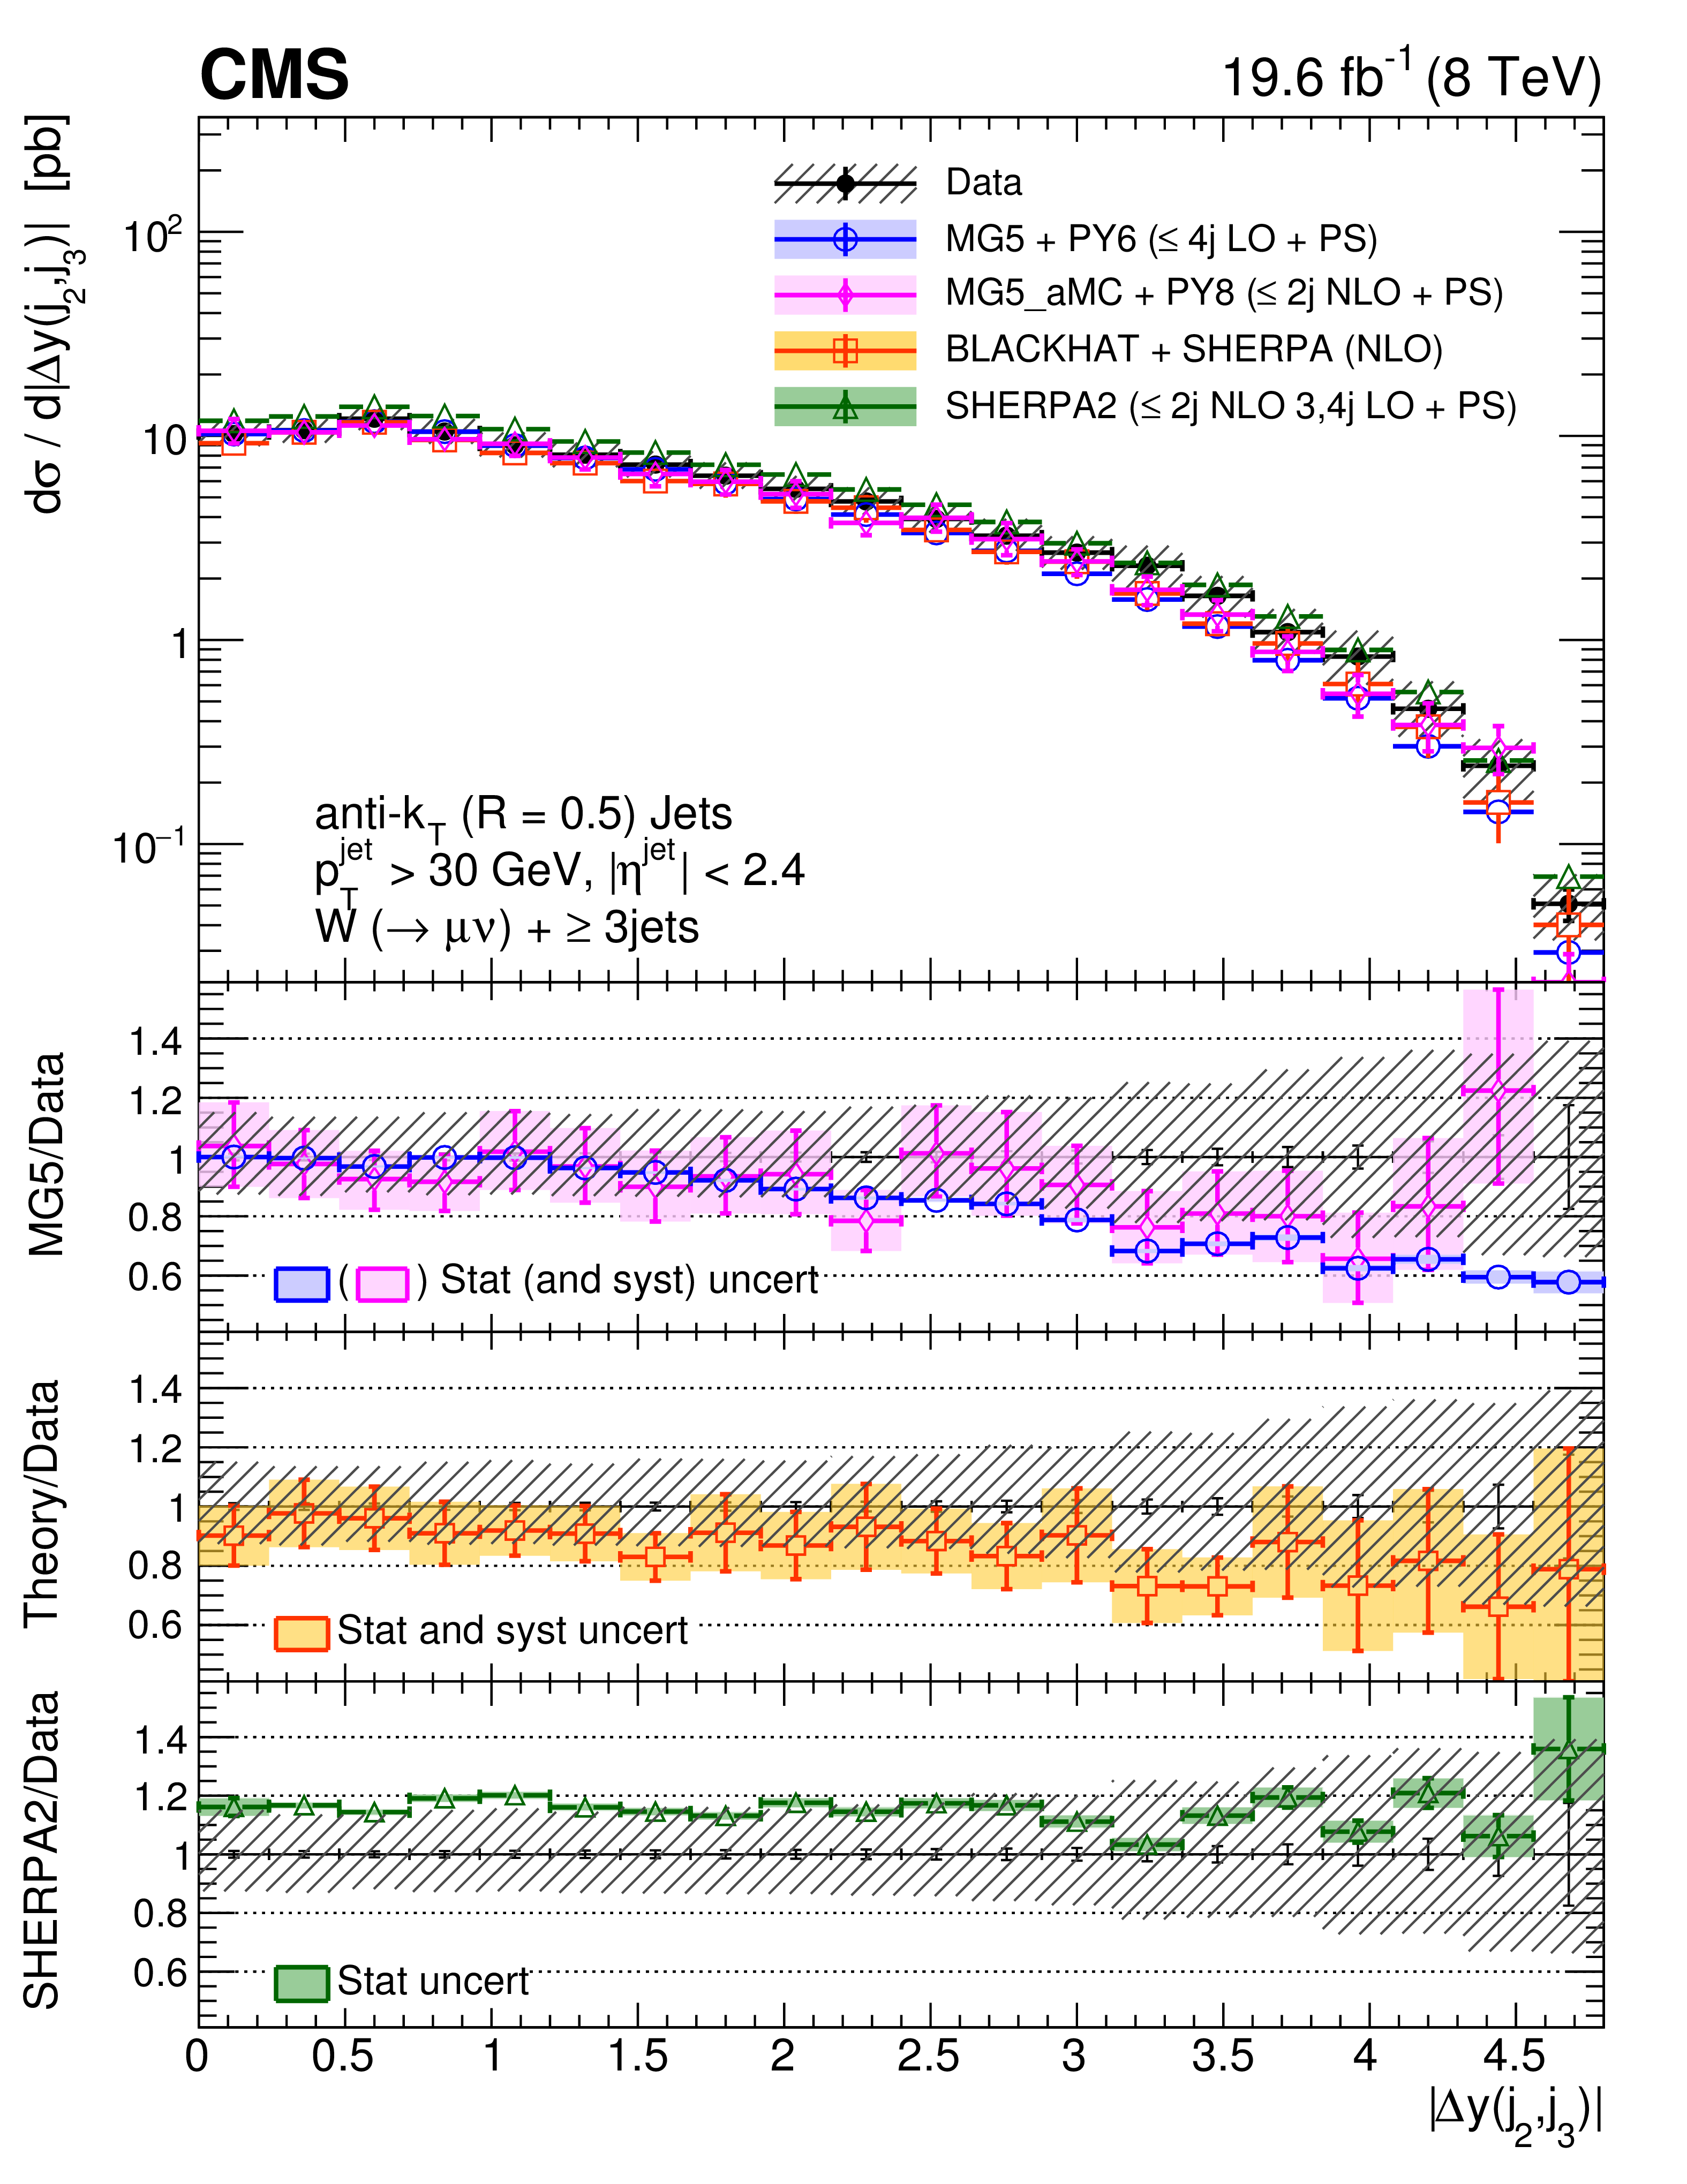
Figure 10-b:
Cross section differential in $\Delta y(j_2,j_3)$ for an inclusive jet multiplicity of 3, compared to the predictions of MadGraph, MadGraph-5-aMC@NLO, SHERPA-2, and BLACKHAT+SHERPA (corrected for hadronization and multiple-parton interactions). Black circular markers with the gray hatched band represent the unfolded data measurements and their total uncertainties. Overlaid are the predictions together with their uncertainties. The lower plots show the ratio of each prediction to the unfolded data. |
png pdf |
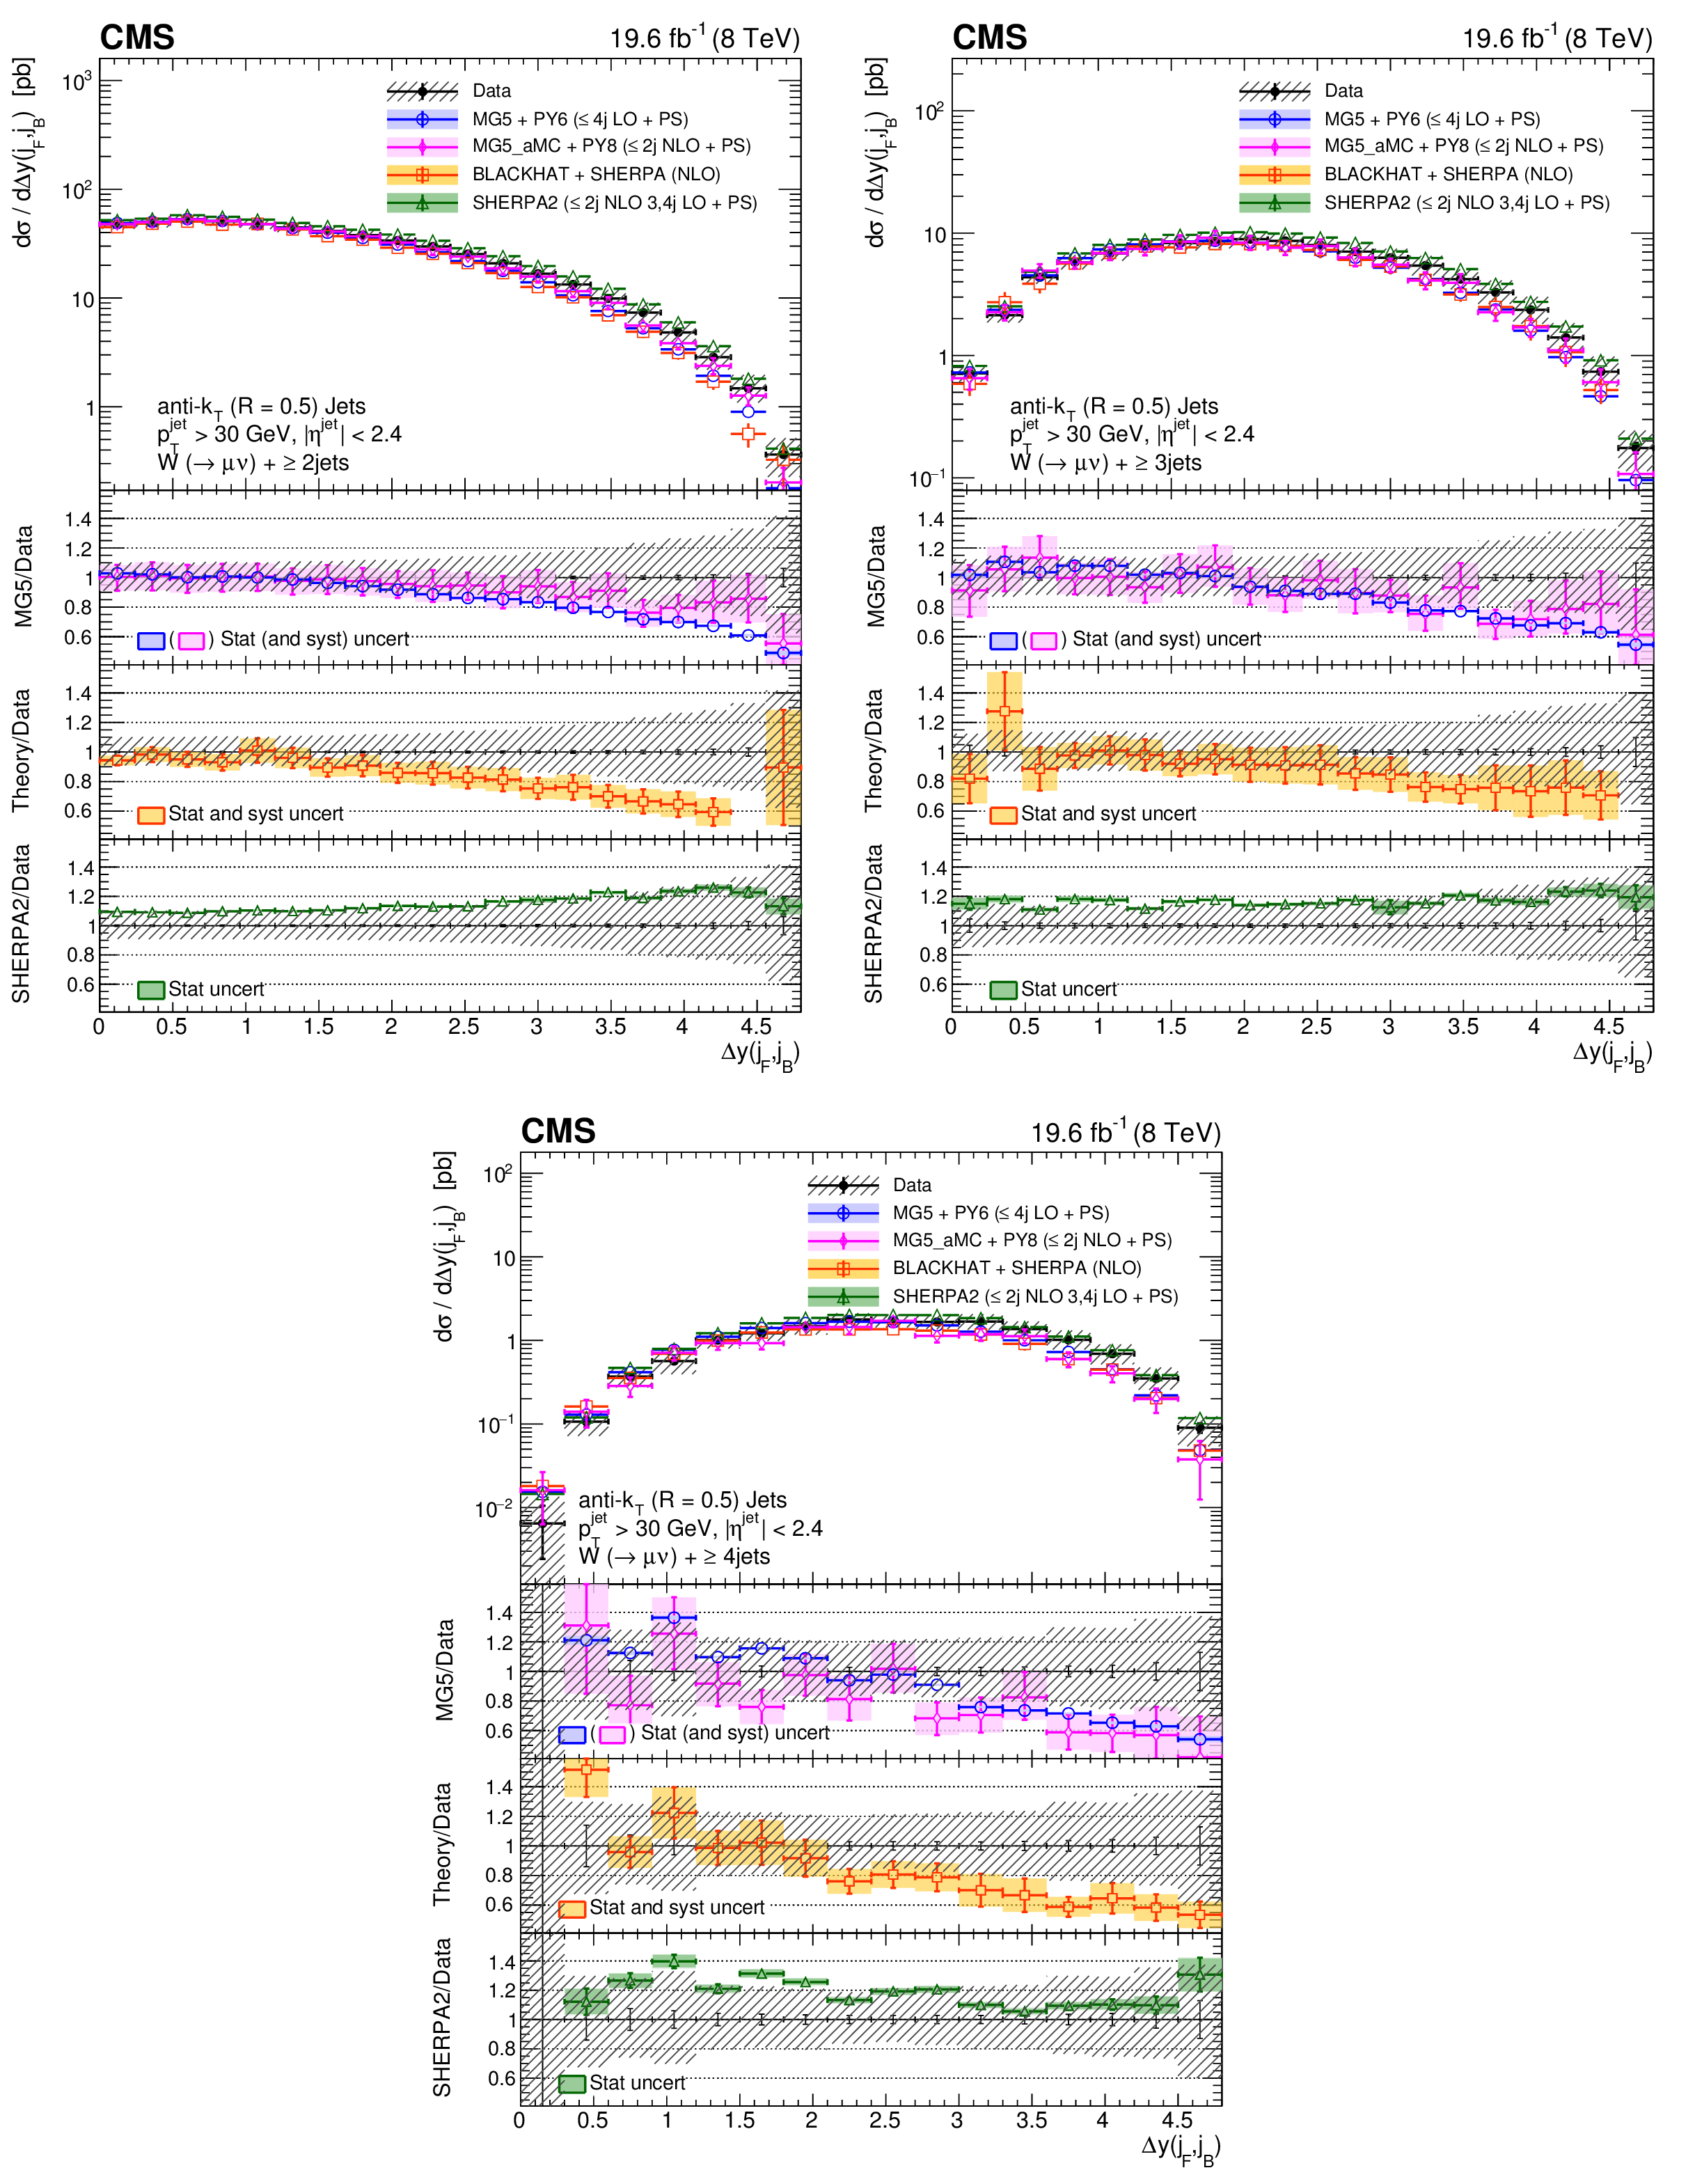
Figure 11:
Cross sections differential in $\Delta y(j_F,j_B)$ for inclusive jet multiplicities 2-4, compared to the predictions of MadGraph, MadGraph-5-aMC@NLO, SHERPA-2, and BLACKHAT+SHERPA (corrected for hadronization and multiple-parton interactions). Black circular markers with the gray hatched band represent the unfolded data measurements and their total uncertainties. Overlaid are the predictions together with their uncertainties. The lower plots show the ratio of each prediction to the unfolded data. |
png pdf |
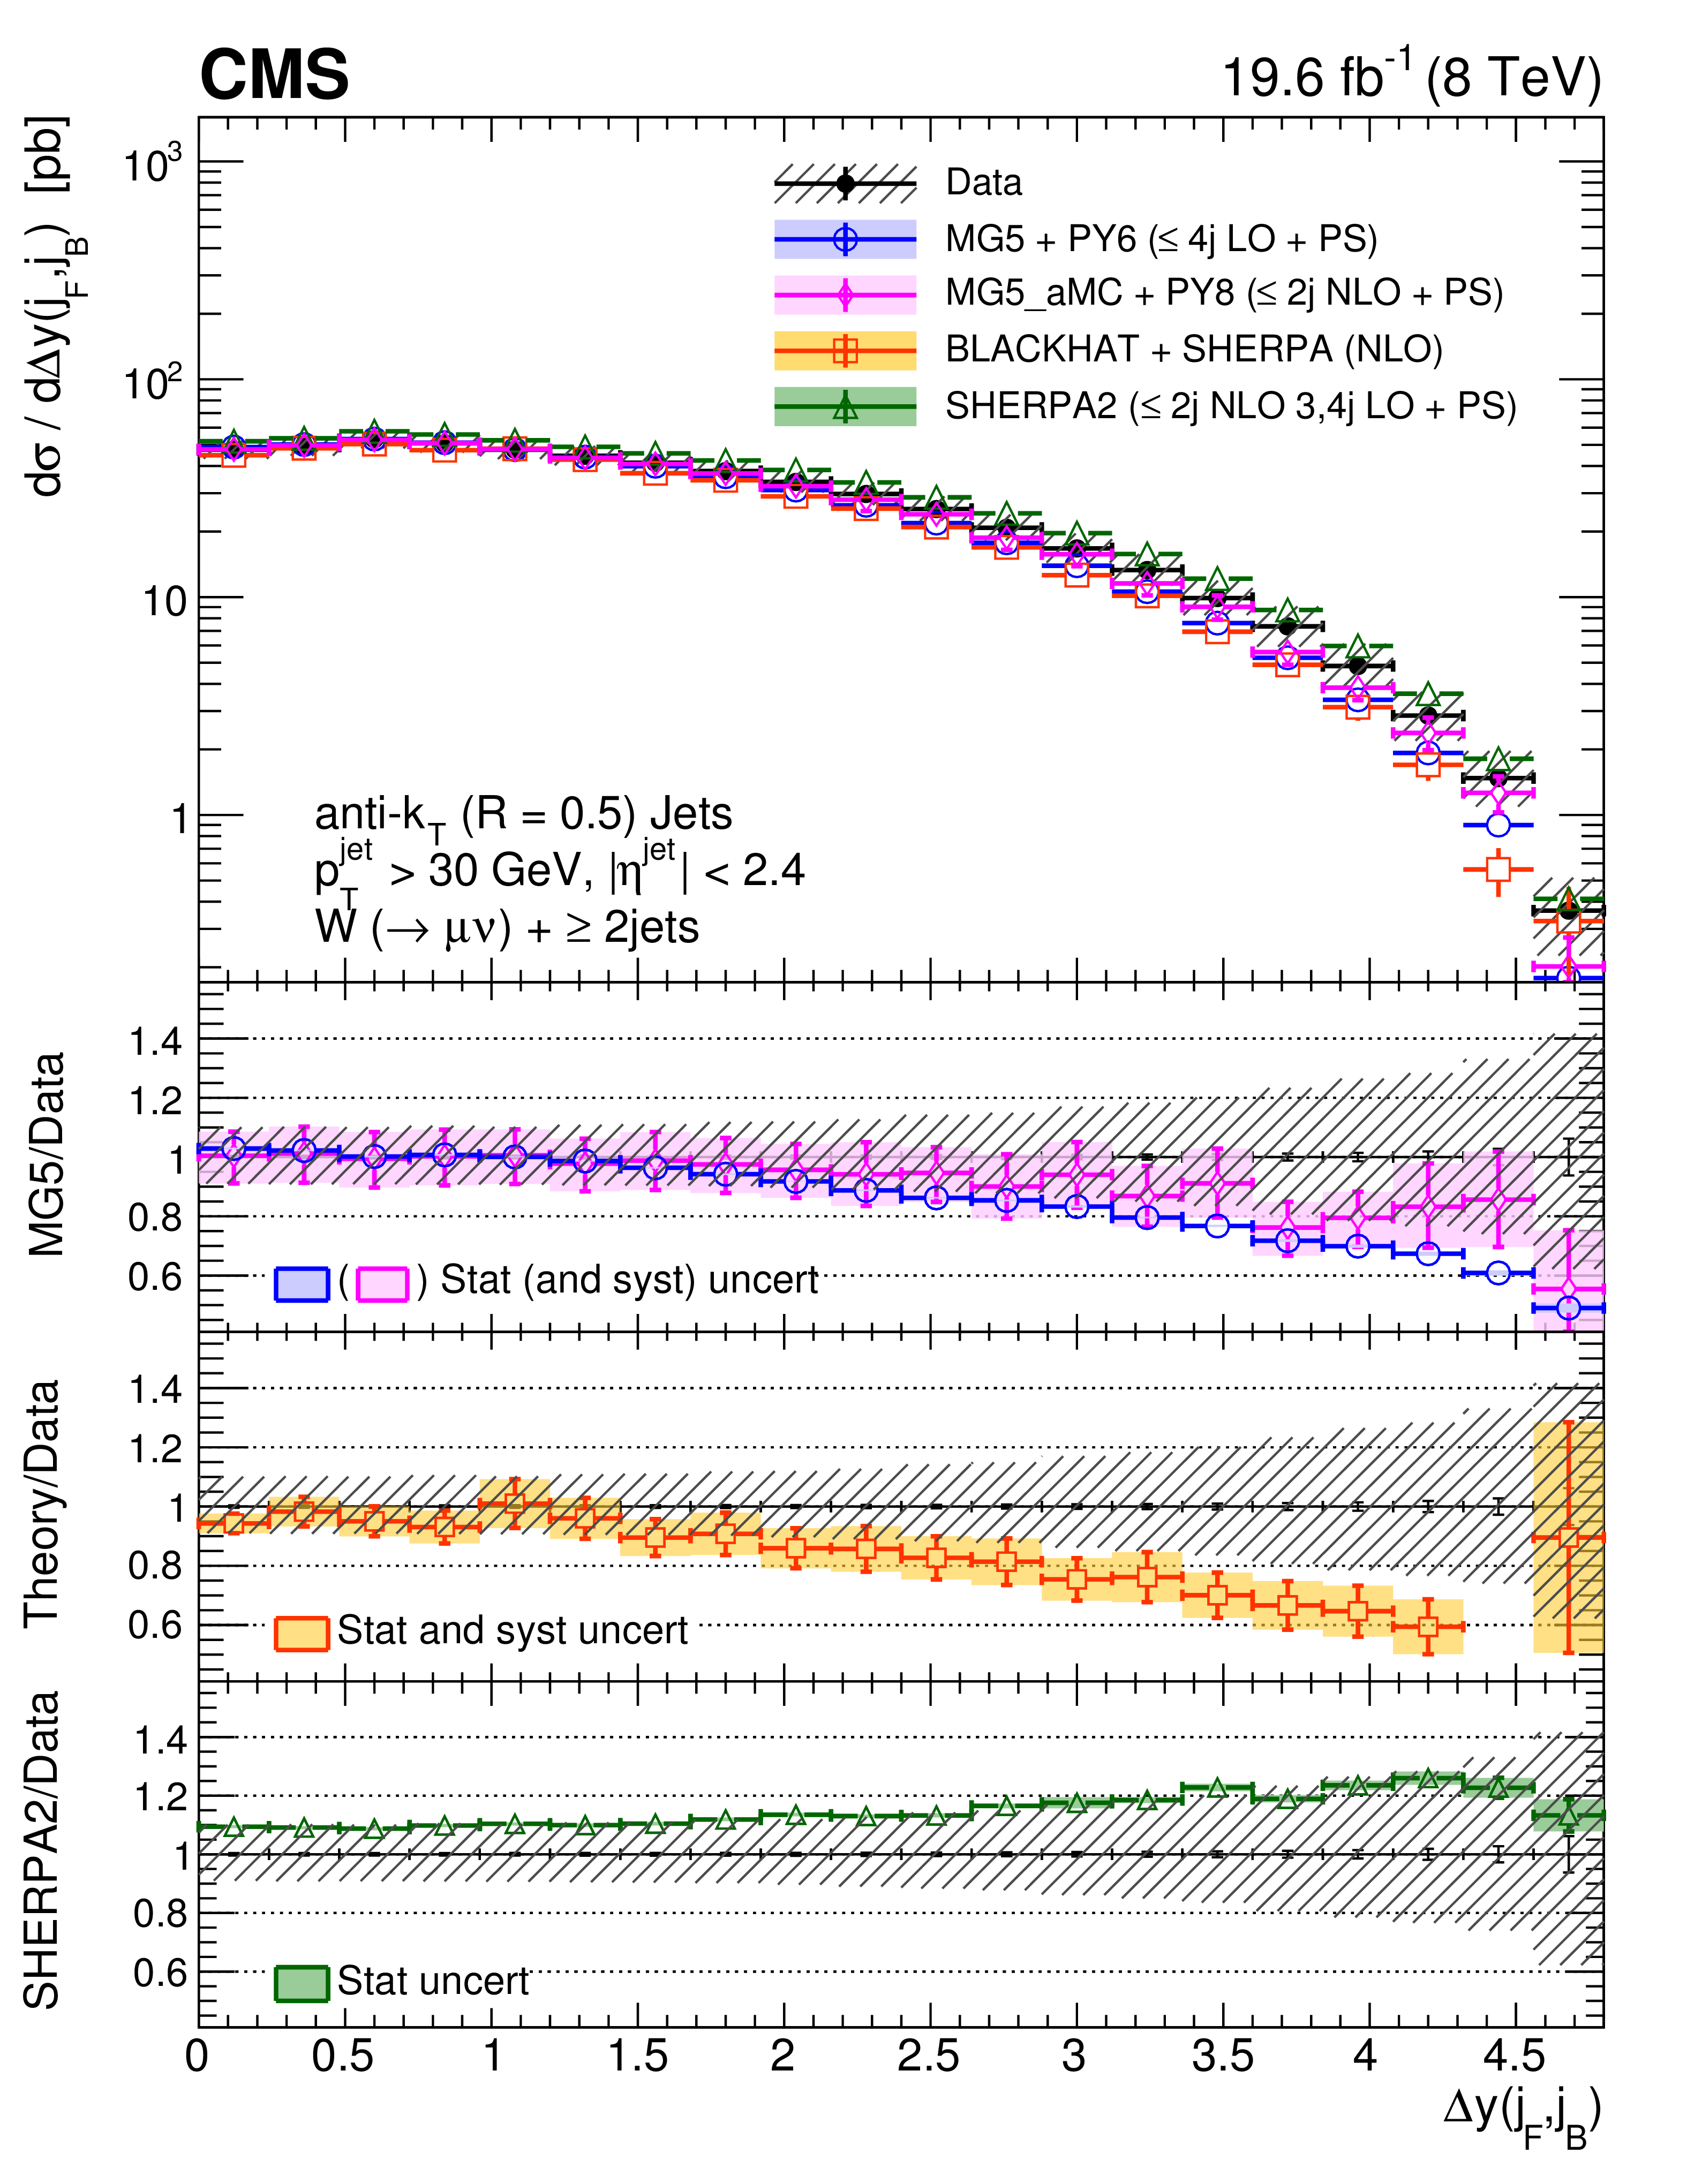
Figure 11-a:
Cross section differential in $\Delta y(j_F,j_B)$ for inclusive jet multiplicity 2, compared to the predictions of MadGraph, MadGraph-5-aMC@NLO, SHERPA-2, and BLACKHAT+SHERPA (corrected for hadronization and multiple-parton interactions). Black circular markers with the gray hatched band represent the unfolded data measurements and their total uncertainties. Overlaid are the predictions together with their uncertainties. The lower plots show the ratio of each prediction to the unfolded data. |
png pdf |
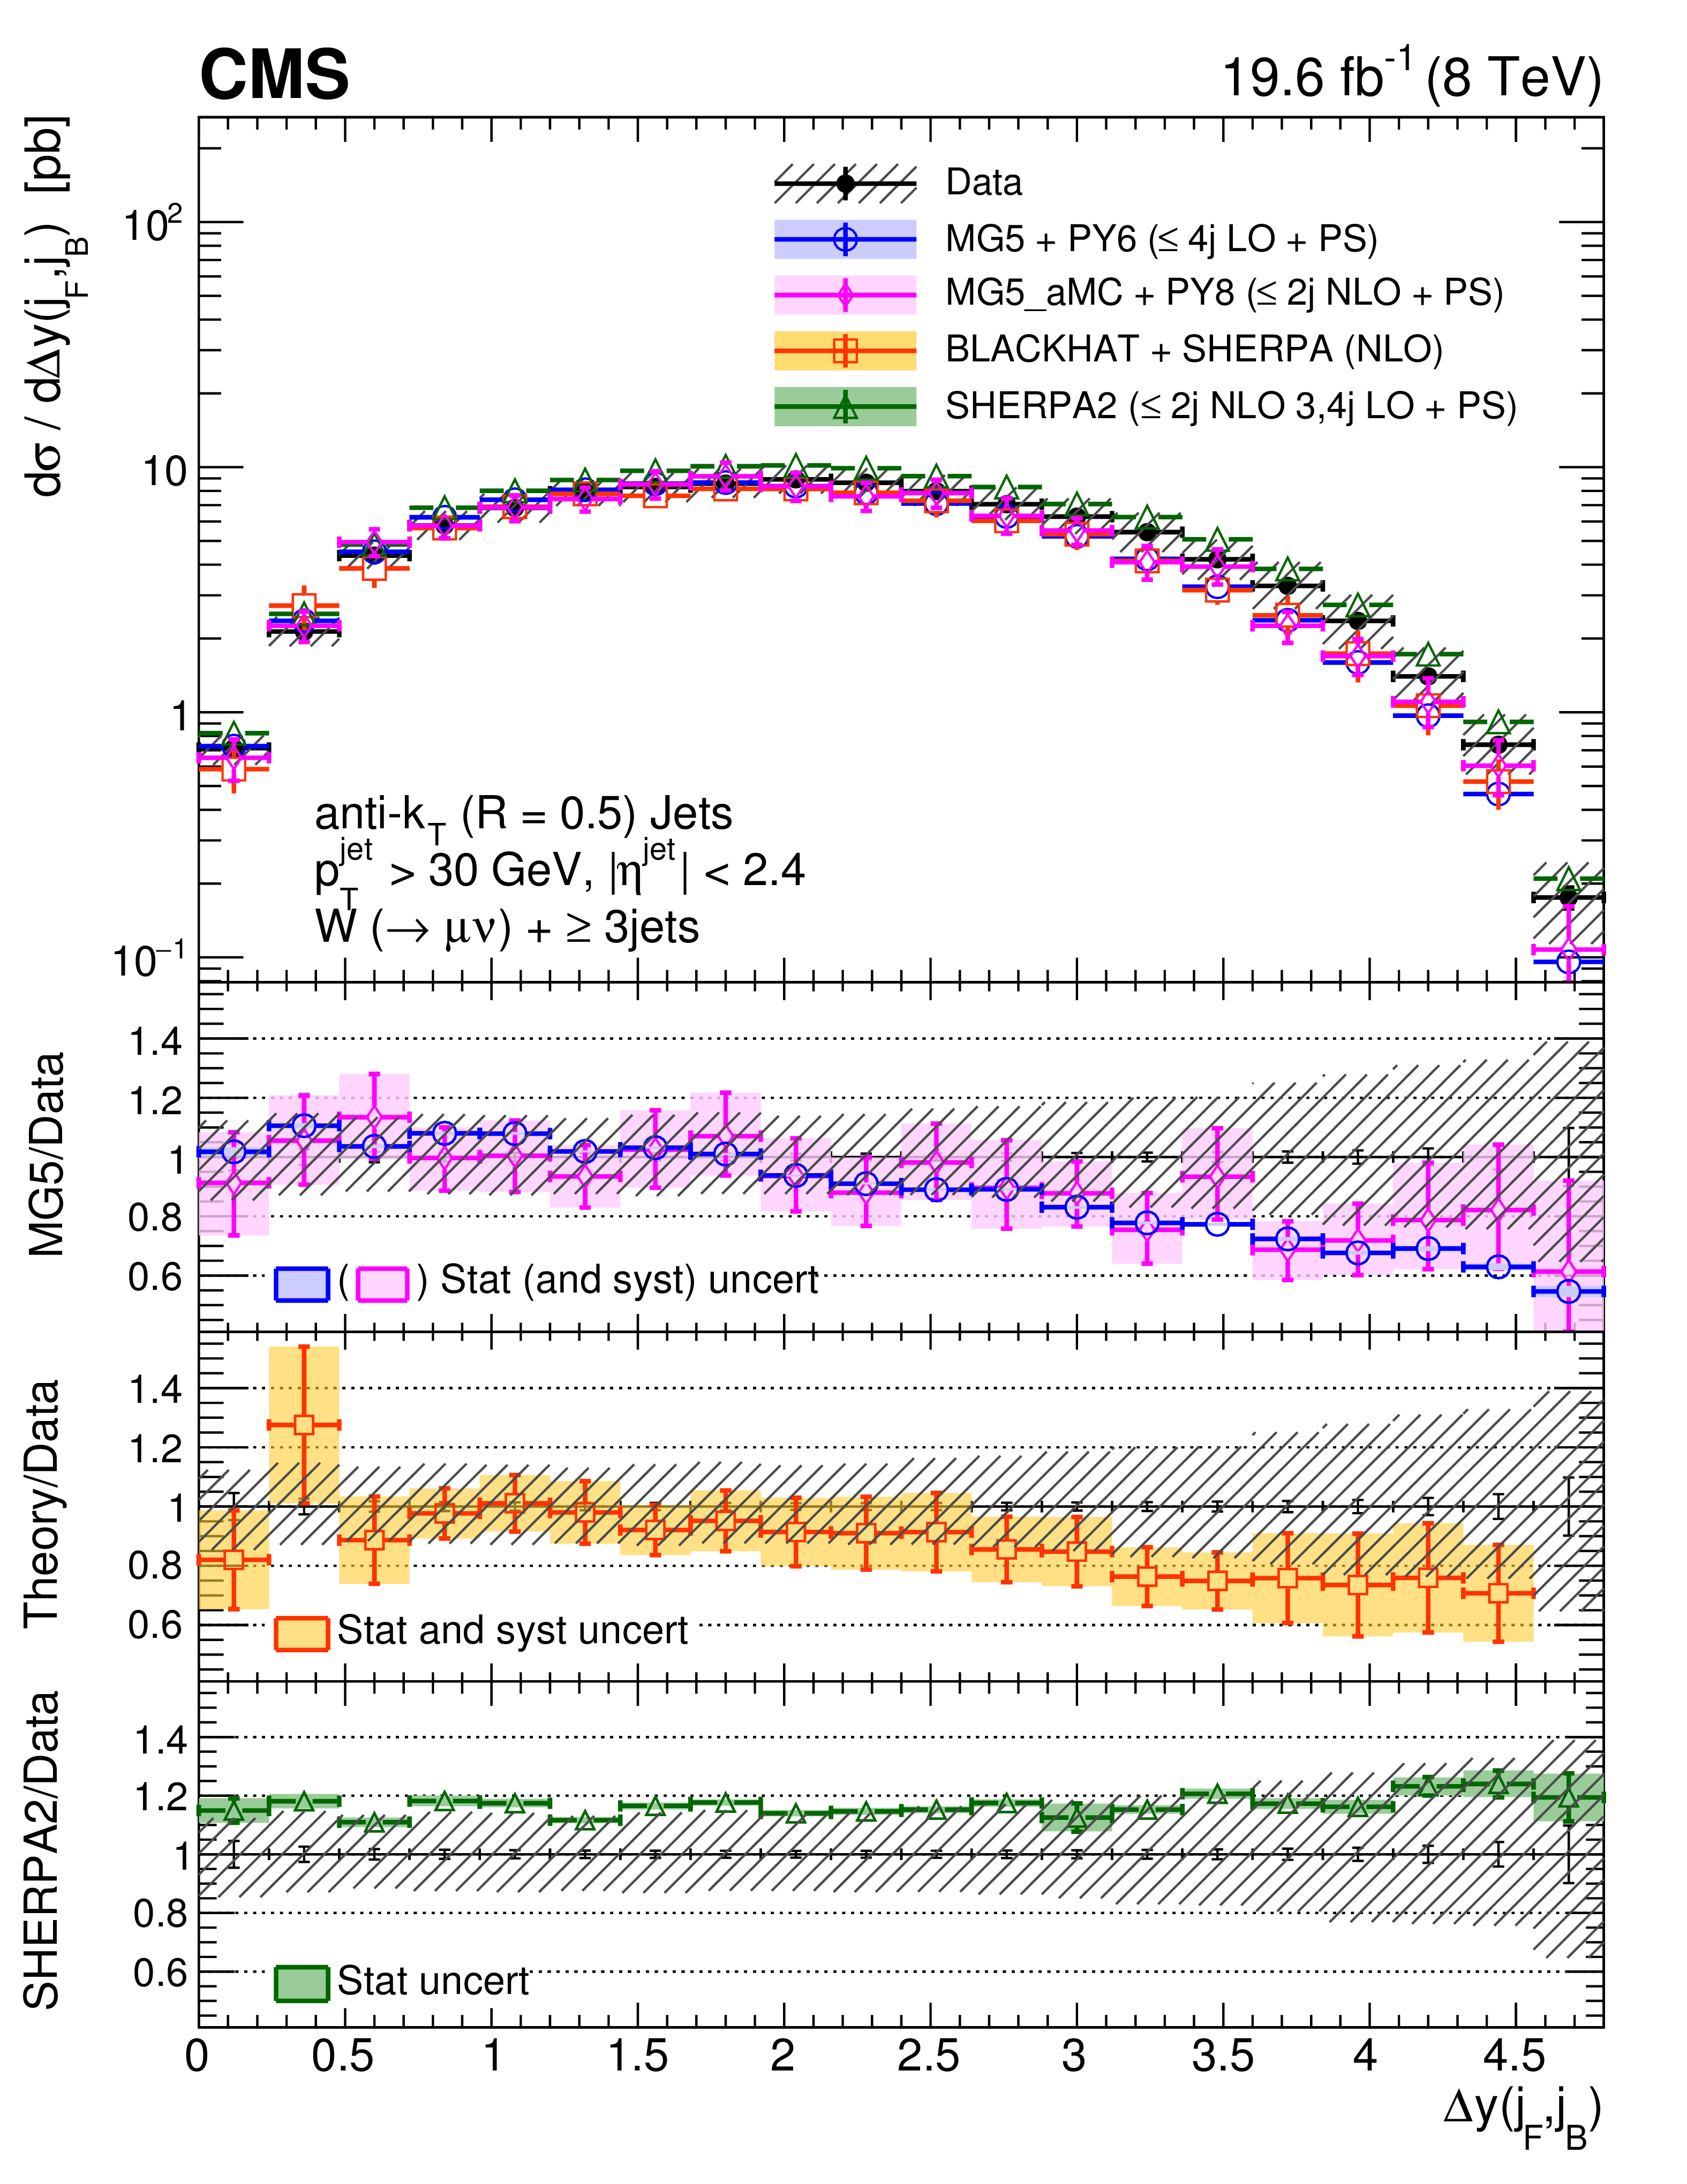
Figure 11-b:
Cross section differential in $\Delta y(j_F,j_B)$ for inclusive jet multiplicity 3, compared to the predictions of MadGraph, MadGraph-5-aMC@NLO, SHERPA-2, and BLACKHAT+SHERPA (corrected for hadronization and multiple-parton interactions). Black circular markers with the gray hatched band represent the unfolded data measurements and their total uncertainties. Overlaid are the predictions together with their uncertainties. The lower plots show the ratio of each prediction to the unfolded data. |
png pdf |
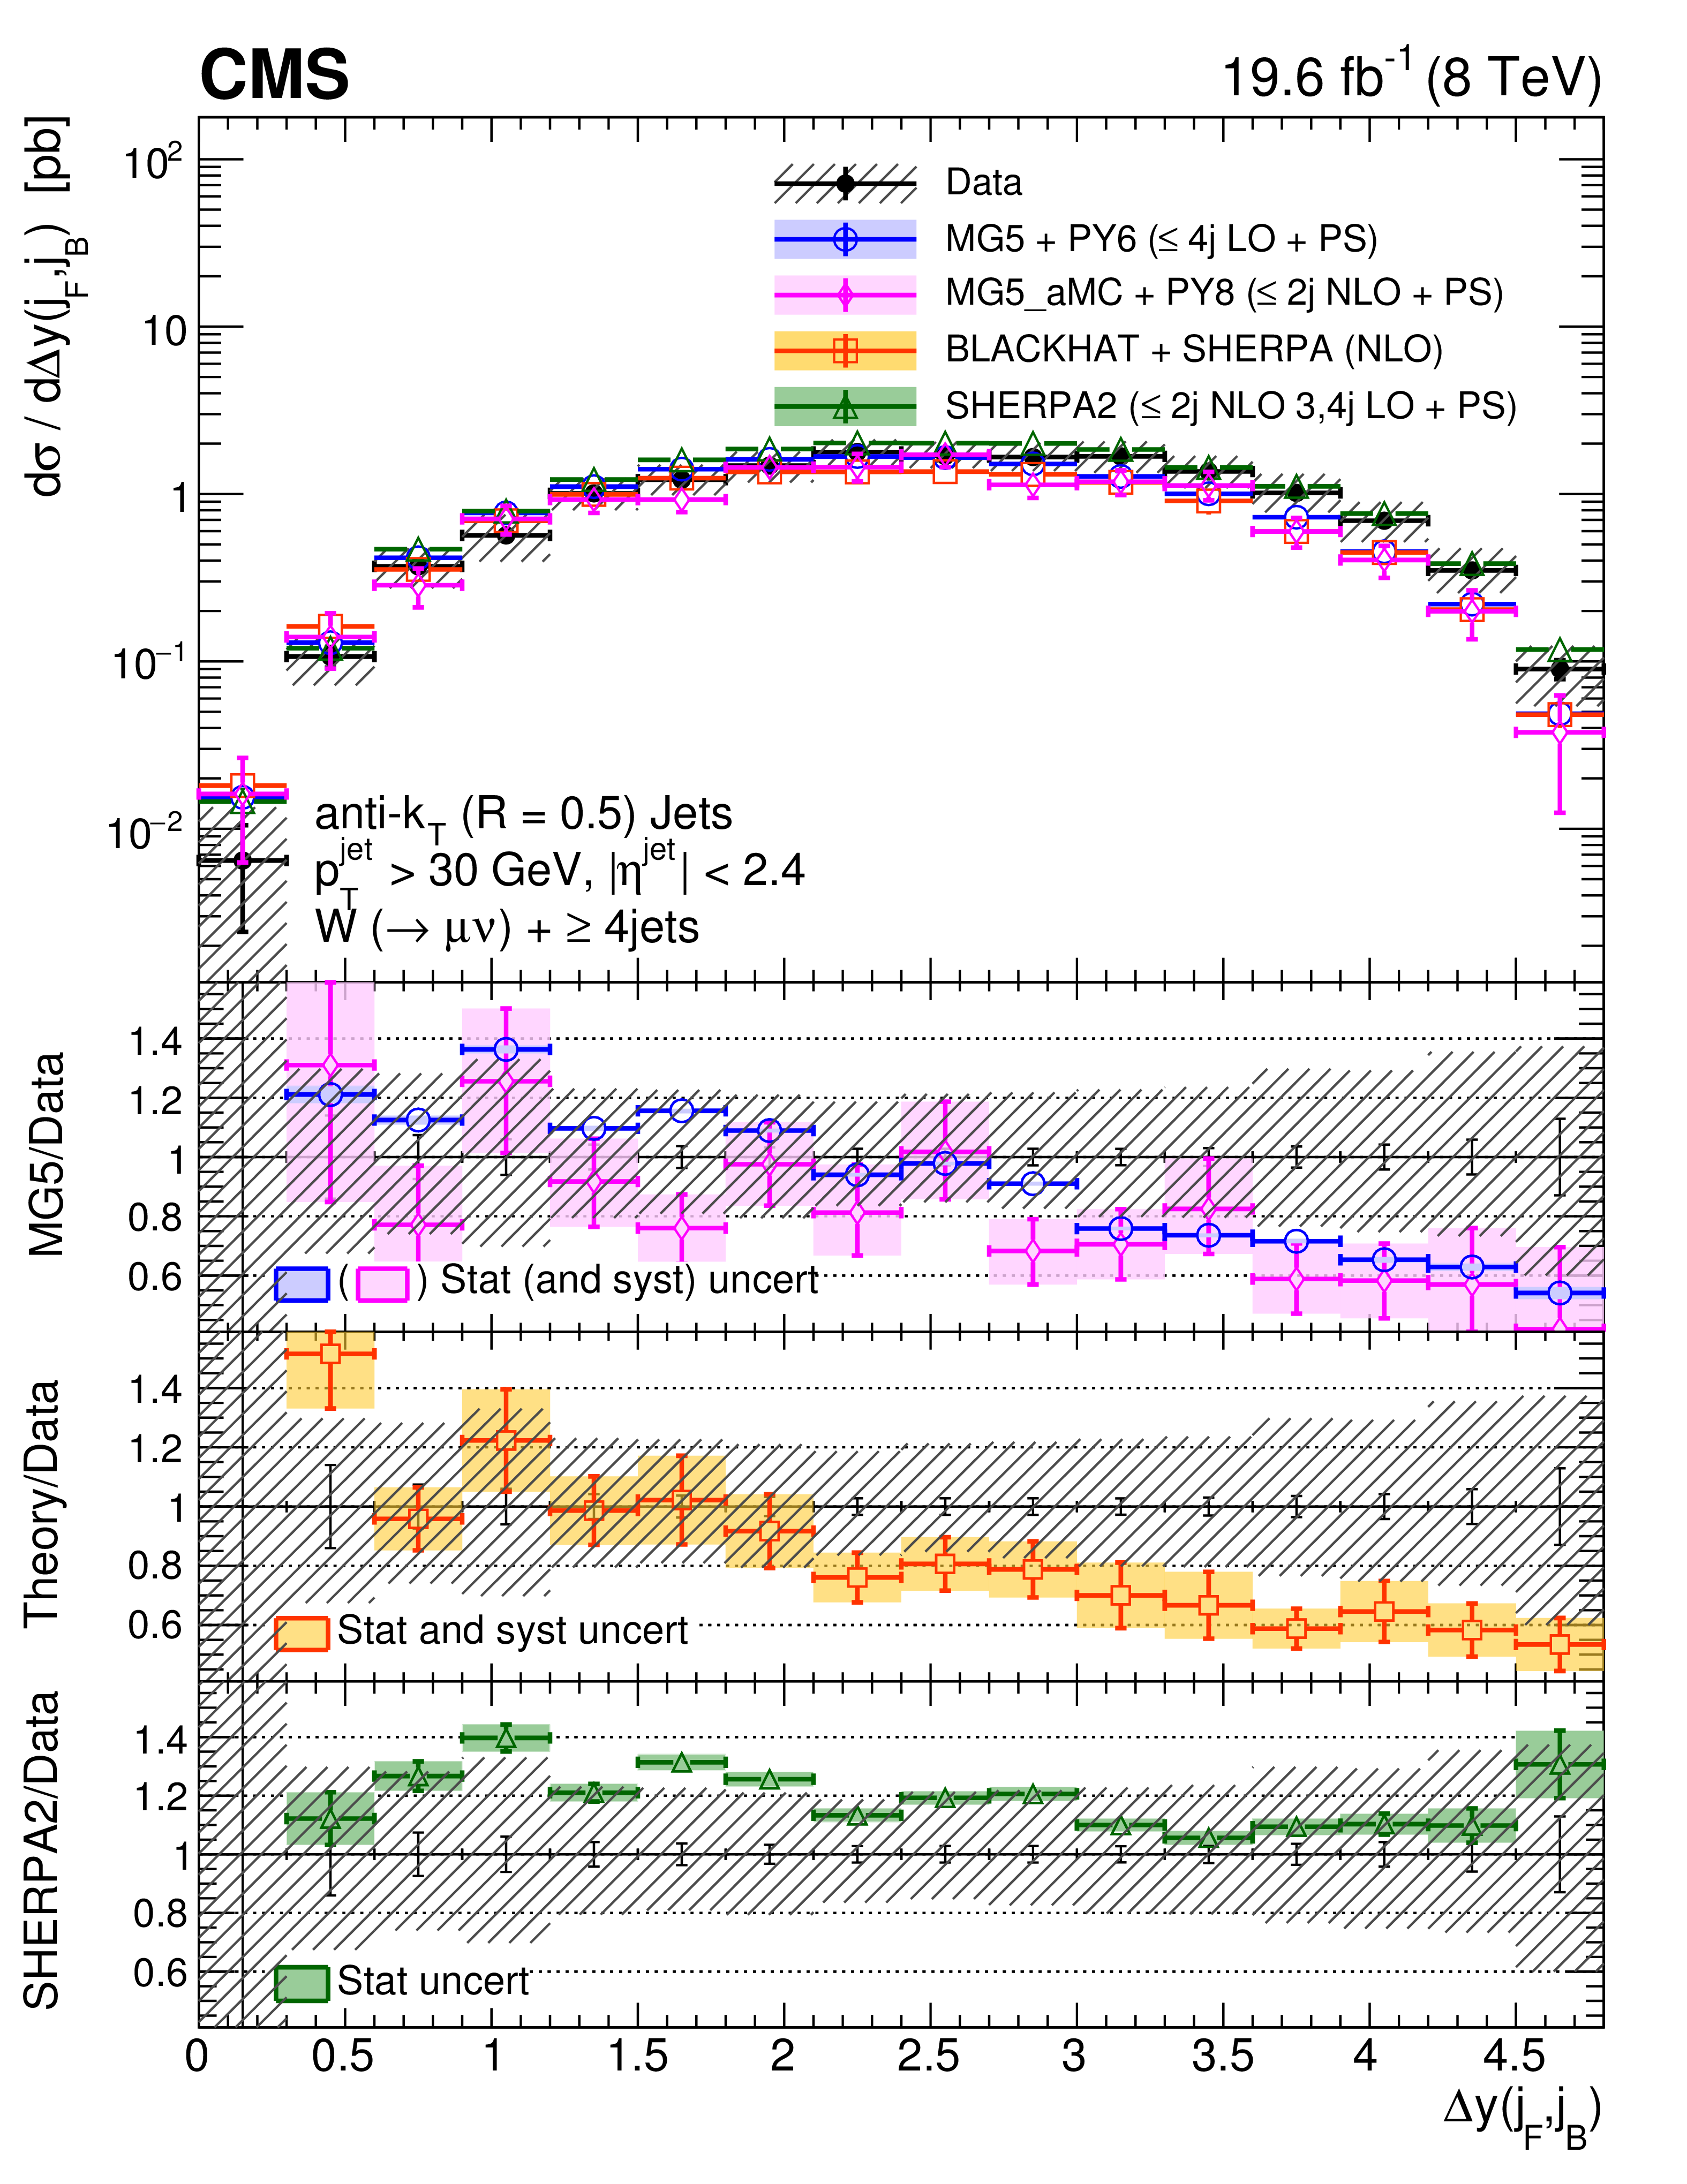
Figure 11-c:
Cross section differential in $\Delta y(j_F,j_B)$ for inclusive jet multiplicity 4, compared to the predictions of MadGraph, MadGraph-5-aMC@NLO, SHERPA-2, and BLACKHAT+SHERPA (corrected for hadronization and multiple-parton interactions). Black circular markers with the gray hatched band represent the unfolded data measurements and their total uncertainties. Overlaid are the predictions together with their uncertainties. The lower plots show the ratio of each prediction to the unfolded data. |

png pdf |
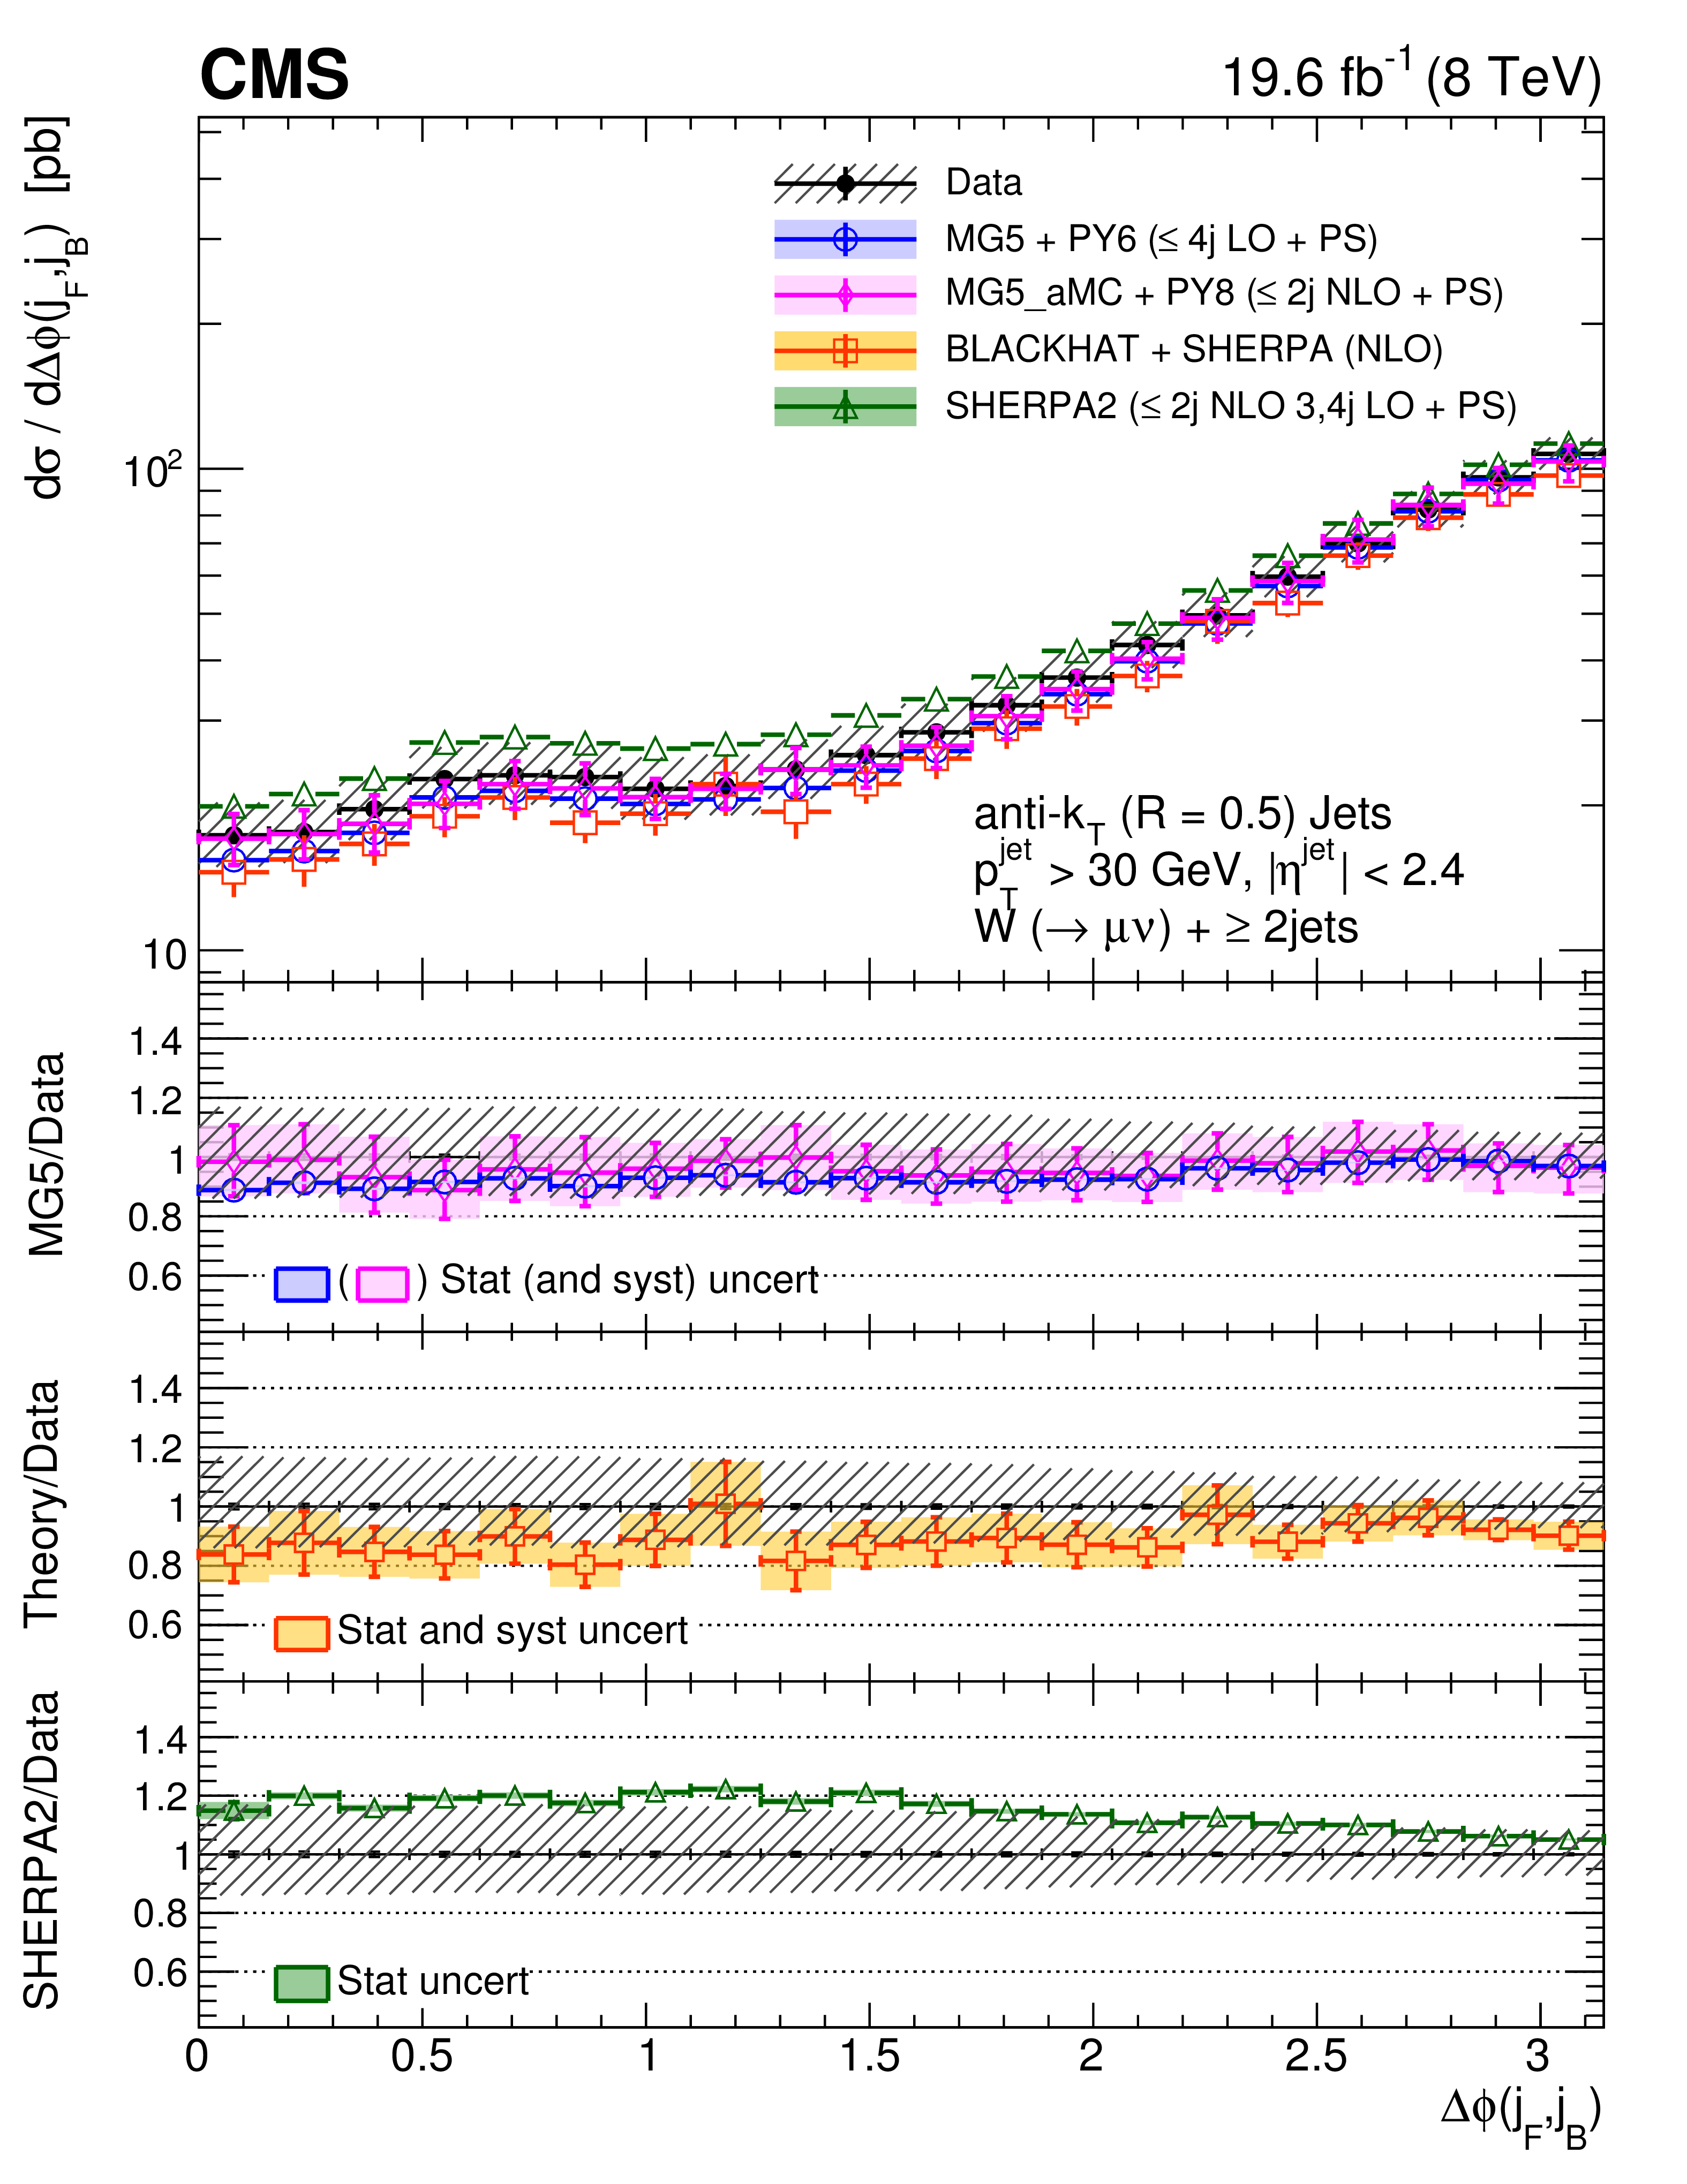
Figure 12:
Cross sections differential in $\Delta \phi (j_1,j_2)$ (left) and $\Delta \phi (j_F,j_B)$ (right) for an inclusive jet multiplicity of 2, compared to the predictions of MadGraph, MadGraph-5-aMC@NLO, SHERPA-2, and BLACKHAT+SHERPA (corrected for hadronization and multiple-parton interactions). Black circular markers with the gray hatched band represent the unfolded data measurements and their total uncertainties. Overlaid are the predictions together with their uncertainties. The lower plots show the ratio of each prediction to the unfolded data. |

png pdf |
Figure 12-a:
Cross section differential in $\Delta \phi (j_1,j_2)$ for an inclusive jet multiplicity of 2, compared to the predictions of MadGraph, MadGraph-5-aMC@NLO, SHERPA-2, and BLACKHAT+SHERPA (corrected for hadronization and multiple-parton interactions). Black circular markers with the gray hatched band represent the unfolded data measurements and their total uncertainties. Overlaid are the predictions together with their uncertainties. The lower plots show the ratio of each prediction to the unfolded data. |
png pdf |
Figure 12-b:
Cross section differential in $\Delta \phi (j_F,j_B)$ for an inclusive jet multiplicity of 2, compared to the predictions of MadGraph, MadGraph-5-aMC@NLO, SHERPA-2, and BLACKHAT+SHERPA (corrected for hadronization and multiple-parton interactions). Black circular markers with the gray hatched band represent the unfolded data measurements and their total uncertainties. Overlaid are the predictions together with their uncertainties. The lower plots show the ratio of each prediction to the unfolded data. |
png pdf |
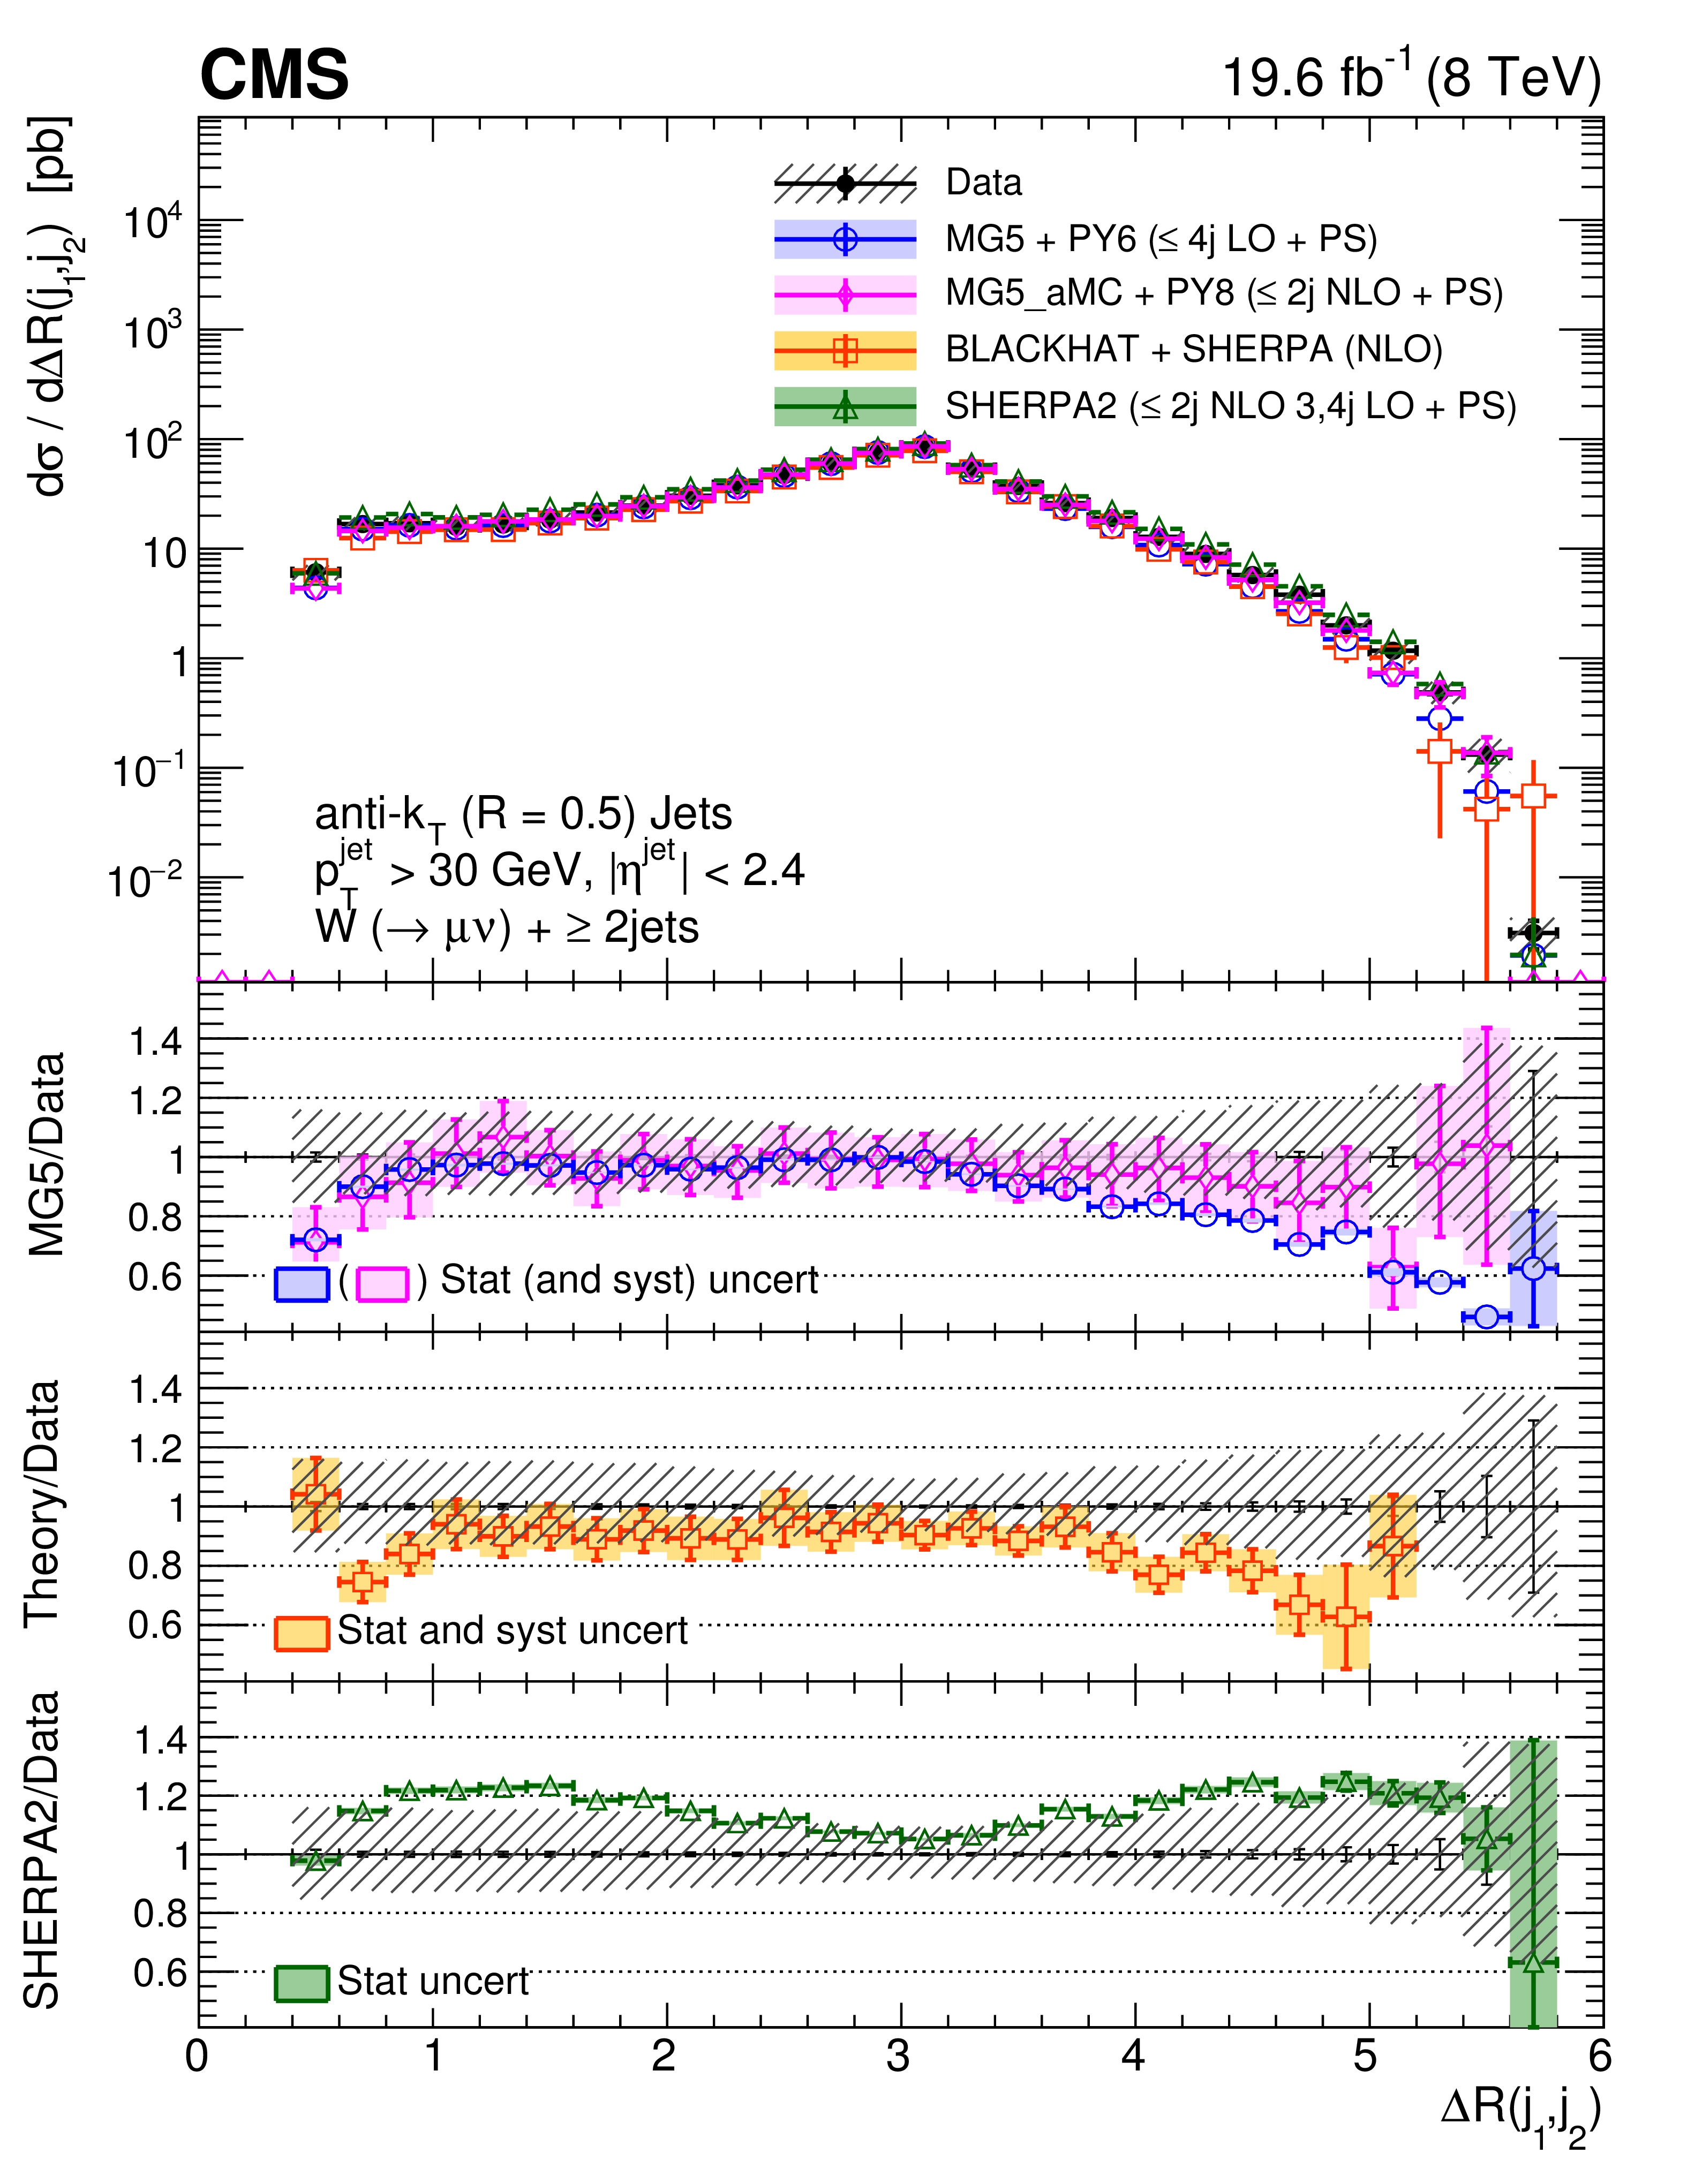
Figure 13:
Cross section differential in $\Delta R(j_{1},j_{2})$ for an inclusive jet multiplicity of 2, compared to the predictions of MadGraph, MadGraph-5-aMC@NLO, SHERPA-2, and BLACKHAT+SHERPA (corrected for hadronization and multiple-parton interactions). Black circular markers with the gray hatched band represent the unfolded data measurements and their total uncertainties. Overlaid are the predictions together with their uncertainties. The lower plots show the ratio of each prediction to the unfolded data. |
png pdf |
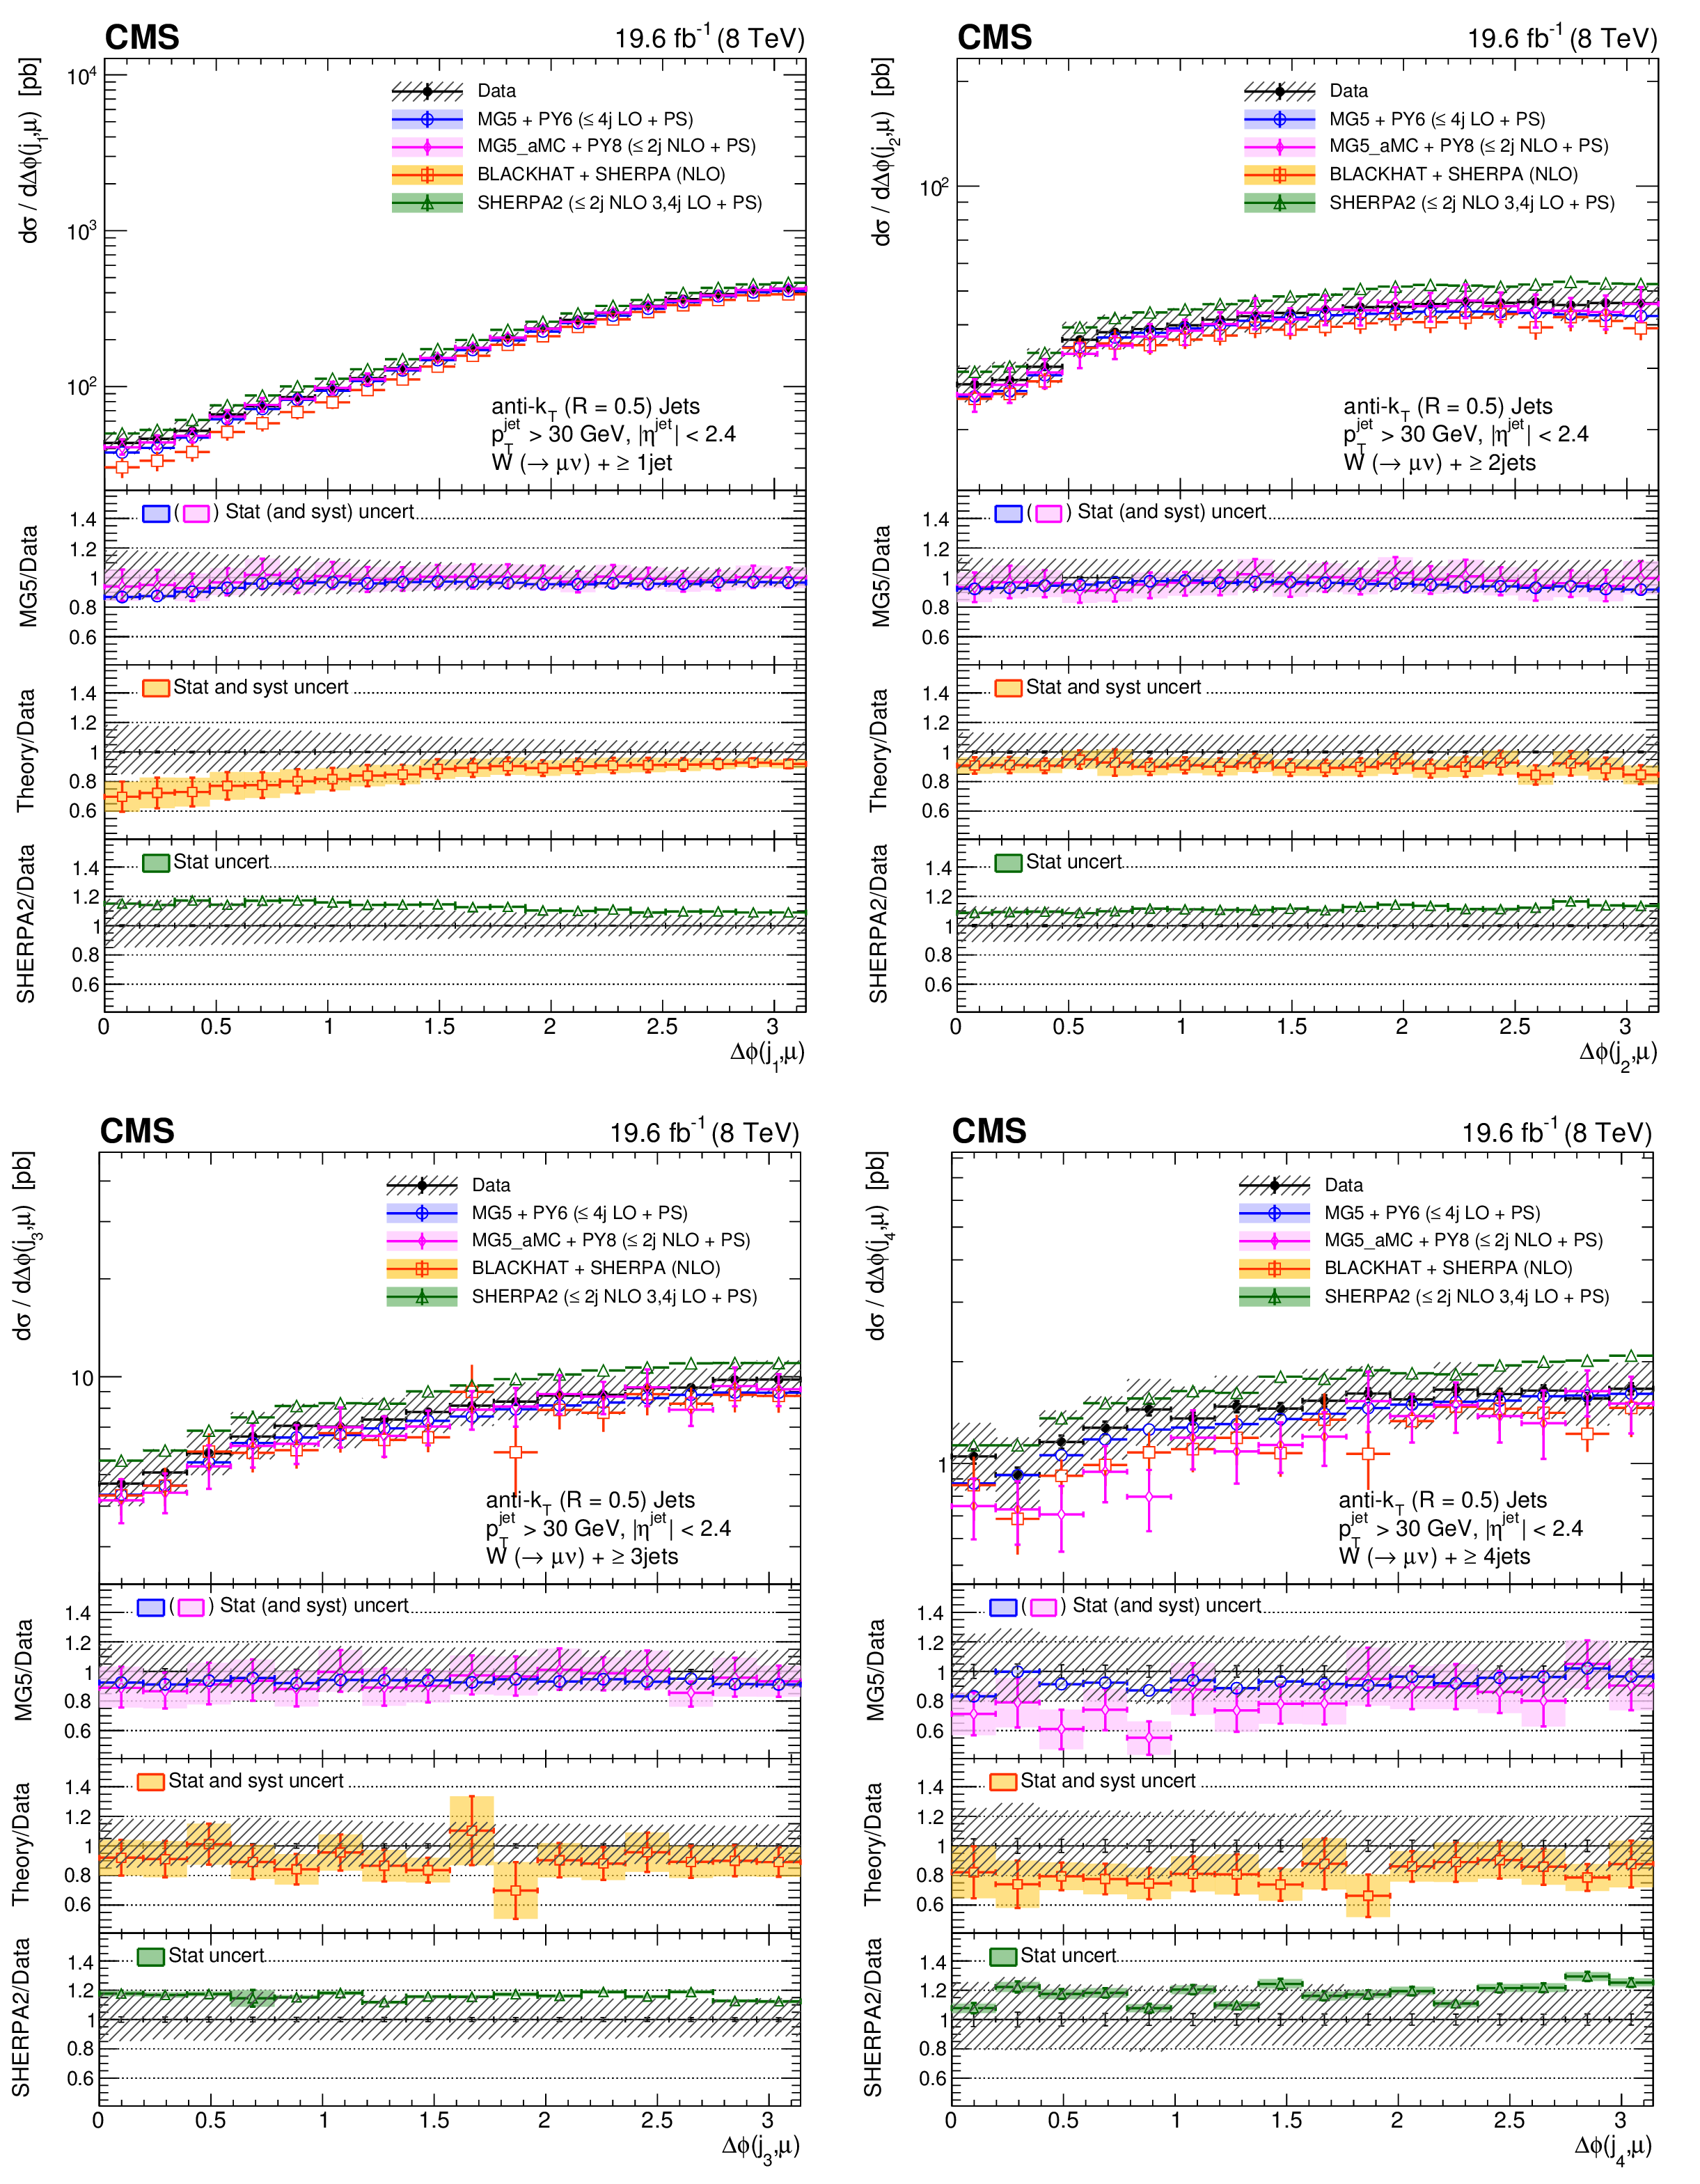
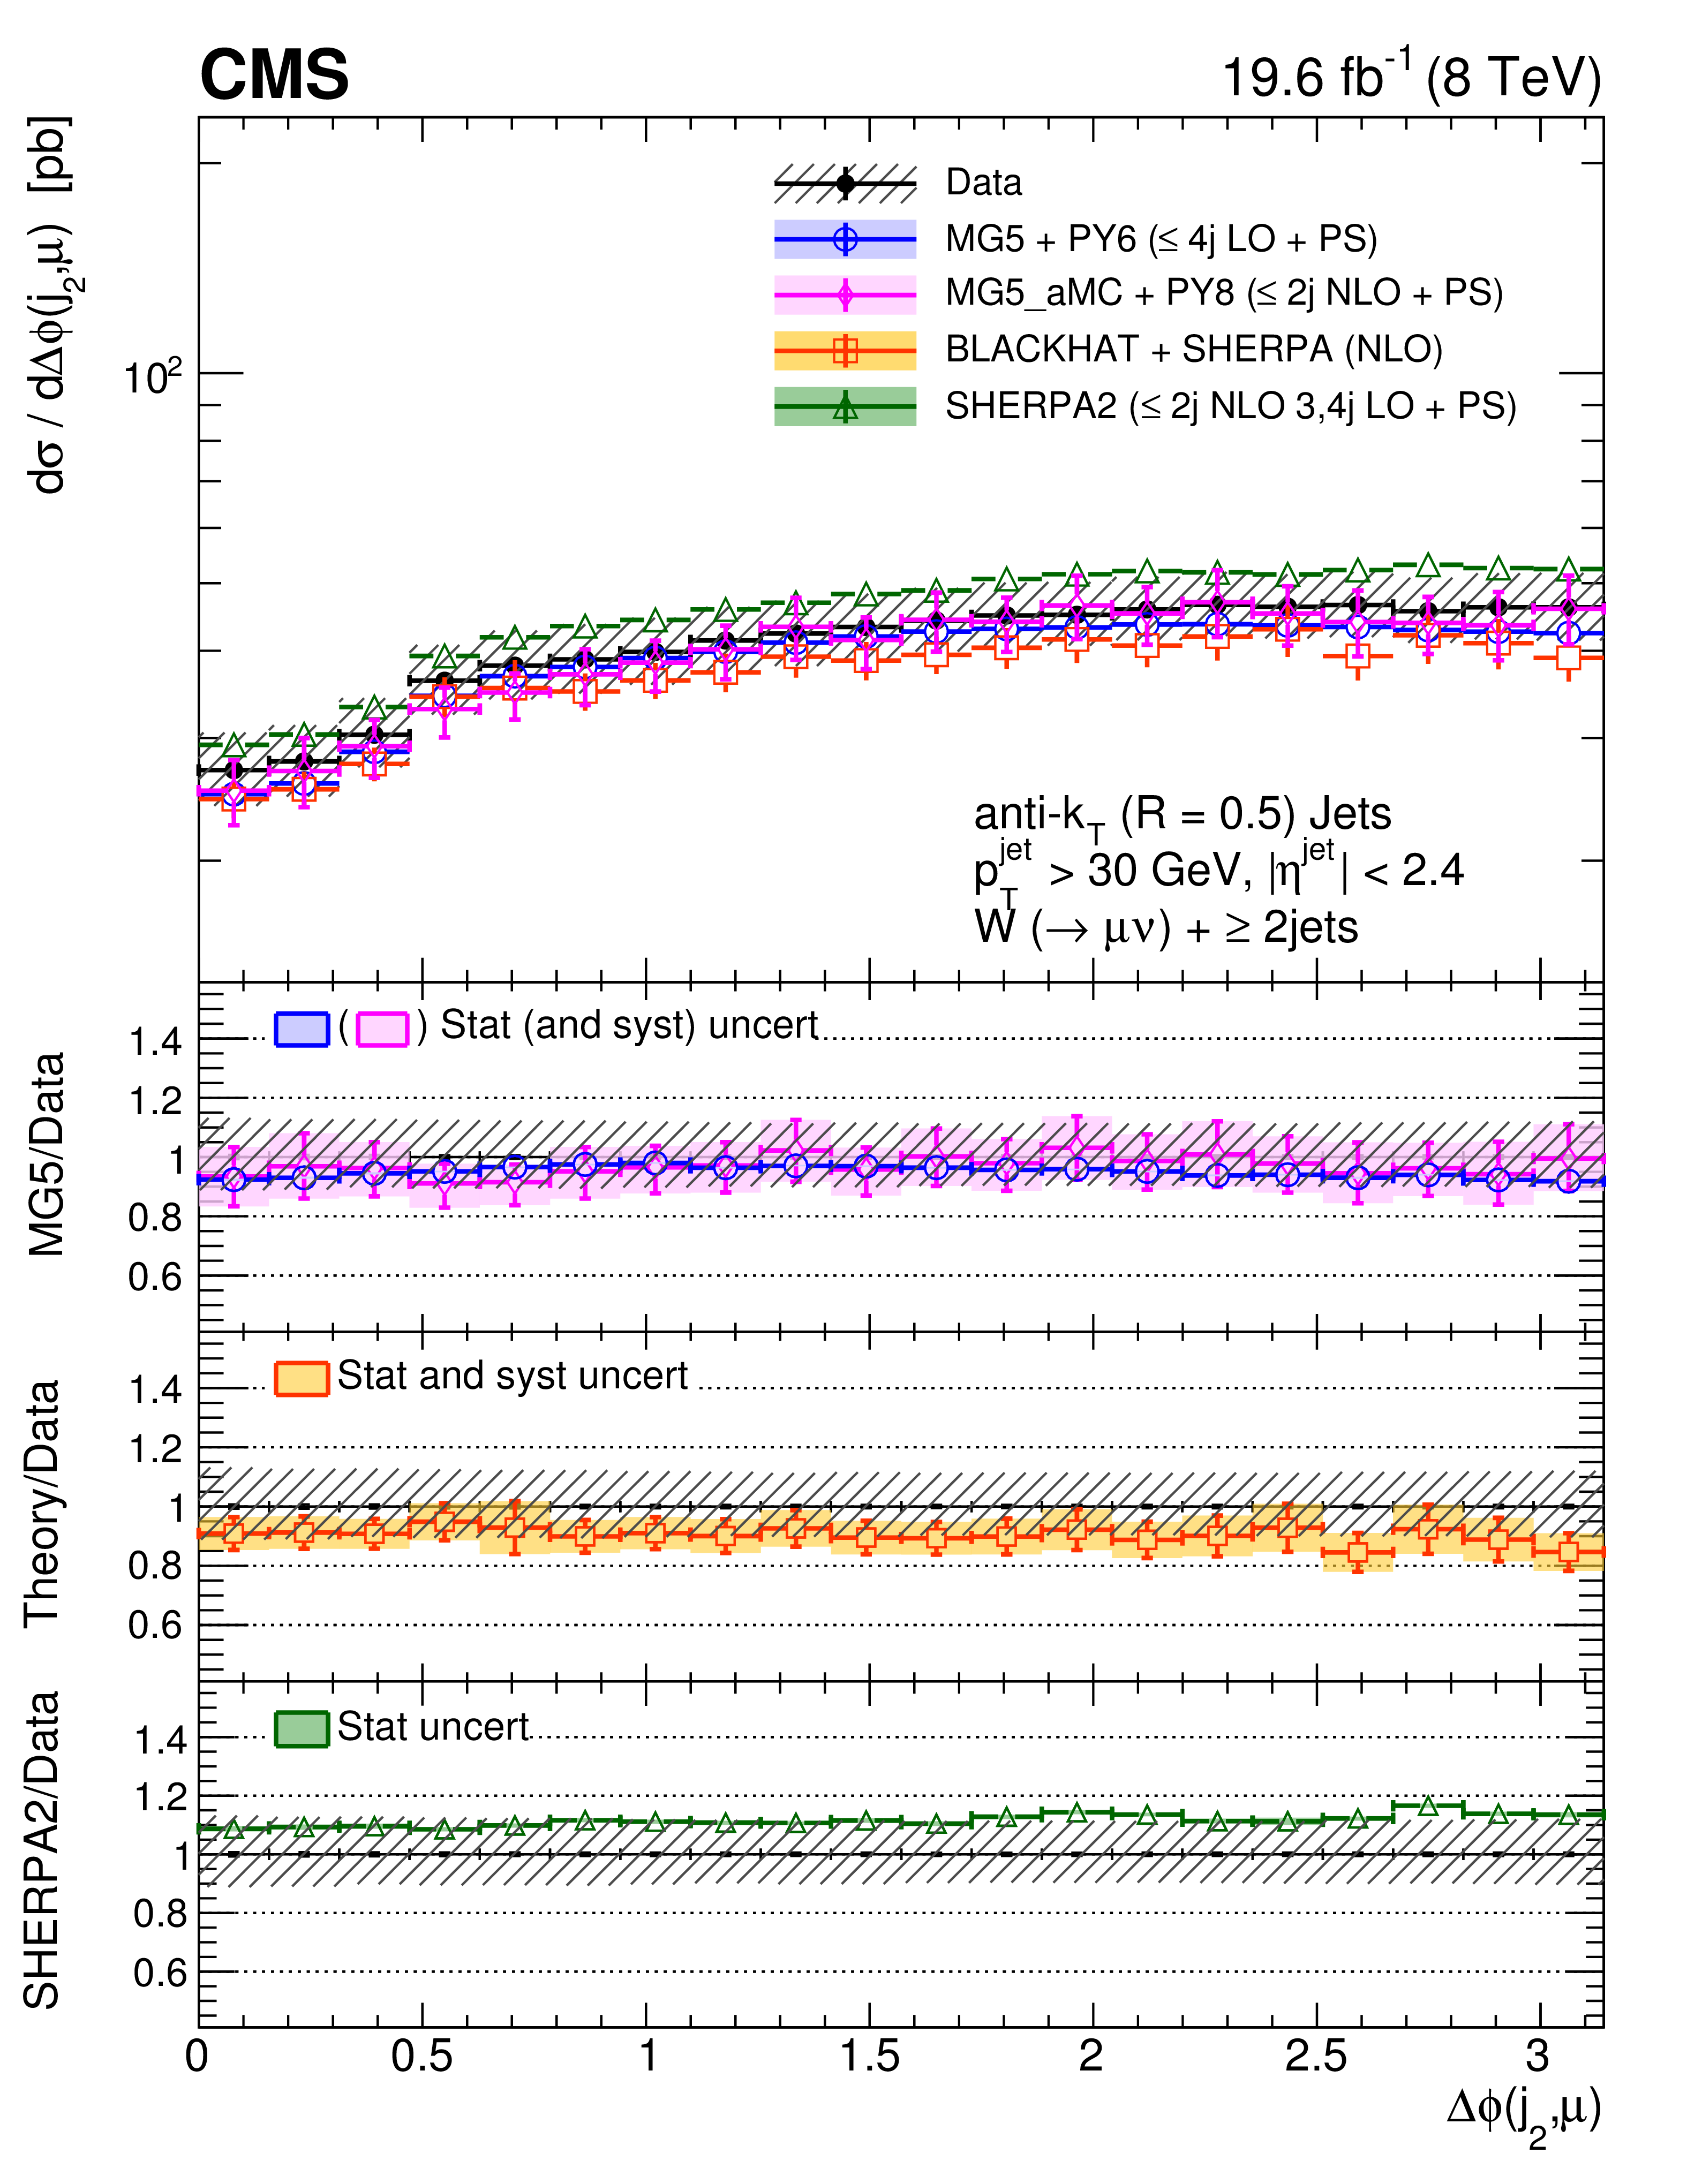
Figure 14:
Cross sections differential in $\Delta \phi (j_{n},\mu )$ for inclusive jet multiplicities $n = $ 1-4, compared to the predictions of MadGraph, MadGraph-5-aMC@NLO, SHERPA-2, and BLACKHAT+SHERPA (corrected for hadronization and multiple-parton interactions). Black circular markers with the gray hatched band represent the unfolded data measurements and their total uncertainties. Overlaid are the predictions together with their uncertainties. The lower plots show the ratio of each prediction to the unfolded data. |

png pdf |
Figure 14-a:
Cross section differential in $\Delta \phi (j_{n},\mu )$ for inclusive jet multiplicity $n = $ 1, compared to the predictions of MadGraph, MadGraph-5-aMC@NLO, SHERPA-2, and BLACKHAT+SHERPA (corrected for hadronization and multiple-parton interactions). Black circular markers with the gray hatched band represent the unfolded data measurements and their total uncertainties. Overlaid are the predictions together with their uncertainties. The lower plots show the ratio of each prediction to the unfolded data. |
png pdf |
Figure 14-b:
Cross section differential in $\Delta \phi (j_{n},\mu )$ for inclusive jet multiplicity $n = $ 2, compared to the predictions of MadGraph, MadGraph-5-aMC@NLO, SHERPA-2, and BLACKHAT+SHERPA (corrected for hadronization and multiple-parton interactions). Black circular markers with the gray hatched band represent the unfolded data measurements and their total uncertainties. Overlaid are the predictions together with their uncertainties. The lower plots show the ratio of each prediction to the unfolded data. |
png pdf |
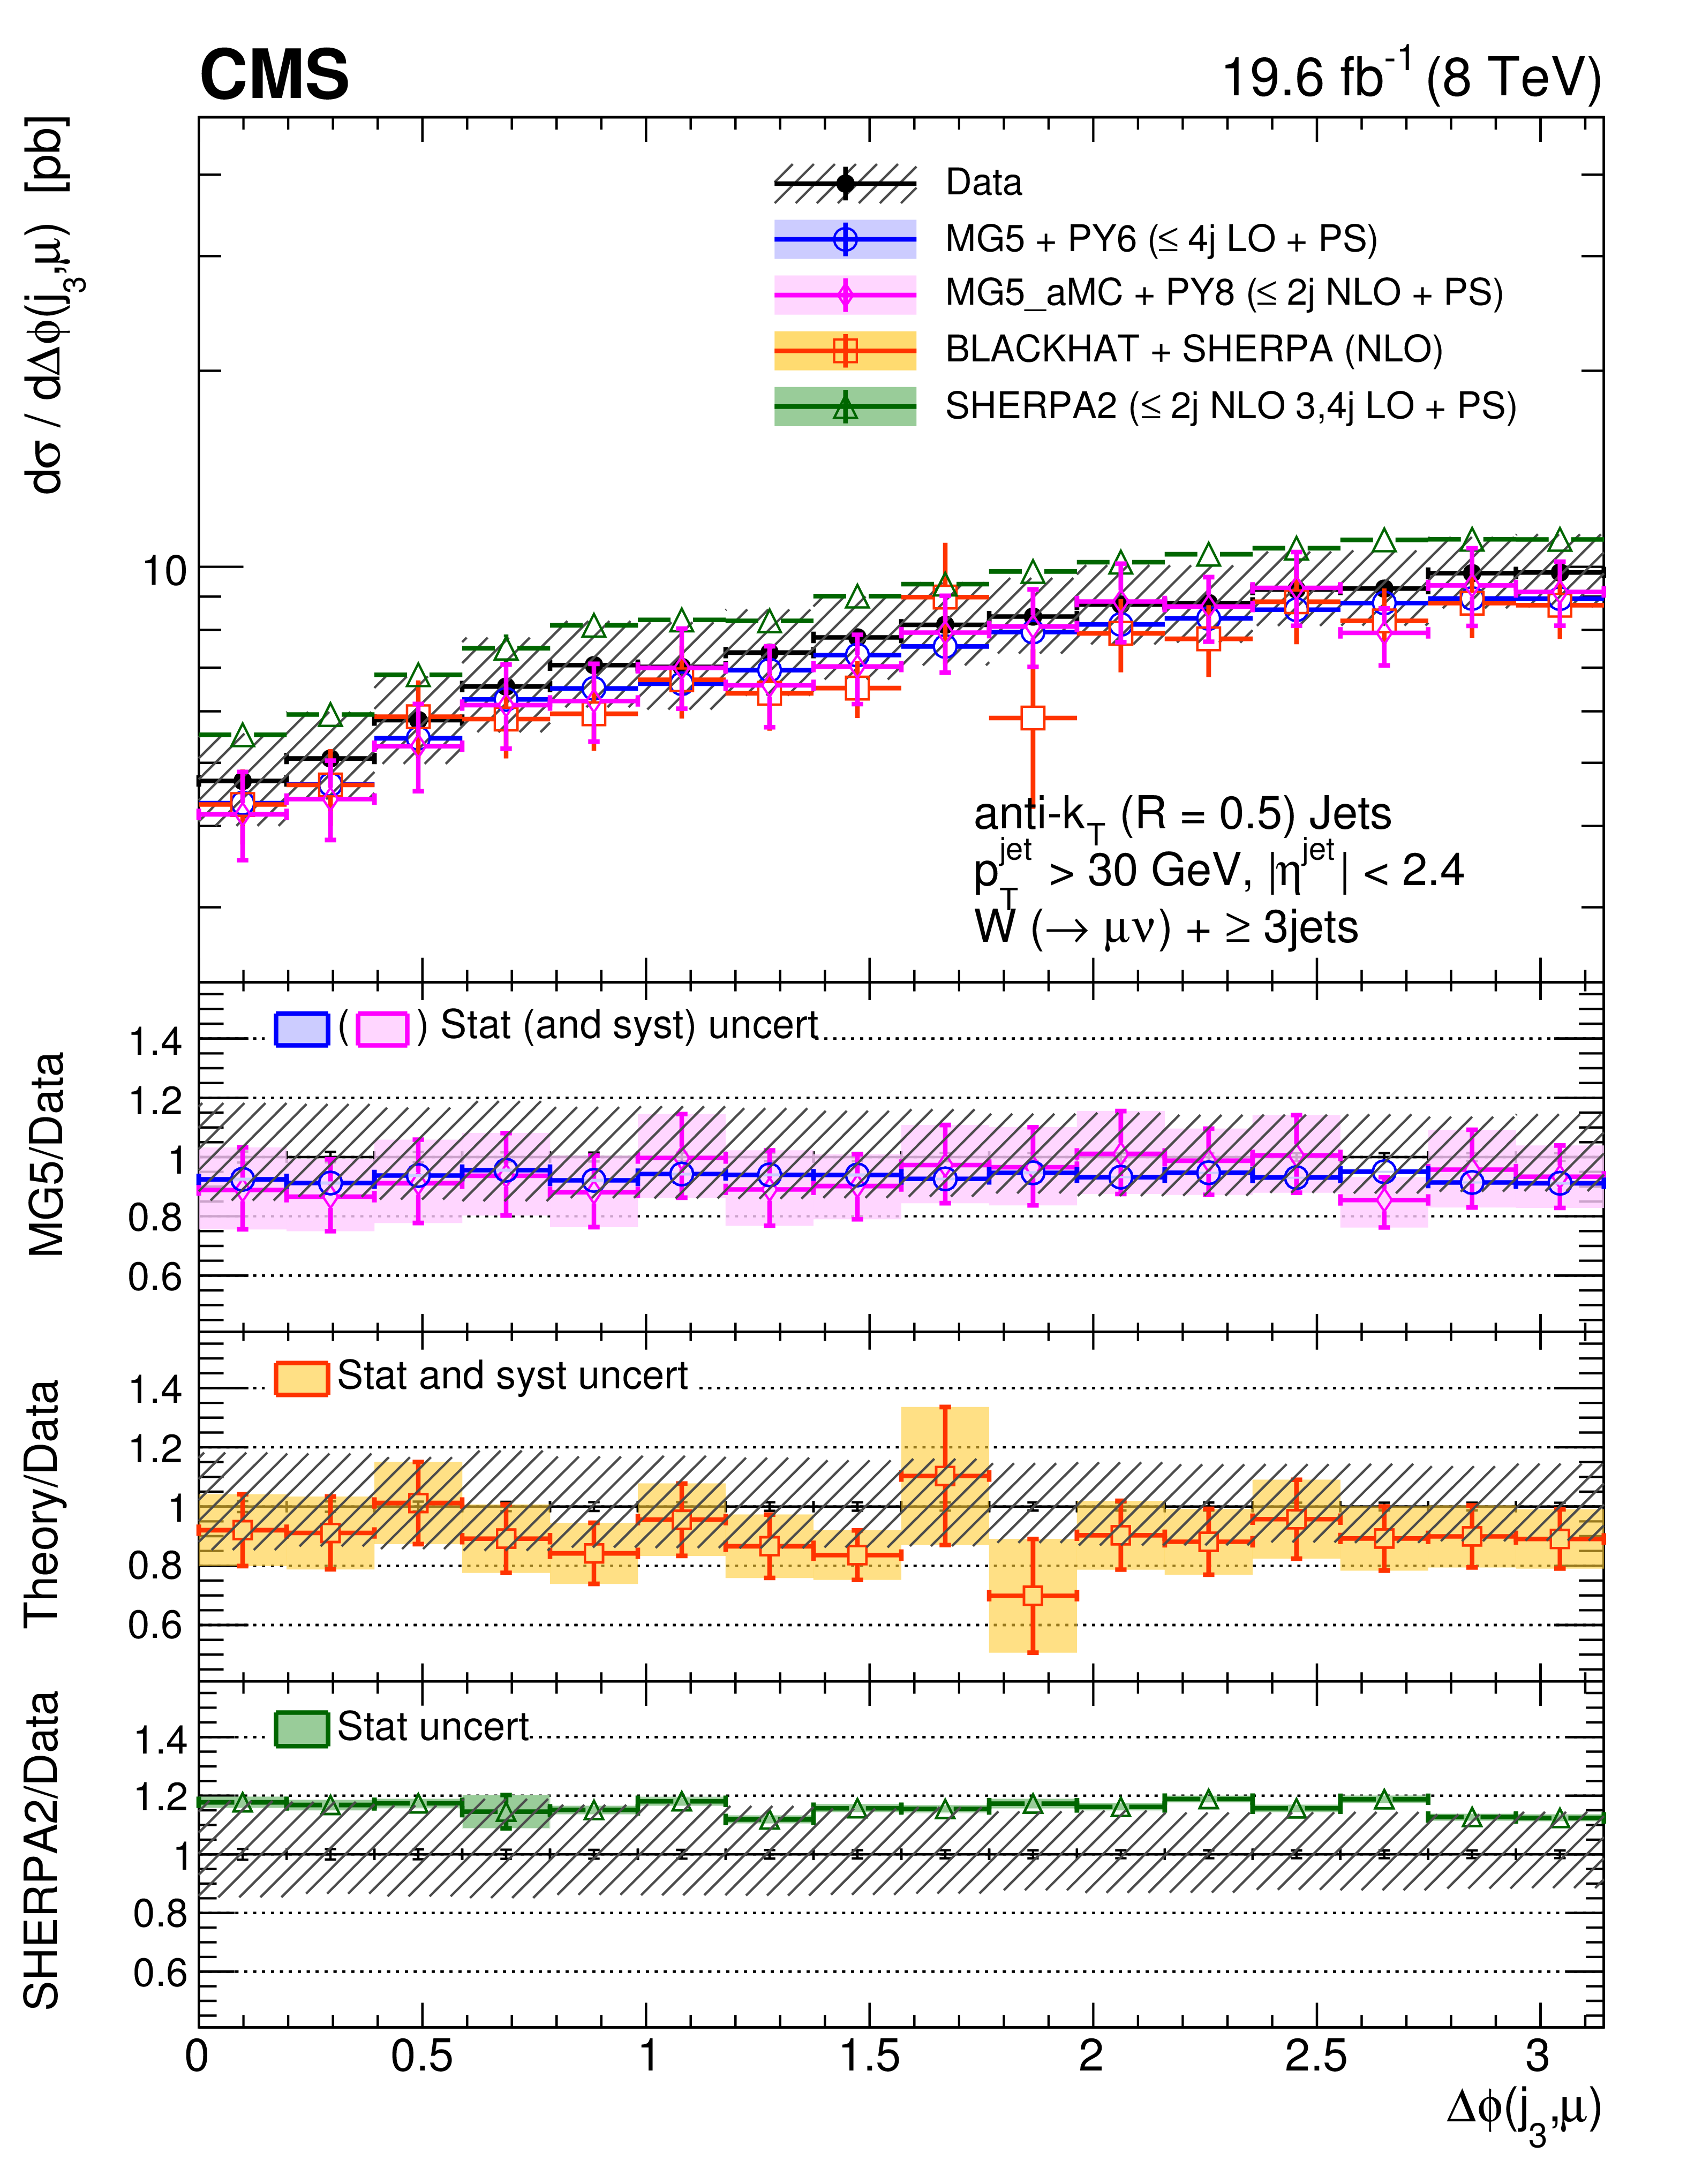
Figure 14-c:
Cross section differential in $\Delta \phi (j_{n},\mu )$ for inclusive jet multiplicity $n = $ 3, compared to the predictions of MadGraph, MadGraph-5-aMC@NLO, SHERPA-2, and BLACKHAT+SHERPA (corrected for hadronization and multiple-parton interactions). Black circular markers with the gray hatched band represent the unfolded data measurements and their total uncertainties. Overlaid are the predictions together with their uncertainties. The lower plots show the ratio of each prediction to the unfolded data. |

png pdf |
Figure 14-d:
Cross section differential in $\Delta \phi (j_{n},\mu )$ for inclusive jet multiplicity $n = $ 4, compared to the predictions of MadGraph, MadGraph-5-aMC@NLO, SHERPA-2, and BLACKHAT+SHERPA (corrected for hadronization and multiple-parton interactions). Black circular markers with the gray hatched band represent the unfolded data measurements and their total uncertainties. Overlaid are the predictions together with their uncertainties. The lower plots show the ratio of each prediction to the unfolded data. |
png pdf |
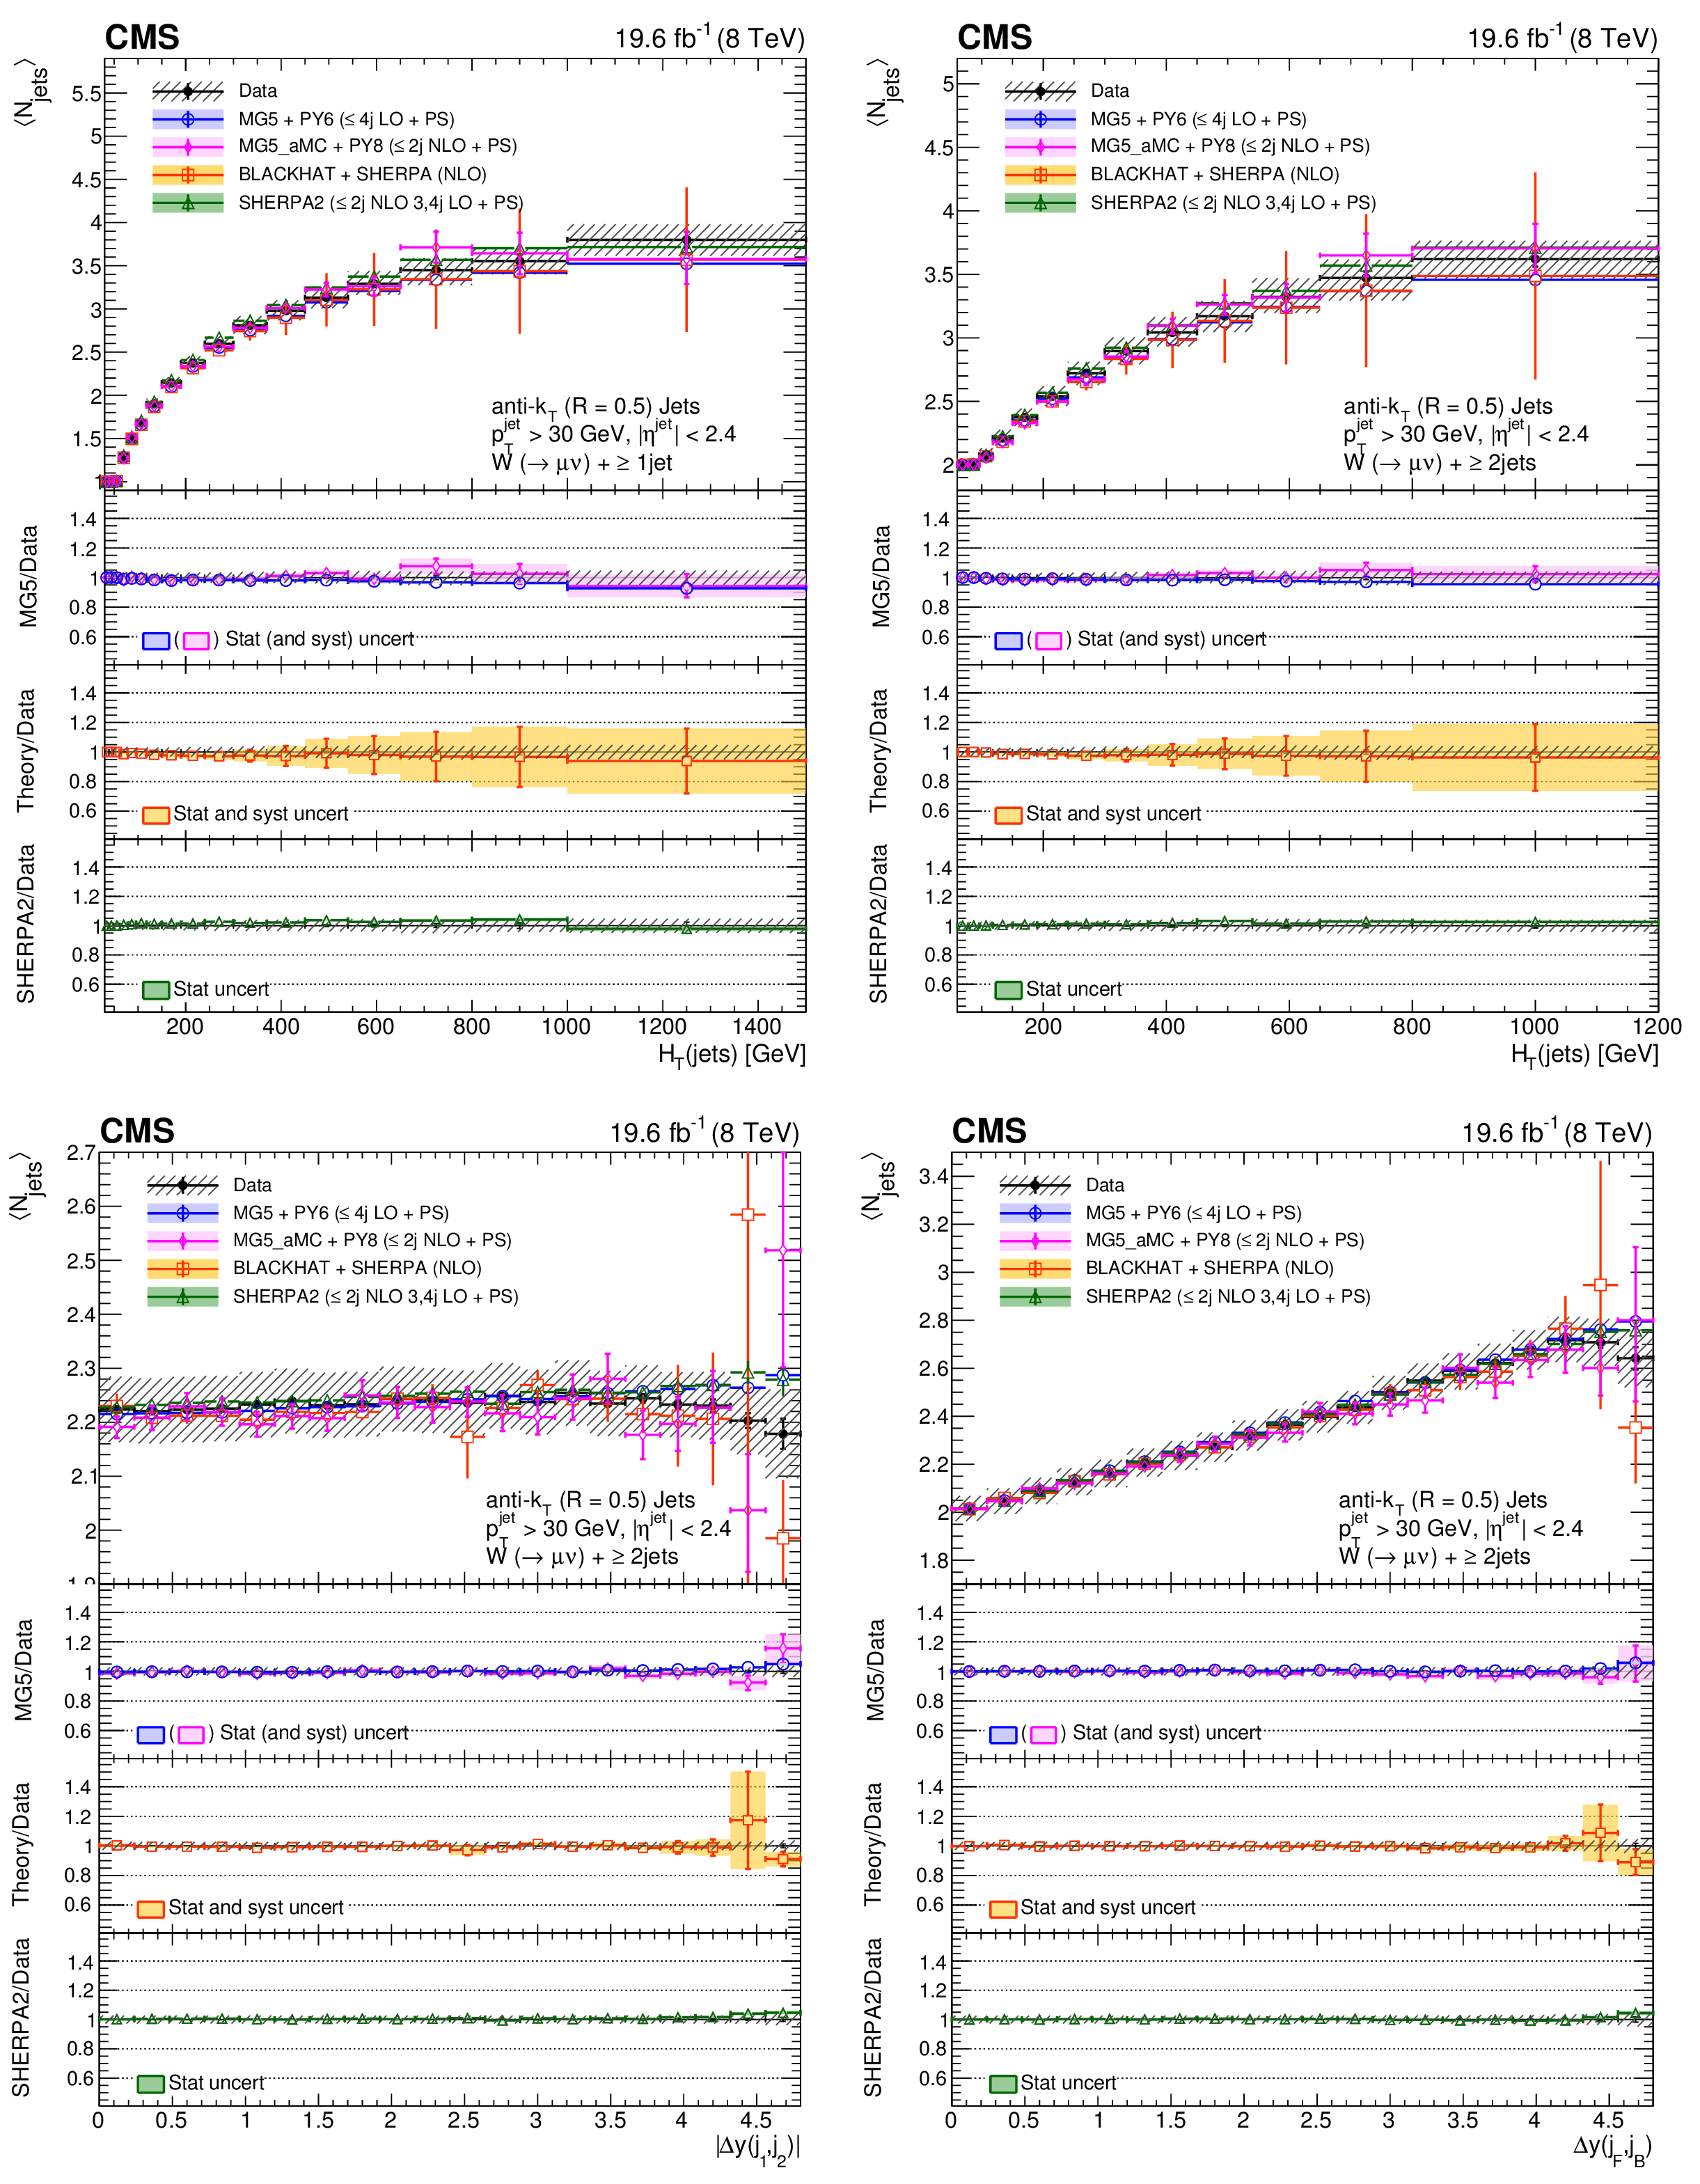
Figure 15:
Average number of jets $< N_\text {jets} > $ as a function of $ {H_{\mathrm {T}}} $ for inclusive jet multiplicities 1-2 (top row) and as a function of $\Delta y(j_1,j_2)$ and $\Delta y(j_F,j_B)$ for an inclusive jet multiplicity of 2 (bottom row), compared to the predictions of MadGraph, SHERPA-2, and BLACKHAT+SHERPA (corrected for hadronization and multiple-parton interactions). Black circular markers with the gray hatched band represent the unfolded data measurements and their total uncertainties. Overlaid are the predictions together with their uncertainties. The lower plots show the ratio of each prediction to the unfolded data. |

png pdf |
Figure 15-a:
Average number of jets $< N_\text {jets} > $ as a function of $ {H_{\mathrm {T}}} $ for inclusive jet multiplicity 1, compared to the predictions of MadGraph, SHERPA-2, and BLACKHAT+SHERPA (corrected for hadronization and multiple-parton interactions). Black circular markers with the gray hatched band represent the unfolded data measurements and their total uncertainties. Overlaid are the predictions together with their uncertainties. The lower plots show the ratio of each prediction to the unfolded data. |
png pdf |
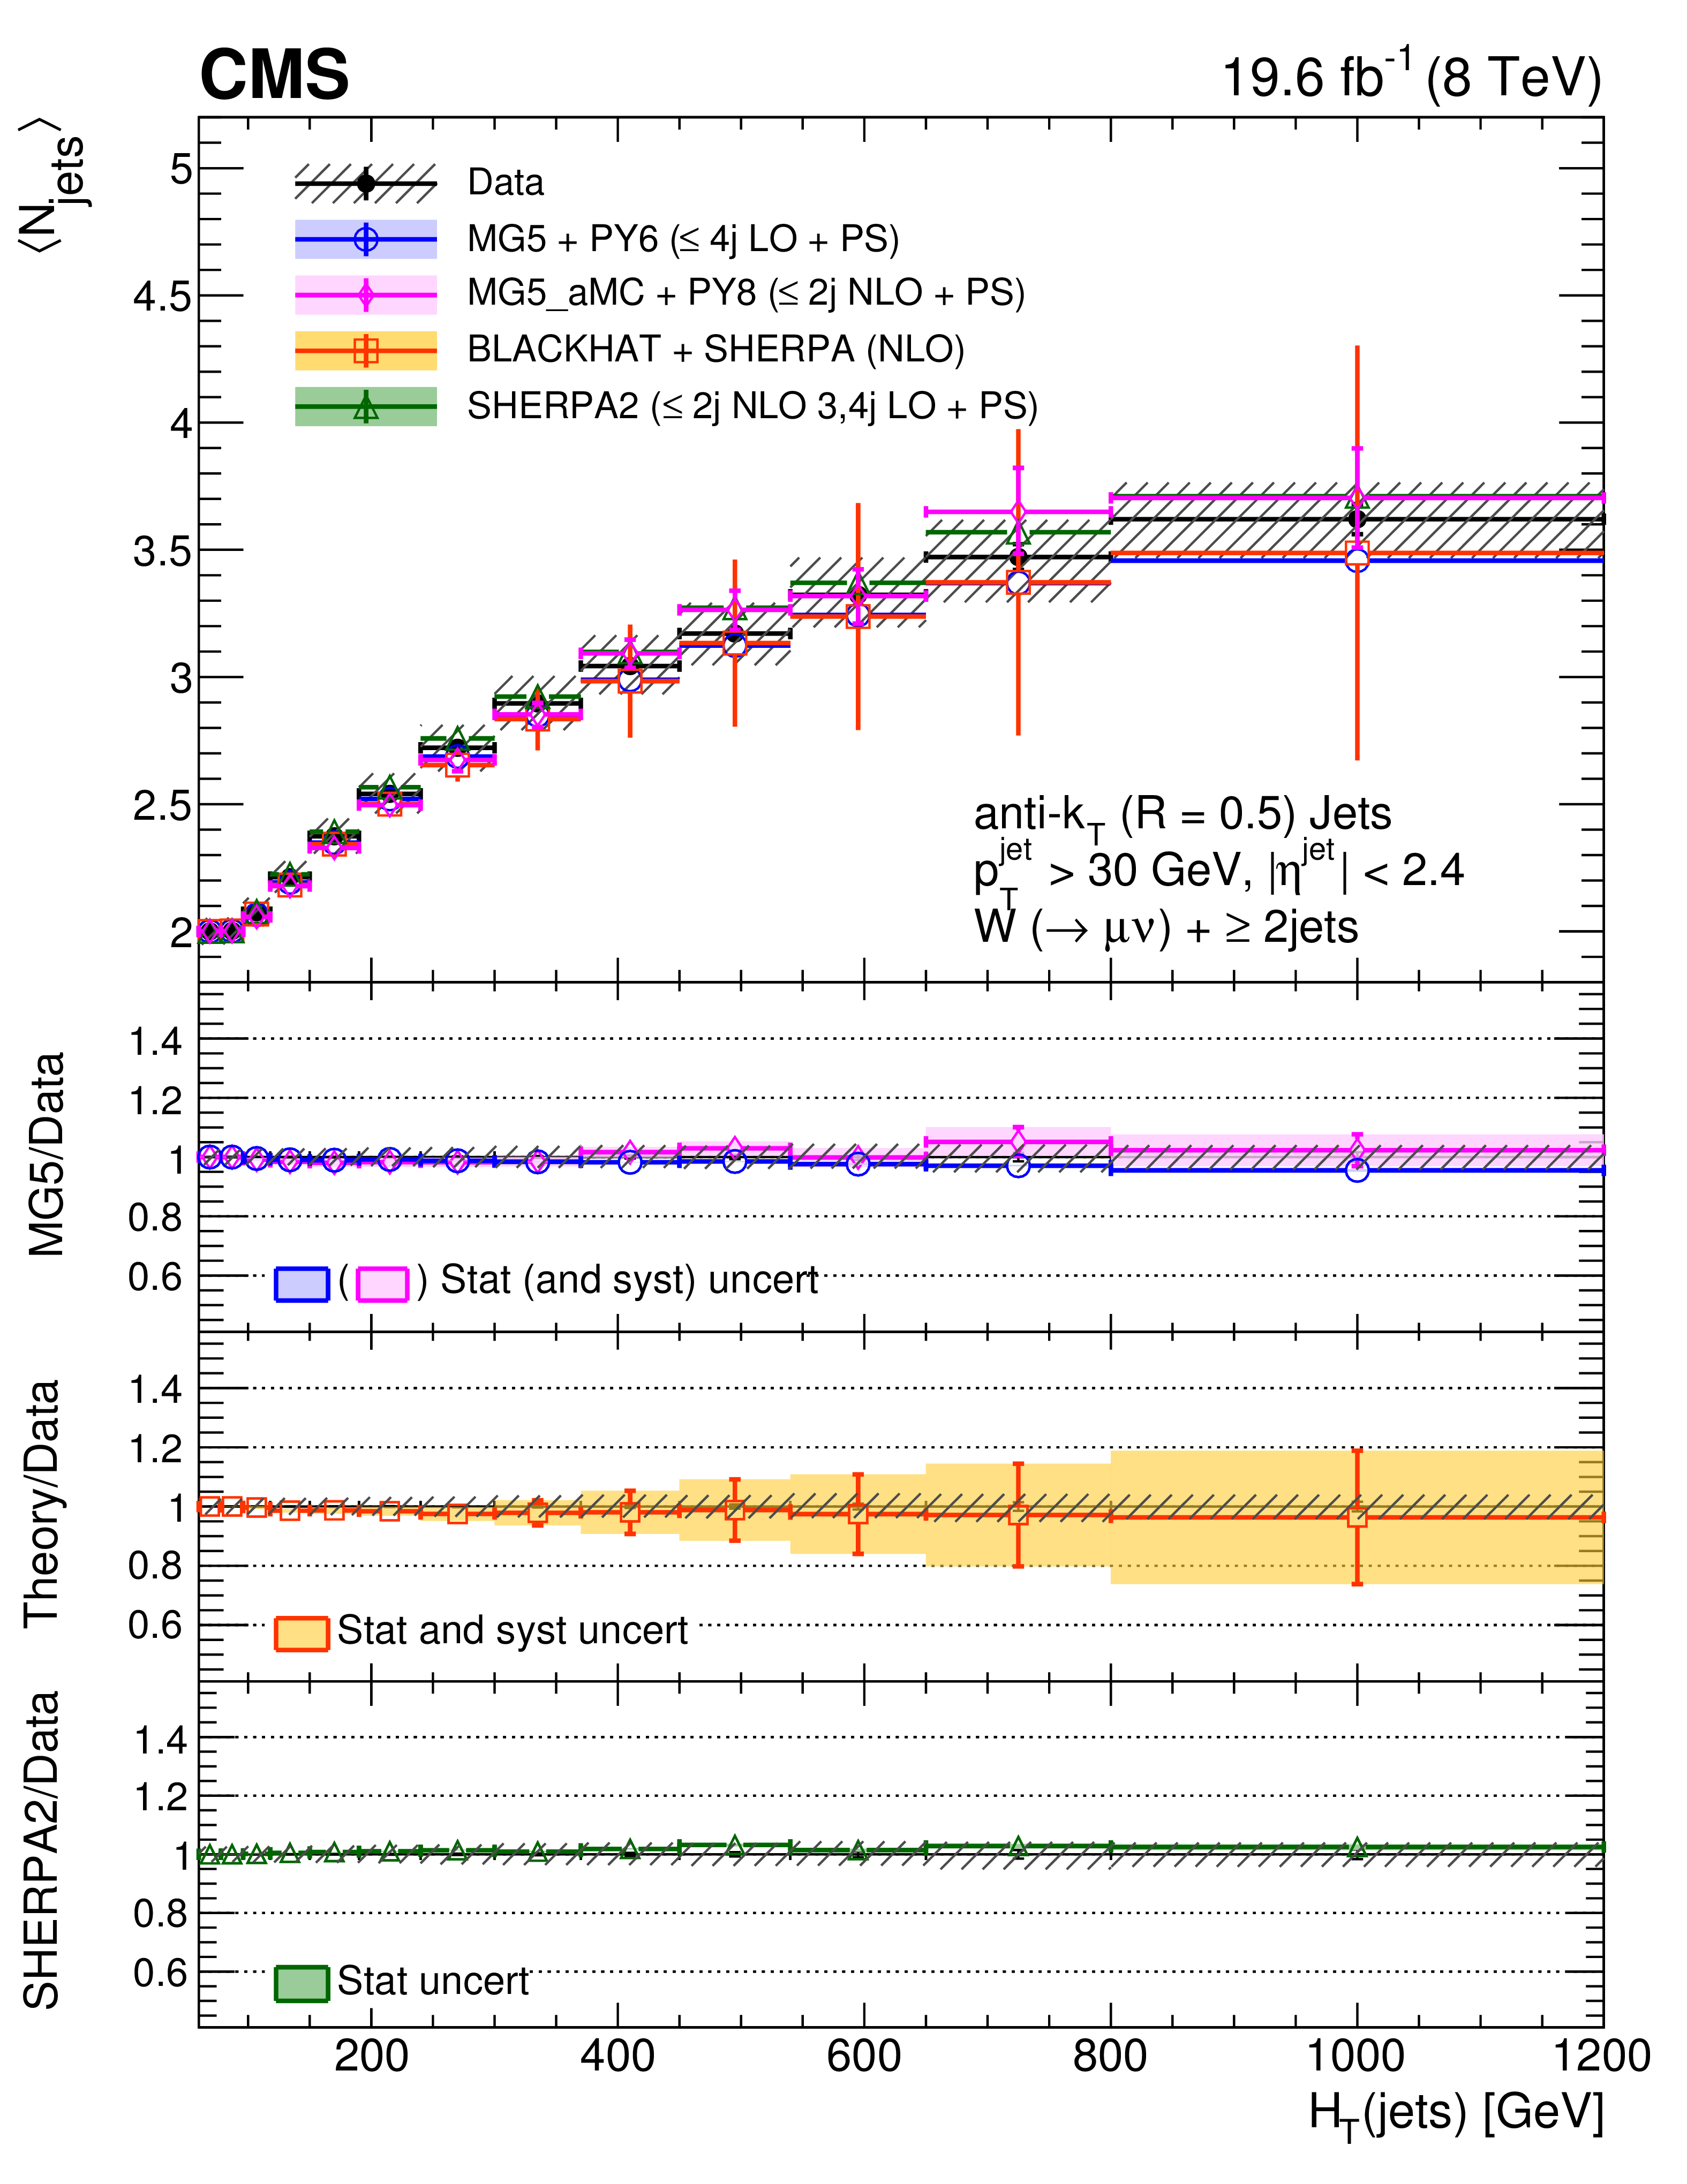
Figure 15-b:
Average number of jets $< N_\text {jets} > $ as a function of $ {H_{\mathrm {T}}} $ for inclusive jet multiplicity 2, compared to the predictions of MadGraph, SHERPA-2, and BLACKHAT+SHERPA (corrected for hadronization and multiple-parton interactions). Black circular markers with the gray hatched band represent the unfolded data measurements and their total uncertainties. Overlaid are the predictions together with their uncertainties. The lower plots show the ratio of each prediction to the unfolded data. |
png pdf |
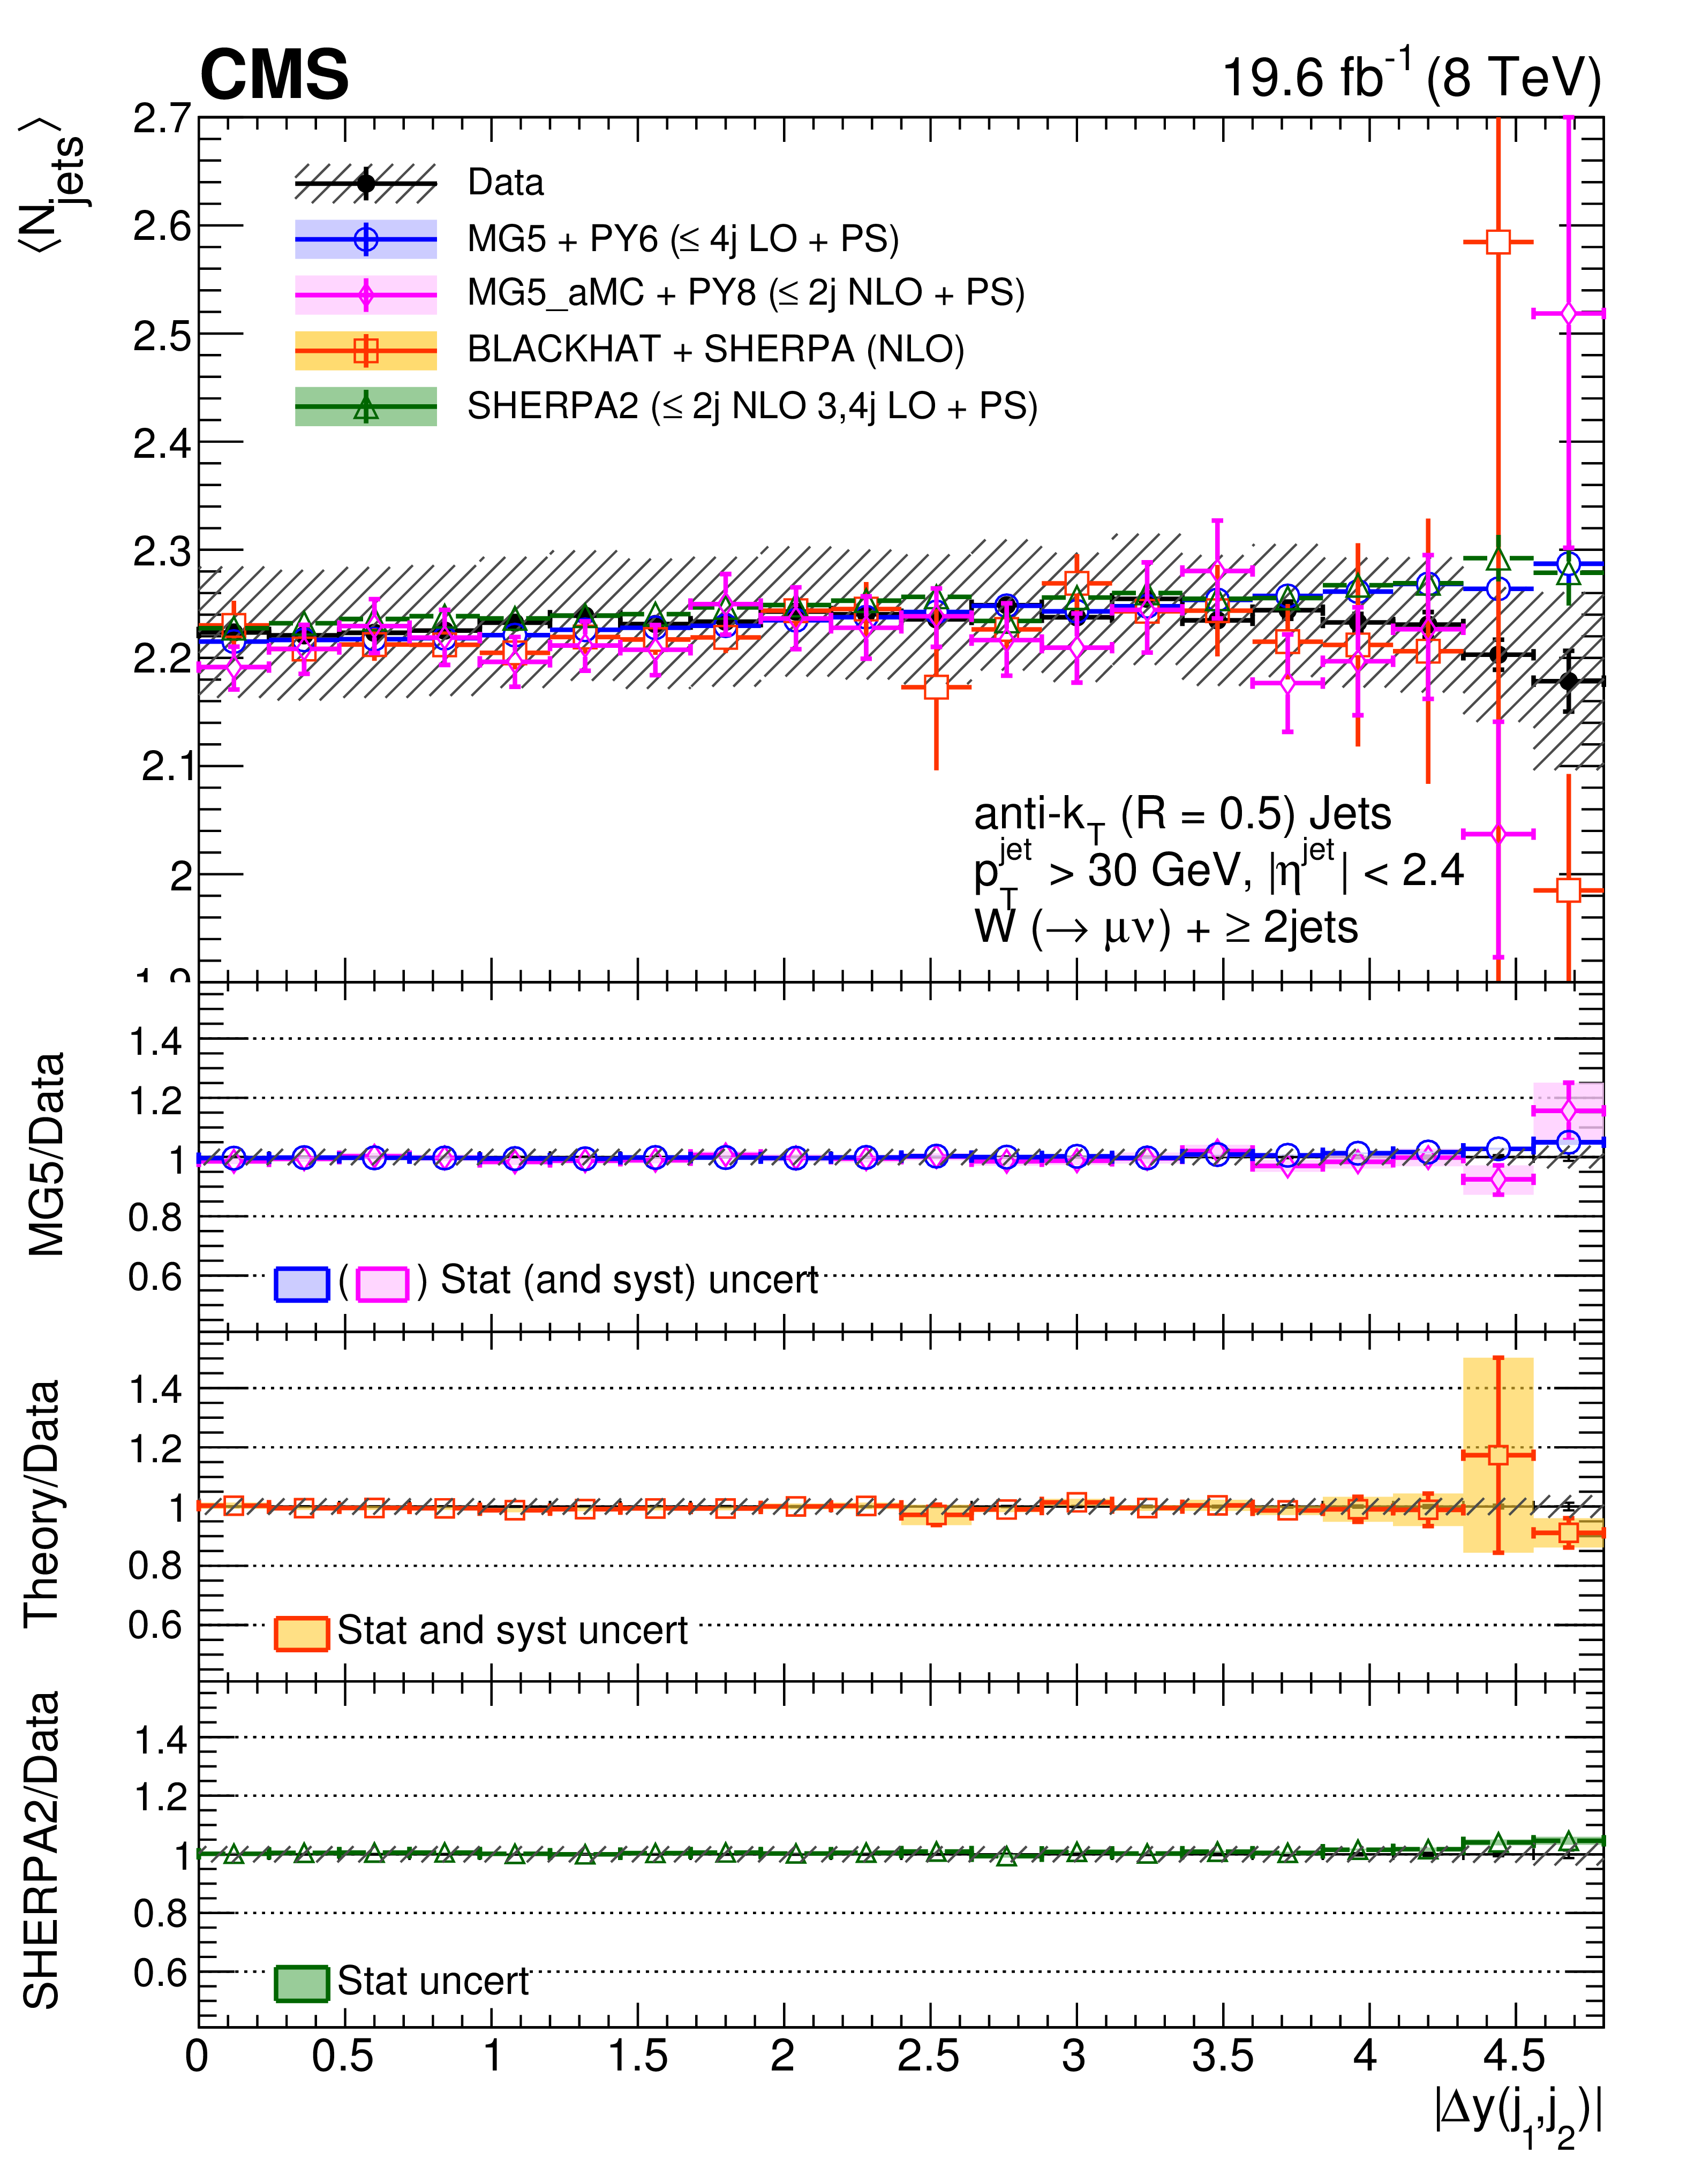
Figure 15-c:
Average number of jets $< N_\text {jets} > $ as a function of $\Delta y(j_1,j_2)$ for an inclusive jet multiplicity of 2, compared to the predictions of MadGraph, SHERPA-2, and BLACKHAT+SHERPA (corrected for hadronization and multiple-parton interactions). Black circular markers with the gray hatched band represent the unfolded data measurements and their total uncertainties. Overlaid are the predictions together with their uncertainties. The lower plots show the ratio of each prediction to the unfolded data. |
png pdf |
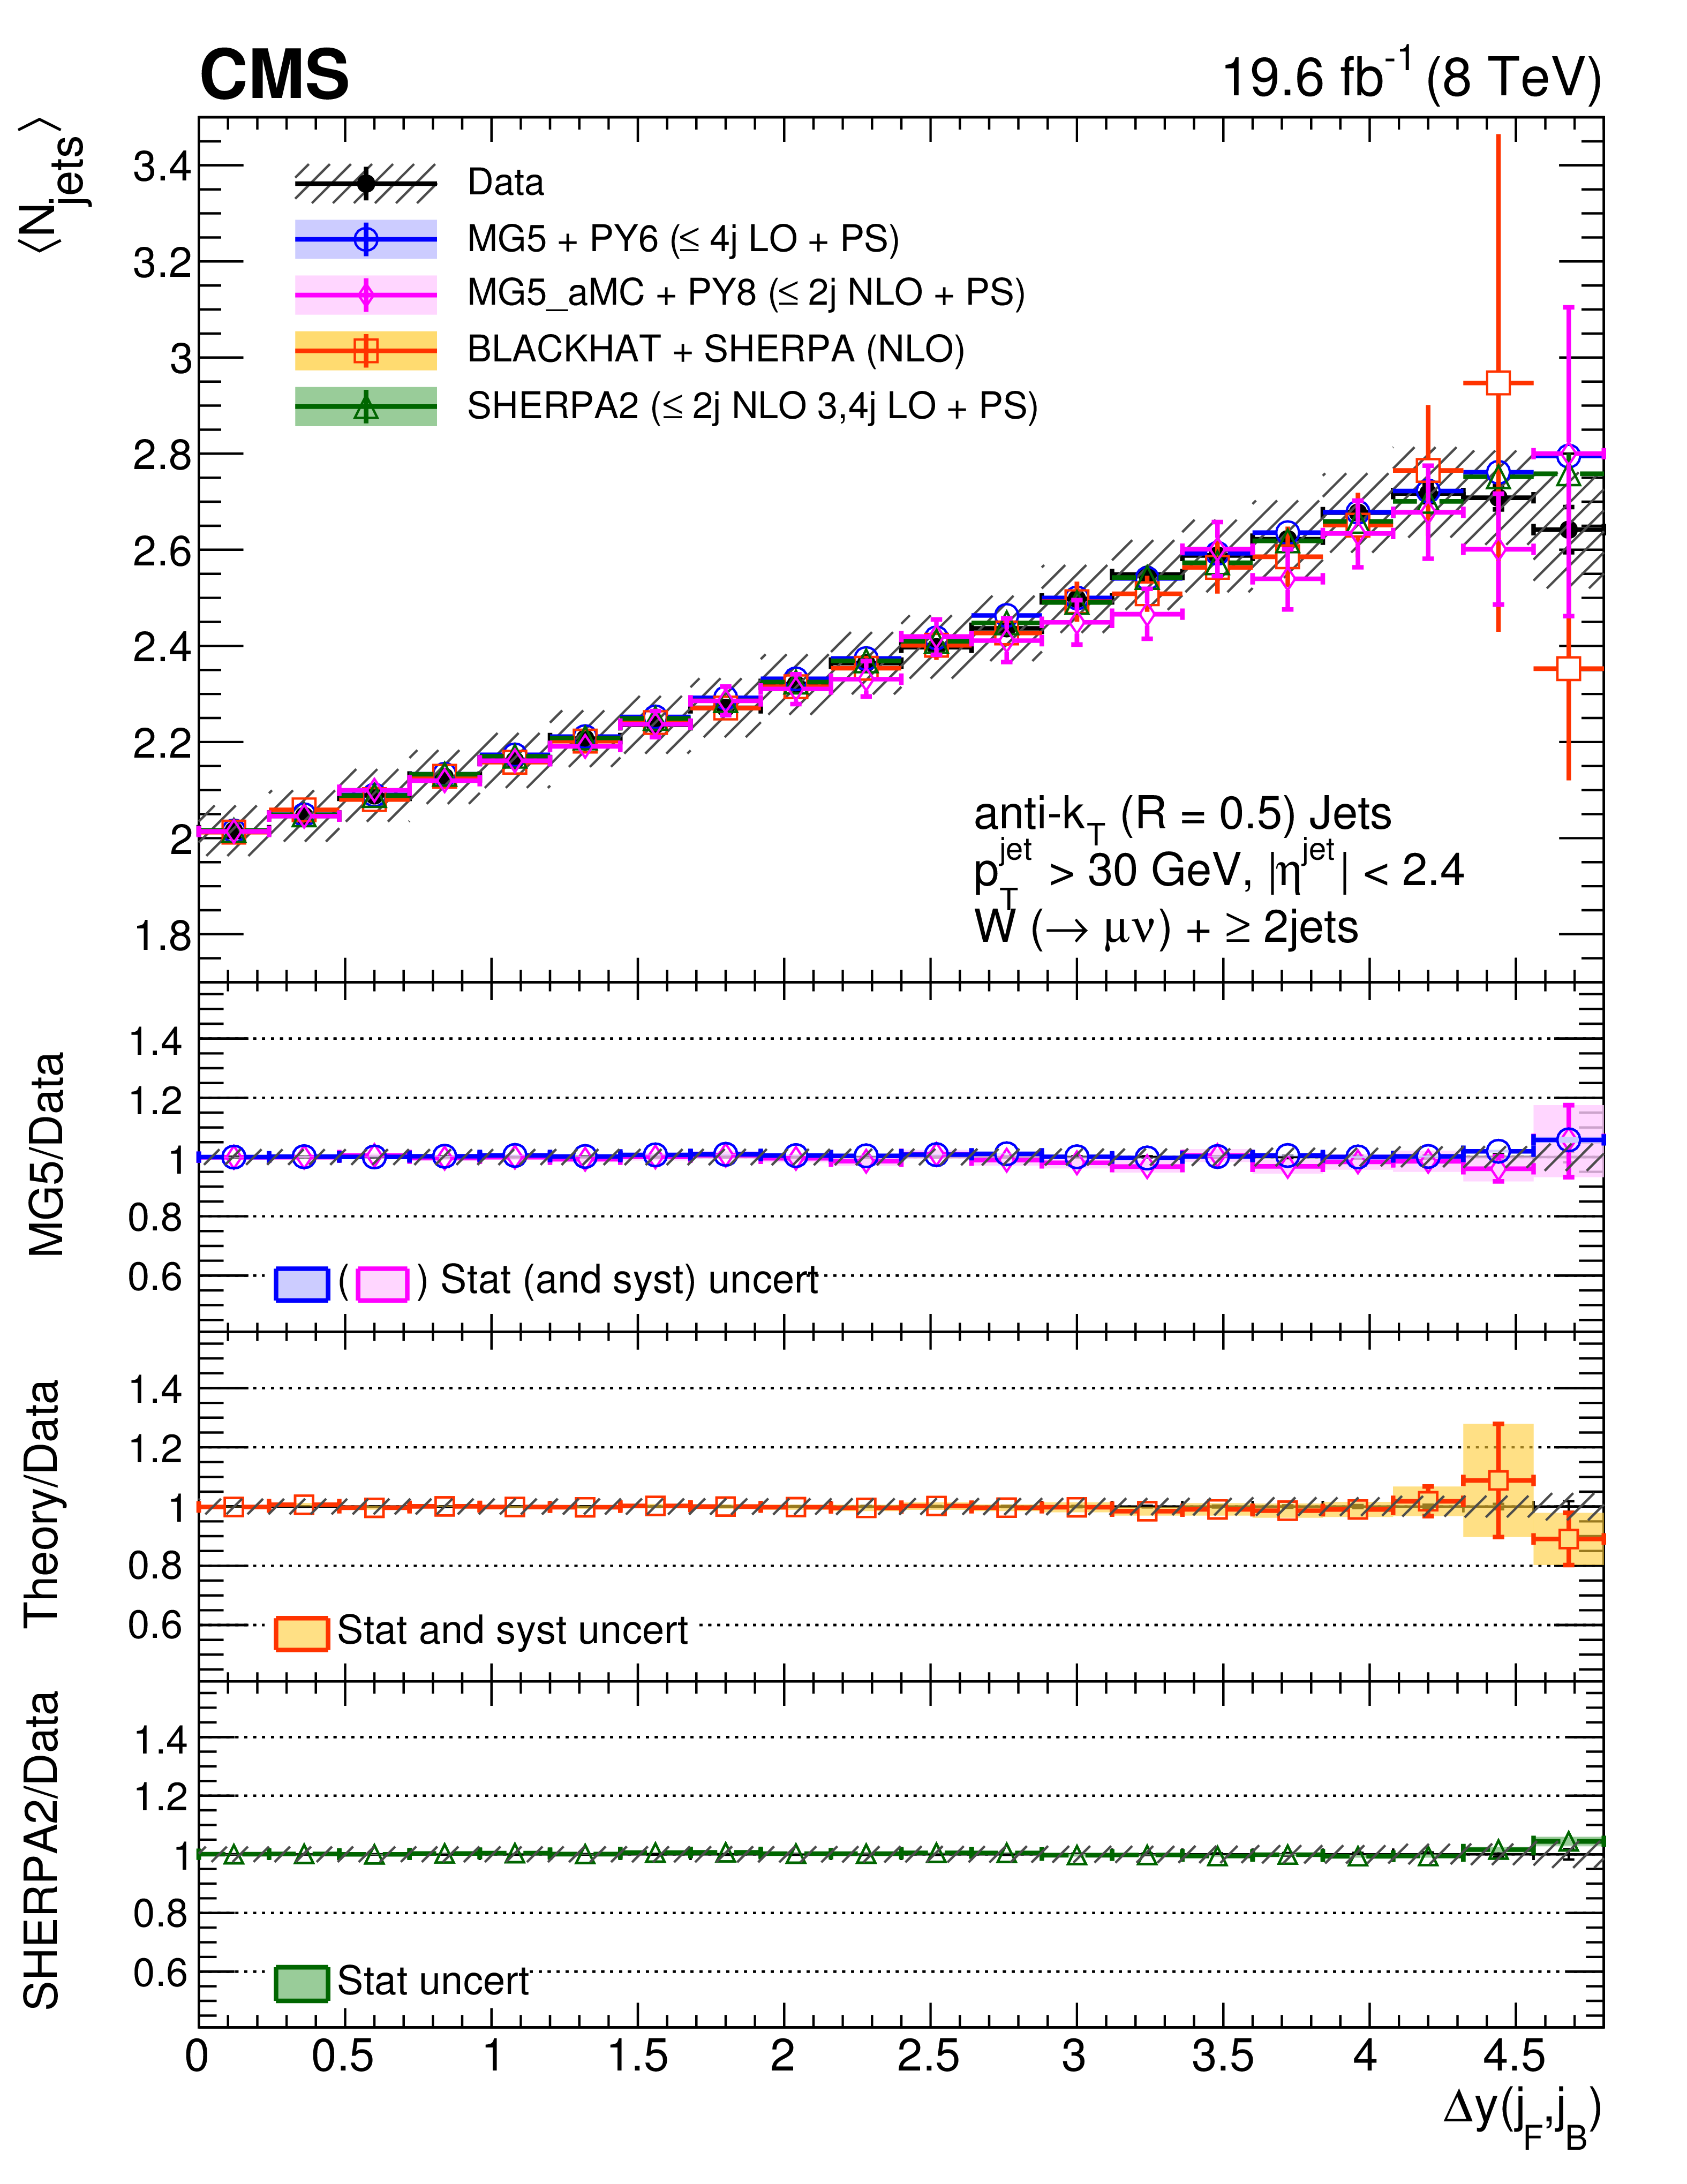
Figure 15-d:
Average number of jets $< N_\text {jets} > $ as a function of $\Delta y(j_F,j_B)$ for an inclusive jet multiplicity of 2, compared to the predictions of MadGraph, SHERPA-2, and BLACKHAT+SHERPA (corrected for hadronization and multiple-parton interactions). Black circular markers with the gray hatched band represent the unfolded data measurements and their total uncertainties. Overlaid are the predictions together with their uncertainties. The lower plots show the ratio of each prediction to the unfolded data. |
| Tables | |

png pdf |
Table 1:
Number of events in data and simulation as a function of exclusive reconstructed jet multiplicity. The purity is the number of simulated signal events (W+jets) divided by the total number of simulated signal and background events (Total). The ratio is the total number of simulated signal and background events divided by the number of data events. |
| Summary |
| Differential cross sections for a W boson produced in association with jets in pp collisions at a center-of-mass energy of 8 TeV were measured. The data correspond to an integrated luminosity of 19.6 fb$^{-1}$ and were collected with the CMS detector at the LHC. Cross sections measured using the muonic decay mode of the W boson were presented as functions of the jet multiplicity, the transverse momenta and pseudorapidities of the four leading jets, $H_{\mathrm{T}}$ for jet multiplicities up to four, and the dijet and invariant mass. Cross sections were also presented as functions of several angular correlation variables: rapidity difference, azimuthal angle difference, and $\Delta R $ between $p_{\mathrm{T}}$-ordered and rapidity-ordered jets, and azimuthal angle difference between the muon and the leading jet. The dependence of the average number of jets on $H_{\mathrm{T}}$ and on rapidity differences between jets was examined. The results were corrected for detector effects by means of regularized unfolding and compared with particle-level simulated predictions using MadGraph5+PYTHIA6; SHERPA-2 and MadGraph-MC@NLO+PYTHIA8 (multileg NLO); BLACKHAT+SHERPA (NLO); and $N_\text{jetti}$ NNLO. The predictions generally describe the jet multiplicity within the uncertainties, with increasing deviations observed in SHERPA-2 for jet multiplicities greater than 4. The cross sections differential in the $p_{\mathrm{T}}$ of the three leading jets are overestimated by MadGraph5+PYTHIA6 in a region of intermediate $p_{\mathrm{T}}$, and by SHERPA-2 at low $p_{\mathrm{T}}$. The cross sections as functions of jet $p_{\mathrm{T}}$ predicted by BLACKHAT+SHERPA and by MadGraph-MC@NLO+PYTHIA8 agree with the measurements within uncertainties. The cross section as a function of $H_{\mathrm{T}}$ is underestimated by BLACKHAT+SHERPA for $N_\text{jets} \geq $ 1 because the contribution from W+$ {\geq}3$ jets is missing from an NLO prediction of W+$ {\geq}$ 1 jet. The corresponding predictions from SHERPA-2 overestimate the cross section, particularly at high $H_{\mathrm{T}}$. The predictions for the jet $|{\eta}|$ distribution deviate from the measurements for large values of $|{\eta}|$, as do the predictions for the angular correlation distributions in rapidity for large rapidity differences. Improvement in describing the data at high rapidity difference and at low azimuthal angle difference between muon and jet is observed when considering MadGraph-MC@NLO+PYTHIA8 versus tree-level MadGraph5+PYTHIA6. The distribution of the azimuthal angle between the muon and the leading jet is not well modeled by BLACKHAT+SHERPA for $N_\text{jets} \geq $ 1. The predictions for the correlation distributions in azimuthal angle between jets agree with the measurements, as well as the dependence of the average number of jets on angular correlation variables and on $H_{\mathrm{T}}$. The NNLO predictions for W+1 jet production were compared with the measured cross sections differential in leading jet $p_{\mathrm{T}}$, $H_{\mathrm{T}}$, and leading jet $|{\eta}|$ and agree with data within uncertainties. |
| References | ||||
| 1 | J. Alwall et al. | MadGraph 5: going beyond | JHEP 06 (2011) 128 | 1106.0522 |
| 2 | T. Sjostrand, S. Mrenna, and P. Skands | PYTHIA 6.4 physics and manual | JHEP 05 (2006) 026 | hep-ph/0603175 |
| 3 | J. Alwall et al. | The automated computation of tree-level and next-to-leading order differential cross sections, and their matching to parton shower simulations | JHEP 07 (2014) 079 | 1405.0301 |
| 4 | S. Hoche, F. Krauss, M. Schonherr, and F. Siegert | QCD matrix elements + parton showers: The NLO case | JHEP 04 (2013) 027 | 1207.5030 |
| 5 | Z. Bern et al. | Ntuples for NLO events at hadron colliders | CPC 185 (2014) 1443 | 1310.7439 |
| 6 | R. Boughezal, C. Focke, X. Liu, and F. Petriello | W-boson production in association with a jet at next-to-next-to-leading order in perturbative QCD | PRL 115 (2015) 062002 | 1504.02131 |
| 7 | R. Boughezal, X. Liu, and F. Petriello | W-boson plus jet differential distributions at NNLO in QCD | 1602.06965 | |
| 8 | CDF Collaboration | Measurement of the cross section for W-boson production in association with jets in p$ \overline{\text{p}} $ collisions at $ \sqrt{s} = $ 1.96 TeV | PRD 77 (2008) 011108 | 0711.4044 |
| 9 | D0 Collaboration | Measurements of inclusive W+jets production rates as a function of jet transverse momentum in p$ \overline{\text{p}} $ collisions at $ \sqrt{s} = $ 1.96 TeV | PLB 705 (2011) 200 | 1106.1457 |
| 10 | D0 Collaboration | Studies of W boson plus jets production in $ p\bar{p} $ collisions at $ \sqrt{s} = $ 1.96 TeV | PRD 88 (2013) 092001 | 1302.6508 |
| 11 | ATLAS Collaboration | Measurements of the w production cross sections in association with jets with the atlas detector | EPJC 75 (2015) 82 | 1409.8639 |
| 12 | CMS Collaboration | Differential cross section measurements for the production of a w boson in association with jets in proton-proton collisions at $ \sqrt{s} = $ 7 TeV | PLB 741 (2015) 12 | CMS-SMP-12-023 1406.7533 |
| 13 | CMS Collaboration | The CMS experiment at the CERN LHC | JINST 3 (2008) S08004 | CMS-00-001 |
| 14 | GEANT4 Collaboration | GEANT4---a simulation toolkit | NIMA 506 (2003) 250 | |
| 15 | CMS Collaboration | Charged particle multiplicities in pp interactions at $ \sqrt{s} = $ 0.9 , 2.36, and 7 TeV | JHEP 01 (2011) 079 | CMS-QCD-10-004 1011.5531 |
| 16 | J. Pumplin et al. | New generation of parton distributions with uncertainties from global QCD analysis | JHEP 07 (2002) 012 | hep-ph/0201195 |
| 17 | K. Melnikov and F. Petriello | Electroweak gauge boson production at hadron colliders through O($ \alpha_{S}^2) $ | PRD 74 (2006) 114017 | hep-ph/0609070 |
| 18 | J. Alwall et al. | Comparative study of various algorithms for the merging of parton showers and matrix elements in hadronic collisions | EPJC 53 (2008) 473 | 0706.2569 |
| 19 | M. Cacciari, G. P. Salam, and G. Soyez | FastJet user manual | EPJC 72 (2012) 1896 | 1111.6097 |
| 20 | P. Nason | A new method for combining NLO QCD with shower Monte Carlo algorithms | JHEP 11 (2004) 040 | hep-ph/0409146 |
| 21 | S. Frixione, P. Nason, and C. Oleari | Matching NLO QCD computations with parton shower simulations: the POWHEG method | JHEP 11 (2007) 070 | 0709.2092 |
| 22 | S. Alioli, P. Nason, C. Oleari, and E. Re | A general framework for implementing NLO calculations in shower Monte Carlo programs: the POWHEG BOX | JHEP 06 (2010) 043 | 1002.2581 |
| 23 | S. Alioli, P. Nason, C. Oleari, and E. Re | NLO single-top production matched with shower in POWHEG: $ s $- and $ t $-channel contributions | JHEP 09 (2009) 111 | 0907.4076 |
| 24 | J. Campbell, R. K. Ellis, and F. Tramontano | Single top-quark production and decay at next-to-leading order | PRD 70 (2004) 094012 | hep-ph/0408158 |
| 25 | J. Campbell and F. Tramontano | Next-to-leading order corrections to Wt production and decay | NPB 726 (2005) 109 | hep-ph/0506289 |
| 26 | J. M. Campbell, R. Frederix, F. Maltoni, and F. Tramontano | Next-to-leading-order predictions for $ t $-channel single-top production at hadron colliders | PRL 102 (2009) 182003 | 0903.0005 |
| 27 | J. M. Campbell, R. K. Ellis, and C. Williams | Vector boson pair production at the LHC | JHEP 07 (2011) 018 | 1105.0020 |
| 28 | M. Czakon, P. Fiedler, and A. Mitov | The total top quark pair production cross-section at hadron colliders through O($ \alpha_S^4 $) | PRL 110 (2013) 252004 | 1303.6254 |
| 29 | CMS Collaboration | Particle--flow event reconstruction in CMS and performance for jets, taus, and $ E_{\mathrm{T}}^{\text{miss}} $ | CDS | |
| 30 | CMS Collaboration | Commissioning of the particle-flow event reconstruction with the first LHC collisions recorded in the CMS detector | CDS | |
| 31 | CMS Collaboration | Performance of CMS muon reconstruction in pp collision events at $ \sqrt{s} = $ 7 TeV | JINST 7 (2012) P10002 | CMS-MUO-10-004 1206.4071 |
| 32 | CMS Collaboration | Performance of the CMS missing transverse momentum reconstruction in pp data at $ \sqrt{s} = $ 8 TeV | JINST 10 (2015) P02006 | CMS-JME-13-003 1411.0511 |
| 33 | M. Cacciari, G. P. Salam, and G. Soyez | The anti-$ k_{\rm t} $ jet clustering algorithm | JHEP 04 (2008) 063 | 0802.1189 |
| 34 | CMS Collaboration | Determination of jet energy calibration and transverse momentum resolution in CMS | JINST 6 (2011) 11002 | CMS-JME-10-011 1107.4277 |
| 35 | CMS Collaboration | Identification of b-quark jets with the CMS experiment | JINST 8 (2013) P04013 | CMS-BTV-12-001 1211.4462 |
| 36 | G. D'Agostini | A multidimensional unfolding method based on Bayes theorem | Nucl. Instr. Meth. A 362 (1995) 487 | |
| 37 | T. Adye | Unfolding algorithms and tests using RooUnfold | in PHYSTAT 2011 Workshop on Statistical Issues Related to Discovery Claims in Search Experiments and Unfolding, H. Prosper and L. Lyons, eds., CERN | 1105.1160 |
| 38 | A. Hocker and V. Kartvelishvili | SVD approach to data unfolding | NIMA 372 (1996) 469 | hep-ph/9509307 |
| 39 | J. Campbell and R. K. Ellis | Next-to-leading order corrections to W+2 jet and Z+2 jet production at hadron colliders | PRD 65 (2002) 113007 | hep-ph/0202176 |
| 40 | CMS Collaboration | Performance of b tagging at $ \sqrt{s} = $ 8 TeV in multijet, $ \mathrm{ t \bar{t} } $, and boosted topology events | CMS-PAS-BTV-13-001 | CMS-PAS-BTV-13-001 |
| 41 | CMS Collaboration | Cms luminosity based on pixel cluster counting - summer 2013 update | CMS-PAS-LUM-13-001 | CMS-PAS-LUM-13-001 |
| 42 | CMS Collaboration | Measurement of the inelastic proton-proton cross section at $ \sqrt{s} = $ 7 TeV | PLB 722 (2013) 5 | CMS-FWD-11-001 1210.6718 |
| 43 | C. F. Berger et al. | Next-to-leading order QCD predictions for W+3-jet distributions at hadron colliders | PRD 80 (2009) 074036 | 0907.1984 |
| 44 | NNPDF Collaboration | Parton distributions for the LHC Run II | JHEP 04 (2015) 040 | 1410.8849 |
| 45 | T. Sjostrand, S. Mrenna, and P. Z. Skands | A brief introduction to PYTHIA 8.1 | CPC 178 (2008) 852 | 0710.3820 |
| 46 | R. Frederix and S. Frixione | Merging meets matching in MC@NLO | JHEP 12 (2012) 061 | 1209.6215 |
| 47 | NNPDF Collaboration, M. Ubiali | Towards the NNPDF3.0 parton set for the next LHC run | in Proceedings of the XXII Int'l Workshop on Deep-Inelastic Scattering and Related Subjects, Warsaw, 2014, PoS(DIS2014)041 | 1407.3122 |
| 48 | CMS Collaboration | Event generator tunes obtained from underlying event and multiparton scattering measurements | EPJC 76 (2016) 155 | CMS-GEN-14-001 1512.00815 |
| 49 | R. Frederix et al. | Four-lepton production at hadron colliders: aMC@NLO predictions with theoretical uncertainties | JHEP 02 (2012) 099 | 1110.4738 |
| 50 | C. F. Berger et al. | One-loop calculations with BlackHat | in Proceedings of the 9th DESY Workshop on Elementary Particle Theory 2008 NPB, Proc. Suppl. 183 (2008) 313 | 0807.3705 |
| 51 | C. F. Berger et al. | Vector boson + jets with BlackHat and SHERPA | in Loops and Legs in Quantum Field Theory --- Proceedings of the 10th DESY Workshop on Elementary Particle Theory, NPB Proc. Suppl. 205-206 (2010) 92 | 1005.3728 |
| 52 | S. Hoeche, F. Krauss, M. Schonherr, and F. Siegert | A critical appraisal of NLO+PS matching methods | JHEP 09 (2012) 049 | 1111.1220 |
| 53 | D. Maitre and S. Sapeta | Simulated NNLO for high-$ p_\text{T} $ observables in vector boson + jets production at the LHC | EPJC 73 (2013) 2663 | 1307.2252 |
|
|
Compact Muon Solenoid LHC, CERN |
|

|

|

|

|

|