

Compact Muon Solenoid
LHC, CERN
| CMS-TOP-13-015 ; CERN-PH-EP-2015-289 | ||
| Measurement of spin correlations in $\mathrm{ t \bar{t} }$ production using the matrix element method in the muon+jets final state in pp collisions at $ \sqrt{s} = $ 8 TeV | ||
| CMS Collaboration | ||
| 19 November 2015 | ||
| Phys. Lett. B 758 (2016) 321 | ||
| Abstract: The consistency of the spin correlation strength in top quark pair production with the standard model (SM) prediction is tested in the muon+jets final state. The events are selected from pp collisions, collected by the CMS detector, at a centre-of-mass energy of 8 TeV, corresponding to an integrated luminosity of 19.7 fb$^{-1}$. The data are compared with the expectation for the spin correlation predicted by the SM and with the expectation of no correlation. Using a template fit method, the fraction of events that show SM spin correlations is measured to be 0.72 $\pm$ 0.08 (stat) $^{+0.15}_{-0.13}$ (syst), representing the most precise measurement of this quantity in the muon+jets final state to date. | ||
| Links: e-print arXiv:1511.06170 [hep-ex] (PDF) ; CDS record ; inSPIRE record ; HepData record ; CADI line (restricted) ; | ||
| Figures | |

png pdf |
Figure 1:
The $\chi ^{2}$ probability distribution of the selected solutions of the kinematic fit in the $\mu $+jets channel, showing a shape comparison between data and simulation including the statistical uncertainties. The relative contributions in simulation are calculated using the theoretical cross sections with the total yield normalised to data. For the analysis, we only consider events with a probability larger than 0.08, as indicated by the arrow. |

png pdf |
Figure 2-a:
$\Delta E$ distributions based on the values obtained from simulation (circles) compared to the $\Delta E$ distribution obtained by folding the $E_\text {parton}$ spectrum of matched partons with the transfer function (squares) summed over all values of $E_\text {parton}$ and $ {| \eta _\text {parton} | }$. The mean and RMS shown on the plots are obtained from simulation. The figure is shown for b quark jets (a) and for light quark jets (b). |

png pdf |
Figure 2-b:
$\Delta E$ distributions based on the values obtained from simulation (circles) compared to the $\Delta E$ distribution obtained by folding the $E_\text {parton}$ spectrum of matched partons with the transfer function (squares) summed over all values of $E_\text {parton}$ and $ {| \eta _\text {parton} | }$. The mean and RMS shown on the plots are obtained from simulation. The figure is shown for b quark jets (a) and for light quark jets (b). |
png pdf |
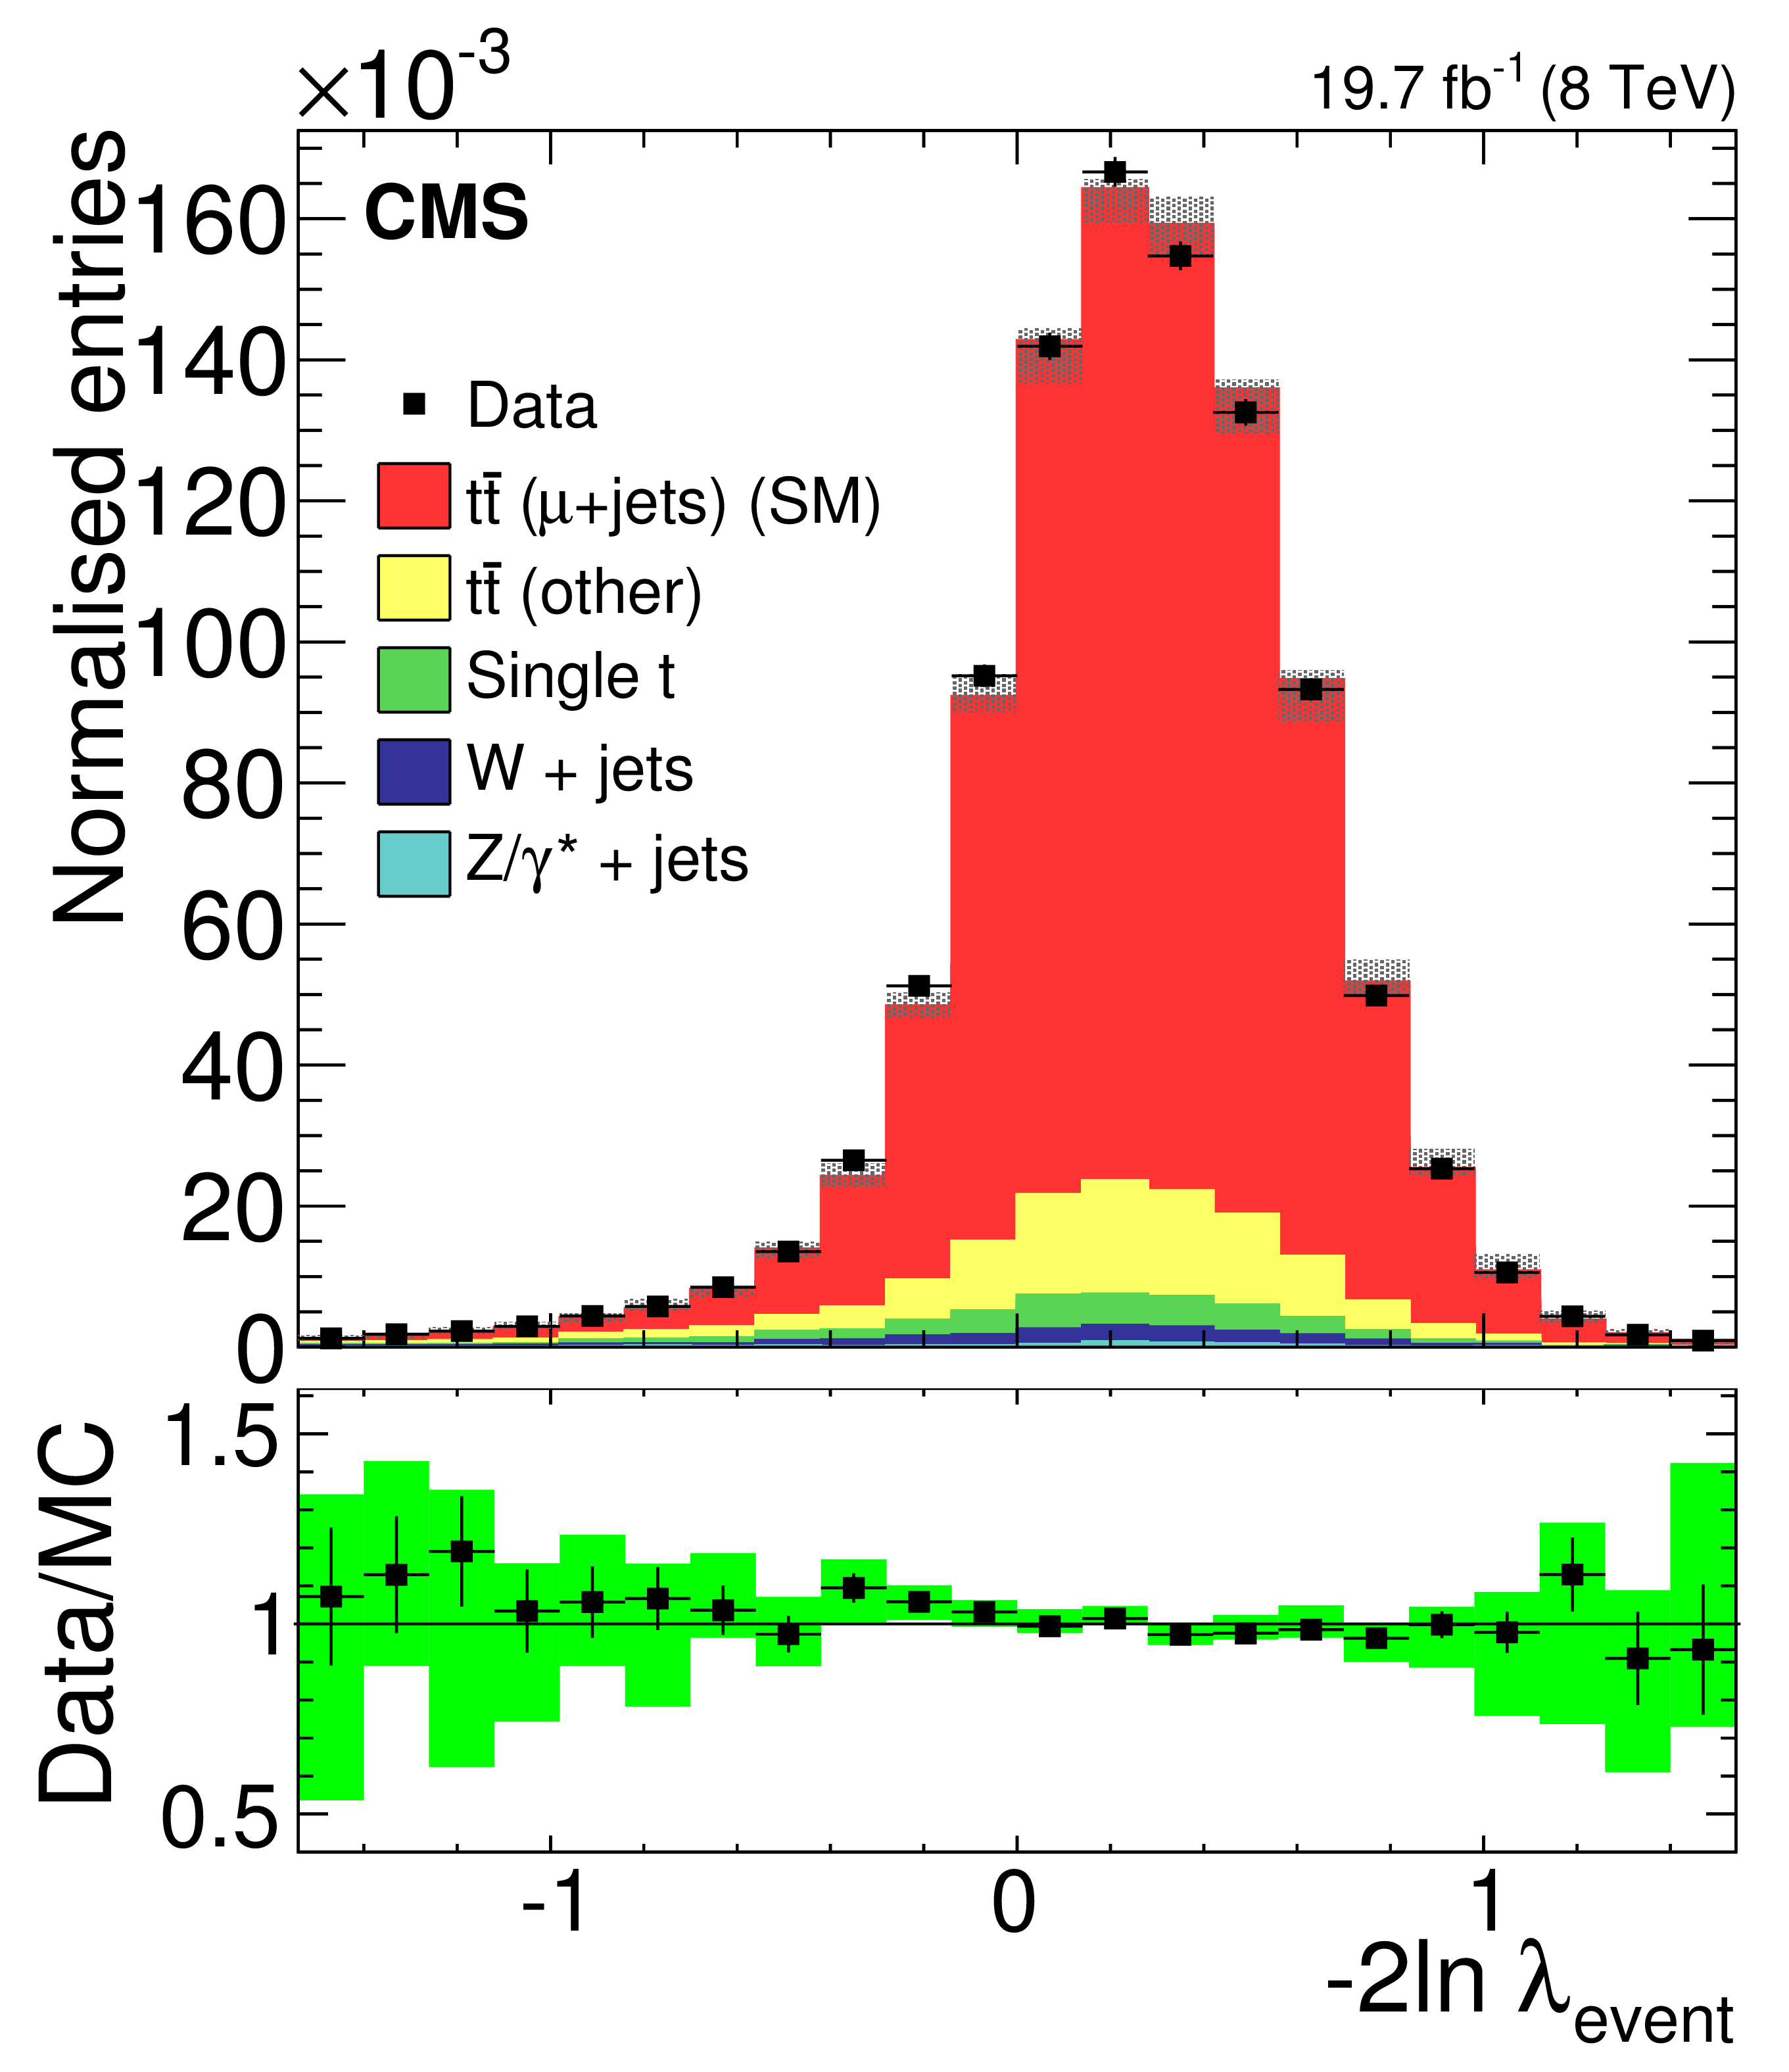
Figure 3-a:
Distribution of $-2\ln\lambda _\text {event}$. The SM $ {\mathrm{ t \bar{t} } } $ simulation is used in the (a) plot and the uncorrelated $ {\mathrm{ t \bar{t} } } $ simulation in the (b) plot. Both data and simulation are normalised to unity. The hatched uncertainty band includes statistical and systematic uncertainties. The error bars in the ratio plot at the bottom only consider statistical uncertainties (of both data and simulation), while the uncertainty band covers both statistical and systematic uncertainties. Systematic uncertainties are described in Section 8. The overlap of the green uncertainty band, which is constructed around the marker position, with the ratio value of 1 indicates agreement between the data and the simulation within the total uncertainty. |
png pdf |
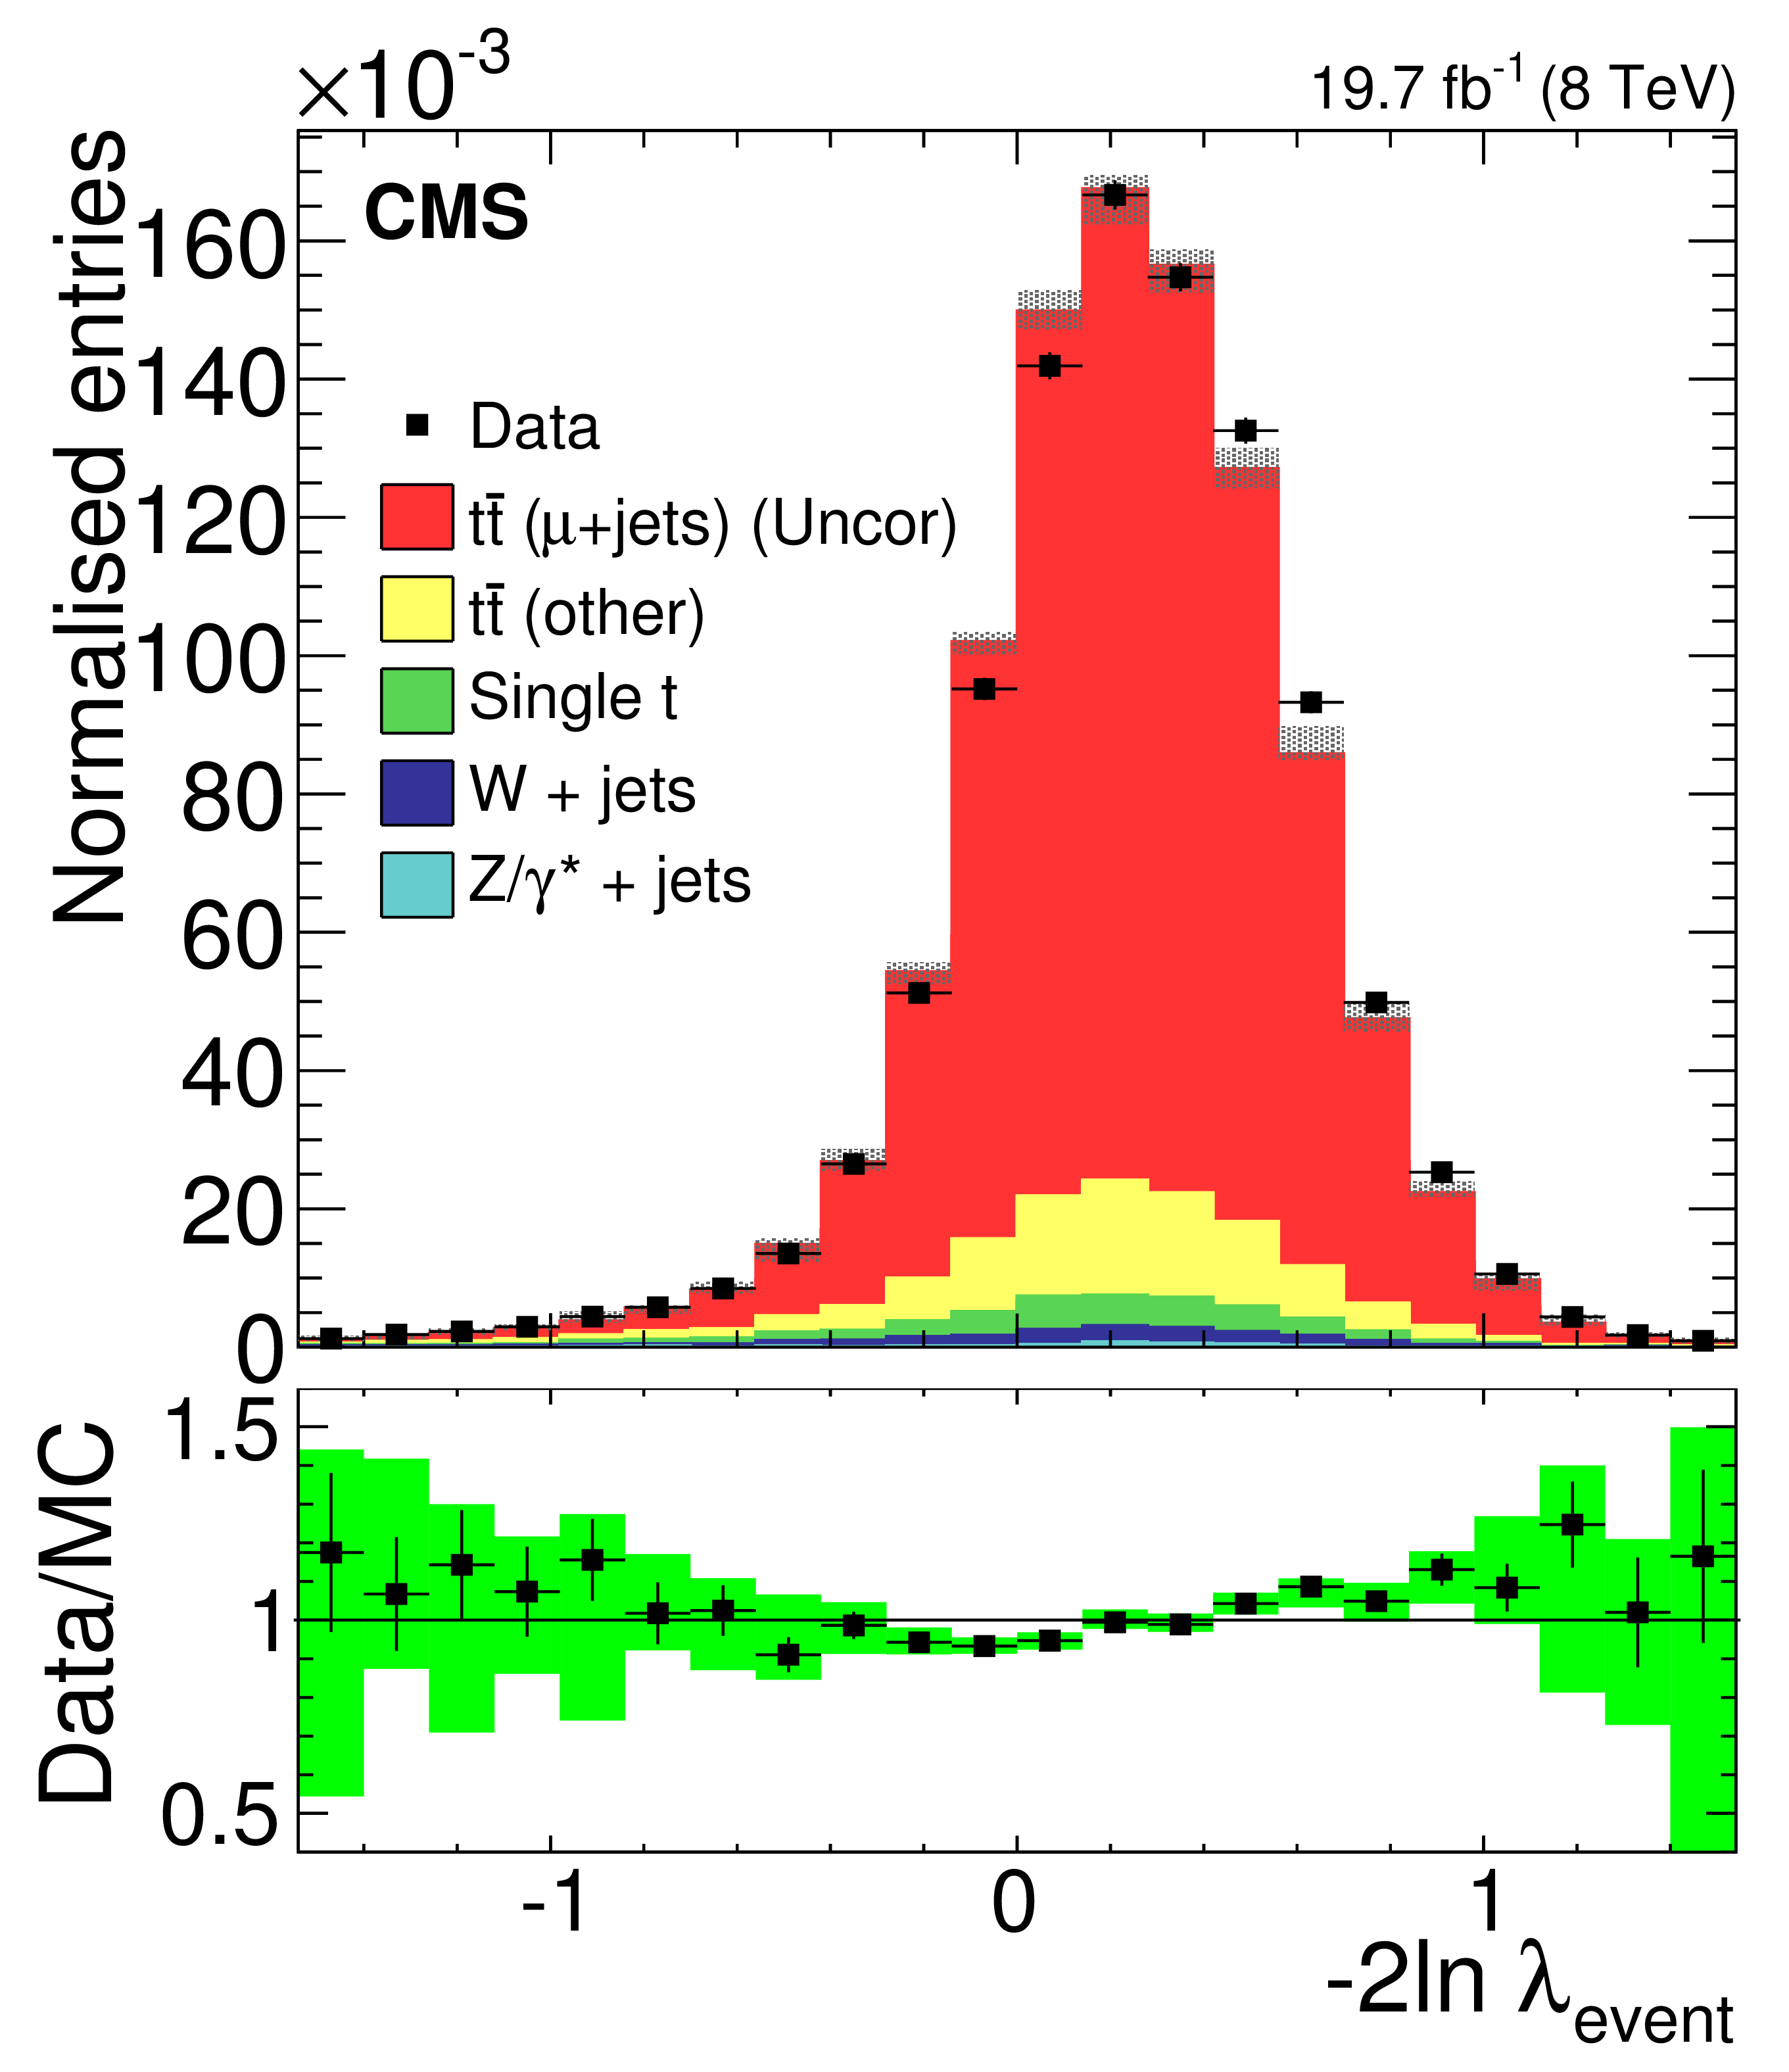
Figure 3-b:
Distribution of $-2\ln\lambda _\text {event}$. The SM $ {\mathrm{ t \bar{t} } } $ simulation is used in the (a) plot and the uncorrelated $ {\mathrm{ t \bar{t} } } $ simulation in the (b) plot. Both data and simulation are normalised to unity. The hatched uncertainty band includes statistical and systematic uncertainties. The error bars in the ratio plot at the bottom only consider statistical uncertainties (of both data and simulation), while the uncertainty band covers both statistical and systematic uncertainties. Systematic uncertainties are described in Section 8. The overlap of the green uncertainty band, which is constructed around the marker position, with the ratio value of 1 indicates agreement between the data and the simulation within the total uncertainty. |

png pdf |
Figure 4:
The expected $-2\ln\lambda _\mathrm {sample}$ distribution estimated using simulation, evaluated at the data sample size. The samples in simulation contain signal and background mixed according to the theoretical cross sections, with the solid Gaussian function using SM $ {\mathrm{ t \bar{t} } } $ simulation and the dashed Gaussian function using uncorrelated $ {\mathrm{ t \bar{t} } } $ simulation. From this figure, the separation power can be assessed in the case when systematic effects are not considered. |

png pdf |
Figure 5:
Result of the template fit to data. The squares represent the data with the statistical uncertainty smaller than the marker size, the dotted curve is the overall result of the fit, the solid curve is the contribution of the SM signal template to the fit, the dashed curve is the contribution of the uncorrelated signal, and the dash-dot curve is the background contribution. |

png pdf |
Figure 6:
The $-2\ln\lambda _\mathrm {sample}$ distribution in simulation, evaluated for the data set size. The samples in simulation contain signal and background mixed according to the theoretical cross sections, with the solid distribution obtained using SM $ {\mathrm{ t \bar{t} } } $ simulation and the dashed distribution obtained using uncorrelated $ {\mathrm{ t \bar{t} } } $ simulation, including systematic uncertainties. The arrow indicates the $-2\ln\lambda _\mathrm {sample}$ observed in data. The dotted curve shows a mixture of 72% SM $ {\mathrm{ t \bar{t} } } $ events and 28% uncorrelated $ {\mathrm{ t \bar{t} } } $ events. |
| Tables | |
png pdf |
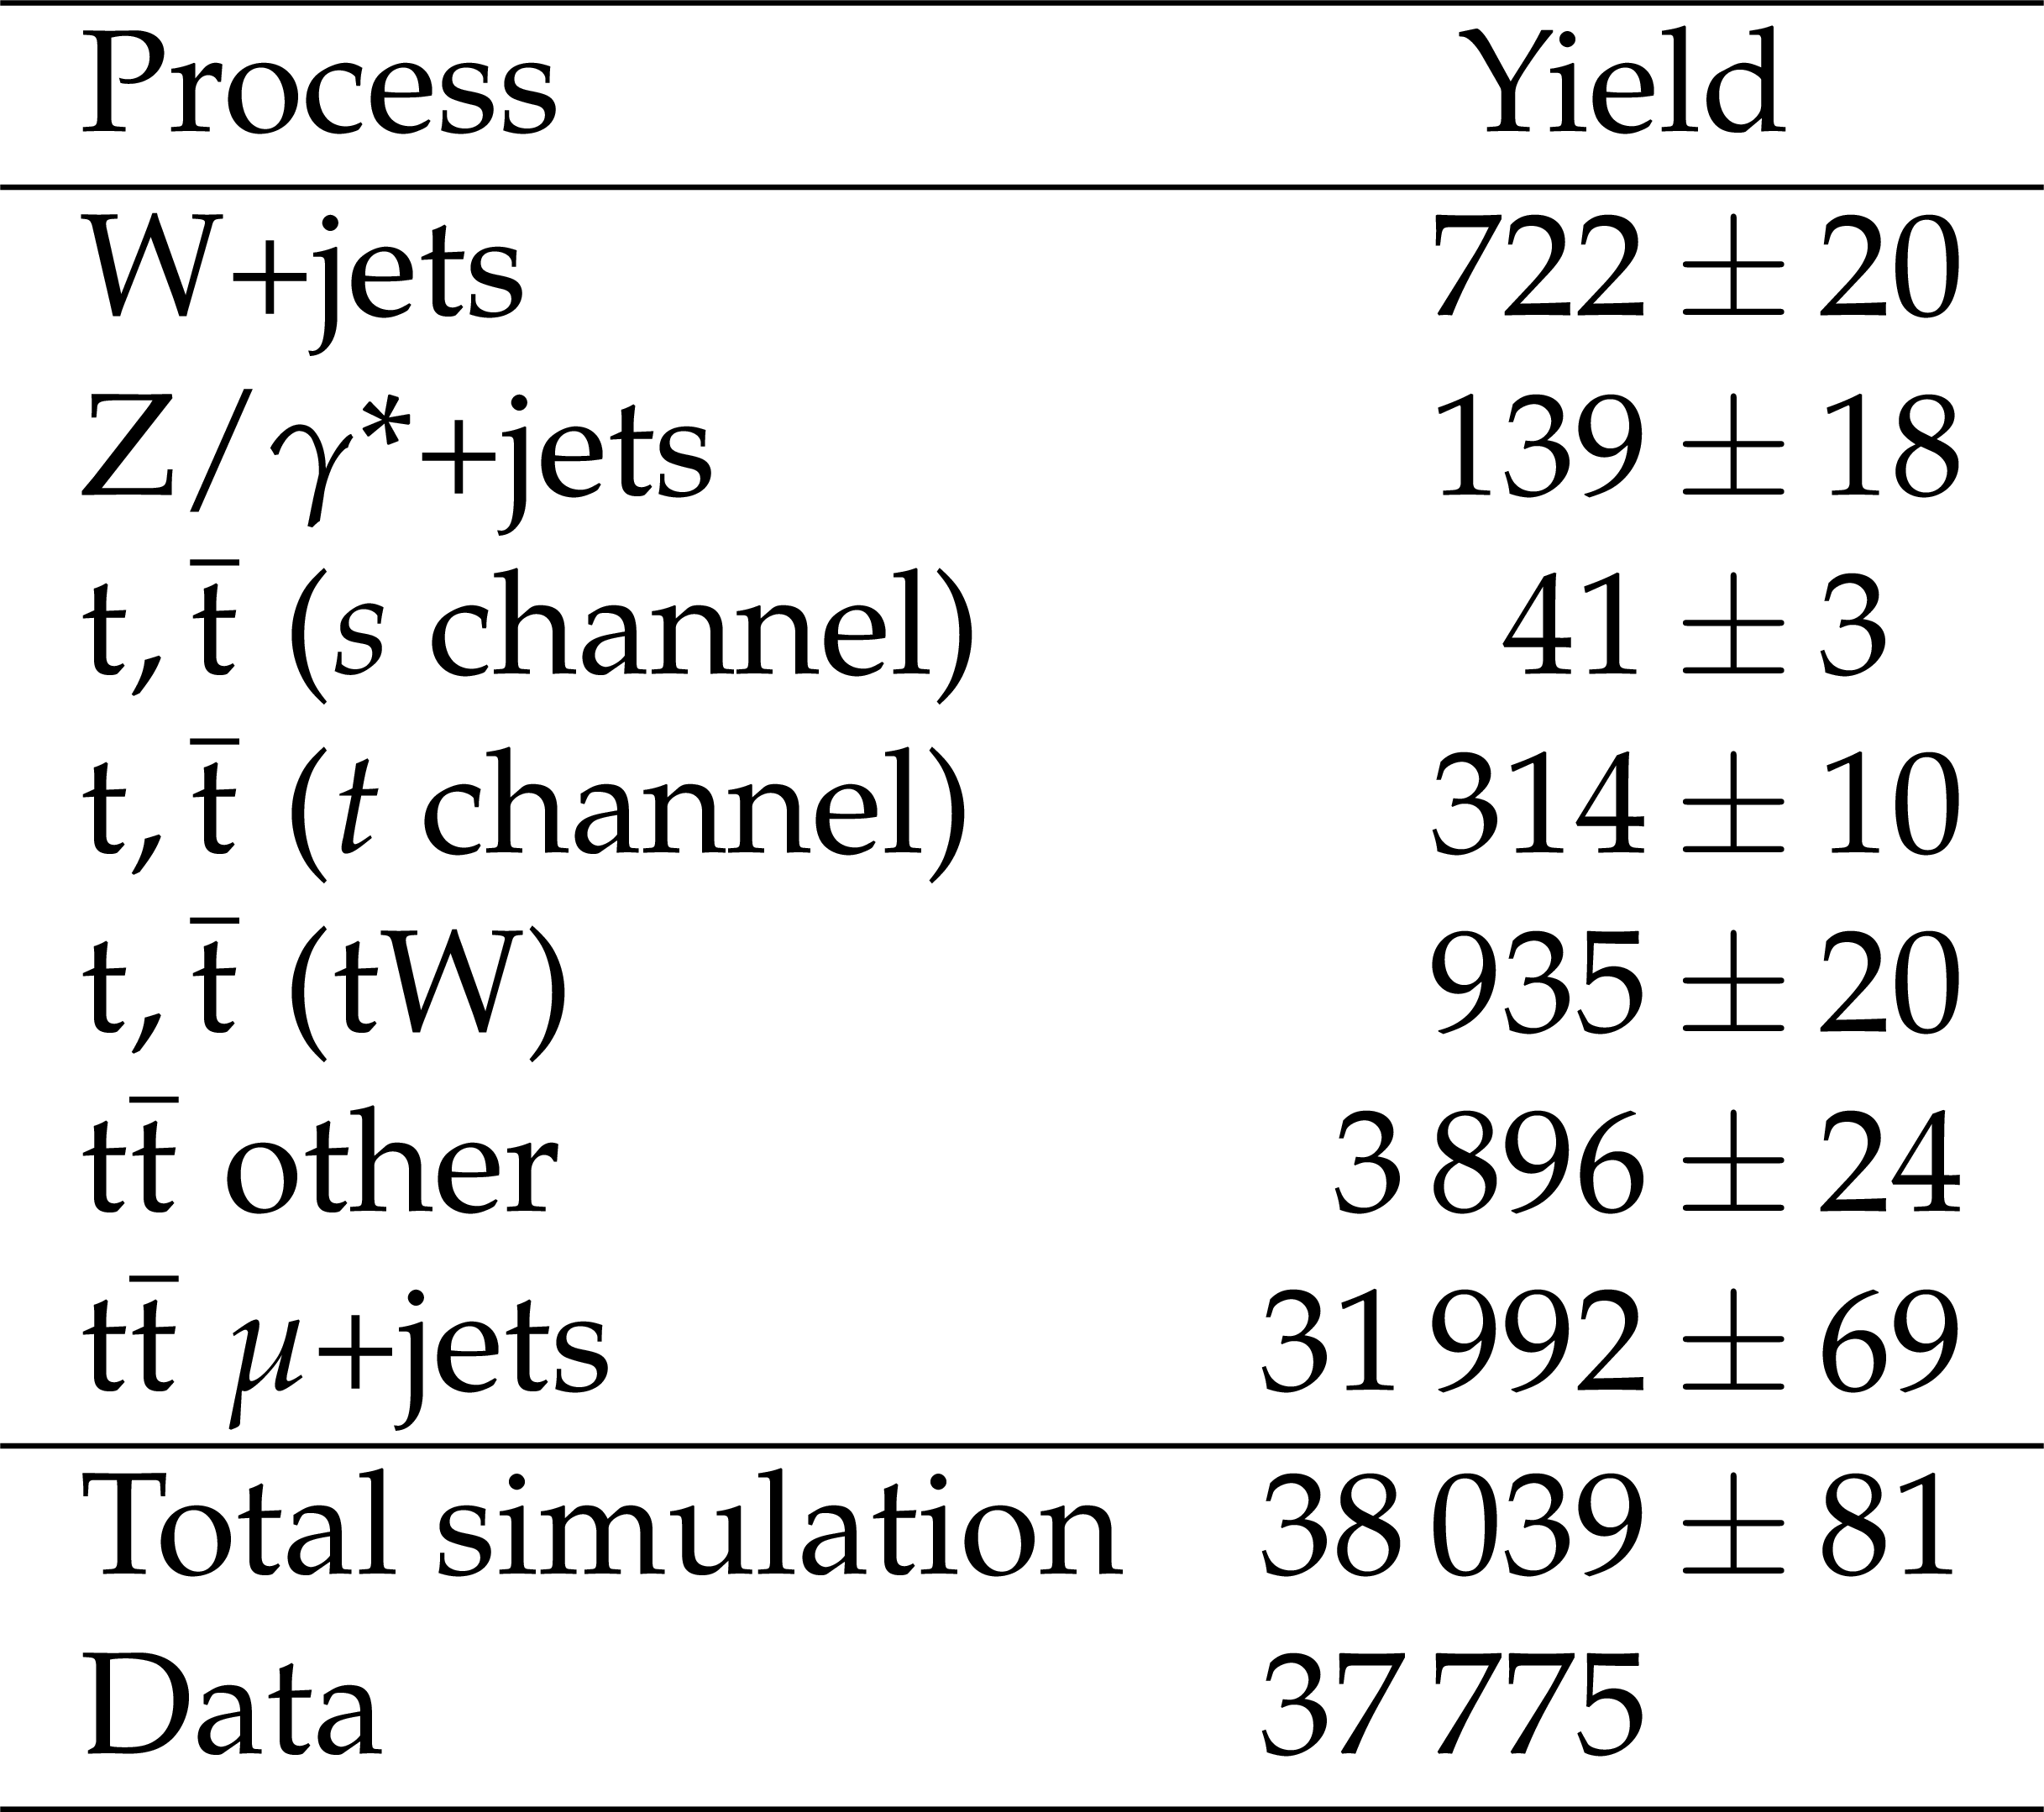
Table 1:
Event yield after event selection, with the statistical uncertainties. The contributions from various physics processes are given, with a comparison between the data and the total simulation at the bottom. |

png pdf |
Table 2:
Fit parameters of the 2D calibration function. The residual correlation between the fit parameters is below 10% and is ignored. |

png pdf |
Table 3:
Sources of systematic uncertainty in the fraction $f$ of events with the SM spin correlation. There is no downward variation for the $ {p_{\mathrm {T}}} ^\mathrm {t}$ modeling. |
| Summary |
|
The hypothesis that $\mathrm{ t \bar{t} }$ events are produced with correlated spins as predicted by the SM is tested using a matrix element method in the $\mu$+jets final state at $ \sqrt{s} = $ 8 TeV, using pp collisions corresponding to an integrated luminosity of 19.7 fb$^{-1}$. The data agree with the uncorrelated hypothesis within 2.9 standard deviations, whereas agreement with the SM is within 2.2 standard deviations. Our hypotheses are only considered up to NLO effects in the simulation, with LO matrix elements in the likelihood calculations. Using a template fit method, the fraction of events which show SM spin correlations has been extracted. This fraction is measured to be $f =$ 0.72 $\pm$ 0.08 (stat) $^{+0.15}_{-0.13}$ (syst), leading to a spin correlation strength of $A^\text{measured}_\text{hel} =$ 0.23 $\pm$ 0.03 (stat) $^{+0.05}_{-0.04}$ (syst) using the value obtained in simulation which is compatible with the theoretical prediction for $A^\mathrm{SM}_\text{hel}$ from [51,52]. The result is the most precise determination of this quantity in the muon+jets final state to date and is competitive with the most accurate result in the dilepton final state [9]. |
| References | ||||
| 1 | D. Krohn, T. Liu, J. Shelton, and L.-T. Wang | A polarized view of the top asymmetry | PRD 84 (2011) 074034 | 1105.3743 |
| 2 | W. Bernreuther and Z.-G. Si | Top quark spin correlations and polarization at the LHC: Standard model predictions and effects of anomalous top chromo moments | PLB 725 (2013) 115 | 1305.2066 |
| 3 | CDF Collaboration | Measurement of $ \mathrm{t\overline{t}} $ spin correlation in $ \mathrm{p\overline{p}} $ collisions using the CDF II detector at the Tevatron | PRD 83 (2011) 031104 | 1012.3093 |
| 4 | D0 Collaboration | Spin correlation in $ \mathrm{t\overline{t}} $ production from $ \mathrm{p\overline{p}} $ collisions at $ \sqrt{s}= $ 1.8 TeV | PRL 85 (2000) 256 | hep-ex/0002058 |
| 5 | D0 Collaboration | Measurement of spin correlation in $ \mathrm{t\overline{t}} $ production using dilepton final states | PLB 702 (2011) 16 | 1103.1871 |
| 6 | D0 Collaboration | Measurement of spin correlation in $ \mathrm{t\overline{t}} $ production using a matrix element approach | PRL 107 (2011) 032001 | 1104.5194 |
| 7 | D0 Collaboration | Evidence for spin correlation in $ \mathrm{t\overline{t}} $ production | PRL 108 (2012) 032004 | 1110.4194 |
| 8 | ATLAS Collaboration | Observation of spin correlation in $ \mathrm{t\overline{t}} $ events from pp collisions at $ \sqrt(s) $ = 7 TeV using the ATLAS detector | PRL 108 (2012) 212001 | 1203.4081 |
| 9 | ATLAS Collaboration | Measurement of spin correlation in top-antitop quark events and search for top squark pair production in pp collisions at $ \sqrt{s} = $ 8 TeV using the ATLAS detector | PRL 114 (2015) 142001 | 1412.4742 |
| 10 | ATLAS Collaboration | Measurement of the correlations between the polar angles of leptons from top quark decays in the helicity basis at $ \sqrt{s}=7 $ TeV using the ATLAS detector | PRD 93 (2016) 012002 | 1510.07478 |
| 11 | ATLAS Collaboration | Measurements of spin correlation in top-antitop quark events from proton-proton collisions at $ \sqrt{s} = $ 7 TeV using the ATLAS detector | PRD 90 (2014) 112016 | 1407.4314 |
| 12 | CMS Collaboration | The CMS experiment at the CERN LHC | JINST 3 (2008) S08004 | CMS-00-001 |
| 13 | CMS Collaboration | Performance of CMS muon reconstruction in pp collision events at $ \sqrt{s} = $ 7 TeV | JINST 7 (2012) P10002 | CMS-MUO-10-004 1206.4071 |
| 14 | S. Frixione and B. R. Webber | Matching NLO QCD computations and parton shower simulations | JHEP 06 (2002) 029 | hep-ph/0204244 |
| 15 | S. Frixione, F. Stoeckli, P. Torrielli, and B. R. Webber | NLO QCD corrections in Herwig++ with MC@NLO | JHEP 01 (2011) 053 | 1010.0568 |
| 16 | H.-L. Lai et al. | New parton distributions for collider physics | PRD 82 (2010) 074024 | 1007.2241 |
| 17 | J. Alwall et al. | The automated computation of tree-level and next-to-leading order differential cross sections, and their matching to parton shower simulations | JHEP 07 (2014) 079 | 1405.0301 |
| 18 | Z. Was | TAUOLA the library for tau lepton decay, and KKMC/KORALB/KORALZ/... status report | NPPS 98 (2001) 96 | hep-ph/0011305 |
| 19 | P. Nason | A new method for combining NLO QCD with shower Monte Carlo algorithms | JHEP 11 (2004) 040 | hep-ph/0409146 |
| 20 | S. Frixione, P. Nason, and C. Oleari | Matching NLO QCD computations with parton shower simulations: the POWHEG method | JHEP 11 (2007) 070 | 0709.2092 |
| 21 | S. Alioli, P. Nason, C. Oleari, and E. Re | A general framework for implementing NLO calculations in shower Monte Carlo programs: the POWHEG BOX | JHEP 06 (2010) 043 | 1002.2581 |
| 22 | N. Davidson et al. | Universal interface of TAUOLA technical and physics documentation | CPC 183 (2012) 821 | 1002.0543 |
| 23 | R. Field | Early LHC underlying event data - findings and surprises | in Hadron collider physics. Proceedings, 22nd Conference, HCP 2010, Toronto, Canada, August 23-27, 2010 2010 | 1010.3558 |
| 24 | J. Pumplin et al. | New generation of parton distributions with uncertainties from global QCD analysis | JHEP 07 (2002) 012 | hep-ph/0201195 |
| 25 | GEANT4 Collaboration | GEANT4---a simulation toolkit | NIMA 506 (2003) 250 | |
| 26 | ATLAS, CDF, CMS and D0 collaborations | First combination of Tevatron and LHC measurements of the top-quark mass | 1403.4427 | |
| 27 | M. Czakon, P. Fiedler, and A. Mitov | The total top quark pair production cross-section at hadron colliders through $ \mathcal{O}(\alpha^{4}_{S}) $ | PRL 110 (2013) 252004 | 1303.6254 |
| 28 | CMS Collaboration | Particle--flow event reconstruction in CMS and performance for jets, taus, and $ E_{\mathrm{T}}^{\text{miss}} $ | CDS | |
| 29 | CMS Collaboration | Commissioning of the particle-flow event reconstruction with the first LHC collisions recorded in the CMS detector | CDS | |
| 30 | M. Cacciari, G. P. Salam, and G. Soyez | The anti-$ k_\mathrm{t} $ jet clustering algorithm | JHEP 04 (2008) 063 | 0802.1189 |
| 31 | M. Cacciari, G. P. Salam, and G. Soyez | FastJet user manual | EPJC 72 (2012) 1896 | 1111.6097 |
| 32 | CMS Collaboration | Identification and filtering of uncharacteristic noise in the CMS hadron calorimeter | JINST 5 (2010) T03014 | CMS-CFT-09-019 0911.4881 |
| 33 | CMS Collaboration | Identification of b-quark jets with the CMS experiment | JINST 8 (2013) P04013 | CMS-BTV-12-001 1211.4462 |
| 34 | D0 Collaboration | Direct measurement of the top quark mass by the D0 Collaboration | PRD 58 (1998) 052001 | hep-ex/9801025 |
| 35 | K. Kondo | Dynamical likelihood method for reconstruction of events with missing momentum. 1: Method and toy models | J. Phys. Soc. Jap. 57 (1988) 4126 | |
| 36 | K. Kondo | Dynamical likelihood method for reconstruction of events with missing momentum. 2: Mass spectra for $ 2 \rightarrow 2 $ processes | J. Phys. Soc. Jap. 60 (1991) 836 | |
| 37 | R. H. Dalitz and G. R. Goldstein | Analysis of top-antitop production and dilepton decay events and the top quark mass | PLB 287 (1992) 225 | |
| 38 | D0 Collaboration | A precision measurement of the mass of the top quark | Nature 429 (2004) 638 | hep-ex/0406031 |
| 39 | P. Artoisenet, V. Lema\^itre, F. Maltoni, and O. Mattelaer | Automation of the matrix element reweighting method | JHEP 12 (2010) 068 | 1007.3300 |
| 40 | R. Cousins, J. Mumford, J. Tucker, and V. Valuev | Spin discrimination of new heavy resonances at the LHC | JHEP 11 (2005) 46 | |
| 41 | W. Verkerke and D. Kirkby | The RooFit toolkit for data modeling | physics:data-an/0306116 | |
| 42 | F. James and M. Roos | Minuit: A system for function minimization and analysis of the parameter errors and correlations | CPC 10 (1975) 343 | |
| 43 | CMS Collaboration | Determination of jet energy calibration and transverse momentum resolution in CMS | JINST 6 (2011) P11002 | CMS-JME-10-011 1107.4277 |
| 44 | CMS Collaboration | 8$ TeV $ jet energy corrections and uncertainties based on 19.8$ fb$^{-1}$ $ of data in CMS | CDS | |
| 45 | S. Alekhin et al. | The PDF4LHC Working Group interim report | 1101.0536 | |
| 46 | M. Botje et al. | The PDF4LHC Working Group interim recommendations | 1101.0538 | |
| 47 | CMS Collaboration | Measurement of differential top-quark pair production cross sections in pp collisions at $ \sqrt{s} = $ 7 TeV | EPJC 73 (2013) 2339 | hep-ph/1211.2220 |
| 48 | CMS Collaboration | Measurement of the differential cross section for top quark pair production in pp collisions at $ \sqrt{s} = $ 8 TeV | EPJC 75 (2015) 542 | CMS-TOP-12-028 1505.04480 |
| 49 | TOTEM Collaboration | First measurement of the total proton-proton cross section at the LHC energy of $ \sqrt{s} = $ 7 TeV | Europhys. Lett. 96 (2011) 21002 | 1110.1395 |
| 50 | CMS Collaboration | Performance of b tagging at $ \sqrt{s} $ = 8 TeV in multijet, $ \mathrm{t\overline{t}} $ and boosted topology events | CMS-PAS-BTV-13-001 | CMS-PAS-BTV-13-001 |
| 51 | W. Bernreuther, A. Brandenburg, Z. G. Si, and P. Uwer | Top quark pair production and decay at hadron colliders | Nucl. Phys. B 690 (2004) 81 | hep-ph/0403035 |
| 52 | W. Bernreuther, D. Heisler, and Z.-G. Si | A set of top quark spin correlation and polarization observables for the LHC: Standard Model predictions and new physics contributions | JHEP 12 (2015) 026 | 1508.05271 |
|
|
Compact Muon Solenoid LHC, CERN |
|

|

|

|

|

|