

Compact Muon Solenoid
LHC, CERN
| CMS-TOP-14-012 ; CERN-EP-2016-078 | ||
| Measurement of the integrated and differential $\mathrm{t \bar{t}}$ production cross sections for high-$p_{\mathrm{T}}$ top quarks in pp collisions at $ \sqrt{s} = $ 8 TeV | ||
| CMS Collaboration | ||
| 30 April 2016 | ||
| Phys. Rev. D 94 (2016) 072002 | ||
| Abstract: The cross section for pair production of top quarks ($\mathrm{ t \bar{t} }$) with high transverse momenta is measured in $\mathrm{ p } \mathrm{ p }$ collisions, collected with the CMS detector at the LHC with $ \sqrt{s} = $ 8 TeV in data corresponding to an integrated luminosity of 19.7 fb$^{-1}$. The measurement is performed using lepton+jets events, where one top quark decays semileptonically, while the second top quark decays to a hadronic final state. The hadronic decay is reconstructed as a single, large-radius jet, and identified as a top quark candidate using jet substructure techniques. The integrated cross section and the differential cross sections as a function of top quark $p_{\mathrm{T}}$ and rapidity are measured at particle level within a fiducial region related to the detector-level requirements and at parton level. The particle-level integrated cross section is found to be $\sigma_{\mathrm{ t \bar{t} }} =$ 0.499 $\pm$ 0.035 (stat+syst) $\pm$ 0.095 (theory) $\pm$ 0.013 (lumi) pb for top quark $p_{\mathrm{T}} > $ 400 GeV. The parton-level measurement is $\sigma_{\mathrm{ t \bar{t} }} =$ 1.44 $\pm$ 0.10 (stat+syst) $\pm$ 0.29 (theory) $\pm$ 0.04 (lumi) pb. The integrated and differential cross section results are compared to predictions from several event generators. | ||
| Links: e-print arXiv:1605.00116 [hep-ex] (PDF) ; CDS record ; inSPIRE record ; HepData record ; CADI line (restricted) ; | ||
| Figures & Tables | Summary | Additional Figures | References | CMS Publications |
|---|
| Figures | |
png pdf |
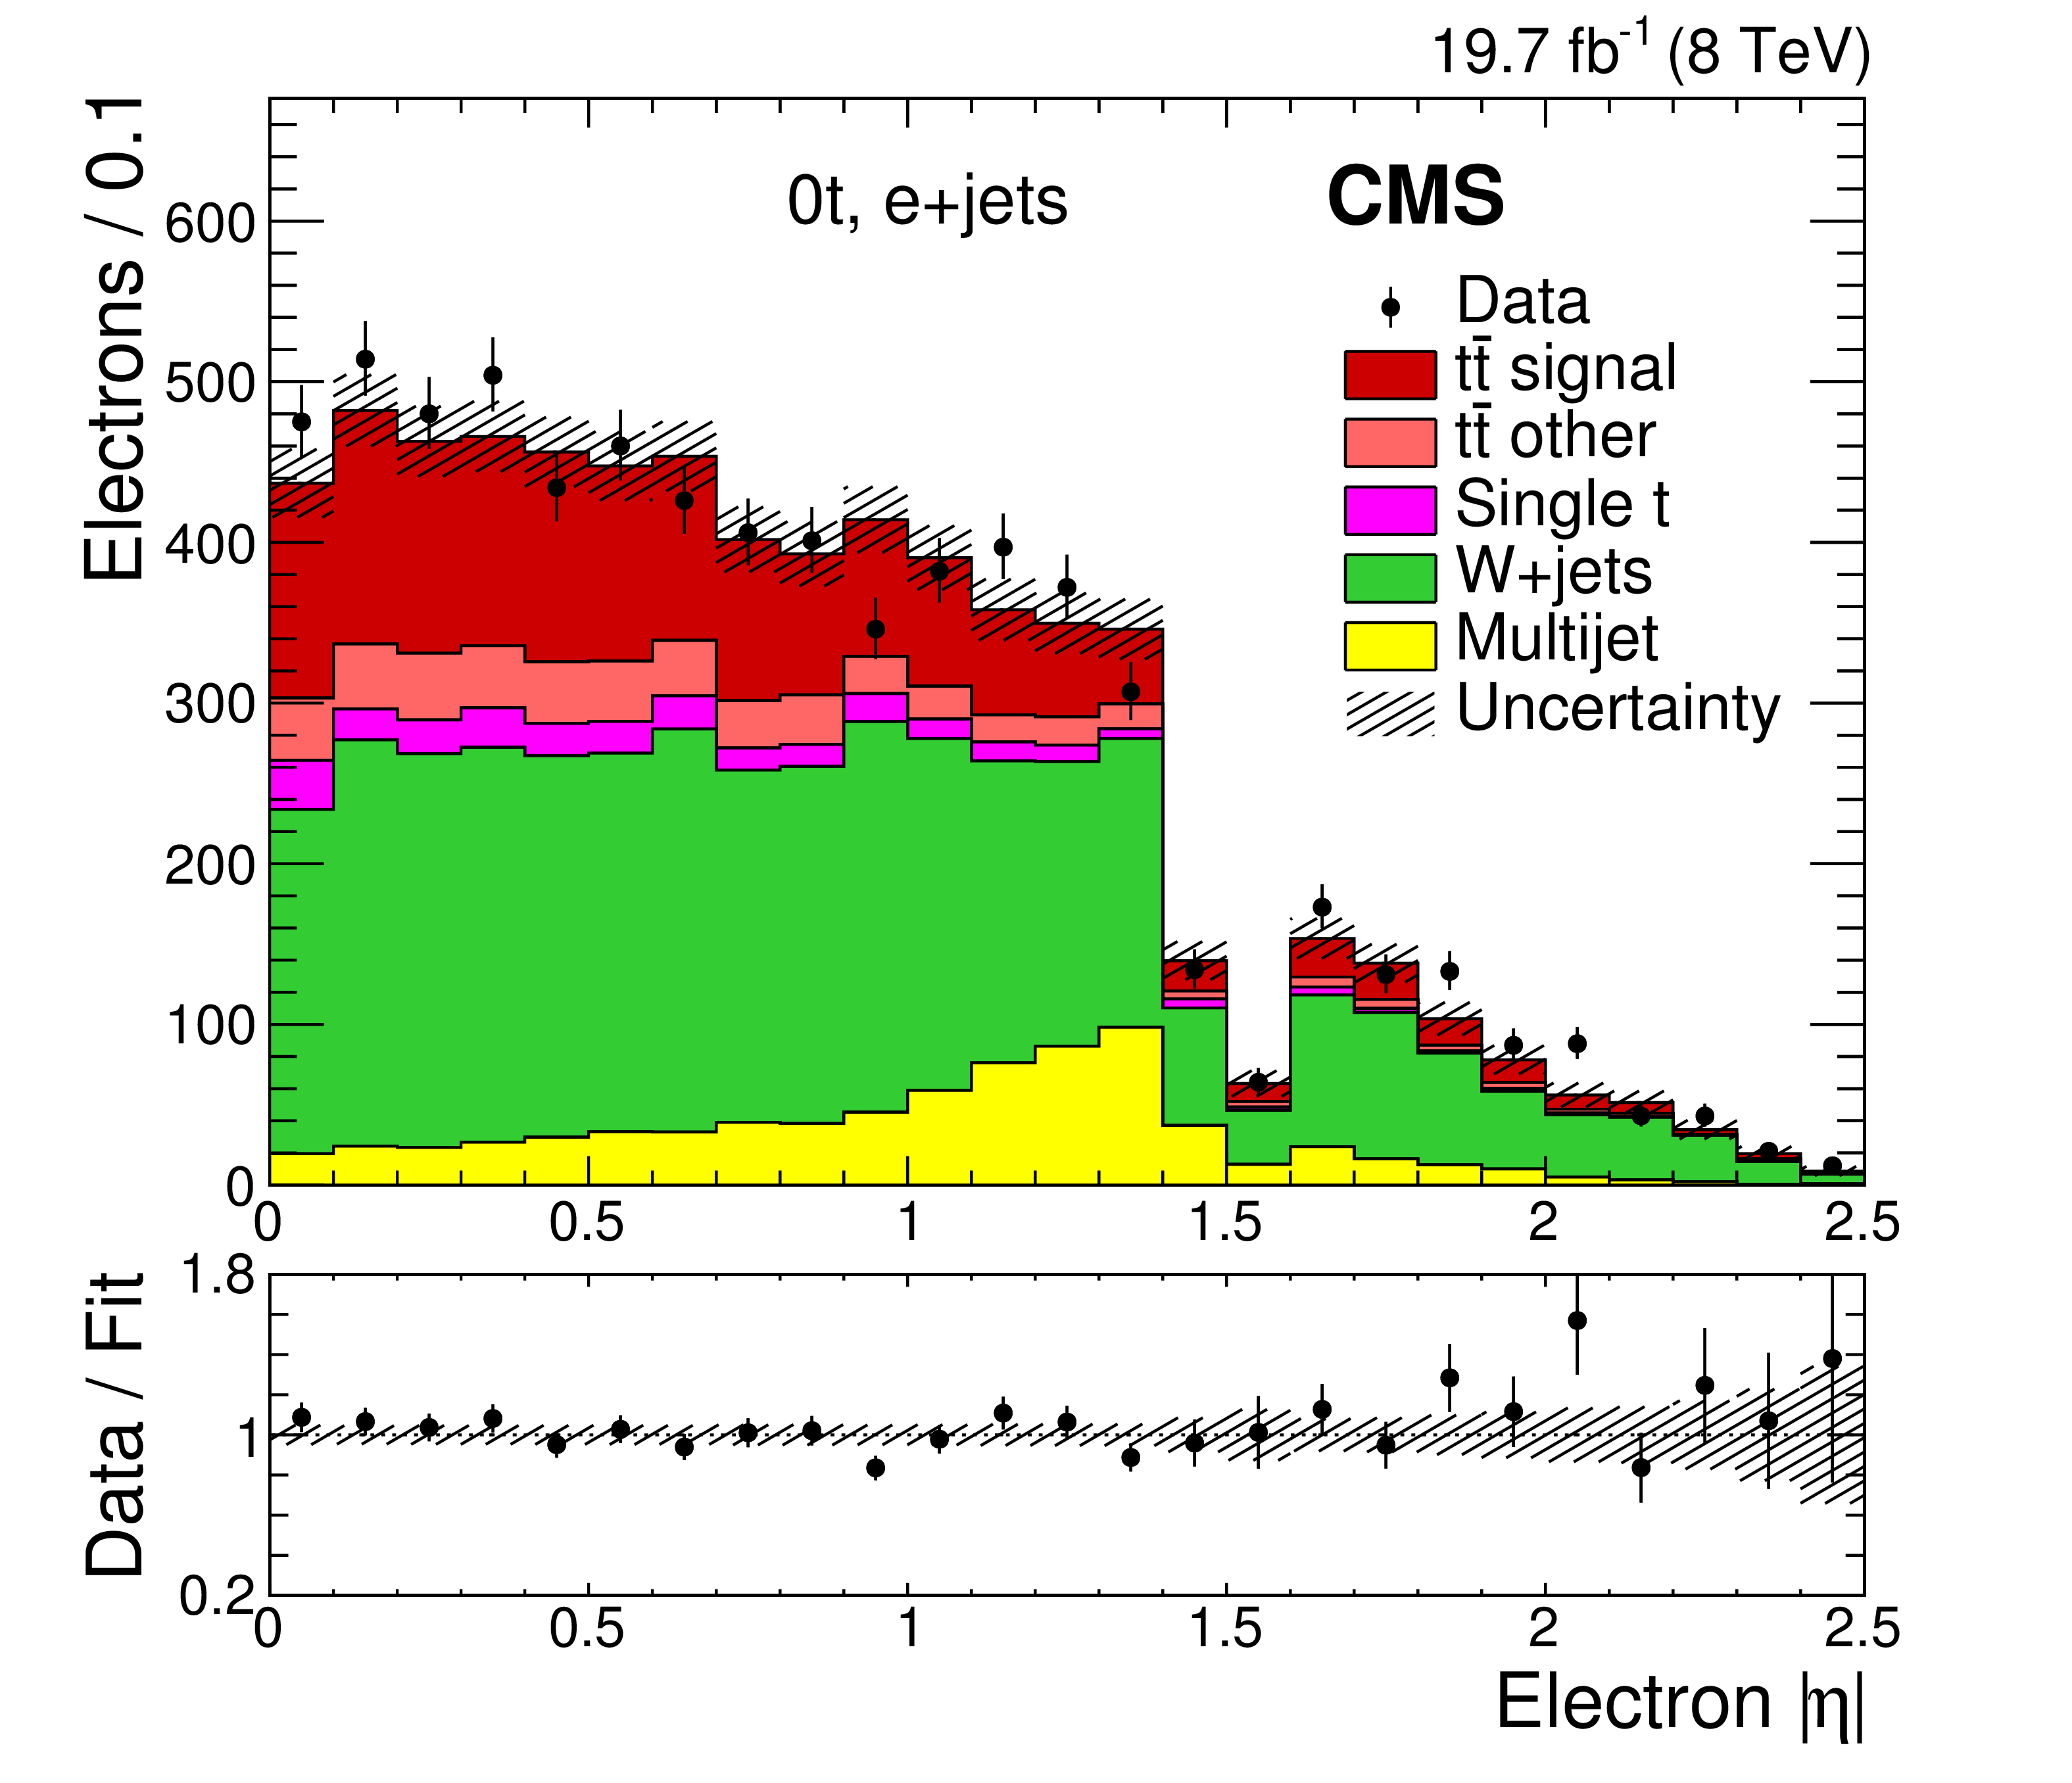
Figure 1-a:
Lepton $|\eta |$ and $m_{\rm vtx}$ distributions from data (points) and for signal and background sources (histograms) with normalizations from the fit for the 0t (a,b), 1t+0b (c,d), and 1t+1b (e,f) event categories, for the e+jets (a,c,e) and $\mu $+jets (b,d,f) channels. The vertical bars on the data points represent the statistical uncertainties. The shaded bands reflect the combined statistical and experimental systematic uncertainties after the fit to the signal and background yields, added in quadrature neglecting their correlations for presentational purposes. The ratios of data to the total fit are shown below each panel, along with the uncertainty band from the fit. |
png pdf |
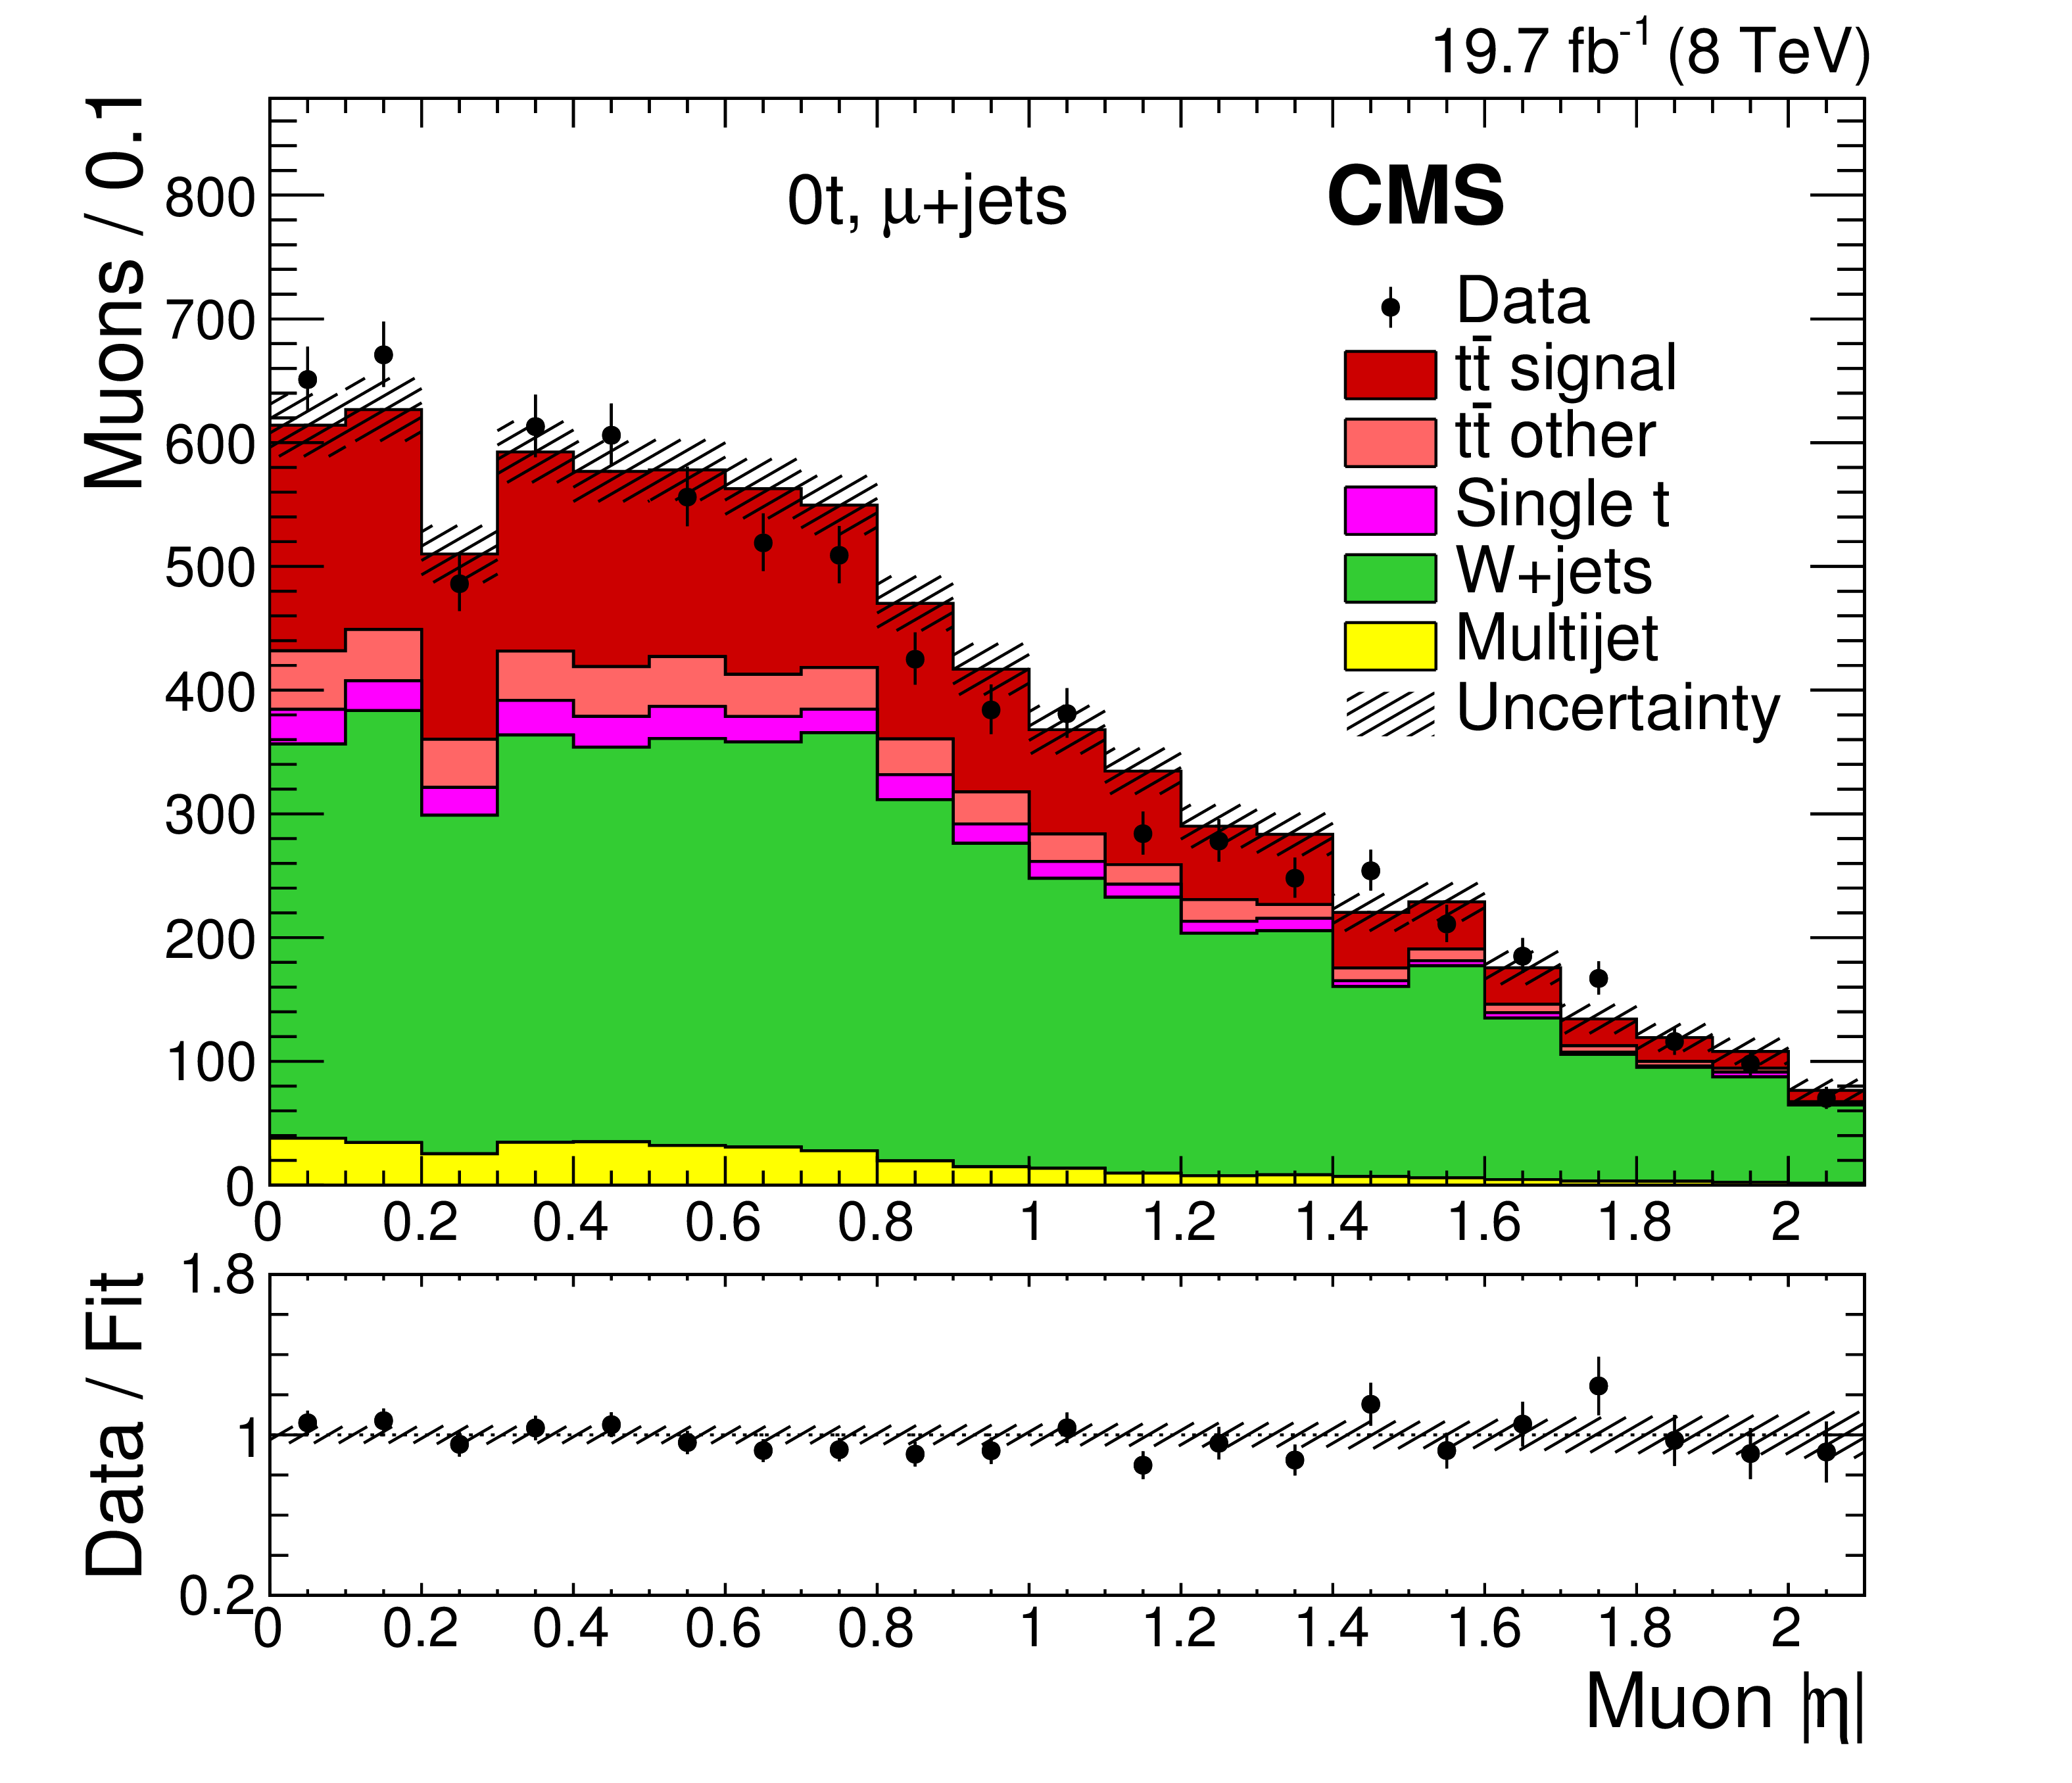
Figure 1-b:
Lepton $|\eta |$ and $m_{\rm vtx}$ distributions from data (points) and for signal and background sources (histograms) with normalizations from the fit for the 0t (a,b), 1t+0b (c,d), and 1t+1b (e,f) event categories, for the e+jets (a,c,e) and $\mu $+jets (b,d,f) channels. The vertical bars on the data points represent the statistical uncertainties. The shaded bands reflect the combined statistical and experimental systematic uncertainties after the fit to the signal and background yields, added in quadrature neglecting their correlations for presentational purposes. The ratios of data to the total fit are shown below each panel, along with the uncertainty band from the fit. |

png pdf |
Figure 1-c:
Lepton $|\eta |$ and $m_{\rm vtx}$ distributions from data (points) and for signal and background sources (histograms) with normalizations from the fit for the 0t (a,b), 1t+0b (c,d), and 1t+1b (e,f) event categories, for the e+jets (a,c,e) and $\mu $+jets (b,d,f) channels. The vertical bars on the data points represent the statistical uncertainties. The shaded bands reflect the combined statistical and experimental systematic uncertainties after the fit to the signal and background yields, added in quadrature neglecting their correlations for presentational purposes. The ratios of data to the total fit are shown below each panel, along with the uncertainty band from the fit. |
png pdf |
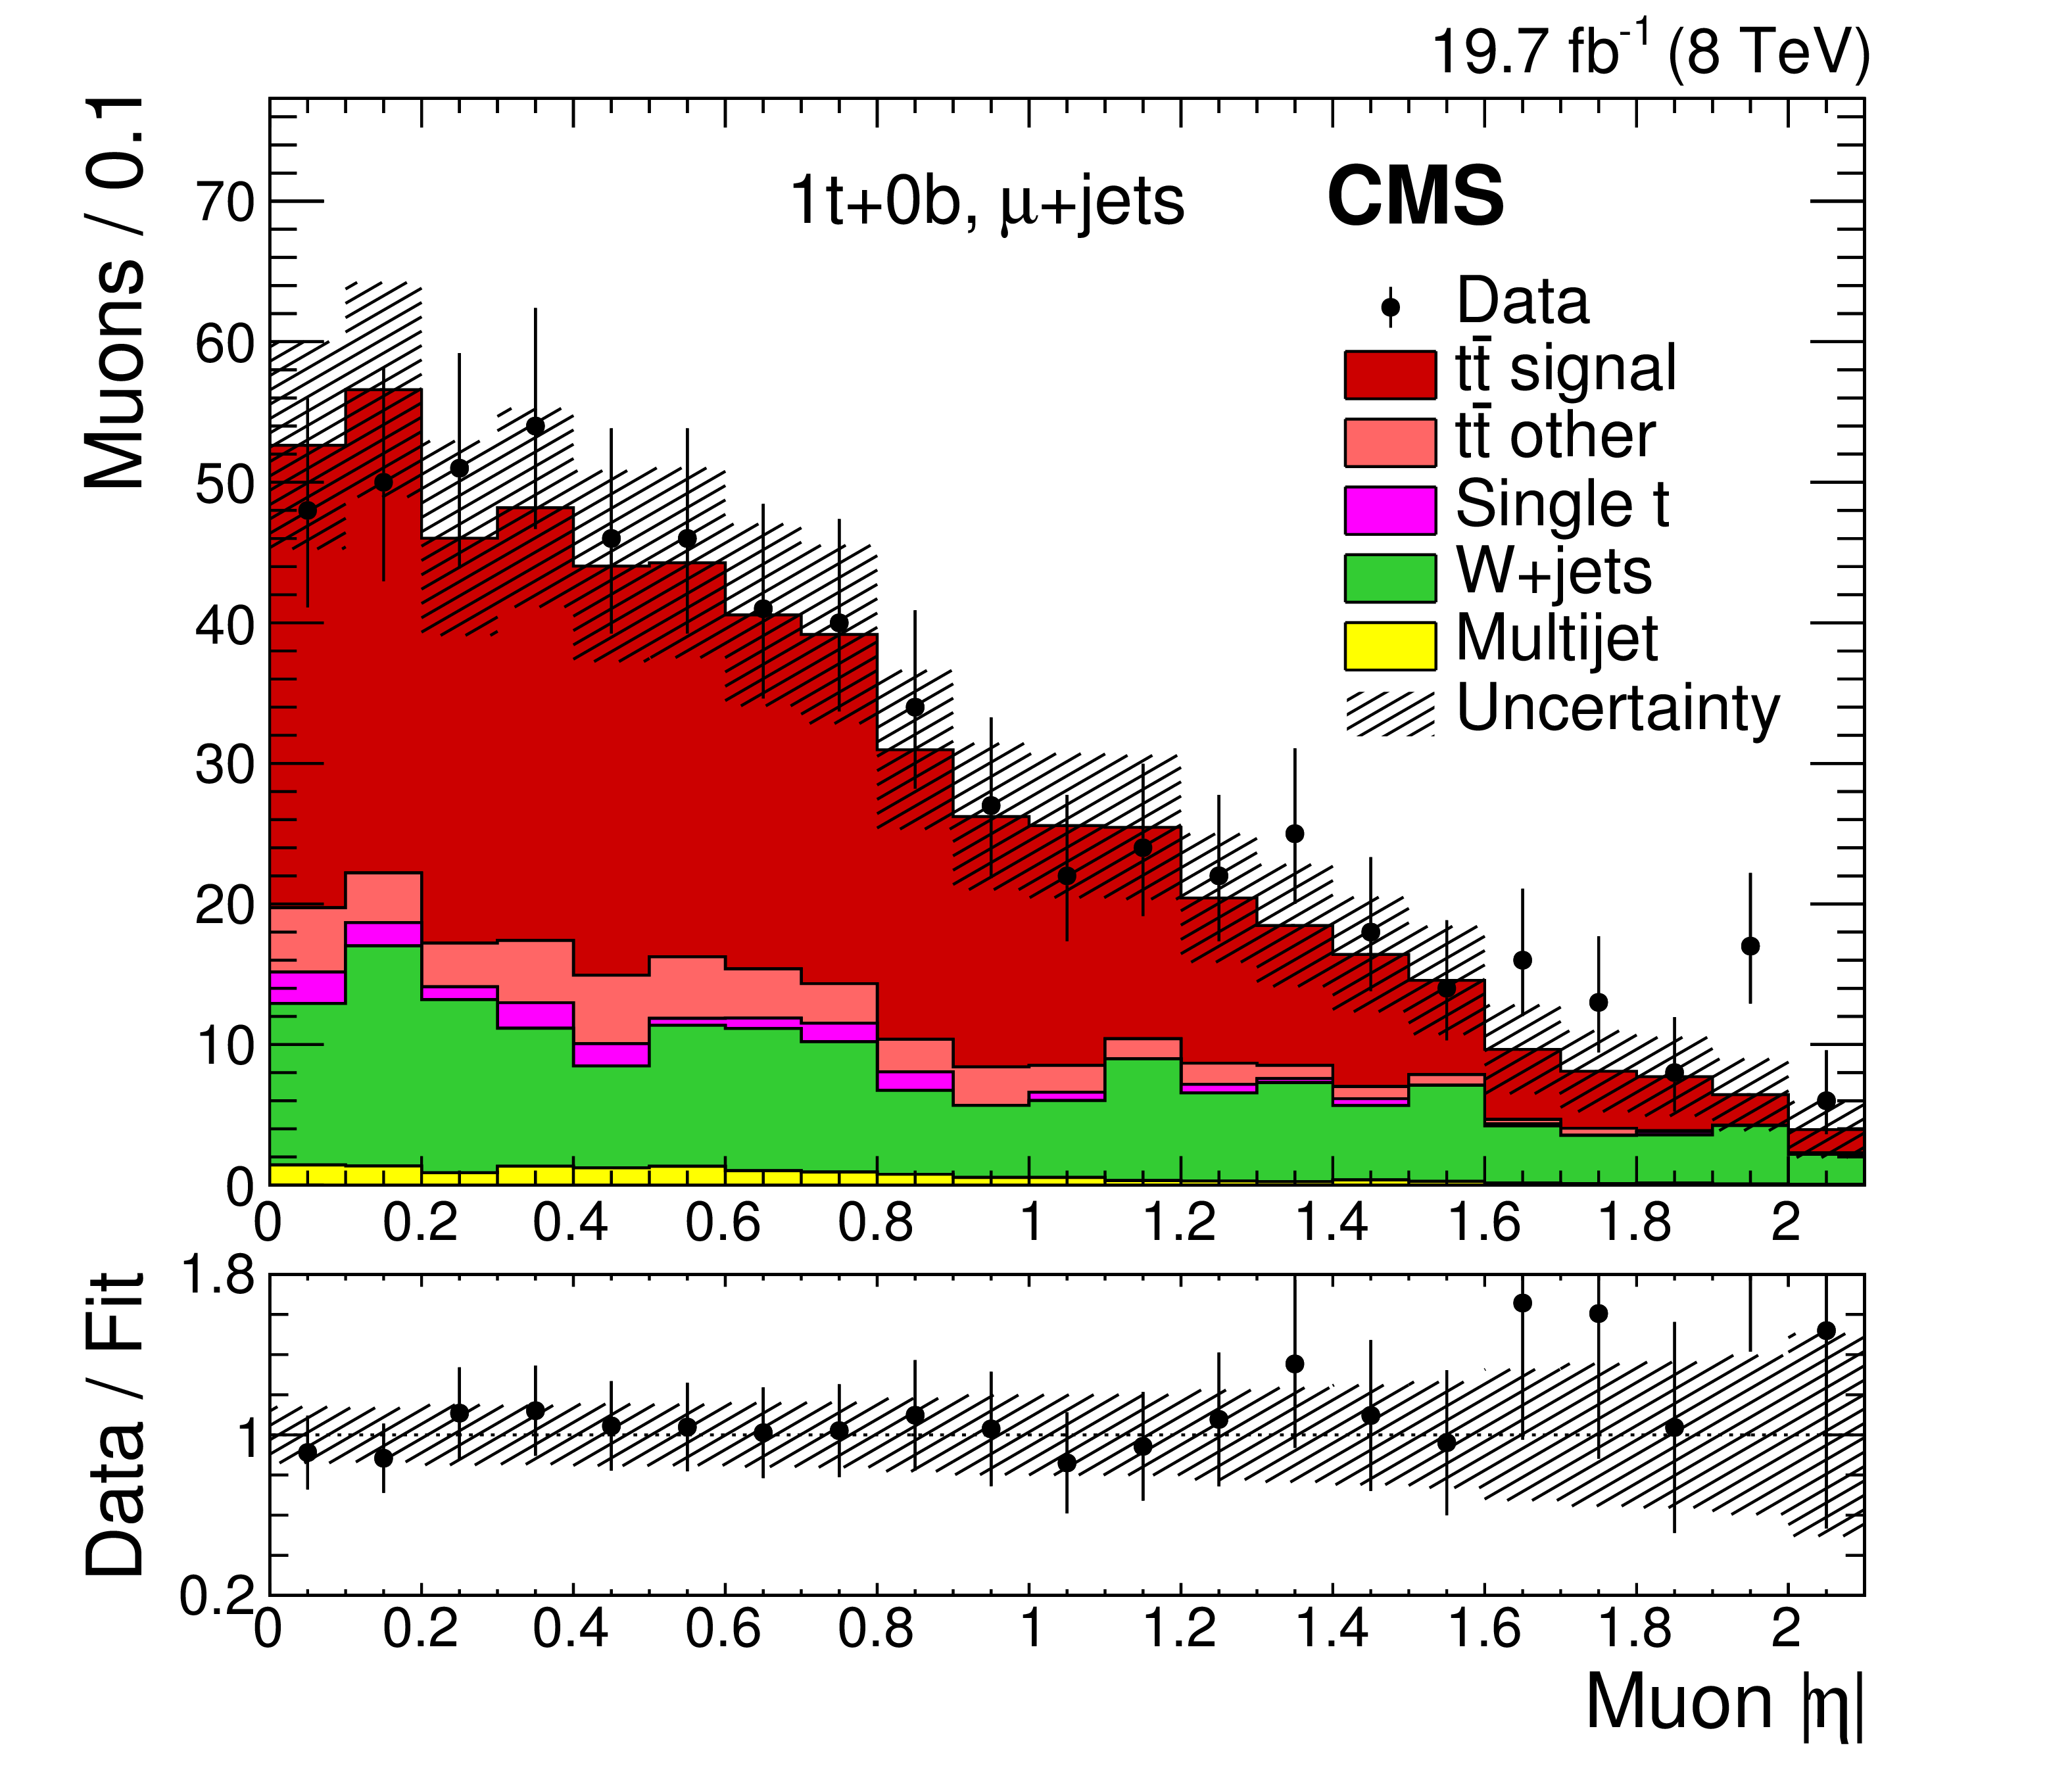
Figure 1-d:
Lepton $|\eta |$ and $m_{\rm vtx}$ distributions from data (points) and for signal and background sources (histograms) with normalizations from the fit for the 0t (a,b), 1t+0b (c,d), and 1t+1b (e,f) event categories, for the e+jets (a,c,e) and $\mu $+jets (b,d,f) channels. The vertical bars on the data points represent the statistical uncertainties. The shaded bands reflect the combined statistical and experimental systematic uncertainties after the fit to the signal and background yields, added in quadrature neglecting their correlations for presentational purposes. The ratios of data to the total fit are shown below each panel, along with the uncertainty band from the fit. |
png pdf |
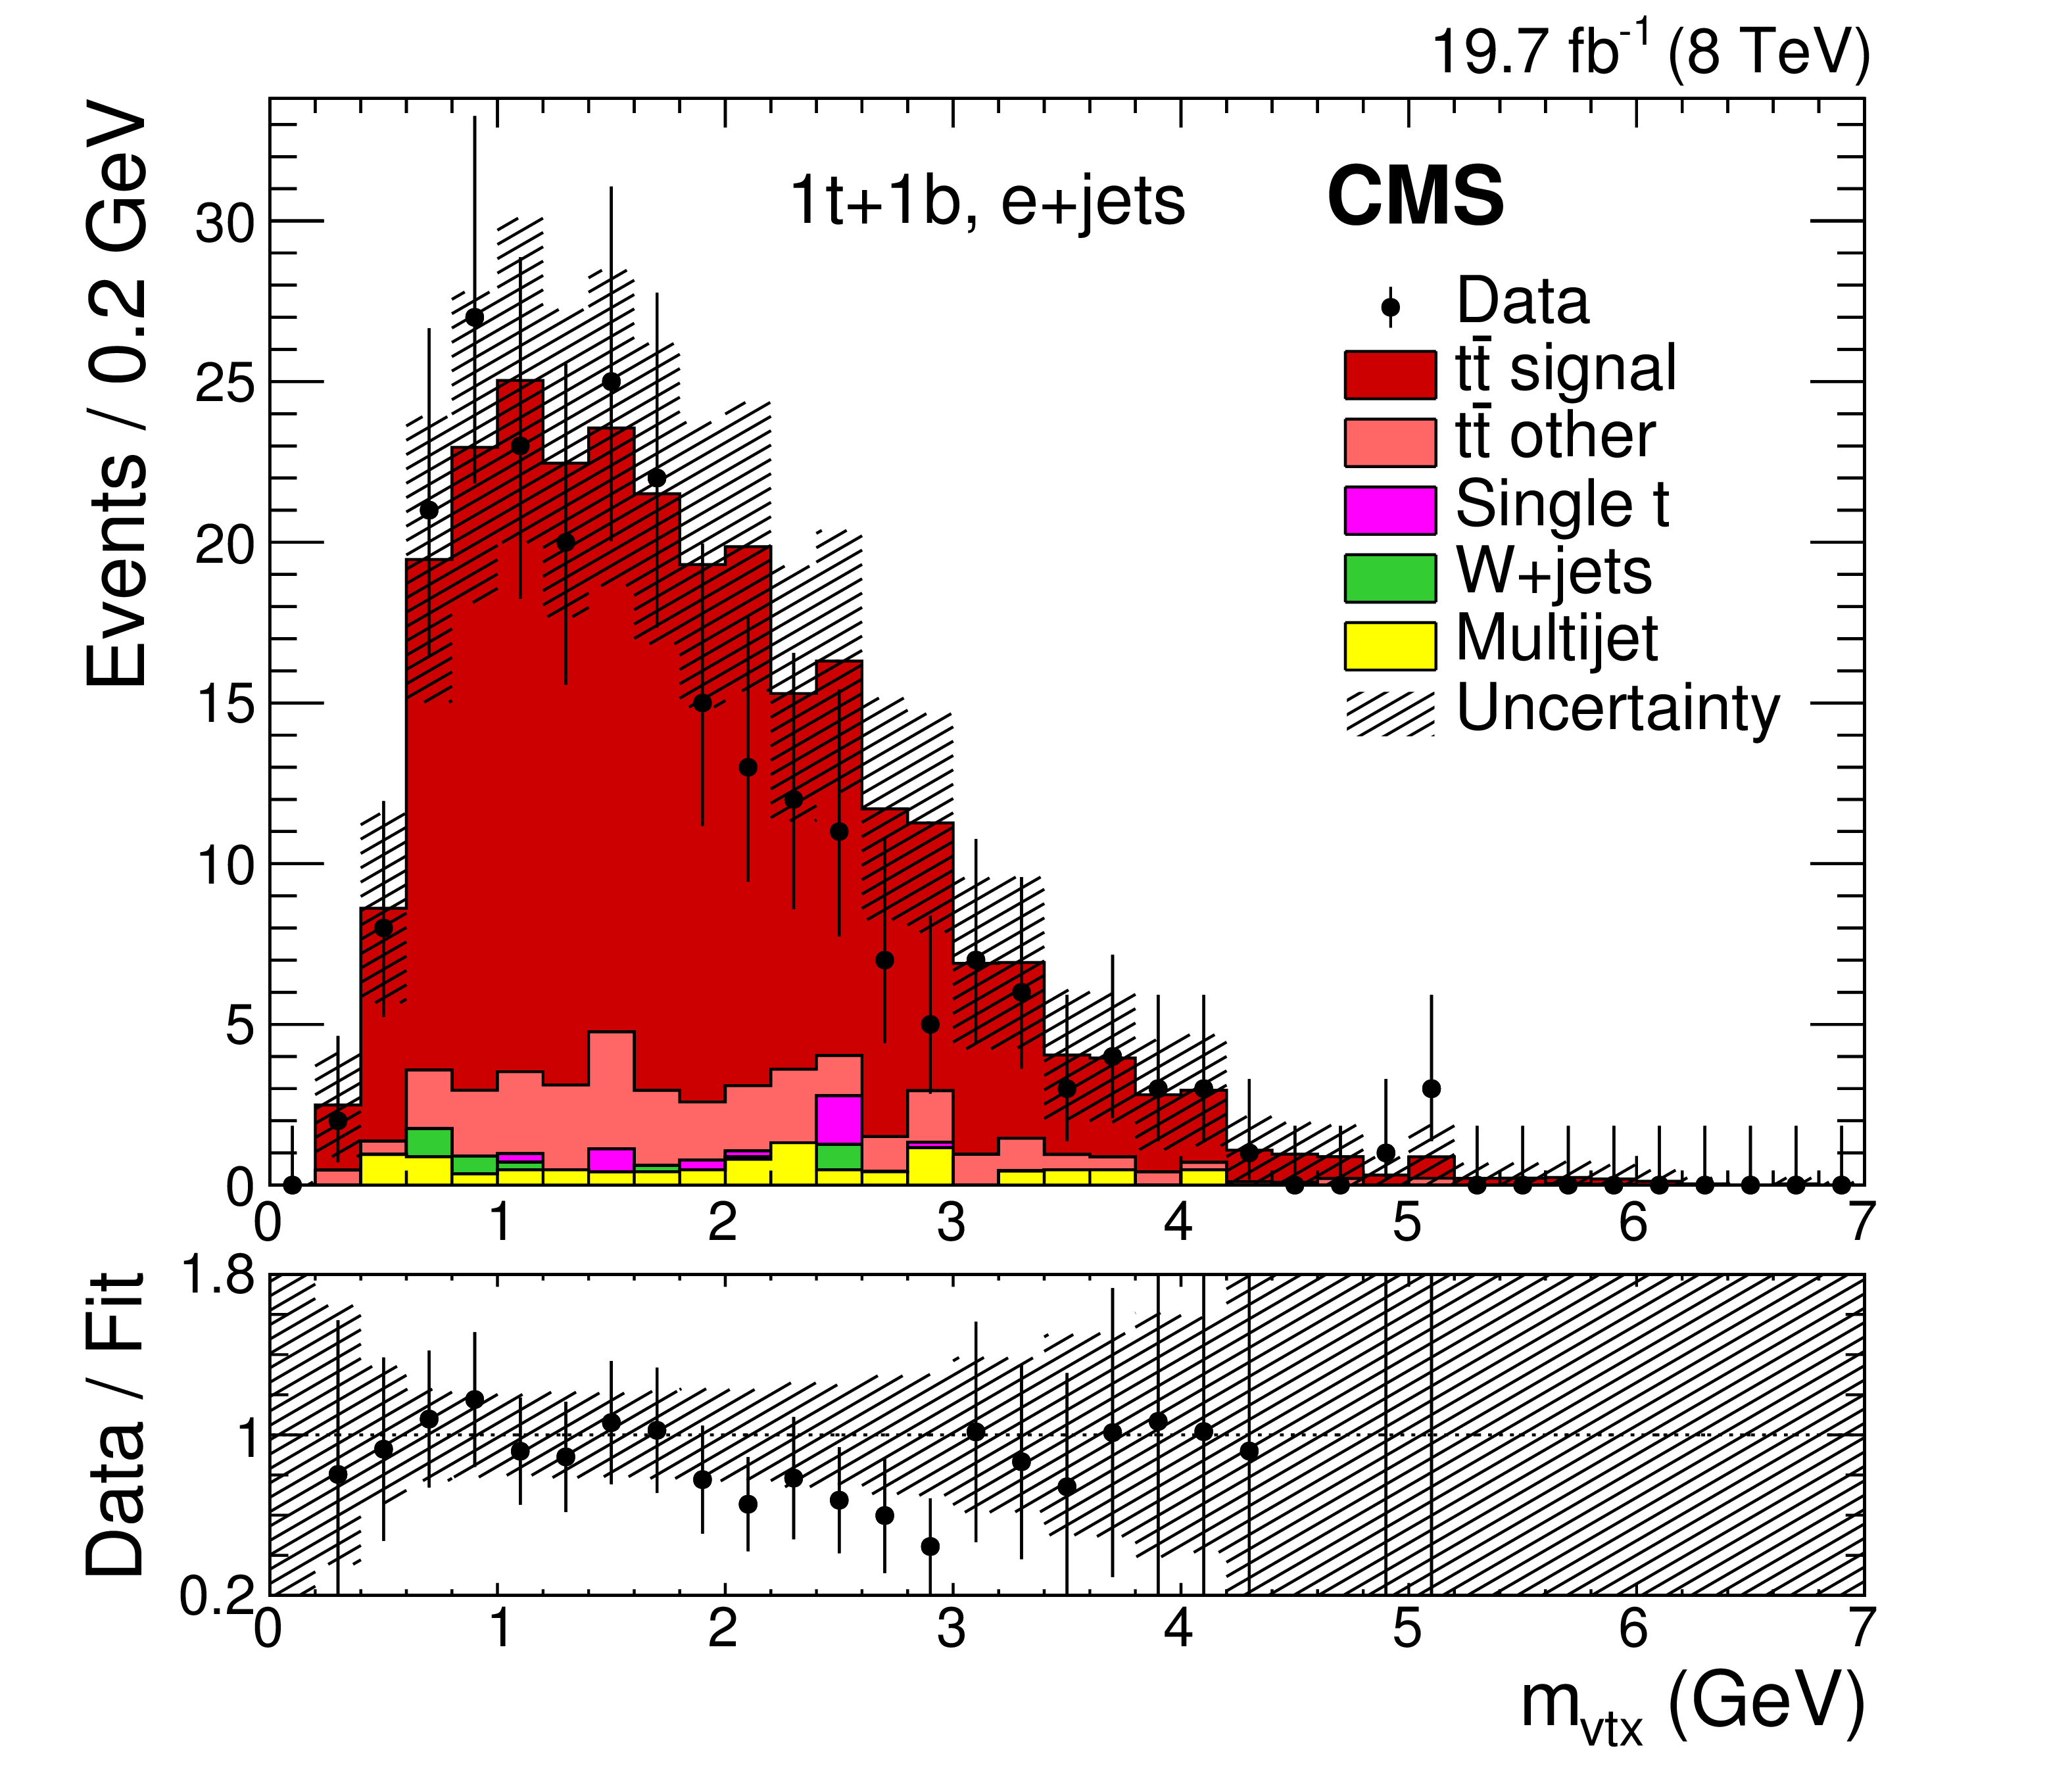
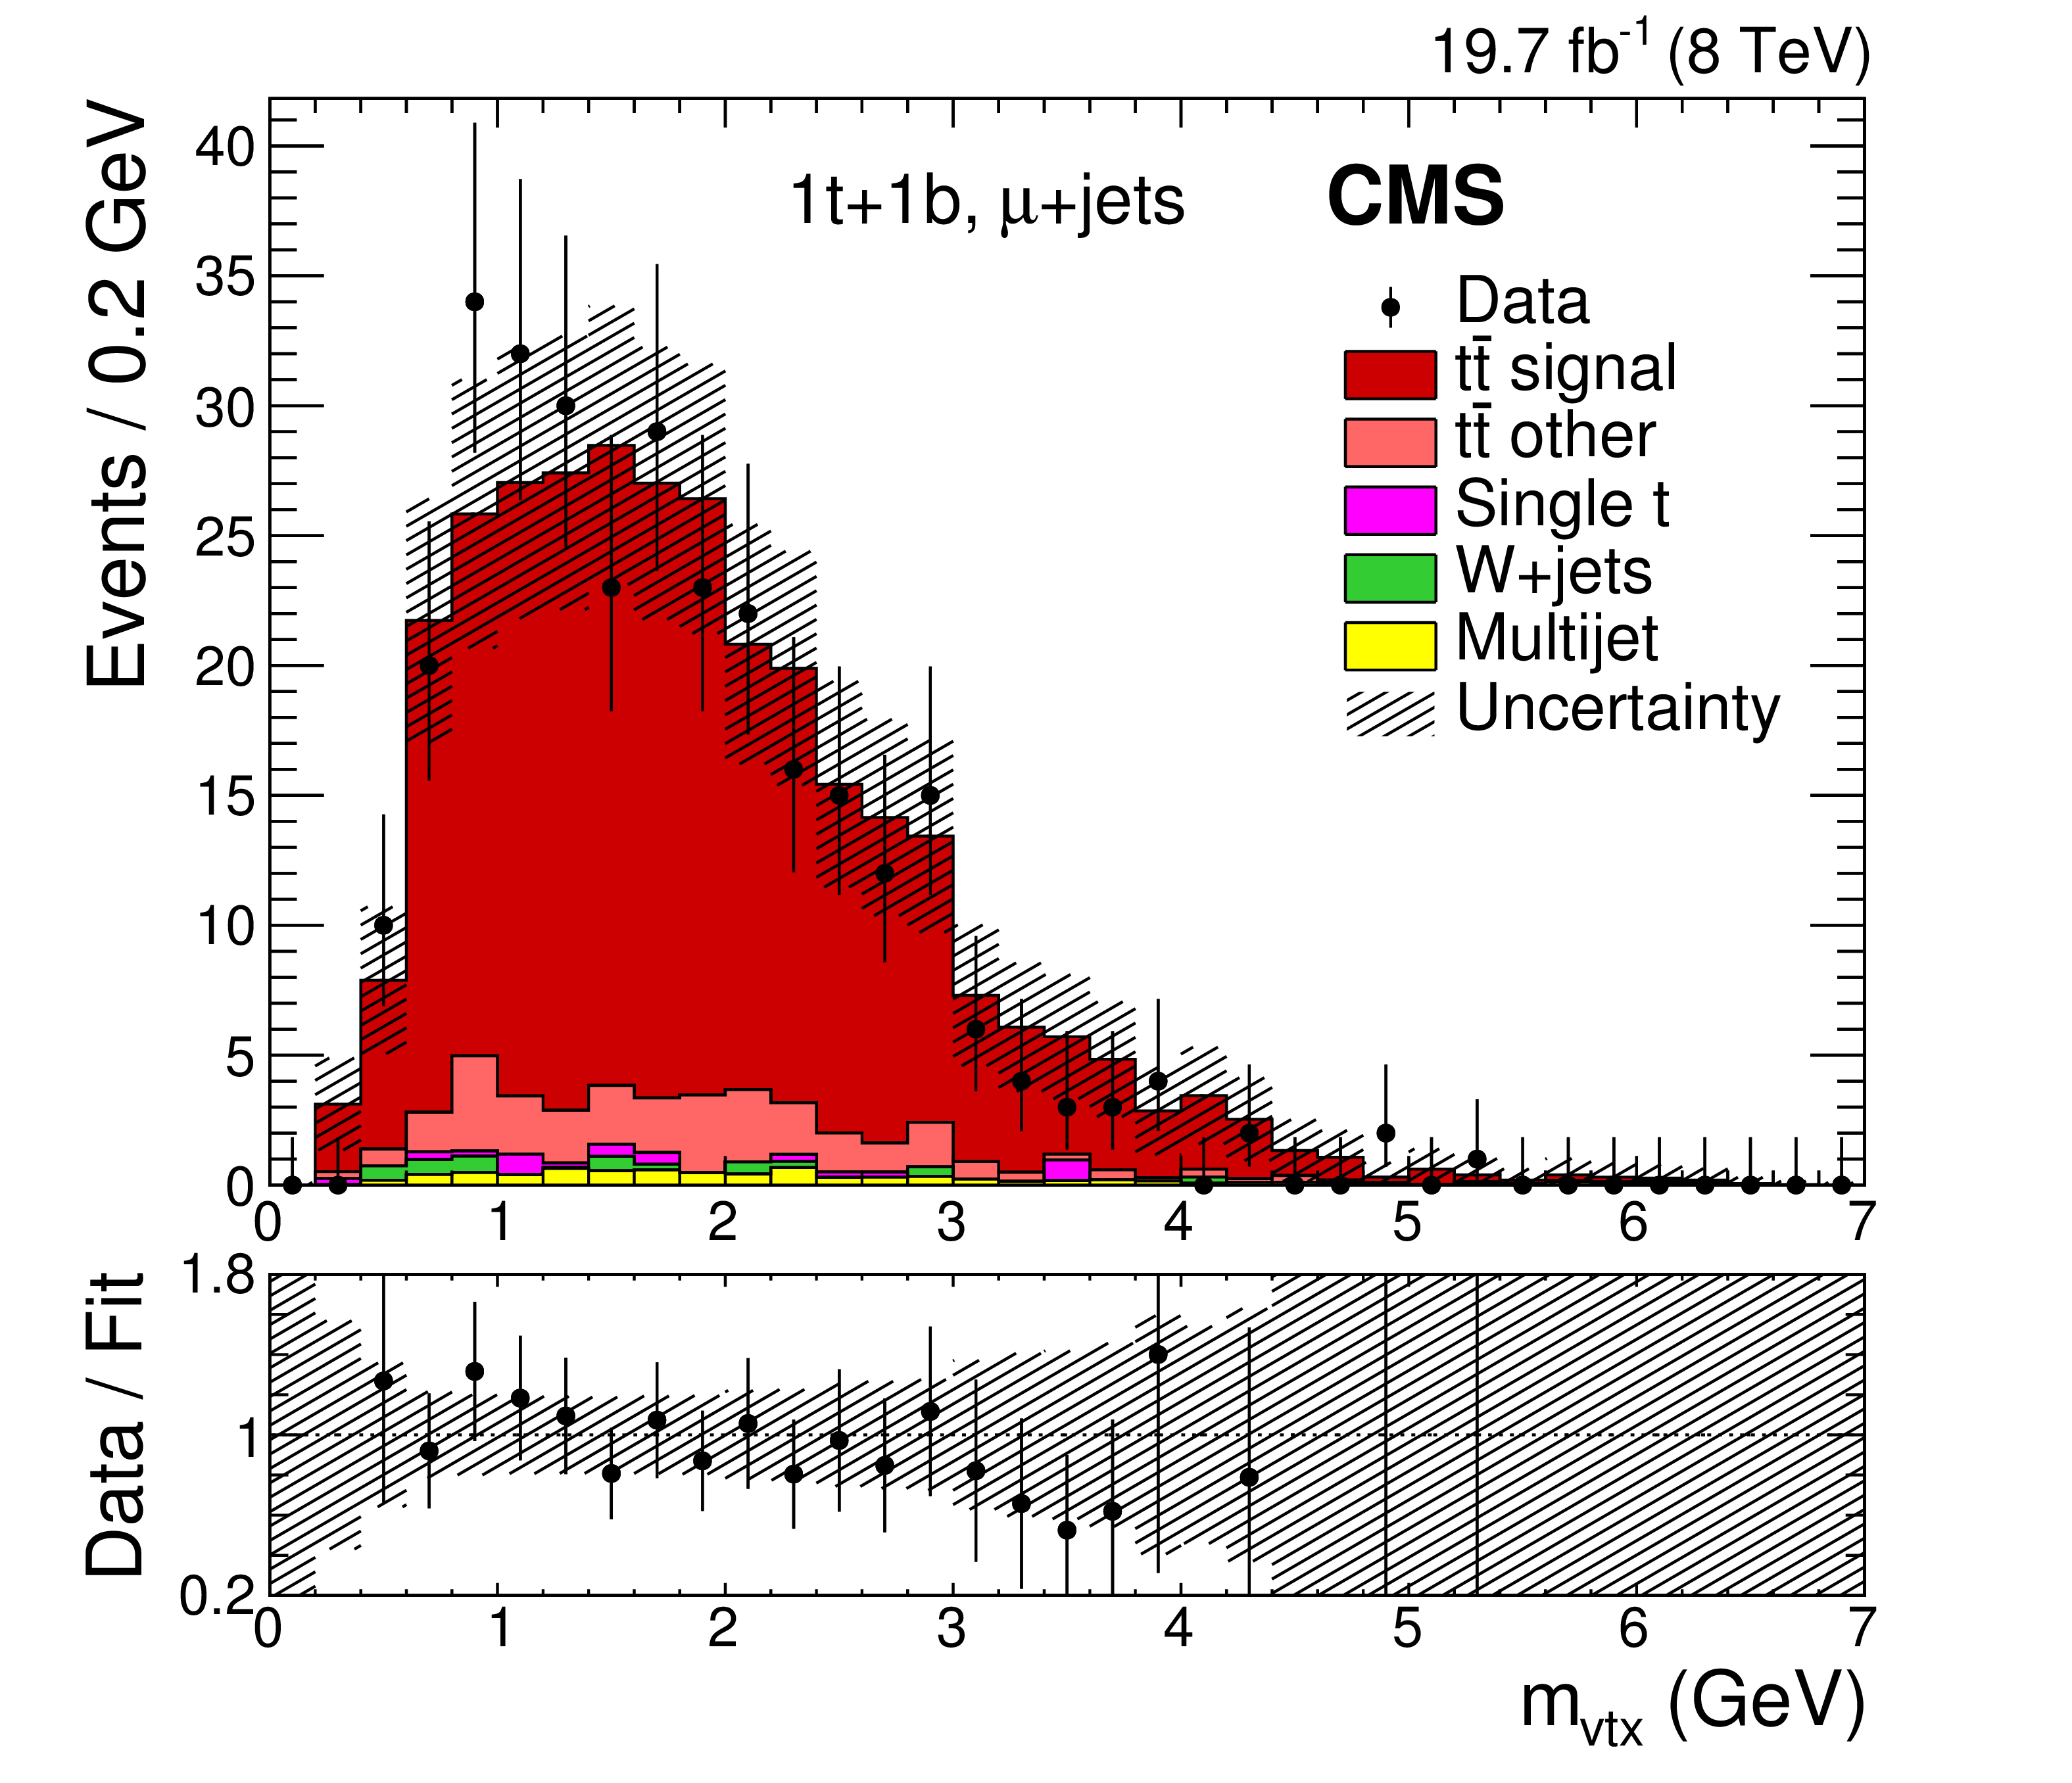
Figure 1-e:
Lepton $|\eta |$ and $m_{\rm vtx}$ distributions from data (points) and for signal and background sources (histograms) with normalizations from the fit for the 0t (a,b), 1t+0b (c,d), and 1t+1b (e,f) event categories, for the e+jets (a,c,e) and $\mu $+jets (b,d,f) channels. The vertical bars on the data points represent the statistical uncertainties. The shaded bands reflect the combined statistical and experimental systematic uncertainties after the fit to the signal and background yields, added in quadrature neglecting their correlations for presentational purposes. The ratios of data to the total fit are shown below each panel, along with the uncertainty band from the fit. |
png pdf |
Figure 1-f:
Lepton $|\eta |$ and $m_{\rm vtx}$ distributions from data (points) and for signal and background sources (histograms) with normalizations from the fit for the 0t (a,b), 1t+0b (c,d), and 1t+1b (e,f) event categories, for the e+jets (a,c,e) and $\mu $+jets (b,d,f) channels. The vertical bars on the data points represent the statistical uncertainties. The shaded bands reflect the combined statistical and experimental systematic uncertainties after the fit to the signal and background yields, added in quadrature neglecting their correlations for presentational purposes. The ratios of data to the total fit are shown below each panel, along with the uncertainty band from the fit. |
png pdf |
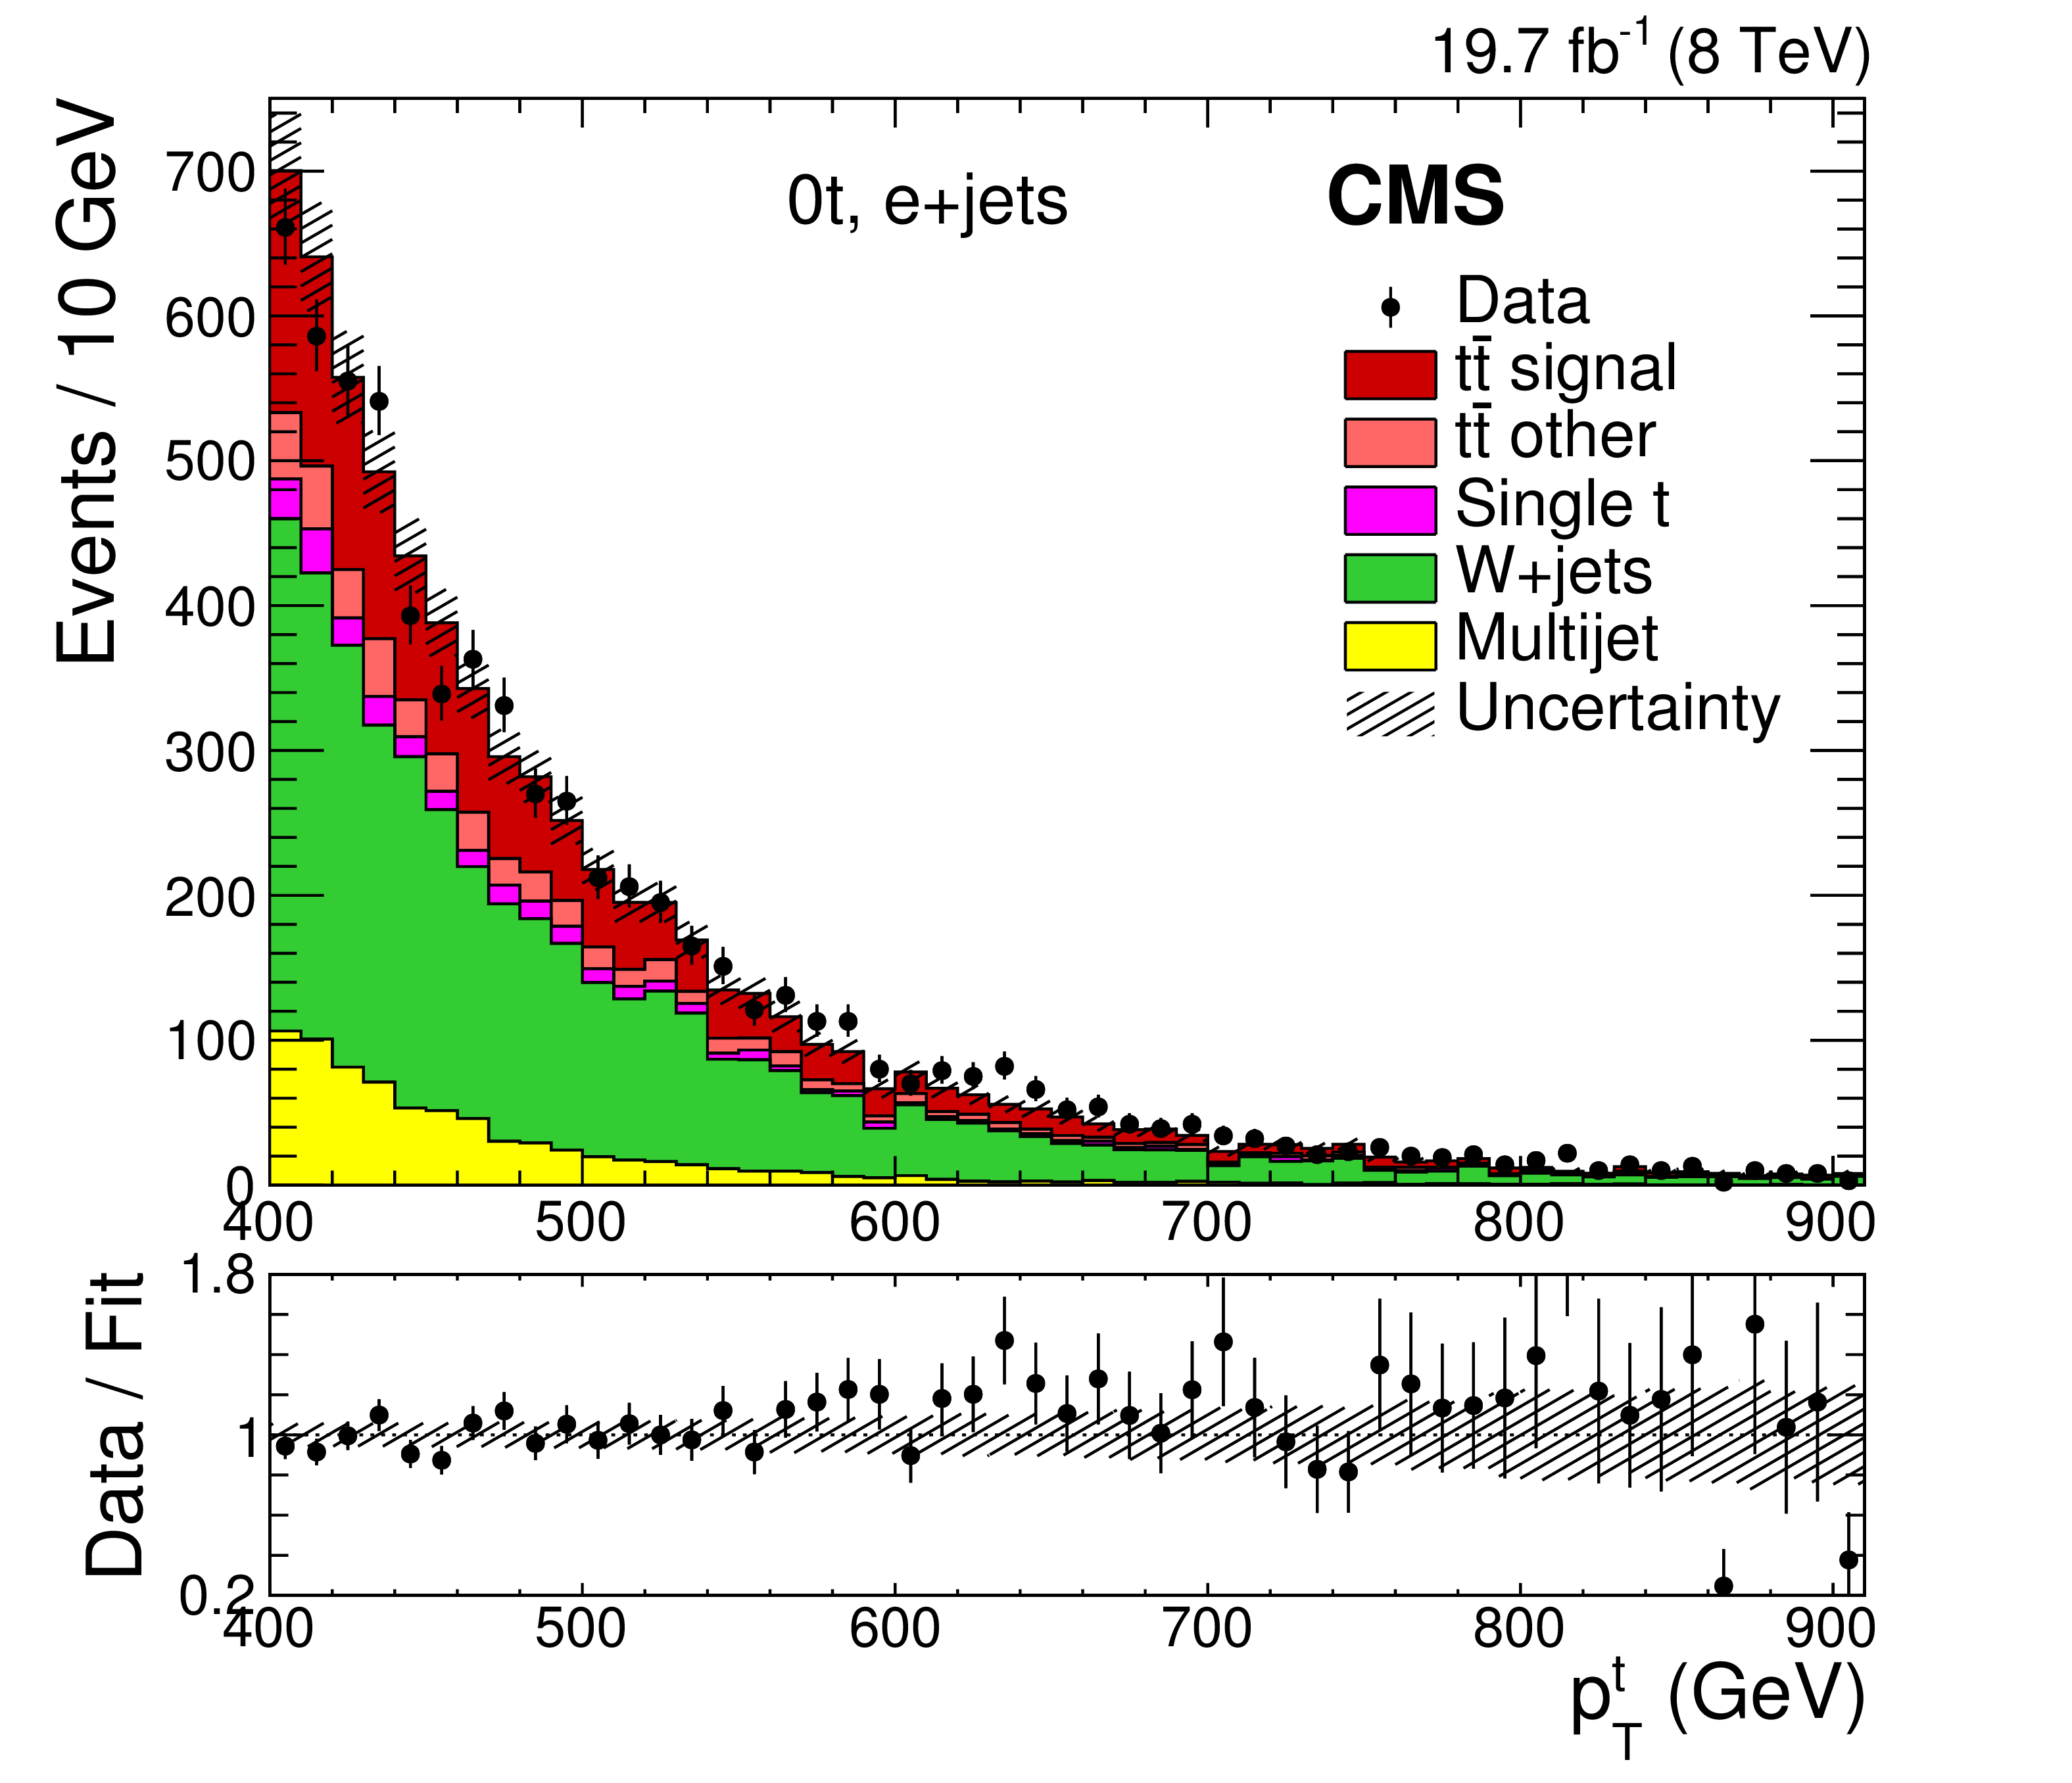
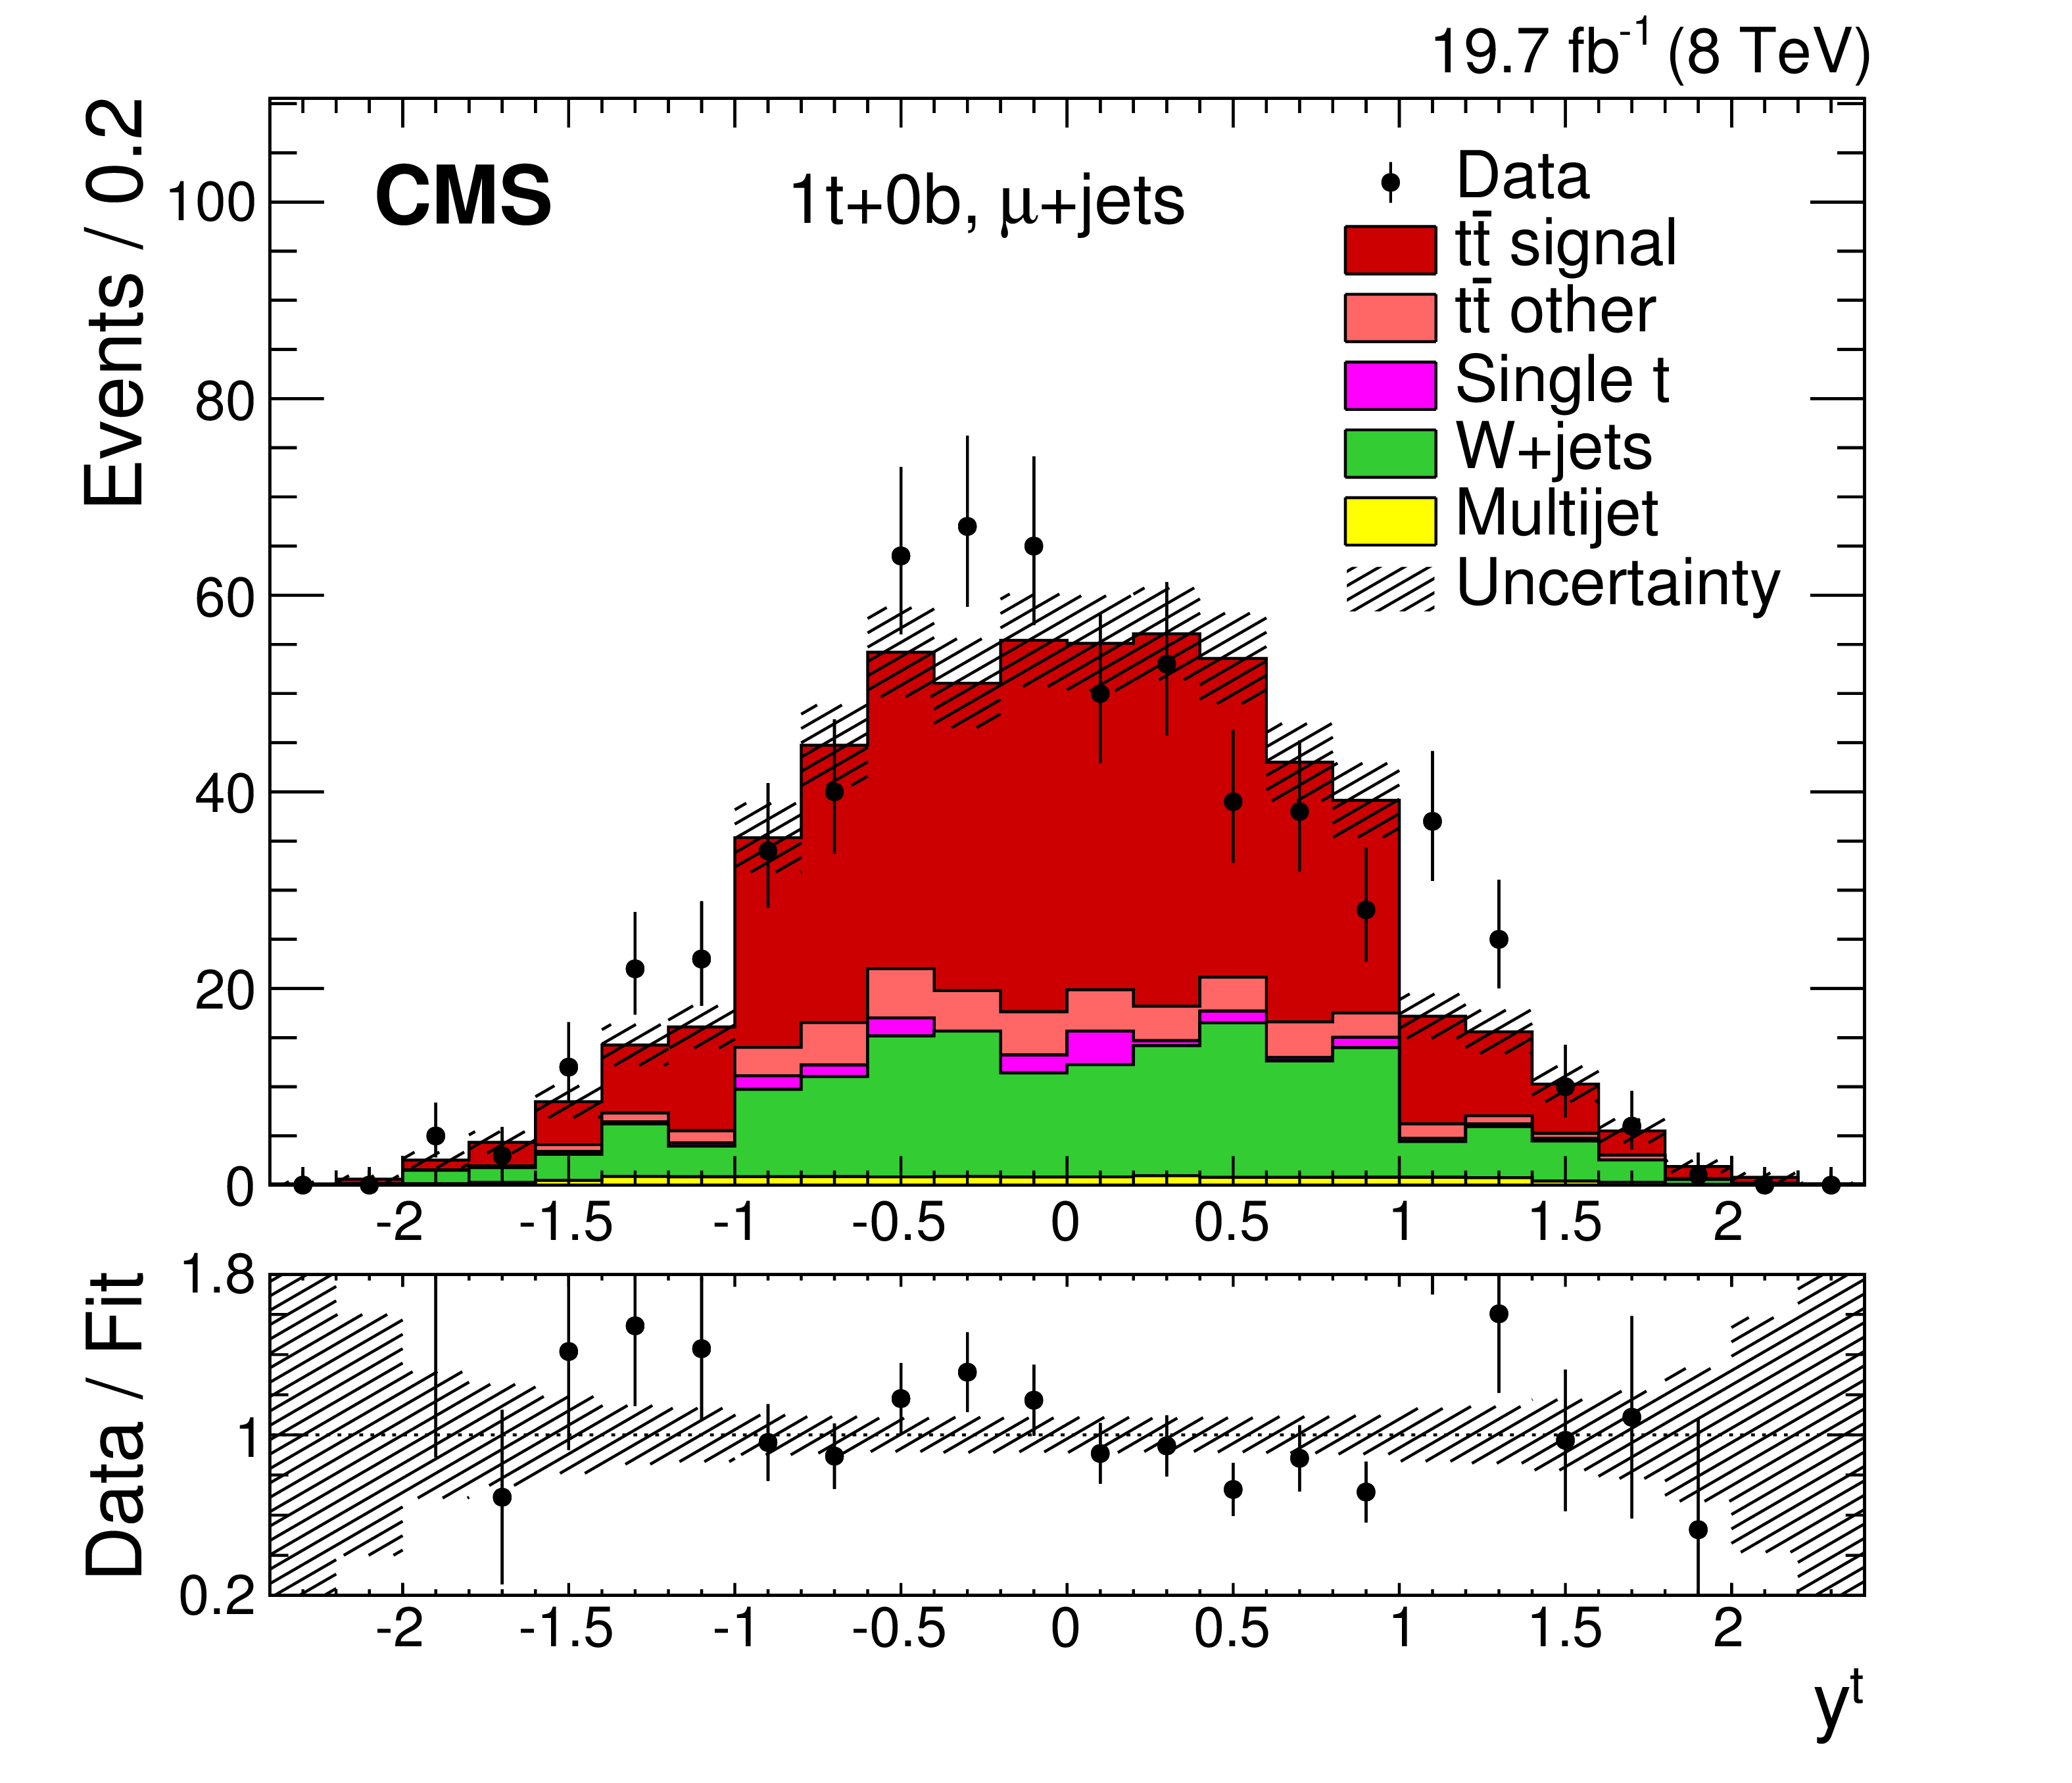
Figure 2-a:
Transverse momentum distribution of the hadronic-side, large-$R$ jet for the 0t (a,b), 1t+0b (c,d), and 1t+1b (e,f) event categories for the e+jets (a,c,e) and $\mu $+jets (b,d,f) channels. The data are compared to the total signal and background yields using normalizations from the maximum-likelihood fit. The vertical bars on the data points represent the statistical uncertainties. The shaded bands reflect the combination of the statistical and post-fit systematic uncertainties in the signal and background yields added in quadrature, without the uncertainties based on the form of the distributions, and neglecting their correlations for presentational purposes. The ratios of data to the total fit are shown below each panel, along with the uncertainty band from the fit. |
png pdf |
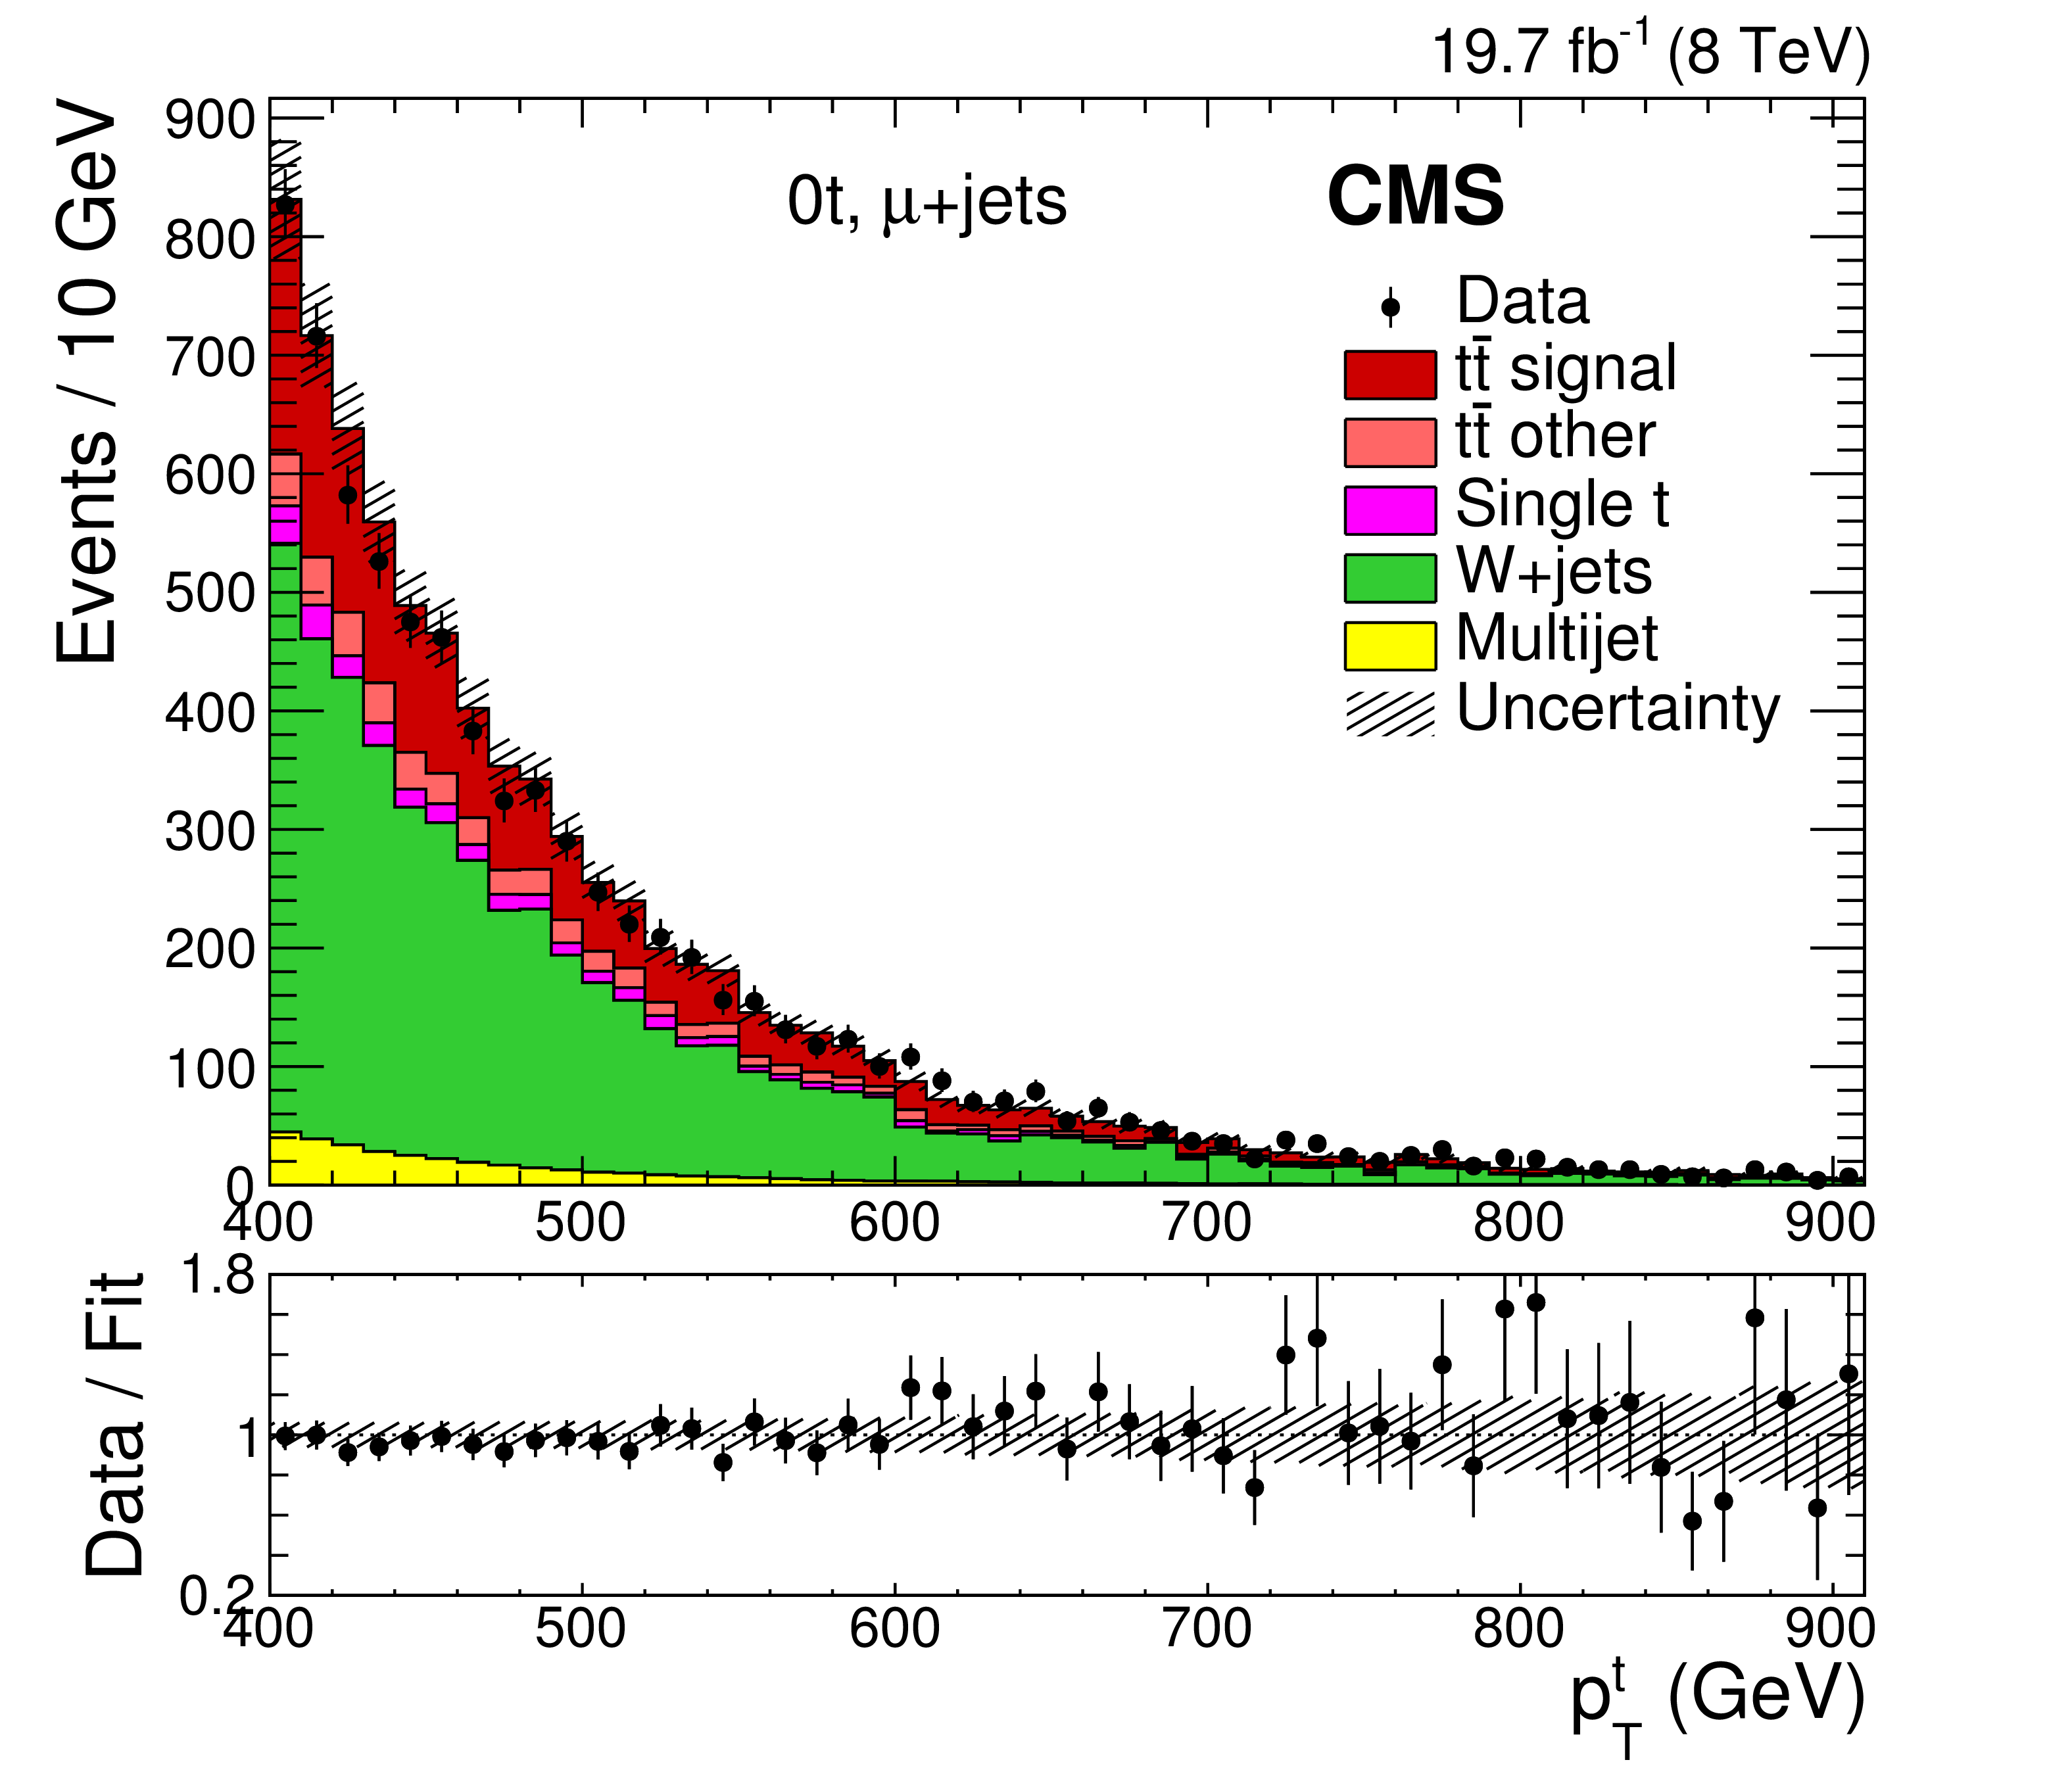
Figure 2-b:
Transverse momentum distribution of the hadronic-side, large-$R$ jet for the 0t (a,b), 1t+0b (c,d), and 1t+1b (e,f) event categories for the e+jets (a,c,e) and $\mu $+jets (b,d,f) channels. The data are compared to the total signal and background yields using normalizations from the maximum-likelihood fit. The vertical bars on the data points represent the statistical uncertainties. The shaded bands reflect the combination of the statistical and post-fit systematic uncertainties in the signal and background yields added in quadrature, without the uncertainties based on the form of the distributions, and neglecting their correlations for presentational purposes. The ratios of data to the total fit are shown below each panel, along with the uncertainty band from the fit. |
png pdf |
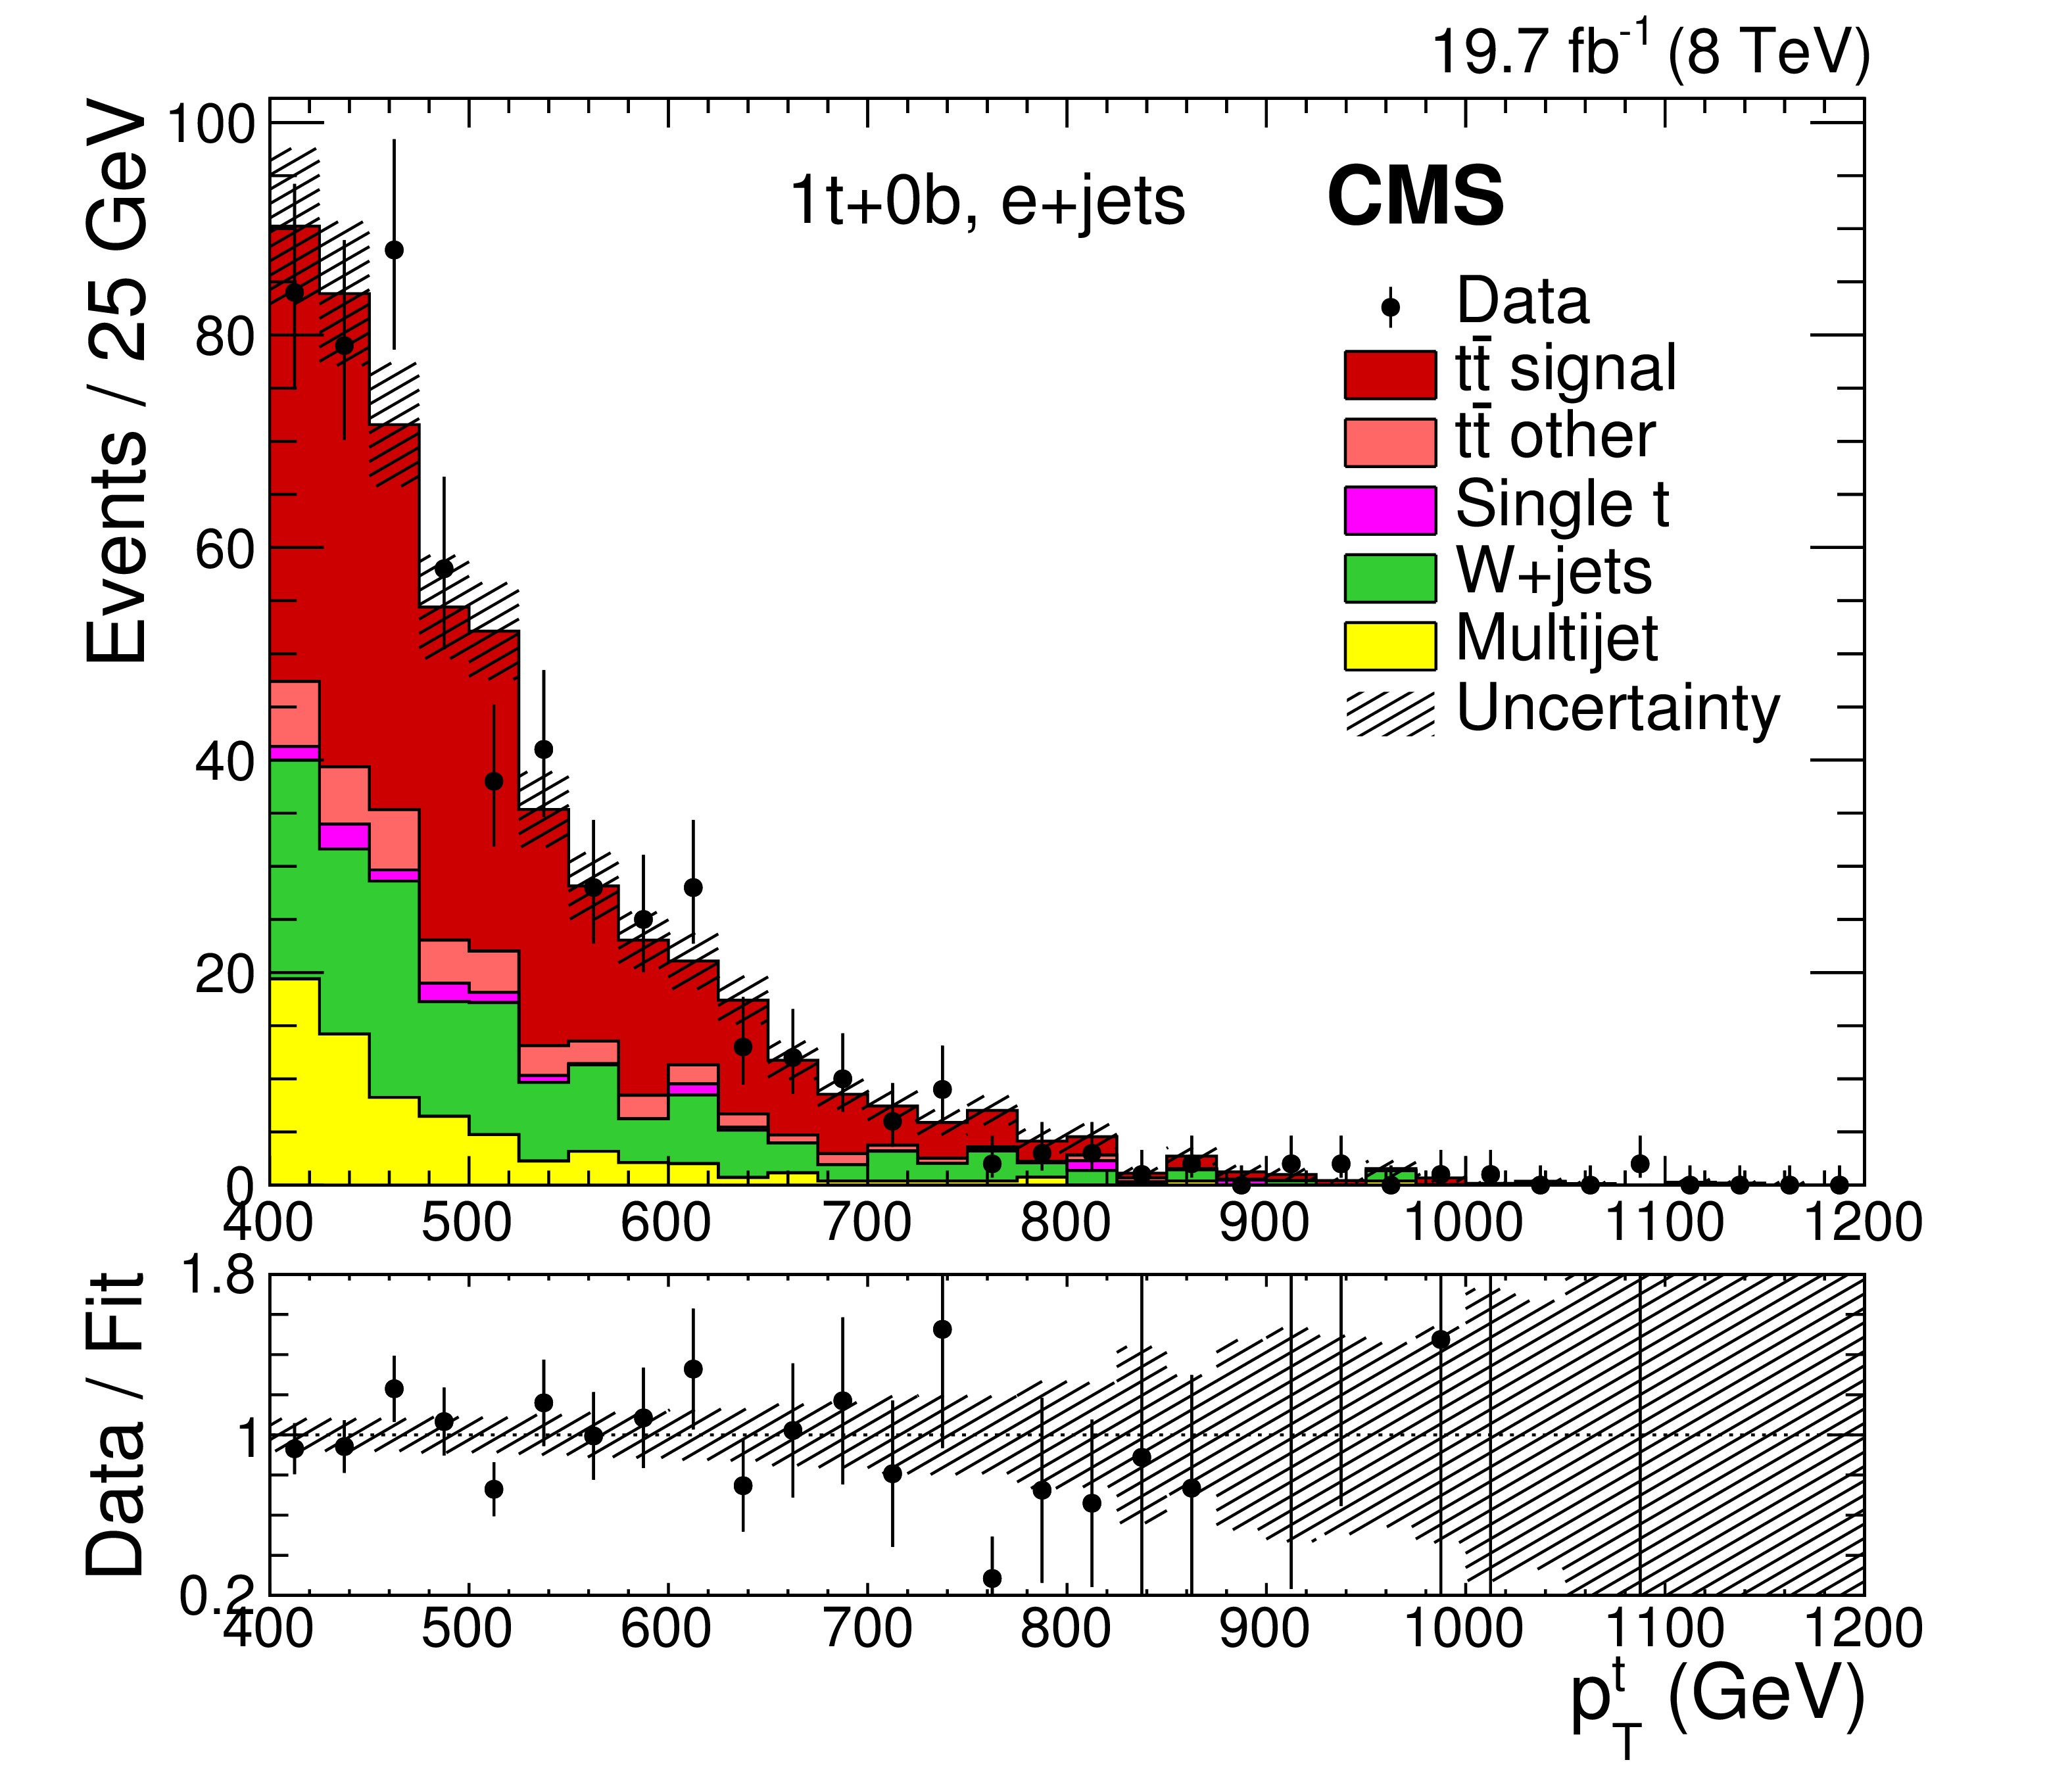
Figure 2-c:
Transverse momentum distribution of the hadronic-side, large-$R$ jet for the 0t (a,b), 1t+0b (c,d), and 1t+1b (e,f) event categories for the e+jets (a,c,e) and $\mu $+jets (b,d,f) channels. The data are compared to the total signal and background yields using normalizations from the maximum-likelihood fit. The vertical bars on the data points represent the statistical uncertainties. The shaded bands reflect the combination of the statistical and post-fit systematic uncertainties in the signal and background yields added in quadrature, without the uncertainties based on the form of the distributions, and neglecting their correlations for presentational purposes. The ratios of data to the total fit are shown below each panel, along with the uncertainty band from the fit. |

png pdf |
Figure 2-d:
Transverse momentum distribution of the hadronic-side, large-$R$ jet for the 0t (a,b), 1t+0b (c,d), and 1t+1b (e,f) event categories for the e+jets (a,c,e) and $\mu $+jets (b,d,f) channels. The data are compared to the total signal and background yields using normalizations from the maximum-likelihood fit. The vertical bars on the data points represent the statistical uncertainties. The shaded bands reflect the combination of the statistical and post-fit systematic uncertainties in the signal and background yields added in quadrature, without the uncertainties based on the form of the distributions, and neglecting their correlations for presentational purposes. The ratios of data to the total fit are shown below each panel, along with the uncertainty band from the fit. |
png pdf |
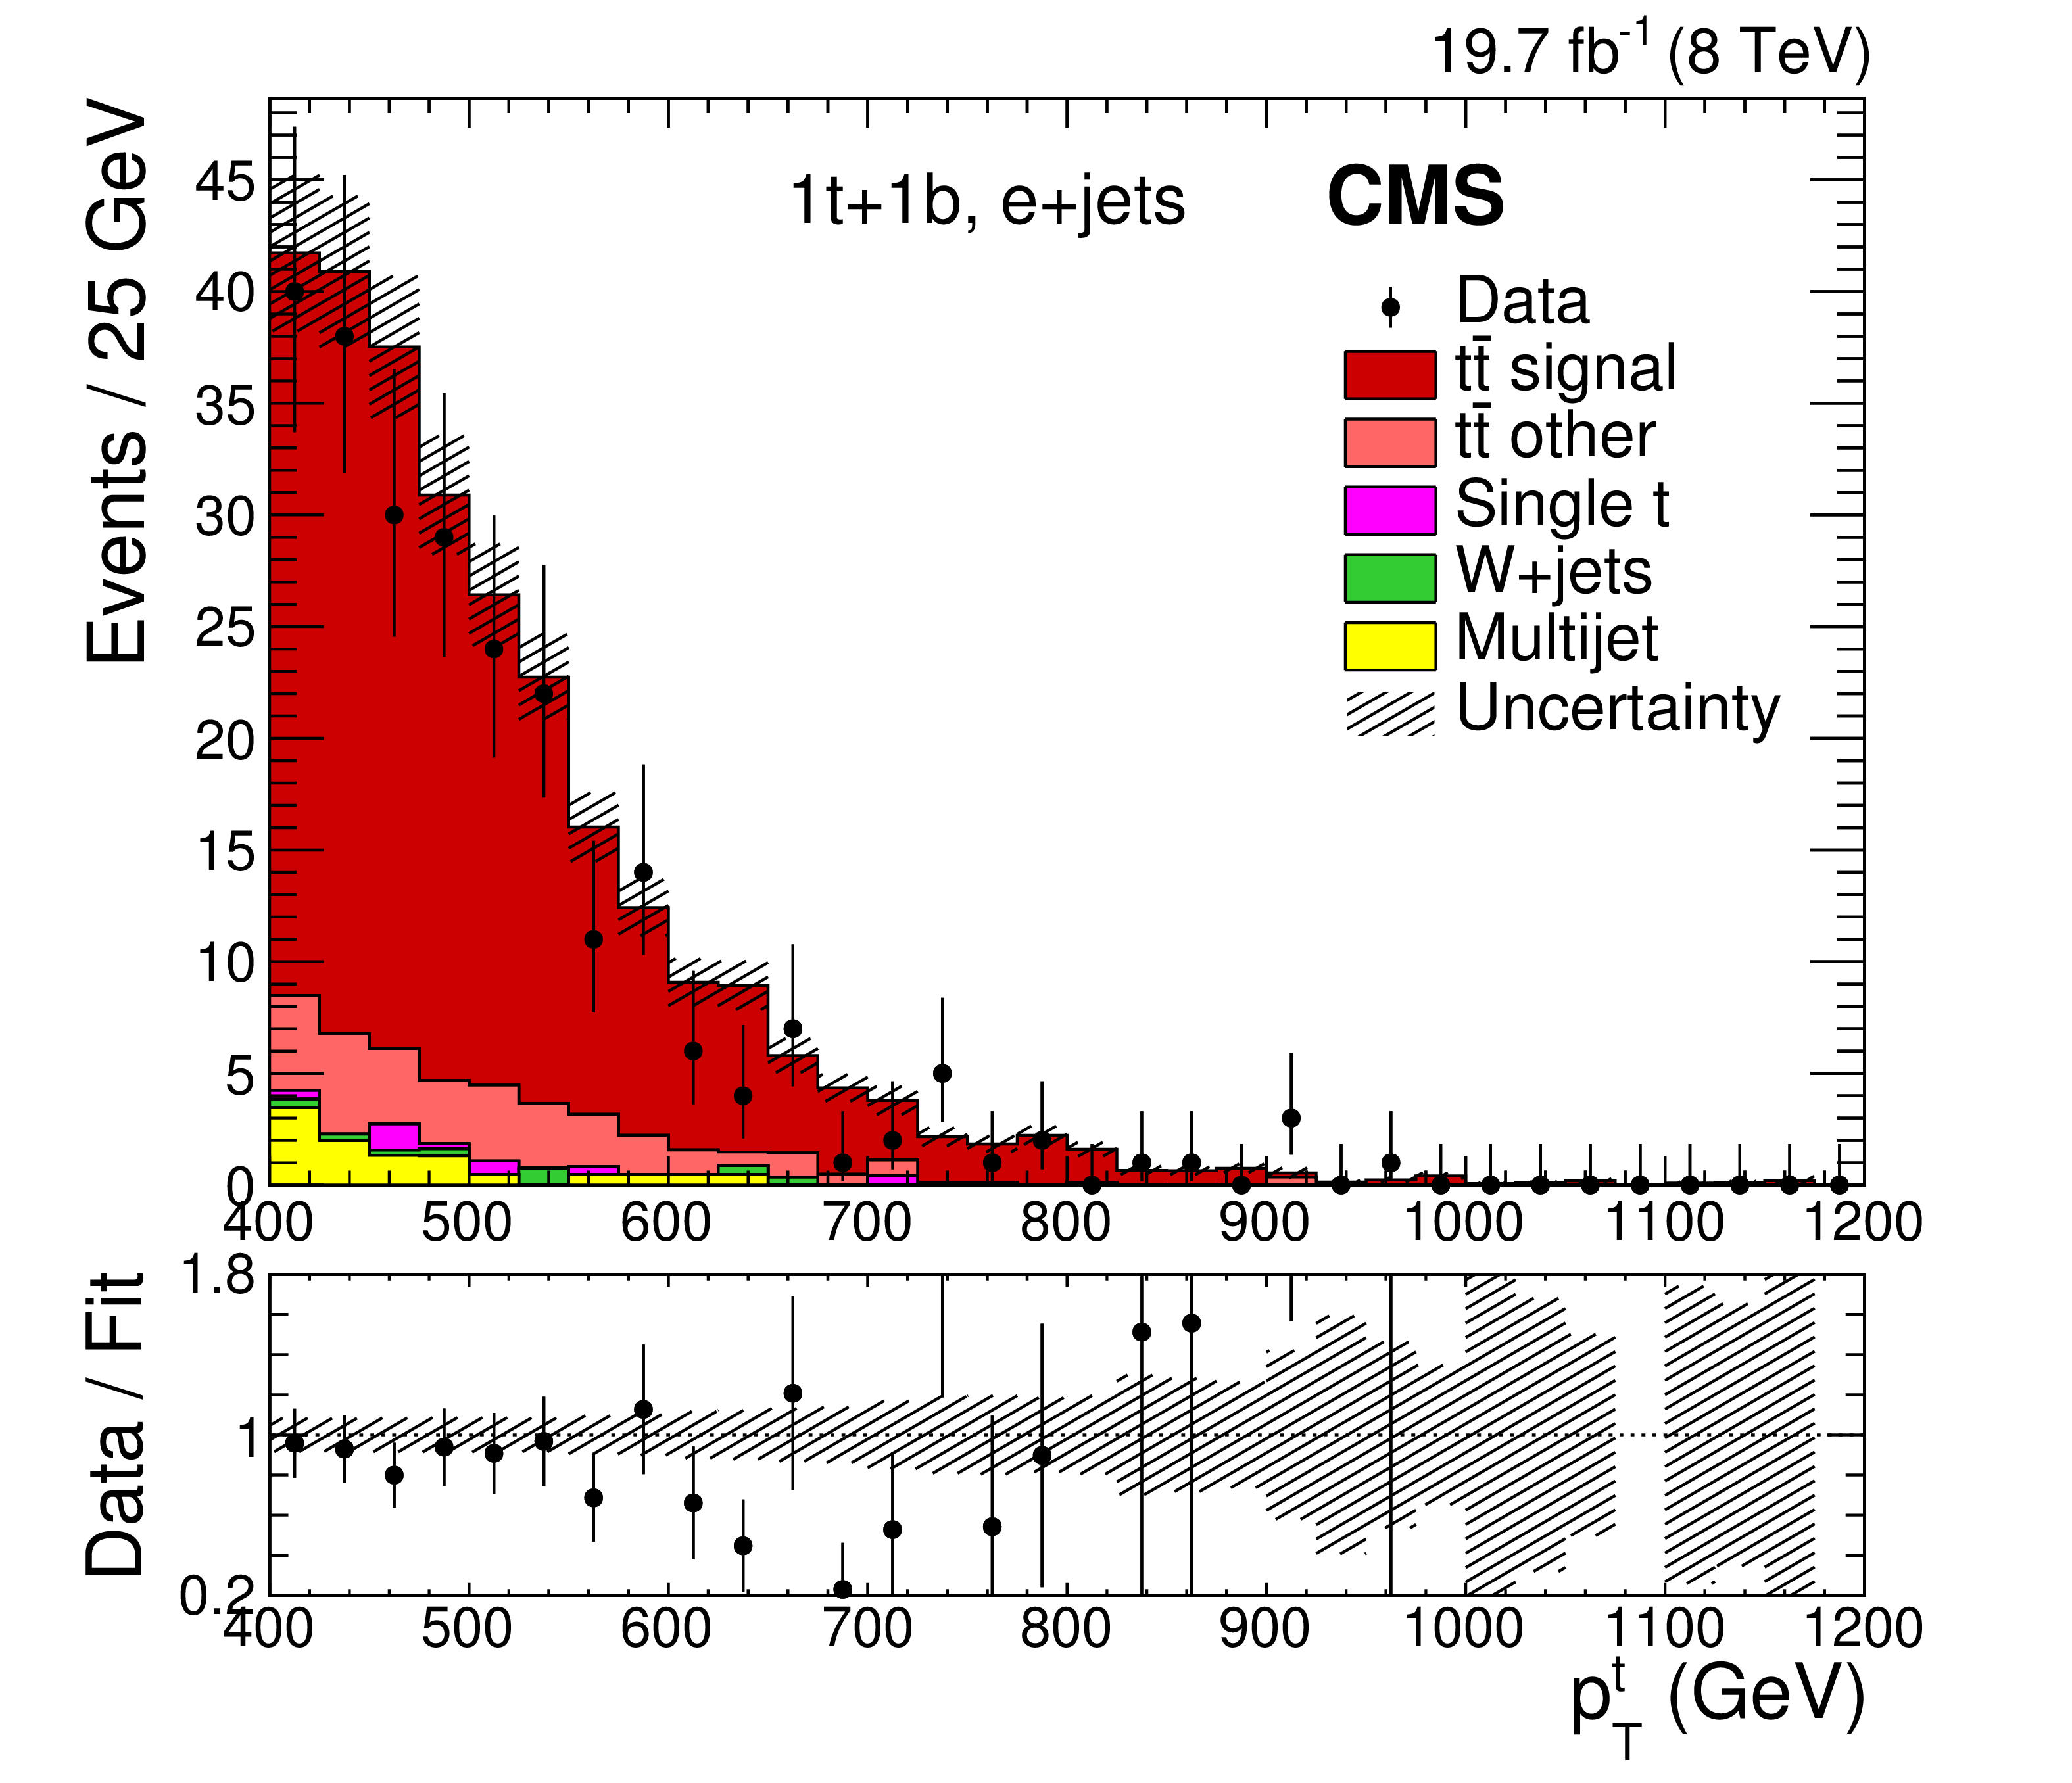
Figure 2-e:
Transverse momentum distribution of the hadronic-side, large-$R$ jet for the 0t (a,b), 1t+0b (c,d), and 1t+1b (e,f) event categories for the e+jets (a,c,e) and $\mu $+jets (b,d,f) channels. The data are compared to the total signal and background yields using normalizations from the maximum-likelihood fit. The vertical bars on the data points represent the statistical uncertainties. The shaded bands reflect the combination of the statistical and post-fit systematic uncertainties in the signal and background yields added in quadrature, without the uncertainties based on the form of the distributions, and neglecting their correlations for presentational purposes. The ratios of data to the total fit are shown below each panel, along with the uncertainty band from the fit. |

png pdf |
Figure 2-f:
Transverse momentum distribution of the hadronic-side, large-$R$ jet for the 0t (a,b), 1t+0b (c,d), and 1t+1b (e,f) event categories for the e+jets (a,c,e) and $\mu $+jets (b,d,f) channels. The data are compared to the total signal and background yields using normalizations from the maximum-likelihood fit. The vertical bars on the data points represent the statistical uncertainties. The shaded bands reflect the combination of the statistical and post-fit systematic uncertainties in the signal and background yields added in quadrature, without the uncertainties based on the form of the distributions, and neglecting their correlations for presentational purposes. The ratios of data to the total fit are shown below each panel, along with the uncertainty band from the fit. |
png pdf |
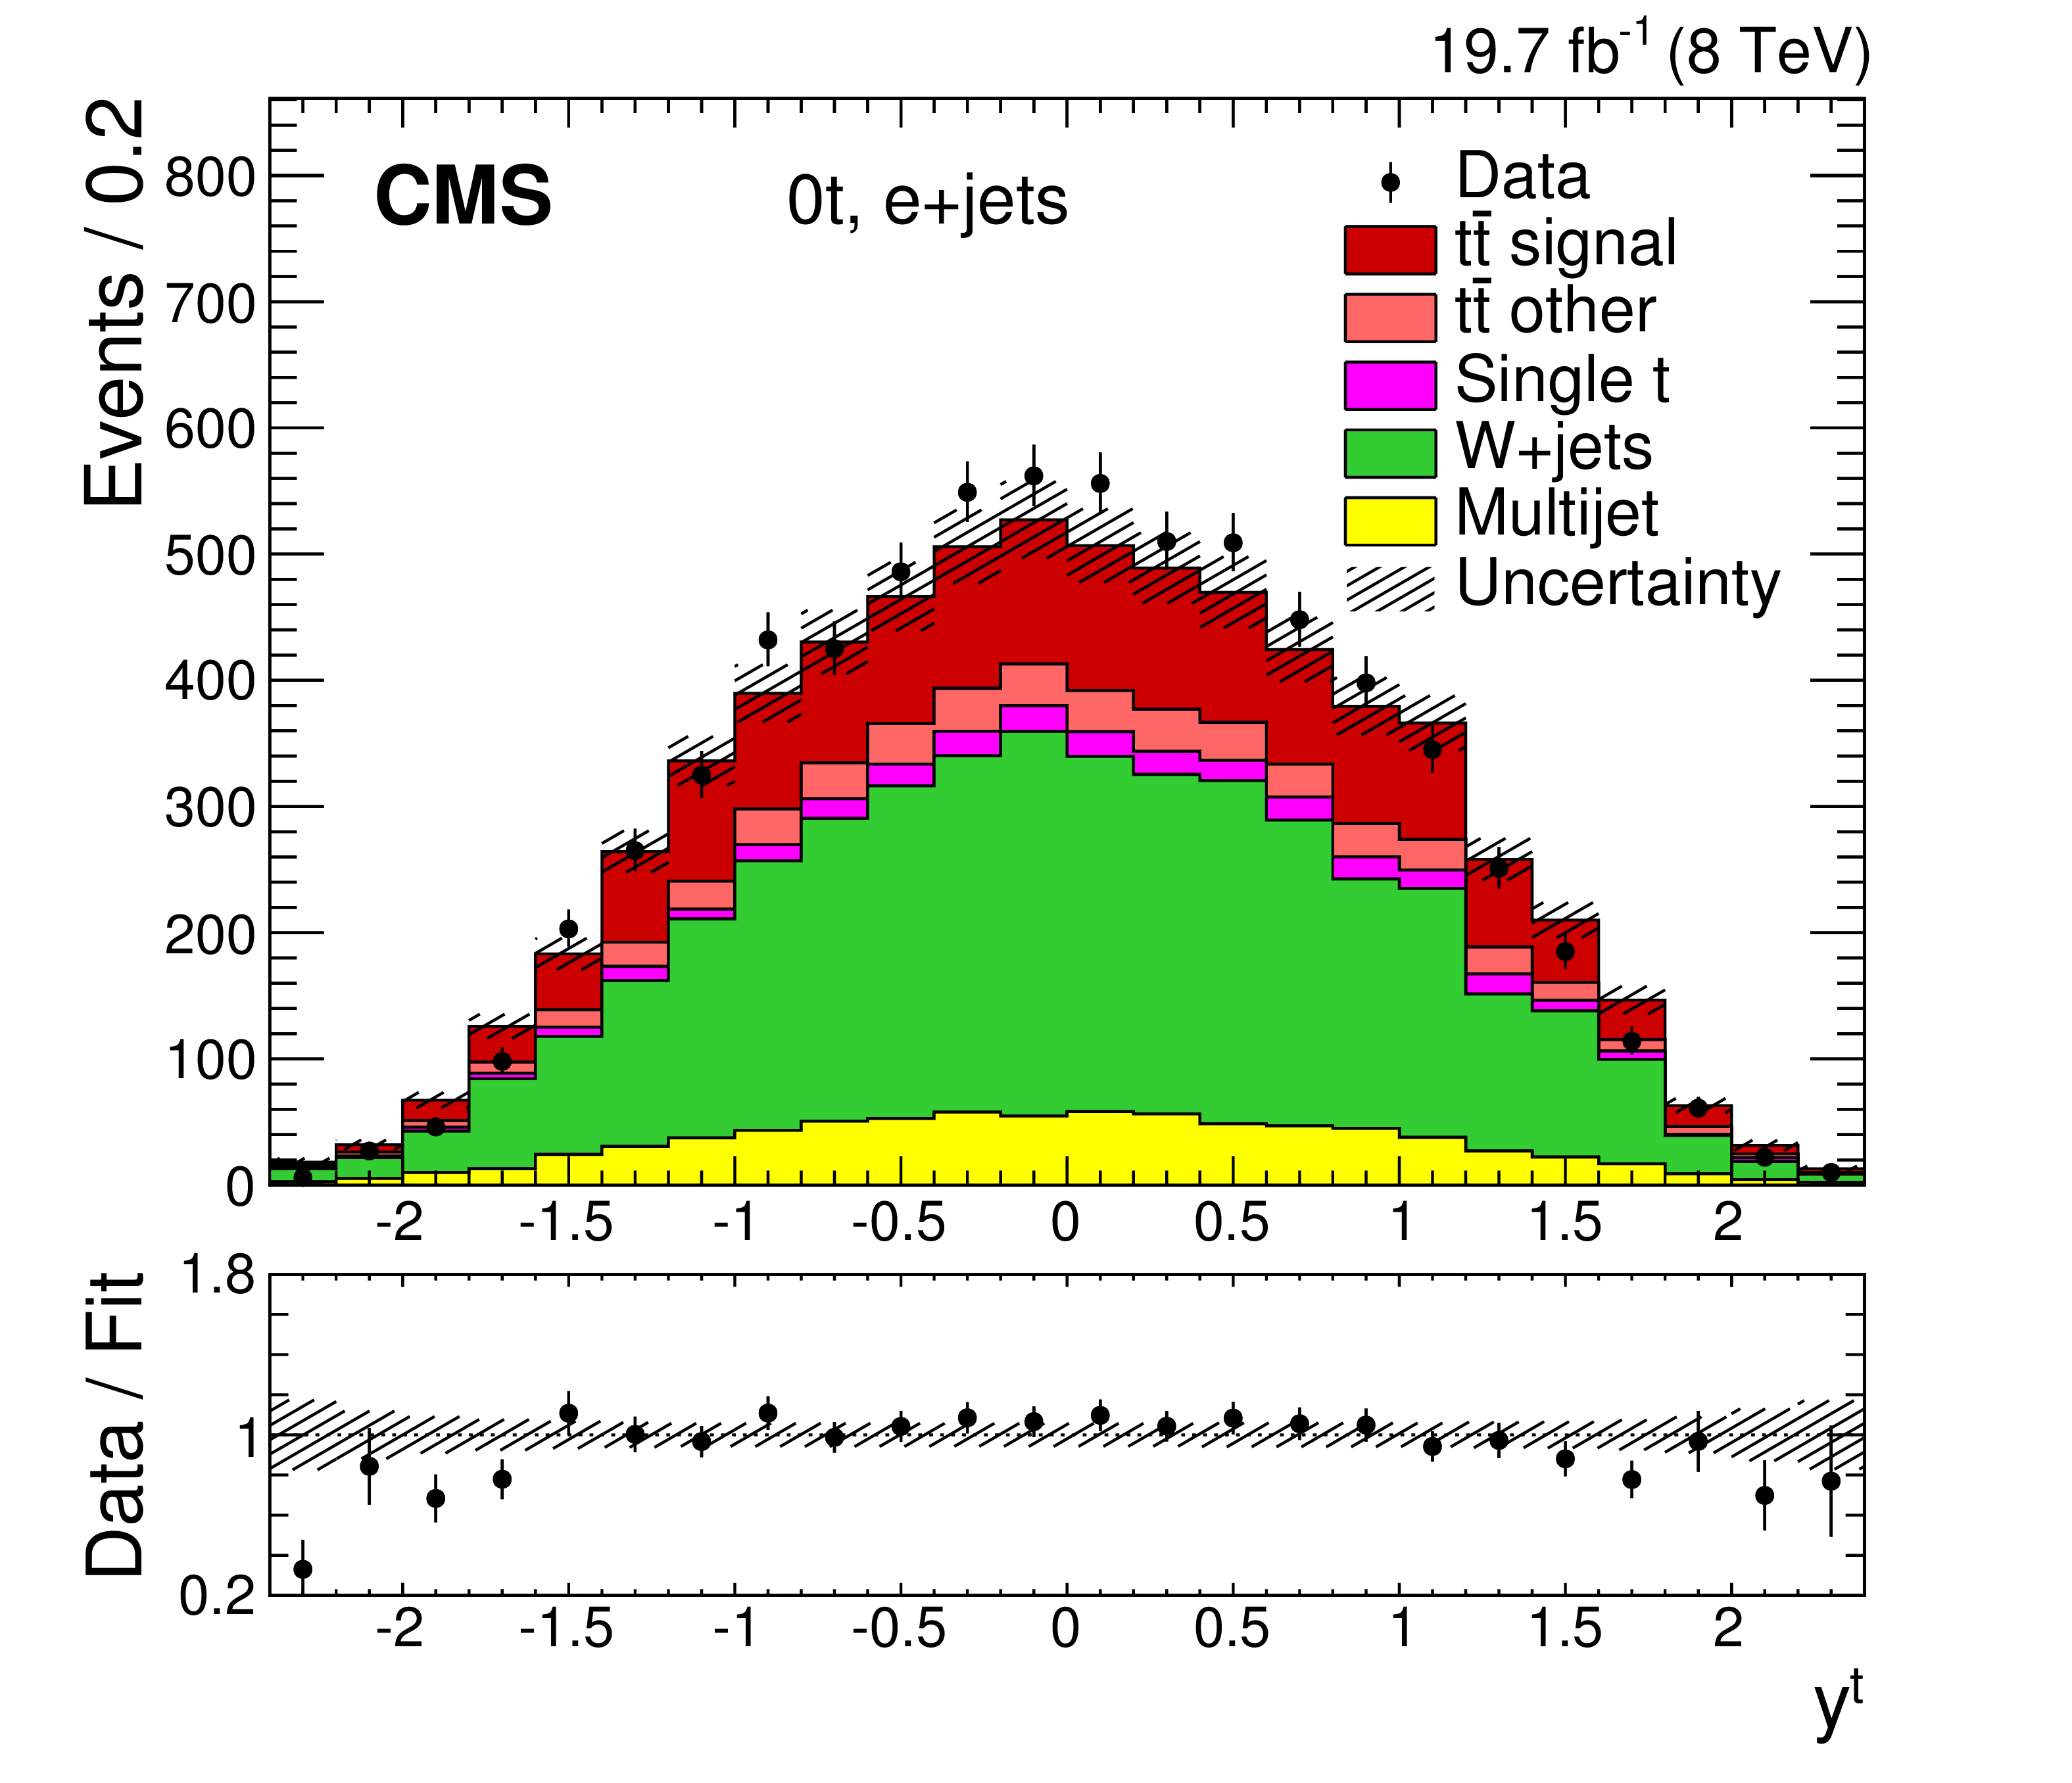
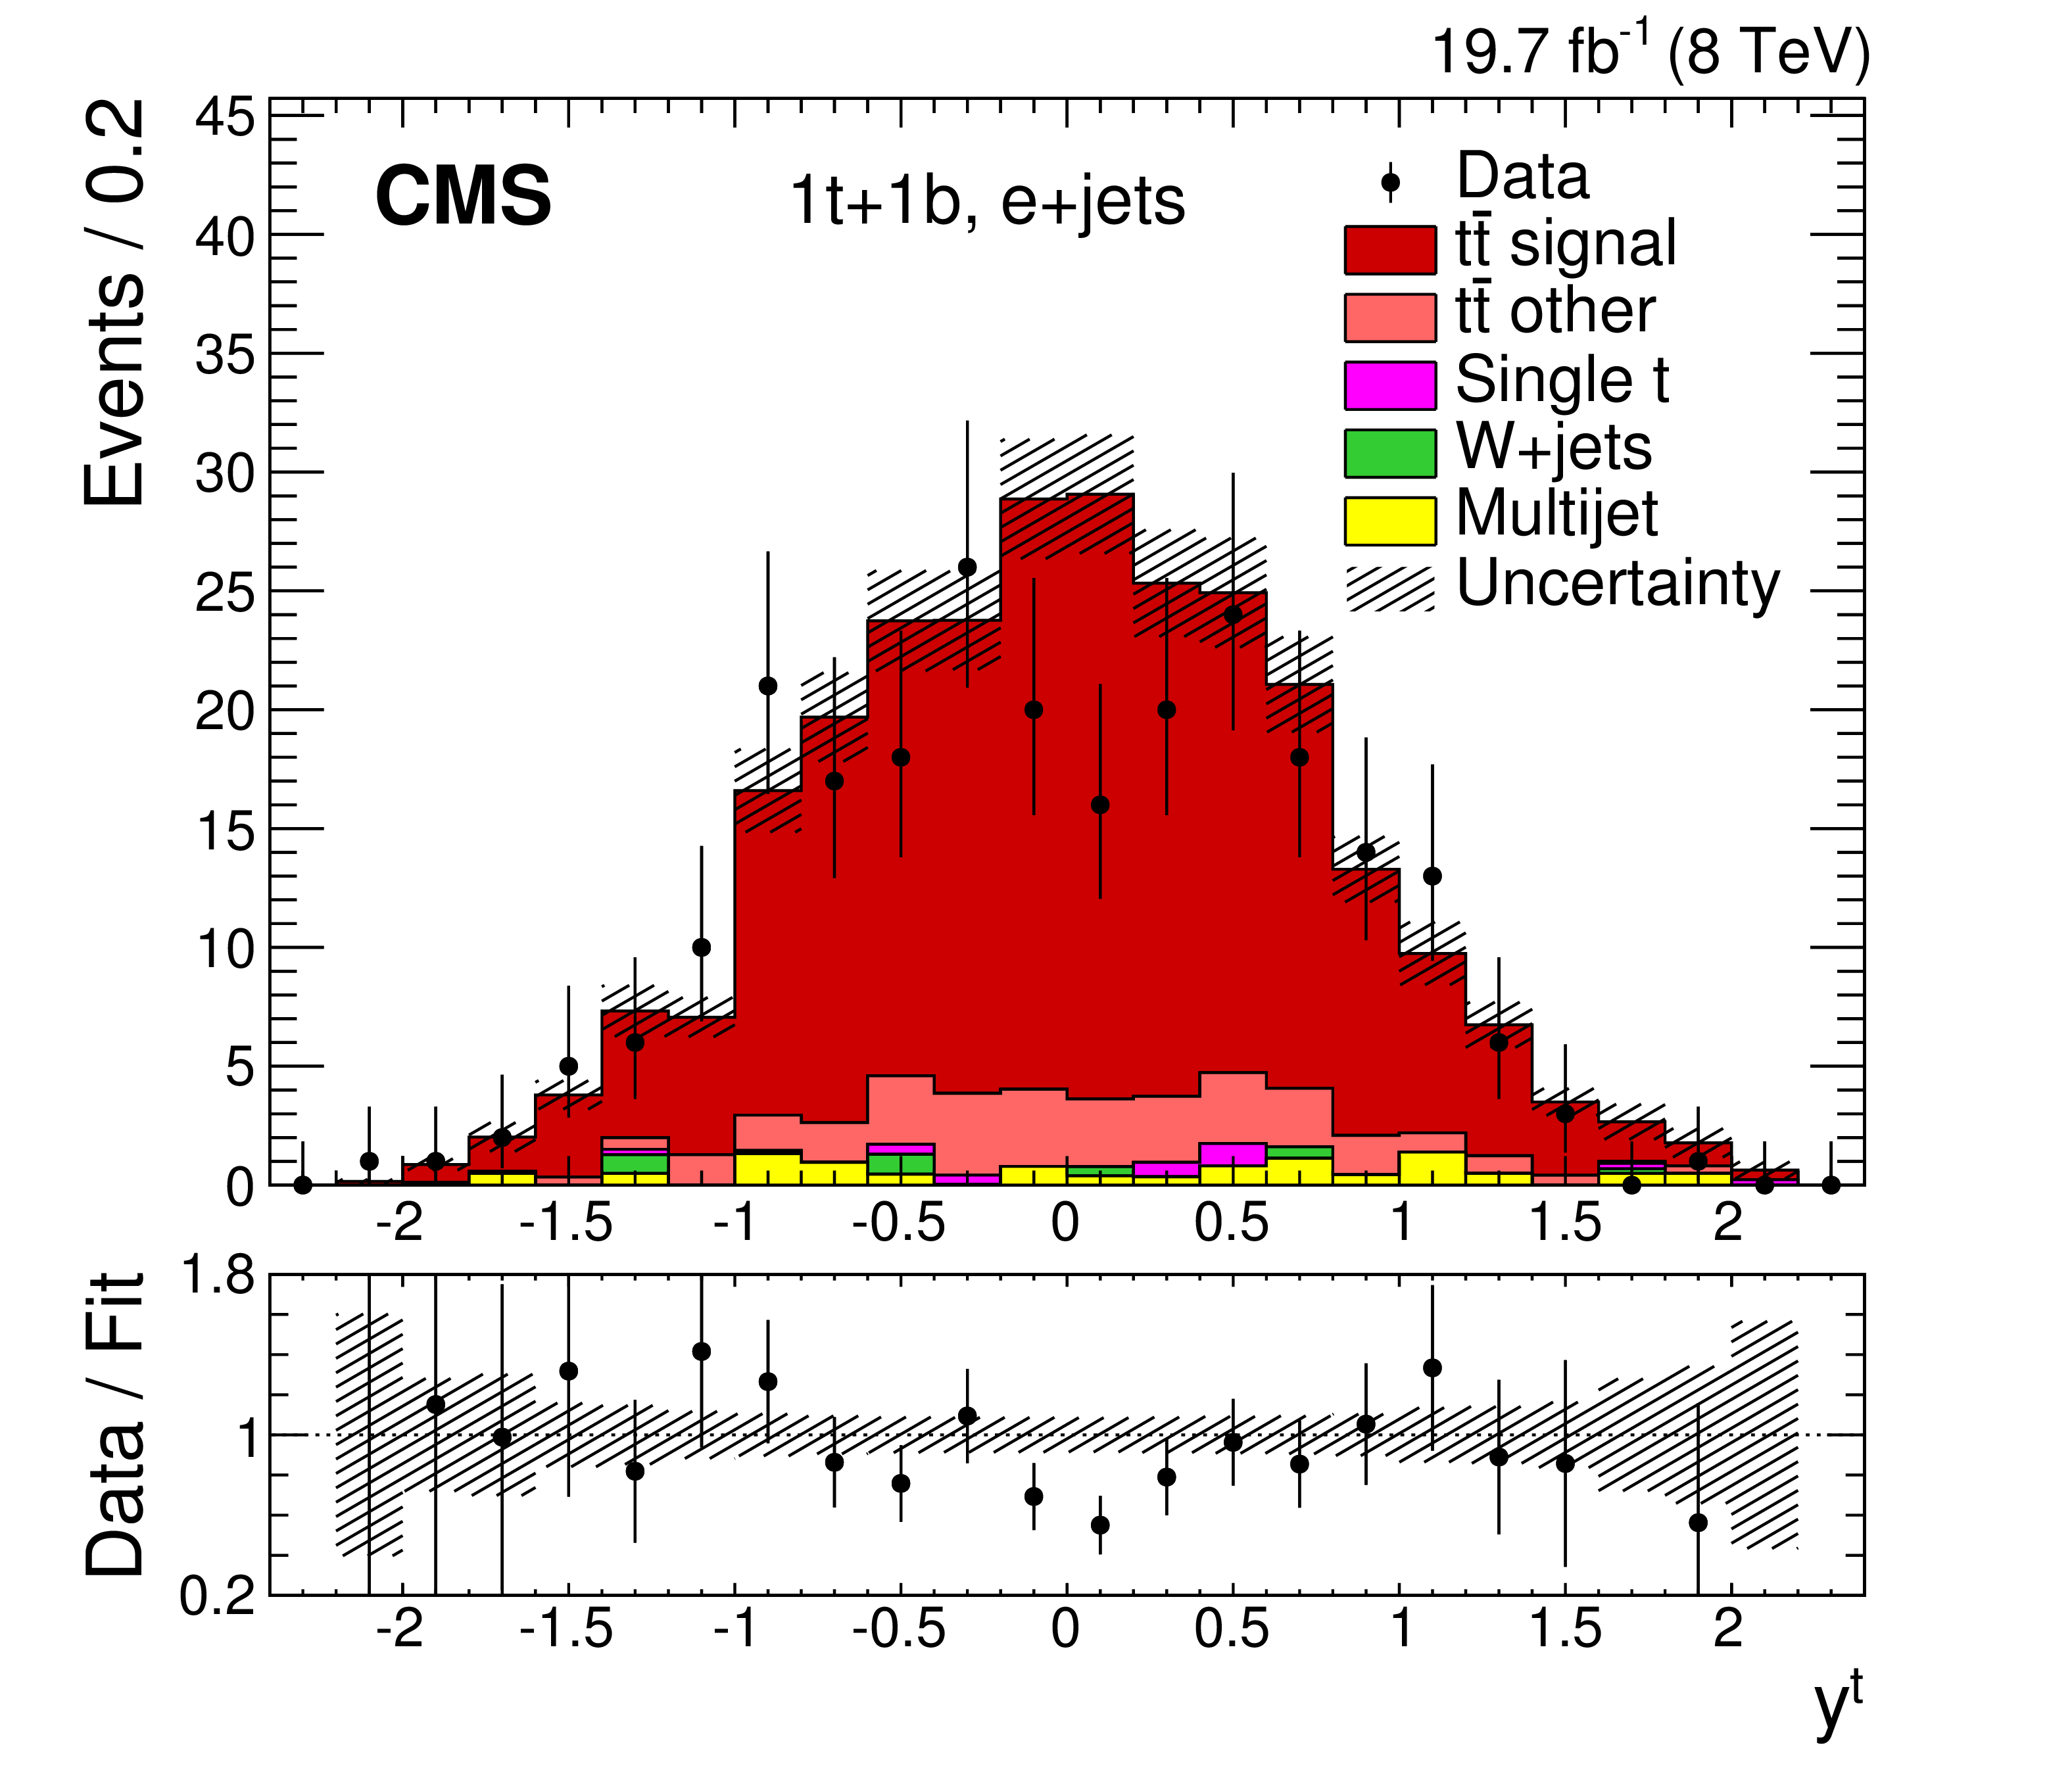
Figure 3-a:
Rapidity distribution of the hadronic-side, large-$R$ jet for the 0t (a,b), 1t+0b (c,d), and 1t+1b (e,f) event categories for the e+jets (a,c,e) and $\mu $+jets (b,d,f) channels. The data are compared to the total signal and background yields using normalizations from the maximum-likelihood fit. The vertical bars on the data points represent the statistical uncertainties. The shaded bands reflect the combination of the statistical and post-fit systematic uncertainties in the signal and background yields added in quadrature, without the uncertainties based on the form of the distributions, and neglecting their correlations for presentational purposes. The ratios of data to the total fit are shown below each panel, along with the uncertainty band from the fit. |
png pdf |
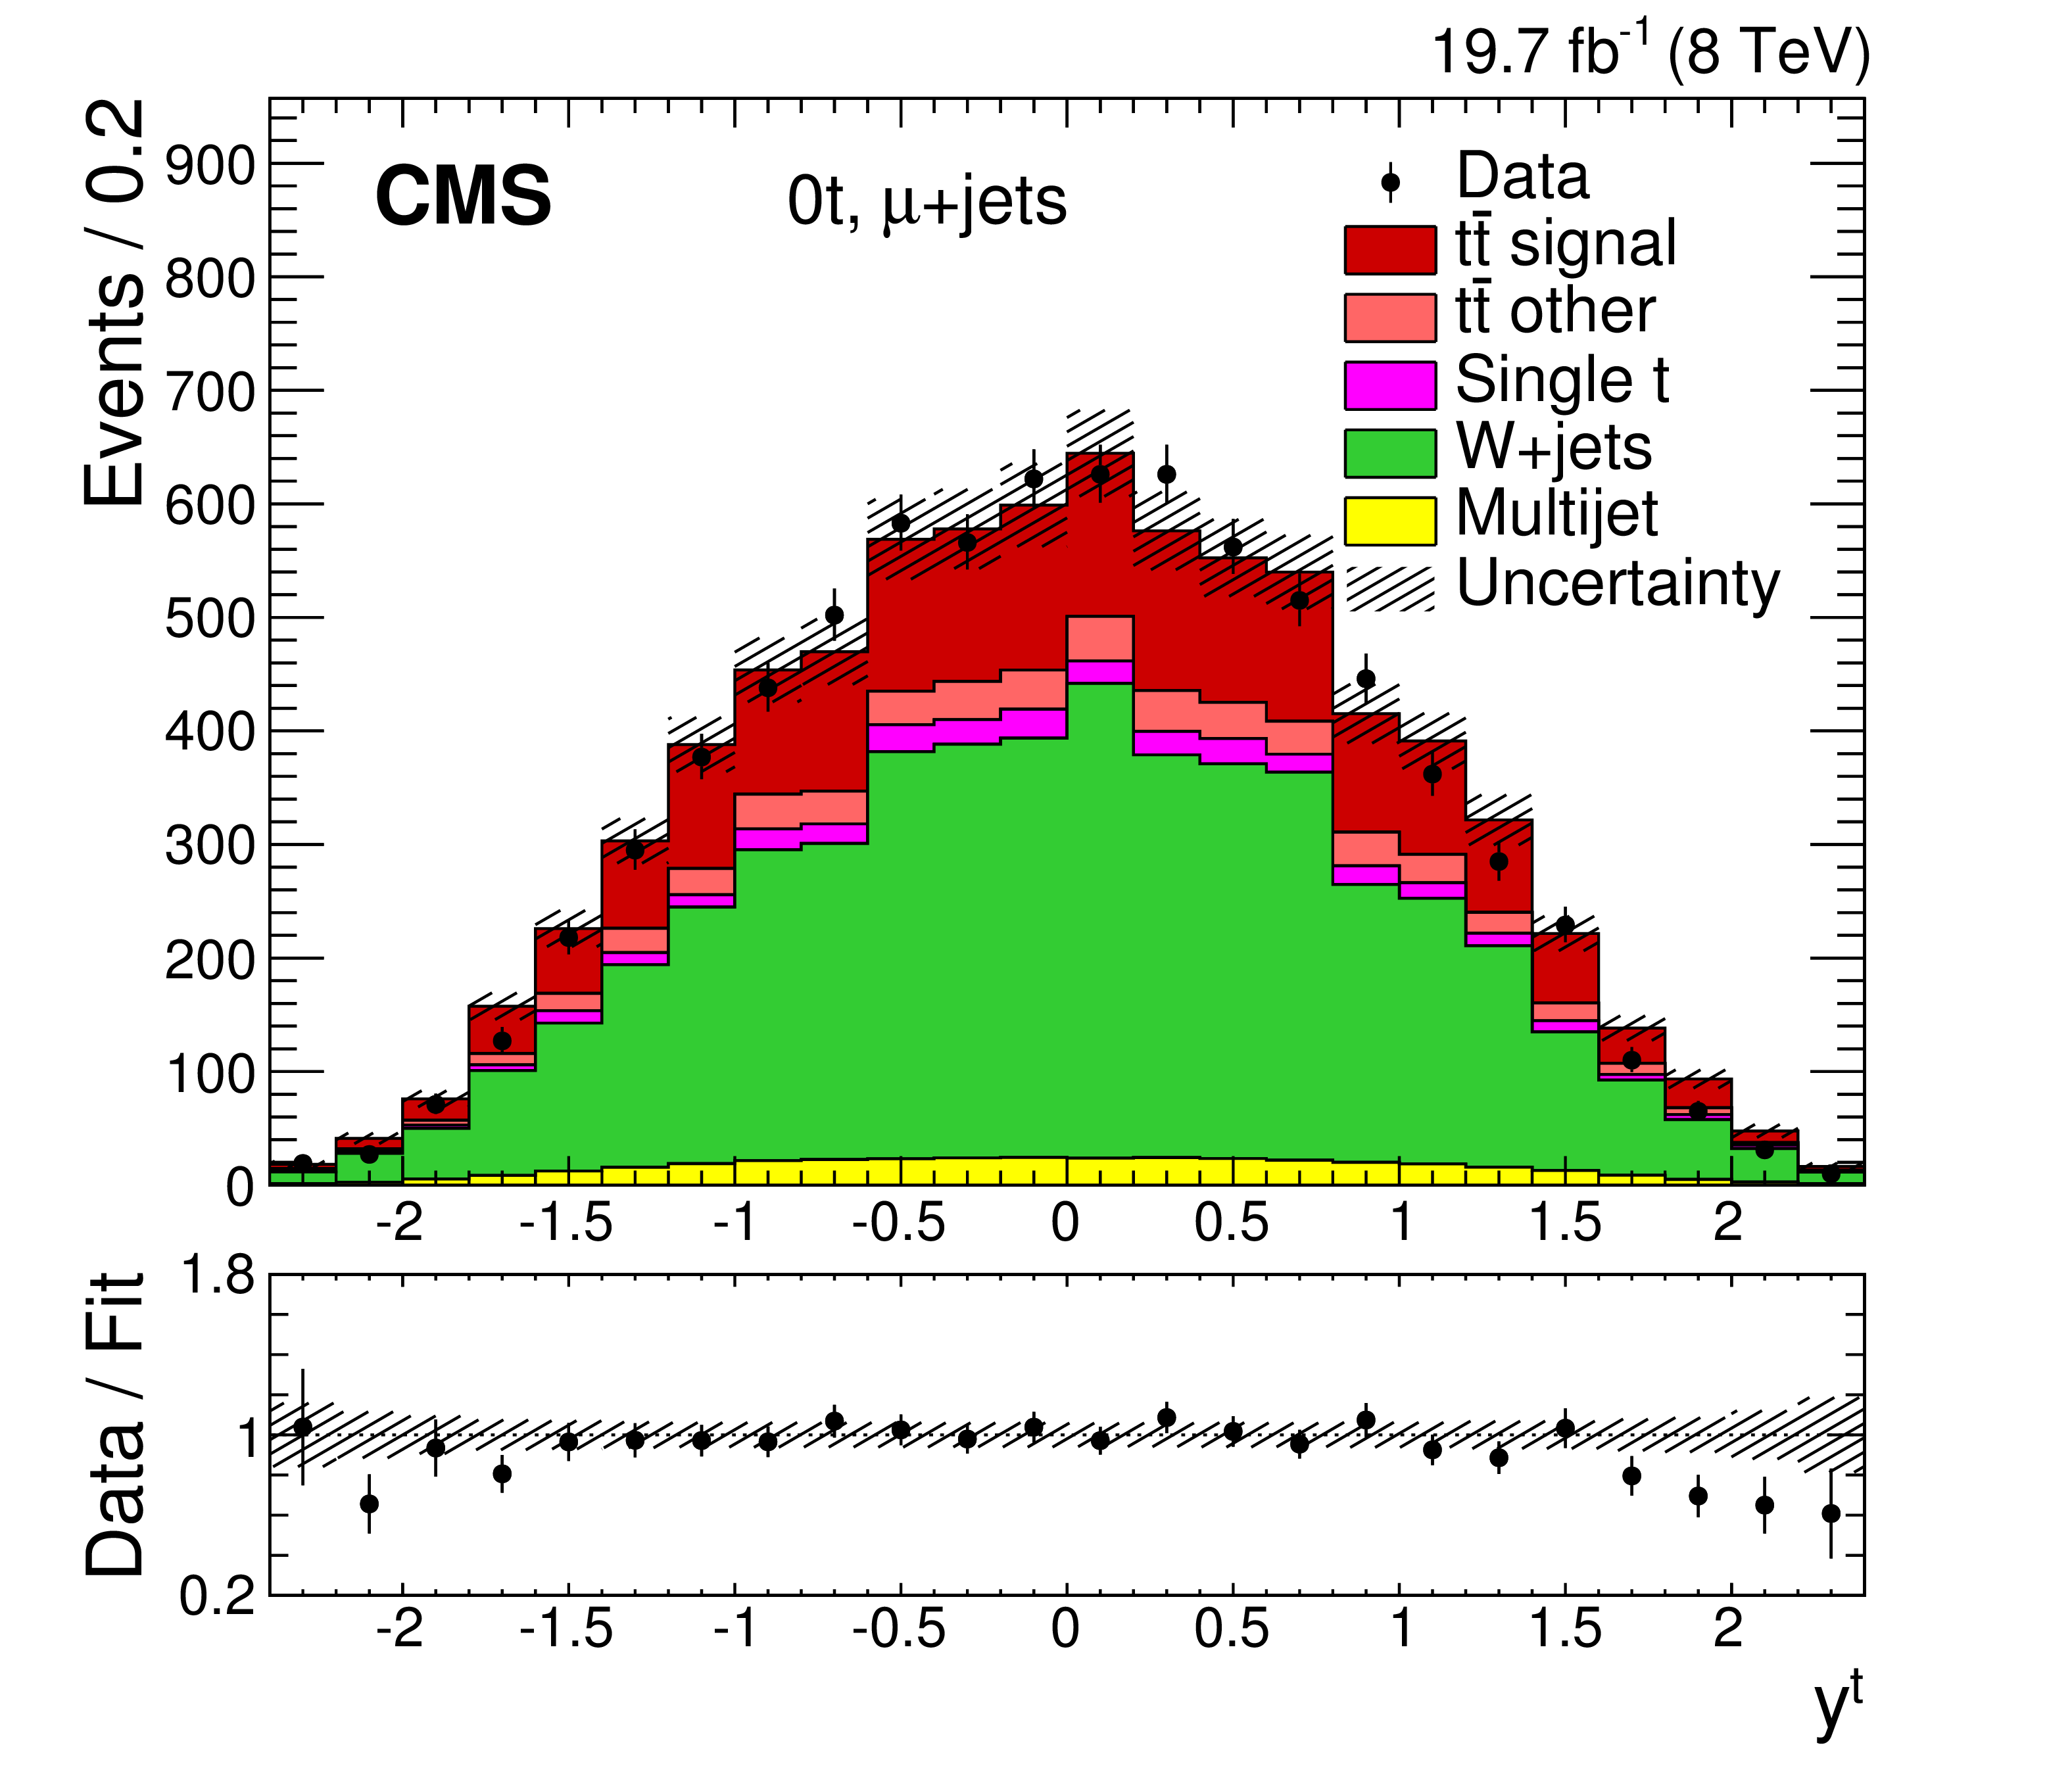
Figure 3-b:
Rapidity distribution of the hadronic-side, large-$R$ jet for the 0t (a,b), 1t+0b (c,d), and 1t+1b (e,f) event categories for the e+jets (a,c,e) and $\mu $+jets (b,d,f) channels. The data are compared to the total signal and background yields using normalizations from the maximum-likelihood fit. The vertical bars on the data points represent the statistical uncertainties. The shaded bands reflect the combination of the statistical and post-fit systematic uncertainties in the signal and background yields added in quadrature, without the uncertainties based on the form of the distributions, and neglecting their correlations for presentational purposes. The ratios of data to the total fit are shown below each panel, along with the uncertainty band from the fit. |
png pdf |
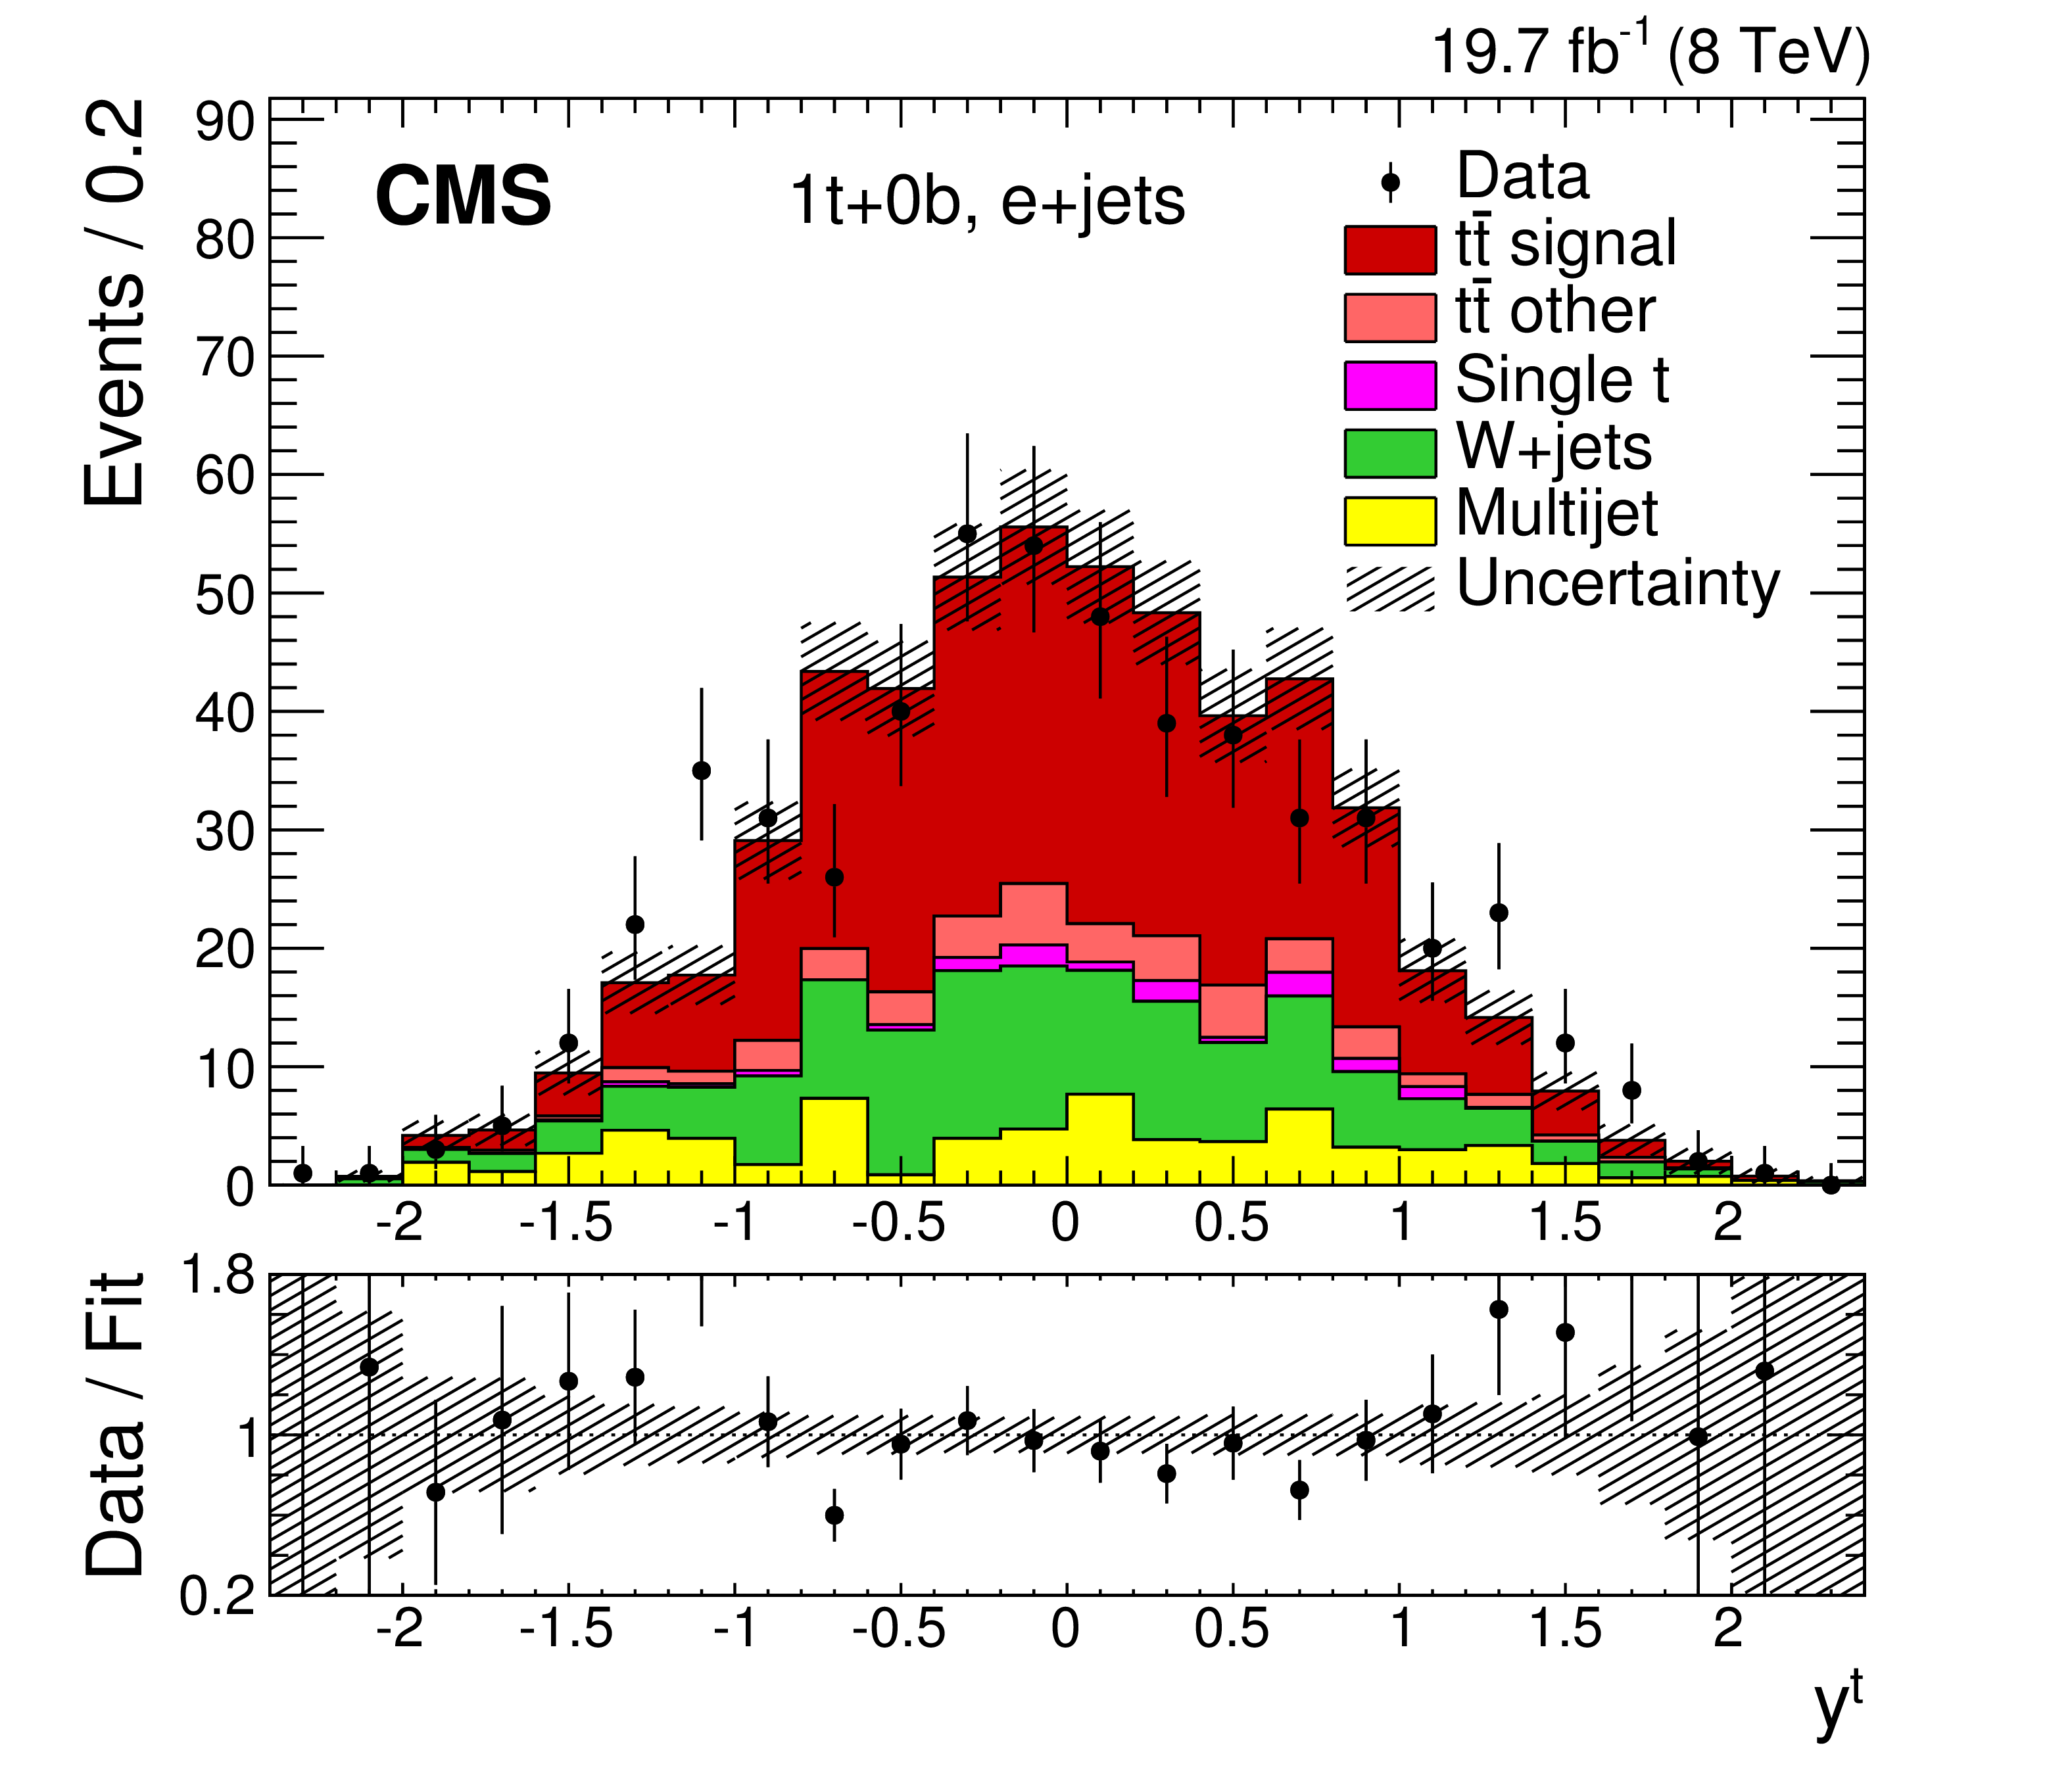
Figure 3-c:
Rapidity distribution of the hadronic-side, large-$R$ jet for the 0t (a,b), 1t+0b (c,d), and 1t+1b (e,f) event categories for the e+jets (a,c,e) and $\mu $+jets (b,d,f) channels. The data are compared to the total signal and background yields using normalizations from the maximum-likelihood fit. The vertical bars on the data points represent the statistical uncertainties. The shaded bands reflect the combination of the statistical and post-fit systematic uncertainties in the signal and background yields added in quadrature, without the uncertainties based on the form of the distributions, and neglecting their correlations for presentational purposes. The ratios of data to the total fit are shown below each panel, along with the uncertainty band from the fit. |
png pdf |
Figure 3-d:
Rapidity distribution of the hadronic-side, large-$R$ jet for the 0t (a,b), 1t+0b (c,d), and 1t+1b (e,f) event categories for the e+jets (a,c,e) and $\mu $+jets (b,d,f) channels. The data are compared to the total signal and background yields using normalizations from the maximum-likelihood fit. The vertical bars on the data points represent the statistical uncertainties. The shaded bands reflect the combination of the statistical and post-fit systematic uncertainties in the signal and background yields added in quadrature, without the uncertainties based on the form of the distributions, and neglecting their correlations for presentational purposes. The ratios of data to the total fit are shown below each panel, along with the uncertainty band from the fit. |
png pdf |
Figure 3-e:
Rapidity distribution of the hadronic-side, large-$R$ jet for the 0t (a,b), 1t+0b (c,d), and 1t+1b (e,f) event categories for the e+jets (a,c,e) and $\mu $+jets (b,d,f) channels. The data are compared to the total signal and background yields using normalizations from the maximum-likelihood fit. The vertical bars on the data points represent the statistical uncertainties. The shaded bands reflect the combination of the statistical and post-fit systematic uncertainties in the signal and background yields added in quadrature, without the uncertainties based on the form of the distributions, and neglecting their correlations for presentational purposes. The ratios of data to the total fit are shown below each panel, along with the uncertainty band from the fit. |

png pdf |
Figure 3-f:
Rapidity distribution of the hadronic-side, large-$R$ jet for the 0t (a,b), 1t+0b (c,d), and 1t+1b (e,f) event categories for the e+jets (a,c,e) and $\mu $+jets (b,d,f) channels. The data are compared to the total signal and background yields using normalizations from the maximum-likelihood fit. The vertical bars on the data points represent the statistical uncertainties. The shaded bands reflect the combination of the statistical and post-fit systematic uncertainties in the signal and background yields added in quadrature, without the uncertainties based on the form of the distributions, and neglecting their correlations for presentational purposes. The ratios of data to the total fit are shown below each panel, along with the uncertainty band from the fit. |

png pdf |
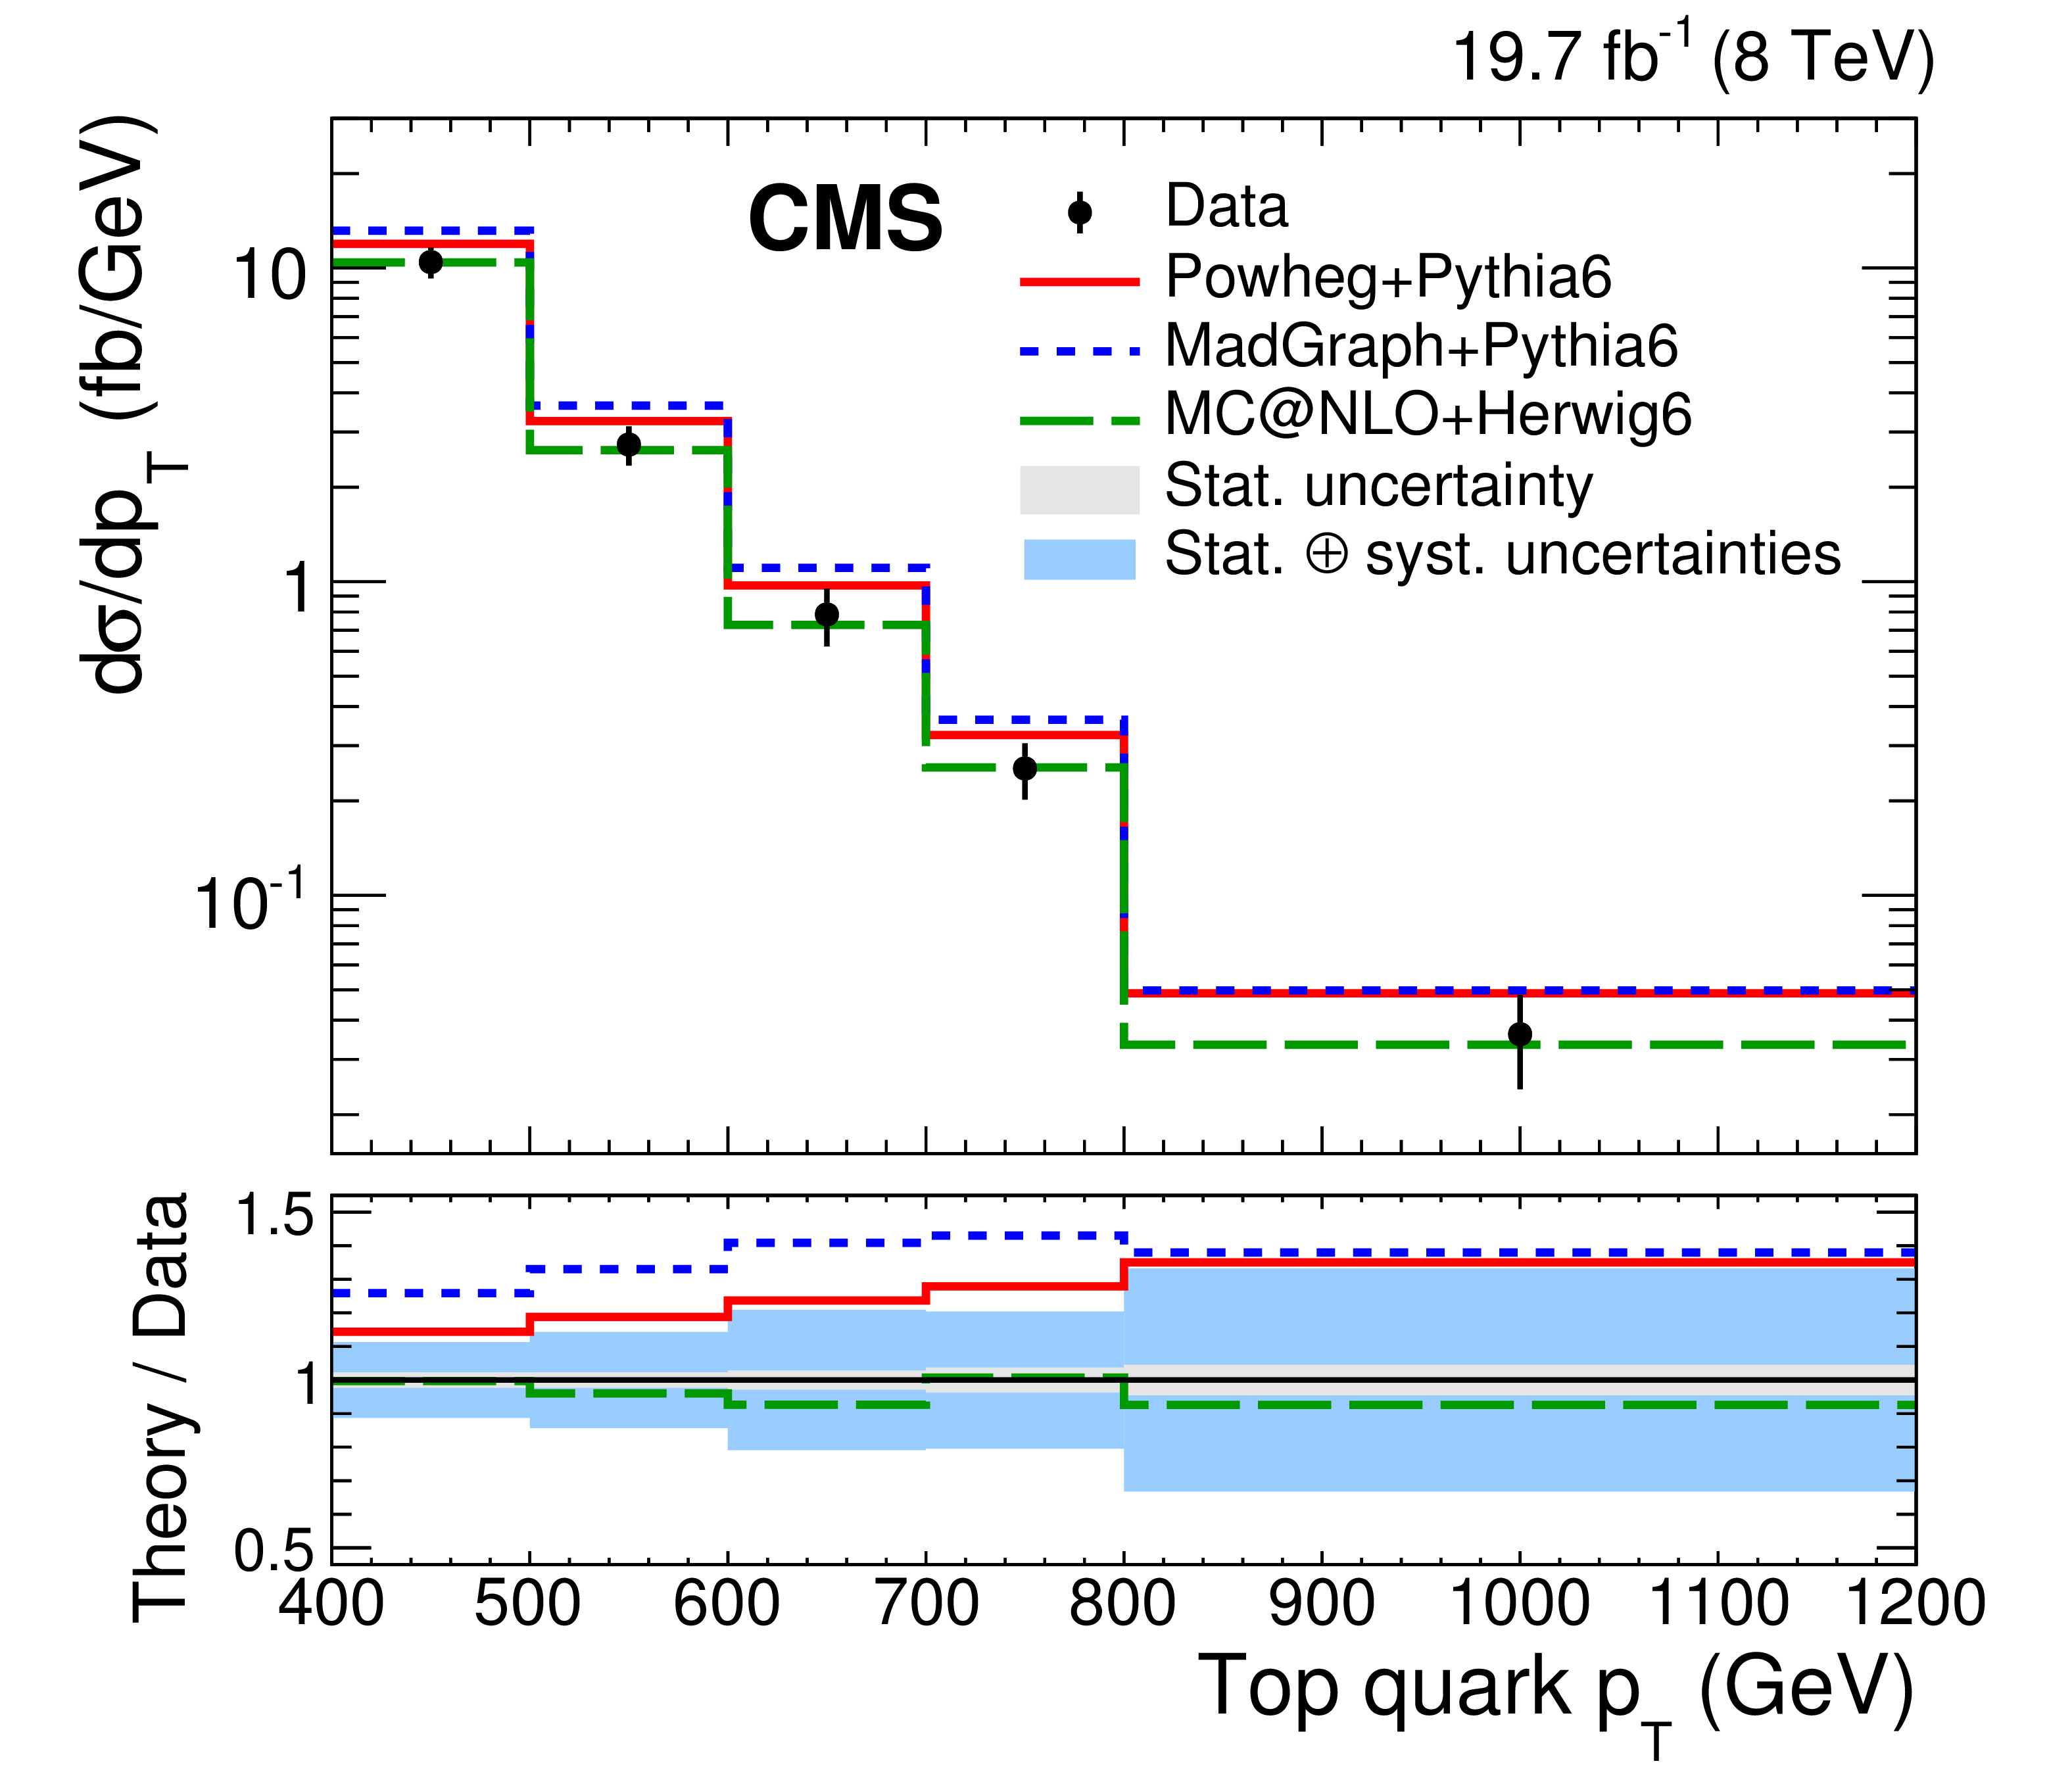
Figure 4-a:
Differential $ {\mathrm{ t \bar{t} } } $ cross section in bins of particle-level $\mathrm{ t } $ jet $ {p_{\mathrm {T}}} $ (a), parton-level top quark $ {p_{\mathrm {T}}} $ (b), particle-level $\mathrm{ t } $ jet $y$ (c), and parton-level top quark $y$ (d), including all systematic uncertainties. The lower plots show the ratio of the theoretical predictions to the data. The statistical uncertainties are represented by the inner vertical bars with ticks and the light bands in the ratios. The combined uncertainties are shown as full vertical bars and the dark solid bands in the ratios. |
png pdf |
Figure 4-b:
Differential $ {\mathrm{ t \bar{t} } } $ cross section in bins of particle-level $\mathrm{ t } $ jet $ {p_{\mathrm {T}}} $ (a), parton-level top quark $ {p_{\mathrm {T}}} $ (b), particle-level $\mathrm{ t } $ jet $y$ (c), and parton-level top quark $y$ (d), including all systematic uncertainties. The lower plots show the ratio of the theoretical predictions to the data. The statistical uncertainties are represented by the inner vertical bars with ticks and the light bands in the ratios. The combined uncertainties are shown as full vertical bars and the dark solid bands in the ratios. |
png pdf |
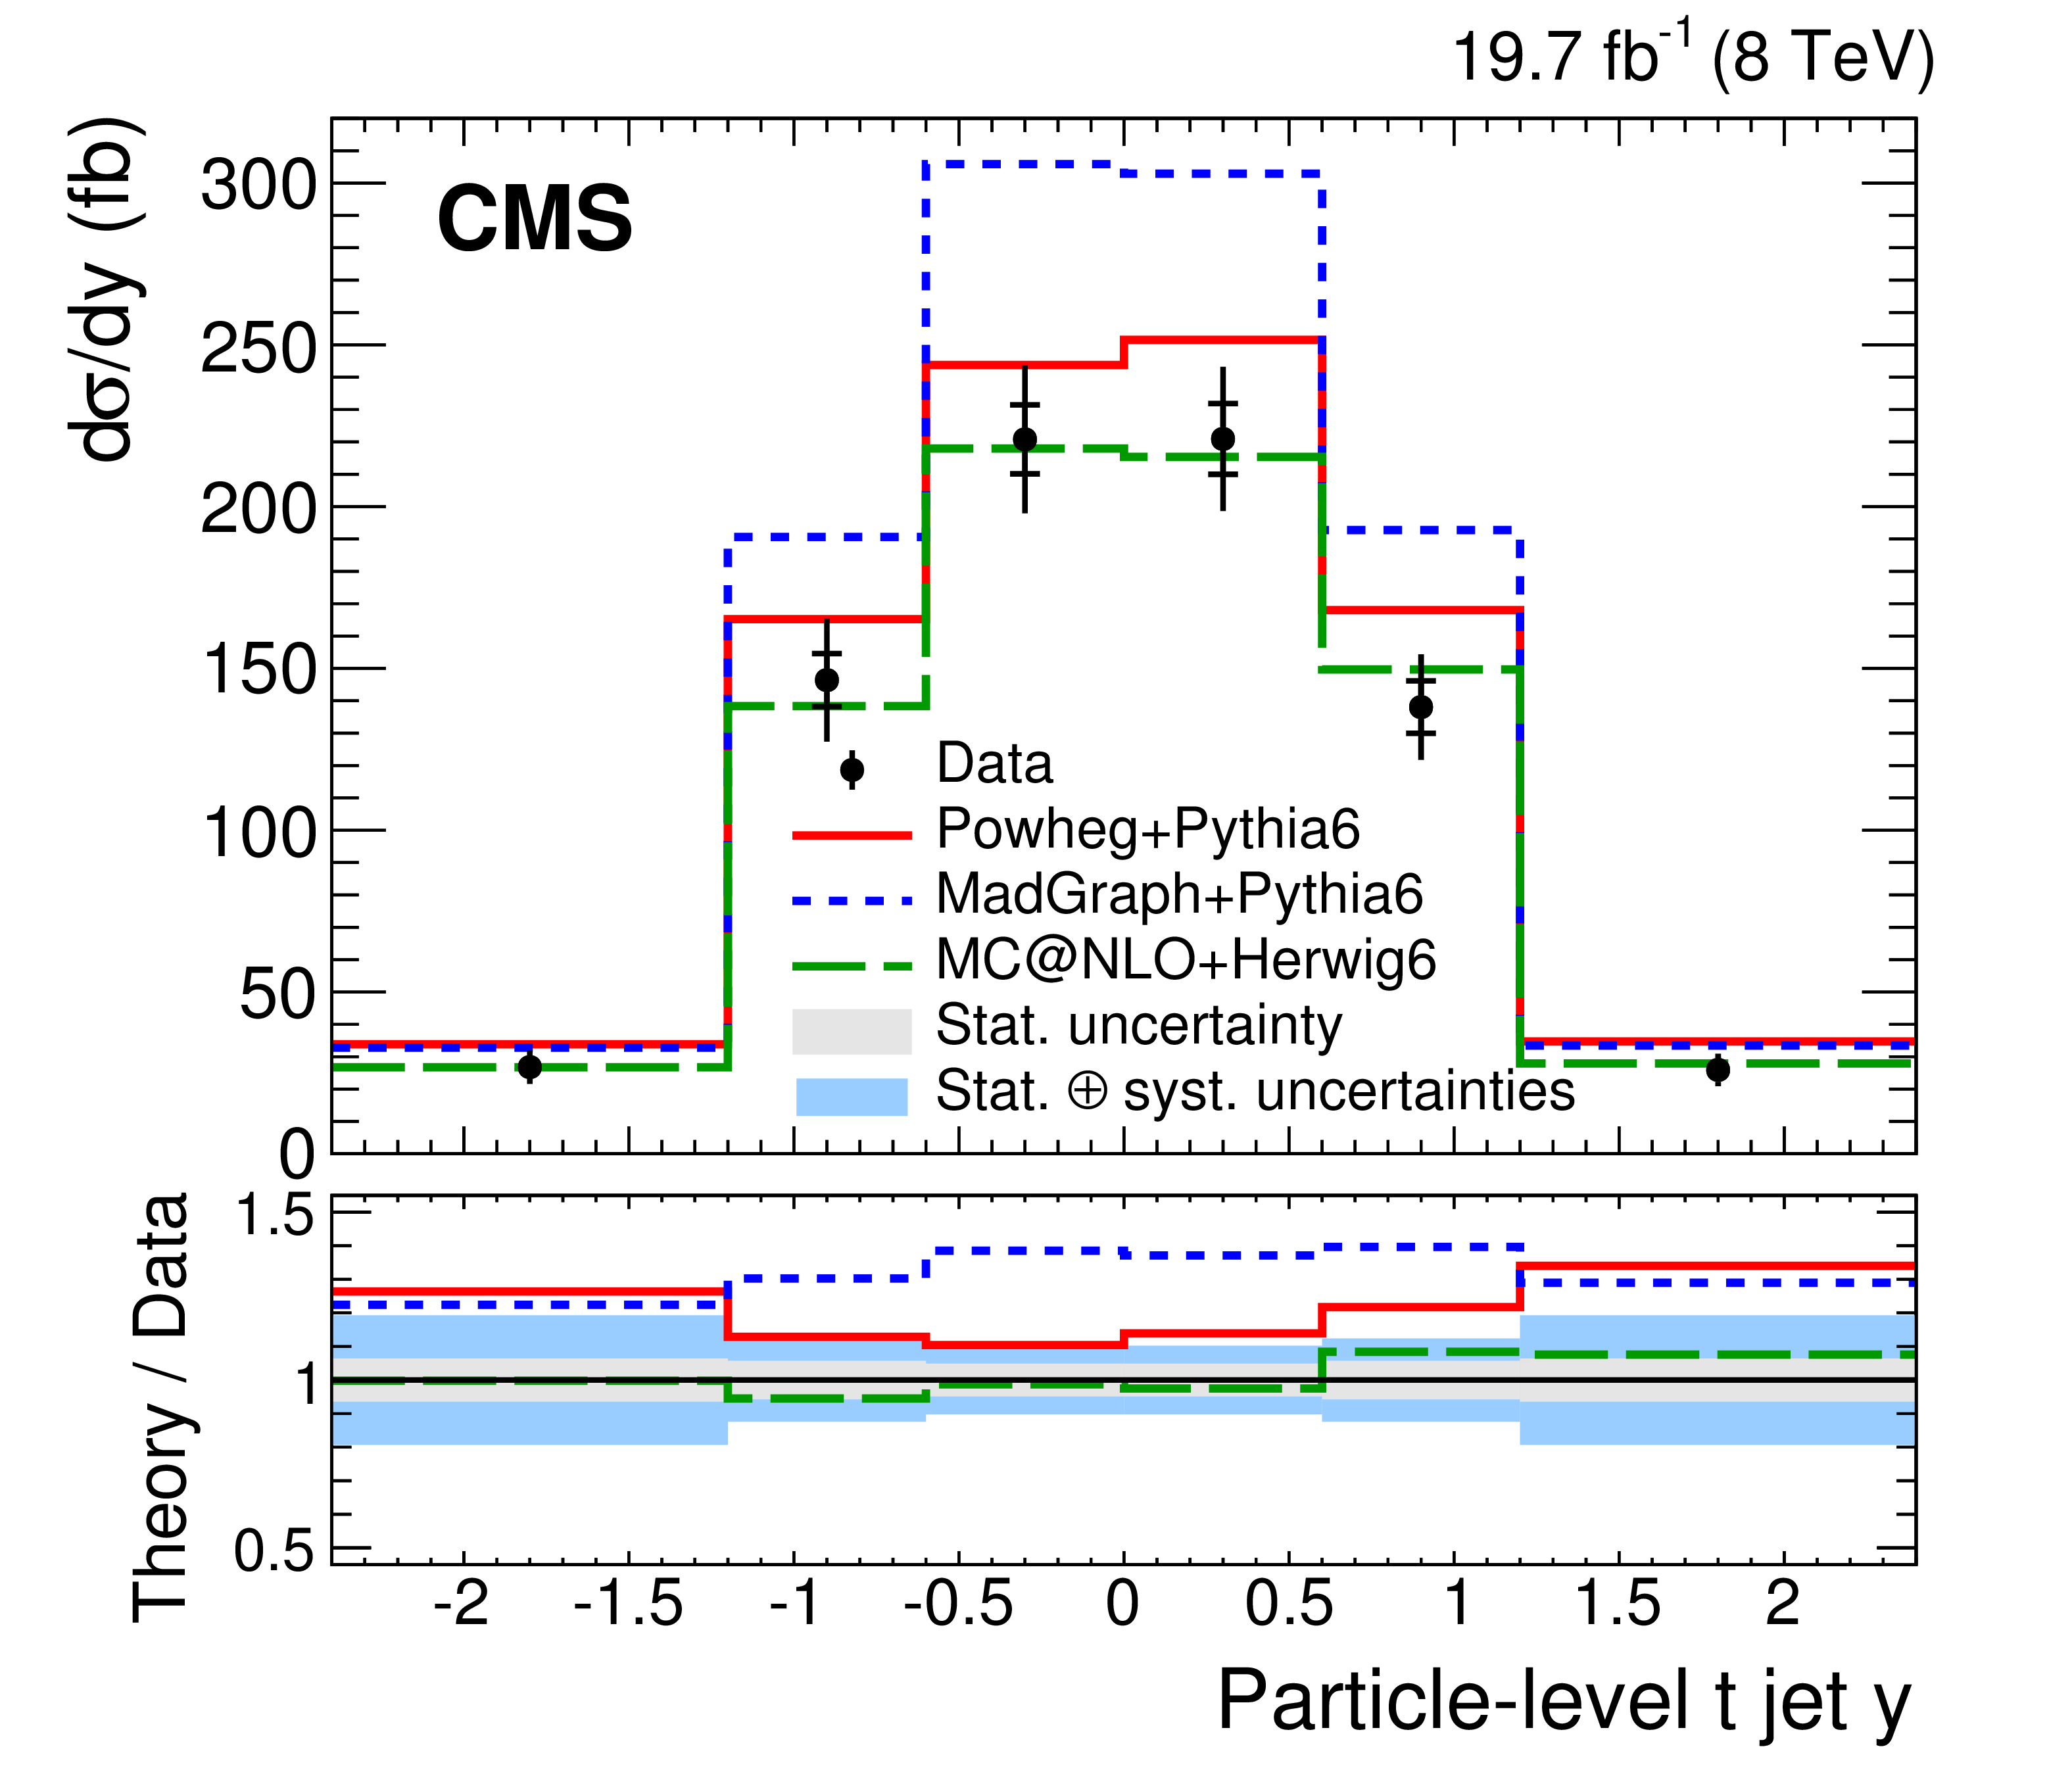
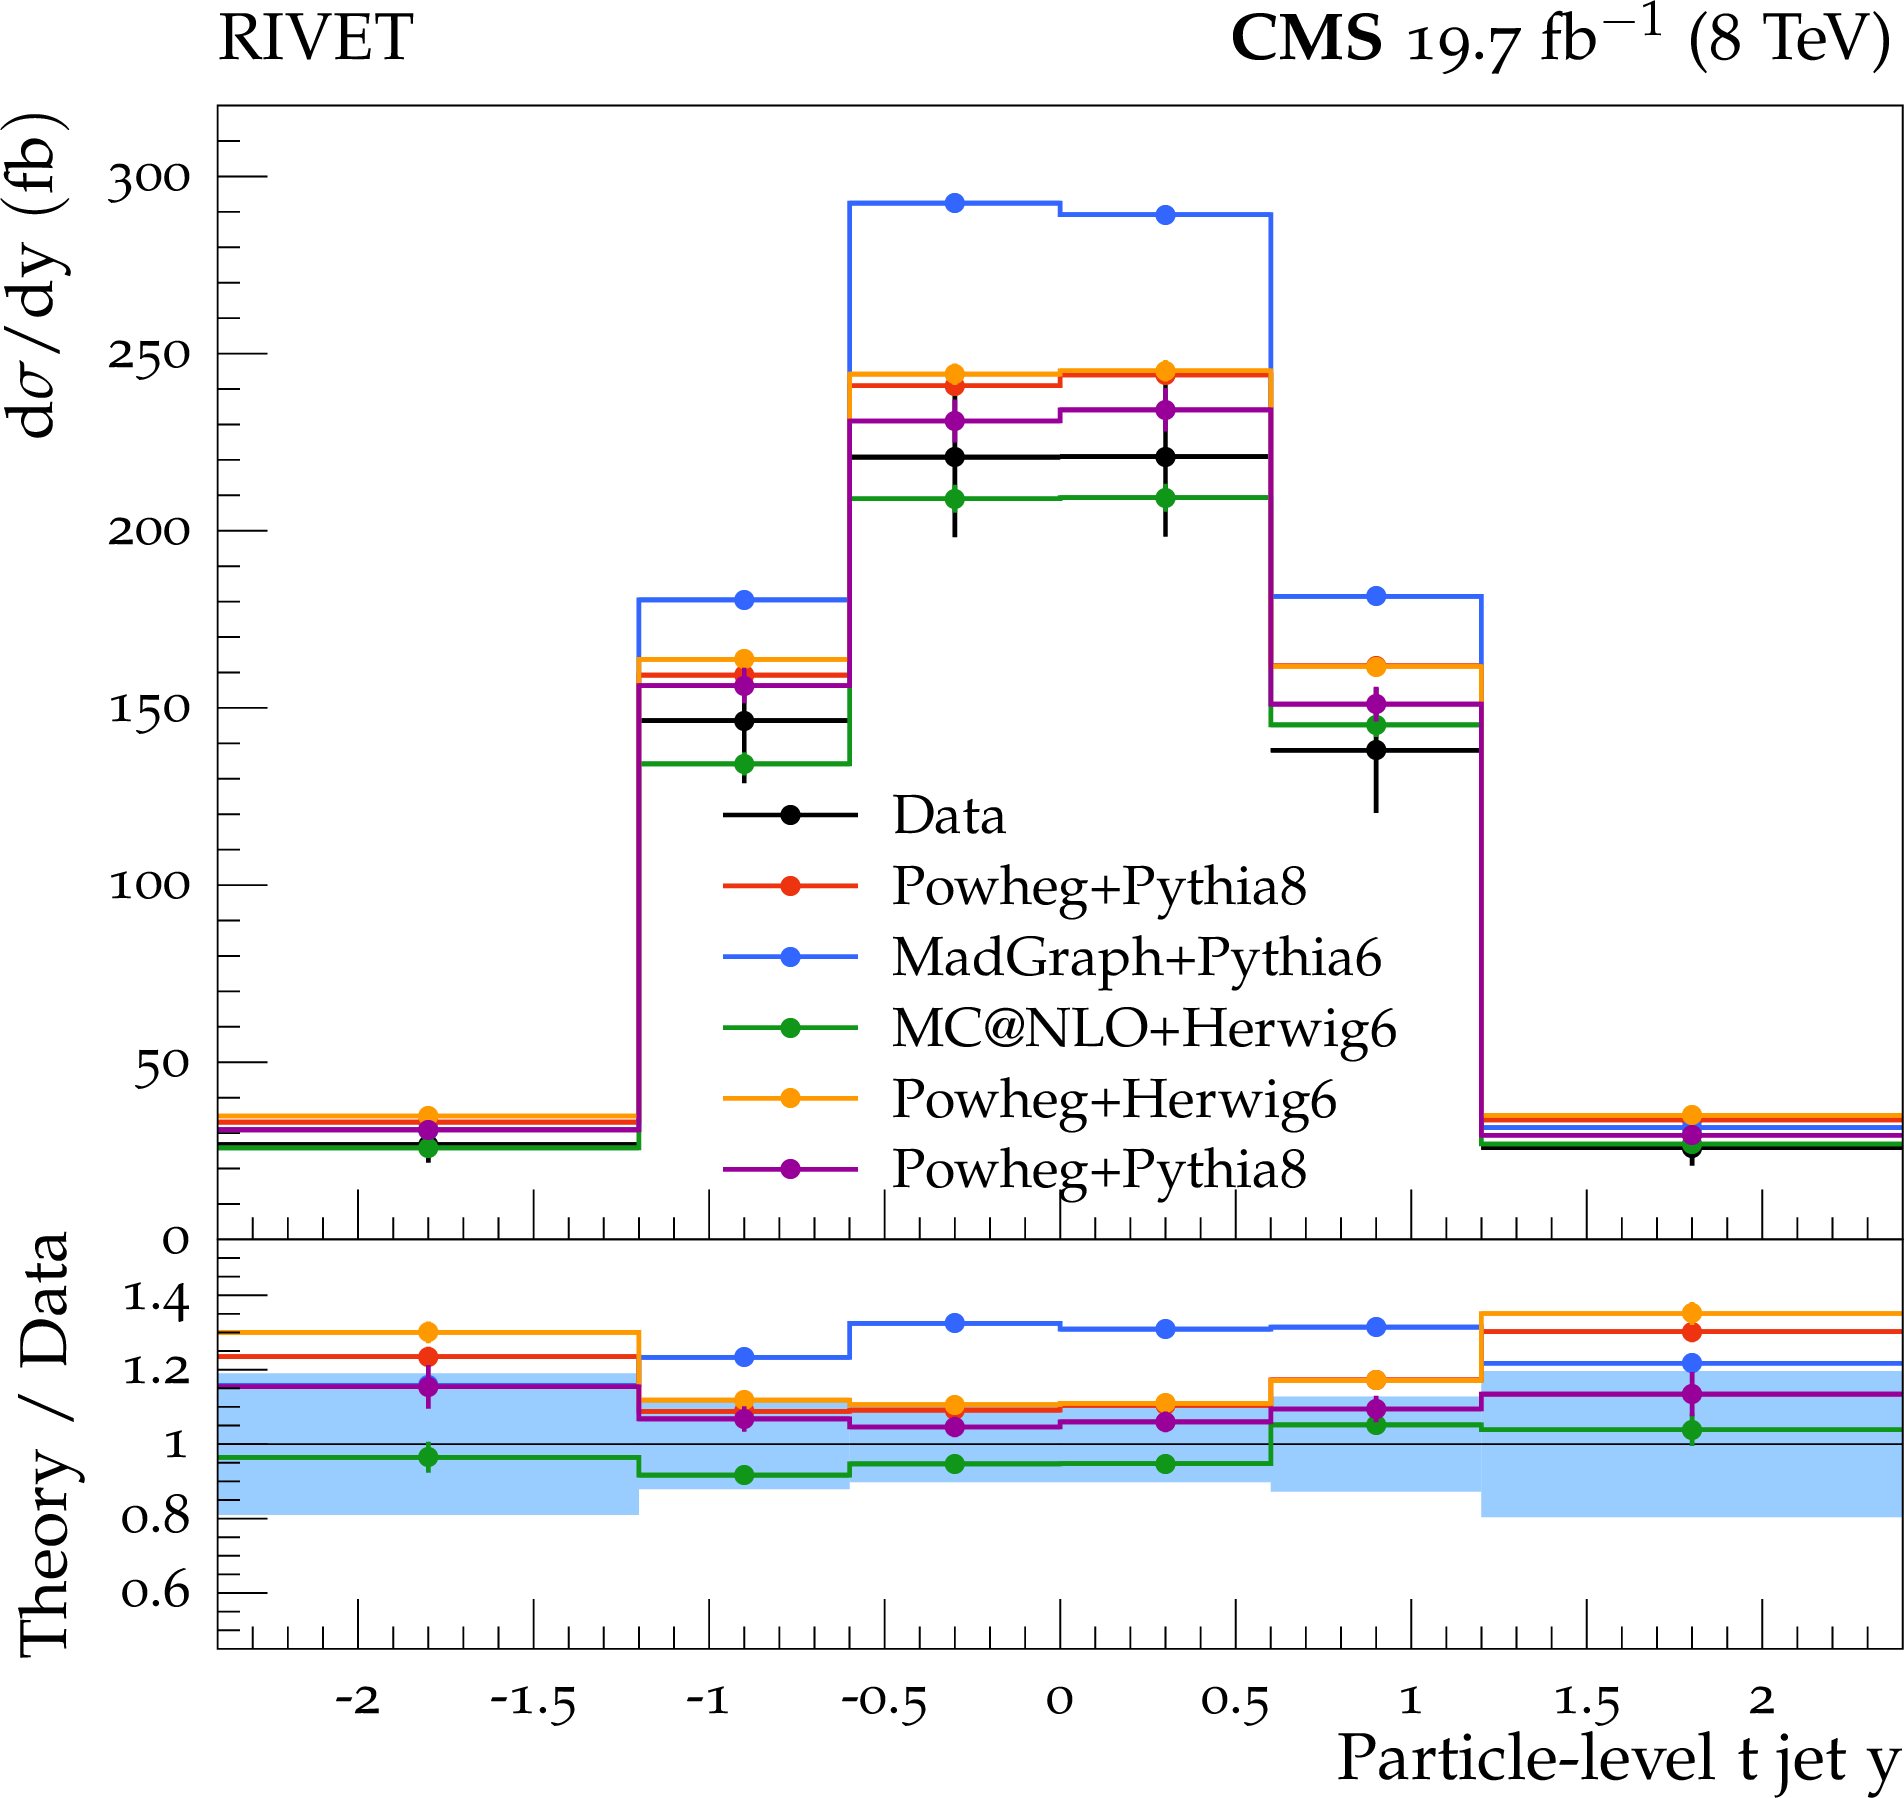
Figure 4-c:
Differential $ {\mathrm{ t \bar{t} } } $ cross section in bins of particle-level $\mathrm{ t } $ jet $ {p_{\mathrm {T}}} $ (a), parton-level top quark $ {p_{\mathrm {T}}} $ (b), particle-level $\mathrm{ t } $ jet $y$ (c), and parton-level top quark $y$ (d), including all systematic uncertainties. The lower plots show the ratio of the theoretical predictions to the data. The statistical uncertainties are represented by the inner vertical bars with ticks and the light bands in the ratios. The combined uncertainties are shown as full vertical bars and the dark solid bands in the ratios. |
png pdf |
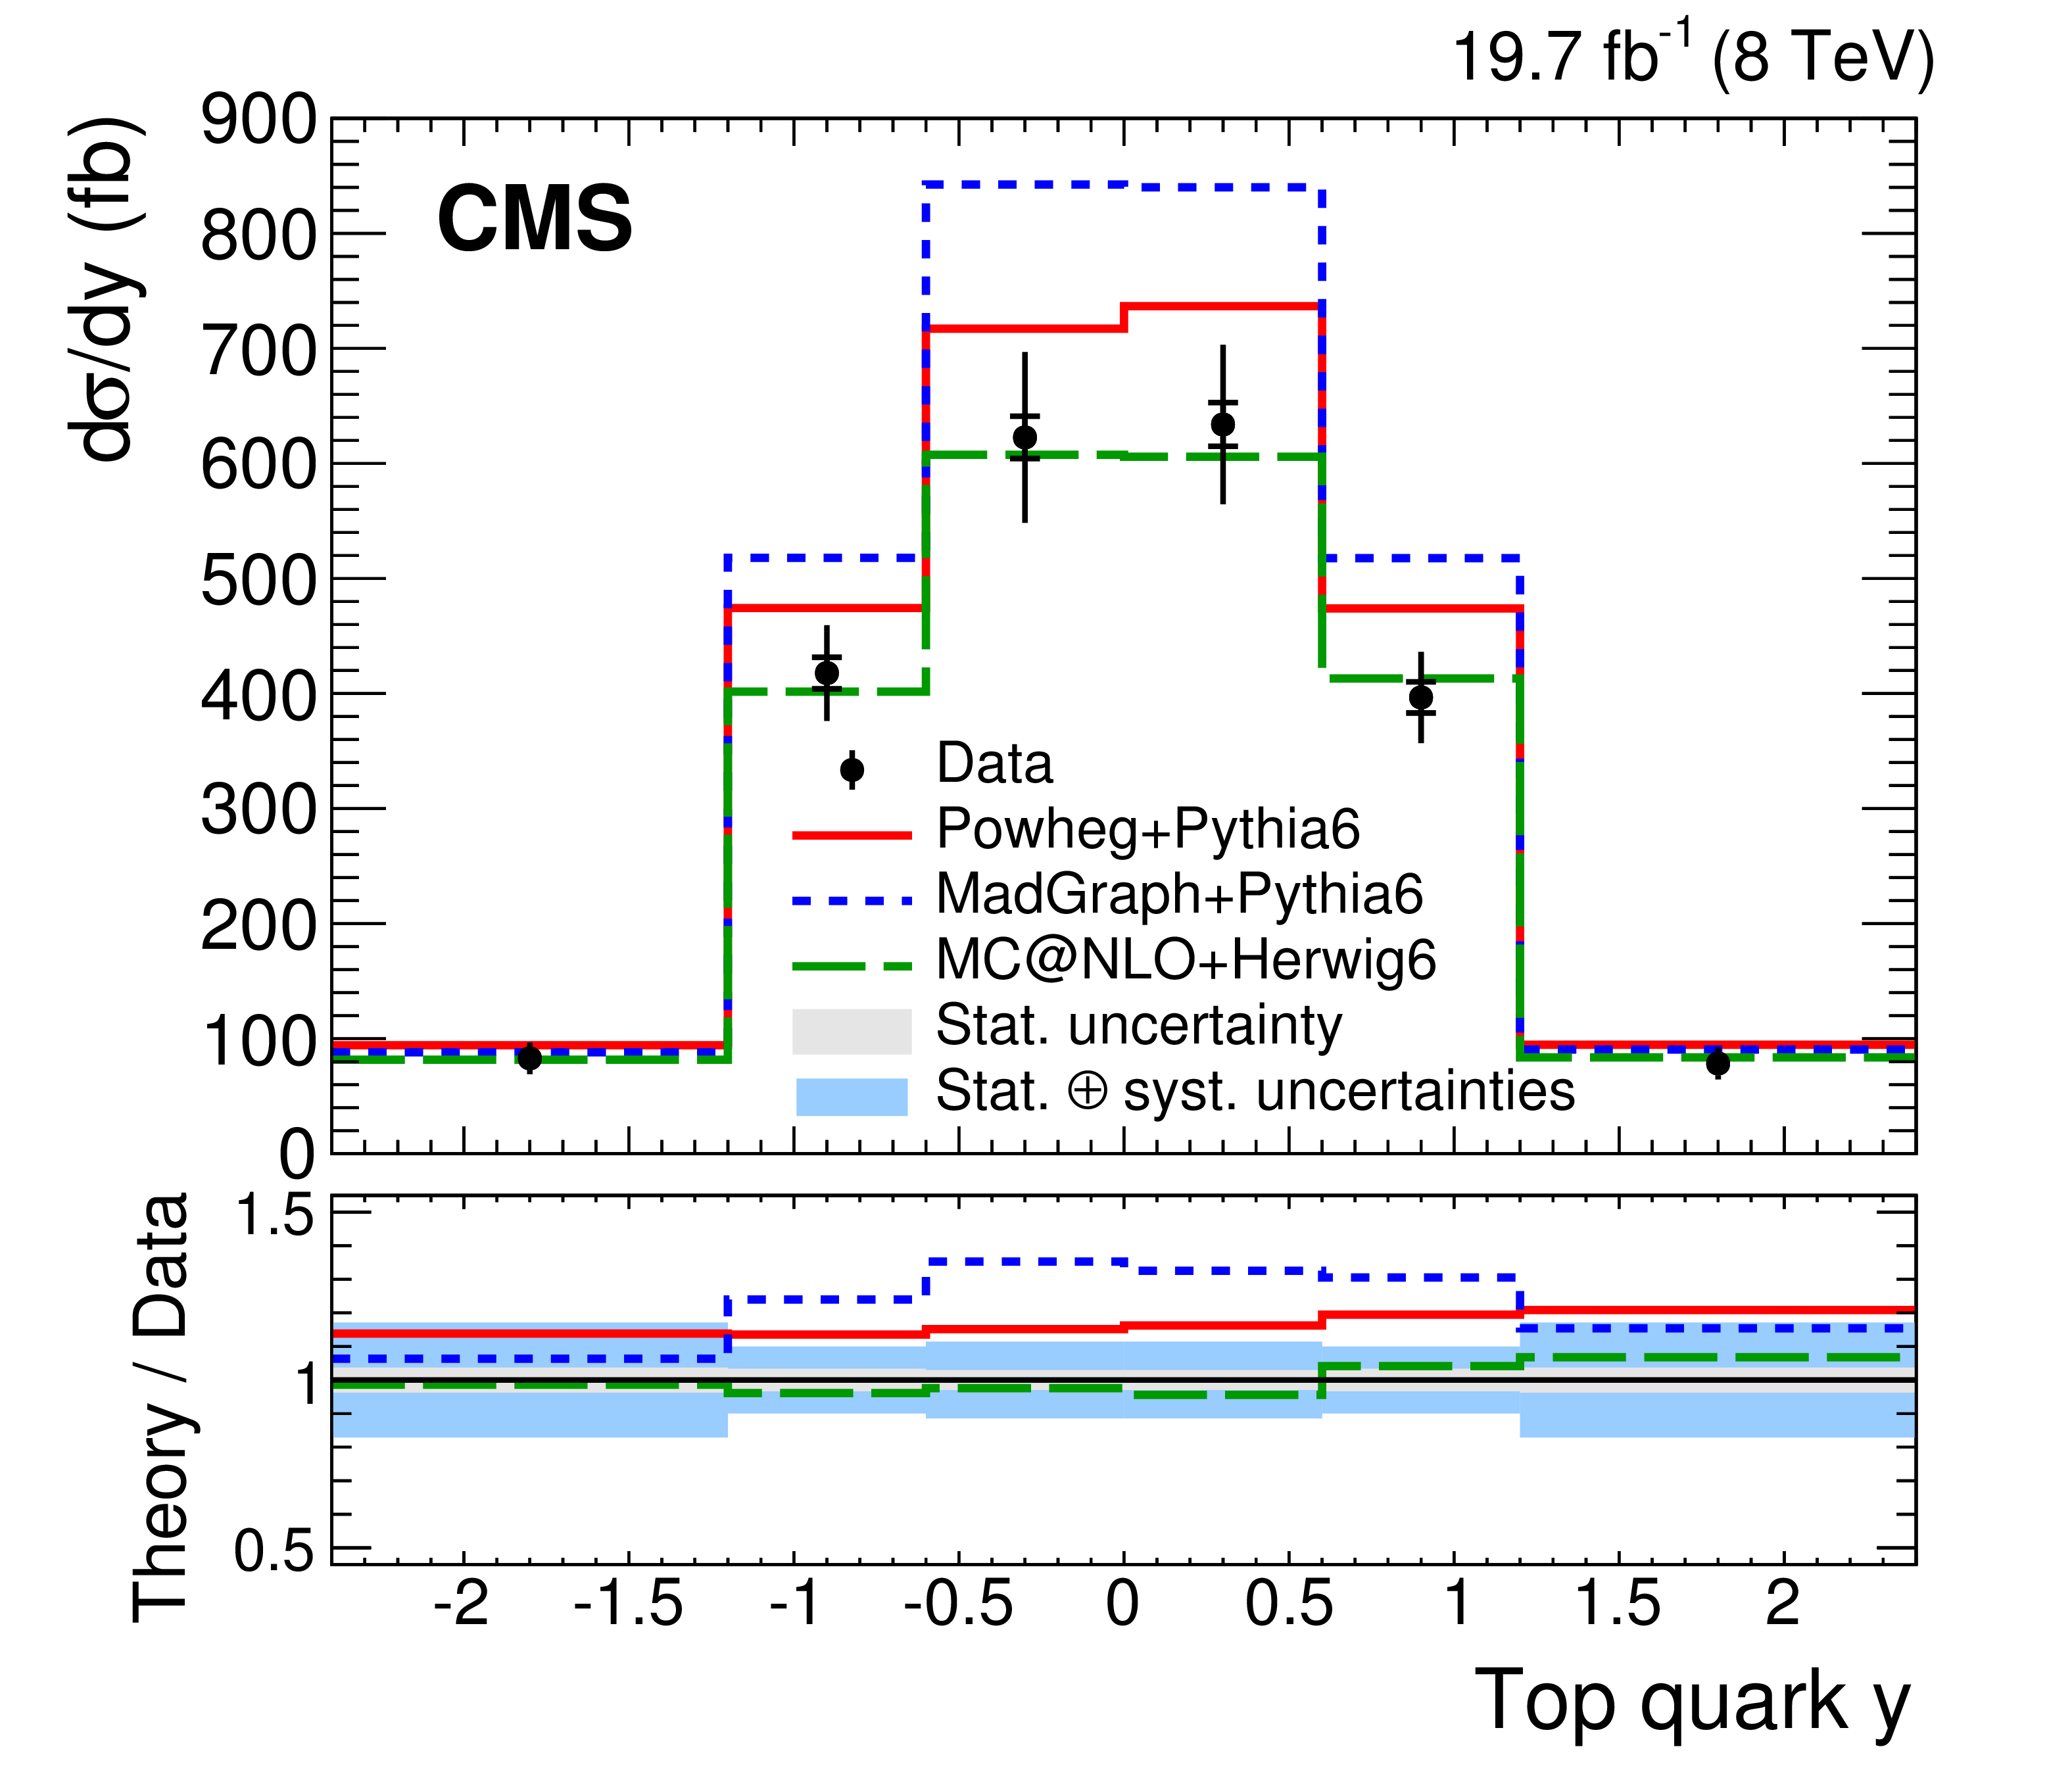
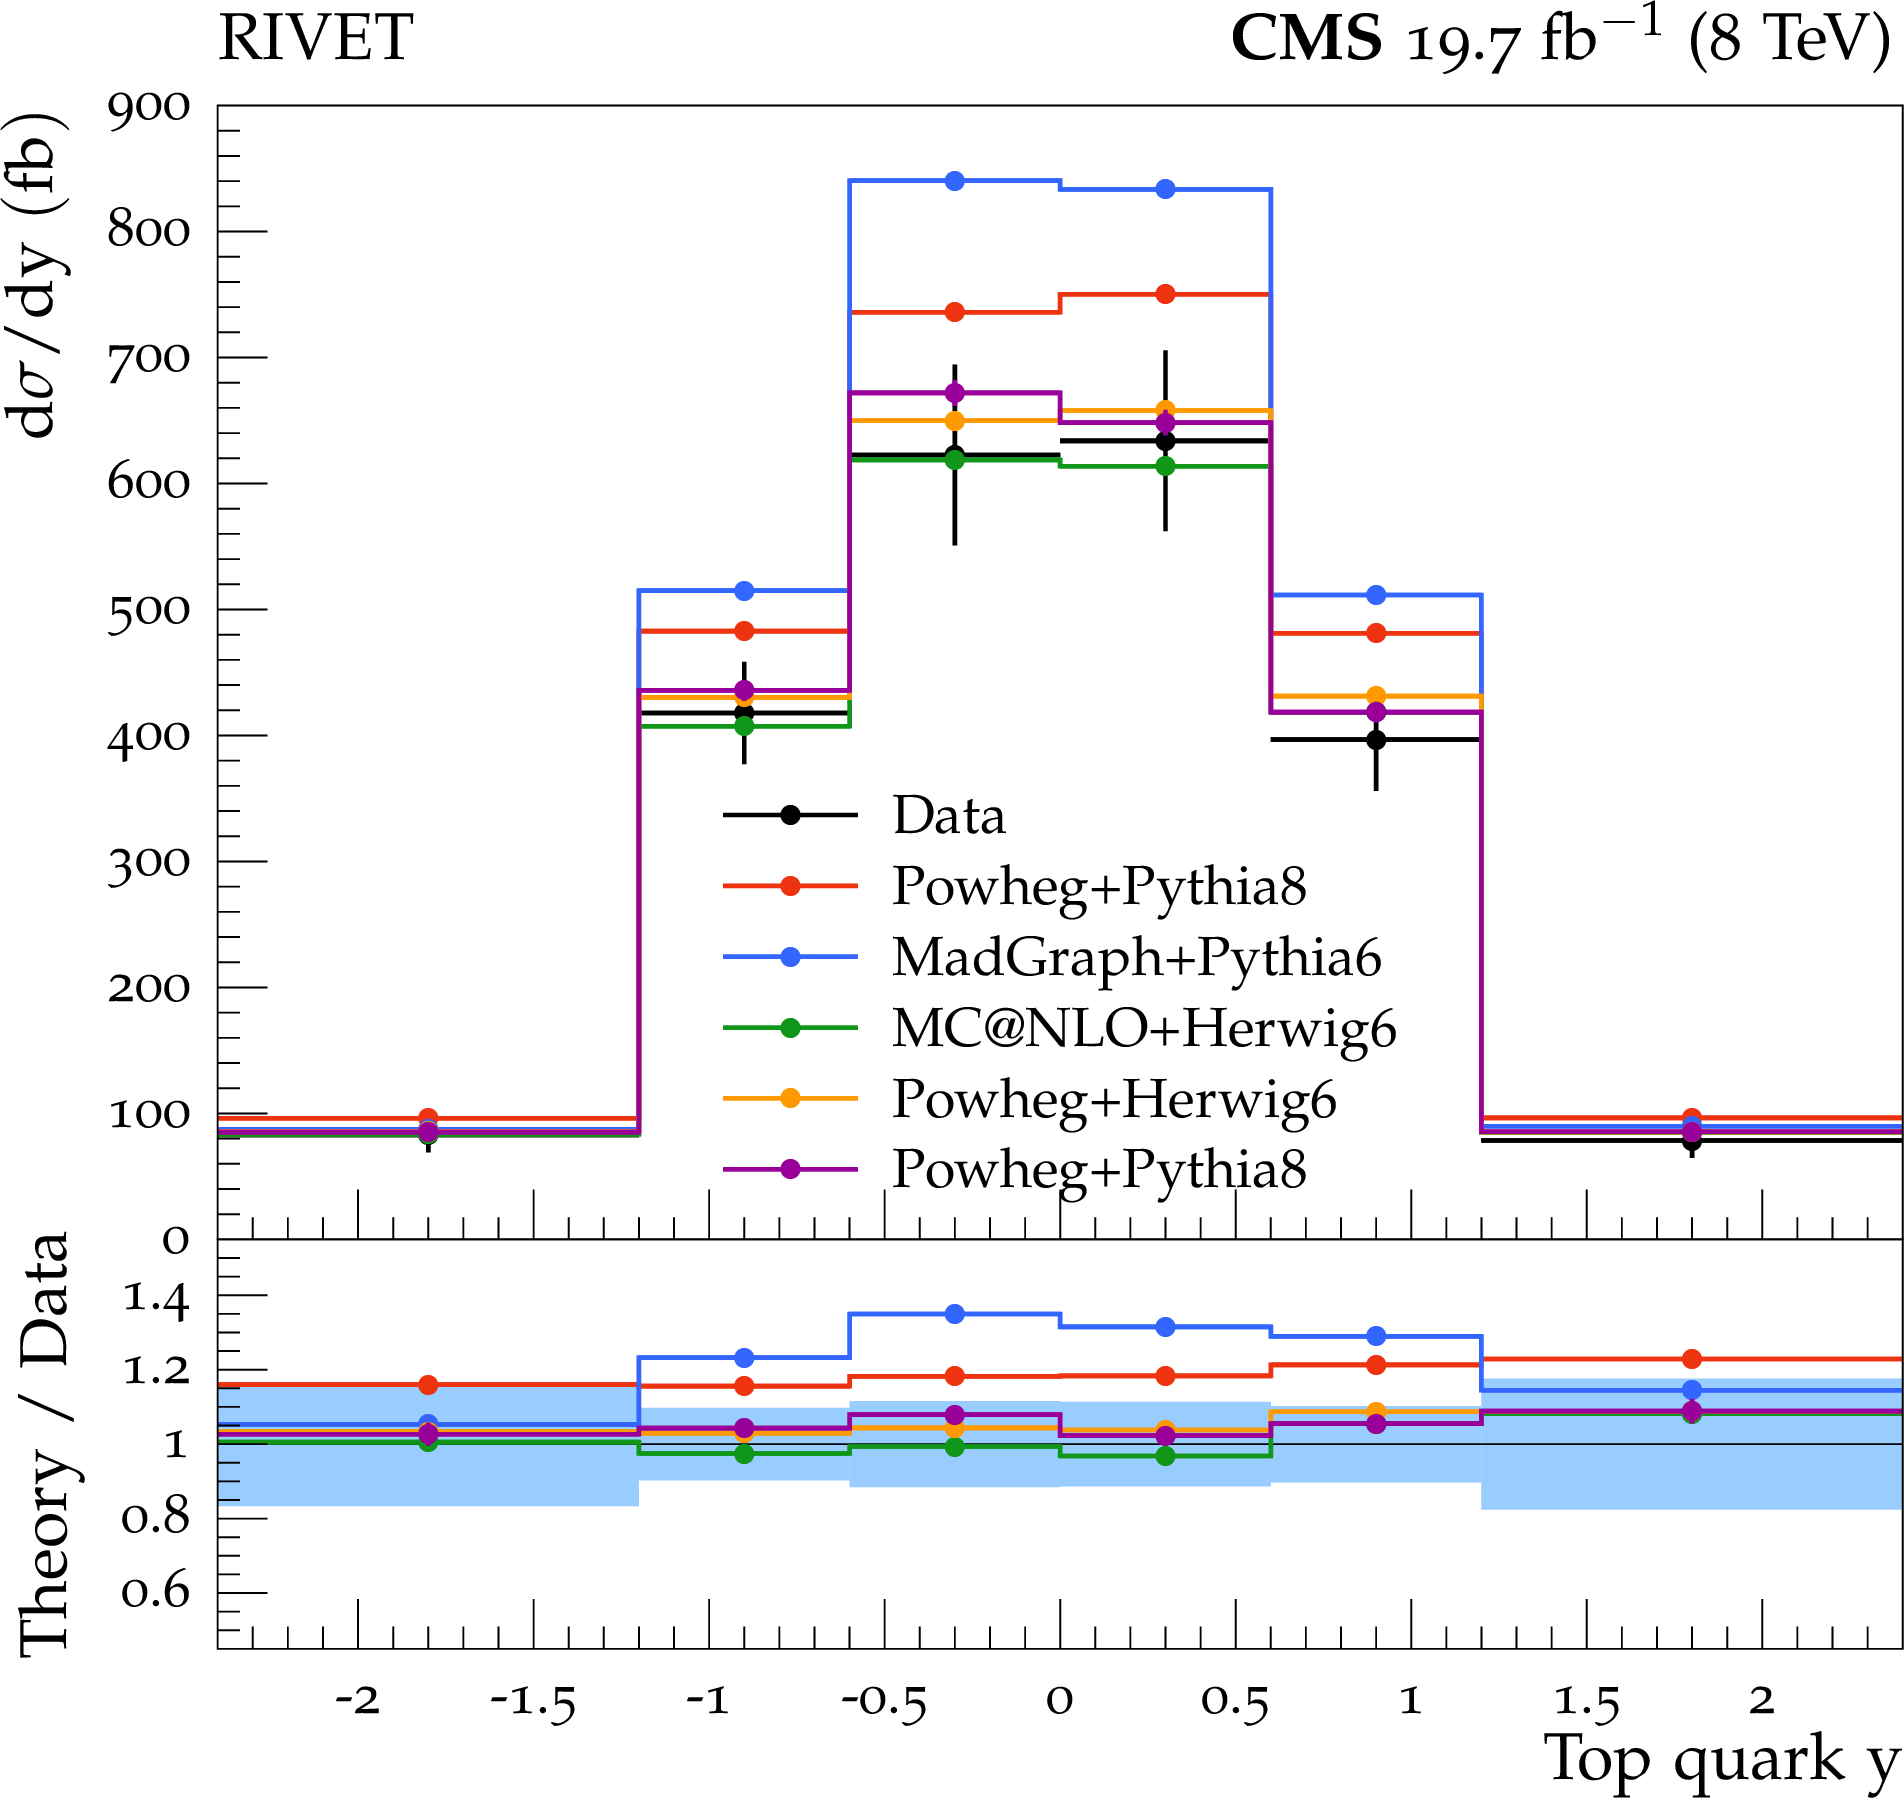
Figure 4-d:
Differential $ {\mathrm{ t \bar{t} } } $ cross section in bins of particle-level $\mathrm{ t } $ jet $ {p_{\mathrm {T}}} $ (a), parton-level top quark $ {p_{\mathrm {T}}} $ (b), particle-level $\mathrm{ t } $ jet $y$ (c), and parton-level top quark $y$ (d), including all systematic uncertainties. The lower plots show the ratio of the theoretical predictions to the data. The statistical uncertainties are represented by the inner vertical bars with ticks and the light bands in the ratios. The combined uncertainties are shown as full vertical bars and the dark solid bands in the ratios. |
png pdf |
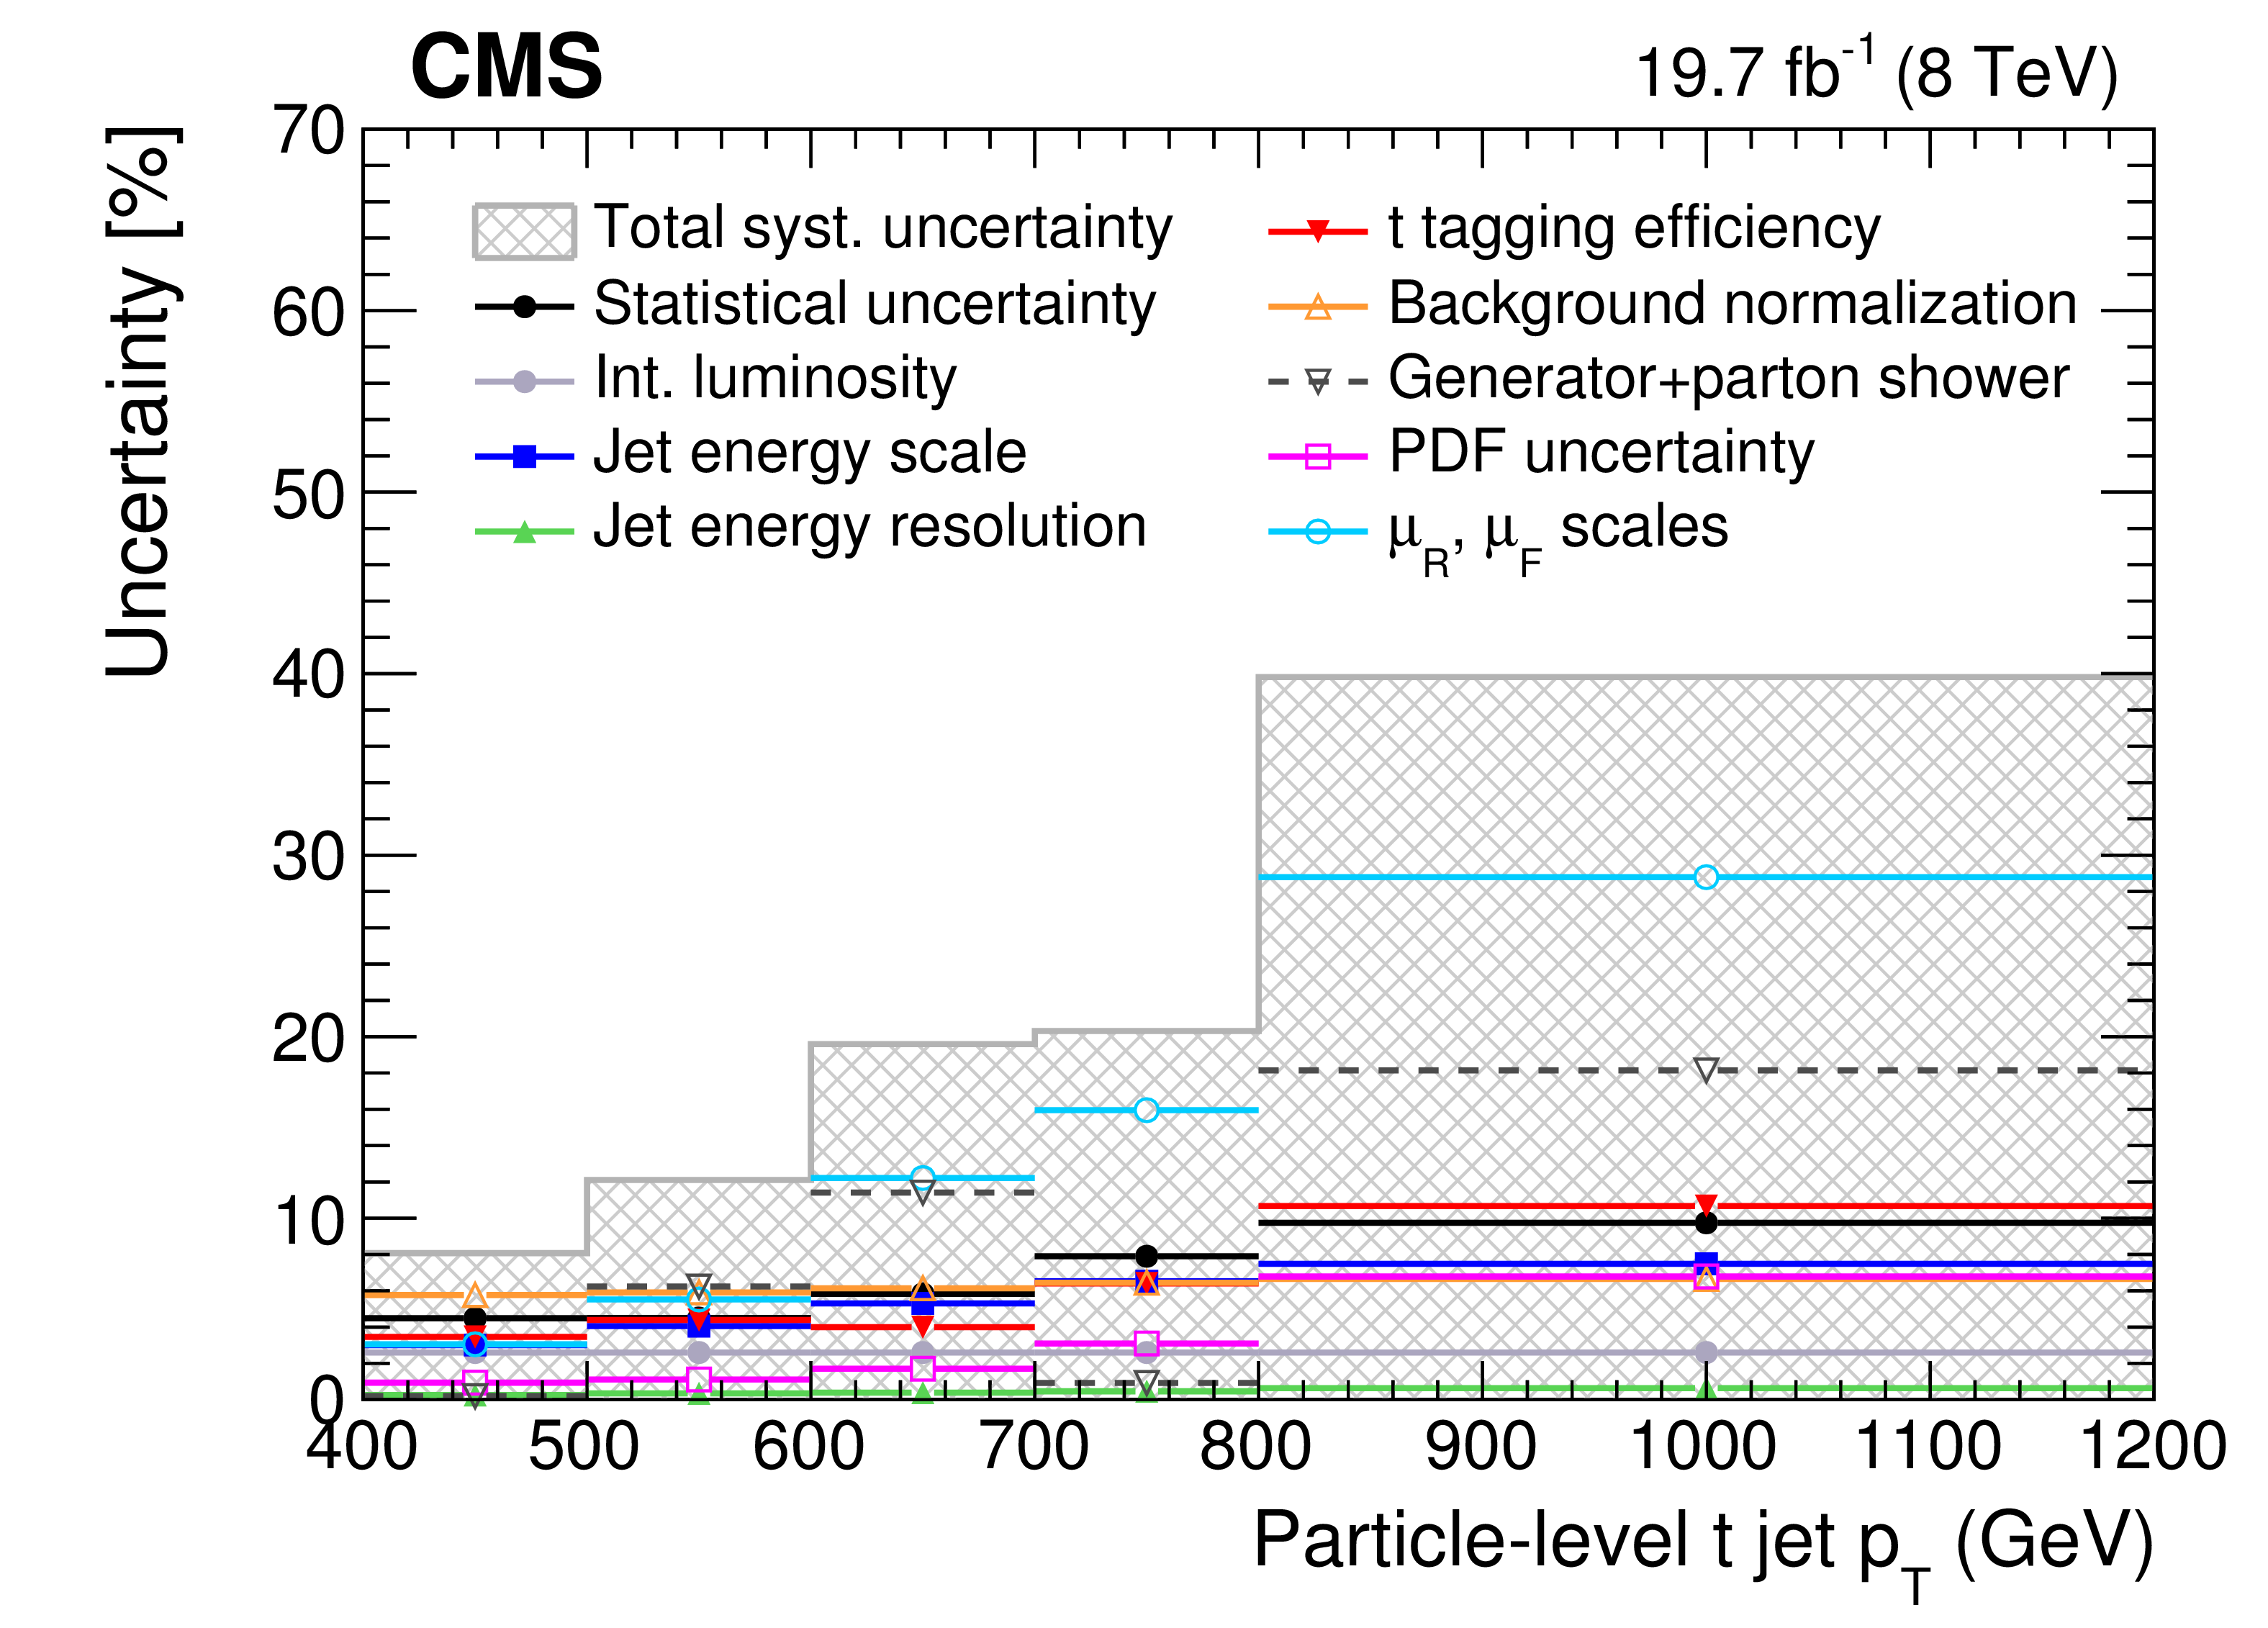
Figure 5-a:
Total systematic uncertainties (cross-hatched regions), as well as individual contributions and statistical-only uncertainties (points) in percent as a function of particle-level $\mathrm{ t } $ jet $ {p_{\mathrm {T}}} $ (a), parton-level top quark $ {p_{\mathrm {T}}} $ (b), particle-level $\mathrm{ t } $ jet $y$ (c), and parton-level top quark $y$ (d) for the differential cross section measurements. The horizontal bars on the points show the bin widths. |
png pdf |
Figure 5-b:
Total systematic uncertainties (cross-hatched regions), as well as individual contributions and statistical-only uncertainties (points) in percent as a function of particle-level $\mathrm{ t } $ jet $ {p_{\mathrm {T}}} $ (a), parton-level top quark $ {p_{\mathrm {T}}} $ (b), particle-level $\mathrm{ t } $ jet $y$ (c), and parton-level top quark $y$ (d) for the differential cross section measurements. The horizontal bars on the points show the bin widths. |
png pdf |
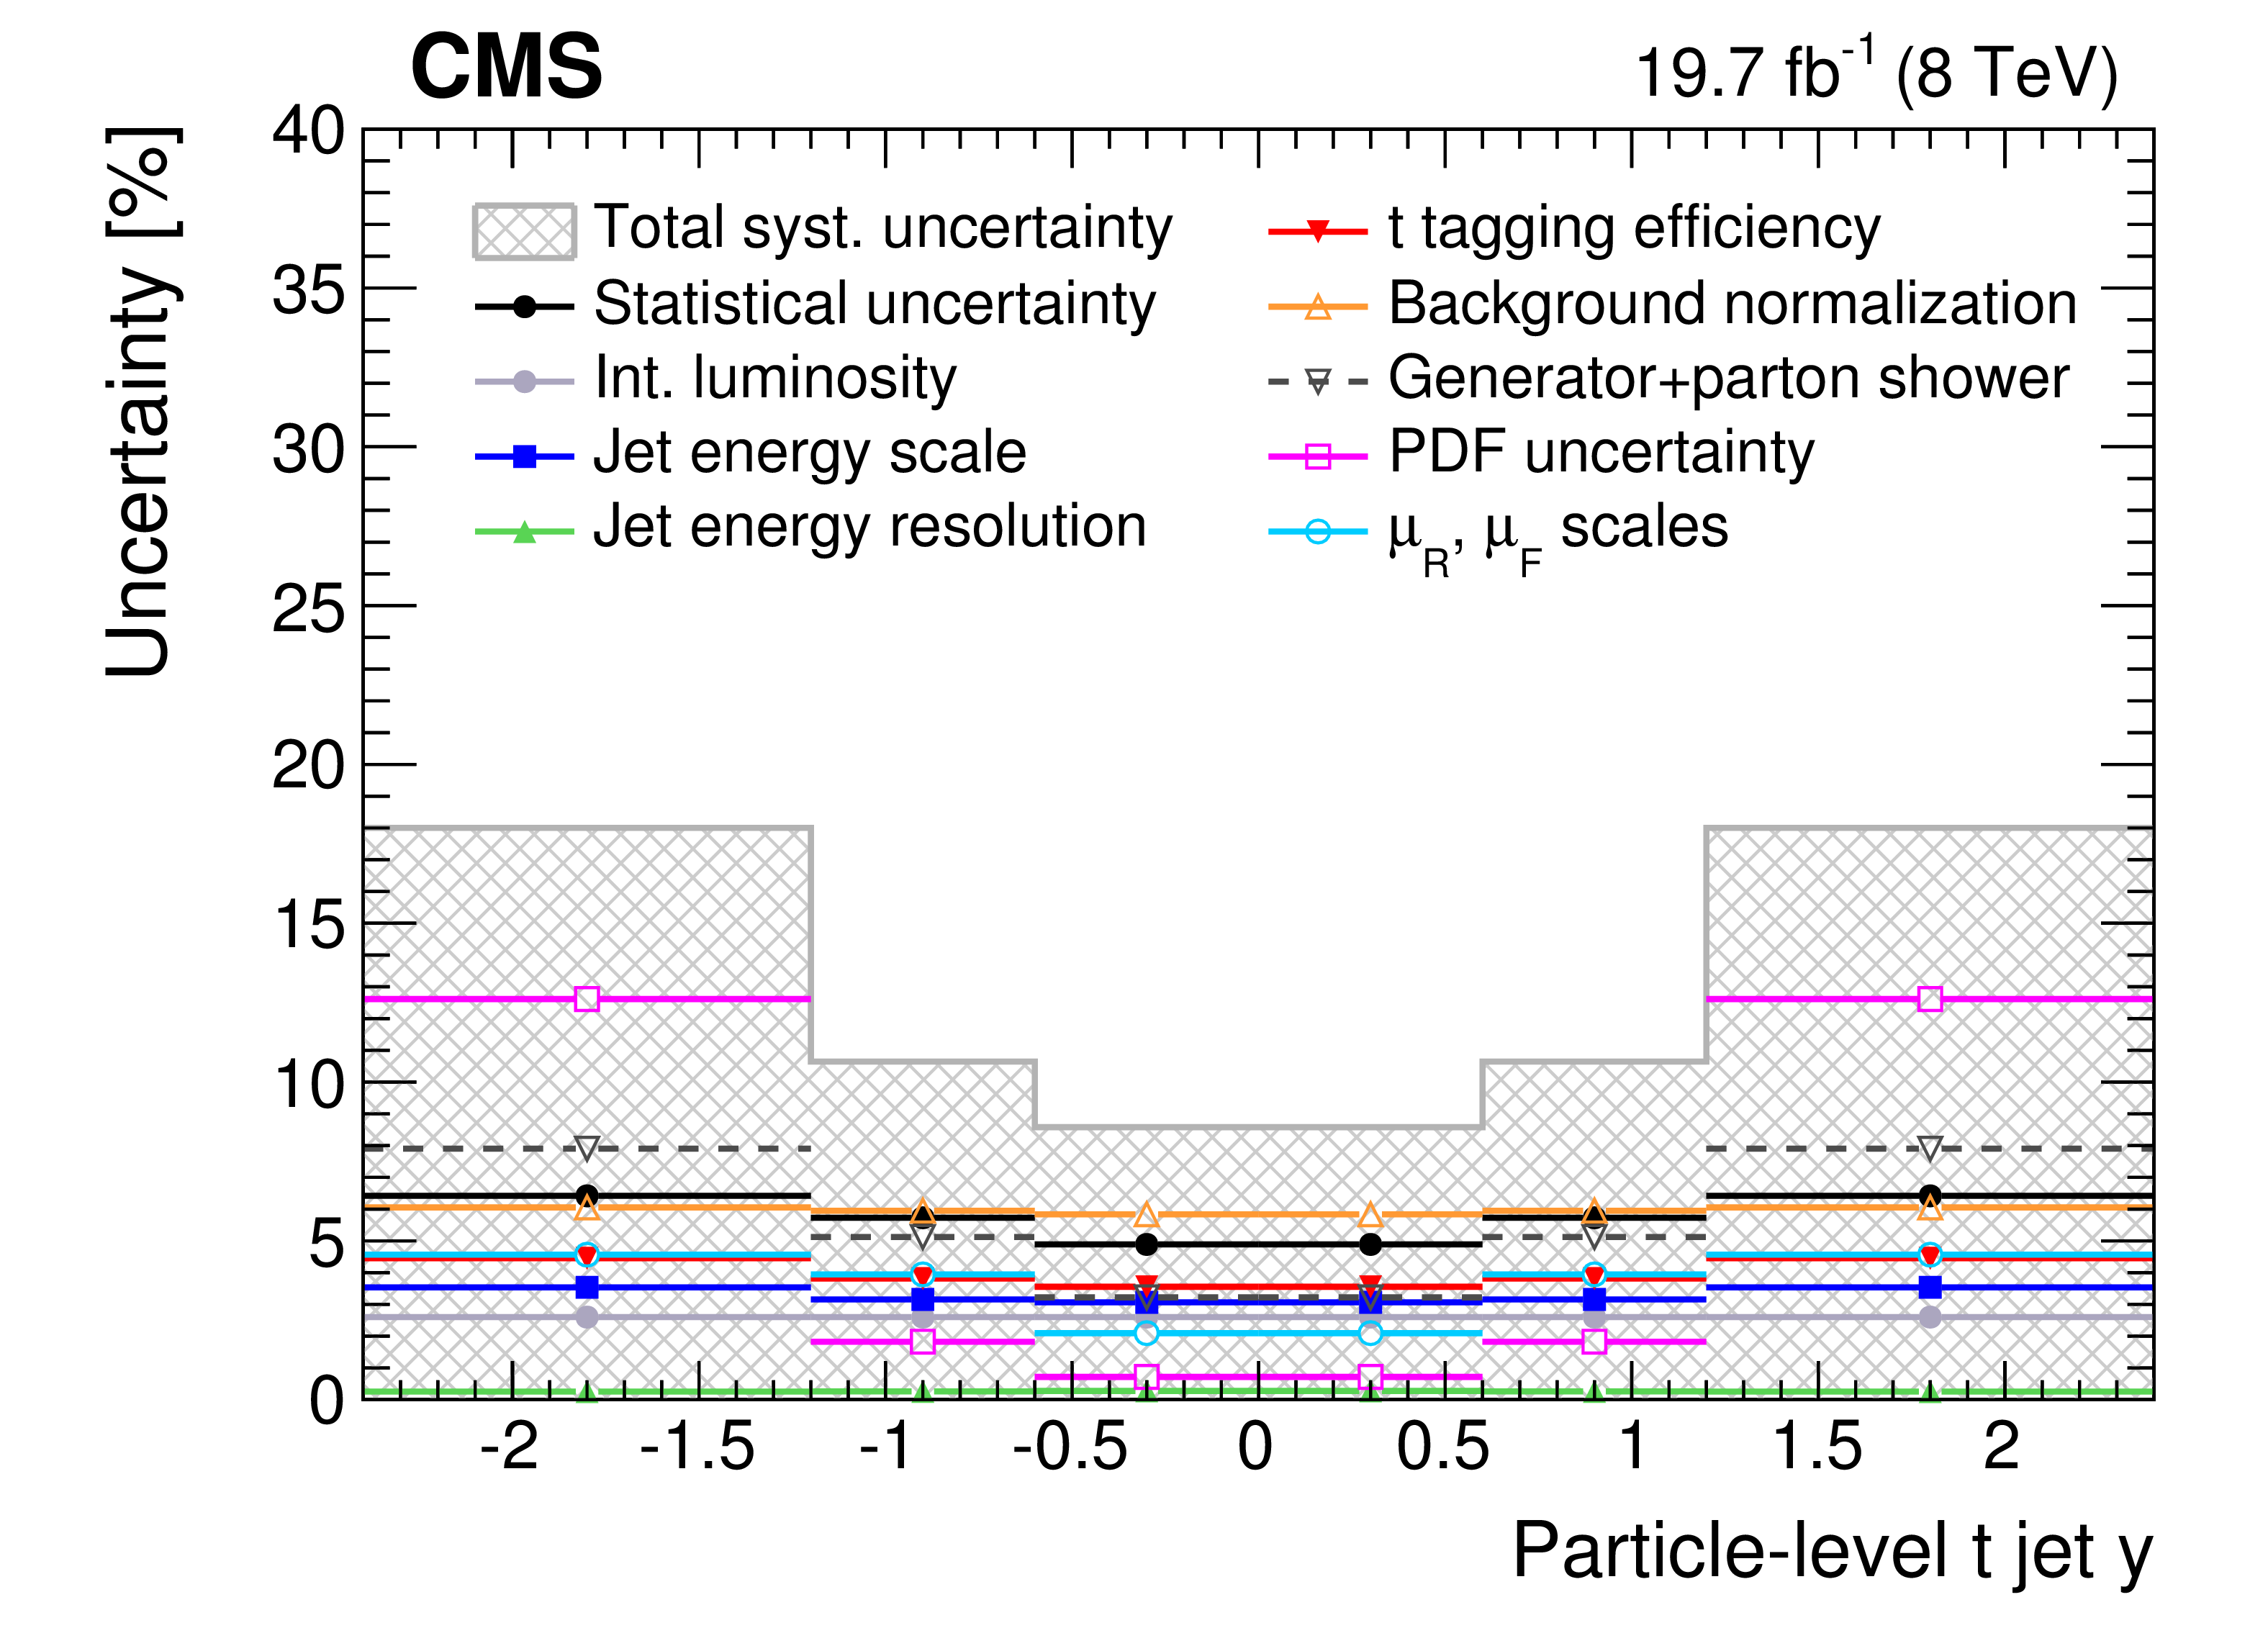
Figure 5-c:
Total systematic uncertainties (cross-hatched regions), as well as individual contributions and statistical-only uncertainties (points) in percent as a function of particle-level $\mathrm{ t } $ jet $ {p_{\mathrm {T}}} $ (a), parton-level top quark $ {p_{\mathrm {T}}} $ (b), particle-level $\mathrm{ t } $ jet $y$ (c), and parton-level top quark $y$ (d) for the differential cross section measurements. The horizontal bars on the points show the bin widths. |
png pdf |
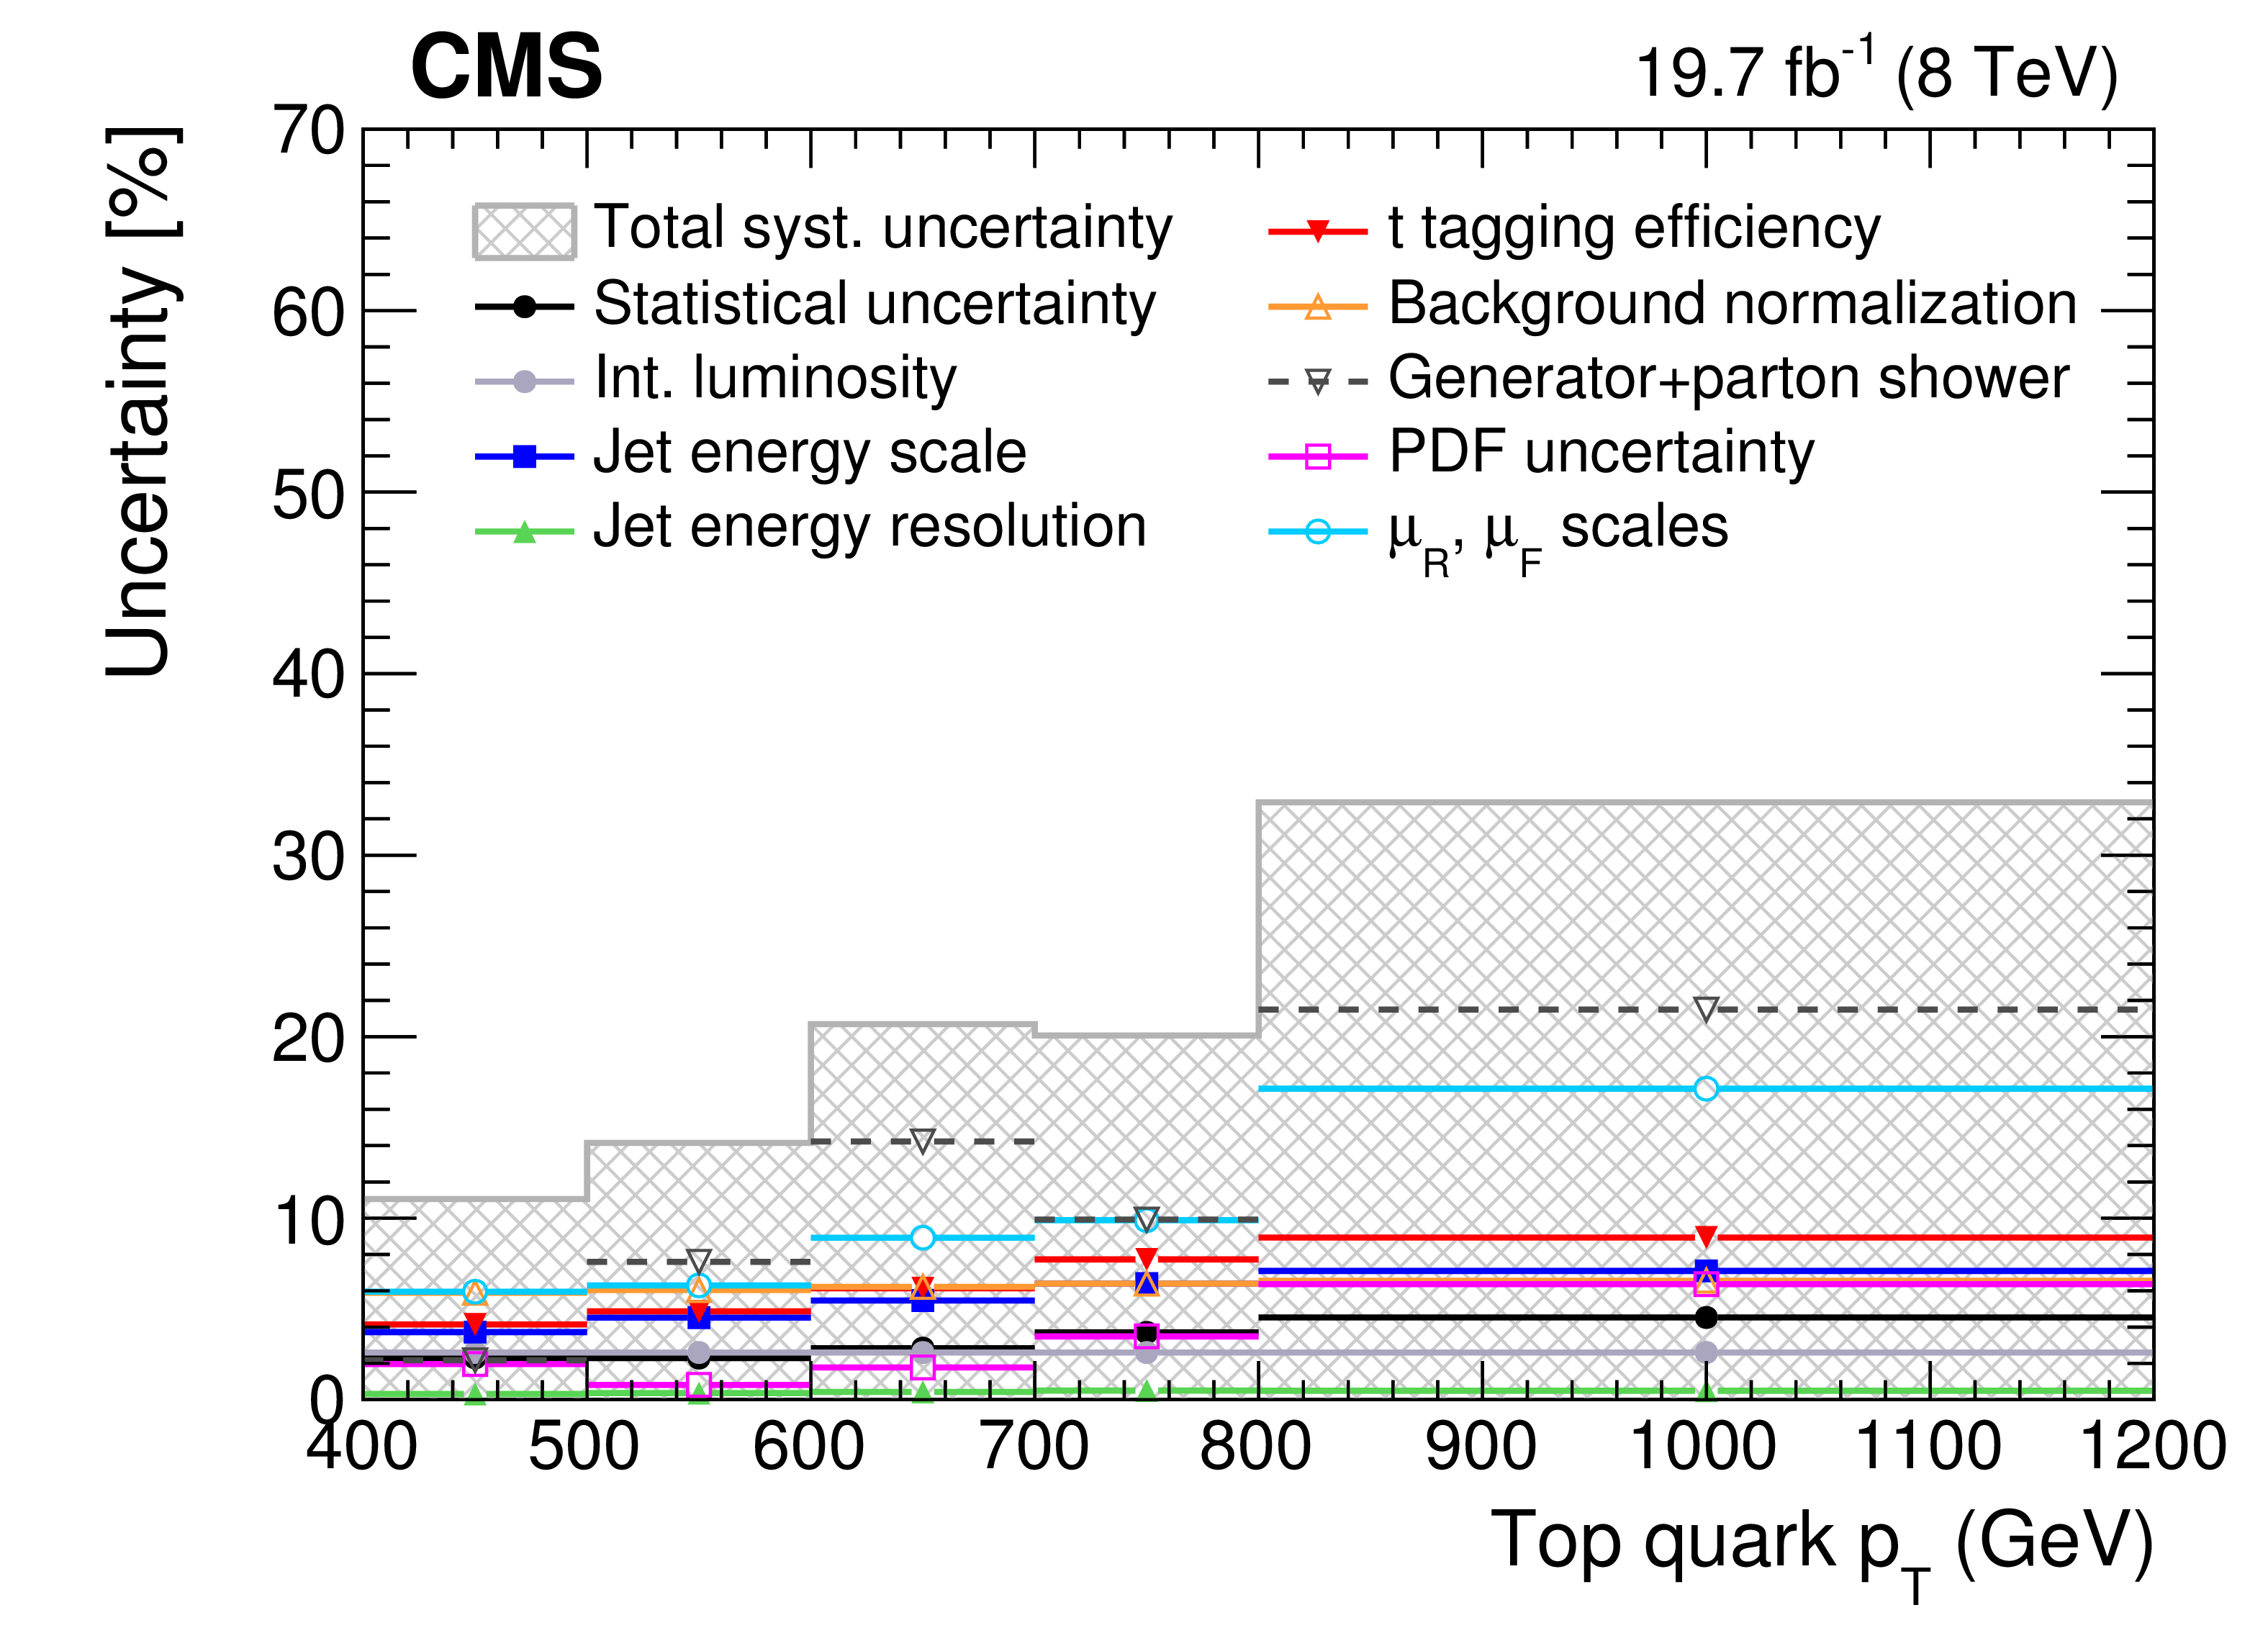
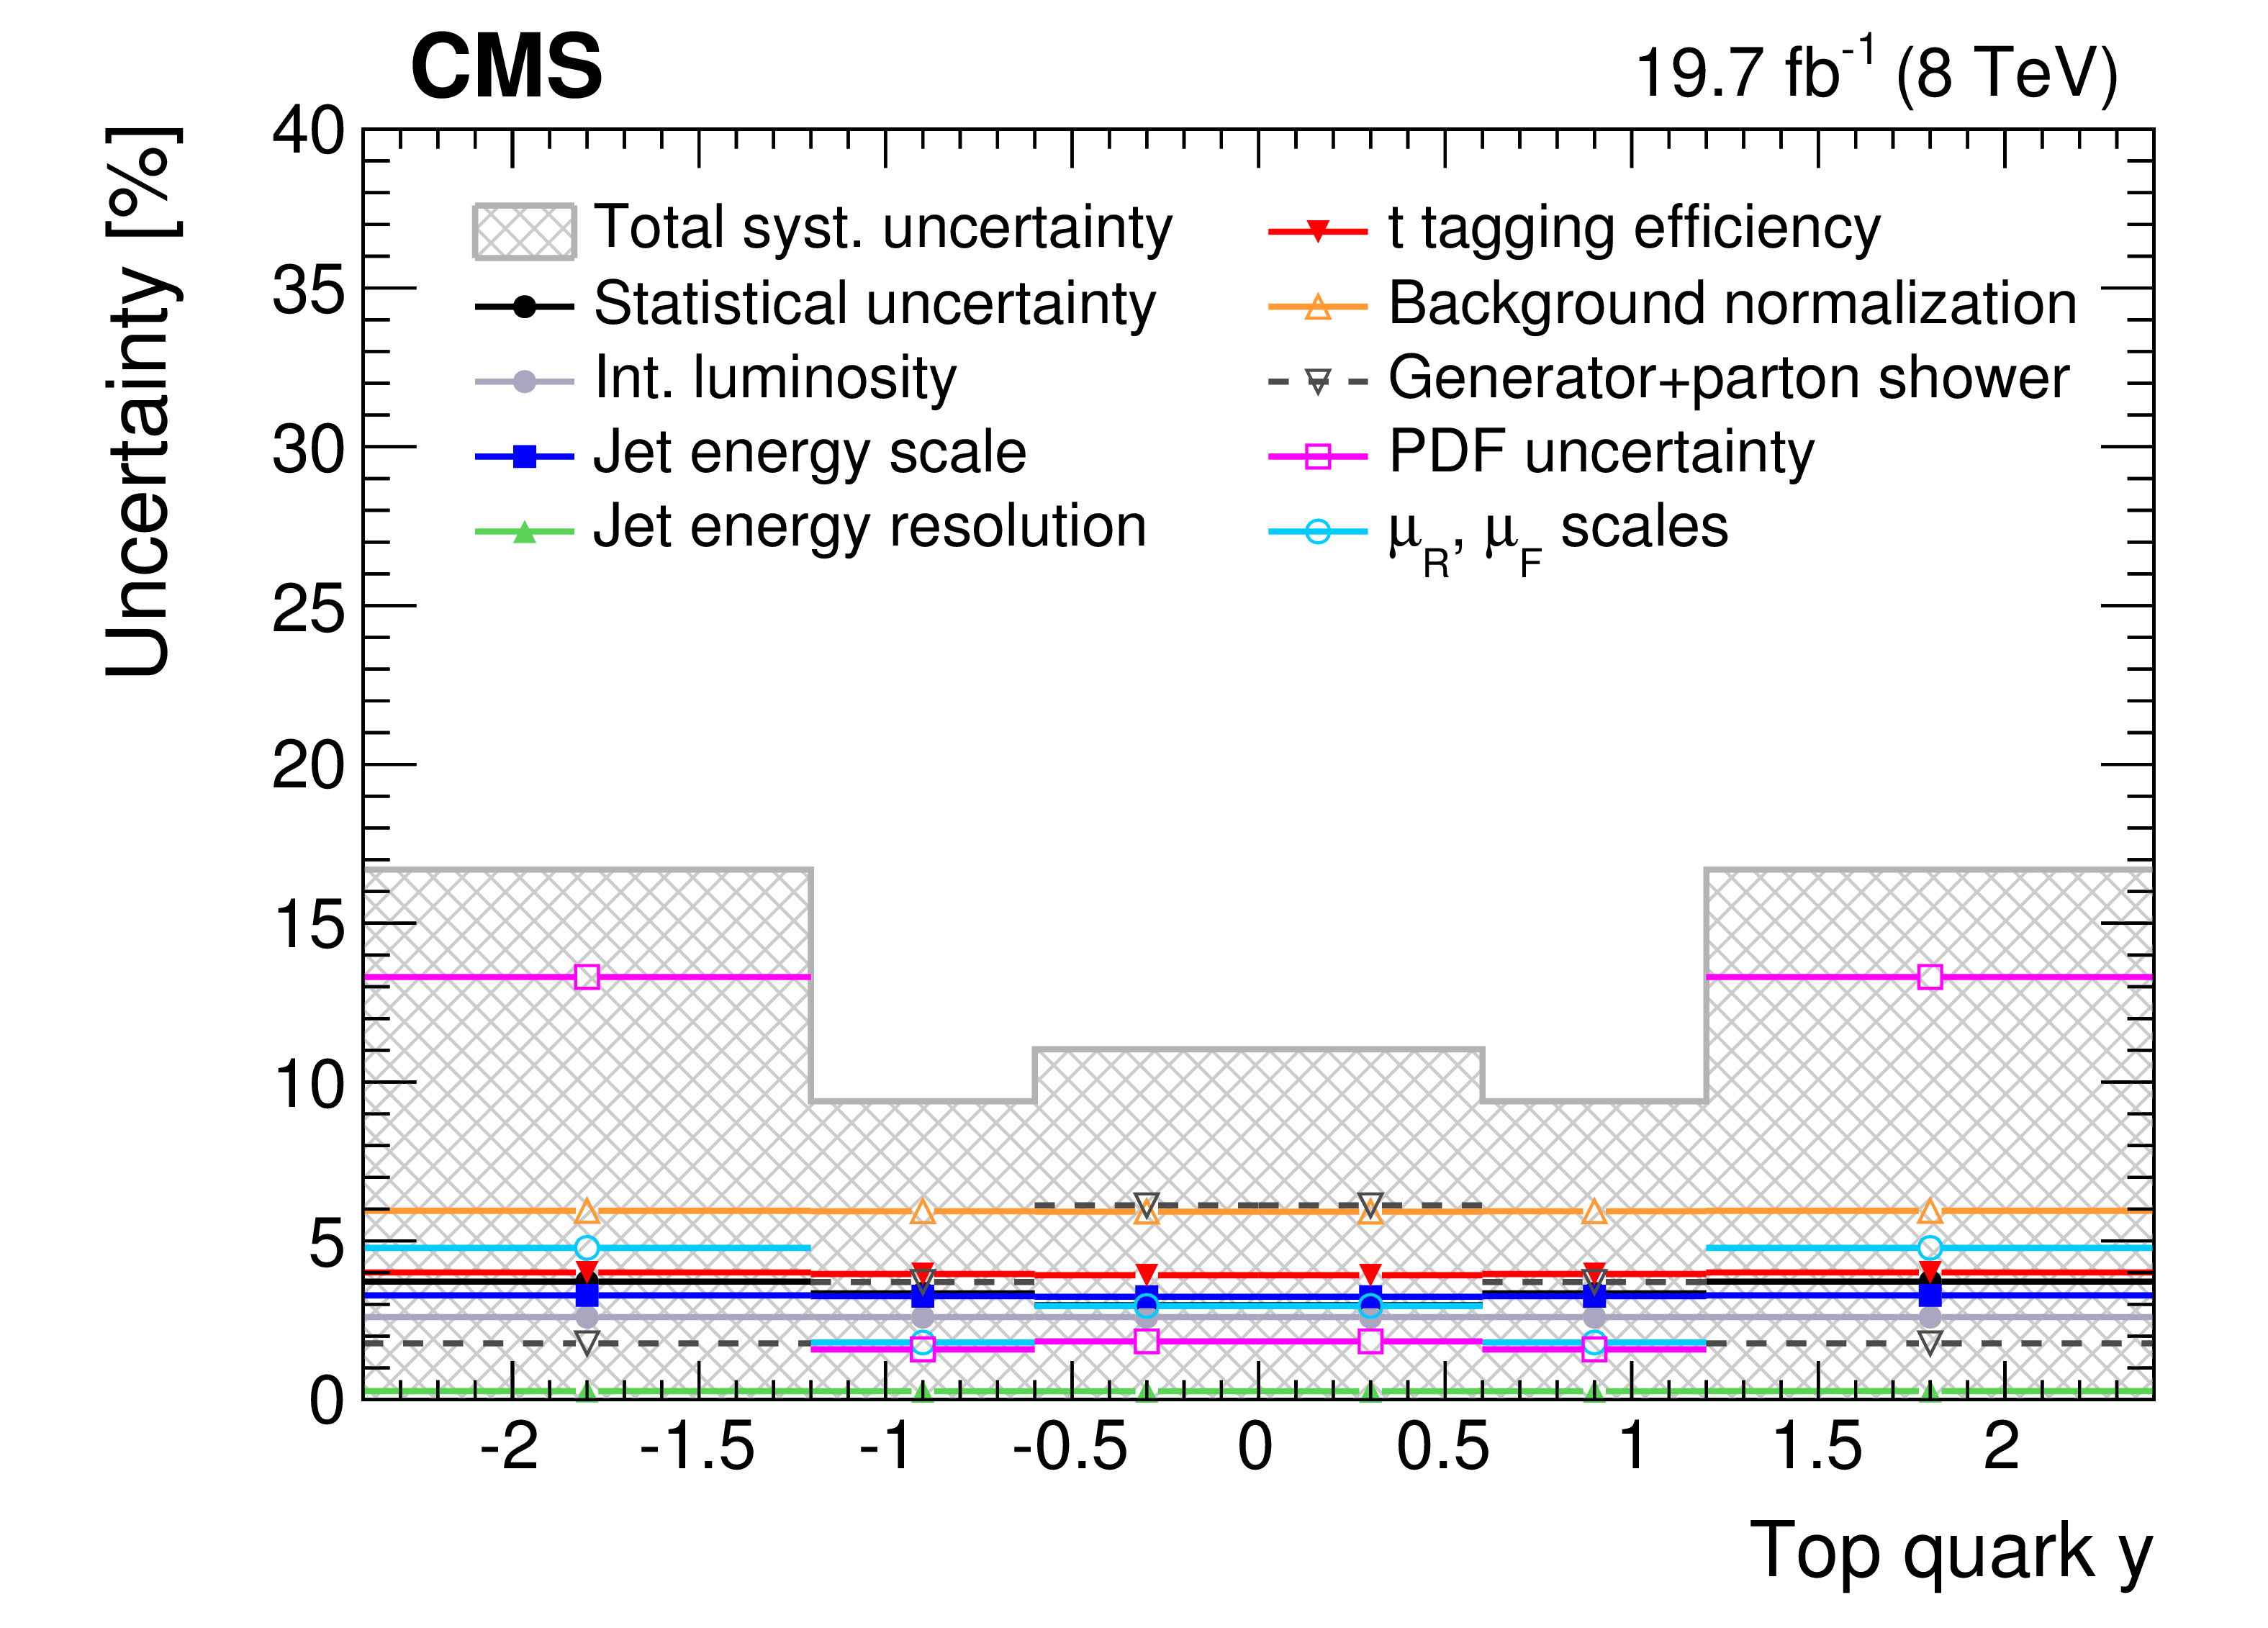
Figure 5-d:
Total systematic uncertainties (cross-hatched regions), as well as individual contributions and statistical-only uncertainties (points) in percent as a function of particle-level $\mathrm{ t } $ jet $ {p_{\mathrm {T}}} $ (a), parton-level top quark $ {p_{\mathrm {T}}} $ (b), particle-level $\mathrm{ t } $ jet $y$ (c), and parton-level top quark $y$ (d) for the differential cross section measurements. The horizontal bars on the points show the bin widths. |
| Tables | |

png pdf |
Table 1:
Predicted numbers of signal and background events, as well as the total yield, together with the observed number of events in data, are shown after the combined maximum-likelihood fit for the e+jets (top) and $\mu $+jets (bottom) categories. The uncertainties include the statistical component from the fit, but not the theoretical uncertainties in the $ {\mathrm{ t \bar{t} } } $ signal. The uncertainties in the sum of backgrounds and the total yield are determined neglecting correlations for presentational purposes, although the full likelihood with correlations is used to compute the uncertainties in the measurements of the cross section. |
png pdf |
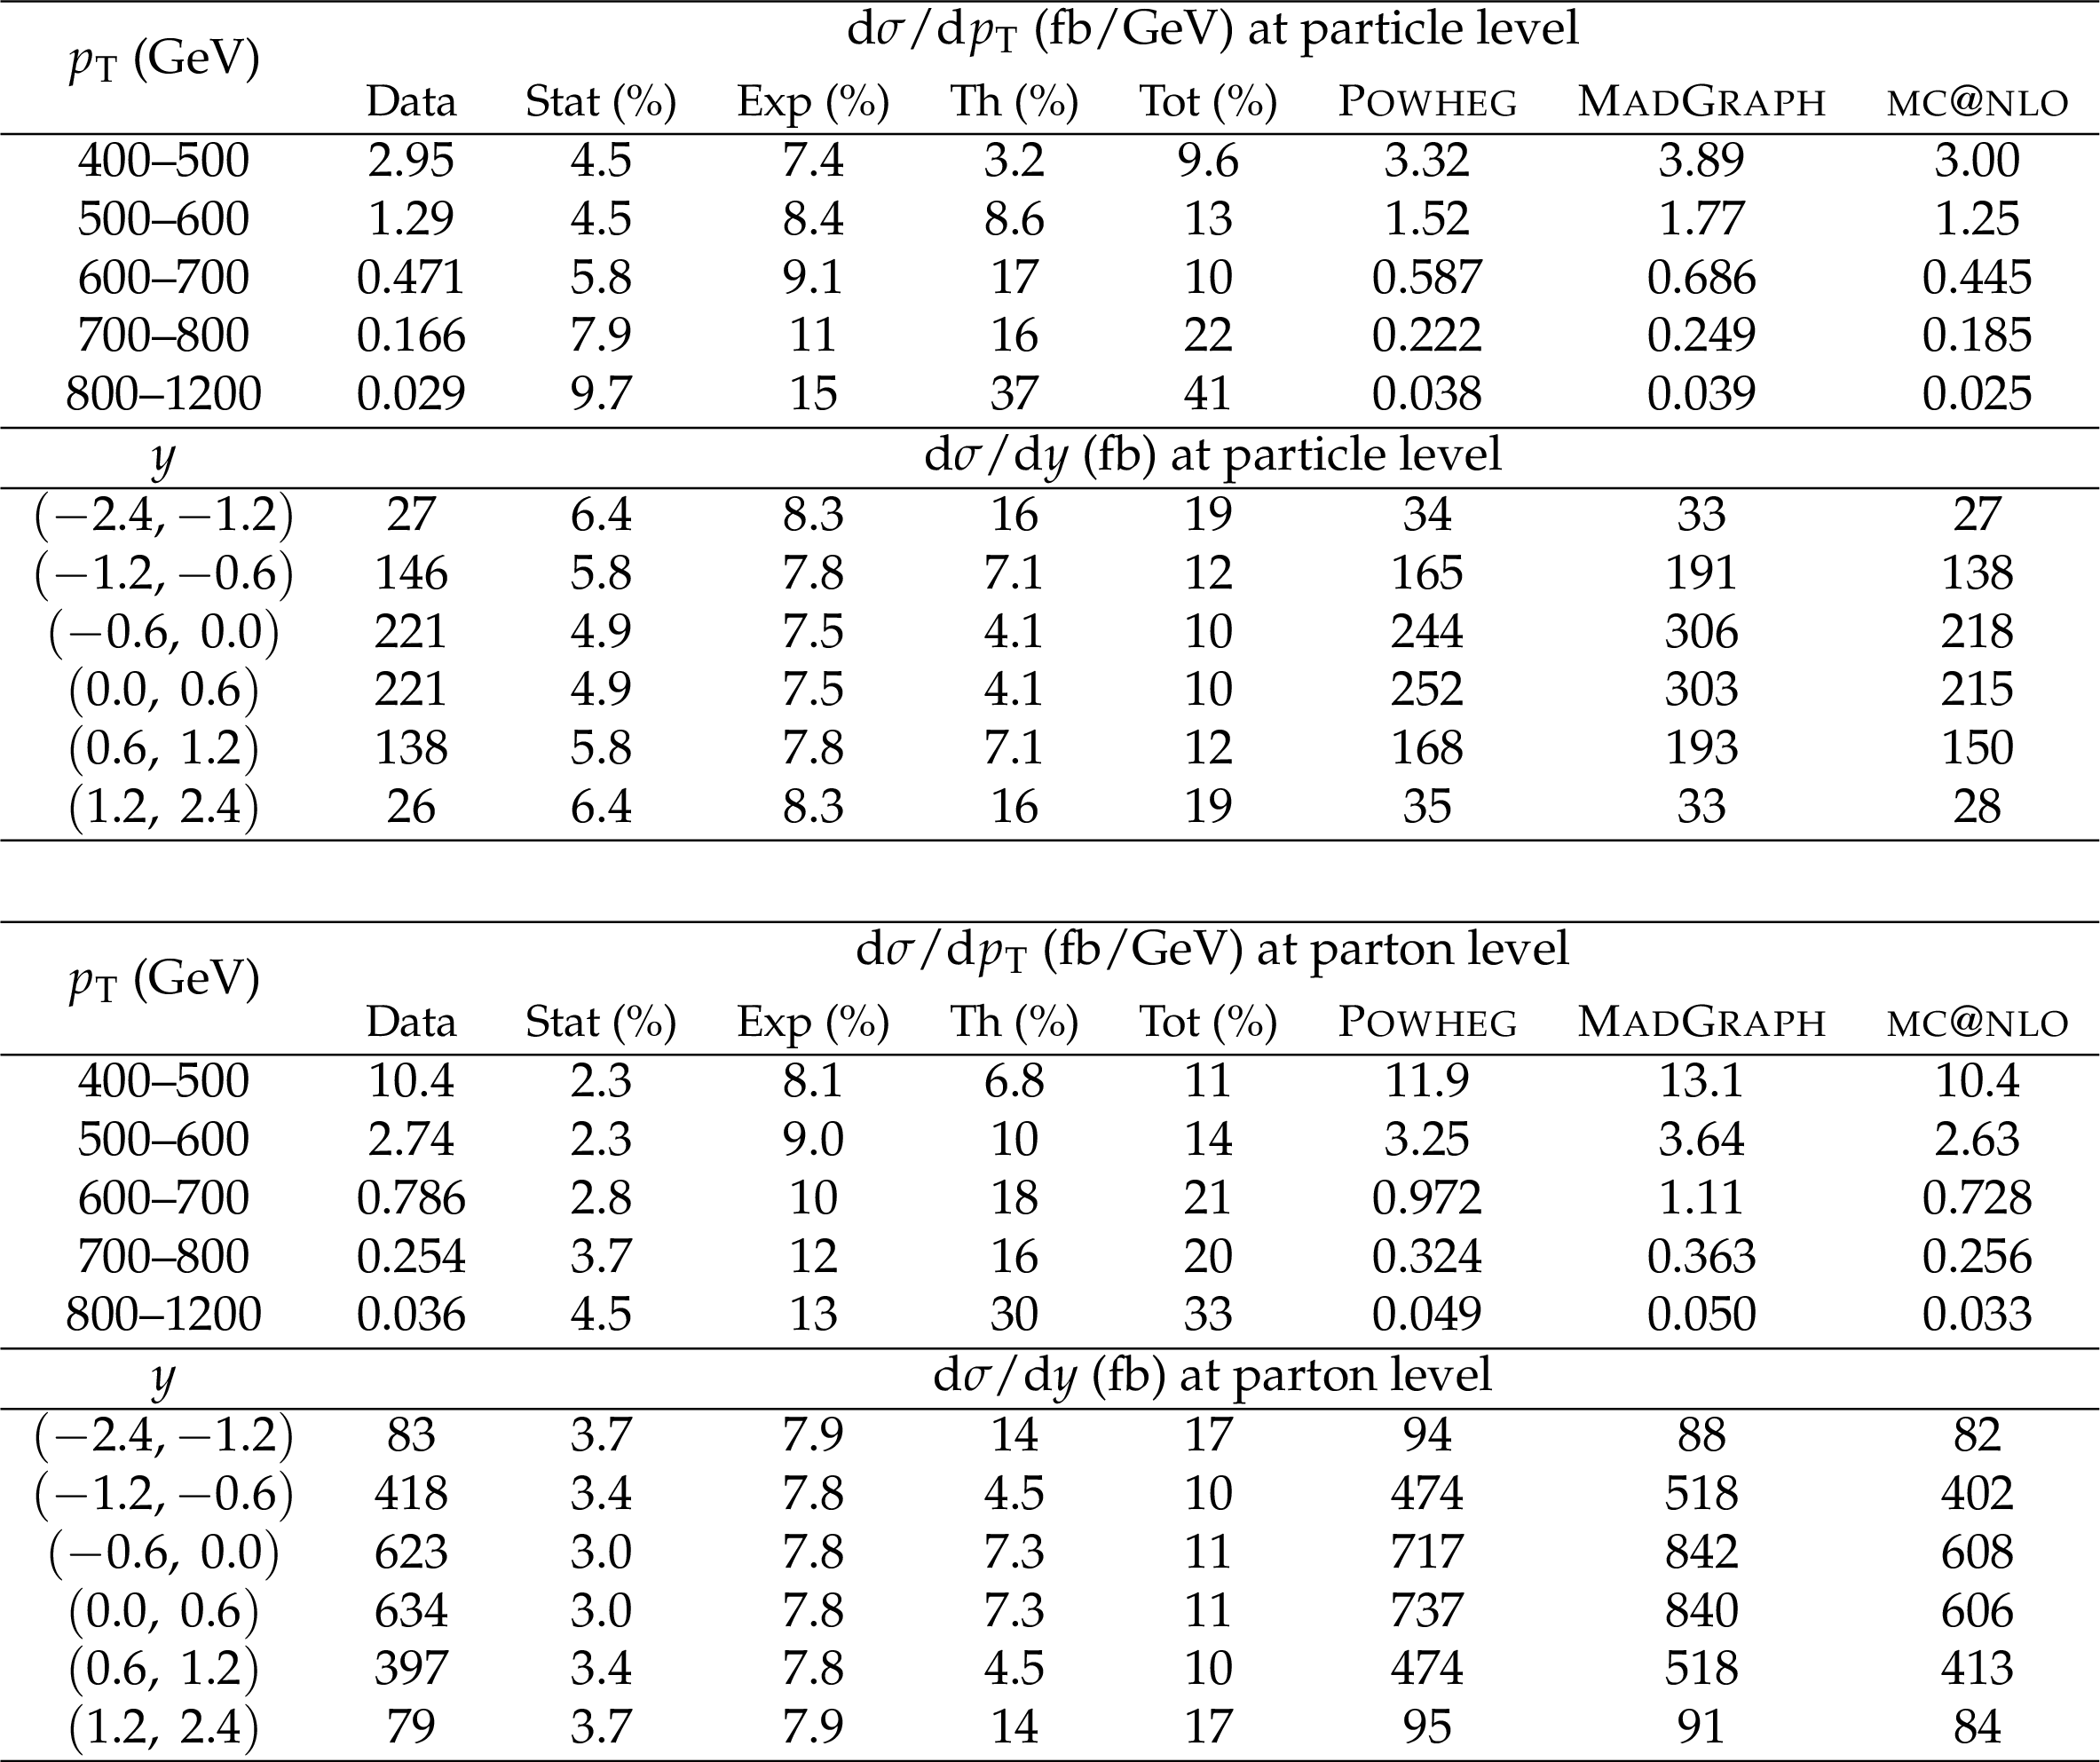
Table 2:
Differential $ {\mathrm{ t \bar{t} } } $ cross section in bins of $ {p_{\mathrm {T}}} $ and $y$ for the $\mathrm{ t } $ jet at the particle level (top) and the top quark at parton level (bottom). The measurements are compared to predictions from the Powheg+Pythia6, MadGraph+Pythia6, and mc@nlo+Herwig6 simulations. The total relative uncertainty (Tot) in the measurements is separated into relative statistical (Stat), experimental (Exp), and theoretical (Th) components, all in percent. |
png pdf |
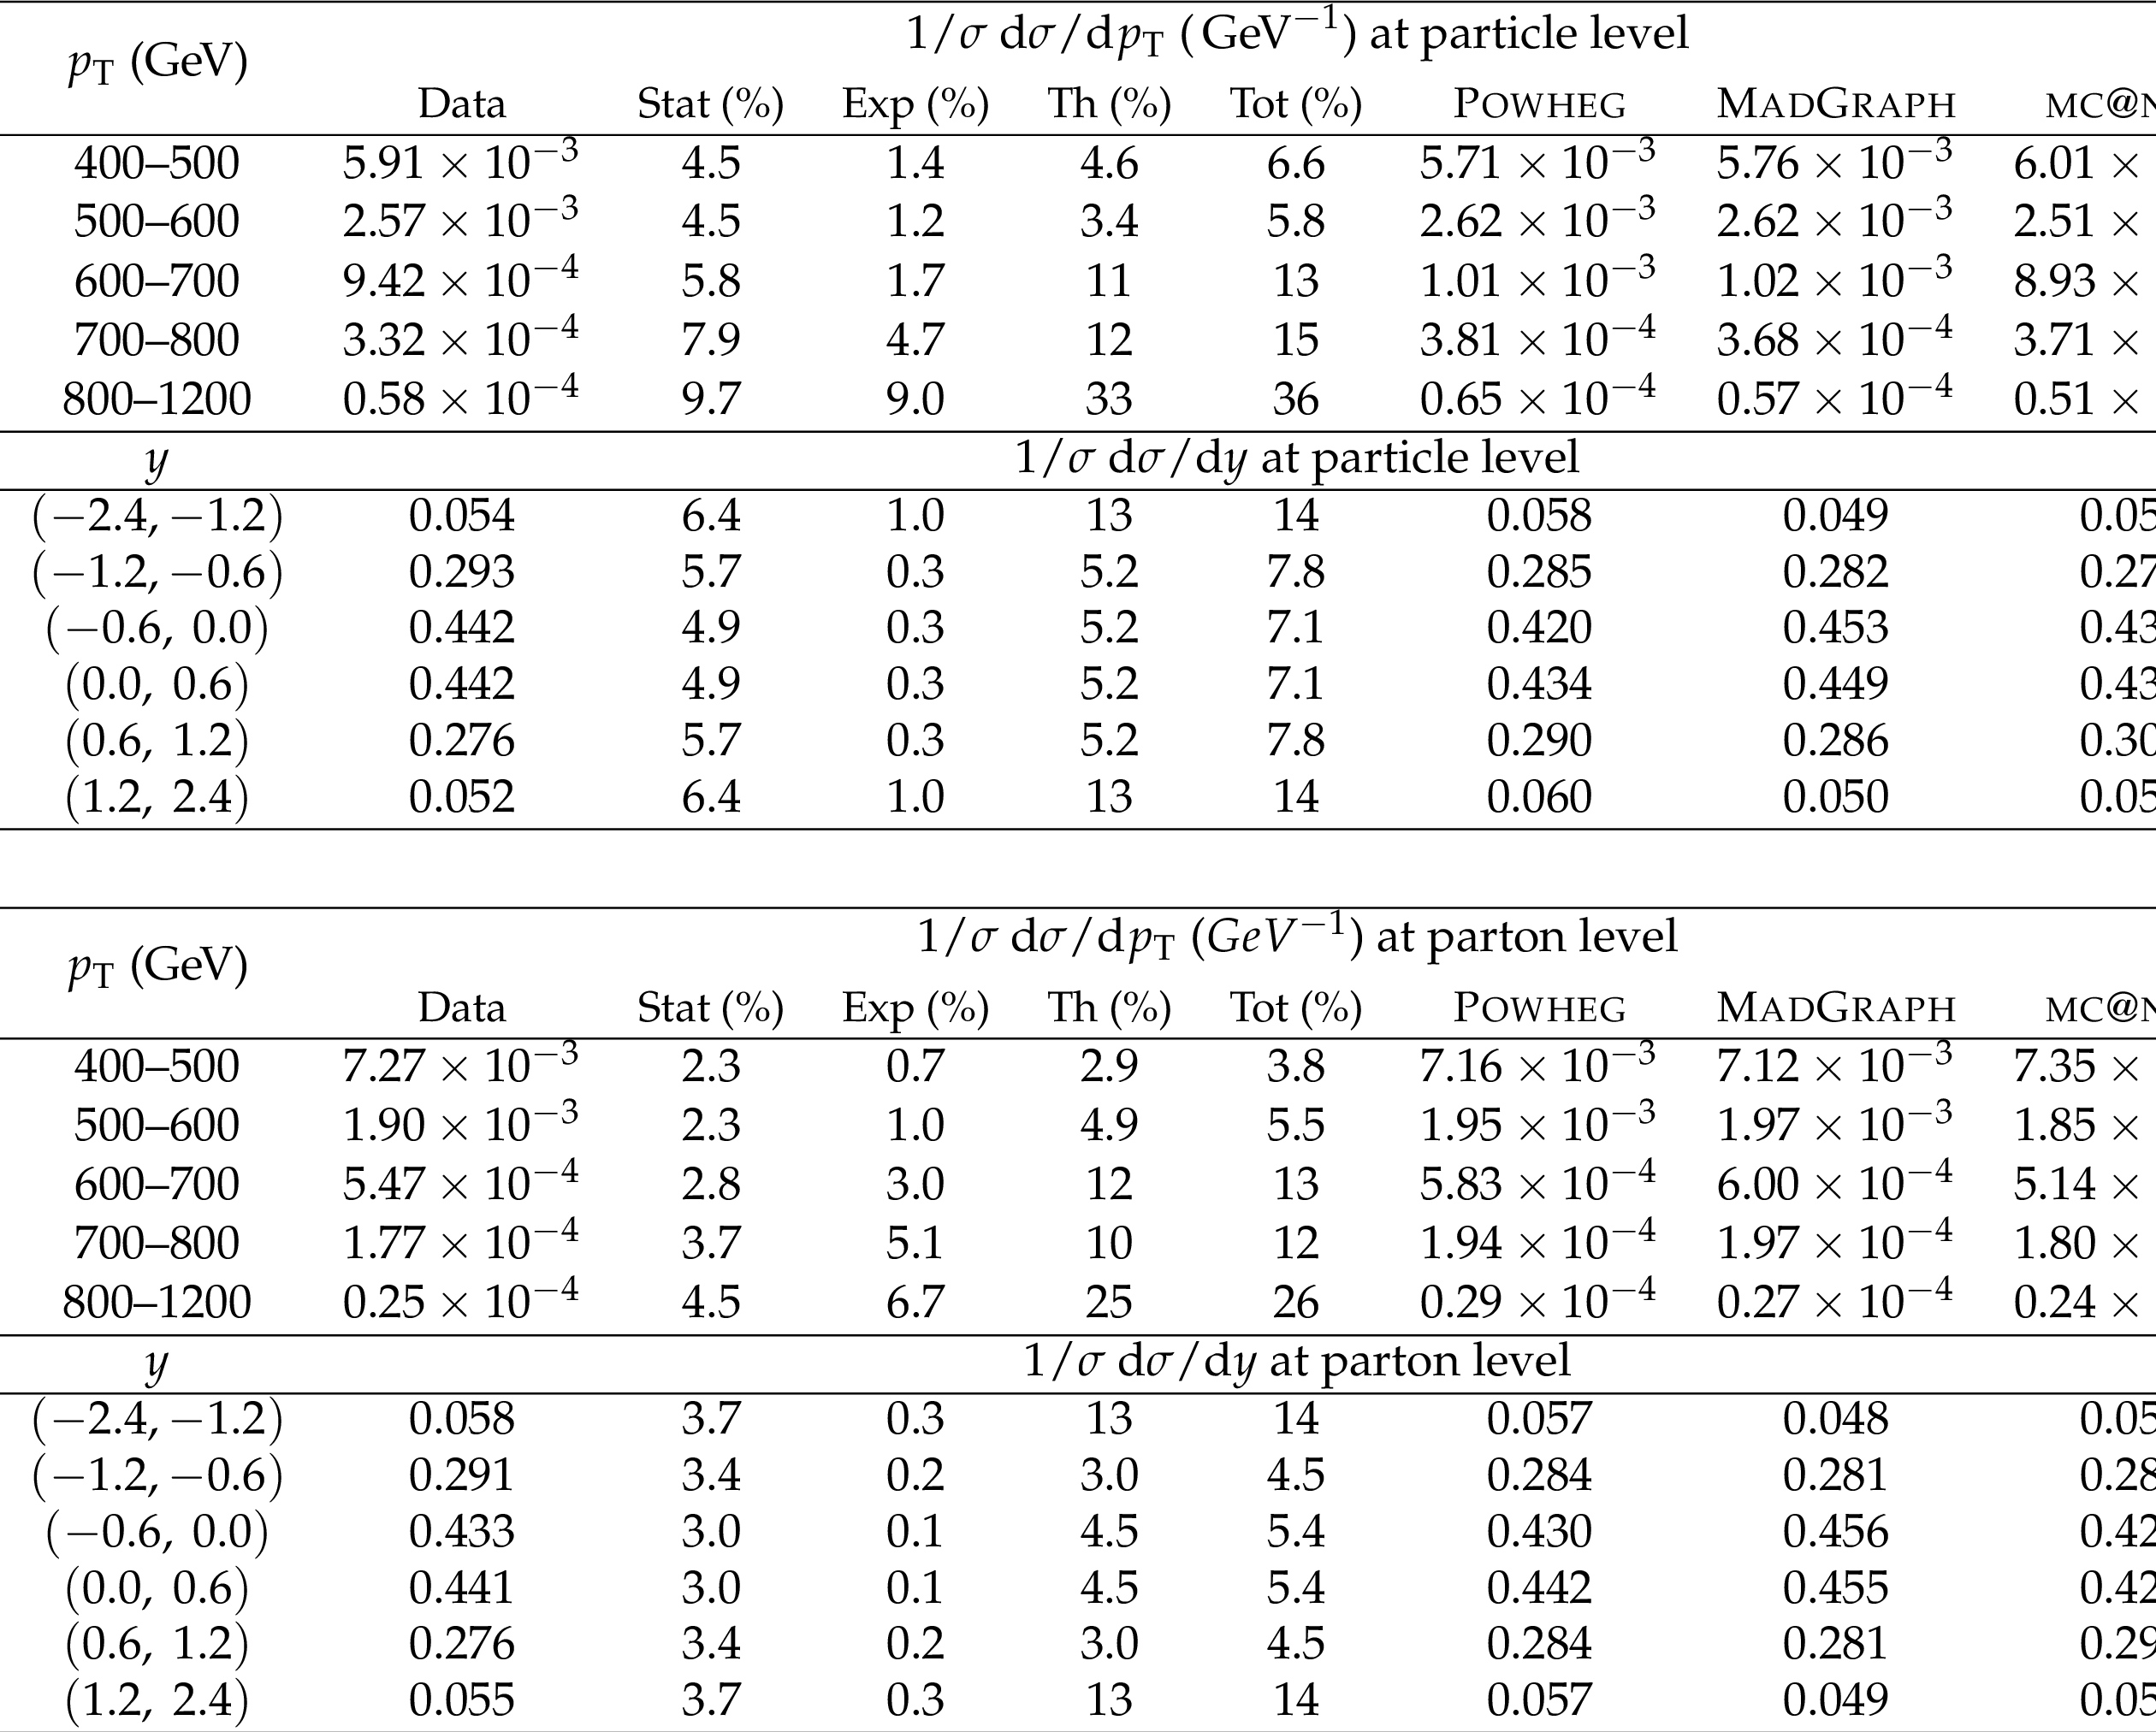
Table 3:
Normalized differential $ {\mathrm{ t \bar{t} } } $ cross section in bins of $ {p_{\mathrm {T}}} $ and $y$ for the $\mathrm{ t } $ jet at particle level (top) and the top quark at parton level (bottom). The measurements are compared to predictions from Powheg+Pythia6, MadGraph+Pythia6, and mc@nlo+Herwig6 simulations. The total relative uncertainty (Tot) in the measurements is separated into relative statistical (Stat), experimental (Exp), and theoretical (Th) components, all in percent. |
| Summary |
|
The first CMS measurement of the $\mathrm{ t \bar{t} }$ production cross section in the boosted regime has been presented. The integrated cross section, as well as differential cross sections as a function of the top quark $p_{\mathrm{T}}$ and $y$, have been measured for $p_{\mathrm{T}}^{\mathrm{ t }} > $ 400 GeV. The measurements use lepton+jets events, identified through an electron or a muon, a b jet candidate from the semileptonic top quark decay, and a t jet candidate from the top quark decaying to a hadronic final state. Backgrounds are modeled using simulations for the distributions, or a data sideband for multijet production. Background normalizations are extracted jointly with the signal yield and the t tagging efficiency using a maximum-likelihood fit. The integrated cross section measured for $p_{\mathrm{T}}^{\mathrm{ t }} > $ 400 GeV is $\sigma_{\mathrm{ t \bar{t} }} =$ 0.499 $\pm$ 0.035 (stat+syst) $\pm$ 0.095 (theory) $\pm$ 0.013 (lumi) pb at particle level, and $\sigma_{\mathrm{ t \bar{t} }} = $ 1.44 $\pm$ 0.10 (stat+syst) $\pm$ 0.29 (theory) $\pm$ 0.04 (lumi) pb at parton level, both corrected for the branching fraction of $\mathrm{ t \bar{t} } \rightarrow \mathrm{ e }/\mu$+jets. The measurements are compared to the predicted cross section for this $p_{\mathrm{T}}$ range from the Powheg+Pythia6 $\mathrm{ t \bar{t} }$ simulation assuming $\sigma_{\rm tot} = $ 252.9 pb, which provides a value of 0.580 pb at particle level and 1.67 pb at parton level. The cross section for this high-$p_{\mathrm{T}}$ region is therefore found to be overestimated by 14% in the Powheg+Pythia6 simulation, but is consistent within the uncertainties. Differential cross sections are also measured at both particle and parton levels. Background contributions are subtracted from the t-tagged jet distributions to obtain the distribution for signal. This is unfolded first to the particle level to correct for signal efficiency, acceptance, and bin migrations to yield the cross section in bins of t jet $p_{\mathrm{T}}$ and $y$ at particle level. The data are further unfolded to the parton level to extract the cross section in bins of top quark $p_{\mathrm{T}}$ and $y$. The measurements are compared to predictions from different $\mathrm{ t \bar{t} }$ simulations. The Powheg+Pythia6 and Madgraph+Pythia6 simulations are observed to overestimate the cross section, in particular at high $p_{\mathrm{T}}^{\mathrm{ t }}$, while MC@NLO+Herwig6 results in a good modeling of the $p_{\mathrm{T}}^{\mathrm{ t }}$ spectrum. The Powheg+Pythia6 and MC@NLO+Herwig6 simulations model the $y^{\mathrm{ t }}$ distributions well, while Madgraph+Pythia6 significantly overestimates the cross section for $|y^{\mathrm{ t }}| < $ 1.2 . The results are compatible with those from the nonboosted CMS measurement [4] in the $p_{\mathrm{T}}$ range where the two analyses overlap (400-500 GeV). The nonboosted measurement also observes an overestimate of the cross section for different MC generators in this $p_{\mathrm{T}}$ range, most prominent for Madgraph+Pythia6, and an improved modeling of the $p_{\mathrm{T}}$ spectrum using Herwig6 for the parton showering. The analysis presented in this paper extends the differential $\mathrm{ t \bar{t} }$ cross section measurement into the $p_{\mathrm{T}} > $ 1 TeV range. These measurements will help improve the modeling of event generators in this high-$p_{\mathrm{T}}$ range, an important regime for many new physics searches. |
| Additional Figures | |

png pdf |
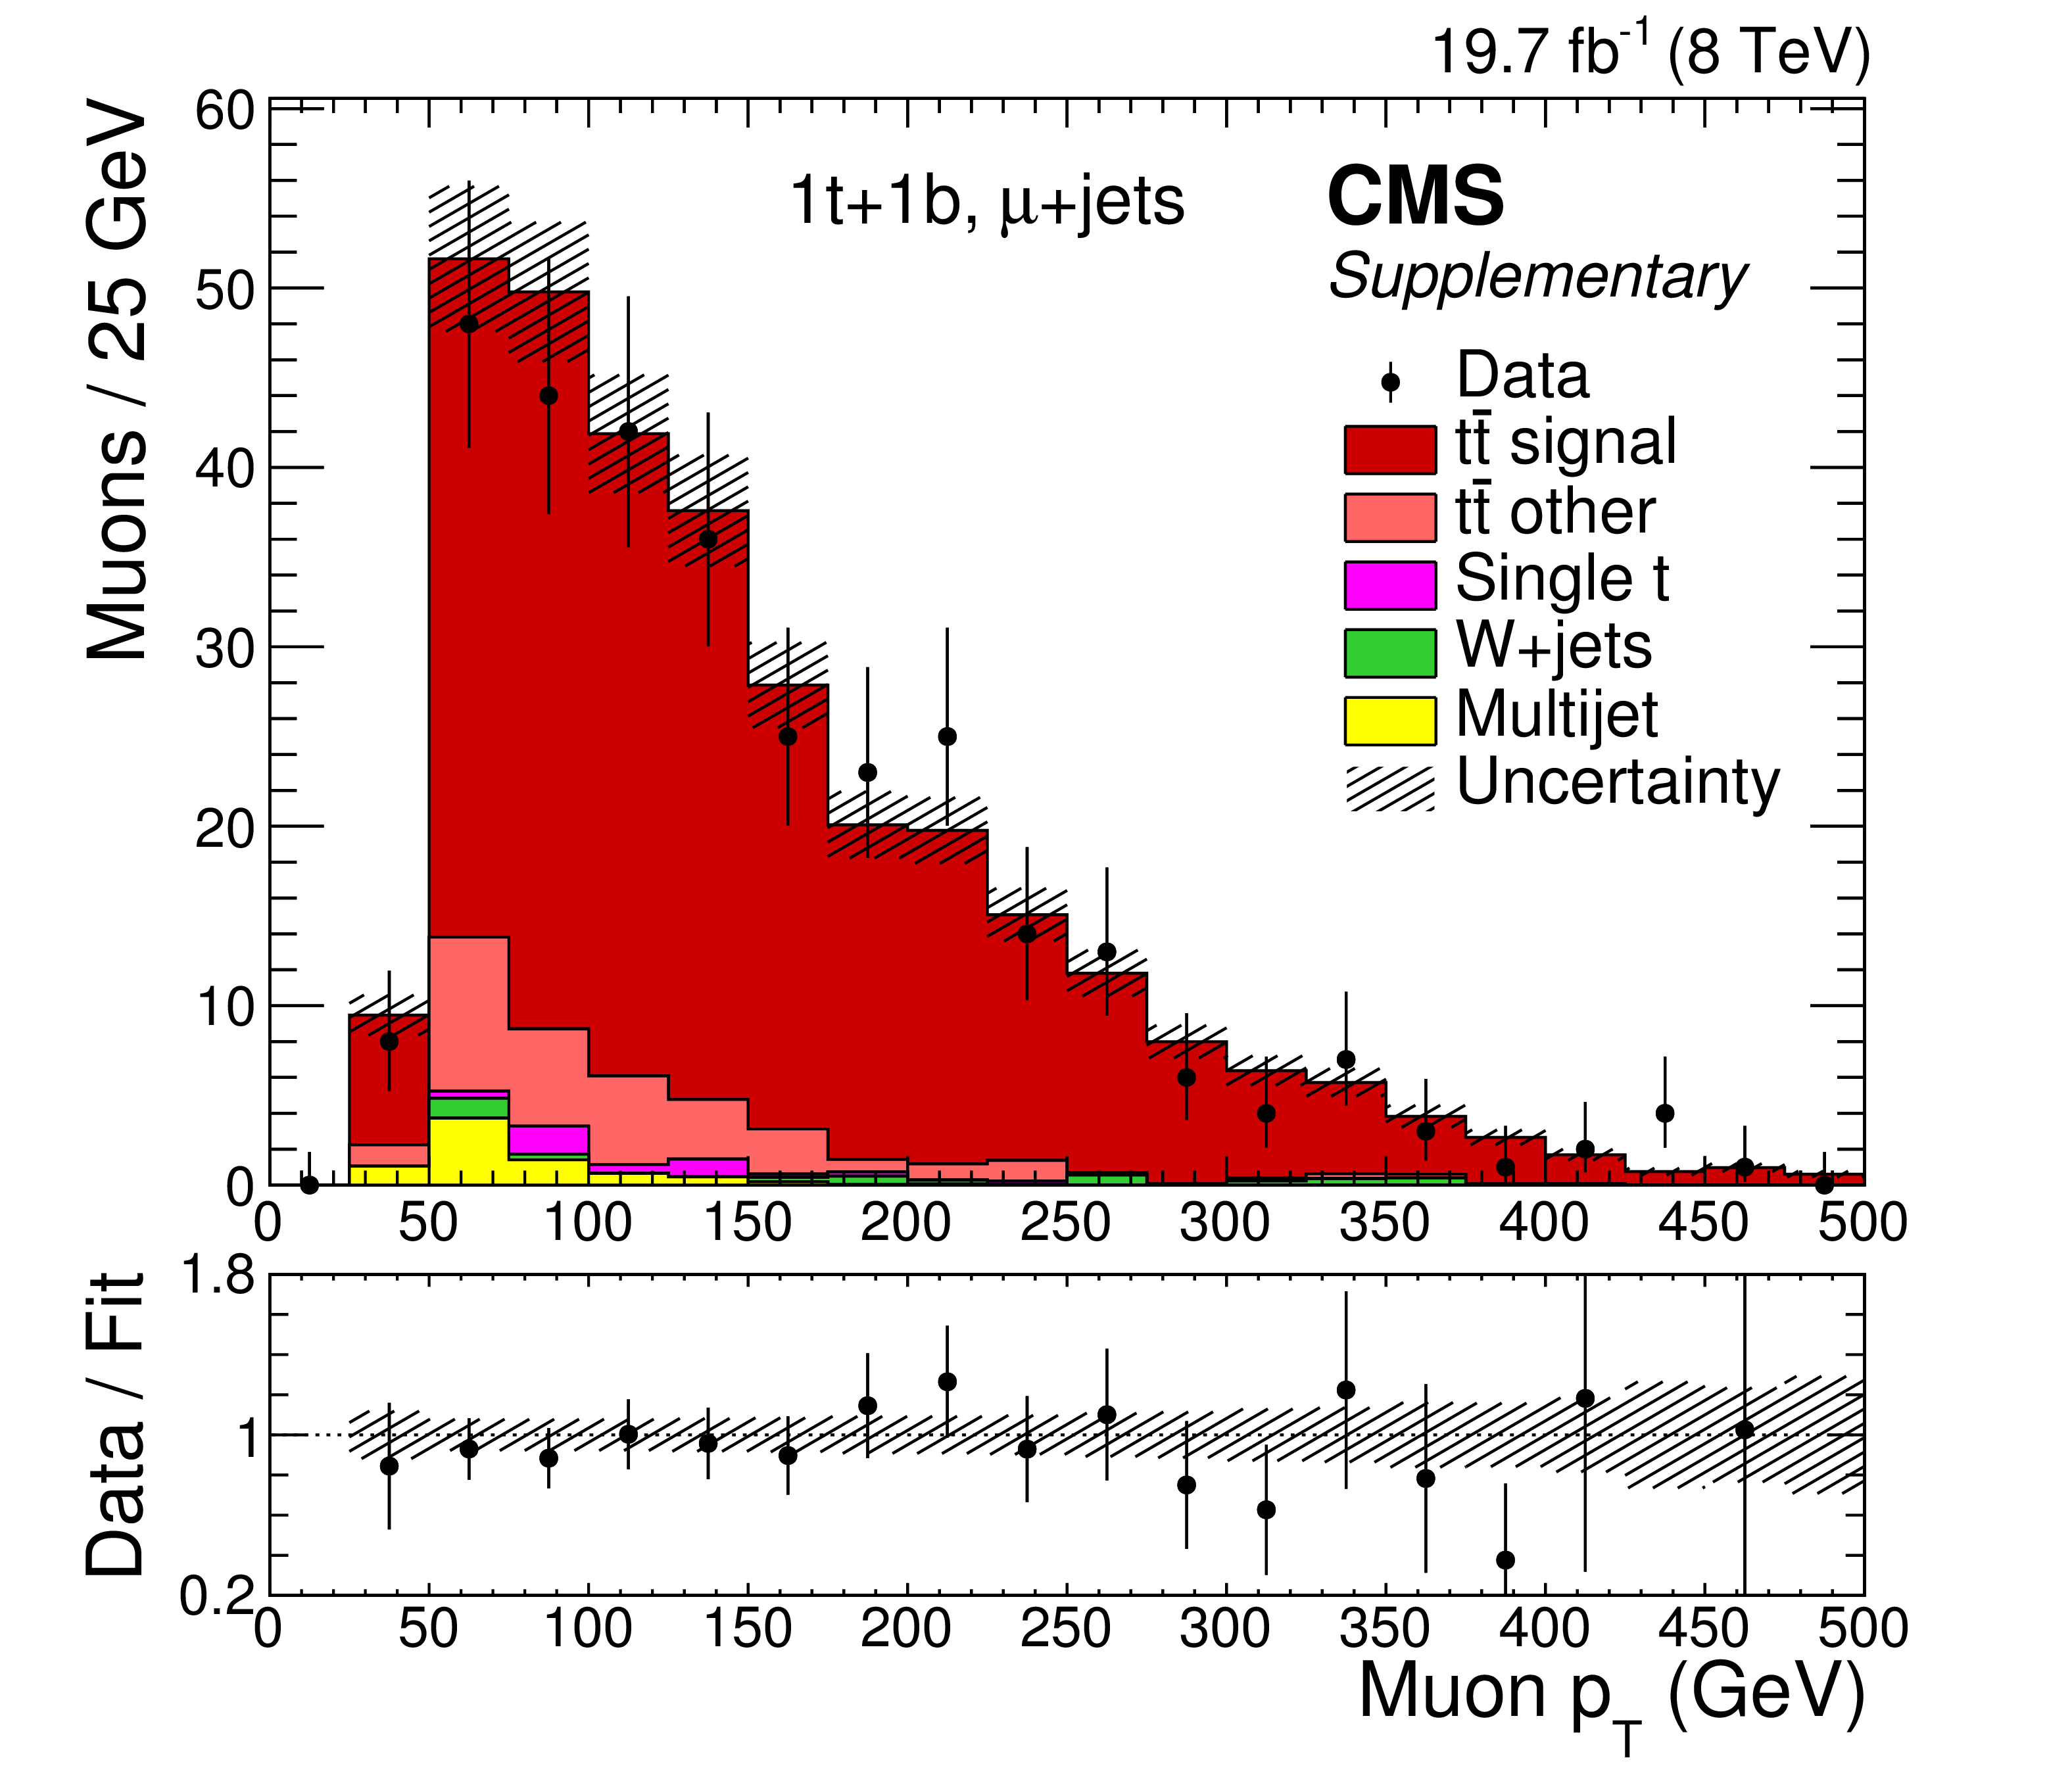
Additional Figure 1-a:
Distribution of the electron (a,c) and muon (b.d) $ {p_{\mathrm {T}}} $ for the 1t+0b (a,b) and 1t+1b (c,d) event categories. The data are compared to the total signal and background yields using normalizations from the maximum-likelihood fit. The vertical bars on the data points represent the statistical uncertainties. The shaded bands reflect the combination of the statistical and post-fit systematic uncertainties in the signal and background yields added in quadrature, without the uncertainties based on the form of the distributions, and neglecting their correlations for presentational purposes. The ratios of data to the total fit are shown below each panel, along with the uncertainty band from the fit. |
png pdf |
Additional Figure 1-b:
Distribution of the electron (a,c) and muon (b.d) $ {p_{\mathrm {T}}} $ for the 1t+0b (a,b) and 1t+1b (c,d) event categories. The data are compared to the total signal and background yields using normalizations from the maximum-likelihood fit. The vertical bars on the data points represent the statistical uncertainties. The shaded bands reflect the combination of the statistical and post-fit systematic uncertainties in the signal and background yields added in quadrature, without the uncertainties based on the form of the distributions, and neglecting their correlations for presentational purposes. The ratios of data to the total fit are shown below each panel, along with the uncertainty band from the fit. |

png pdf |
Additional Figure 1-c:
Distribution of the electron (a,c) and muon (b.d) $ {p_{\mathrm {T}}} $ for the 1t+0b (a,b) and 1t+1b (c,d) event categories. The data are compared to the total signal and background yields using normalizations from the maximum-likelihood fit. The vertical bars on the data points represent the statistical uncertainties. The shaded bands reflect the combination of the statistical and post-fit systematic uncertainties in the signal and background yields added in quadrature, without the uncertainties based on the form of the distributions, and neglecting their correlations for presentational purposes. The ratios of data to the total fit are shown below each panel, along with the uncertainty band from the fit. |
png pdf |
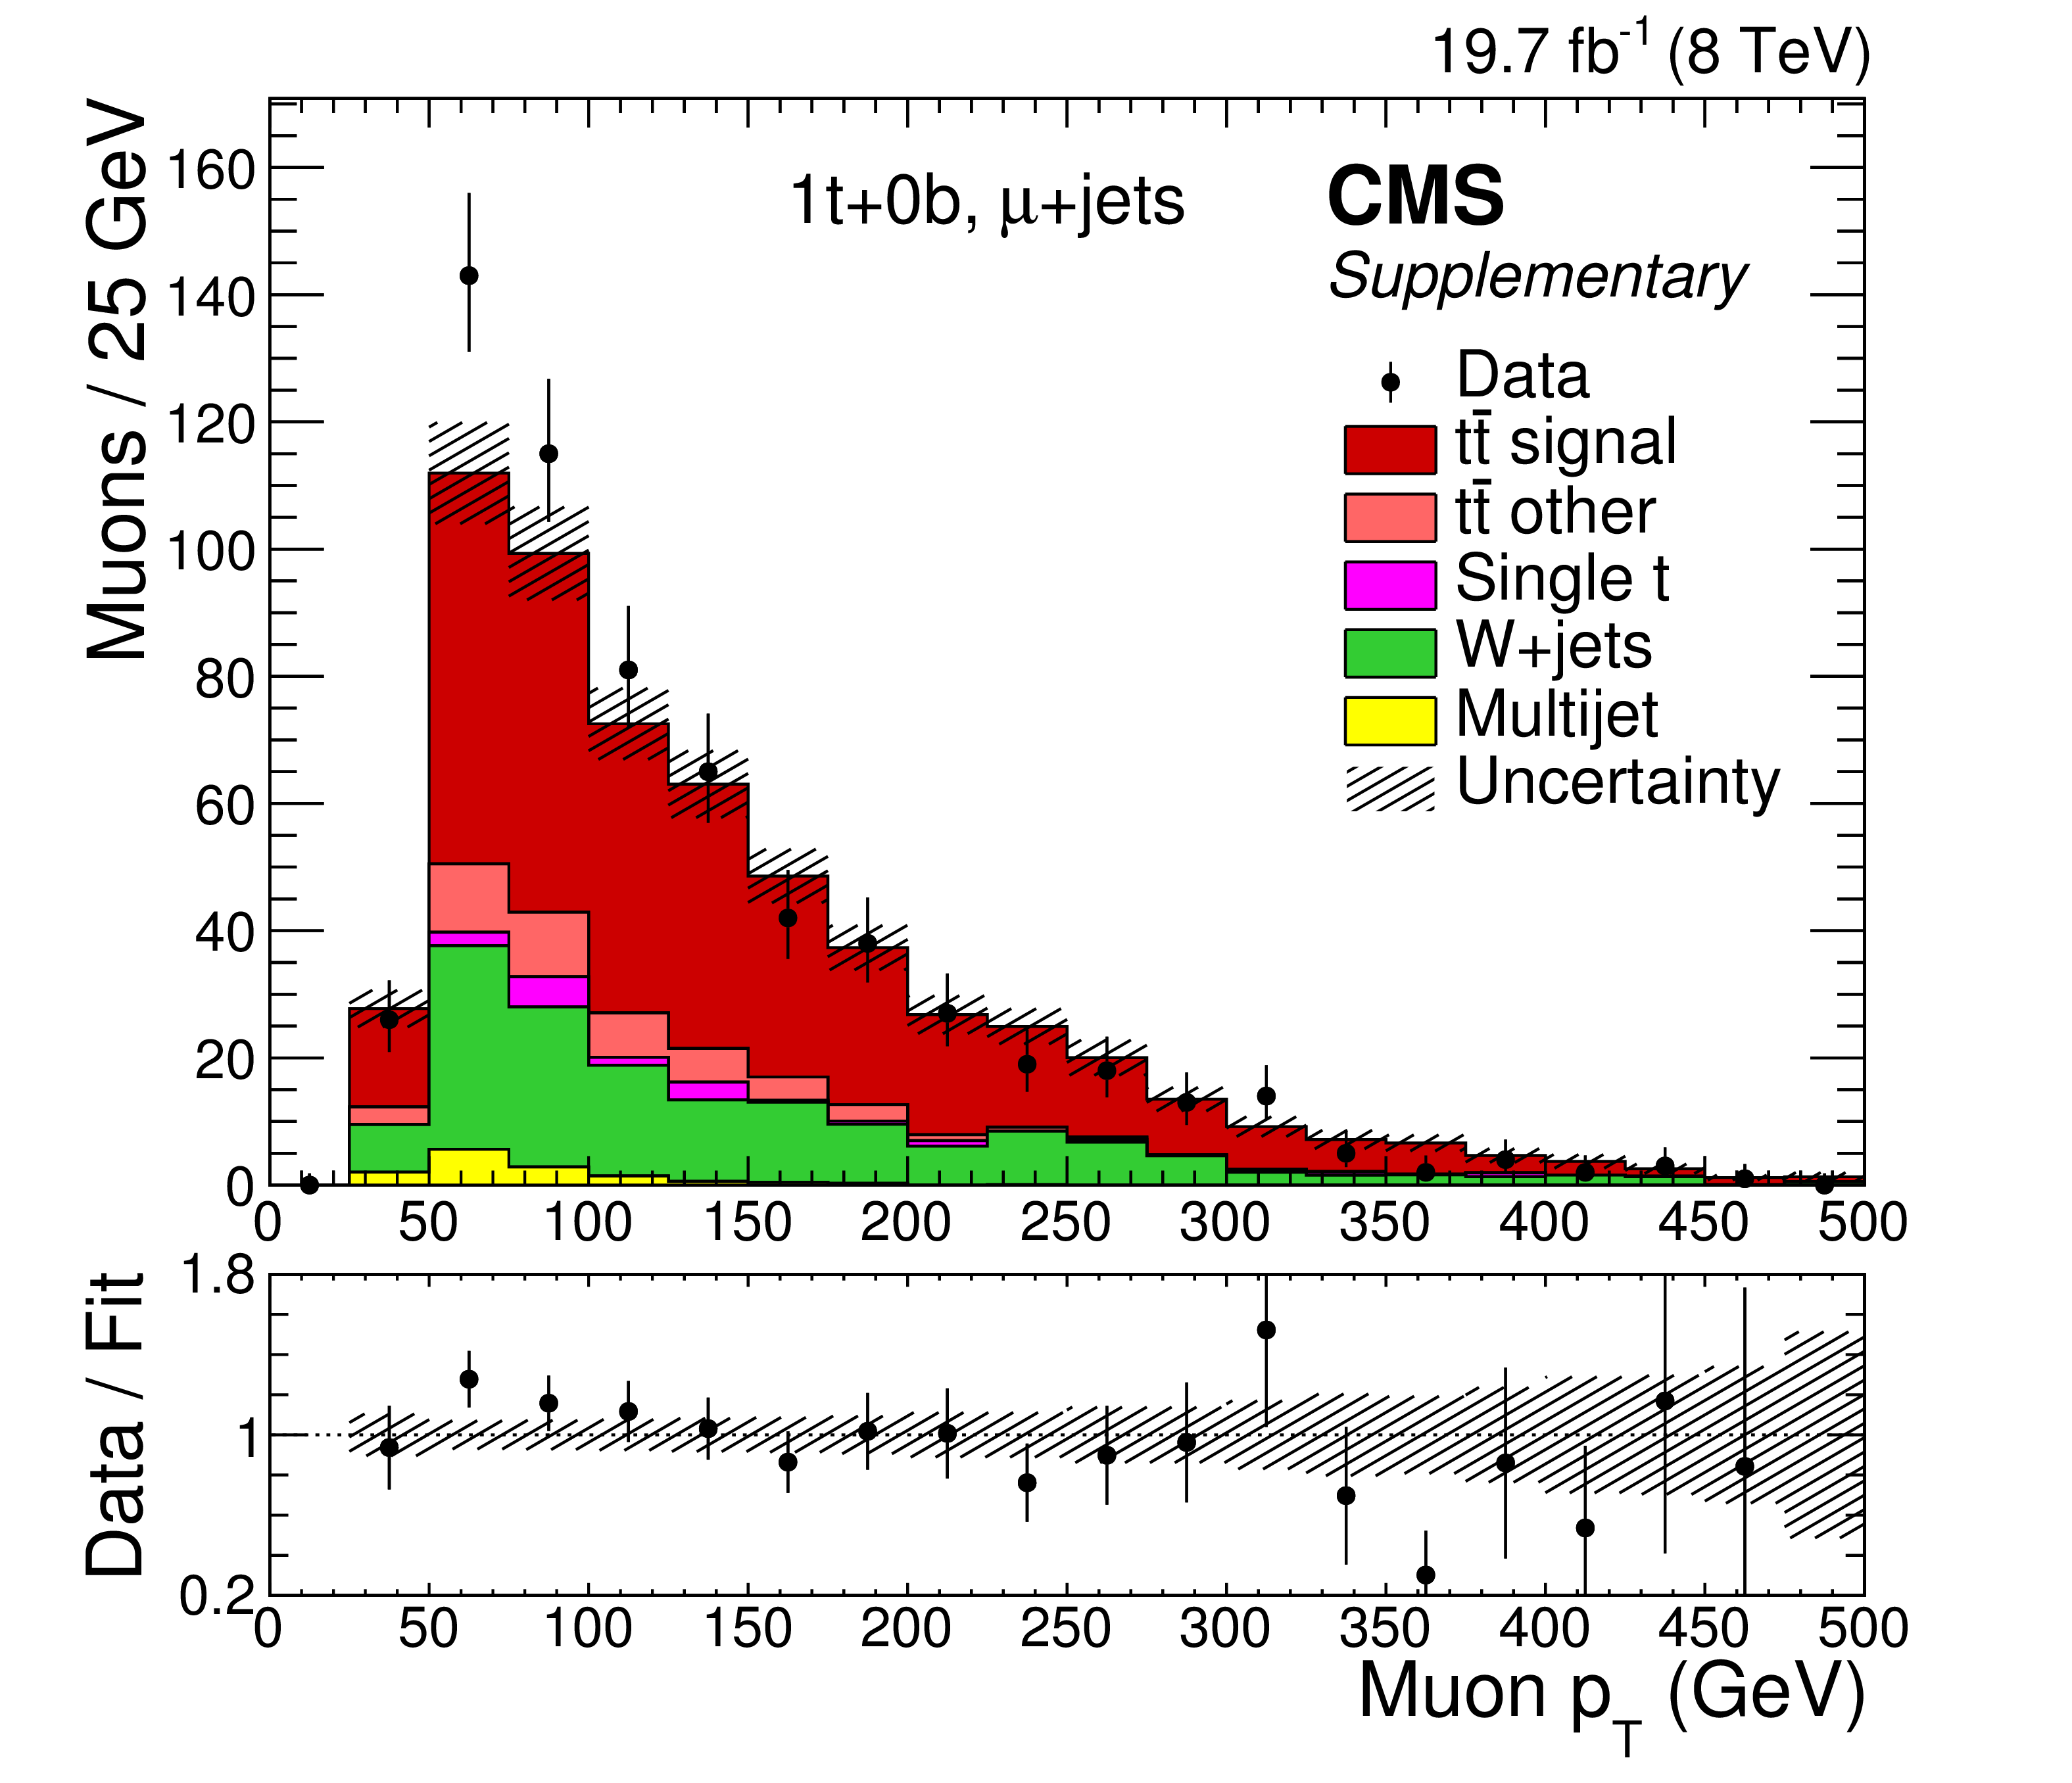
Additional Figure 1-d:
Distribution of the electron (a,c) and muon (b.d) $ {p_{\mathrm {T}}} $ for the 1t+0b (a,b) and 1t+1b (c,d) event categories. The data are compared to the total signal and background yields using normalizations from the maximum-likelihood fit. The vertical bars on the data points represent the statistical uncertainties. The shaded bands reflect the combination of the statistical and post-fit systematic uncertainties in the signal and background yields added in quadrature, without the uncertainties based on the form of the distributions, and neglecting their correlations for presentational purposes. The ratios of data to the total fit are shown below each panel, along with the uncertainty band from the fit. |
png pdf |
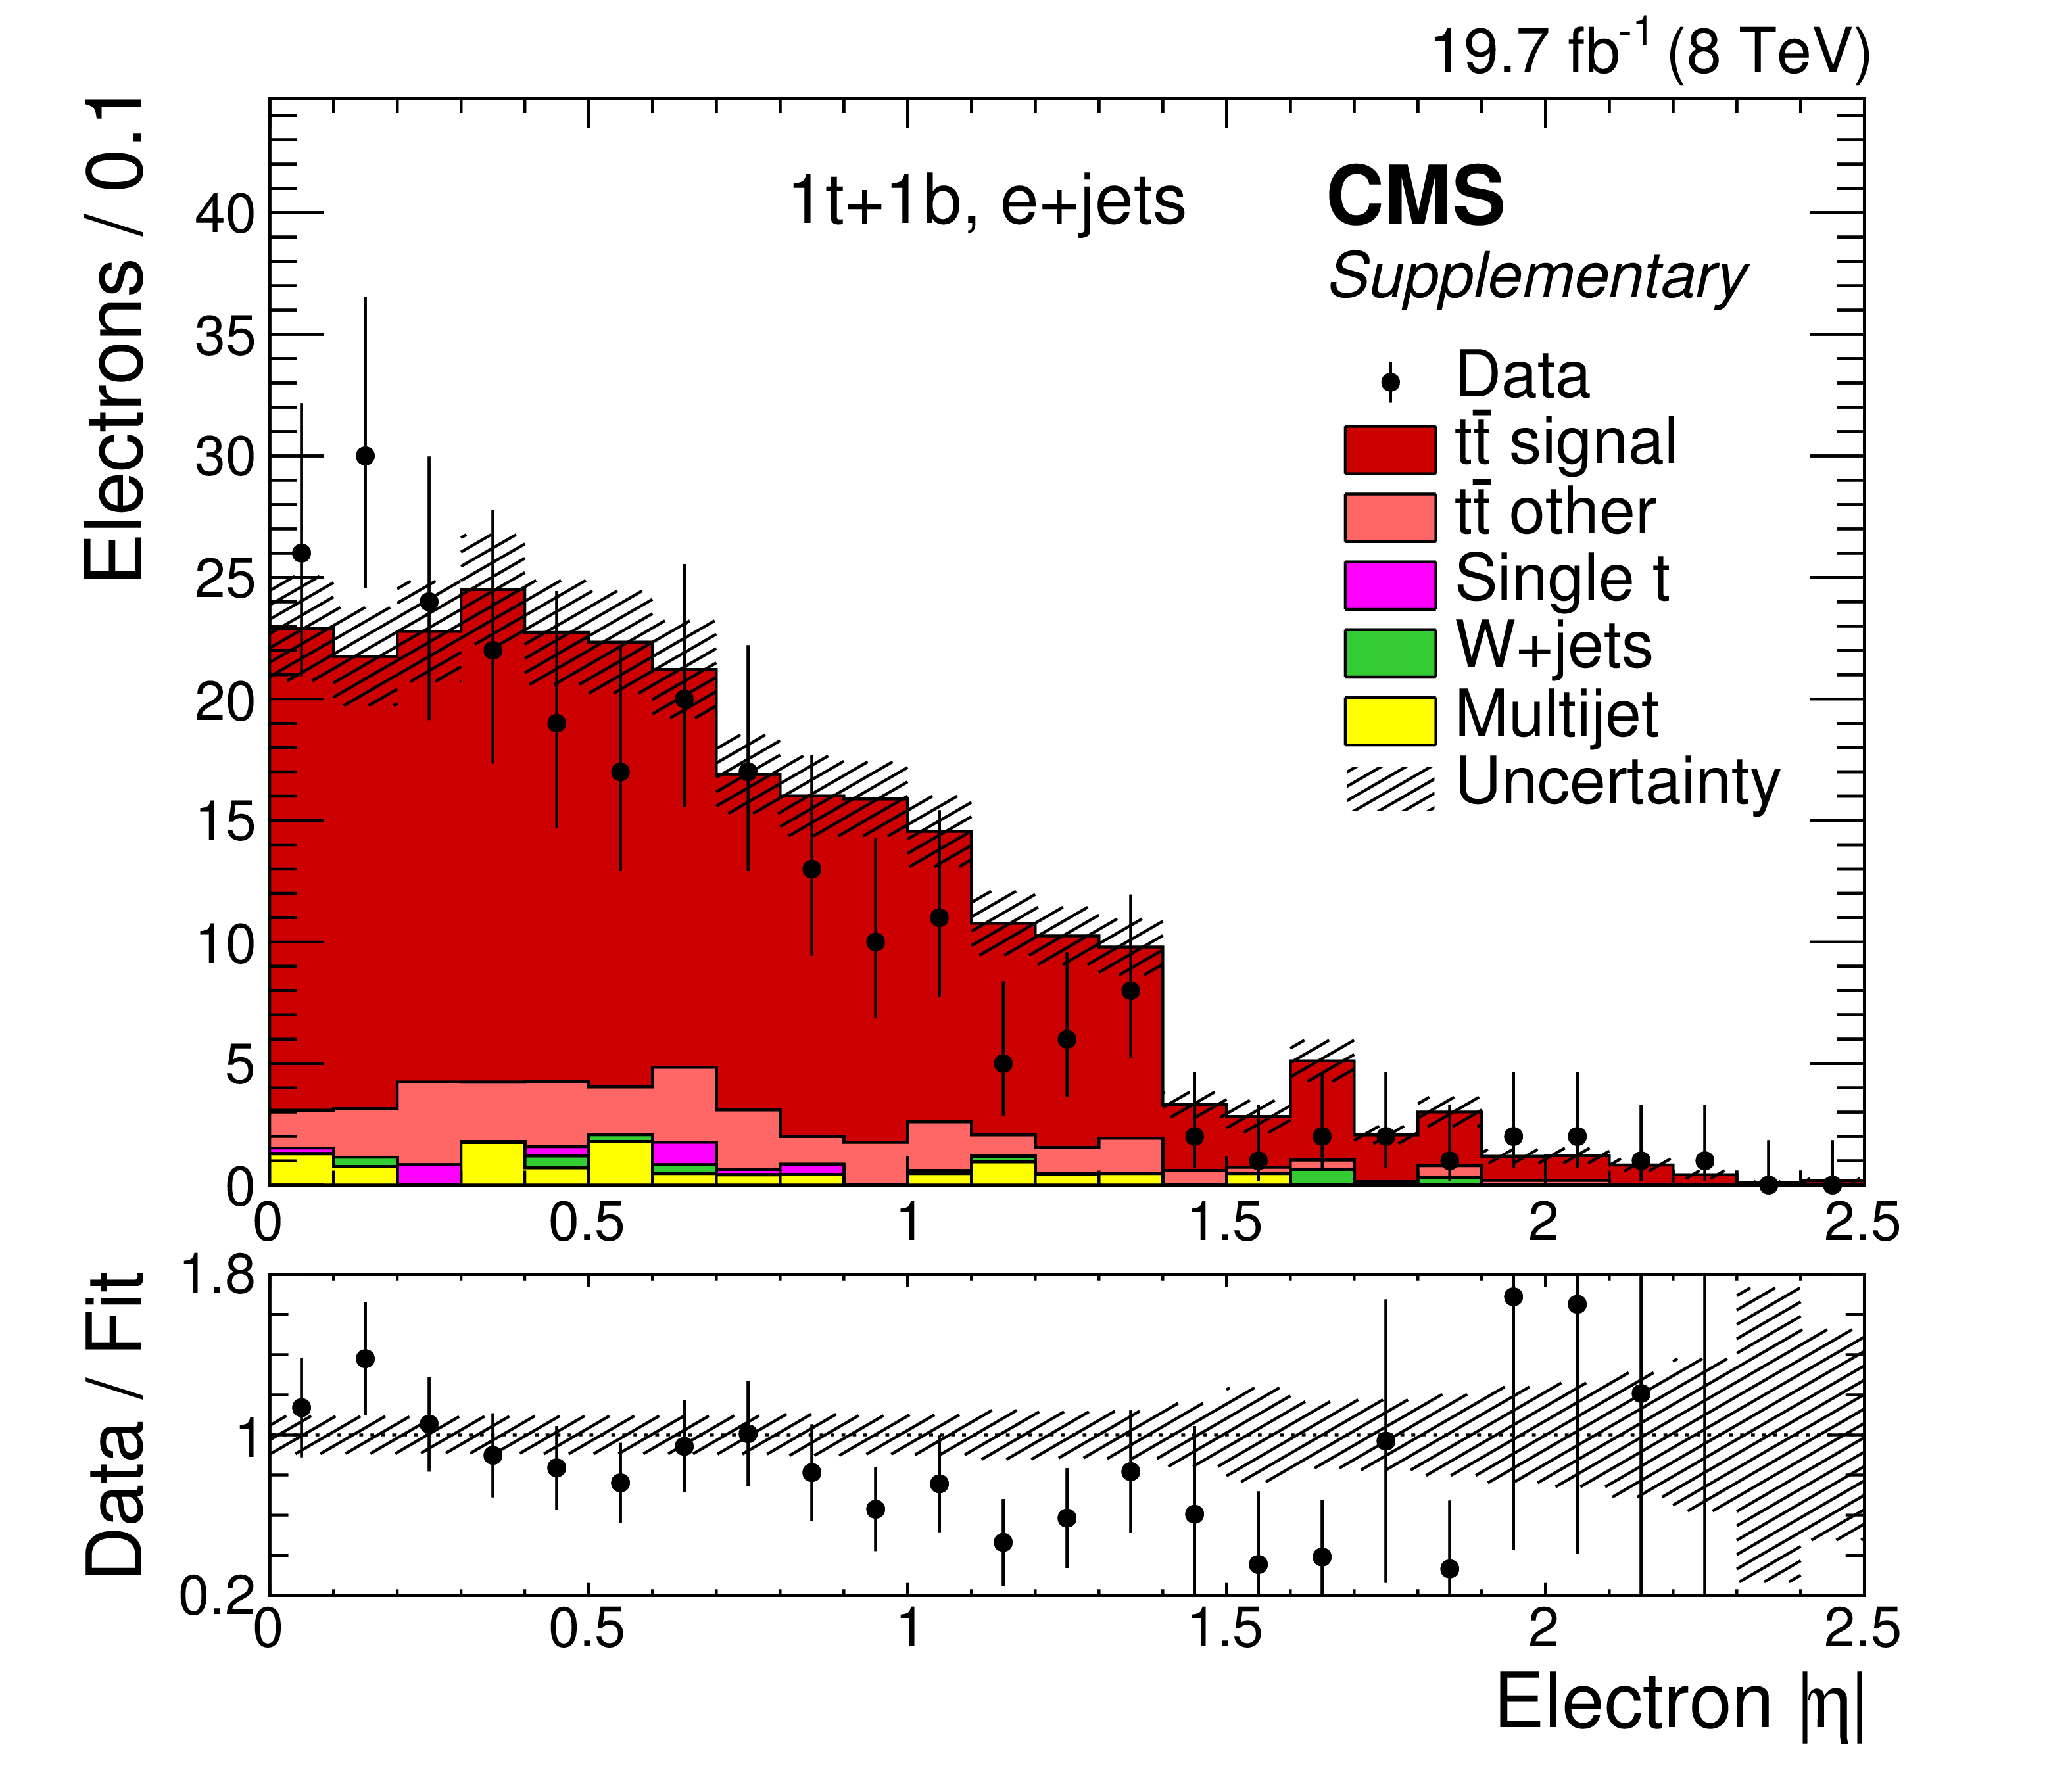
Additional Figure 2-a:
Distribution of the electron (a) and muon (b) $|\eta |$ for the 1t+1b event category. The data are compared to the total signal and background yields using normalizations from the maximum-likelihood fit. The vertical bars on the data points represent the statistical uncertainties. The shaded bands reflect the combination of the statistical and post-fit systematic uncertainties in the signal and background yields added in quadrature, without the uncertainties based on the form of the distributions, and neglecting their correlations for presentational purposes. The ratios of data to the total fit are shown below each panel, along with the uncertainty band from the fit. |
png pdf |
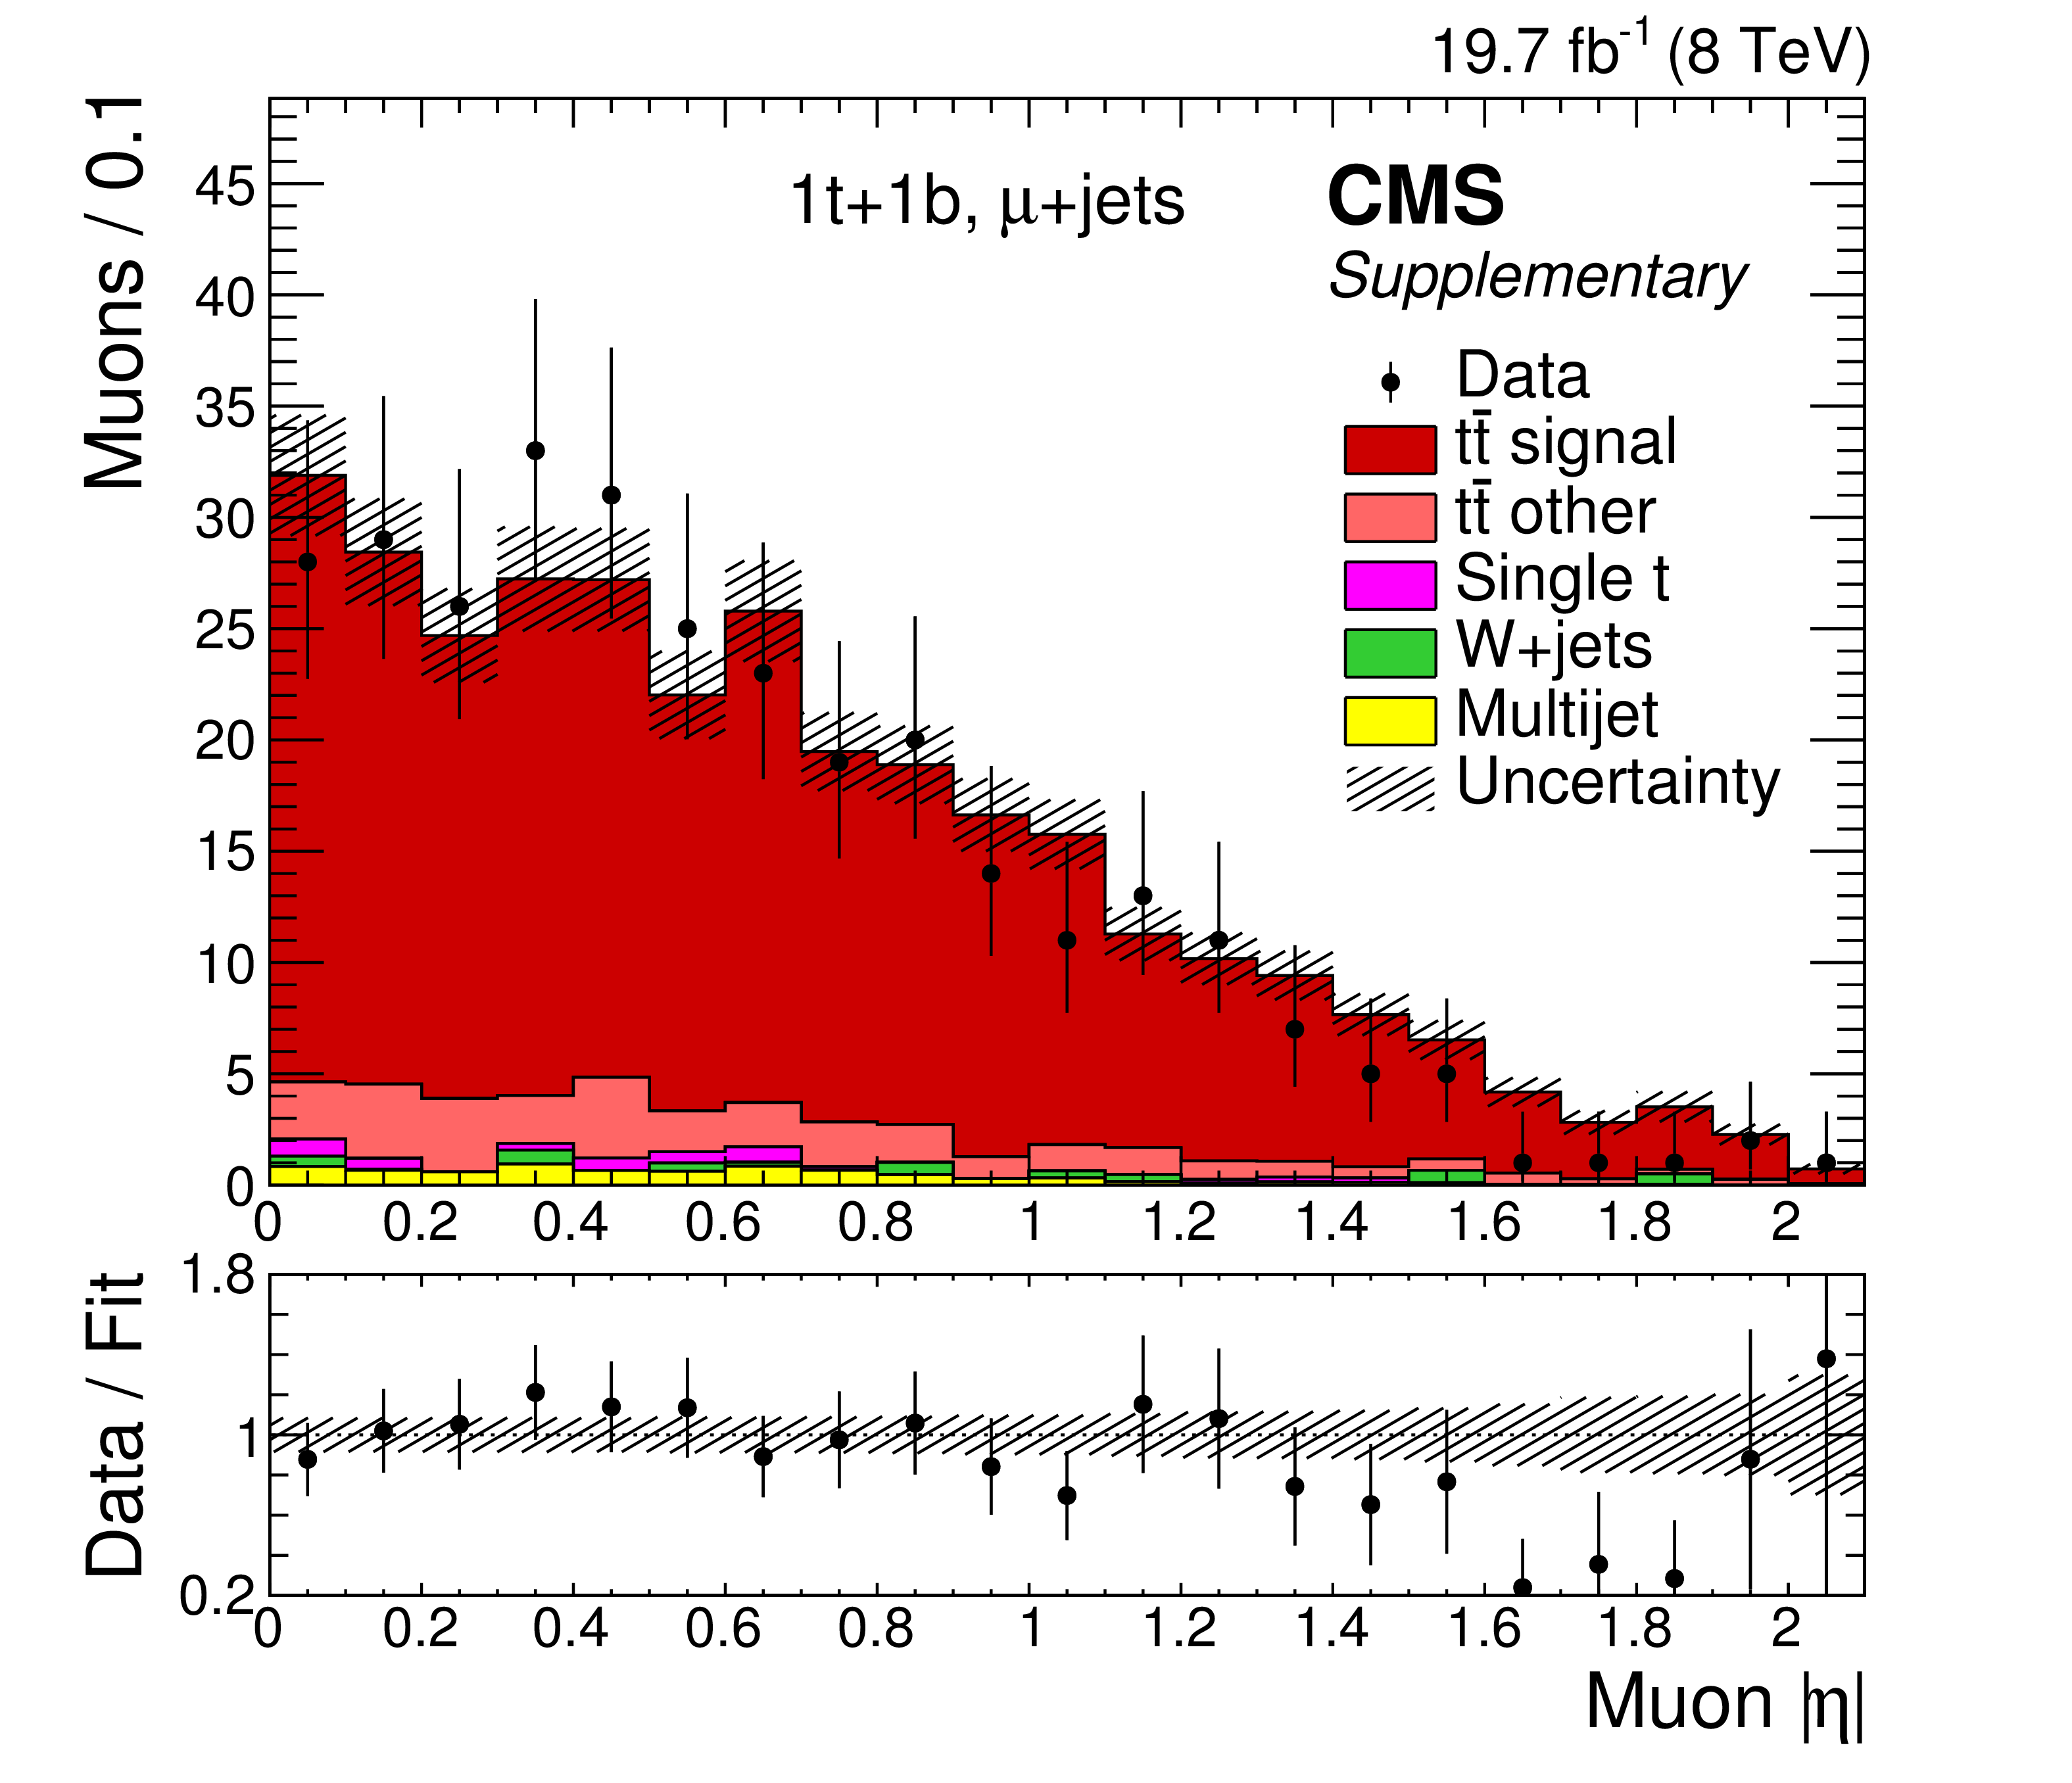
Additional Figure 2-b:
Distribution of the electron (a) and muon (b) $|\eta |$ for the 1t+1b event category. The data are compared to the total signal and background yields using normalizations from the maximum-likelihood fit. The vertical bars on the data points represent the statistical uncertainties. The shaded bands reflect the combination of the statistical and post-fit systematic uncertainties in the signal and background yields added in quadrature, without the uncertainties based on the form of the distributions, and neglecting their correlations for presentational purposes. The ratios of data to the total fit are shown below each panel, along with the uncertainty band from the fit. |
png pdf |
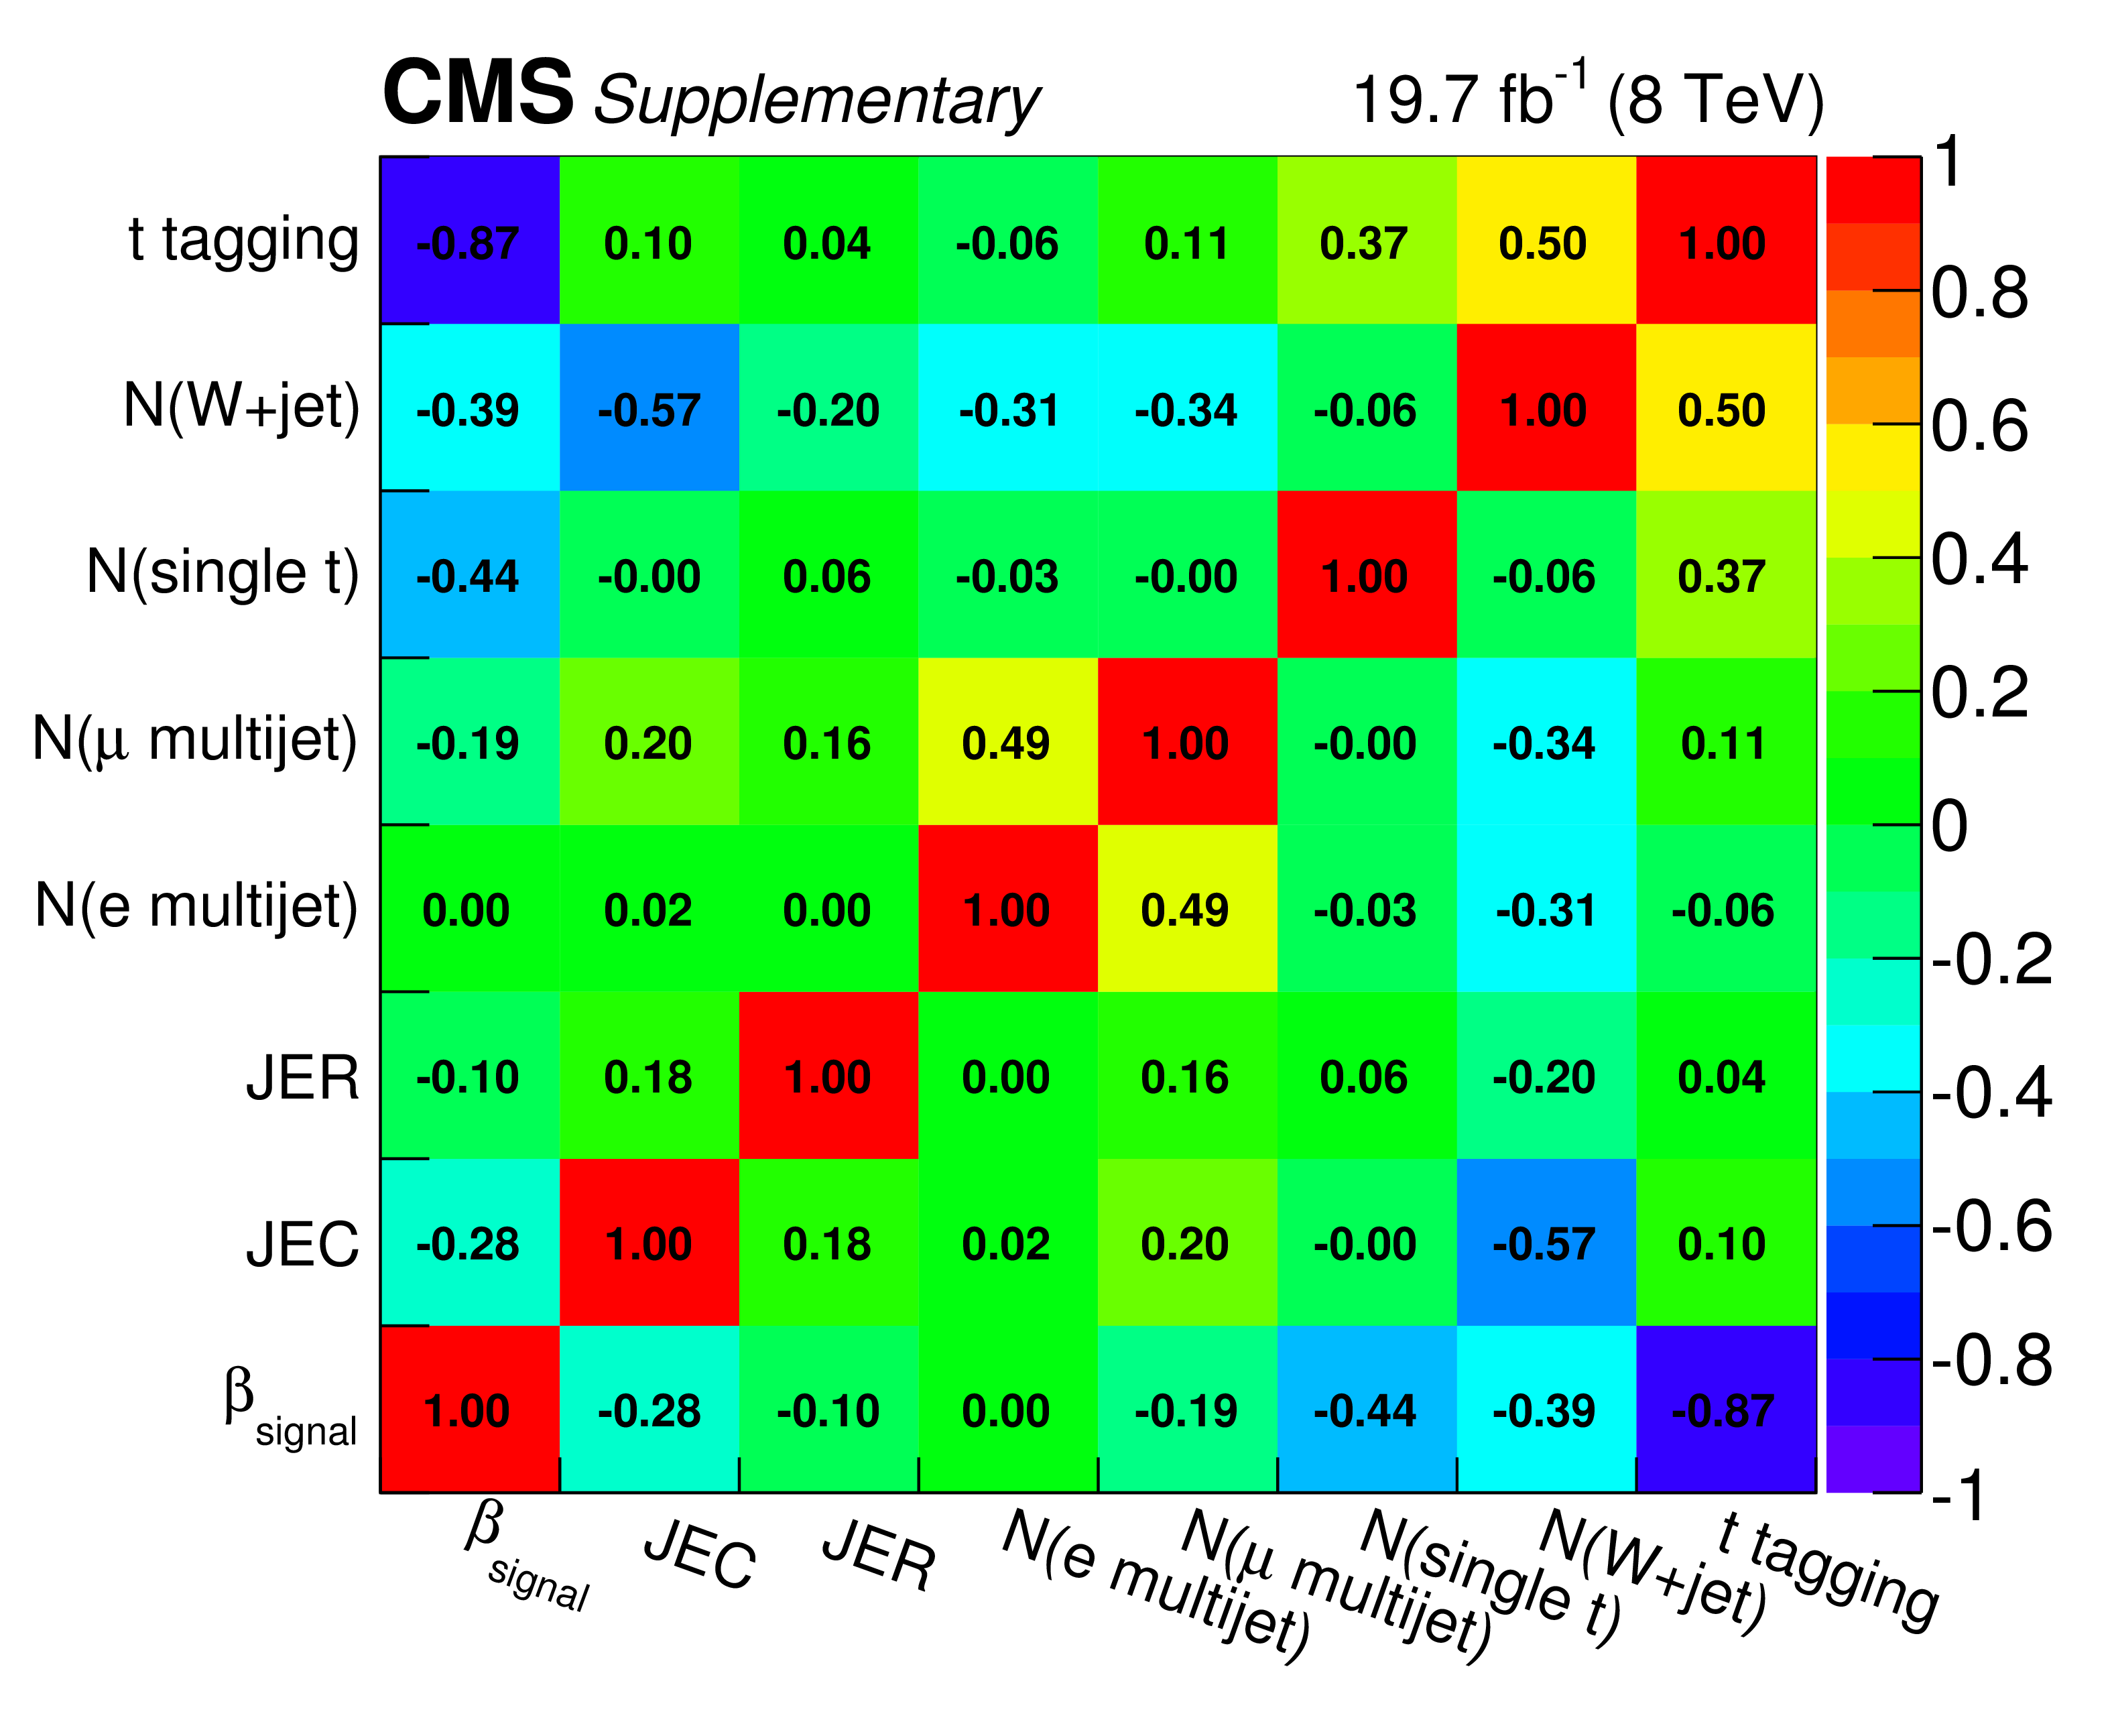
Additional Figure 3:
Correlation matrix between different fit variables and nuisance parameters in the binned, extended maximum-likelihood fit as observed in data. |
png pdf |
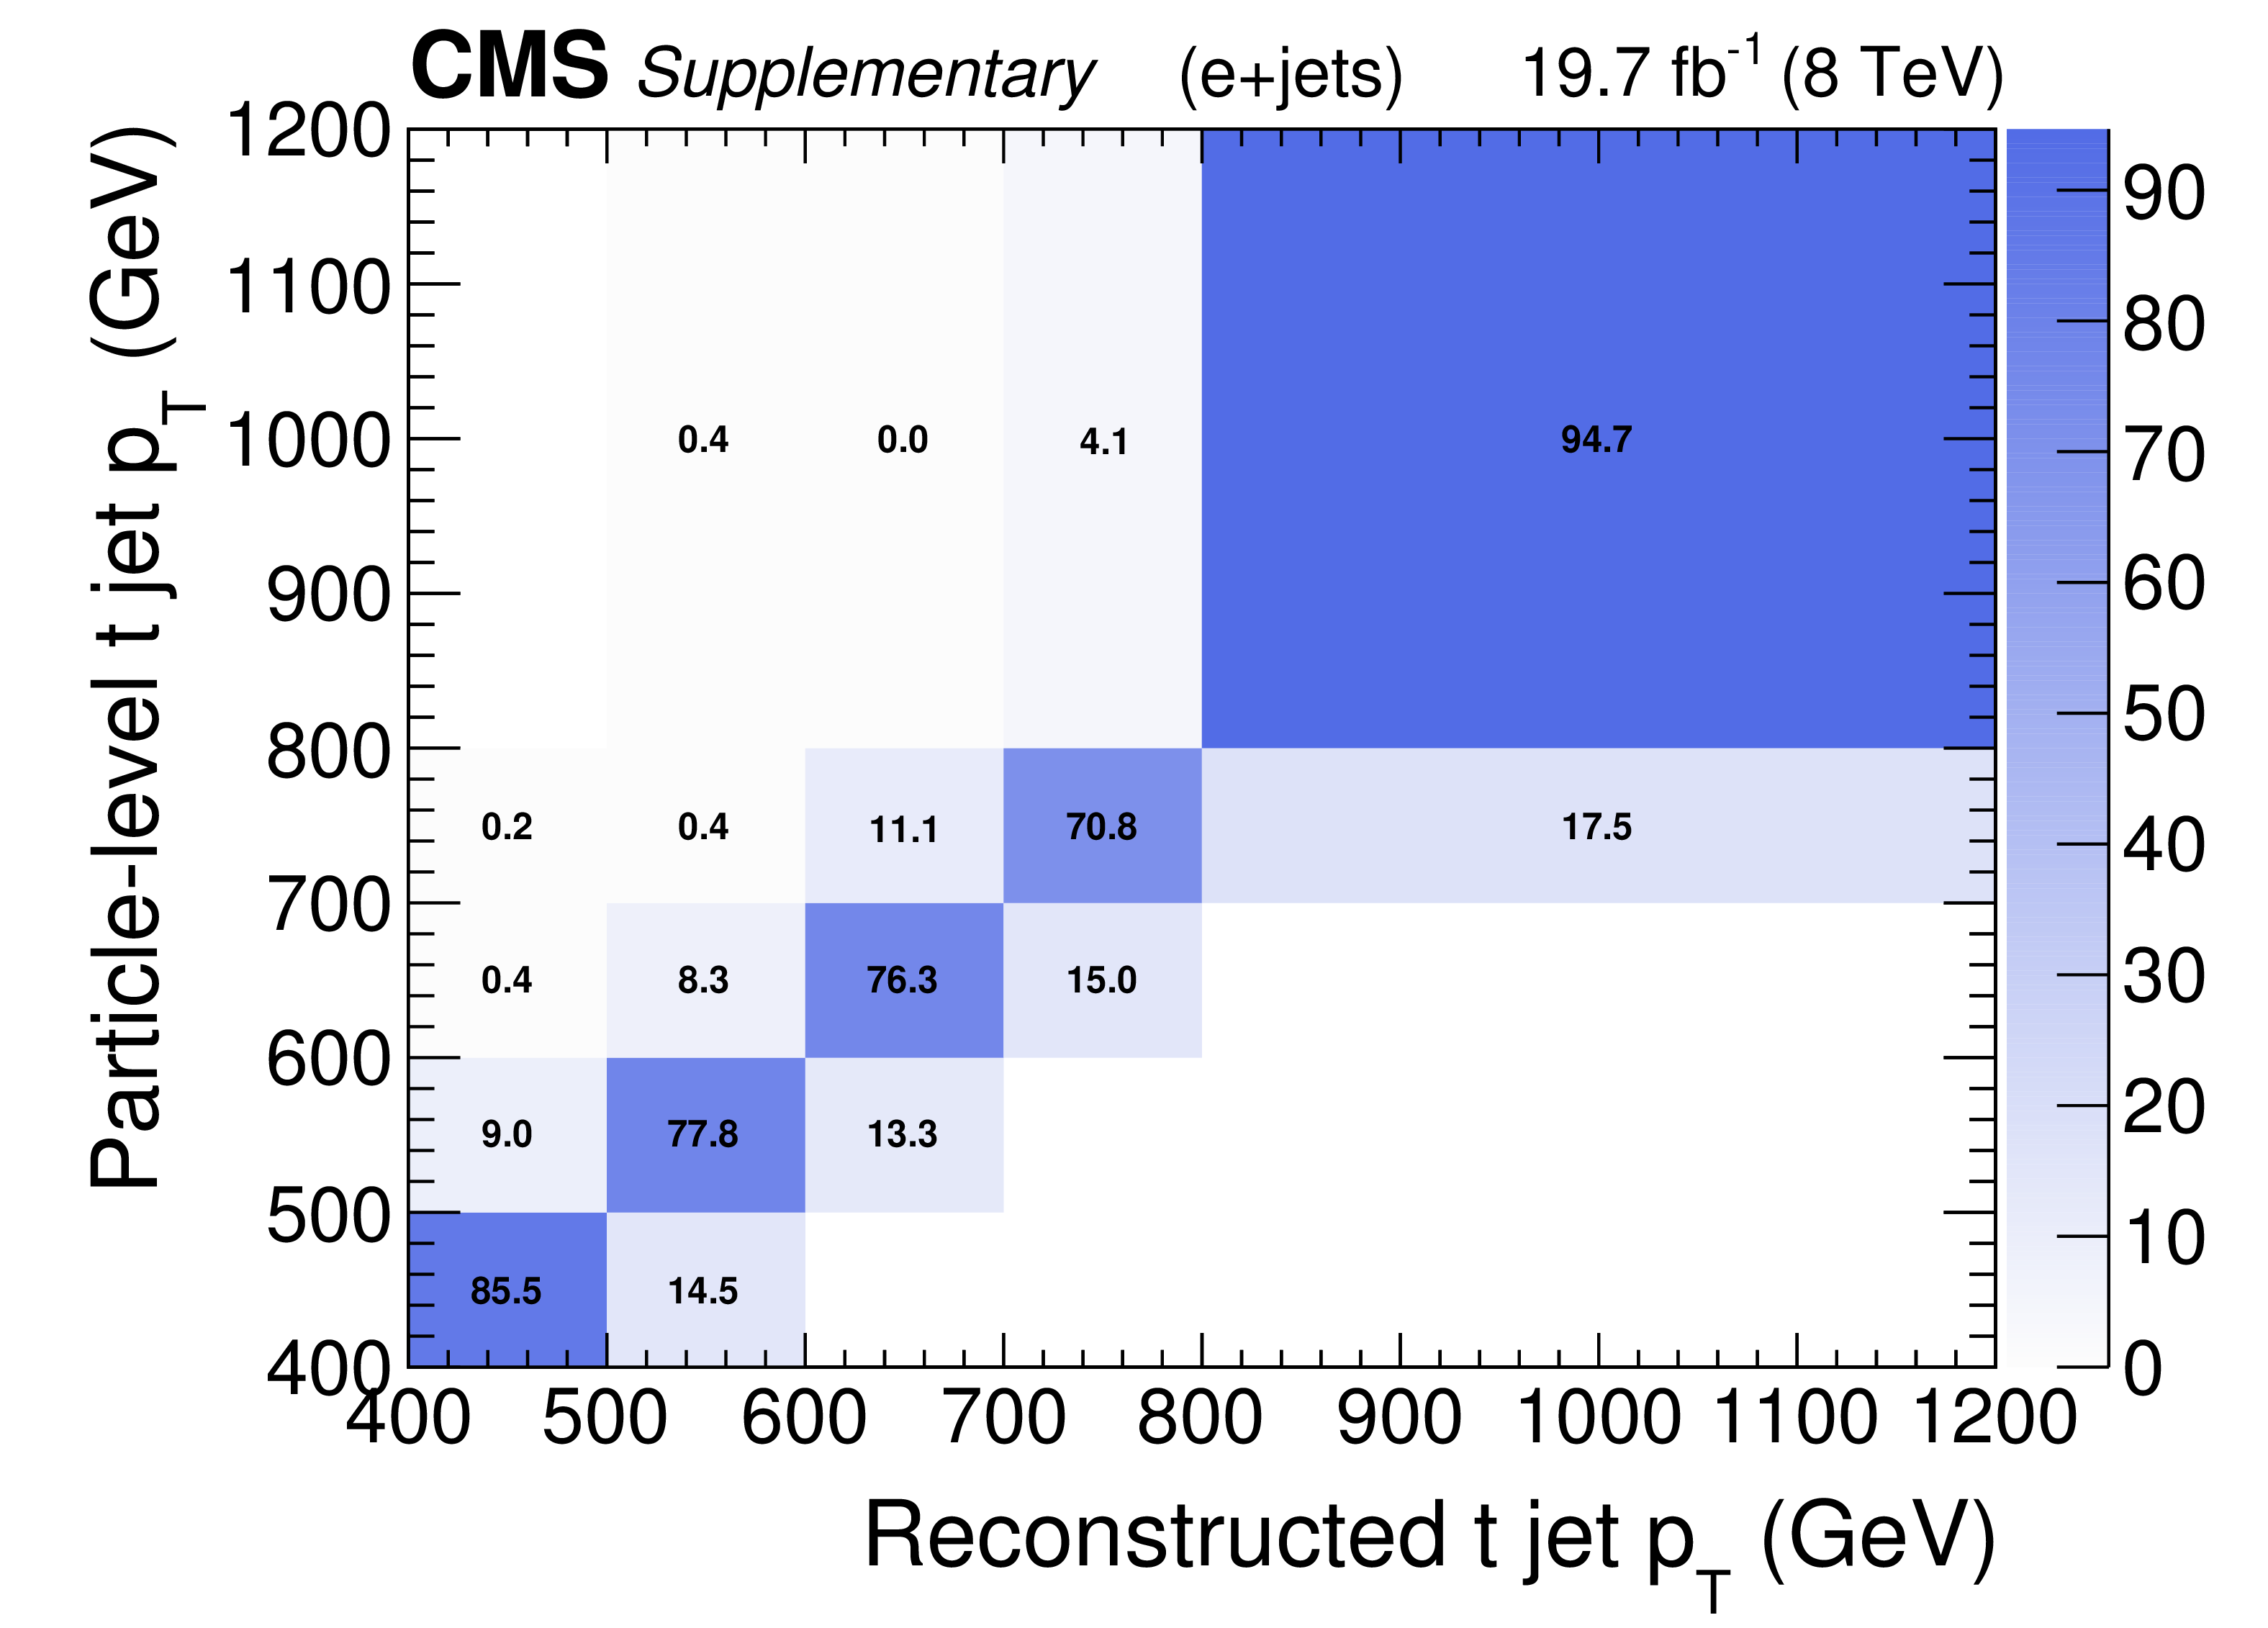
Additional Figure 4-a:
Bin migration matrices between the particle-level t jet $ {p_{\mathrm {T}}} $ and the parton-level top quark $ {p_{\mathrm {T}}} $ (c,d) and the reconstructed t jet $ {p_{\mathrm {T}}} $ and the particle-level t jet $ {p_{\mathrm {T}}} $ (a,b), shown for the e+jets (a,c) and $\mu $+jets (b,d) channels. The bin migration matrices are normalized so that each row adds up to 100%, including the over/underflow bins. |
png pdf |
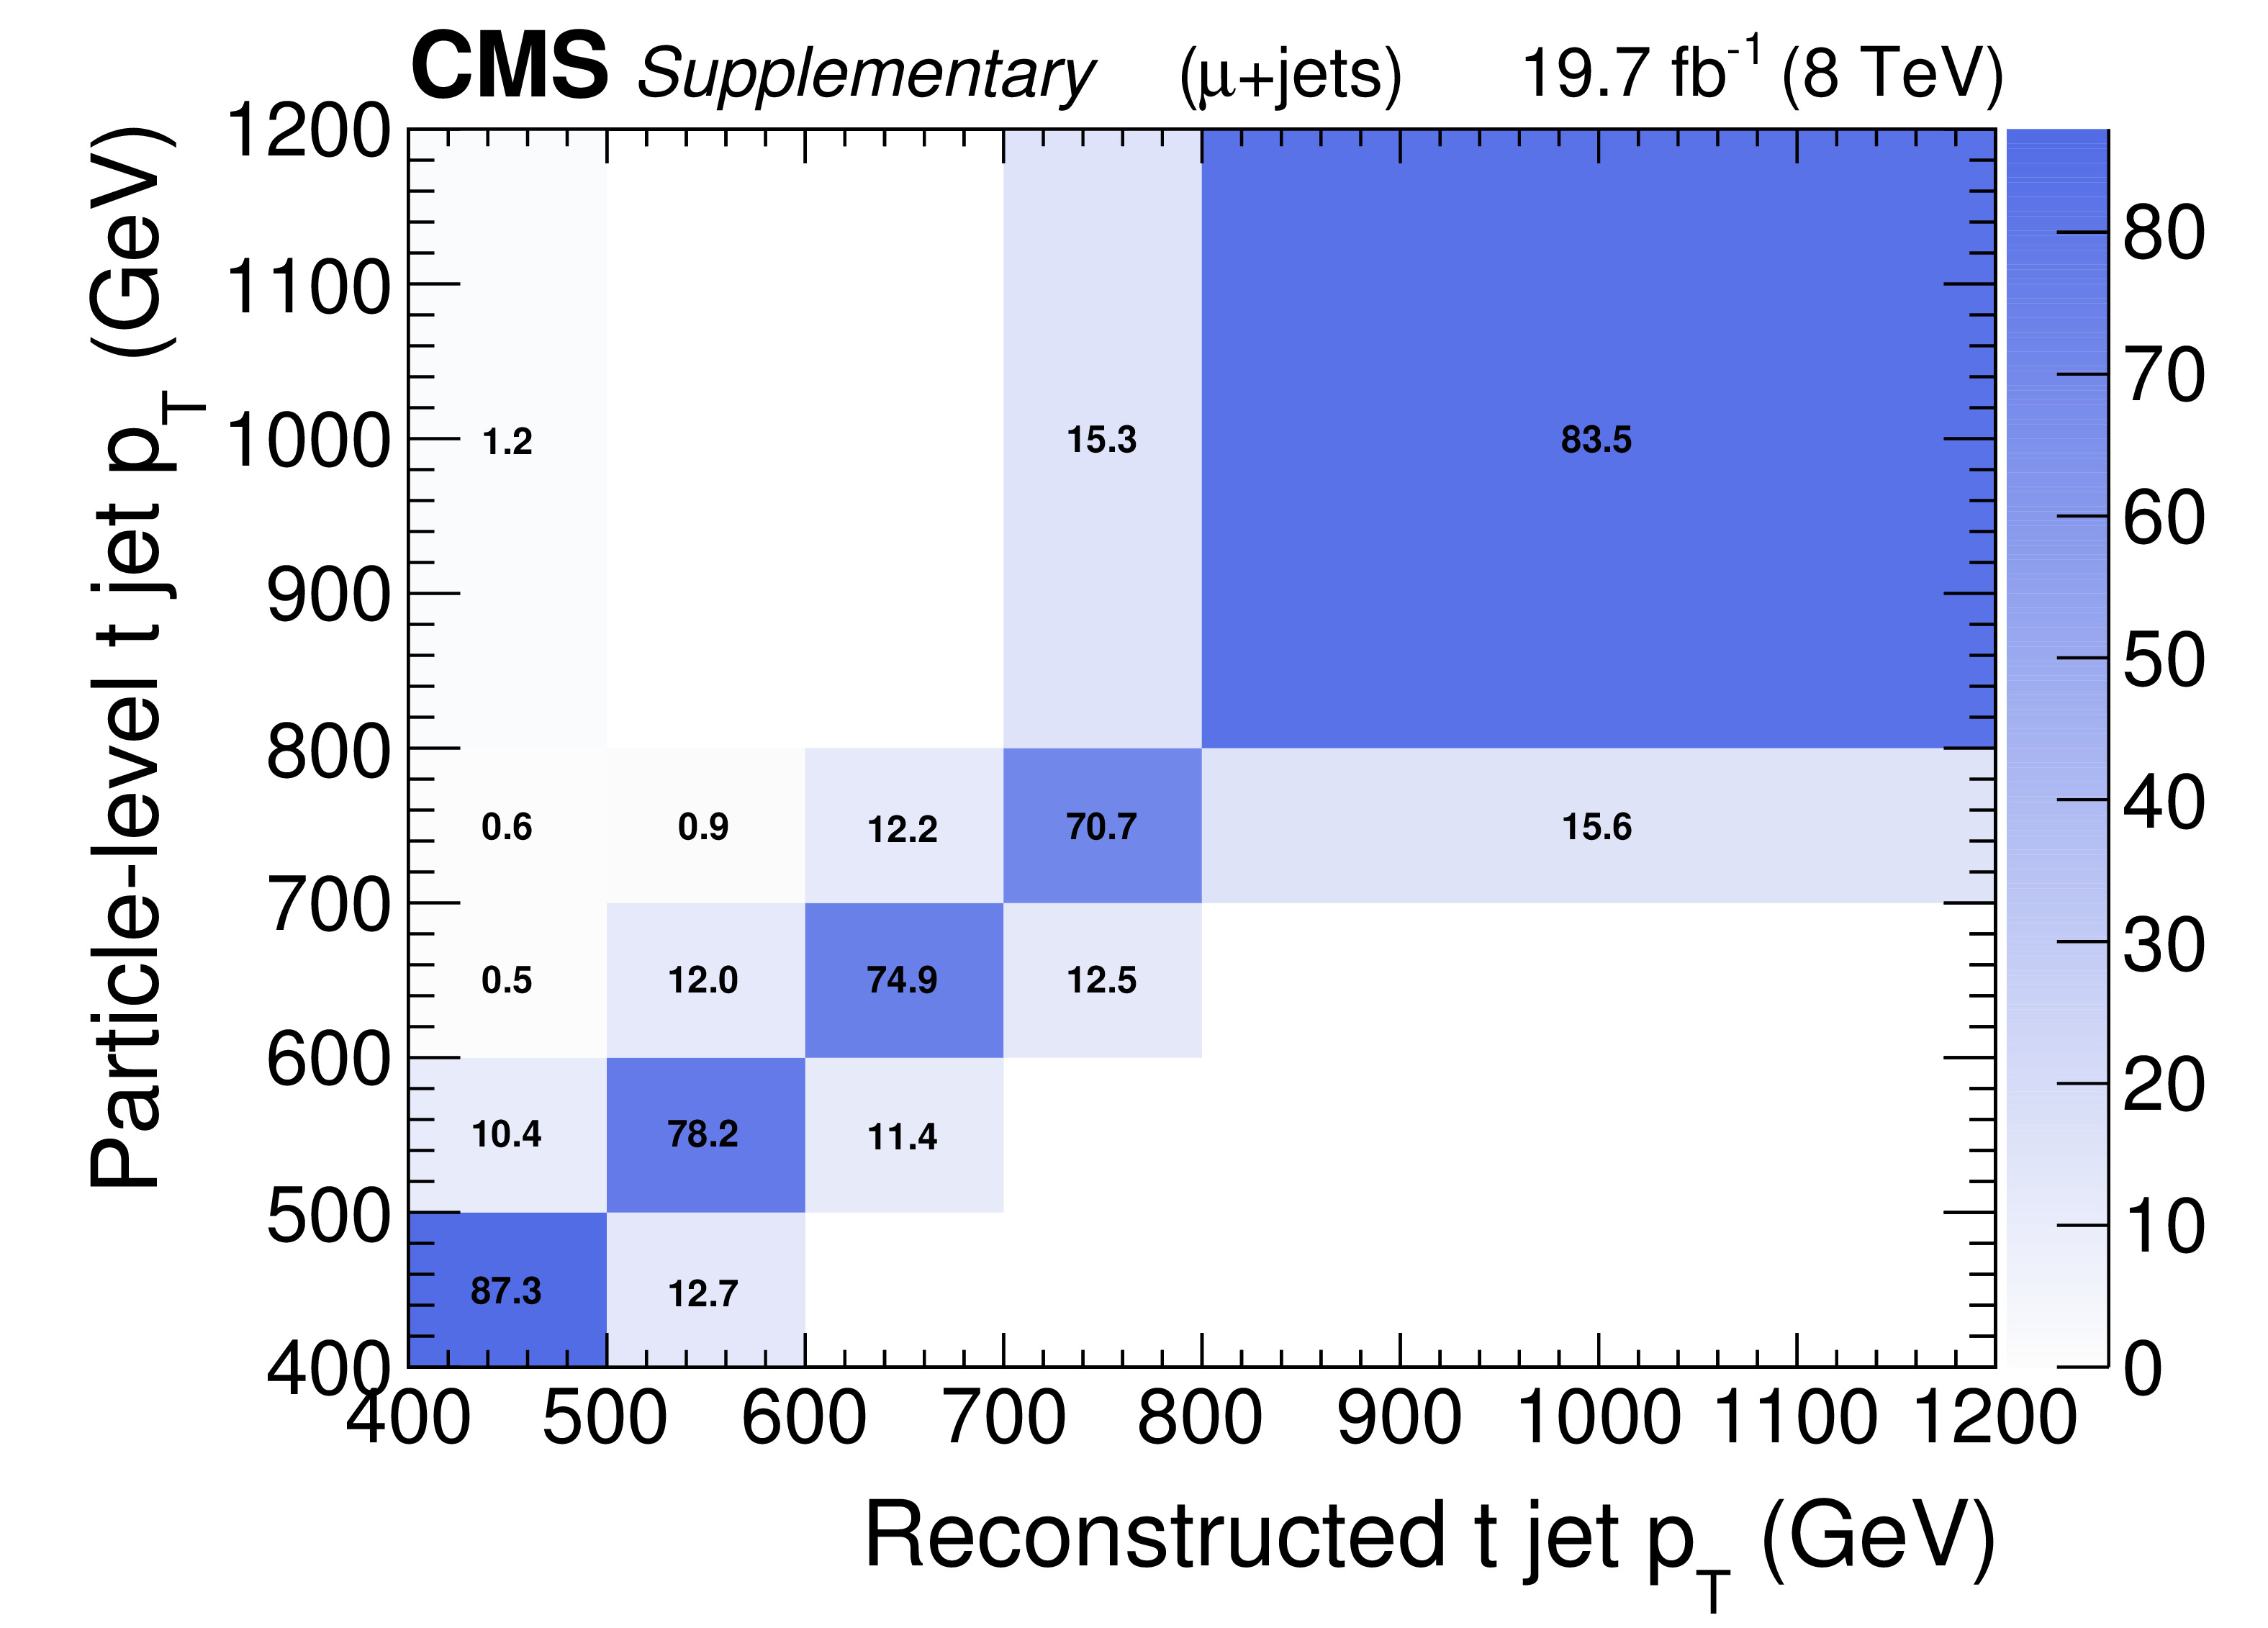
Additional Figure 4-b:
Bin migration matrices between the particle-level t jet $ {p_{\mathrm {T}}} $ and the parton-level top quark $ {p_{\mathrm {T}}} $ (c,d) and the reconstructed t jet $ {p_{\mathrm {T}}} $ and the particle-level t jet $ {p_{\mathrm {T}}} $ (a,b), shown for the e+jets (a,c) and $\mu $+jets (b,d) channels. The bin migration matrices are normalized so that each row adds up to 100%, including the over/underflow bins. |
png pdf |
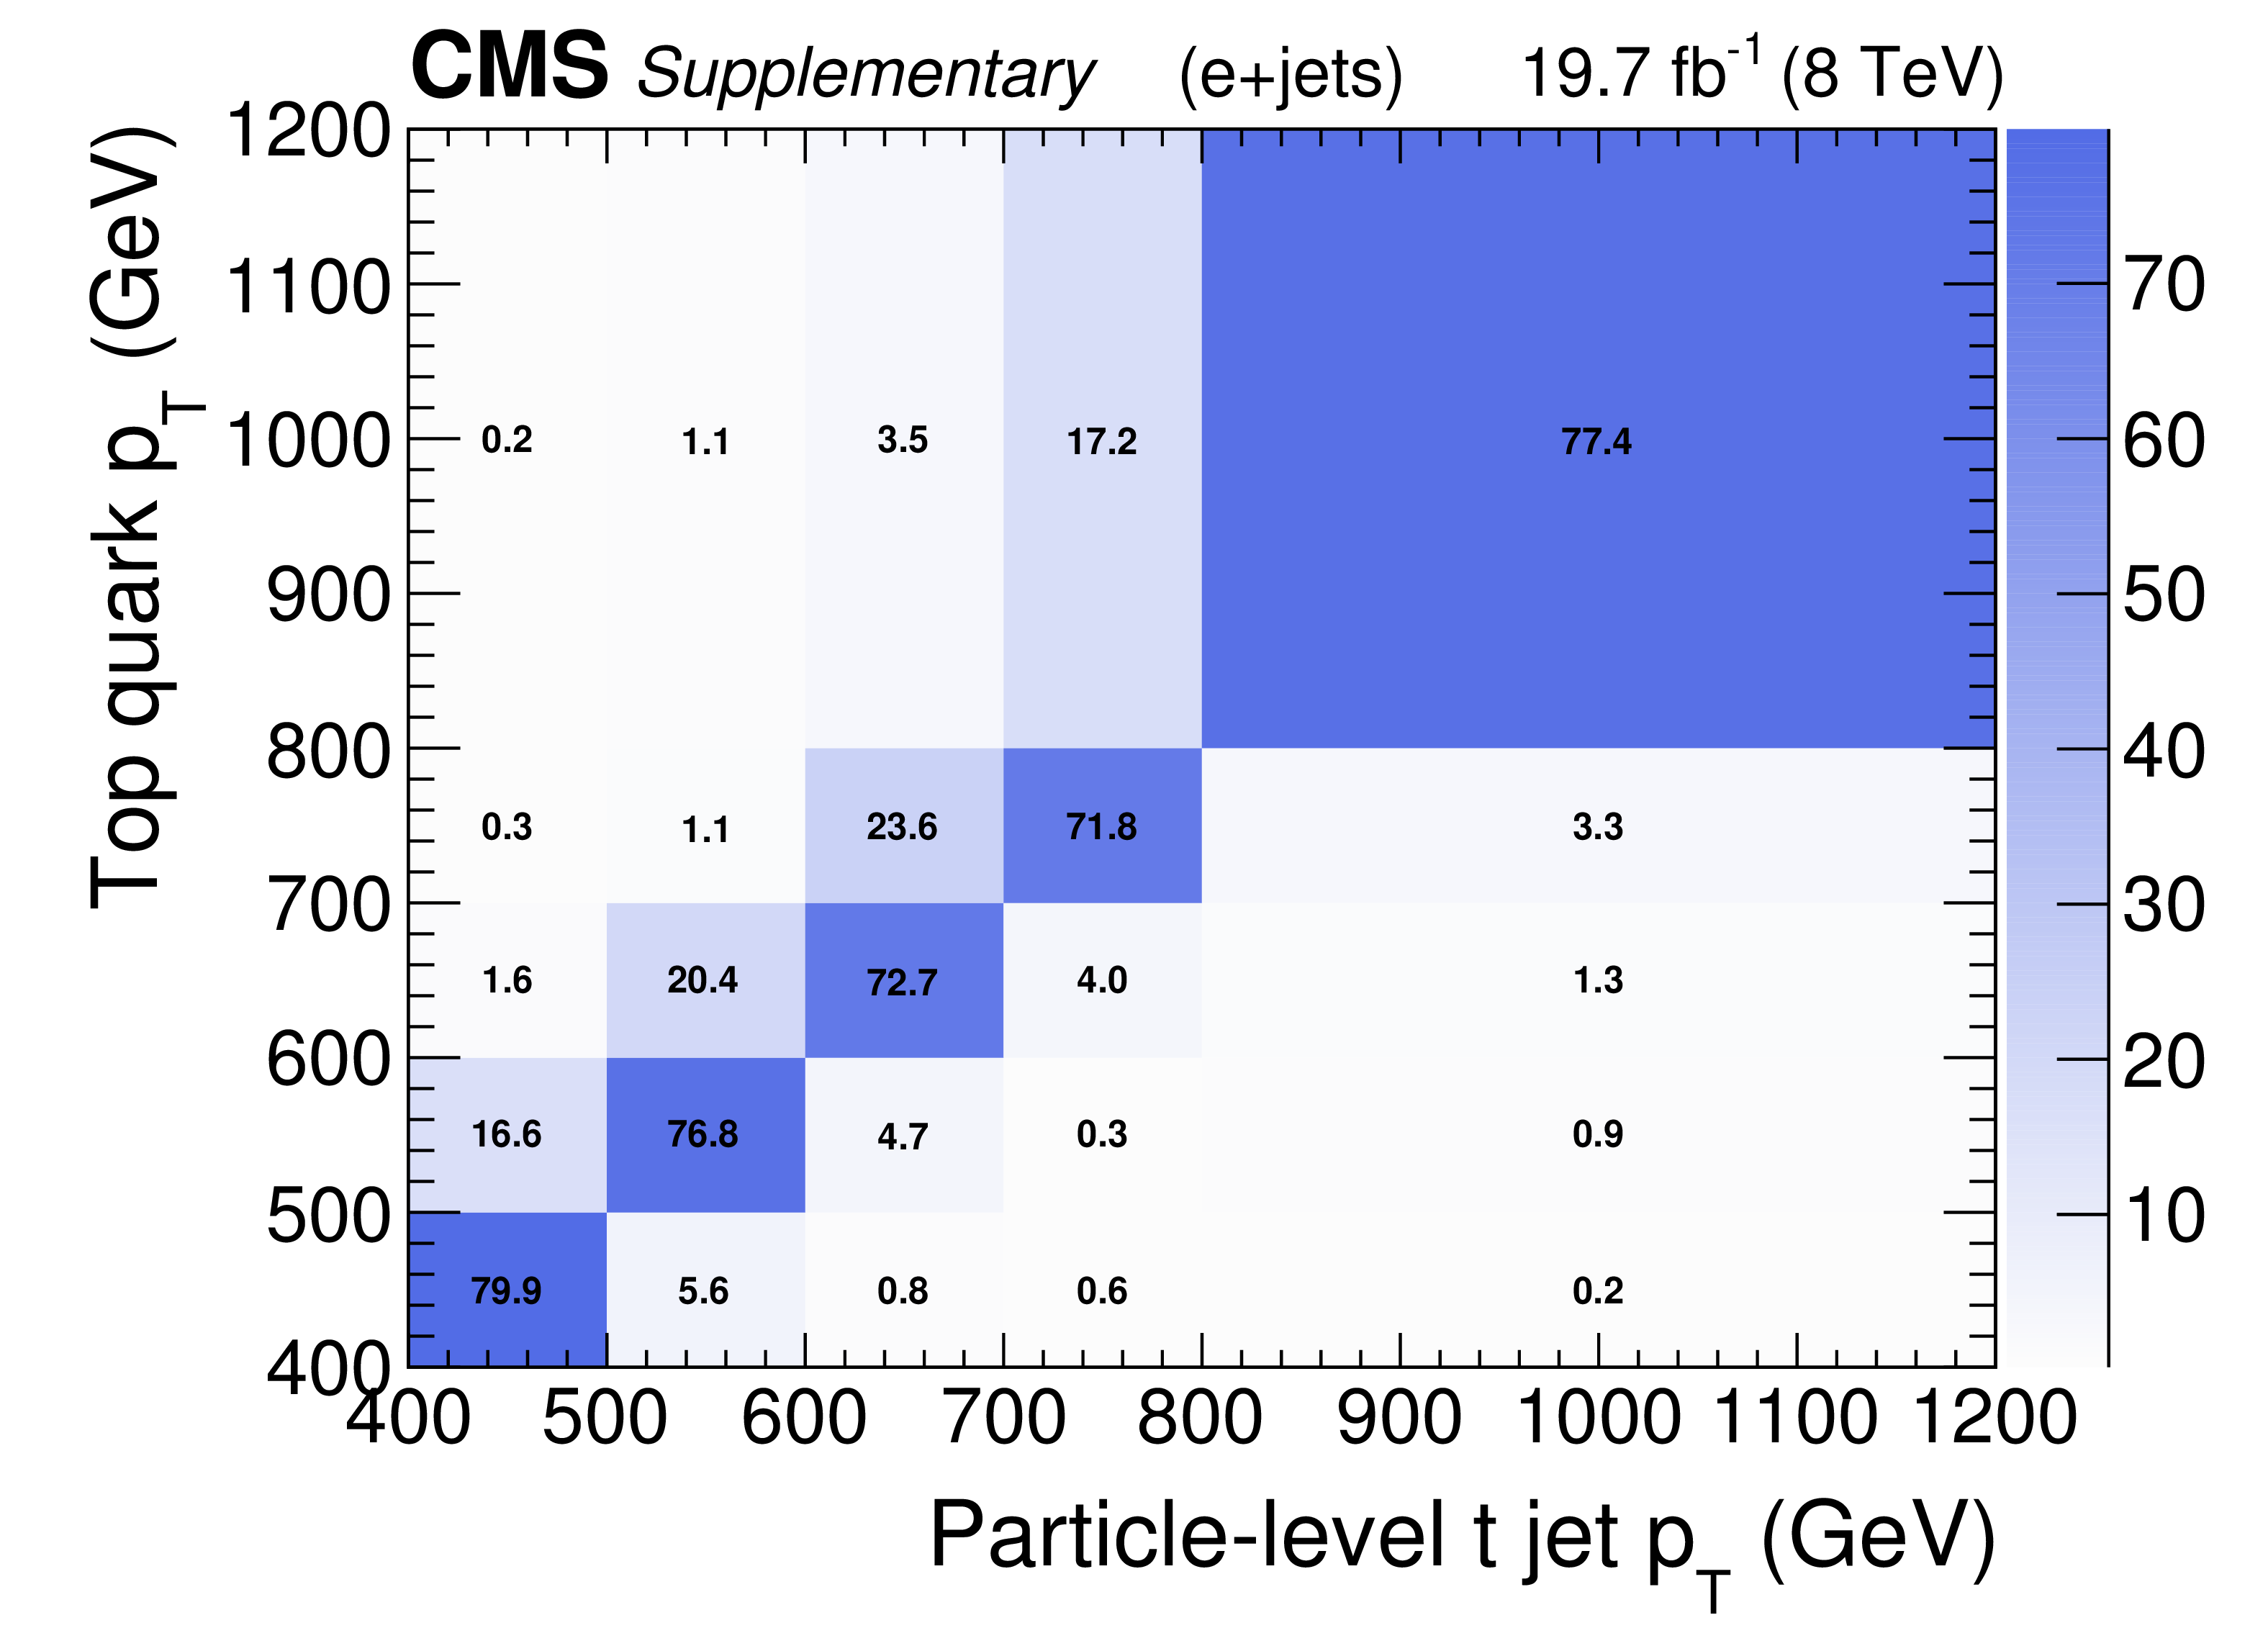
Additional Figure 4-c:
Bin migration matrices between the particle-level t jet $ {p_{\mathrm {T}}} $ and the parton-level top quark $ {p_{\mathrm {T}}} $ (c,d) and the reconstructed t jet $ {p_{\mathrm {T}}} $ and the particle-level t jet $ {p_{\mathrm {T}}} $ (a,b), shown for the e+jets (a,c) and $\mu $+jets (b,d) channels. The bin migration matrices are normalized so that each row adds up to 100%, including the over/underflow bins. |

png pdf |
Additional Figure 4-d:
Bin migration matrices between the particle-level t jet $ {p_{\mathrm {T}}} $ and the parton-level top quark $ {p_{\mathrm {T}}} $ (c,d) and the reconstructed t jet $ {p_{\mathrm {T}}} $ and the particle-level t jet $ {p_{\mathrm {T}}} $ (a,b), shown for the e+jets (a,c) and $\mu $+jets (b,d) channels. The bin migration matrices are normalized so that each row adds up to 100%, including the over/underflow bins. |
png pdf |
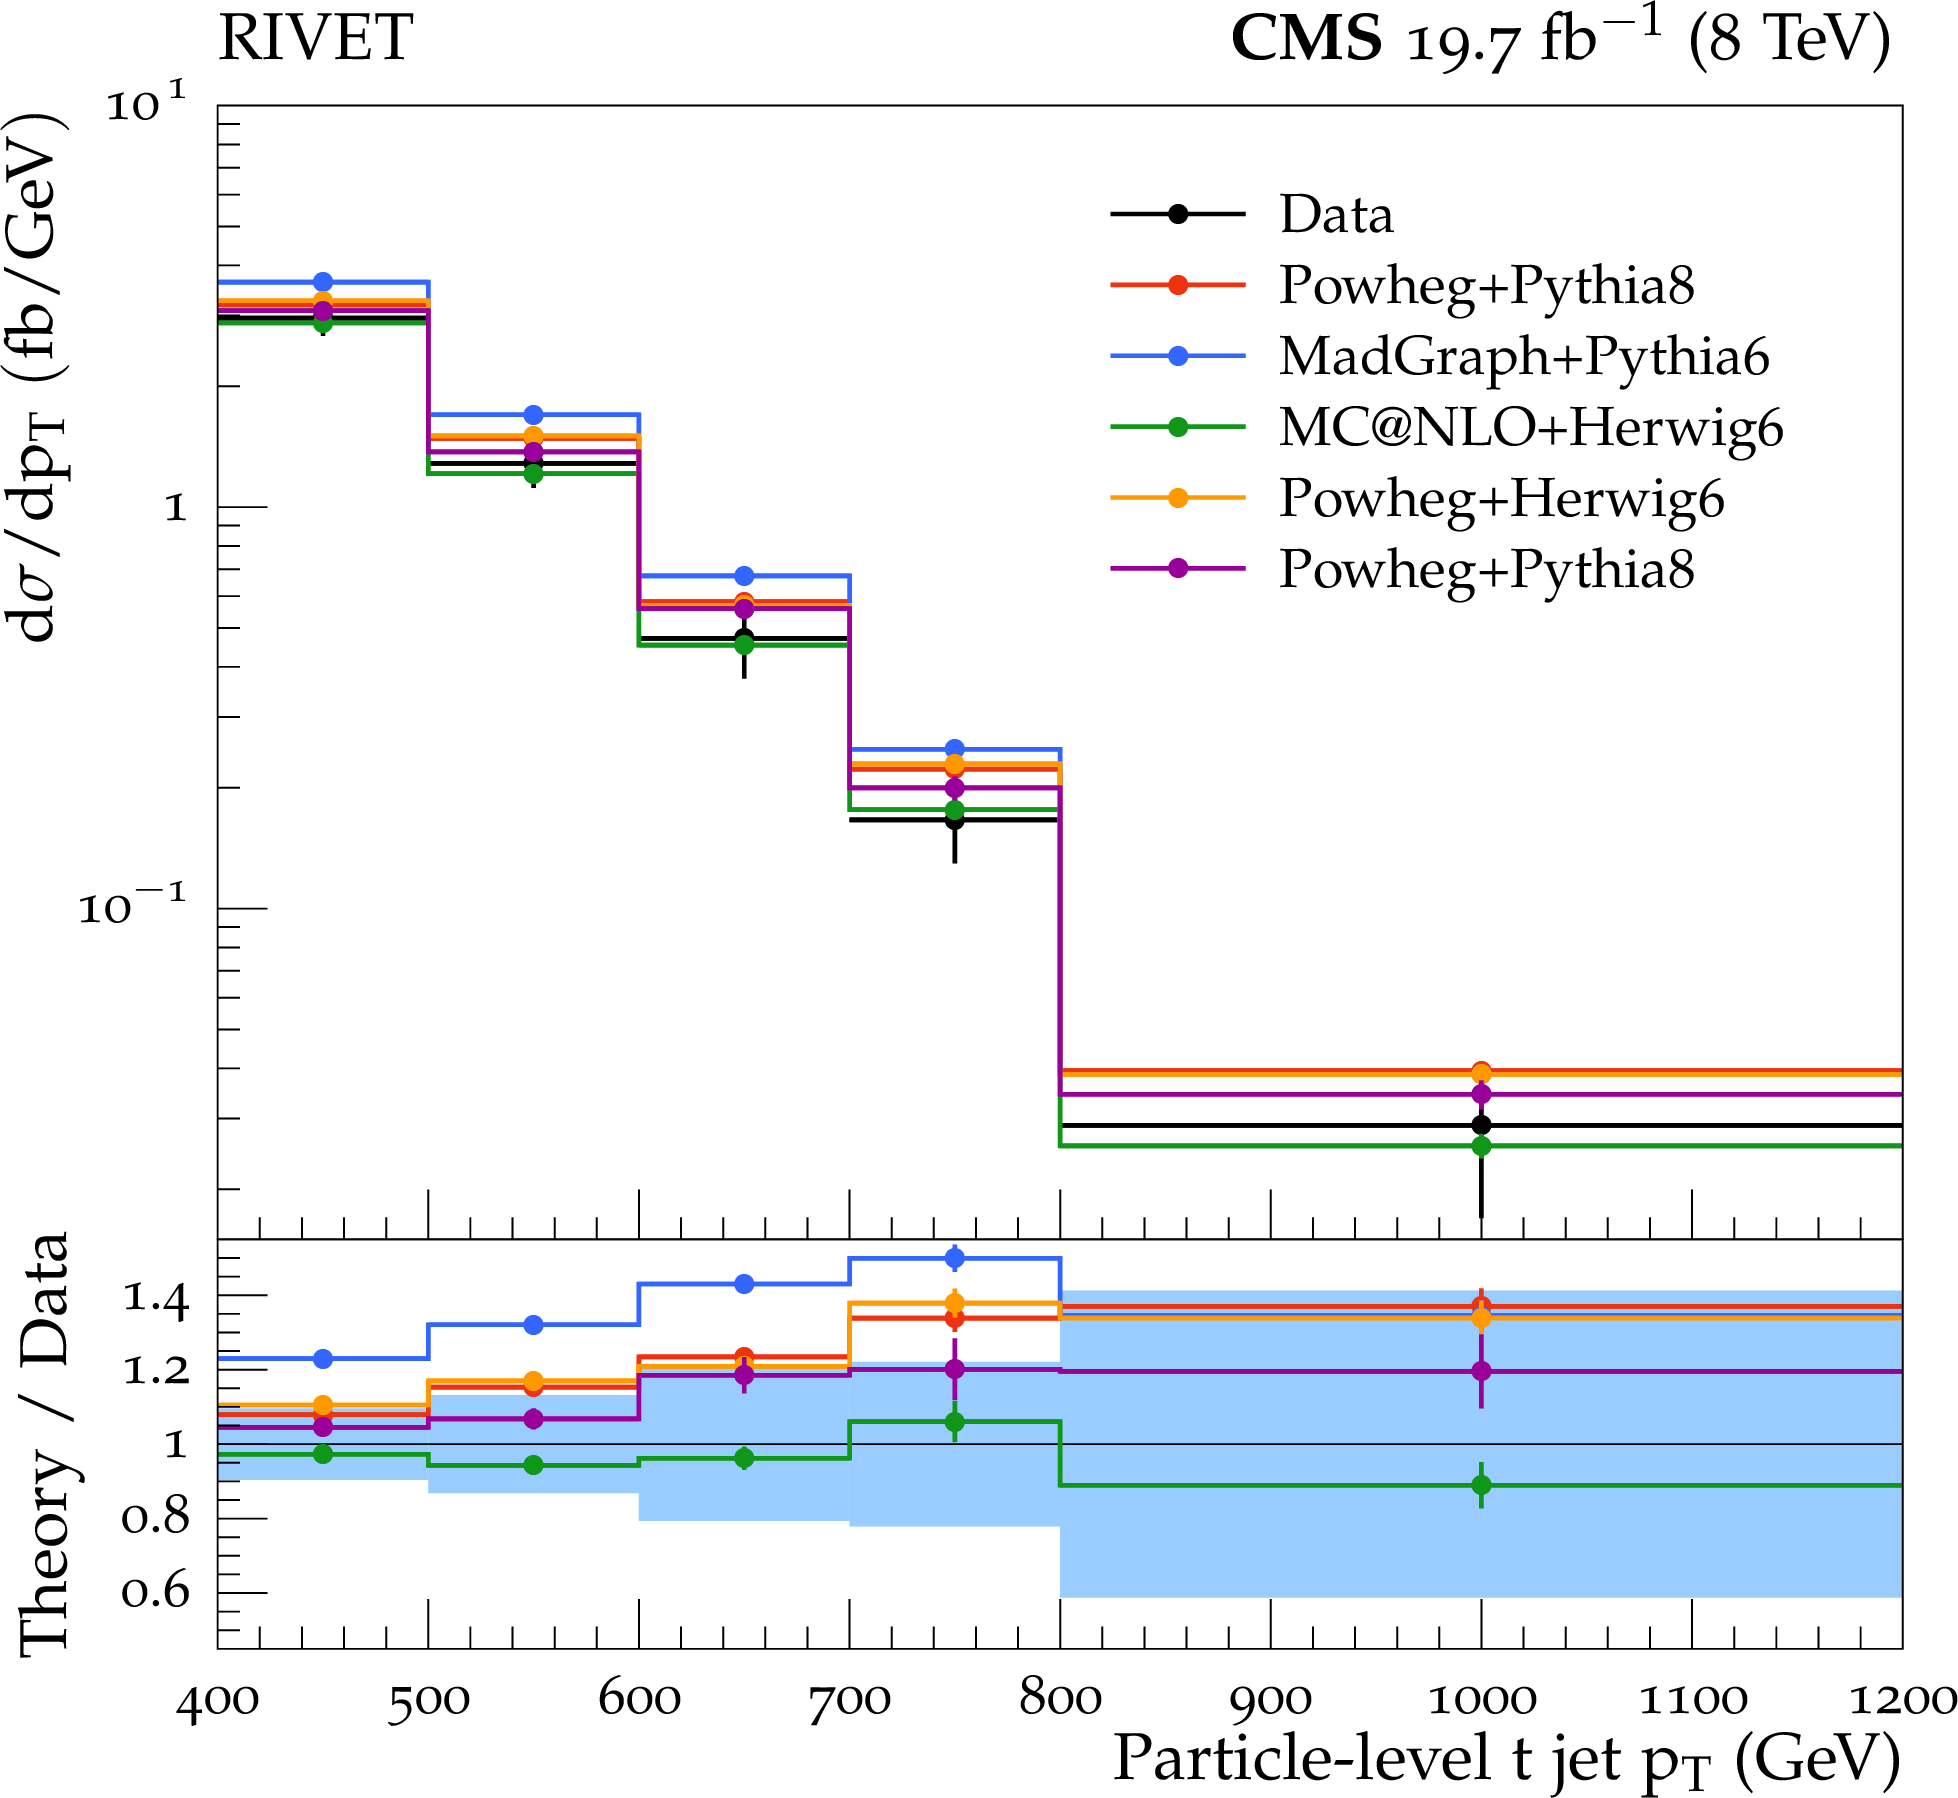
Additional Figure 5-a:
Differential $ {\mathrm{ t \bar{t} } } $ cross section in bins of particle-level t jet $ {p_{\mathrm {T}}} $ (a), parton-level top quark $ {p_{\mathrm {T}}} $ (b), particle-level t jet $y$ (c), and parton-level top quark $y$ (d), including the combined uncertainties. The different theoretical predictions are extracted using the RIVET framework. The lower plots show the ratio of these theoretical predictions to the data. The combined uncertainties are shown as vertical bars and the solid bands in the ratios. |

png pdf |
Additional Figure 5-b:
Differential $ {\mathrm{ t \bar{t} } } $ cross section in bins of particle-level t jet $ {p_{\mathrm {T}}} $ (a), parton-level top quark $ {p_{\mathrm {T}}} $ (b), particle-level t jet $y$ (c), and parton-level top quark $y$ (d), including the combined uncertainties. The different theoretical predictions are extracted using the RIVET framework. The lower plots show the ratio of these theoretical predictions to the data. The combined uncertainties are shown as vertical bars and the solid bands in the ratios. |
png pdf |
Additional Figure 5-c:
Differential $ {\mathrm{ t \bar{t} } } $ cross section in bins of particle-level t jet $ {p_{\mathrm {T}}} $ (a), parton-level top quark $ {p_{\mathrm {T}}} $ (b), particle-level t jet $y$ (c), and parton-level top quark $y$ (d), including the combined uncertainties. The different theoretical predictions are extracted using the RIVET framework. The lower plots show the ratio of these theoretical predictions to the data. The combined uncertainties are shown as vertical bars and the solid bands in the ratios. |
png pdf |
Additional Figure 5-d:
Differential $ {\mathrm{ t \bar{t} } } $ cross section in bins of particle-level t jet $ {p_{\mathrm {T}}} $ (a), parton-level top quark $ {p_{\mathrm {T}}} $ (b), particle-level t jet $y$ (c), and parton-level top quark $y$ (d), including the combined uncertainties. The different theoretical predictions are extracted using the RIVET framework. The lower plots show the ratio of these theoretical predictions to the data. The combined uncertainties are shown as vertical bars and the solid bands in the ratios. |
| References | ||||
| 1 | CMS Collaboration | The CMS experiment at the CERN LHC | JINST 3 (2008) S08004 | CMS-00-001 |
| 2 | ATLAS Collaboration | The ATLAS experiment at the CERN Large Hadron Collider | JINST 3 (2008) S08003 | |
| 3 | CMS Collaboration | Measurement of differential top-quark pair production cross sections in $ \mathrm{ p } \mathrm{ p } $ colisions at $ \sqrt{s} = $ 7 TeV | EPJC 73 (2013) 2339 | CMS-TOP-11-013 1211.2220 |
| 4 | CMS Collaboration | Measurement of the differential cross section for top quark pair production in $ \mathrm{ p } \mathrm{ p } $ collisions at $ \sqrt{s} = $ 8 TeV | EPJC 75 (2015) 542 | CMS-TOP-12-028 1505.04480 |
| 5 | ATLAS Collaboration | Differential top-antitop cross-section measurements as a function of observables constructed from final-state particles using $ \mathrm{ p } \mathrm{ p } $ collisions at $ \sqrt{s} = $ 7 TeV in the ATLAS detector | JHEP 06 (2015) 100 | 1502.05923 |
| 6 | ATLAS Collaboration | Measurements of normalized differential cross sections for $ \mathrm{ t \bar{t} } $ production in $ \mathrm{ p } \mathrm{ p } $ collisions at $ \sqrt{s} = $ 7 TeV using the ATLAS detector | PRD 90 (2014) 072004 | 1407.0371 |
| 7 | CMS Collaboration | Measurement of the $ \mathrm{ t \bar{t} } $ production cross section in the all-jets final state in $ \mathrm{ p } \mathrm{ p } $ collisions at $ \sqrt{s} = $ 8 TeV | Submitted to EPJC | CMS-TOP-14-018 1509.06076 |
| 8 | R. Frederix and F. Maltoni | Top pair invariant mass distribution: a window on new physics | JHEP 01 (2009) 047 | 0712.2355 |
| 9 | ATLAS Collaboration | Measurement of the differential cross-section of highly boosted top quarks as a function of their transverse momentum in $ \sqrt{s} = $ 8 TeV proton-proton collisions using the ATLAS detector | Submitted to PRD | 1510.03818 |
| 10 | CMS Collaboration | Searches for new physics using the $ \mathrm{ t \bar{t} } $ invariant mass distribution in $ \mathrm{ p } \mathrm{ p } $ collisions at $ \sqrt{s} = $ 8 TeV | PRL 111 (2013) 211804, , [Erratum: \DOI10.1103/PhysRevLett.112.119903] | CMS-B2G-13-001 1309.2030 |
| 11 | CMS Collaboration | Search for resonant $ \mathrm{ t \bar{t} } $ production in proton-proton collisions at $ \sqrt{s} = $ 8 TeV | PRD 93 (2016) 012001 | CMS-B2G-13-008 1506.03062 |
| 12 | CMS Collaboration | Particle-flow event reconstruction in CMS and performance for jets, taus, and $ E_{\mathrm{T}}^{\text{miss}} $ | CMS-PAS-PFT-09-001 | |
| 13 | CMS Collaboration | Commissioning of the particle-flow event reconstruction with the first LHC collisions recorded in the CMS detector | CMS-PAS-PFT-10-001 | |
| 14 | CMS Collaboration | CMS luminosity based on pixel cluster counting -- summer 2013 update | CMS-PAS-LUM-13-001 | CMS-PAS-LUM-13-001 |
| 15 | P. Nason | A new method for combining NLO QCD with shower Monte Carlo algorithms | JHEP 11 (2004) 040 | hep-ph/0409146 |
| 16 | S. Frixione, P. Nason, and C. Oleari | Matching NLO QCD computations with Parton Shower simulations: the POWHEG method | JHEP 11 (2007) 070 | 0709.2092 |
| 17 | S. Alioli, P. Nason, C. Oleari, and E. Re | A general framework for implementing NLO calculations in shower Monte Carlo programs: the POWHEG BOX | JHEP 06 (2010) 043 | 1002.2581 |
| 18 | J. M. Campbell, R. K. Ellis, P. Nason, and E. Re | Top-pair production and decay at NLO matched with parton showers | JHEP 04 (2015) 114 | 1412.1828 |
| 19 | S. Alioli, P. Nason, C. Oleari, and E. Re | NLO single-top production matched with shower in POWHEG: $ s $- and $ t $-channel contributions | JHEP 09 (2009) 111, , [Erratum: \DOI10.1007/JHEP02(2010)011] | 0907.4076 |
| 20 | J. Alwall et al. | The automated computation of tree-level and next-to-leading order differential cross sections, and their matching to parton shower simulations | JHEP 07 (2014) 079 | 1405.0301 |
| 21 | S. Frixione and B. R. Webber | Matching NLO QCD computations and parton shower simulations | JHEP 06 (2002) 029 | hep-ph/0204244 |
| 22 | G. Corcella et al. | HERWIG 6: An Event generator for hadron emission reactions with interfering gluons (including supersymmetric processes) | JHEP 01 (2001) 010 | hep-ph/0011363 |
| 23 | T. Sj\"ostrand, S. Mrenna, and P. Skands | PYTHIA 6.4 physics and manual | JHEP 05 (2006) 026 | hep-ph/0603175 |
| 24 | R. Field | Early LHC underlying event data -- findings and surprises | in Hadron collider physics. Proceedings, 22nd Conference, HCP 2010, Toronto, 2010 | 1010.3558 |
| 25 | J. Pumplin et al. | New generation of parton distributions with uncertainties from global QCD analysis | JHEP 07 (2002) 012 | hep-ph/0201195 |
| 26 | J. Gao et al. | CT10 next-to-next-to-leading order global analysis of QCD | PRD 89 (2014) 033009 | 1302.6246 |
| 27 | GEANT4 Collaboration | GEANT4---a simulation toolkit | NIMA 506 (2003) 250 | |
| 28 | CMS Collaboration | Determination of jet energy calibration and transverse momentum resolution in CMS | JINST 6 (2011) P11002 | CMS-JME-10-011 1107.4277 |
| 29 | M. Cacciari, G. P. Salam, and G. Soyez | The catchment area of jets | JHEP 04 (2008) 005 | 0802.1188 |
| 30 | M. Cacciari, G. P. Salam, and G. Soyez | FastJet user manual | EPJC 72 (2012) 1896 | 1111.6097 |
| 31 | M. Cacciari, G. P. Salam, and G. Soyez | The anti-$ k_t $ jet clustering algorithm | JHEP 04 (2008) 063 | 0802.1189 |
| 32 | CMS Collaboration | Identification of $ \mathrm{ b } $-quark jets with the CMS experiment | JINST 8 (2013) P04013 | CMS-BTV-12-001 1211.4462 |
| 33 | M. Wobisch and T. Wengler | Hadronization corrections to jet cross sections in deep-inelastic scattering | hep-ph/9907280 | |
| 34 | Y. L. Dokshitzer, G. D. Leder, S. Moretti, and B. R. Webber | Better jet clustering algorithms | JHEP 08 (1997) 001 | hep-ph/9707323 |
| 35 | CMS Collaboration | Boosted top jet tagging at CMS | CMS-PAS-JME-13-007 | CMS-PAS-JME-13-007 |
| 36 | CMS Collaboration | Performance of electron reconstruction and selection with the CMS detector in proton-proton collisions at $ \sqrt{s} = $ 8 TeV | JINST 10 (2015) P06005 | CMS-EGM-13-001 1502.02701 |
| 37 | CMS Collaboration | Performance of CMS muon reconstruction in pp collision events at $ \sqrt{s} = $ 7 TeV | JINST 7 (2012) P10002 | CMS-MUO-10-004 1206.4071 |
| 38 | A. D. Martin, W. J. Stirling, R. S. Thorne, and G. Watt | Parton distributions for the LHC | EPJC 63 (2009) 189 | 0901.0002 |
| 39 | R. D. Ball et al. | Parton distributions with LHC data | Nucl. Phys. B 867 (2013) 244 | 1207.1303 |
| 40 | S. Alekhin et al. | The PDF4LHC Working Group interim report | 1101.0536 | |
| 41 | M. Botje et al. | The PDF4LHC Working Group interim recommendations | 1101.0538 | |
| 42 | J. Ott | The Theta package | ||
| 43 | M. Czakon and A. Mitov | Top++: a program for the calculation of the top-pair cross-section at hadron colliders | CPC 185 (2014) 2930 | 1112.5675 |
| 44 | A. H\"ocker and V. Kartvelishvili | SVD approach to data unfolding | NIMA 372 (1996) 469 | hep-ph/9509307 |
| 45 | T. Adye | Unfolding algorithms and tests using RooUnfold | 1105.1160 | |
|
|
Compact Muon Solenoid LHC, CERN |
|

|

|

|

|

|