

Compact Muon Solenoid
LHC, CERN
| CMS-TOP-14-018 ; CERN-PH-EP-2015-243 | ||
| Measurement of the $ \mathrm{ t \bar{t} } $ production cross section in the all-jets final state in pp collisions at $\sqrt{s} =$ 8 TeV | ||
| CMS Collaboration | ||
| 21 September 2015 | ||
| Eur. Phys. J. C 76 (2016) 128 | ||
| Abstract: The cross section for $ \mathrm{ t \bar{t} } $ production in the all-jets final state is measured in pp collisions at a centre-of-mass energy of 8 TeV at the LHC with the CMS detector, in data corresponding to an integrated luminosity of 18.4 fb$^{-1}$. The inclusive cross section is found to be 275.6 $\pm$ 6.1 (stat) $\pm$ 37.8 (syst) $\pm$ 7.2 (lum) pb. The normalized differential cross sections are measured as a function of the top quark transverse momenta, $ p_{\mathrm{T}} $, and compared to predictions from quantum chromodynamics. The results are reported at detector, parton, and particle levels. In all cases, the measured top quark $ p_{\mathrm{T}} $ spectra are significantly softer than theoretical predictions. | ||
| Links: e-print arXiv:1509.06076 [hep-ex] (PDF) ; CDS record ; inSPIRE record ; CADI line (restricted) ; | ||
| Figures & Tables | Summary | Additional Figures | CMS Publications |
|---|
| Figures | |
png pdf |
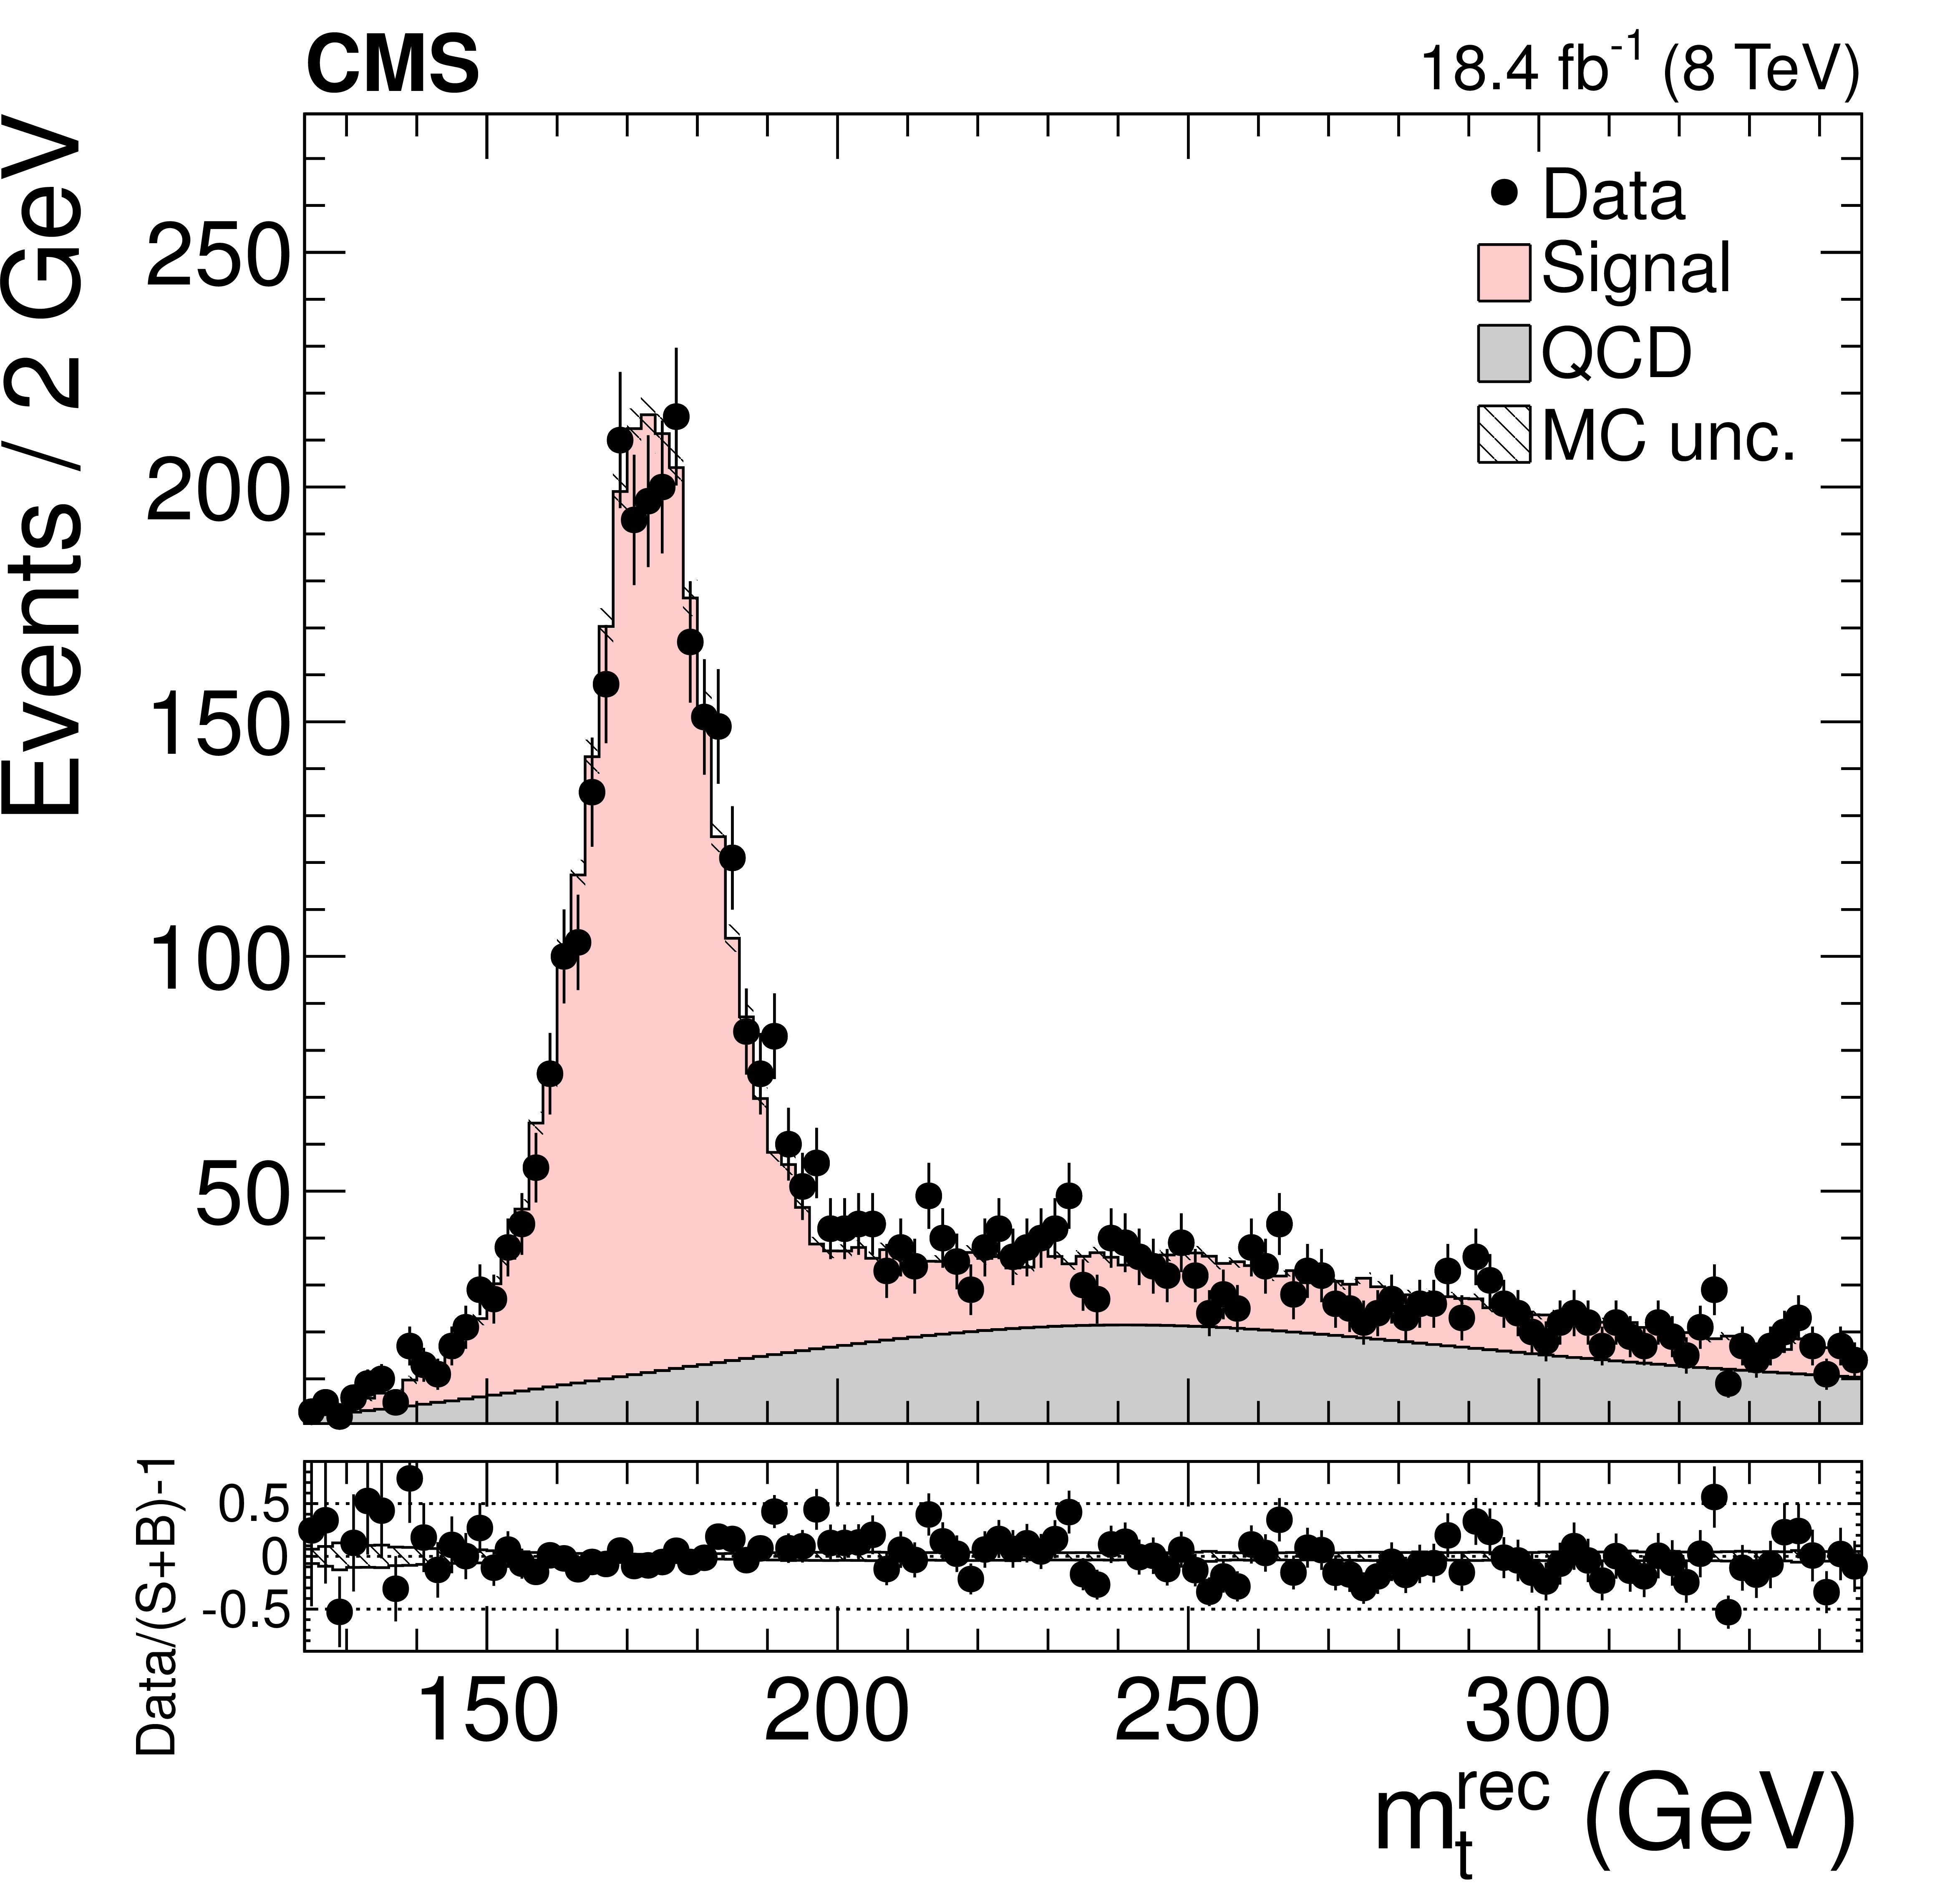
Figure 1:
Distribution of the reconstructed top quark mass after the kinematic fit. The normalizations of the $ {\mathrm {t}} {\overline {\mathrm {t}}}$ signal and the QCD multijet background are taken from the template fit to the data. The bottom panel shows the fractional difference between the data and the sum of signal and background predictions, with the shaded band representing the MC statistical uncertainty. |
png pdf |
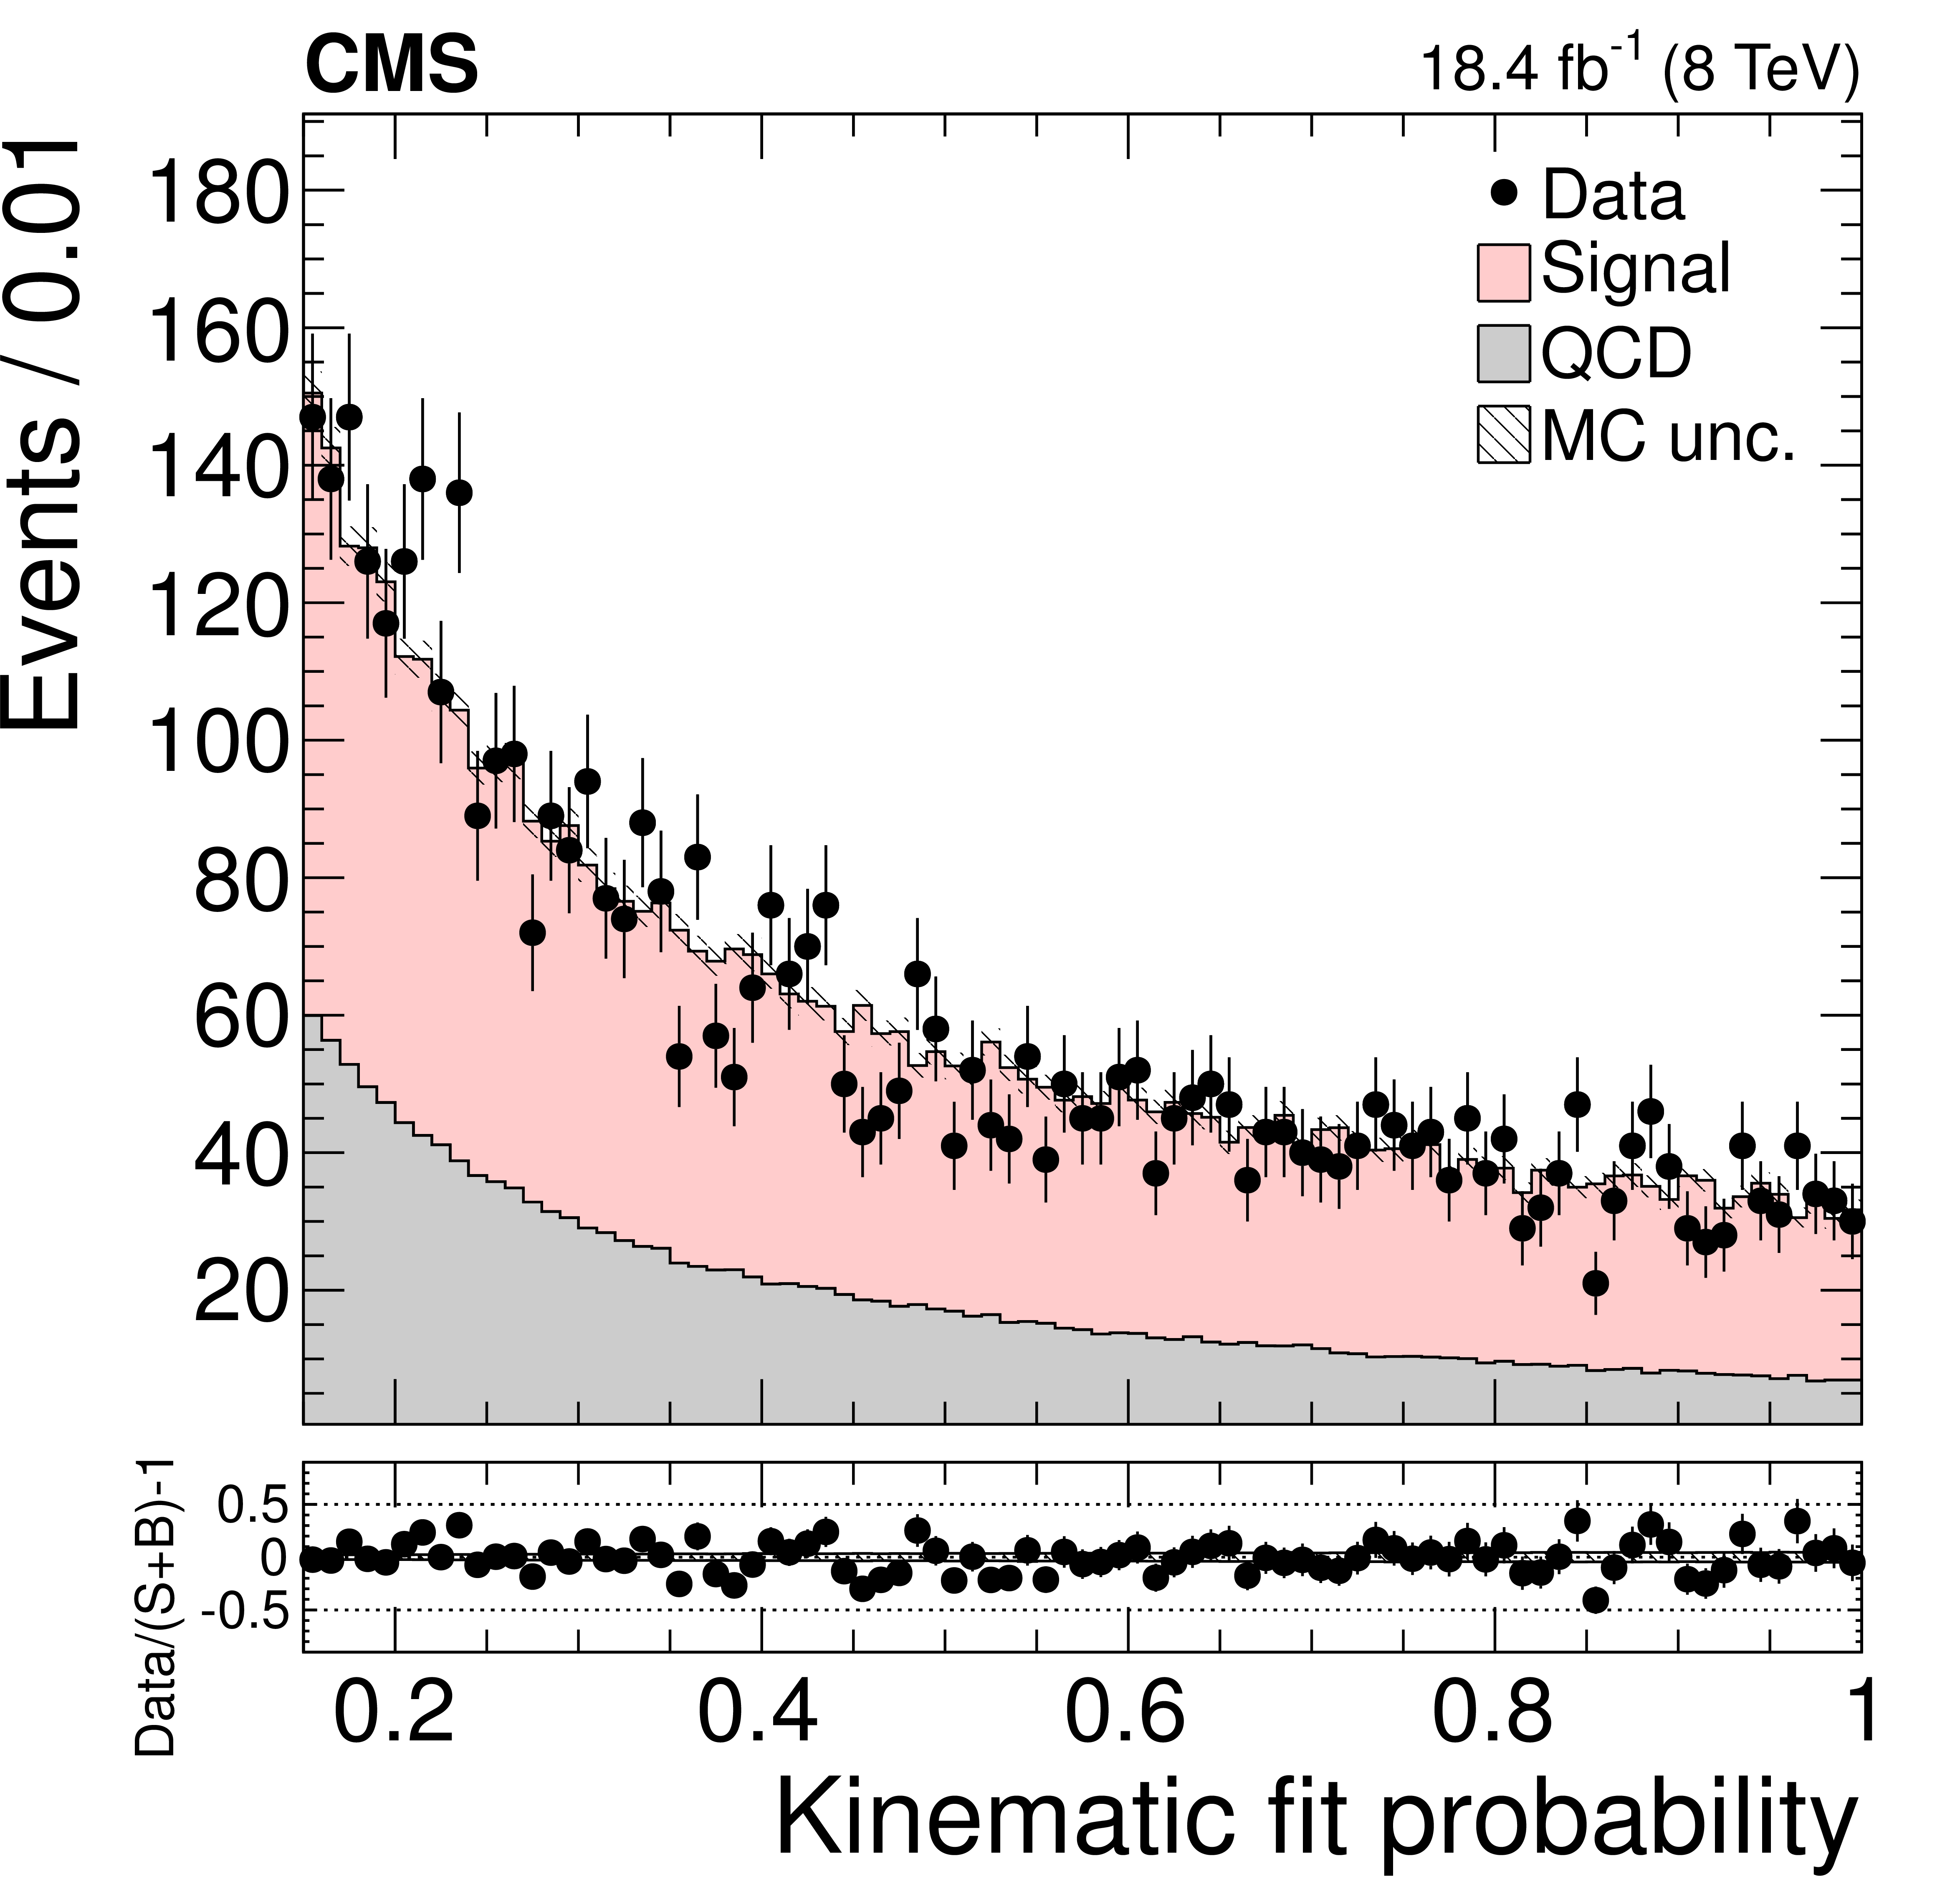
Figure 2-a:
Distribution of the kinematic fit probability (a). Distribution of the distance between the reconstructed b partons at the $\eta $--$\phi $ plane (b). The normalization of the $ {\mathrm {t}} {\overline {\mathrm {t}}}$ signal and the QCD multijet background are taken from the template fit to the data. The bottom panels show the fractional difference between the data and the sum of signal and background predictions, with the shaded band representing the MC statistical uncertainty. |
png pdf |
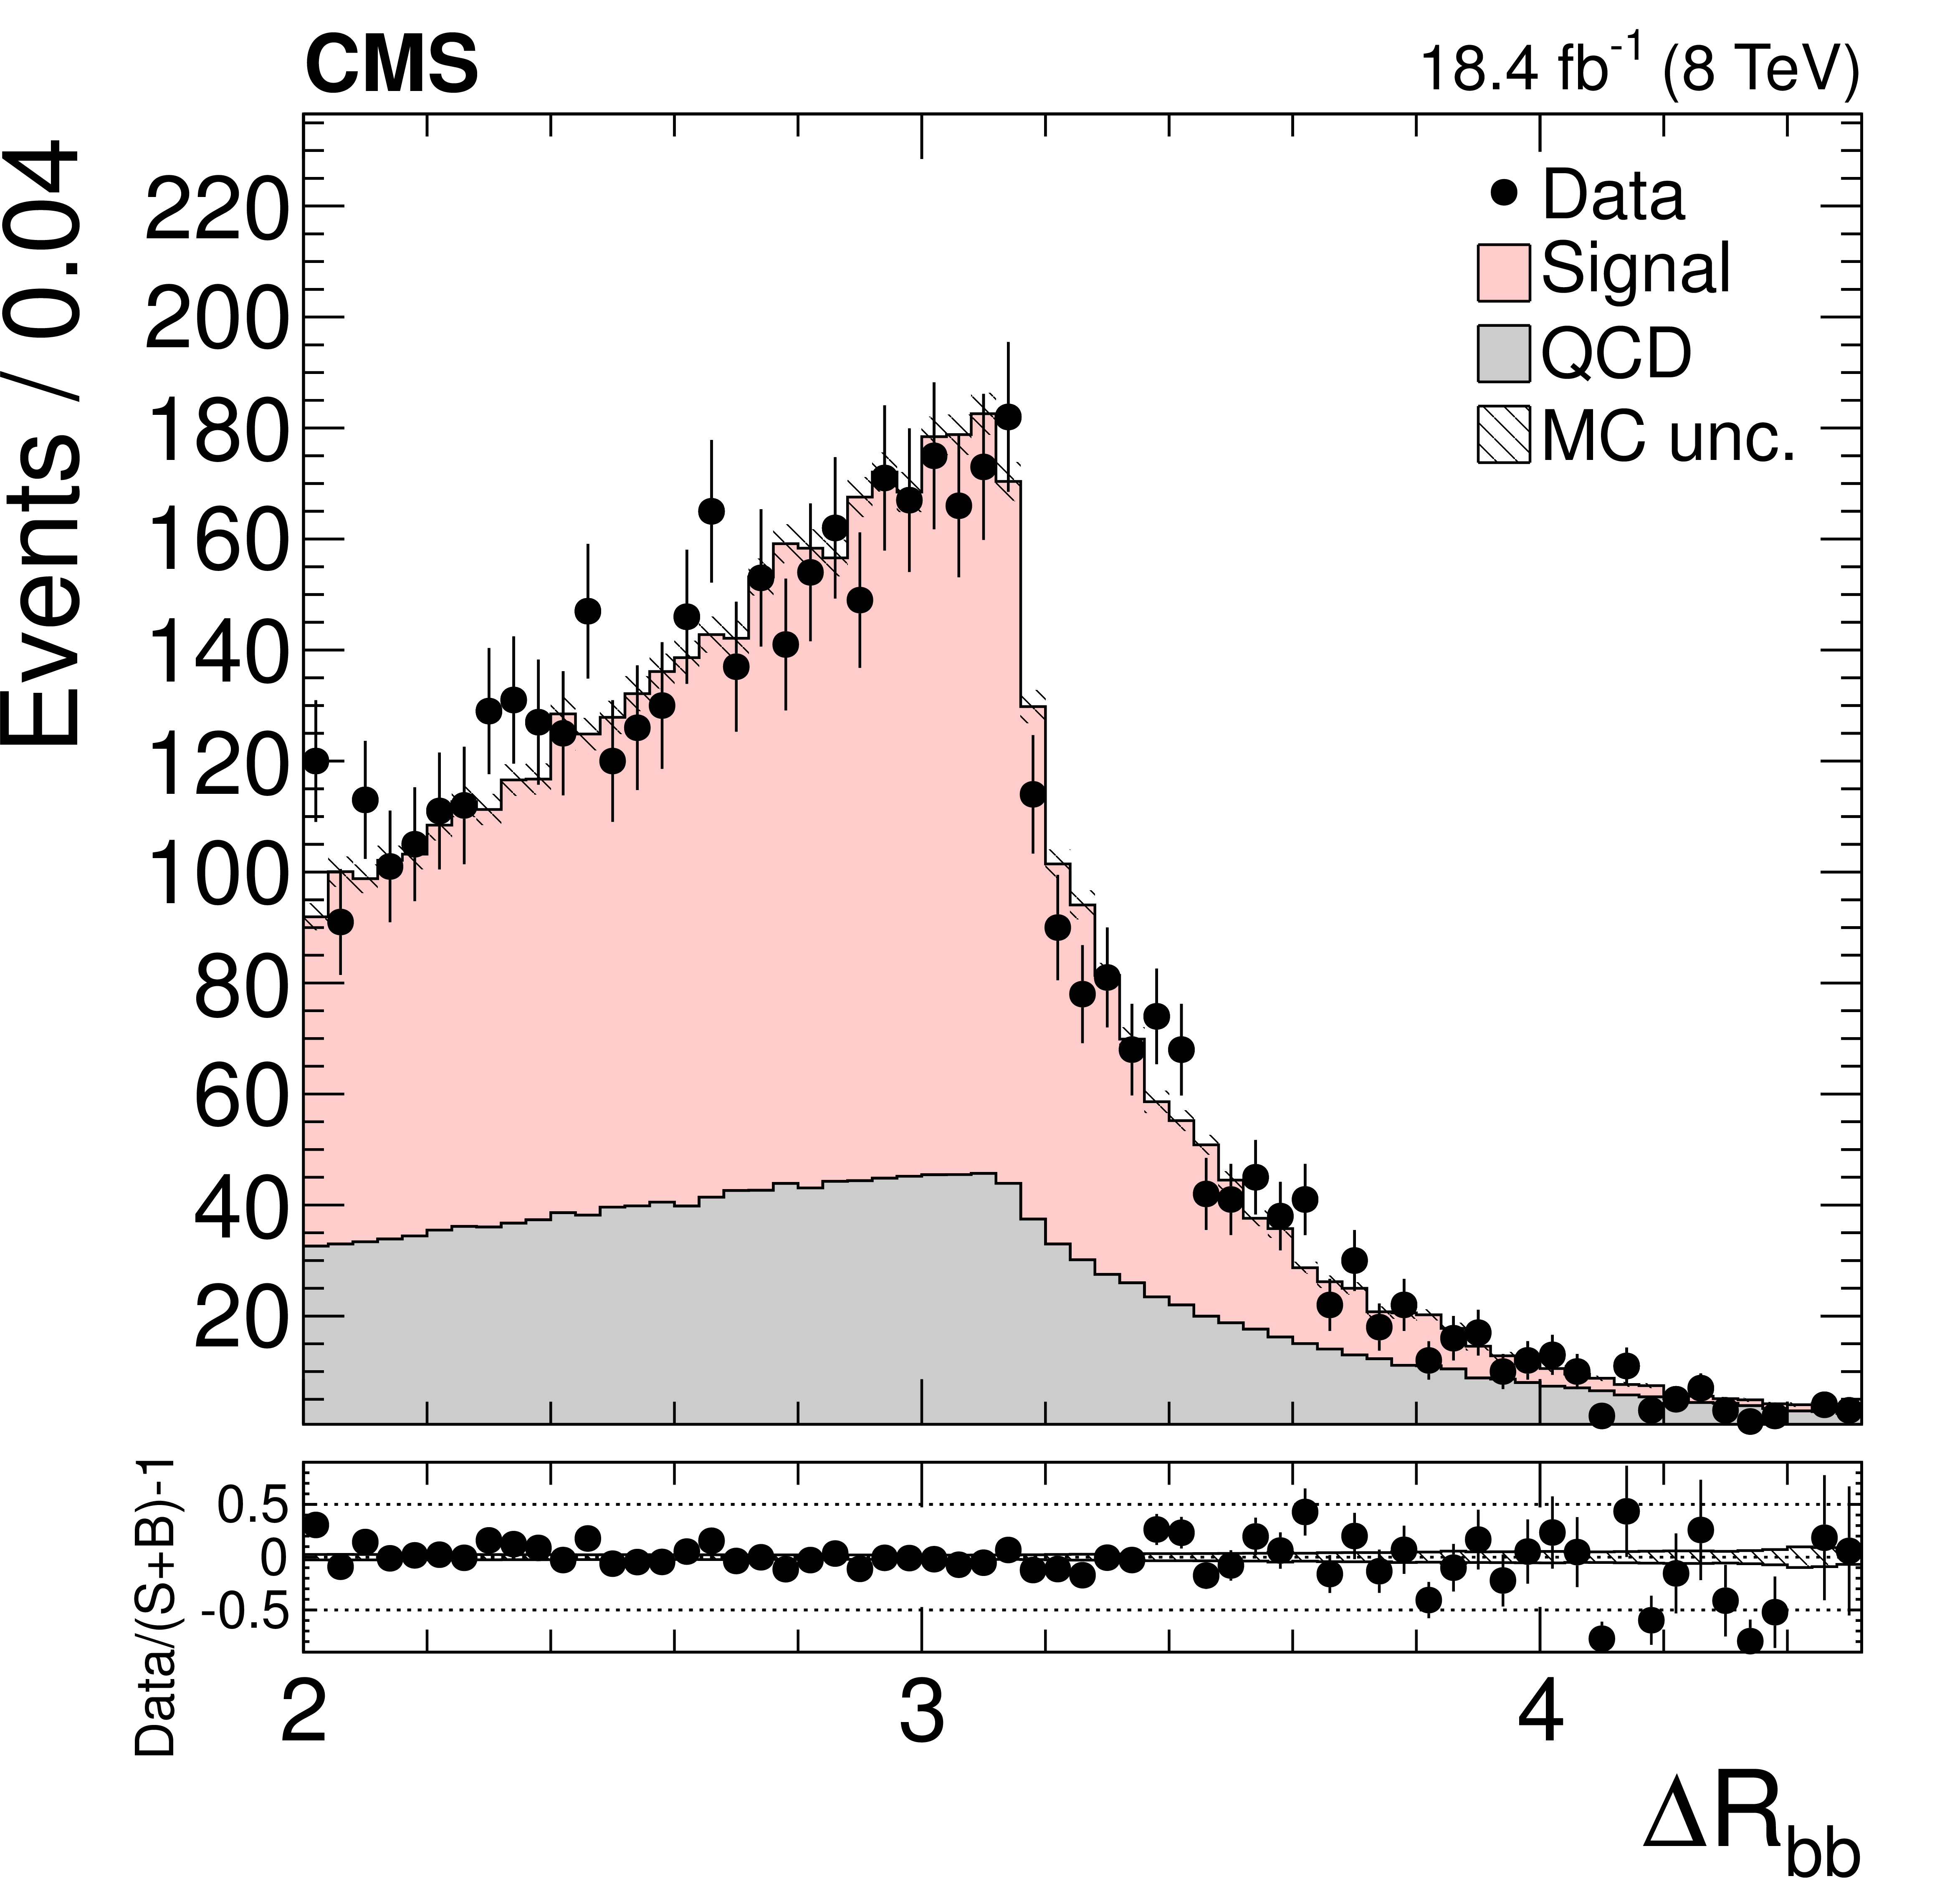
Figure 2-b:
Distribution of the kinematic fit probability (a). Distribution of the distance between the reconstructed b partons at the $\eta $--$\phi $ plane (b). The normalization of the $ {\mathrm {t}} {\overline {\mathrm {t}}}$ signal and the QCD multijet background are taken from the template fit to the data. The bottom panels show the fractional difference between the data and the sum of signal and background predictions, with the shaded band representing the MC statistical uncertainty. |
png pdf |
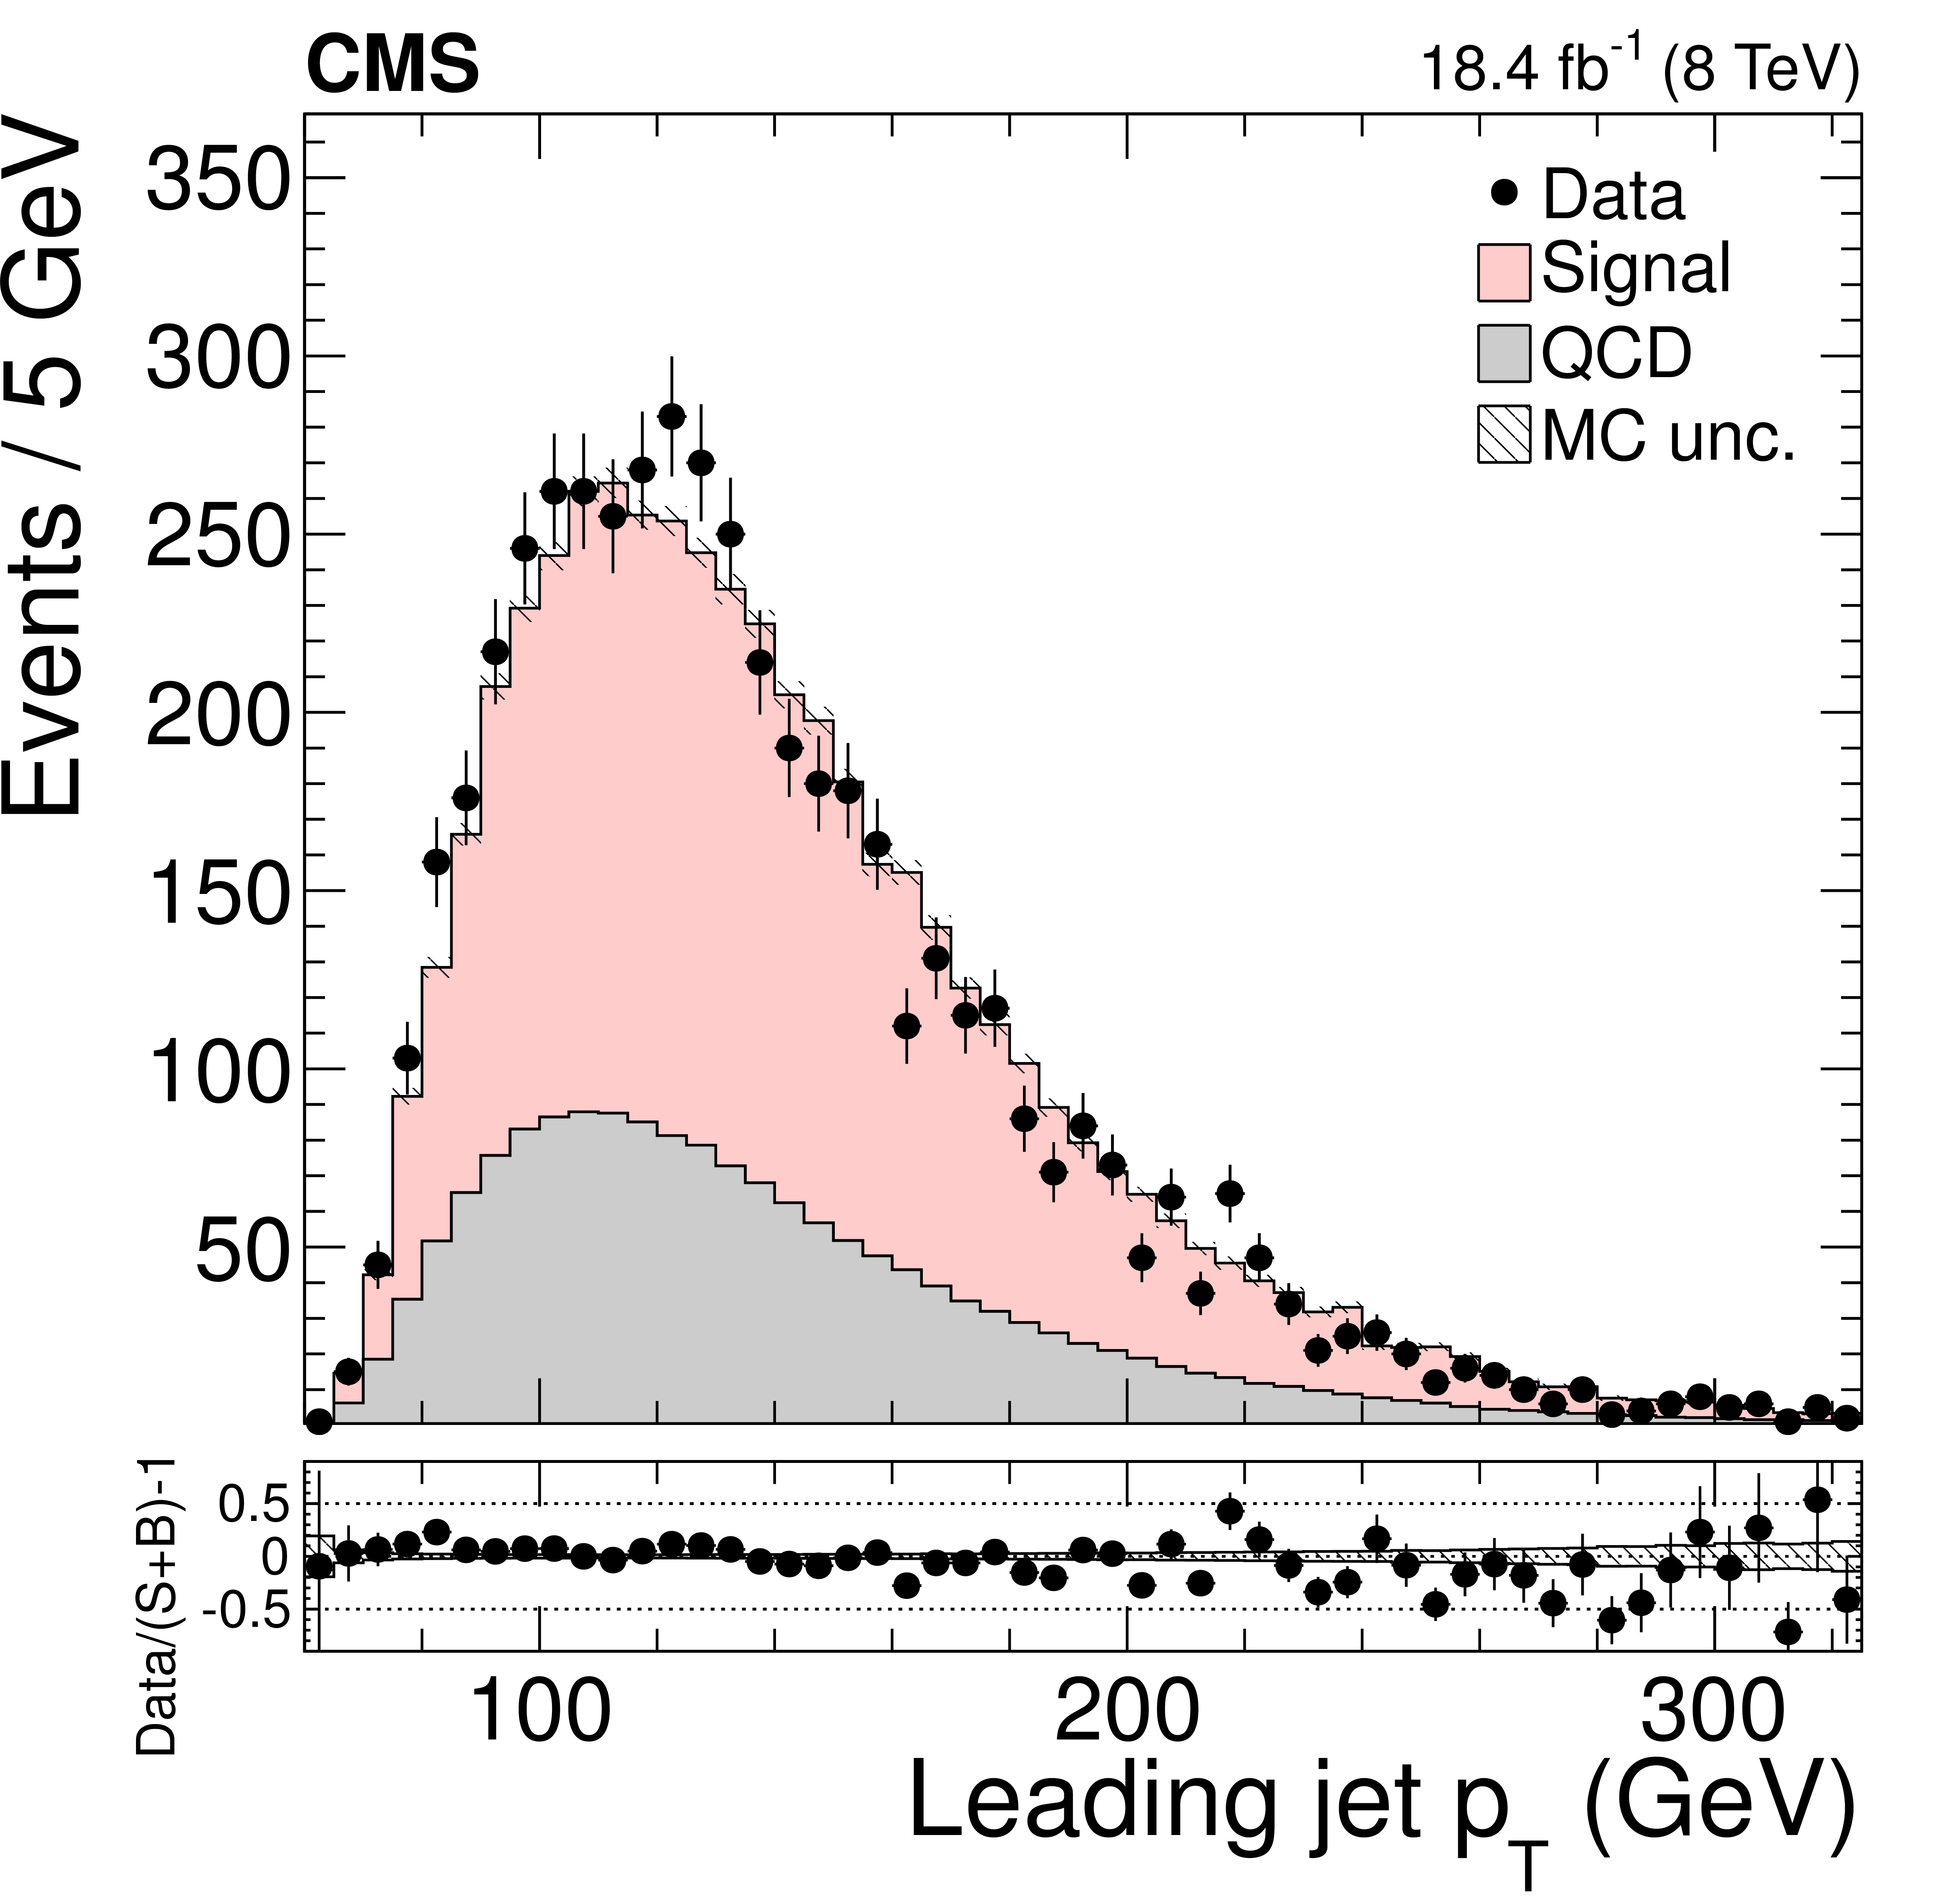
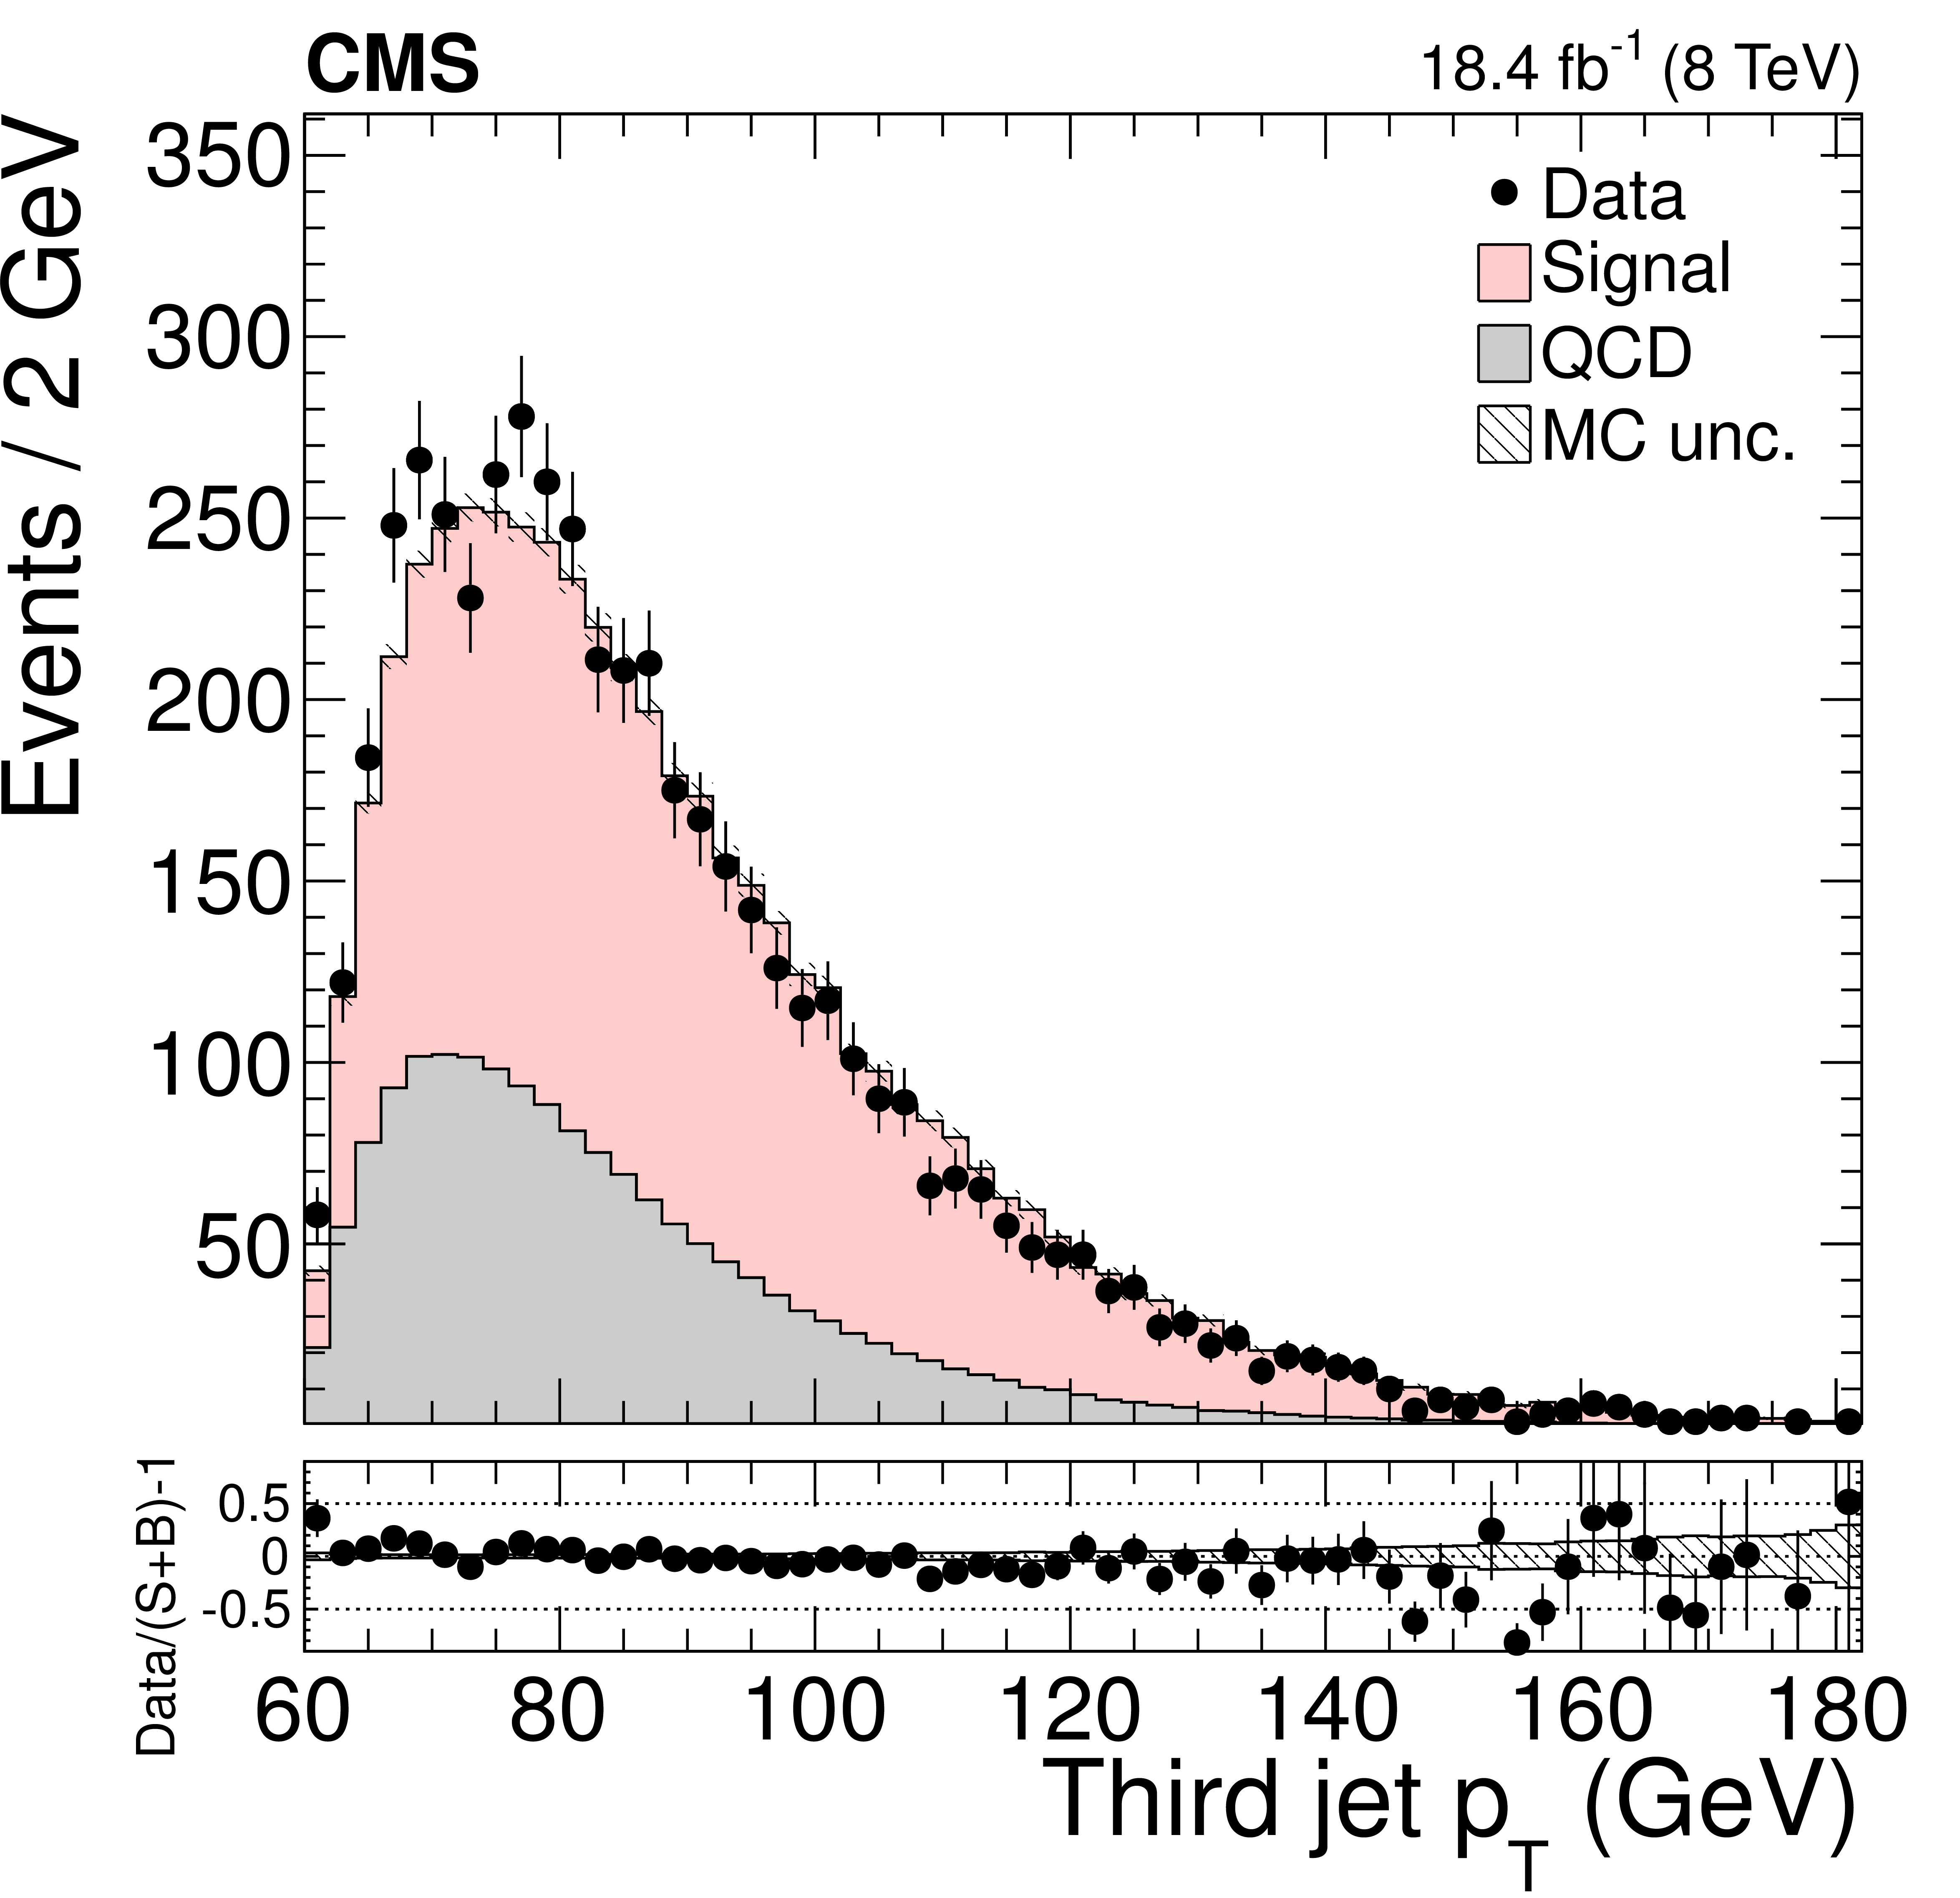
Figure 3-a:
Distribution of the $ {p_{\mathrm {T}}} $ of the six leading jets. The normalization of the $ {\mathrm {t}} {\overline {\mathrm {t}}}$ signal and the QCD multijet background are taken from the template fit to the data. The bottom panels show the fractional difference between the data and the sum of signal and background predictions, with the shaded band representing the MC statistical uncertainty. |

png pdf |
Figure 3-b:
Distribution of the $ {p_{\mathrm {T}}} $ of the six leading jets. The normalization of the $ {\mathrm {t}} {\overline {\mathrm {t}}}$ signal and the QCD multijet background are taken from the template fit to the data. The bottom panels show the fractional difference between the data and the sum of signal and background predictions, with the shaded band representing the MC statistical uncertainty. |
png pdf |
Figure 3-c:
Distribution of the $ {p_{\mathrm {T}}} $ of the six leading jets. The normalization of the $ {\mathrm {t}} {\overline {\mathrm {t}}}$ signal and the QCD multijet background are taken from the template fit to the data. The bottom panels show the fractional difference between the data and the sum of signal and background predictions, with the shaded band representing the MC statistical uncertainty. |
png pdf |
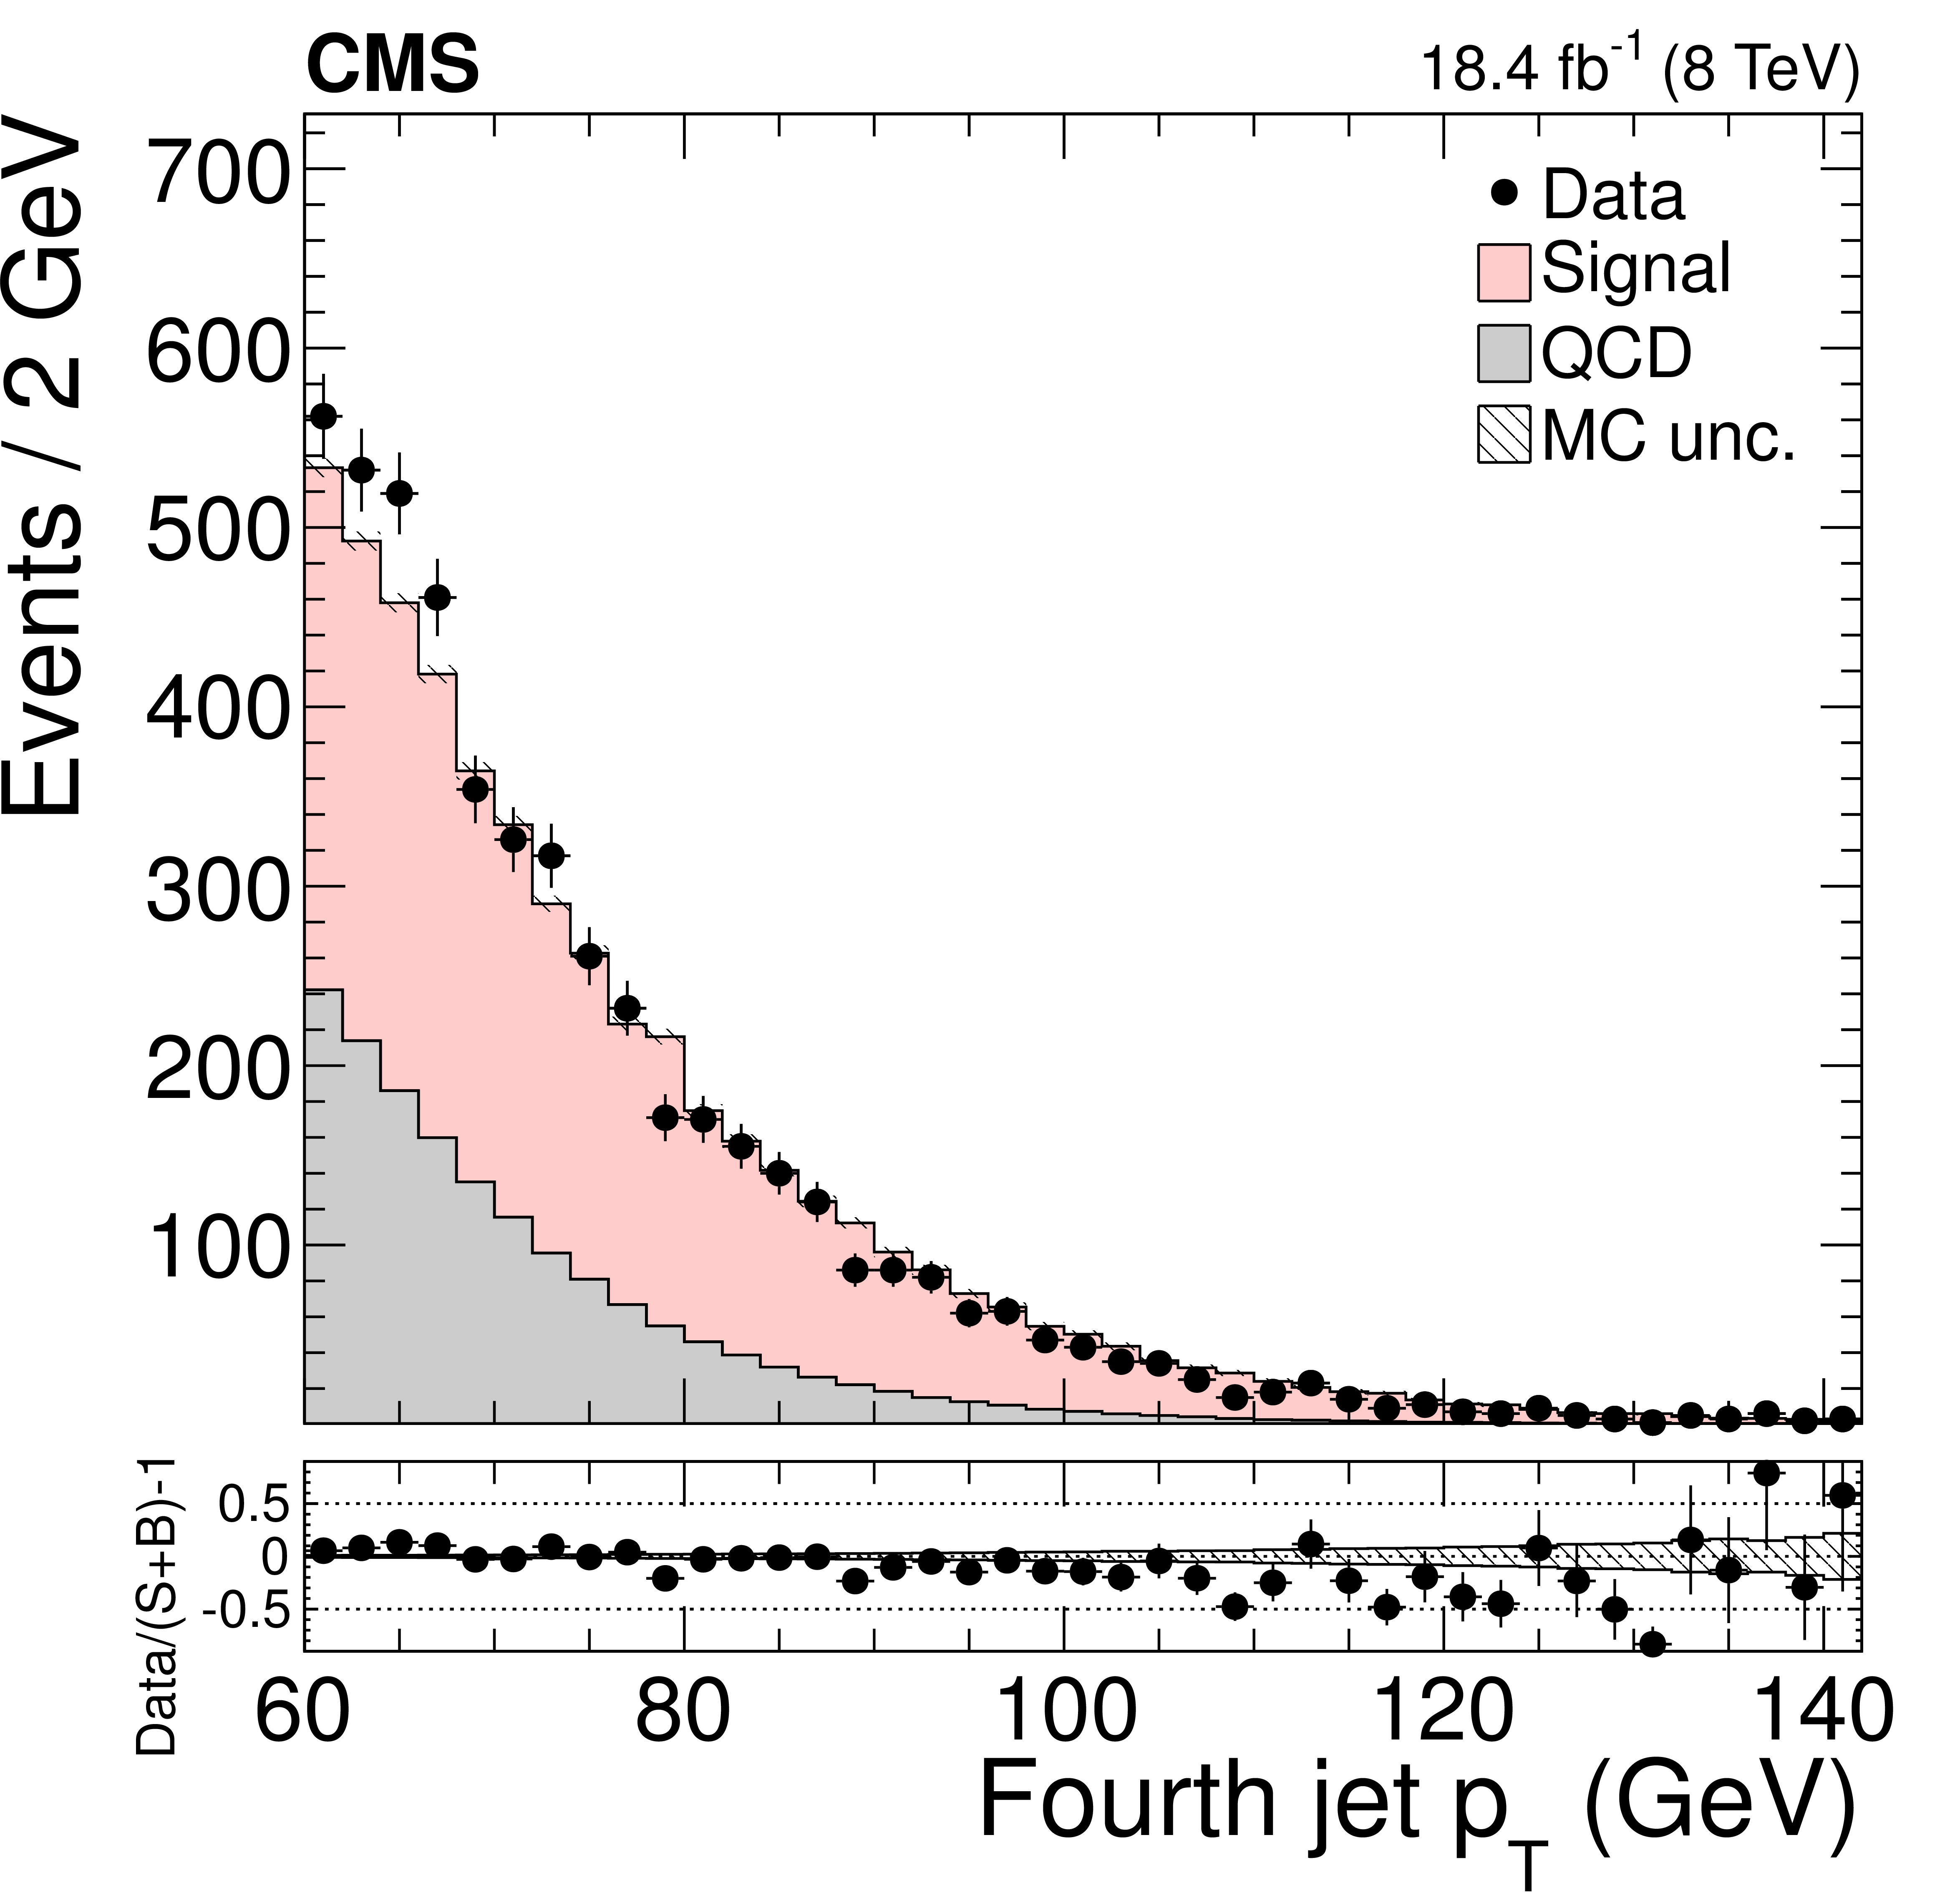
Figure 3-d:
Distribution of the $ {p_{\mathrm {T}}} $ of the six leading jets. The normalization of the $ {\mathrm {t}} {\overline {\mathrm {t}}}$ signal and the QCD multijet background are taken from the template fit to the data. The bottom panels show the fractional difference between the data and the sum of signal and background predictions, with the shaded band representing the MC statistical uncertainty. |
png pdf |
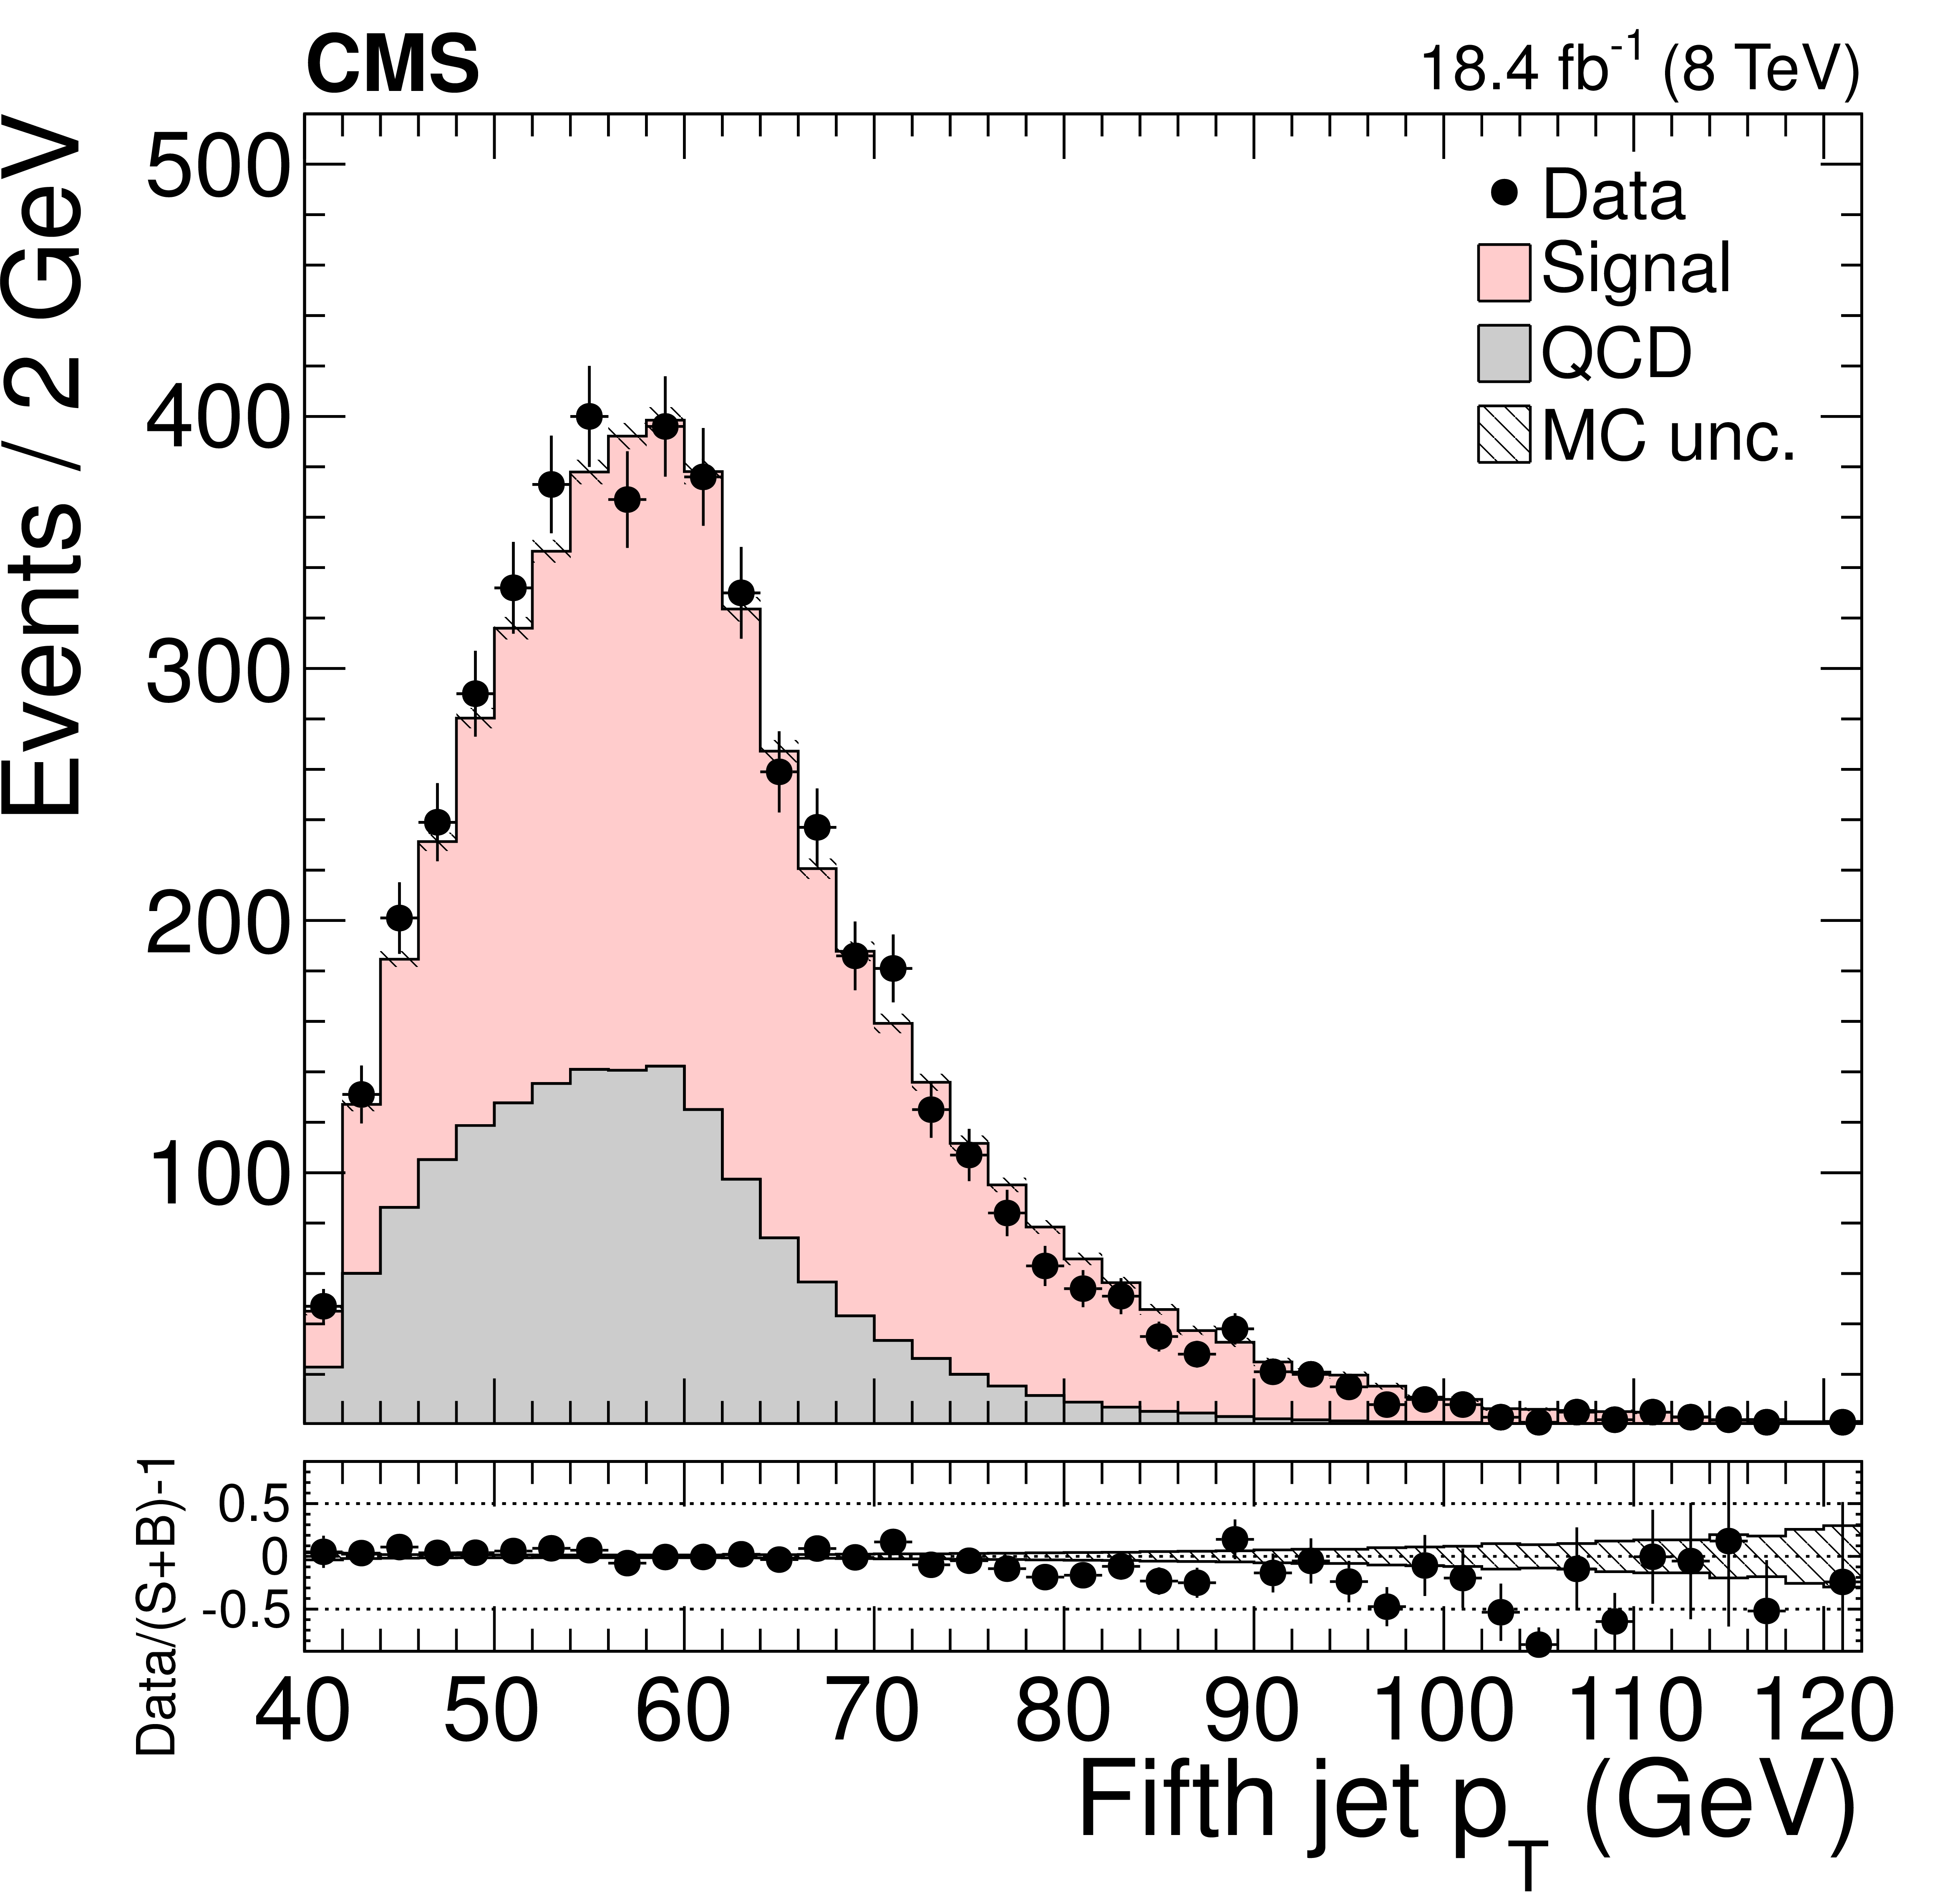
Figure 3-e:
Distribution of the $ {p_{\mathrm {T}}} $ of the six leading jets. The normalization of the $ {\mathrm {t}} {\overline {\mathrm {t}}}$ signal and the QCD multijet background are taken from the template fit to the data. The bottom panels show the fractional difference between the data and the sum of signal and background predictions, with the shaded band representing the MC statistical uncertainty. |

png pdf |
Figure 3-f:
Distribution of the $ {p_{\mathrm {T}}} $ of the six leading jets. The normalization of the $ {\mathrm {t}} {\overline {\mathrm {t}}}$ signal and the QCD multijet background are taken from the template fit to the data. The bottom panels show the fractional difference between the data and the sum of signal and background predictions, with the shaded band representing the MC statistical uncertainty. |

png pdf |
Figure 4-a:
Distribution of the leading (a) and subleading (b) reconstructed top quark $ {p_{\mathrm {T}}} $. The normalizations of the $ {\mathrm {t}} {\overline {\mathrm {t}}}$ signal and the QCD multijet background are taken from the template fit to the data. The bottom panels show the fractional difference between the data and the sum of signal and background predictions, with the shaded band representing the MC statistical uncertainty. |
png pdf |
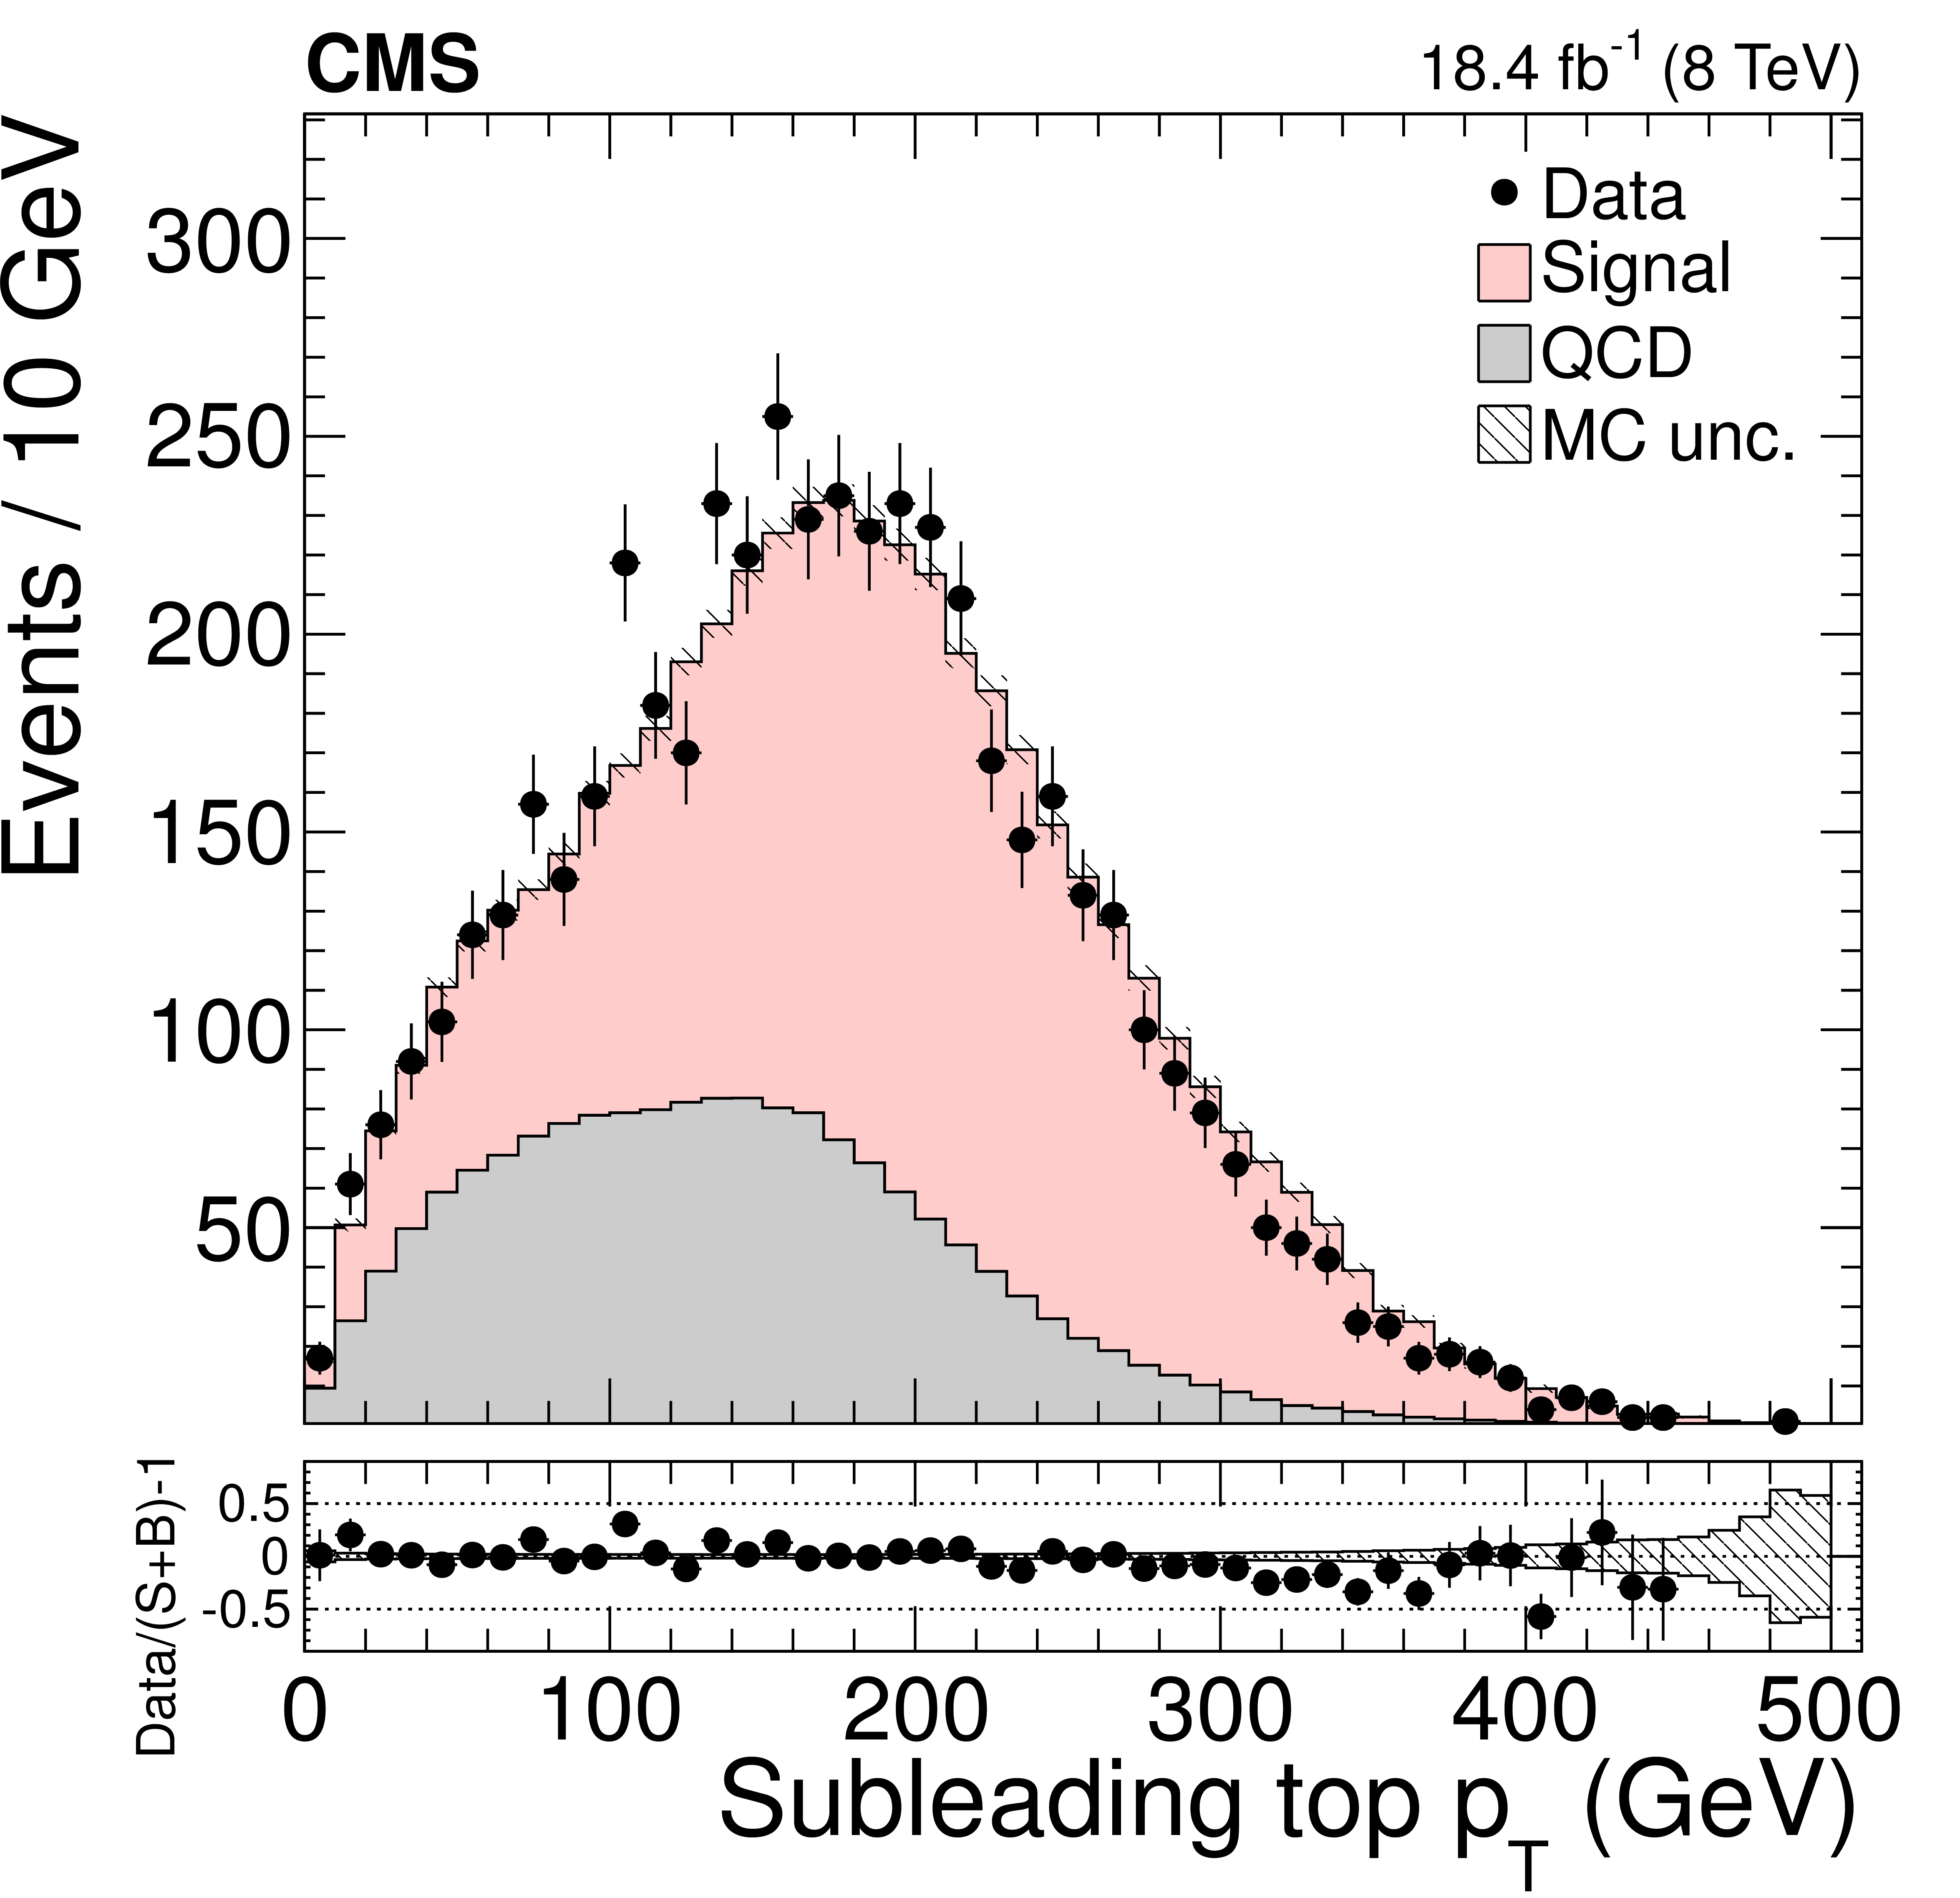
Figure 4-b:
Distribution of the leading (a) and subleading (b) reconstructed top quark $ {p_{\mathrm {T}}} $. The normalizations of the $ {\mathrm {t}} {\overline {\mathrm {t}}}$ signal and the QCD multijet background are taken from the template fit to the data. The bottom panels show the fractional difference between the data and the sum of signal and background predictions, with the shaded band representing the MC statistical uncertainty. |
png pdf |
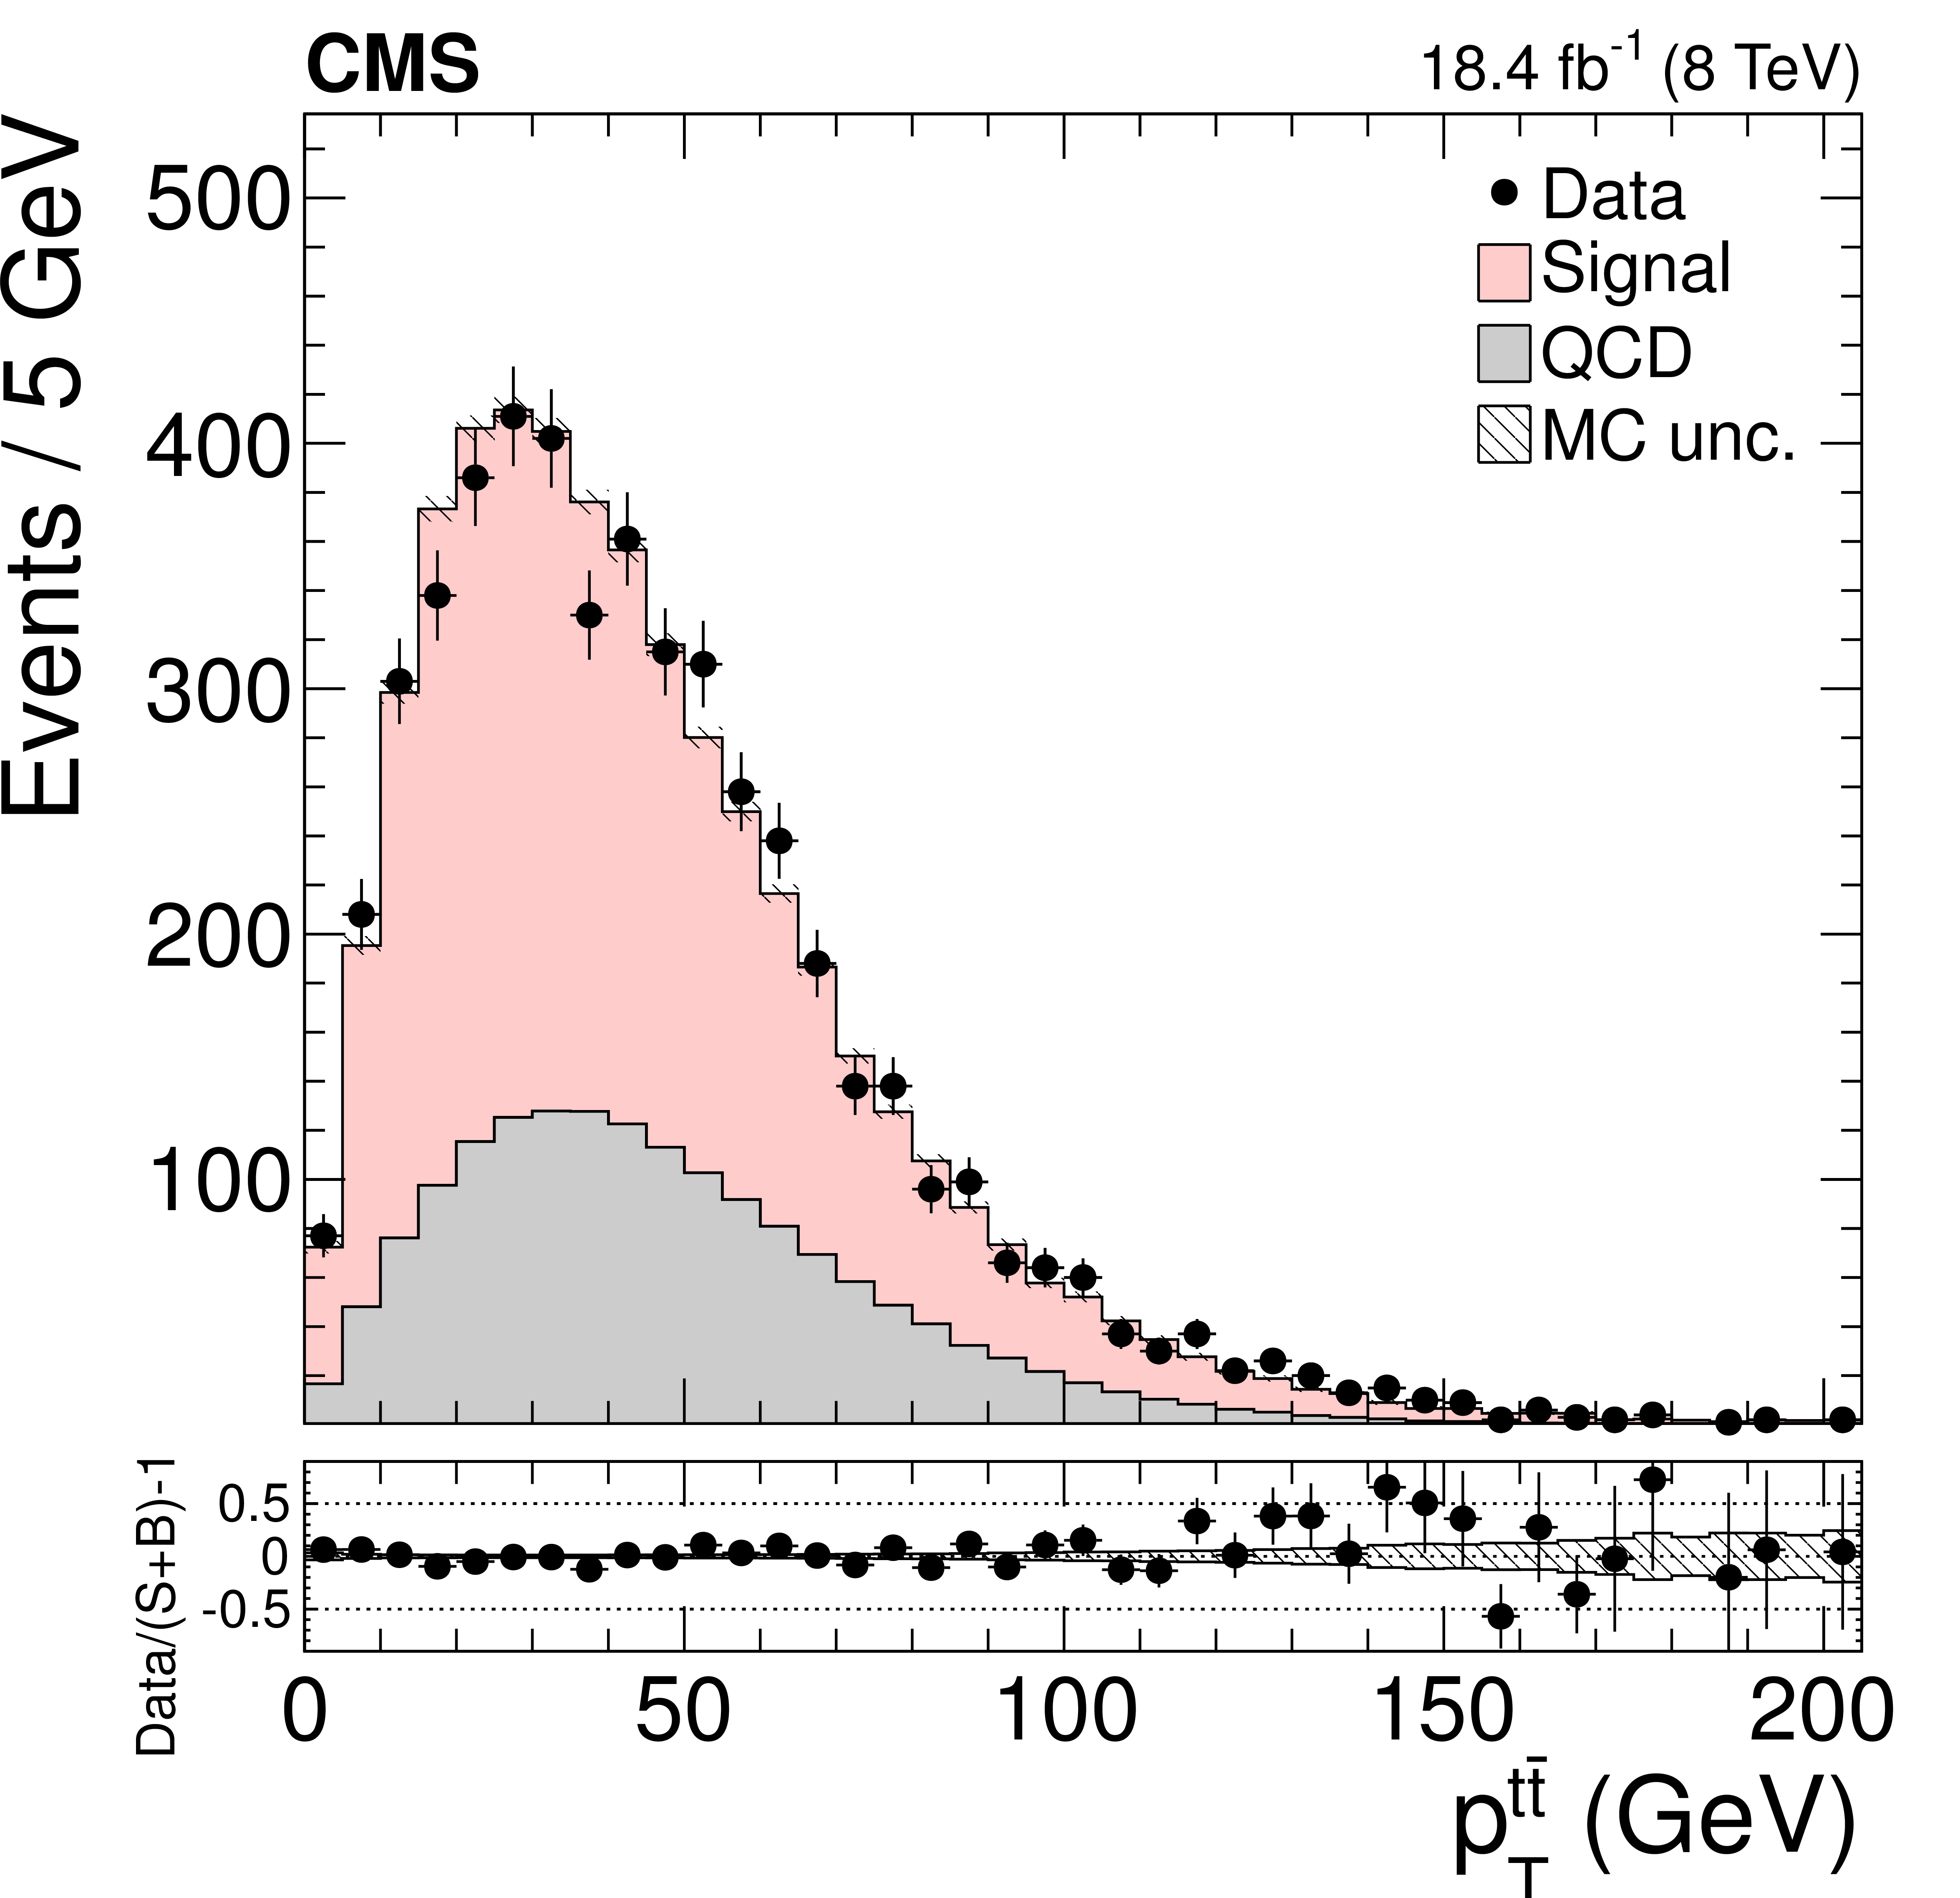
Figure 5-a:
Distribution of the $ {p_{\mathrm {T}}} $ (a) and the rapidity (b) of the reconstructed top quark pair. The normalizations of the $ {\mathrm {t}} {\overline {\mathrm {t}}}$ signal and the QCD multijet background are taken from the template fit to the data. The bottom panels show the fractional difference between the data and the sum of signal and background predictions, with the shaded band representing the MC statistical uncertainty. |
png pdf |
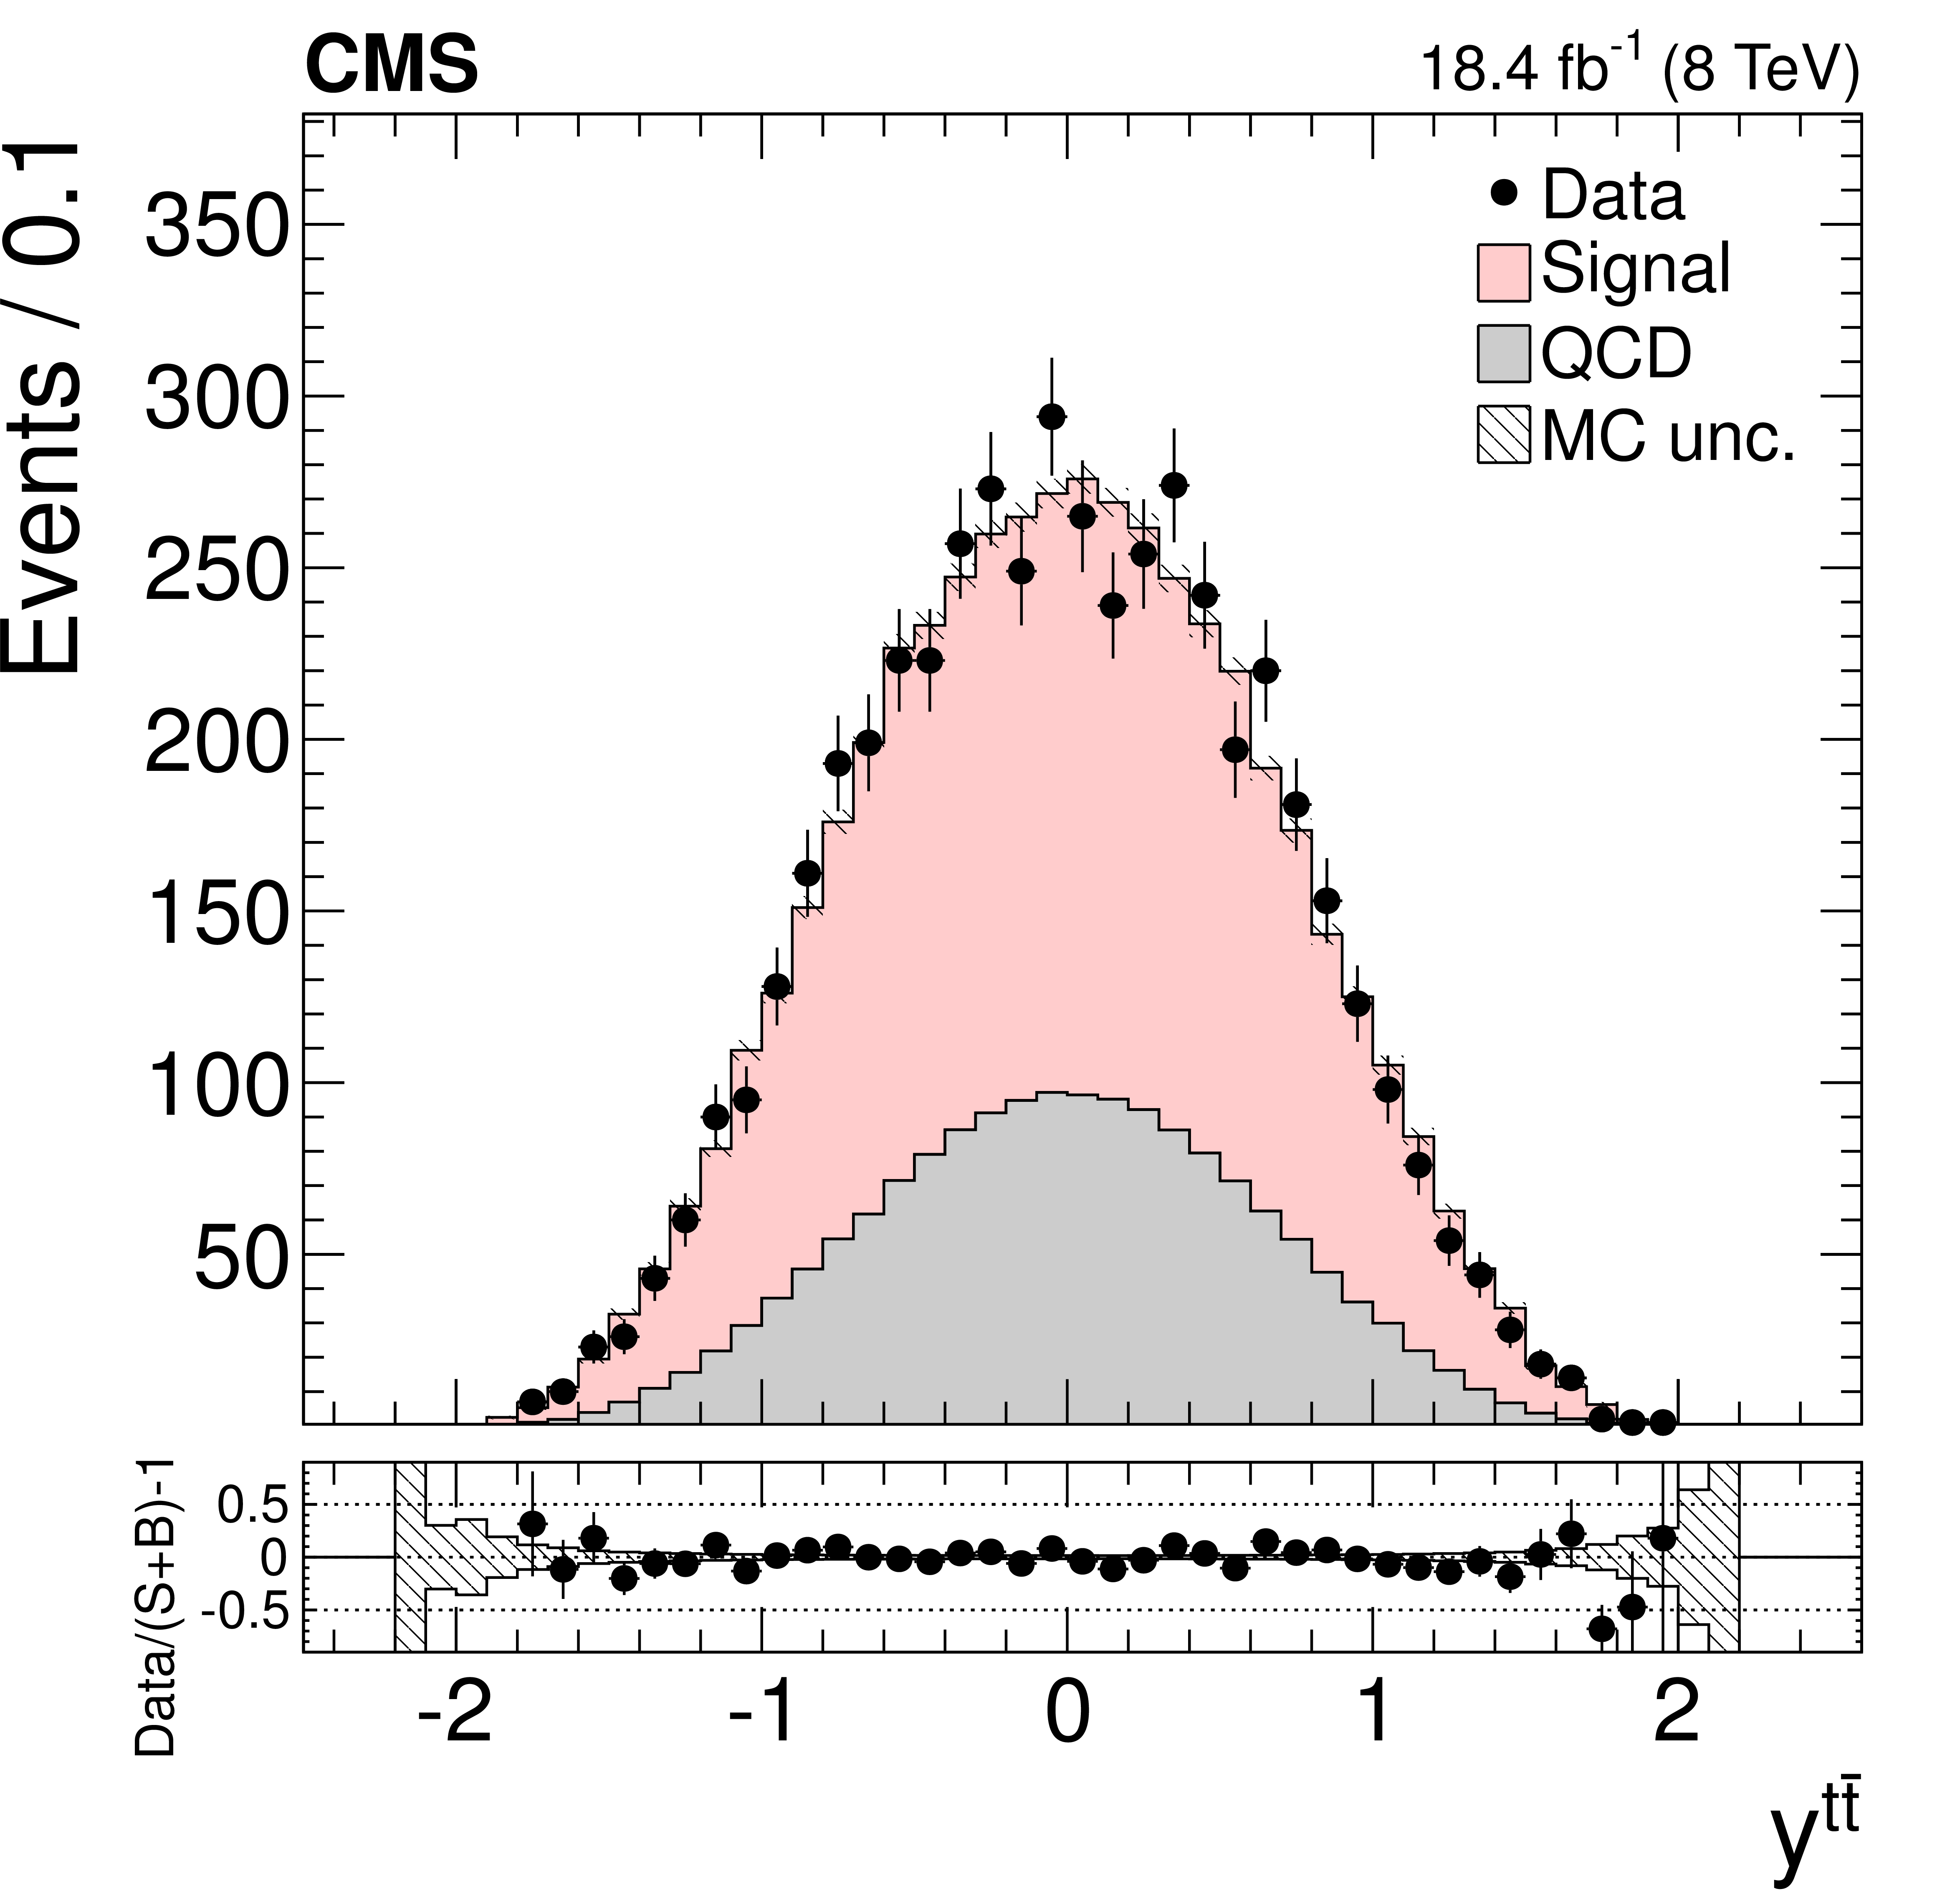
Figure 5-b:
Distribution of the $ {p_{\mathrm {T}}} $ (a) and the rapidity (b) of the reconstructed top quark pair. The normalizations of the $ {\mathrm {t}} {\overline {\mathrm {t}}}$ signal and the QCD multijet background are taken from the template fit to the data. The bottom panels show the fractional difference between the data and the sum of signal and background predictions, with the shaded band representing the MC statistical uncertainty. |
png pdf |
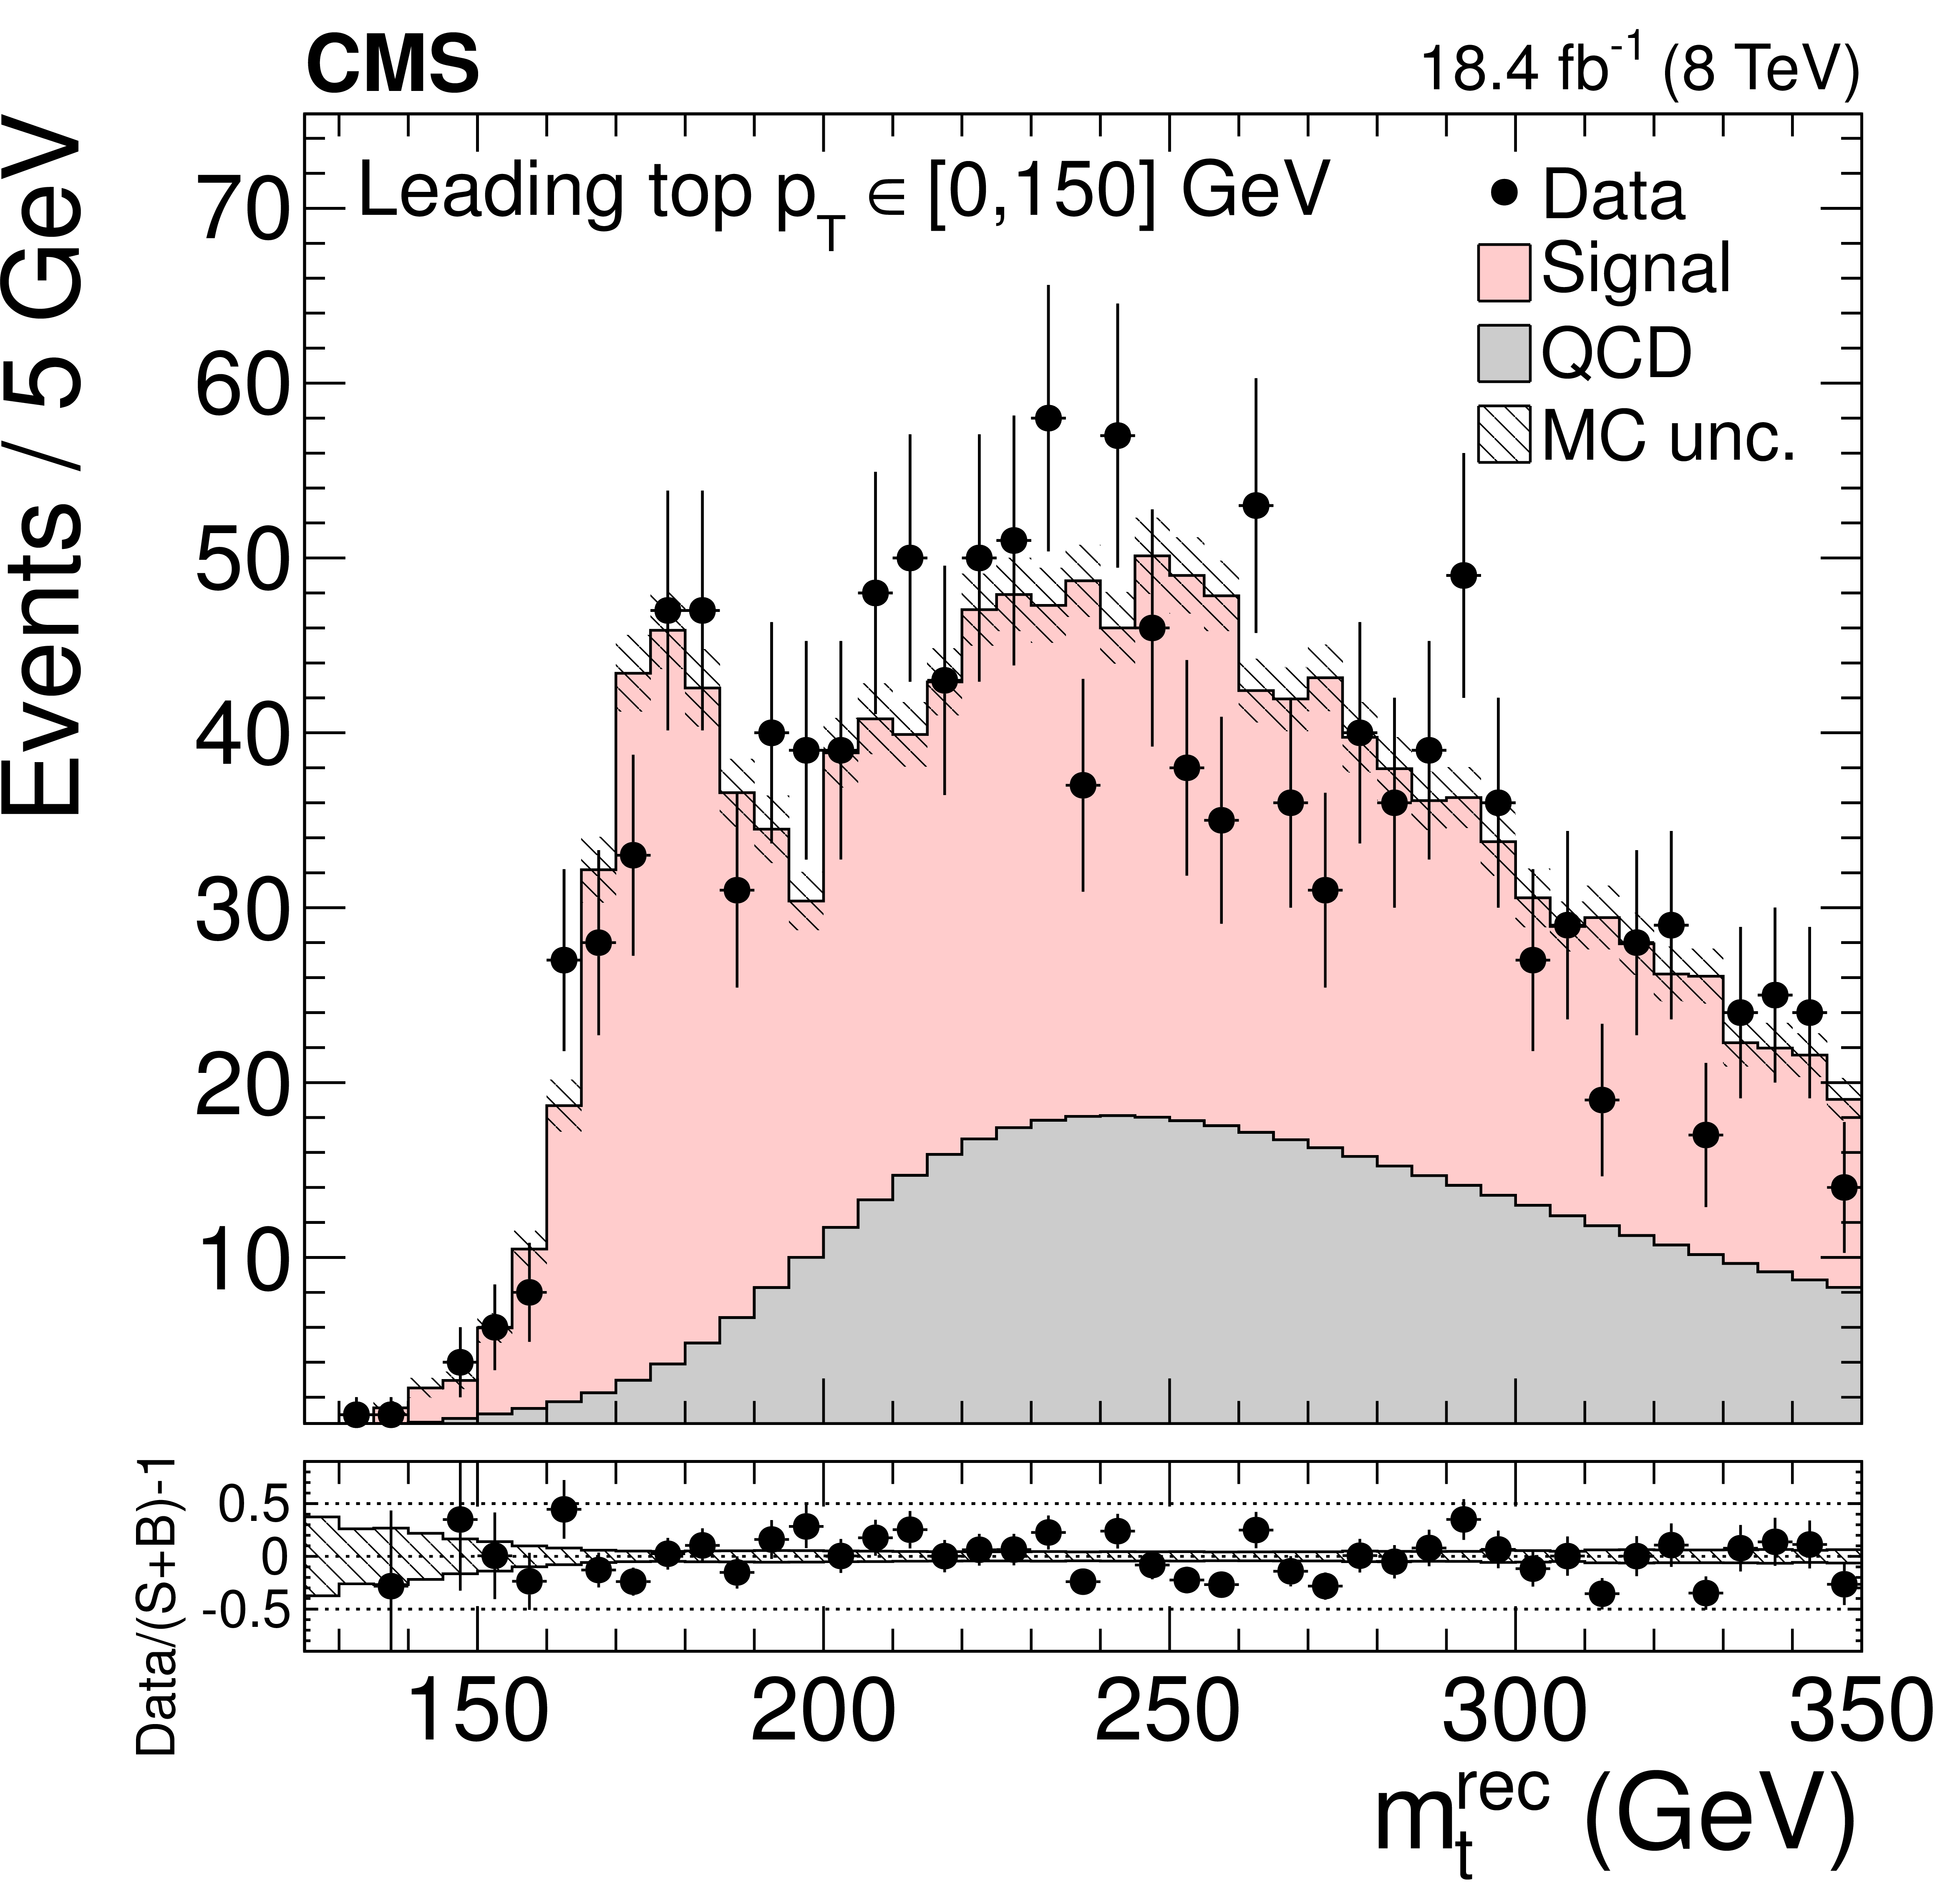
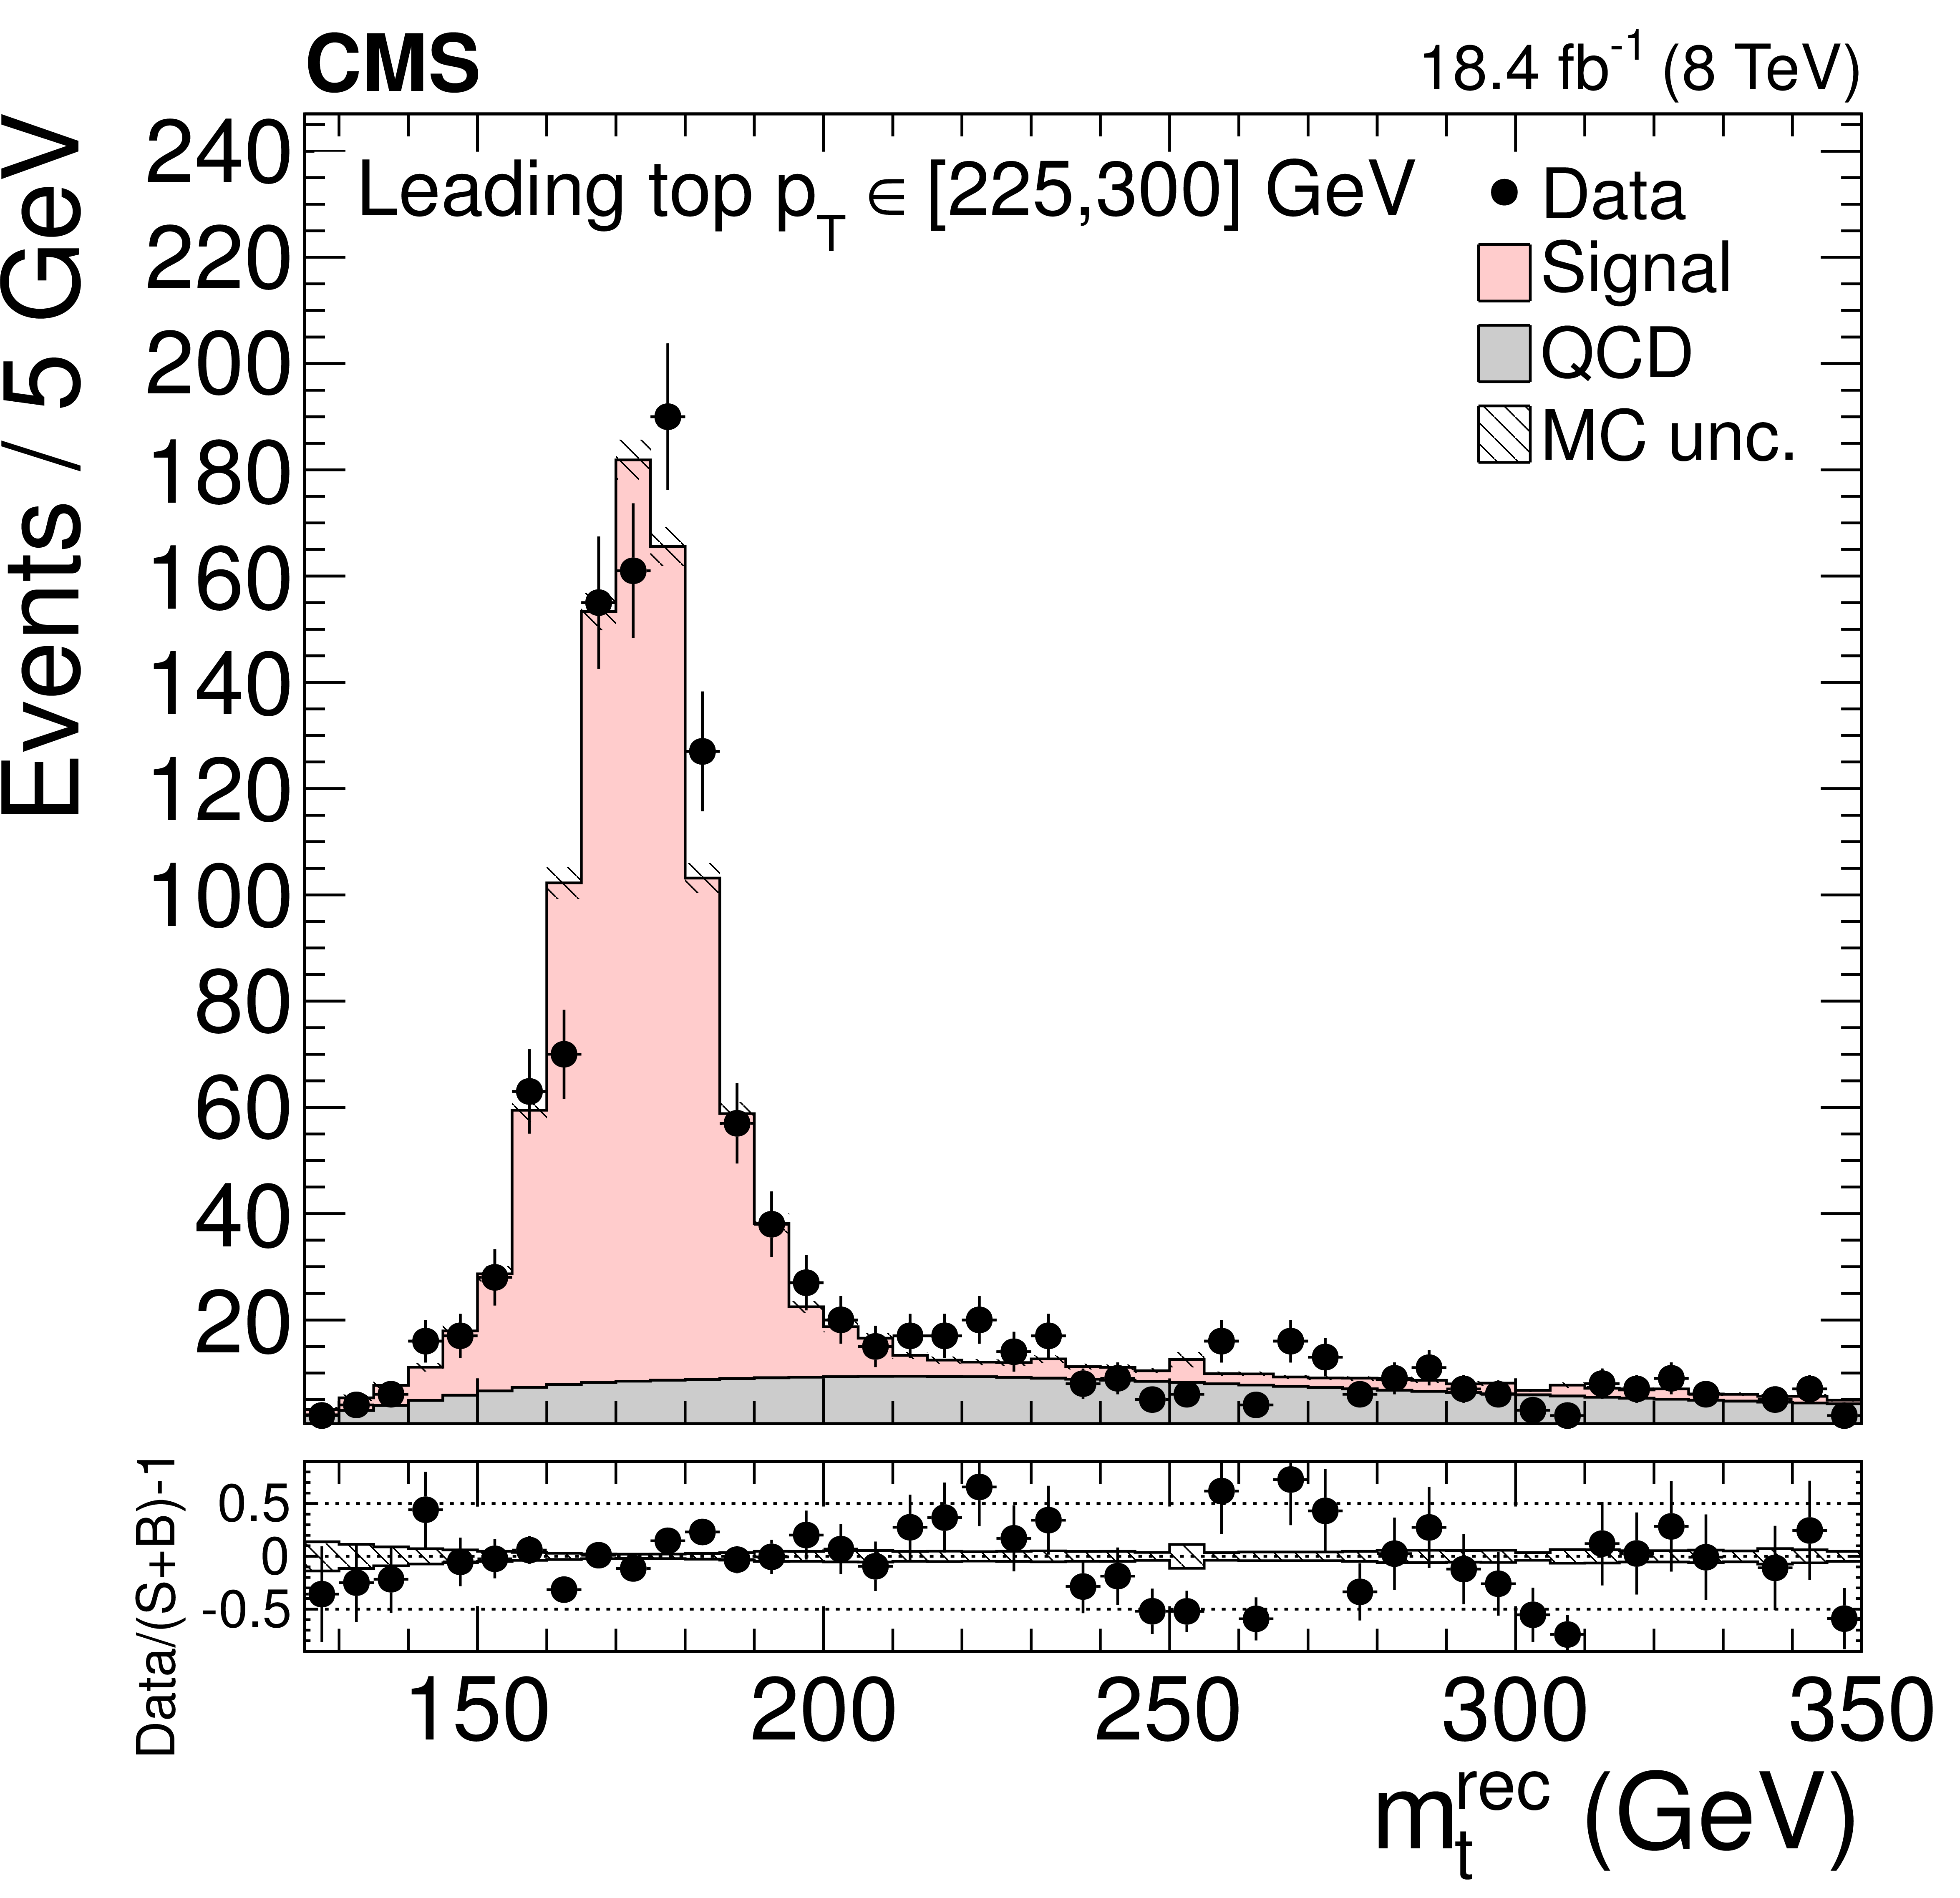
Figure 6-a:
Distribution of the reconstructed top quark mass after the kinematic fit in bins of the leading reconstructed top quark $ {p_{\mathrm {T}}} $. The normalizations of the $ {\mathrm {t}} {\overline {\mathrm {t}}}$ signal and the QCD multijet background are taken from the template fit to the data. The bottom panels show the fractional difference between the data and the sum of signal and background predictions, with the shaded band representing the MC statistical uncertainty. |
png pdf |
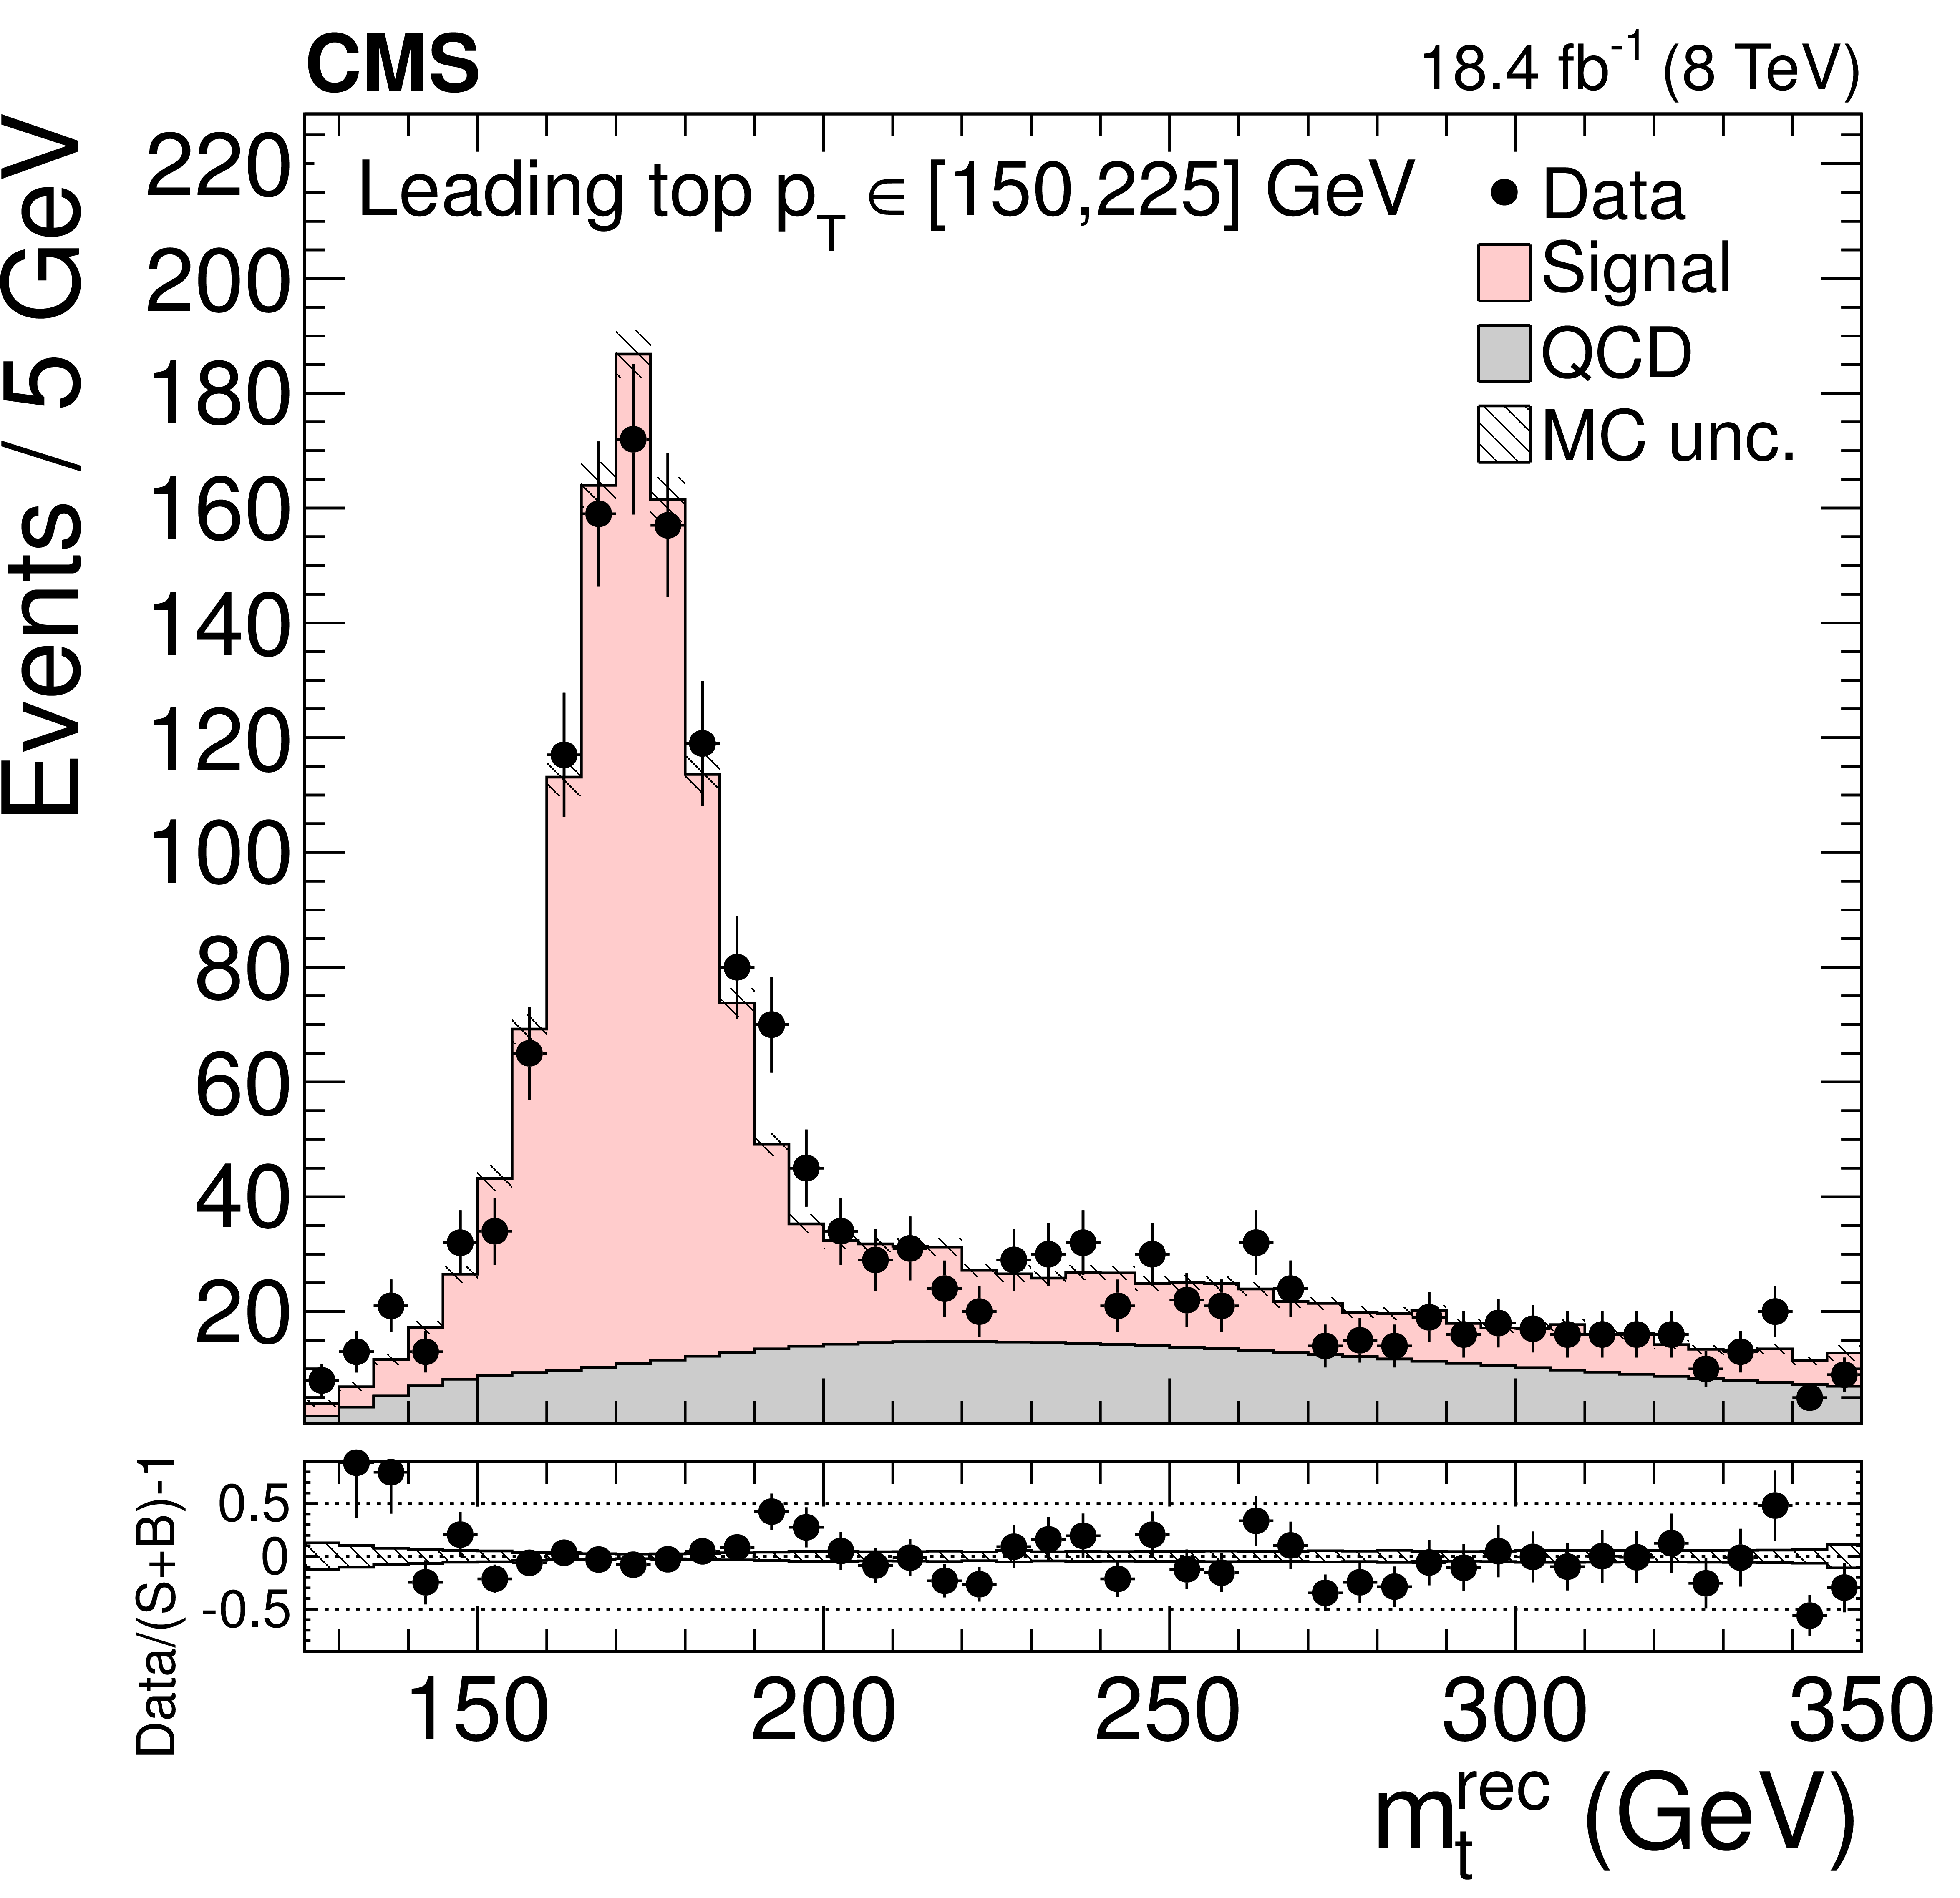
Figure 6-b:
Distribution of the reconstructed top quark mass after the kinematic fit in bins of the leading reconstructed top quark $ {p_{\mathrm {T}}} $. The normalizations of the $ {\mathrm {t}} {\overline {\mathrm {t}}}$ signal and the QCD multijet background are taken from the template fit to the data. The bottom panels show the fractional difference between the data and the sum of signal and background predictions, with the shaded band representing the MC statistical uncertainty. |
png pdf |
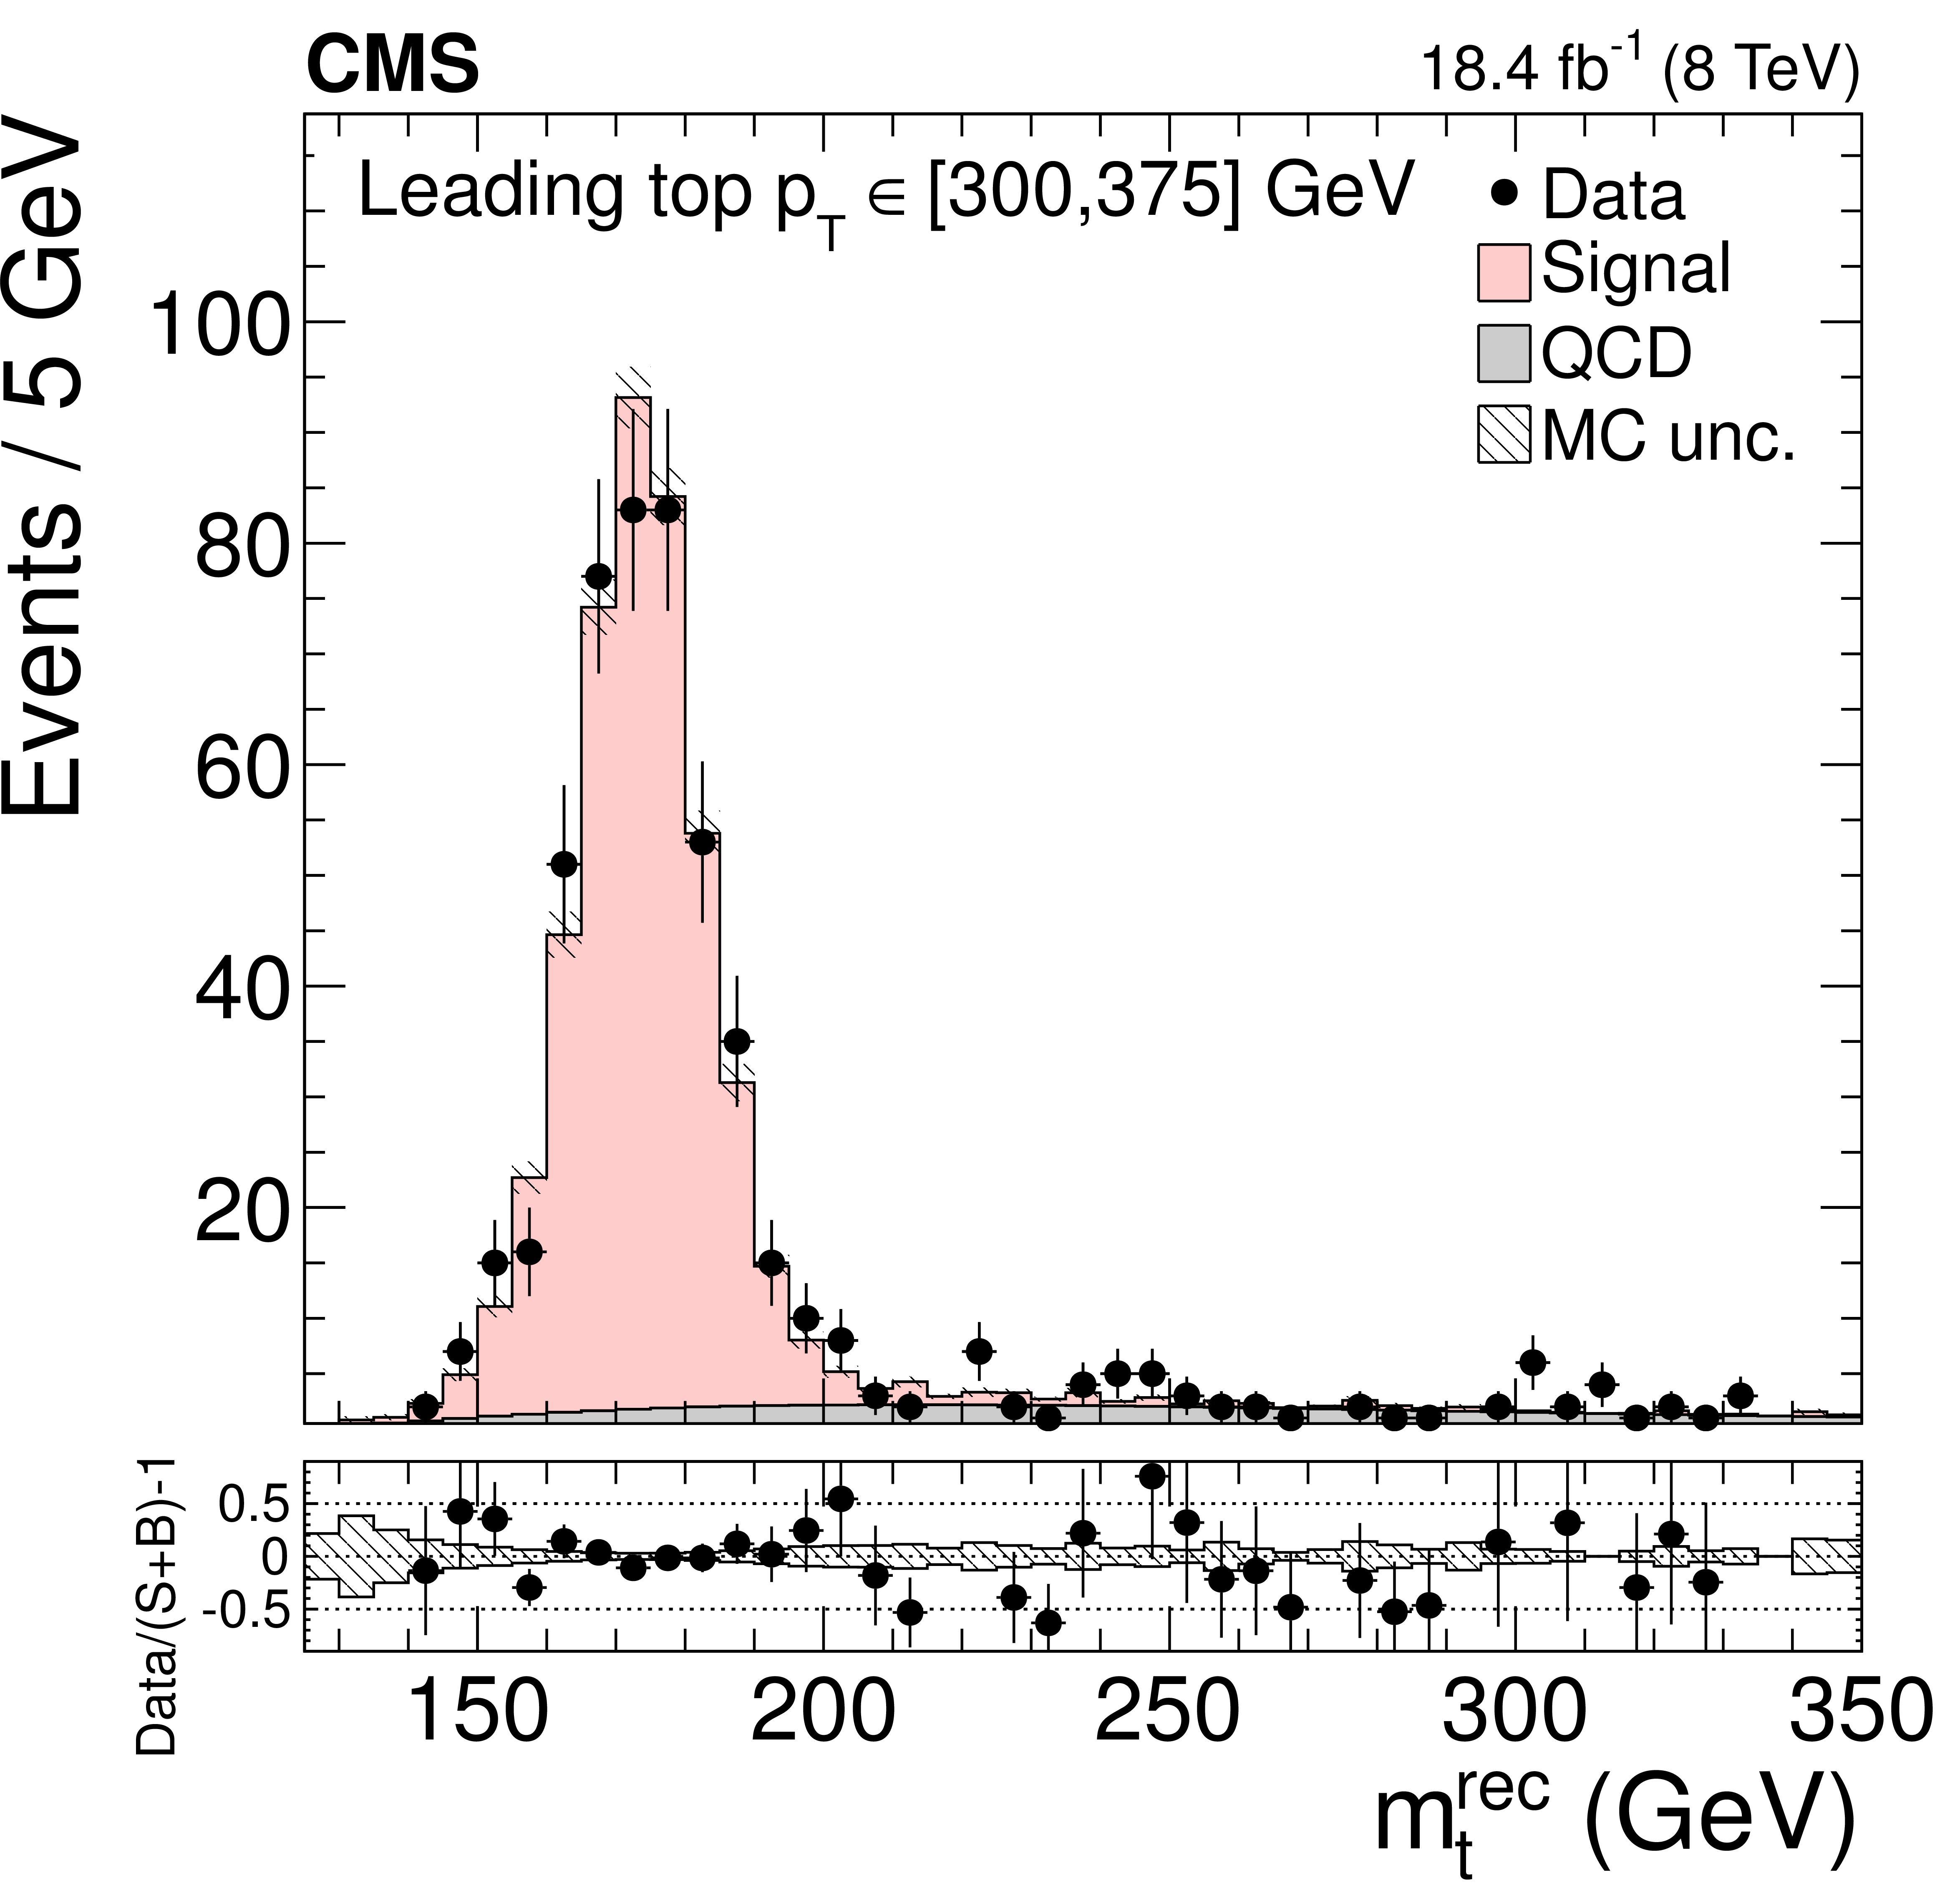
Figure 6-c:
Distribution of the reconstructed top quark mass after the kinematic fit in bins of the leading reconstructed top quark $ {p_{\mathrm {T}}} $. The normalizations of the $ {\mathrm {t}} {\overline {\mathrm {t}}}$ signal and the QCD multijet background are taken from the template fit to the data. The bottom panels show the fractional difference between the data and the sum of signal and background predictions, with the shaded band representing the MC statistical uncertainty. |
png pdf |
Figure 6-d:
Distribution of the reconstructed top quark mass after the kinematic fit in bins of the leading reconstructed top quark $ {p_{\mathrm {T}}} $. The normalizations of the $ {\mathrm {t}} {\overline {\mathrm {t}}}$ signal and the QCD multijet background are taken from the template fit to the data. The bottom panels show the fractional difference between the data and the sum of signal and background predictions, with the shaded band representing the MC statistical uncertainty. |
png pdf |
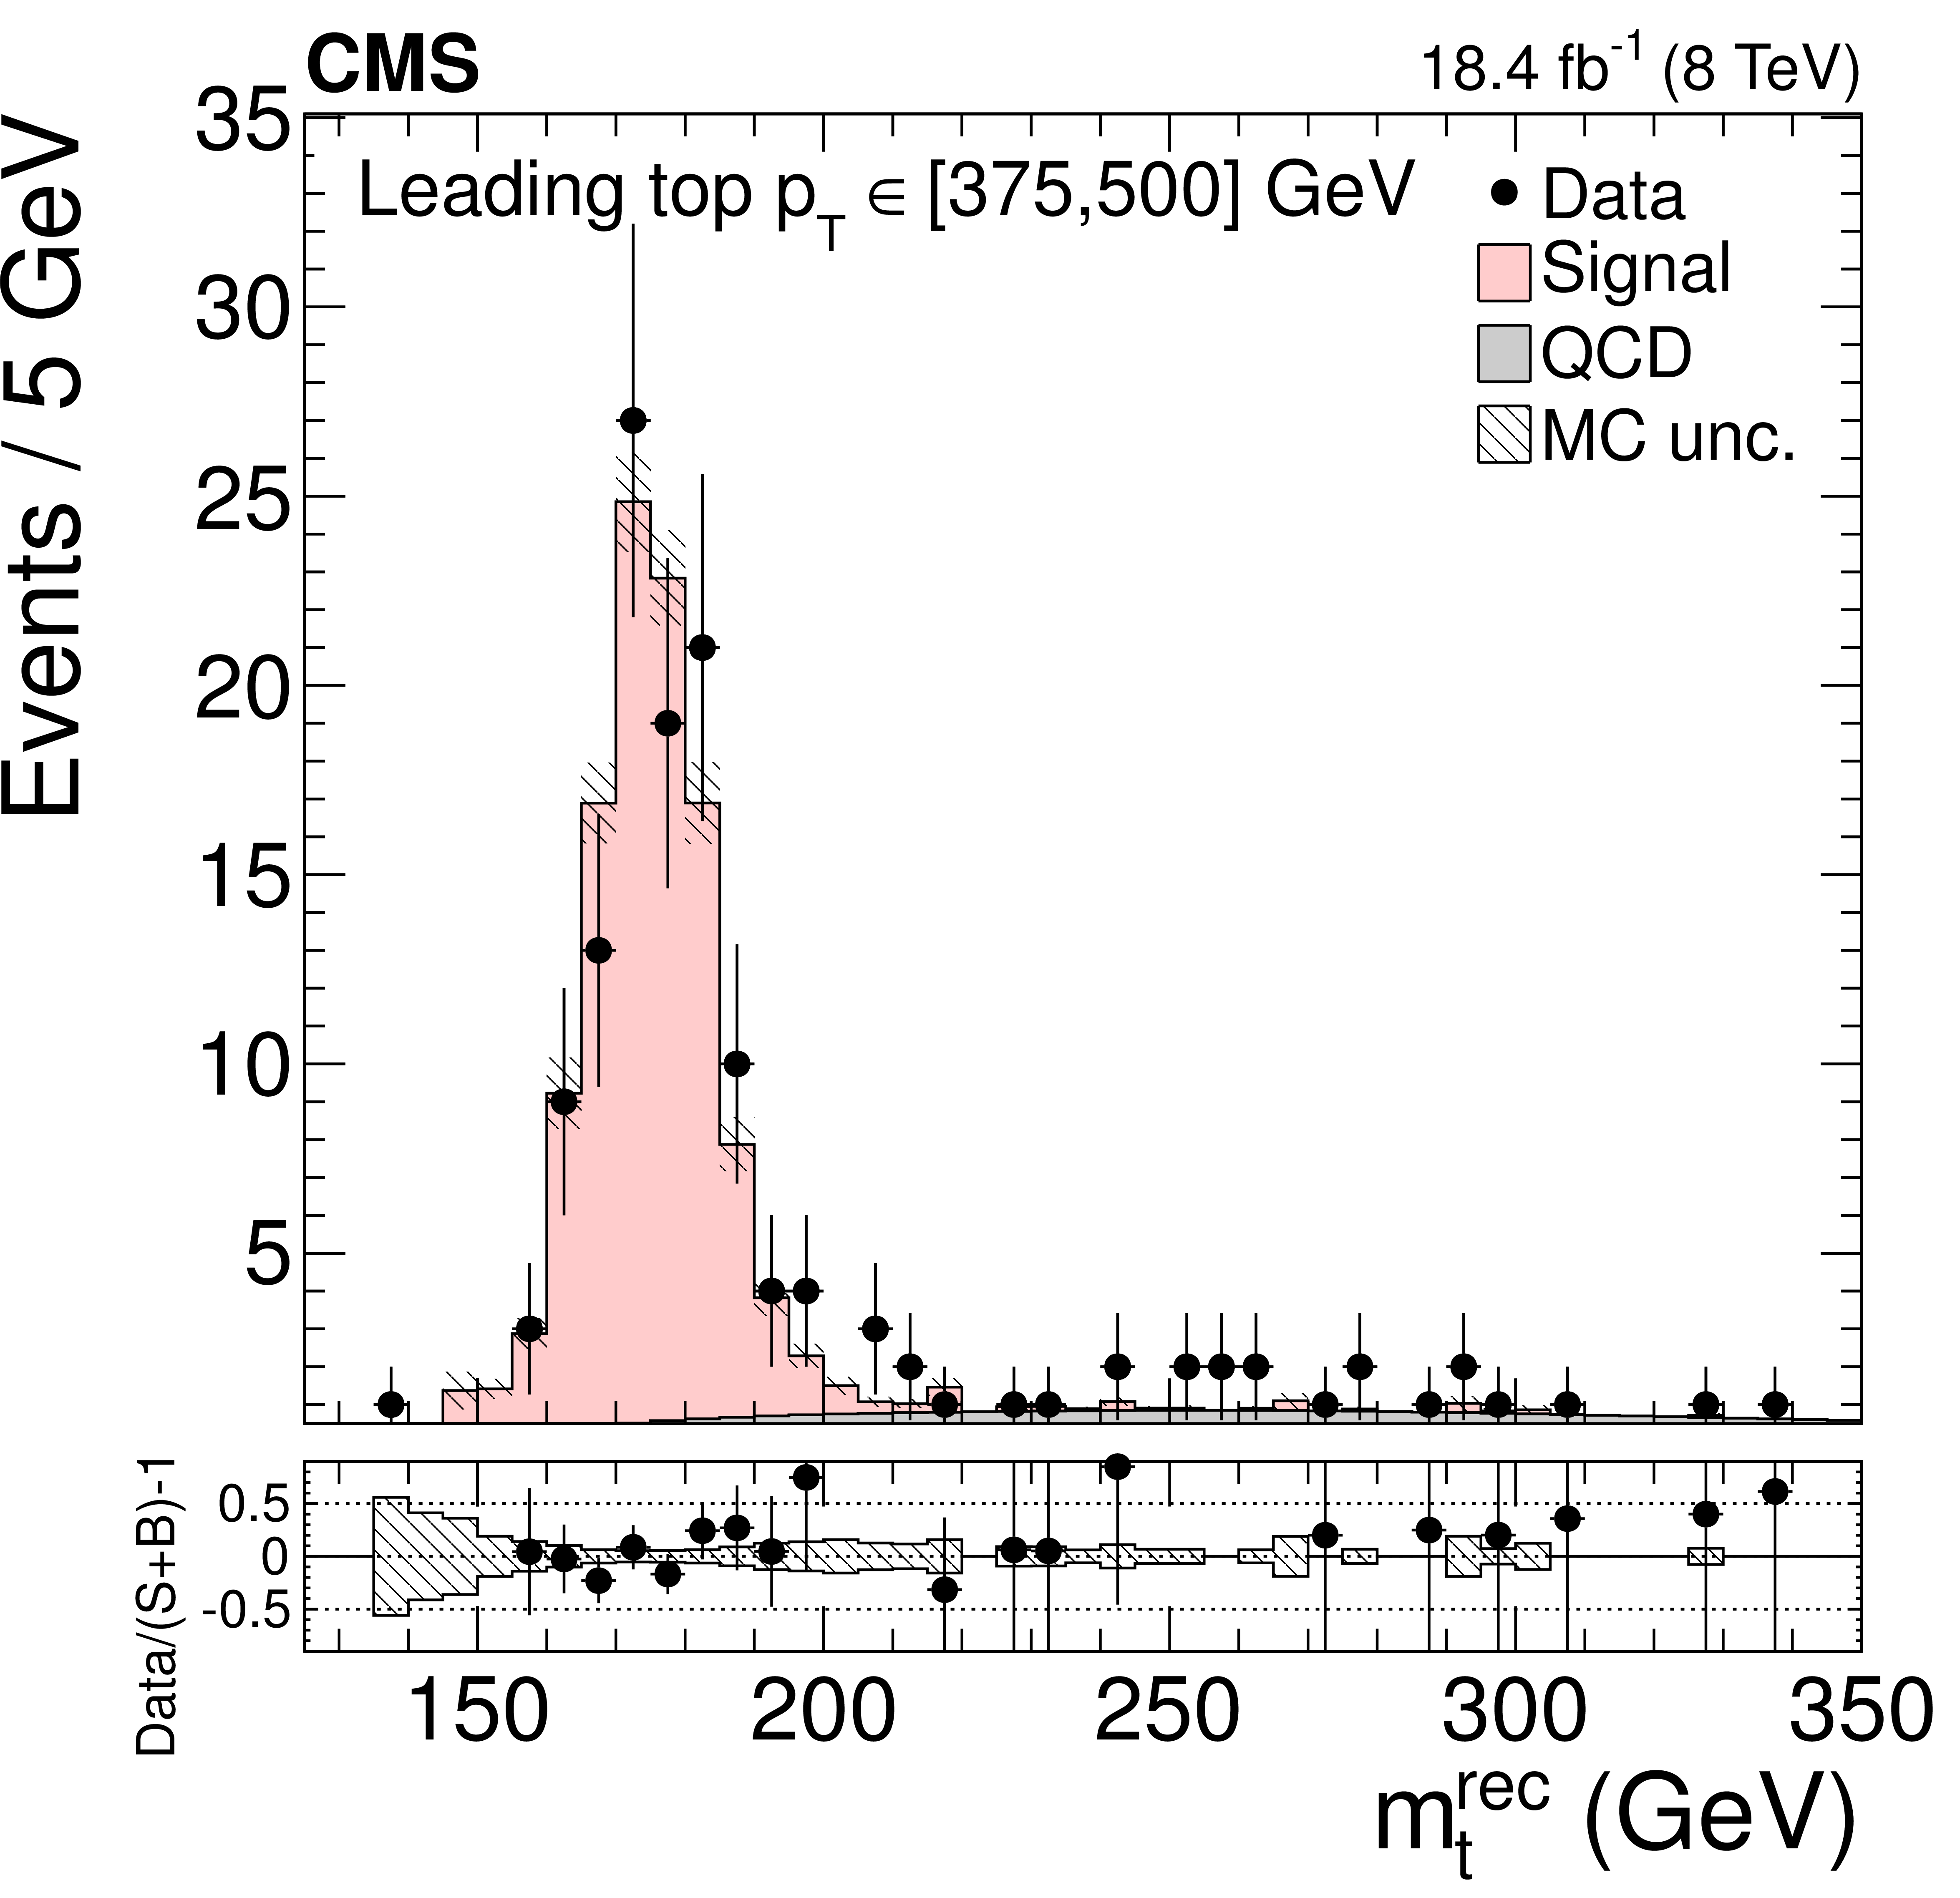
Figure 6-e:
Distribution of the reconstructed top quark mass after the kinematic fit in bins of the leading reconstructed top quark $ {p_{\mathrm {T}}} $. The normalizations of the $ {\mathrm {t}} {\overline {\mathrm {t}}}$ signal and the QCD multijet background are taken from the template fit to the data. The bottom panels show the fractional difference between the data and the sum of signal and background predictions, with the shaded band representing the MC statistical uncertainty. |
png pdf |
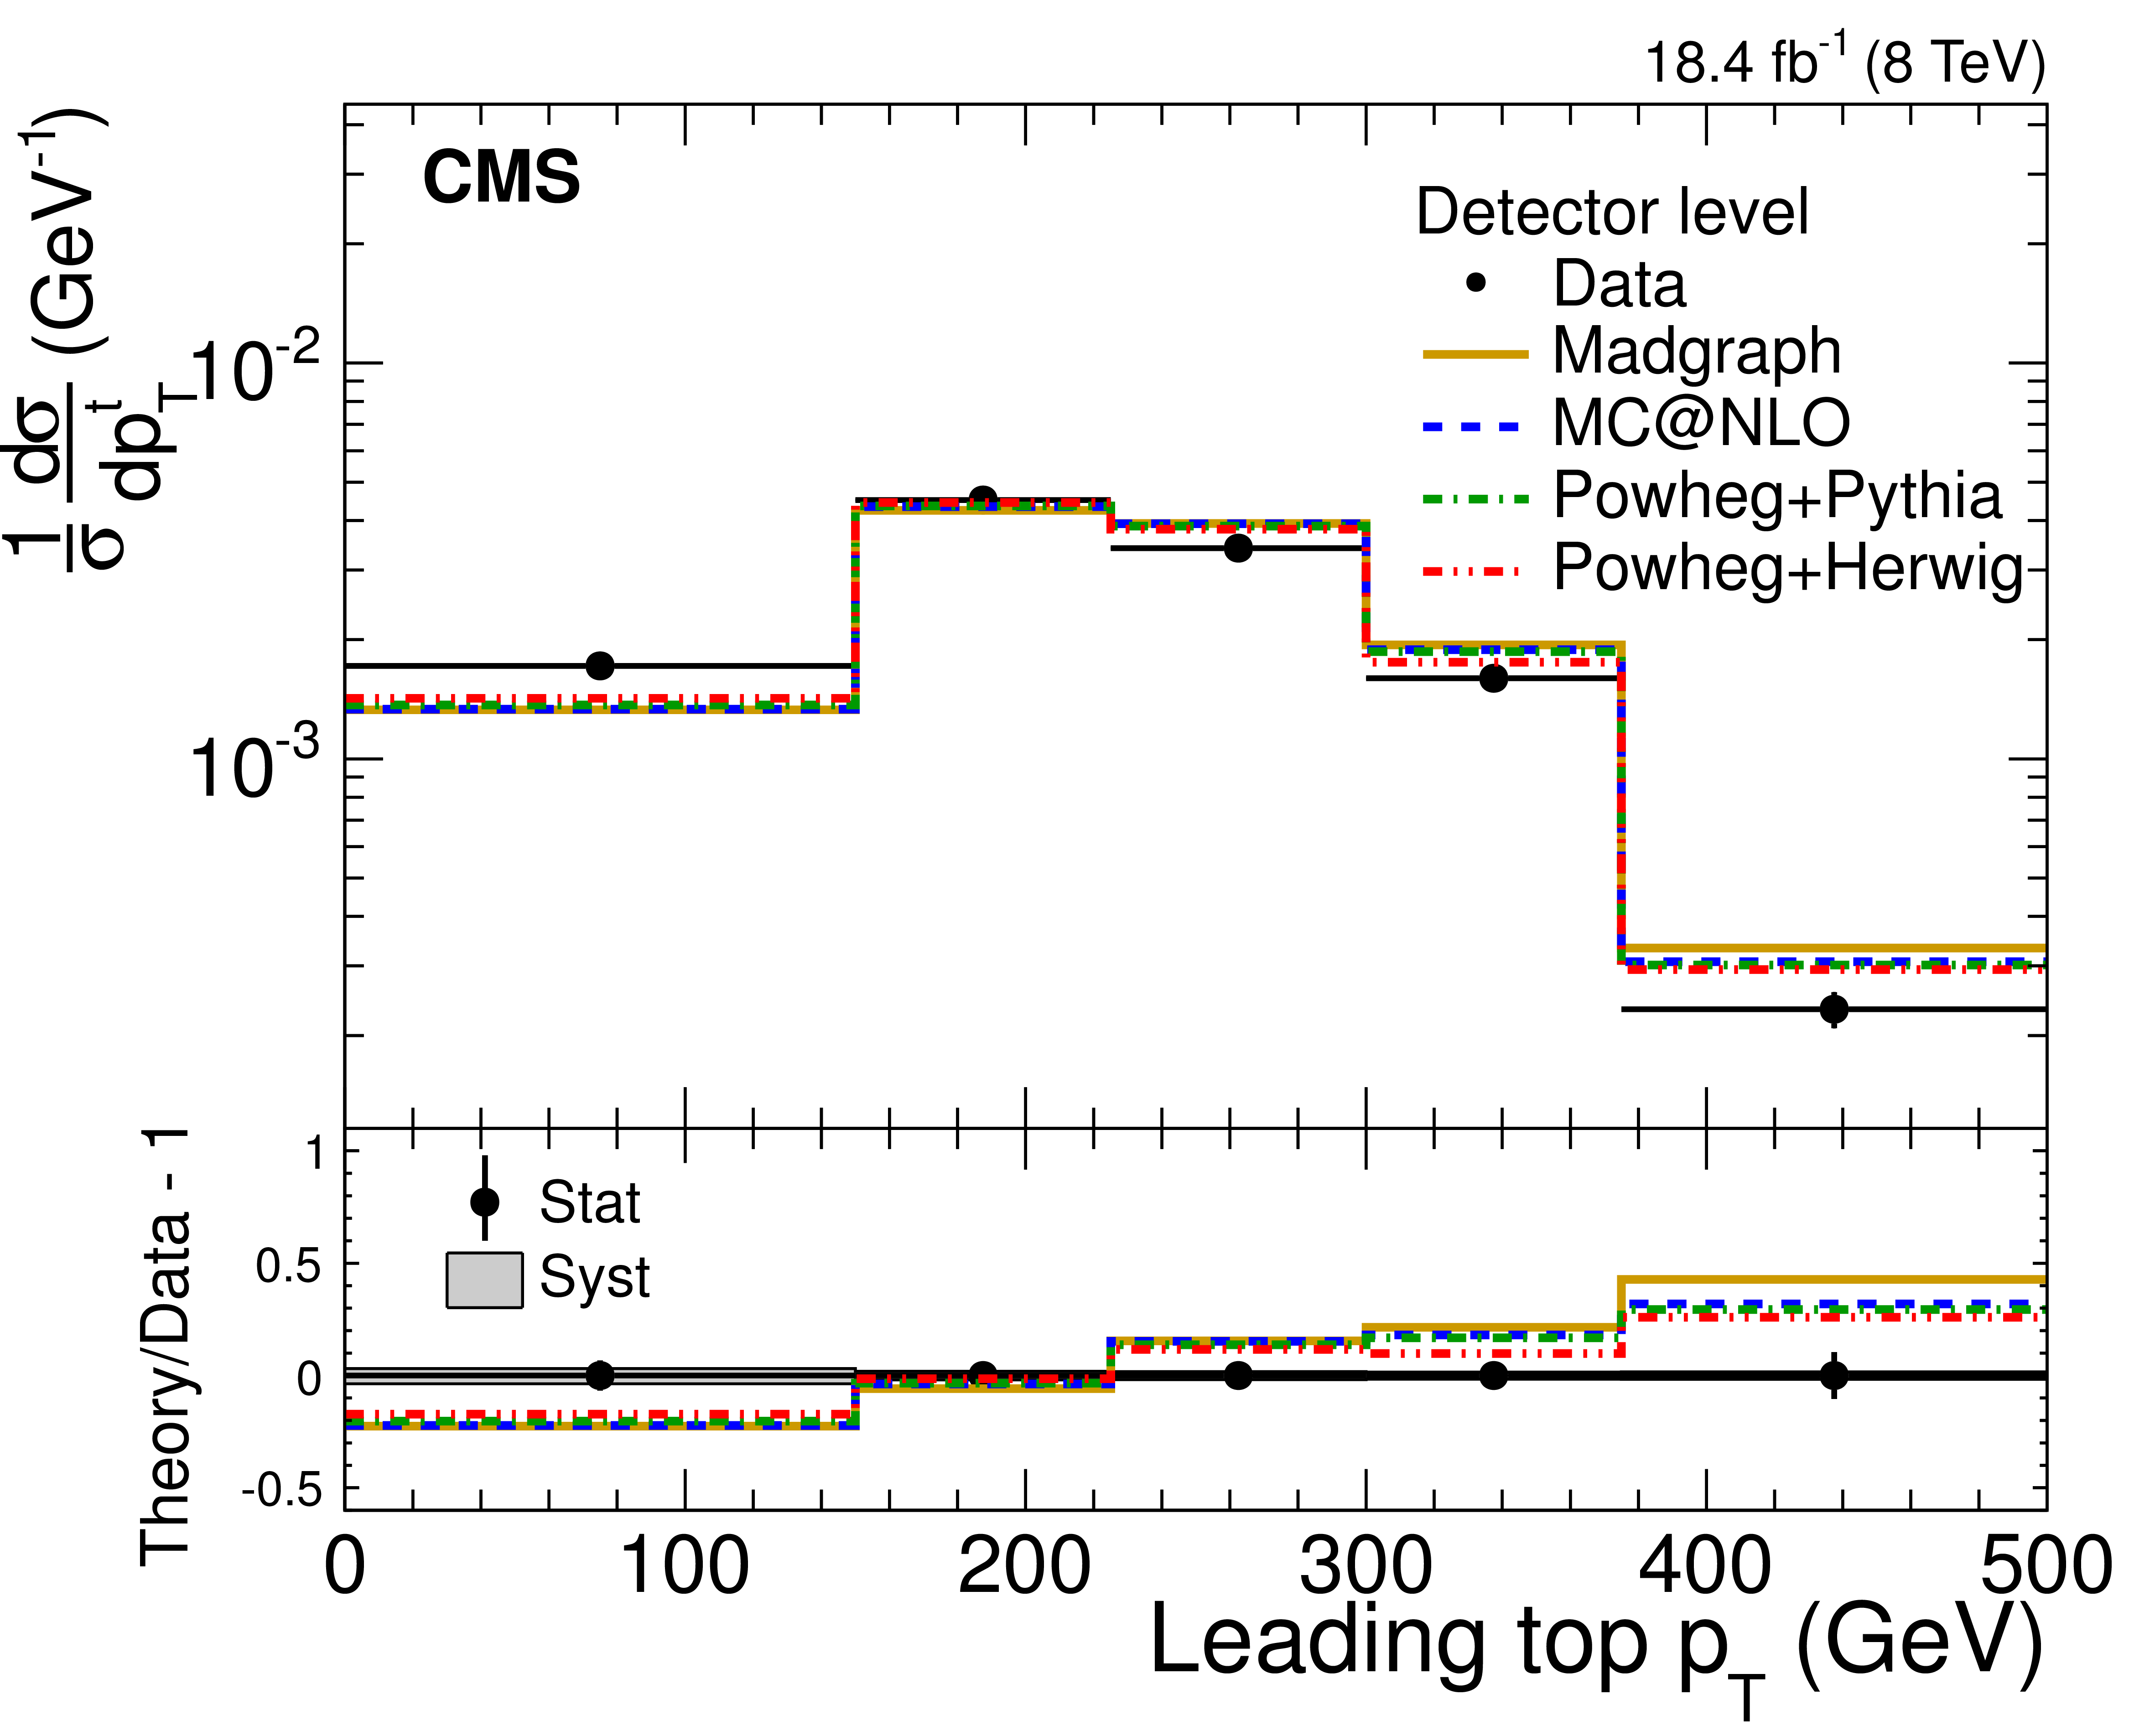
Figure 7-a:
Normalized fiducial differential cross section of the $ {\mathrm {t}} {\overline {\mathrm {t}}}$ production as a function of the leading (a) and subleading (b) reconstructed top quark $ {p_{\mathrm {T}}} $ (detector level). The bottom panels show the fractional difference between various MC predictions and the data. Statistical uncertainties are shown with error bars, and systematic uncertainties with the shaded band. |
png pdf |
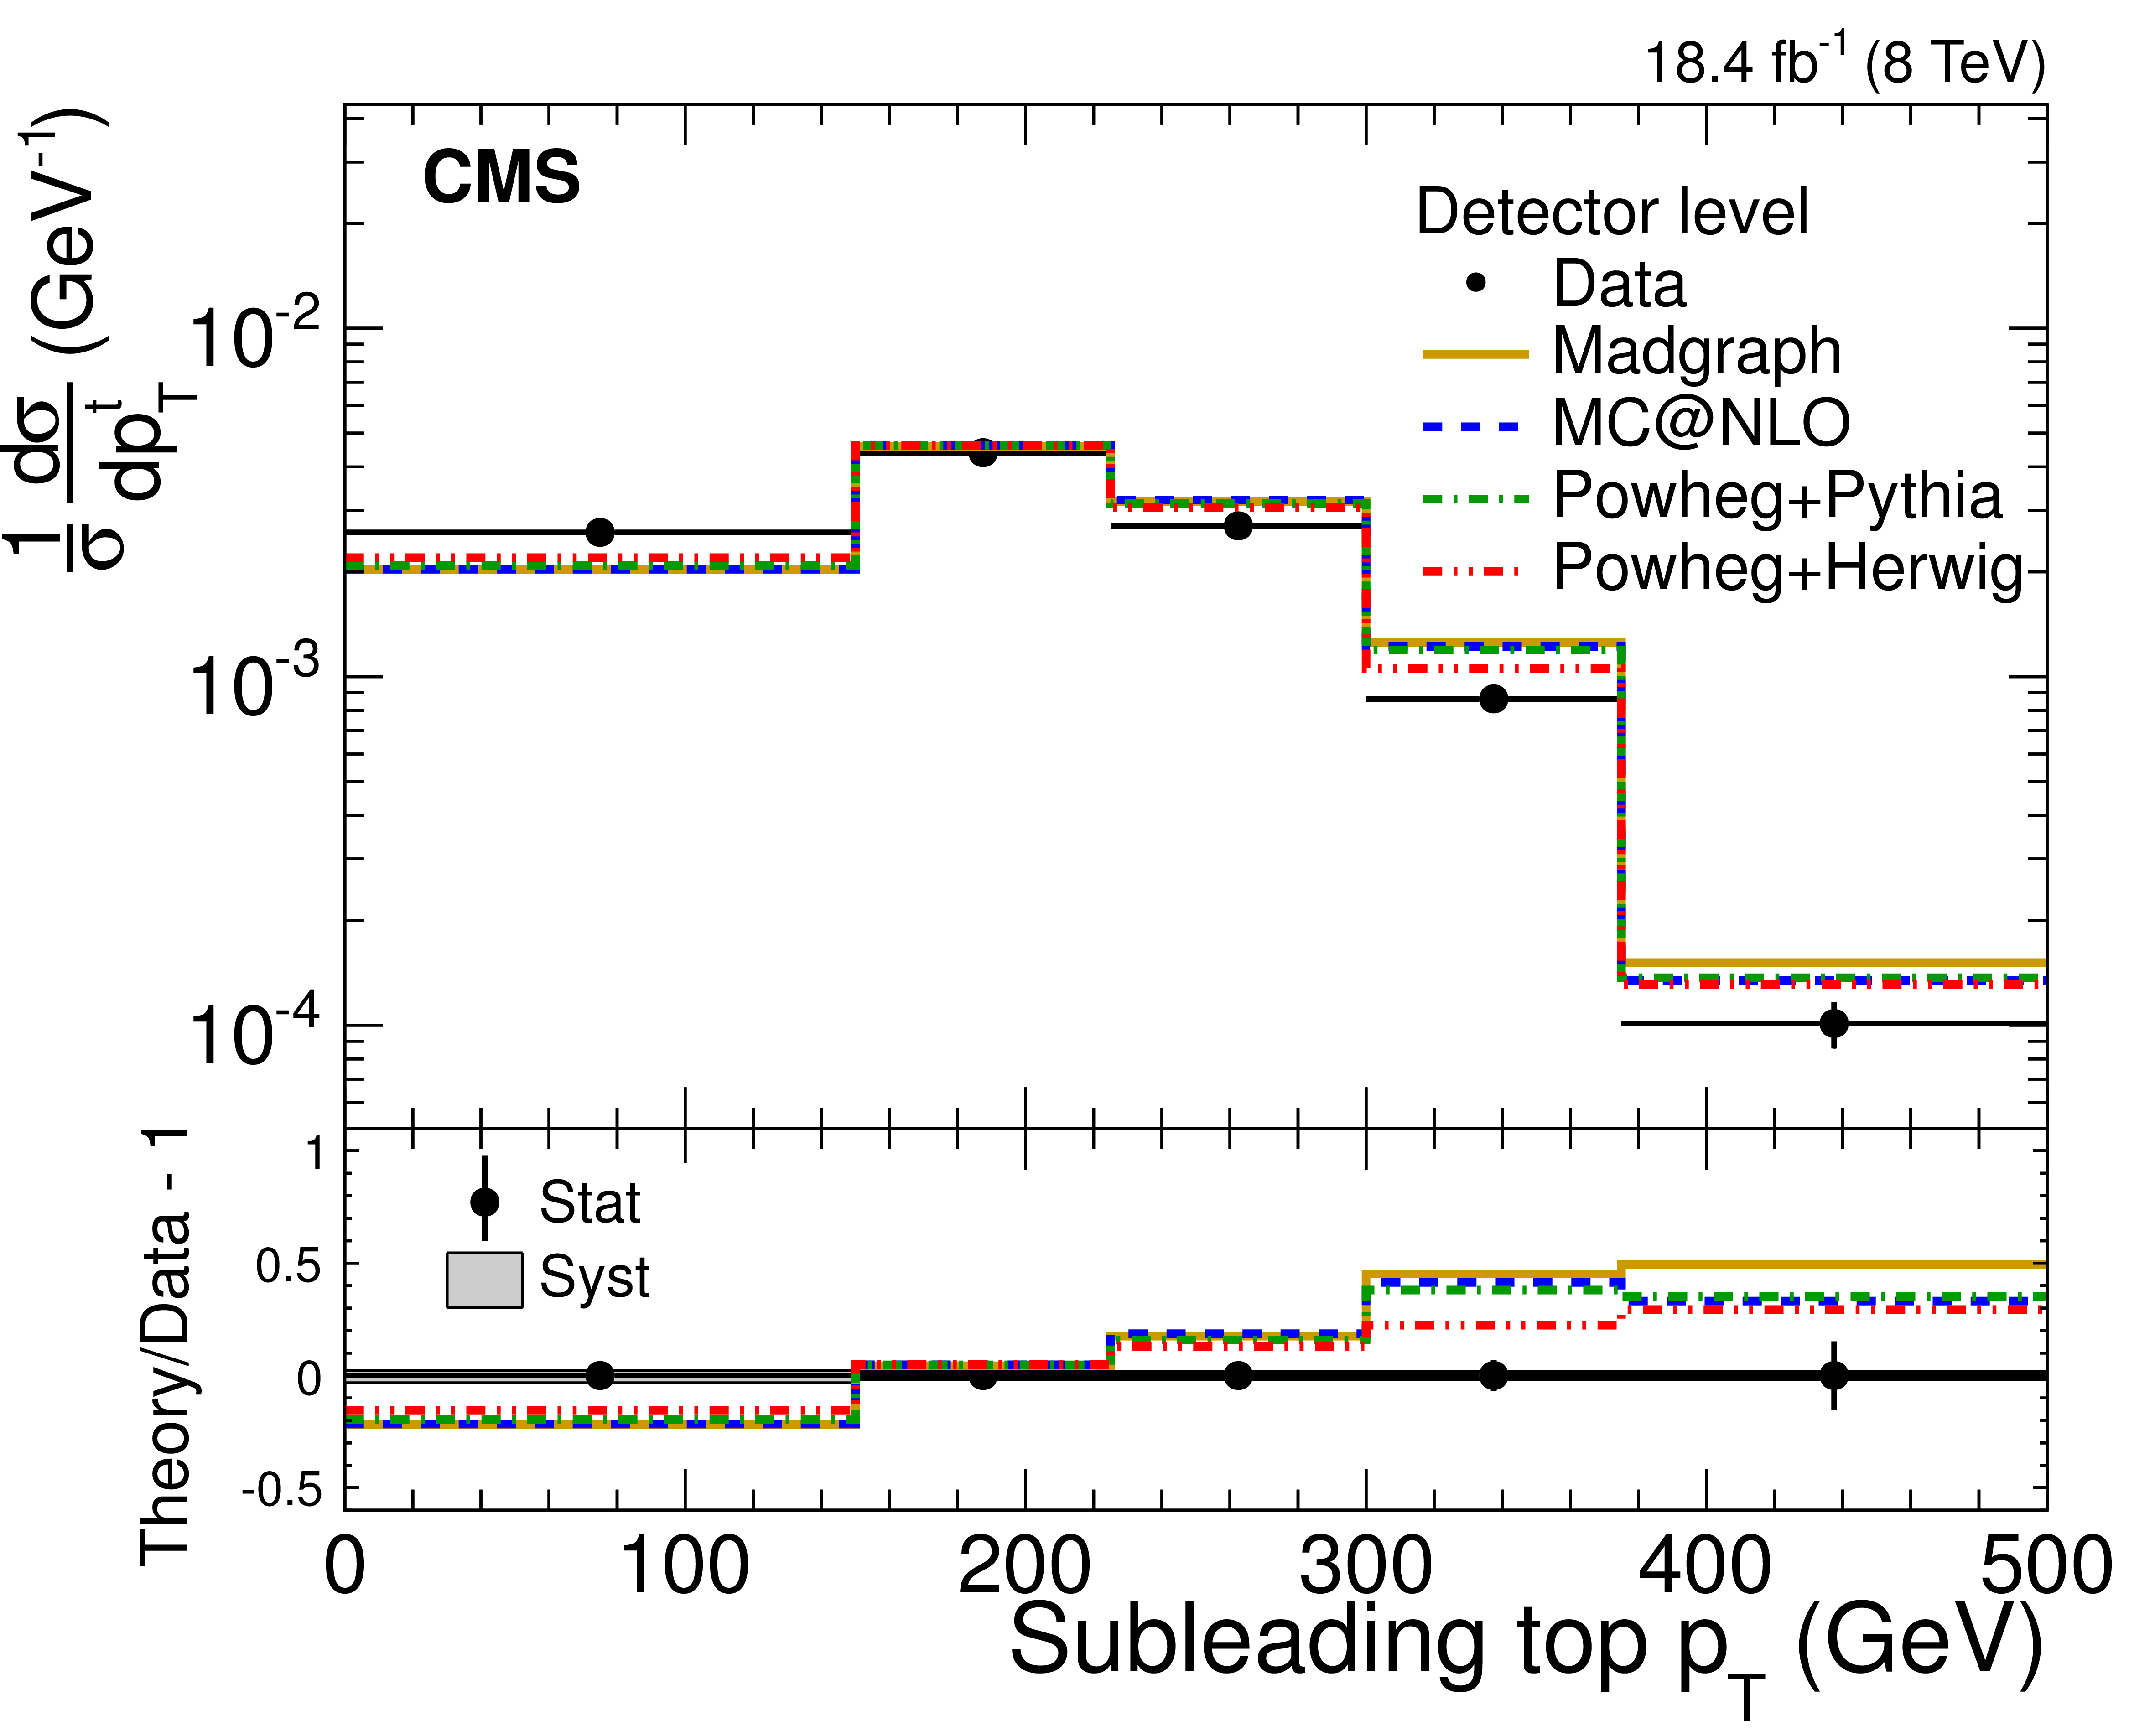
Figure 7-b:
Normalized fiducial differential cross section of the $ {\mathrm {t}} {\overline {\mathrm {t}}}$ production as a function of the leading (a) and subleading (b) reconstructed top quark $ {p_{\mathrm {T}}} $ (detector level). The bottom panels show the fractional difference between various MC predictions and the data. Statistical uncertainties are shown with error bars, and systematic uncertainties with the shaded band. |
png pdf |
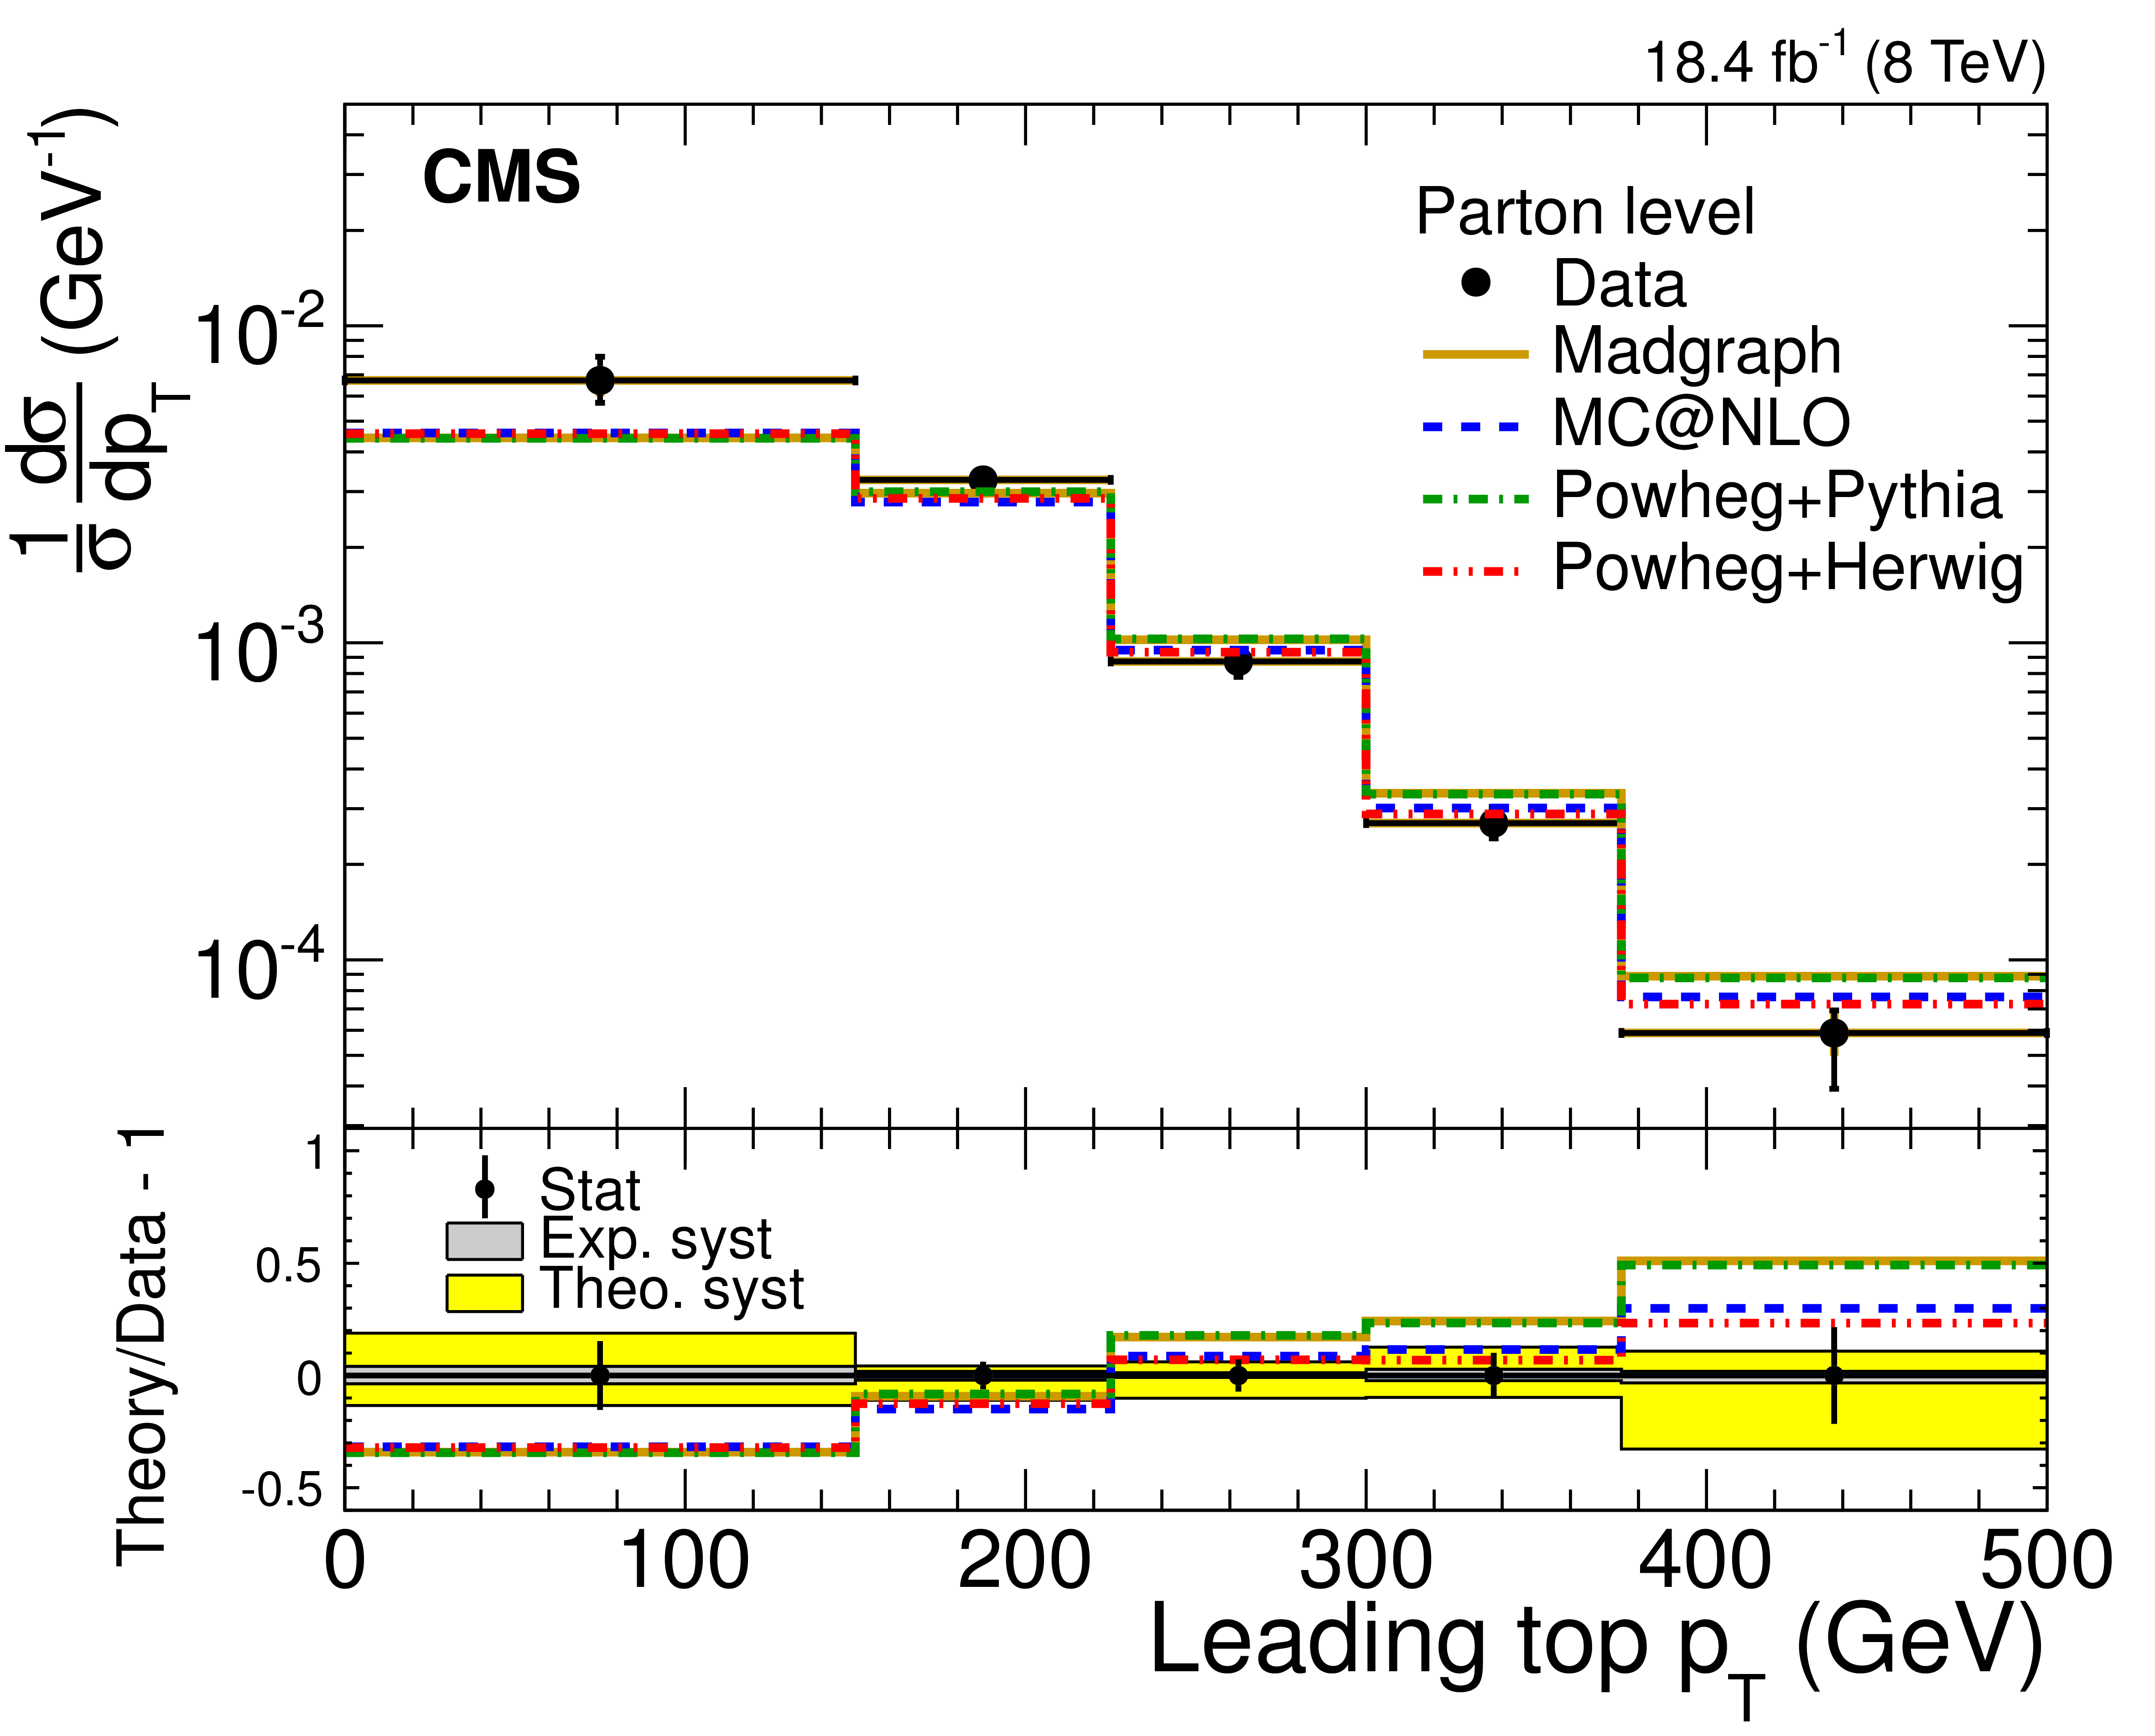
Figure 8-a:
Normalized differential cross section of the $ {\mathrm {t}} {\overline {\mathrm {t}}}$ production at parton level as a function of the leading (a) and subleading (b) top quark$ {p_{\mathrm {T}}} $. The bottom panels show the fractional difference between various MC predictions and the data. Statistical uncertainties are shown with error bars, while theoretical (theo.) and experimental (exp.) systematic uncertainties with the shaded bands. |
png pdf |
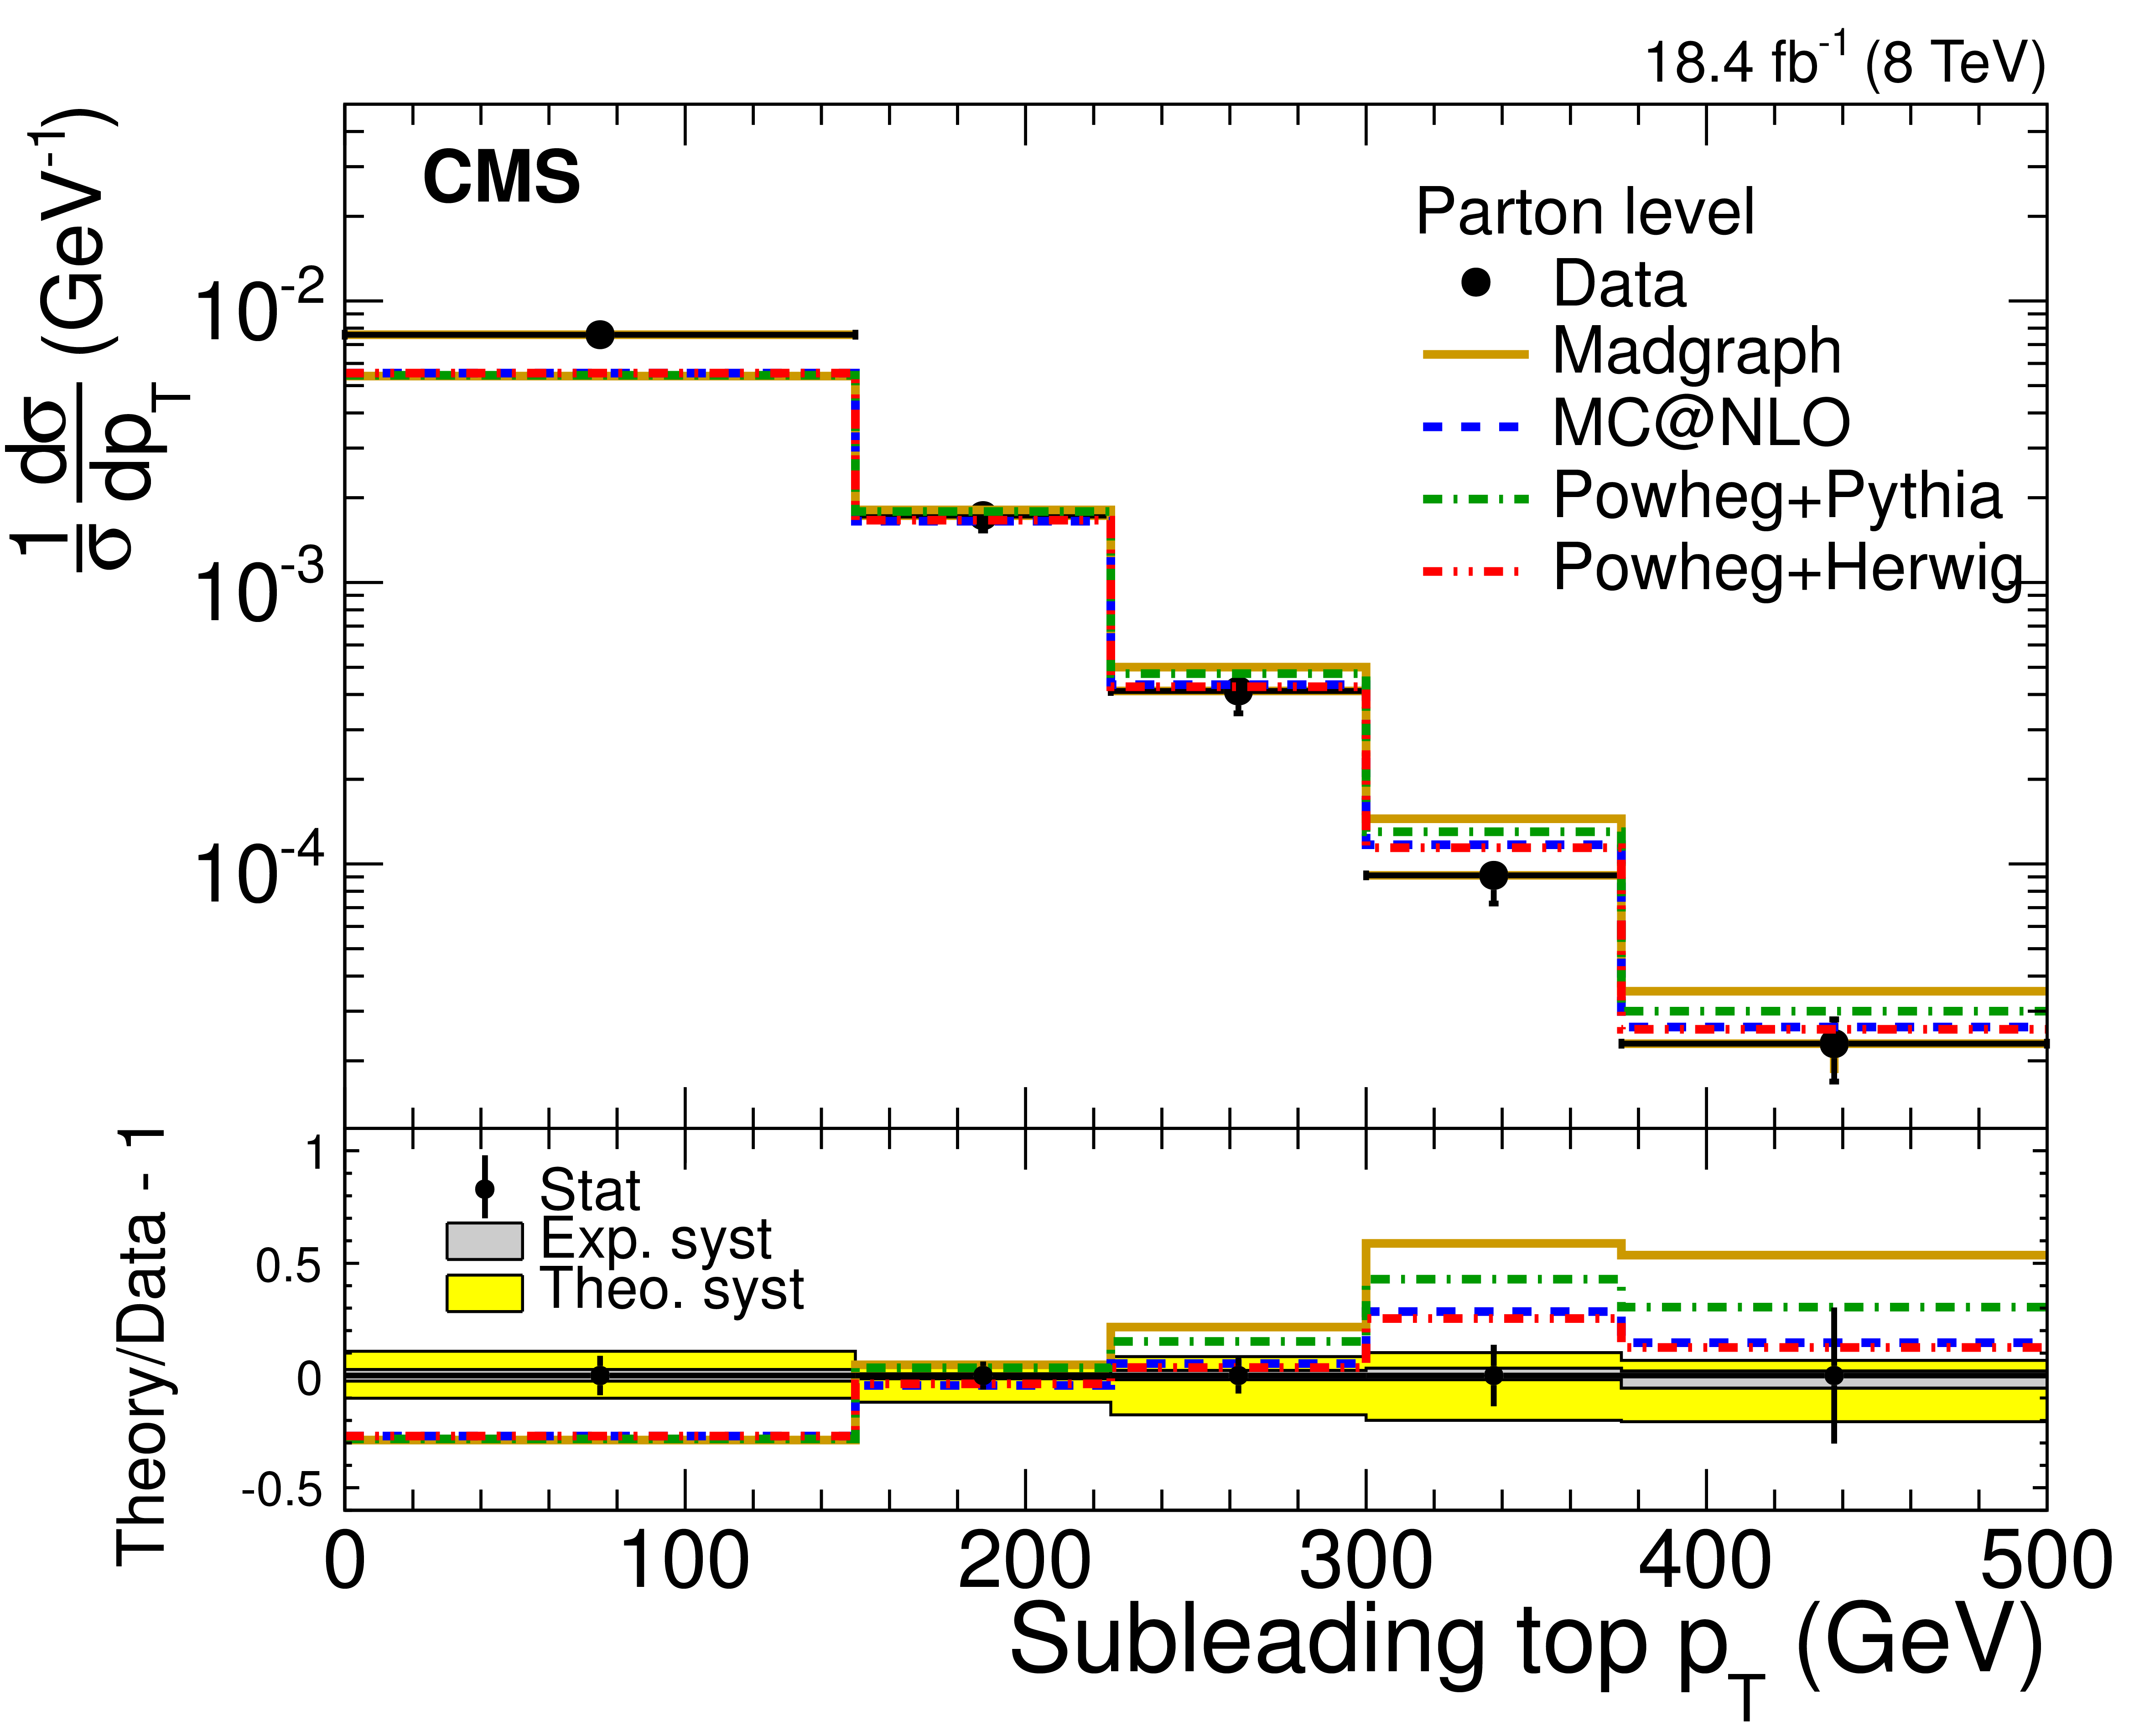
Figure 8-b:
Normalized differential cross section of the $ {\mathrm {t}} {\overline {\mathrm {t}}}$ production at parton level as a function of the leading (a) and subleading (b) top quark$ {p_{\mathrm {T}}} $. The bottom panels show the fractional difference between various MC predictions and the data. Statistical uncertainties are shown with error bars, while theoretical (theo.) and experimental (exp.) systematic uncertainties with the shaded bands. |

png pdf |
Figure 9-a:
Normalized differential cross section of the $ {\mathrm {t}} {\overline {\mathrm {t}}}$ production at particle level as a function of the leading (a) and subleading (b) top quark $ {p_{\mathrm {T}}} $. The bottom panels show the fractional difference between various MC predictions and the data. Statistical uncertainties are shown with error bars, while theoretical (theo.) and experimental (exp.) systematic uncertainties with the shaded bands. |
png pdf |
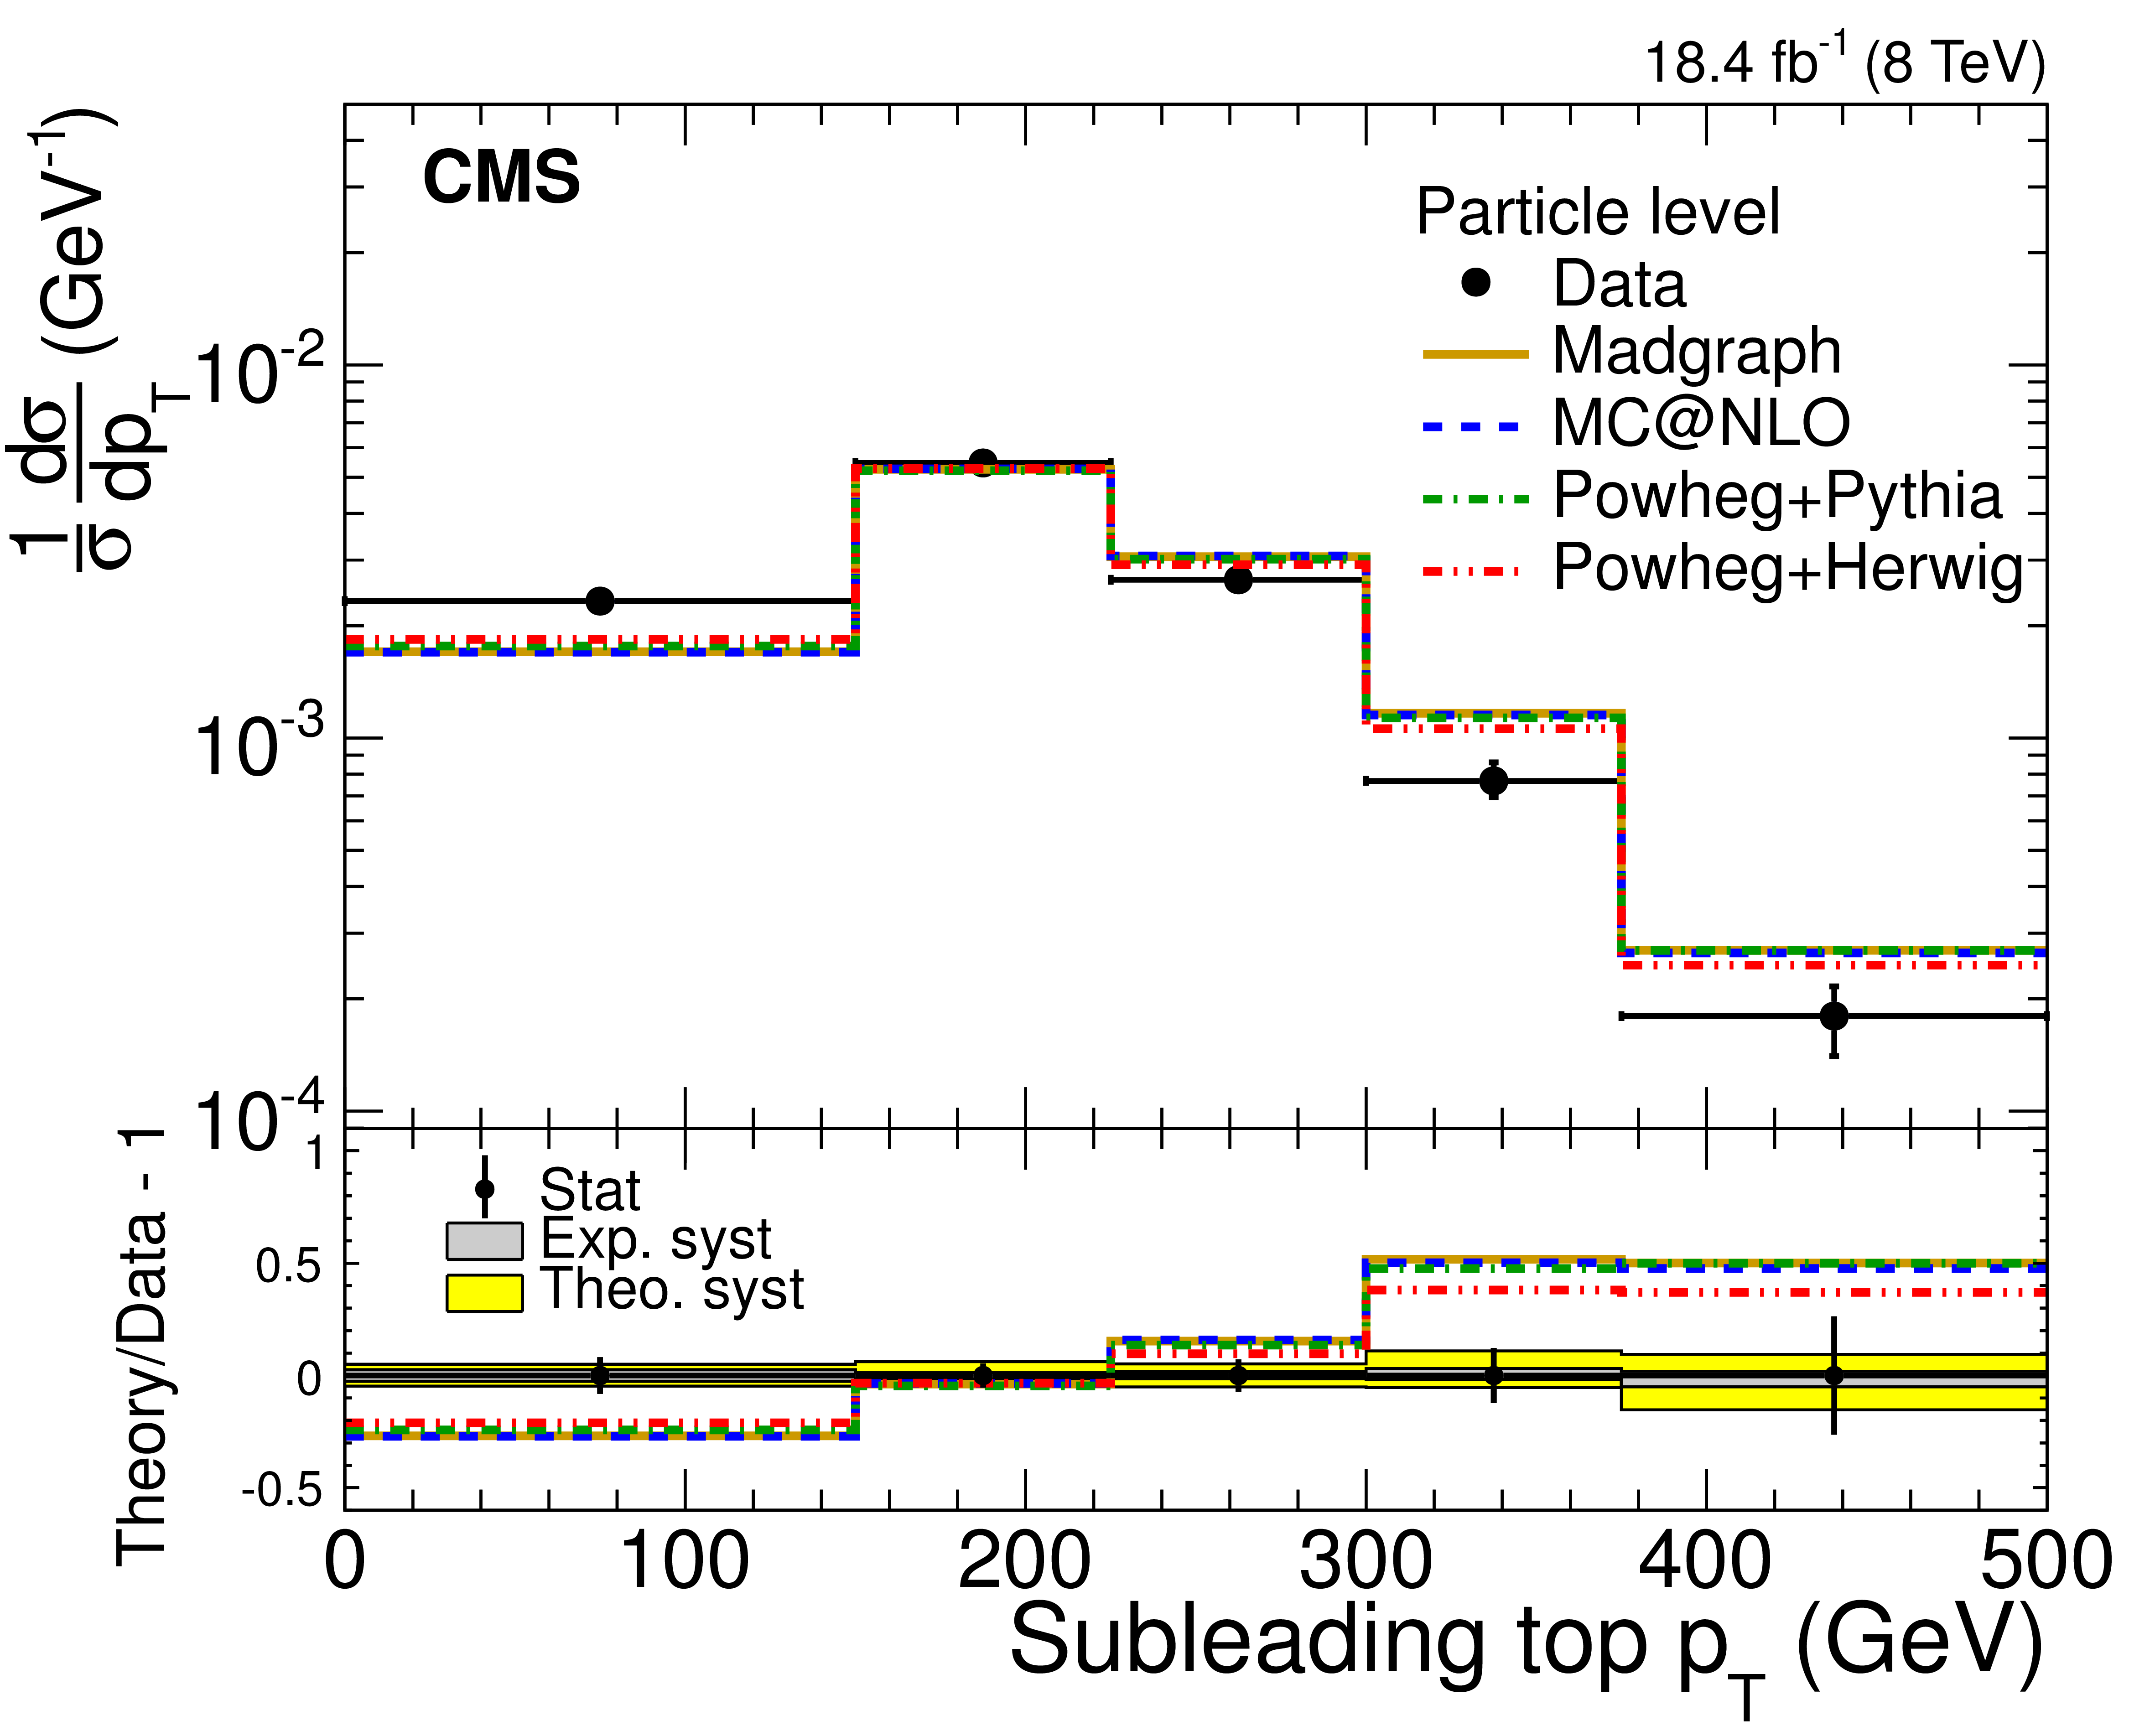
Figure 9-b:
Normalized differential cross section of the $ {\mathrm {t}} {\overline {\mathrm {t}}}$ production at particle level as a function of the leading (a) and subleading (b) top quark $ {p_{\mathrm {T}}} $. The bottom panels show the fractional difference between various MC predictions and the data. Statistical uncertainties are shown with error bars, while theoretical (theo.) and experimental (exp.) systematic uncertainties with the shaded bands. |
| Tables | |
png pdf |
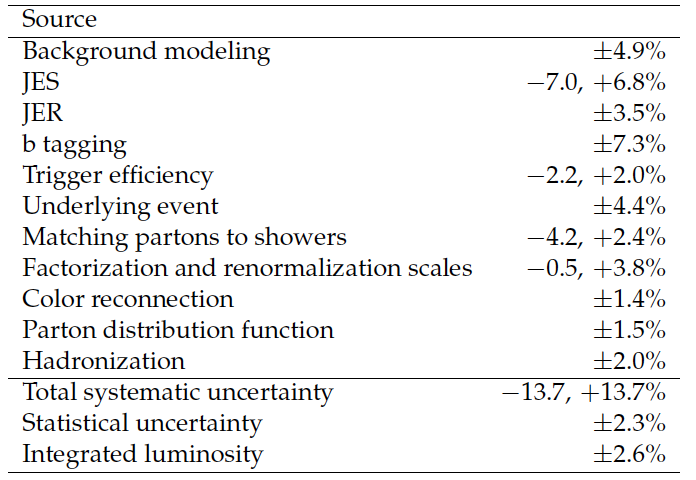
Table 1:
Fractional uncertainties in the inclusive $ {\mathrm {t}} {\overline {\mathrm {t}}}$ production cross section. |
png pdf |
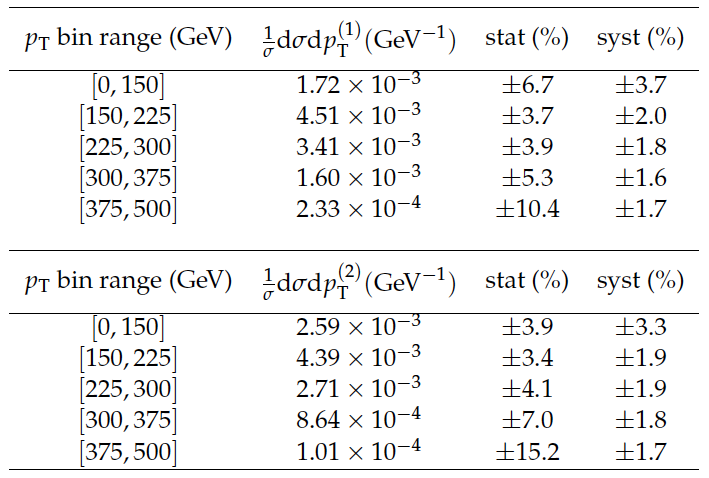
Table 2:
Normalized differential $ {\mathrm {t}} {\overline {\mathrm {t}}}$ cross section as a function of the $ {p_{\mathrm {T}}} $ of the leading ($ {p_{\mathrm {T}}} ^{(1)}$) and subleading ($ {p_{\mathrm {T}}} ^{(2)}$) top quarks or antiquarks. The results are presented at detector level in the visible phase space. |
png pdf |
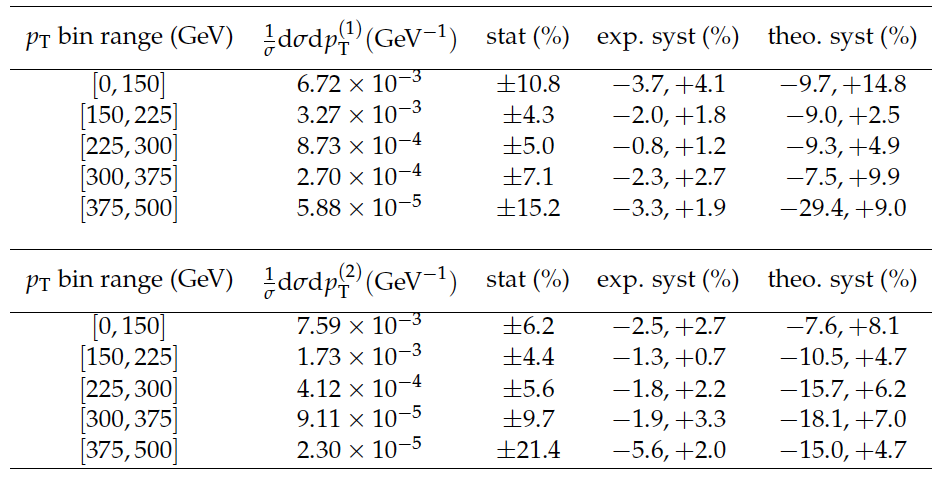
Table 3:
Normalized differential $ {\mathrm {t}} {\overline {\mathrm {t}}}$ cross section as a function of the $ {p_{\mathrm {T}}} $ of the leading ($ {p_{\mathrm {T}}} ^{(1)}$) and subleading ($ {p_{\mathrm {T}}} ^{(2)}$) top quarks or antiquarks. The results are presented at parton level in the full phase space. |
png pdf |
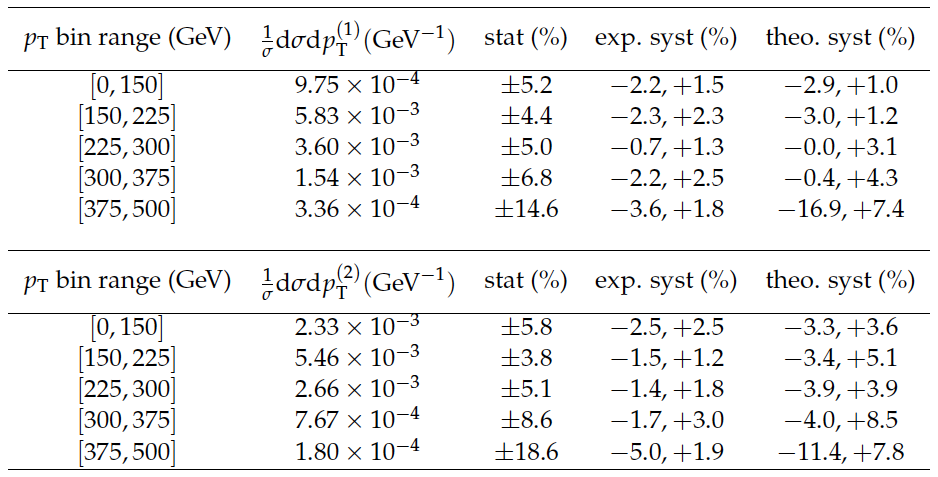
Table 4:
Normalized differential $ {\mathrm {t}} {\overline {\mathrm {t}}}$ cross section as a function of the $ {p_{\mathrm {T}}} $ of the leading ($ {p_{\mathrm {T}}} ^{(1)}$) and subleading ($ {p_{\mathrm {T}}} ^{(2)}$) top quarks or antiquarks. The results are presented at particle level. |
| Summary |
| A measurement of the $ \mathrm{ t \bar{t} } $ production cross section has been performed in the all-jets final state, using pp collision data at $\sqrt{s}=$ 8 TeV corresponding to an integrated luminosity of 18.4 fb$^{-1}$. The measured inclusive cross section is 275.6 $\pm$ 6.1 (stat) $\pm$ 37.8 (syst) $\pm$ 7.2 (lum) pb for a top quark mass of 172.5 GeV, in agreement with the standard model prediction of 234$^{+10}_{-7}$ $\pm$ 12 pb for $m_{\mathrm{t}}=$173 GeV [Kidonakis et al, 2012]. Also reported are the fiducial normalized differential cross sections as a function of the leading and subleading top quark $ p_{\mathrm{T}} $. Compared to QCD predictions, the measurement shows a significantly softer top quark $ p_{\mathrm{T}} $ spectrum. The differential cross sections are also extrapolated to the full partonic phase space, as well as to particle level, and can be used to tune Monte Carlo models. |
| Additional Figures | |
png pdf |
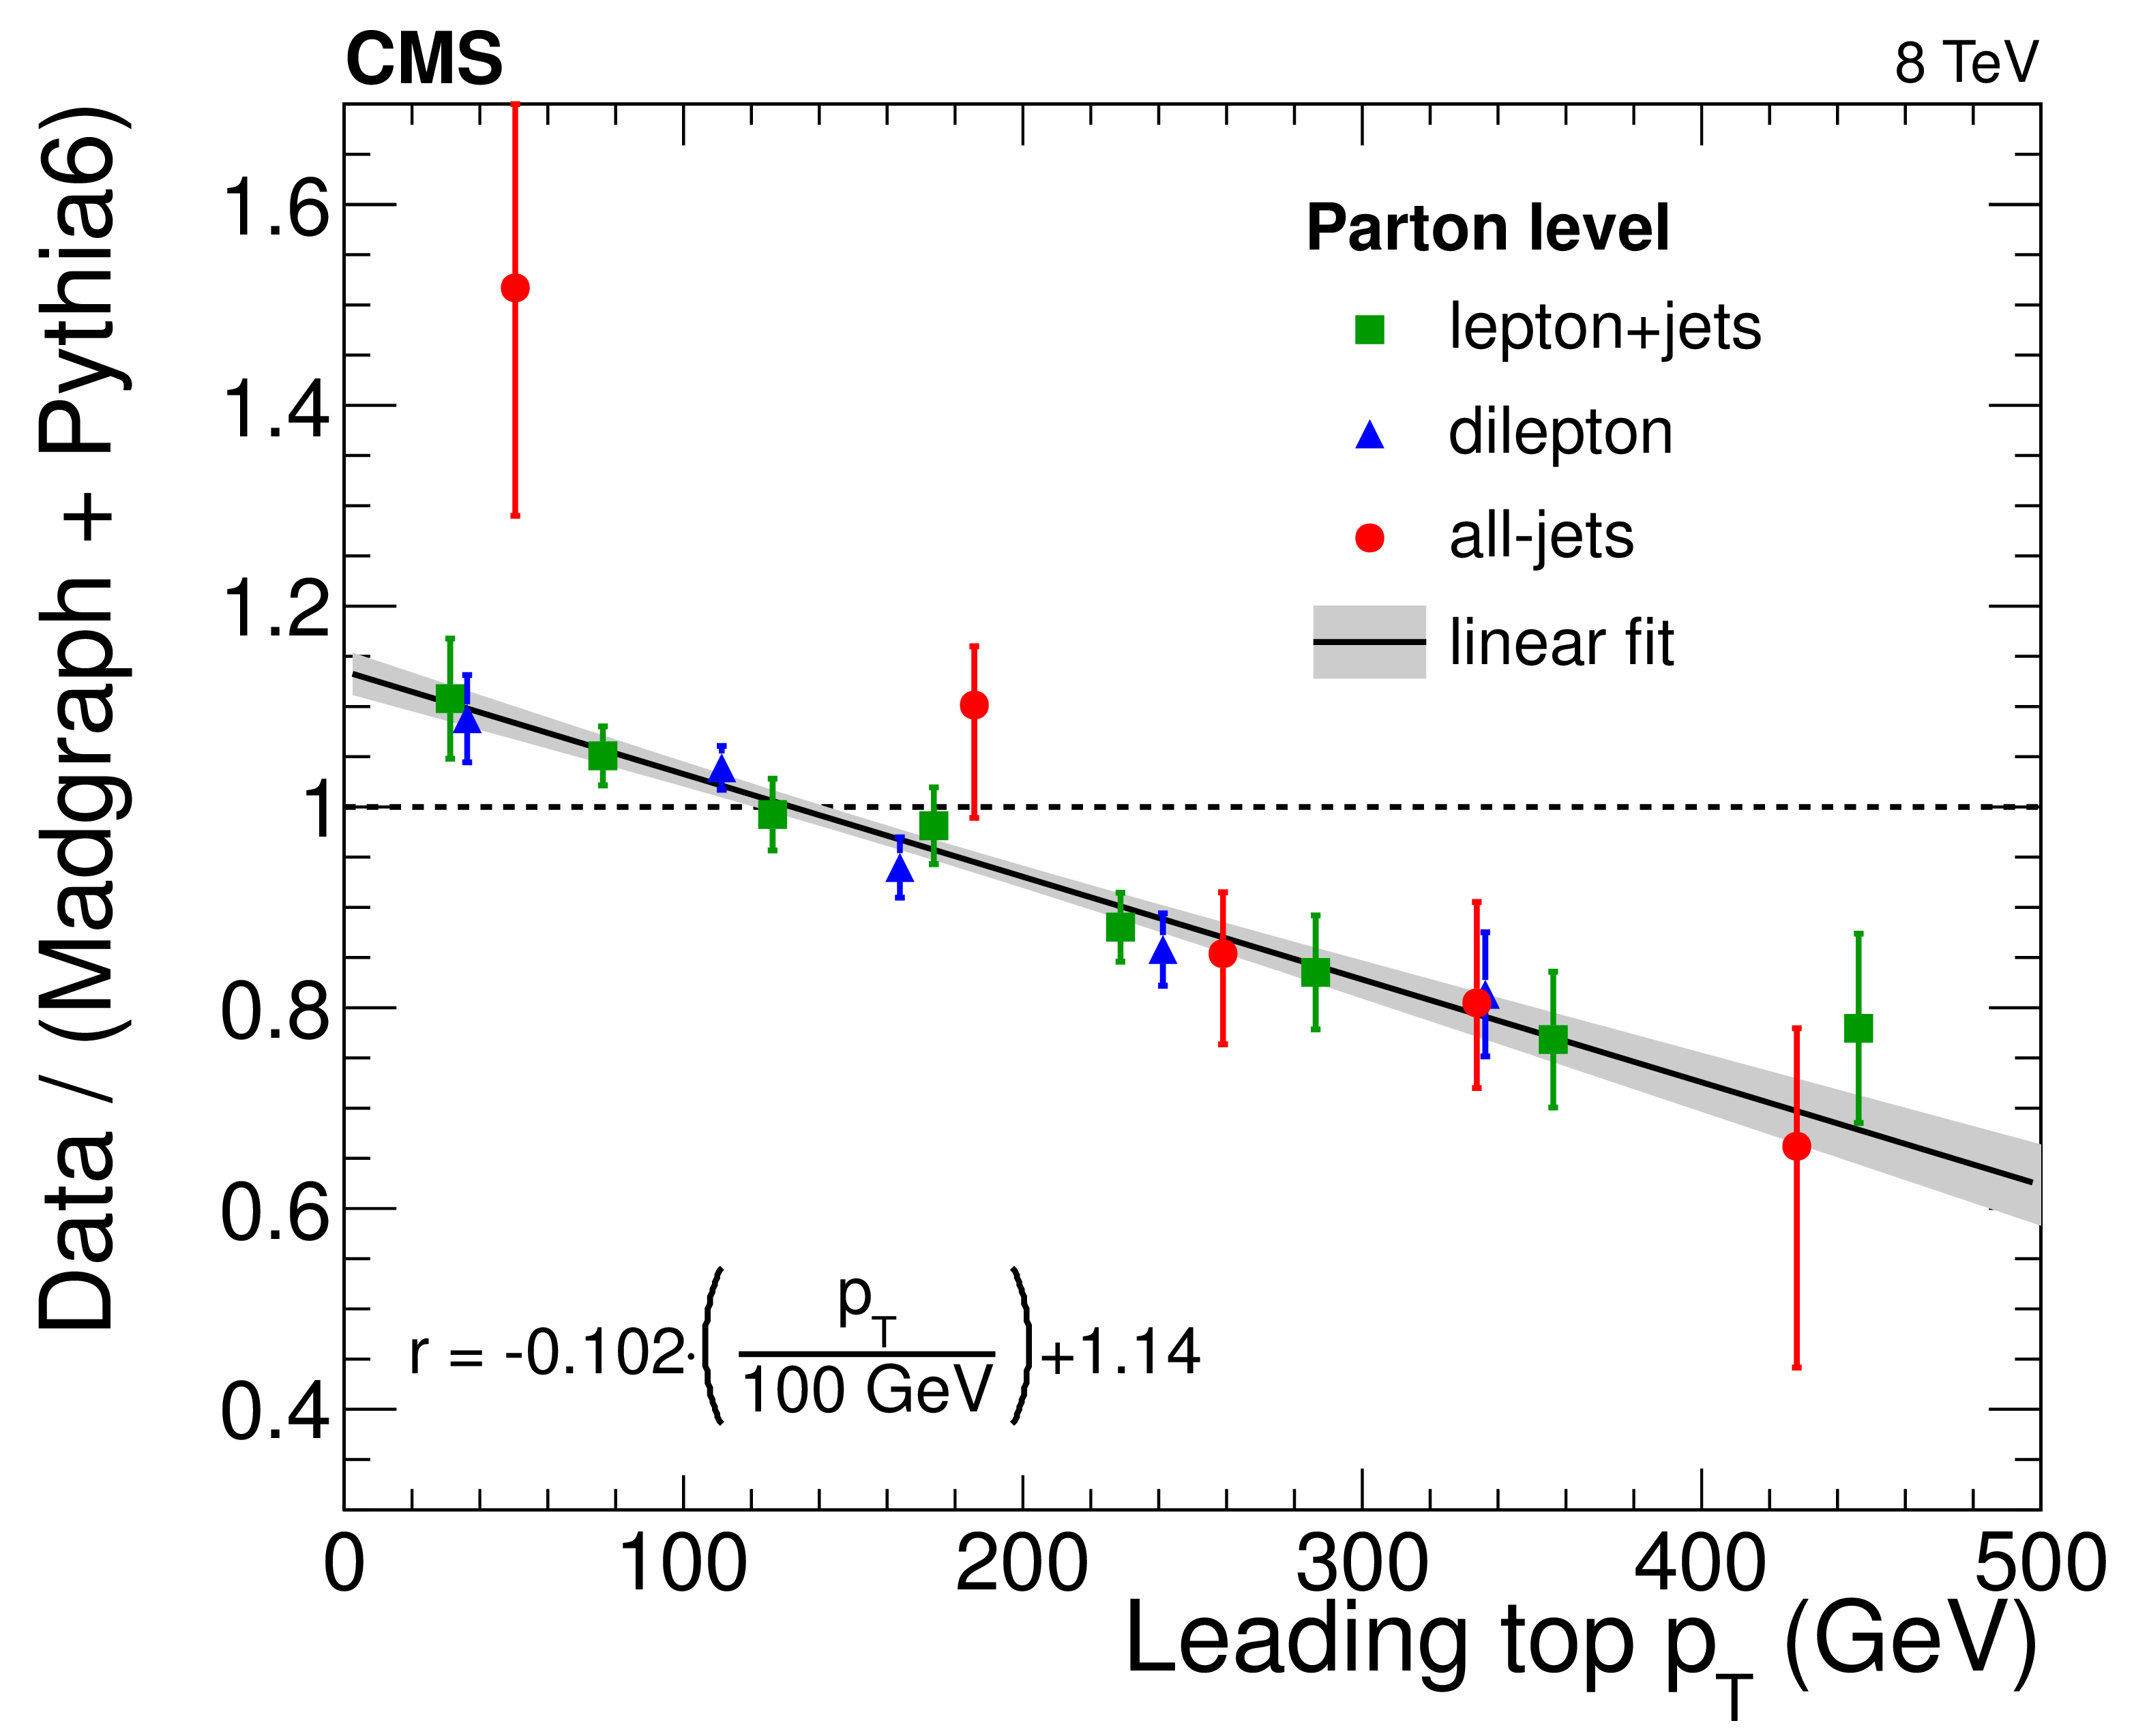
Additional Figure 1:
Ratio of data over theory (Madgraph interfaced with Pythia 6) for the normalized differential cross section of the $\mathrm{ t \bar{t} }$ production at parton level as a function of the leading top $p_{\mathrm{T}}$ in different decay channels. The error bars represent the total uncertainty. The measurements in the leptonic final states are taken from arXiv:1505.04480. |
png pdf |
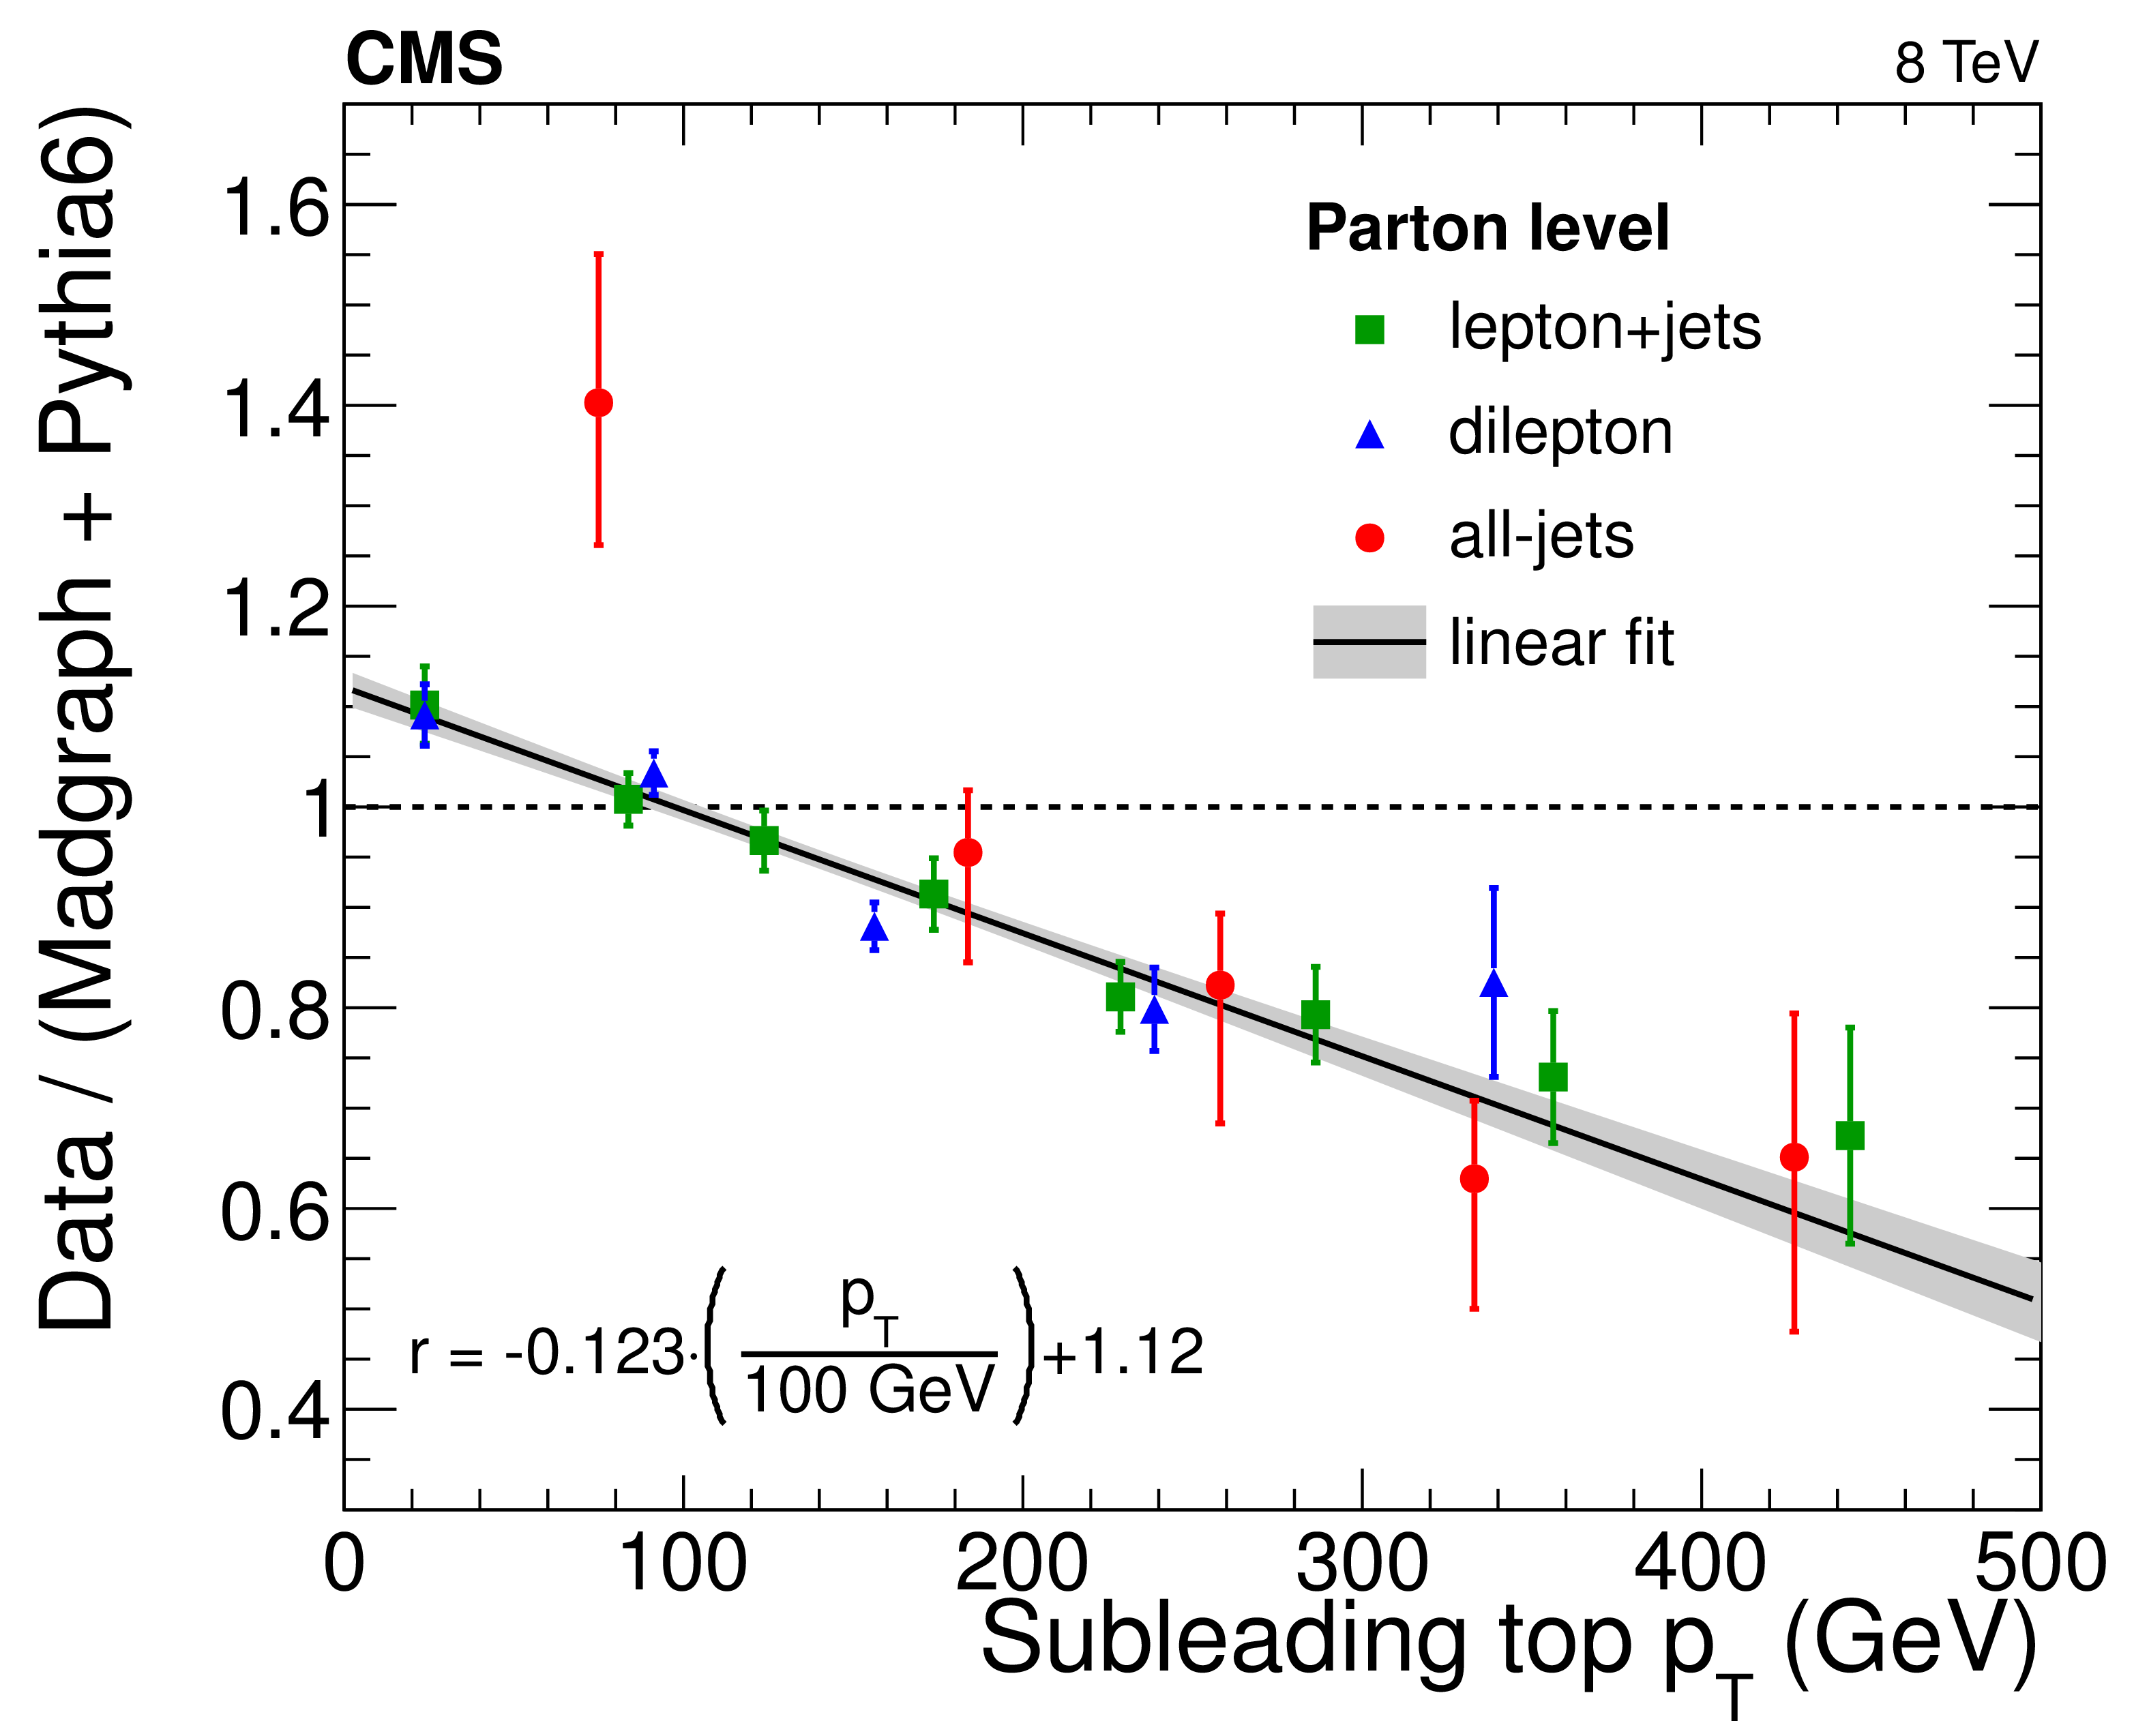
Additional Figure 2:
Ratio of data over theory (Madgraph interfaced with Pythia 6) for the normalized differential cross section of the $\mathrm{ t \bar{t} }$ production at parton level as a function of the subleading top $p_{\mathrm{T}}$ in different decay channels. The error bars represent the total uncertainty. The measurements in the leptonic final states are taken from arXiv:1505.04480. |
|
|
Compact Muon Solenoid LHC, CERN |
|

|

|

|

|

|