Measurement of the ηc(1S) production cross-section in pp collisions at √s=13 TeV
[to restricted-access page]Information
LHCb-PAPER-2019-024
CERN-EP-2019-214
arXiv:1911.03326 [PDF]
(Submitted on 08 Nov 2019)
Eur. Phys. J. C80 (2020) 191
Inspire 1763898
Tools
Abstract
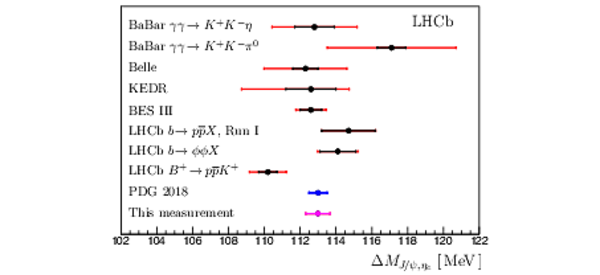
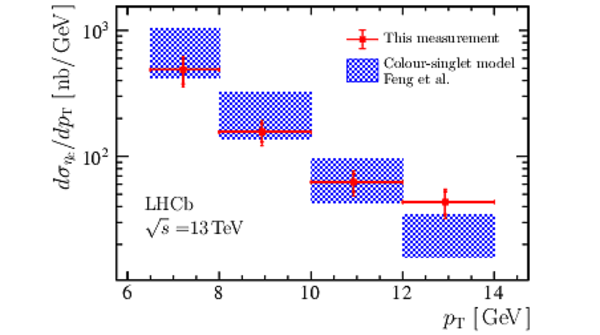
Using a data sample corresponding to an integrated luminosity of 2.0fb−1, collected by the LHCb experiment, the production of the ηc(1S) state in proton-proton collisions at a centre-of-mass energy of √s=13 TeV is studied in the rapidity range 2.0<y<4.5 and in the transverse momentum range 6.5<pT<14.0 GeV. The cross-section for prompt production of ηc(1S) mesons relative to that of the J/ψ meson is measured using the pˉp decay mode and is found to be σηc(1S)/σJ/ψ=1.69±0.15±0.10±0.18. The quoted uncertainties are, in order, statistical, systematic and due to uncertainties on the branching fractions of the J/ψ→pˉp and ηc→pˉp decays. The prompt ηc(1S) production cross-section is determined to be σηc(1S)=1.26±0.11±0.08±0.14μb, where the last uncertainty includes that on the J/ψ meson cross-section. The ratio of the branching fractions of b-hadron decays to the ηc(1S) and J/ψ states is measured to be Bb→ηcX/Bb→J/ψX=0.48±0.03±0.03±0.05, where the last uncertainty is due to those on the branching fractions of the J/ψ→pˉp and ηc→pˉp decays. The difference between the J/ψ and ηc(1S) masses is also determined to be 113.0±0.7±0.1 MeV, which is the most precise single measurement of this quantity to date.
Figures and captions
|
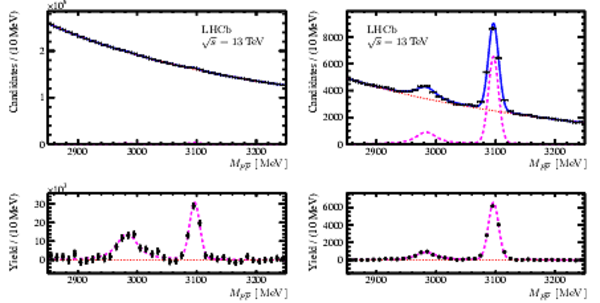
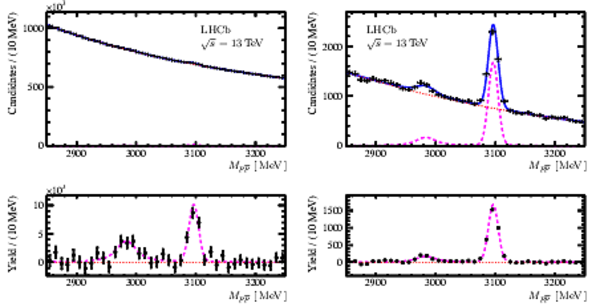
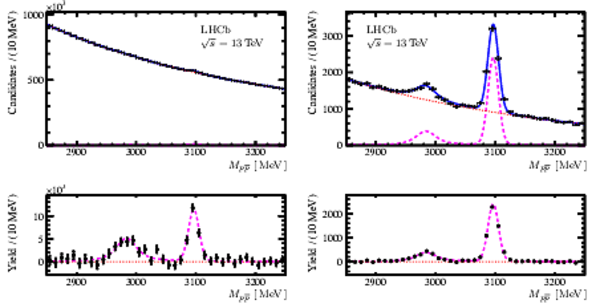
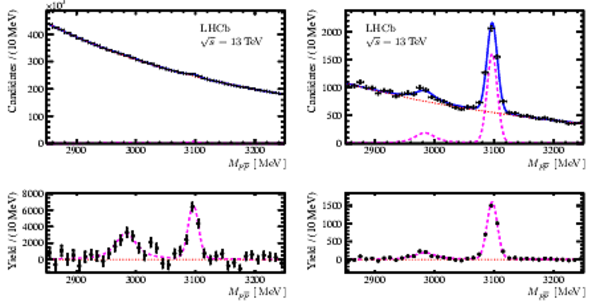
Invariant-mass distribution of the p ¯p candidates for (top left) prompt-enriched and (top right) b -hadron-enriched samples in the entire pT range, 6.5<pT<14.0 Ge V. The solid blue lines represent the total fit result. The dashed magenta and dotted red lines show the signal and background components, respectively. Signal distributions with the background components from the fit subtracted are shown on the bottom plots for the two samples. |
Fig1.pdf [302 KiB] HiDef png [380 KiB] Thumbnail [213 KiB] *.C file |
|
|
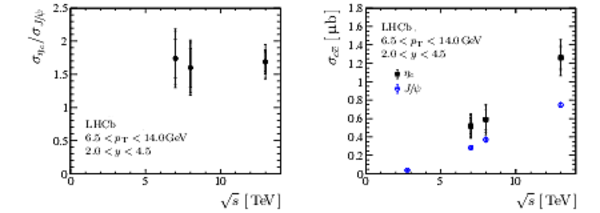
The prompt ηc production cross-section as a function of centre-of-mass energy. (Left) Relative ηc prompt production cross-section. (Right) Absolute ηc (black rectangles) and J/ψ (blue circles) prompt production cross-sections. The error bars show uncertainties due to statistical, systematic, and to the ηc→p¯p and J/ψ→p¯p branching fractions and J/ψ production cross-section. |
Fig2.pdf [318 KiB] HiDef png [167 KiB] Thumbnail [101 KiB] *.C file |
|
|
Relative ηc to J/ψ differential production cross-sections for (left) prompt production and (right) production in b -hadron inclusive decays. The uncertainties are statistical, systematic, and due to the ηc→p¯p and J/ψ→p¯p branching fractions, respectively. For the relative prompt production cross-section, the result of a fit with a linear function is overlaid. |
Fig3.pdf [384 KiB] HiDef png [208 KiB] Thumbnail [122 KiB] *.C file |

|
|
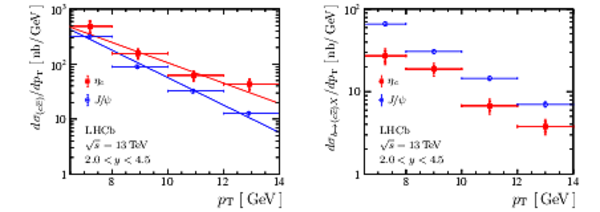
Differential production cross-sections of ηc (red rectangles) and J/ψ (blue circles) for (left) prompt production and (right) production in b -hadron inclusive decays. The uncertainties for ηc production are statistical, systematic, and due to the ηc→p¯p and J/ψ→p¯p branching fractions and J/ψ production cross-section. For the prompt production cross-sections, the results of fits with an exponential function are overlaid. The pT values of the data points correspond to the average values of the fit function over the bins. |
Fig4.pdf [384 KiB] HiDef png [196 KiB] Thumbnail [119 KiB] *.C file |
|
|
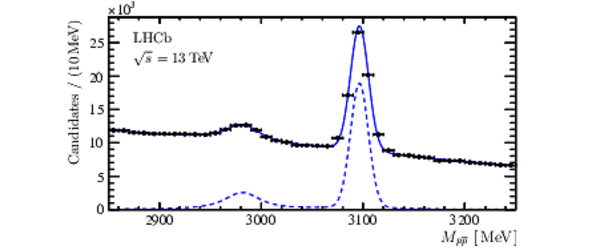
Distribution of the p¯p invariant mass. The solid line represents the fit result, while the dashed line shows the ηc and J/ψ signal contributions. |
Fig5.pdf [332 KiB] HiDef png [180 KiB] Thumbnail [107 KiB] *.C file |
|
|
Invariant mass distributions of the p ¯p candidates for seven bins of tz for the pT -integrated sample 6.5<pT<14.0 Ge V. The solid blue lines represent the total fit result. Dashed magenta and dotted red lines show the signal and background components, respectively. The distributions with the background component of the fit subtracted are shown below. |
Fig6.pdf [553 KiB] HiDef png [1 KiB] Thumbnail [0 KiB] *.C file |

|
|
Distributions of tz for (left) J/ψ and (right) ηc mesons for the entire pT range 6.5<pT<14.0 Ge V and the result of the simultaneous χ2 fit. The solid blue lines show the fit function, the red dashed areas show the prompt components, the green dotted areas show the contributions from inclusive b -hadron decays, the grey lines show contributions from the events with wrongly associated PV. The tz values of the data points correspond to the average values of the fit function over the bins. |
Fig7.pdf [1 MiB] HiDef png [334 KiB] Thumbnail [163 KiB] *.C file |

|
|
Relative ηc to J/ψ differential production cross-sections for (left) prompt production and (right) production in b -hadron inclusive decays obtained using the alternative technique (points) and the baseline technique (red boxes). The uncertainties shown are statistical, systematic, and the uncertainty due to the ηc→p¯p and J/ψ→p¯p branching fractions. |
Fig8.pdf [1 MiB] HiDef png [207 KiB] Thumbnail [135 KiB] *.C file |

|
|
Animated gif made out of all figures. |
PAPER-2019-024.gif Thumbnail |

|
Tables and captions
|
Yield of J/ψ mesons and the ηc -to- J/ψ yield ratio for prompt and b -hadron decay production, corrected for the cross-feed, in bins of transverse momentum. |
Table_1.pdf [116 KiB] HiDef png [66 KiB] Thumbnail [34 KiB] tex code |

|
|
Relative uncertainties (in %) on the ratio of prompt cross-sections σpromptηc/σpromptJ/ψ. Uncertainties on Bηc→p¯p and BJ/ψ→p¯p are considered separately and given in the text. |
Table_2.pdf [110 KiB] HiDef png [84 KiB] Thumbnail [40 KiB] tex code |

|
|
Relative uncertainties (in %) on the ratio of cross-sections for production in inclusive b -hadron decays σbηc/σbJ/ψ. Uncertainties on Bηc→p¯p and BJ/ψ→p¯p are considered separately and given in the text. |
Table_3.pdf [110 KiB] HiDef png [78 KiB] Thumbnail [37 KiB] tex code |

|
|
Systematic uncertainties on the measurement of the J/ψ --ηc mass difference. |
Table_4.pdf [89 KiB] HiDef png [97 KiB] Thumbnail [47 KiB] tex code |

|
|
Relative pT -differential ηc prompt production cross-section. |
Table_5.pdf [106 KiB] HiDef png [62 KiB] Thumbnail [32 KiB] tex code |

|
|
Differential ηc prompt production cross-section. |
Table_6.pdf [112 KiB] HiDef png [63 KiB] Thumbnail [35 KiB] tex code |

|
|
Relative pT -differential ηc production cross-section in inclusive b -hadron decays. |
Table_7.pdf [104 KiB] HiDef png [65 KiB] Thumbnail [33 KiB] tex code |

|
|
The pT -differential ηc production cross-section in inclusive b -hadron decays. |
Table_8.pdf [112 KiB] HiDef png [66 KiB] Thumbnail [37 KiB] tex code |

|
Supplementary Material [file]
| Supplementary material full pdf |
supple[..].pdf [874 KiB] |

|
|
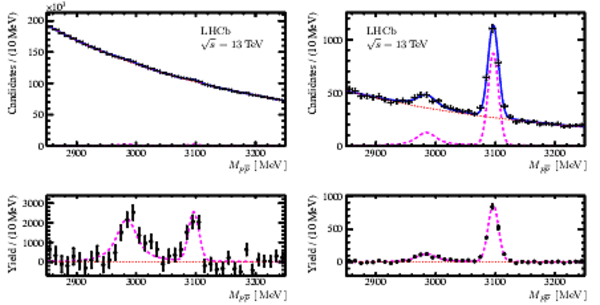
This ZIP file contains supplementary material for the publication LHCb-PAPER-2019-024. The files are: Supplementary.pdf : An overview of the extra figures supplementary.tex : tex-file of supplementary material, needs to be imported to main.tex) *.pdf, *.png, *.eps : The figures in various formats |
Fig1S.pdf [482 KiB] HiDef png [178 KiB] Thumbnail [101 KiB] *C file |
|
|
Fig2S.pdf [391 KiB] HiDef png [379 KiB] Thumbnail [179 KiB] *C file |
|
|
|
Fig3S.pdf [372 KiB] HiDef png [385 KiB] Thumbnail [191 KiB] *C file |
|
|
|
Fig4S.pdf [347 KiB] HiDef png [385 KiB] Thumbnail [183 KiB] *C file |
|
|
|
Fig5S.pdf [347 KiB] HiDef png [413 KiB] Thumbnail [222 KiB] *C file |
|
|
|
Fig6S.pdf [284 KiB] HiDef png [404 KiB] Thumbnail [203 KiB] *C file |
|
Created on 04 April 2025.
