
NonCollisionBackgroundPublicResults
Introduction
This page shows public results (publications and plots) from the Non-Collision Background groupPublic Plots Approved in Spring of 2017
| ATLAS BCM background rate in 2015 The plot shows the rate of LHC beam-induced background reaching ATLAS, as measured with the Beam Conditions Monitor during the proton-proton run in 2015. Each point represents the rate of BCM triggers at the start of an ATLAS run, averaged over the first ten minutes of stable beams. The BCM trigger rates are before prescale and are normalized by the 600s duration of the luminosity blocks used, and by the sum of bunch intensities in unpaired isolated bunches in each beam. A systematically higher rate of Beam 1 than Beam 2 is observed in 2015 data and is consistent with previous studies. |
 eps file |
| ATLAS BCM background rate in 2016 The plot shows the rate of LHC beam-induced background reaching ATLAS, as measured with the Beam Conditions Monitor during the proton-proton run in 2016. Each point represents the rate of BCM triggers at the start of an ATLAS run, averaged over the first ten minutes of stable beams. The BCM trigger rates are before prescale and are normalized by the 600s duration of the luminosity blocks used, and by the sum of bunch intensities in unpaired isolated bunches in each beam. A systematically higher rate of Beam 1 than Beam 2 is observed in 2016 data and is consistent with previous studies. An increased Beam 1 background due to the pressure bump test on 25/9/16 is apparent in subsequent LHC Fills 5332, 5337, 5338, 5339, and is thought to be due to slow out-gassing of the beam screen in the triplet. |
 eps file |
| ATLAS Background rate evolution during an entire fill The plot shows the rate of LHC beam-induced background reaching ATLAS, as measured with the Beam Conditions Monitor during LHC proton Fill 5111 in 2016. Fill 5111 is selected by the LHC Beam Background Study group as a typical example, for comparison with background rates in the other LHC experiments for the IPAC conference. Each point represents the rate of BCM triggers in one ATLAS luminosity block. The BCM trigger rates are before prescale and are normalized by the duration of the luminosity block, and by the sum of bunch intensities in unpaired isolated bunches in each beam. The vertical line indicates the start of STABLE BEAMS. A systematically higher rate of Beam 1 than Beam 2 is observed in 2016 data and is consistent with previous studies. An increase in rate is observed during the LHC beam energy ramp, prior to stable beams, then falls off with the beam intensity over the duration of the fill, because the background rate is dominated by residual beam-gas interactions. |
 eps file |
Results for ICHEP 2016
| Rate of on-track pixel clusters in 2016 The plots show the rate of on-track pixel clusters versus the azimuthal coordinate of the pixel cluster in all unpaired isolated bunches (upper plots for unpaired isolated beam1, lower plots for unpaired isolated beam 2), during the different pressure bumps at 150 m, 58 m, 19 m from ATLAS run 298771 (LHC Fill 4905). Beam1 indicates the beam circulating clockwise, and phi=0 points to the centre of LHC. The distributions are normalized by the duration of the luminosity block slice, indicated in the right hand side table. All triggers are used in the physics_Background stream. The main phi variation indicates the influence of accelerator optics on the background reaching ATLAS. Background originating at 19 m does not cross any LHC magnetic element, and therefore a uniform distribution is expected. The fine structure is due to geometrical effects of module overlaps and ganged pixels. The small dips are due to inoperable pixel modules in some layers. |
 eps file |
| Radial coordinate of CSC muon segments The plot shows the radial coordinate of CSC muon segments for LHC Fill 4905 (Atlas run 298771) in luminosity block intervals corresponding to the different increase of local pressure at 150 m, 58 m, 19 m from the interaction point and also for standard running (no bump). The distributions are normalized by the duration of the luminosity block slice, indicated in the right hand side table. Events without any primary vertex in unpaired bunches are selected. A cut on the difference between the polar position and the polar direction of the muon segment is applied in order to select segments produced by background muons travelling parallel to the beam axis. |
 pdf file |
| Spatial distributions of CSC muon segments Spatial distributions of CSC muon segments during LHC fill n. 4905 (Atlas run n. 298771) in the luminosity block intervals corresponding to the local increase of the beam pipe pressure at 150 m (top right), 58 m (bottom left), 19 m (bottom right). The top left plot corresponds to standard operating values of the pressure. Events without any primary vertex in unpaired isolated (> 175ns) bunches are selected. A cut on the difference between the polar position and the polar direction of the muon segment is applied. The distributions are normalized by the duration of the luminosity block intervals. |
 pdf file |
| Space distributions of CSC muon segments Space distributions of CSC muon segments during LHC fill n. 4905 (Atlas run n. 298771) when the beam pipe pressure was increased at 150 m from the interaction point. Unpaired bunches from beam 1 (left column) and beam 2 (right column) are selected. Upper row plots show the distributions of muon segments from CSC End Cap C, while the bottom row shows the distributions for CSC End Cap A. Events without any primary vertex are selected and a cut on the difference between the polar position and the polar direction of the muon segment is applied. The distributions are normalized by the duration of the luminosity block interval when the pressure was stable. |
 pdf file |
| Distribution of the time of the leading calorimeter clusters vs. pseudorapidity Distribution of the time of the leading calorimeter clusters vs. pseudorapidity in runs taken from May 12 to June 2nd in events from unpaired isolated bunches, without any primary vertex and passing a trigger requiring a jet with pT> 12 GeV in unpaired isolated bunches. The cut on the leading cluster pT is 20 GeV. Event cleaning is applied by removing the events with at least one jet failing the loose jet cleaning cuts for EM coherent noise and HEC spikes. The distributions for each run are normalized by the duration of the run in seconds, and the plot represents the average over all the runs. |
 pdf file |
| Eta versus time distribution of leading calorimeter clusters Eta versus time distribution of leading calorimeter clusters in runs from May 12 to June 2nd, in events from unpaired bunches in beam 1, without any primary vertex and passing a trigger a trigger requiring a jet with pT> 12 GeV in unpaired isolated bunches. The cut on the leading cluster pT is 20 GeV. Event cleaning is applied by removing the events with at least one jet failing the loose jet cleaning cuts for EM coherent noise and HEC spikes. The distributions for each run are normalized by the duration of the run in seconds, and the plot represents the average over all the runs. |
 pdf file |
| Eta versus time distribution of leading calorimeter clusters, beam 2 Eta versus time distribution of leading calorimeter clusters in runs from May 12 to June 2nd, in events from unpaired bunches in beam 2, without any primary vertex and passing a trigger requiring a jet with pT> 12 GeV in unpaired isolated bunches. The cut on the leading cluster pT is 20 GeV. Event cleaning is applied by removing the events with at least one jet failing the loose jet cleaning cuts for EM coherent noise and HEC spikes. The distributions for each run are normalized by the duration of the run in seconds, and the plot represents the average over all the runs. |
 pdf file |
| Distribution in space of the CSC muon segments Distribution in space of the CSC muon segments in ATLAS runs from May 12 to June 2nd , in events from unpaired bunches, without any primary vertex. A cut on the difference between the polar position and the polar direction of the muon segment is applied. The distributions for each run are normalized by the duration of the run in seconds, and the plot represents the average over all the runs. |
 pdf file |
| Distribution in space of the CSC muon segments Distribution in space of the CSC muon segments in runs from May 12 to June 2nd , in events from unpaired bunches, without any primary vertex and passing a trigger requiring a jet with pT > 12 GeV in unpaired isolated bunches. A cut on the difference between the polar position and the polar direction of the muon segment is applied. The distributions for each run are normalized by the duration of the run in seconds, and the plot represents the average over all the runs. |
 pdf file |
| Distribution in the transverse plane of the CSC muon segments Distribution in the transverse plane of the CSC muon segments in EndCap C, in runs from May 12 to June 2nd in events from unpaired bunches in beam 1, without any primary vertex and passing a trigger requiring a jet with pT> 12 GeV in unpaired isolated bunches. A cut on the difference between the polar position and the polar direction of the muon segment is applied. The distributions for each run are normalized by the duration of the run in seconds, and the plot represents the average over all the runs. |
 pdf file |
| Distribution in the plane transverse to the beam pipe of CSC muon segments Distribution in the plane transverse to the beam pipe of the CSC muon segments in EndCap A, in runs from May 13 to June 2nd, in events from unpaired bunches in beam 1, without any primary vertex and passing a trigger requiring a jet with pT> 12 GeV in unpaired isolated bunches. A cut on the difference between the polar position and the polar direction of the muon segment is applied. The distributions for each run are normalized by the duration of the run in seconds, and the plot represents the average over all the runs. |
 pdf file |
| Distribution of the CSC muon segments in the transverse plane for EndCap C Distribution of the CSC muon segments in the transverse plane for EndCap C, from May 13 to June 2nd 2016, in events from unpaired bunches in beam 2, without any primary vertex and passing a trigger requiring a jet with pT> 12 GeV in unpaired isolated bunches. A cut on the difference between the polar position and the polar direction of the muon segment is applied. The distributions for each run are normalized by the duration of the run in seconds, and the plot represents the average over all the runs. |
 pdf file |
| Distribution of the CSC muon segments in the transverse plane for EndCap A Distribution of the CSC muon segments in the transverse plane for EndCap A in runs from May 13 to June 2, in events from unpaired bunches in beam 2, without any primary vertex and passing a trigger requiring a jet with pT> 12 GeV in unpaired isolated bunches. A cut on the difference between the polar position and the polar direction of the muon segment is applied. The distributions for each run are normalized by the duration of the run in seconds, and the plot represents the average over all the runs. |
 pdf file |
Results from Run 1
Below are the public results from the Non-Colliding Backgrounds group in Run 1.Publications and Conference Results
2011 Non Collision Background paper
- Characterisation and mitigation of beam-induced backgrounds observed in the ATLAS detector during the 2011 proton-proton run
 Documents the 2011 non collision background studies
2010 Non Collision Background conference note
2012 data preliminary plots
25ns vs 50ns bunch spacing comparison
The following plots show comparisons of beam backgrounds in standard 50 ns runs of 2012 and of the short 25 ns run at the very end of 2012. For the 50 ns runs we only use data before Technical Stop 3 (TS3, starting 17. September), because conditions early in the year were better comparable to those during the 25 ns run. In particular we observed a significant - unexplained - rise of ghost charge after TS3, while ghost charge interactions were largely absent due to the better isolation of unpaired bunches in the 25 ns run. Also, some instrumental noise in the BCM detector disturbed the data late in 2012, but was absent during the 25 ns run and in all runs prior to TS3. In normal 50 ns running the bunch pattern included three unpaired isolated and three non-isolated bunches per beam. For the 25 ns beam 12 isolated bunches per beam are used for these plots. The requirement for a bunch to be isolated is that there is no bunch in the other beam within 150 ns. In all following plots, the lower x-axis labels indicate the BCIDs in the 50 ns run, while the upper labels give those in the 25 ns run.| Beam background rate from BCM Beam background rate measured by the L1 BCM AC CA UNPAIRED ISO trigger. This trigger selects events with an early signal on one side and an in-time signal on the other, characteristic of beam background tracks. Standard runs with 50 ns bunch spacing and 1368 colliding bunches taken before TS3 are compared to a run with 25 ns bunch spacing that was taken during fill 3453. The fills with 1368 colliding bunches had a short train at the beginning containing 3 unpaired isolated bunches in each beam. Two trains with unpaired bunches only are shown from the bunch pattern in fill 3453. Entries are normalised by the bunch intensity. Only events from luminosity blocks passing general quality requirements are considered. |
 eps file |
| Ghost charge interaction rate Ghost charge interaction rate measured by the L1 BCM Wide UNPAIRED ISO and L1 BCM Wide UNPAIRED NONISO trigger. These triggers select events with an in-time coincidence on both sides, characteristic of collision an the interaction point. Ghost charge is due to a part of the LHC beam having spread into nominally empty BCIDs such that they can produce collisions with unpaired bunches in the other beam. Standard runs with 50 ns bunch spacing and 1368 colliding bunches taken before TS3 are compared to a run with 25 ns bunch spacing that was taken during fill 3453. The fills with 1368 colliding bunches had a short train at the beginning consisting of 6 unpaired bunches for each beam. Two trains with unpaired bunches only are shown from the bunch pattern in fill 3453. The rate of ghost charge interactions rises with decreasing bunch isolation (in the 25 ns run all bunches are well isolated). Entries are normalised by the bunch intensity. Only events from luminosity blocks passing general quality requirements are considered. |
 eps file |
BCM Background rates
| BCM Background rate per run Rate of BCM background-like Level 1 triggers in unpaired isolated bunches throughout 2012 in Stable Beams periods. Unpaired isolated bunches are required to have no bunch in the other beam within 150 ns. Each dot represents the average rate over an ATLAS run. Since the background is dominated by loss-processes which are proportional to beam intensity, the rates have been normalized to an intensity of 1011 protons in order to remove the effect of intensity variations. At the start of an LHC fill on 1st November unusually high backgrounds were observed, and the corresponding ATLAS run is seen as an outlier in this plot. |
 eps file |
| BCM Background rate per Luminosity Block Rate of BCM background-like Level 1 triggers in unpaired isolated bunches throughout 2012 in Stable Beams periods. Unpaired isolated bunches are required to have no bunch in the other beam within 150 ns. Each dot represents the average rate over one ATLAS luminosity block, corresponding to typically 60 seconds of data-taking. Since the background is dominated by loss-processes which are proportional to beam intensity, the rates have been normalized to an intensity of 1011 protons in order to remove the effect of intensity variations. At the start of an LHC fill on 1st November unusually high backgrounds were observed. This background came back to normal level within a hour. In the plot this background decay is seen as a vertical string of points above the normal level. |
 eps file |
2011 data preliminary plots
BCM Halo trigger rates
| BCM Halo rate vs LHC Fill Beam-induced background rates as measured by Beam Condition Monitor (BCM). The trigger rate is obtained from the L1_BCM_AC_CA trigger in Unpaired Isolated bunches (no proton bunches in the other beam within 75 ns). The trigger rate for the 2011 data-taking period in is normalised to 10^11 protons. |
 eps file |
| BCM Halo rate during a single LHC Fill The BCM_AC_CA halo signal is formed by a coincidence of an early hit on one side of the interaction point and and in-time hit on the other side. The time windows for accepting a hit are 5.5 ns wide and centered around the expected incoming/outgoing time. The Figure shows the BCM_AC_CA Halo rate during the start of an LHC fill for unpaired isolated bunches (no bunch in the other beam within 75 ns). Also shown are the beam energy and the residual pressures in the vacuum pipe at z = 58 m and z = 22 m from the interaction point. The important phases: Injection (intensity increase), Ramp (energy increase), Adjust (bringing beams into collision) and Stable Beams (colliding) are indicated on top of the plot. The pressure at 58 m correlates with the intensity increase, while that at 22 m rises during the energy ramp. The plot shows that the background measured by the BCM halo monitor is mostly determined by the pressure at 22 m. The zero-point of the time axis is set to the start of ATLAS data-taking in this LHC fill. |
 eps file |
Beam Background Rejection
| Delta theta in CSC Difference between the reconstructed theta direction and the theta position for the muon segments in CSC. Data from unpaired (non-colliding) bunches (points) are cleaned from noise and parasitic collisions by requiring no primary vertex. There is an additional requirement of at least one jet in order to assure a calorimeter activity. In this way, an almost pure sample of beam induced background is prepared. Beam background events are compared to the physics collision events with muon triggers (filled histogram) where also at least one jet is required. Beam background data are characterised by a muon traversing the detector in a direction parallel to the beam pipe. Therefore, the expected value is ~ 11 degrees, for the CSC detector. For muons coming from collisions, we expect delta theta ~ 0. The tail for collision data may come from resolution, magnetic field or cavern background. |
 eps file |
| Delta theta in the inner MDT end-cap Difference between the reconstructed theta direction and the theta position for the muon segments in the inner MDT end-cap. Data from unpaired (non-colliding) bunches (points) are cleaned from noise and parasitic collisions by requiring no primary vertex. There is an additional requirement of at least one jet in order to assure a calorimeter activity. In this way, an almost pure sample of beam induced background is prepared. Beam background events are compared to the physics collision events with muon triggers (filled histogram) where also at least one jet is required. Beam background data are characterised by a muon traversing the detector in a direction parallel to the beam pipe. Therefore, the expected value is > 14 degrees, for the inner MDT end-cap. For muons coming from collisions, we expect delta theta ~ 0. The tail for collision data may come from resolution, magnetic field or cavern background. |
 eps file |
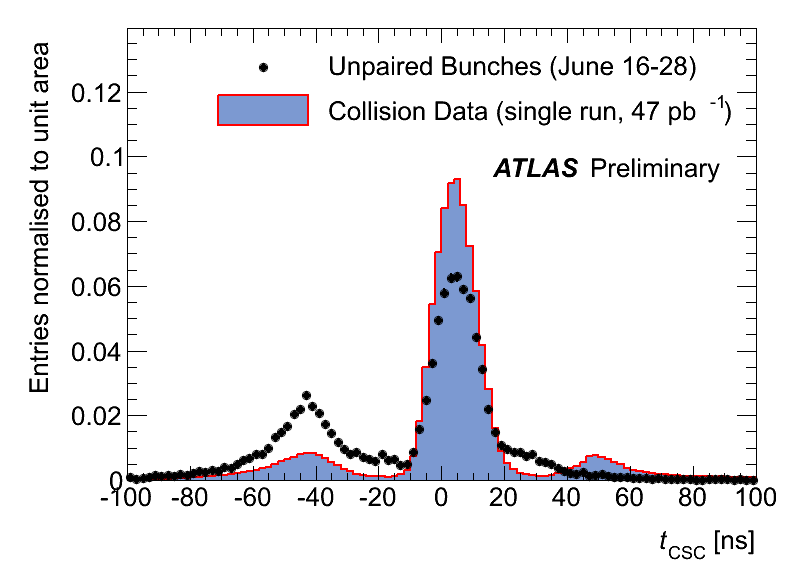
| CSC time Reconstructed time of the CSC muon segments in the beam background data. A cut on the difference between the reconstructed position and the reconstructed direction > 5 degrees is applied in order to select muon candidates going in a direction parallel to the beam-pipe. Data from unpaired (non-colliding) bunches (points) are cleaned from noise and parasitic collisions by requiring no primary vertex. There is an additional requirement of at least one jet in order to assure a calorimeter activity. In this way, an almost pure sample of beam induced background is prepared. Beam background events are compared to the physics collision events with muon triggers (filled histogram) where also at least one jet is required. In the beam background events, one expects in-time muon segments (peak at 0 ns) for the beam halo muons leaving the detector. If the muon leaves a segment on the way into the detector, the expected time is ~ 50 ns (twice the time-of-flight between the interaction point and the CSC position). In the collision events, we always expect in-time muon segments. The peaks at +-50 ns correspond to the out-of-time pile-up (50 ns bunch spacing). |
 eps file |
| CSC time difference between side A and C Time difference of the muon segments on side A and C that are matched to a calorimeter cluster. A cut on the difference between the reconstructed position and the reconstructed direction is applied in order to select muon candidates going in a direction parallel to the beam-pipe. Data from unpaired (non-colliding) bunches (points) are cleaned from noise and parasitic collisions by requiring no primary vertex. There is an additional requirement of at least one jet in order to assure a calorimeter activity. In this way, an almost pure sample of beam induced background is prepared. The muon segments are matched to a calorimeter cluster by comparing their phi and R position. The idea is to select events where a halo muon leaves hits in the muon chambers on both sides and also deposits energy in the calorimeter. |
 eps file |
| Position of the CSC segments Position of the muon segments in the beam background events. A cut on the difference between the reconstructed position and the reconstructed direction is applied in order to select muon candidates going in a direction parallel to the beam-pipe. Data from unpaired (non-colliding) bunches (points) are cleaned from noise and parasitic collisions by requiring no primary vertex. There is an additional requirement of at least one jet in order to assure a calorimeter activity. In this way, an almost pure sample of beam induced background is prepared. The arrow indicates the direction towards the centre of the LHC ring (positive x-axis). Units correspond to the number of entries per bin. |
 eps file |
| LAr cluster time as a function of z position Cluster time plotted as a function of z position in the LAr calorimeter. Data from unpaired (non-colliding) bunches are cleaned from noise and parasitic collisions by requiring no primary vertex. There is an additional requirement of at least one jet in order to assure a calorimeter activity. In this way, an almost pure sample of beam induced background is prepared. Furthermore, beam halo muon candidates are selected by demanding a segment in CSC or the inner MDT end-cap with a direction parallel to the beam-pipe. Only the clusters with E > 10 GeV that are matched in phi and R to such muon segments are plotted. The two bands show the expected time for the clusters in 1 < R < 2 m coming from beam halo muons going in the AC or CA direction. Units correspond to the number of entries per bin. |
 eps file |
| Tile cluster time as a function of z position Cluster time plotted as a function of z position in the Tile calorimeter. Data from unpaired (non-colliding) bunches are cleaned from noise and parasitic collisions by requiring no primary vertex. There is an additional requirement of at least one jet in order to assure a calorimeter activity. In this way, an almost pure sample of beam induced background is prepared. Furthermore, beam halo muon candidates are selected by demanding a segment in CSC or the inner MDT end-cap with a direction parallel to the beam-pipe. Only the clusters with E > 10 GeV that are matched in phi and R to such muon segments are plotted. The two bands show the expected time for the clusters in 2 < R < 4.25 m coming from beam halo muons going in the AC or CA direction. Units correspond to the number of entries per bin. |
 eps file |
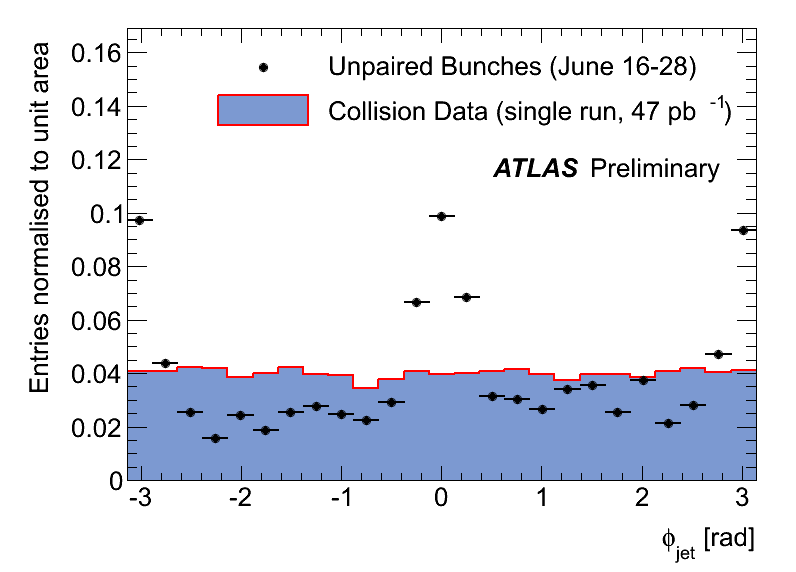
| Leading jet phi Phi of the leading jet in the beam background events (points) and physics collision data (filled histogram). Data from unpaired (non-colliding) bunches are cleaned from noise and parasitic collisions by requiring no primary vertex. There is an additional requirement of at least one jet in order to assure a calorimeter activity. In this way, an almost pure sample of beam induced background is prepared. Beam background events are compared to the physics collision events with muon triggers where also at least one jet is required. |
 eps file |
| Leading jet time Time of the leading jet in the beam background events (points) and physics collision data (filled histogram). Data from unpaired (non-colliding) bunches are cleaned from noise and parasitic collisions by requiring no primary vertex. There is an additional requirement of at least one jet in order to assure a calorimeter activity. In this way, an almost pure sample of beam induced background is prepared. Beam background events are compared to the physics collision events with muon triggers where also at least one jet is required. |
 eps file |
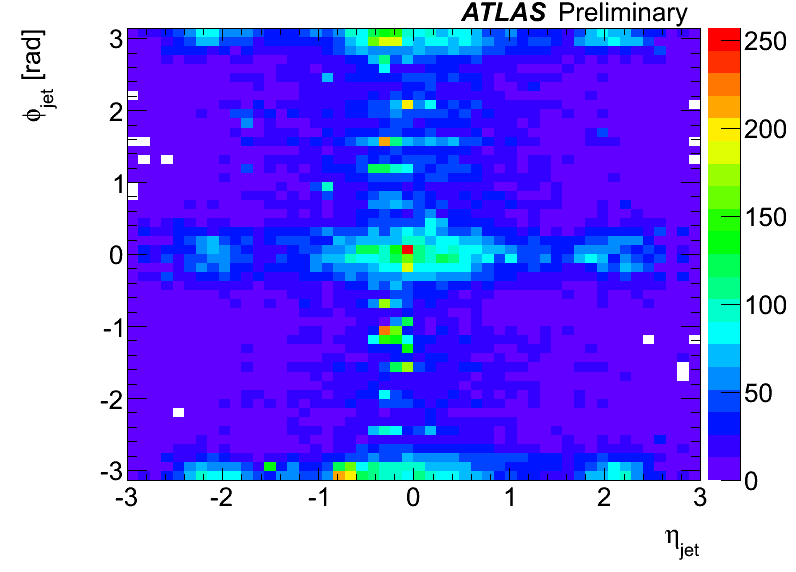
| Leading jet in the eta-phi plane Leading jets in the eta-phi plane in the beam background data. Data from unpaired (non-colliding) bunches are cleaned from noise and parasitic collisions by requiring no primary vertex. There is an additional requirement of at least one jet in order to assure a calorimeter activity. In this way, an almost pure sample of beam induced background is prepared. Units correspond to the number of entries per bin. |
 eps file |
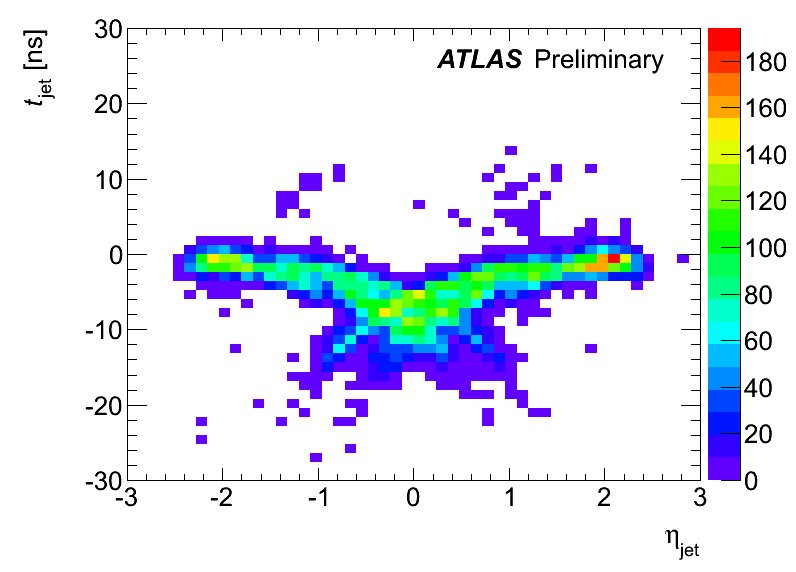
| Time of the leading jet as a function of eta Time of the leading jet as a function of eta in the beam background data. Only the events identified by the One-sided loose method are shown. This method requires a muon segment in CSC or the inner MTD end-cap with a direction parallel to the beam-pipe. This segment has to be matched in phi and R to a calorimeter cluster with E > 10 GeV and time corresponding to a particle going in the AC or CA direction. The direction is reconstructed from the muon segment time and position measurement. Units correspond to the number of entries per bin. |
 eps file |
Major updates:
Responsible: LucaFiorini


| I | Attachment | History | Action | Size | Date | Who | Comment |
|---|---|---|---|---|---|---|---|
| |
BcmSpecificRatePaper_2011.eps | r1 | manage | 14.2 K | 2011-11-01 - 17:06 | LucaFiorini | 2011 plot with UISO only by Fill eps |
| |
BcmSpecificRatePaper_2011.png | r1 | manage | 40.1 K | 2011-11-01 - 17:05 | LucaFiorini | 2011 plot with UISO only by Fill |
| |
bb_jet1EtaPhi.eps | r1 | manage | 66.1 K | 2011-11-02 - 16:21 | DavidSalek | |
| |
bb_jet1EtaPhi.png | r1 | manage | 14.7 K | 2011-11-02 - 16:18 | DavidSalek | |
| |
bb_jet1EtaTime.eps | r1 | manage | 21.0 K | 2011-11-02 - 16:20 | DavidSalek | |
| |
bb_jet1EtaTime.png | r1 | manage | 14.4 K | 2011-11-02 - 16:19 | DavidSalek | |
| |
bb_jet1Phi.eps | r1 | manage | 10.5 K | 2011-11-02 - 16:20 | DavidSalek | |
| |
bb_jet1Phi.png | r1 | manage | 20.2 K | 2011-11-02 - 16:19 | DavidSalek | |
| |
bb_jet1Time.eps | r1 | manage | 10.9 K | 2011-11-02 - 16:20 | DavidSalek | |
| |
bb_jet1Time.png | r1 | manage | 20.6 K | 2011-11-02 - 16:19 | DavidSalek | |
| |
bb_thetaCSC.eps | r1 | manage | 14.8 K | 2011-11-02 - 16:21 | DavidSalek | |
| |
bb_thetaCSC.png | r1 | manage | 28.1 K | 2011-11-02 - 14:08 | DavidSalek | |
| |
bb_thetaMDT.eps | r1 | manage | 15.6 K | 2011-11-02 - 16:22 | DavidSalek | |
| |
bb_thetaMDT.png | r1 | manage | 28.4 K | 2011-11-02 - 16:19 | DavidSalek | |
| |
bb_timeCSC.eps | r1 | manage | 13.0 K | 2011-11-02 - 16:23 | DavidSalek | |
| |
bb_timeCSC.png | r1 | manage | 27.1 K | 2011-11-02 - 14:16 | DavidSalek | |
| |
bb_timeDiffAC.eps | r1 | manage | 11.9 K | 2011-11-02 - 16:22 | DavidSalek | |
| |
bb_timeDiffAC.png | r1 | manage | 17.6 K | 2011-11-02 - 16:17 | DavidSalek | |
| |
bb_xySeg.eps | r1 | manage | 154.7 K | 2011-11-02 - 16:22 | DavidSalek | |
| |
bb_xySeg.png | r1 | manage | 21.5 K | 2011-11-02 - 16:17 | DavidSalek | |
| |
bb_ztLar.eps | r1 | manage | 30.0 K | 2011-11-02 - 16:22 | DavidSalek | |
| |
bb_ztLar.png | r1 | manage | 21.2 K | 2011-11-02 - 16:18 | DavidSalek | |
| |
bb_ztTile.eps | r1 | manage | 30.4 K | 2011-11-02 - 16:22 | DavidSalek | |
| |
bb_ztTile.png | r1 | manage | 22.4 K | 2011-11-02 - 16:18 | DavidSalek | |
| |
beamhalo.eps | r1 | manage | 14.0 K | 2011-11-02 - 17:33 | MikaHuhtinen | |
| |
beamhalo.png | r1 | manage | 41.9 K | 2011-11-02 - 17:33 | MikaHuhtinen |
Topic revision: r13 - 2017-10-02 - MikaHuhtinen
 |
|
|
or Ideas, requests, problems regarding TWiki? use Discourse or Send feedback