We have to start somewhere... ideas for useful figures can be sketched below, or included as attachments (whichever is easier).
Everything on this page is preliminary, incomplete and for sole use by those participating in the testbeam at ATF
- Introduction
- Description of Apparatus
- Vessel/target in frame (click on figure to edit),
")
- Description of beamline and typical conditions,

- Vessel/target in frame (click on figure to edit),
- Predictions for Damage Summary of what is in the models, assumptions/limitations
- Energy deposition (from FLUKA and from dE/dx estimate) and figure,
")
- Resulting macroscopic heating (from ANSYS and "back of the envelope" estimate)
- For various (sig_x, sig_y), charge (single bunch impacts)
- Also consider 3 bunch "mini-train" mode, separated by 150ns
- Compare also with previous works
- Marc Ross et al
- V. Rotshtein et al, poster procs., URL: http://www.congress-2006.hcei.tsc.ru/cat/proc_2006/cmm/Paper-088.pdf

- Energy deposition (from FLUKA and from dE/dx estimate) and figure,
- Experimental procedure
- Include comparison of "single pulse" vs. "continuous operation" data taking
- Data Analysis
- Interferometer measurements, estimates of damaged area
- Example plots of damaged area, two different ways of estimating melted area:
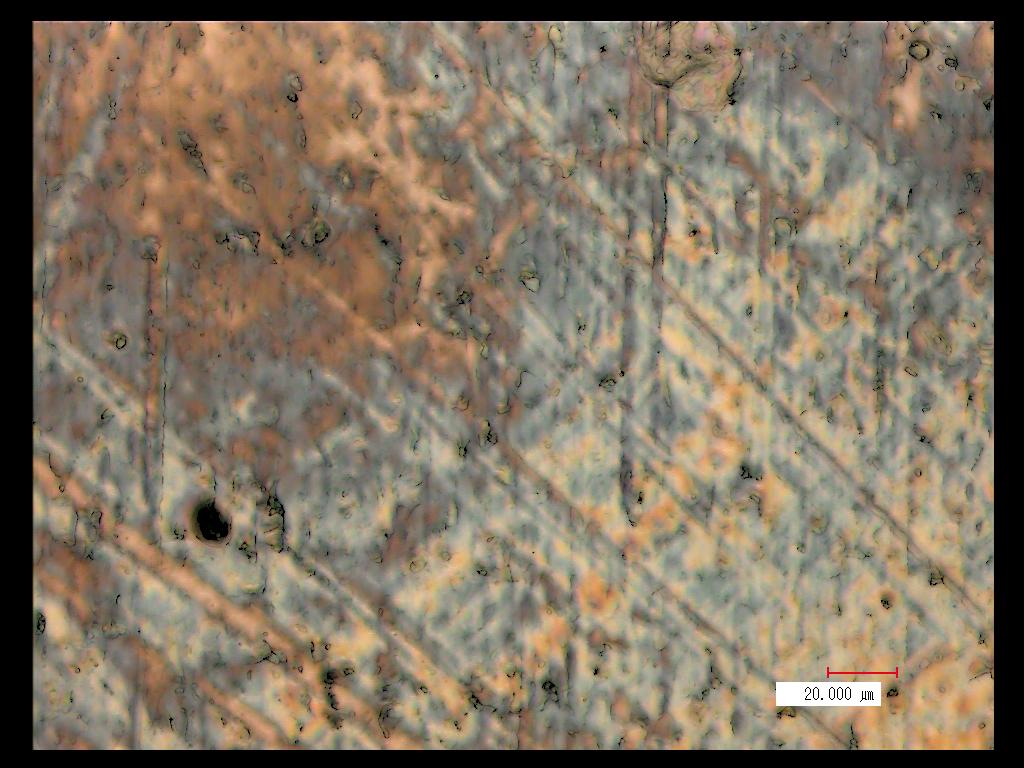
- Example of single inteferometer picture, sample 2, before installation:
- Example of 3D profile inteferometer picture, sample 2, before installation:

- Example of single inteferometer picture, sample 2, before installation:
- Comparison with predictions
- Figures and Tables,
")
- Figures and Tables,
| sigx x sigy | N/bunch (x10e10) | n_bunches | Energy density (J/gm) |
|---|---|---|---|
| 15x2 | 1.5 | 1 | |
| 1.0 | 1 | ||
| 0.5 | 3 | ||
| 5x5 | 1.5 | 1 | |
| 1.0 | 1 | ||
| 0.5 | 3 | ||
| 1.5 | 1 | ||
| 1.0 | 1 | ||
| 0.5 | 3 |
- Summary and Conclusions


| I | Attachment | History | Action | Size | Date | Who | Comment |
|---|---|---|---|---|---|---|---|
| |
001x1000-3.JPG | r1 | manage | 167.1 K | 2008-02-23 - 21:07 | NigelWatson | Example of 3D profile inteferometer picture, sample 2, before installation |
| |
001x1000.JPG | r1 | manage | 107.0 K | 2008-02-23 - 21:00 | NigelWatson | Example of single inteferometer picture, sample 2, before installation |
| |
fig1.draw | r1 | manage | 0.4 K | 2008-02-23 - 16:58 | NigelWatson | TWiki Draw draw file |
| |
fig1.gif | r1 | manage | 1.4 K | 2008-02-23 - 16:58 | NigelWatson | TWiki Draw GIF file |
| |
fig3.draw | r1 | manage | 4.3 K | 2008-02-23 - 22:13 | NigelWatson | TWiki Draw draw file |
| |
fig3.gif | r1 | manage | 2.5 K | 2008-02-23 - 22:13 | NigelWatson | TWiki Draw GIF file |
Topic revision: r2 - 2008-02-23 - NigelWatson
- ABATBEA
- ACPP
- ADCgroup
- AEGIS
- AfricaMap
- AgileInfrastructure
- ALICE
- AliceEbyE
- AliceSPD
- AliceSSD
- AliceTOF
- AliFemto
- ALPHA
- Altair
- ArdaGrid
- ASACUSA
- AthenaFCalTBAna
- Atlas
- AtlasLBNL
- AXIALPET
- CAE
- CALICE
- CDS
- CENF
- CERNSearch
- CLIC
- Cloud
- CloudServices
- CMS
- Controls
- CTA
- CvmFS
- DB
- DefaultWeb
- DESgroup
- DPHEP
- DM-LHC
- DSSGroup
- EGEE
- EgeePtf
- ELFms
- EMI
- ETICS
- FIOgroup
- FlukaTeam
- Frontier
- Gaudi
- GeneratorServices
- GuidesInfo
- HardwareLabs
- HCC
- HEPIX
- ILCBDSColl
- ILCTPC
- IMWG
- Inspire
- IPv6
- IT
- ItCommTeam
- ITCoord
- ITdeptTechForum
- ITDRP
- ITGT
- ITSDC
- LAr
- LCG
- LCGAAWorkbook
- Leade
- LHCAccess
- LHCAtHome
- LHCb
- LHCgas
- LHCONE
- LHCOPN
- LinuxSupport
- Main
- Medipix
- Messaging
- MPGD
- NA49
- NA61
- NA62
- NTOF
- Openlab
- PDBService
- Persistency
- PESgroup
- Plugins
- PSAccess
- PSBUpgrade
- R2Eproject
- RCTF
- RD42
- RFCond12
- RFLowLevel
- ROXIE
- Sandbox
- SocialActivities
- SPI
- SRMDev
- SSM
- Student
- SuperComputing
- Support
- SwfCatalogue
- TMVA
- TOTEM
- TWiki
- UNOSAT
- Virtualization
- VOBox
- WITCH
- XTCA
 |
|
or Ideas, requests, problems regarding TWiki? use Discourse or Send feedback