

Compact Muon Solenoid
LHC, CERN
| CMS-PAS-B2G-15-003 | ||
| Search for top quark-antiquark resonances in the all-hadronic final state at $\sqrt{s}= $ 13 TeV | ||
| CMS Collaboration | ||
| June 2016 | ||
| Abstract: A search is presented for the production of heavy resonances decaying to top quark-antiquark pairs in the all-hadronic channel. The analysis is performed using 2.6 fb$^{-1}$ of data collected in proton-proton collisions at $\sqrt{s} = $ 13 TeV with the CMS detector. This analysis focuses on high-mass resonances decaying to top quarks with high Lorentz boosts. These highly-boosted top quarks are reconstructed as single jets with substructure corresponding to the t$\rightarrow$bW$\rightarrow$bqq decay. No excess above the expectation from the standard model is observed, and we set limits on the production cross sections of Z' bosons and RS gluons, for signal models with varying widths. For wider Z' signal models, we eclipse previous exclusion limits, excluding Z' bosons with masses up to 3.3 (3.8) TeV, for Z' widths of 10% (30%) of their masses. | ||
| Links: CDS record (PDF) ; inSPIRE record ; CADI line (restricted) ; | ||
| Figures | |

png pdf |
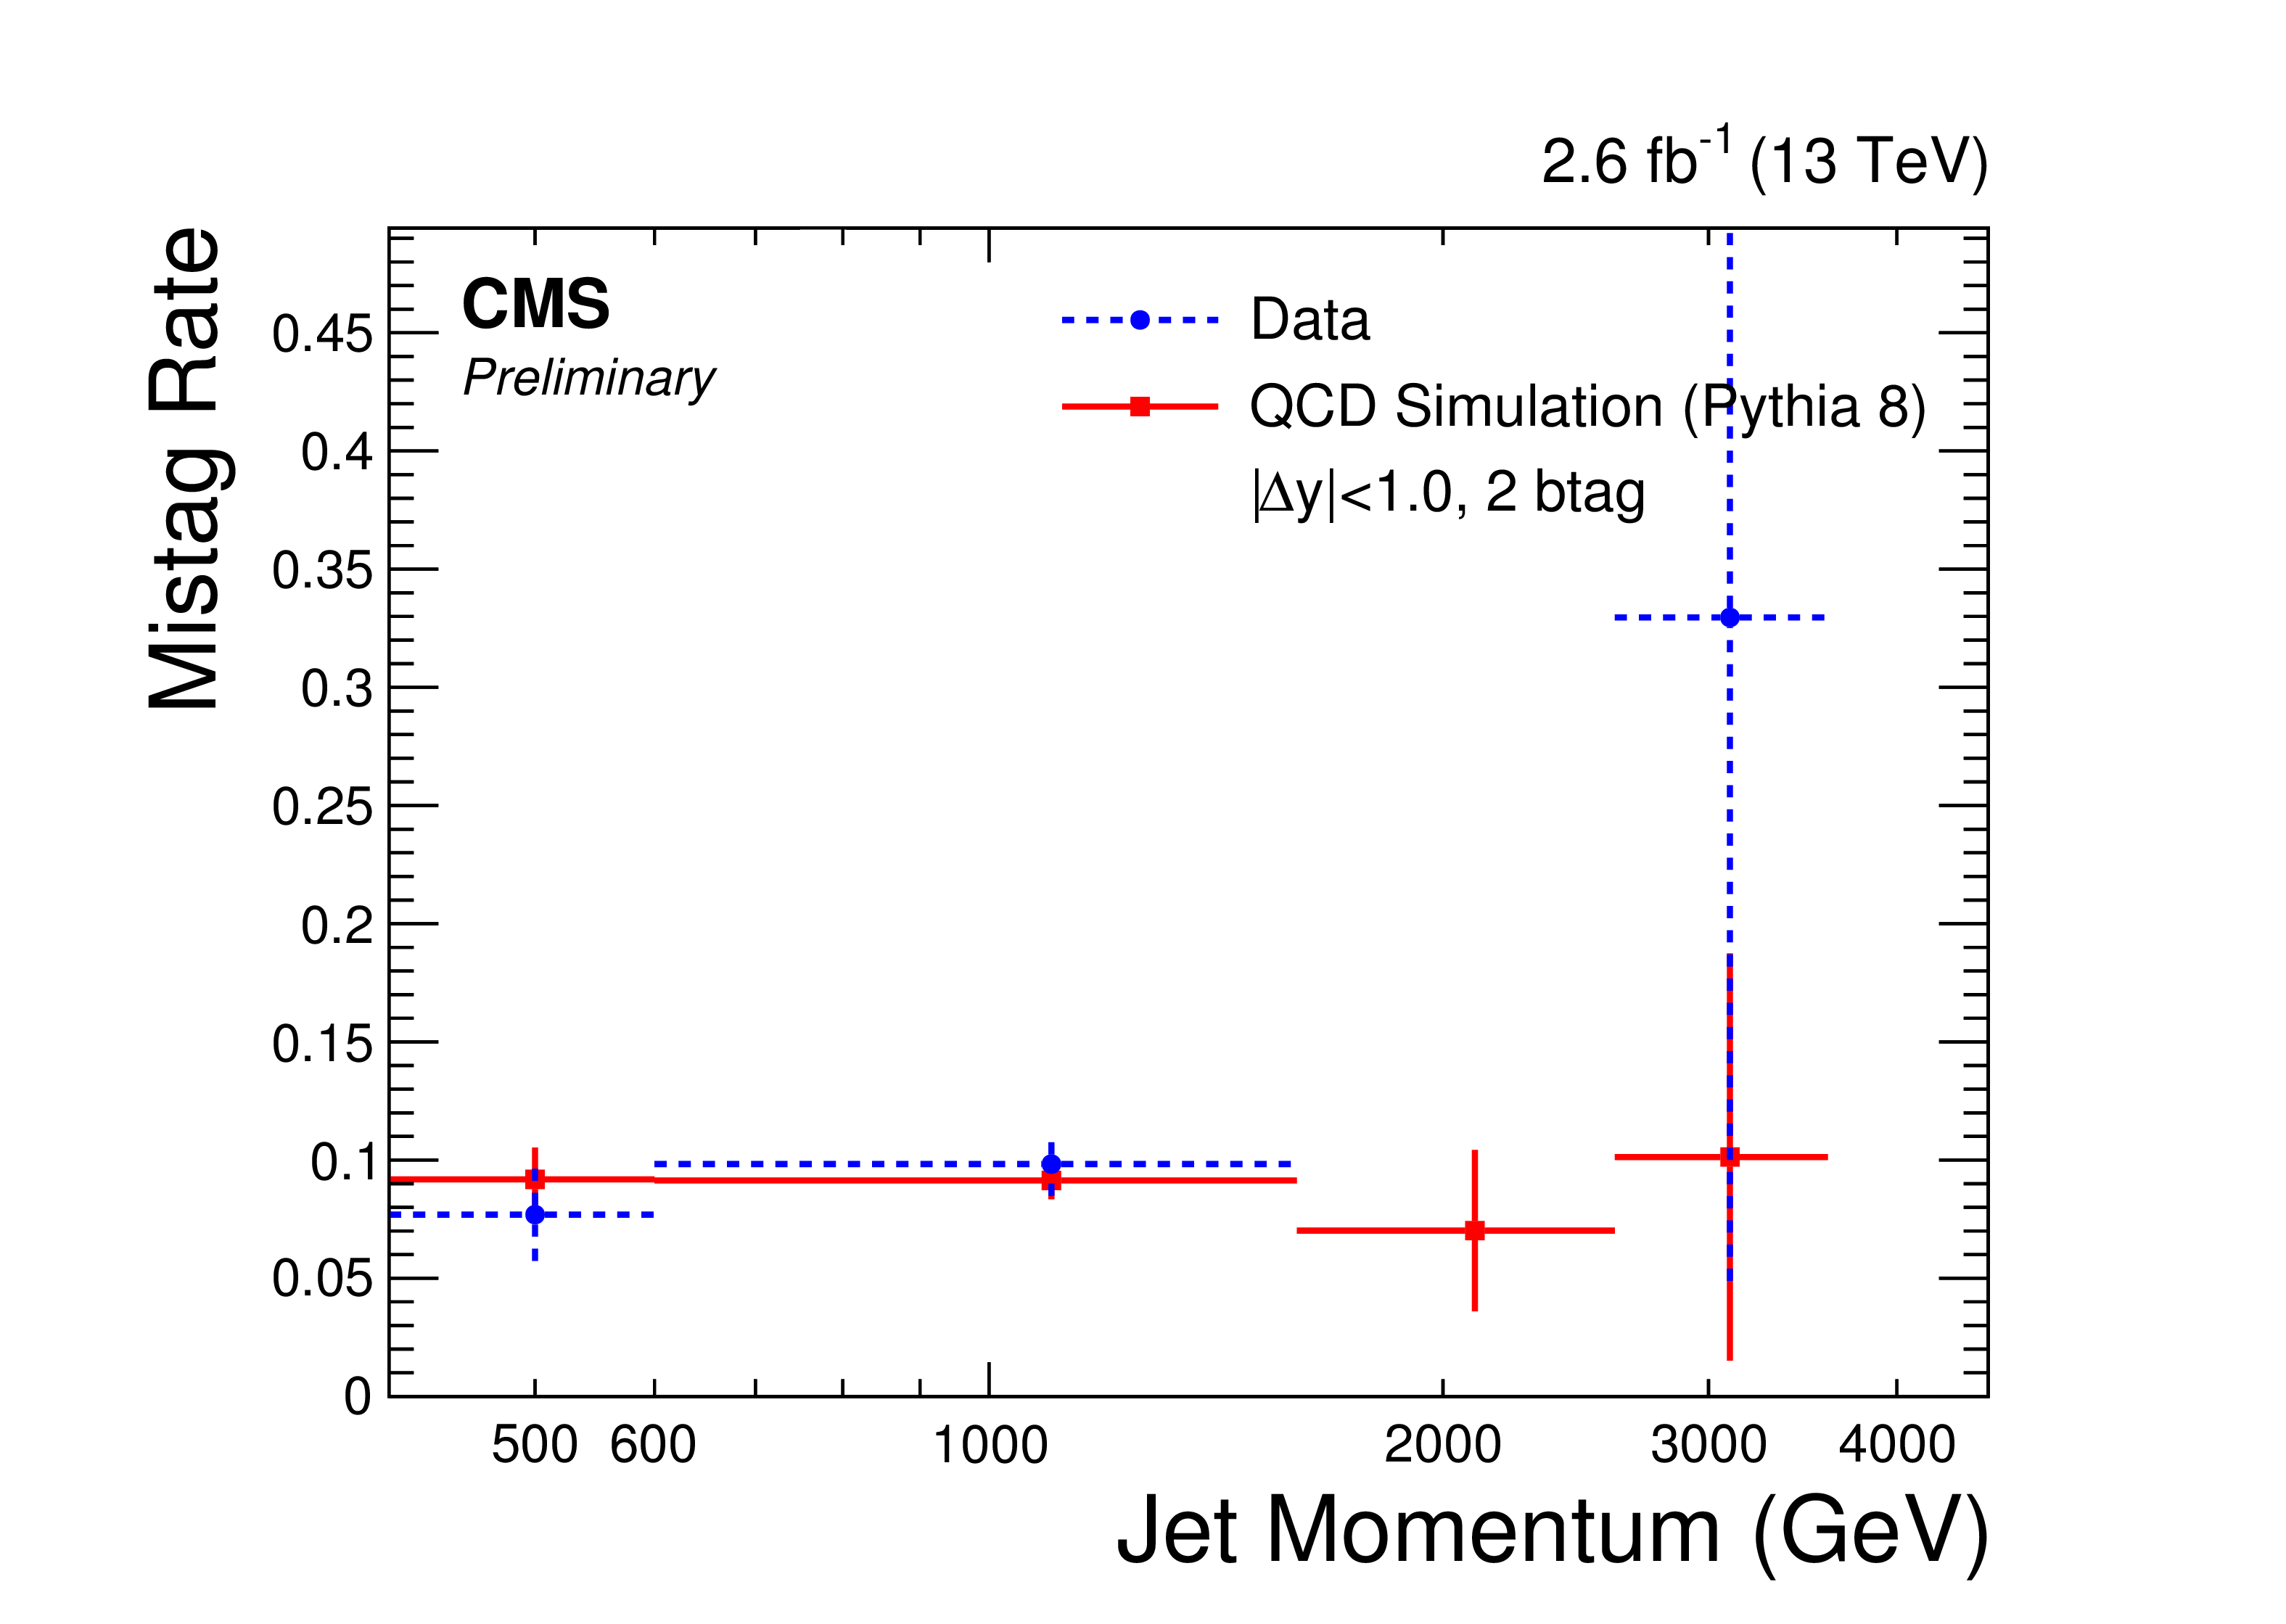
Figure 1-a:
t-tagging mistag rate as measured with an anti-tag and probe procedure. The red squares indicate the mistag rate measured in QCD simulation. Blue circles indicate the mistag rate measured in data. The contamination from $ {\mathrm{ t \bar{t} } } $ is removed by subtracting simulated $ {\mathrm{ t \bar{t} } } $ events, normalized to expectation. The mistag rate is measured separately for each of the six event categories described in the text. |

png pdf |
Figure 1-b:
t-tagging mistag rate as measured with an anti-tag and probe procedure. The red squares indicate the mistag rate measured in QCD simulation. Blue circles indicate the mistag rate measured in data. The contamination from $ {\mathrm{ t \bar{t} } } $ is removed by subtracting simulated $ {\mathrm{ t \bar{t} } } $ events, normalized to expectation. The mistag rate is measured separately for each of the six event categories described in the text. |

png pdf |
Figure 1-c:
t-tagging mistag rate as measured with an anti-tag and probe procedure. The red squares indicate the mistag rate measured in QCD simulation. Blue circles indicate the mistag rate measured in data. The contamination from $ {\mathrm{ t \bar{t} } } $ is removed by subtracting simulated $ {\mathrm{ t \bar{t} } } $ events, normalized to expectation. The mistag rate is measured separately for each of the six event categories described in the text. |

png pdf |
Figure 1-d:
t-tagging mistag rate as measured with an anti-tag and probe procedure. The red squares indicate the mistag rate measured in QCD simulation. Blue circles indicate the mistag rate measured in data. The contamination from $ {\mathrm{ t \bar{t} } } $ is removed by subtracting simulated $ {\mathrm{ t \bar{t} } } $ events, normalized to expectation. The mistag rate is measured separately for each of the six event categories described in the text. |
png pdf |
Figure 1-e:
t-tagging mistag rate as measured with an anti-tag and probe procedure. The red squares indicate the mistag rate measured in QCD simulation. Blue circles indicate the mistag rate measured in data. The contamination from $ {\mathrm{ t \bar{t} } } $ is removed by subtracting simulated $ {\mathrm{ t \bar{t} } } $ events, normalized to expectation. The mistag rate is measured separately for each of the six event categories described in the text. |

png pdf |
Figure 1-f:
t-tagging mistag rate as measured with an anti-tag and probe procedure. The red squares indicate the mistag rate measured in QCD simulation. Blue circles indicate the mistag rate measured in data. The contamination from $ {\mathrm{ t \bar{t} } } $ is removed by subtracting simulated $ {\mathrm{ t \bar{t} } } $ events, normalized to expectation. The mistag rate is measured separately for each of the six event categories described in the text. |

png pdf |
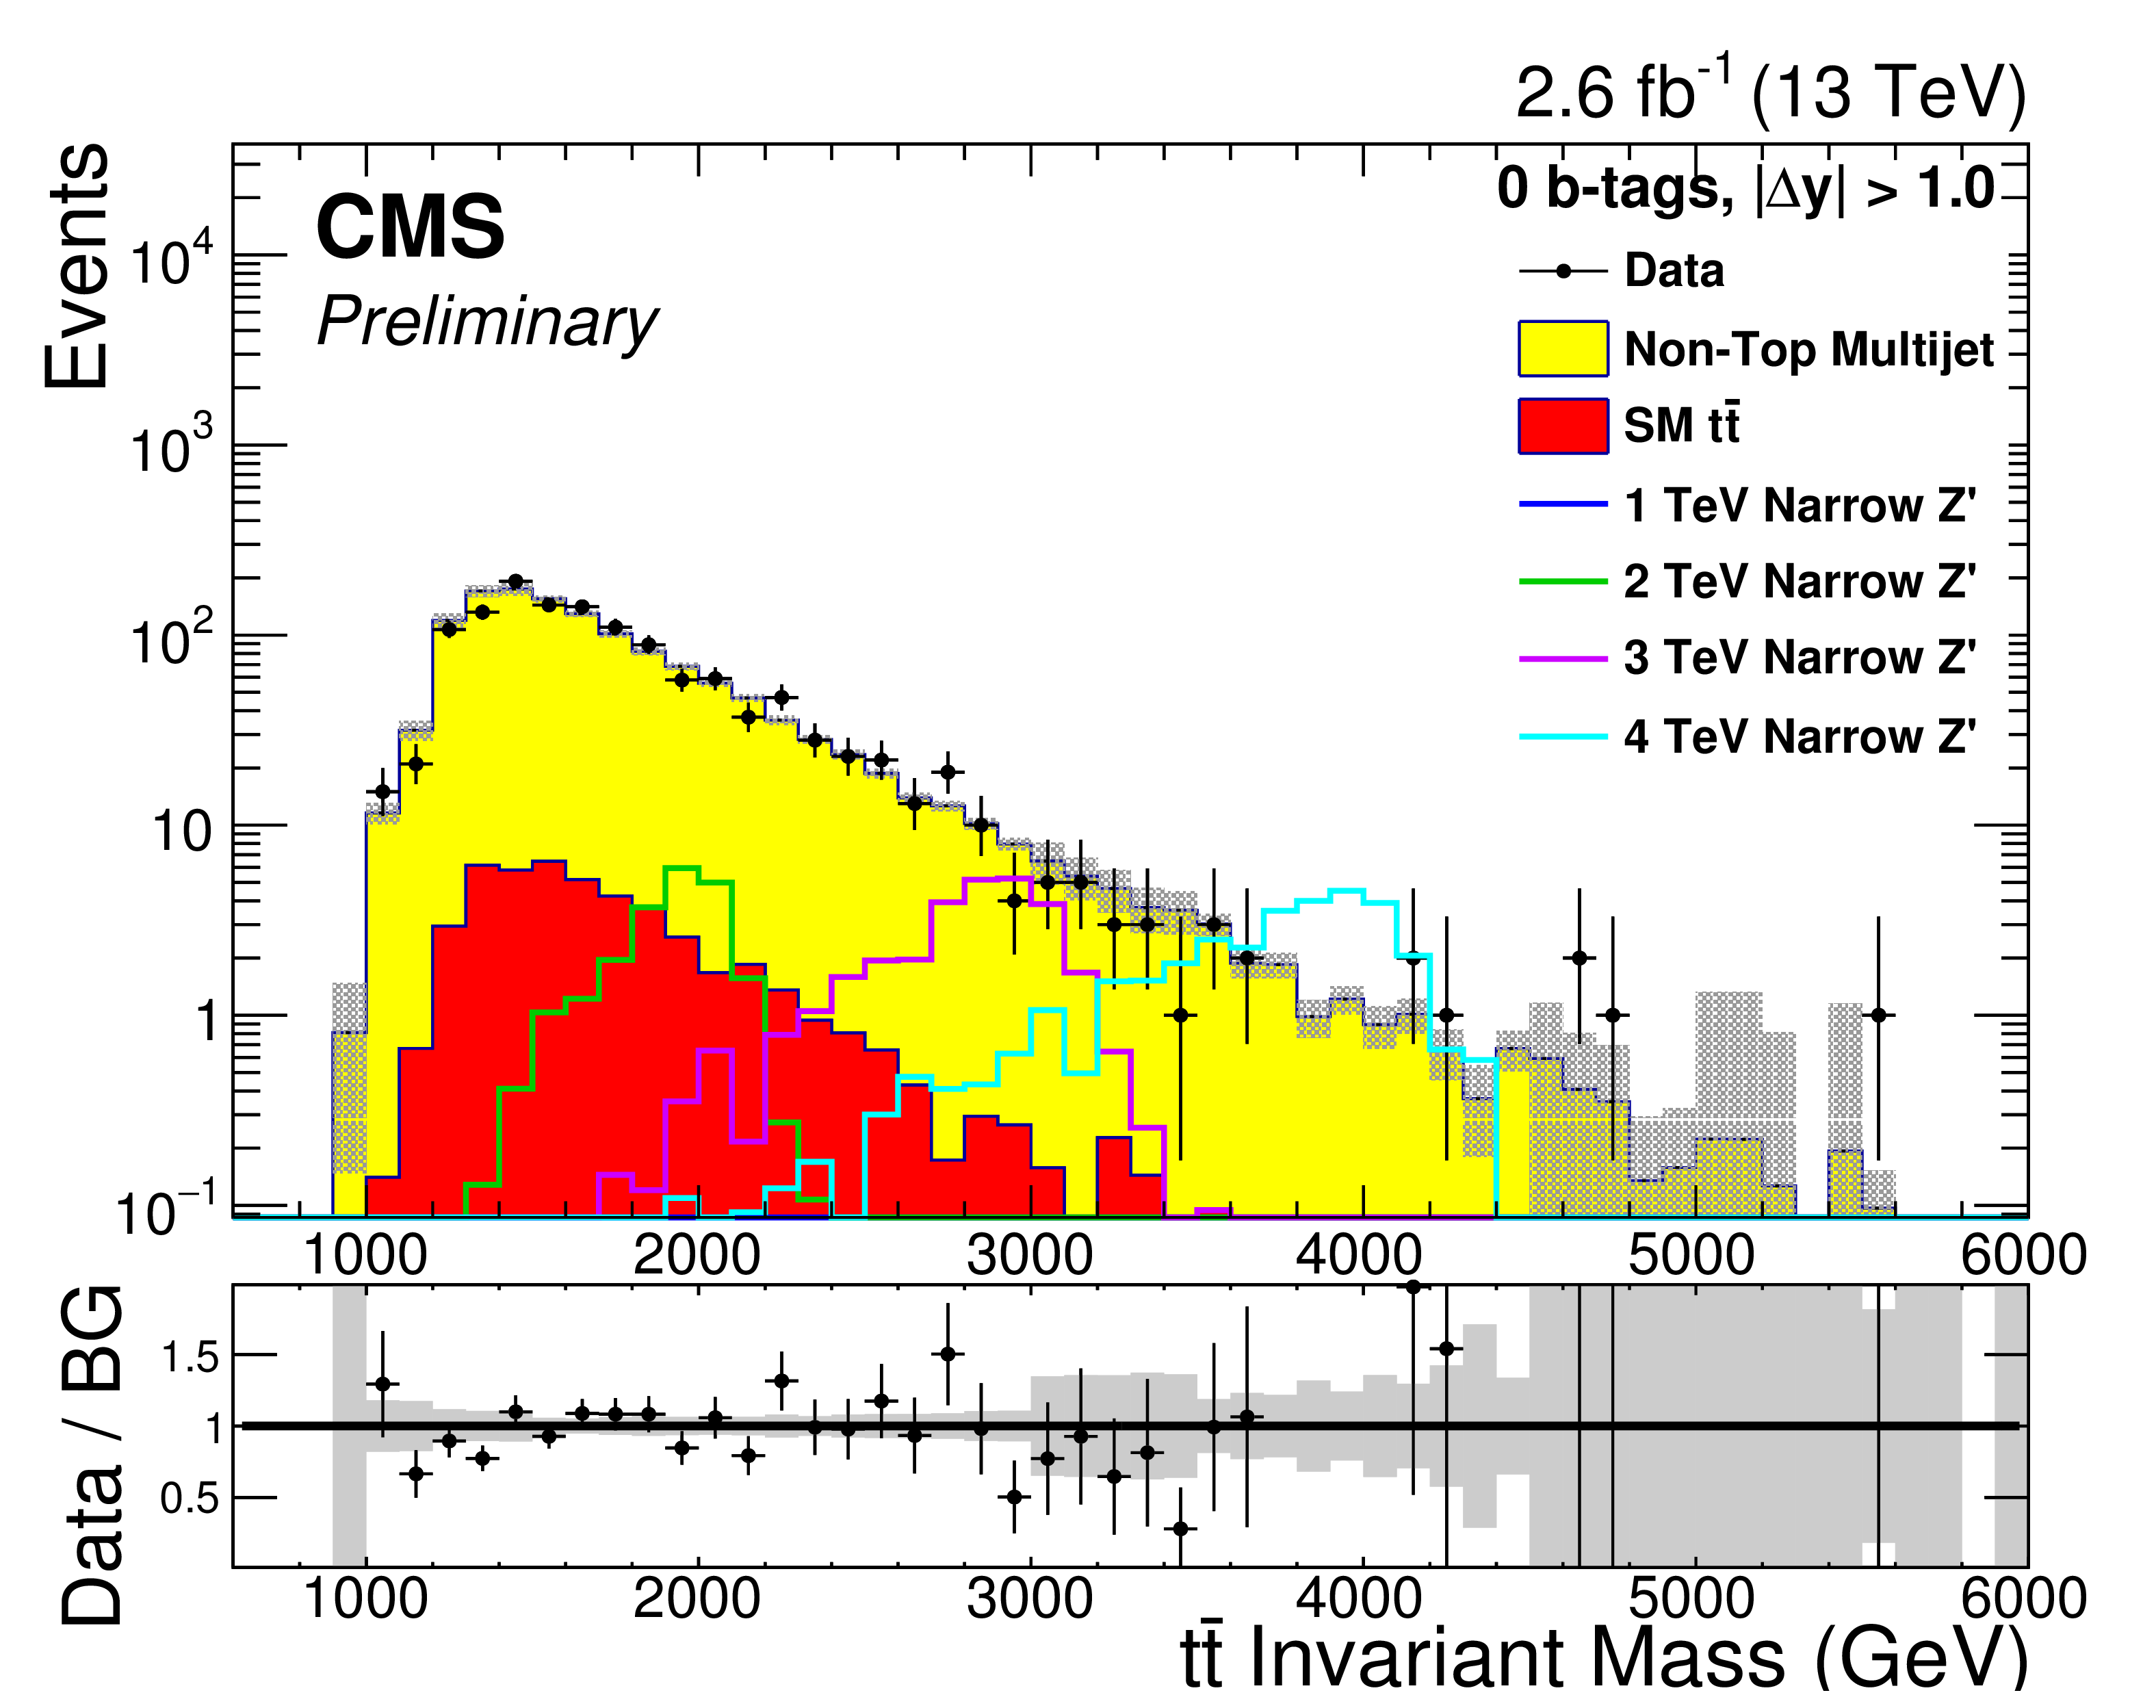
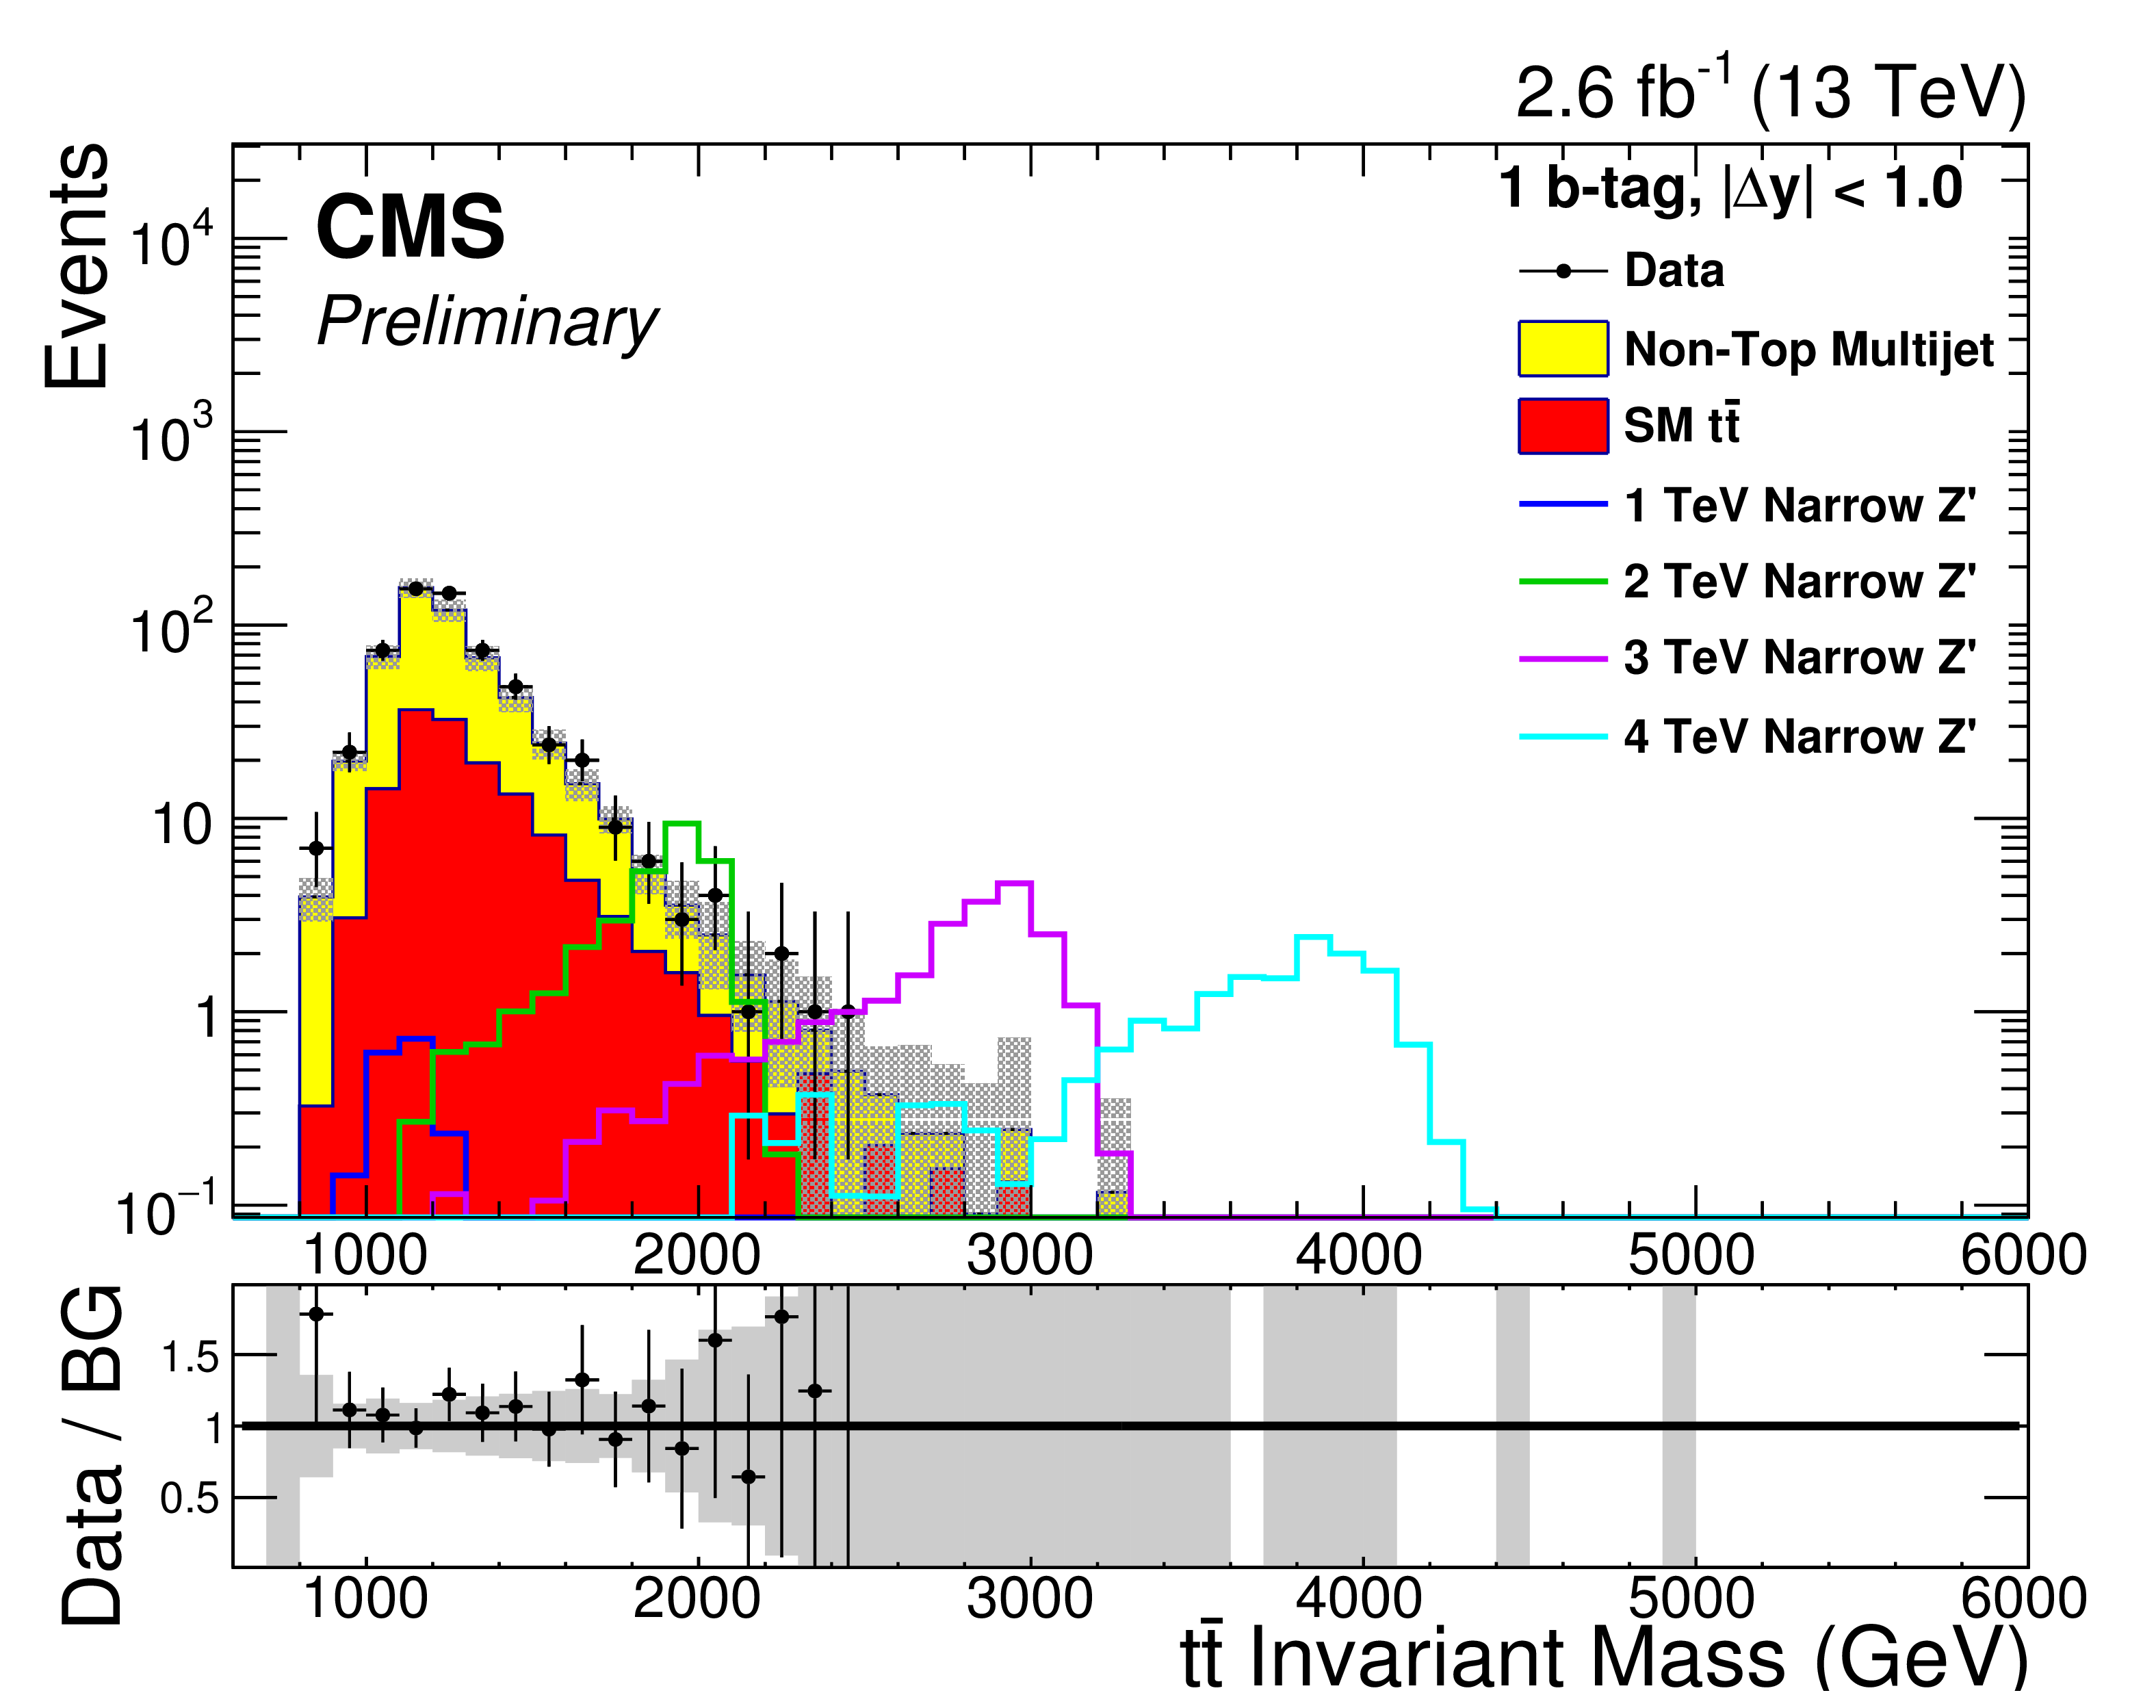
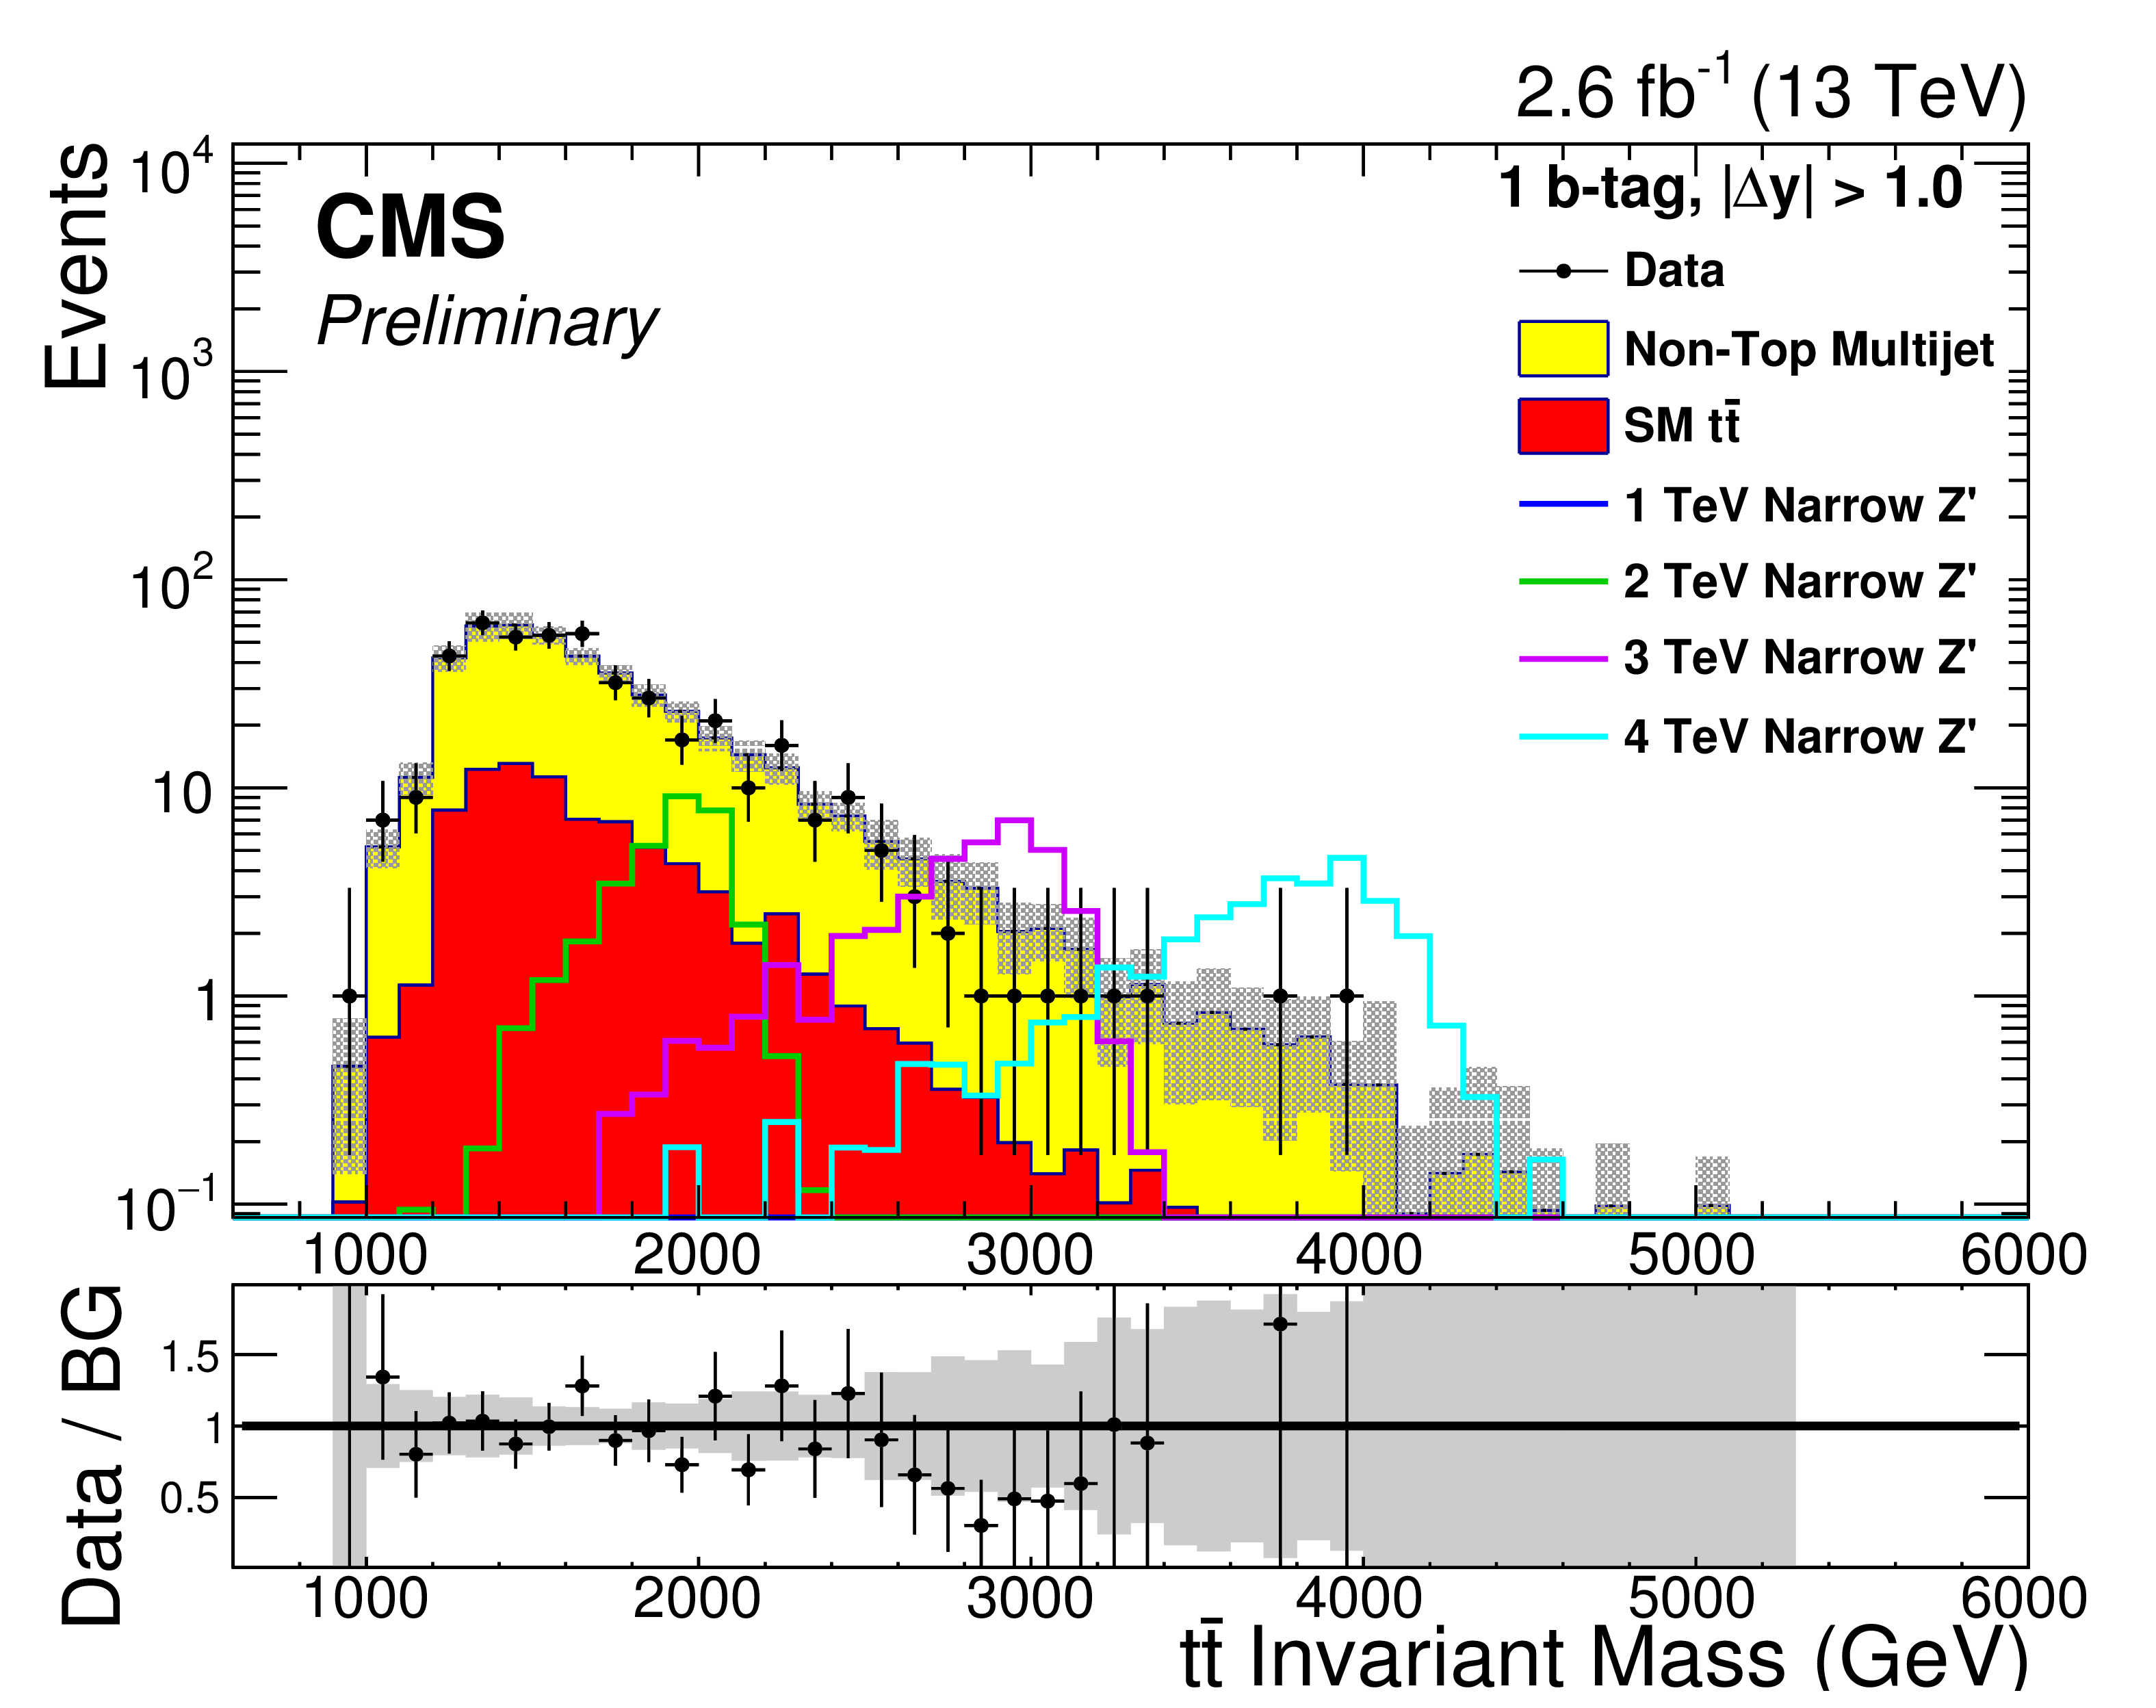
Figure 2-a:
Final log-scale distributions of $m_{ {\mathrm{ t \bar{t} } } }$ for all six signal regions, with the $\Delta y < $ 1.0 categories shown in the left column and the $\Delta y > $ 1.0 categories in the right. The number of b-tags in the plots increase from zero in the first row to two b-tags in the third row. The shaded region corresponds to the combined systematic and statistical uncertainties on the background model. Signal models have been normalized to a cross section of 1 pb. |
png pdf |
Figure 2-b:
Final log-scale distributions of $m_{ {\mathrm{ t \bar{t} } } }$ for all six signal regions, with the $\Delta y < $ 1.0 categories shown in the left column and the $\Delta y > $ 1.0 categories in the right. The number of b-tags in the plots increase from zero in the first row to two b-tags in the third row. The shaded region corresponds to the combined systematic and statistical uncertainties on the background model. Signal models have been normalized to a cross section of 1 pb. |
png pdf |
Figure 2-c:
Final log-scale distributions of $m_{ {\mathrm{ t \bar{t} } } }$ for all six signal regions, with the $\Delta y < $ 1.0 categories shown in the left column and the $\Delta y > $ 1.0 categories in the right. The number of b-tags in the plots increase from zero in the first row to two b-tags in the third row. The shaded region corresponds to the combined systematic and statistical uncertainties on the background model. Signal models have been normalized to a cross section of 1 pb. |
png pdf |
Figure 2-d:
Final log-scale distributions of $m_{ {\mathrm{ t \bar{t} } } }$ for all six signal regions, with the $\Delta y < $ 1.0 categories shown in the left column and the $\Delta y > $ 1.0 categories in the right. The number of b-tags in the plots increase from zero in the first row to two b-tags in the third row. The shaded region corresponds to the combined systematic and statistical uncertainties on the background model. Signal models have been normalized to a cross section of 1 pb. |

png pdf |
Figure 2-e:
Final log-scale distributions of $m_{ {\mathrm{ t \bar{t} } } }$ for all six signal regions, with the $\Delta y < $ 1.0 categories shown in the left column and the $\Delta y > $ 1.0 categories in the right. The number of b-tags in the plots increase from zero in the first row to two b-tags in the third row. The shaded region corresponds to the combined systematic and statistical uncertainties on the background model. Signal models have been normalized to a cross section of 1 pb. |

png pdf |
Figure 2-f:
Final log-scale distributions of $m_{ {\mathrm{ t \bar{t} } } }$ for all six signal regions, with the $\Delta y < $ 1.0 categories shown in the left column and the $\Delta y > $ 1.0 categories in the right. The number of b-tags in the plots increase from zero in the first row to two b-tags in the third row. The shaded region corresponds to the combined systematic and statistical uncertainties on the background model. Signal models have been normalized to a cross section of 1 pb. |

png pdf |
Figure 3-a:
Expected and observed 95% CL upper limits on the cross section times branching ratio for the four signal models, as a function of the new heavy particle mass. The four models considered are a Z' boson whose width is 1% of its mass (a), a 10% width Z' boson (b), a 30% width Z' boson (c), and an RS KK gluon (d). The solid (dashed) black line gives the observed (median expected) limits, while the one (two) sigma expected limit band is shown in green (yellow). The solid line shows the expected theoretical cross section for the signal process of interest. |
png pdf |
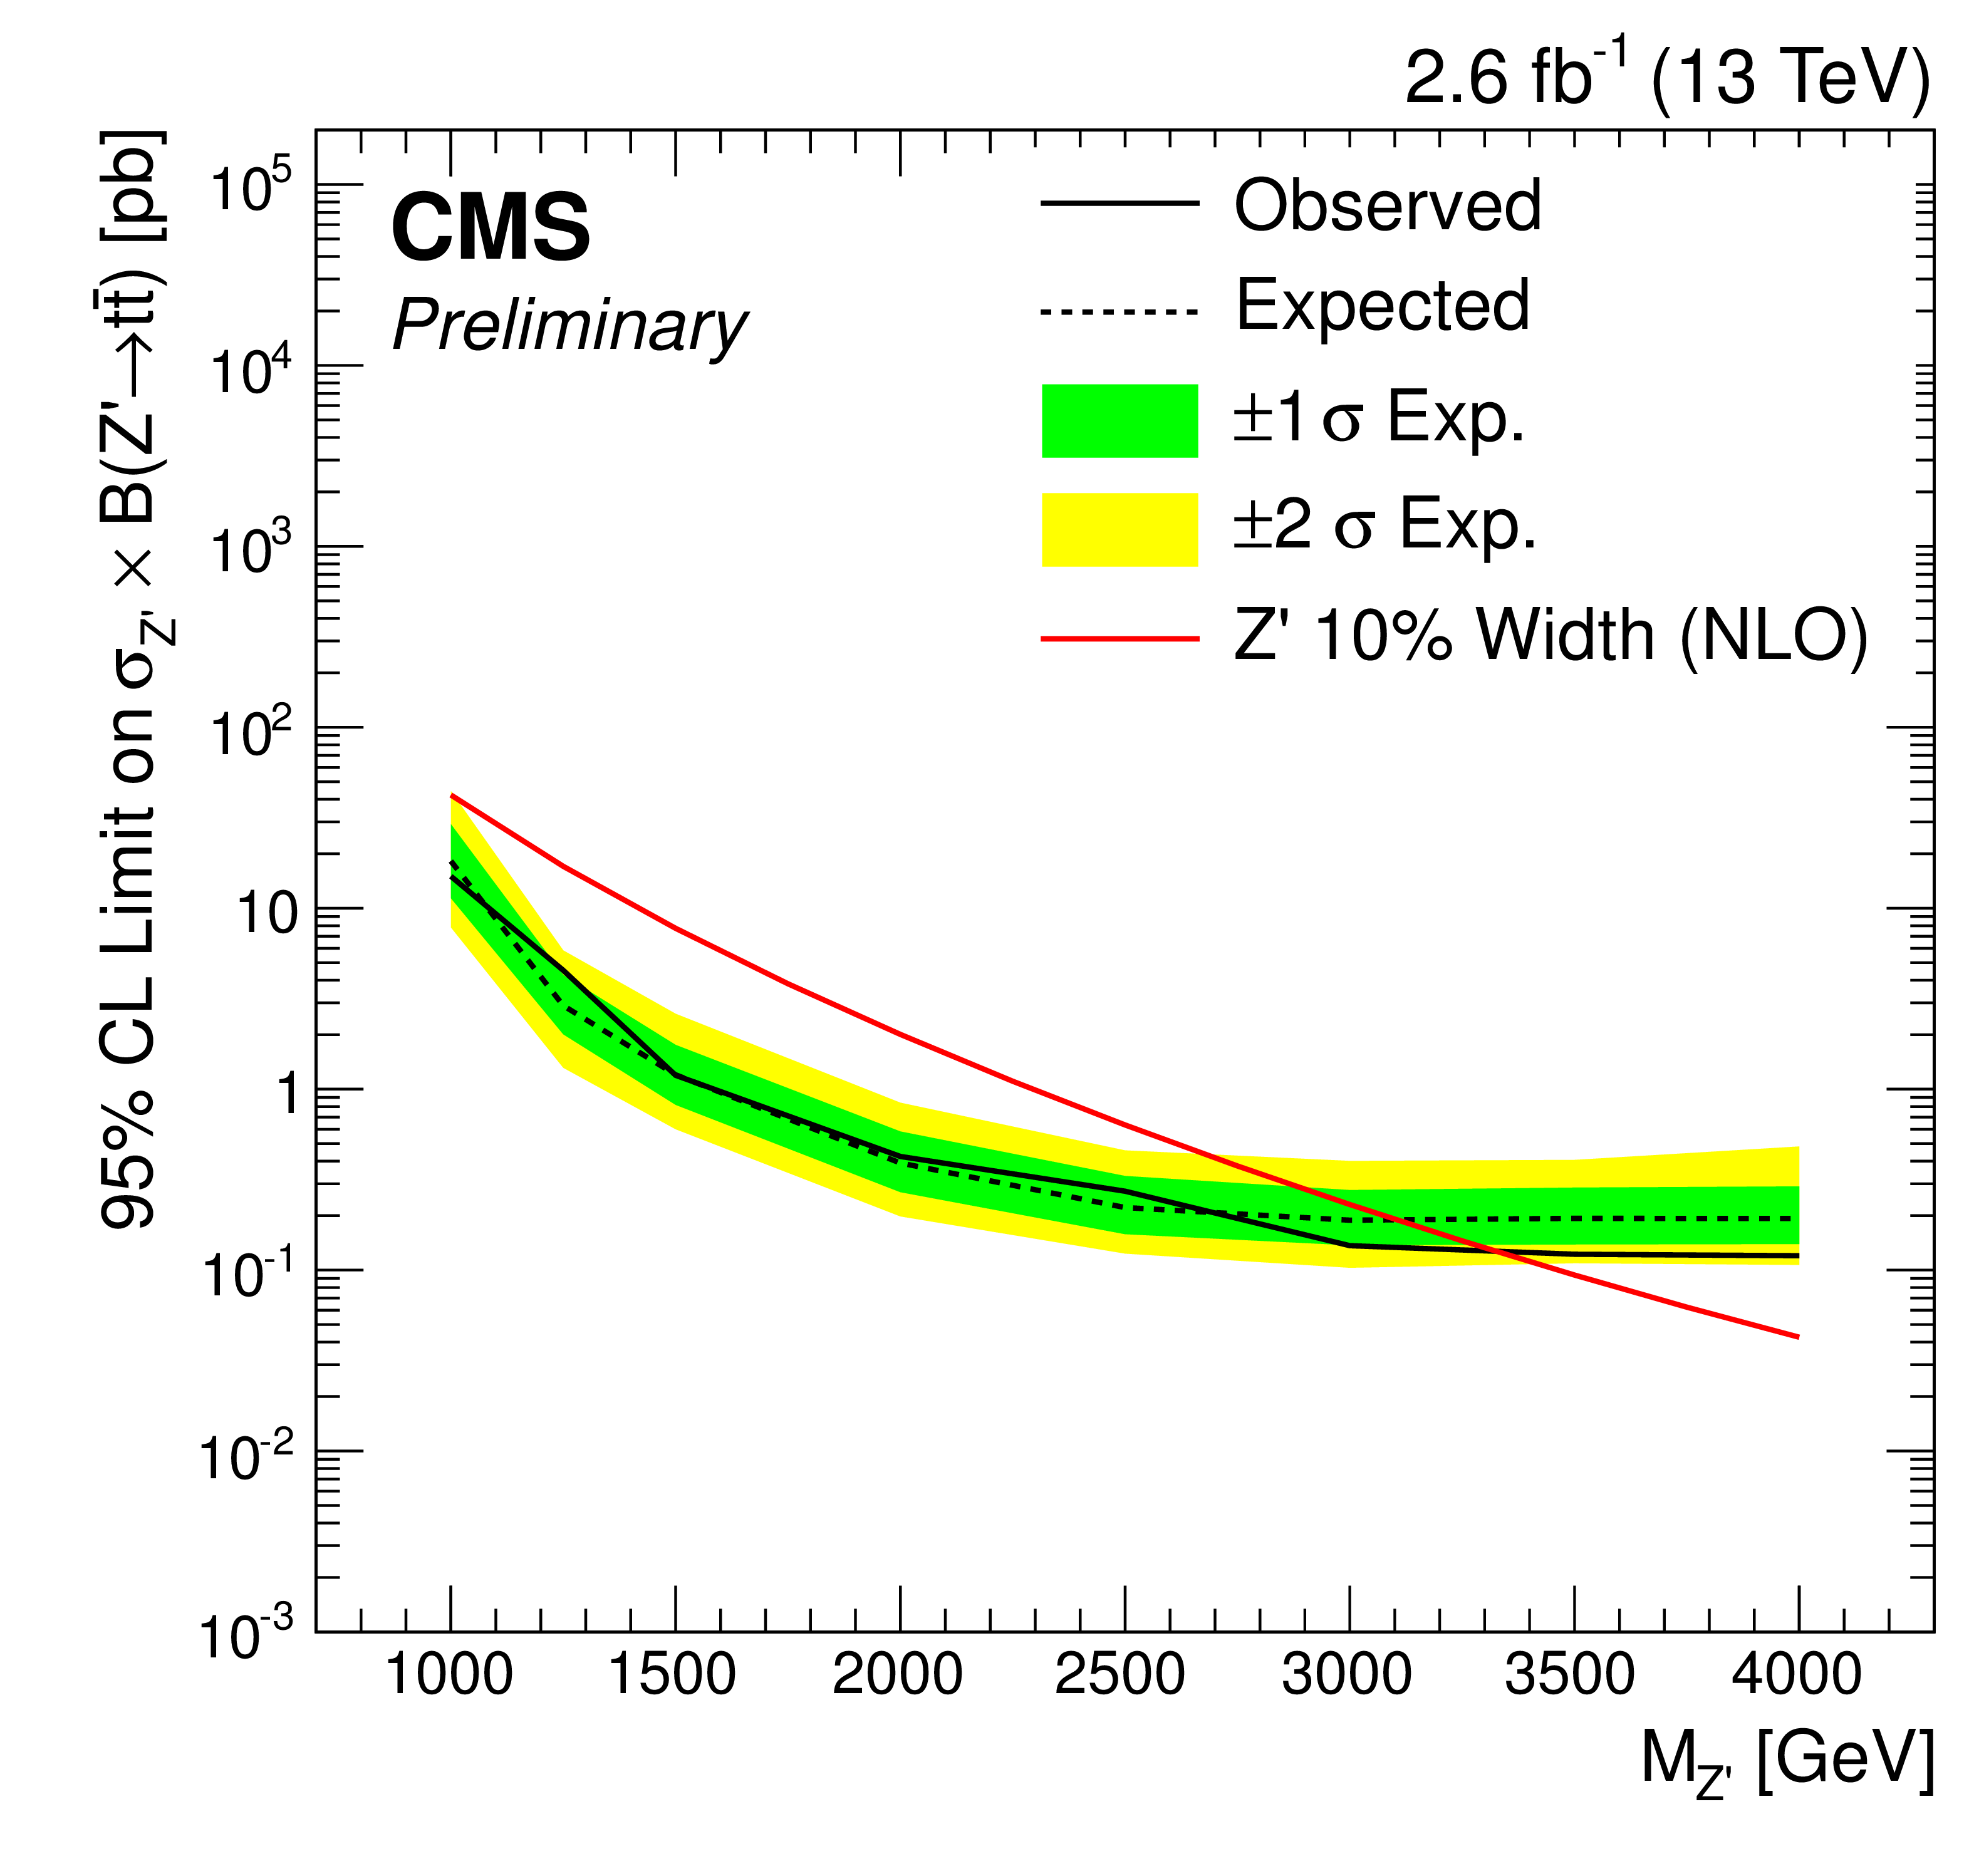
Figure 3-b:
Expected and observed 95% CL upper limits on the cross section times branching ratio for the four signal models, as a function of the new heavy particle mass. The four models considered are a Z' boson whose width is 1% of its mass (a), a 10% width Z' boson (b), a 30% width Z' boson (c), and an RS KK gluon (d). The solid (dashed) black line gives the observed (median expected) limits, while the one (two) sigma expected limit band is shown in green (yellow). The solid line shows the expected theoretical cross section for the signal process of interest. |

png pdf |
Figure 3-c:
Expected and observed 95% CL upper limits on the cross section times branching ratio for the four signal models, as a function of the new heavy particle mass. The four models considered are a Z' boson whose width is 1% of its mass (a), a 10% width Z' boson (b), a 30% width Z' boson (c), and an RS KK gluon (d). The solid (dashed) black line gives the observed (median expected) limits, while the one (two) sigma expected limit band is shown in green (yellow). The solid line shows the expected theoretical cross section for the signal process of interest. |
png pdf |
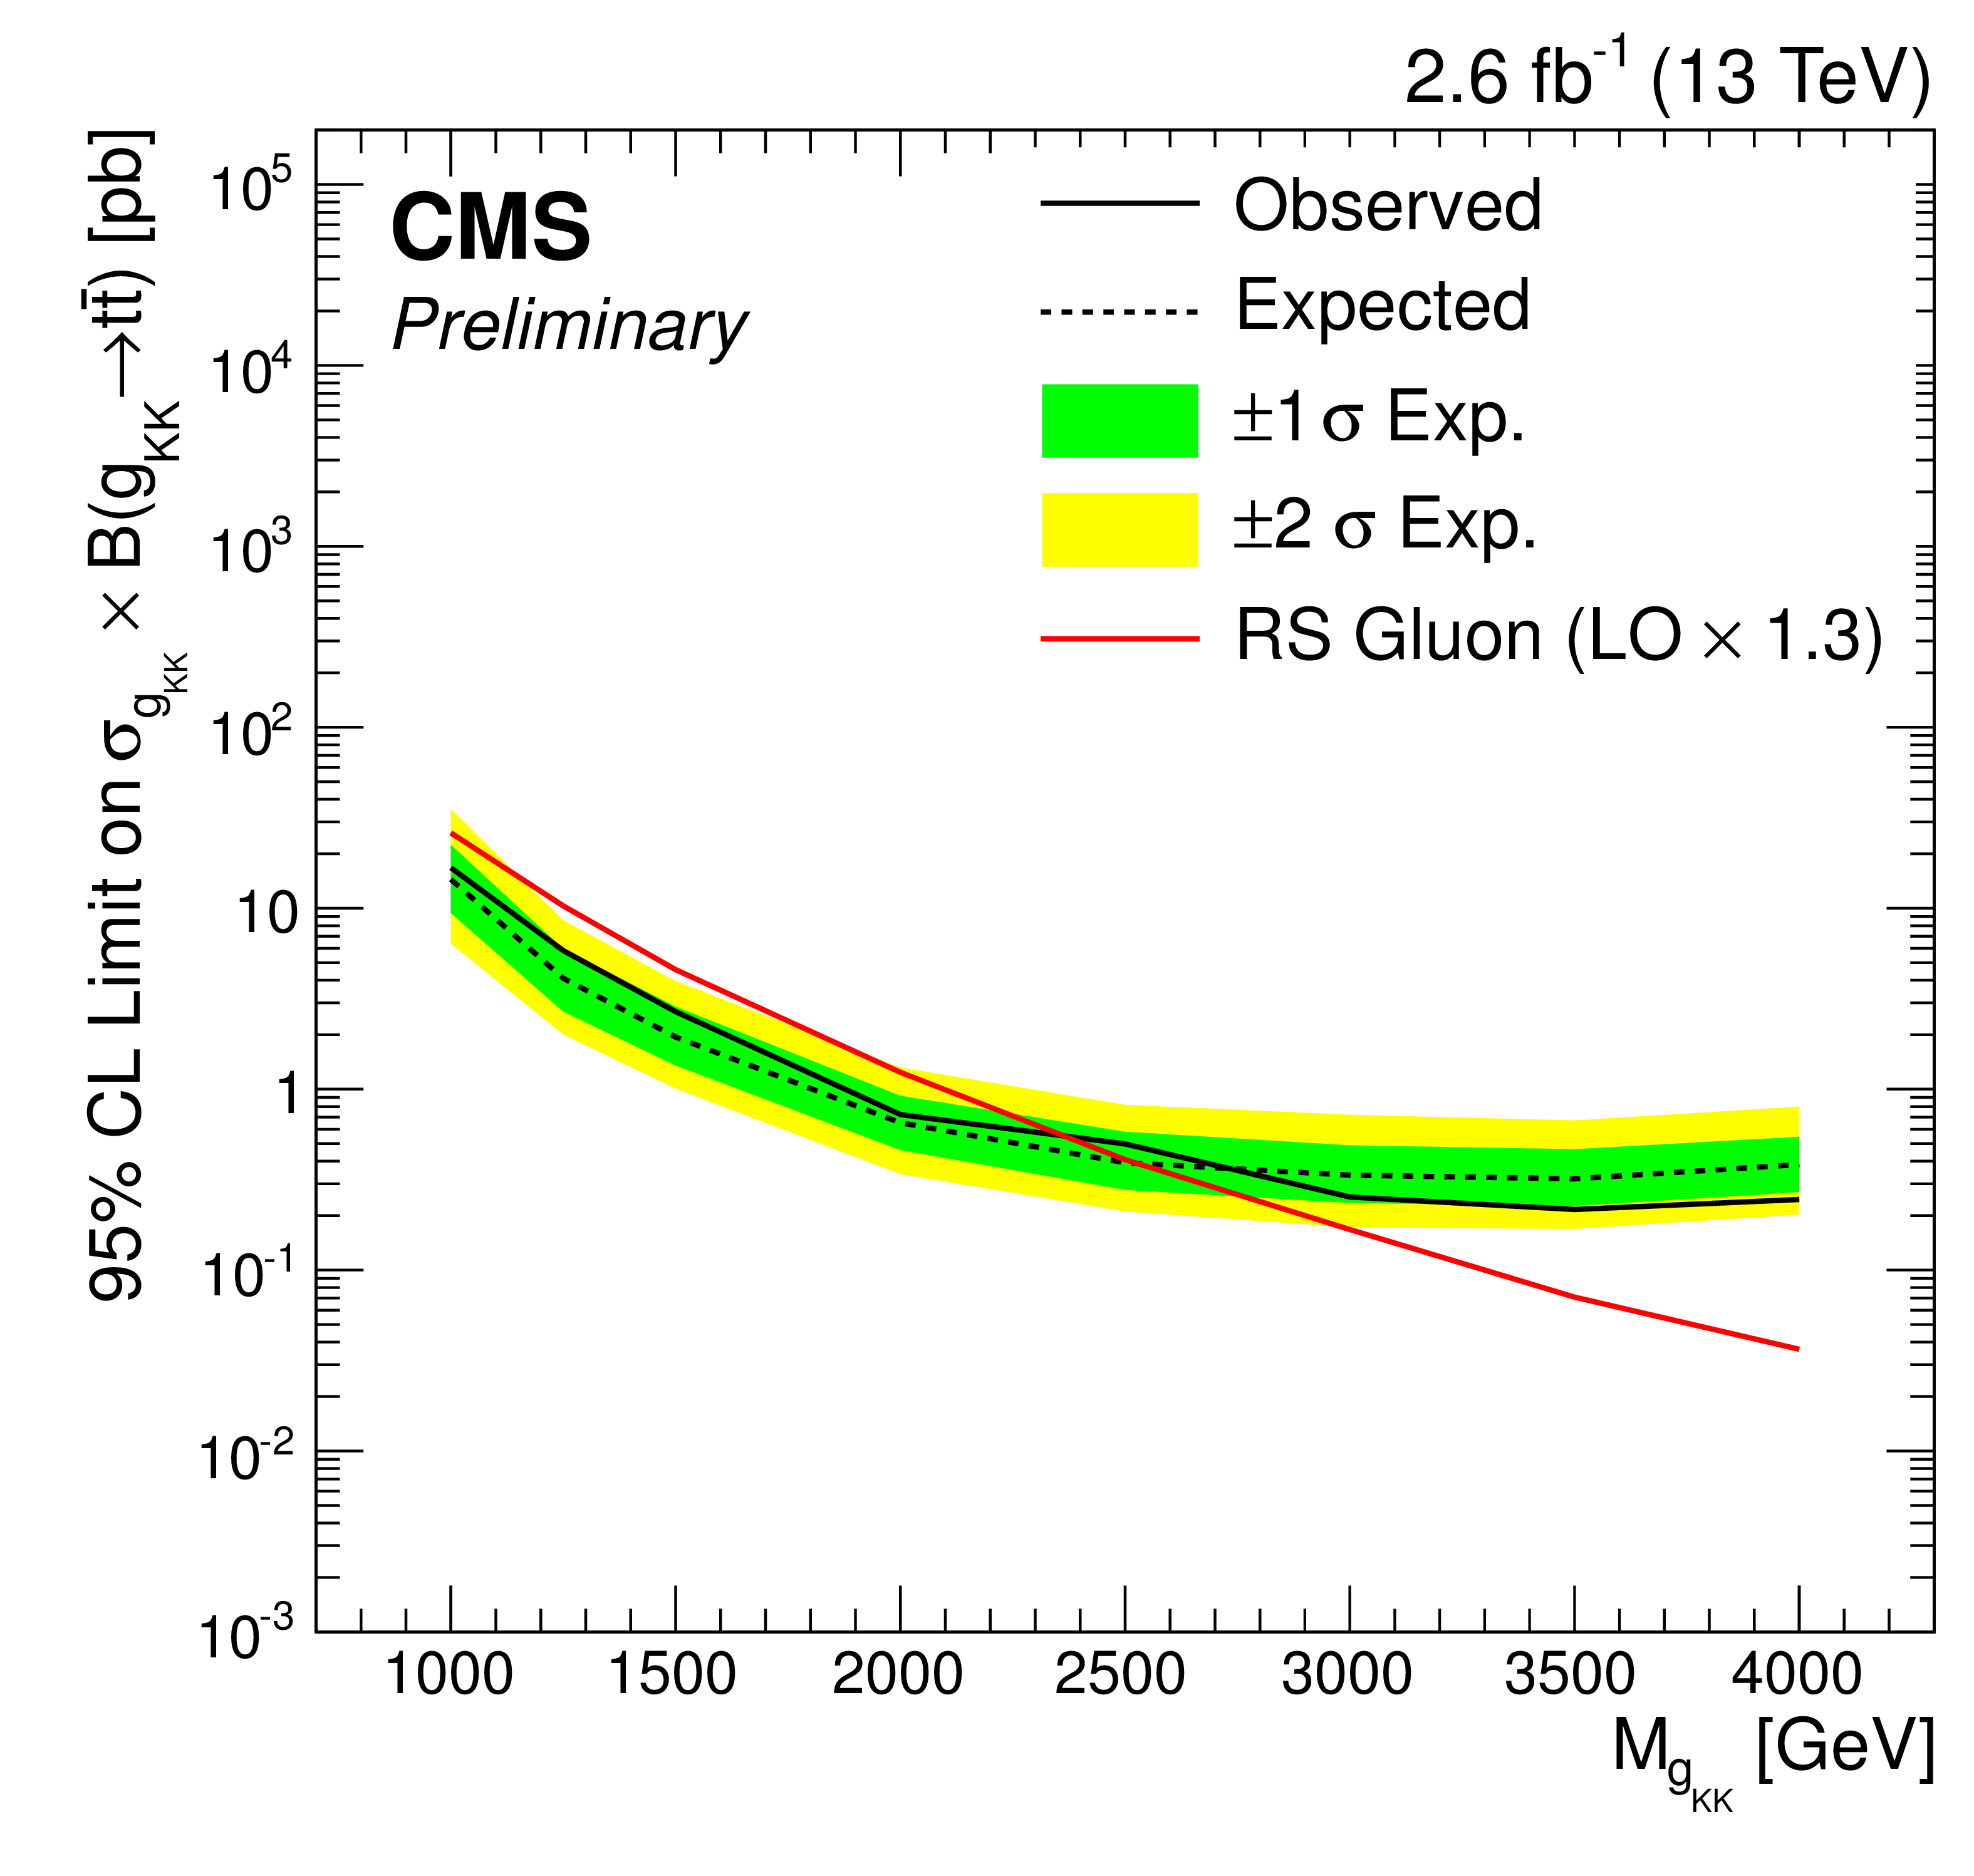
Figure 3-d:
Expected and observed 95% CL upper limits on the cross section times branching ratio for the four signal models, as a function of the new heavy particle mass. The four models considered are a Z' boson whose width is 1% of its mass (a), a 10% width Z' boson (b), a 30% width Z' boson (c), and an RS KK gluon (d). The solid (dashed) black line gives the observed (median expected) limits, while the one (two) sigma expected limit band is shown in green (yellow). The solid line shows the expected theoretical cross section for the signal process of interest. |
| Tables | |

png pdf |
Table 1:
Summary of systematic uncertainties applied to the analysis. |

png pdf |
Table 2:
Expected background and observed data yields for the six event categorizations used in the final analysis selection. Errors include both the statistical and systematic components. |
png pdf |
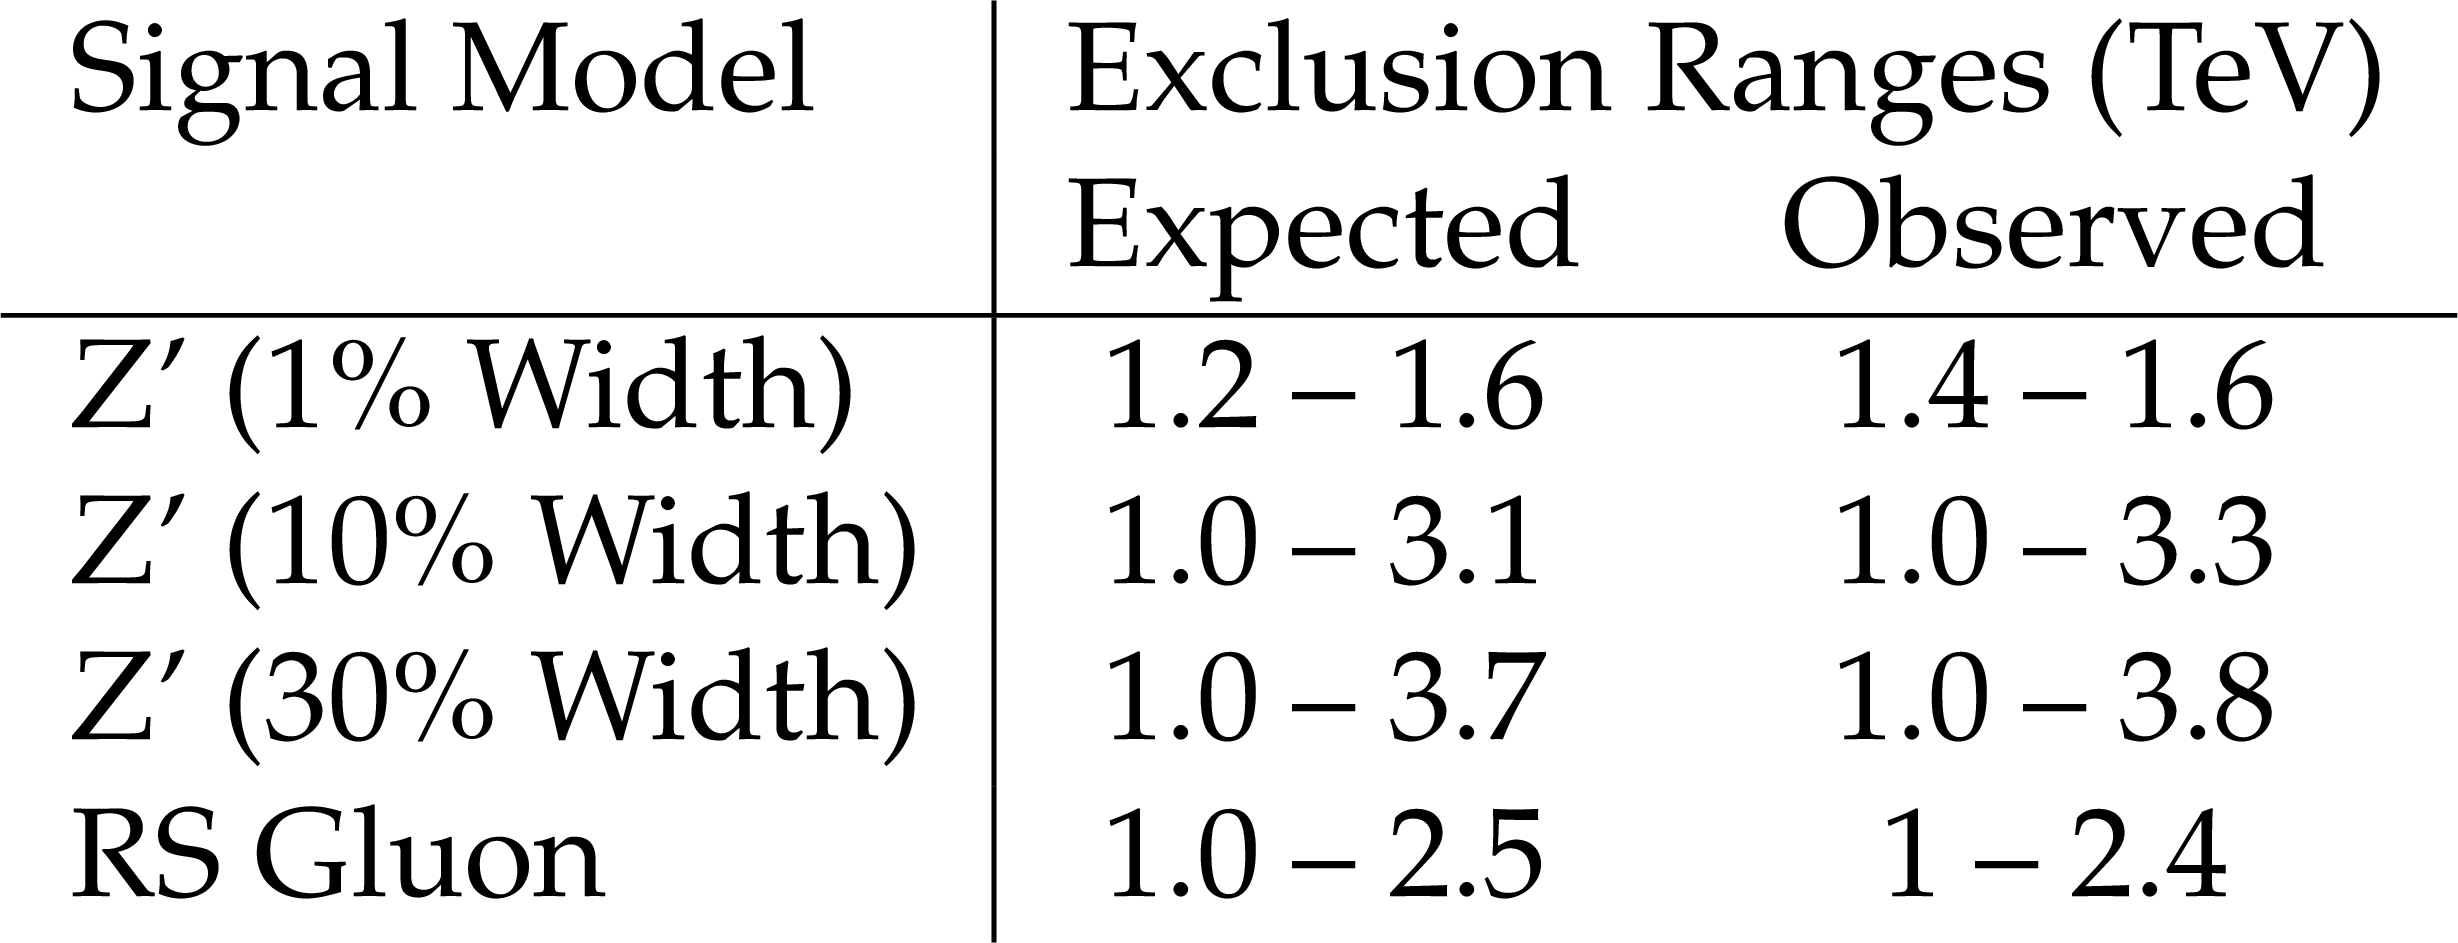
Table 3:
Observed and expected exclusion ranges for resonance masses in each of the signal models tested in the analysis. |

png pdf |
Table of expected and observed 95% CL cross section limits, for the narrow (1% width) Z' signal hypothesis.:
|
png pdf |
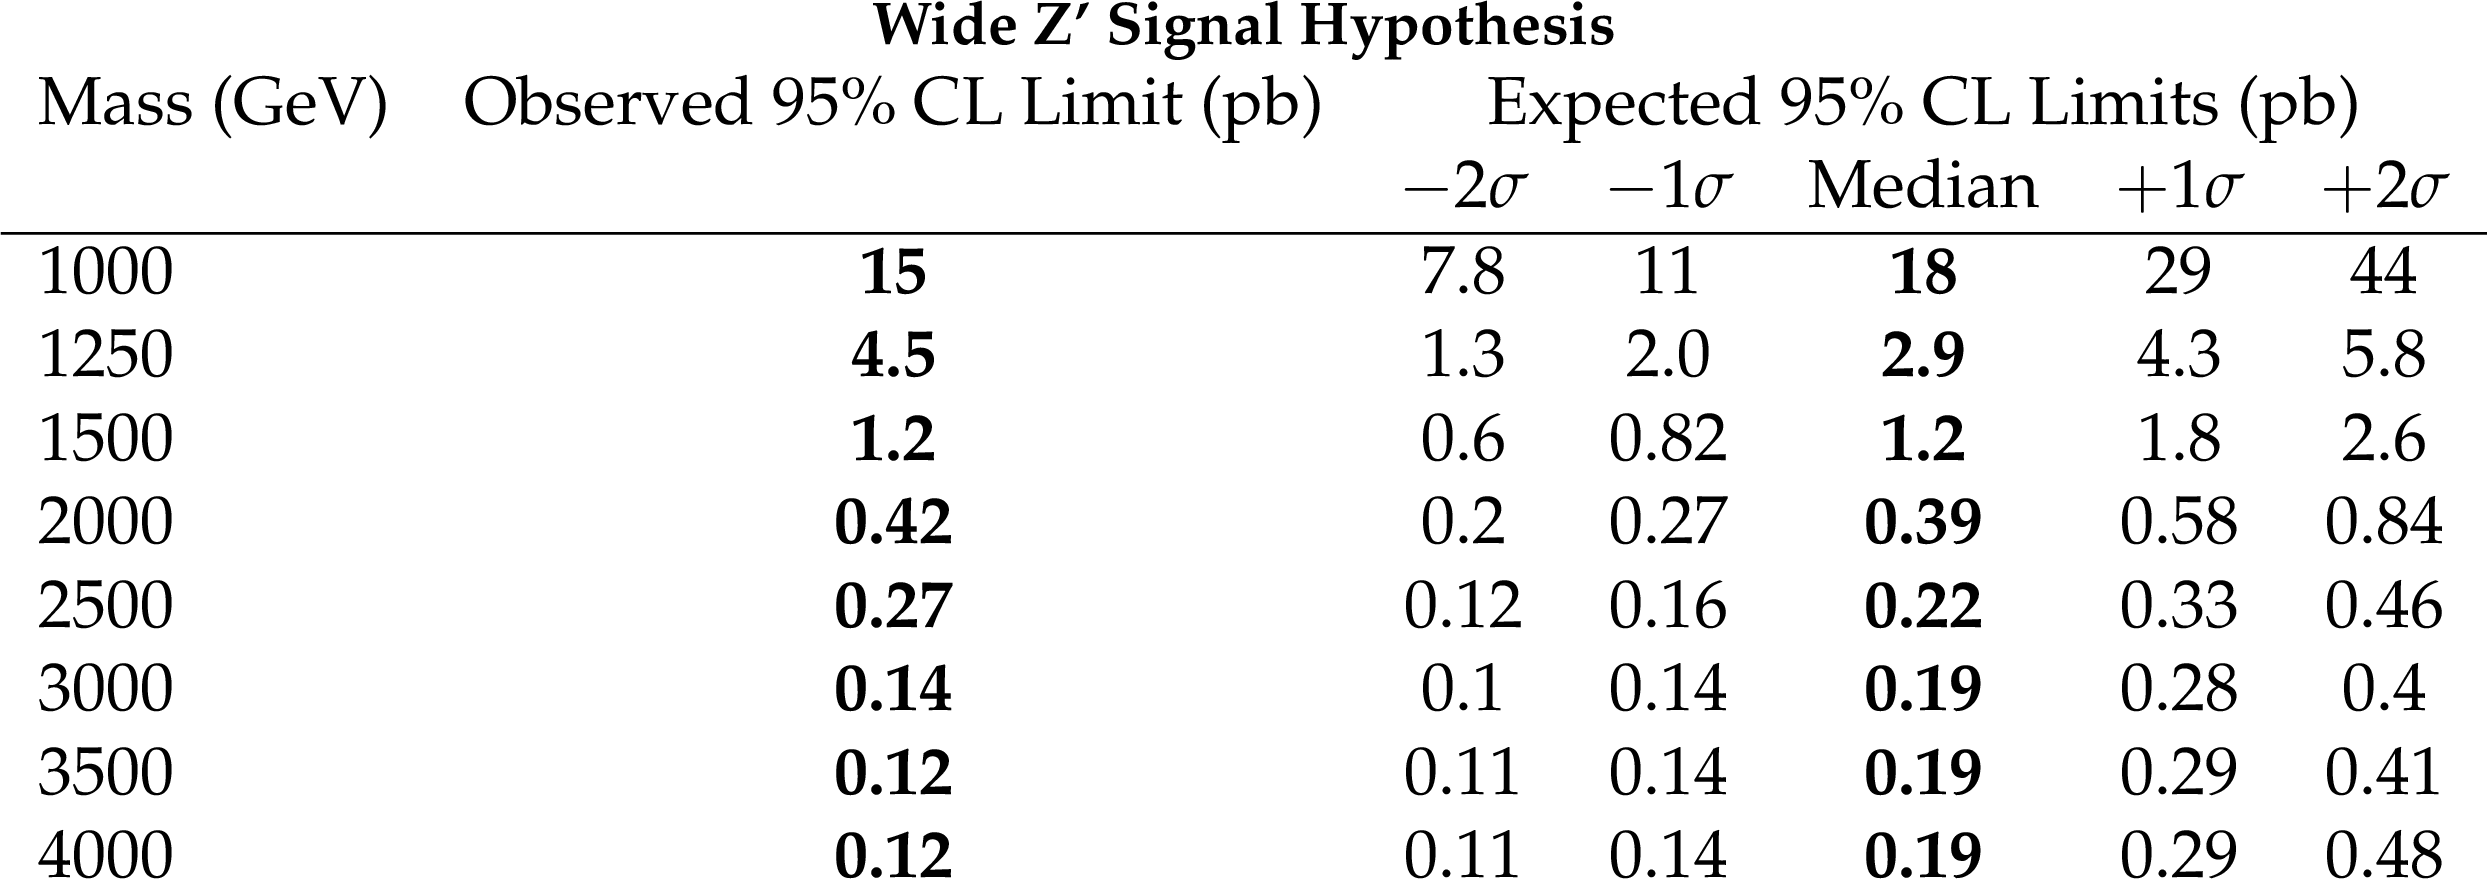
Table of expected and observed 95% CL cross section limits, for the wide (10% width) Z' signal hypothesis.:
|
png pdf |
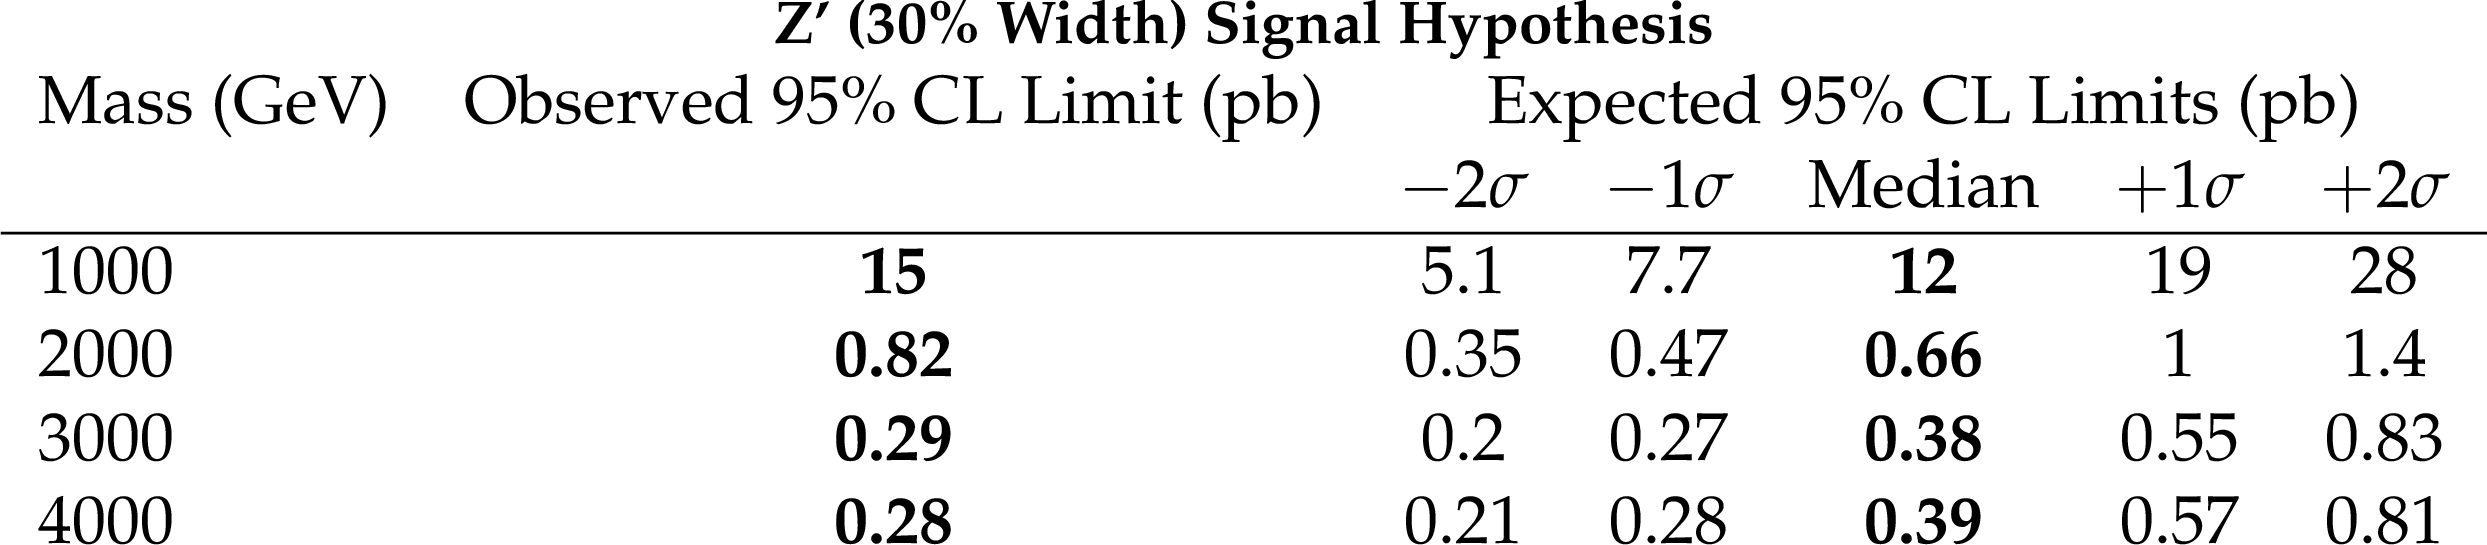
Table of expected and observed 95% CL cross section limits, for the extra wide (30% width) Z' signal hypothesis.:
|

png pdf |
Table of expected and observed 95% CL cross section limits, for the RS Gluon signal hypothesis.:
|
| Summary |
| We have performed the first search for top quark pair resonances in the all-hadronic channel using $\sqrt{s} = $ 13 TeV data from the LHC Run 2. The search uses a new top-tagging algorithm, optimized for Run 2 analyses, using the jet mass from the modified mass-drop tagger and N-subjettiness jet substructure variables along with subjet b-tagging. We estimate the non-top multijet background using a mistag rate measured in a control region depleted of $\mathrm{ t \bar{t} }$ events. No excess above the standard model expectation is observed, and we set limits on the production cross sections of Z' bosons and RS gluons, for signal models with varying widths. For some signal models, we eclipse previous exclusion limits, excluding Z' bosons with masses up to 3.3 (3.8) TeV, for Z' relative widths of 10% (30%) of their masses. |
| References | ||||
| 1 | S. Dimopoulos and H. Georgi | Softly Broken Supersymmetry and SU(5) | Nucl. Phys. B 193 (1981) 150 | |
| 2 | S. Weinberg | Implications of Dynamical Symmetry Breaking | PRD 13 (1976) 974 | |
| 3 | L. Susskind | Dynamics of Spontaneous Symmetry Breaking in the Weinberg- Salam Theory | PRD 20 (1979) 2619 | |
| 4 | C. T. Hill and S. J. Parke | Top production: Sensitivity to new physics | PRD 49 (1994) 4454 | hep-ph/9312324 |
| 5 | R. S. Chivukula, B. A. Dobrescu, H. Georgi, and C. T. Hill | Top quark seesaw theory of electroweak symmetry breaking | PRD 59 (1999) 075003 | hep-ph/9809470 |
| 6 | N. Arkani-Hamed, A. G. Cohen, and H. Georgi | Electroweak symmetry breaking from dimensional deconstruction | PLB 513 (2001) 232 | hep-ph/0105239 |
| 7 | N. Arkani-Hamed, S. Dimopoulos, and G. R. Dvali | The hierarchy problem and new dimensions at a millimeter | PLB 429 (1998) 263 | hep-ph/9803315 |
| 8 | L. Randall and R. Sundrum | A large mass hierarchy from a small extra dimension | PRL 83 (1999) 3370--3373 | hep-ph/9905221 |
| 9 | L. Randall and R. Sundrum | An alternative to compactification | PRL 83 (1999) 4690--4693 | hep-th/9906064 |
| 10 | J. Rosner | Prominent Decay Modes of a Leptophobic Z' | PRB 387 (1996) 113--117 | 9607207v3 |
| 11 | CDF Collaboration | Cross Section for Topcolor Z' decaying to top-antitop | Technical Report FERMILAB-FN-0687, Fermilab | 9911288 |
| 12 | K. Lynch, M. Narain, E. Simmons, and S. Mrenna | Finding Z' bosons coupled preferentially to the third family at CERN LEP and the Fermilab Tevatron | PRD 63 (2001) 035006 | 0007286 |
| 13 | K. Agashe et al. | LHC signals for warped electroweak neutral gauge bosons | PRD 76 (2007) 115015 | 0810.1497 |
| 14 | K. Agashe et al. | LHC signals from warped extra dimensions | PRD 77 (2008) 015003 | 0612015 |
| 15 | A. Faraggi and M. Guzzi | Extra $ Z' $s and $ W' $s in heterotic-string derived models | EPJC 75 (2015) 537 | 1507.07406 |
| 16 | T. Li, J. Maxin, V. Mayes, and D. Nanopoulos | Diboson Excesses in Leptophobic $ U(1)_{\mathrm{LP}} $ Models from String Theories | PRD 93 (2016) 045007 | 1509.06821 |
| 17 | CMS Collaboration | Search for new physics in high mass diphoton events in proton-proton collisions at $ \sqrt{s} $ = 13 TeV | CMS-PAS-EXO-15-004 | CMS-PAS-EXO-15-004 |
| 18 | CDF Collaboration | Search for resonant production of $ t\overline{t} $ pairs in $ 4.8\text{ }\text{ }{\mathrm{fb}}^{\mathbf{-}1} $ of integrated luminosity of $ p\overline{p} $ collisions at $ \sqrt{s}\mathbf{=}1.96\text{ }\text{ }\mathrm{TeV} $ | PRD 84 (2011) 072004 | 1107.5063 |
| 19 | D0 Collaboration | Search for $ t\overline{t} $ Resonances in the Lepton+Jets Final State in $ p\overline{p} $ Collisions at $ \sqrt{s} $ = 1.96 TeV | PRB 668 (2008) 98--104 | 0804.3664 |
| 20 | CMS Collaboration | Search for anomalous $ t\overline{t} $ production in the highly-boosed all-hadronic final state | JHEP 09 (2012) 29 | CMS-EXO-11-006 1204.2488 |
| 21 | CMS Collaboration | Search for resonant $ t\overline{t} $ production in lepton+jets events in $ pp $ collisions at $ \sqrt{s} $ = 7 TeV | JHEP 12 (2012) 15 | CMS-TOP-12-017 1209.4397 |
| 22 | ATLAS Collaboration | Search for resonances decaying into top-quark pairs using fully hadronic decays in $ pp $ collisions with ATLAS at $ \sqrt{s} $ = 7 TeV | JHEP 01 (2013) 116 | 1211.2202 |
| 23 | ATLAS Collaboration | A search for $ t\overline{t} $ resonances in lepton+jets events with highly-boosed top quarks collected in $ pp $ collisions with ATLAS at $ \sqrt{s} $ = 7 TeV | JHEP 09 (2012) 41 | 1207.2409 |
| 24 | CMS Collaboration | Search for Anomalous Top Quark Pair Production in the Boosted All-Hadronic Final State using pp Collisions at $ \sqrt{s} = 8 $ TeV | CMS-PAS-B2G-12-005 | CMS-PAS-B2G-12-005 |
| 25 | CMS Collaboration | Searches for new physics using the $ t\overline{t} $ invariant mass distribution in $ pp $ collisions at $ \sqrt{s} $ = 8 TeV | PRL 111 (2013) 211804 | CMS-B2G-13-001 1309.2030 |
| 26 | CMS Collaboration | Search for resonant $ t\overline{t} $ production in proton-proton collisions at $ \sqrt{s} $ = 8 TeV | PRD 93 (2016) 012001 | CMS-B2G-13-008 1506.03062 |
| 27 | ATLAS Collaboration | A search for $ t\overline{t} $ resonances using lepton-plus-jets events in proton-proton collisions at $ \sqrt{s} $ = 8 TeV with the ATLAS detector | JHEP 08 (2015) 148 | 1505.07018 |
| 28 | CMS Collaboration | Search for $ t\overline{t} $ resonances in boosted semileptonic final states in pp collisions at $ \sqrt{s} $ = 13 TeV | CMS-PAS-B2G-15-002 | CMS-PAS-B2G-15-002 |
| 29 | ATLAS Collaboration Collaboration | Search for heavy particles decaying to pairs of highly-boosted top quarks using lepton-plus-jets events in proton-proton collisions at $ \sqrt{s} $ = 13 TeV with the ATLAS detector | ATLAS Conference Note ATLAS-CONF-2016-014, CERN | |
| 30 | CMS Collaboration | Top Tagging with New Approaches | CDS | |
| 31 | M. Dasgupta, A. Fregoso, S. Marzani, and G. P. Salam | Towards an understanding of jet substructure | JHEP 09 (2013) 029 | 1307.0007 |
| 32 | J. Thaler and K. Van Tilburg | Identifying Boosted Objects with N-subjettiness | JHEP 1103 (2011) 015 | 1011.2268 |
| 33 | J. Thaler and K. Van Tilburg | Maximizing Boosted Top Identification by Minimizing N-subjettiness | JHEP 1202 (2012) 093 | 1108.2701 |
| 34 | CMS Collaboration | Performance of b tagging at sqrt(s)=8 TeV in multijet, ttbar and boosted topology events | CMS-PAS-BTV-13-001 | CMS-PAS-BTV-13-001 |
| 35 | CMS Collaboration | The CMS experiment at the CERN LHC | JINST 3 (2008) S08004 | CMS-00-001 |
| 36 | CMS Collaboration | Particle--Flow Event Reconstruction in CMS and Performance for Jets, Taus, and $ E_{\mathrm{T}}^{\text{miss}} $ | CDS | |
| 37 | CMS Collaboration | Commissioning of the Particle-flow Event Reconstruction with the first LHC collisions recorded in the CMS detector | CDS | |
| 38 | M. Cacciari, G. P. Salam, and G. Soyez | The anti-kt jet clustering algorithm | JHEP 04 (2008) 063 | 0802.1189 |
| 39 | M. Cacciari and G. P. Salam | Dispelling the N**3 myth for the k(t) jet-finder | PLB 641 (2006) 57 | hep-ph/0512210 |
| 40 | M. Cacciari, G. P. Salam, and G. Soyez | FastJet user manual | Eur.Phys.J. C 72 (2012) 1896 | 1111.6097 |
| 41 | M. Cacciari and G. P. Salam | Pileup subtraction using jet areas | PLB 659 (2008) 119 | 0707.1378 |
| 42 | CMS Collaboration | Determination of jet energy calibration and transverse momentum resolution in CMS | JINST 6 (2011) P11002 | CMS-JME-10-011 1107.4277 |
| 43 | Y. L. Dokshitzer, G. D. Leder, S. Moretti, and B. R. Webber | Better Jet Clustering Algorithms | JHEP 08 (1997) 001 | hep-ph/9707323 |
| 44 | M. Wobisch and T. Wengler | Hadronization corrections to jet cross sections in deep- inelastic scattering | hep-ph/9907280 | |
| 45 | A. J. Larkoski, S. Marzani, G. Soyez, and J. Thaler | Soft Drop | JHEP 05 (2014) 146 | 1402.2657 |
| 46 | CMS Collaboration | Identification of b-quark jets with the CMS experiment | JINST 8 (2013) P04013 | CMS-BTV-12-001 1211.4462 |
| 47 | J. Alwall et al. | The automated computation of tree-level and next-to-leading order differential cross sections, and their matching to parton shower simulations | JHEP 07 (2014) 079 | 1405.0301 |
| 48 | T. Sj\"ostrand et al. | An Introduction to PYTHIA 8.2 | CPC 191 (2015) 159 | 1410.3012 |
| 49 | M. L. Mangano, M. Moretti, F. Piccinini, and M. Treccani | Matching Matrix Elements and Shower Evolution for Top-Quark Production in Hadronic Collisions | JHEP 01 (2007) 013 | hep-ph/0611129 |
| 50 | P. Nason | A New method for combining NLO QCD with shower Monte Carlo algorithms | JHEP 11 (2004) 040 | hep-ph/0409146 |
| 51 | S. Frixione, P. Nason, and C. Oleari | Matching NLO QCD computations with Parton Shower simulations: the POWHEG method | JHEP 11 (2007) 070 | 0709.2092 |
| 52 | S. Alioli, P. Nason, C. Oleari, and E. Re | A general framework for implementing NLO calculations in shower Monte Carlo programs: the POWHEG BOX | JHEP 06 (2010) 043 | 1002.2581 |
| 53 | S. Frixione, P. Nason, and G. Ridolfi | A Positive-weight next-to-leading-order Monte Carlo for heavy flavour hadroproduction | JHEP 09 (2007) 126 | 0707.3088 |
| 54 | E. Re | Single-top Wt-channel production matched with parton showers using the POWHEG method | EPJC 71 (2011) 1547 | 1009.2450 |
| 55 | M. Czakon and A. Mitov | Top++: A Program for the Calculation of the Top-Pair Cross-Section at Hadron Colliders | CPC 185 (2014) 2930 | 1112.5675 |
| 56 | NNPDF Collaboration | Parton distributions for the LHC Run II | JHEP 04 (2015) 040 | 1410.8849 |
| 57 | CMS Collaboration | Event generator tunes obtained from underlying event and multiparton scattering measurements | EPJC 76 (2016), no. 3, 155 | CMS-GEN-14-001 1512.00815 |
| 58 | CMS Collaboration | Measurement of the differential cross section for top quark pair production in pp collisions at sqrt(s) = 8 TeV | CMS-TOP-12-028 1505.04480 |
|
|
|
Compact Muon Solenoid LHC, CERN |
|

|

|

|

|

|