

Compact Muon Solenoid
LHC, CERN
| CMS-PAS-B2G-17-007 | ||
| Search for single production of a vector-like T quark decaying to a Z boson and a top quark in proton-proton collisions at $\sqrt{s} = $ 13 TeV | ||
| CMS Collaboration | ||
| March 2017 | ||
| Abstract: A search for the single production of a vector-like quark, T, decaying into a Z boson and a top quark is presented. The Z boson decays leptonically while the top quark decays hadronically. The search is performed using data collected by the CMS experiment at the LHC in proton-proton collisions at $\sqrt{s} =$ 13 TeV in 2016, corresponding to an integrated luminosity of 35.9 fb$^{-1}$. The presence of jets produced in the forward region of the detector is a particular characteristic of the single production of vector-like quarks and is utilized in the analysis. Limits are set for different hypotheses, from negligible width to a width equal to 30% of the resonance mass. An additional production mode is also studied for the T quark, through the decay of a heavy Z' resonance that decays to Tt. The product of cross section and branching fraction above values in the range 0.27-0.04 pb is excluded at 95% confidence level for the range of resonance mass considered, which is between 0.7 and 1.7 TeV in the case of a T quark with negligible width. A similar sensitivity is observed for widths of up to 30% of the resonance mass. In the case that the T comes from the decay of a Z', limits on the product of cross section and branching fraction are set between 0.13 and 0.06 pb for Z' boson masses in the range from 1.5 to 2.5 TeV. | ||
|
Links:
CDS record (PDF) ;
inSPIRE record ;
CADI line (restricted) ;
These preliminary results are superseded in this paper, PLB 781 (2018) 574. The superseded preliminary plots can be found here. |
||
| Figures & Tables | Summary | Additional Figures & Tables | References | CMS Publications |
|---|
| Figures | |

png pdf |
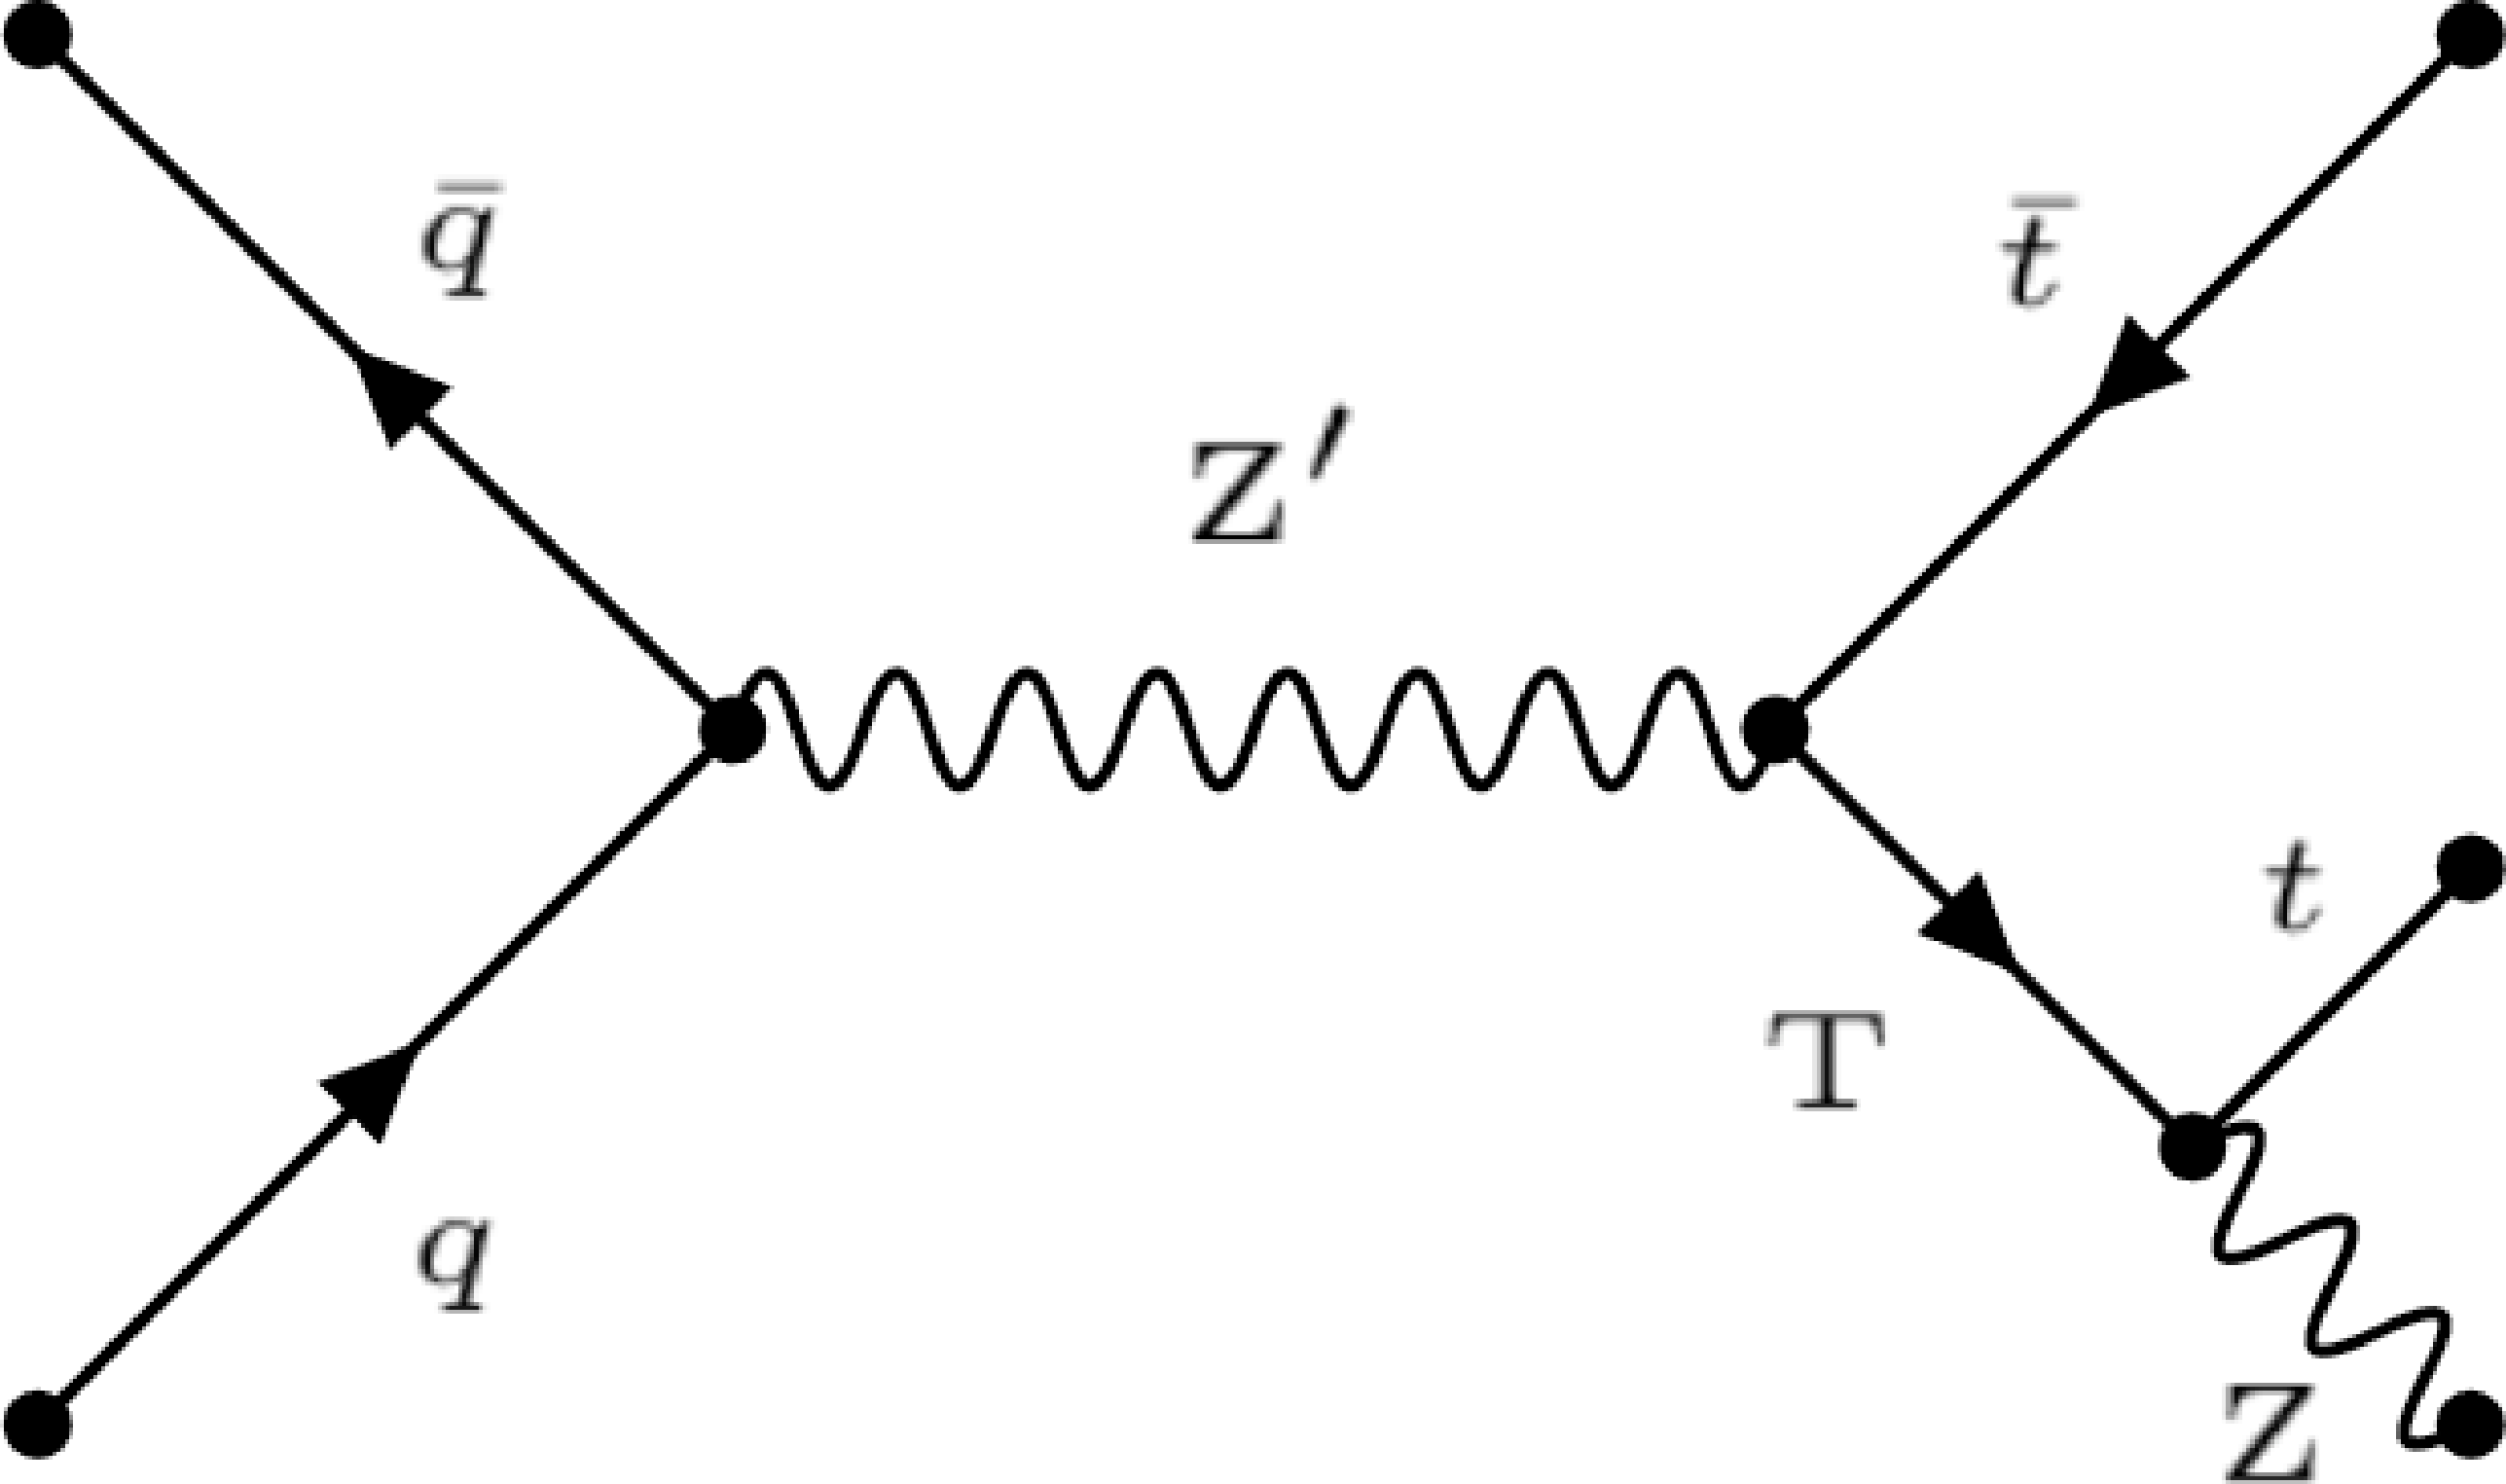
Figure 1:
Leading order Feynman diagram for the production of a single T vector-like quark and its decay to a Z boson and a t quark, produced in association with a b quark (left) and for the production of a Z' boson decaying to Tt (right). |

png pdf |
Figure 1-a:
Leading order Feynman diagram for the production of a single T vector-like quark and its decay to a Z boson and a t quark, produced in association with a b quark. |
png pdf |
Figure 1-b:
Leading order Feynman diagram for the production of a Z' boson decaying to Tt. |

png pdf |
Figure 2:
Comparison between the background estimate (as derived from control regions in the data) and data for the 2 categories where the T is reconstructed in the fully merged topology for events with the Z boson decaying into muons (left) and electrons (right). Background composition is taken from simulation. The uncertainties in the background estimate method include both statistical and systematic components, as described in Section 6. The lower panel in each plot shows the ratio of the data and the background estimation, with the shaded band representing the uncertainties in the background estimate. |
png pdf |
Figure 2-a:
Comparison between the background estimate (as derived from control regions in the data) and data for the 2 categories where the T is reconstructed in the fully merged topology for events with the Z boson decaying into muons. Background composition is taken from simulation. The uncertainties in the background estimate method include both statistical and systematic components, as described in Section 6. The lower panel shows the ratio of the data and the background estimation, with the shaded band representing the uncertainties in the background estimate. |
png pdf |
Figure 2-b:
Comparison between the background estimate (as derived from control regions in the data) and data for the 2 categories where the T is reconstructed in the fully merged topology for events with the Z boson decaying into electrons. Background composition is taken from simulation. The uncertainties in the background estimate method include both statistical and systematic components, as described in Section 6. The lower panel shows the ratio of the data and the background estimation, with the shaded band representing the uncertainties in the background estimate. |

png pdf |
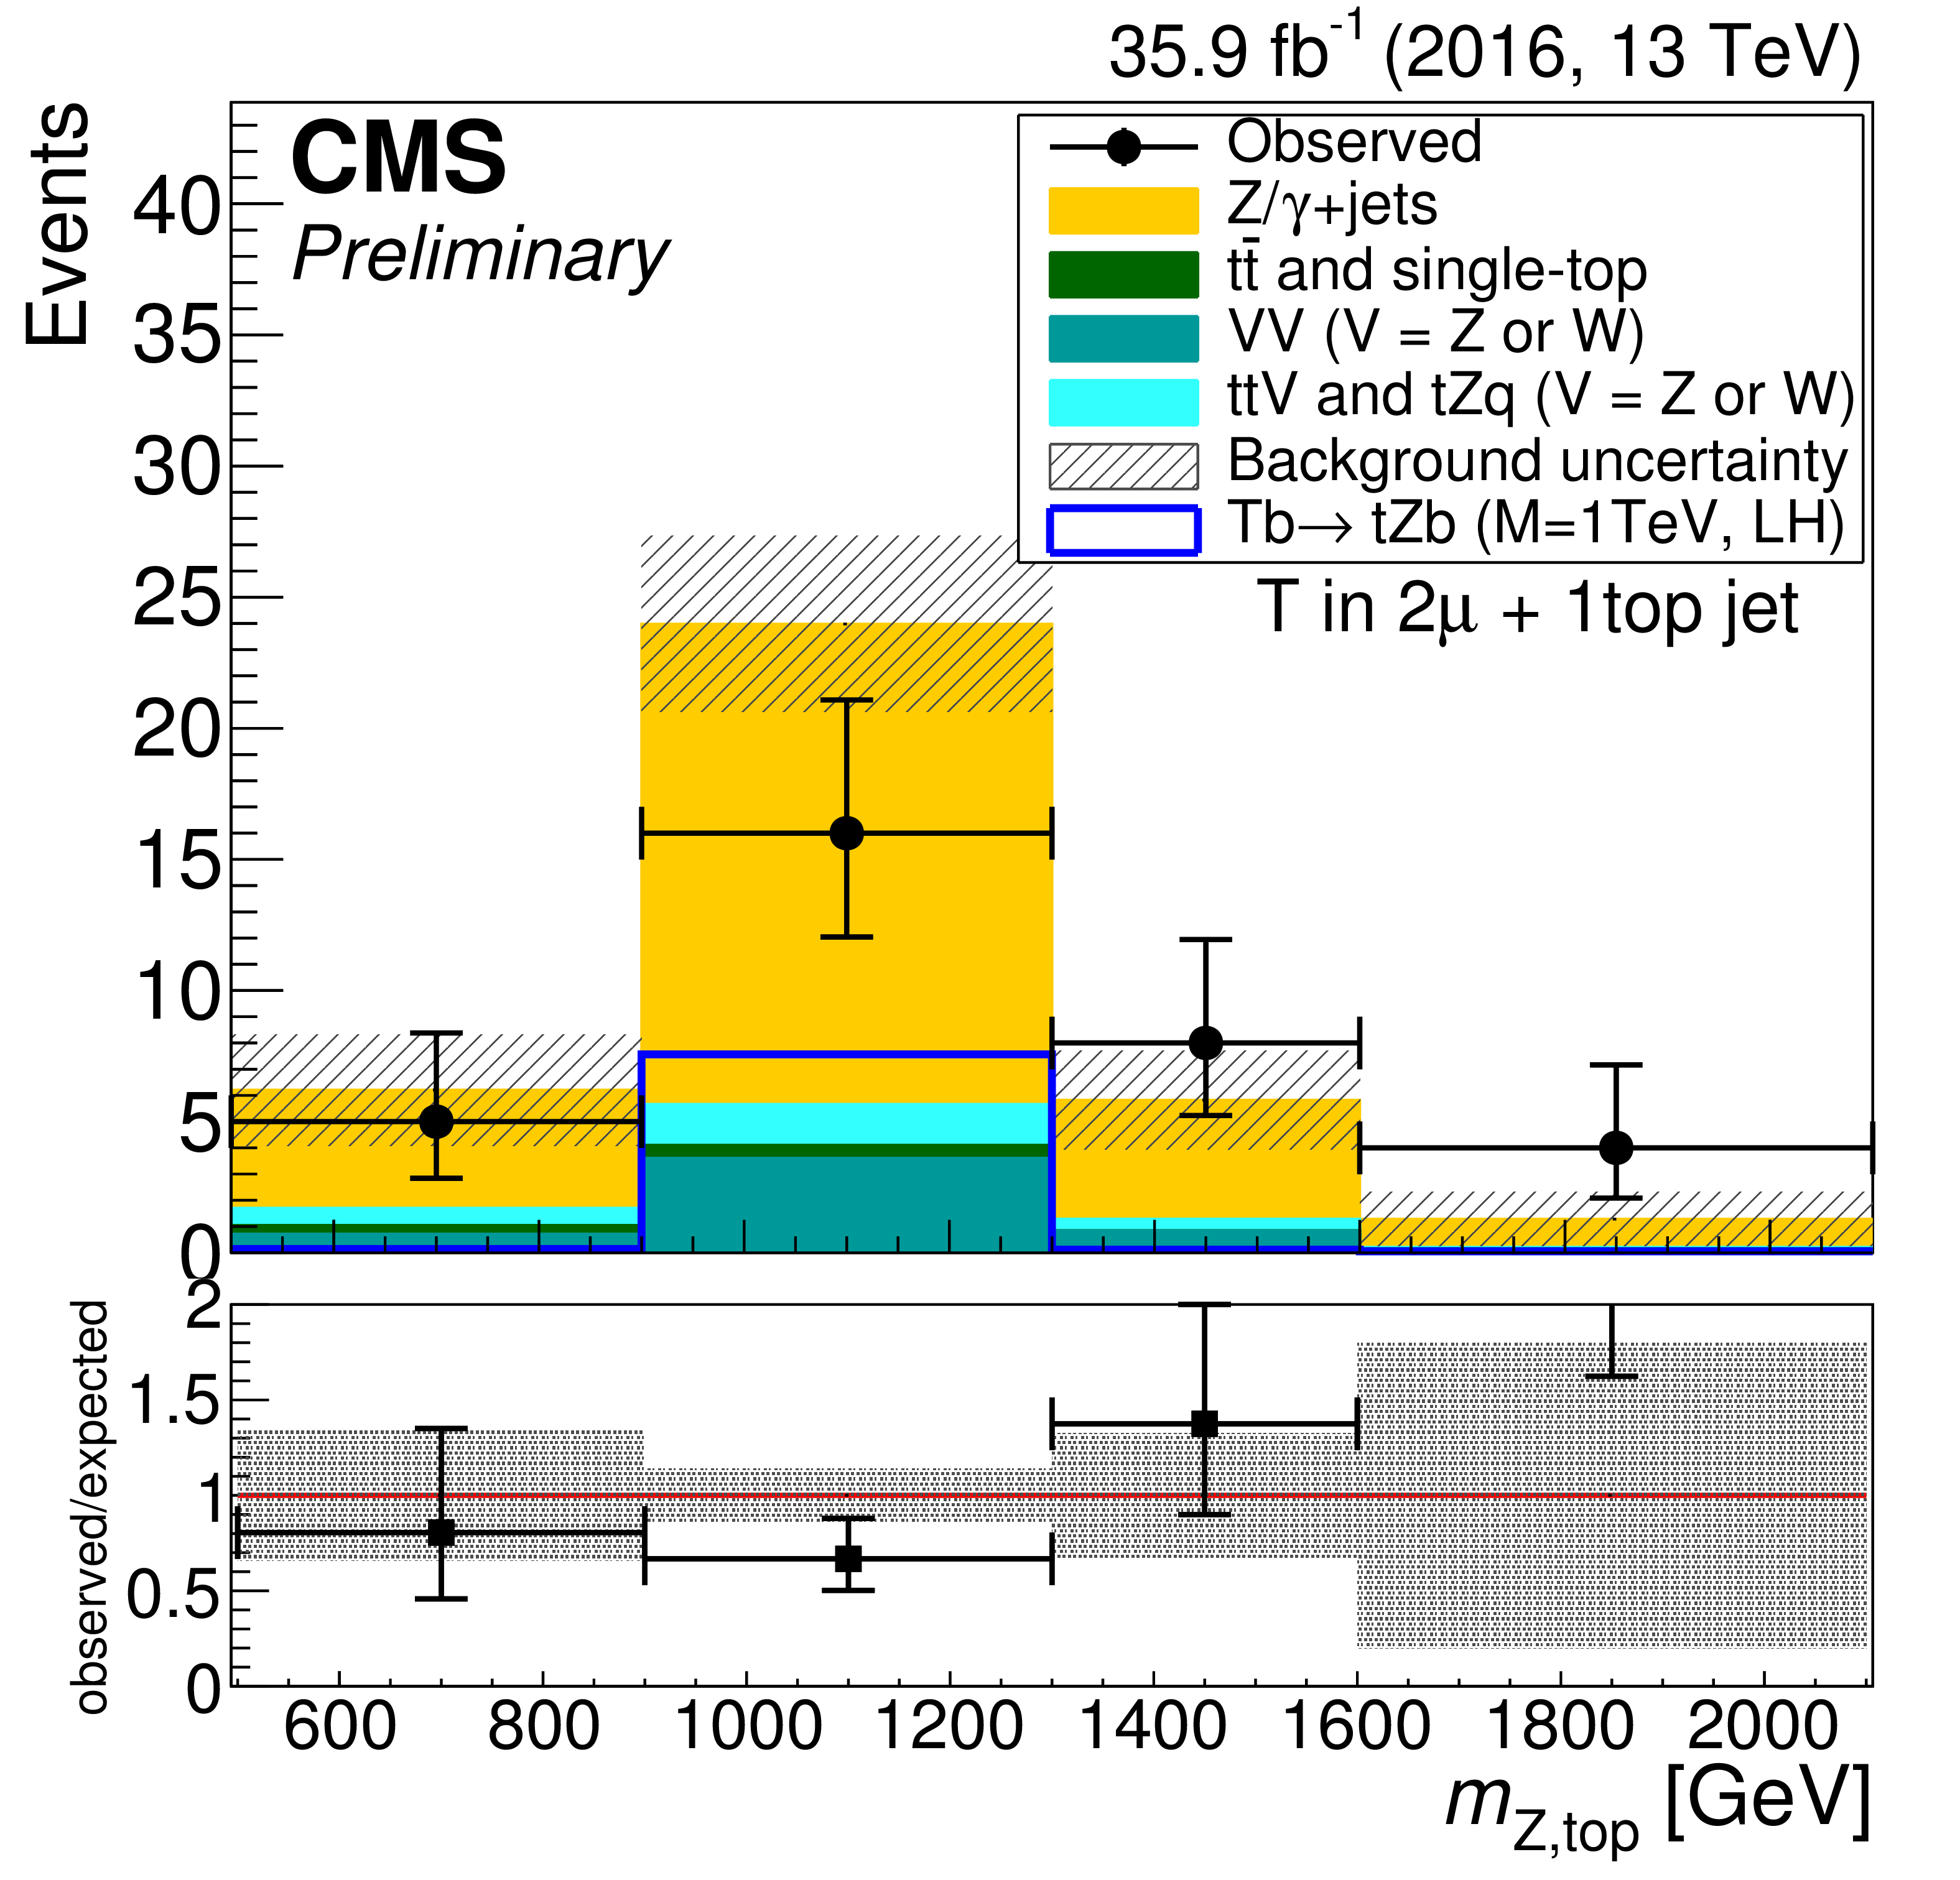
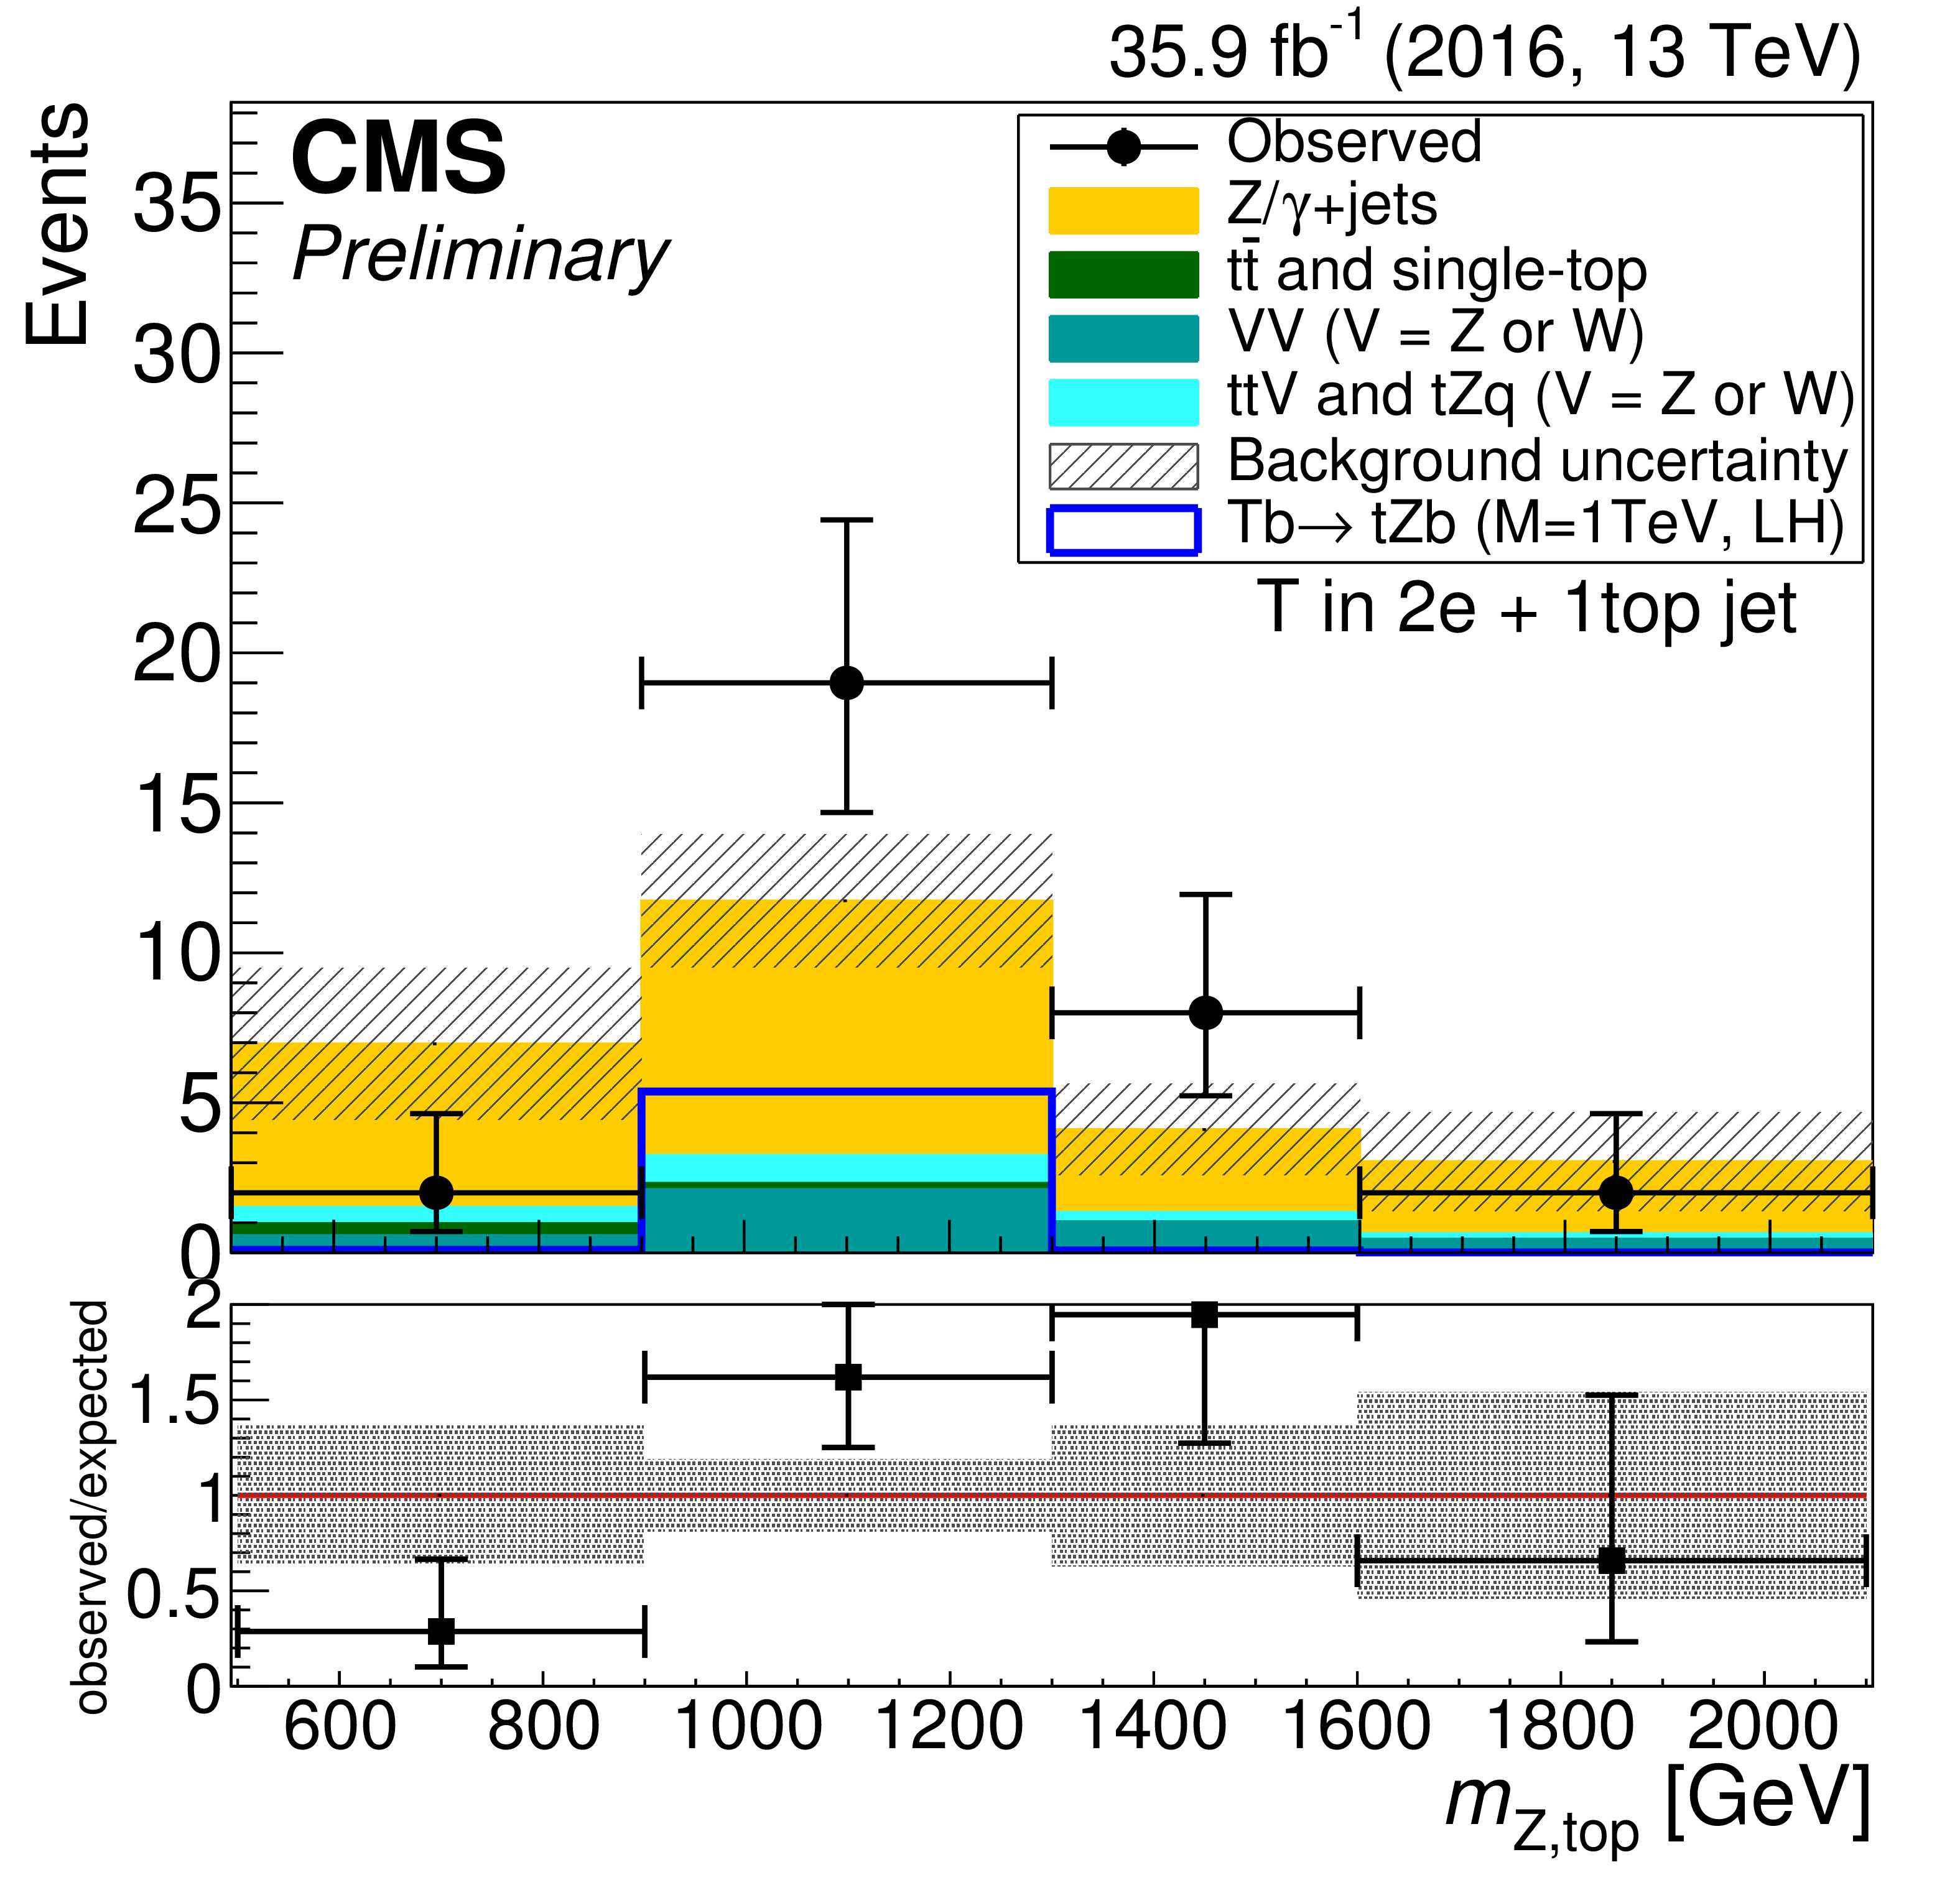
Figure 3:
Comparison between the background estimate (as derived from control regions in the data) and data for the 4 categories where the T is reconstructed in the partially merged topology for events with the Z boson decaying into muons (left) and electrons (right) and zero (at least one) forward jets on the top (bottom). Background composition is taken from simulation. The uncertainties in the background estimate method include both statistical and systematic components, as described in Section 6. The lower panel in each plot shows the ratio of the data and the background estimation, with the shaded band representing the uncertainties in the background estimate. |

png pdf |
Figure 3-a:
Comparison between the background estimate (as derived from control regions in the data) and data for the 4 categories where the T is reconstructed in the partially merged topology for events with the Z boson decaying into muons and zero forward jet. Background composition is taken from simulation. The uncertainties in the background estimate method include both statistical and systematic components, as described in Section 6. The lower panel shows the ratio of the data and the background estimation, with the shaded band representing the uncertainties in the background estimate. |

png pdf |
Figure 3-b:
Comparison between the background estimate (as derived from control regions in the data) and data for the 4 categories where the T is reconstructed in the partially merged topology for events with the Z boson decaying into electrons and zero forward jet. Background composition is taken from simulation. The uncertainties in the background estimate method include both statistical and systematic components, as described in Section 6. The lower panel shows the ratio of the data and the background estimation, with the shaded band representing the uncertainties in the background estimate. |
png pdf |
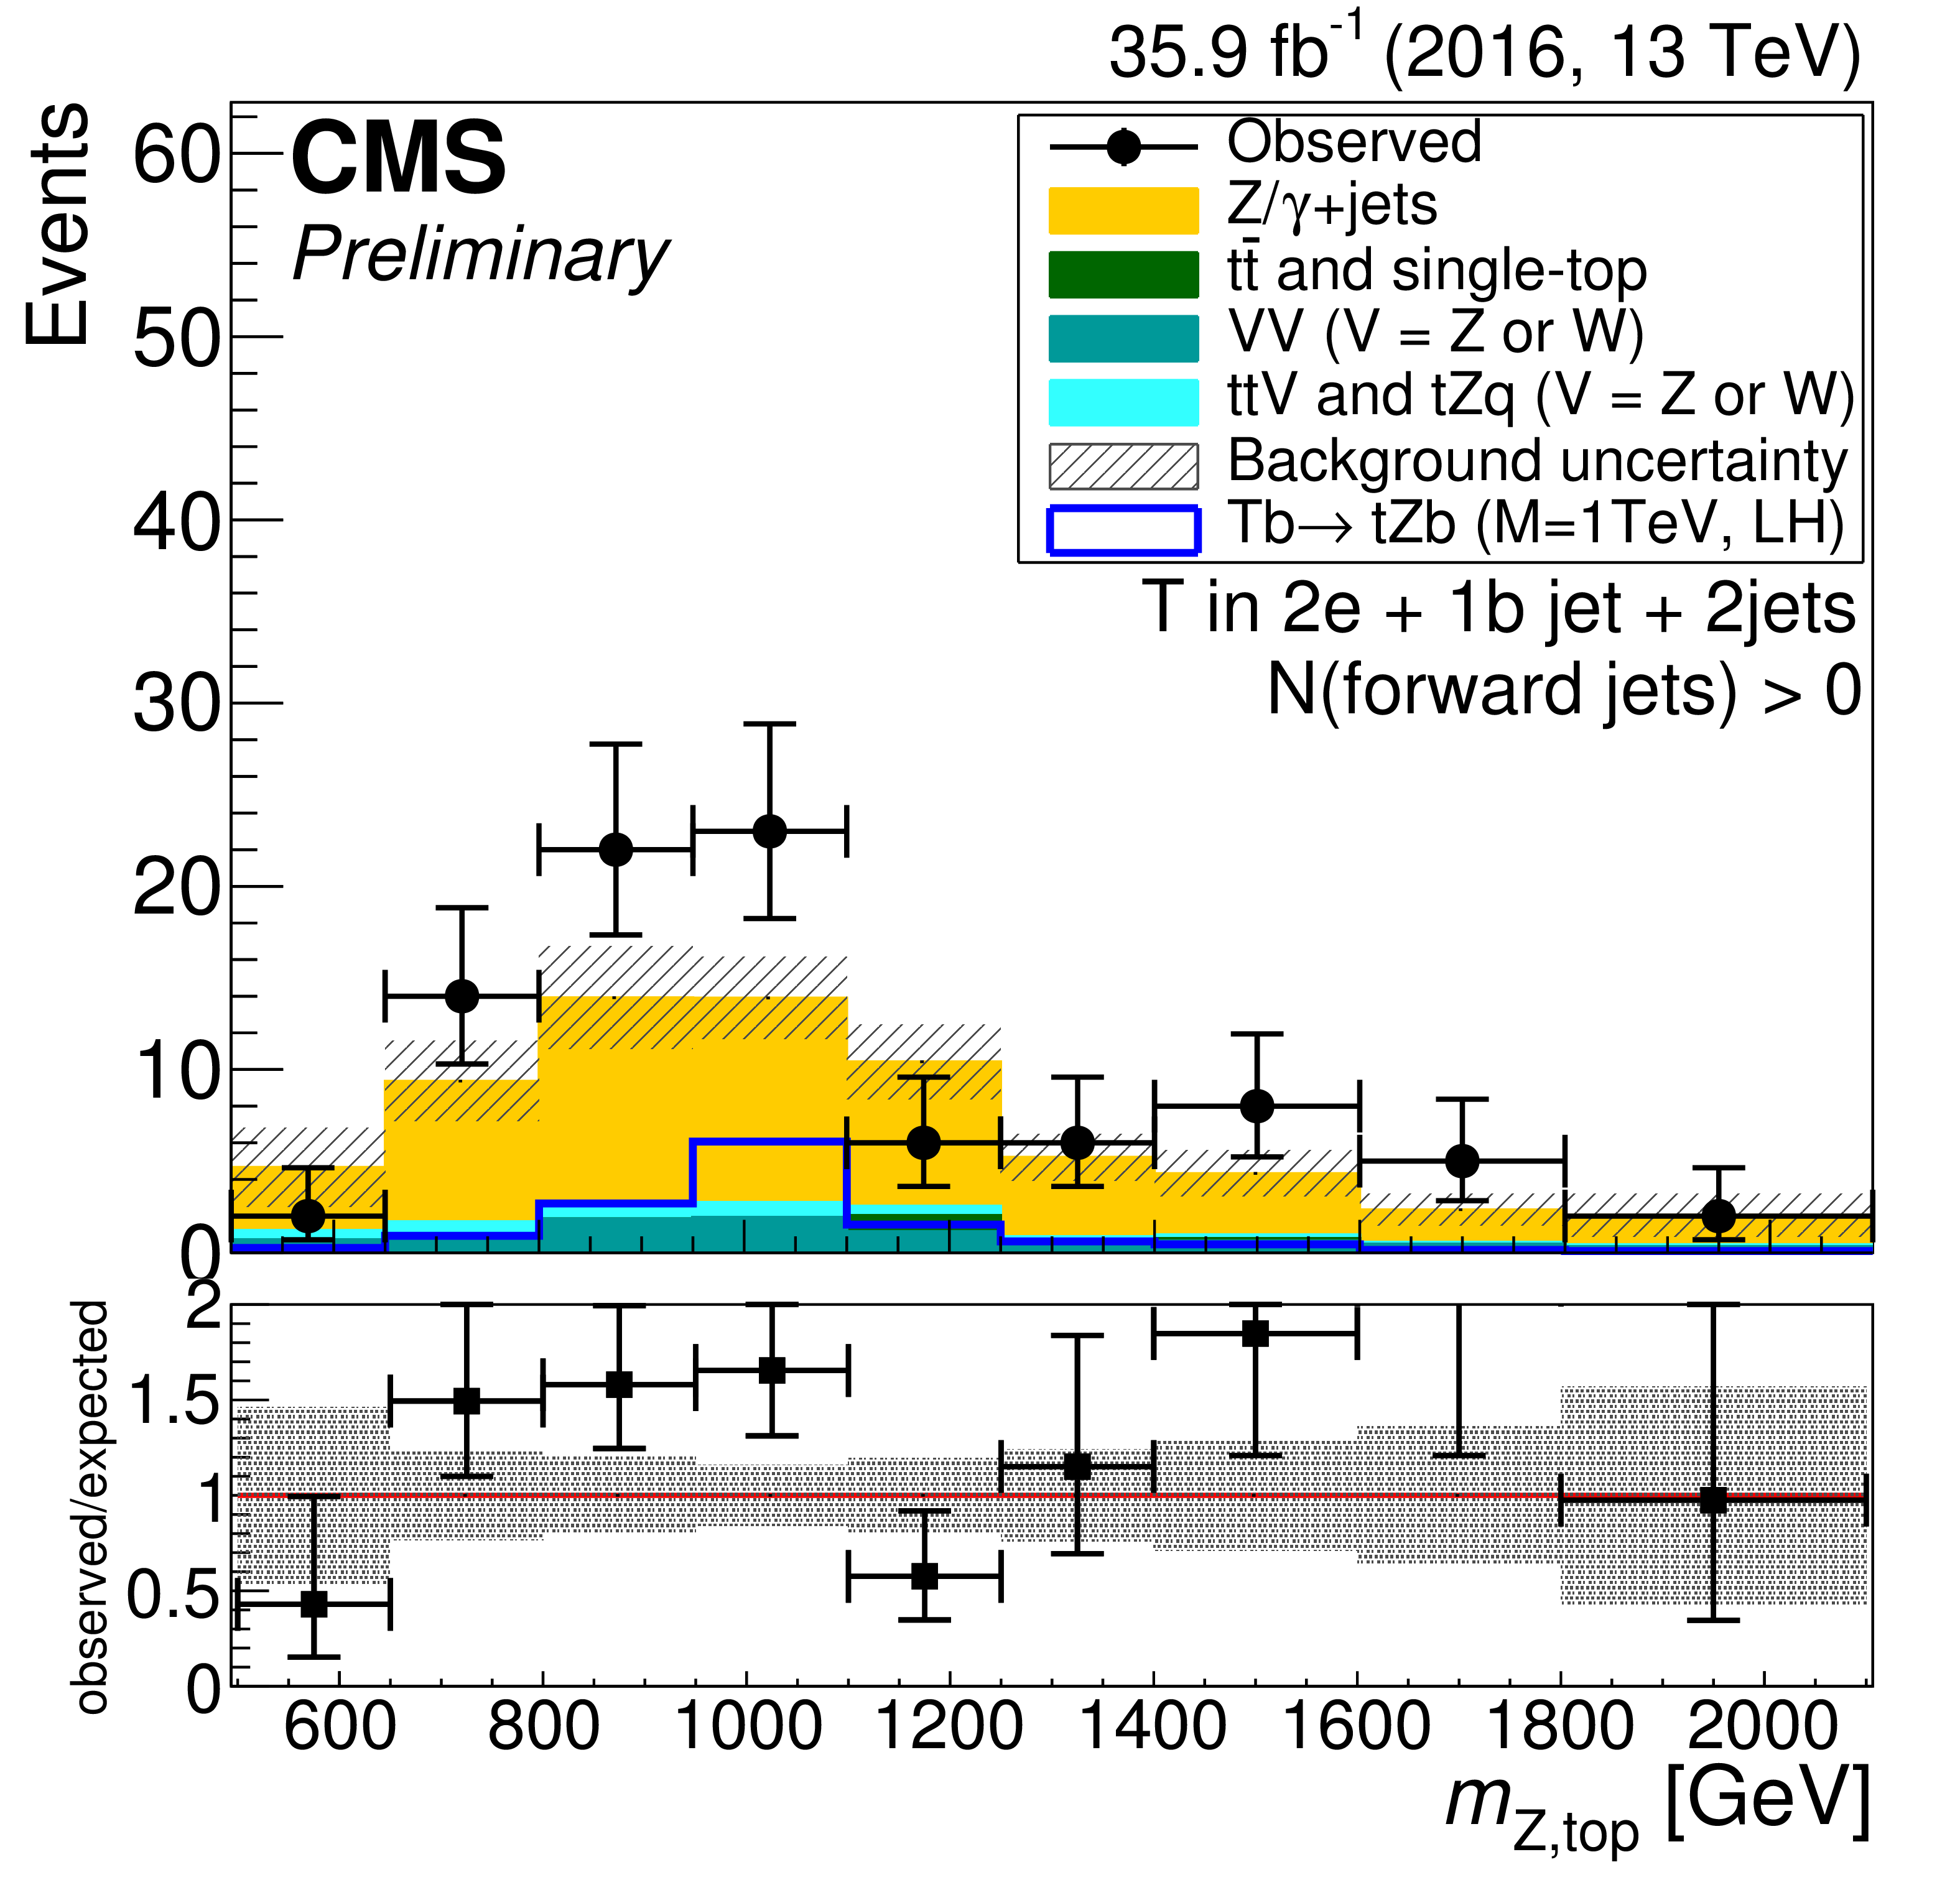
Figure 3-c:
Comparison between the background estimate (as derived from control regions in the data) and data for the 4 categories where the T is reconstructed in the partially merged topology for events with the Z boson decaying into muons and at least one forward jet. Background composition is taken from simulation. The uncertainties in the background estimate method include both statistical and systematic components, as described in Section 6. The lower panel shows the ratio of the data and the background estimation, with the shaded band representing the uncertainties in the background estimate. |

png pdf |
Figure 3-d:
Comparison between the background estimate (as derived from control regions in the data) and data for the 4 categories where the T is reconstructed in the partially merged topology for events with the Z boson decaying into electrons and at least one forward jet. Background composition is taken from simulation. The uncertainties in the background estimate method include both statistical and systematic components, as described in Section 6. The lower panel shows the ratio of the data and the background estimation, with the shaded band representing the uncertainties in the background estimate. |

png pdf |
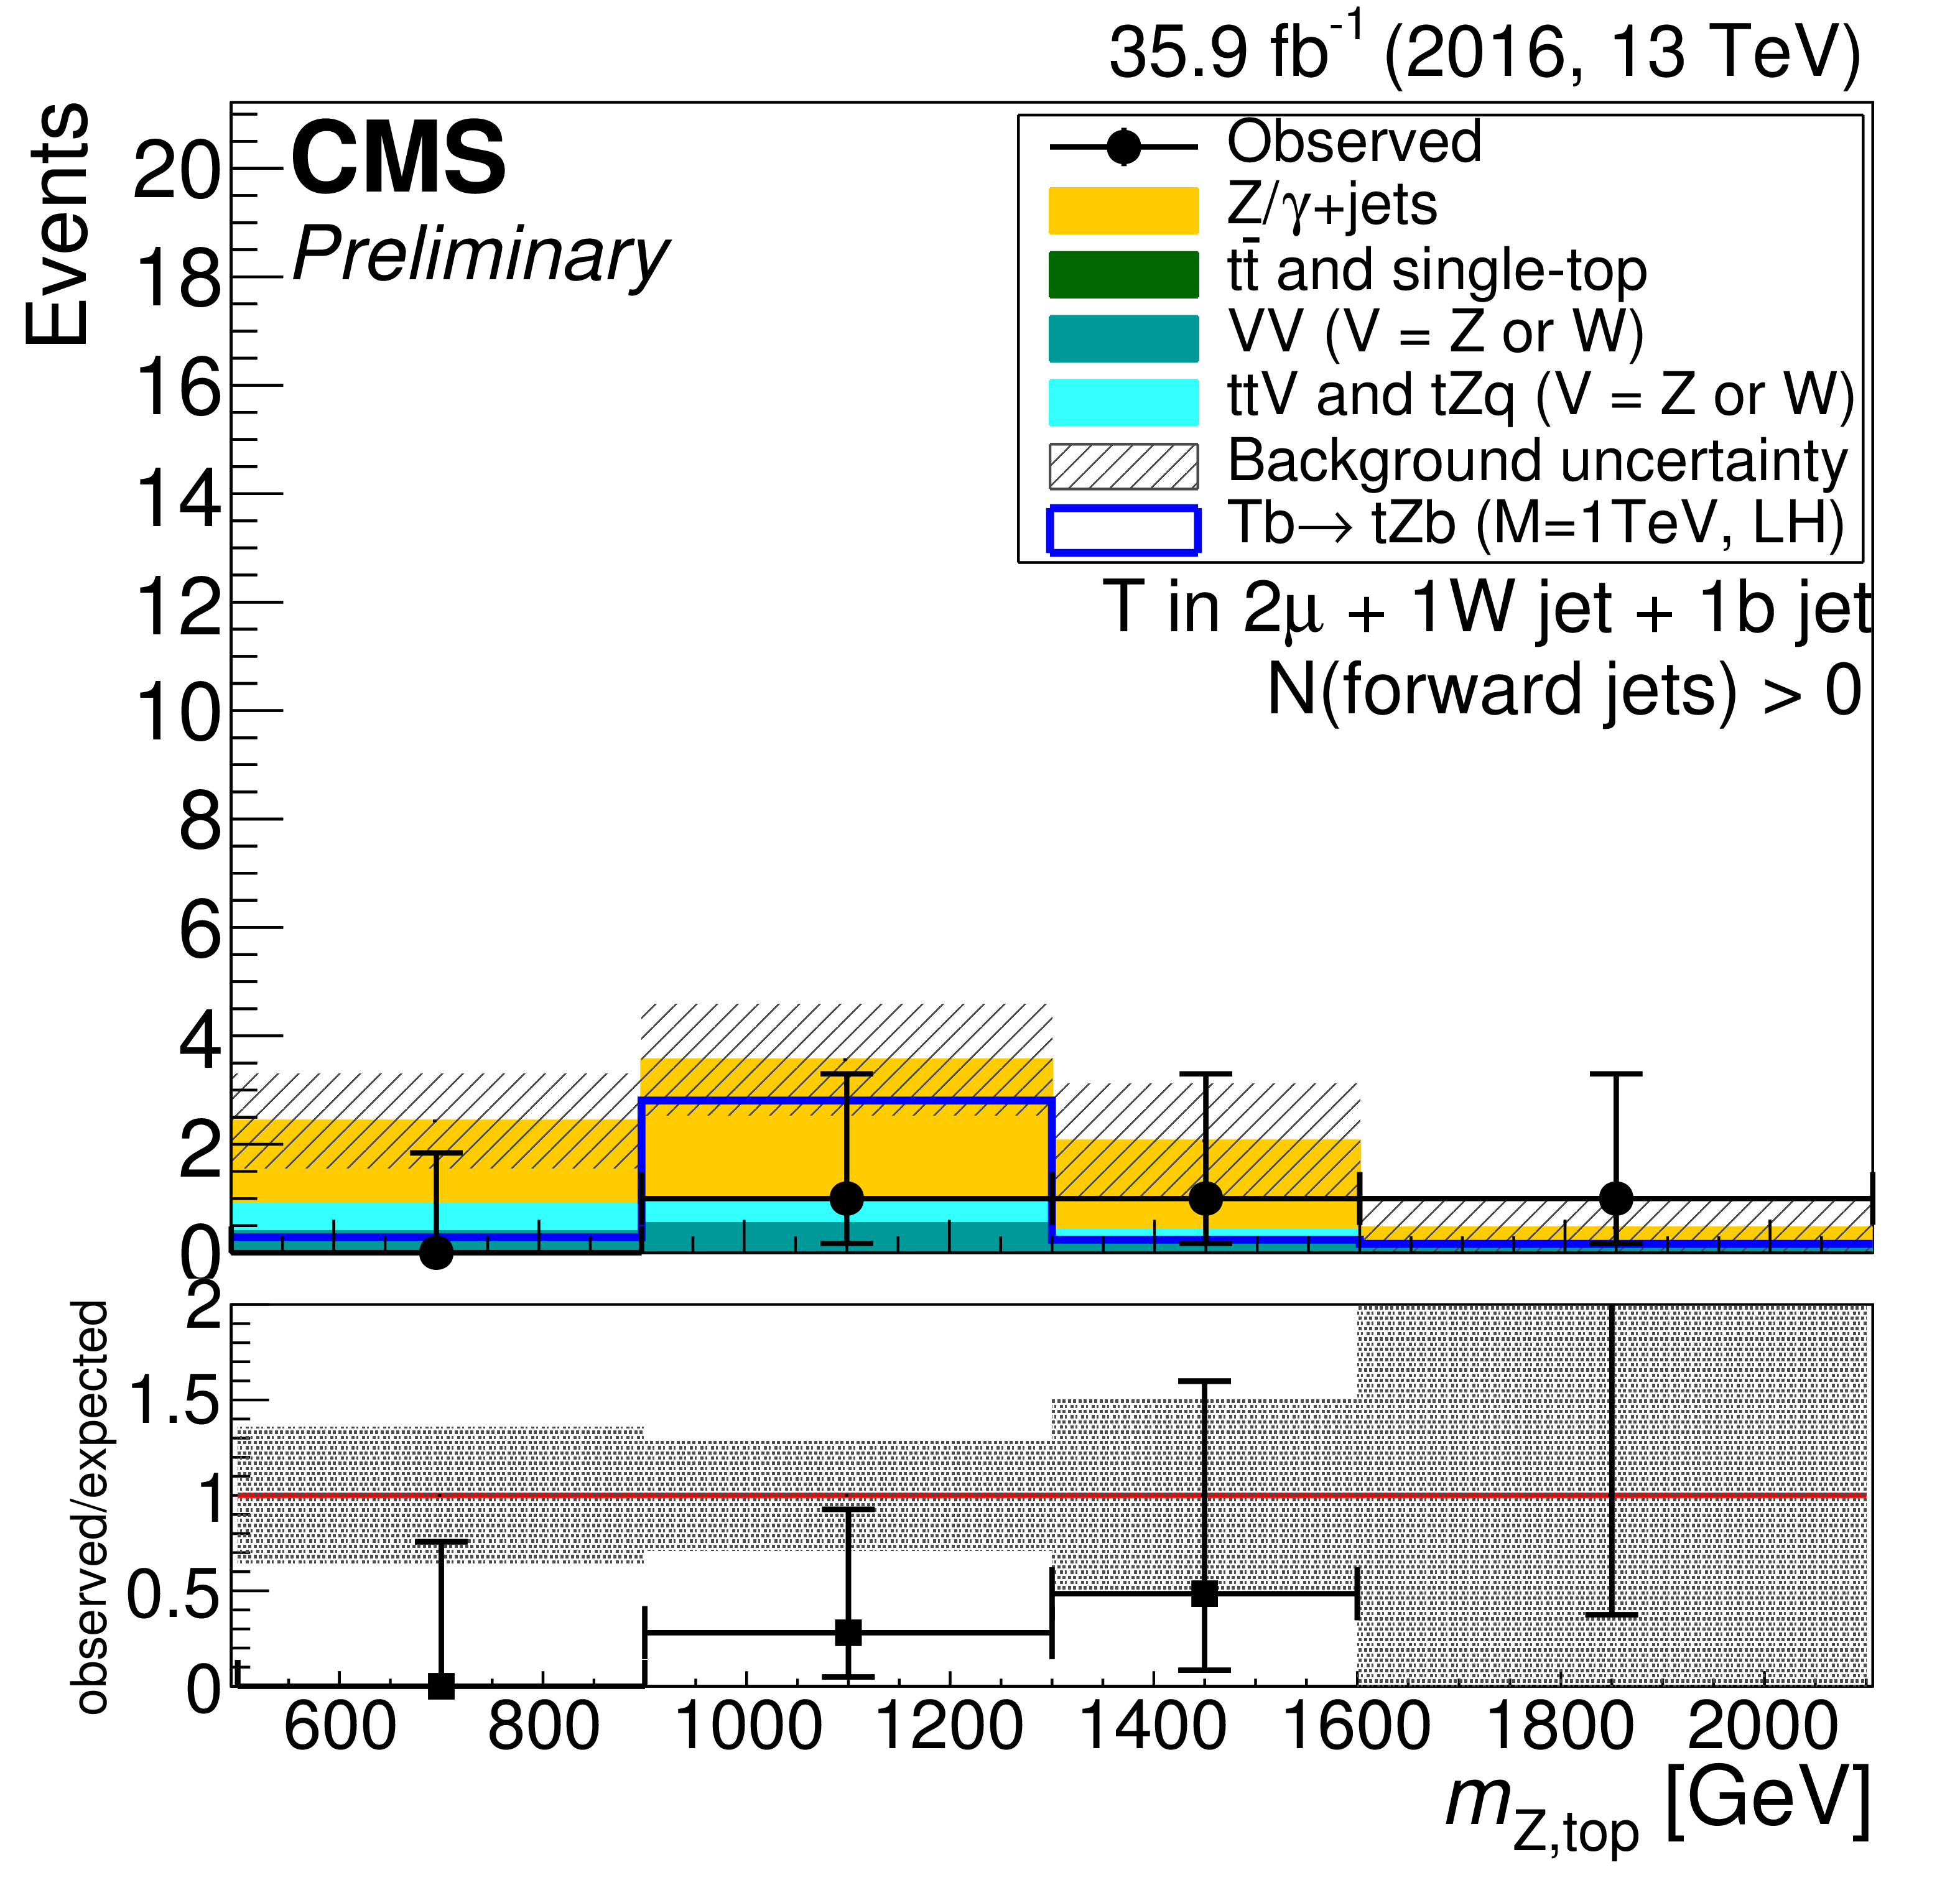
Figure 4:
Comparison between the background estimate (as derived from control regions in the data) and data for the 4 categories where the T is reconstructed in the resolved topology for events with the Z boson decaying into muons (left) and electrons (right) and zero (at least one) forward jets on the top (bottom). Background composition is taken from simulation. The uncertainties in the background estimate method include both statistical and systematic components, as described in Section 6. The lower panel in each plot shows the ratio of the data and the background estimation, with the shaded band representing the uncertainties in the background estimate. |

png pdf |
Figure 4-a:
Comparison between the background estimate (as derived from control regions in the data) and data for the 4 categories where the T is reconstructed in the resolved topology for events with the Z boson decaying into muons and zero forward jet. Background composition is taken from simulation. The uncertainties in the background estimate method include both statistical and systematic components, as described in Section 6. The lower panel shows the ratio of the data and the background estimation, with the shaded band representing the uncertainties in the background estimate. |

png pdf |
Figure 4-b:
Comparison between the background estimate (as derived from control regions in the data) and data for the 4 categories where the T is reconstructed in the resolved topology for events with the Z boson decaying into electrons and zero forward jet. Background composition is taken from simulation. The uncertainties in the background estimate method include both statistical and systematic components, as described in Section 6. The lower panel shows the ratio of the data and the background estimation, with the shaded band representing the uncertainties in the background estimate. |

png pdf |
Figure 4-c:
Comparison between the background estimate (as derived from control regions in the data) and data for the 4 categories where the T is reconstructed in the resolved topology for events with the Z boson decaying into muons and at least one forward jet. Background composition is taken from simulation. The uncertainties in the background estimate method include both statistical and systematic components, as described in Section 6. The lower panel shows the ratio of the data and the background estimation, with the shaded band representing the uncertainties in the background estimate. |
png pdf |
Figure 4-d:
Comparison between the background estimate (as derived from control regions in the data) and data for the 4 categories where the T is reconstructed in the resolved topology for events with the Z boson decaying into electrons and at least one forward jet. Background composition is taken from simulation. The uncertainties in the background estimate method include both statistical and systematic components, as described in Section 6. The lower panel shows the ratio of the data and the background estimation, with the shaded band representing the uncertainties in the background estimate. |
png pdf |
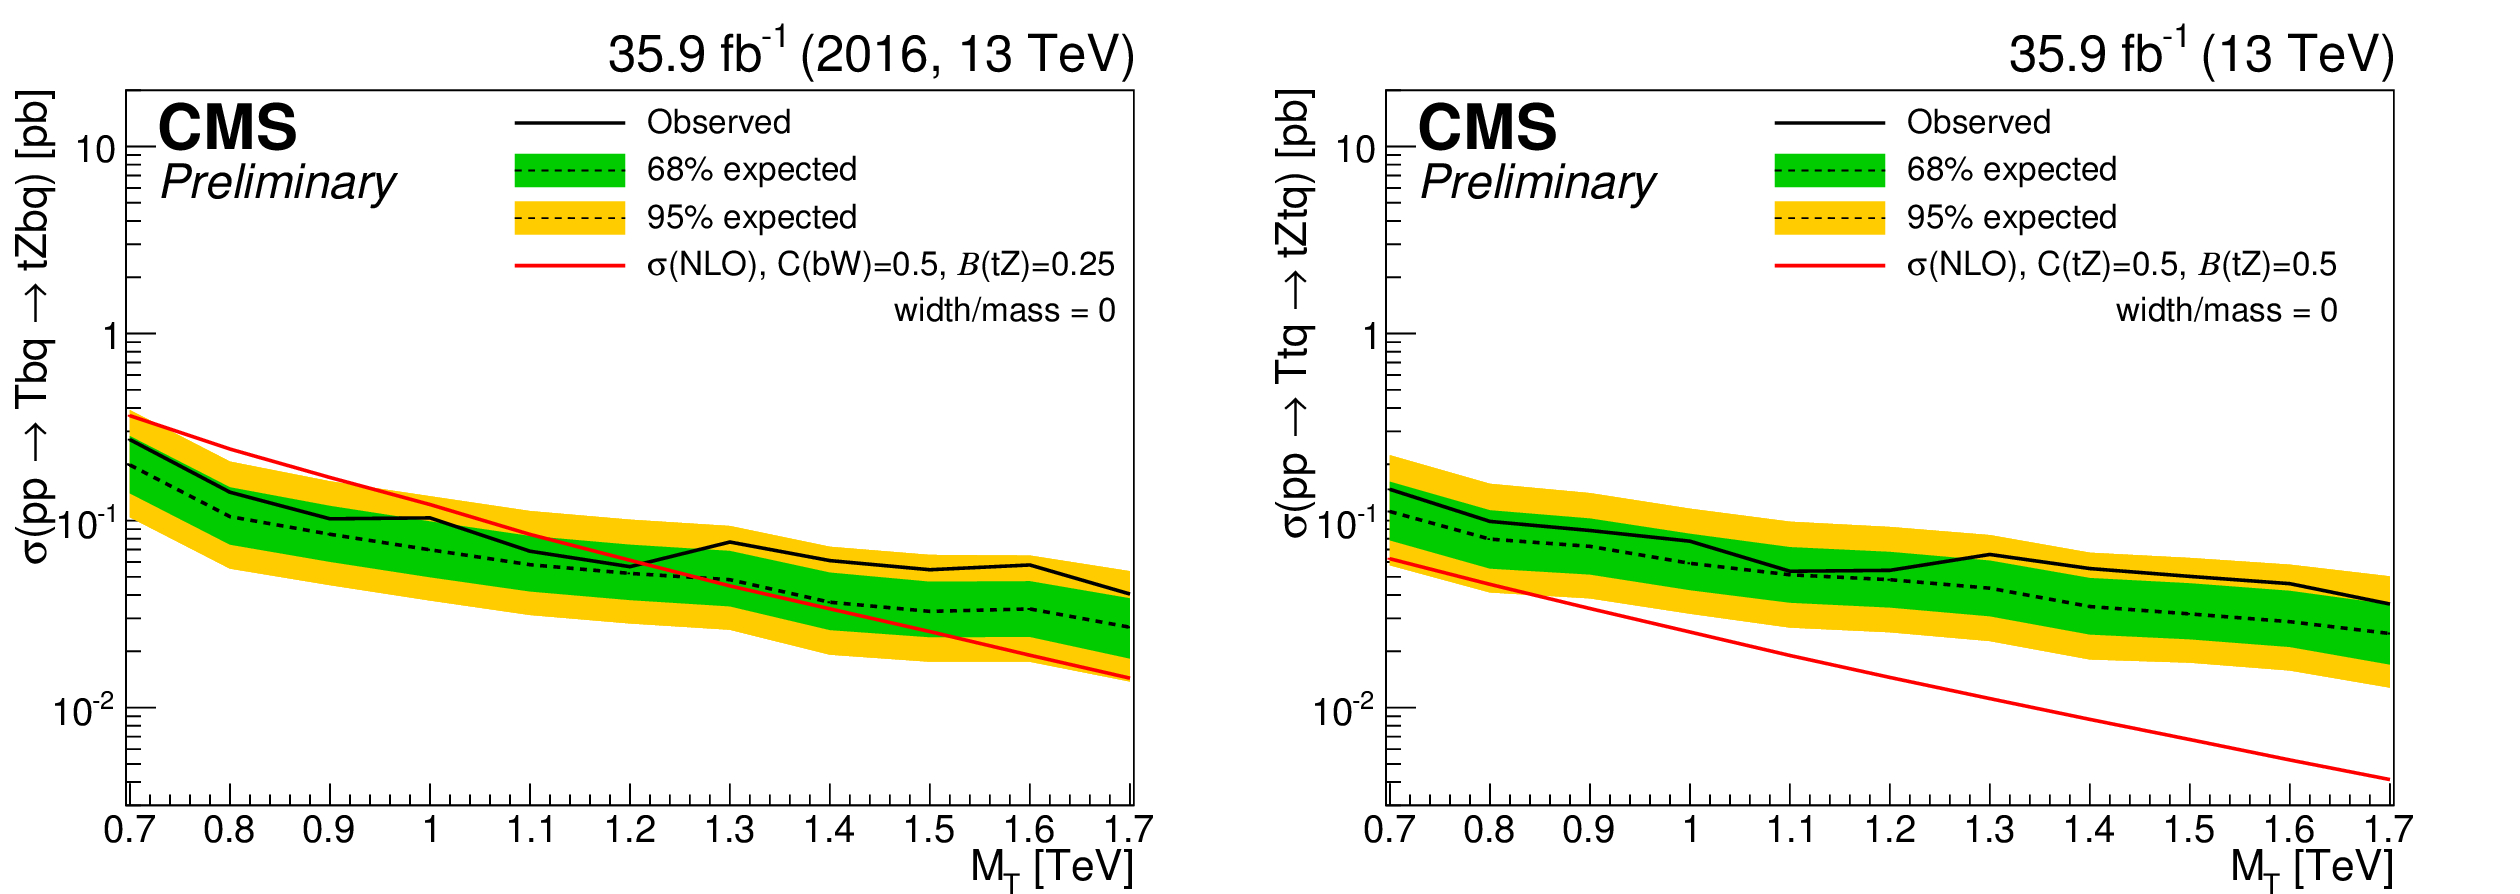
Figure 5:
Observed and expected 95% CL upper limit on the product of cross section and branching fraction for the singlet LH T(b) (left) and doublet RH T(t) (right) production modes, with the T decaying to tZ, where the T has a negligible width. The 68% and 95% expected bands are shown. Theoretical cross sections as calculated at next-to-leading order in Ref. [4] are shown. The branching fraction $\mathcal {B}(\mathrm{T\rightarrow tZ})$ is 0.25 (0.5) for the left (right) plot. |

png pdf |
Figure 5-a:
Observed and expected 95% CL upper limit on the product of cross section and branching fraction for the singlet LH T(b) production modes, with the T deaying to tZ, where the T has a negligible width. The 68% and 95% expected bands are shown. Theoretical cross sections as calculated at next-to-leading order in Ref. [4] are shown. The branching fraction $\mathcal {B}(\mathrm{T\rightarrow tZ})$ is 0.25 (0.5) for the left (right) plot. |

png pdf |
Figure 5-b:
Observed and expected 95% CL upper limit on the product of cross section and branching fraction for the doublet RH T(t) production modes, with the T deaying to tZ, where the T has a negligible width. The 68% and 95% expected bands are shown. Theoretical cross sections as calculated at next-to-leading order in Ref. [4] are shown. The branching fraction $\mathcal {B}(\mathrm{T\rightarrow tZ})$ is 0.25 (0.5) for the left (right) plot. |

png pdf |
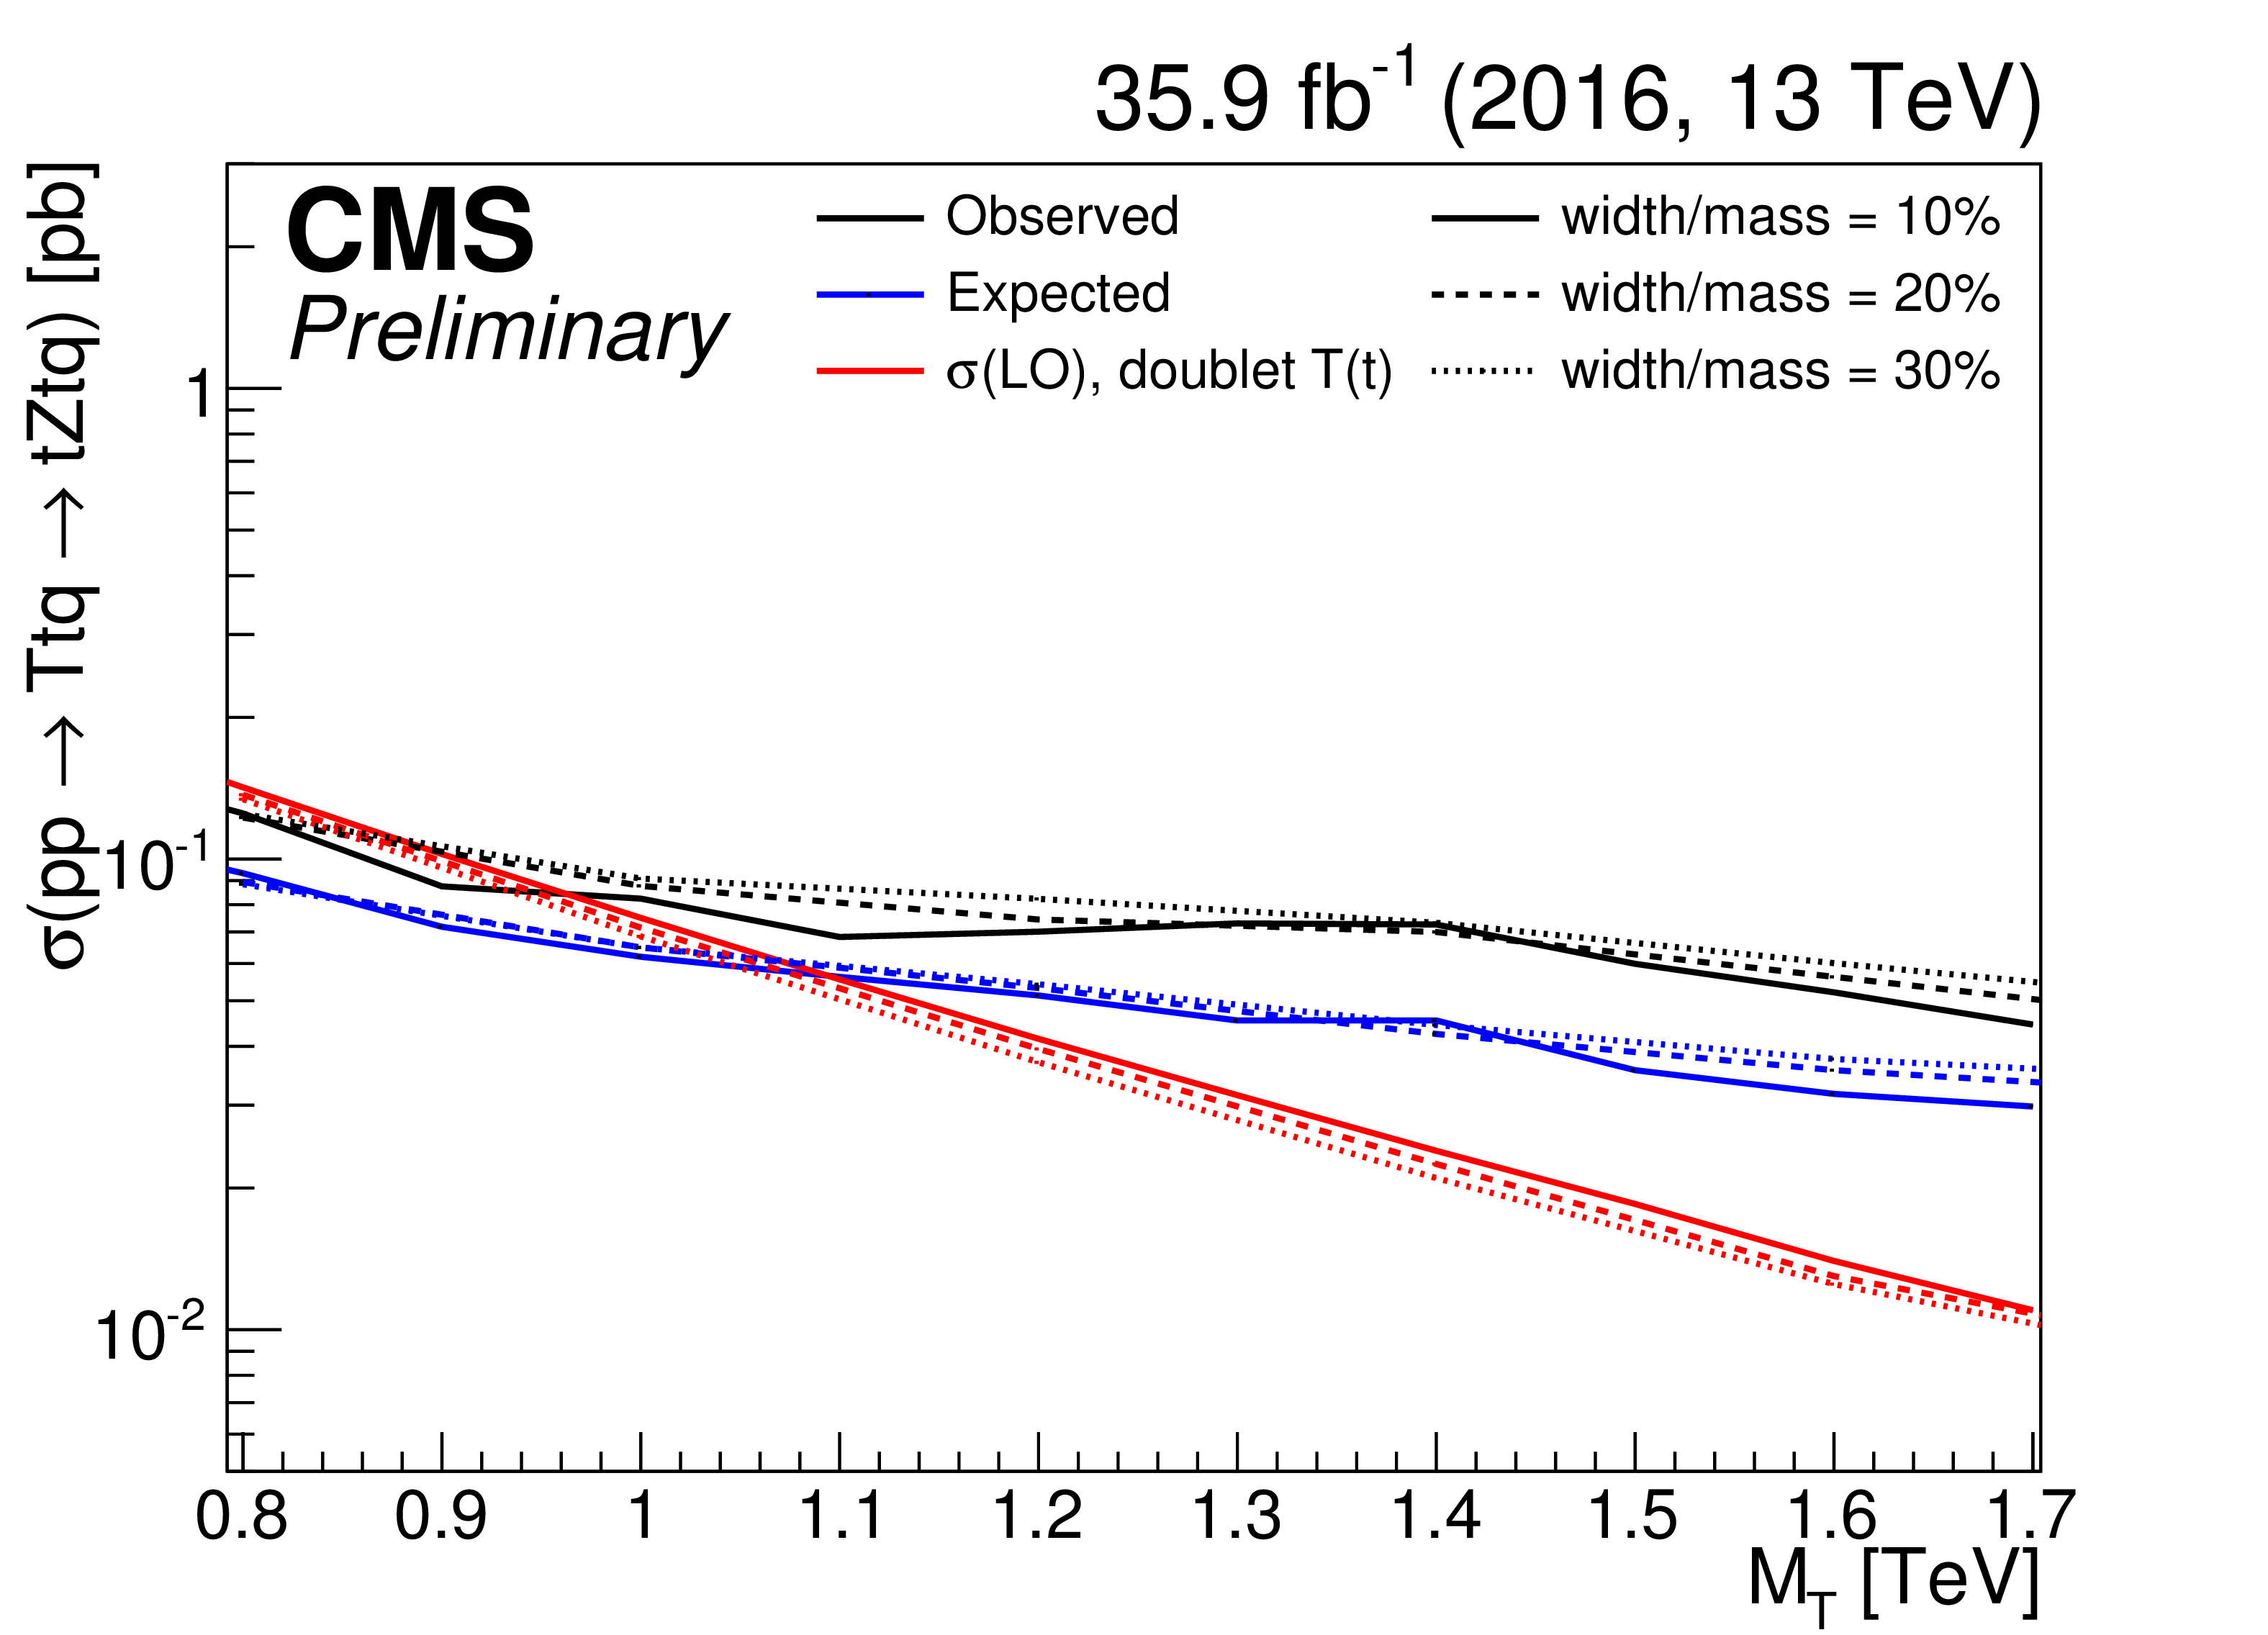
Figure 6:
Observed and expected 95% CL upper limit on the product of cross section and branching fraction for the singlet LH T(b) (left) and doublet RH T(t) (right) production modes, with the T decaying to tZ, where the T has a width of 10%, 20% and 30% of the resonance mass. Theoretical cross sections have been calculated at leading order using a private version of the model constructed by the authors of [5,31,32] and are reported in Table 2. |

png pdf |
Figure 6-a:
Observed and expected 95% CL upper limit on the product of cross section and branching fraction for the singlet LH T(b) production modes, with the T decaying to tZ, where the T has a width of 10%, 20% and 30% of the resonance mass. Theoretical cross sections have been calculated at leading order using a private version of the model constructed by the authors of [5,31,32] and are reported in Table 2. |
png pdf |
Figure 6-b:
Observed and expected 95% CL upper limit on the product of cross section and branching fraction for the doublet RH T(t) production modes, with the T decaying to tZ, where the T has a width of 10%, 20% and 30% of the resonance mass. Theoretical cross sections have been calculated at leading order using a private version of the model constructed by the authors of [5,31,32] and are reported in Table 2. |
| Tables | |

png pdf |
Table 1:
Theoretical cross sections for T(b) and T(t) processes for the different benchmark mass points considered in the analysis, with the couplings set to 0.5 and a narrow width as calculated at next-to-leading order in Ref. [4]. The cross sections do not depend on the chirality of the new particle. For any value of the couplings below 0.5, the theoretical width of the VLQ is negligible compared to the experimental mass resolution. |
png pdf |
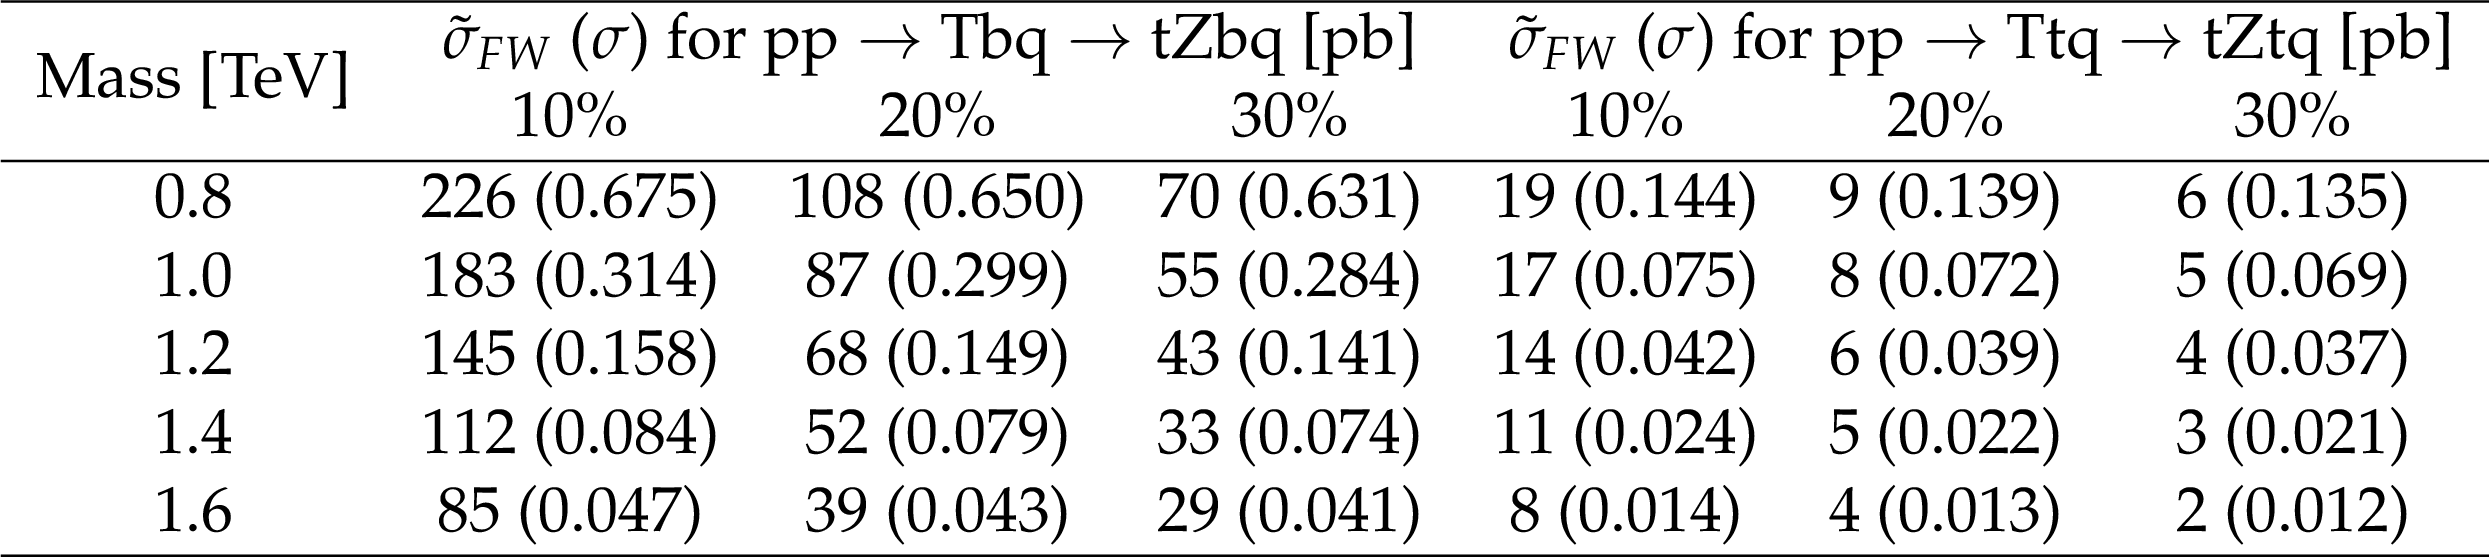
Table 2:
Theoretical cross sections $\tilde{\sigma }_{FW}$ for T(b) and T(t) processes for the different benchmark mass points considered in the analysis for a T width of 10%, 20% and 30% of the resonance mass. In parentheses the leading order cross sections $\sigma $ are shown. |

png pdf |
Table 3:
The numbers of estimated background events compared to the measured numbers of events for the two fully merged categories. The quoted uncertainties in the background estimates include both statistical and systematic components, as described in Section 6. Expected signal yields and signal efficiencies in parentheses, defined considering only events with the Z boson decaying to electrons or muons, are also shown for two benchmark mass points and two width ("w'') points for both T(b) and T(t) processes. |

png pdf |
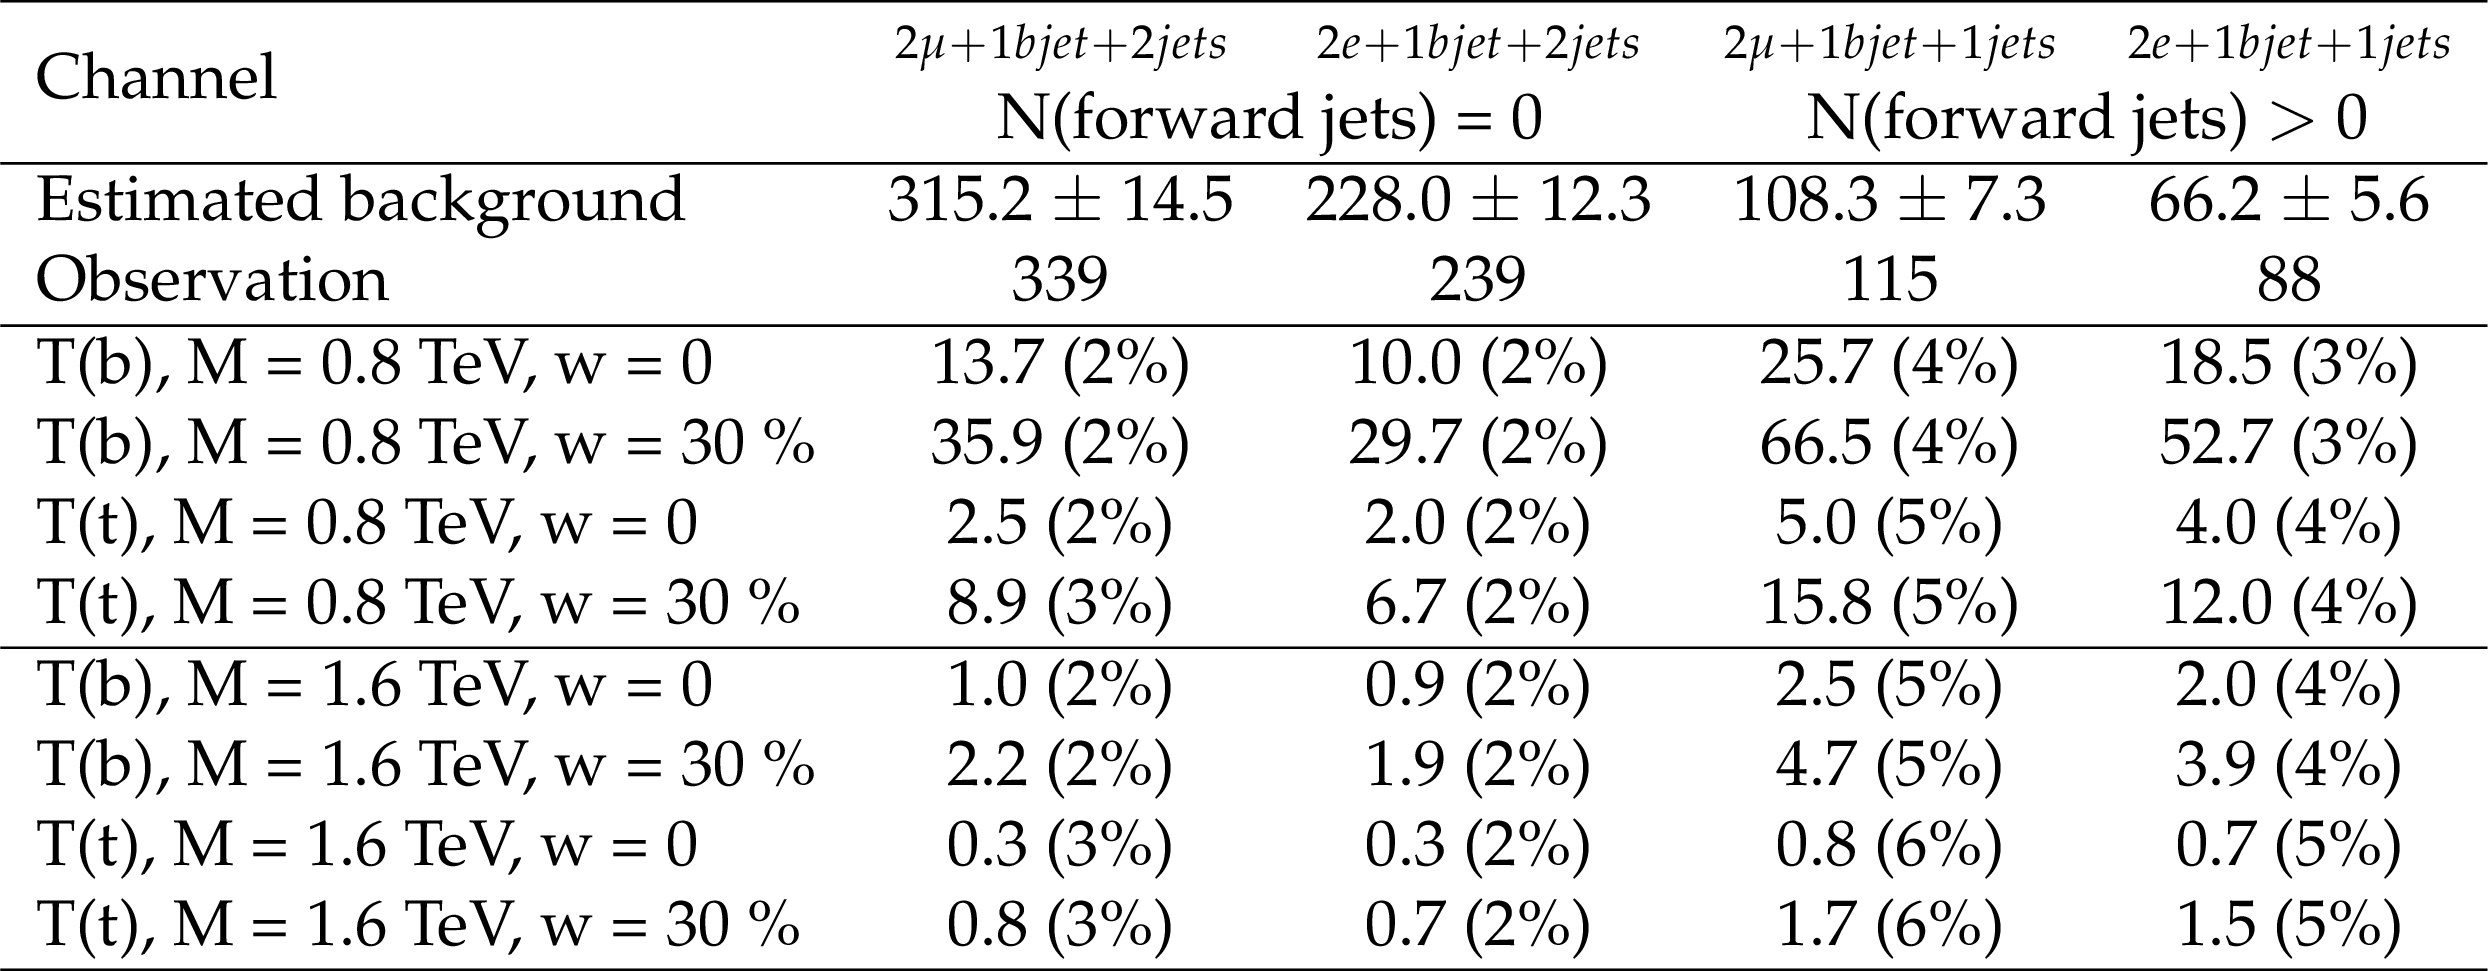
Table 4:
The numbers of estimated background events compared to the measured numbers of events for the four partially merged categories. The quoted uncertainties in the background estimates include both statistical and systematic components, as described in Section 6. Expected signal yields and signal efficiencies in parentheses, defined considering only events with the Z boson decaying to electrons or muons are also shown for two benchmark mass points and two width (``w'') points for both T(b) and T(t) processes. |
png pdf |
Table 5:
The numbers of estimated background events compared to the measured numbers of events for the four resolved categories. The quoted uncertainties in the background estimates include both statistical and systematic components, as described in Section 6. Expected signal yields and signal efficiencies in parentheses, defined considering only events with the Z boson decaying to electrons or muons are also shown for two benchmark mass points and two width (``w'') points for both T(b) and T(t) processes. |

png pdf |
Table 6:
Observed and expected 95% CL upper limit on $\sigma (\mathrm{ pp \rightarrow Z'}) \mathcal {B}(\mathrm{ Z'\rightarrow Tt}) \mathcal {B} (\mathrm{ T \rightarrow tZ}) $. The branching fraction $\mathcal {B}(\mathrm{T \rightarrow tZ})$ is taken to be 100%. In order to consider different branching fractions, the limits should be scaled by the corresponding branching fraction value. The 1 and 2 standard deviation bands are given. |
| Summary |
| Results of a search for single production of a T quark with a charge of $+2/3$ decaying to a Z boson and a top quark have been presented. No deviations from the expected standard model background are observed. Limits on the product of the cross section and branching fraction vary between 0.27 and 0.04 pb at 95% confidence level for a left-handed T(b) with the T quark decaying to tZ, and between 0.15 and 0.04 pb for a right-handed T(t) signal, for the ranges of resonance masses considered, which is between 0.7 and 1.7 TeV. This result has been obtained under the hypothesis of a narrow width resonance, allowing the interpretation of results using the simplified approach studied in [4]. In this case, left-handed T quarks produced in association with a b quark and with a coupling C(bW) set to 0.5 are excluded below the mass of 1.2 TeV. The effect of a non-negligible width is also studied by considering values of the width to be 10%, 20% and 30% of the resonance mass; a similar sensitivity is observed. In this case the results have been interpreted using a private version of the model constructed by the authors of [5,31,32] and a left-handed T(b) signal is excluded for masses below values in the range 1.35 to 1.45 TeV depending on the width, while a right-handed T(t) signal is excluded for masses below values in the range 0.85 to 0.95 TeV. Finally, the production of a Z' that decays to Tt is excluded for products of production cross sections and branching fractions below values in the range 0.13-0.06 pb for a Z' (T) mass range of 1.5 to 2.5 (0.7 to 1.5) TeV. |
| Additional Figures | |

png pdf |
Additional Figure 1:
Reconstructed T mass after full event selection for $\mathrm{ pp \rightarrow Tb }$ signal, with T mass equal to 1.2 TeV and four values of the T width: negligible, 10%, 20% and 30%. |
png pdf |
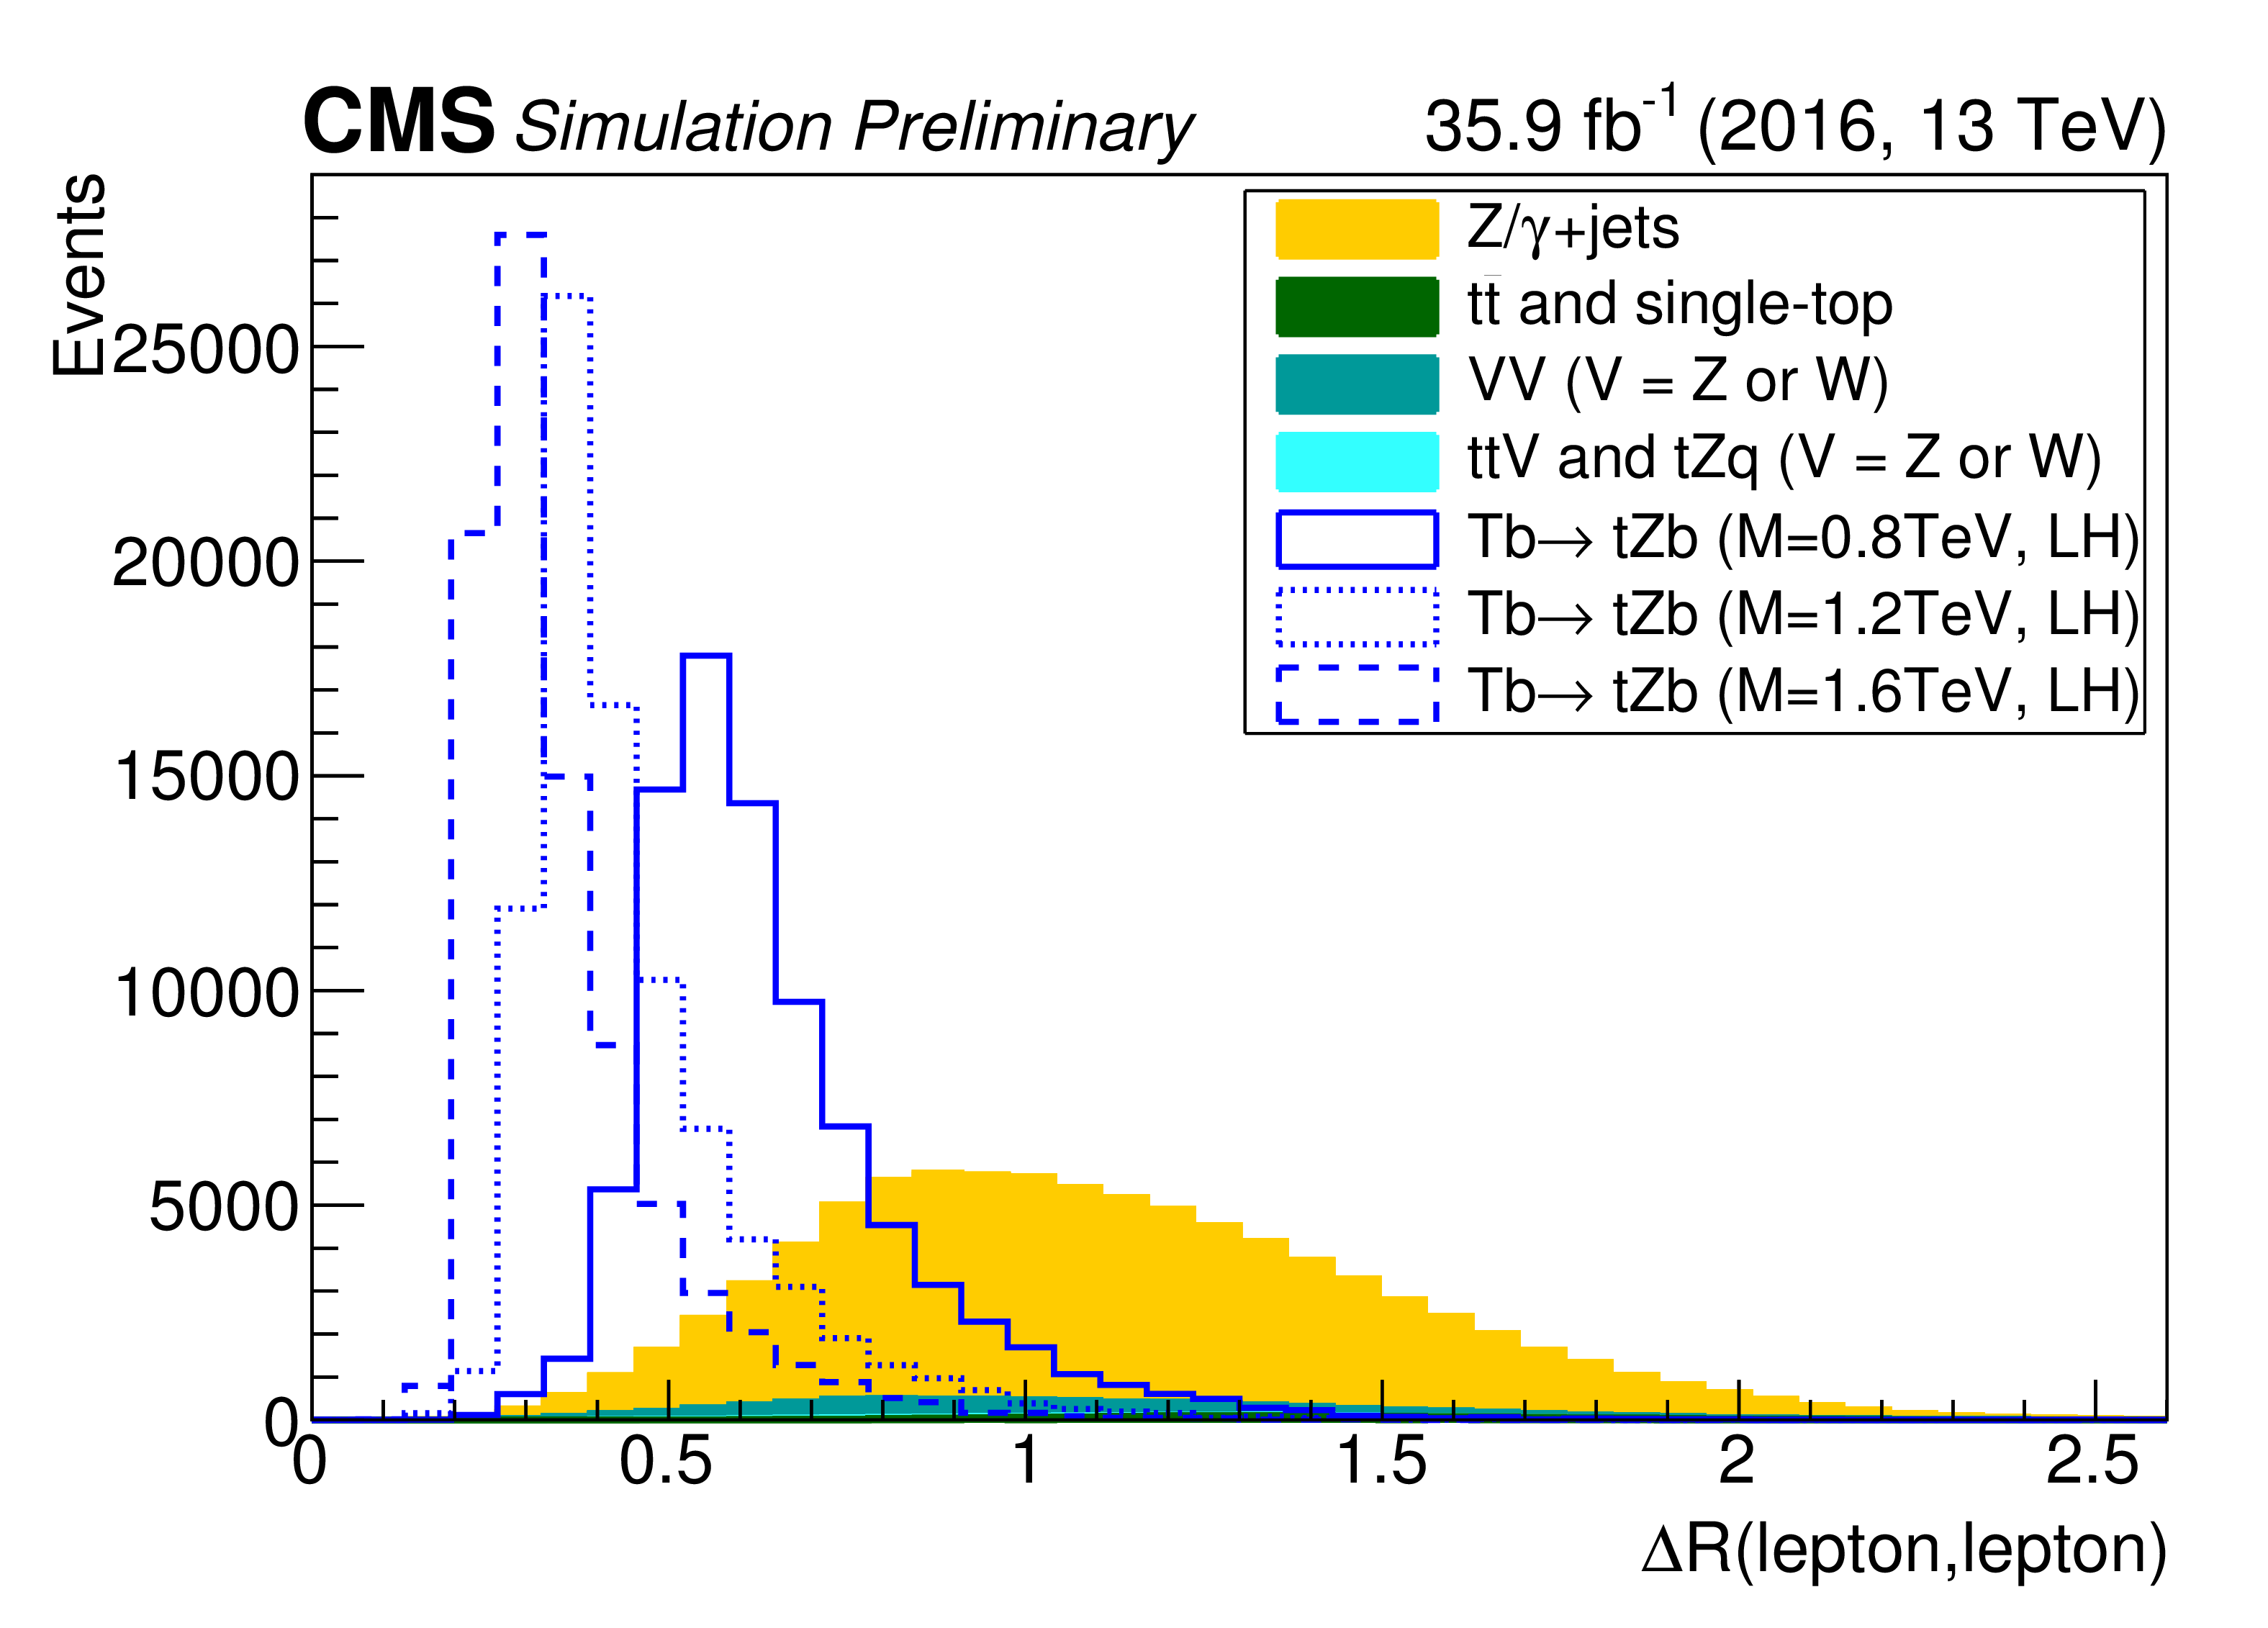
Additional Figure 2:
Comparison between background and signal for the $\Delta $R between the two leptons after event preselection. Signal is normalized to background yield. |

png pdf |
Additional Figure 3:
Comparison between background and signal for the leading lepton ${p_{\mathrm {T}}}$ after event preselection. Signal is normalized to background yield. |
png pdf |
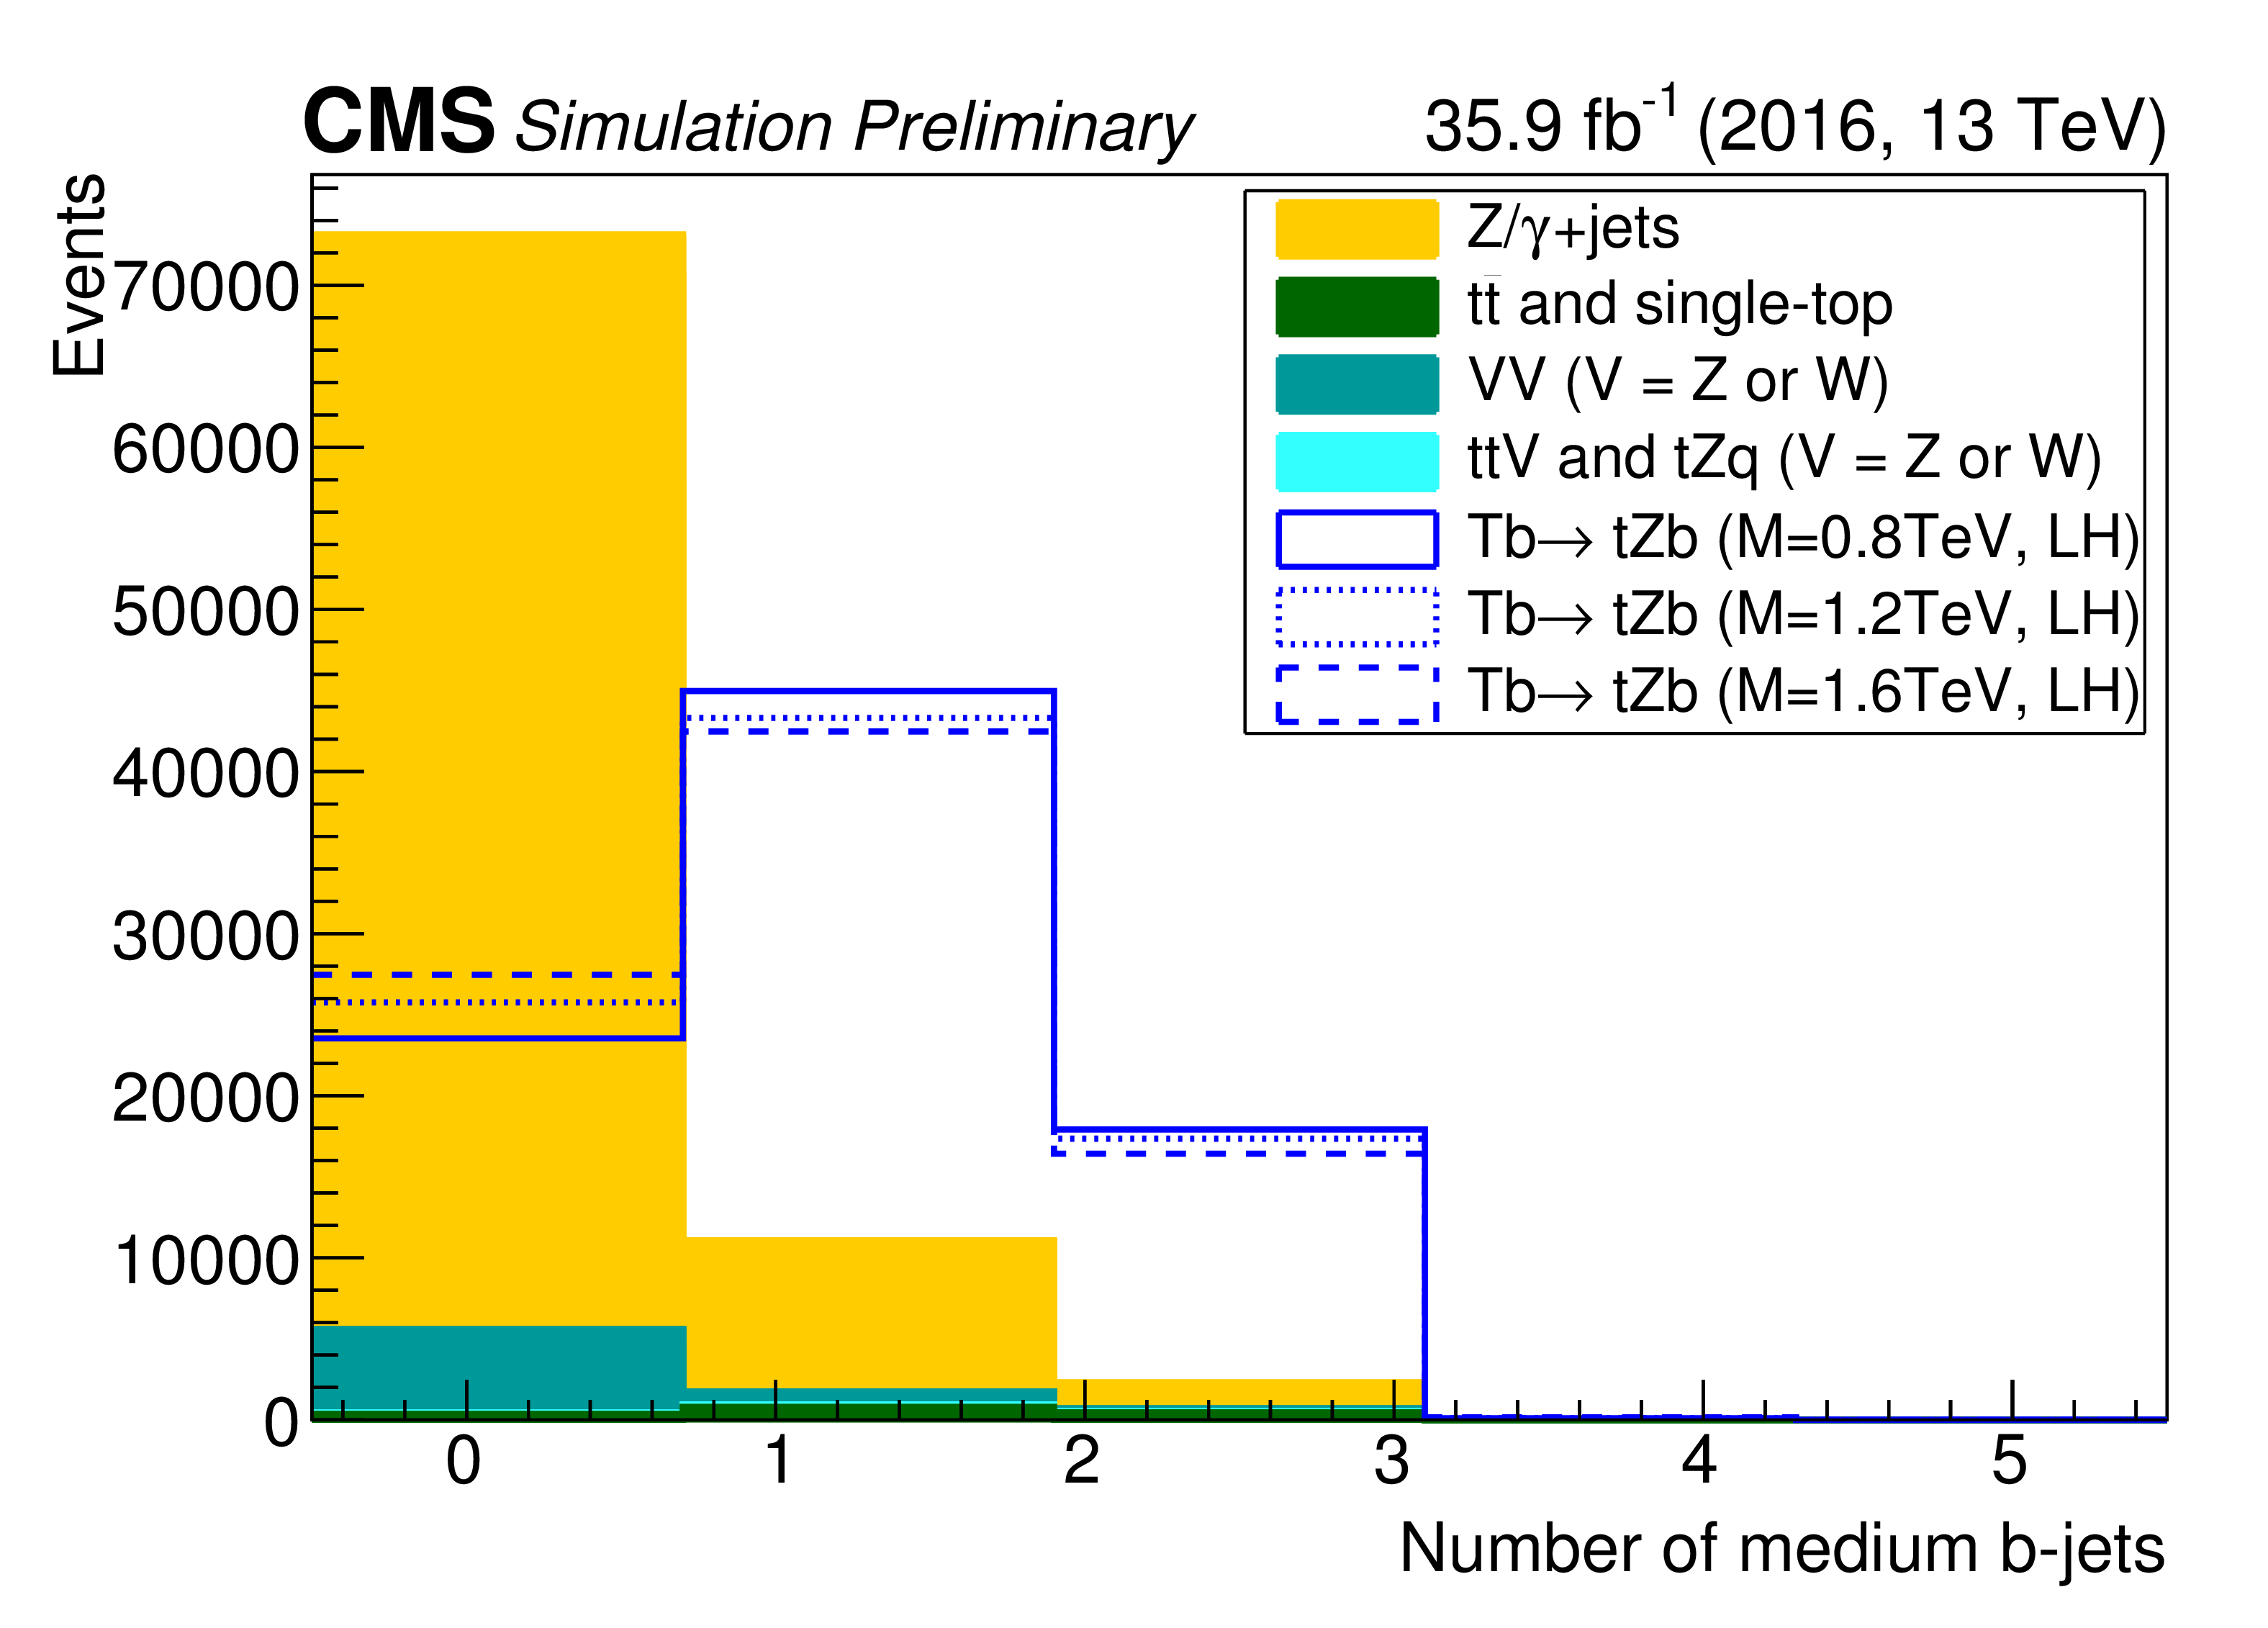
Additional Figure 4:
Comparison between background and signal for the number of b-tagged jets (medium working point) after event preselection. Signal is normalized to background yield. |

png pdf |
Additional Figure 5:
Comparison between background and signal for the number of forward jets after event preselection. Signal is normalized to background yield. |
| Additional Tables | |
png pdf |
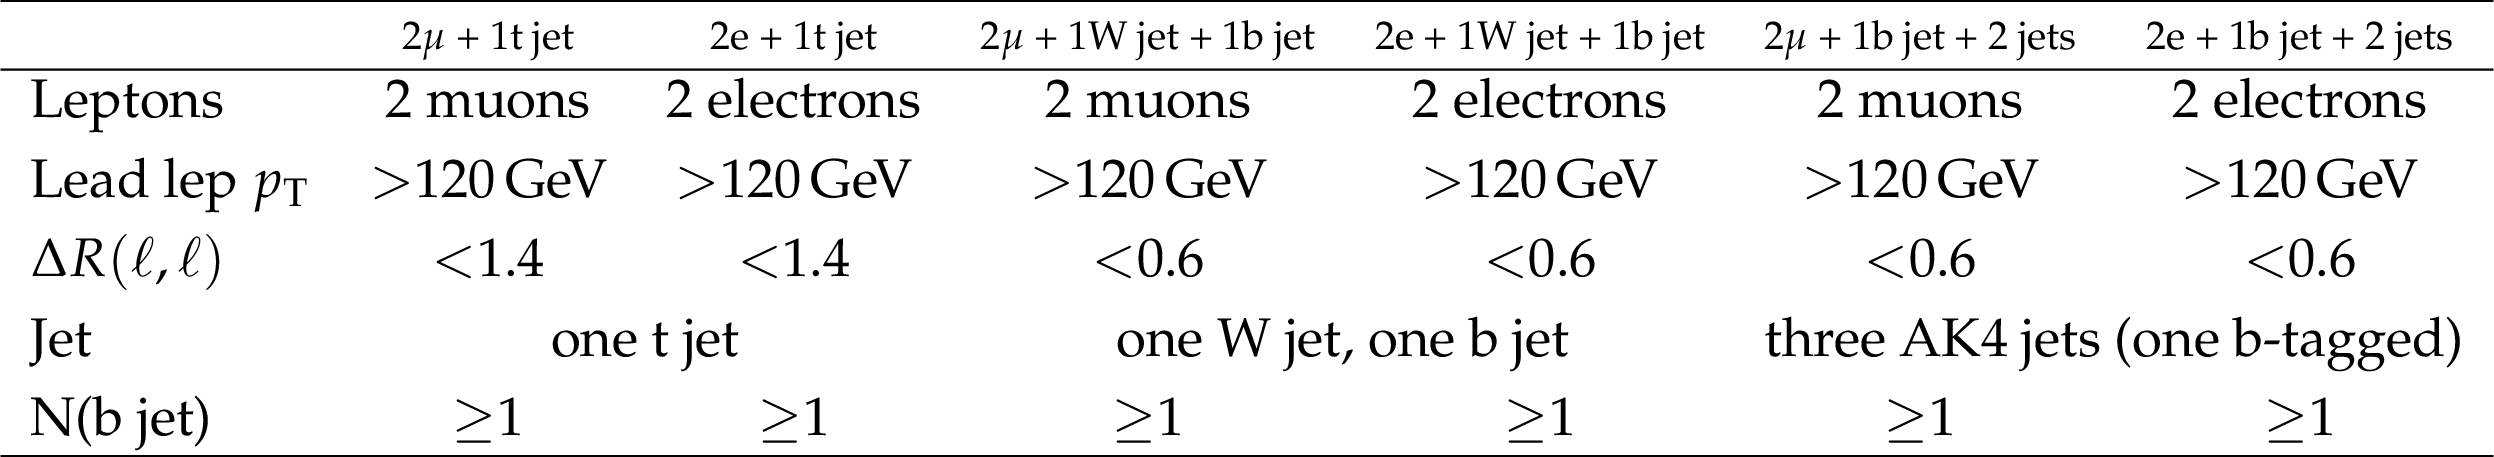
Additional Table 1:
Summary of the final event selection. In each category exactly two oppositely charged leptons are required. |
| References | ||||
| 1 | J. A. Aguilar-Saavedra, R. Benbrik, S. Heinemeyer, and M. Perez-Victoria | Handbook of vectorlike quarks: Mixing and single production | PRD 88 (2013) 094010 | 1306.0572 |
| 2 | J. A. Aguilar-Saavedra | Identifying top partners at LHC | JHEP 11 (2009) 030 | 0907.3155 |
| 3 | A. De Simone, O. Matsedonskyi, R. Rattazzi, and A. Wulzer | A First Top Partner Hunter's Guide | JHEP 04 (2013) 004 | 1211.5663 |
| 4 | O. Matsedonskyi, G. Panico, and A. Wulzer | On the Interpretation of Top Partners Searches | JHEP 12 (2014) 097 | 1409.0100 |
| 5 | M. Buchkremer, G. Cacciapaglia, A. Deandrea, and L. Panizzi | Model Independent Framework for Searches of Top Partners | Nucl. Phys. B 876 (2013) 376 | 1305.4172 |
| 6 | O. Eberhardt et al. | Joint analysis of Higgs decays and electroweak precision observables in the Standard Model with a sequential fourth generation | PRD 86 (2012) 013011 | 1204.3872 |
| 7 | ATLAS Collaboration | Search for production of vector-like quark pairs and of four top quarks in the lepton-plus-jets final state in pp collisions at $ \sqrt{s}= $ 8 TeV with the ATLAS detector | JHEP 08 (2015) 105 | 1505.04306 |
| 8 | ATLAS Collaboration | Search for vector-like B quarks in events with one isolated lepton, missing transverse momentum and jets at $ \sqrt{s}= $ 8 TeV with the ATLAS detector | PRD 91 (2015) 112011 | 1503.05425 |
| 9 | ATLAS Collaboration | Search for pair and single production of new heavy quarks that decay to a Z boson and a third-generation quark in pp collisions at $ \sqrt{s}= $ 8 TeV with the ATLAS detector | JHEP 11 (2014) 104 | 1409.5500 |
| 10 | ATLAS Collaboration | Search for single production of a vector-like quark via a heavy gluon in the 4b final state with the ATLAS detector in pp collisions at $ \sqrt{s}= $ 8 TeV | PLB 758 (2016) | 1602.06034 |
| 11 | ATLAS Collaboration | Search for single production of vector-like quarks decaying into Wb in pp collisions at $ \sqrt{s}= $ 8 TeV with the ATLAS detector | EPJC 76 (2016) 442 | 1602.05606 |
| 12 | ATLAS Collaboration | Search for the production of single vector-like and excited quarks in the Wt final state in pp collisions at $ \sqrt{s}= $ 8 TeV with the ATLAS detector | JHEP 02 (2016) 110 | 1510.02664 |
| 13 | CMS Collaboration | Search for vector-like charge 2/3 T quarks in proton-proton collisions at $ \sqrt{s}= $ 8 TeV | PRD 93 (2016) 012003 | CMS-B2G-13-005 1509.04177 |
| 14 | CMS Collaboration | Search for pair-produced vector-like B quarks in proton-proton collisions at $ \sqrt{s}= $ 8 TeV | PRD 93 (2016) 112009 | CMS-B2G-13-006 1507.07129 |
| 15 | CMS Collaboration | Search for top-quark partners with charge 5/3 in the same-sign dilepton final state | PRL 112 (2014) 171801 | CMS-B2G-12-012 1312.2391 |
| 16 | CMS Collaboration | Search for single production of a heavy vector-like T quark decaying to a Higgs boson and a top quark with a lepton and jets in the final state | Submitted to: PLB (2016) | CMS-B2G-15-008 1612.00999 |
| 17 | CMS Collaboration | Search for single production of vector-like quarks decaying to a Z boson and a top or a bottom quark in proton-proton collisions at $ \sqrt{s}= $ 13 TeV | CMS-B2G-16-001 1701.07409 |
|
| 18 | B. W. Lee, C. Quigg, and H. B. Thacker | Weak Interactions at Very High-Energies: The Role of the Higgs Boson Mass | PRD 16 (1977) 1519 | |
| 19 | C. Bini, R. Contino, and N. Vignaroli | Heavy-light decay topologies as a new strategy to discover a heavy gluon | JHEP 01 (2012) 157 | 1110.6058 |
| 20 | E. Accomando et al. | Z' physics with early LHC data | PRD 83 (2011) 075012 | 1010.6058 |
| 21 | D. Greco and D. Liu | Hunting composite vector resonances at the LHC: naturalness facing data | JHEP 12 (2014) 126 | 1410.2883 |
| 22 | CMS Collaboration | The CMS experiment at the CERN LHC | JINST 3 (2008) S08004 | CMS-00-001 |
| 23 | J. Alwall et al. | The automated computation of tree-level and next-to-leading order differential cross sections, and their matching to parton shower simulations | JHEP 07 (2014) 079 | 1405.0301 |
| 24 | P. Nason | A new method for combining NLO QCD with shower Monte Carlo algorithms | JHEP 11 (2004) 040 | hep-ph/0409146 |
| 25 | S. Frixione, P. Nason, and C. Oleari | Matching NLO QCD computations with Parton Shower simulations: the POWHEG method | JHEP 11 (2007) 070 | 0709.2092 |
| 26 | S. Alioli, P. Nason, C. Oleari, and E. Re | A general framework for implementing NLO calculations in shower Monte Carlo programs: the POWHEG BOX | JHEP 06 (2010) 043 | 1002.2581 |
| 27 | S. Alioli, S.-O. Moch, and P. Uwer | Hadronic top-quark pair-production with one jet and parton showering | JHEP 01 (2012) 137 | 1110.5251 |
| 28 | T. Sjostrand et al. | An Introduction to PYTHIA 8.2 | CPC 191 (2015) 159 | 1410.3012 |
| 29 | CMS Collaboration | Investigations of the impact of the parton shower tuning in Pythia 8 in the modelling of $ \mathrm{t\overline{t}} $ at $ \sqrt{s}= $ 8 and 13 TeV | CMS-PAS-TOP-16-021 | CMS-PAS-TOP-16-021 |
| 30 | P. Artoisenet, R. Frederix, O. Mattelaer, and R. Rietkerk | Automatic spin-entangled decays of heavy resonances in Monte Carlo simulations | JHEP 03 (2013) 015 | 1212.3460 |
| 31 | B. Fuks and H.-S. Shao | QCD next-to-leading-order predictions matched to parton showers for vector-like quark models | EPJC77 (2017), no. 2, 135 | 1610.04622 |
| 32 | A. Oliveira | Gravity particles from Warped Extra Dimensions, predictions for LHC | 1404.0102 | |
| 33 | GEANT4 Collaboration | GEANT4: A simulation toolkit | NIMA 506 (2003) 250 | |
| 34 | J. Allison et al. | Geant4 developments and applications | IEEE Trans. Nucl. Sci. 53 (2006) 270 | |
| 35 | NNPDF Collaboration | Parton distributions for the LHC Run II | JHEP 04 (2015) 040 | 1410.8849 |
| 36 | J. Butterworth et al. | PDF4LHC recommendations for LHC Run II | JPG 43 (2016) 023001 | 1510.03865 |
| 37 | CMS Collaboration | Description and performance of track and primary-vertex reconstruction with the CMS tracker | JINST 9 (2014) P10009 | CMS-TRK-11-001 1405.6569 |
| 38 | CMS Collaboration | Particle-flow event reconstruction in CMS and performance for jets, taus, and $ E_{\mathrm{T}}^{\text{miss}} $ | CDS | |
| 39 | CMS Collaboration | Commissioning of the particle-flow event with the first LHC collisions recorded in the CMS detector | CDS | |
| 40 | CMS Collaboration | Performance of Electron Reconstruction and Selection with the CMS Detector in Proton-Proton Collisions at $ \sqrt{s}= $ 8 TeV | JINST 10 (2015) P06005 | CMS-EGM-13-001 1502.02701 |
| 41 | CMS Collaboration | Performance of CMS muon reconstruction in pp collision events at $ \sqrt{s}= $ 7 TeV | JINST 7 (2012) P10002 | CMS-MUO-10-004 1206.4071 |
| 42 | M. Cacciari, G. P. Salam, and G. Soyez | The anti-$ k_{t} $ jet clustering algorithm | JHEP 04 (2008) 063 | 0802.1189 |
| 43 | S. D. Ellis, C. K. Vermilion, and J. R. Walsh | Techniques for improved heavy particle searches with jet substructure | PRD 80 (2009) 051501 | 0903.5081 |
| 44 | CMS Collaboration | Identification techniques for highly boosted W bosons that decay into hadrons | JHEP 12 (2014) 017 | CMS-JME-13-006 1410.4227 |
| 45 | M. Dasgupta, A. Fregoso, S. Marzani, and G. P. Salam | Towards an understanding of jet substructure | JHEP 09 (2013) 029 | 1307.0007 |
| 46 | A. J. Larkoski, S. Marzani, G. Soyez, and J. Thaler | Soft Drop | JHEP 05 (2014) 146 | 1402.2657 |
| 47 | CMS Collaboration | Identification of b quark jets at the CMS Experiment in the LHC Run 2 | CMS-PAS-BTV-15-001 | CMS-PAS-BTV-15-001 |
| 48 | CMS Collaboration | Measurement of the production cross sections for a Z boson and one or more b jets in pp collisions at $ \sqrt{s}= $ 7 TeV | JHEP 06 (2014) 120 | CMS-SMP-13-004 1402.1521 |
| 49 | CMS Collaboration | Identification of b-quark jets with the CMS experiment | JINST 8 (2013) P04013 | CMS-BTV-12-001 1211.4462 |
| 50 | ATLAS Collaboration | Measurement of the Inelastic Proton-Proton Cross Section at $ \sqrt{s}= $ 13 TeV with the ATLAS Detector at the LHC | PRL 117 (2016) 182002 | 1606.02625 |
| 51 | A. L. Read | Presentation of search results: The CLs technique | JPG 28 (2002) 2693 | |
| 52 | T. Junk | Confidence level computation for combining searches with small statistics | NIMA 434 (1999) 435 | hep-ex/9902006 |
| 53 | G. Cowan, K. Cranmer, E. Gross, and O. Vitells | Asymptotic formulae for likelihood-based tests of new physics | EPJC 71 (2011) 1554 | 1007.1727 |
| 54 | ATLAS and CMS Collaboration | Procedure for the LHC Higgs boson search combination in summer 2011 | CMS-NOTE-2011-005 | |
|
|
Compact Muon Solenoid LHC, CERN |
|

|

|

|

|

|