

Compact Muon Solenoid
LHC, CERN
| CMS-PAS-EXO-16-012 | ||
| Search for dark matter in association with a Higgs boson decaying into a pair of bottom quarks at $\sqrt{s} =$ 13 TeV with the CMS detector | ||
| CMS Collaboration | ||
| July 2016 | ||
| Abstract: A search for the dark matter is performed using events with large missing transverse momentum and a Higgs boson decaying into a pair of bottom quarks in a data sample of proton-proton interactions at the centre-of-mass energy of 13 TeV collected with the CMS detector at the LHC in 2015. The data correspond to an integrated luminosity of 2.3 fb$^{-1}$. Results are interpreted in the framework of the Type-2 two-Higgs-doublet model where a high-mass resonance Z' decays into a pseudoscalar $\textrm{A}_{0}$ and the standard model Higgs boson. $\textrm{A}_{0}$ further decays into a pair of dark matter particles. The recoil of the Higgs boson against the dark matter particles is dependent on the mass of the resonance $m_{\textrm{Z}^{'}}$, therefore, the Higgs boson is reconstructed using a pair of small-radius jets for low transverse momentum and a large-radius jet for high transverse momentum. | ||
|
Links:
CDS record (PDF) ;
inSPIRE record ;
CADI line (restricted) ;
These preliminary results are superseded in this paper, JHEP 10 (2017) 180. The superseded preliminary plots can be found here. |
||
| Figures & Tables | Summary | Additional Figures | References | CMS Publications |
|---|
| Figures | |
png pdf |
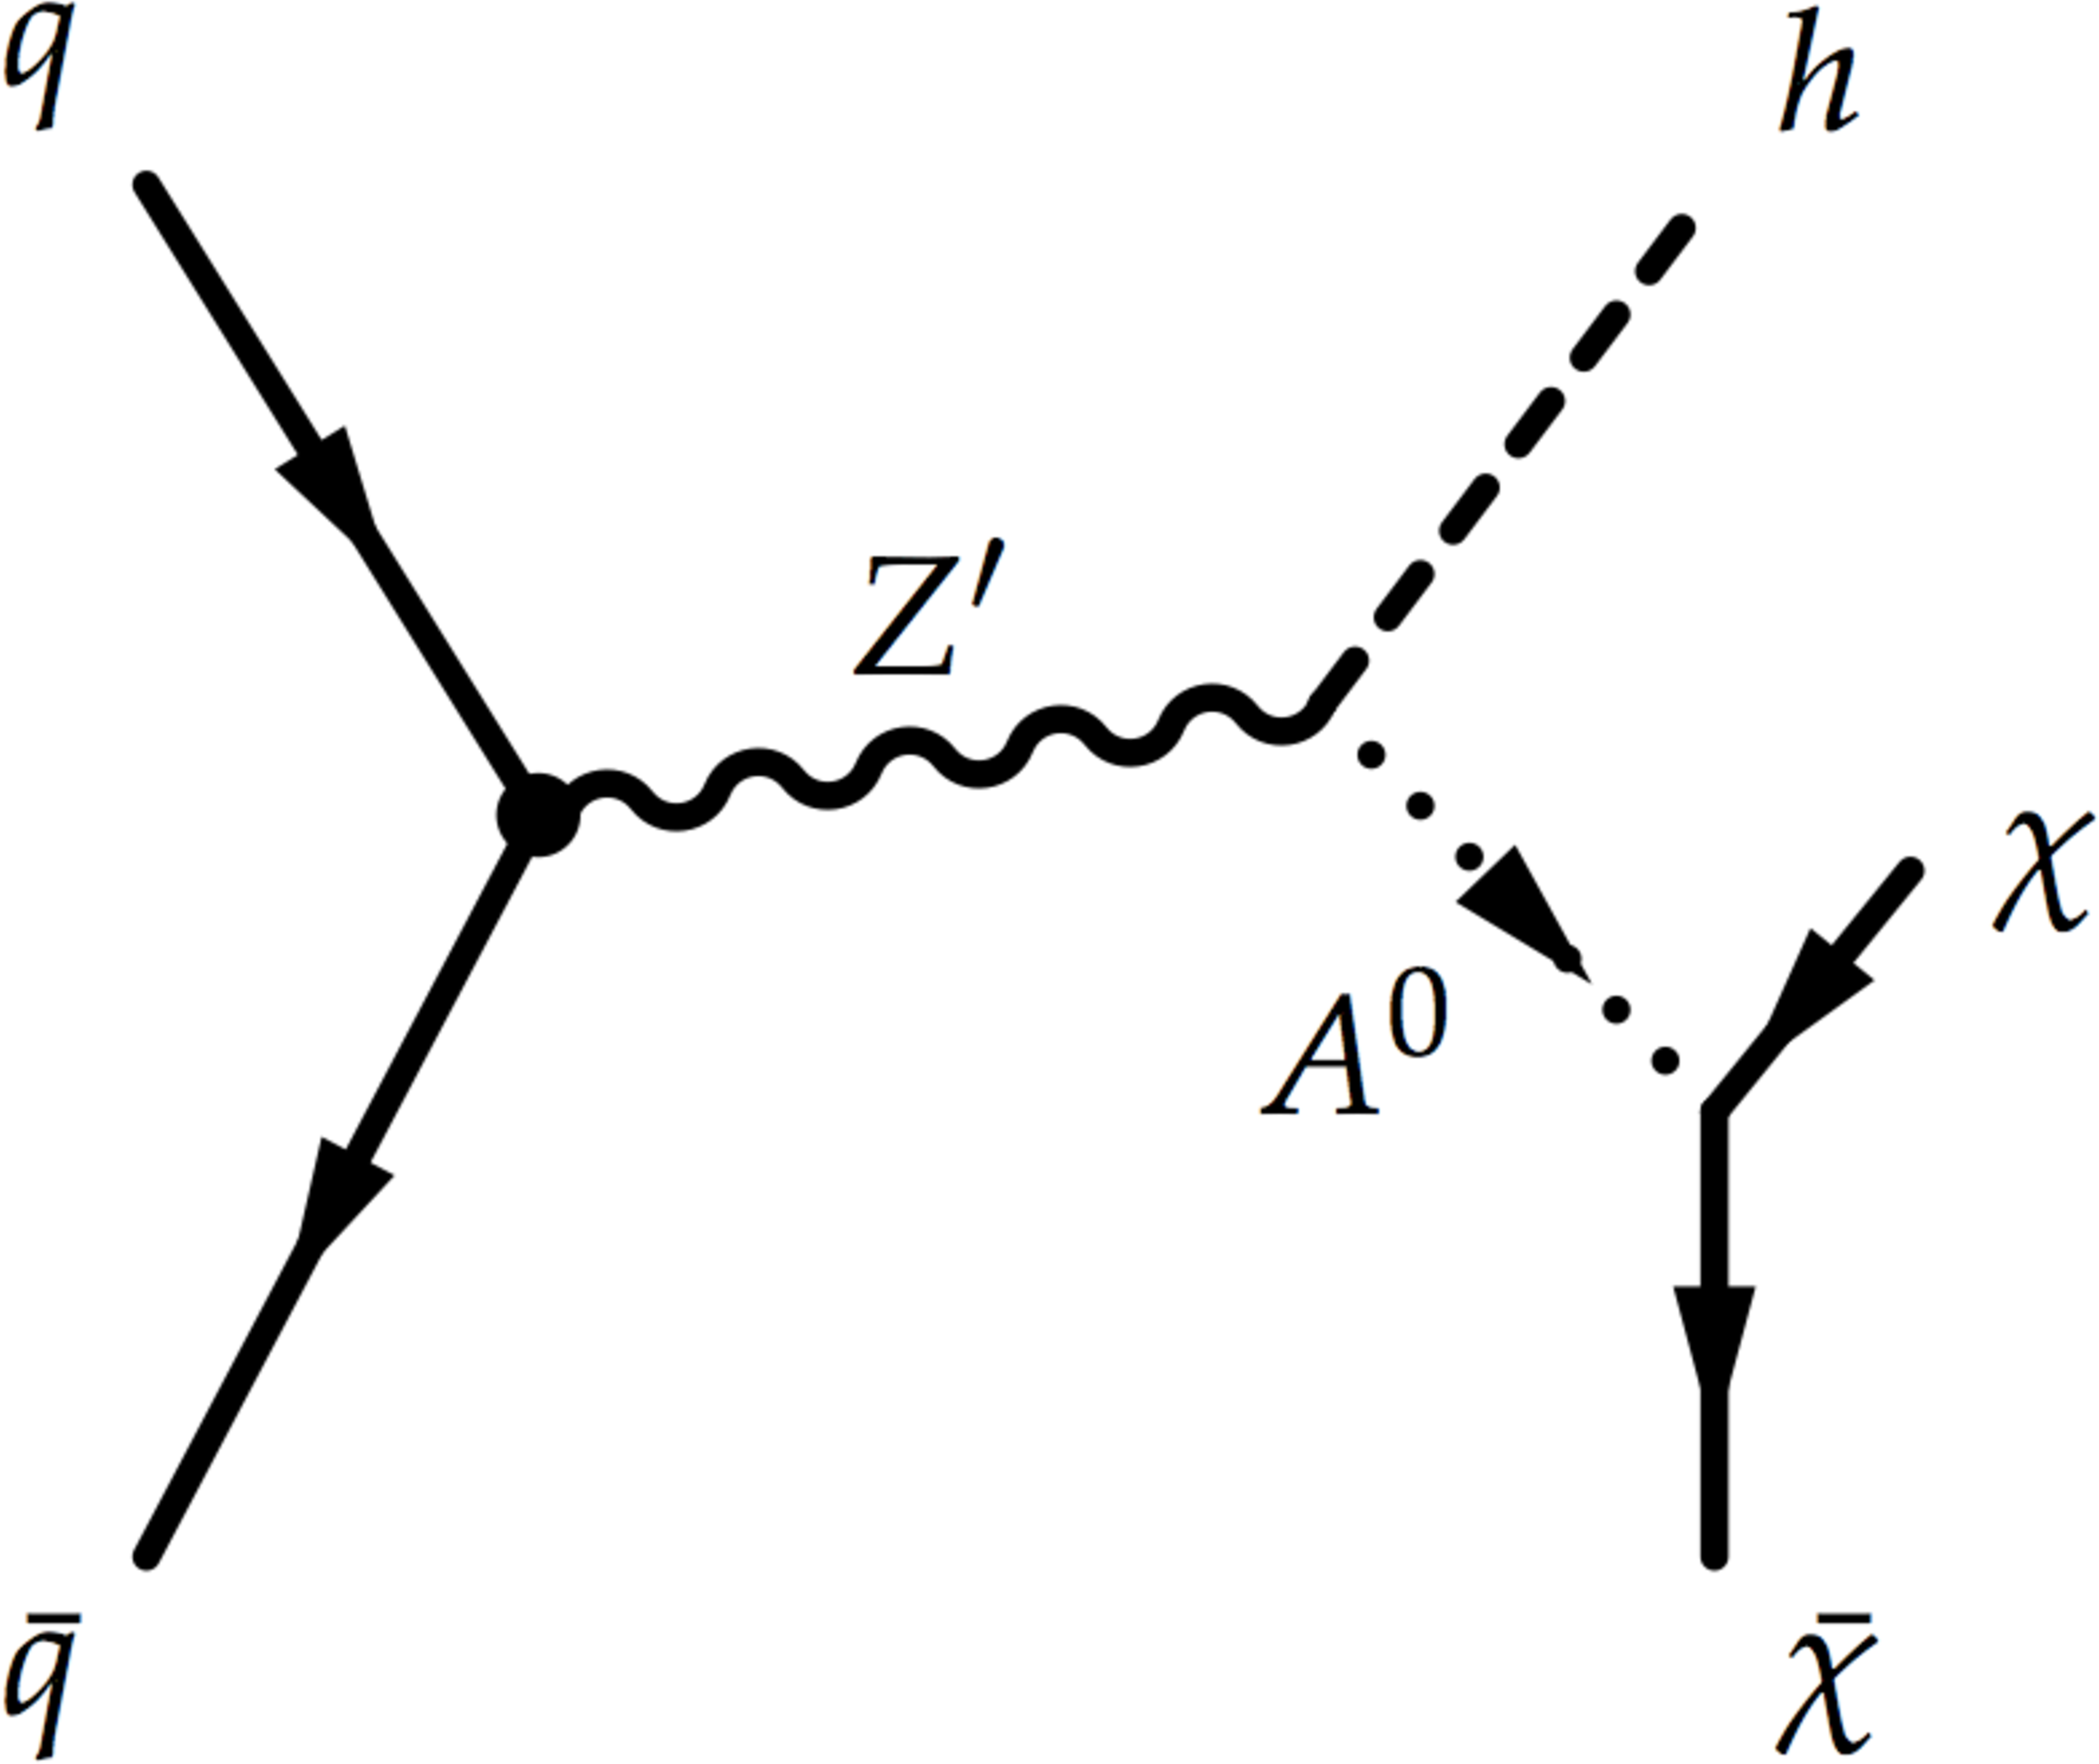
Figure 1:
Feynman diagram of a 2HDM with a new invisibly decaying pseudoscalar $\mathrm{A}_0$ from the decay of an on-shell resonance Z' giving rise to a Higgs+$ {E_{\mathrm {T}}^{\text {miss}}}$ signature. |
png pdf |
Figure 2:
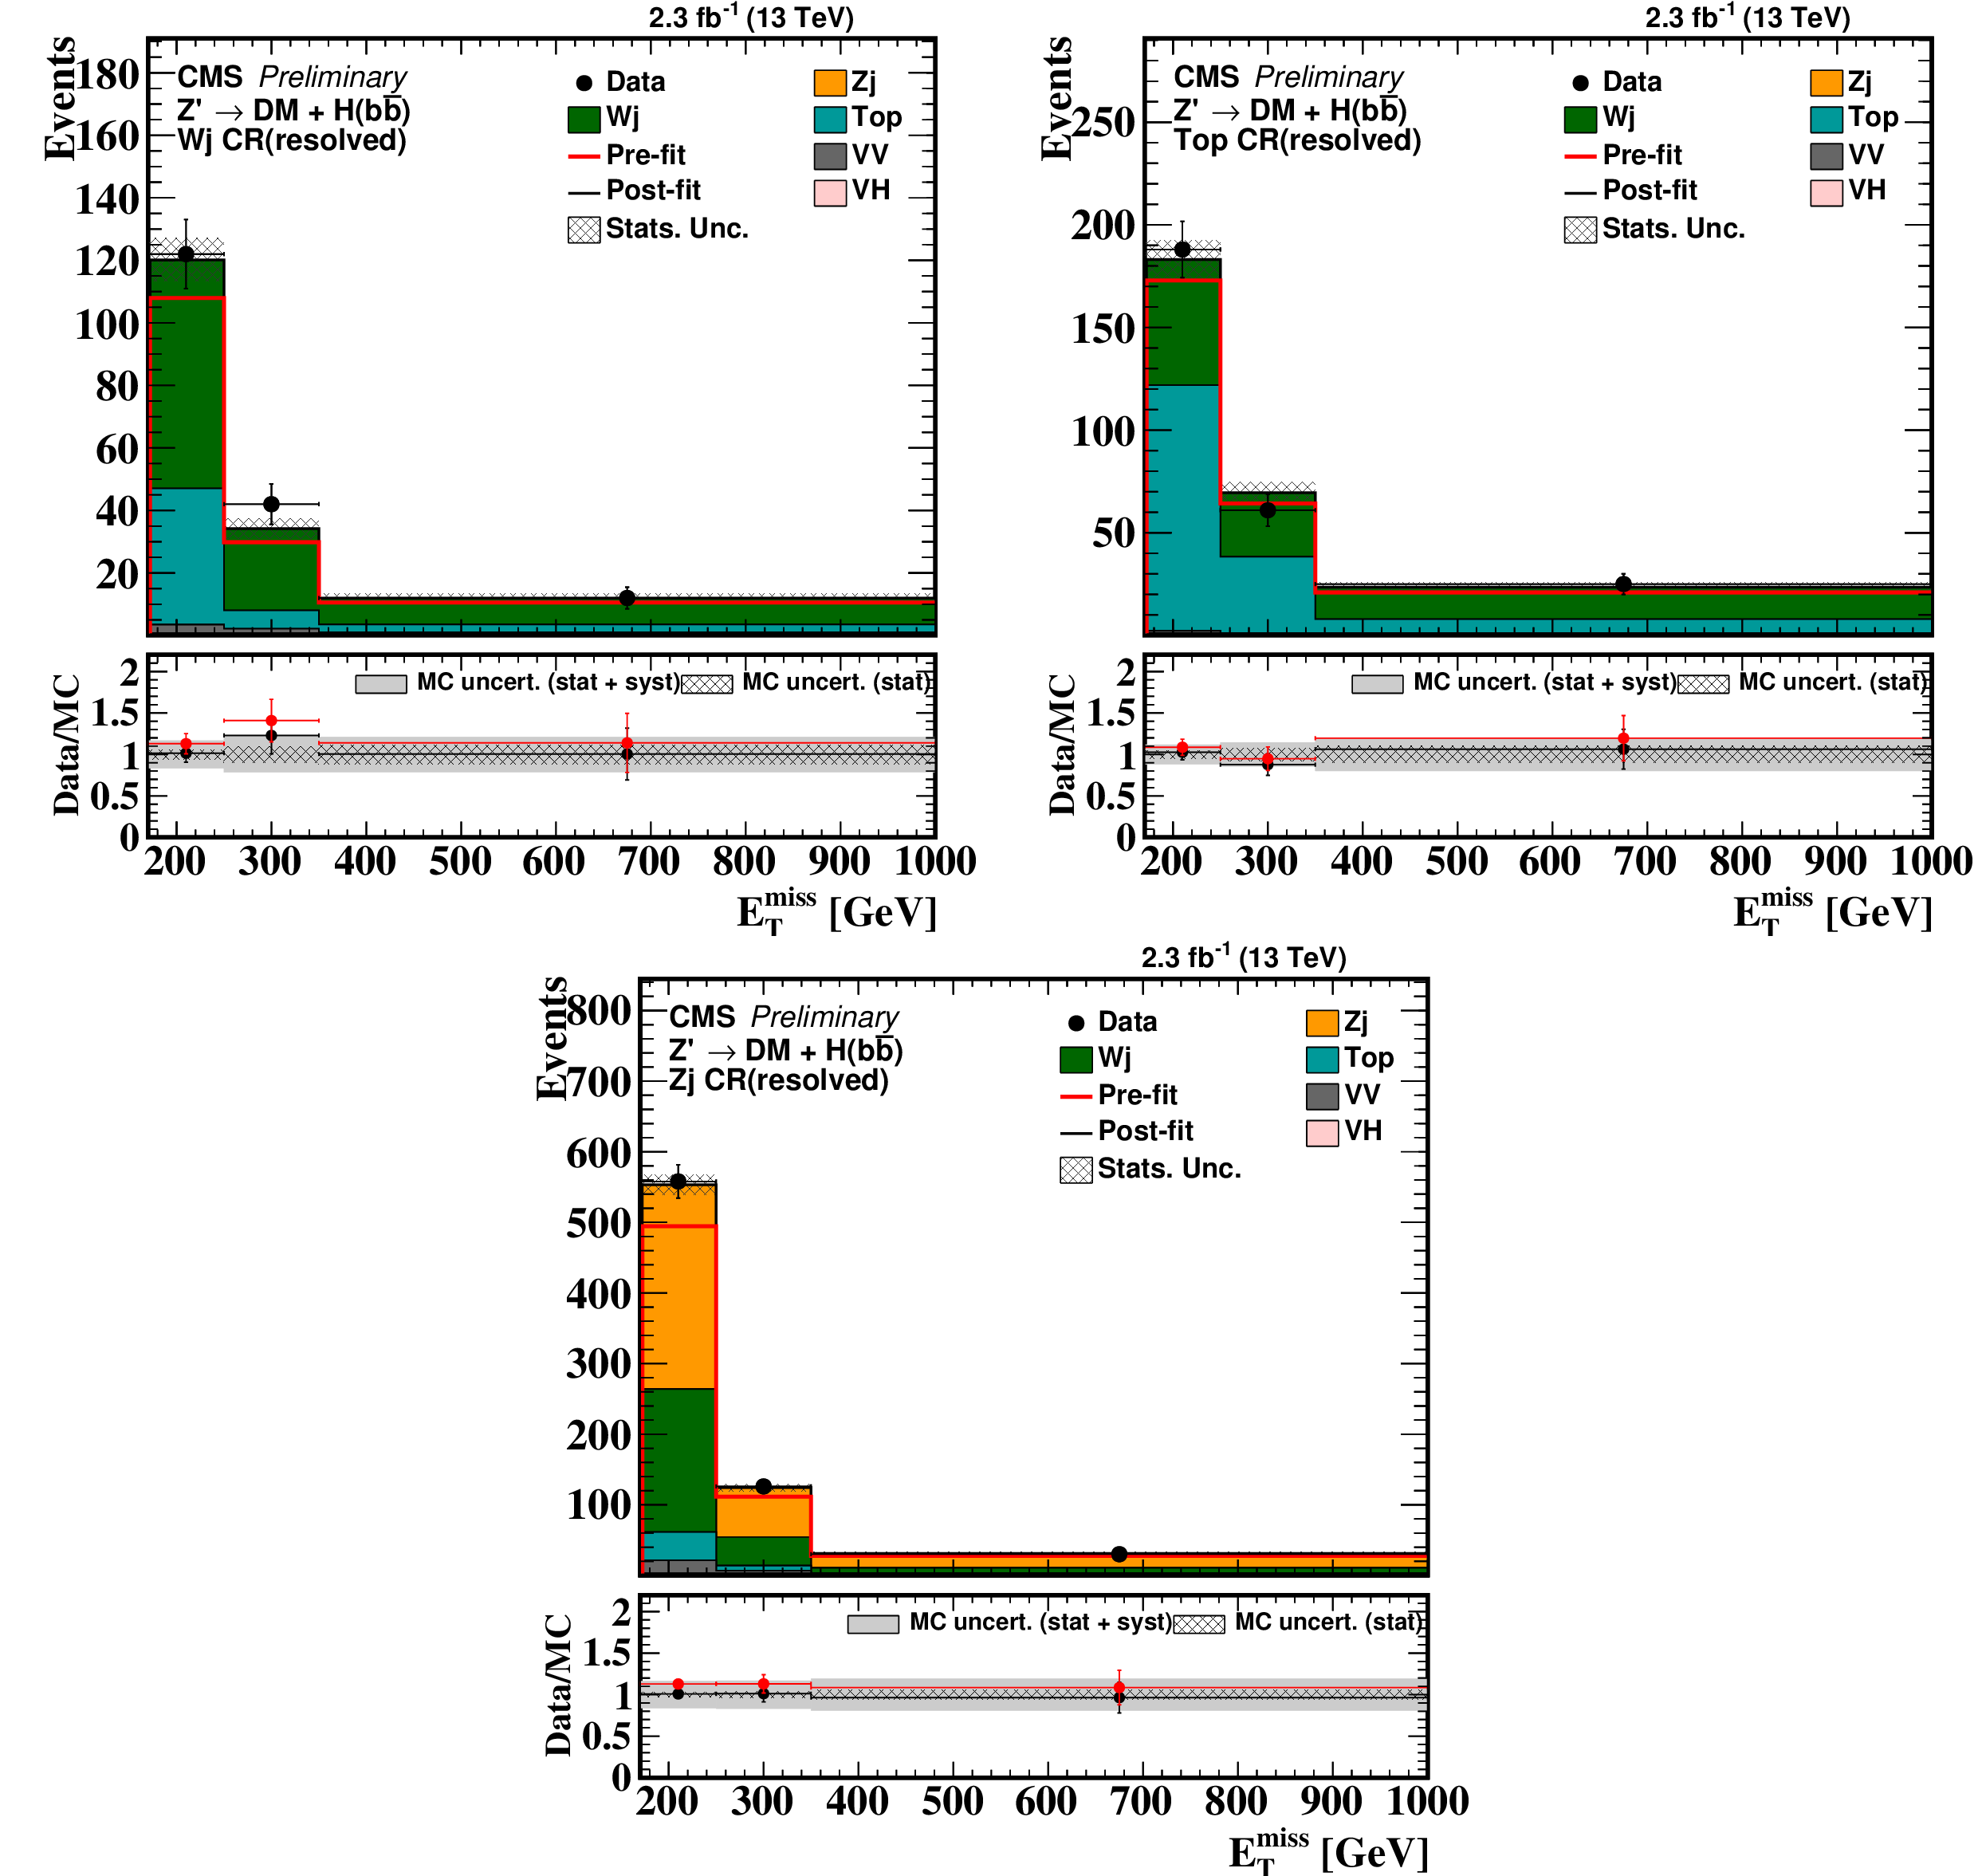
Post-fit and pre-fit distribution of ${E_{\mathrm {T}}^{\text {miss}}}$ expected from SM backgrounds and observed data for the W+jets (top left), Top (top right) and Z($\rightarrow \nu \nu $)+jets (bottom) CRs for the resolved regime. The bottom pads show the data-to-simulation ratio for pre-fit and post-fit background prediction with a dashed band corresponding to the uncertainty due to finite size of simulation samples and a gray band that adds the systematic uncertainty on the post-fit background prediction. The last bin includes all events with ${E_{\mathrm {T}}^{\text {miss}}} > $ 350 GeV. |
png pdf |
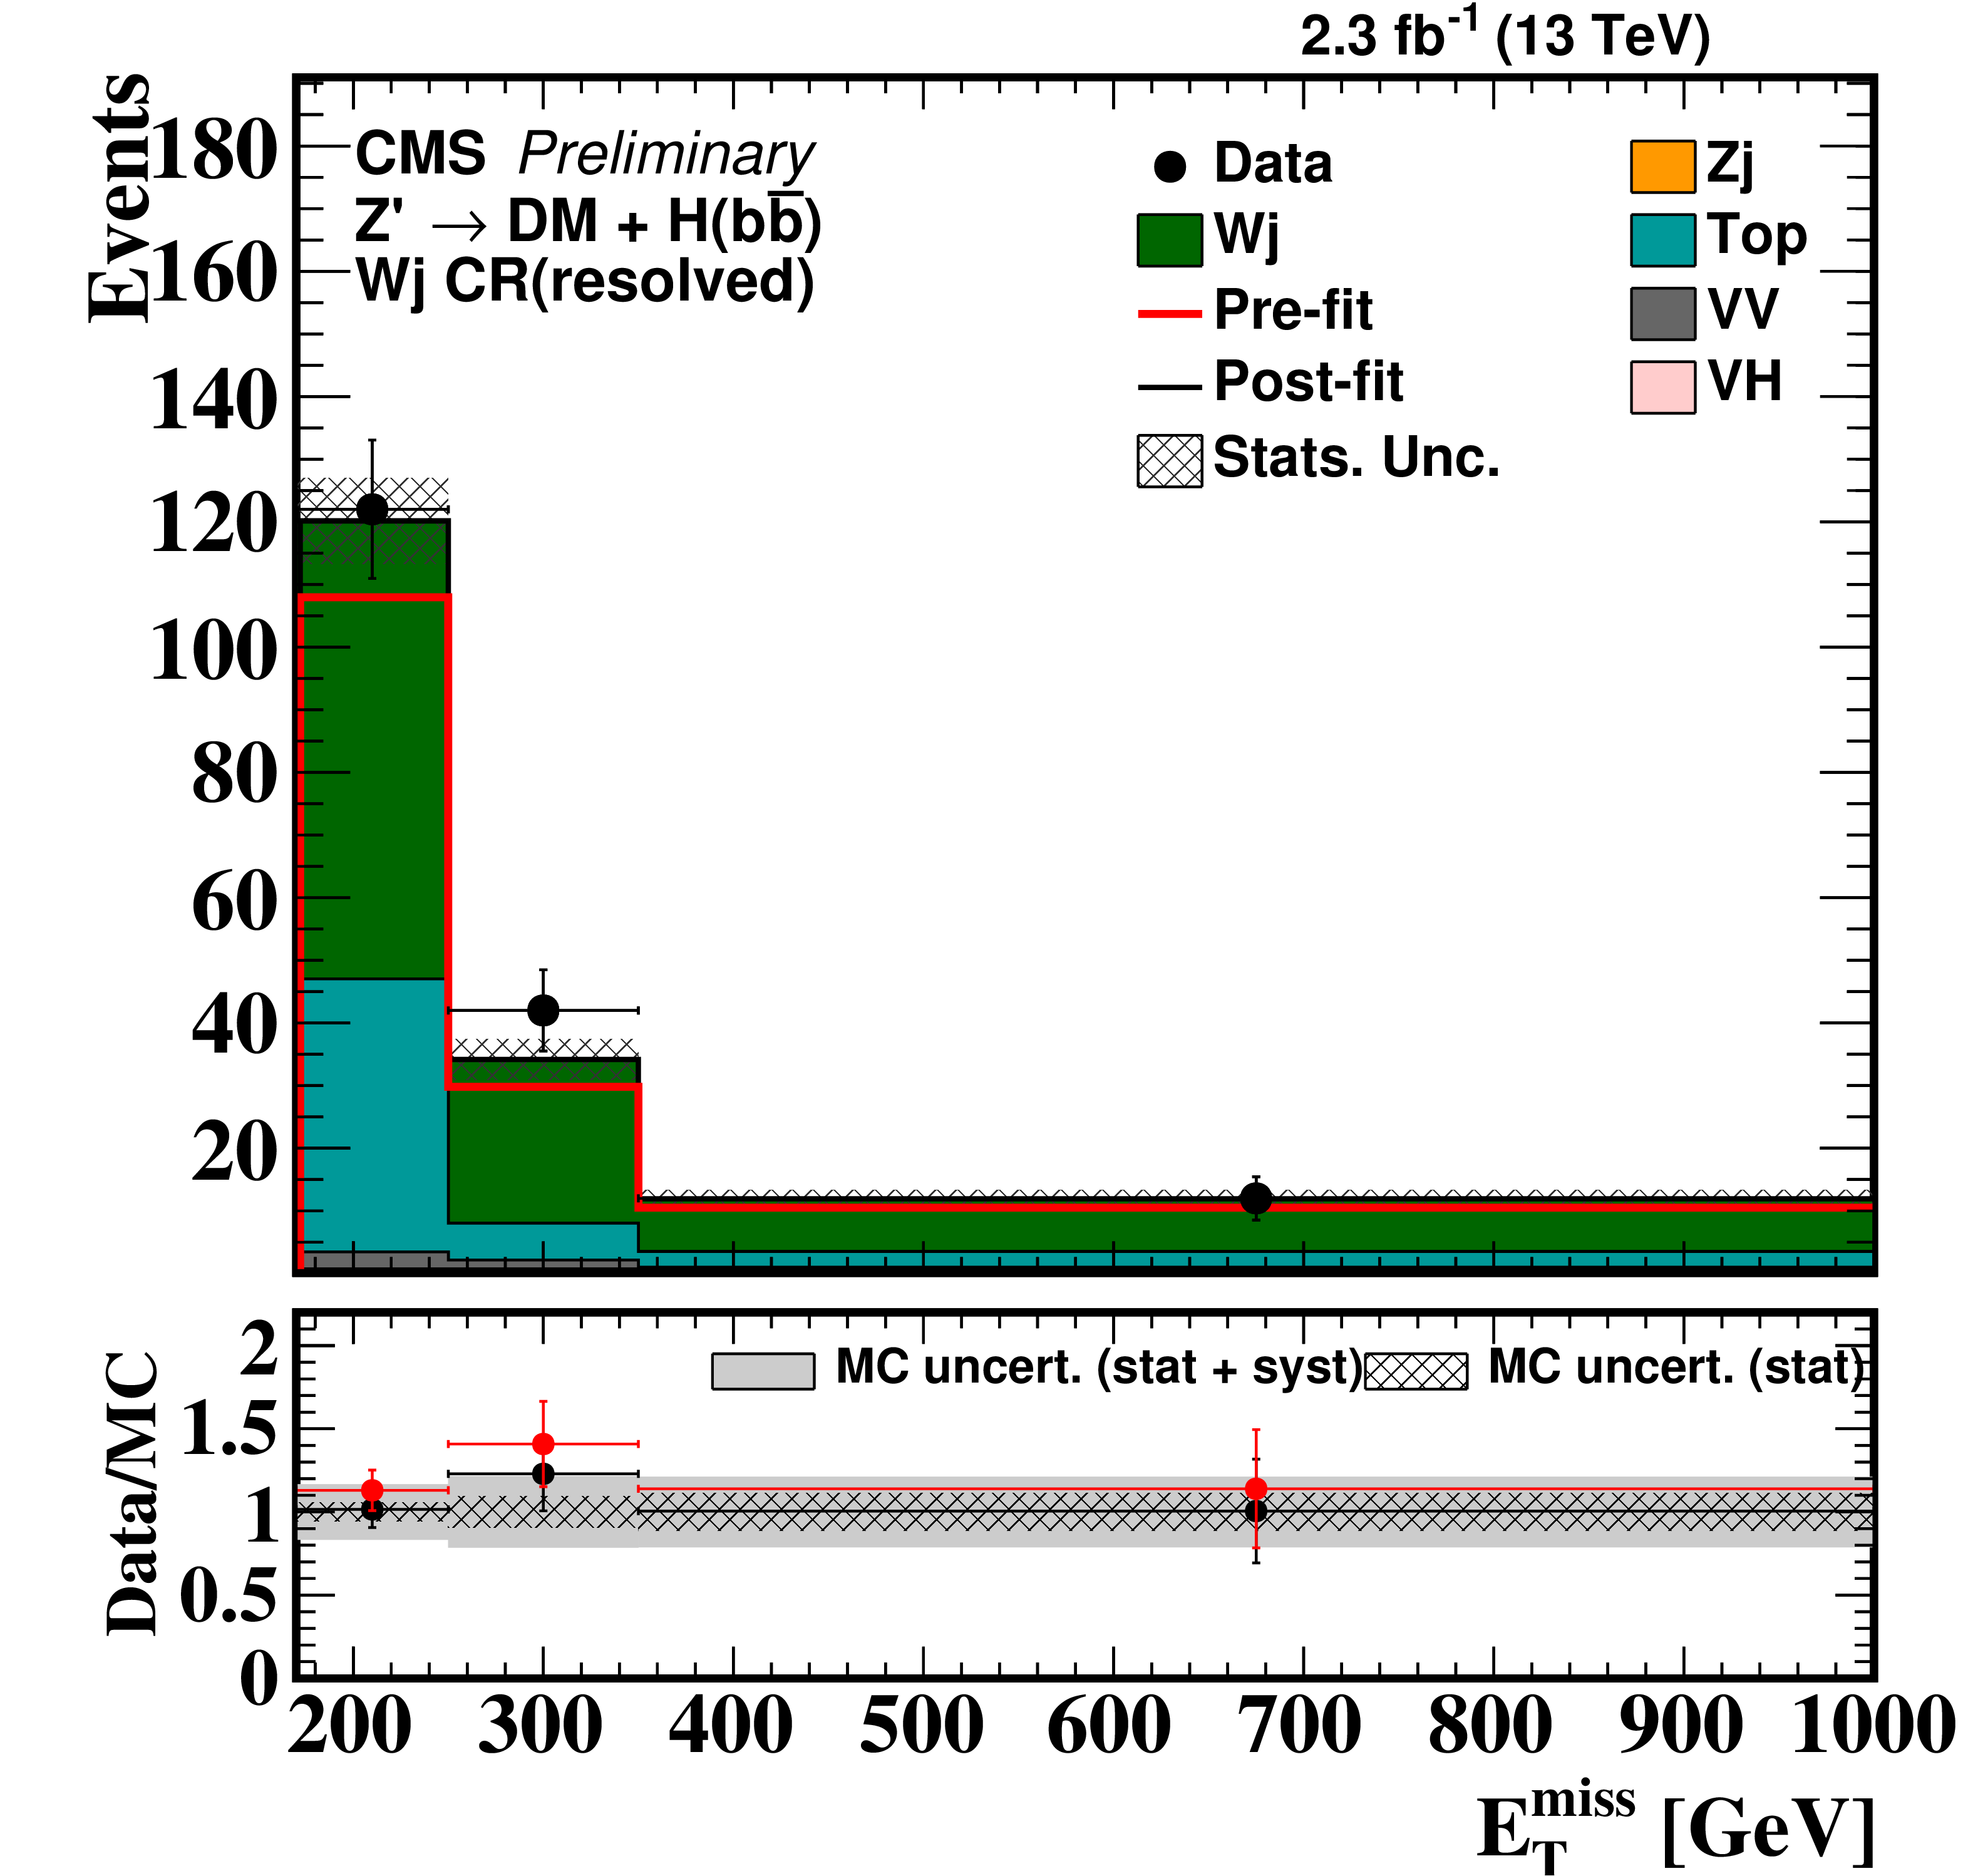
Figure 2-a:
Post-fit and pre-fit distribution of ${E_{\mathrm {T}}^{\text {miss}}}$ expected from SM backgrounds and observed data for the W+jets CR for the resolved regime. The bottom pads show the data-to-simulation ratio for pre-fit and post-fit background prediction with a dashed band corresponding to the uncertainty due to finite size of simulation samples and a gray band that adds the systematic uncertainty on the post-fit background prediction. The last bin includes all events with ${E_{\mathrm {T}}^{\text {miss}}} > $ 350 GeV. |
png pdf |
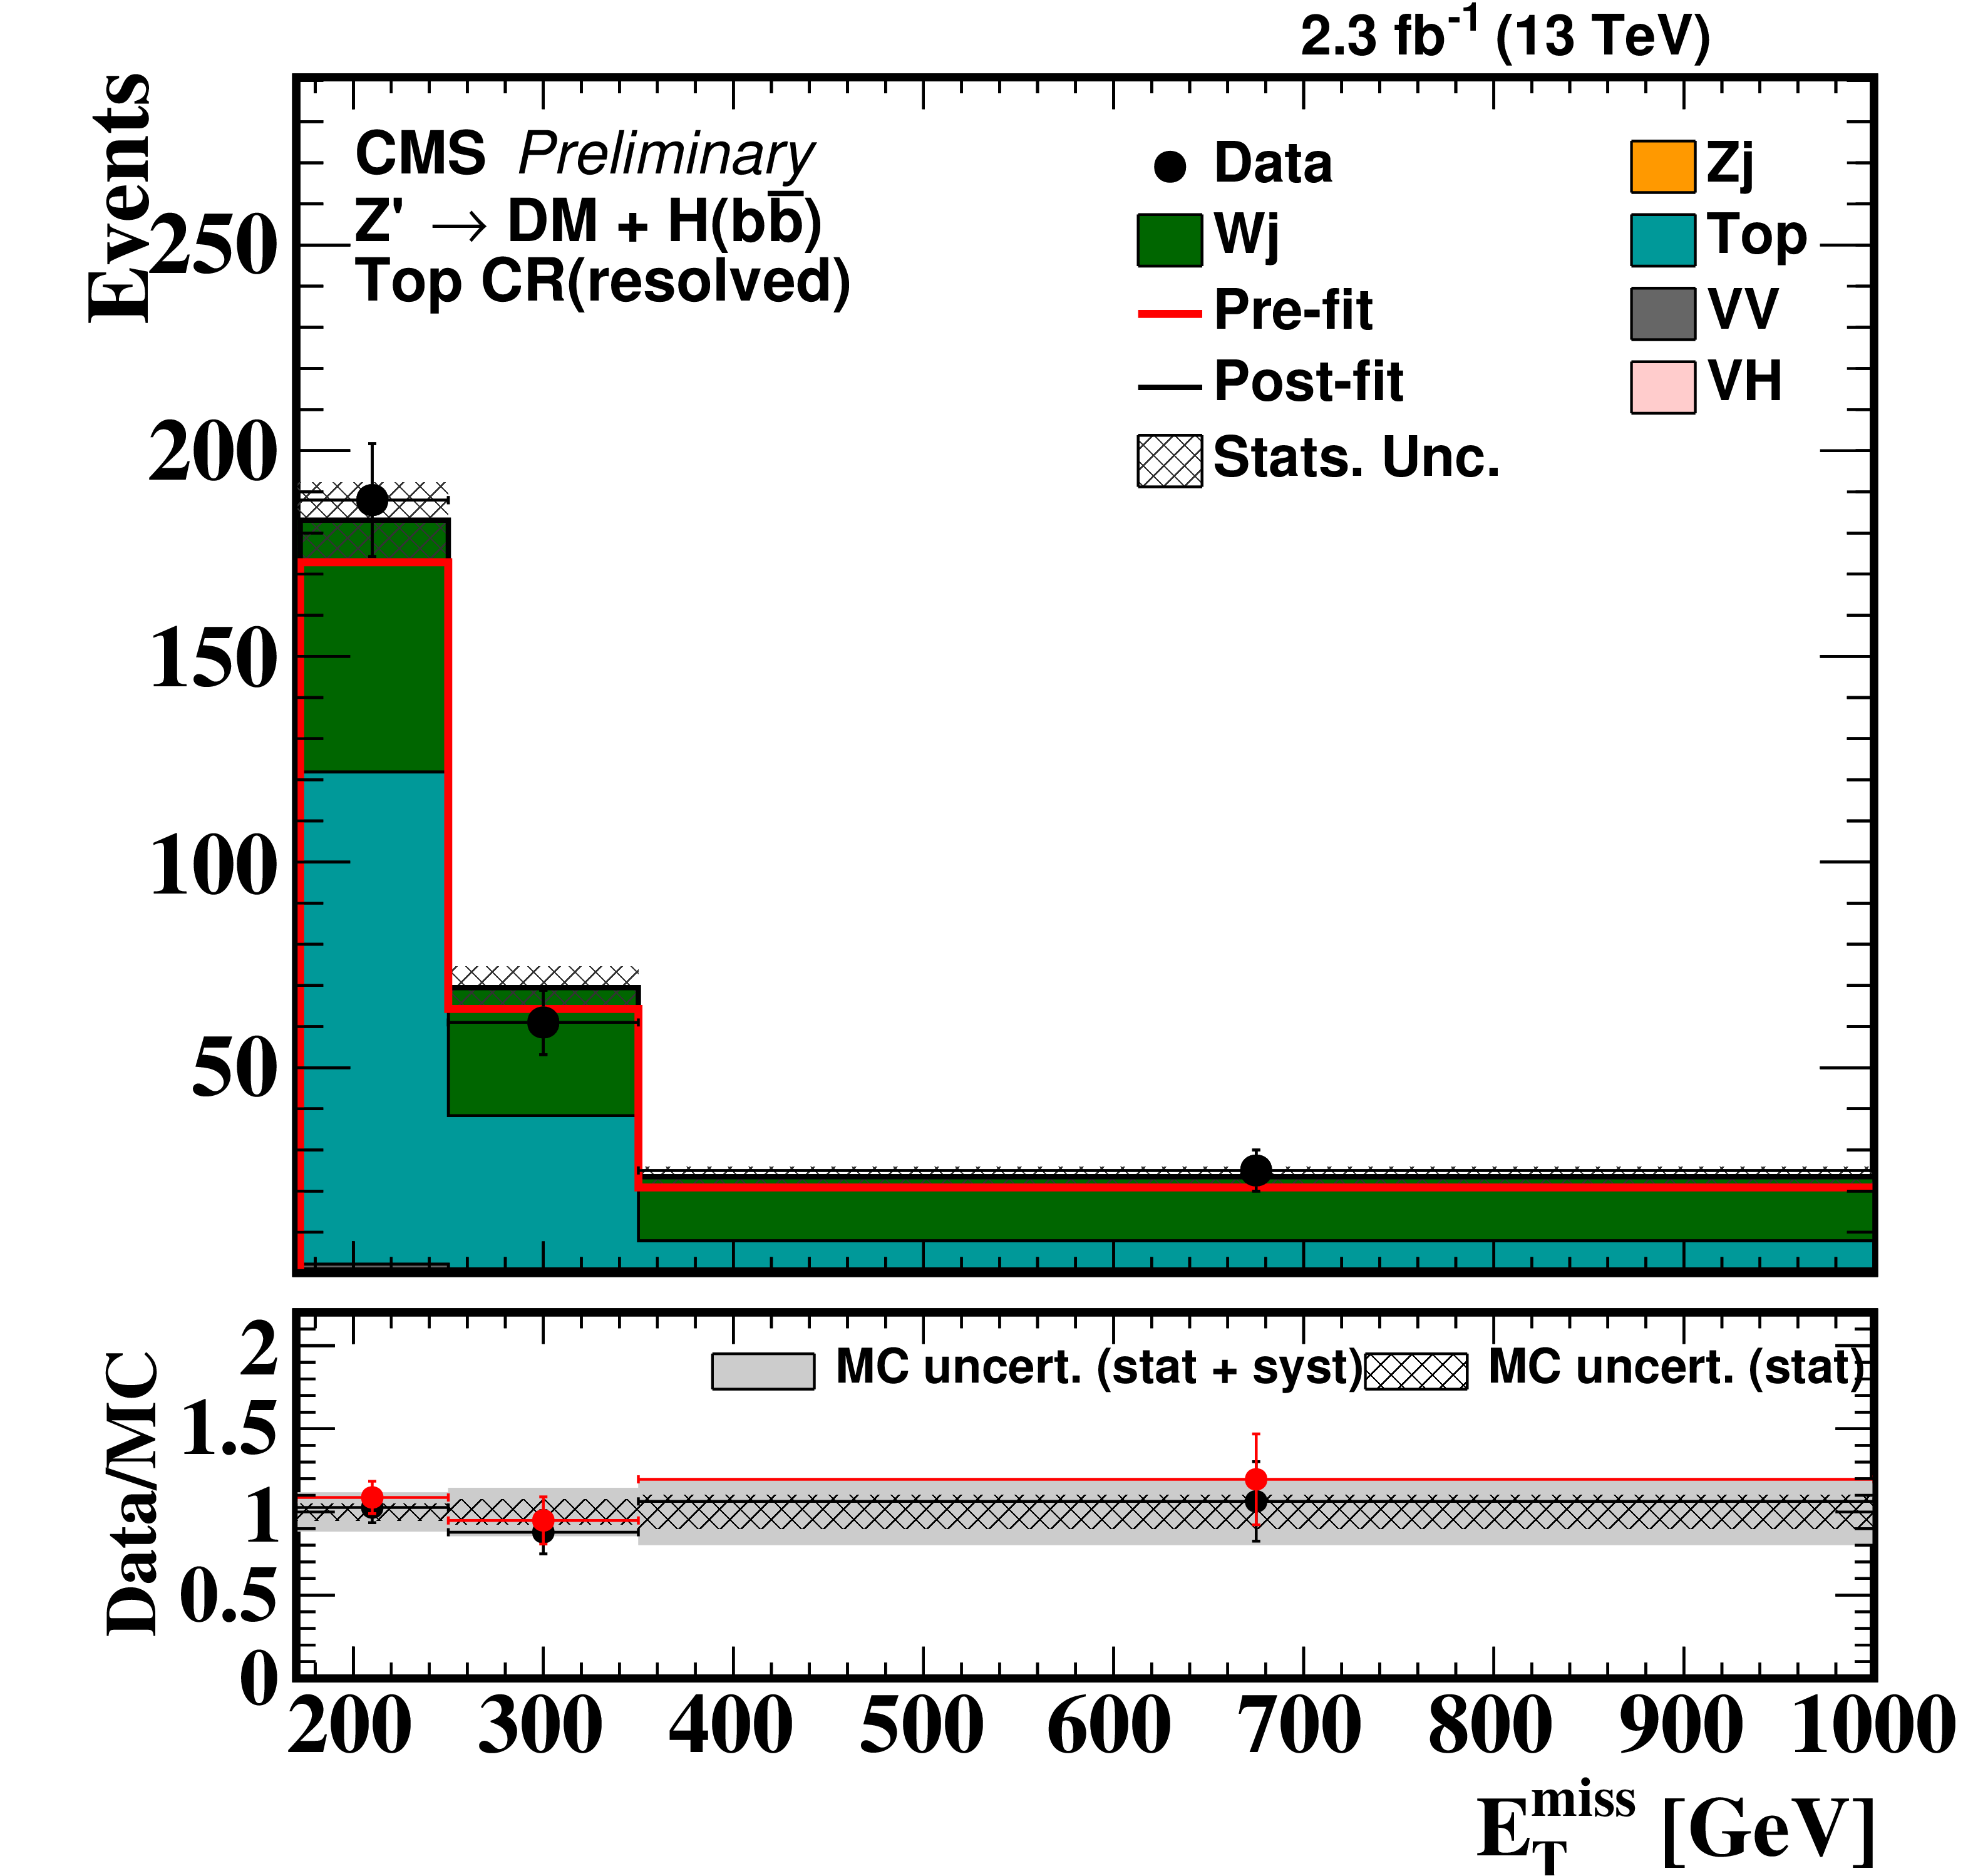
Figure 2-b:
Post-fit and pre-fit distribution of ${E_{\mathrm {T}}^{\text {miss}}}$ expected from SM backgrounds and observed data for the Top CR for the resolved regime. The bottom pads show the data-to-simulation ratio for pre-fit and post-fit background prediction with a dashed band corresponding to the uncertainty due to finite size of simulation samples and a gray band that adds the systematic uncertainty on the post-fit background prediction. The last bin includes all events with ${E_{\mathrm {T}}^{\text {miss}}} > $ 350 GeV. |
png pdf |
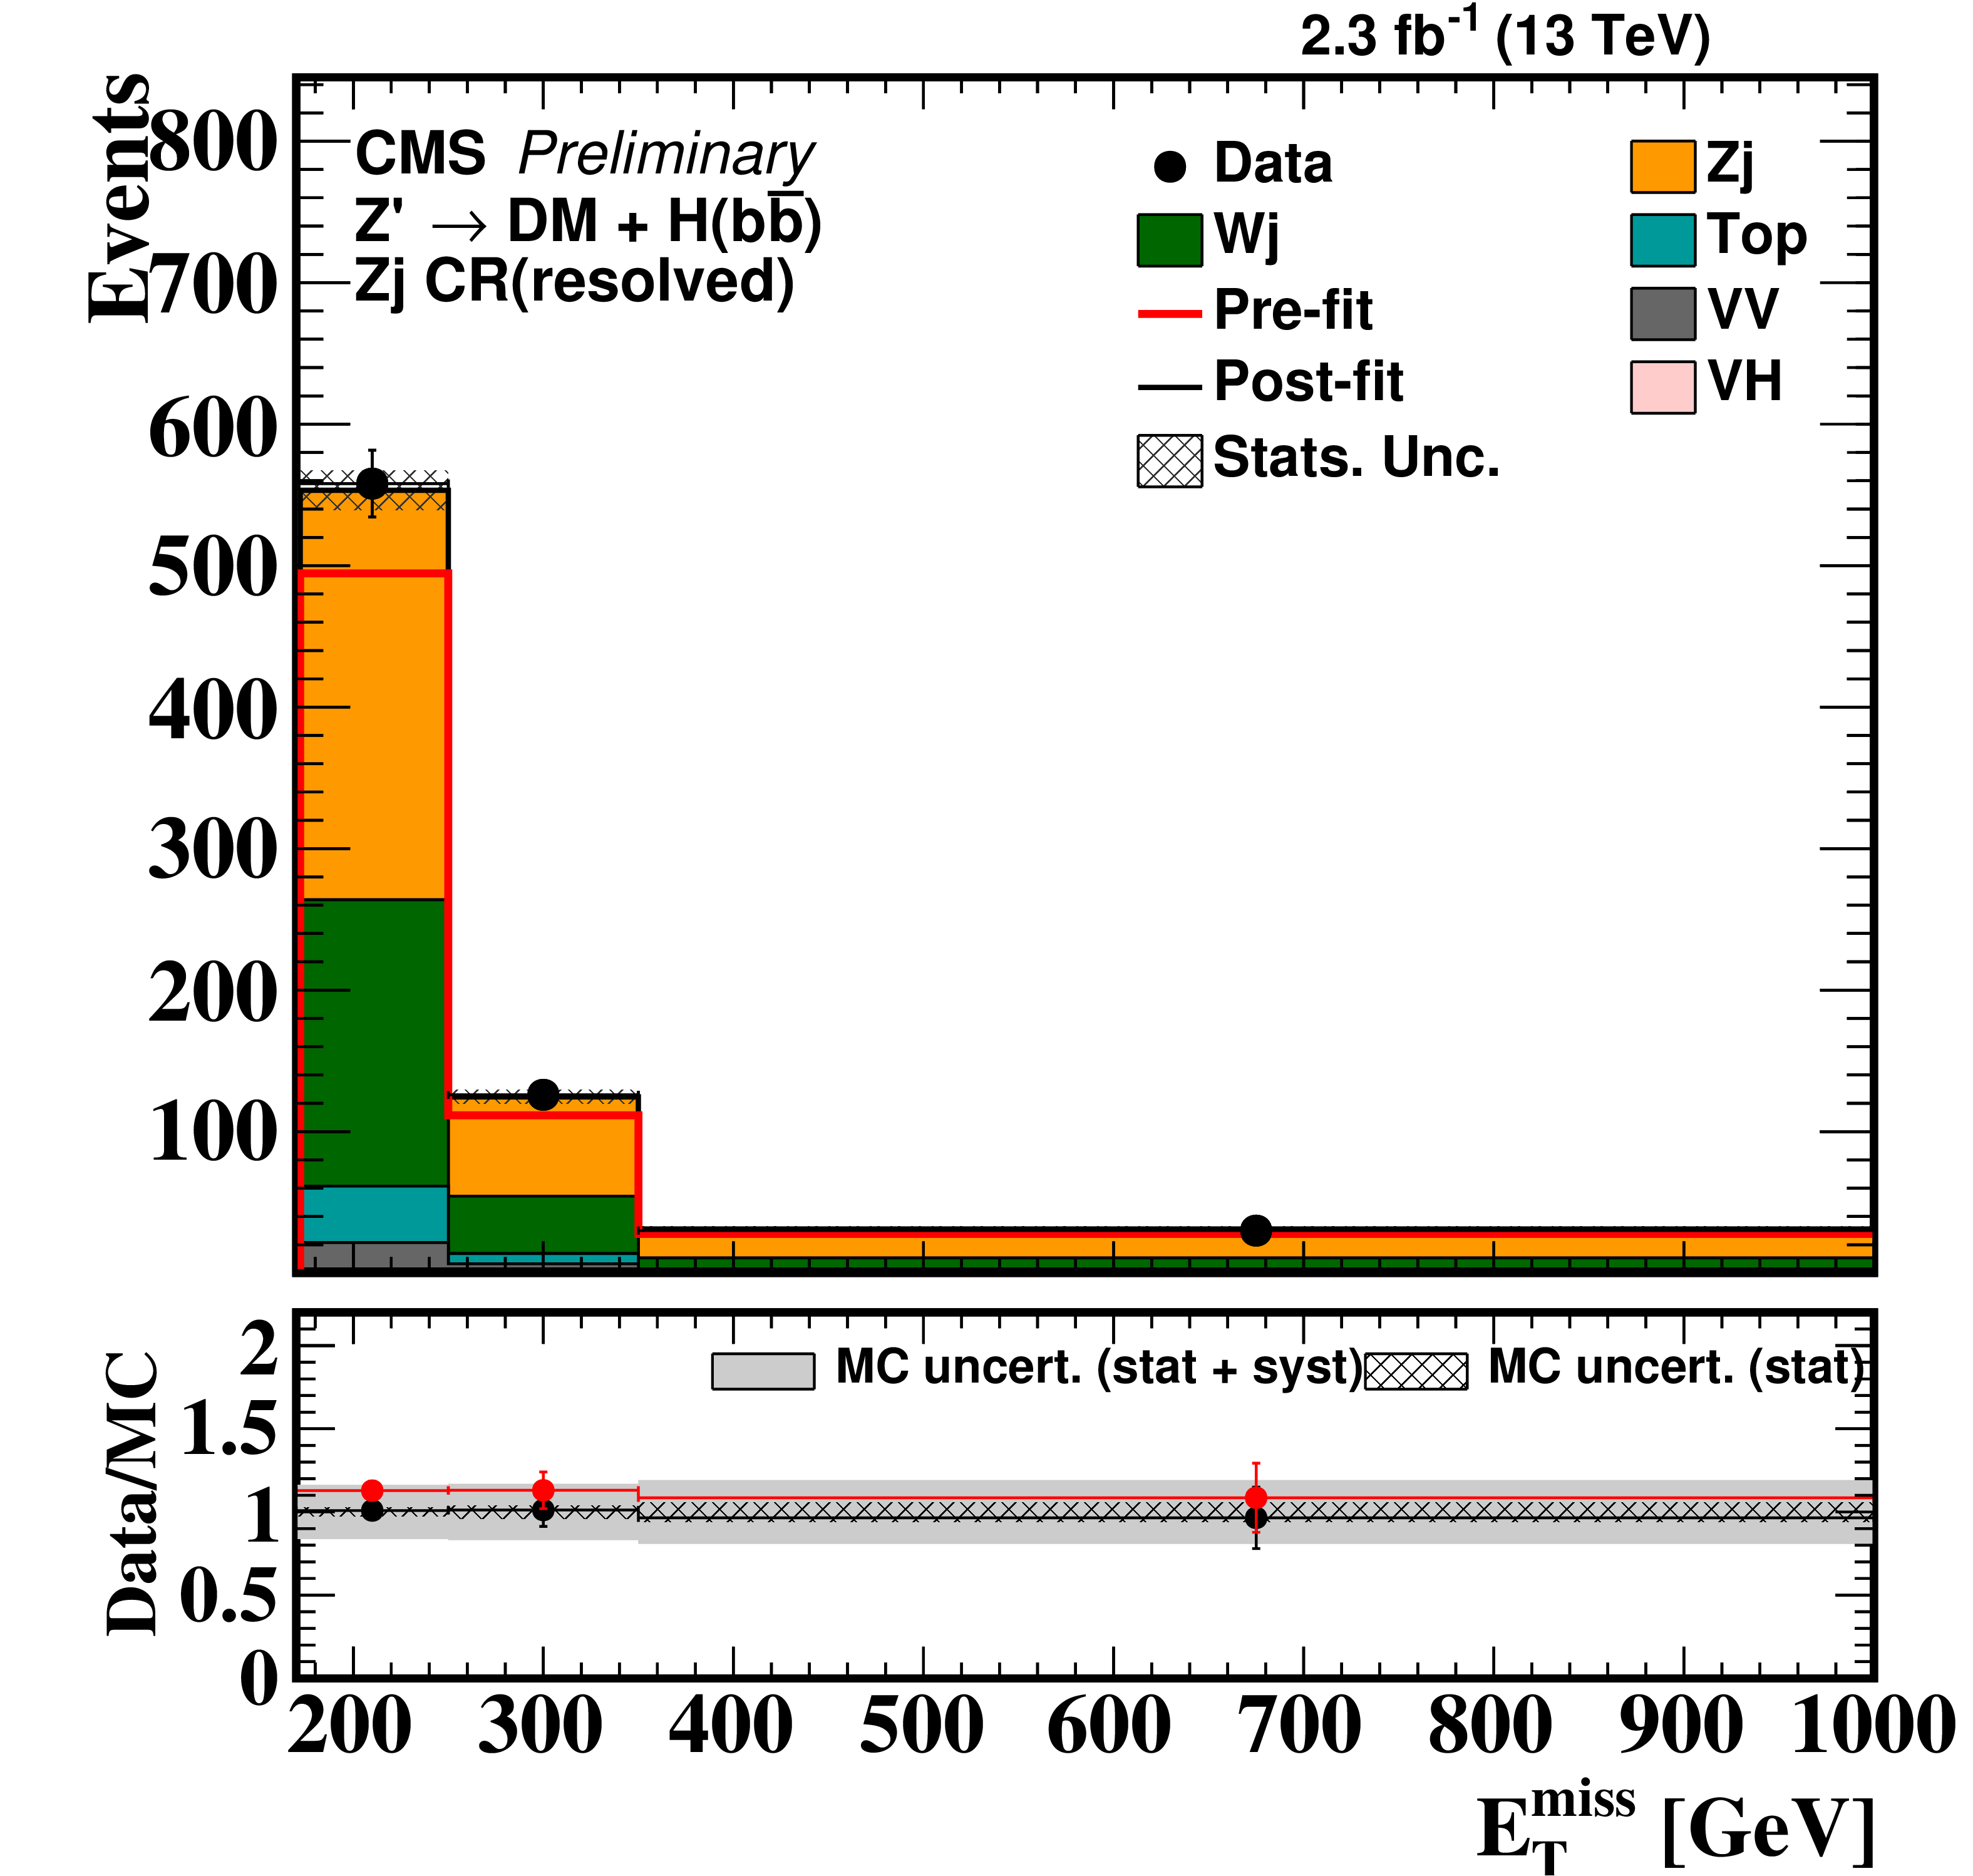
Figure 2-c:
Post-fit and pre-fit distribution of ${E_{\mathrm {T}}^{\text {miss}}}$ expected from SM backgrounds and observed data for the Z($\rightarrow \nu \nu $)+jets CR for the resolved regime. The bottom pads show the data-to-simulation ratio for pre-fit and post-fit background prediction with a dashed band corresponding to the uncertainty due to finite size of simulation samples and a gray band that adds the systematic uncertainty on the post-fit background prediction. The last bin includes all events with ${E_{\mathrm {T}}^{\text {miss}}} > $ 350 GeV. |

png pdf |
Figure 3:
Post-fit and pre-fit distribution of ${E_{\mathrm {T}}^{\text {miss}}}$ expected from SM backgrounds and observed data for the one-lepton (left) and Z($\rightarrow \nu \nu $)+jets (right) CRs for the boosted regime. The bottom pads show the data-to-simulation ratio for pre-fit and post-fit background prediction with a dashed band corresponding to the uncertainty due to finite size of simulation samples and a gray band that adds the systematic uncertainty on the post-fit background prediction. The last bin includes all events with ${E_{\mathrm {T}}^{\text {miss}}} > $ 500 GeV. |
png pdf |
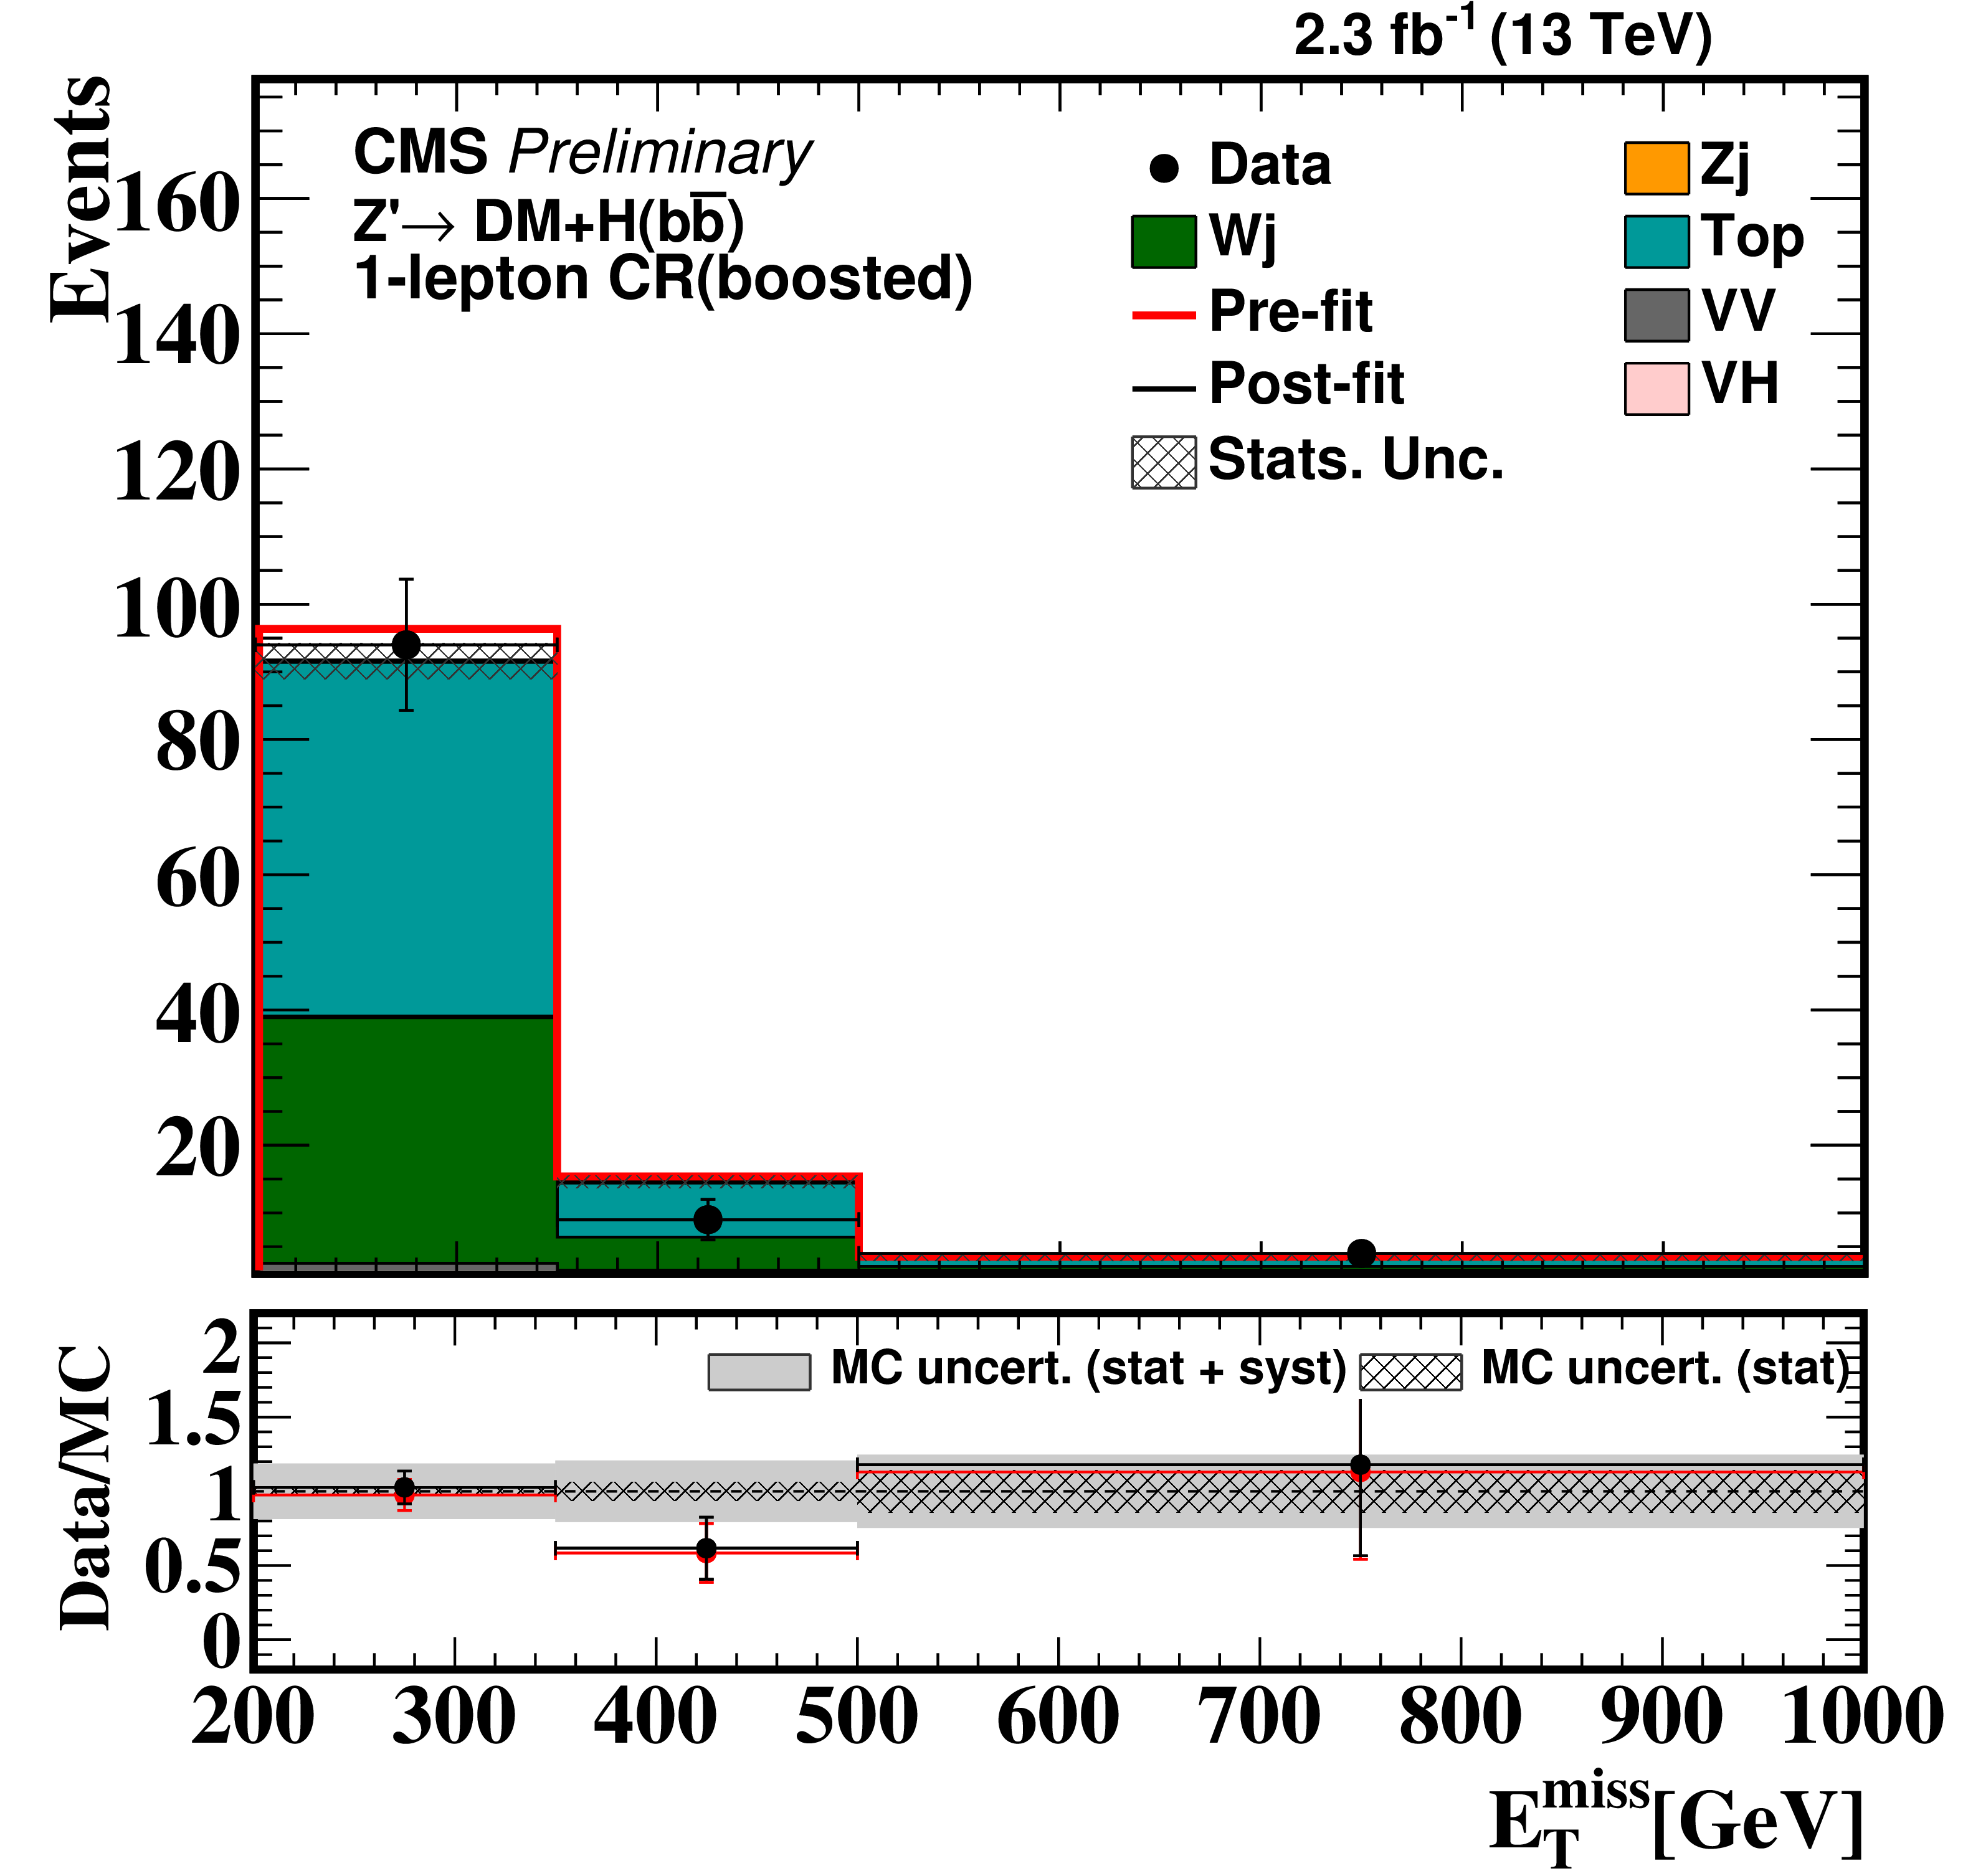
Figure 3-a:
Post-fit and pre-fit distribution of ${E_{\mathrm {T}}^{\text {miss}}}$ expected from SM backgrounds and observed data for the one-lepton CR for the boosted regime. The bottom pads show the data-to-simulation ratio for pre-fit and post-fit background prediction with a dashed band corresponding to the uncertainty due to finite size of simulation samples and a gray band that adds the systematic uncertainty on the post-fit background prediction. The last bin includes all events with ${E_{\mathrm {T}}^{\text {miss}}} > $ 500 GeV. |
png pdf |
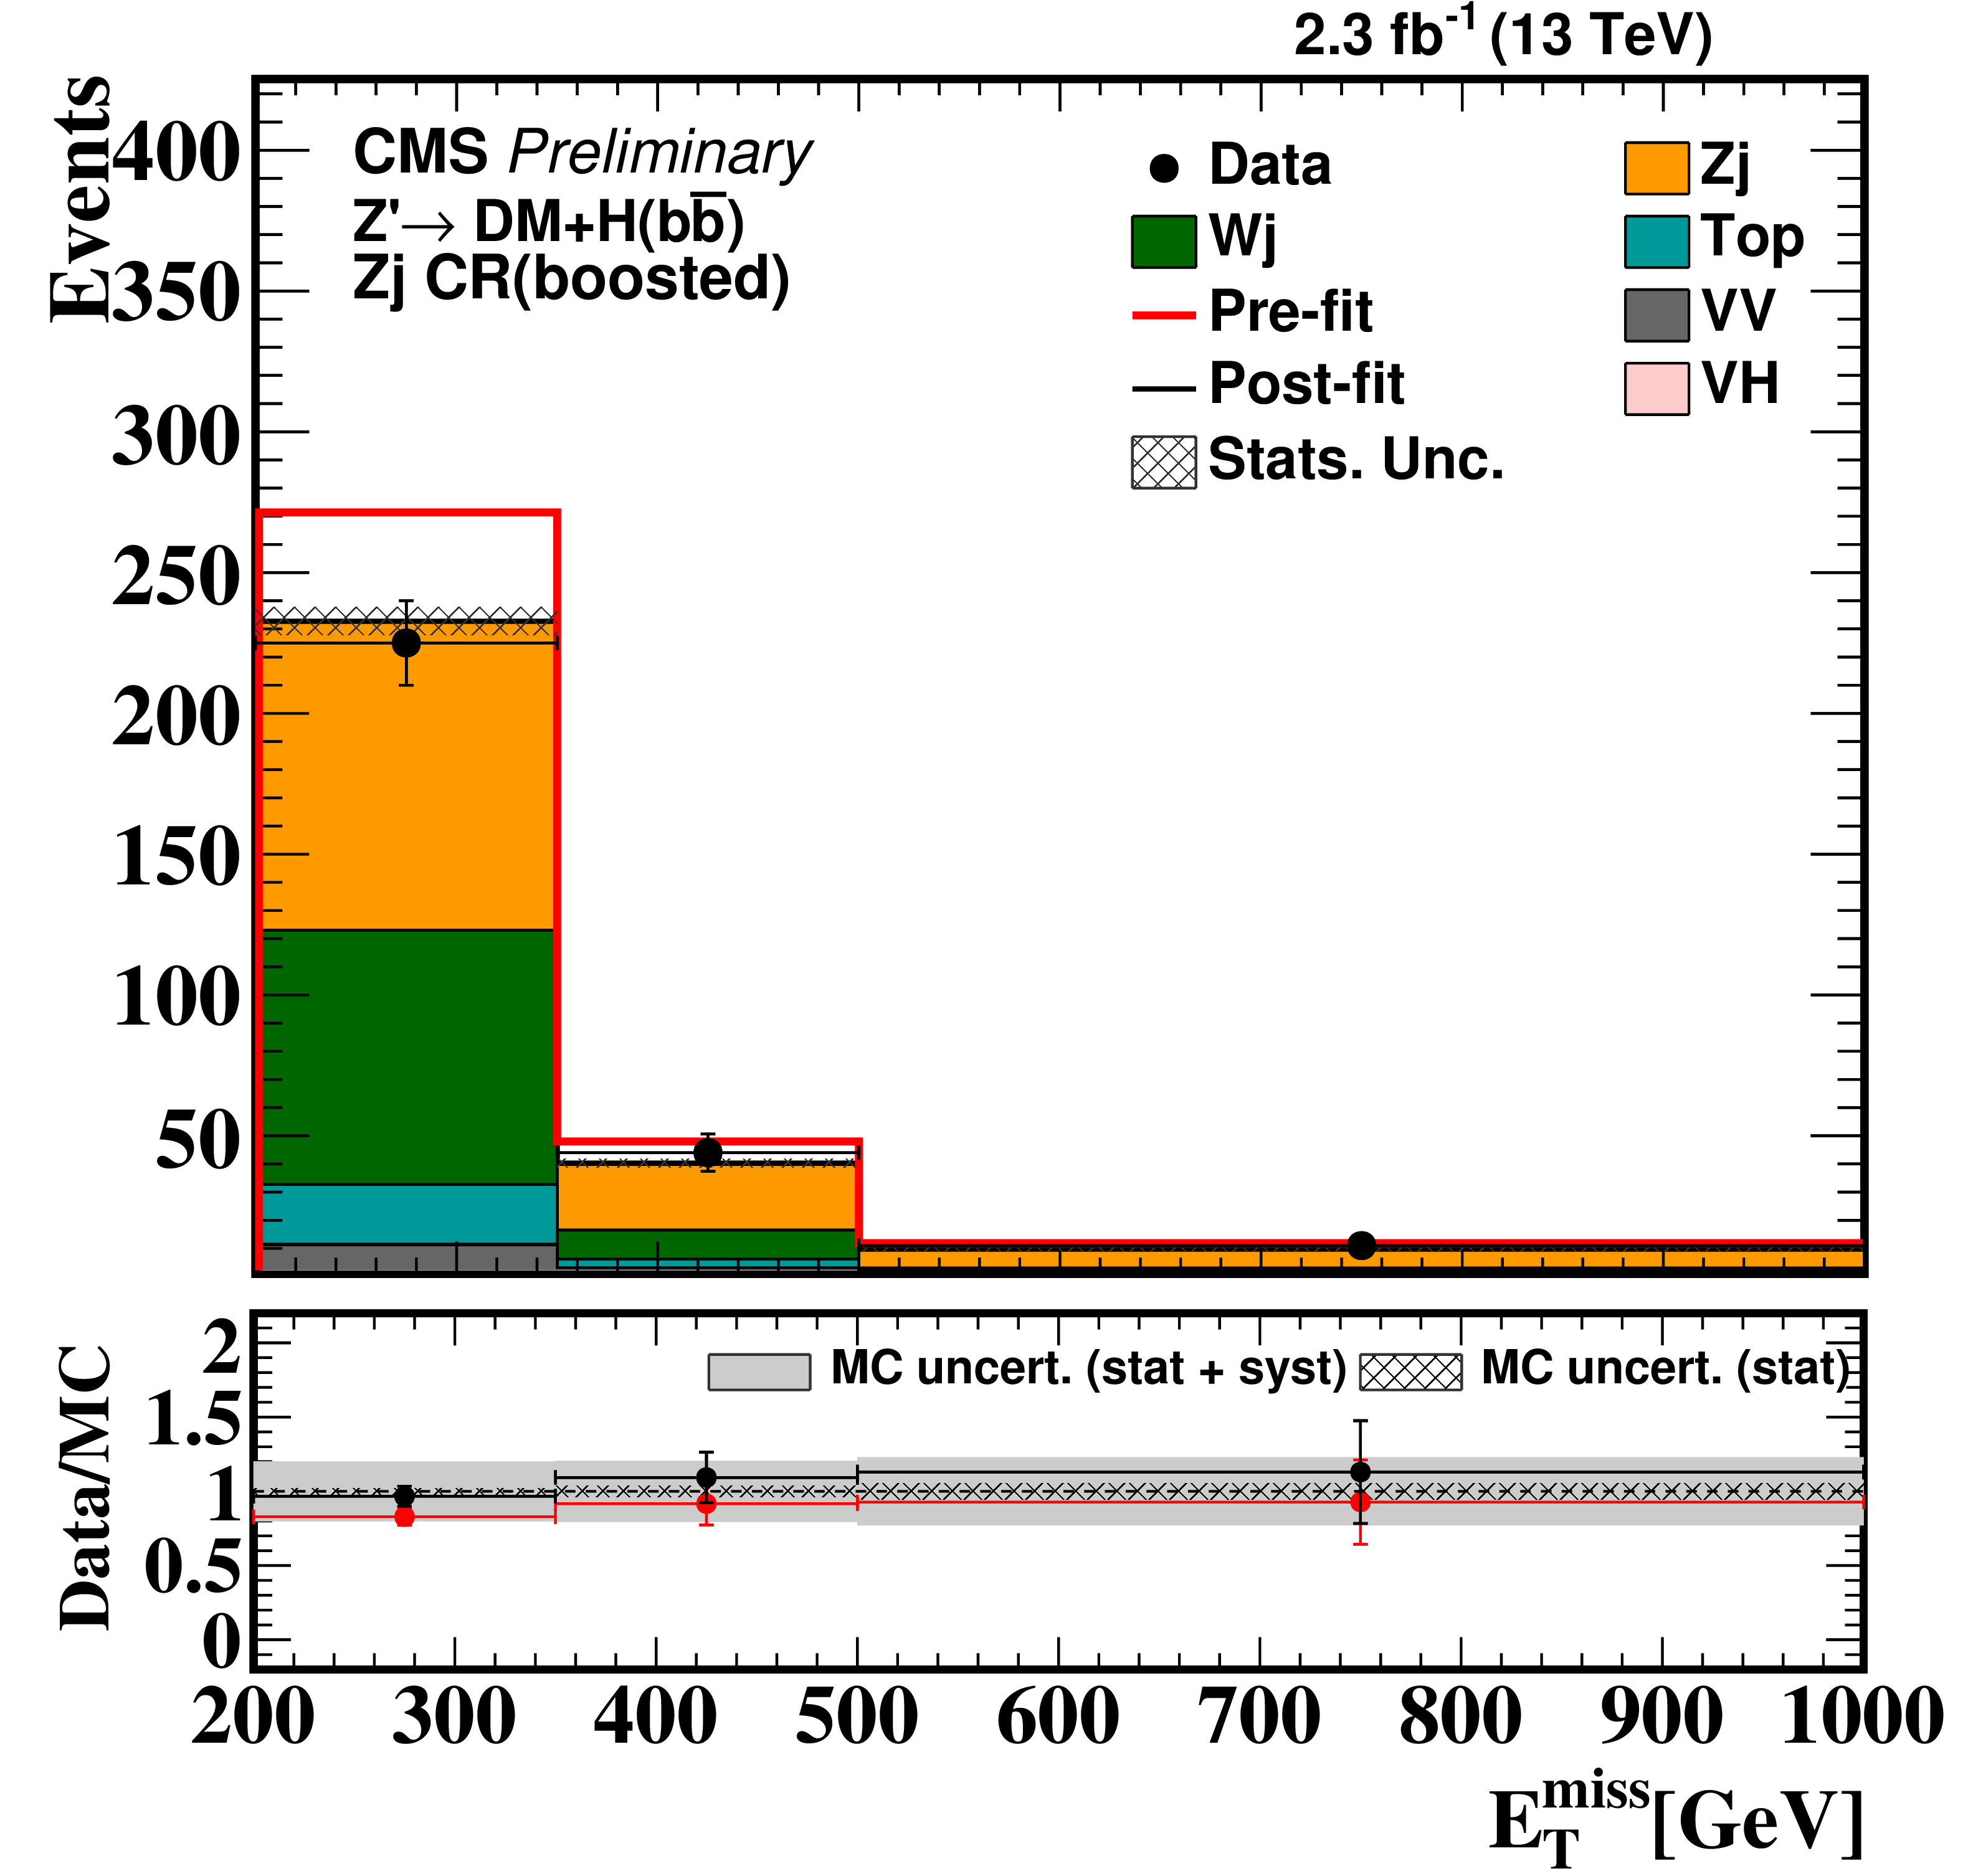
Figure 3-b:
Post-fit and pre-fit distribution of ${E_{\mathrm {T}}^{\text {miss}}}$ expected from SM backgrounds and observed data for the Z($\rightarrow \nu \nu $)+jets CR for the boosted regime. The bottom pads show the data-to-simulation ratio for pre-fit and post-fit background prediction with a dashed band corresponding to the uncertainty due to finite size of simulation samples and a gray band that adds the systematic uncertainty on the post-fit background prediction. The last bin includes all events with ${E_{\mathrm {T}}^{\text {miss}}} > $ 500 GeV. |
png pdf |
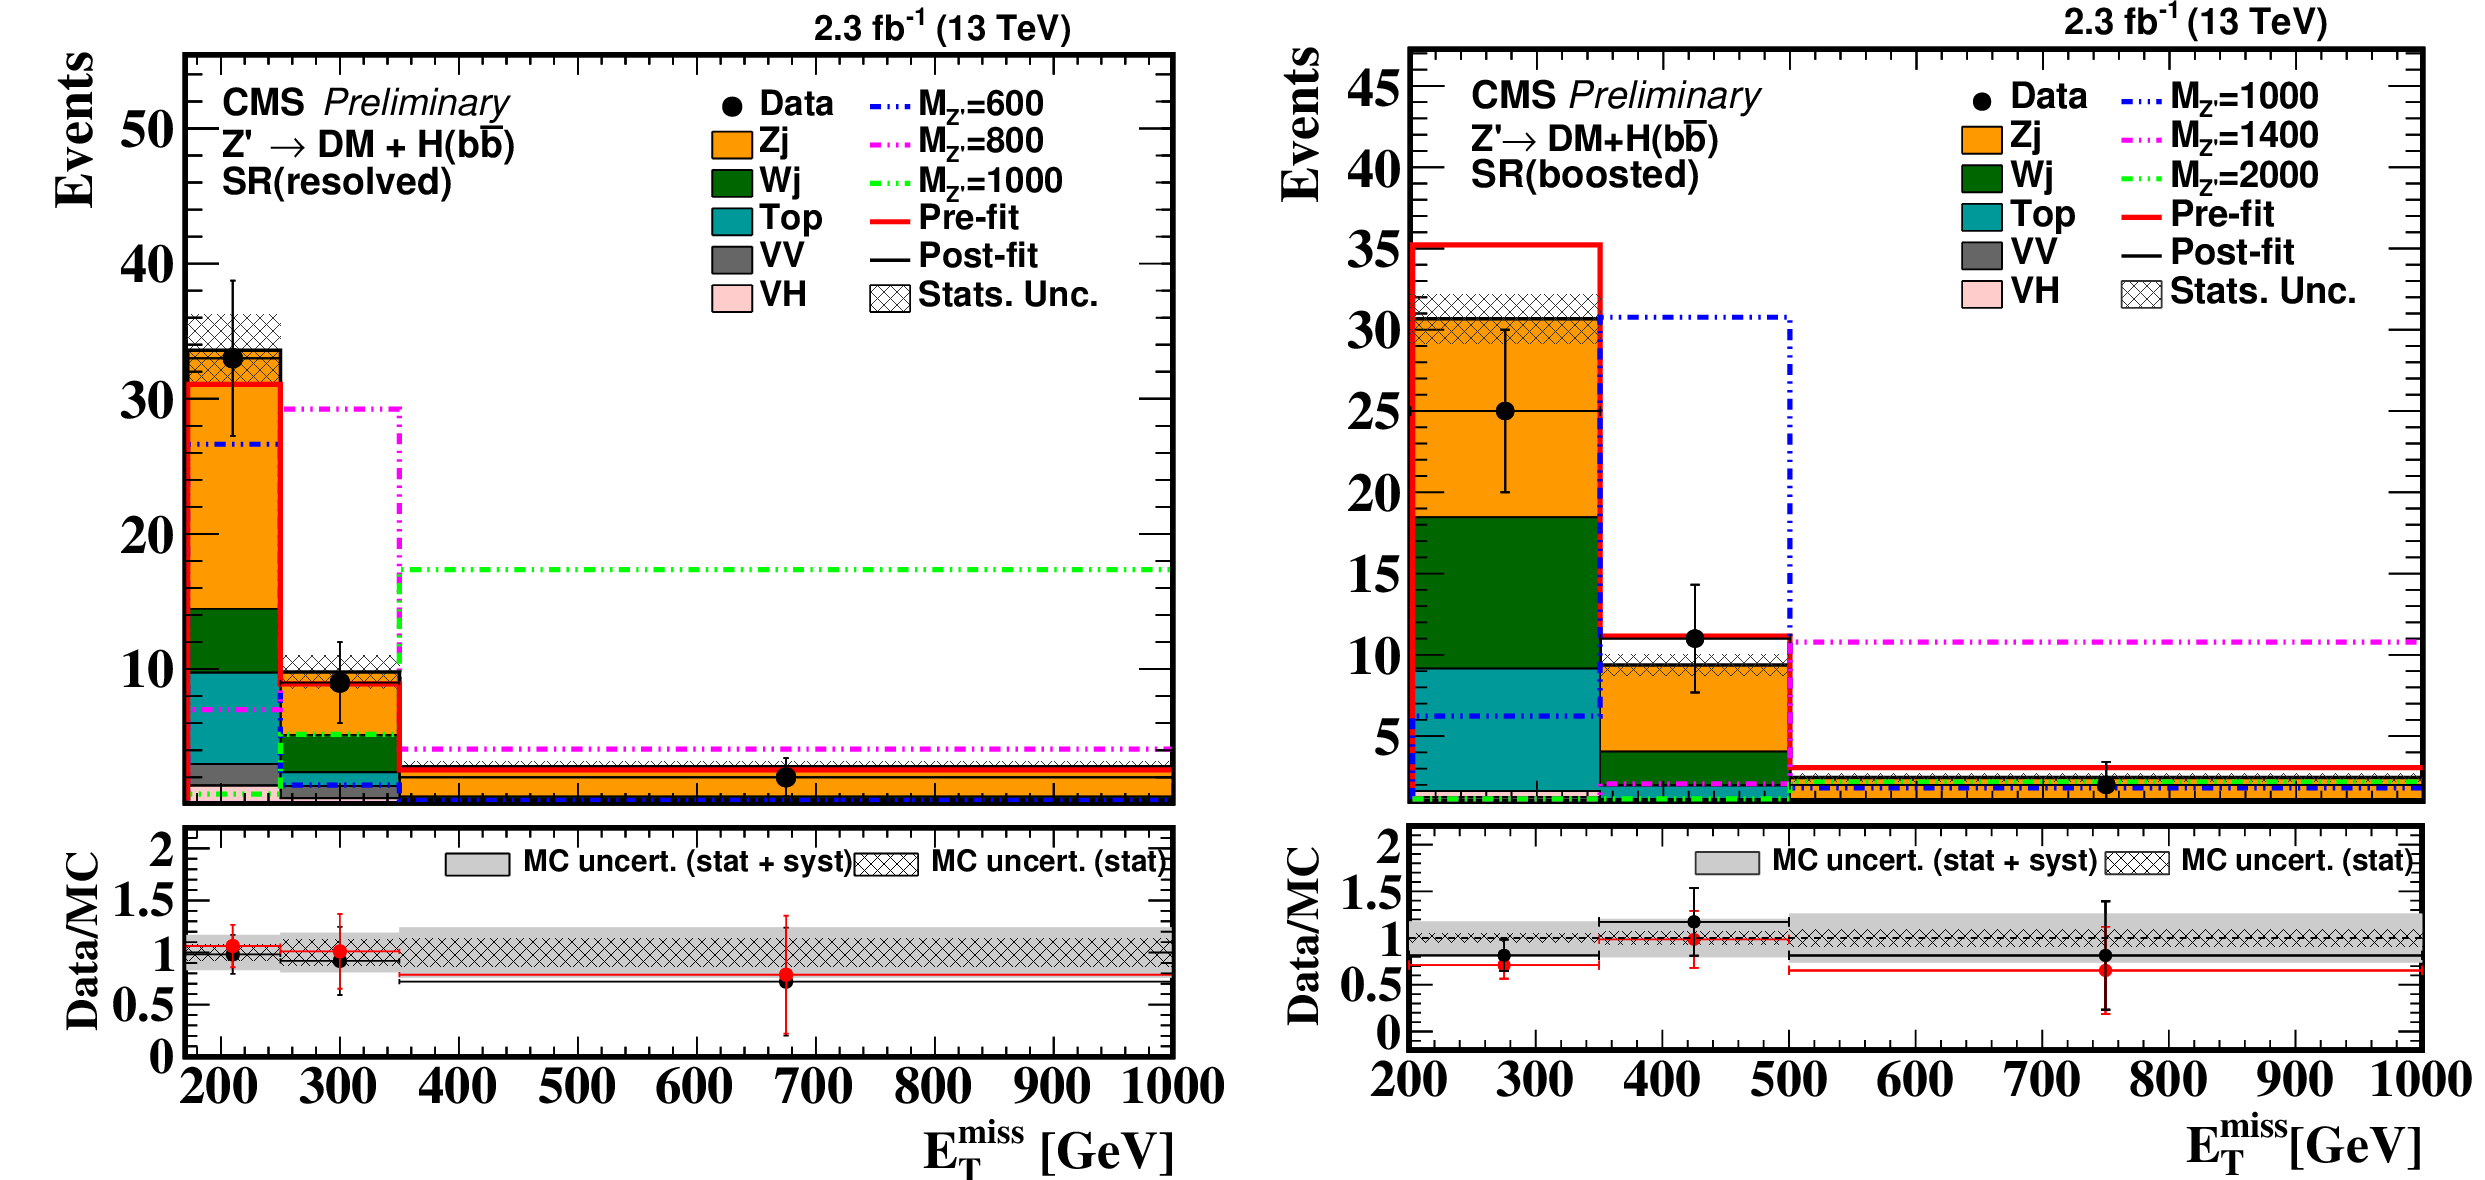
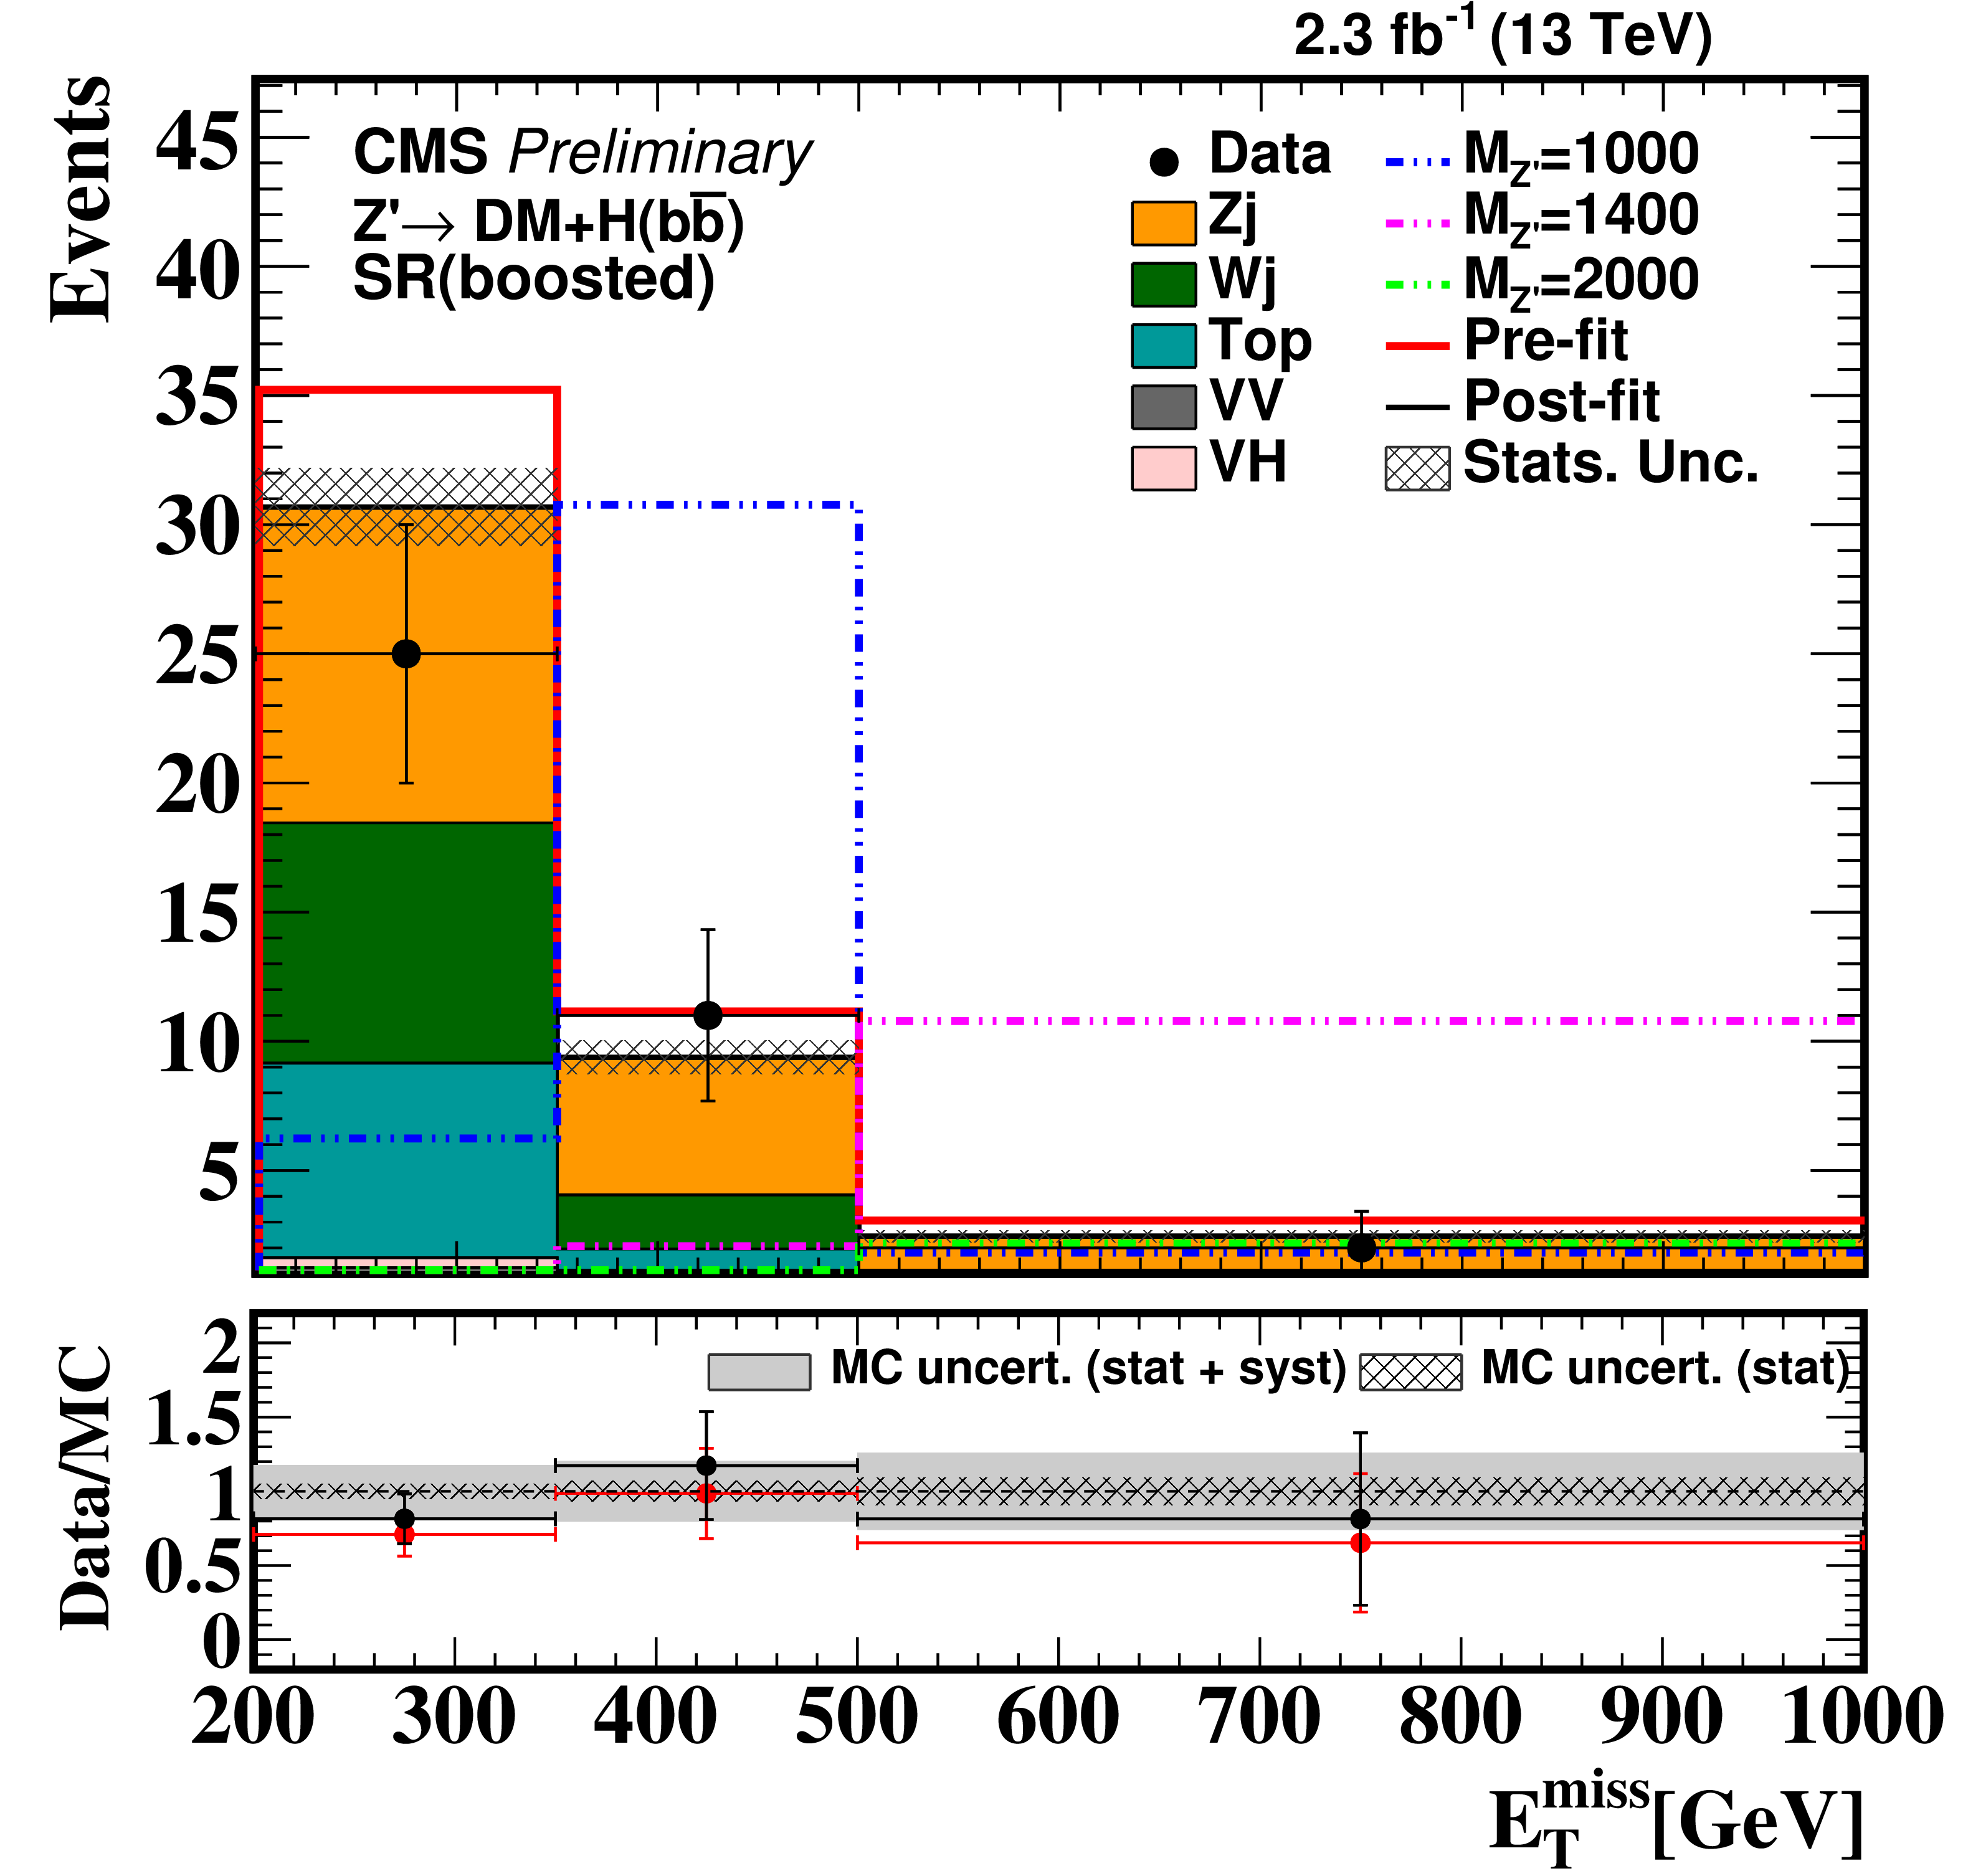
Figure 4:
Post-fit and pre-fit distribution of ${E_{\mathrm {T}}^{\text {miss}}}$ expected from SM backgrounds and observed data for the resolved (left) and the boosted (right) regimes in the signal region with three different $m_{ \mathrm{ Z }' } $ signal points overlaid. The cross section for the signal model uses $g_{\mathrm{ Z }' } = $ 0.8. The bottom pads show the data/simulation ratio for pre-fit and post-fit background prediction with a dashed band corresponding to the uncertainty due to finite size of simulation samples and a gray band that adds the systematic uncertainty on the post-fit background prediction. The last bin includes all events with ${E_{\mathrm {T}}^{\text {miss}}} > $ 350 GeV for the resolved regime and $>$500 GeV for the boosted regime. |

png pdf |
Figure 4-a:
Post-fit and pre-fit distribution of ${E_{\mathrm {T}}^{\text {miss}}}$ expected from SM backgrounds and observed data for the resolved regime in the signal region with three different $m_{ \mathrm{ Z }' } $ signal points overlaid. The cross section for the signal model uses $g_{\mathrm{ Z }' } = $ 0.8. The bottom pads show the data/simulation ratio for pre-fit and post-fit background prediction with a dashed band corresponding to the uncertainty due to finite size of simulation samples and a gray band that adds the systematic uncertainty on the post-fit background prediction. The last bin includes all events with ${E_{\mathrm {T}}^{\text {miss}}} > $ 350 GeV for the resolved regime and $>$500 GeV for the boosted regime. |
png pdf |
Figure 4-b:
Post-fit and pre-fit distribution of ${E_{\mathrm {T}}^{\text {miss}}}$ expected from SM backgrounds and observed data for the boosted regime in the signal region with three different $m_{ \mathrm{ Z }' } $ signal points overlaid. The cross section for the signal model uses $g_{\mathrm{ Z }' } = $ 0.8. The bottom pads show the data/simulation ratio for pre-fit and post-fit background prediction with a dashed band corresponding to the uncertainty due to finite size of simulation samples and a gray band that adds the systematic uncertainty on the post-fit background prediction. The last bin includes all events with ${E_{\mathrm {T}}^{\text {miss}}} > $ 350 GeV for the resolved regime and $>$500 GeV for the boosted regime. |

png pdf |
Figure 5:
Expected and observed 95% CL limit on dark matter production cross section $\times $ branching ratio. For $m_{Z'} =$ 600, 800, 1000 GeV resolved analysis has been used while for other higher mass points boosted analysis is used. Theory cross section is calculated using two different approaches as explained earlier in section 1. |
| Tables | |

png pdf |
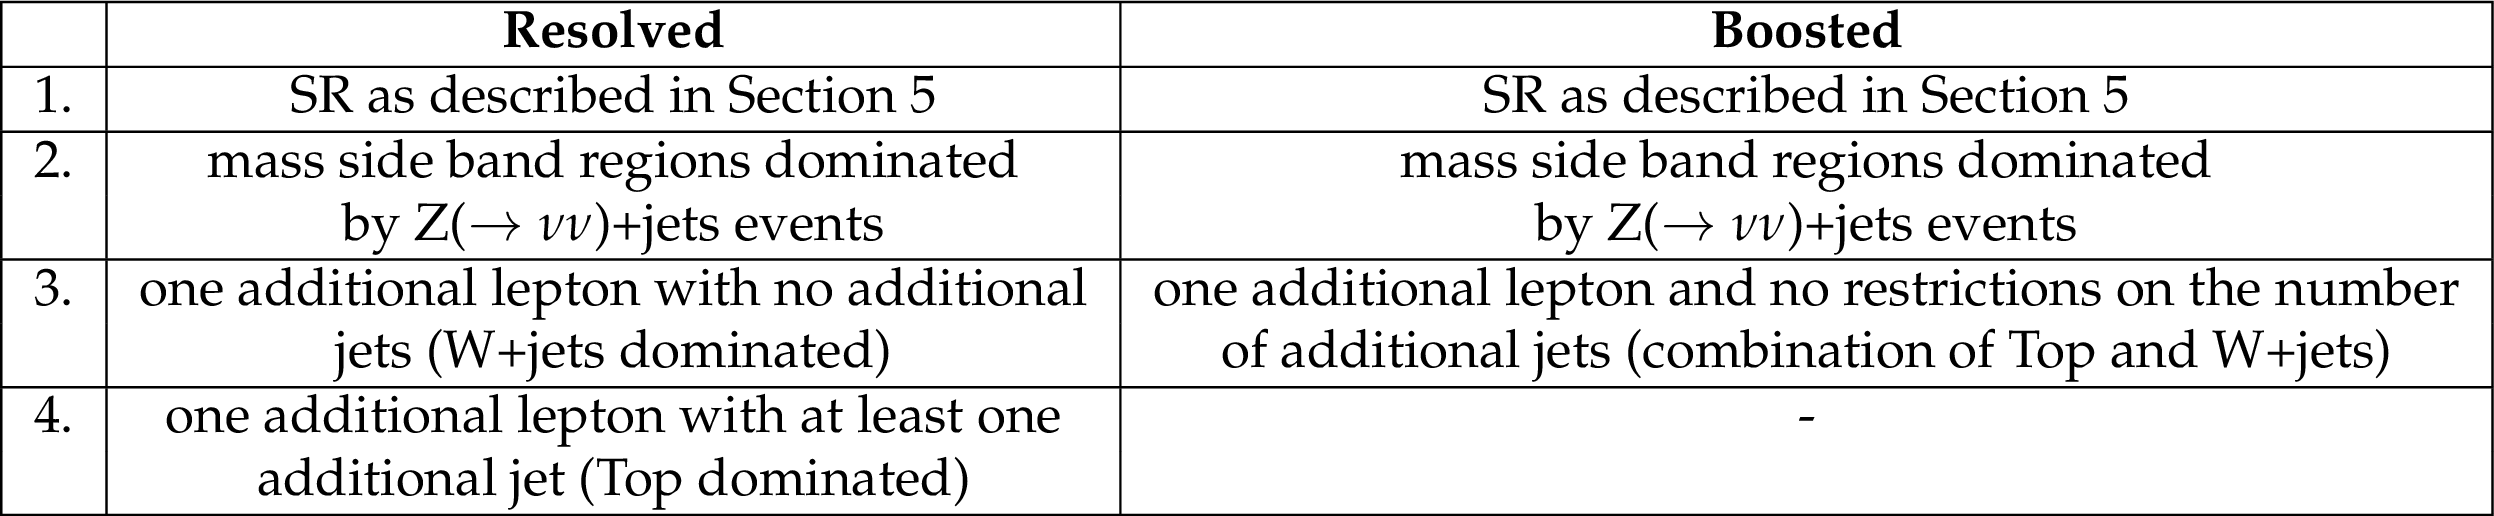
Table 1:
Signal region event selections for resolved and boosted regimes. |
png pdf |
Table 2:
SR and CRs summary used in the simultaneous fit for resolved and boosted analysis. |

png pdf |
Table 3:
Post-fit background event yields and observed numbers of events in data for 2.3 fb$^{-1}$ for the resolved and the boosted regimes. The expected number of signal events, scaled to the nominal cross section with $g_{{\mathrm{ Z }' } }$ = 0.8, are also reported. |
| Summary |
| A search has been presented for an excess of events with large missing transverse momentum produced in association with the standard model Higgs boson decaying to bottom quarks in a data sample of proton-proton interactions at center-of-mass energy of 13 TeV. The data correspond to an integrated luminosity of 2.3 fb$^{-1}$ collected by the CMS detector at the LHC in 2015. No significant deviation from standard model background prediction is observed. The search is interpreted in terms of dark matter production to place constraint on the parameter space of the Type-2 two-Higgs-doublet model. |
| Additional Figures | |

png pdf |
Additional Figure 1:
$ {E_{\mathrm {T}}^{\text {miss}}} $ or transverse momentum of the Higgs boson for $m_{{\mathrm{ Z }' } } = $ 600 GeV, 1000 GeV and 1400 GeV. As the resonance mass increases $ {E_{\mathrm {T}}^{\text {miss}}} $ or transverse momentum of the Higgs boson increases. The distributions are shown for two different $m_{\chi }$ values, 10 GeV and 100 GeV and the $ {E_{\mathrm {T}}^{\text {miss}}} $ is almost independent of the dark matter mass considered. |

png pdf |
Additional Figure 2:
$\Delta R$ between decay products of the Higgs boson for $m_{{\mathrm{ Z }' } } = $ 600 GeV, 1000 GeV and 1400 GeV. As the resonance mass increases the distance between two b quarks decreases because of high transverse momentum of the Higgs boson. The distributions are shown for two different $m_{\chi }$ values, 10 GeV and 100 GeV and $\Delta R$ is almost independent of the dark matter mass considered. |

png pdf |
Additional Figure 3:
Post-fit and pre-fit distribution of the reconstructed Higgs boson candidate mass expected from SM backgrounds and observed data for the resolved regime with three different $m_{{\mathrm{ Z }' } }$ signal points overlaid. The cross section for the signal model uses $g_{{\mathrm{ Z }' } } = $ 0.8. The black band on the top pad shows the statistical uncertainity due to finite size of the simulation samples. The bottom pad shows the data/simulation ratio for pre-fit and post-fit background prediction with a dashed band corresponding to the uncertainty due to finite size of simulation samples and a gray band that adds the systematic uncertainty on the post-fit background prediction. The first and third bins in the distribution shows the mass sidebands (Z($ \rightarrow \nu \nu $)+jets control region) and the second bin shows the region considered as signal region. |

png pdf |
Additional Figure 4:
Post-fit and pre-fit distribution of the reconstructed Higgs boson candidate mass expected from SM backgrounds and observed data for the boosted regime with three different $m_{{\mathrm{ Z }' } }$ signal points overlaid. The cross section for the signal model uses $g_{{\mathrm{ Z }' } } = $ 0.8. The black band on the top pad shows the statistical uncertainity due to finite size of the simulation samples. The bottom pad shows the data/simulation ratio for pre-fit and post-fit background prediction with a dashed band corresponding to the uncertainty due to finite size of simulation samples and a gray band that adds the systematic uncertainty on the post-fit background prediction. The first and third bins in the distribution shows the mass sidebands (Z($\rightarrow \nu \nu $)+jets control region) and the second bin shows the region considered as signal region. |
png pdf |
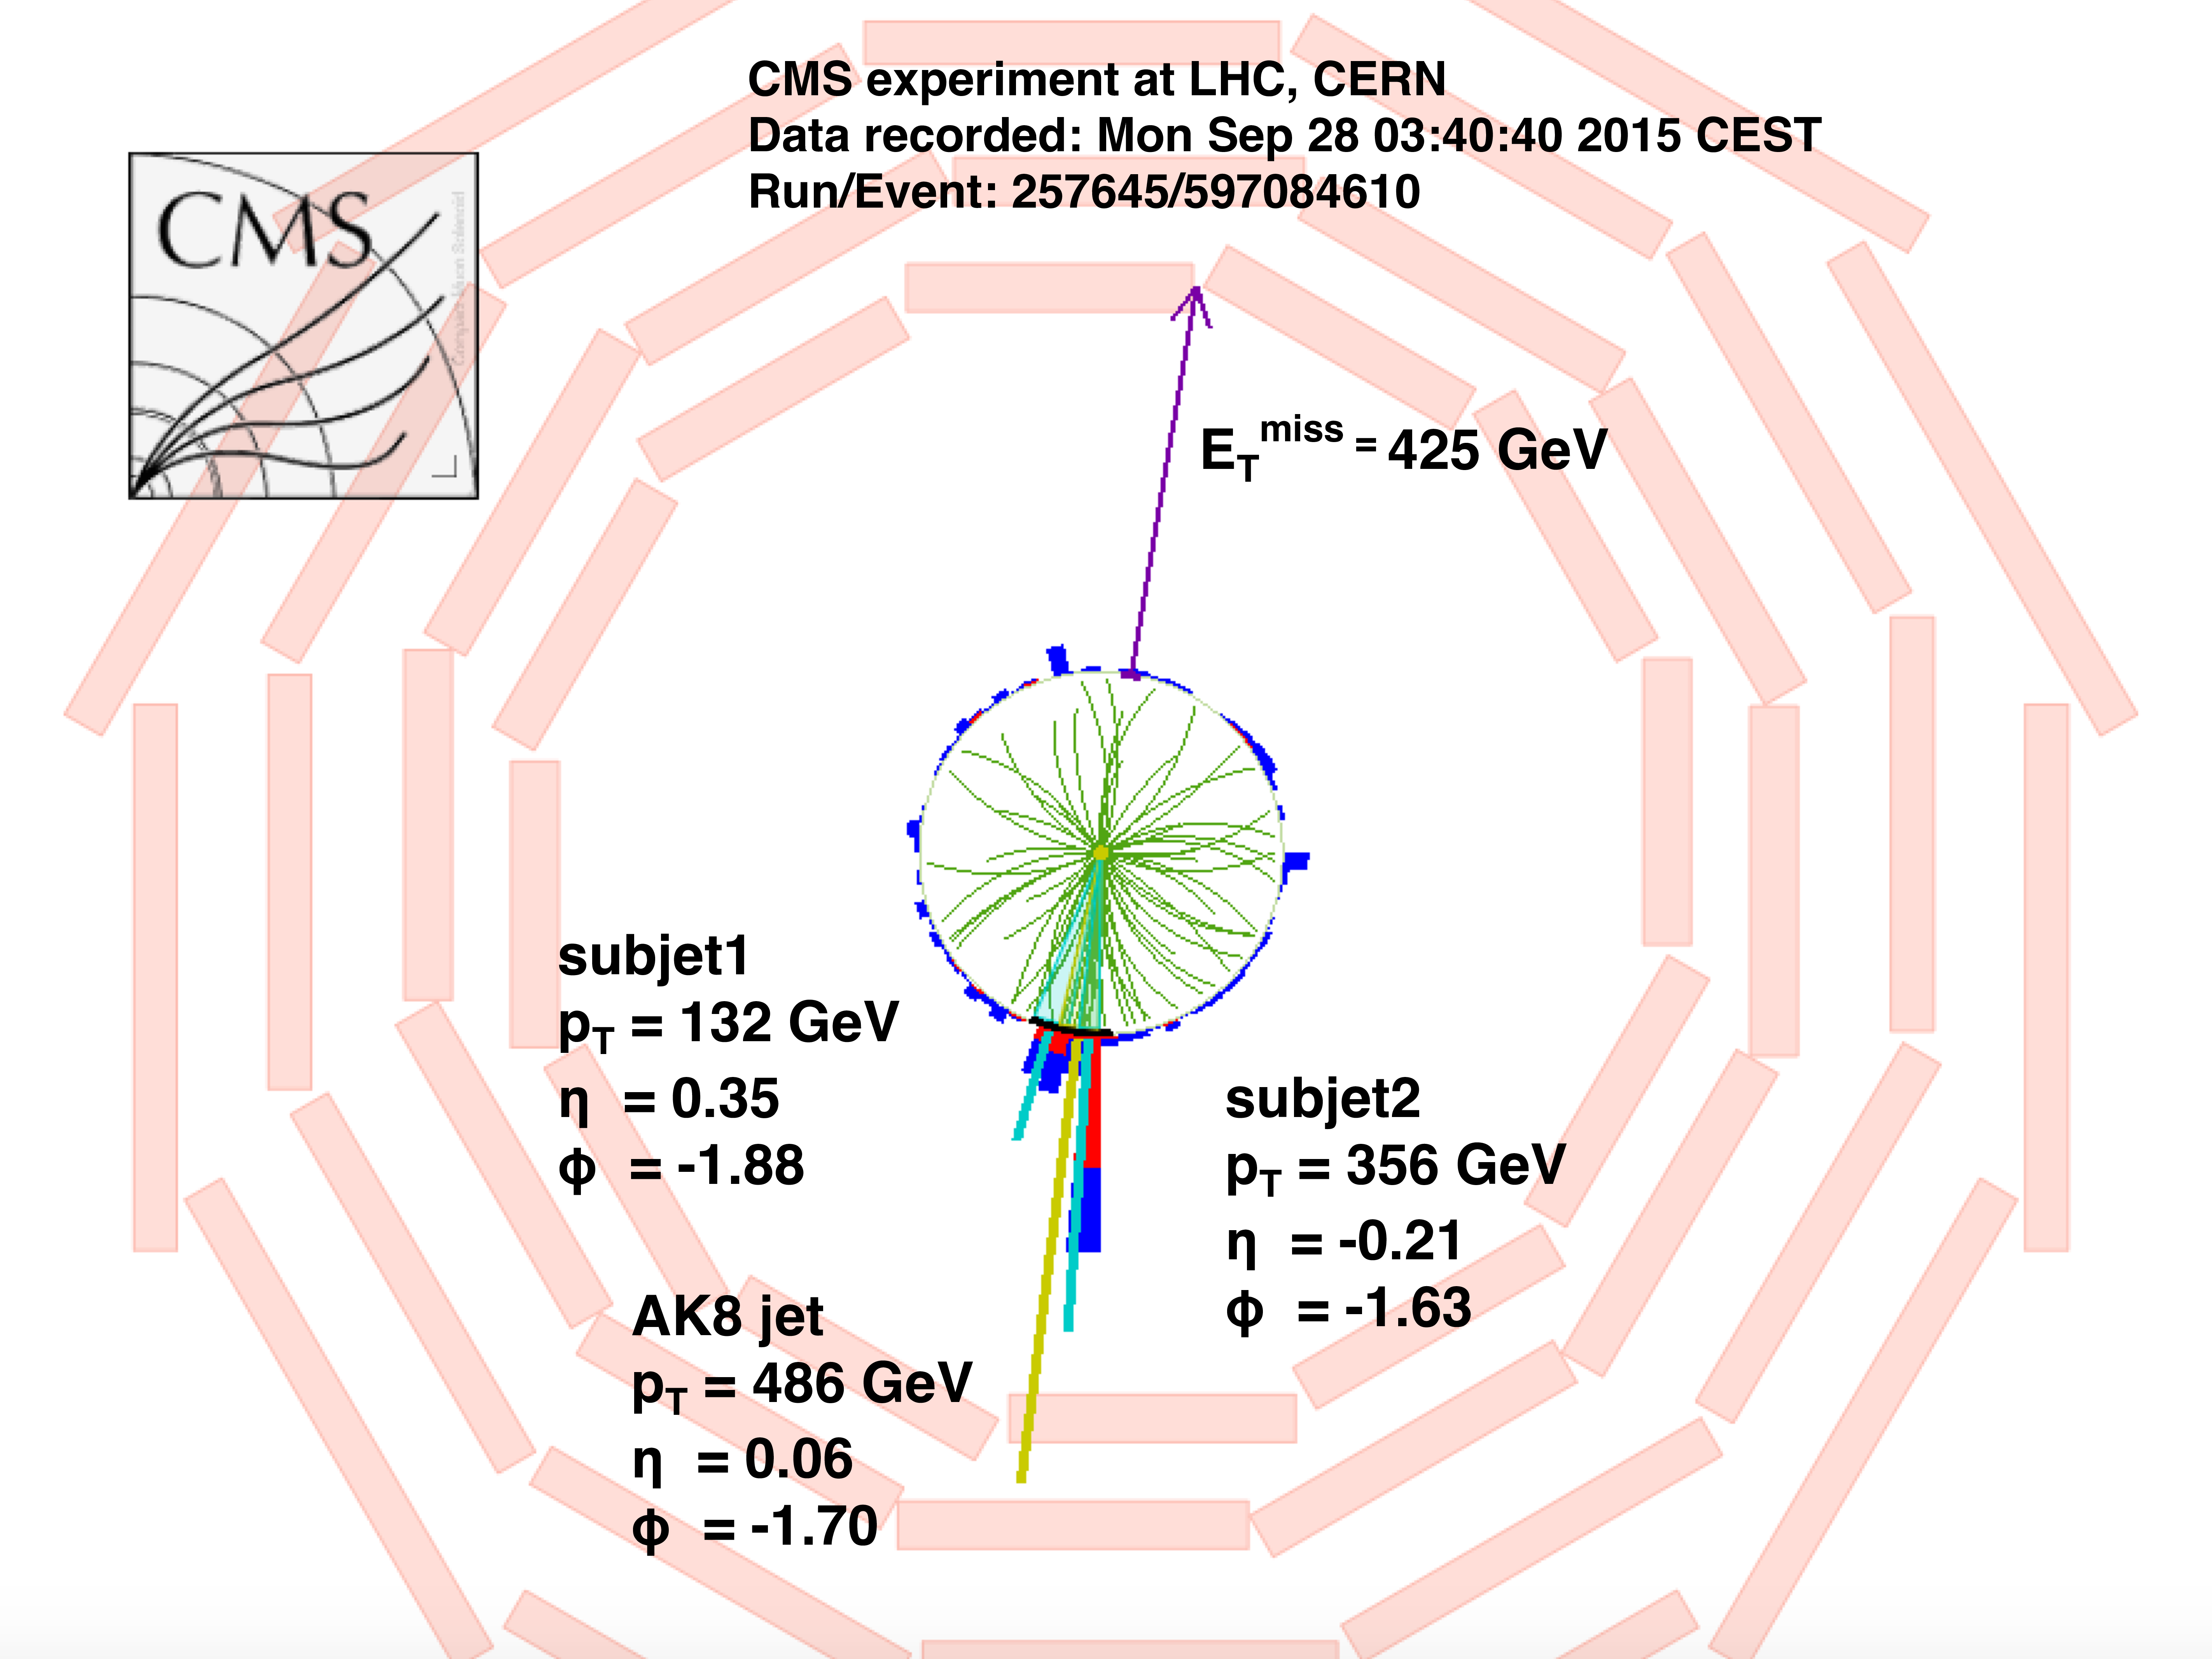
Additional Figure 5:
A picture of event observed in 2015 data after applying the boosted regime selection. The selected event has $ {E_{\mathrm {T}}^{\text {miss}}} $ of 425 GeV and a boosted jet with ${p_{\mathrm {T}}}$ of 486 GeV. Subjets inside the AK8 jet have $p_{\mathrm{T}}$ of 356 GeV and 132 GeV with $\Delta R$ separation of 0.61 between them. |
| References | ||||
| 1 | G. Bertone, D. Hooper, and J. Silk | Particle Dark Matter: Evidence, Candidates and Constraints | Phys.Rept. 405 (2005) 279 | 0404175 |
| 2 | ATLAS Collaboration | Search for Dark Matter in Events with Missing Transverse Momentum and a Higgs Boson Decaying to Two Photons in $ \rm{pp} $ Collisions at $ \sqrt{s}=8 $ TeV with the ATLAS Detector | PRL 115 (2015), no. 13, 131801 | 1506.01081 |
| 3 | ATLAS Collaboration | Search for dark matter produced in association with a Higgs boson decaying to two bottom quarks in $ \rm{pp} $ collisions at $ \sqrt{s} = 8 $ TeV with the ATLAS detector | Phys.Rev.D 93 (2016) 47 | 1510.06218 |
| 4 | A. Berlin, T. Lin, and L.-T. Wang | Mono-Higgs Detection of Dark Matter at the LHC | JHEP 06 (2014) 078 | 1402.7074 |
| 5 | T. D. Lee | A Theory of Spontaneous T Violation | PRD8 (1973) 1226--1239 | |
| 6 | G. C. Branco et al. | Theory and phenomenology of two-Higgs-doublet models | PR 516 (2012) 1--102 | 1106.0034 |
| 7 | ATLAS Collaboration | Search for Dark Matter in association with a Higgs boson decaying to b-quarks in pp collisions at $ \sqrt{s} $ = 13 TeV with the ATLAS detector | Technical Report ATLAS-CONF-2016-019, CERN, Geneva | |
| 8 | CMS Collaboration | The CMS experiment at the CERN LHC | JINST 03 (2008) S08004 | CMS-00-001 |
| 9 | J. Alwall et al. | The automated computation of tree-level and next-to-leading order differential cross sections, and their matching to parton shower simulations | JHEP 07 (2014) 079 | 1405.0301 |
| 10 | T. Sj\"ostrand et al. | An Introduction to PYTHIA 8.2 | CPC 191 (2015) 159--177 | 1410.3012 |
| 11 | P. Nason | A New method for combining NLO QCD with shower Monte Carlo algorithms | JHEP 11 (2004) 040 | hep-ph/0409146 |
| 12 | S. Frixione, P. Nason, and C. Oleari | Matching NLO QCD computations with Parton Shower simulations: the POWHEG method | JHEP 11 (2007) 070 | 0709.2092 |
| 13 | S. Alioli, P. Nason, C. Oleari, and E. Re | A general framework for implementing NLO calculations in shower Monte Carlo programs: the POWHEG BOX | JHEP 06 (2010) 043 | 1002.2581 |
| 14 | S. Frixione, P. Nason, and G. Ridolfi | A Positive-weight next-to-leading-order Monte Carlo for heavy flavour hadroproduction | JHEP 09 (2007) 126 | 0707.3088 |
| 15 | E. Re | Single-top Wt-channel production matched with parton showers using the POWHEG method | EPJC71 (2011) 1547 | 1009.2450 |
| 16 | CMS Collaboration | Measurement of differential top-quark-pair production cross sections in pp collisions at $ \sqrt{s} $ = 7 TeV | EPJC73 (2013) 1--29 | |
| 17 | CMS Collaboration | Measurement of differential top-quark pair production cross sections in the lepton+jets channel in pp collisions at 8 TeV | EPJC75 (2015) | CMS-TOP-12-028 1505.04480 |
| 18 | M. L. Mangano, M. Moretti, F. Piccinini, and M. Treccani | Matching Matrix Elements and Shower Evolution for Top-Quark Production in Hadronic Collisions | JHEP 01 (2007) 013 | |
| 19 | NNPDF Collaboration | Parton distributions for the LHC Run II | JHEP 04 (2015) 040 | 1410.8849 |
| 20 | P. Skands, S. Carrazza, and J. Rojo | Tuning PYTHIA 8.1: the Monash 2013 Tune | EPJC74 (2014), no. 8 | 1404.5630 |
| 21 | CMS Collaboration | Underlying Event Tunes and Double Parton Scattering | EPJC76 | |
| 22 | GEANT4 Collaboration | GEANT4: A Simulation toolkit | NIMA506 (2003) 250--303 | |
| 23 | CMS Collaboration | Commissioning of the Particle-flow Event Reconstruction with the first LHC collisions recorded in the CMS detector | CDS | |
| 24 | M. Cacciari, G. P. Salam, and G. Soyez | The anti-$ k_t $ jet clustering algorithm | JHEP 04 (2008) 063 | 0802.1189 |
| 25 | M. Cacciari, G.P. Salam and G. Soyez | FastJet User Manual | EPJC72 (2012) | 1111.6097 |
| 26 | CMS Collaboration | Determination of Jet Energy Calibration and Transverse Momentum Resolution in CMS | JINST 6 (2011) P11002 | CMS-JME-10-011 1107.4277 |
| 27 | CMS Collaboration | Identification of b quark jets at the CMS Experiment in the LHC Run 2 | CDS | |
| 28 | A. J. Larkoski, S. Marzani, G. Soyez, and J. Thaler | Soft Drop | JHEP 05 (2014) 146 | 1402.2657 |
| 29 | CMS Collaboration | Performance of CMS muon reconstruction in pp collision events at $ \sqrt{s} $ = 7 TeV | JINST 7 (2012) P10002 | CMS-MUO-10-004 1206.4071 |
| 30 | CMS Collaboration | Reconstruction and identification of $ \tau $ lepton decays to hadrons and $ \nu_{\tau} $ at CMS | JINST 11 (2016) P01019 | CMS-TAU-14-001 1510.07488 |
| 31 | S. D. Ellis, C. K. Vermilion, and J. R. Walsh | Techniques for improved heavy particle searches with jet substructure | PRD 80 (2009) 051501 | 0903.5081 |
| 32 | S. D. Ellis, C. K. Vermilion, and J. R. Walsh | Recombination Algorithms and Jet Substructure: Pruning as a Tool for Heavy Particle Searches | PRD 81 (2010) 094023 | 0912.0033 |
| 33 | CMS Collaboration | CMS Luminosity Measurement for the 2015 Data Taking Period | CMS-PAS-LUM-15-001 | CMS-PAS-LUM-15-001 |
| 34 | J. Butterworth, S. Carrazza et al. | PDF4LHC recommendations for LHC Run II | Journal of Physics G: Nuclear and Particle Physics 43 (2016) 2 | arXiv:1510.03865 |
| 35 | A. L. Read | Presentation of search results: the CLs technique | JPG28 (2002) 2693 | |
| 36 | T. Junk | Confidence level computation for combining searches with small statistics | NIMA434 (1999) 435 | 9902006 |
|
|
Compact Muon Solenoid LHC, CERN |
|

|

|

|

|

|