

Compact Muon Solenoid
LHC, CERN
| CMS-PAS-EXO-16-037 | ||
| Search for dark matter in final states with an energetic jet, or a hadronically decaying W or Z boson using 12.9 fb$^{-1}$ of data at $ \sqrt{s} = $ 13 TeV | ||
| CMS Collaboration | ||
| August 2016 | ||
| Abstract: A search for dark matter is performed using events with large missing transverse momentum and one or more energetic jets in a data sample of proton-proton collisions at $ \sqrt{s} = $ 13 TeV, collected with the CMS detector at the LHC in the first half of 2016. The search includes events in which a hadronically decaying W or Z boson is produced in association with large missing transverse momentum. Results are presented in terms of limits on the dark matter production in association with jets or vector bosons using simplified models, and on the decay of the standard model Higgs boson to invisible particles. Vector and axial-vector mediators with masses up to 1.95 TeV are excluded at 95% confidence level. The exclusion for pseudoscalar (scalar) mediators reaches 430 (100) GeV. The observed (expected) upper limit on the invisible branching fraction of the standard model like Higgs boson is set at 0.44 (0.56) at 95% confidence level. | ||
|
Links:
CDS record (PDF) ;
inSPIRE record ;
CADI line (restricted) ;
These preliminary results are superseded in this paper, JHEP 07 (2017) 014. The superseded preliminary plots can be found here. |
||
| Figures & Tables | Summary | Additional Figures & Tables | References | CMS Publications |
|---|
| Figures | |

png pdf |
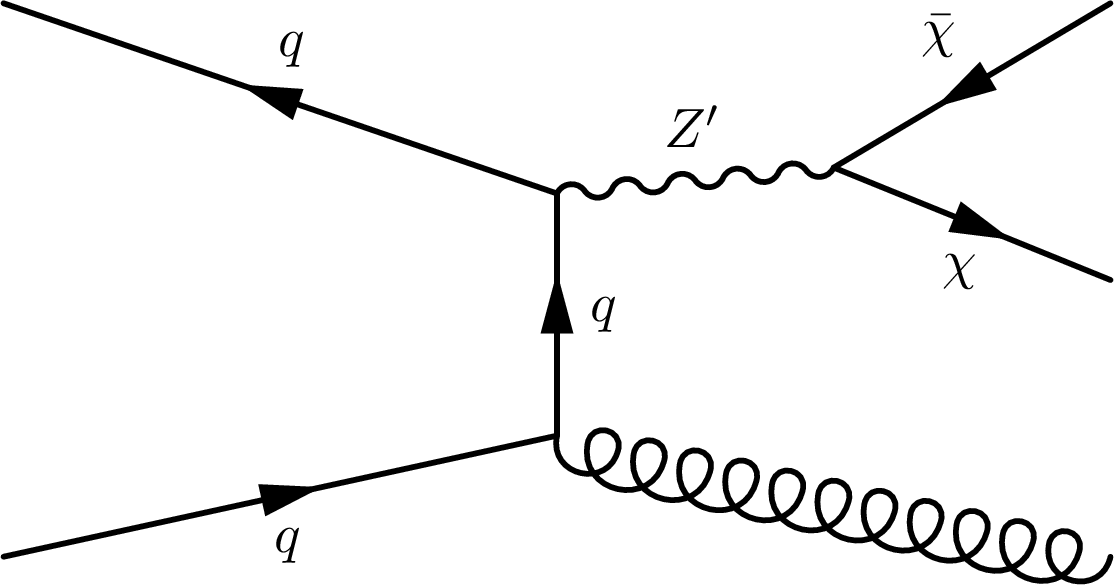
Figure 1:
Monojet (a) and mono-V (b) production diagrams for a spin-1 mediator. |
png pdf |
Figure 1-a:
Monojet production diagram for a spin-1 mediator. |

png pdf |
Figure 1-b:
Mmono-V production diagram for a spin-1 mediator. |
png pdf |
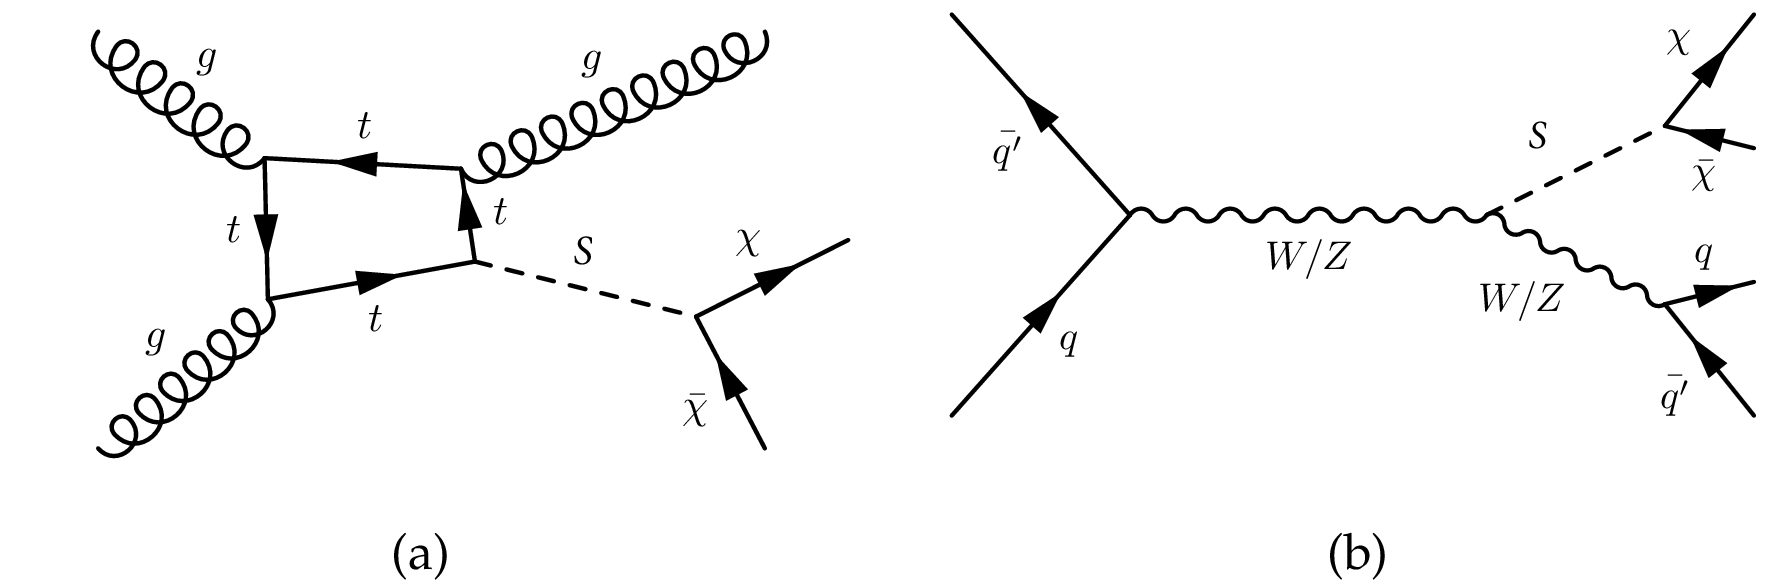
Figure 2:
Monojet (a) and mono-V (b) production diagrams for a spin-0 mediator. |
png pdf |
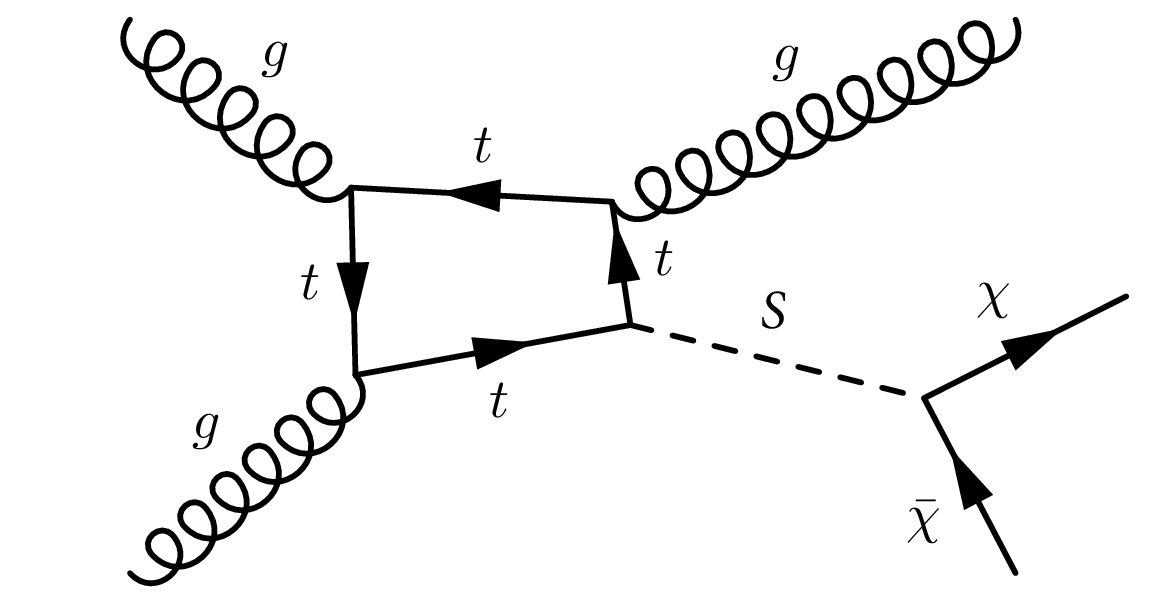
Figure 2-a:
Monojet production diagram for a spin-0 mediator. |

png pdf |
Figure 2-b:
Mono-V production diagrams for a spin-0 mediator. |
png pdf |
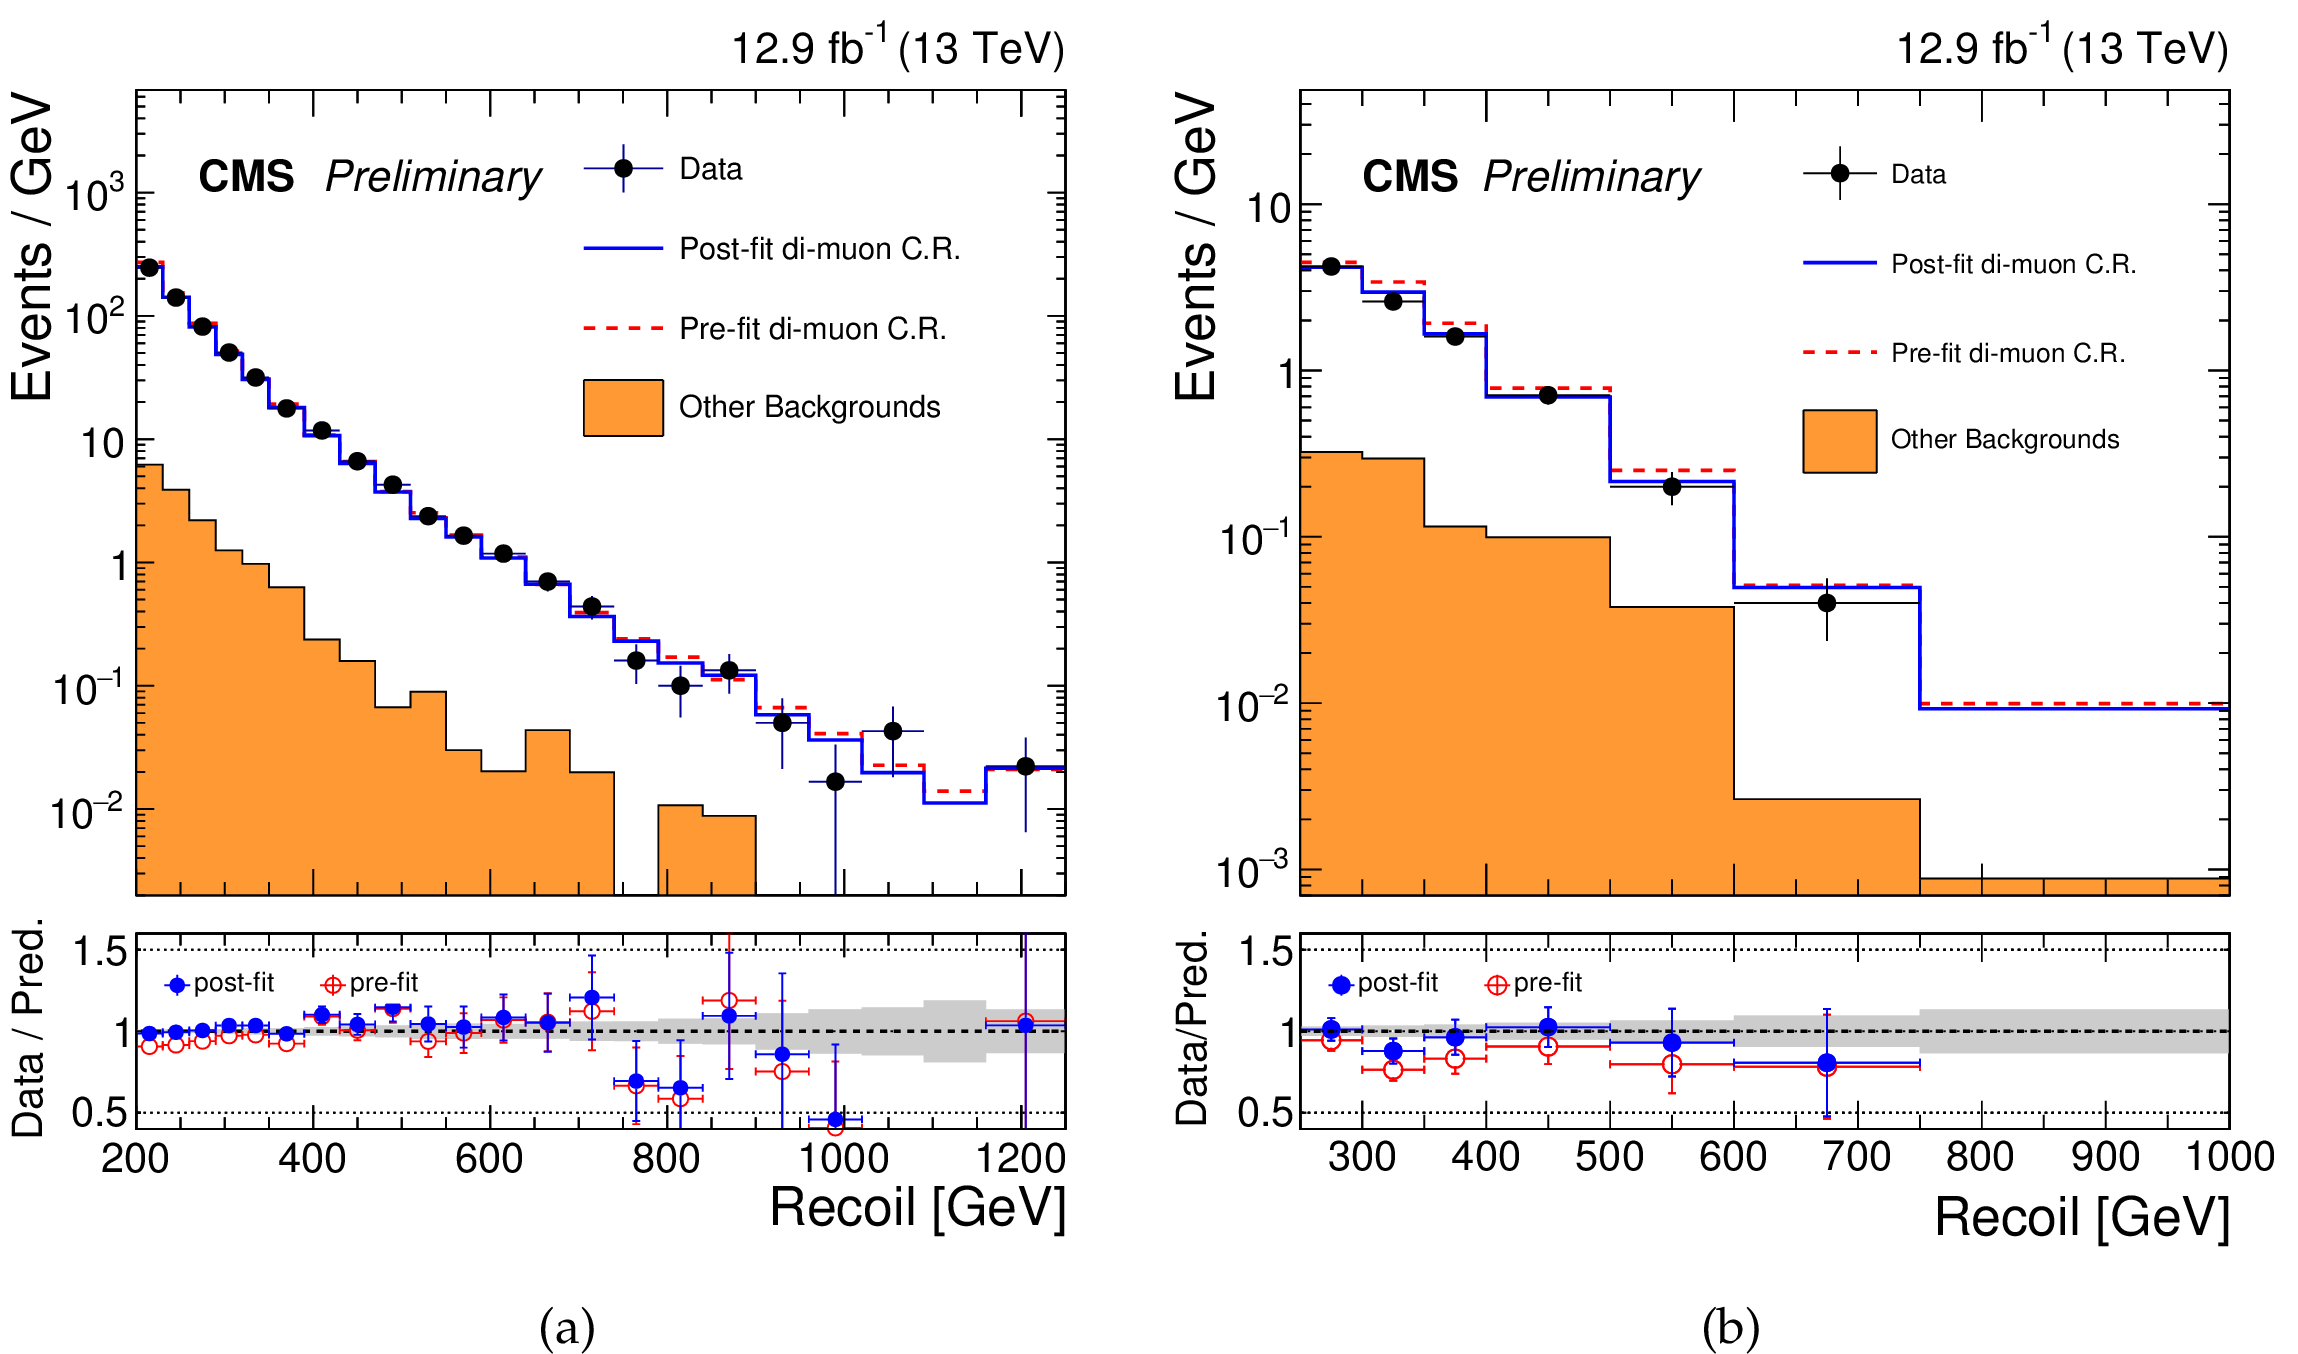
Figure 3:
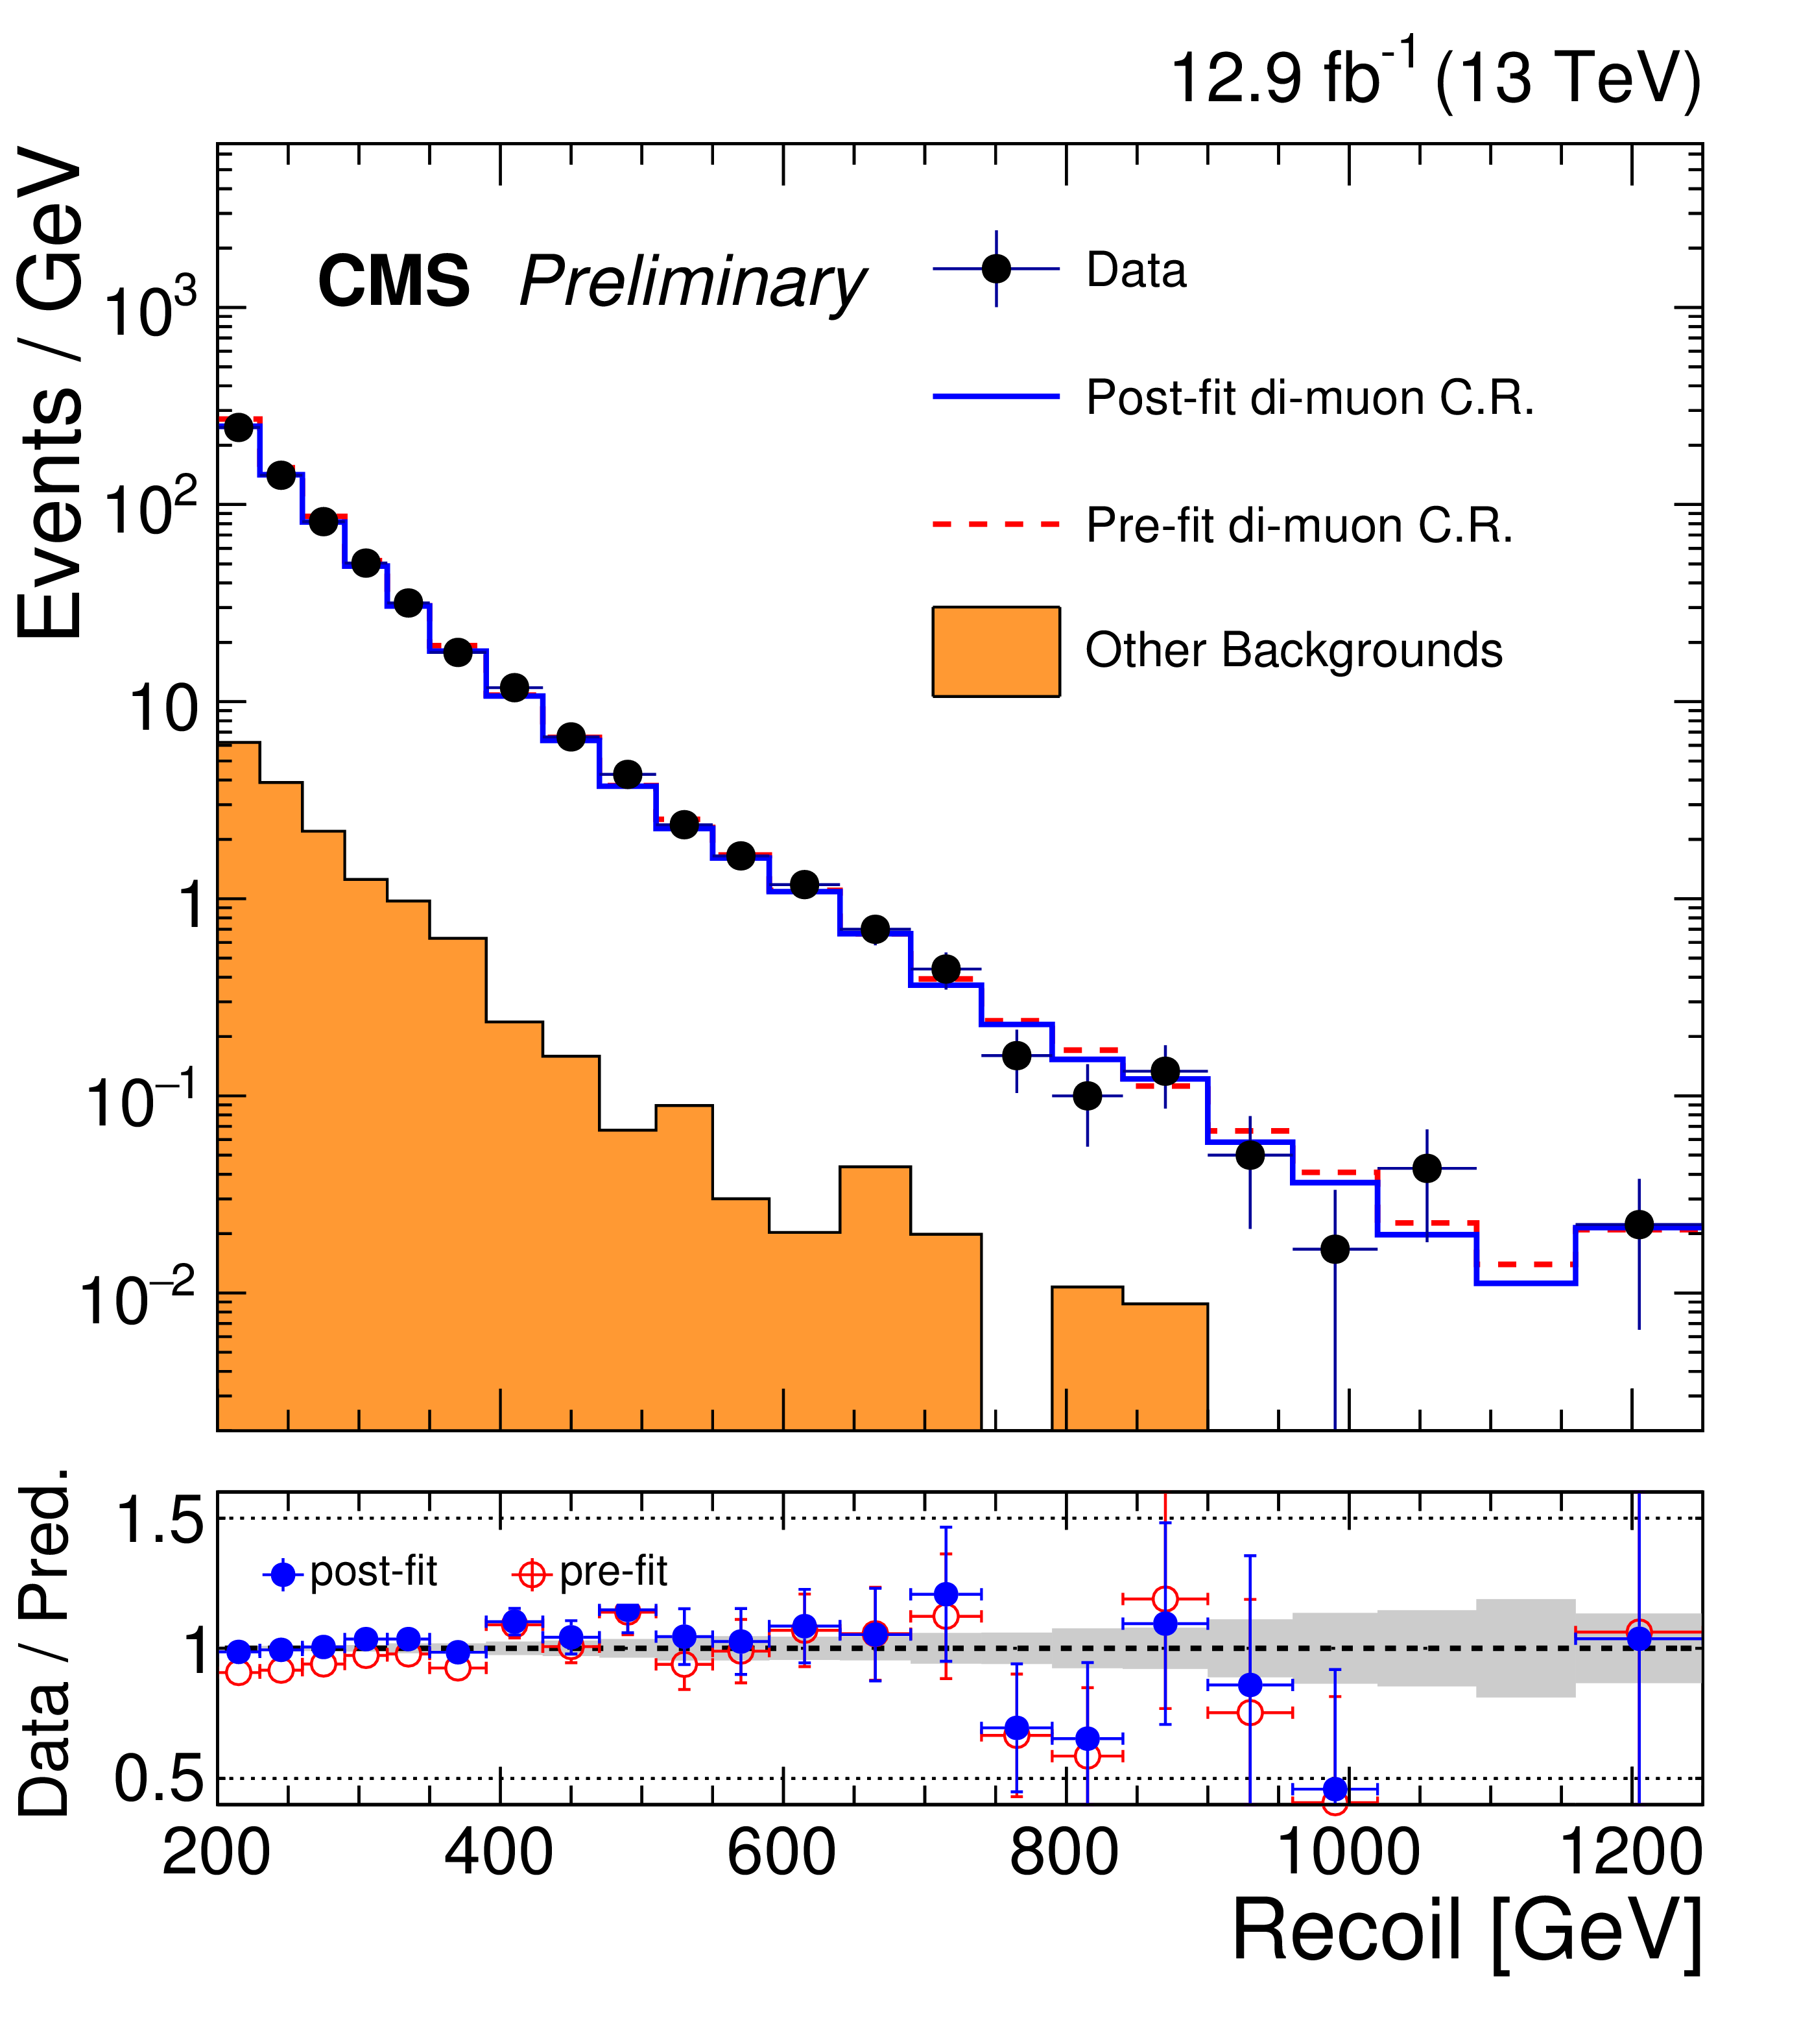
Comparison between data and Monte Carlo simulation in the dimuon control region before and after performing the simultaneous fit across all the control regions and the signal region. Plot (a) corresponds to the monojet category and plot (b) corresponds to the mono-V category. The orange histogram corresponds to all processes other than $ \mathrm {Z}(\mu \mu )$+jets. The gray band indicates the postfit uncertainty after propagating all the systematic uncertainties to the fit. The last bin includes all events with ${E_{\mathrm {T}}^{\text {miss}}} > $ 1160 GeV in the monojet category and ${E_{\mathrm {T}}^{\text {miss}}} > $ 750 GeV in the mono-V category. |
png pdf |
Figure 3-a:
Comparison between data and Monte Carlo simulation in the dimuon control region before and after performing the simultaneous fit across all the control regions and the signal region. The plot corresponds to the monojet category. The orange histogram corresponds to all processes other than $ \mathrm {Z}(\mu \mu )$+jets. The gray band indicates the postfit uncertainty after propagating all the systematic uncertainties to the fit. The last bin includes all events with ${E_{\mathrm {T}}^{\text {miss}}} > $ 1160 GeV in the monojet category and ${E_{\mathrm {T}}^{\text {miss}}} > $ 750 GeV in the mono-V category. |

png pdf |
Figure 3-b:
Comparison between data and Monte Carlo simulation in the dimuon control region before and after performing the simultaneous fit across all the control regions and the signal region. The plot corresponds to the mono-V category. The orange histogram corresponds to all processes other than $ \mathrm {Z}(\mu \mu )$+jets. The gray band indicates the postfit uncertainty after propagating all the systematic uncertainties to the fit. The last bin includes all events with ${E_{\mathrm {T}}^{\text {miss}}} > $ 1160 GeV in the monojet category and ${E_{\mathrm {T}}^{\text {miss}}} > $ 750 GeV in the mono-V category. |
png pdf |
Figure 4:
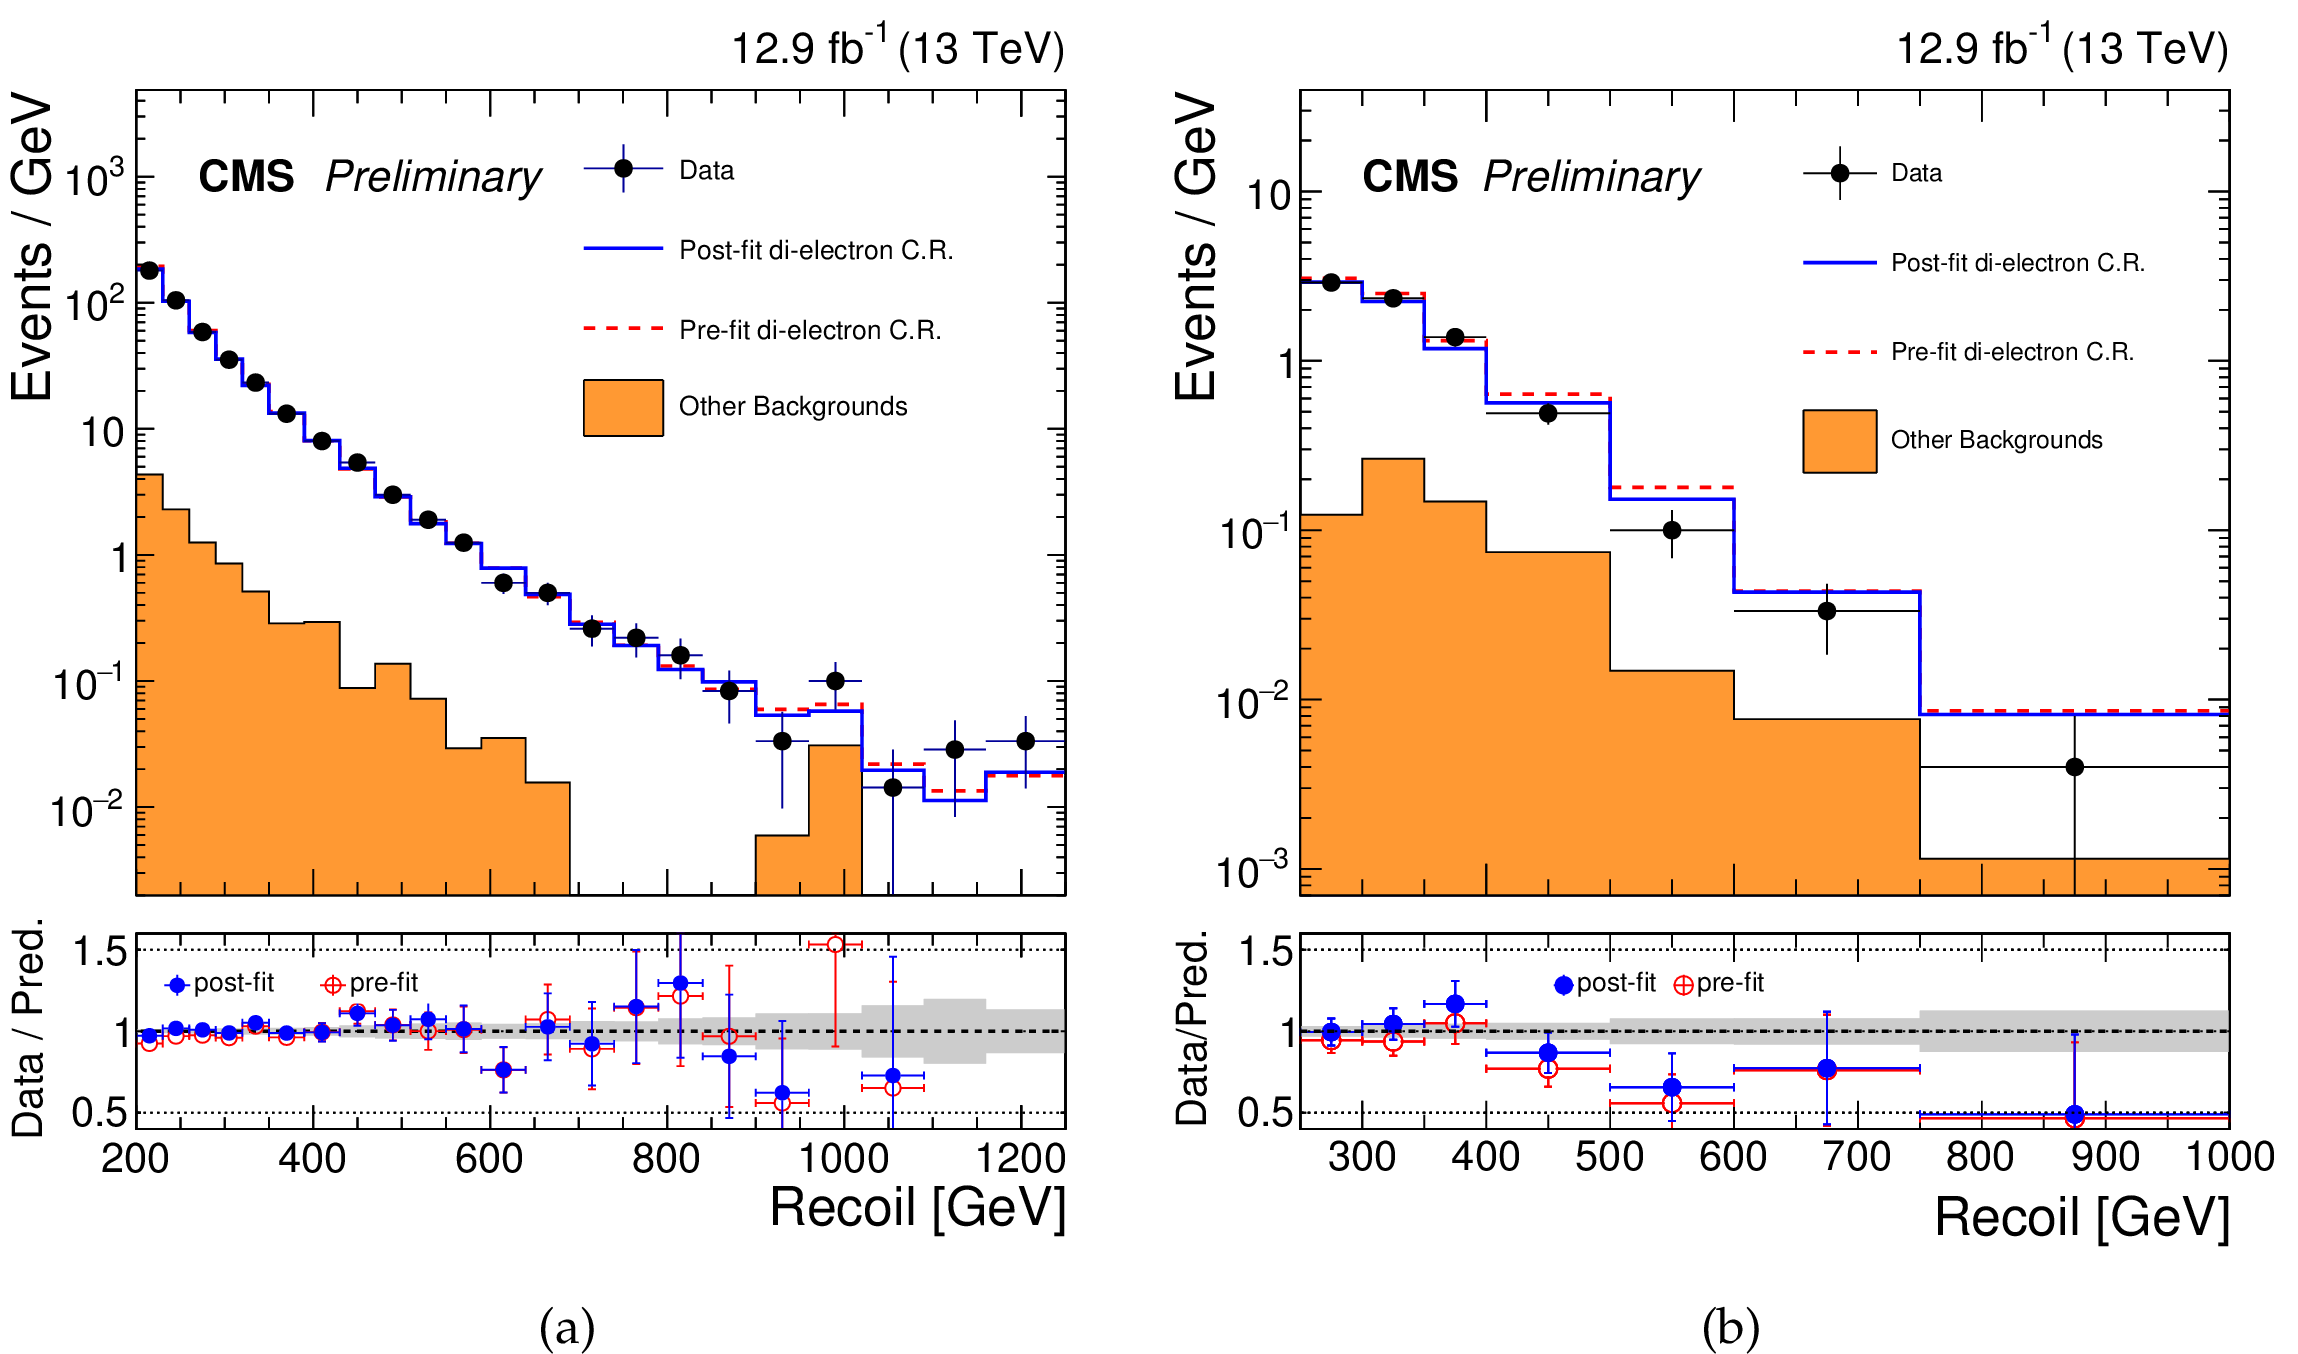
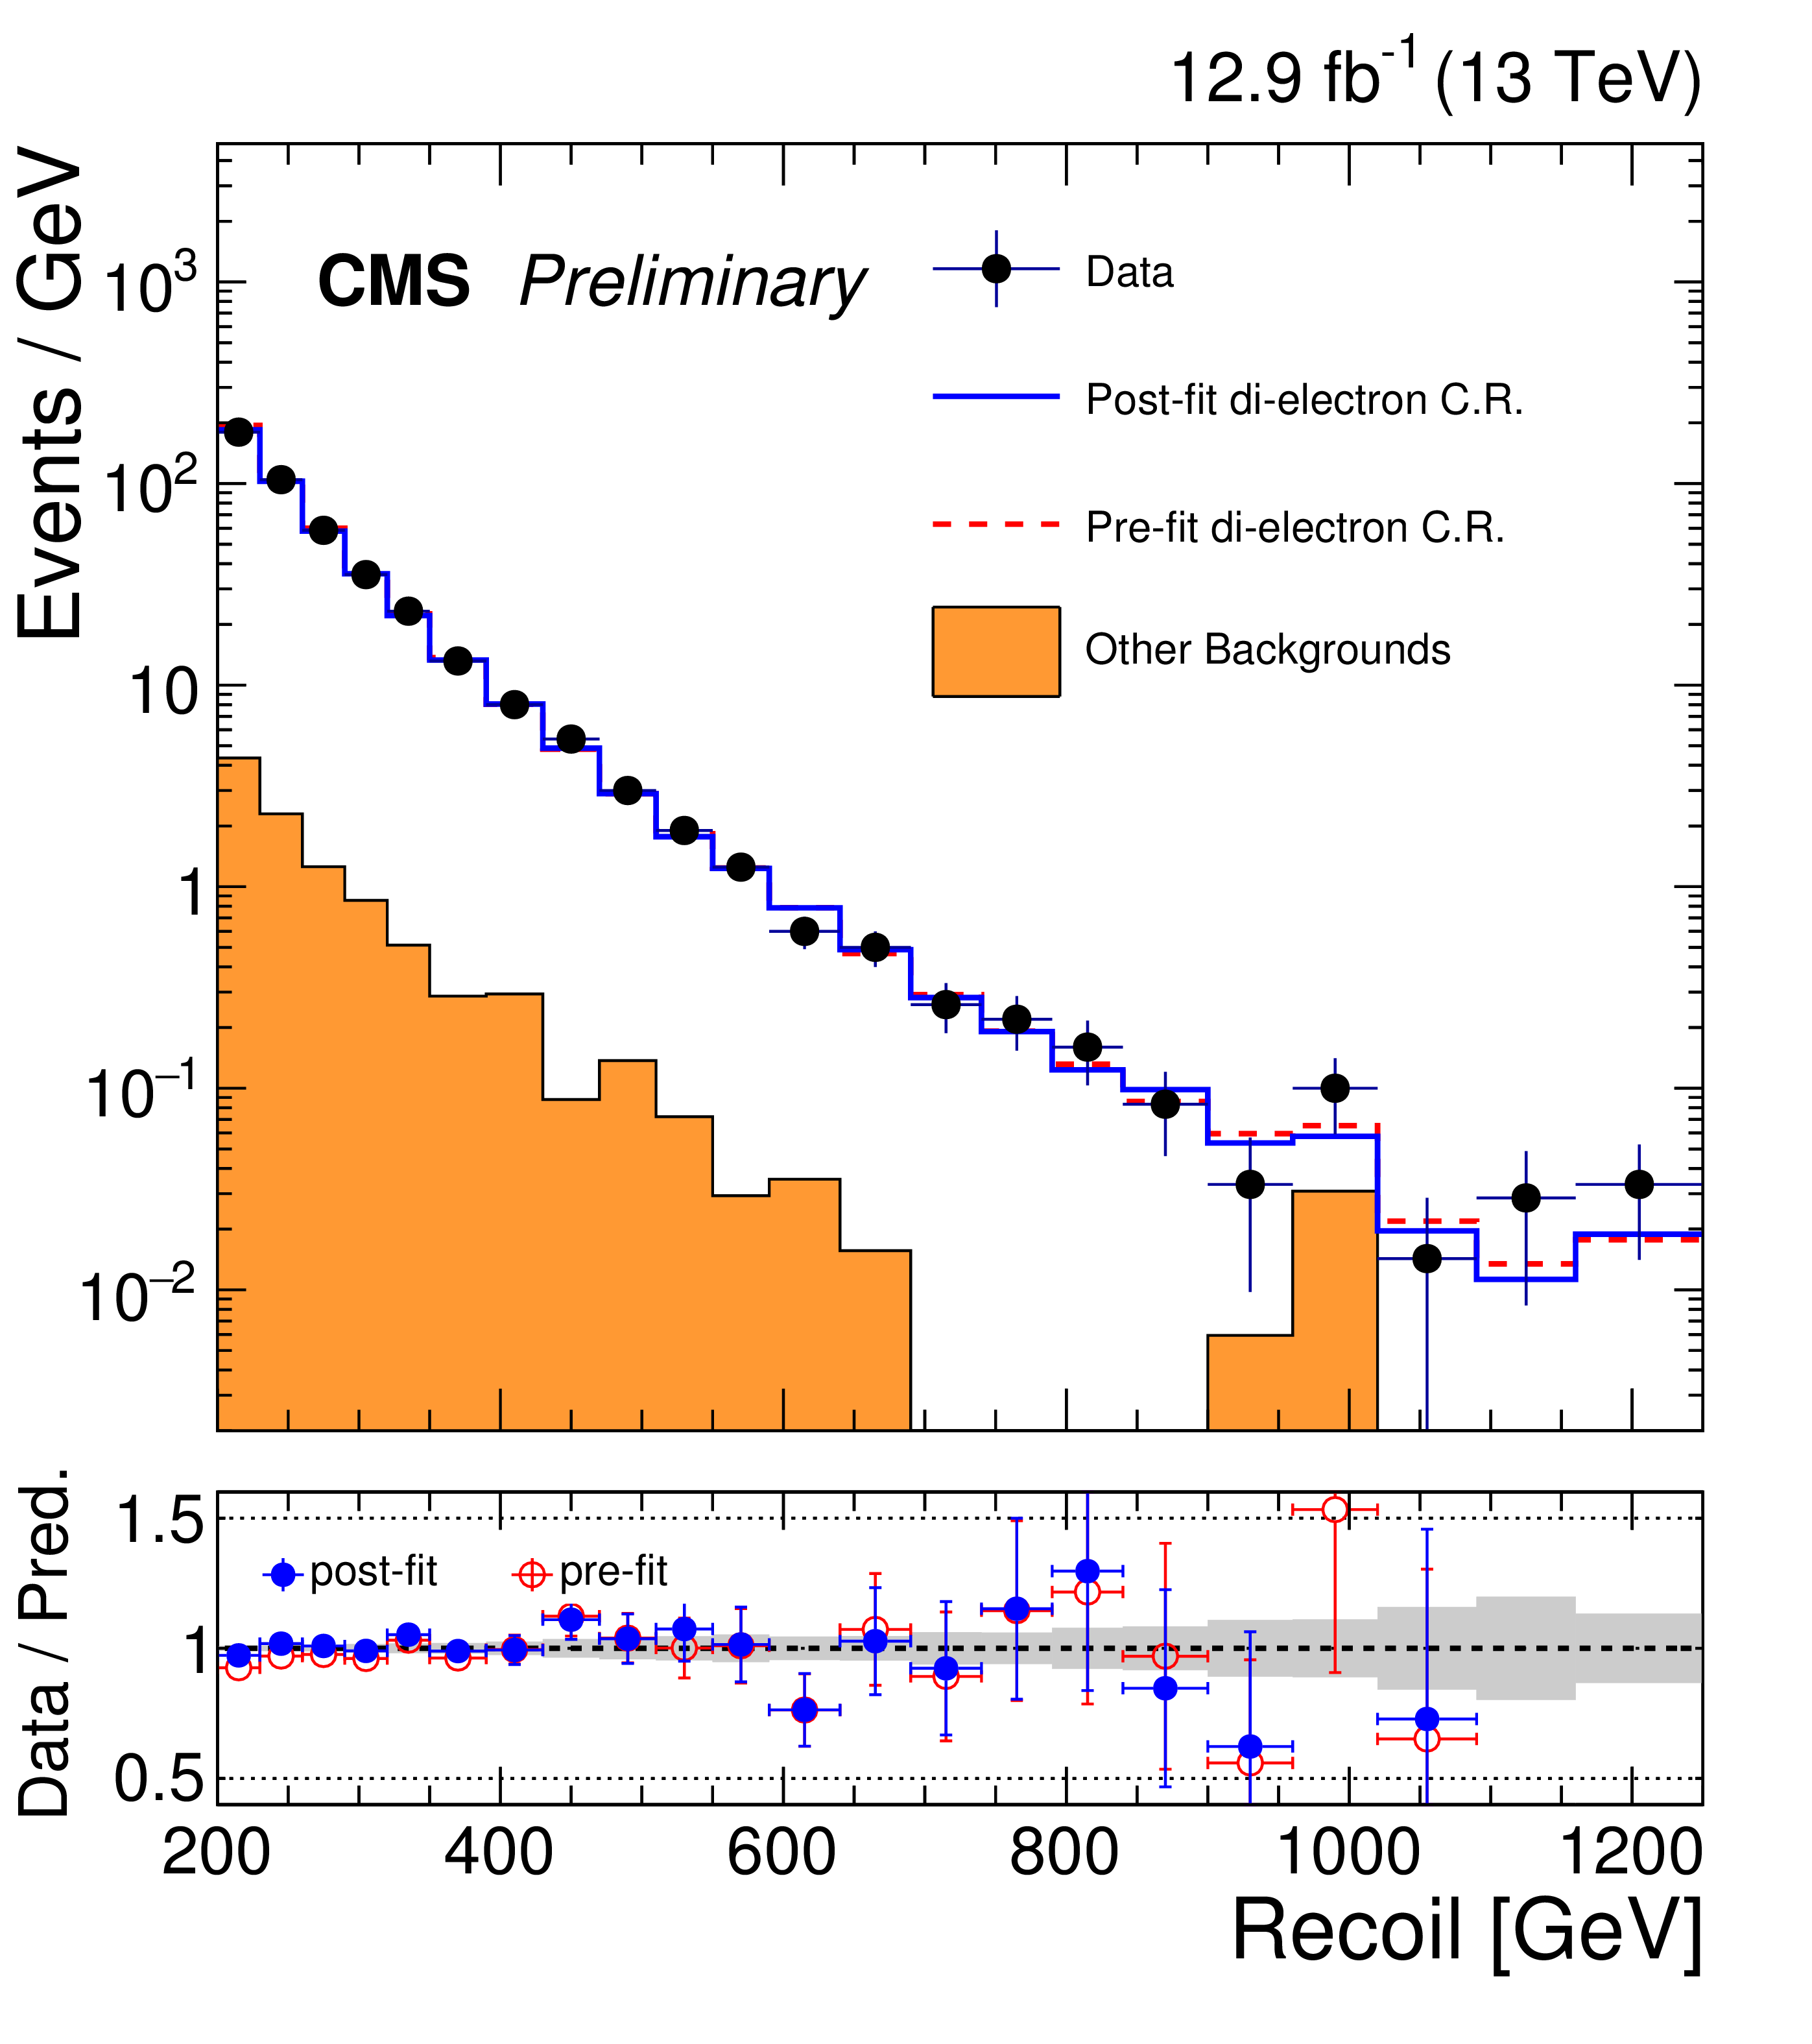
Comparison between data and Monte Carlo simulation in the dielectron control region before and after performing the simultaneous fit across all the control regions and the signal region. Plot (a) corresponds to the monojet category and plot (b) corresponds to the mono-V category. The orange histogram corresponds to all processes other than $ \mathrm {Z(ee) } $+jets. The gray band indicates the post-fit uncertainty after propagating all the systematic uncertainties to the fit. The last bin includes all events with ${E_{\mathrm {T}}^{\text {miss}}} > $ 1160 GeV in the monojet category and $ {E_{\mathrm {T}}^{\text {miss}}} > $ 750 GeV in the mono-V category. |
png pdf |
Figure 4-a:
Comparison between data and Monte Carlo simulation in the dielectron control region before and after performing the simultaneous fit across all the control regions and the signal region. The plot corresponds to the monojet category. The orange histogram corresponds to all processes other than $ \mathrm {Z(ee) } $+jets. The gray band indicates the post-fit uncertainty after propagating all the systematic uncertainties to the fit. The last bin includes all events with ${E_{\mathrm {T}}^{\text {miss}}} > $ 1160 GeV in the monojet category and $ {E_{\mathrm {T}}^{\text {miss}}} > $ 750 GeV in the mono-V category. |

png pdf |
Figure 4-b:
Comparison between data and Monte Carlo simulation in the dielectron control region before and after performing the simultaneous fit across all the control regions and the signal region. The plot corresponds to the mono-V category. The orange histogram corresponds to all processes other than $ \mathrm {Z(ee) } $+jets. The gray band indicates the post-fit uncertainty after propagating all the systematic uncertainties to the fit. The last bin includes all events with ${E_{\mathrm {T}}^{\text {miss}}} > $ 1160 GeV in the monojet category and $ {E_{\mathrm {T}}^{\text {miss}}} > $ 750 GeV in the mono-V category. |

png pdf |
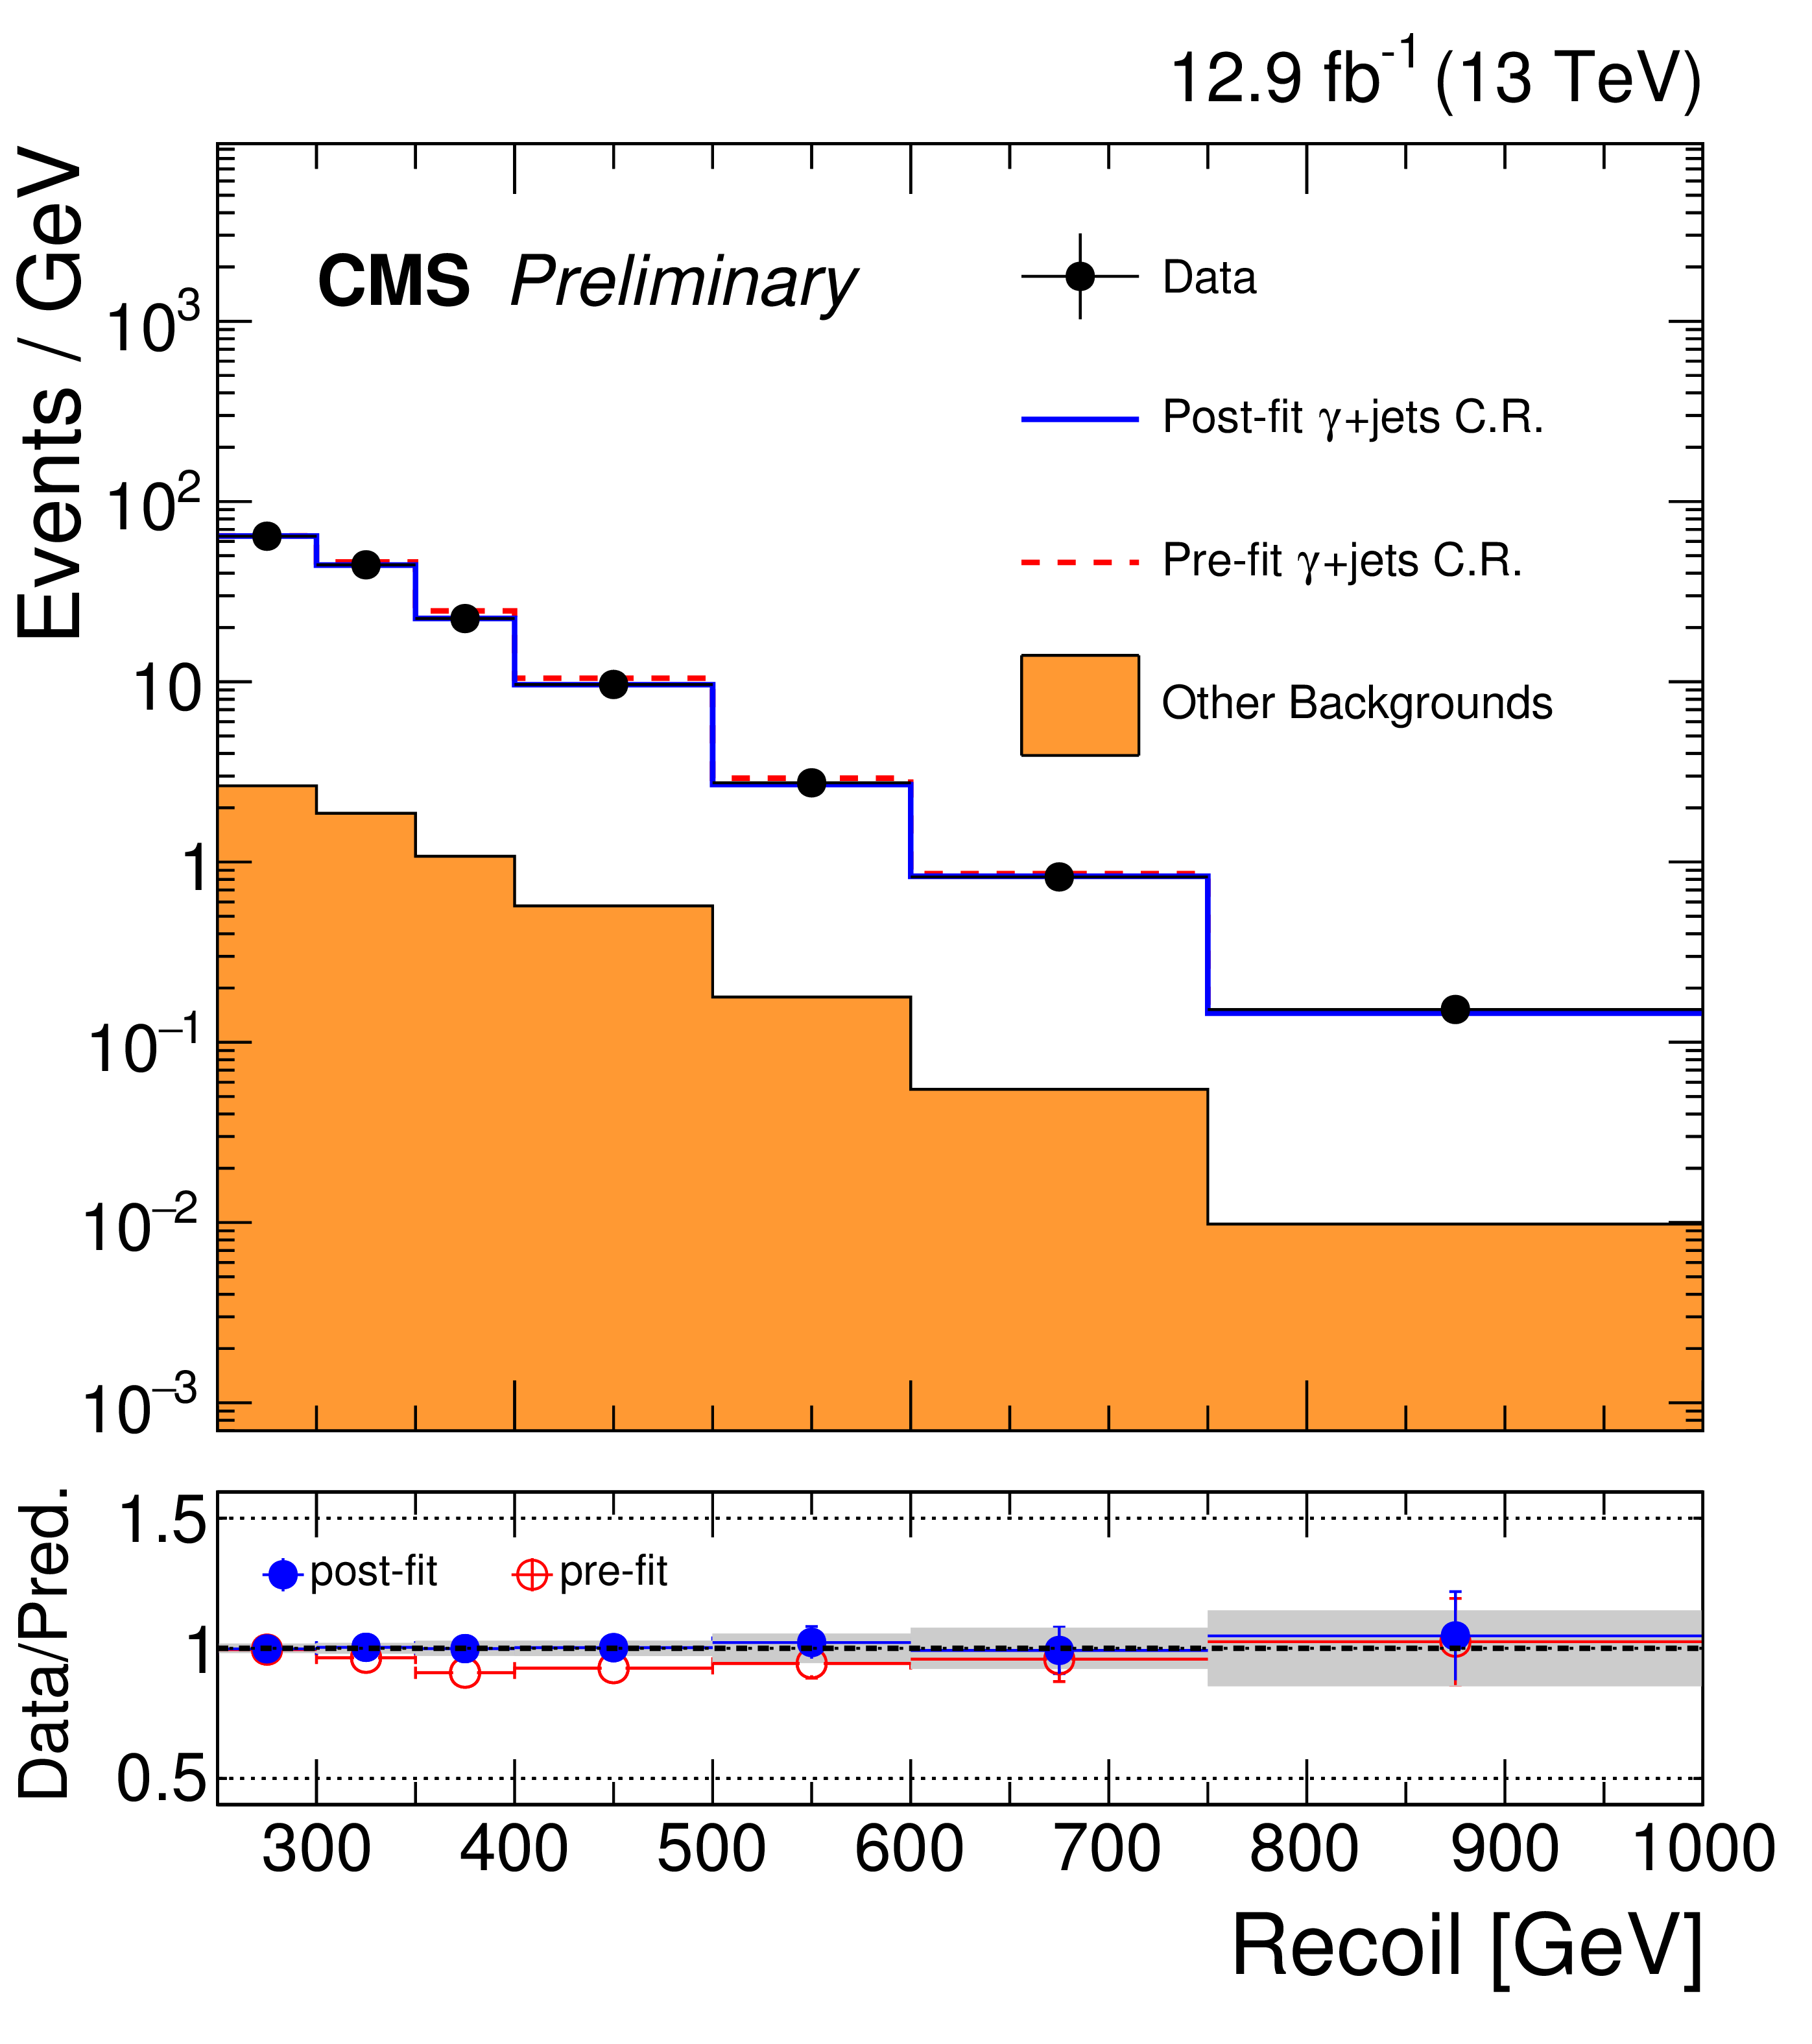
Figure 5:
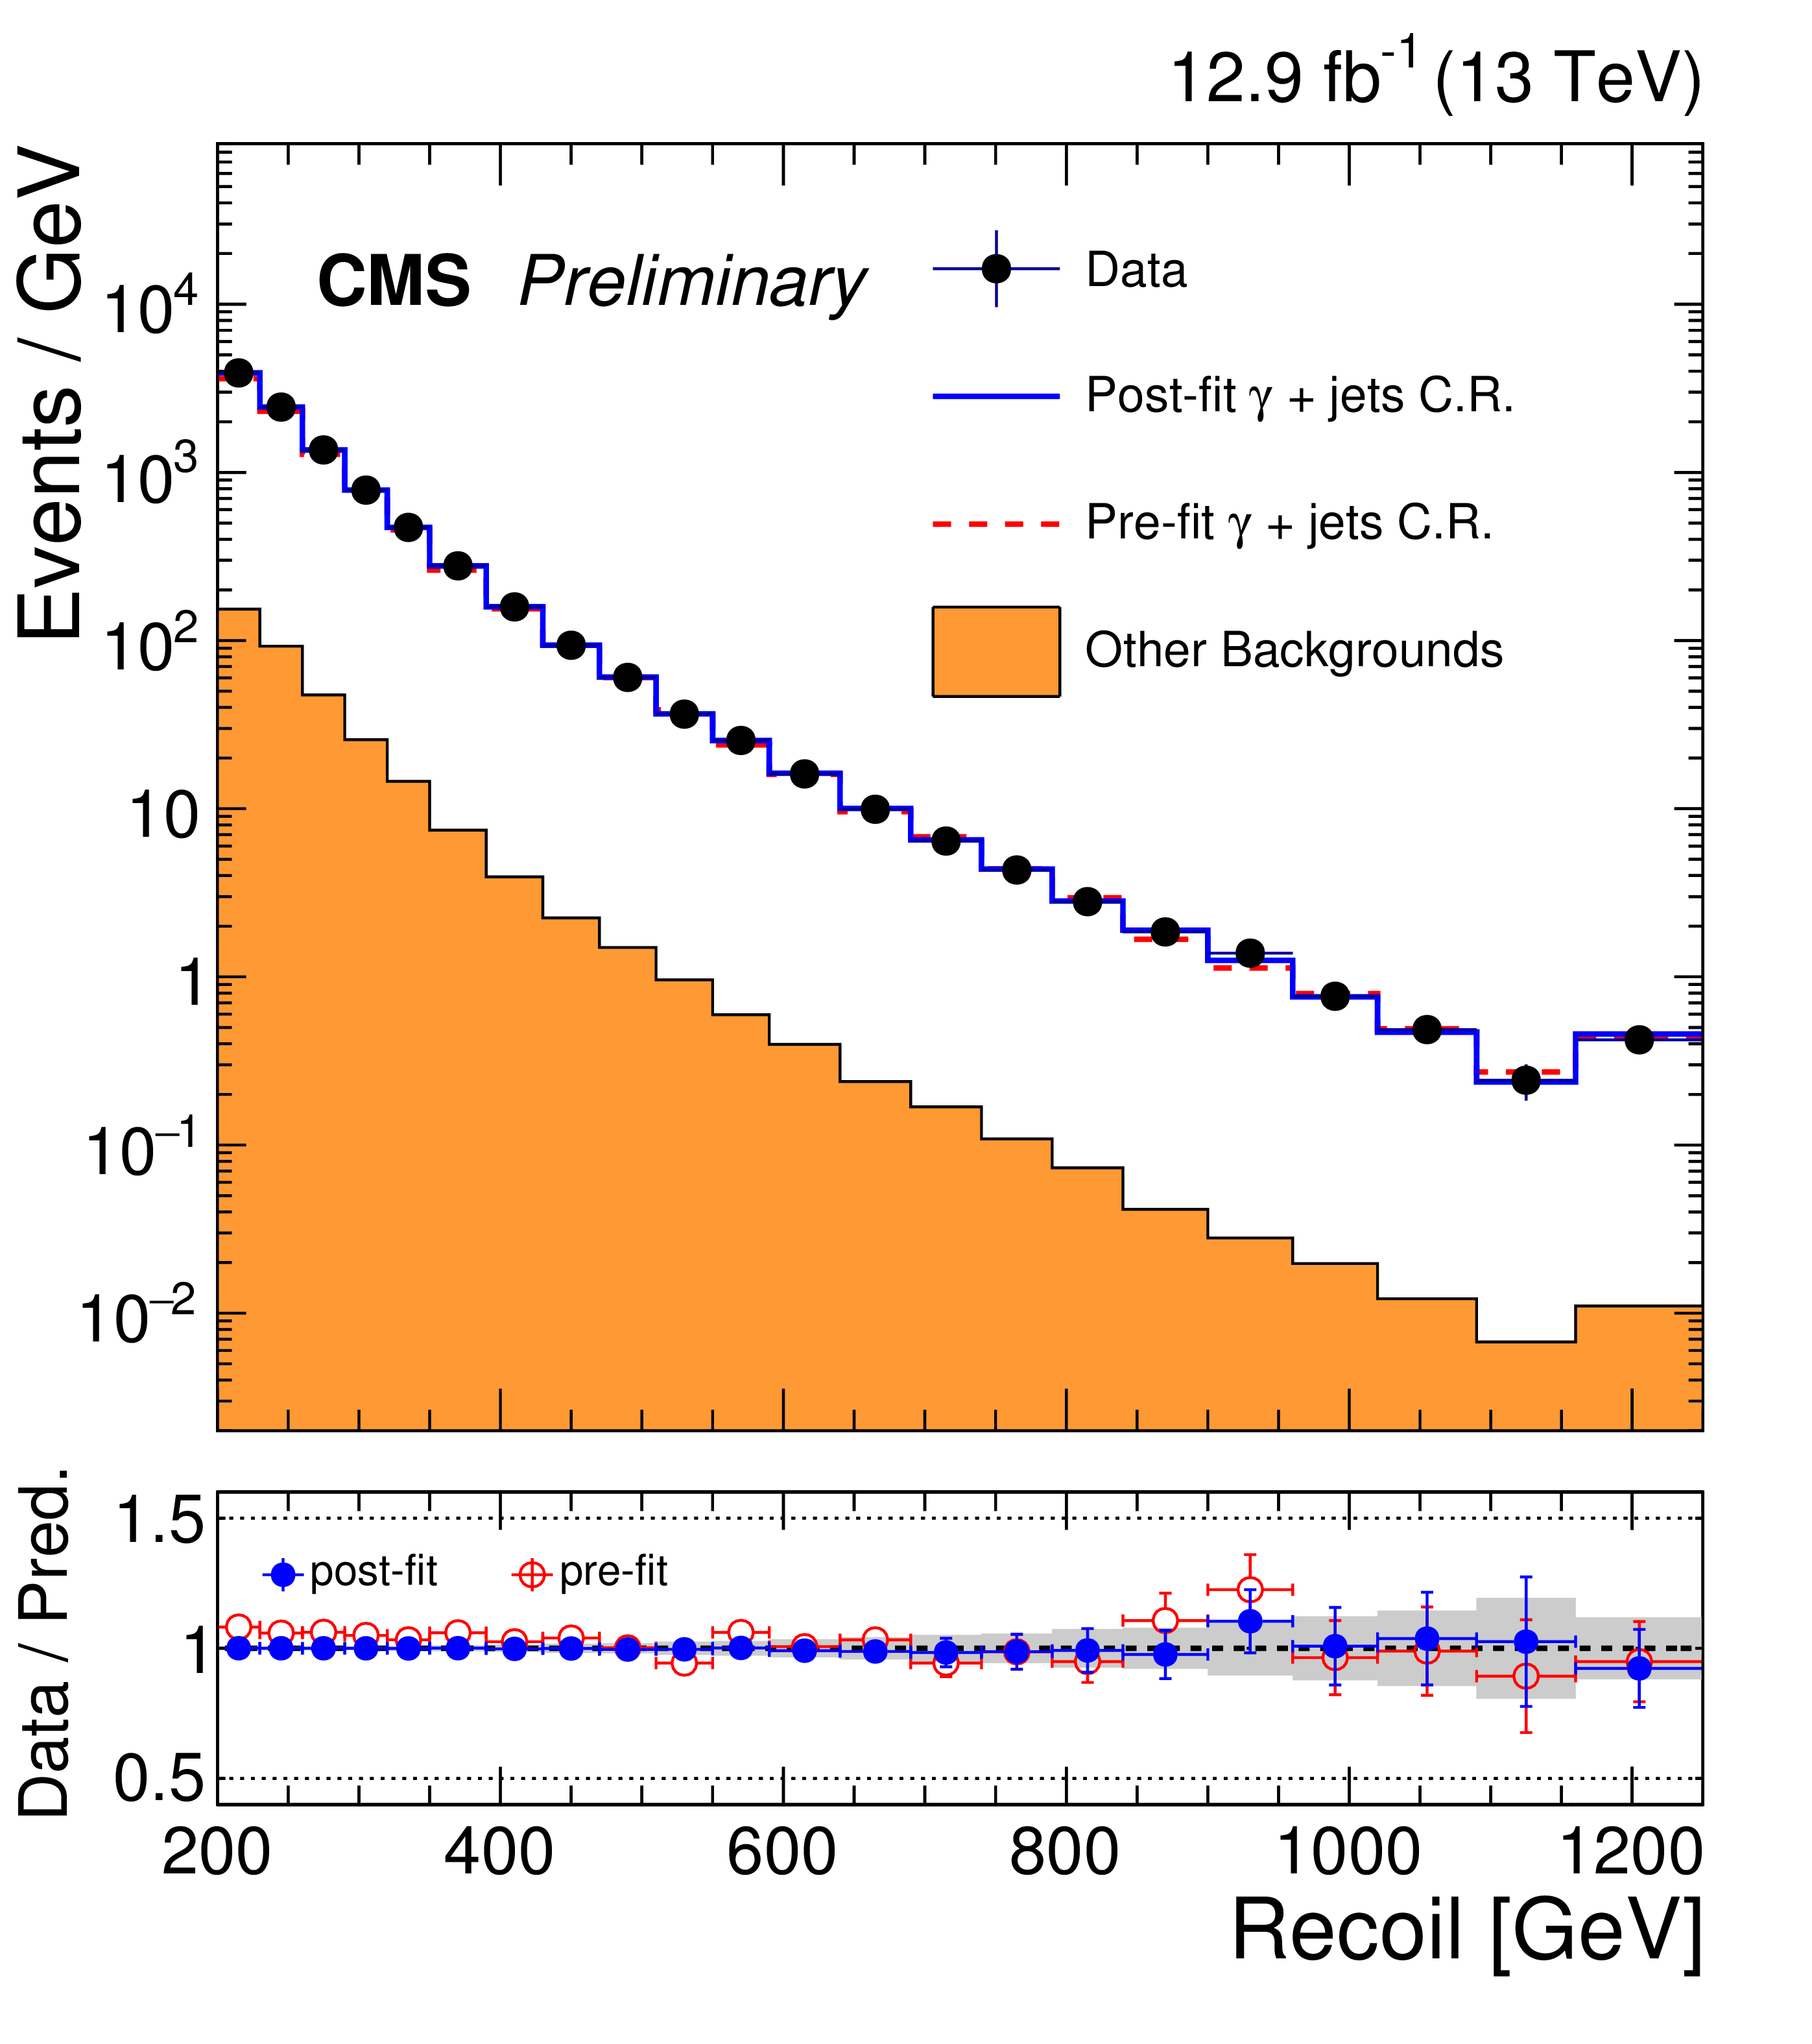
Comparison between data and Monte Carlo simulation in the ${\gamma }$+jets control region before and after performing the simultaneous fit across all the control regions and the signal region. Plot (a) corresponds to the monojet category and plot (b) corresponds to the mono-V category. The orange histogram corresponds to the QCD multijets background. The gray band indicates the post-fit uncertainty after propagating all the systematic uncertainties to the fit. The last bin includes all events with ${E_{\mathrm {T}}^{\text {miss}}} > $ 1160 GeV in the monojet category and $ {E_{\mathrm {T}}^{\text {miss}}} > $ 750 GeV in the mono-V category. |
png pdf |
Figure 5-a:
Comparison between data and Monte Carlo simulation in the ${\gamma }$+jets control region before and after performing the simultaneous fit across all the control regions and the signal region. The plot corresponds to the monojet category. The orange histogram corresponds to the QCD multijets background. The gray band indicates the post-fit uncertainty after propagating all the systematic uncertainties to the fit. The last bin includes all events with ${E_{\mathrm {T}}^{\text {miss}}} > $ 1160 GeV in the monojet category and $ {E_{\mathrm {T}}^{\text {miss}}} > $ 750 GeV in the mono-V category. |
png pdf |
Figure 5-b:
Comparison between data and Monte Carlo simulation in the ${\gamma }$+jets control region before and after performing the simultaneous fit across all the control regions and the signal region. The plot corresponds to the mono-V category. The orange histogram corresponds to the QCD multijets background. The gray band indicates the post-fit uncertainty after propagating all the systematic uncertainties to the fit. The last bin includes all events with ${E_{\mathrm {T}}^{\text {miss}}} > $ 1160 GeV in the monojet category and $ {E_{\mathrm {T}}^{\text {miss}}} > $ 750 GeV in the mono-V category. |
png pdf |
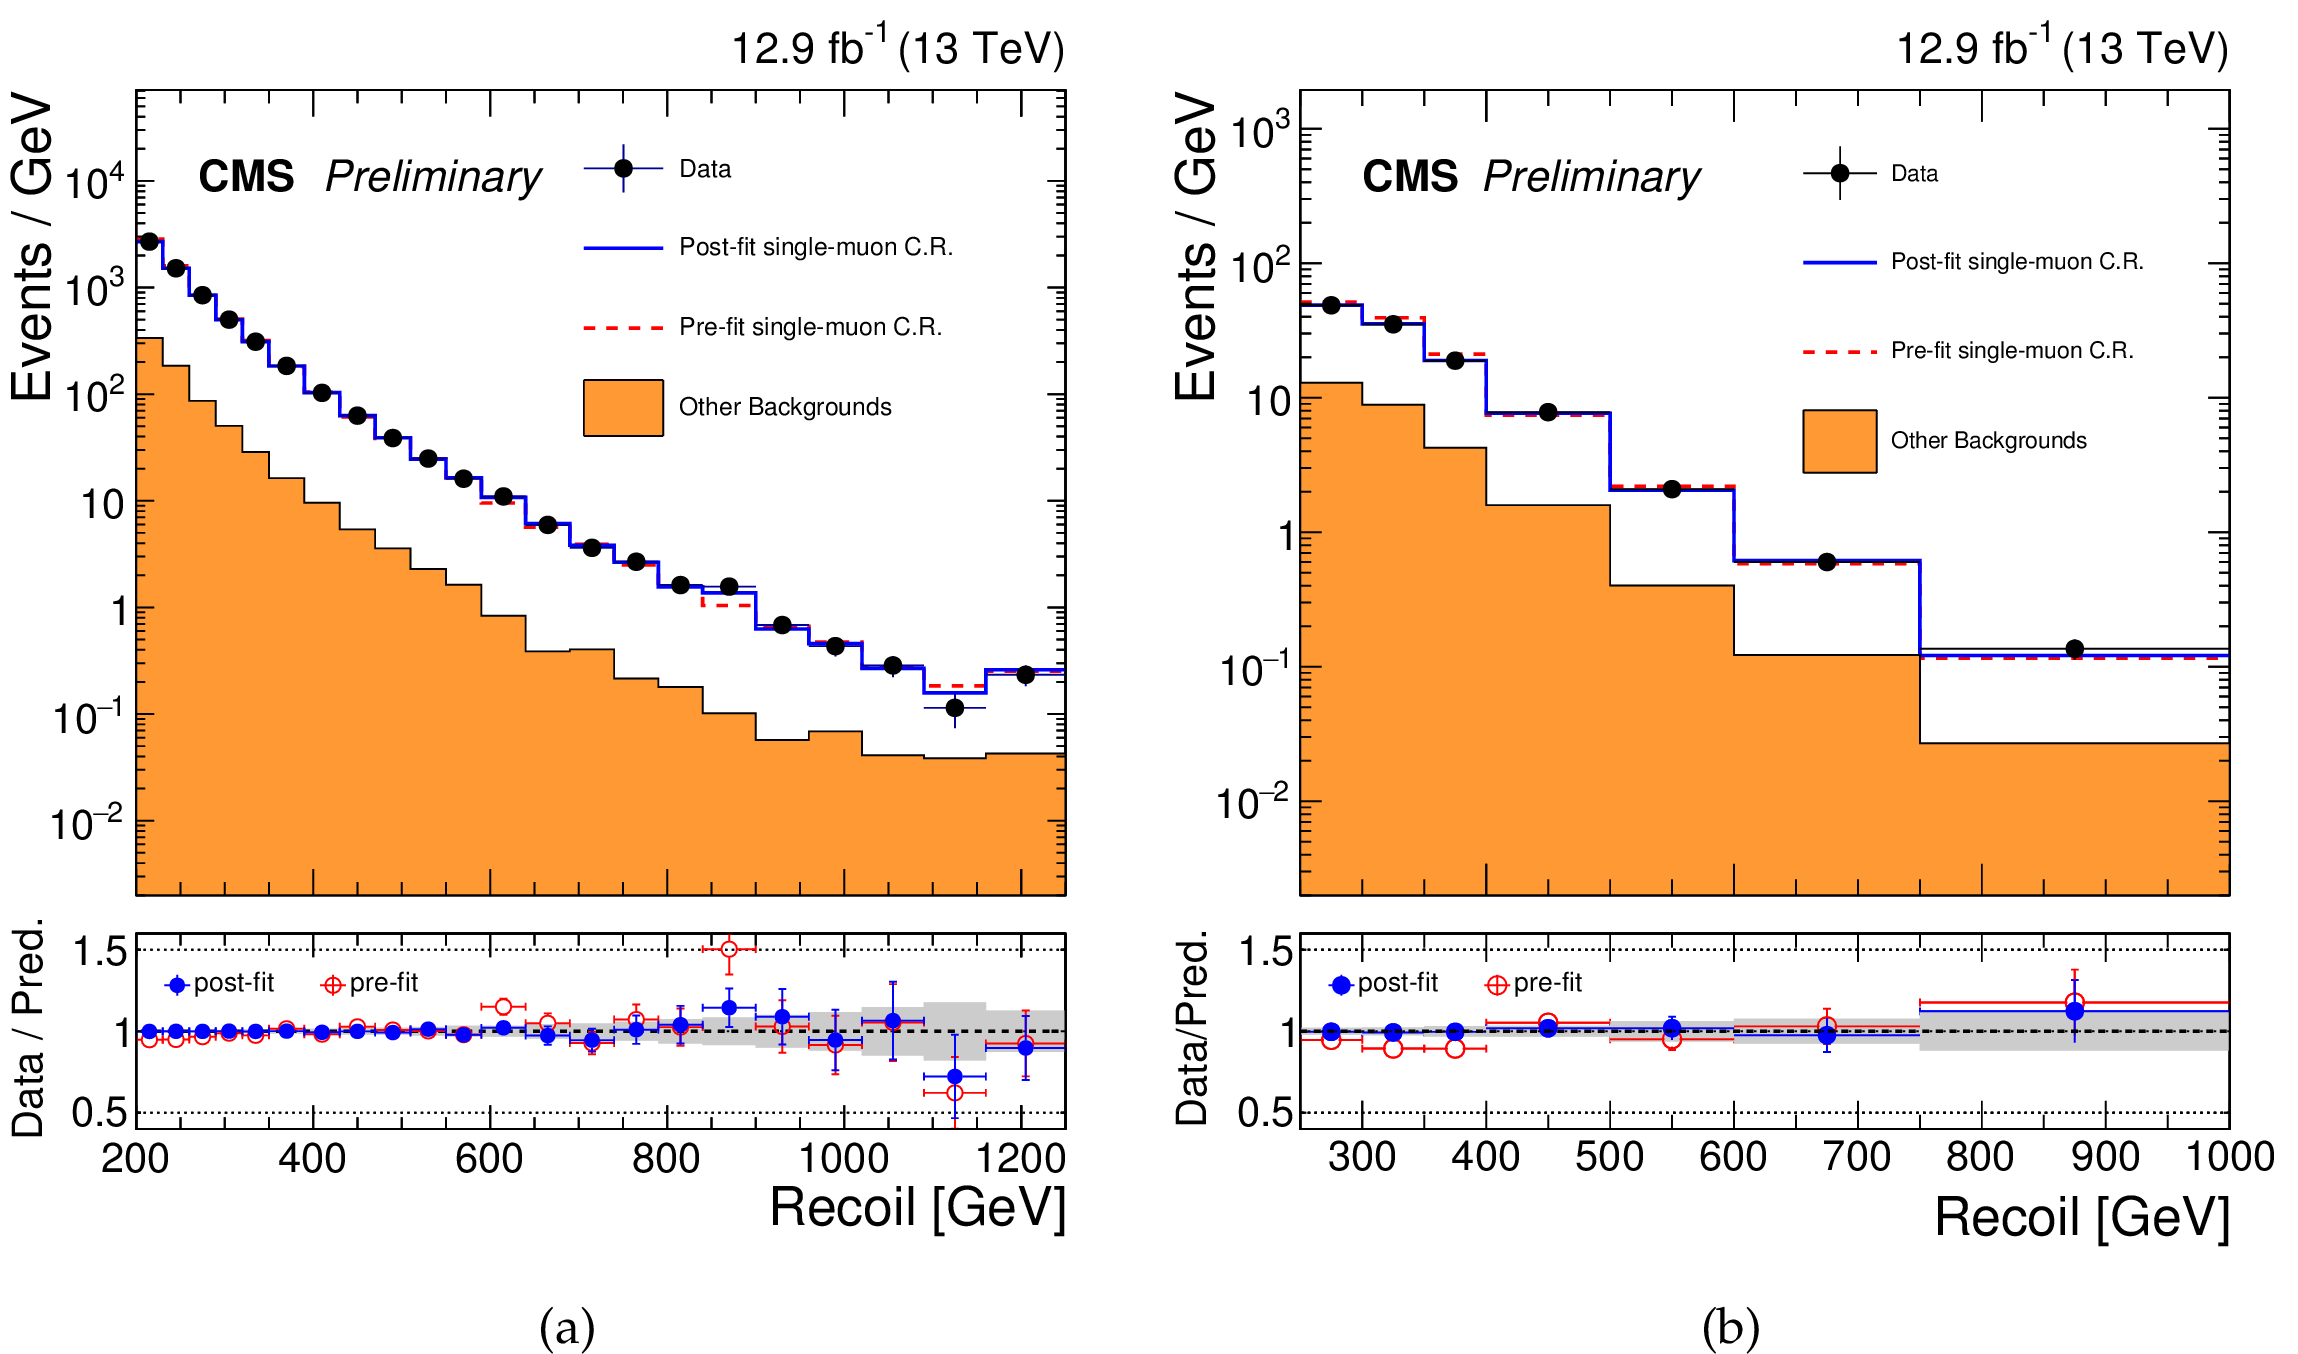
Figure 6:
Comparison between data and Monte Carlo simulation in the single-muon control region before and after performing the simultaneous fit across all the control regions and the signal region. Plot (a) corresponds to the monojet category and plot (b) corresponds to the mono-V category. The orange histogram corresponds to all processes other than $ \mathrm {W}(\mu \nu )$+jets. The gray band indicates the post-fit uncertainty after propagating all the systematic uncertainties to the fit. The last bin includes all events with ${E_{\mathrm {T}}^{\text {miss}}} > $ 1160 GeV in the monojet category and ${E_{\mathrm {T}}^{\text {miss}}} > $ 750 GeV in the mono-V category. |
png pdf |
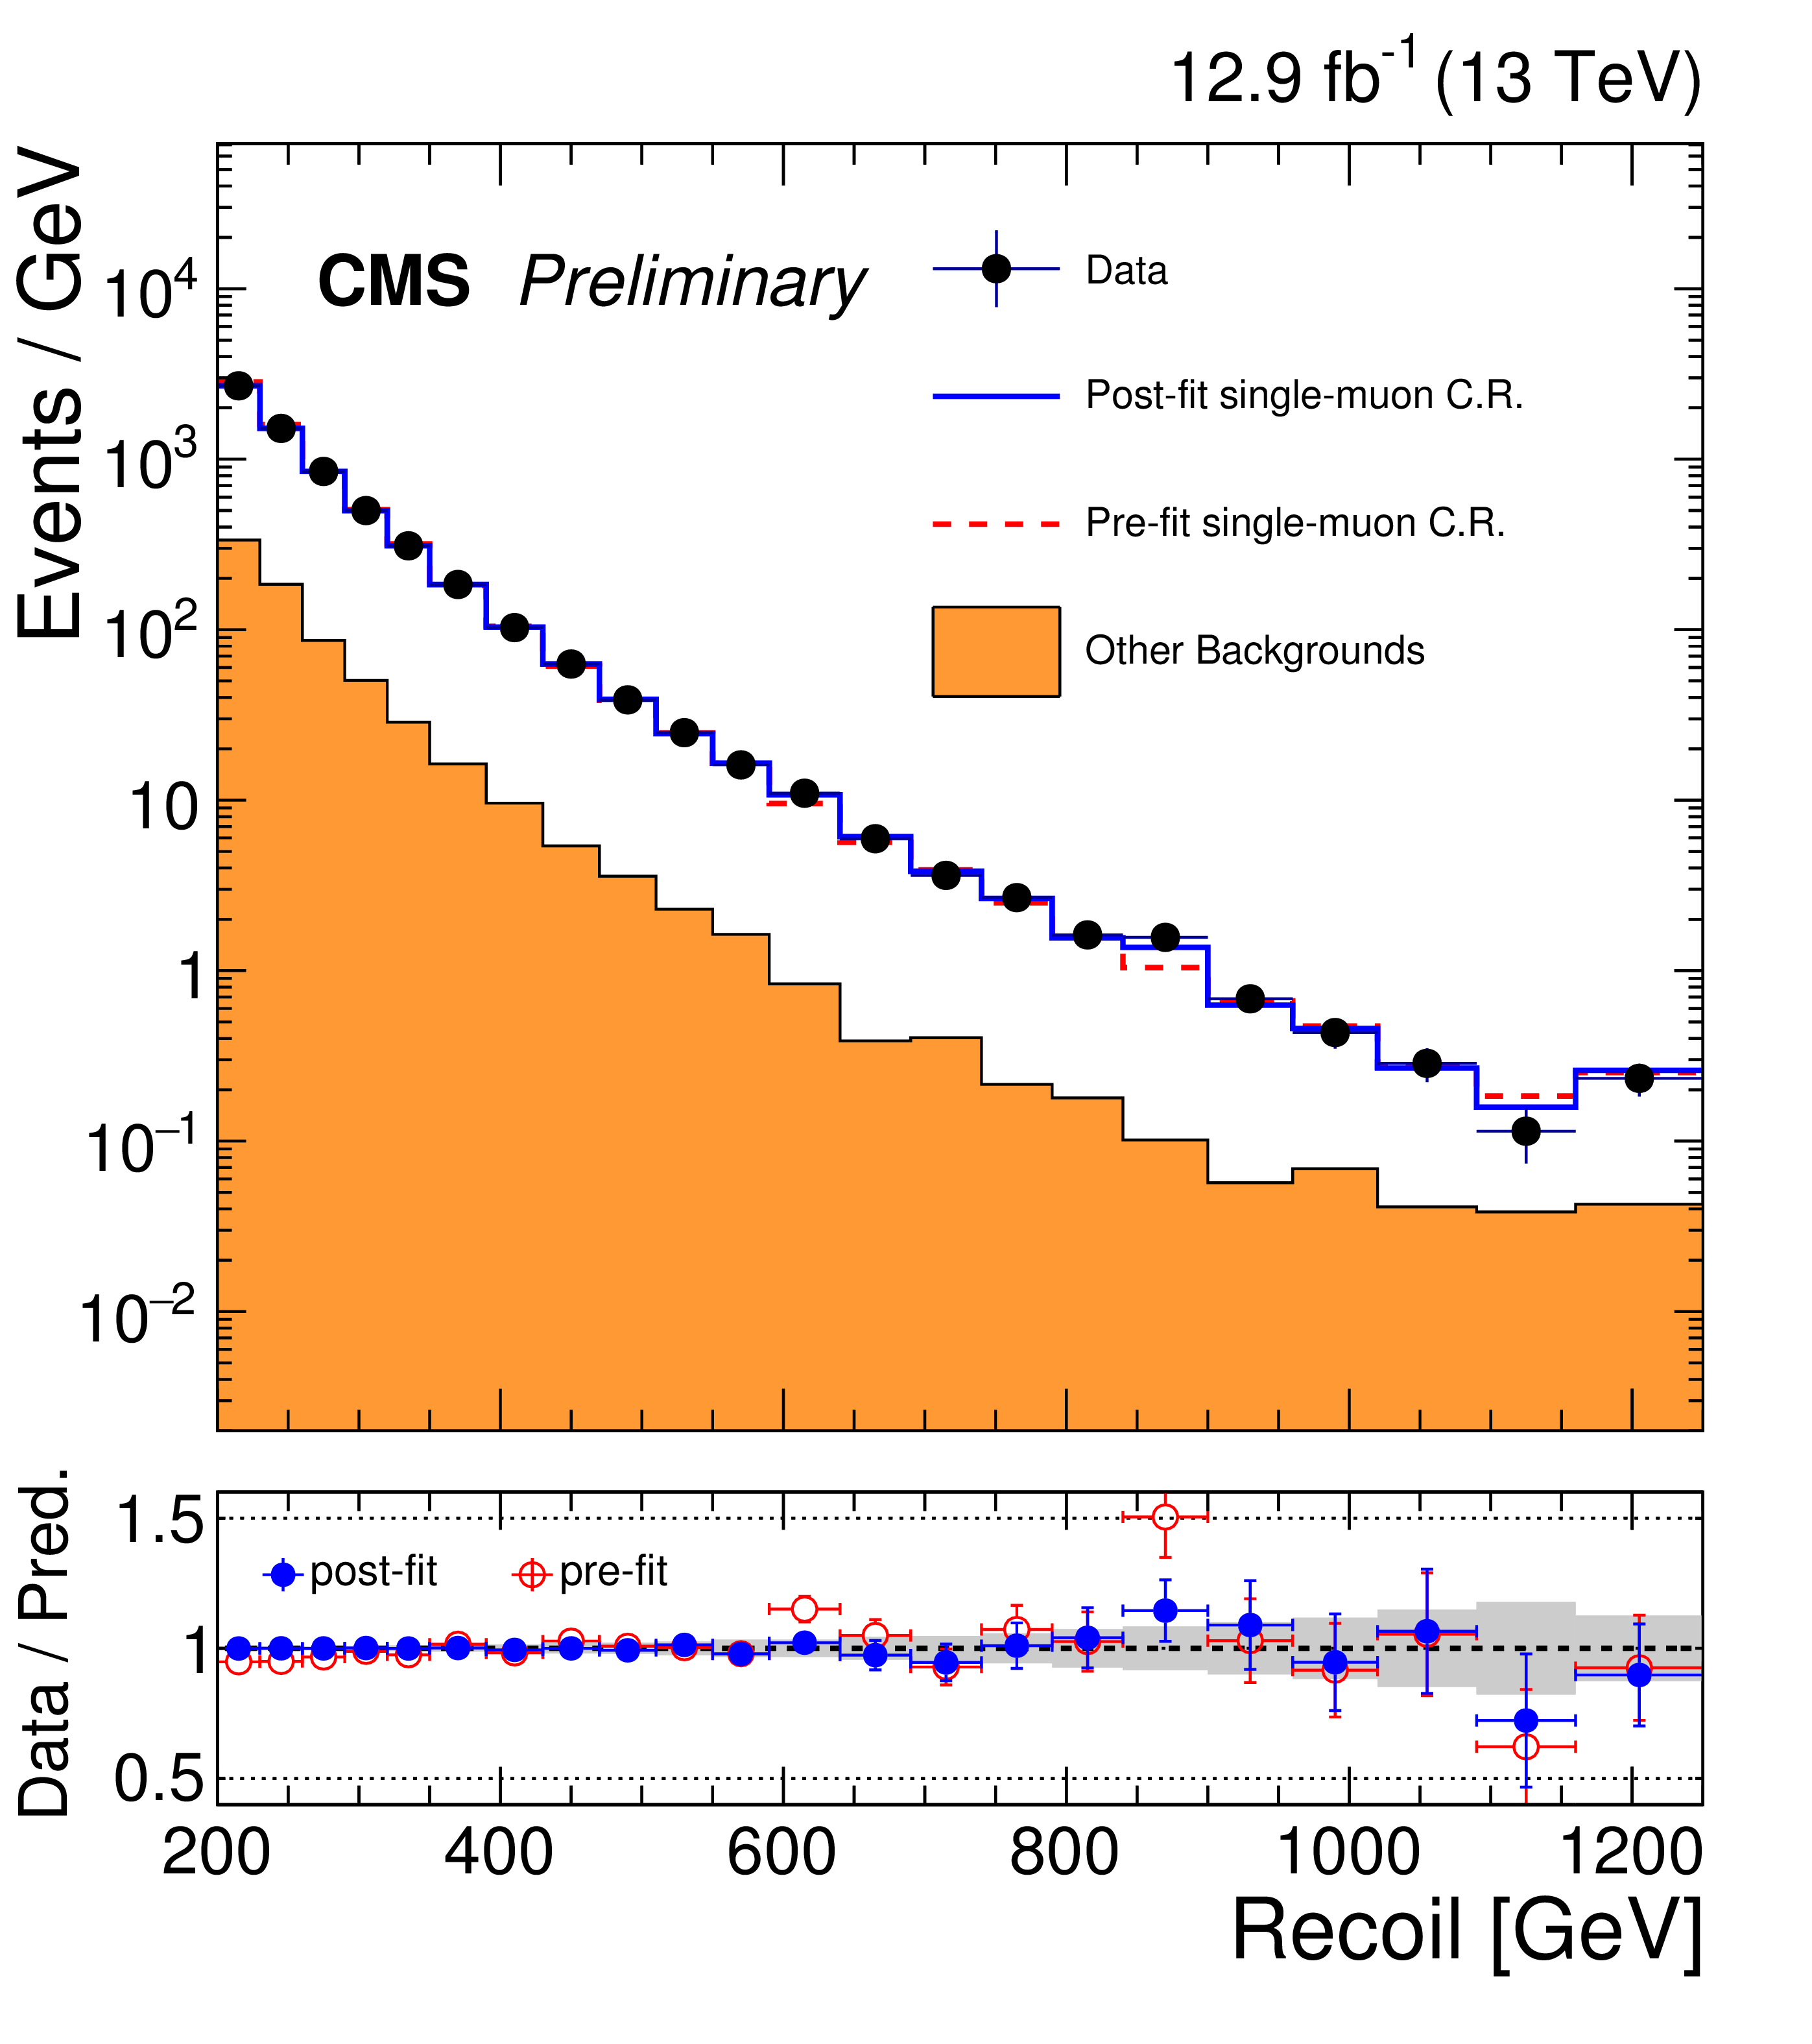
Figure 6-a:
Comparison between data and Monte Carlo simulation in the single-muon control region before and after performing the simultaneous fit across all the control regions and the signal region. Plot (a) corresponds to the monojet category and plot (b) corresponds to the mono-V category. The orange histogram corresponds to all processes other than $ \mathrm {W}(\mu \nu )$+jets. The gray band indicates the post-fit uncertainty after propagating all the systematic uncertainties to the fit. The last bin includes all events with ${E_{\mathrm {T}}^{\text {miss}}} > $ 1160 GeV in the monojet category and ${E_{\mathrm {T}}^{\text {miss}}} > $ 750 GeV in the mono-V category. |
png pdf |
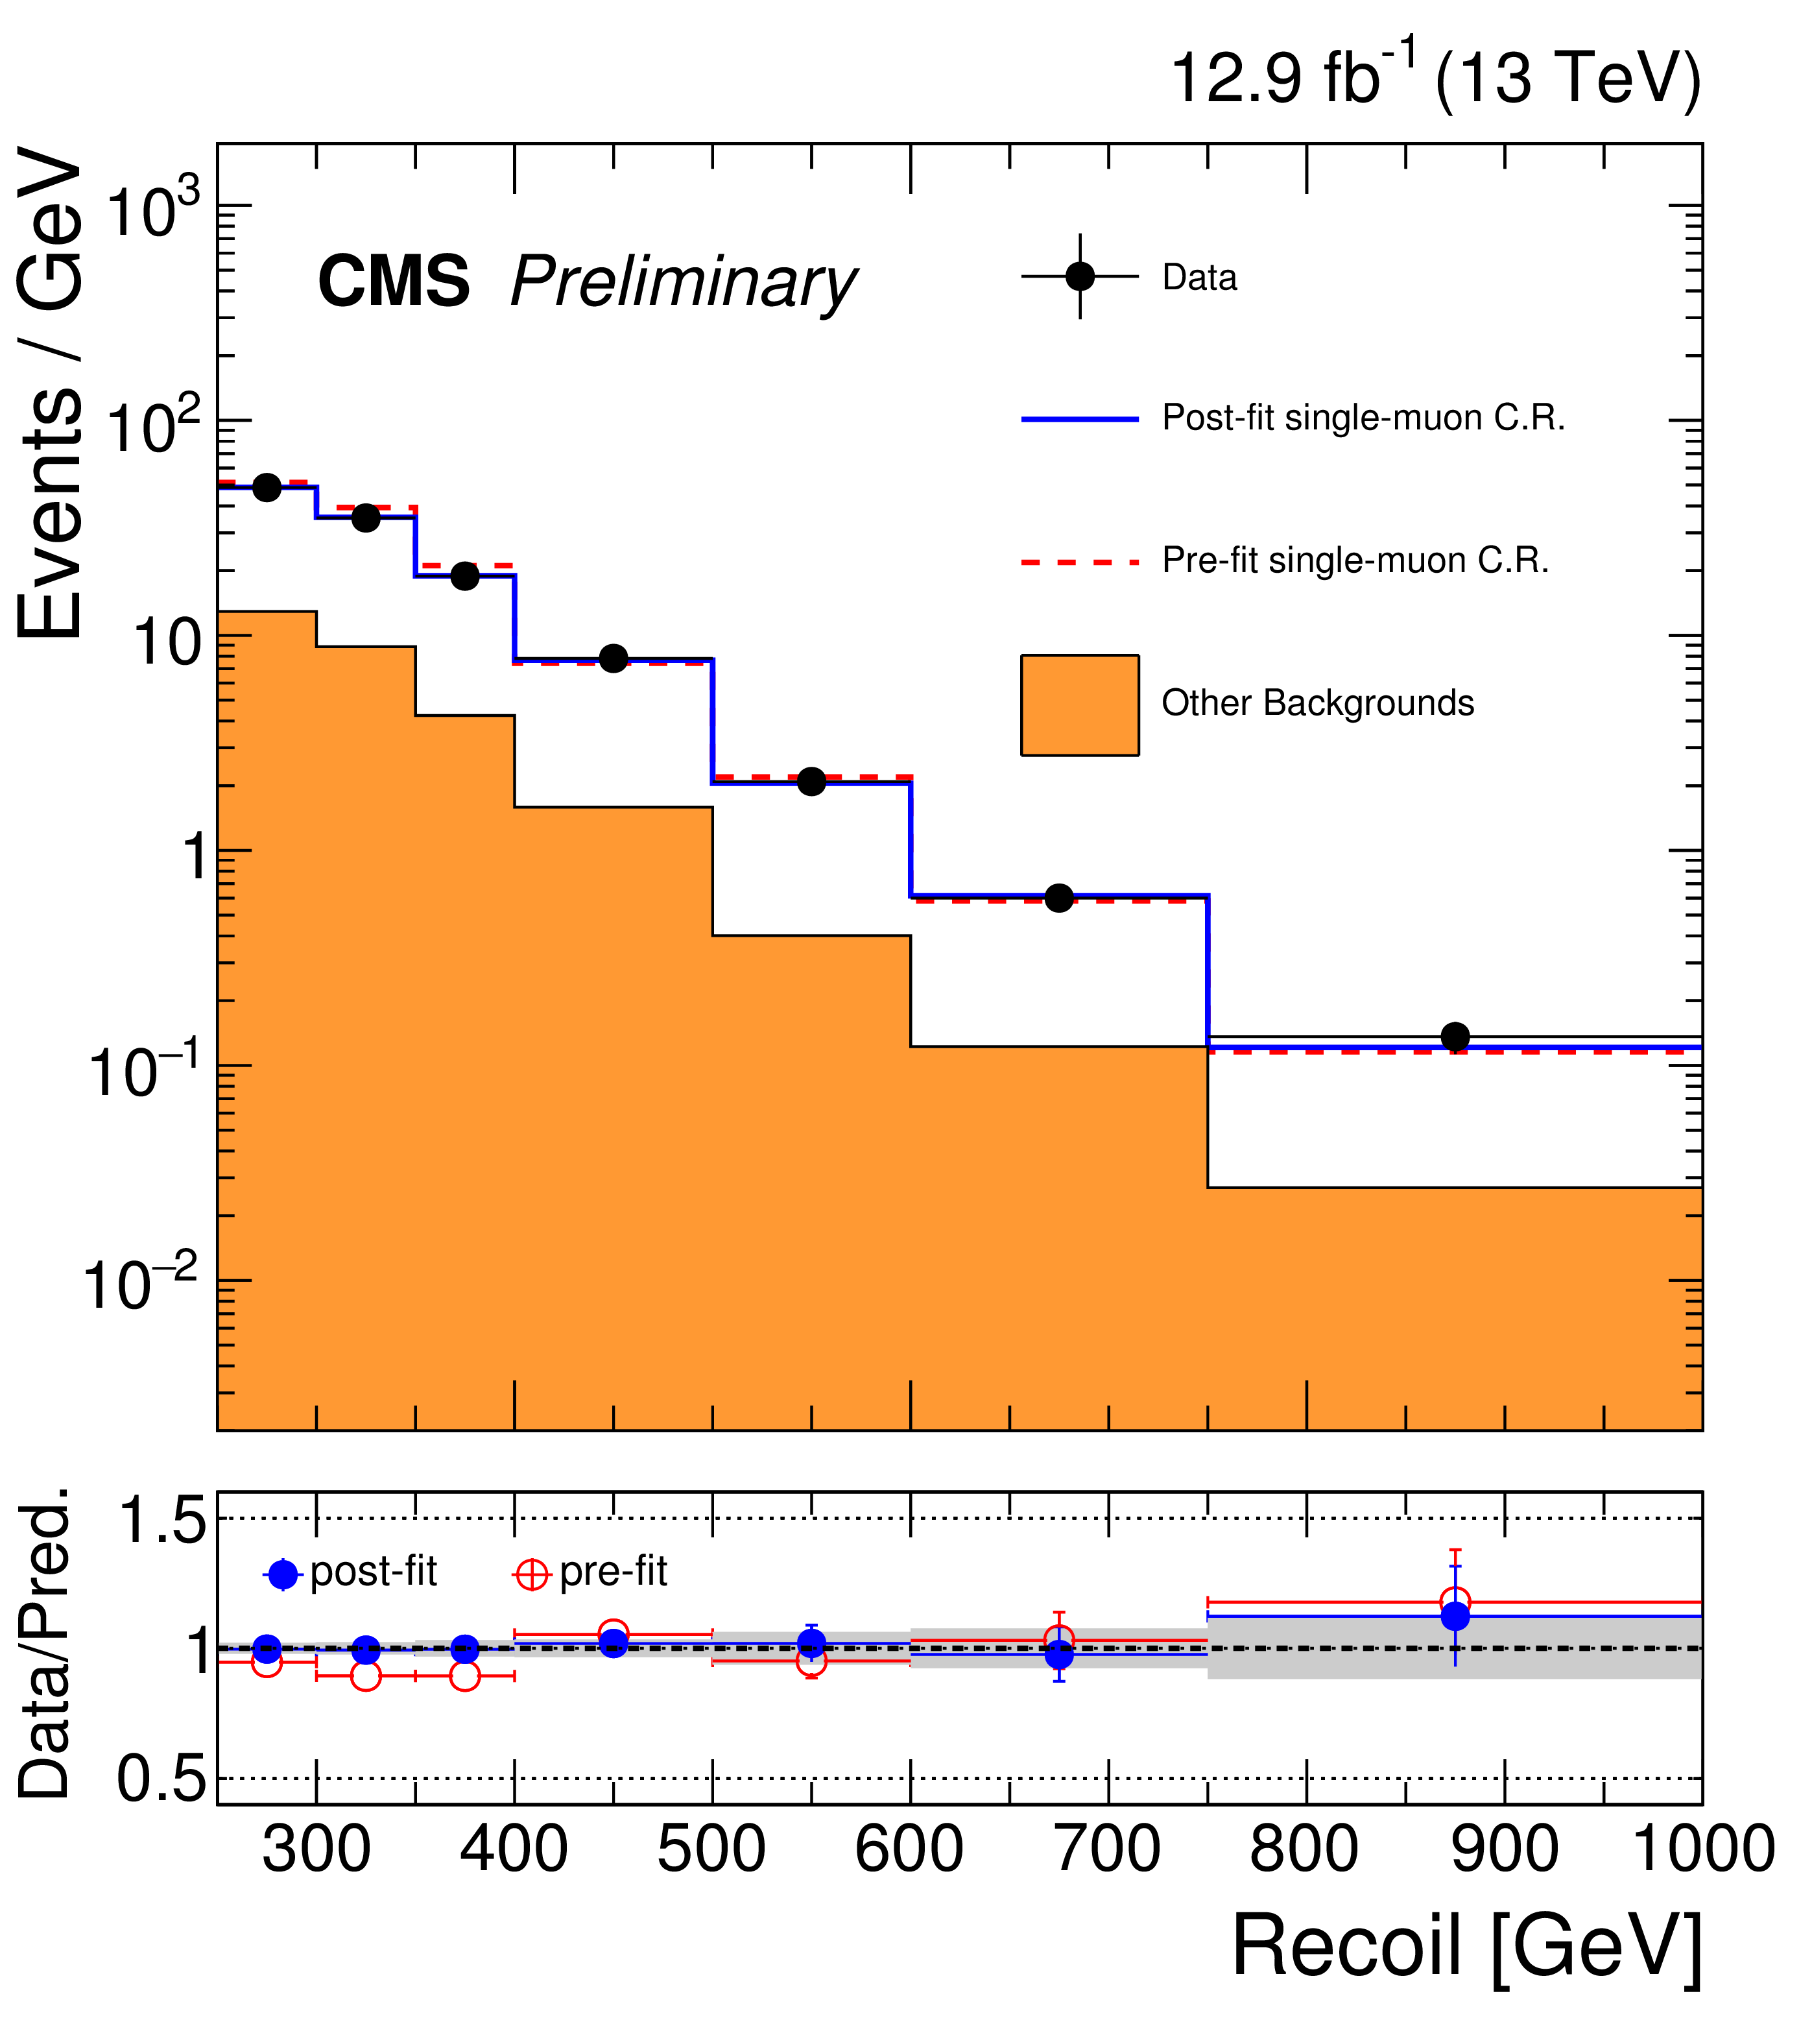
Figure 6-b:
Comparison between data and Monte Carlo simulation in the single-muon control region before and after performing the simultaneous fit across all the control regions and the signal region. Plot (a) corresponds to the monojet category and plot (b) corresponds to the mono-V category. The orange histogram corresponds to all processes other than $ \mathrm {W}(\mu \nu )$+jets. The gray band indicates the post-fit uncertainty after propagating all the systematic uncertainties to the fit. The last bin includes all events with ${E_{\mathrm {T}}^{\text {miss}}} > $ 1160 GeV in the monojet category and ${E_{\mathrm {T}}^{\text {miss}}} > $ 750 GeV in the mono-V category. |
png pdf |
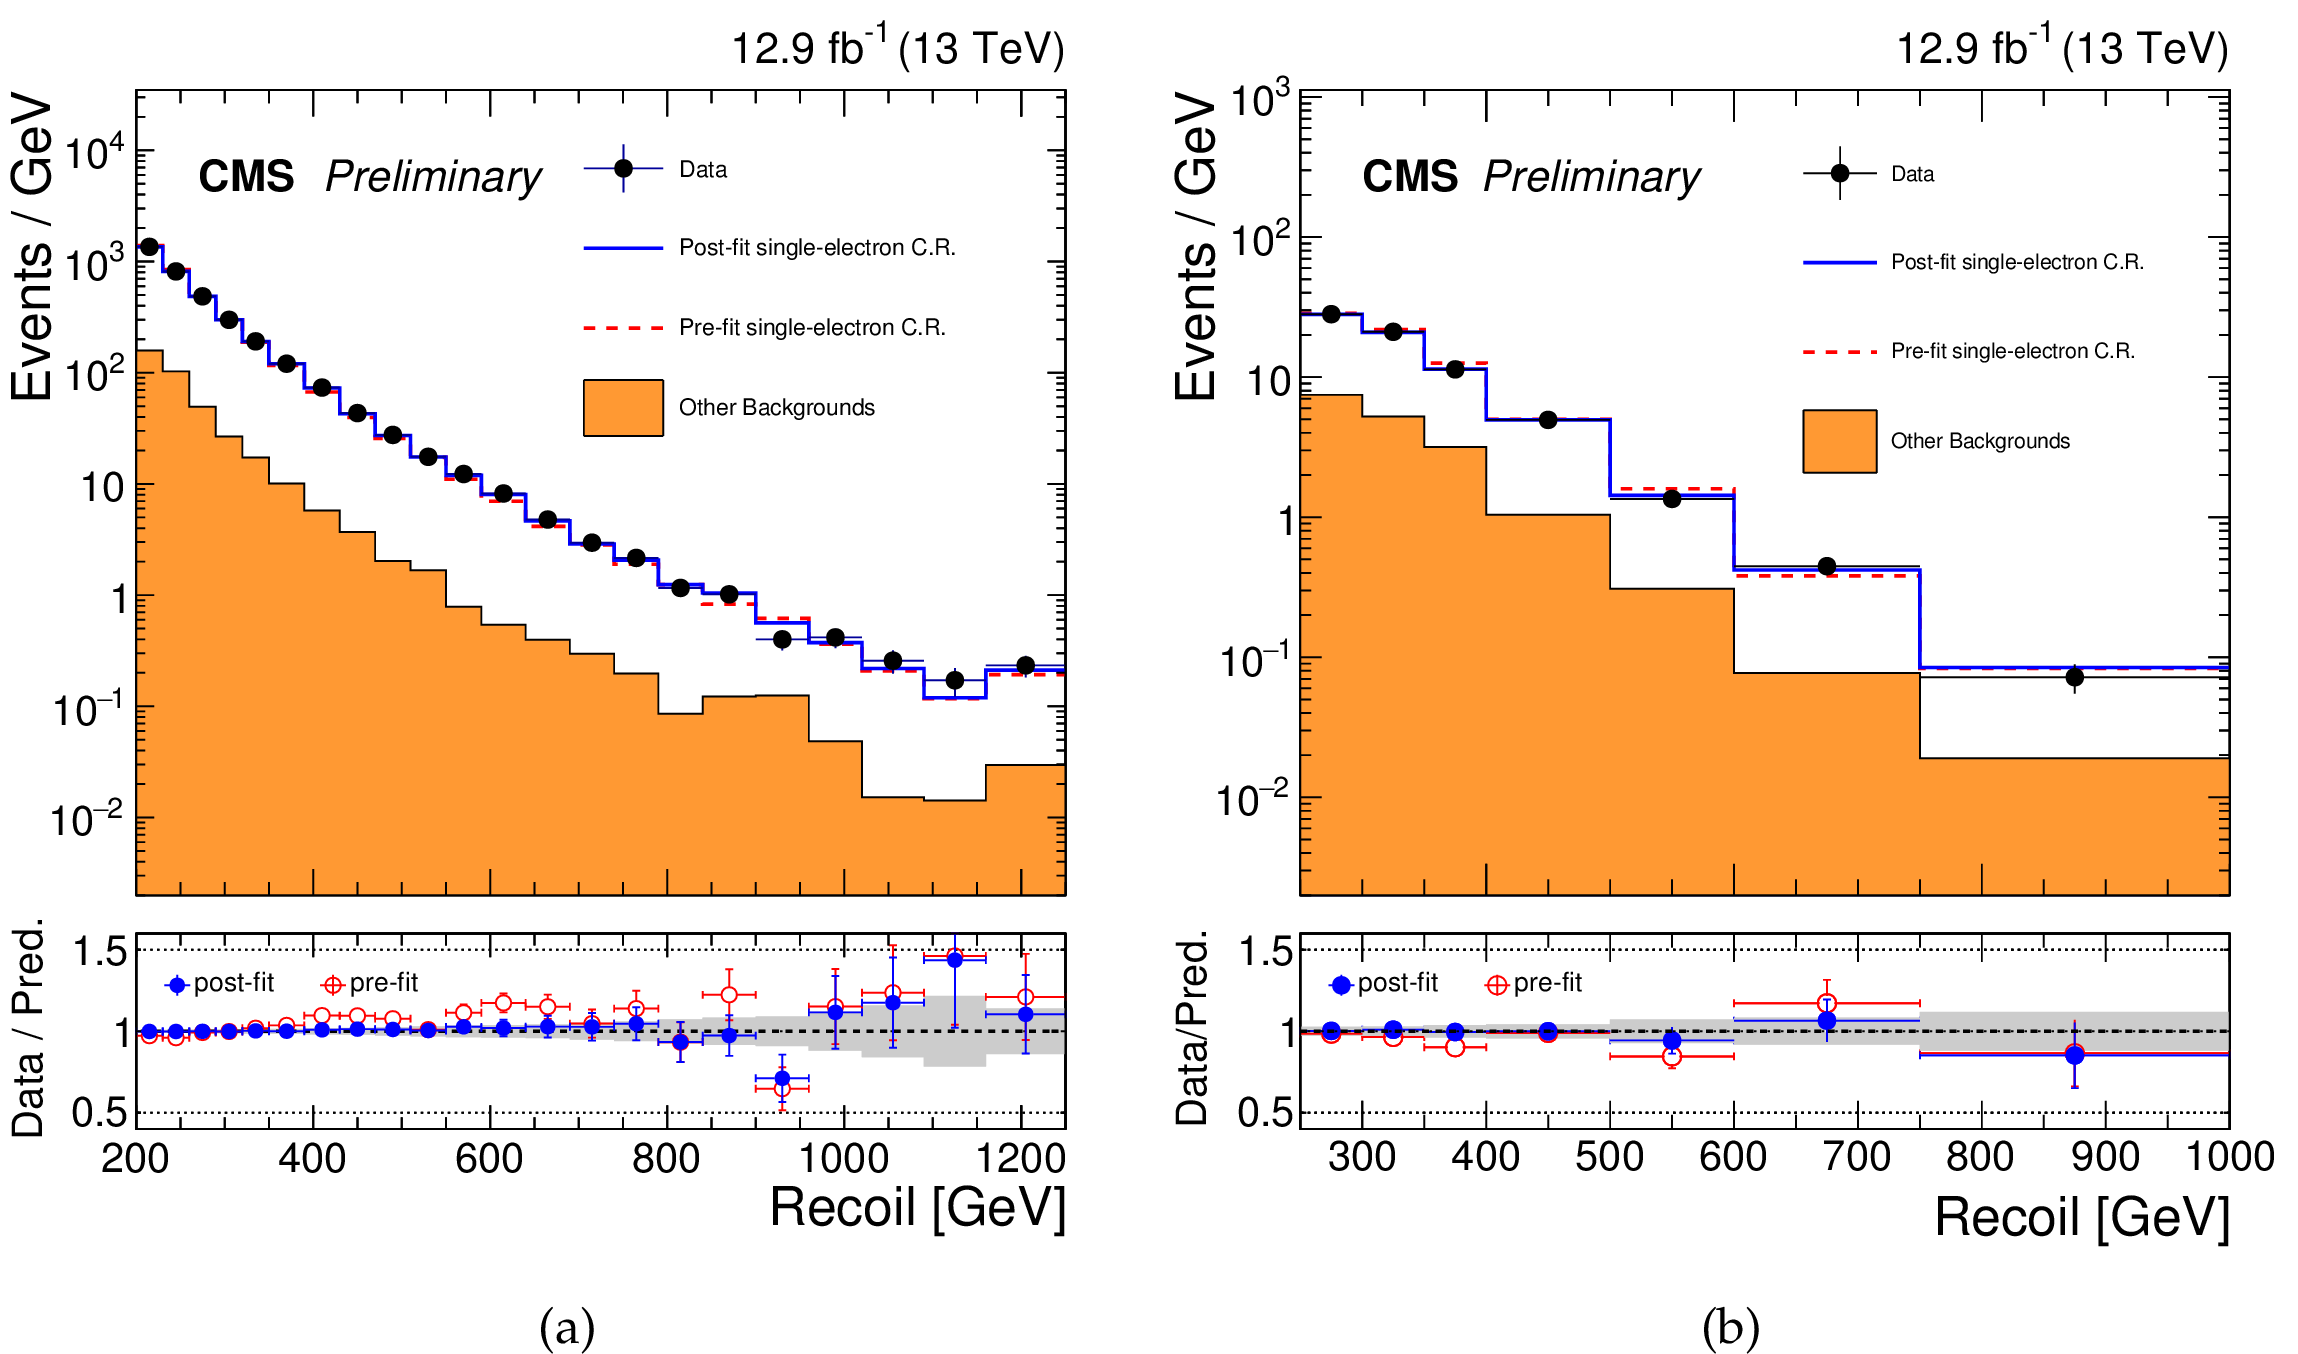
Figure 7:
Comparison between data and Monte Carlo simulation in the single-electron control region before and after performing the simultaneous fit across all the control regions and the signal region. Plot (a) corresponds to the monojet category and plot (b) corresponds to the mono-V category. The orange histogram corresponds to all processes other than $ \mathrm {W (e\nu )}$+jets. The gray band indicates the post-fit uncertainty after propagating all the systematic uncertainties to the fit. The last bin includes all events with ${E_{\mathrm {T}}^{\text {miss}}} > $ 1160 GeV in the monojet category and ${E_{\mathrm {T}}^{\text {miss}}} > $ 750 GeV in the mono-V category. |

png pdf |
Figure 7-a:
Comparison between data and Monte Carlo simulation in the single-electron control region before and after performing the simultaneous fit across all the control regions and the signal region. The plot corresponds to the monojet category. The orange histogram corresponds to all processes other than $ \mathrm {W (e\nu )}$+jets. The gray band indicates the post-fit uncertainty after propagating all the systematic uncertainties to the fit. The last bin includes all events with ${E_{\mathrm {T}}^{\text {miss}}} > $ 1160 GeV in the monojet category and ${E_{\mathrm {T}}^{\text {miss}}} > $ 750 GeV in the mono-V category. |

png pdf |
Figure 7-b:
Comparison between data and Monte Carlo simulation in the single-electron control region before and after performing the simultaneous fit across all the control regions and the signal region. The plot corresponds to the mono-V category. The orange histogram corresponds to all processes other than $ \mathrm {W (e\nu )}$+jets. The gray band indicates the post-fit uncertainty after propagating all the systematic uncertainties to the fit. The last bin includes all events with ${E_{\mathrm {T}}^{\text {miss}}} > $ 1160 GeV in the monojet category and ${E_{\mathrm {T}}^{\text {miss}}} > $ 750 GeV in the mono-V category. |
png pdf |
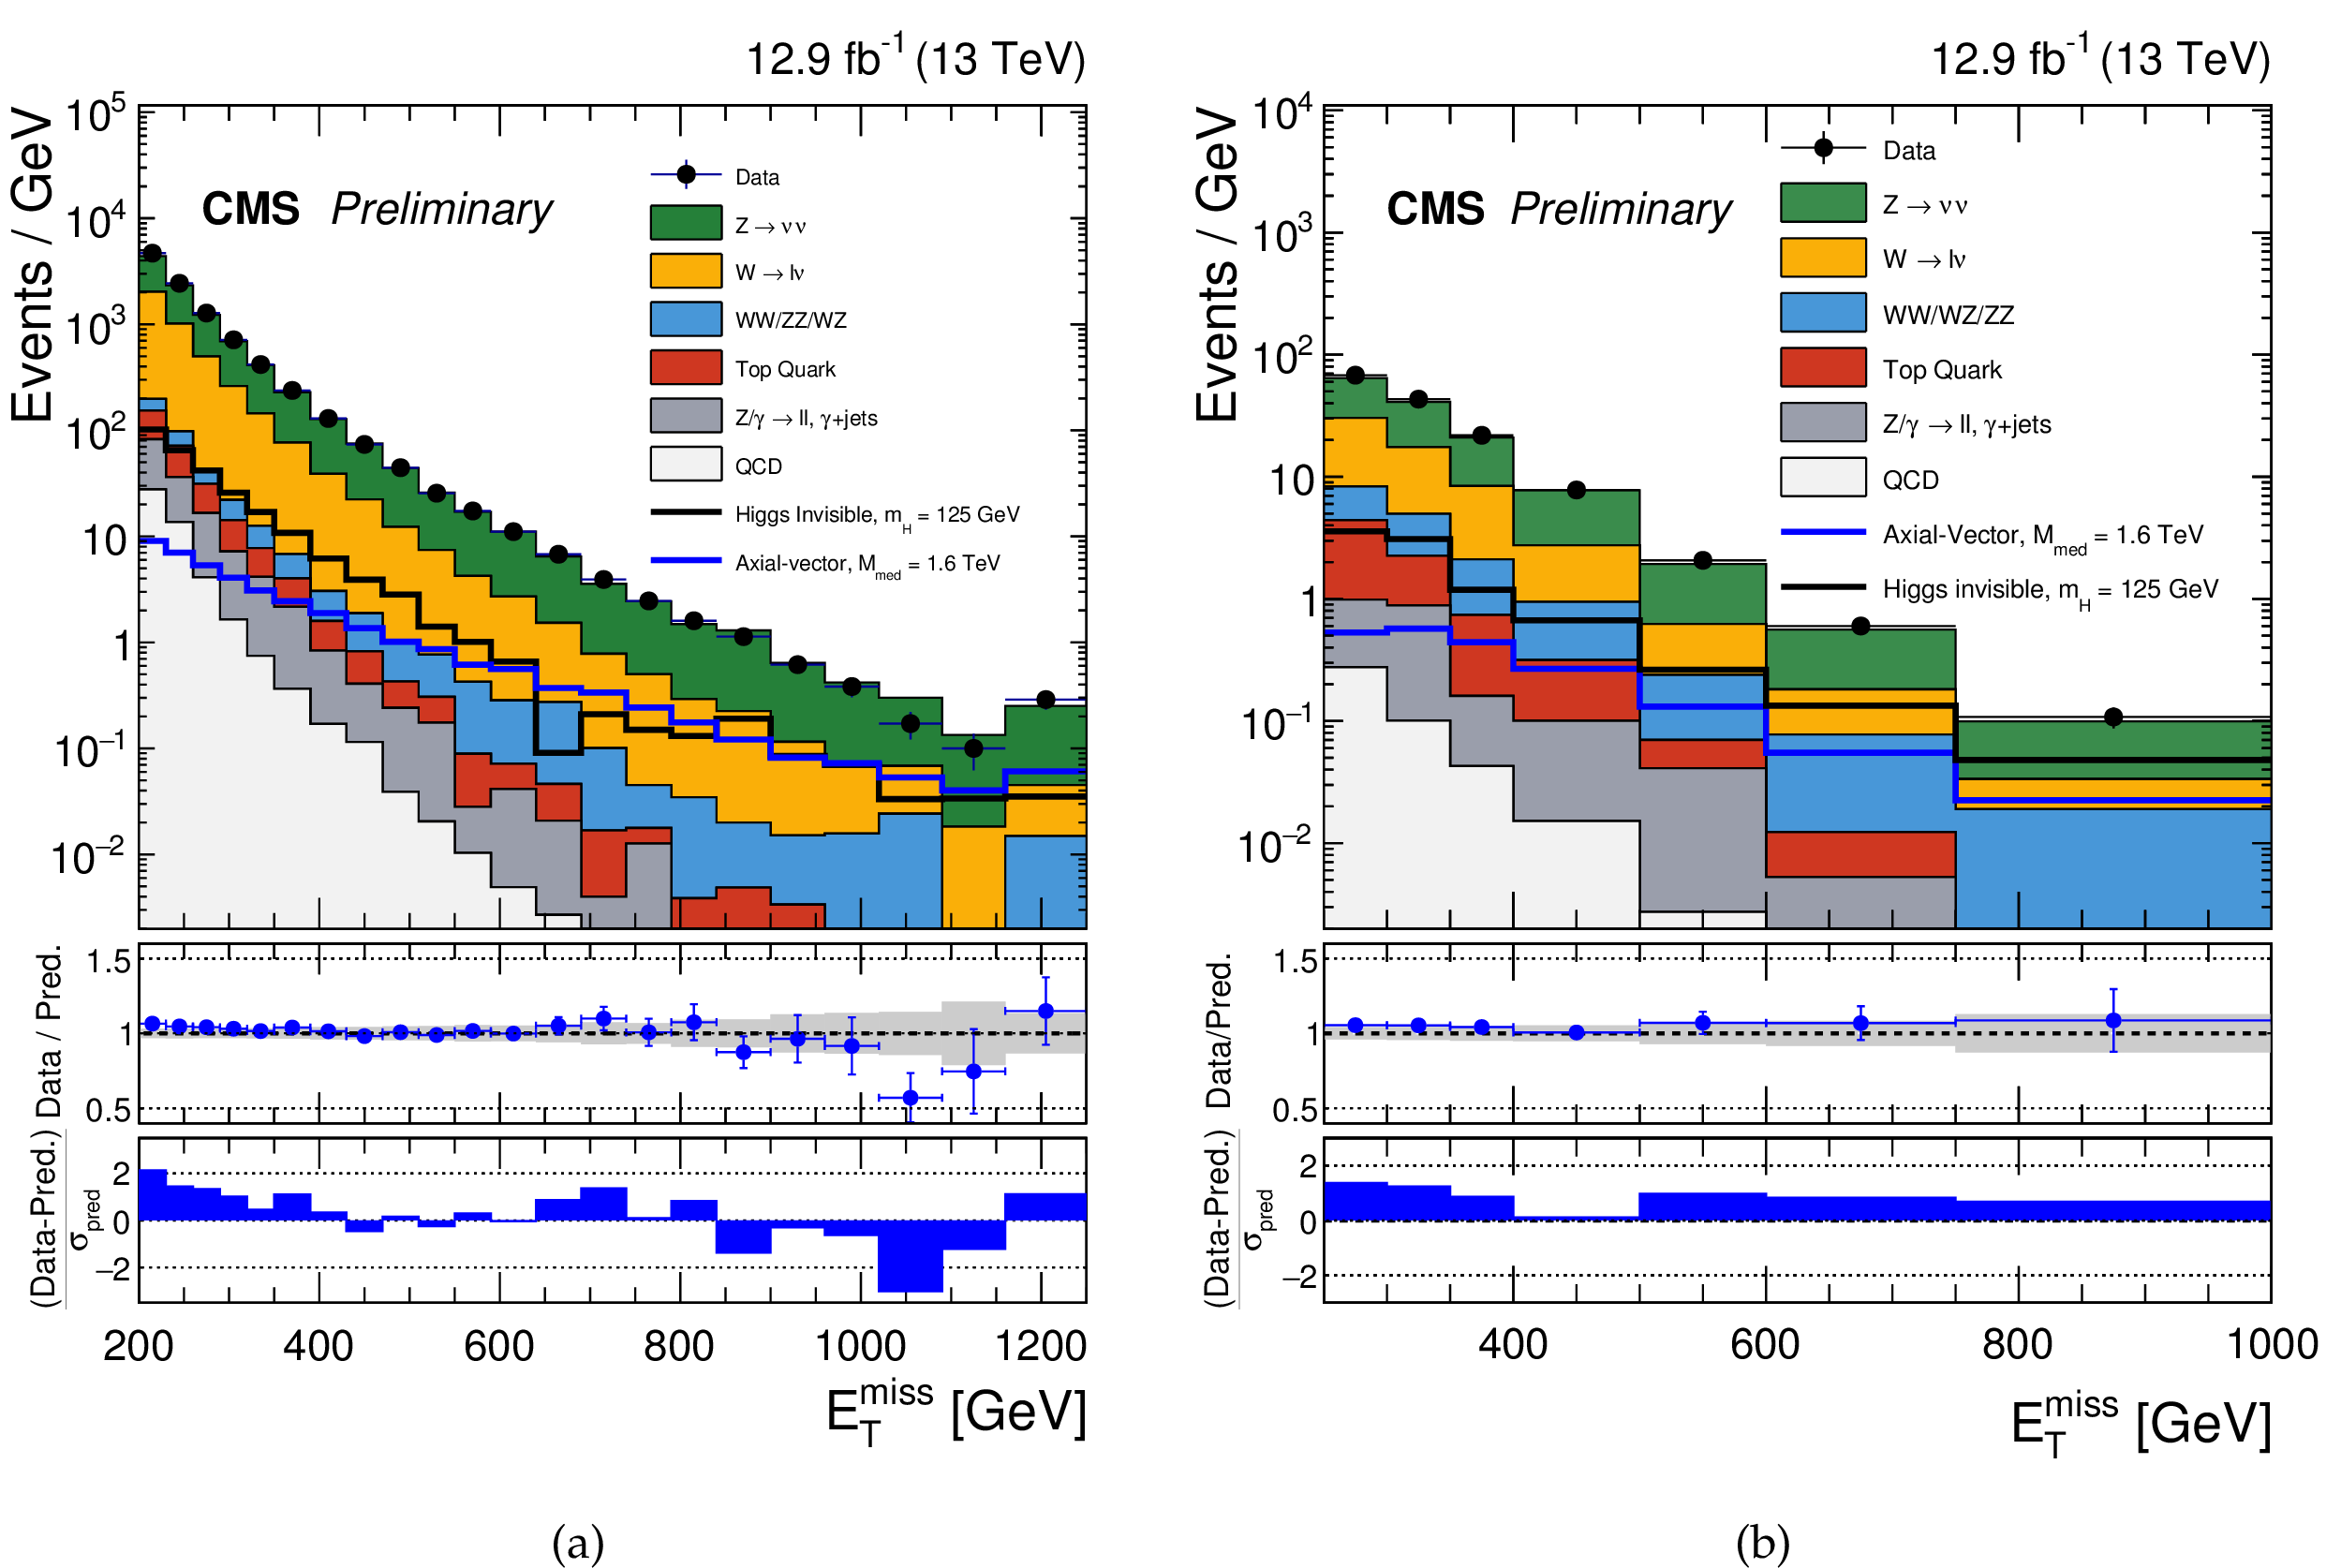
Figure 8:
Observed ${E_{\mathrm {T}}^{\text {miss}}}$ distribution in the monojet (a) and mono-V (b) signal regions compared with the post-fit background expectations for various SM processes. The last bin includes all events with ${E_{\mathrm {T}}^{\text {miss}}} > $ 1160 GeV for the monojet category and ${E_{\mathrm {T}}^{\text {miss}}} > $ 750 GeV for the mono-V category. The expected background distributions are evaluated after performing a combined fit to the data in all the control regions. Expected signal distributions from the 125 GeV Higgs boson decaying exclusively to invisible particles, and a 1.6 TeV axial-vector mediator decaying to 1 GeV dark matter particles, are overlaid. The ratio of data with the postfit background prediction is shown for both the monojet and mono-V signal regions. The gray bands in these ratio plots indicate the post-fit uncertainty on the background prediction. Finally, the distribution of the pulls, defined as the difference between data and the post-fit background prediction relative to the post-fit uncertainty on the prediction, are also added. |
png pdf |
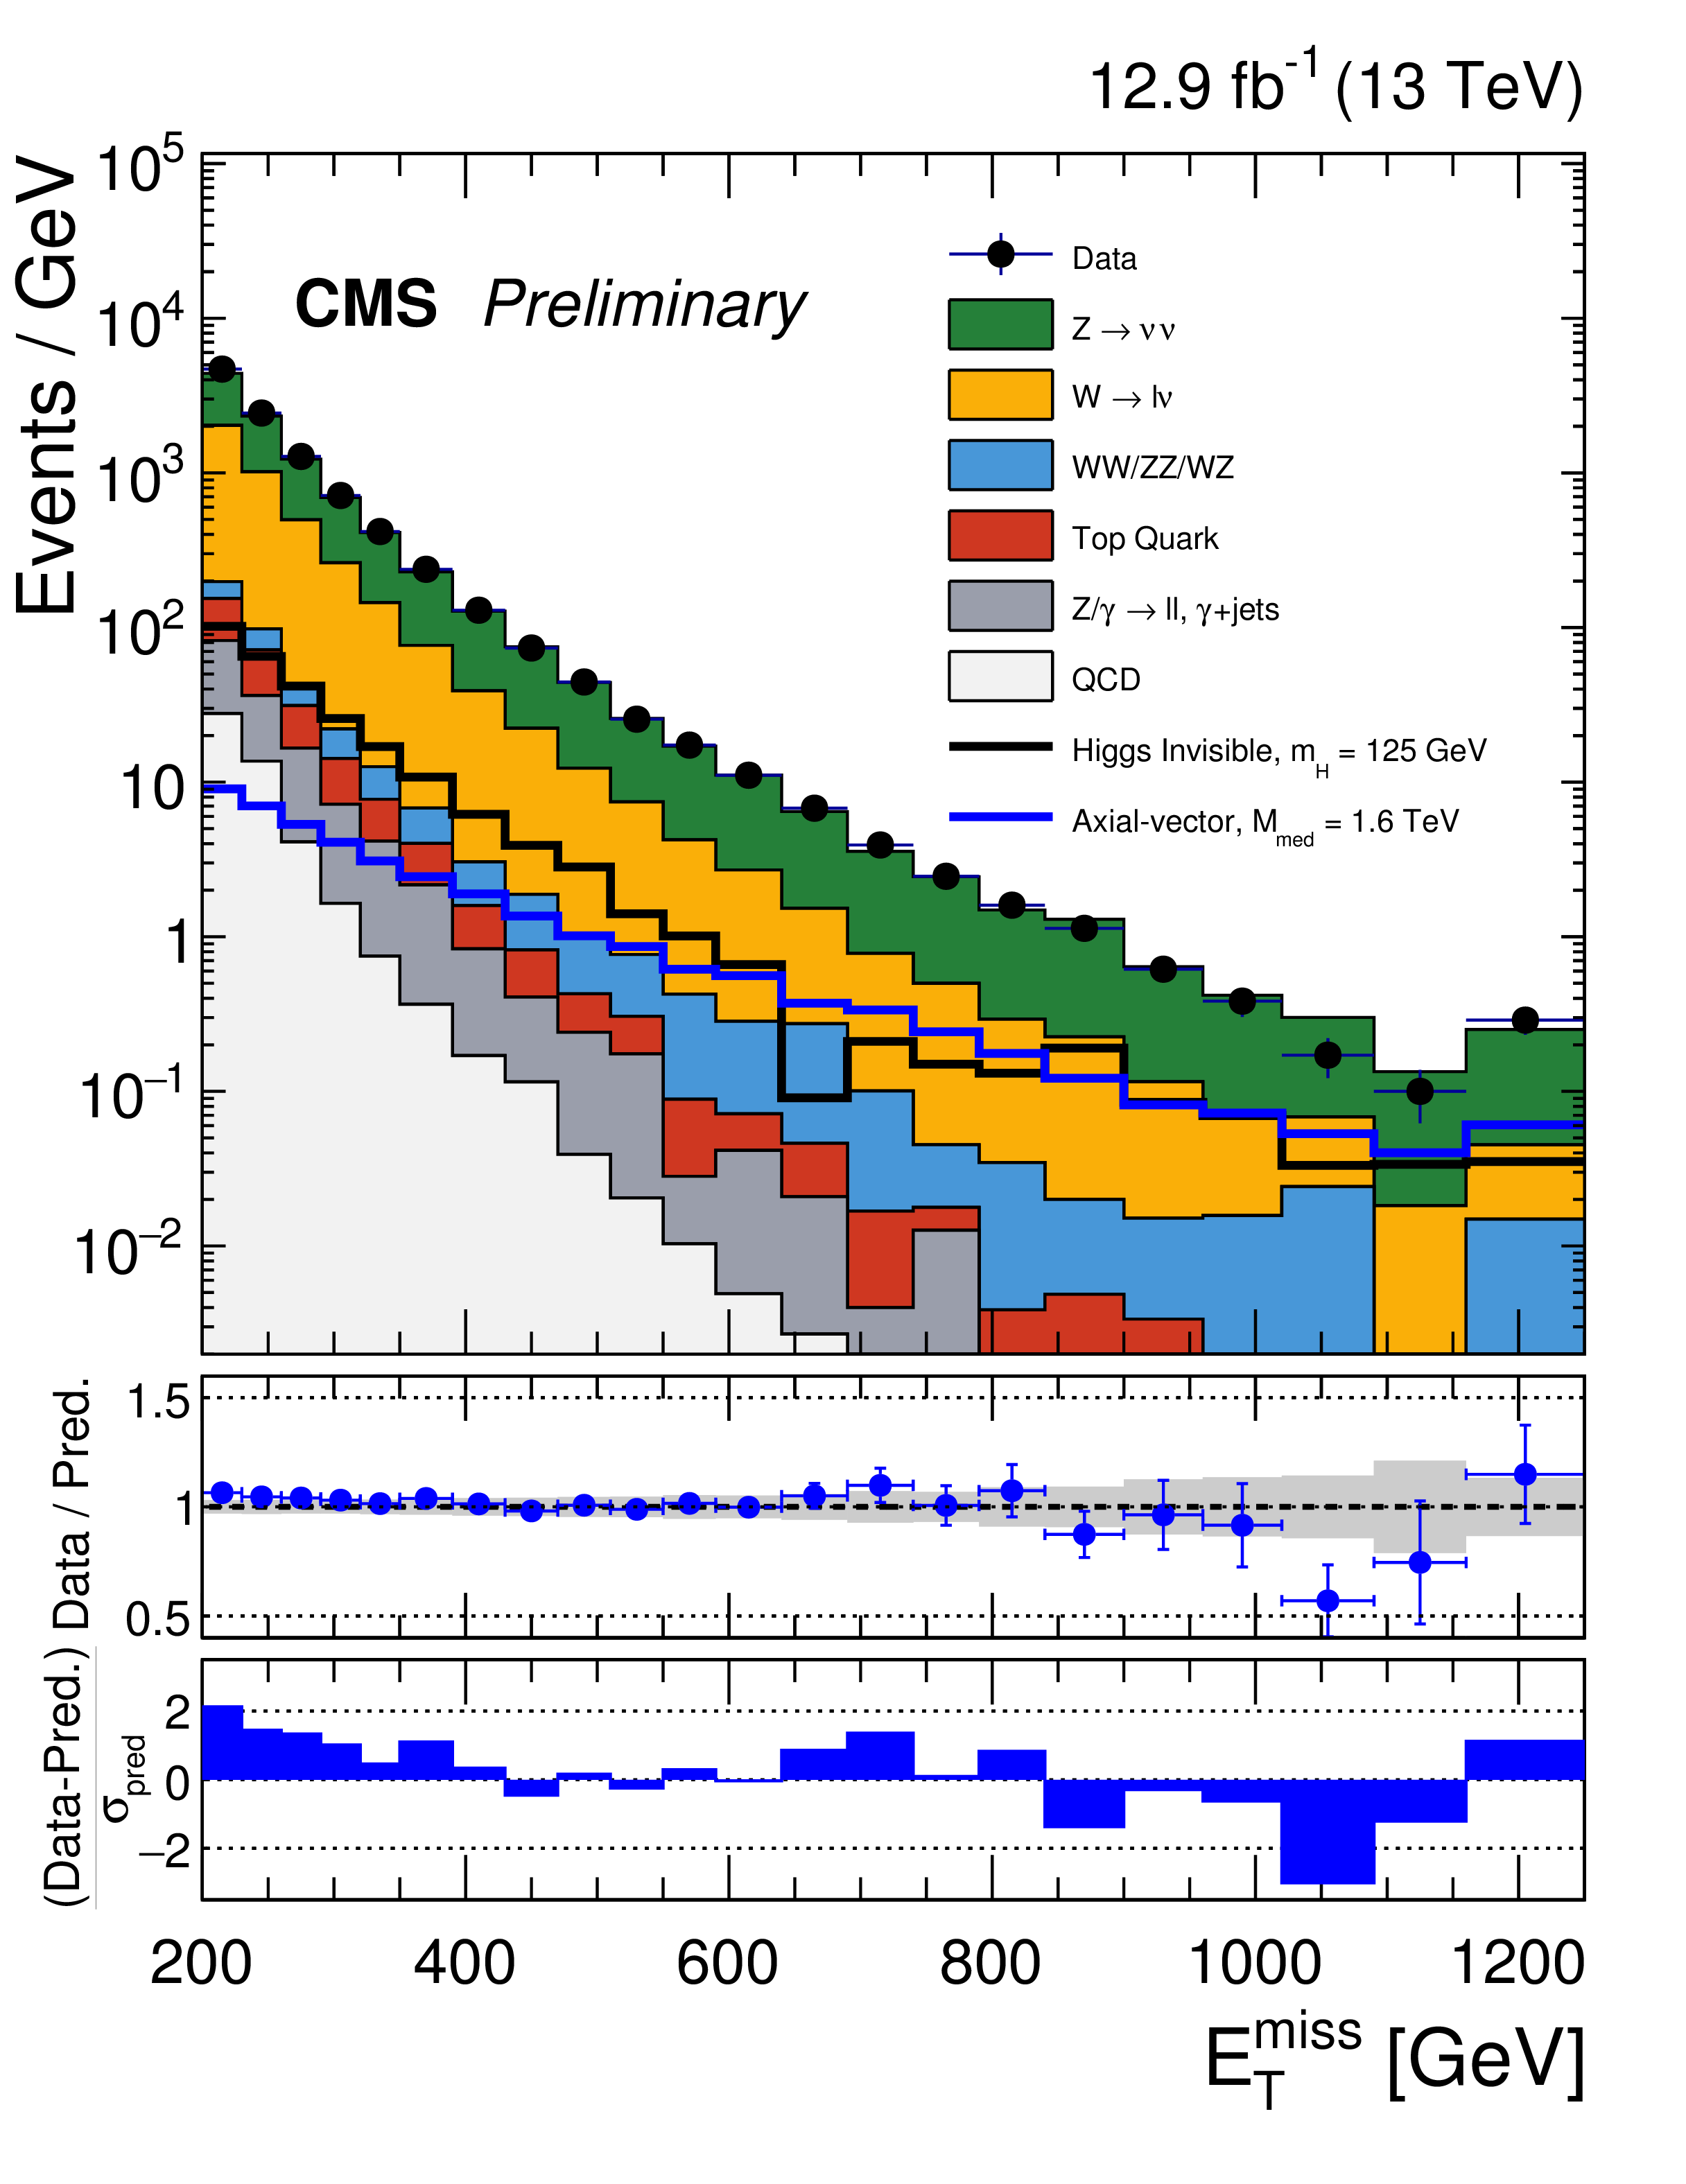
Figure 8-a:
Observed ${E_{\mathrm {T}}^{\text {miss}}}$ distribution in the monojet signal regions compared with the post-fit background expectations for various SM processes. The last bin includes all events with ${E_{\mathrm {T}}^{\text {miss}}} > $ 1160 GeV for the monojet category and ${E_{\mathrm {T}}^{\text {miss}}} > $ 750 GeV for the mono-V category. The expected background distributions are evaluated after performing a combined fit to the data in all the control regions. Expected signal distributions from the 125 GeV Higgs boson decaying exclusively to invisible particles, and a 1.6 TeV axial-vector mediator decaying to 1 GeV dark matter particles, are overlaid. The ratio of data with the postfit background prediction is shown for both the monojet and mono-V signal regions. The gray bands in these ratio plots indicate the post-fit uncertainty on the background prediction. Finally, the distribution of the pulls, defined as the difference between data and the post-fit background prediction relative to the post-fit uncertainty on the prediction, are also added. |

png pdf |
Figure 8-b:
Observed ${E_{\mathrm {T}}^{\text {miss}}}$ distribution in the mono-V signal regions compared with the post-fit background expectations for various SM processes. The last bin includes all events with ${E_{\mathrm {T}}^{\text {miss}}} > $ 1160 GeV for the monojet category and ${E_{\mathrm {T}}^{\text {miss}}} > $ 750 GeV for the mono-V category. The expected background distributions are evaluated after performing a combined fit to the data in all the control regions. Expected signal distributions from the 125 GeV Higgs boson decaying exclusively to invisible particles, and a 1.6 TeV axial-vector mediator decaying to 1 GeV dark matter particles, are overlaid. The ratio of data with the postfit background prediction is shown for both the monojet and mono-V signal regions. The gray bands in these ratio plots indicate the post-fit uncertainty on the background prediction. Finally, the distribution of the pulls, defined as the difference between data and the post-fit background prediction relative to the post-fit uncertainty on the prediction, are also added. |
png pdf |
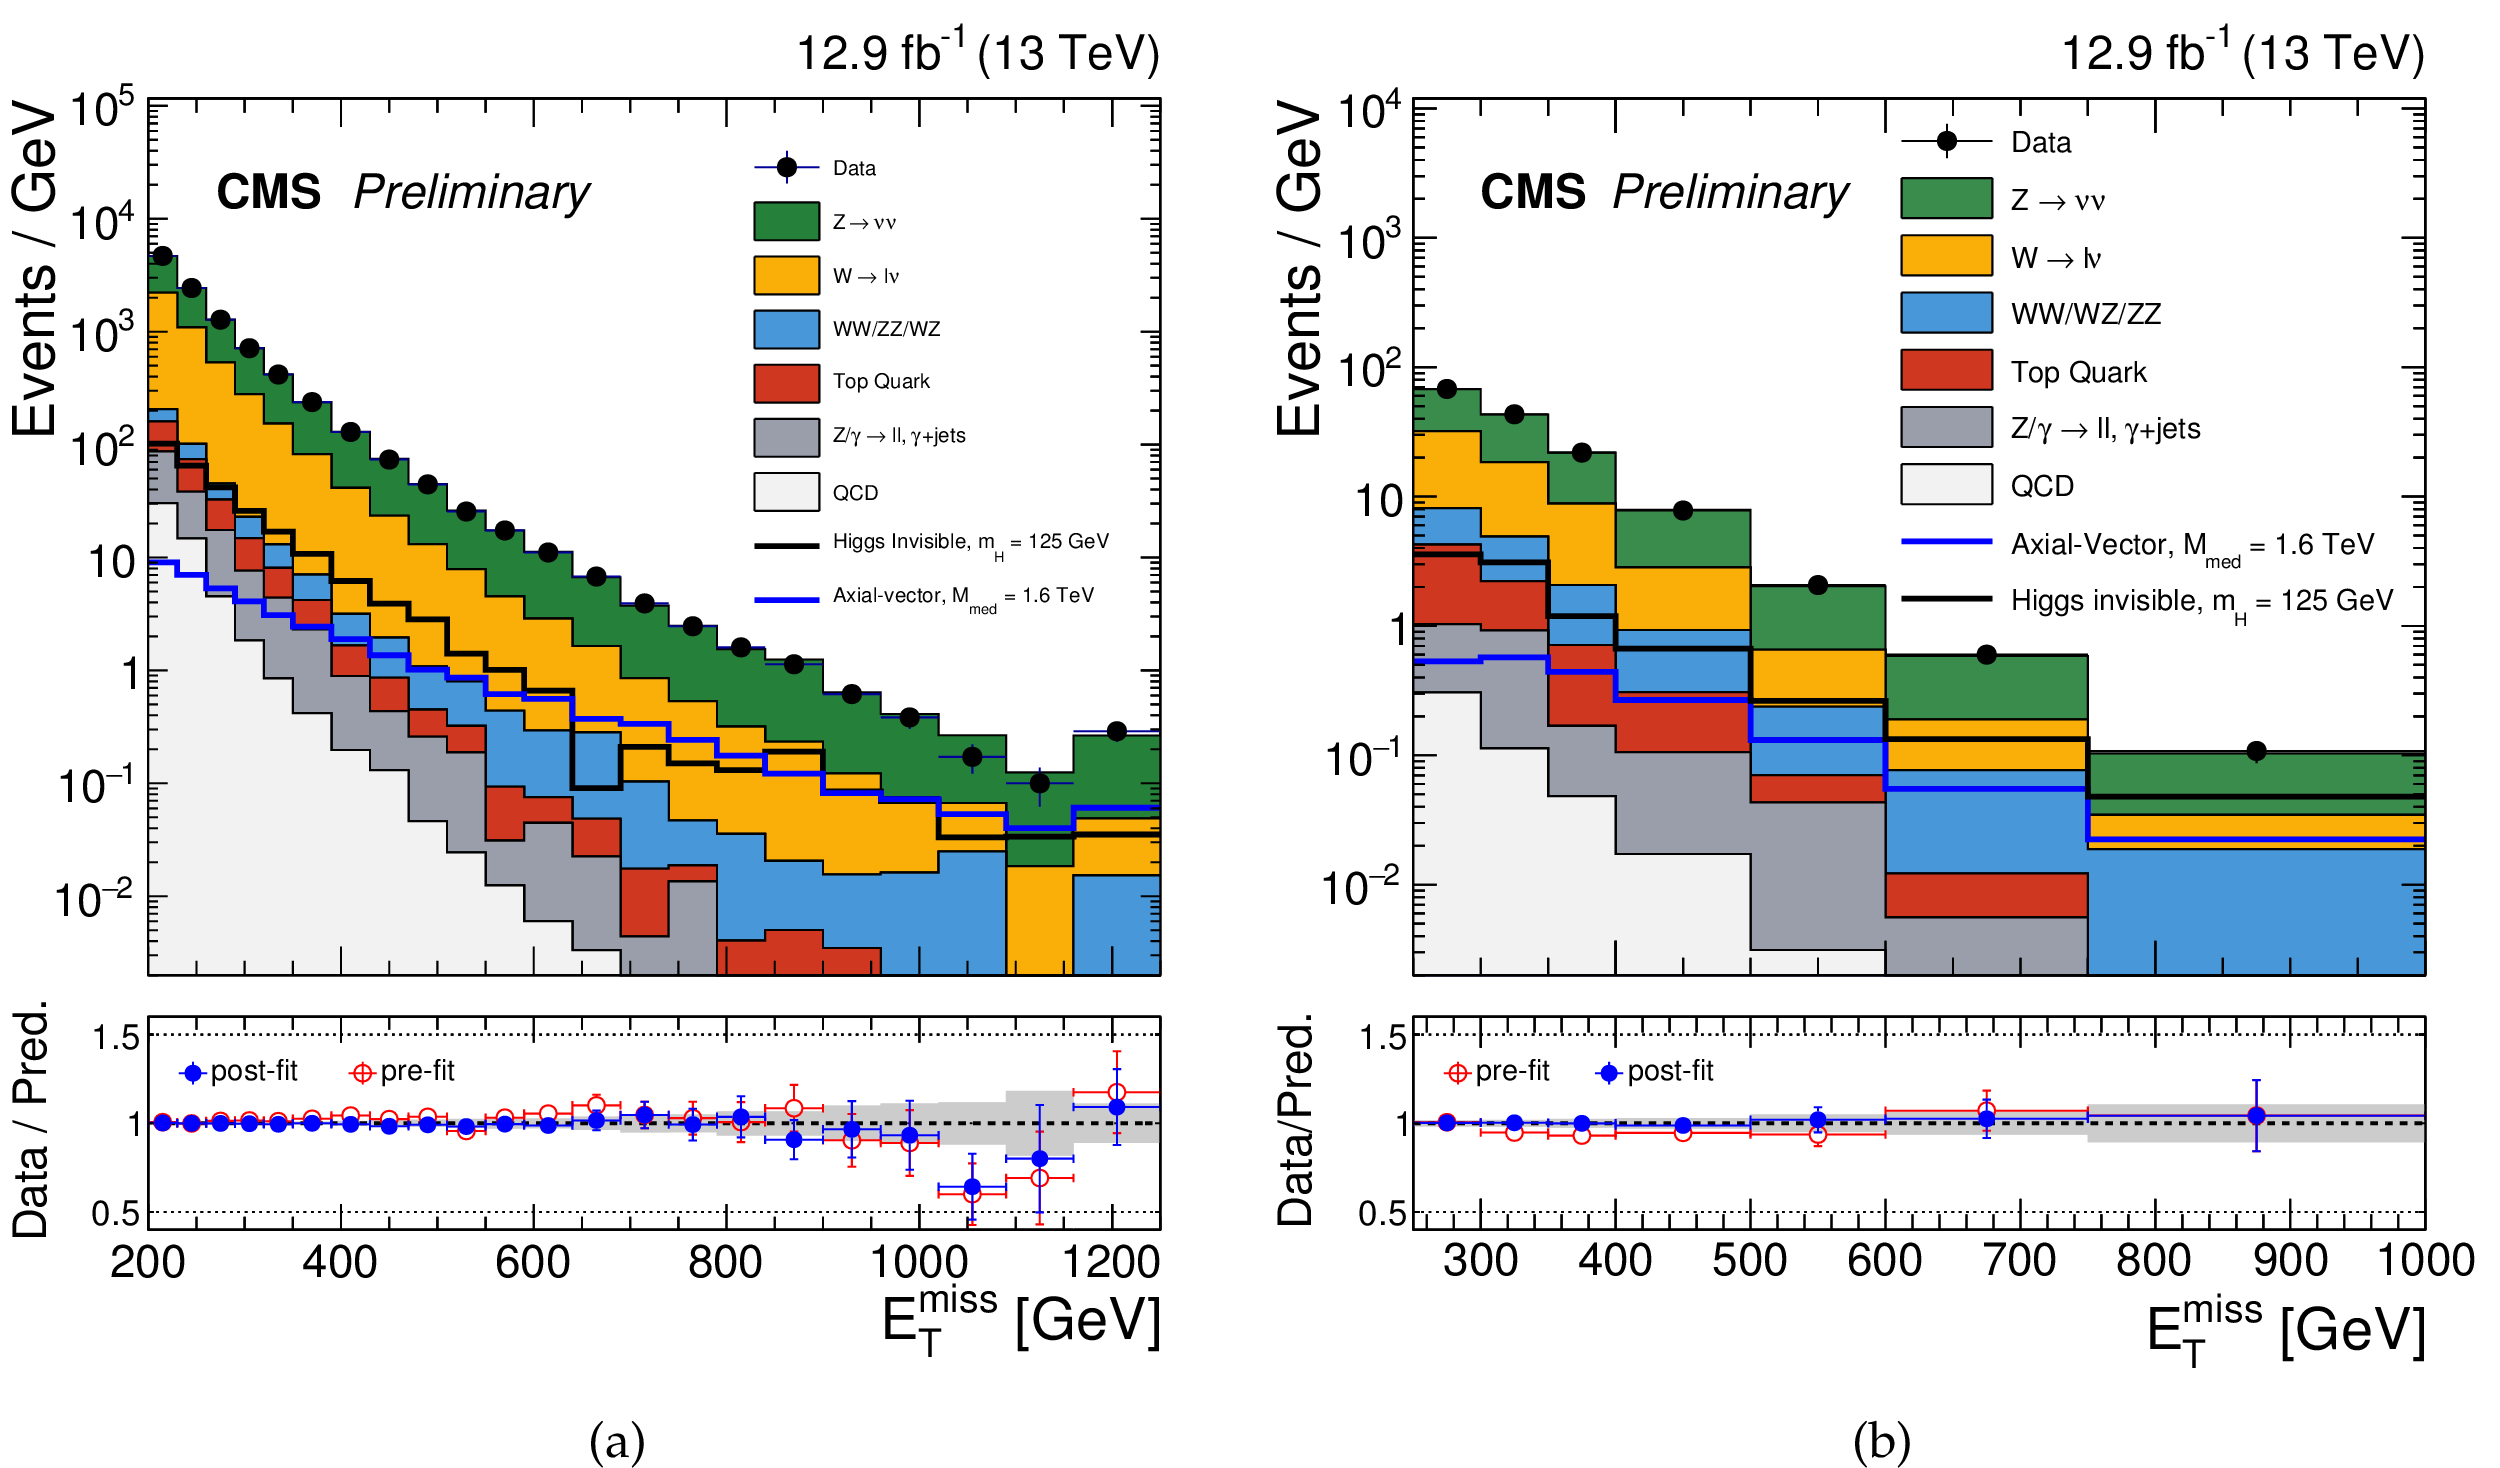
Figure 9:
Observed ${E_{\mathrm {T}}^{\text {miss}}}$ distribution in the monojet (a) and mono-V (b) signal regions compared with the post-fit background expectations for various SM processes. The last bin includes all events with ${E_{\mathrm {T}}^{\text {miss}}} > $ 1160 GeV for the monojet category and ${E_{\mathrm {T}}^{\text {miss}}} > $ 750 GeV for the mono-V category. The expected background distributions are evaluated after performing a combined fit to the data in all the control regions, as well as the signal region. The fit is performed assuming no dark matter signal in the signal region. Expected signal distributions from the 125 GeV Higgs boson decaying exclusively to invisible particles, and a 1.6 TeV axial-vector mediator decaying to 1 GeV dark matter particles, are overlaid. Ratios of data with the pre-fit background prediction (red points) and postfit background prediction (blue points) are shown for both the monojet and mono-V signal regions. The gray bands in these ratio plots indicate the post-fit uncertainty on the background prediction. |

png pdf |
Figure 9-a:
Observed ${E_{\mathrm {T}}^{\text {miss}}}$ distribution in the monojet signal regions compared with the post-fit background expectations for various SM processes. The last bin includes all events with ${E_{\mathrm {T}}^{\text {miss}}} > $ 1160 GeV for the monojet category and ${E_{\mathrm {T}}^{\text {miss}}} > $ 750 GeV for the mono-V category. The expected background distributions are evaluated after performing a combined fit to the data in all the control regions, as well as the signal region. The fit is performed assuming no dark matter signal in the signal region. Expected signal distributions from the 125 GeV Higgs boson decaying exclusively to invisible particles, and a 1.6 TeV axial-vector mediator decaying to 1 GeV dark matter particles, are overlaid. Ratios of data with the pre-fit background prediction (red points) and postfit background prediction (blue points) are shown for both the monojet and mono-V signal regions. The gray bands in these ratio plots indicate the post-fit uncertainty on the background prediction. |

png pdf |
Figure 9-b:
Observed ${E_{\mathrm {T}}^{\text {miss}}}$ distribution in the mono-V signal regions compared with the post-fit background expectations for various SM processes. The last bin includes all events with ${E_{\mathrm {T}}^{\text {miss}}} > $ 1160 GeV for the monojet category and ${E_{\mathrm {T}}^{\text {miss}}} > $ 750 GeV for the mono-V category. The expected background distributions are evaluated after performing a combined fit to the data in all the control regions, as well as the signal region. The fit is performed assuming no dark matter signal in the signal region. Expected signal distributions from the 125 GeV Higgs boson decaying exclusively to invisible particles, and a 1.6 TeV axial-vector mediator decaying to 1 GeV dark matter particles, are overlaid. Ratios of data with the pre-fit background prediction (red points) and postfit background prediction (blue points) are shown for both the monojet and mono-V signal regions. The gray bands in these ratio plots indicate the post-fit uncertainty on the background prediction. |
png pdf |
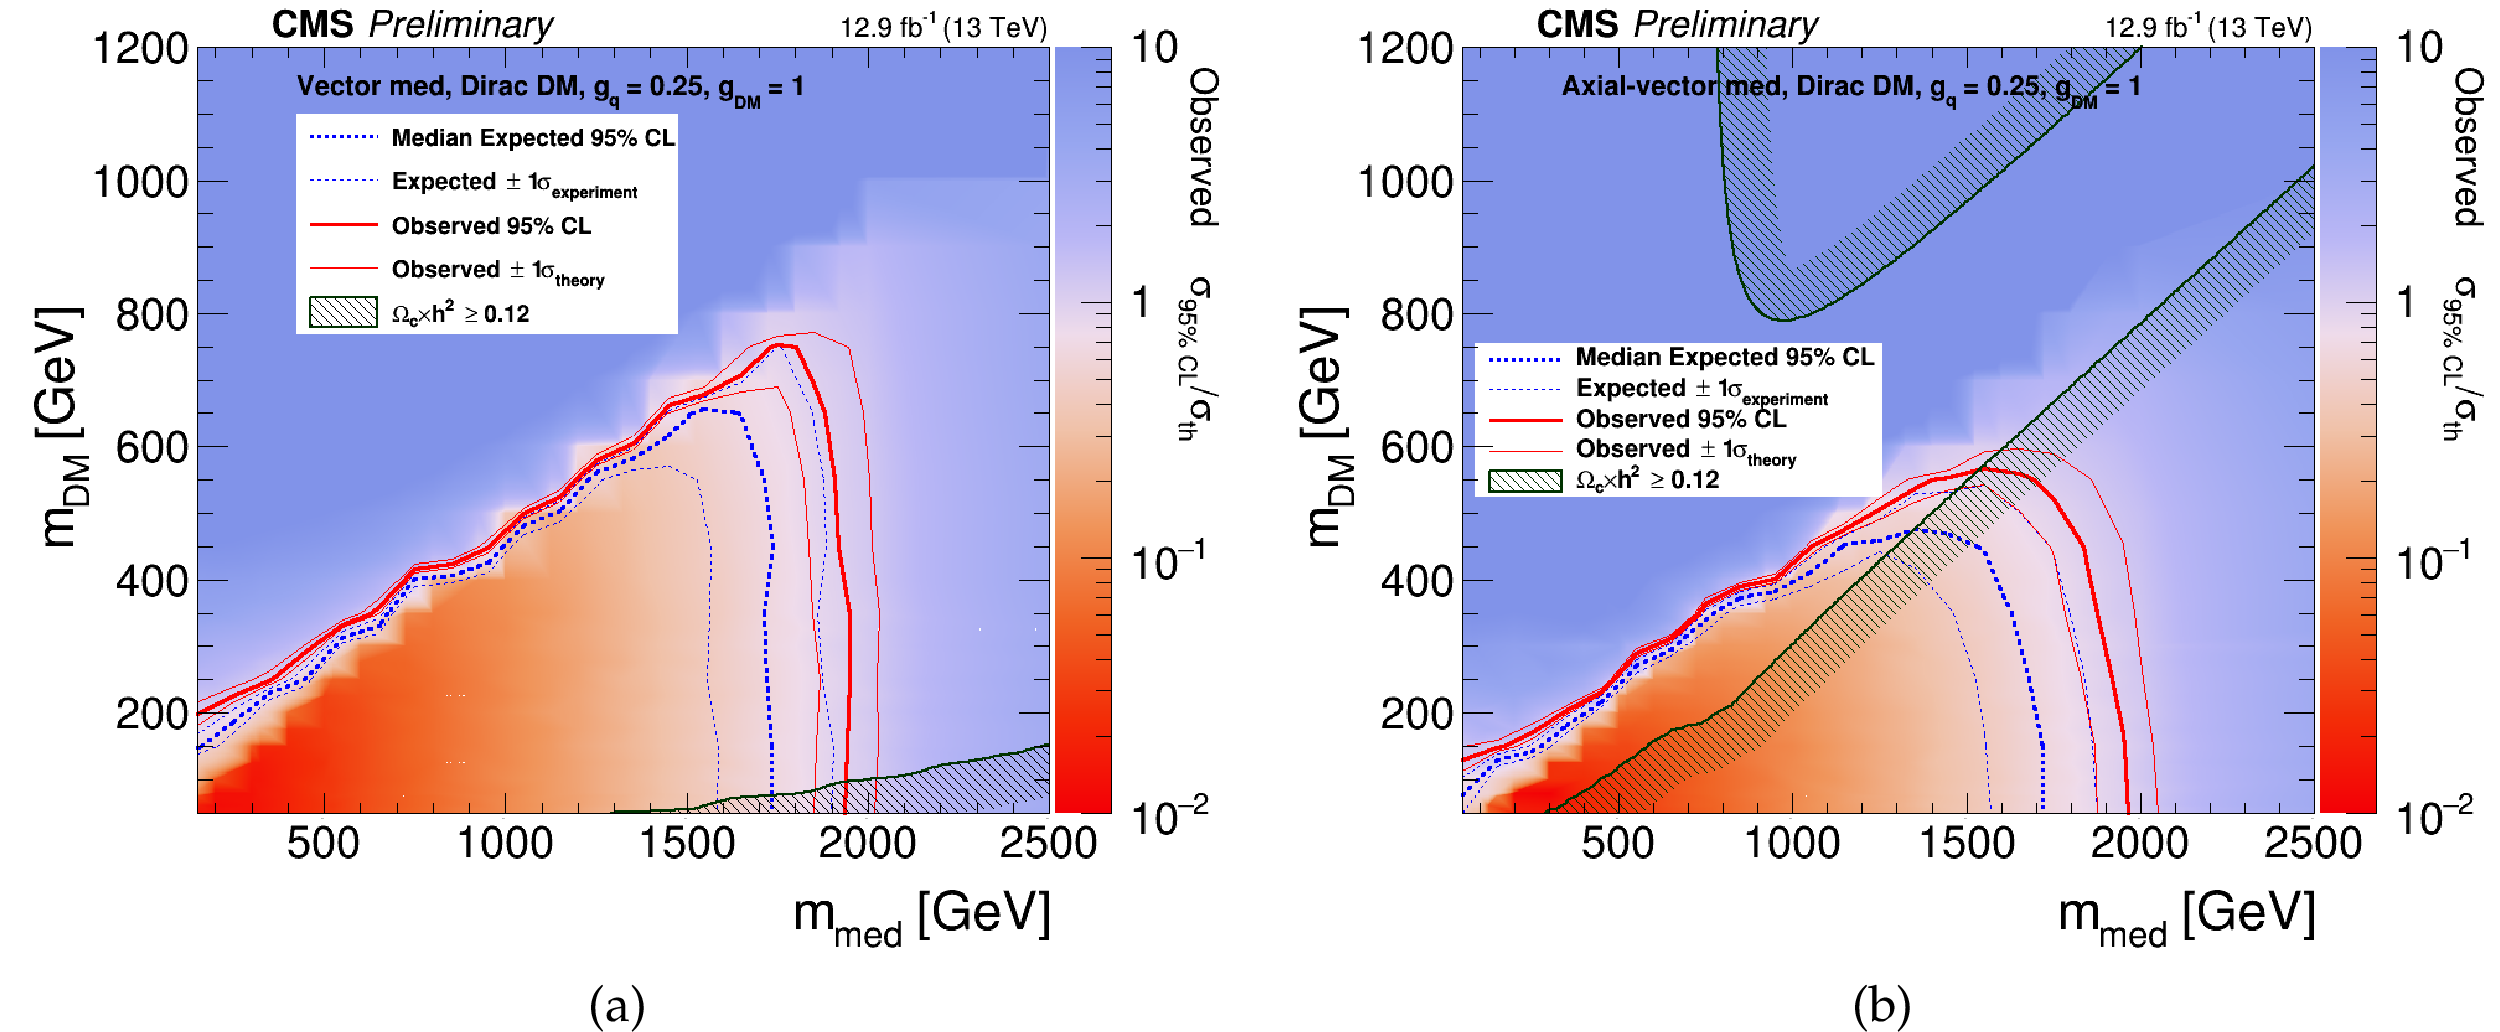
Figure 10:
Exclusion limits at 95% CL on the $\mu =\sigma /\sigma _{\textrm {th}}$ in the $m_{\textrm {med}}$-$m_{\textrm {DM}}$ plane assuming vector (a) and axial-vector (b) mediators. The solid (dotted) red (blue) line shows the contour for the observed (expected) exclusion. The solid contours around the observed limit and the dashed contours around the expected limit represent one standard deviation due theoretical uncertainties in the signal cross section and the combination of the statistical and experimental systematic uncertainties, respectively. Cosmological constraints from the WMAP and Planck experiments [74,78] are shown with the dark green line. |
png |
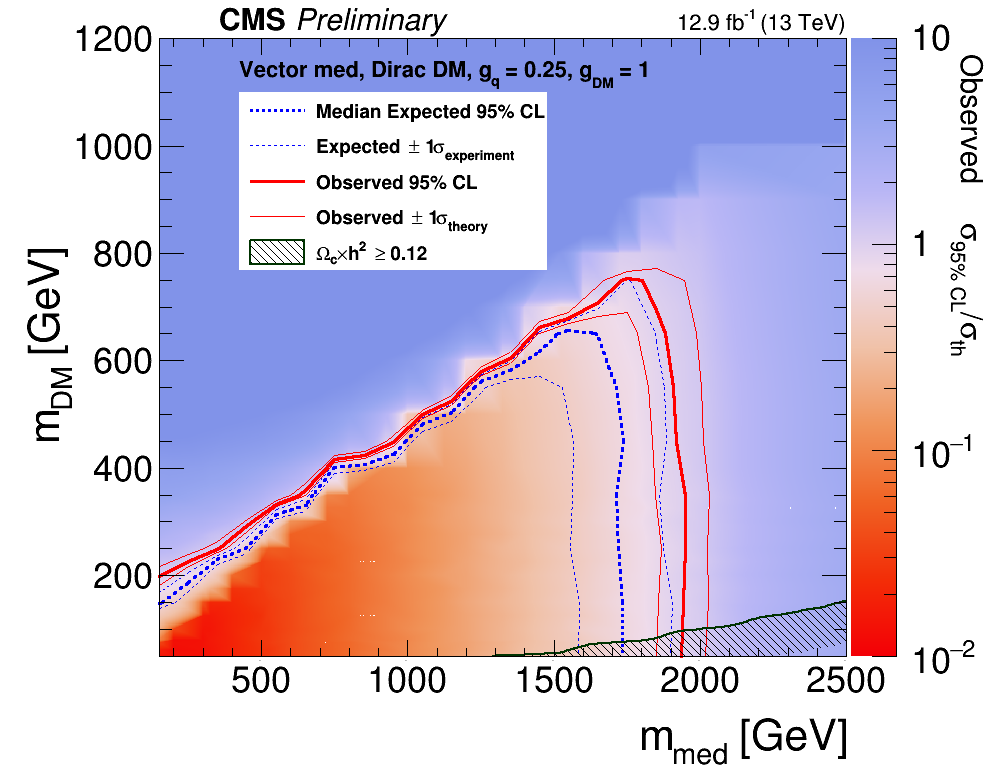
Figure 10-a:
Exclusion limits at 95% CL on the $\mu =\sigma /\sigma _{\textrm {th}}$ in the $m_{\textrm {med}}$-$m_{\textrm {DM}}$ plane assuming a vector mediator. The solid (dotted) red (blue) line shows the contour for the observed (expected) exclusion. The solid contours around the observed limit and the dashed contours around the expected limit represent one standard deviation due theoretical uncertainties in the signal cross section and the combination of the statistical and experimental systematic uncertainties, respectively. Cosmological constraints from the WMAP and Planck experiments [74,78] are shown with the dark green line. |
png |
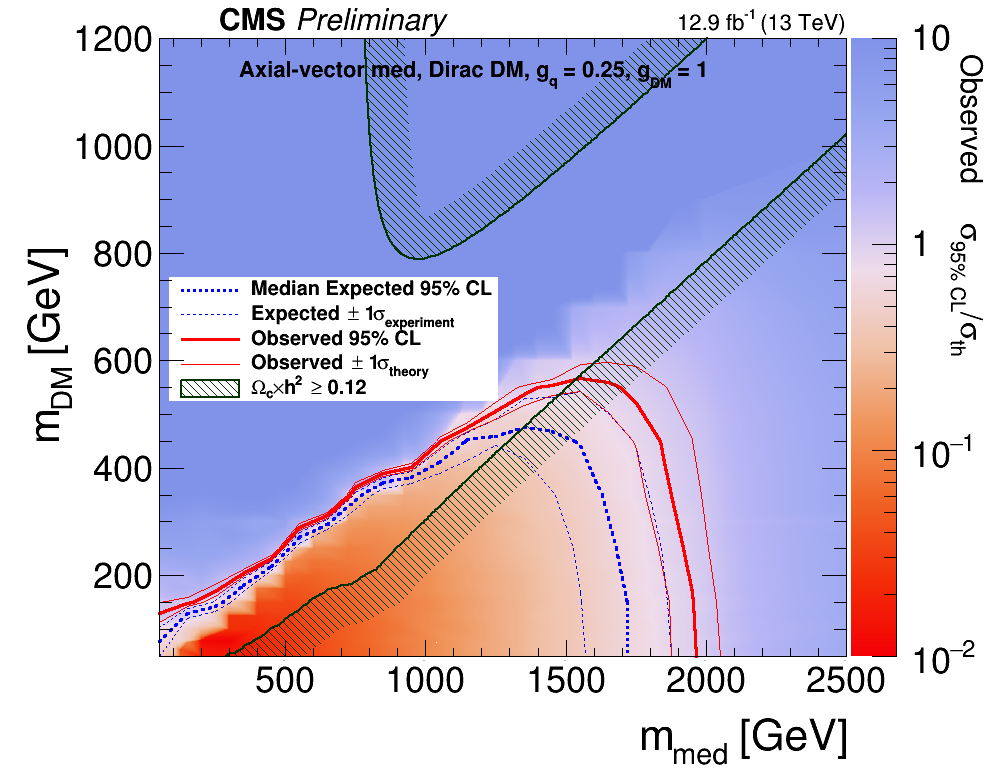
Figure 10-b:
Exclusion limits at 95% CL on the $\mu =\sigma /\sigma _{\textrm {th}}$ in the $m_{\textrm {med}}$-$m_{\textrm {DM}}$ plane assuming an axial-vector mediator. The solid (dotted) red (blue) line shows the contour for the observed (expected) exclusion. The solid contours around the observed limit and the dashed contours around the expected limit represent one standard deviation due theoretical uncertainties in the signal cross section and the combination of the statistical and experimental systematic uncertainties, respectively. Cosmological constraints from the WMAP and Planck experiments [74,78] are shown with the dark green line. |

png pdf |
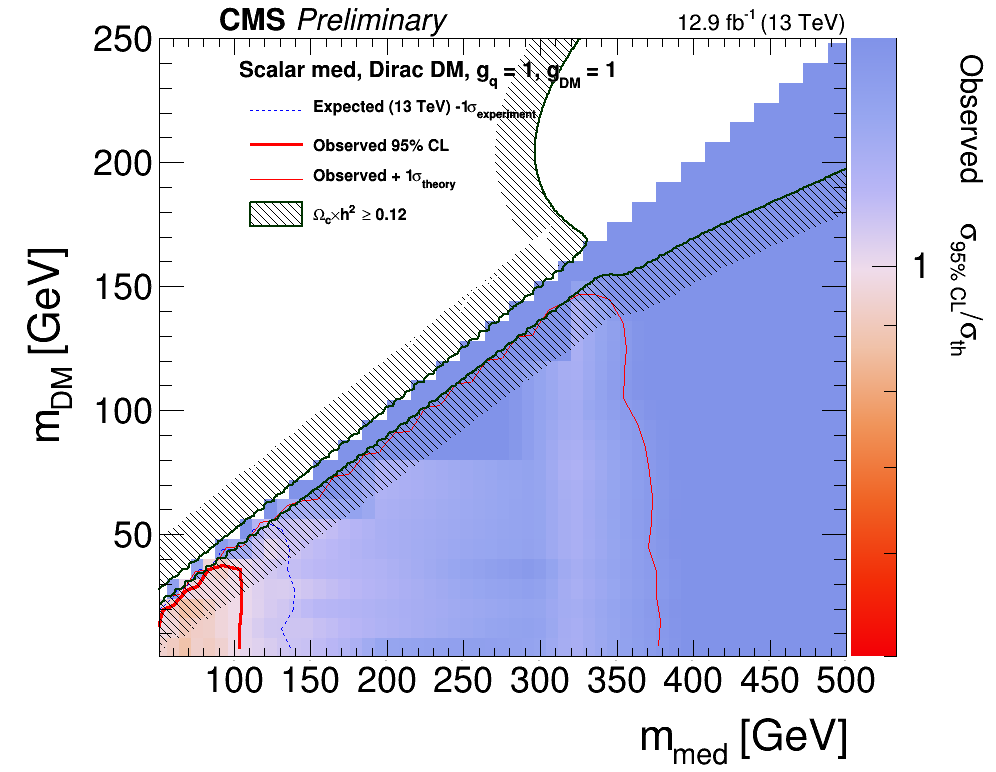
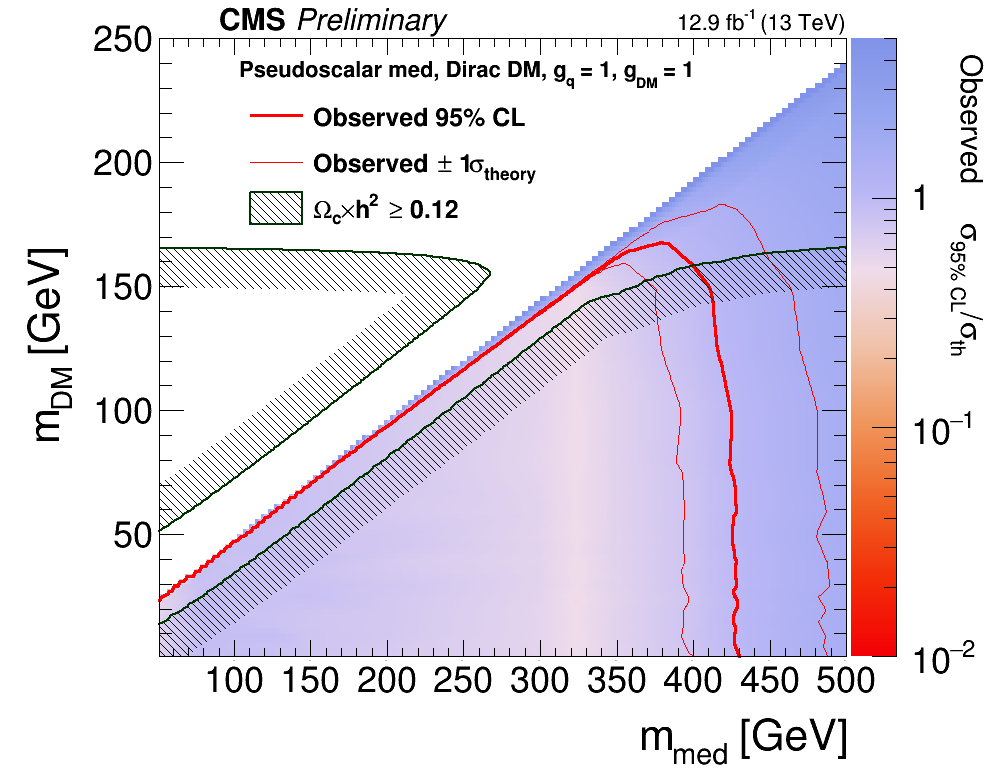
Figure 11:
Exclusion limits at 95% CL on the $\mu =\sigma /\sigma _{\textrm {th}}$ in the $m_{\textrm {med}}$-$m_{\textrm {DM}}$ plane assuming scalar (a) and pseudoscalar (b) mediators. The red line shows the contour for the observed exclusion. The solid red contours around the observed limit represent one standard deviation due theoretical uncertainties in the signal cross section. The dashed blue contour in the case of the scalar mediator shows the -1$\sigma $ deviation due to the combination of the statistical and experimental systematic uncertainties. Cosmological constraints from the WMAP and Planck experiments [74,78] are shown with the dark green line. |
png |
Figure 11-a:
Exclusion limits at 95% CL on the $\mu =\sigma /\sigma _{\textrm {th}}$ in the $m_{\textrm {med}}$-$m_{\textrm {DM}}$ plane assuming a scalar mediator. The red line shows the contour for the observed exclusion. The solid red contours around the observed limit represent one standard deviation due theoretical uncertainties in the signal cross section. The dashed blue contour in the case of the scalar mediator shows the -1$\sigma $ deviation due to the combination of the statistical and experimental systematic uncertainties. Cosmological constraints from the WMAP and Planck experiments [74,78] are shown with the dark green line. |
png |
Figure 11-b:
Exclusion limits at 95% CL on the $\mu =\sigma /\sigma _{\textrm {th}}$ in the $m_{\textrm {med}}$-$m_{\textrm {DM}}$ plane assuming a pseudoscalar mediator. The red line shows the contour for the observed exclusion. The solid red contours around the observed limit represent one standard deviation due theoretical uncertainties in the signal cross section. The dashed blue contour in the case of the scalar mediator shows the -1$\sigma $ deviation due to the combination of the statistical and experimental systematic uncertainties. Cosmological constraints from the WMAP and Planck experiments [74,78] are shown with the dark green line. |

png pdf |
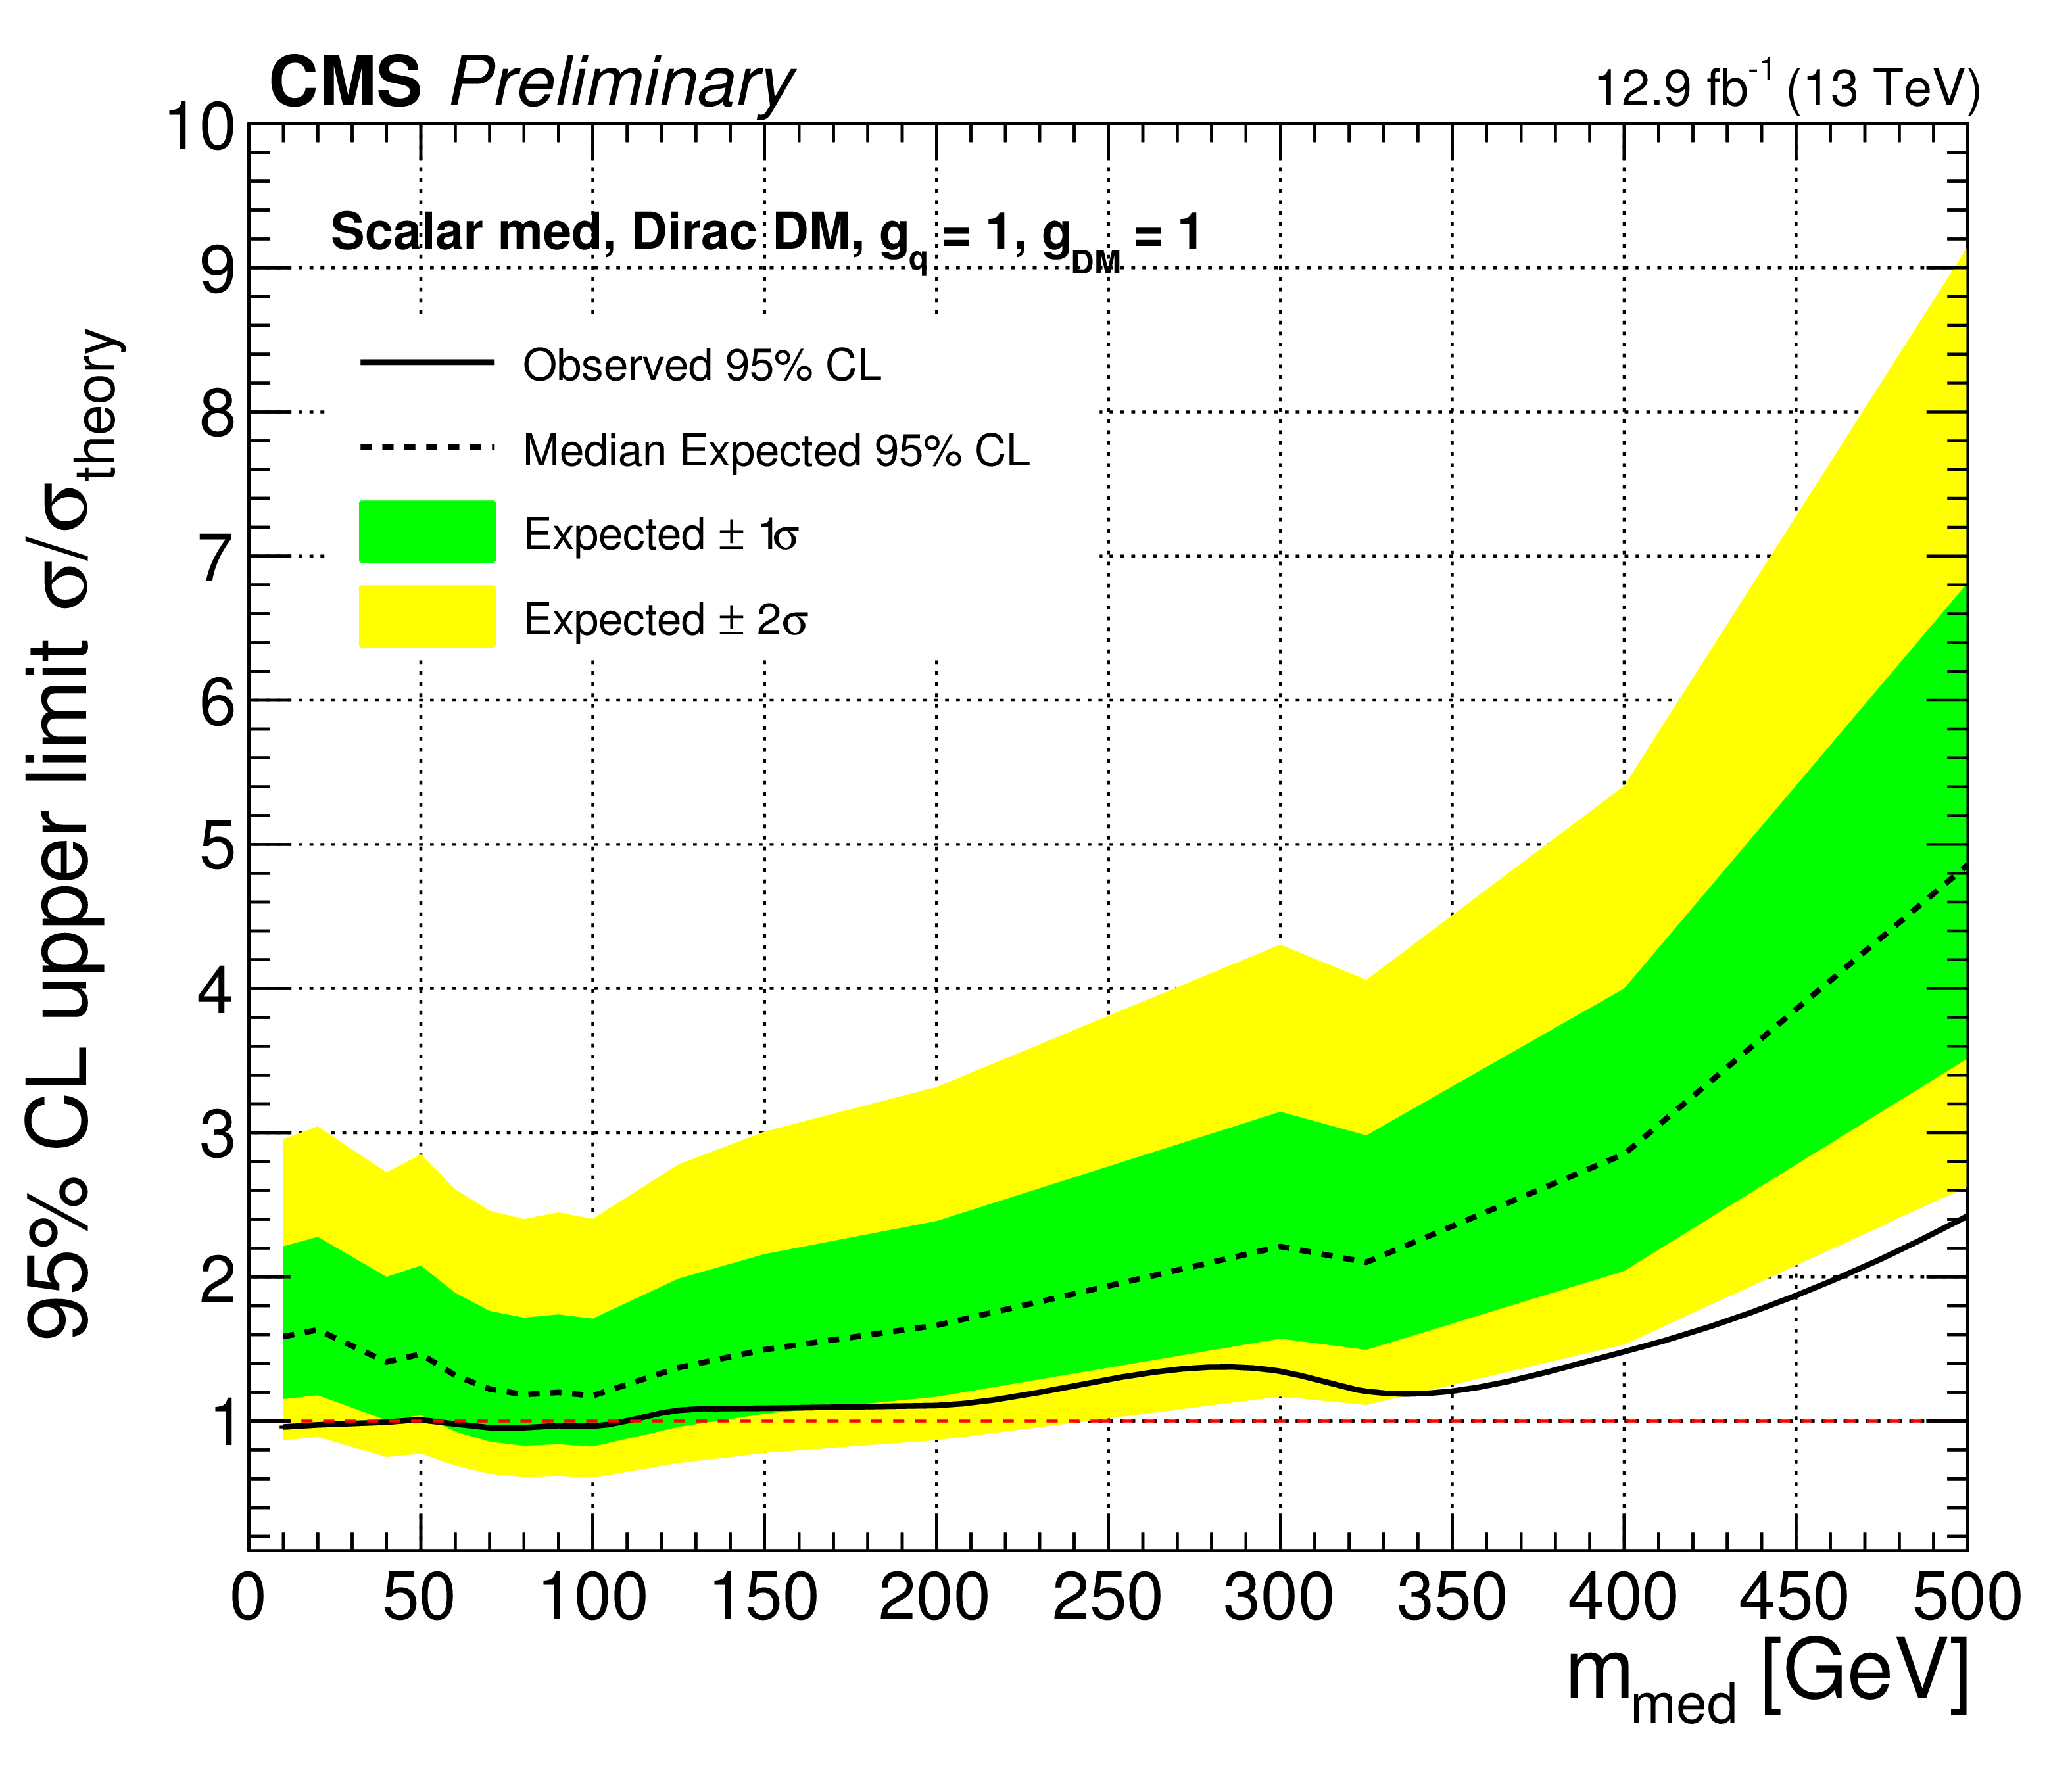
Figure 12:
Expected (dotted black line) and observed (solid black line) 95% CL upper limits on the signal strength $\mu $ as a function of the mediator mass for the spin-0 models. Limits for the pseudoscalar model, assuming only the monojet signal process. |
png pdf |
Figure 12-a:
Expected (dotted black line) and observed (solid black line) 95% CL upper limits on the signal strength $\mu $ as a function of the mediator mass for the spin-0 models. Limits for the scalar model on the combined cross section of the monojet and mono-V processes. |

png pdf |
Figure 12-b:
Expected (dotted black line) and observed (solid black line) 95% CL upper limits on the signal strength $\mu $ as a function of the mediator mass for the spin-0 models. Limits for the scalar model, assuming only the monojet signal process. |

png pdf |
Figure 12-c:
Expected (dotted black line) and observed (solid black line) 95% CL upper limits on the signal strength $\mu $ as a function of the mediator mass for the spin-0 models. Limits for the pseudoscalar model, assuming only the monojet signal process. |
png pdf |
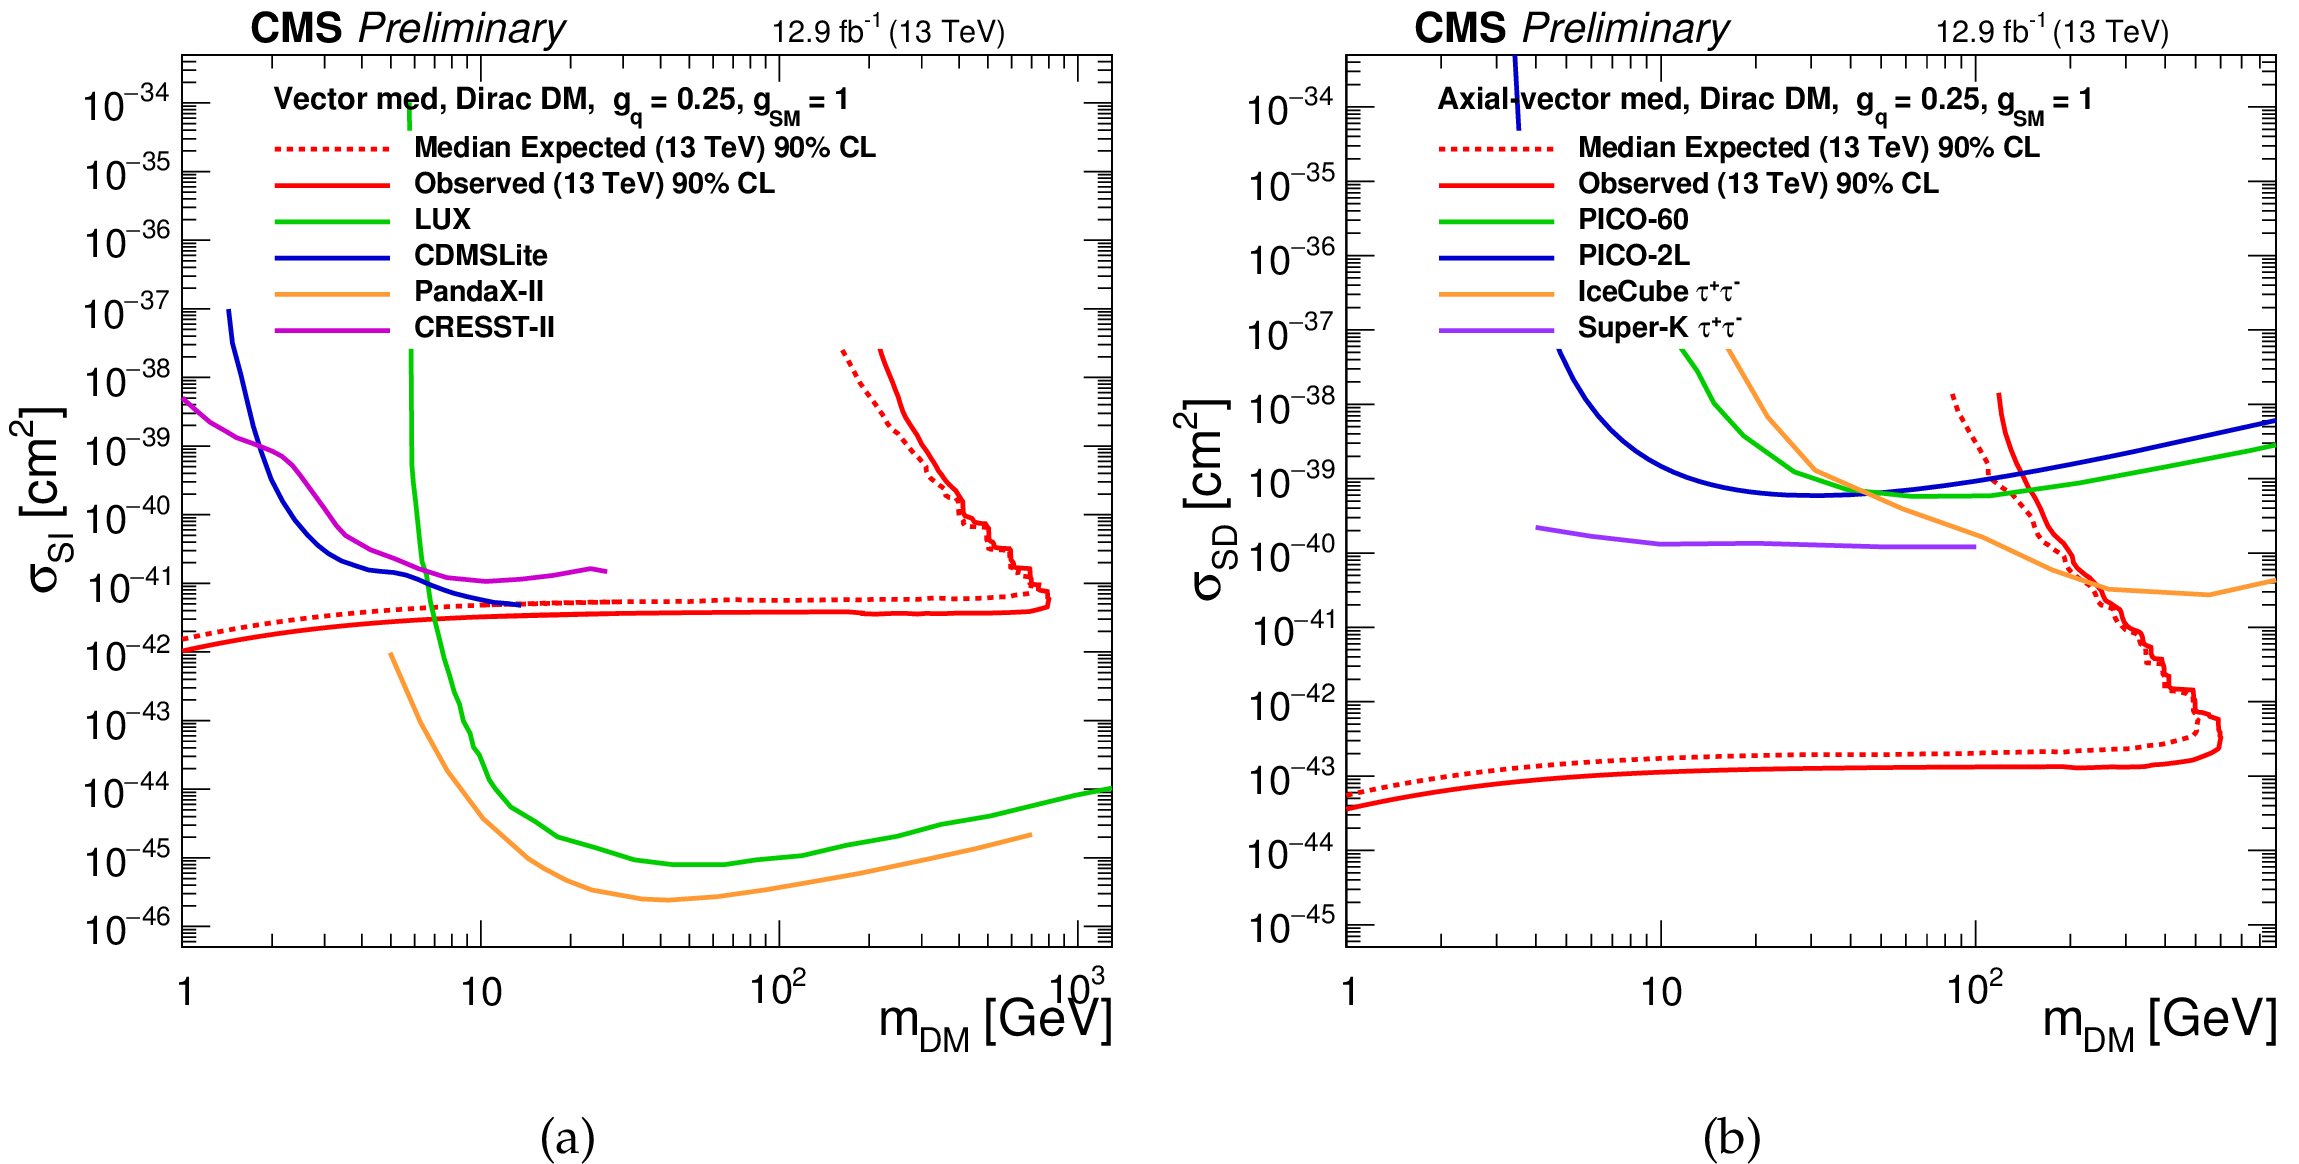
Figure 13:
Exclusion limits at 90% CL in the $m_{\textrm {DM}}$-$\sigma _{\textrm {SI/SD}}$ plane assuming for vector (a) and axial-vector (b) mediator models. The solid (dotted) red line shows the contour for the observed (expected) exclusion using 12.9 fb$^{-1}$ of 13 TeV data. Limits from CDMSLite [81], LUX [82], PandaX-II [83] and CRESST-II [84] experiments are shown for the vector mediator. Limits from PICO-2L [85], PICO-60 [86], IceCube [87] and Super-Kamiokande [88] experiments are shown for the axial-vector mediator. |
png pdf |
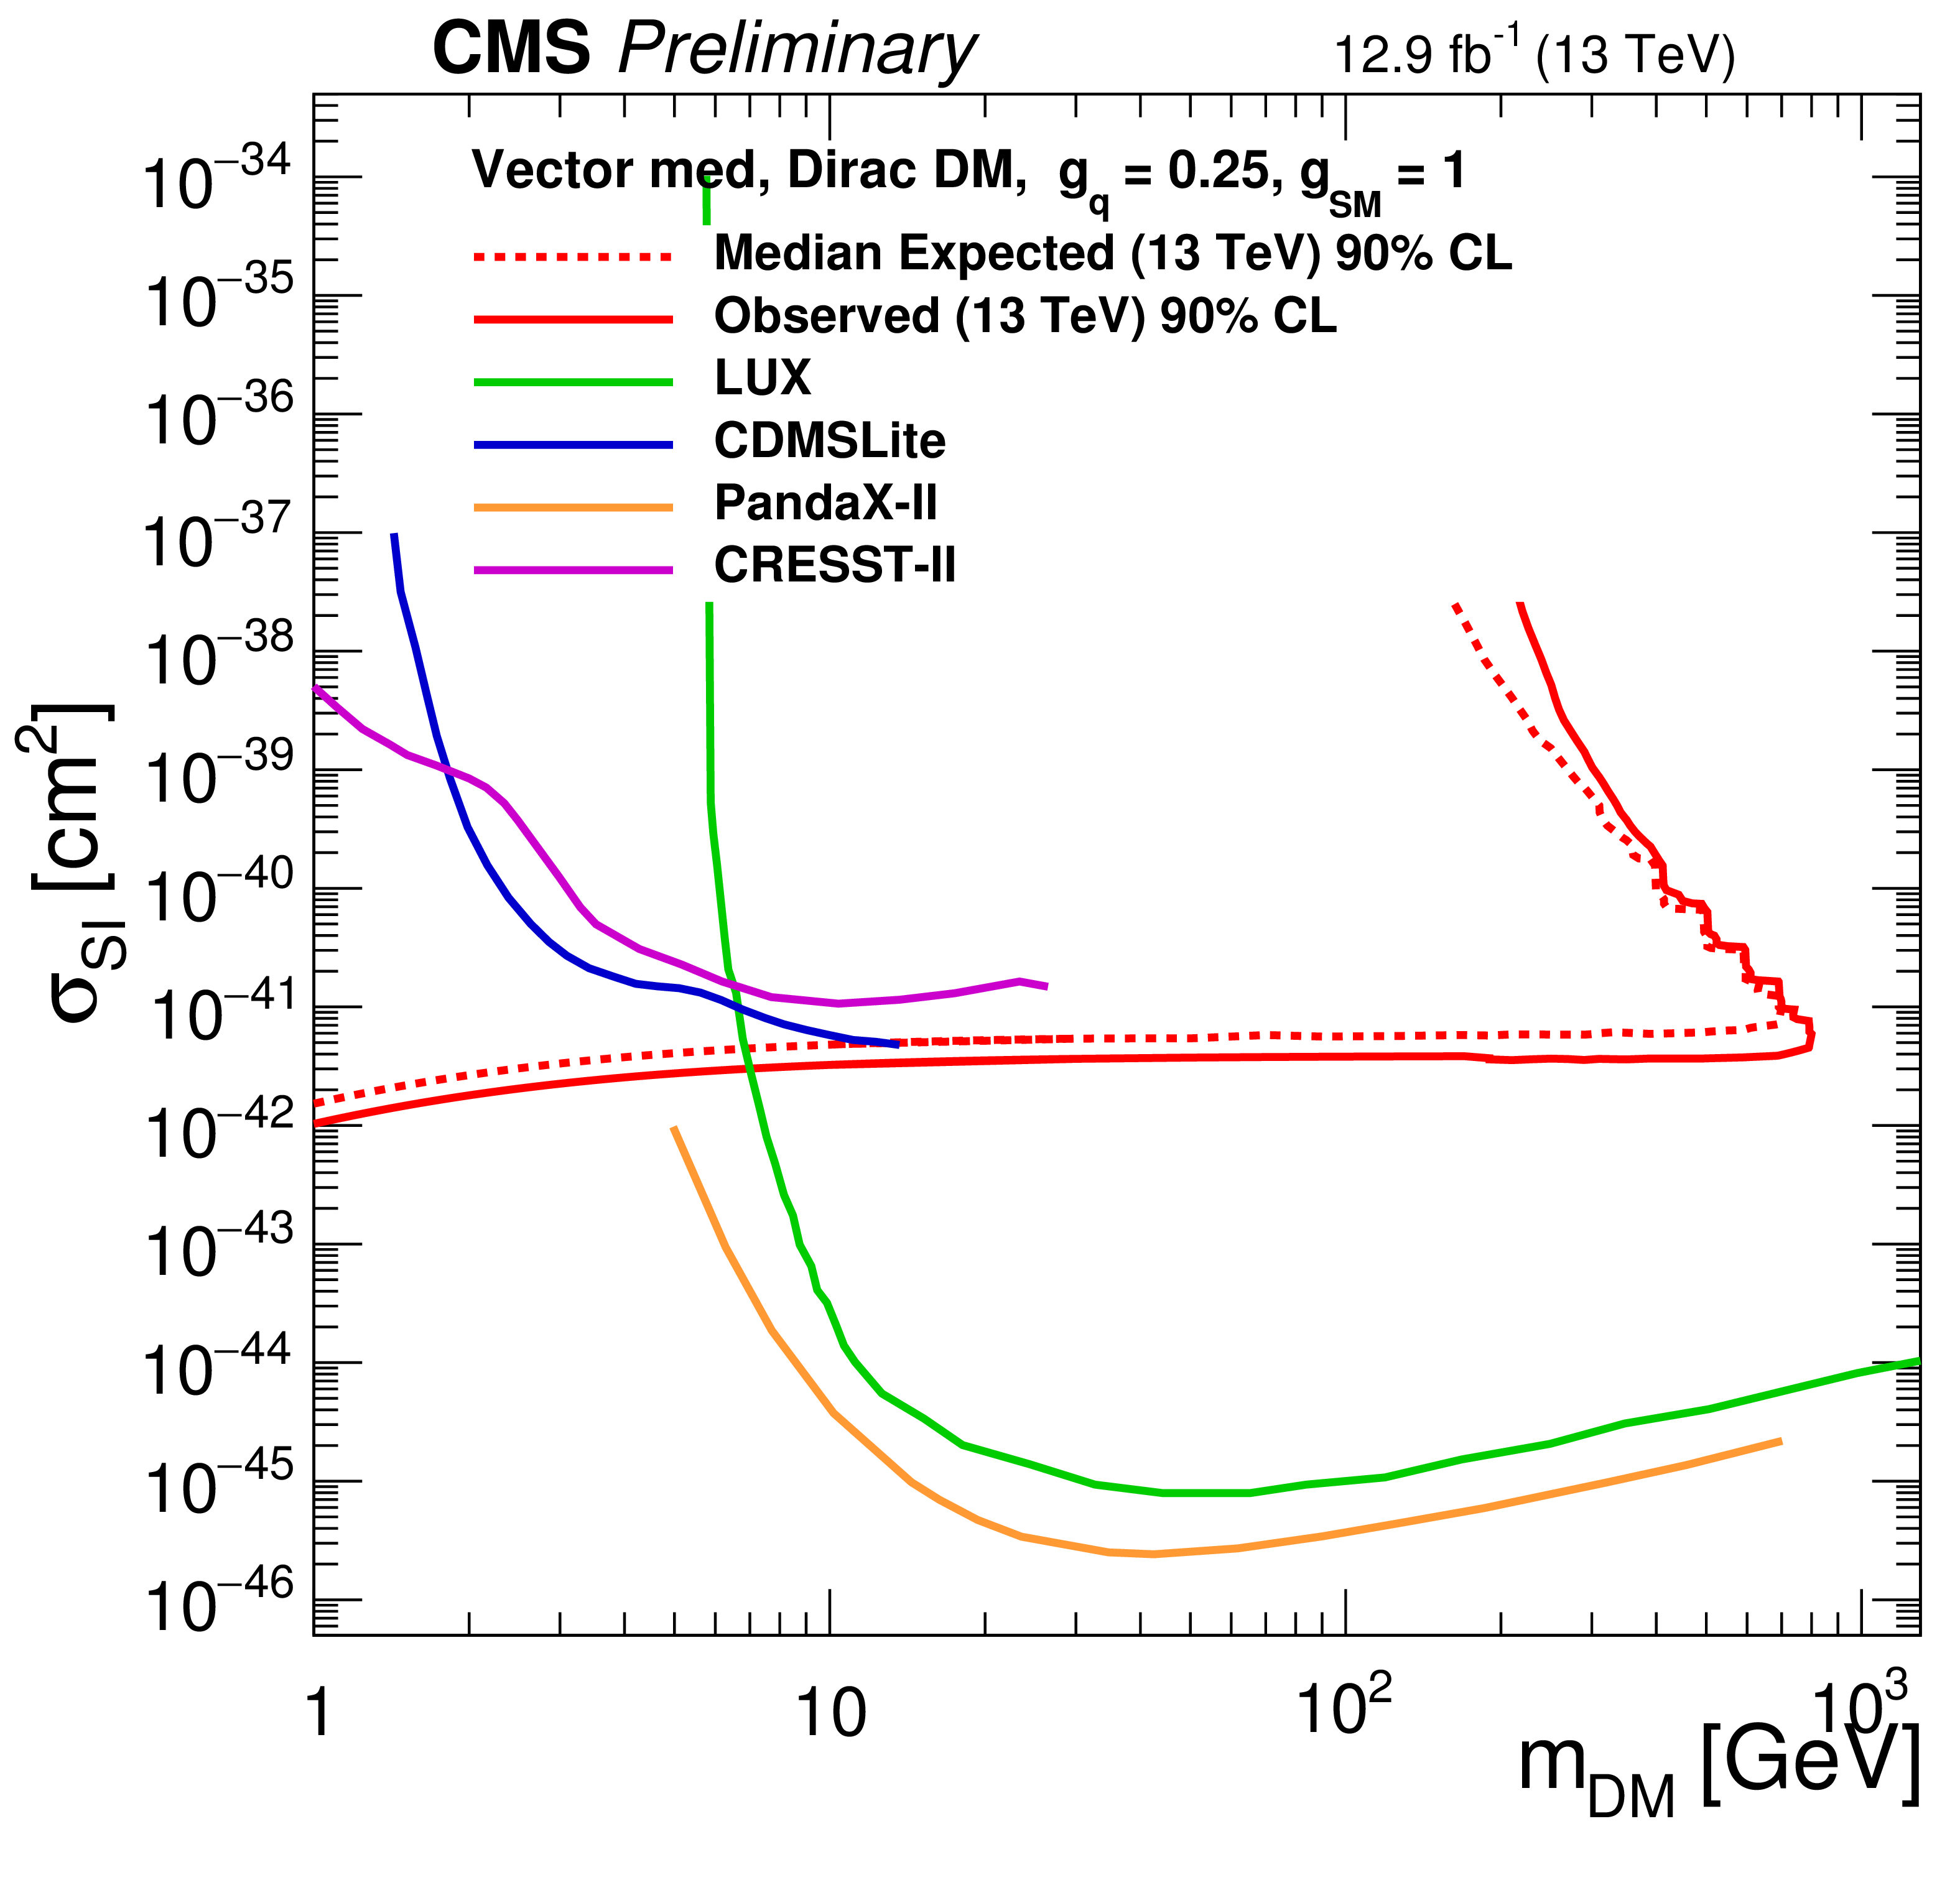
Figure 13-a:
Exclusion limits at 90% CL in the $m_{\textrm {DM}}$-$\sigma _{\textrm {SI/SD}}$ plane assuming for the vector mediator model. The solid (dotted) red line shows the contour for the observed (expected) exclusion using 12.9 fb$^{-1}$ of 13 TeV data. Limits from CDMSLite [81], LUX [82], PandaX-II [83] and CRESST-II [84] experiments are shown for the vector mediator. Limits from PICO-2L [85], PICO-60 [86], IceCube [87] and Super-Kamiokande [88] experiments are shown for the axial-vector mediator. |
png pdf |
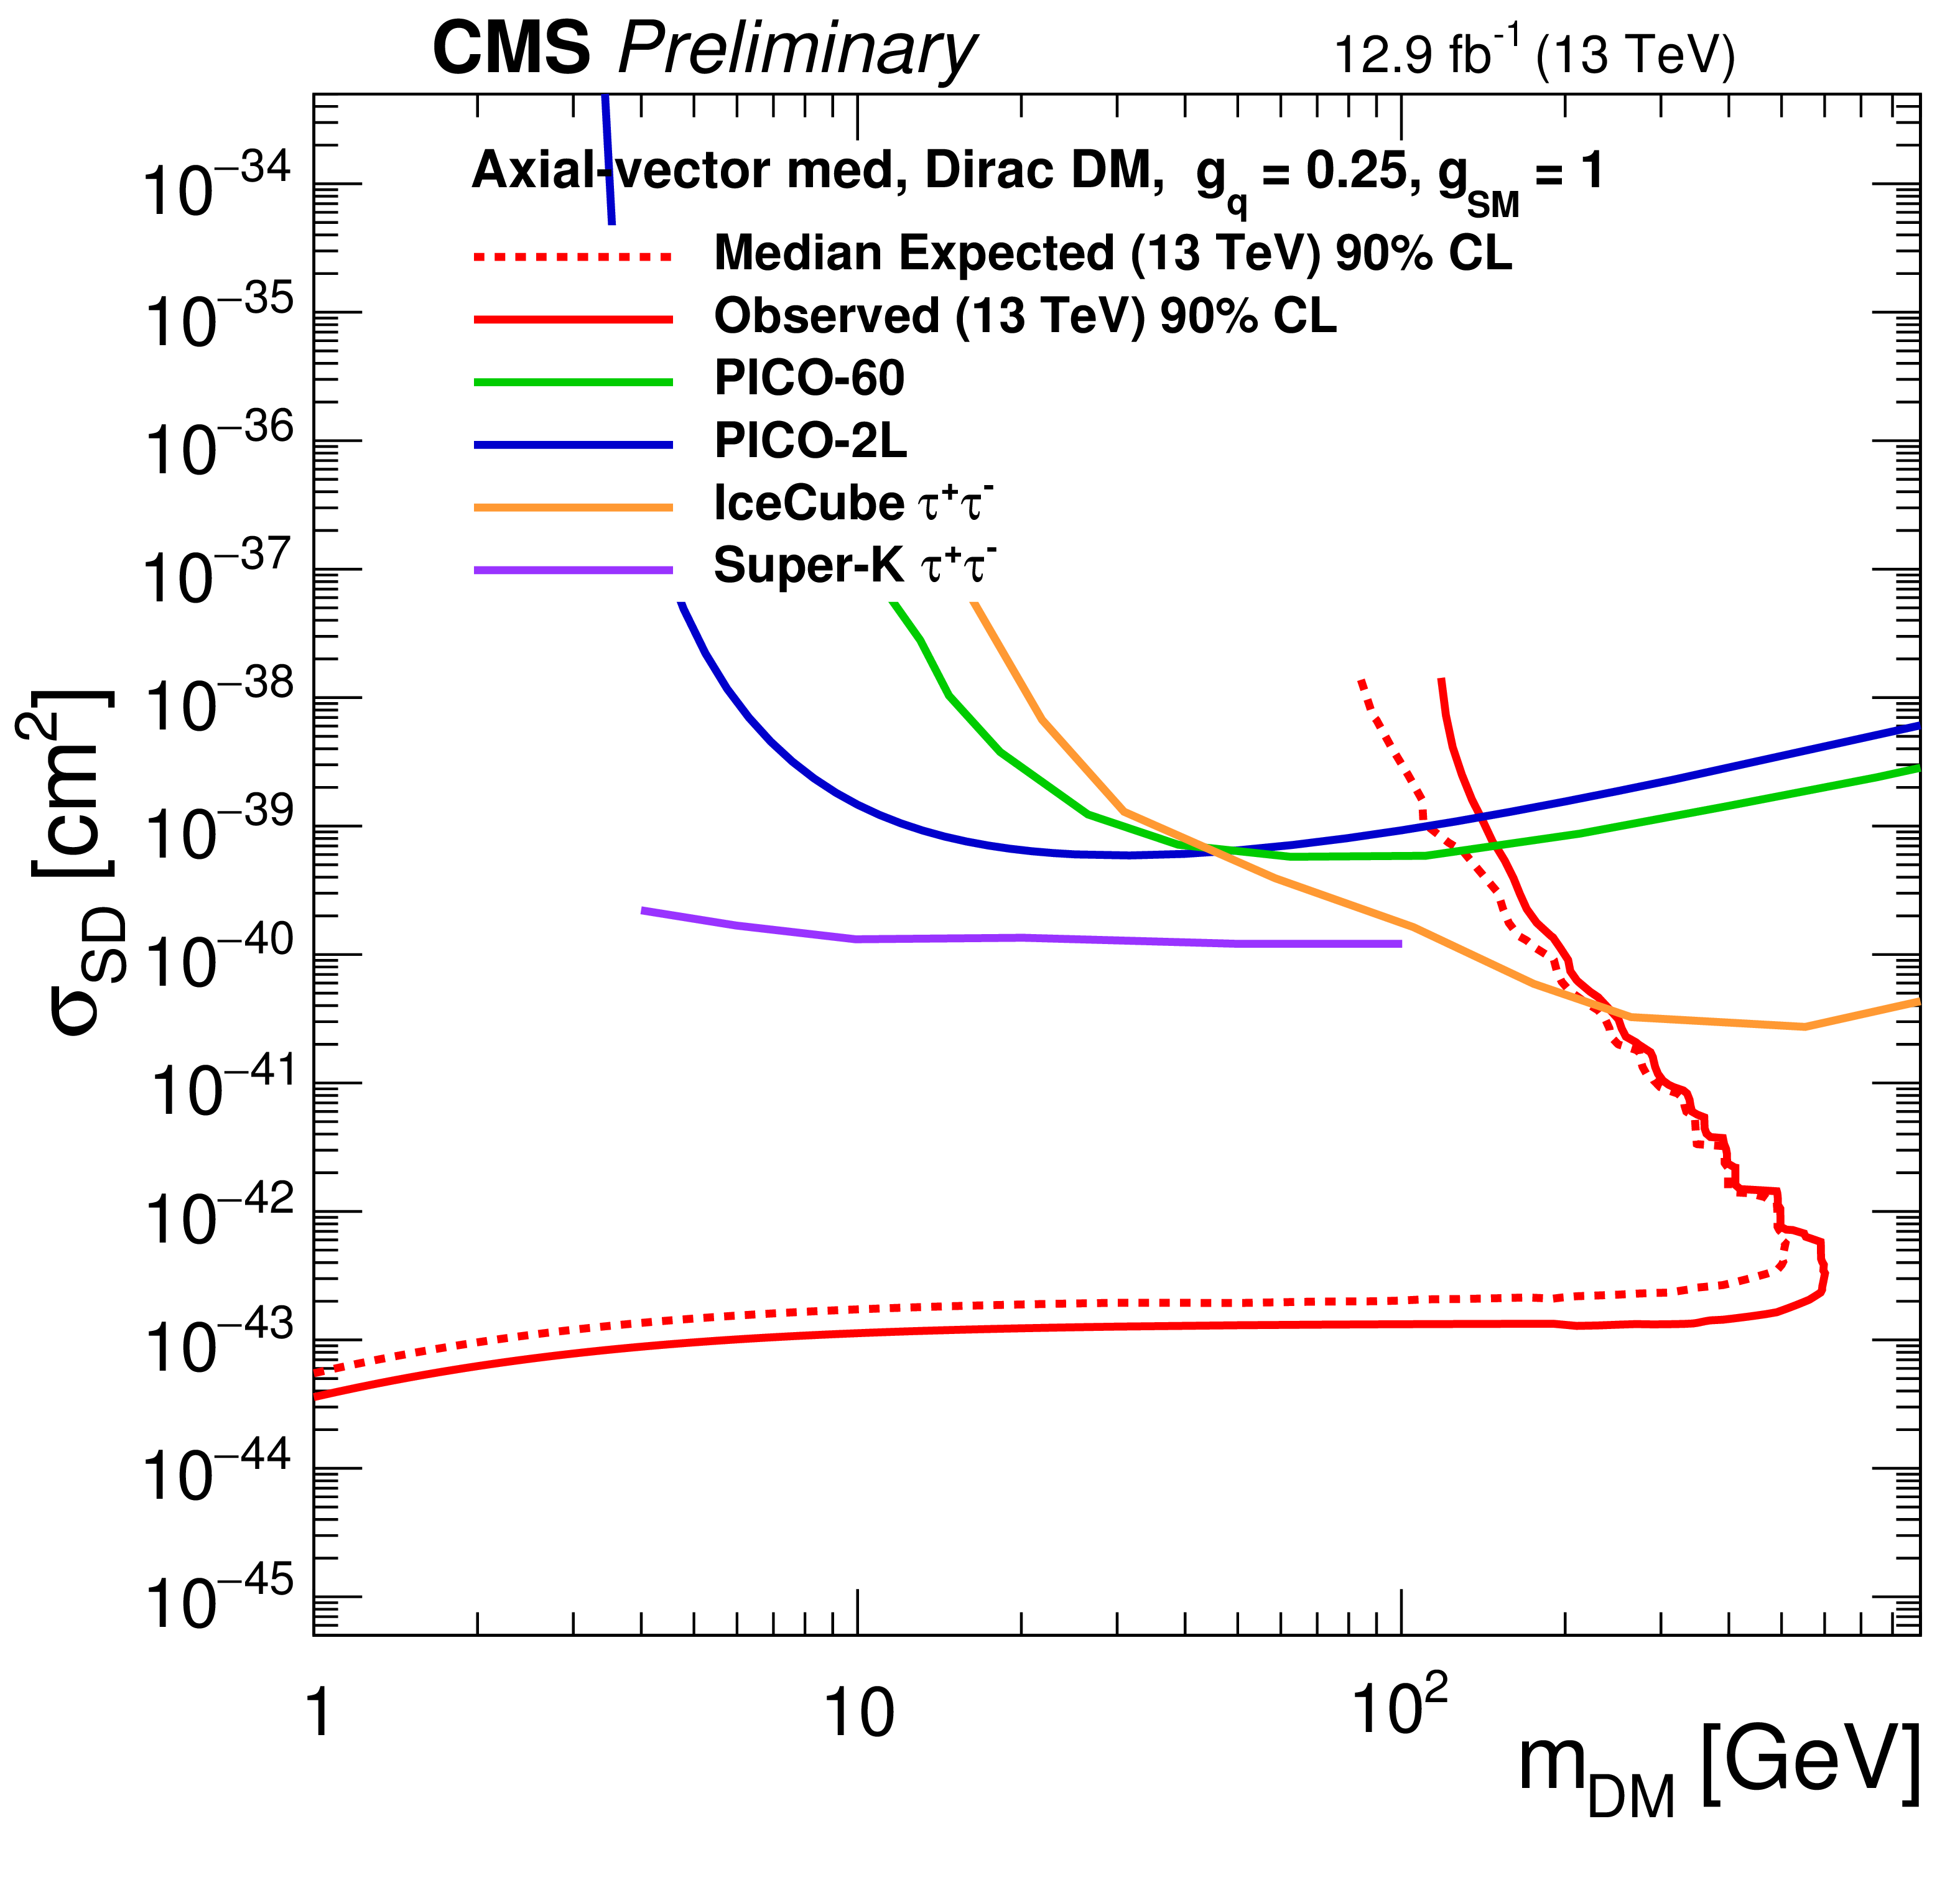
Figure 13-b:
Exclusion limits at 90% CL in the $m_{\textrm {DM}}$-$\sigma _{\textrm {SI/SD}}$ plane assuming for the axial-vector mediator model. The solid (dotted) red line shows the contour for the observed (expected) exclusion using 12.9 fb$^{-1}$ of 13 TeV data. Limits from CDMSLite [81], LUX [82], PandaX-II [83] and CRESST-II [84] experiments are shown for the vector mediator. Limits from PICO-2L [85], PICO-60 [86], IceCube [87] and Super-Kamiokande [88] experiments are shown for the axial-vector mediator. |
png pdf |
Figure 14:
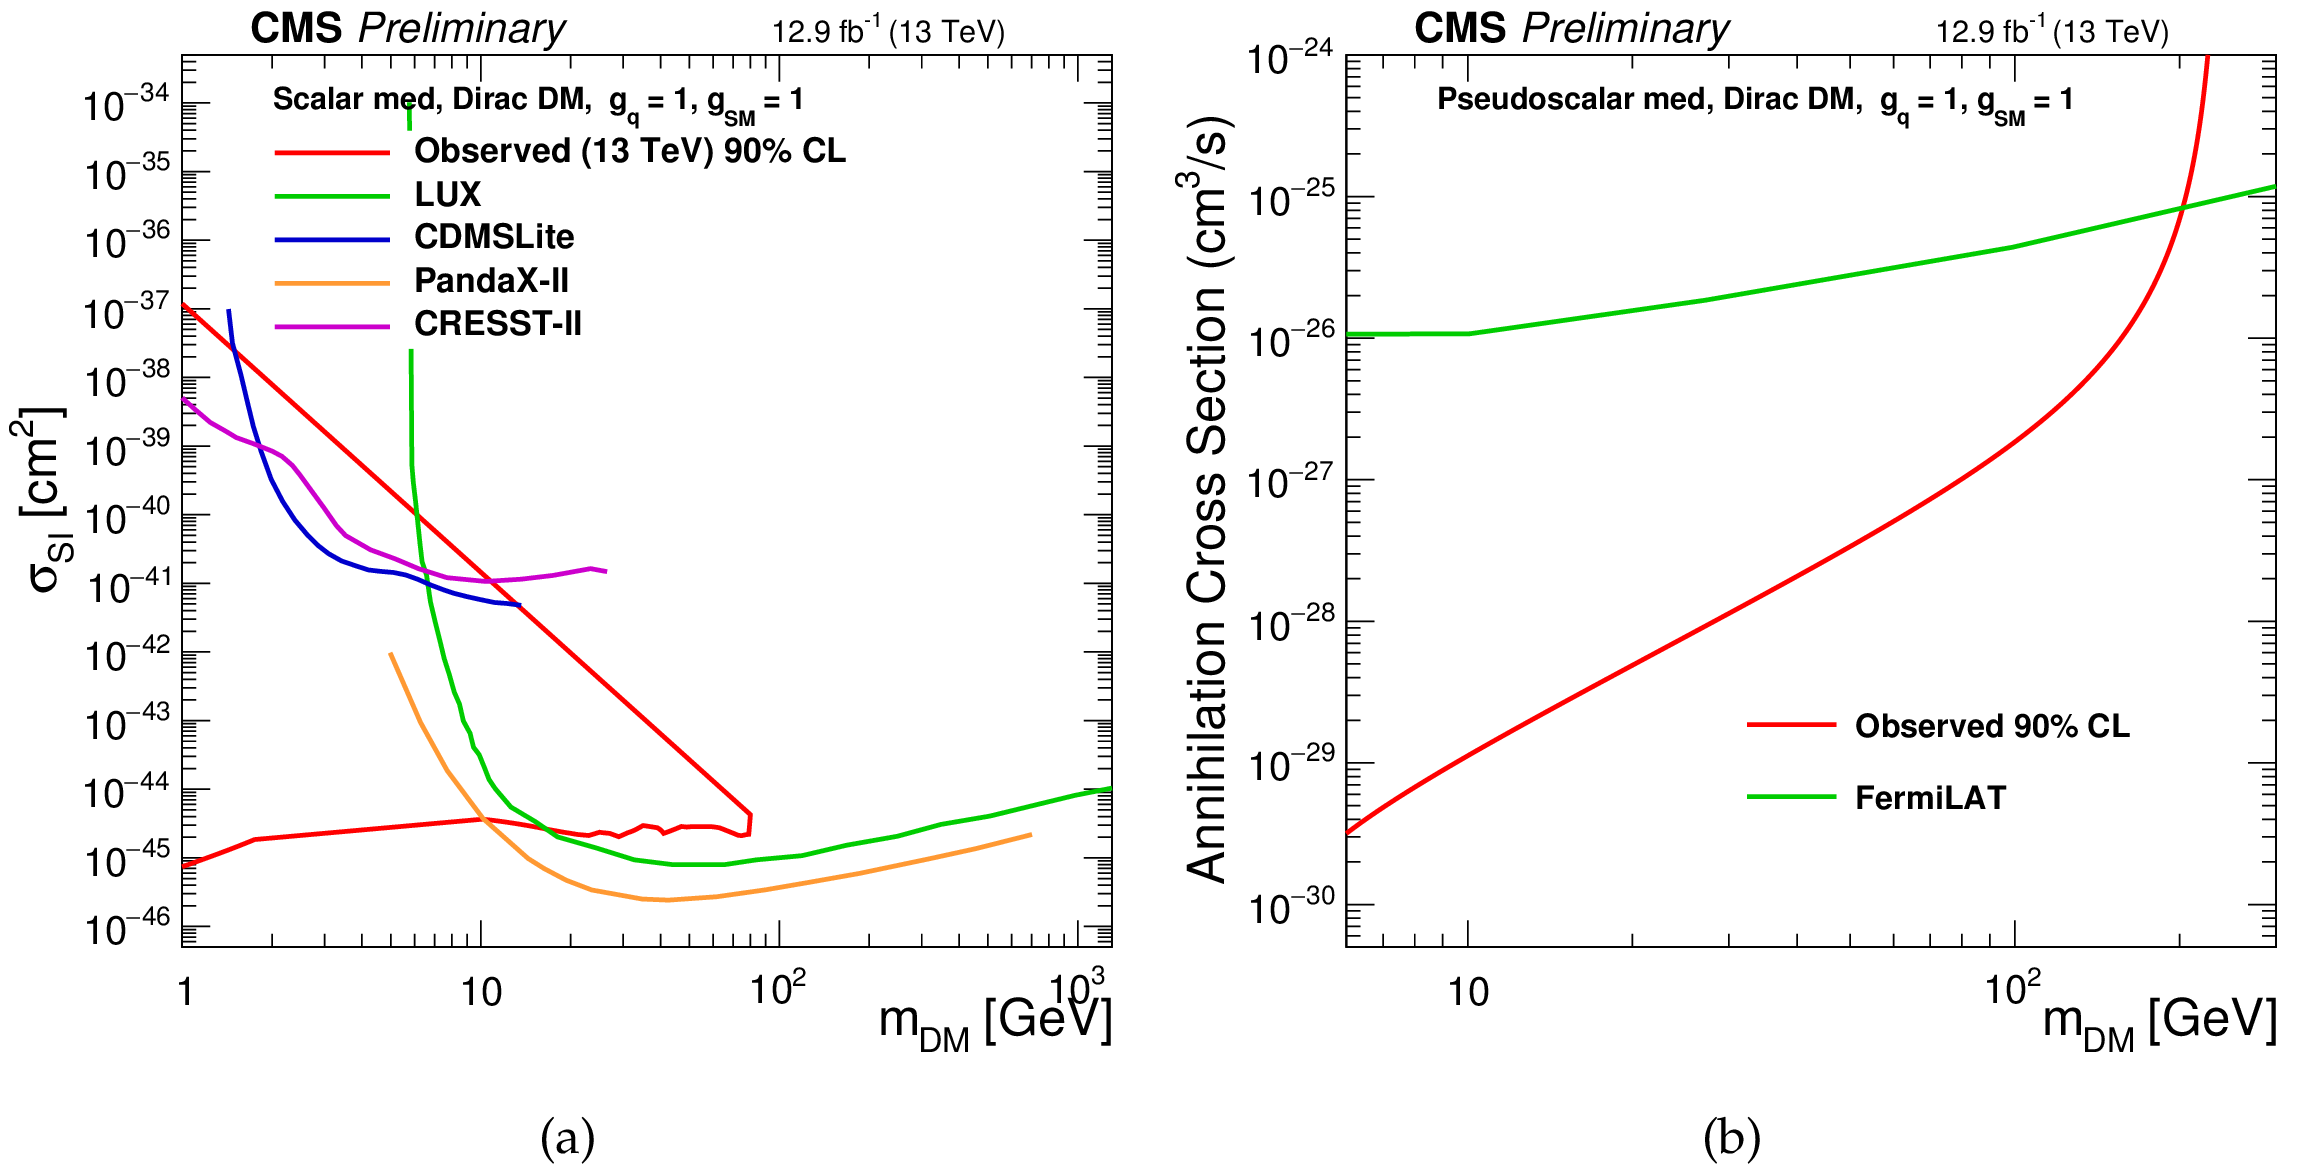
Exclusion limits at 90% CL in the $m_{\textrm {DM}}$-$\sigma _{\textrm {SI/SD}}$ plane for scalar (a) and pseudoscalar (b) mediator models. The solid red line shows the contour for the observed exclusion using 12.9 fb$^{-1}$ of 13 TeV data. Limits from the CDMSLite [81], LUX [82], PandaX-II [83] and CRESST-II [84] experiments are shown for the scalar mediator case. For the pseudoscalar mediator, limits are compared to the the DM annihilation cross section upper limits from Fermi-LAT [91]. |
png pdf |
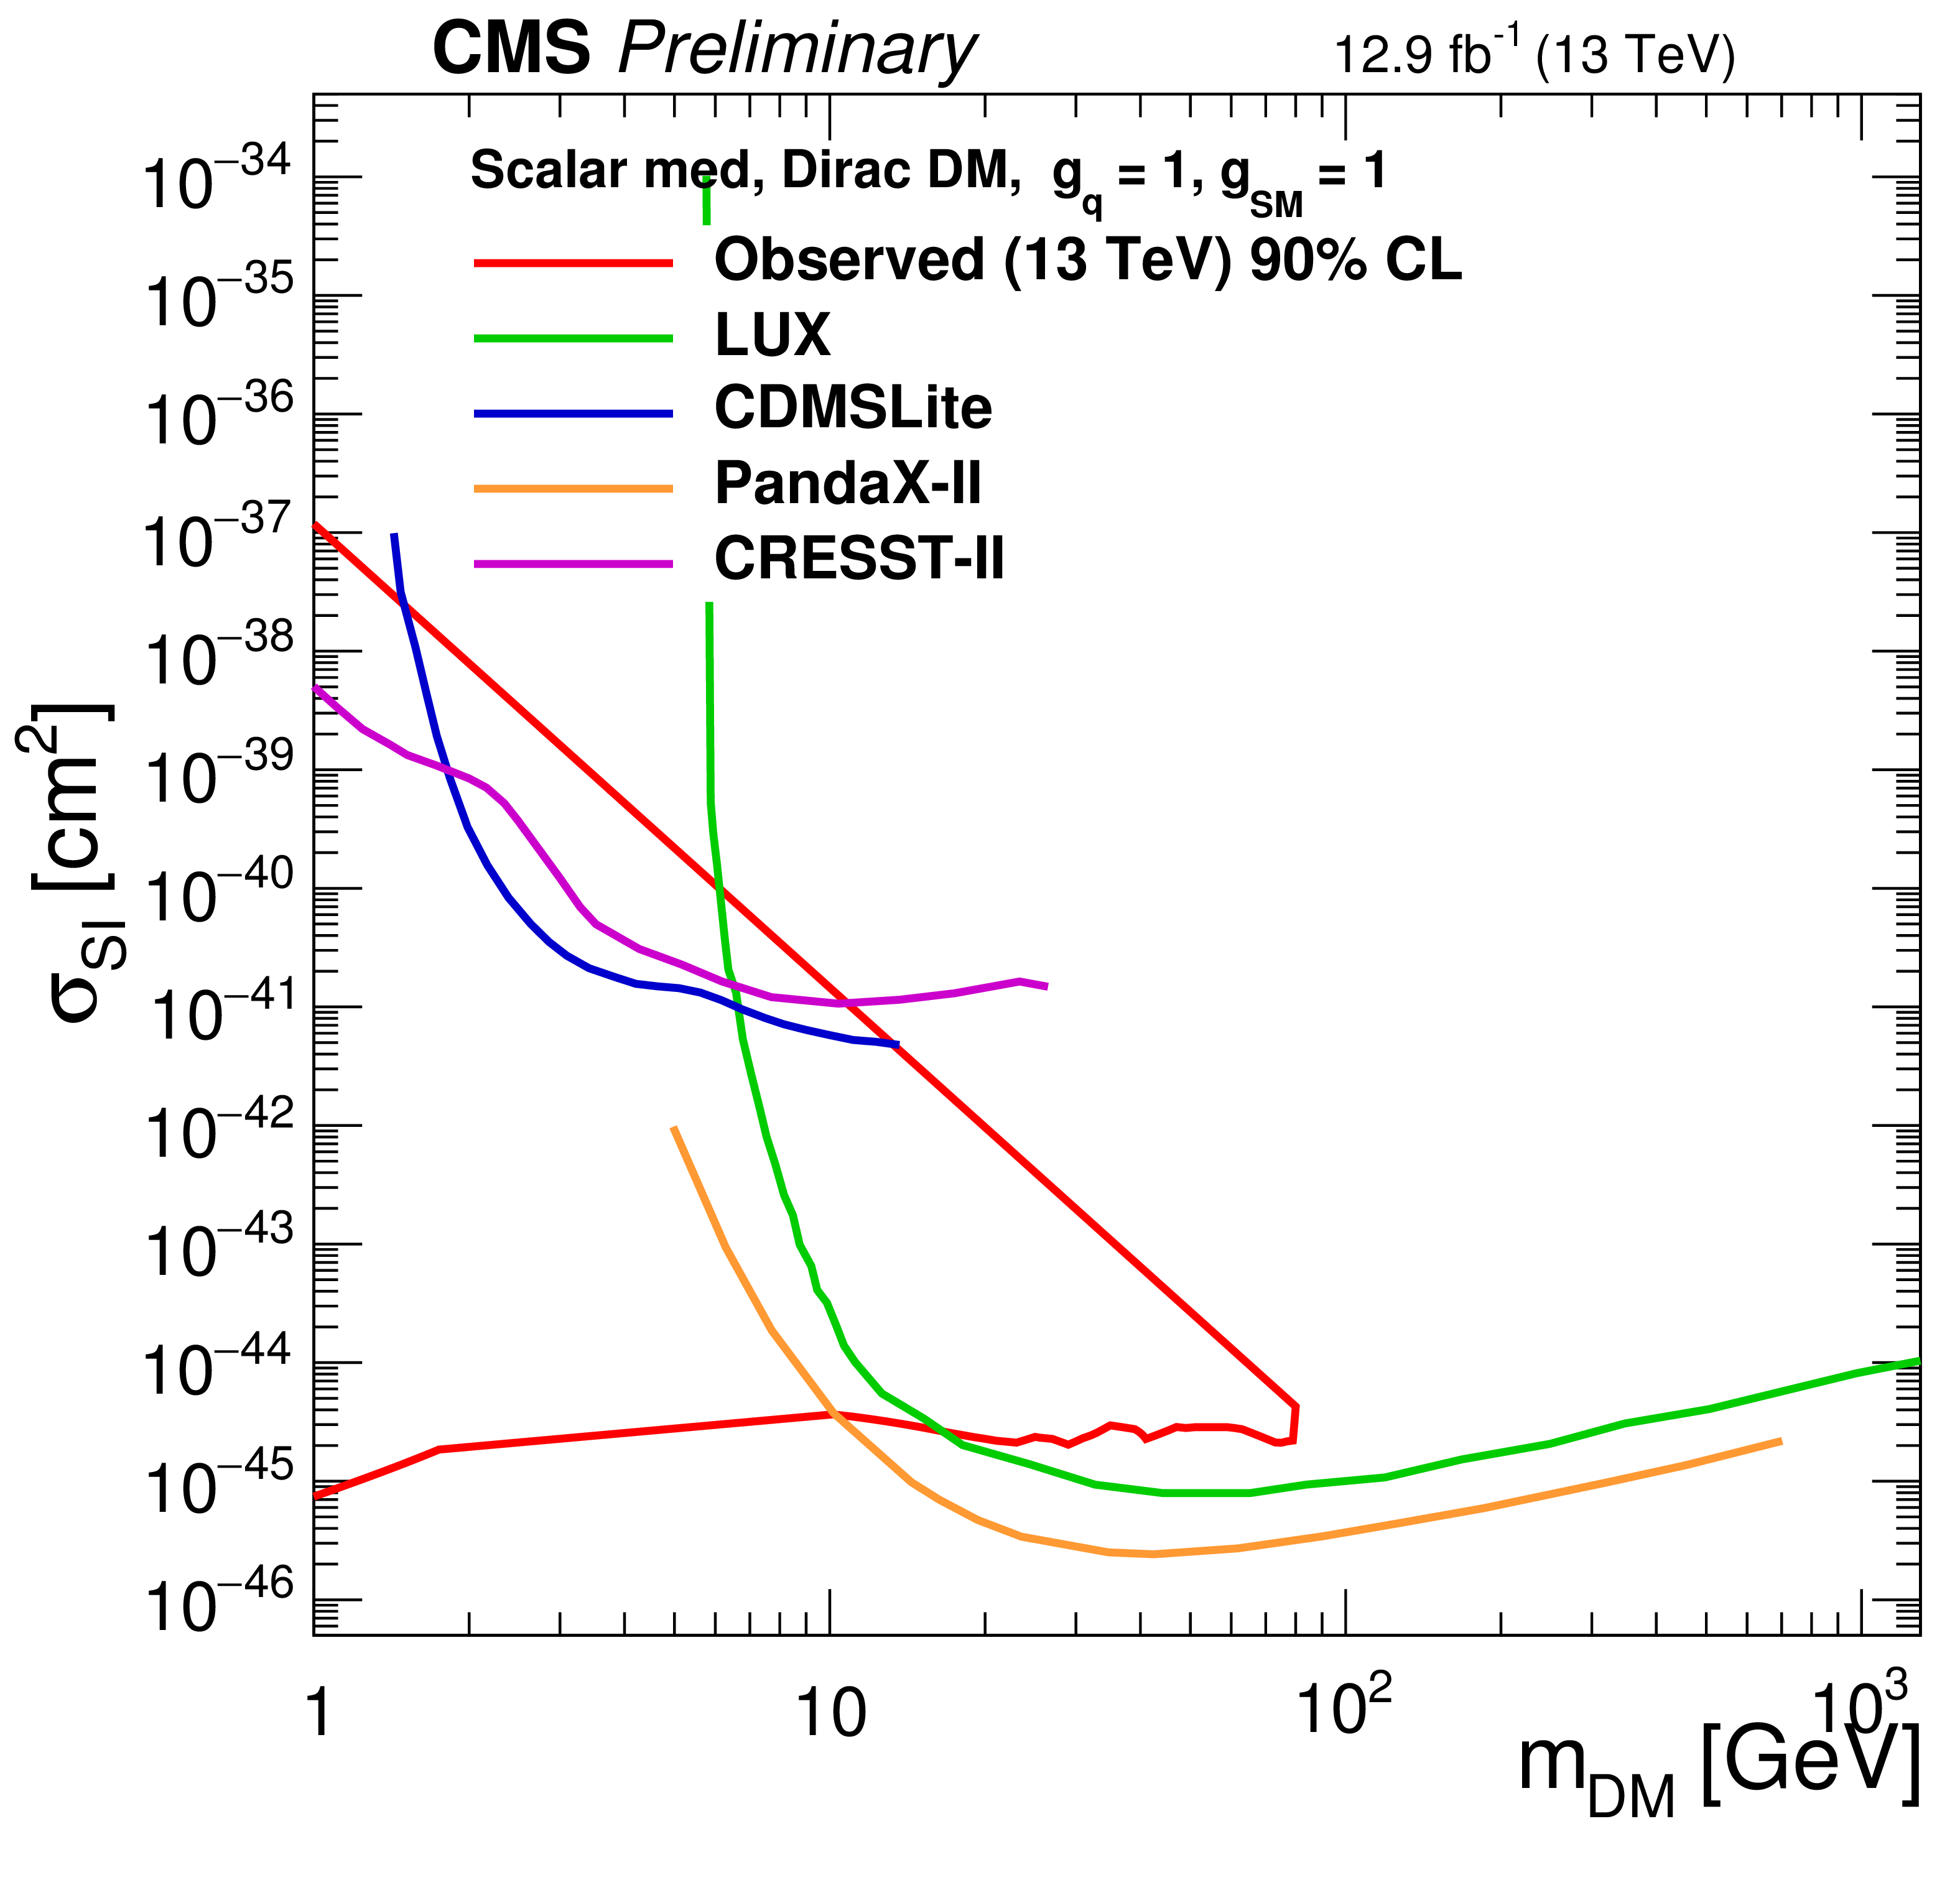
Figure 14-a:
Exclusion limits at 90% CL in the $m_{\textrm {DM}}$-$\sigma _{\textrm {SI/SD}}$ plane for the scalar mediator model. The solid red line shows the contour for the observed exclusion using 12.9 fb$^{-1}$ of 13 TeV data. Limits from the CDMSLite [81], LUX [82], PandaX-II [83] and CRESST-II [84] experiments are shown for the scalar mediator case. For the pseudoscalar mediator, limits are compared to the the DM annihilation cross section upper limits from Fermi-LAT [91]. |
png pdf |
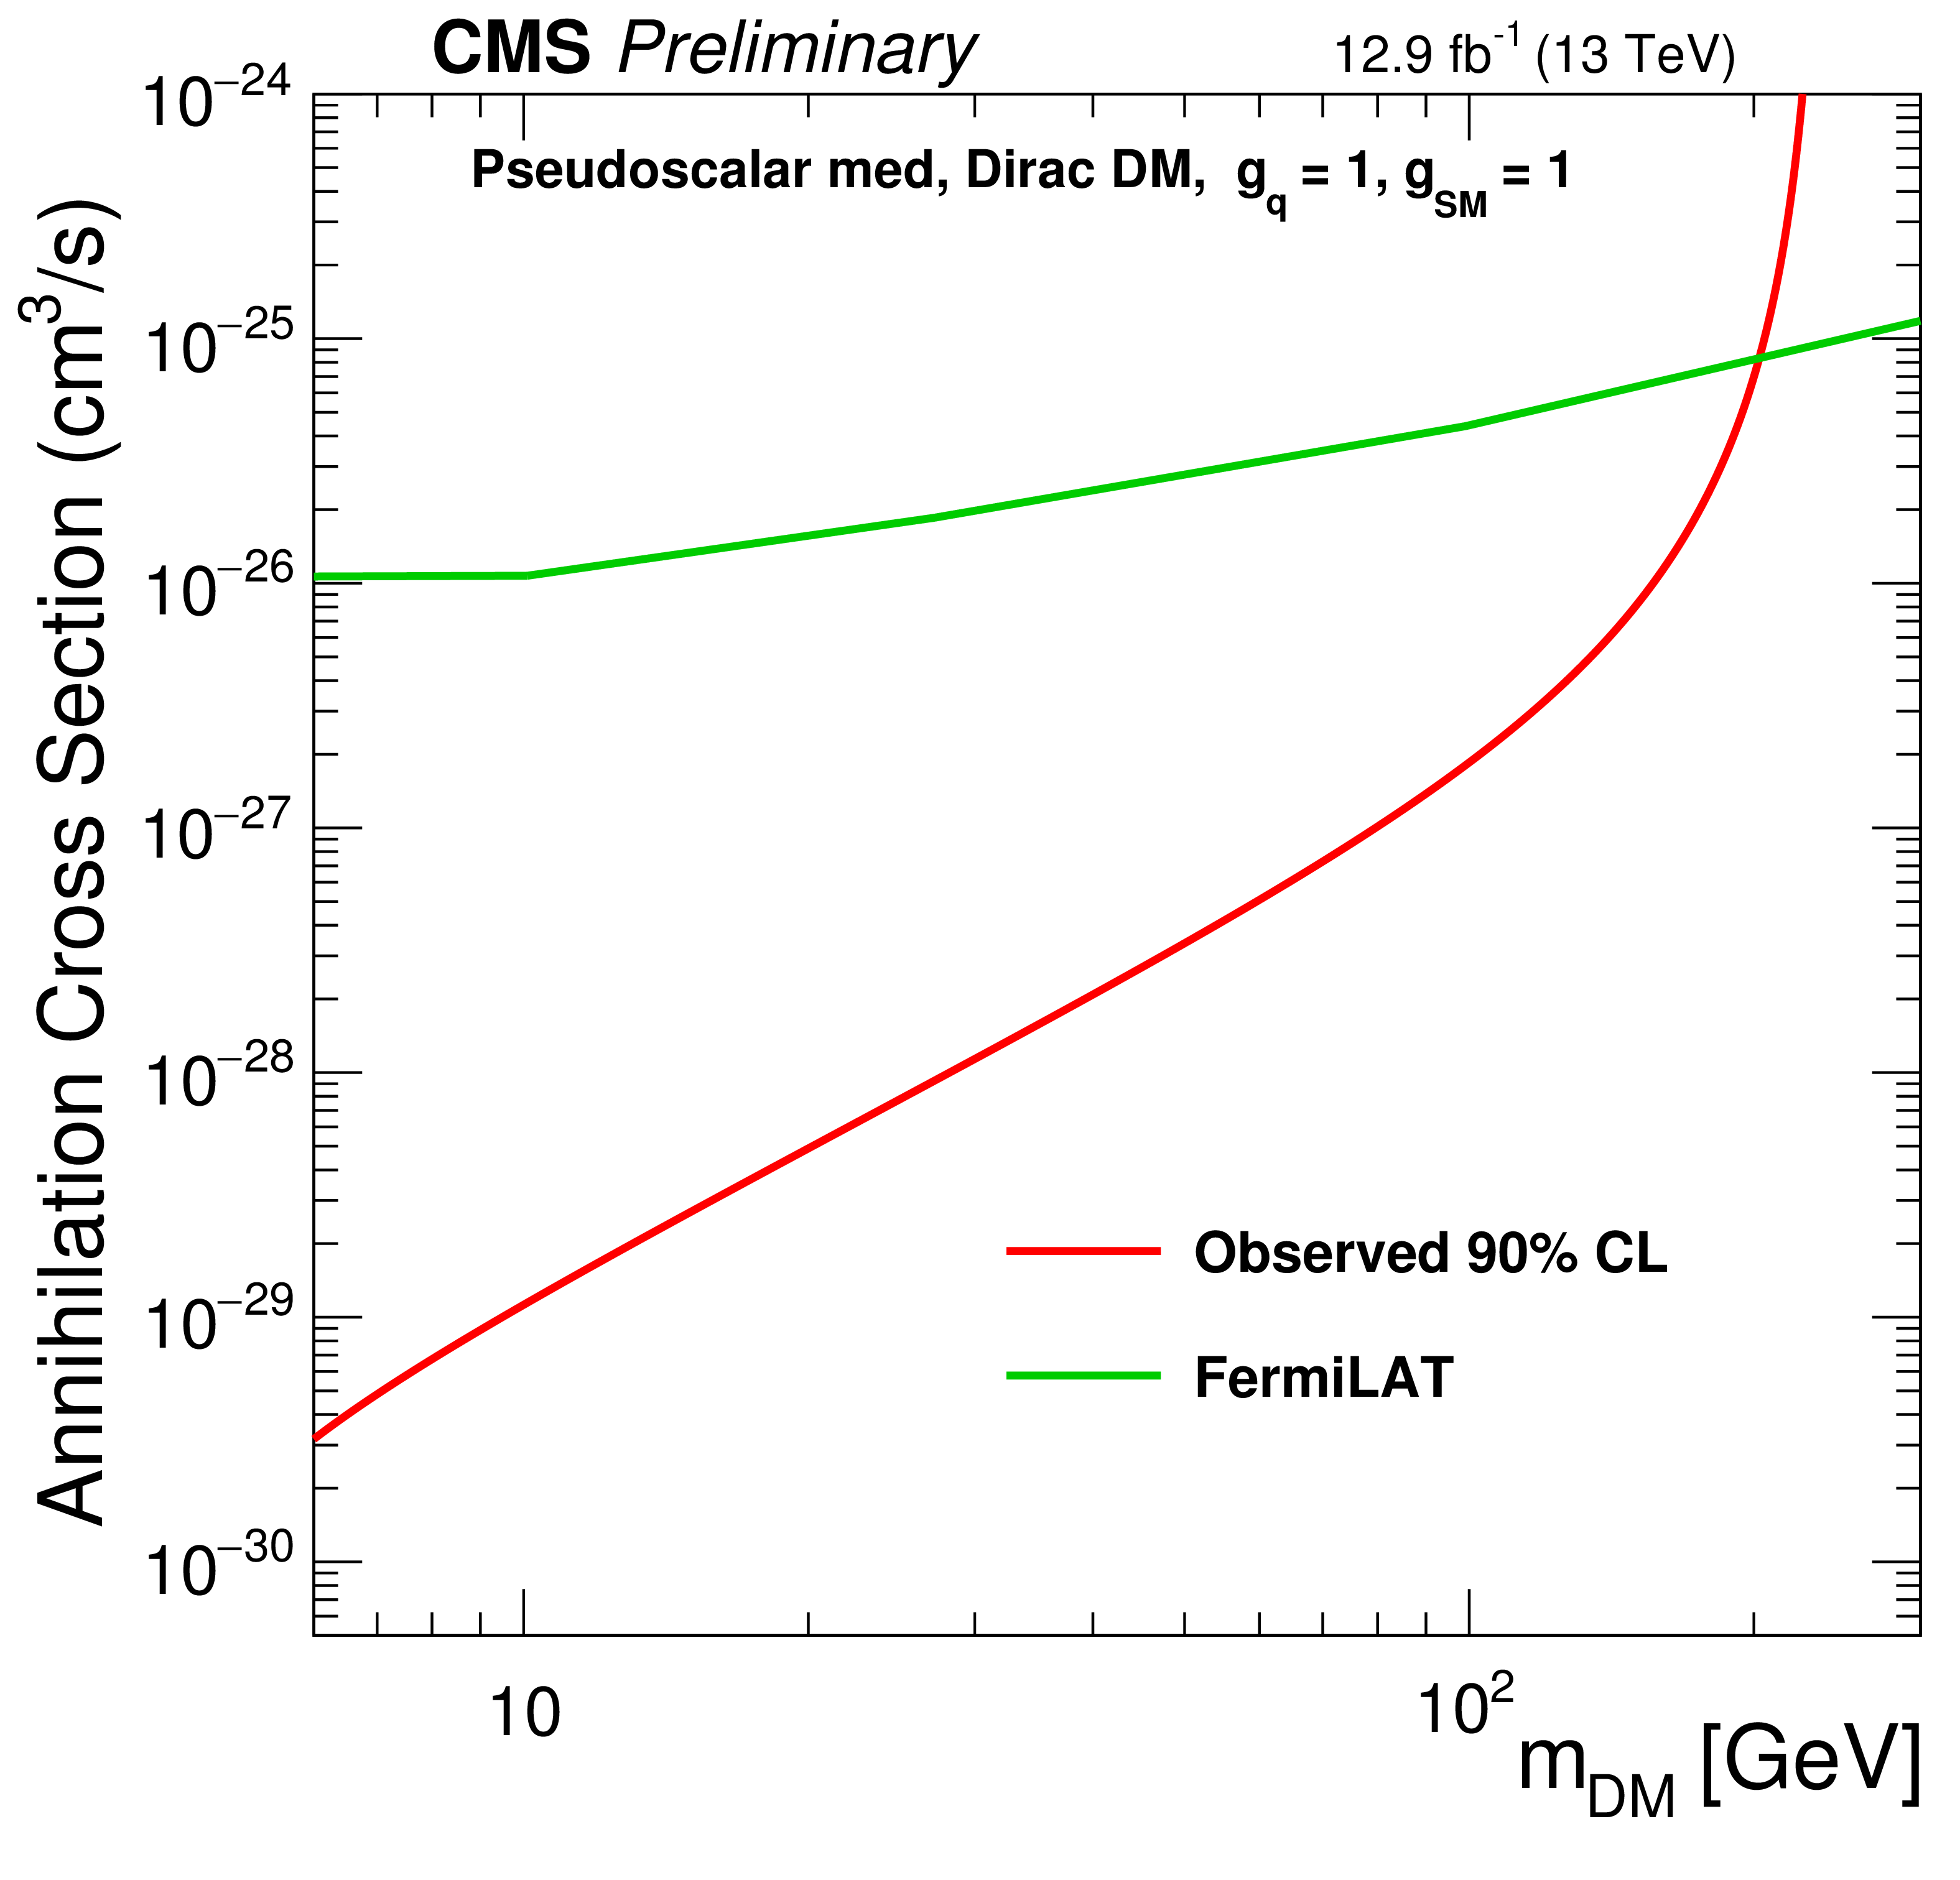
Figure 14-b:
Exclusion limits at 90% CL in the $m_{\textrm {DM}}$-$\sigma _{\textrm {SI/SD}}$ plane for the pseudoscalar mediator model. The solid red line shows the contour for the observed exclusion using 12.9 fb$^{-1}$ of 13 TeV data. Limits from the CDMSLite [81], LUX [82], PandaX-II [83] and CRESST-II [84] experiments are shown for the scalar mediator case. For the pseudoscalar mediator, limits are compared to the the DM annihilation cross section upper limits from Fermi-LAT [91]. |

png pdf |
Figure 15:
95% CL expected (dotted black line) and observed (solid black line) upper limits on the invisible branching fraction of the 125 GeV SM-like Higgs boson. Limits are shown for the monojet and mono-V categories separately, and also for their combination. |
| Tables | |
png pdf |
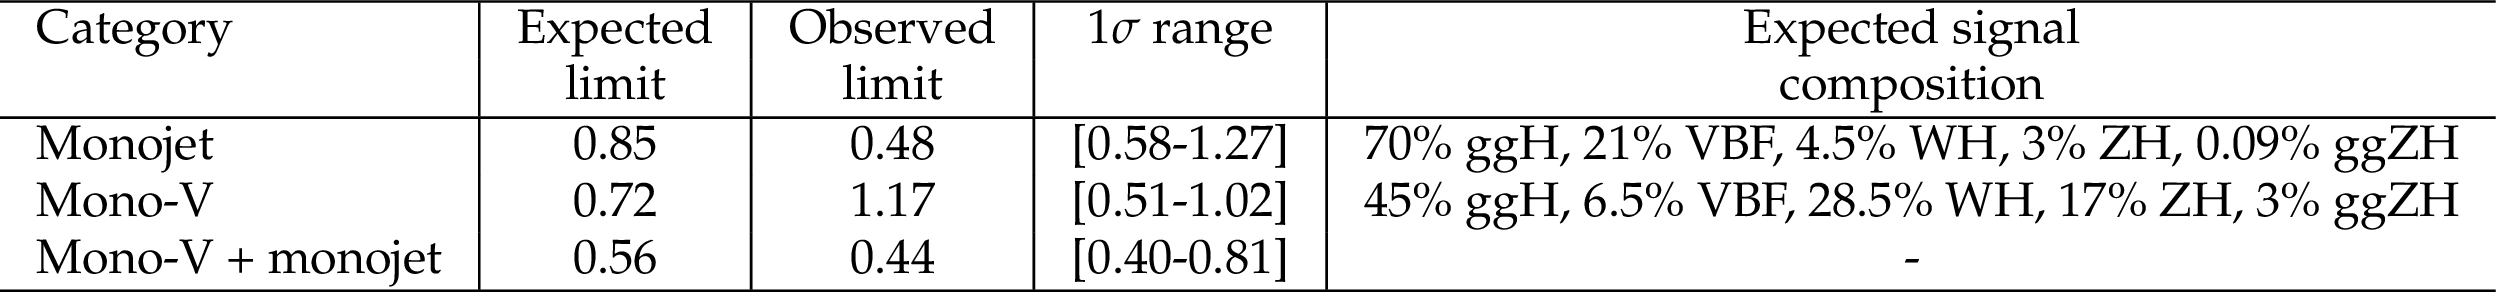
Table 1:
Expected and observed 95% CL upper limits on $\sigma \times {\cal B}(\textrm {H} \rightarrow \textrm {invisible}) / \sigma _{\textrm {H}}$ for the 125 GeV SM-like Higgs boson. Limits are tabulated for the monojet and mono-V categories separately, and also for their combination. The 1$\sigma $ uncertainty range on the expected limits is listed. The signal composition in terms of gluon fusion, vector boson fusion, Higgs-strahlung, and an associated production with a W or Z boson is also provided. |
| Summary |
| A search for DM has been performed using events with jets and large $E_{\mathrm{T}}^{\text{miss}}$ in the 13 TeV proton-proton collision data corresponding to an integrated luminosity of 12.9 fb$^{-1}$. No significant excess is observed with respect to the SM backgrounds. Limits are computed on the DM production cross section using simplified models in which DM production is mediated by spin-1 or spin-0 particles. Vector and axial-vector mediators with masses up to 1.95 TeV are excluded at 95% CL. Scalar and pseudoscalar mediators with masses up to 100 and 430 GeV, respectively, are excluded at 95% CL. The search yields an observed (expected) upper limit of 0.44 (0.56) at 95% CL on the invisible branching fraction of the 125 GeV Higgs boson assuming SM production cross section. |
| Additional Figures | |
png pdf |
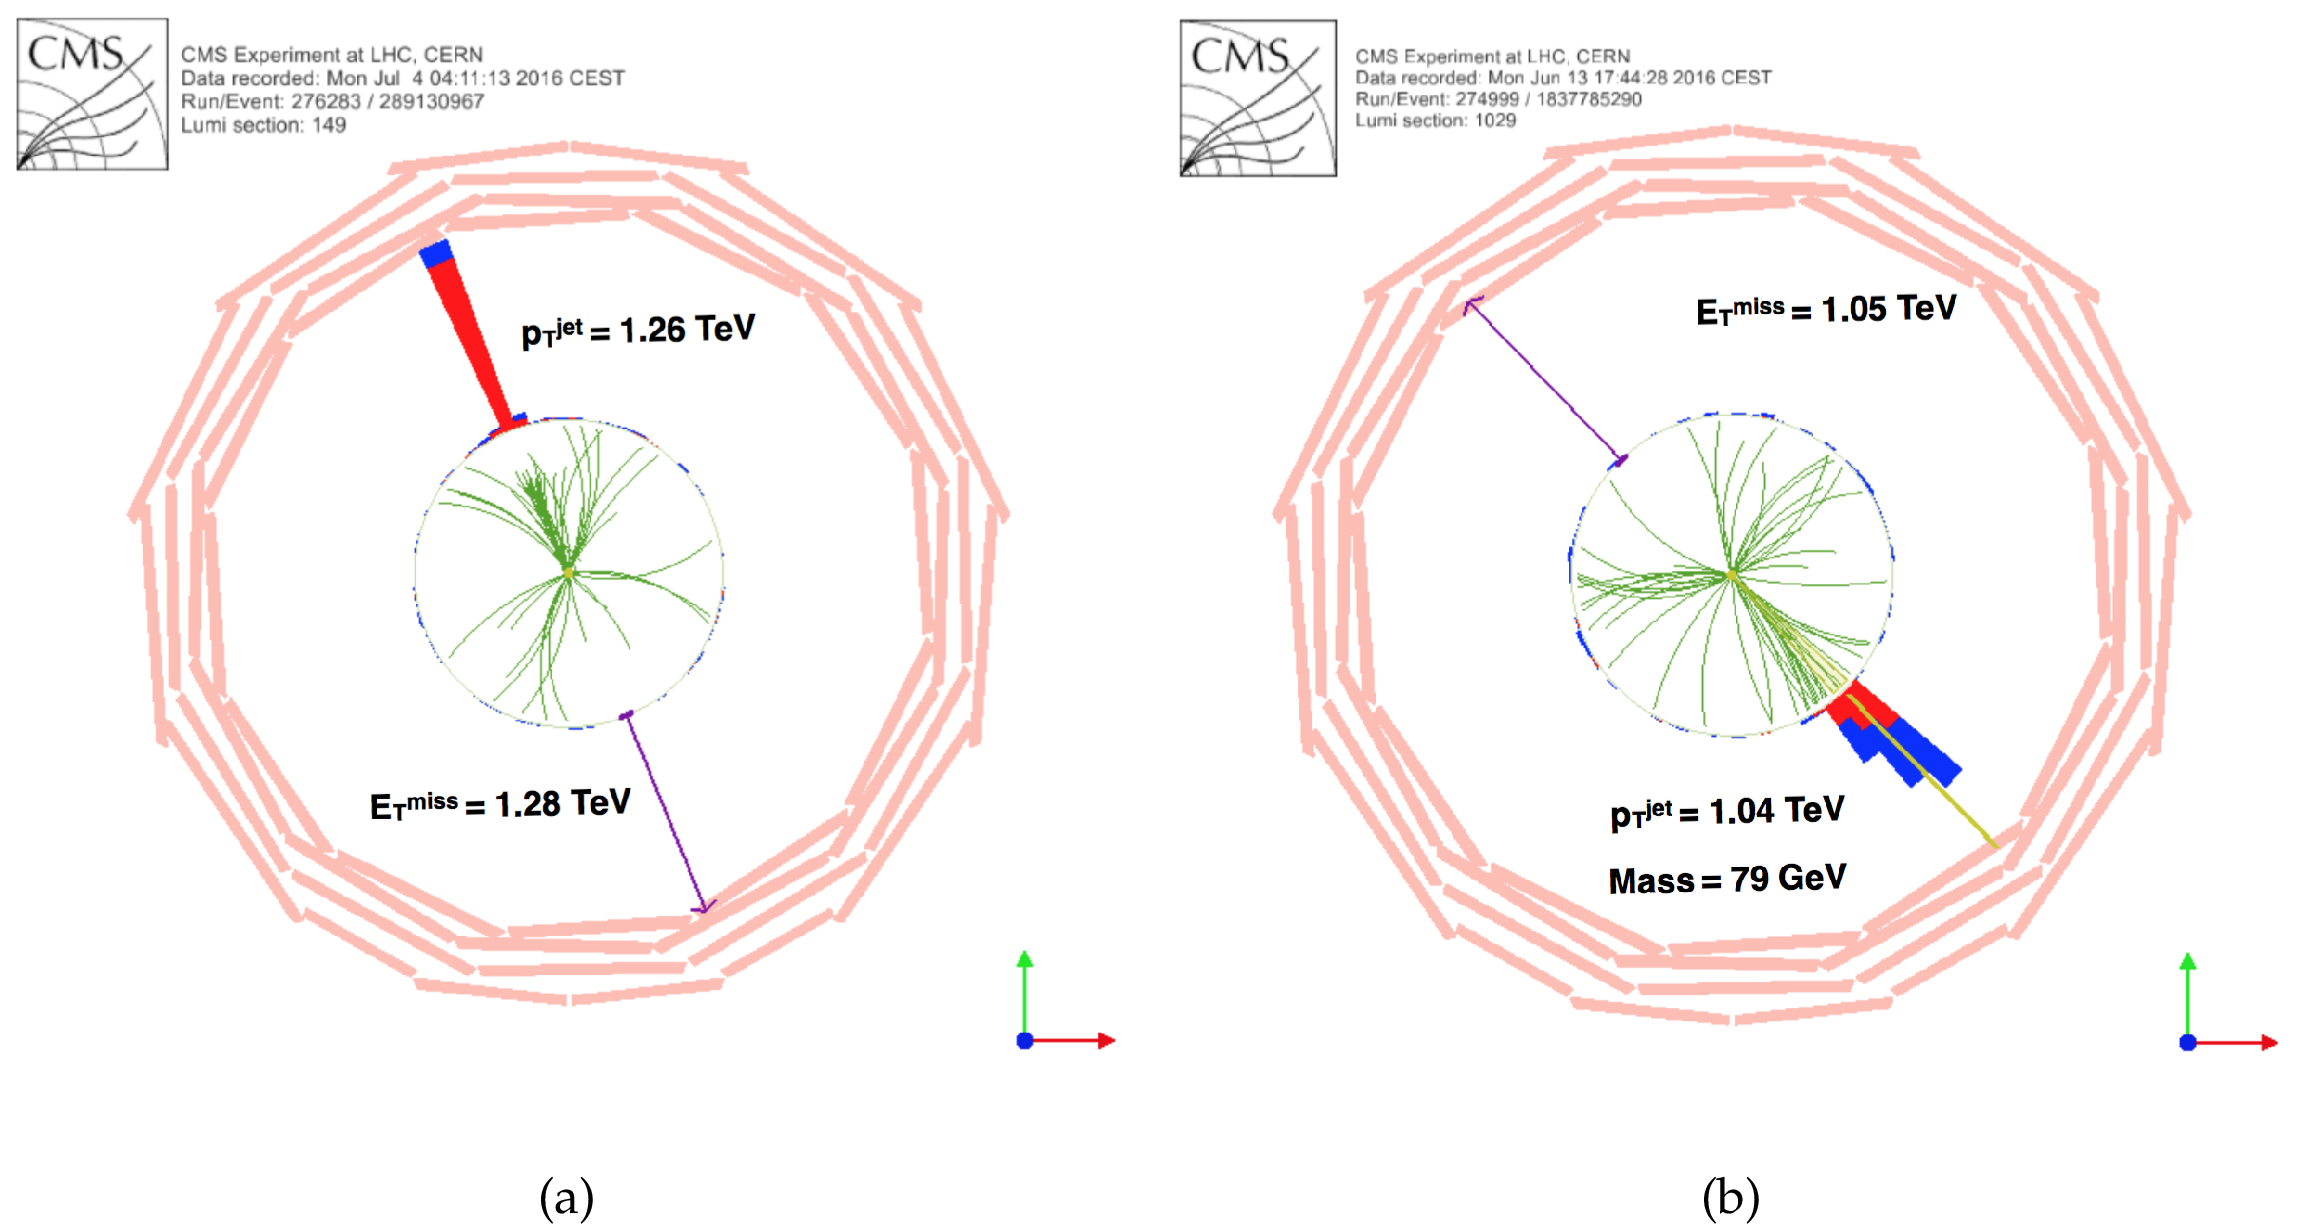
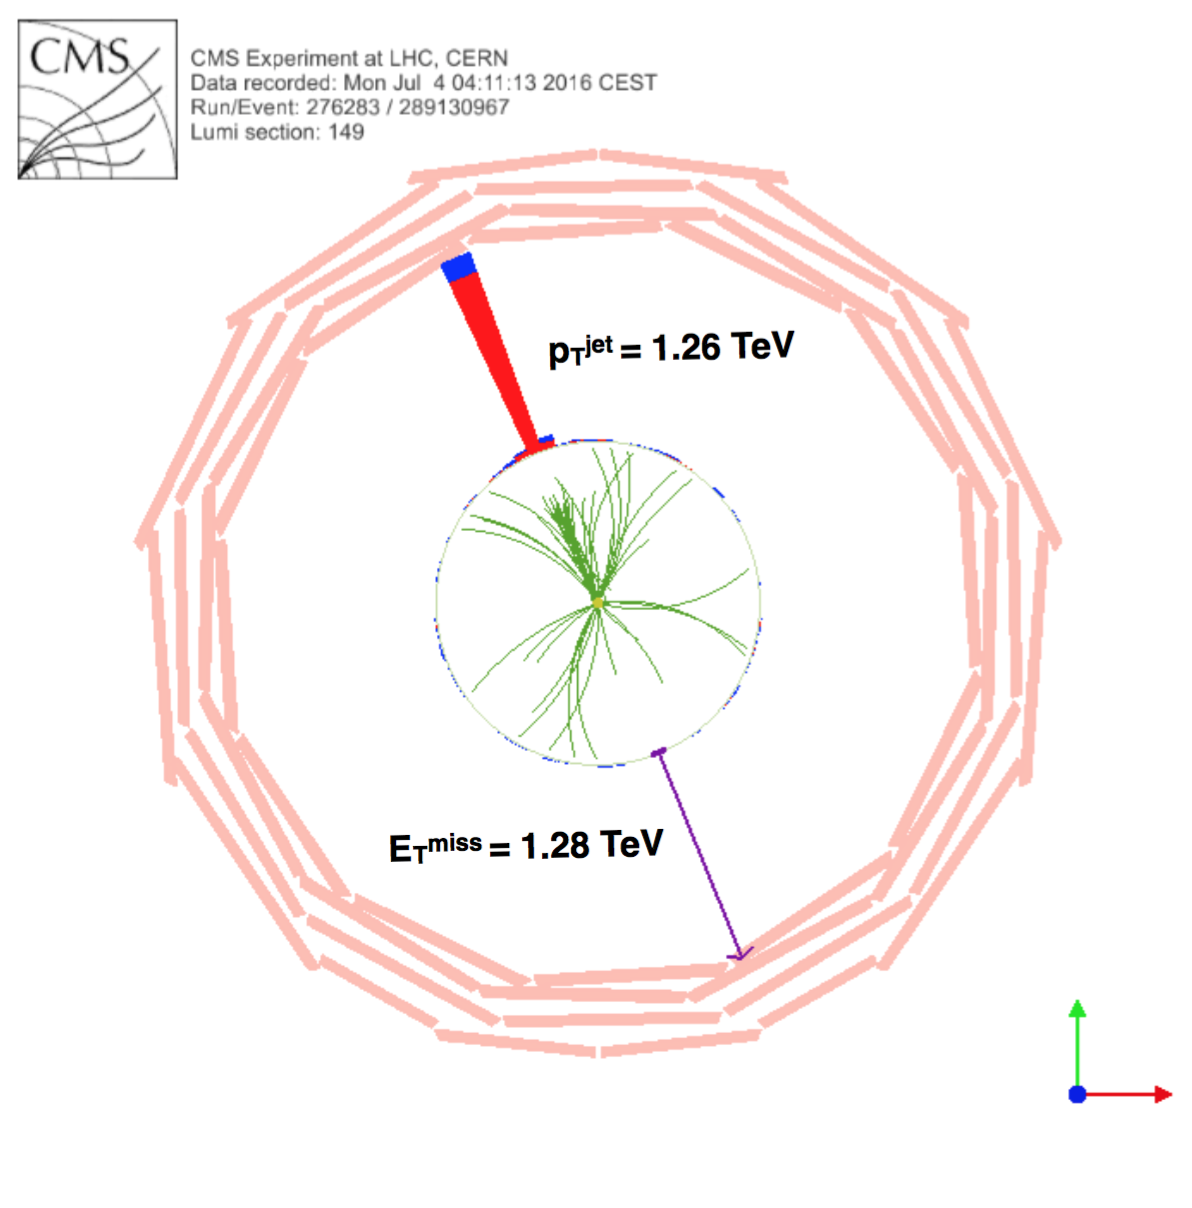
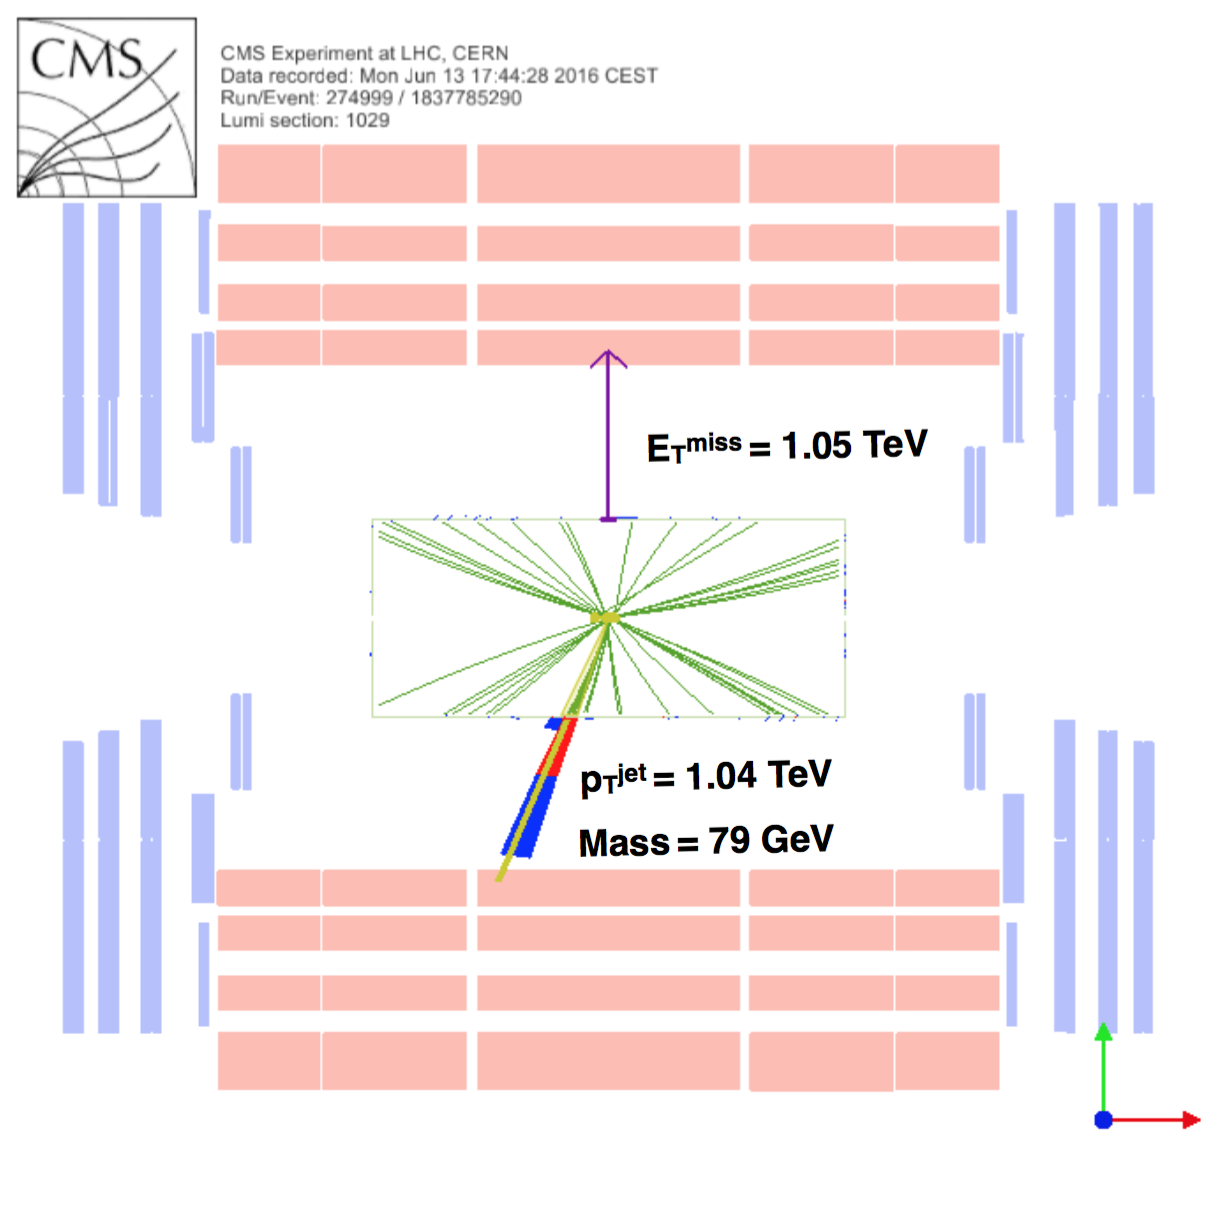
Additional Figure 1:
Event displays showing the $\rho $-$\phi $ view of events passing the monojet selection (a) and the mono-V selection (b). Event shown in (a) is also one of the highest ${E_{\mathrm {T}}^{\text {miss}}}$ event included in the analysis. |
png |
Additional Figure 1-a:
Event displays showing the $\rho$-$\phi $ view of events passing the monojet selection. The event is also one of the highest ${E_{\mathrm {T}}^{\text {miss}}}$ event included in the analysis. |

png |
Additional Figure 1-b:
Event displays showing the $\rho $-$\phi $ view of events passing the mono-V selection. |

png pdf |
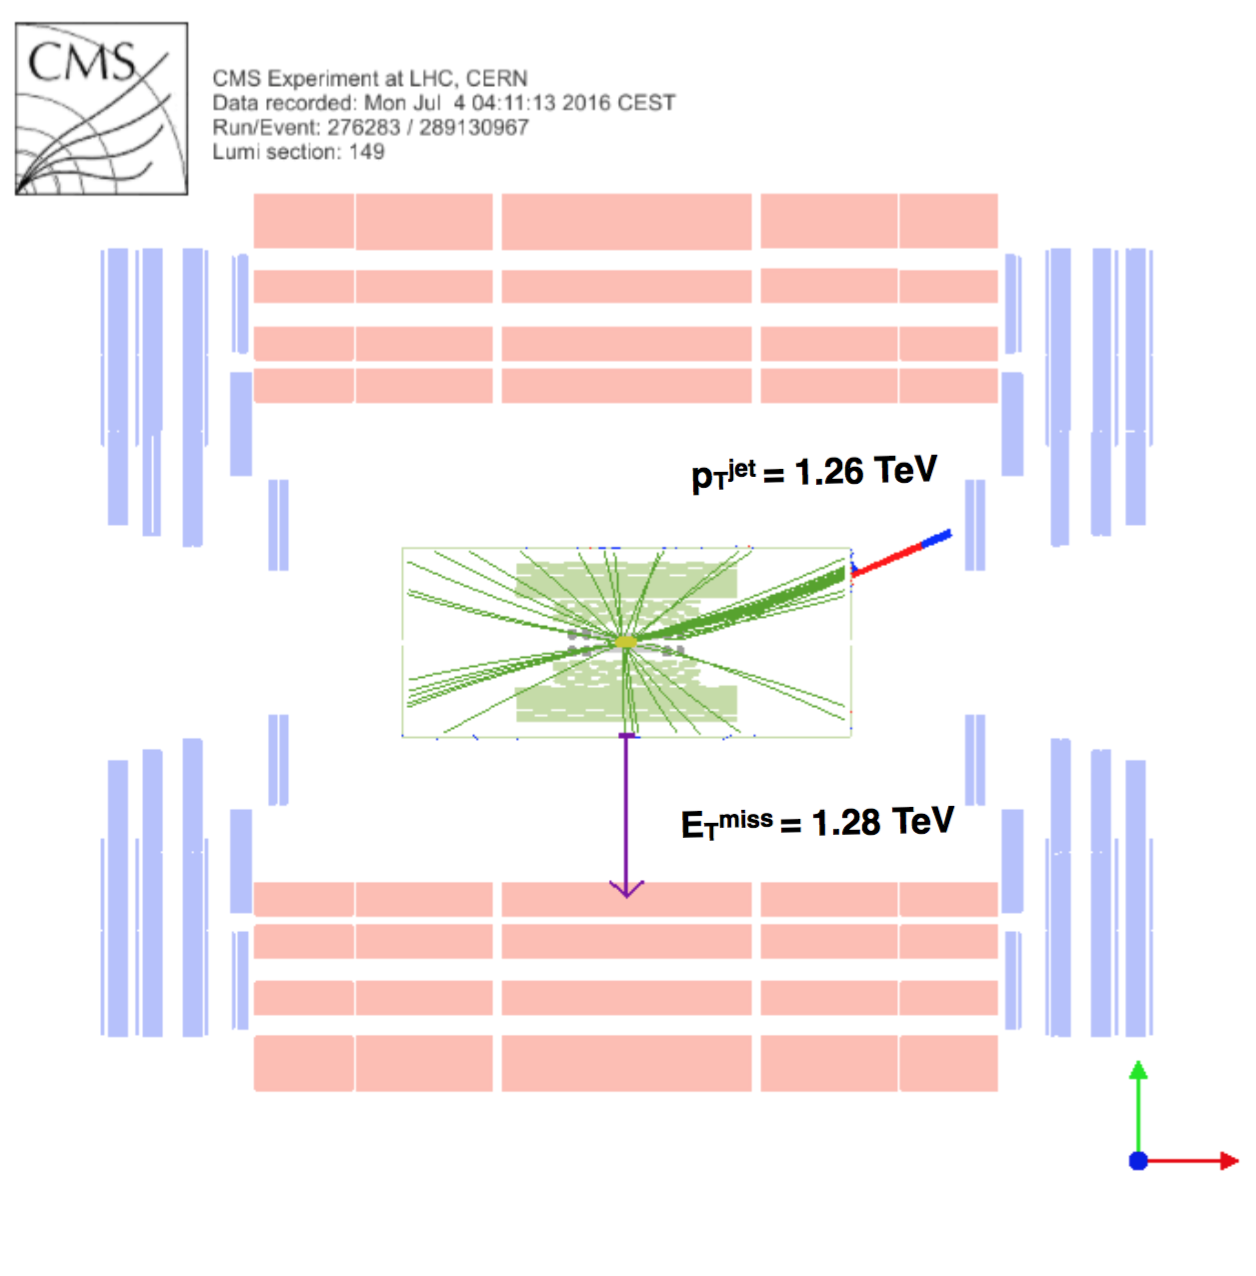
Additional Figure 2:
Event displays showing the $\rho $-$z$ view of events passing the monojet selection (a) and the mono-V selection (b). Event shown in (a) is also one of the highest ${E_{\mathrm {T}}^{\text {miss}}}$ event included in the analysis. |
png |
Additional Figure 2-a:
Event displays showing the $\rho $-$z$ view of events passing the monojet selection. The event is also one of the highest ${E_{\mathrm {T}}^{\text {miss}}}$ event included in the analysis. |
png |
Additional Figure 2-b:
Event displays showing the $\rho $-$z$ view of events passing the mono-V selection. |
png pdf |
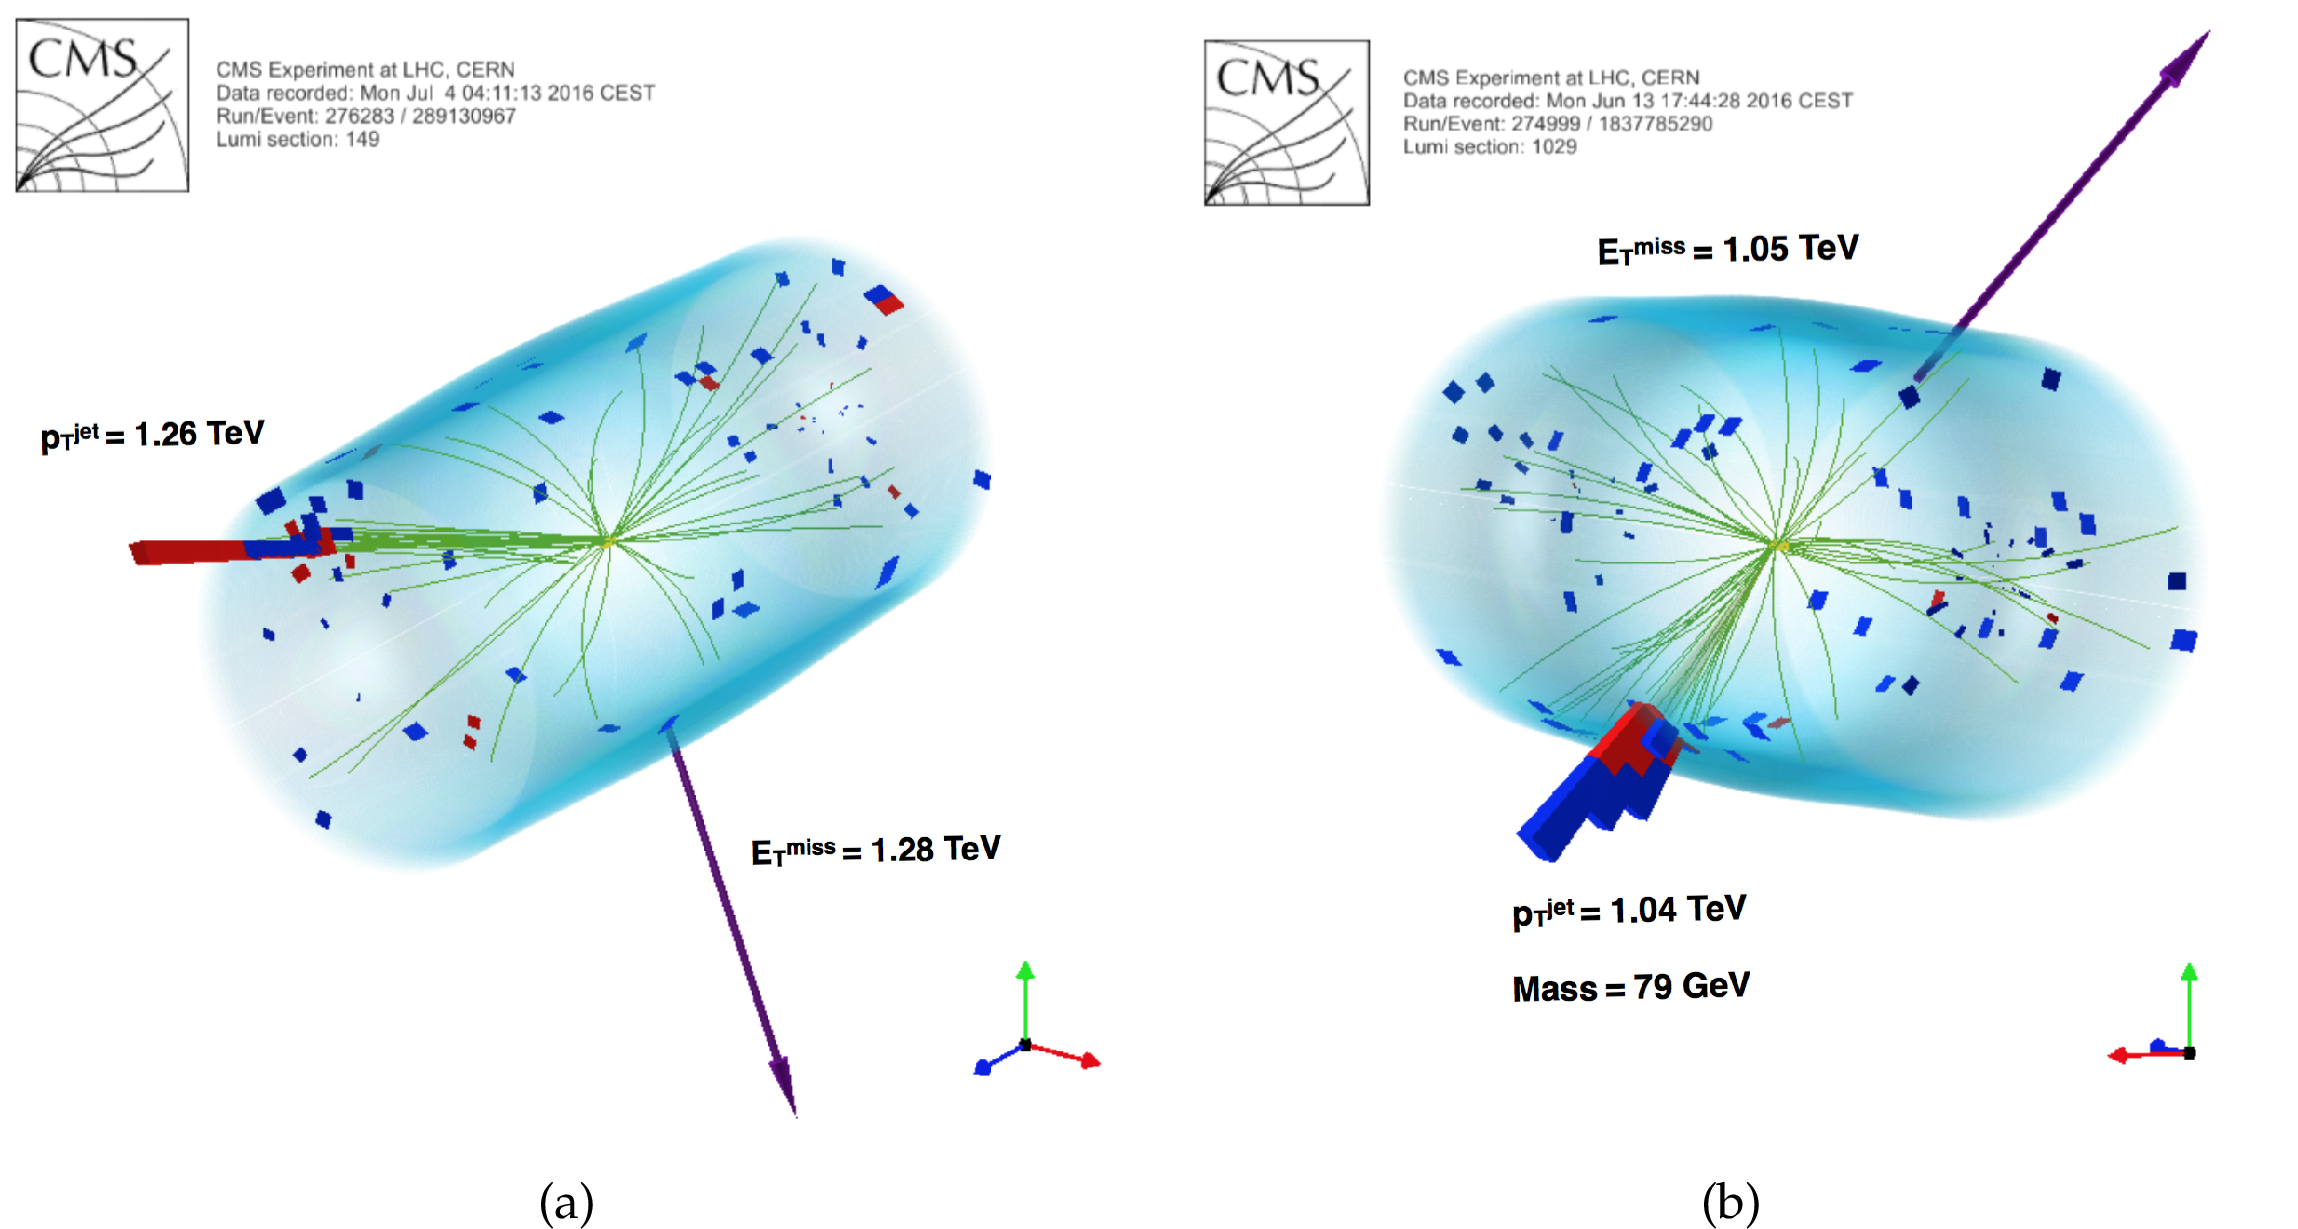
Additional Figure 3:
Event displays showing the three-dimensional view of events passing the monojet selection (a) and the mono-V selection (b). Event shown in (a) is also one of the highest ${E_{\mathrm {T}}^{\text {miss}}}$ event included in the analysis. |

png |
Additional Figure 3-a:
Event displays showing the three-dimensional view of events passing the monojet selection. The event is also one of the highest ${E_{\mathrm {T}}^{\text {miss}}}$ event included in the analysis. |

png |
Additional Figure 3-b:
Event displays showing the three-dimensional view of events passing the mono-V selection. |
| Additional Tables | |
png pdf |
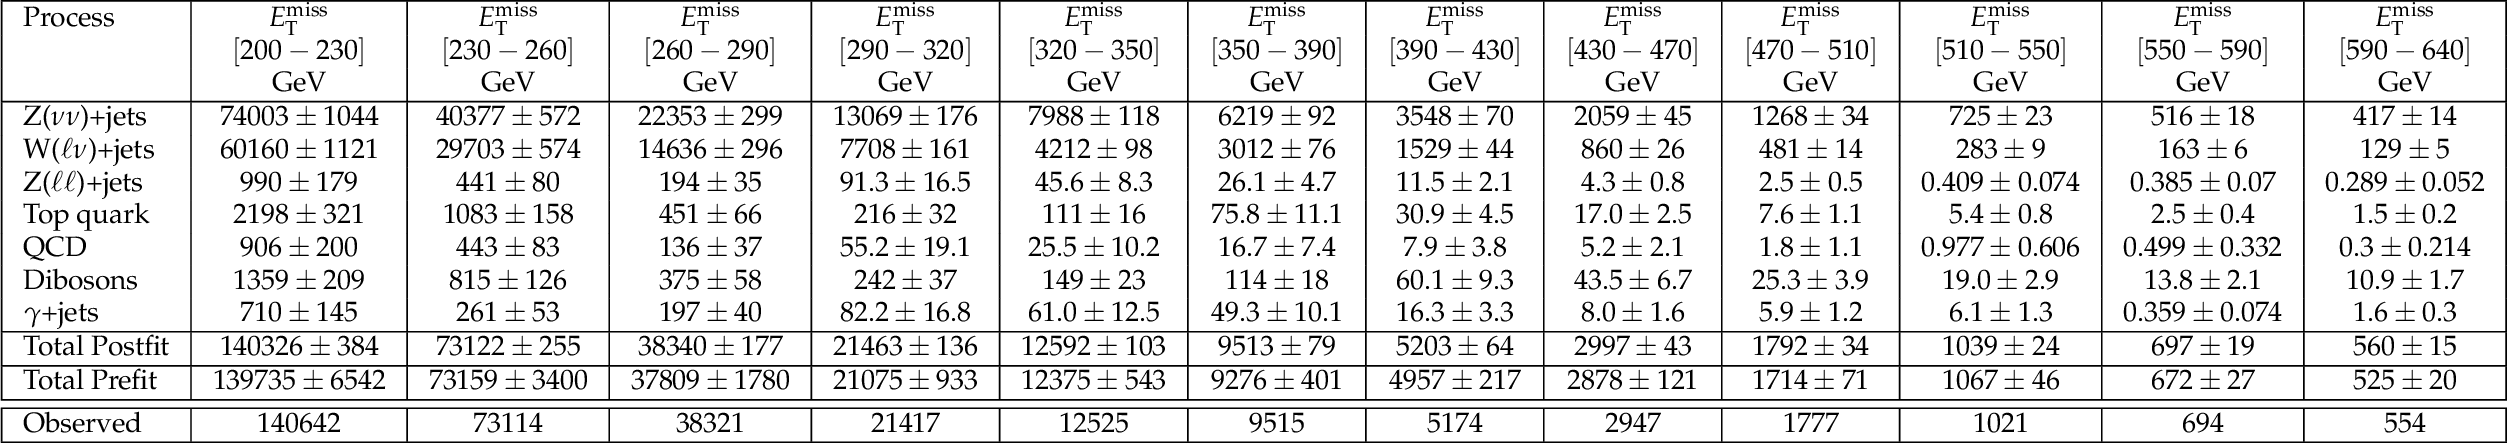
Additional Table 1:
Events yields of the various processes in each ${E_{\mathrm {T}}^{\text {miss}}}$ bin in the monojet category. The yields and the corresponding uncertainties are obtained after performing a combined fit of the signal and the control regions. The fit is performed assuming no signal. Total background predictions before (Total Prefit) and after (Total Postfit) the fit is performed are also shown. |

png pdf |
Additional Table 2:
Events yields of the various processes in each ${E_{\mathrm {T}}^{\text {miss}}}$ bin in the monojet category. The yields and the corresponding uncertainties are obtained after performing a combined fit of the signal and the control regions. When the expected background prediction was found to be 0 for a given bin, the statistical accuracy of the given process is shown as the upper bound. The fit is performed assuming no signal. Total background predictions before (Total Prefit) and after (Total Postfit) the fit is performed are also shown. |

png pdf |
Additional Table 3:
Events yields of the various processes in each ${E_{\mathrm {T}}^{\text {miss}}}$ bin in the mono-V category. The yields and the corresponding uncertainties are obtained after performing a combined fit of the signal and the control regions. When the expected background prediction was found to be 0 for a given bin, the statistical accuracy of the given process is shown as the upper bound. The fit is performed assuming no signal. Total background predictions before (Total Prefit) and after (Total Postfit) the fit is performed are also shown. |
| References | ||||
| 1 | J. L. Feng | Dark Matter Candidates from Particle Physics and Methods of Detection | Ann. Rev. Astron. Astrophys. 48 (2010) 495 | 1003.0904 |
| 2 | T. A. Porter, R. P. Johnson, and P. W. Graham | Dark Matter Searches with Astroparticle Data | Ann. Rev. Astron. Astrophys. 49 (2011) 155 | 1104.2836 |
| 3 | G. Busoni, A. De Simone, E. Morgante, and A. Riotto | On the Validity of the Effective Field Theory for Dark Matter Searches at the LHC | PLB728 (2014) 412 | 1307.2253 |
| 4 | O. Buchmueller, M. J. Dolan, and C. McCabe | Beyond Effective Field Theory for Dark Matter Searches at the LHC | JHEP 01 (2014) 025 | 1308.6799 |
| 5 | O. Buchmueller, M. J. Dolan, S. A. Malik, and C. McCabe | Characterising dark matter searches at colliders and direct detection experiments: Vector mediators | JHEP 01 (2015) 037 | 1407.8257 |
| 6 | ATLAS Collaboration | Search for dark matter in events with a hadronically decaying W or Z boson and missing transverse momentum in $ pp $ collisions at $ \sqrt{s} = $ 8 TeV with the ATLAS detector | PRL 112 (2014) 041802 | 1309.4017 |
| 7 | CMS Collaboration | Search for dark matter, extra dimensions, and unparticles in monojet events in proto-proton collisions at $ \sqrt{s} = 8 $ TeV | EPJC75 (2015) 235 | CMS-EXO-12-048 1408.3583 |
| 8 | ATLAS Collaboration | Search for new phenomena in final states with an energetic jet and large missing transverse momentum in pp collisions at $ \sqrt{s}= $8 TeV with the ATLAS detector | EPJC75 (2015) 299, , [Erratum:\it Eur. Phys. J.\/ \bf C75 (2015) 408] | 1502.01518 |
| 9 | CMS Collaboration | Search for dark matter in proton-proton collisions at 8 TeV with missing transverse momentum and vector boson tagged jets | CMS-EXO-12-055 1607.05764 |
|
| 10 | ATLAS Collaboration | Search for dark matter produced in association with a hadronically decaying vector boson in $ pp $ collisions at $ \sqrt{s} = 13 $ TeV with the ATLAS detector at the LHC | Physics Analysis Summary ATLAS-CONF-2015-080, CERN, Geneva, Dec | |
| 11 | CMS Collaboration | Search for dark matter production in association with jets, or hadronically decaying W or Z boson at $ \sqrt{s} = 13 $ TeV | CMS-PAS-EXO-16-013 | CMS-PAS-EXO-16-013 |
| 12 | ATLAS Collaboration | Search for new phenomena in final states with an energetic jet and large missing transverse momentum in $ pp $ collisions at $ \sqrt{s}=13 $ TeV using the ATLAS detector | 1604.07773 | |
| 13 | J. Alwall, P. Schuster, and N. Toro | Simplified Models for a First Characterization of New Physics at the LHC | PRD79 (2009) 075020 | 0810.3921 |
| 14 | J. Goodman and W. Shepherd | LHC Bounds on UV-Complete Models of Dark Matter | 1111.2359 | |
| 15 | LHC New Physics Working Group Collaboration | Simplified Models for LHC New Physics Searches | JPG39 (2012) 105005 | 1105.2838 |
| 16 | H. An, X. Ji, and L.-T. Wang | Light Dark Matter and $ Z' $ Dark Force at Colliders | JHEP 07 (2012) 182 | 1202.2894 |
| 17 | H. An, R. Huo, and L.-T. Wang | Searching for Low Mass Dark Portal at the LHC | Phys. Dark Univ. 2 (2013) 50 | 1212.2221 |
| 18 | A. DiFranzo, K. I. Nagao, A. Rajaraman, and T. M. P. Tait | Simplified Models for Dark Matter Interacting with Quarks | JHEP 11 (2013) 014, , [Erratum:\it JHEP\/ \bf 01 (2014) 162] | 1308.2679 |
| 19 | Y. Bai and J. Berger | Fermion Portal Dark Matter | JHEP 11 (2013) 171 | 1308.0612 |
| 20 | Y. Bai and J. Berger | Lepton Portal Dark Matter | JHEP 08 (2014) 153 | 1402.6696 |
| 21 | H. An, L.-T. Wang, and H. Zhang | Dark matter with $ t $-channel mediator: a simple step beyond contact interaction | PRD89 (2014) 115014 | 1308.0592 |
| 22 | J. Abdallah et al. | Simplified Models for Dark Matter and Missing Energy Searches at the LHC | 1409.2893 | |
| 23 | S. A. Malik et al. | Interplay and Characterization of Dark Matter Searches at Colliders and in Direct Detection Experiments | Phys. Dark Univ. 9-10 (2015) 51 | 1409.4075 |
| 24 | P. Harris, V. V. Khoze, M. Spannowsky, and C. Williams | Constraining Dark Sectors at Colliders: Beyond the Effective Theory Approach | PRD91 (2015) 055009 | 1411.0535 |
| 25 | M. R. Buckley, D. Feld, and D. Goncalves | Scalar Simplified Models for Dark Matter | PRD91 (2015) 015017 | 1410.6497 |
| 26 | U. Haisch and E. Re | Simplified dark matter top-quark interactions at the LHC | JHEP 06 (2015) 078 | 1503.00691 |
| 27 | P. Harris, V. V. Khoze, M. Spannowsky, and C. Williams | Closing up on Dark Sectors at Colliders: from 14 to 100 TeV | PRD93 (2016) 054030 | 1509.02904 |
| 28 | L. M. Carpenter et al. | Collider searches for dark matter in events with a Z boson and missing energy | PRD87 (2013) 074005 | 1212.3352 |
| 29 | N. F. Bell et al. | Searching for Dark Matter at the LHC with a Mono-Z | PRD86 (2012) 096011 | 1209.0231 |
| 30 | ATLAS Collaboration | Observation of a new particle in the search for the Standard Model Higgs boson with the ATLAS detector at the LHC | PLB716 (2012) 1 | 1207.7214 |
| 31 | CMS Collaboration | Observation of a new boson at a mass of 125 GeV with the CMS experiment at the LHC | PLB716 (2012) 30 | CMS-HIG-12-028 1207.7235 |
| 32 | CMS Collaboration | Observation of a new boson with mass near 125 GeV in pp collisions at $ \sqrt{s} $ = 7 and 8 TeV | JHEP 06 (2013) 081 | CMS-HIG-12-036 1303.4571 |
| 33 | CMS Collaboration | The CMS experiment at the CERN LHC | JINST 3 (2008) S08004 | CMS-00-001 |
| 34 | CMS Collaboration | Particle-Flow Event Reconstruction in CMS and Performance for Jets, Taus, and MET | CDS | |
| 35 | CMS Collaboration | Commissioning of the Particle-flow Event Reconstruction with the first LHC collisions recorded in the CMS detector | CDS | |
| 36 | M. Cacciari, G. P. Salam, and G. Soyez | The Anti-k(t) jet clustering algorithm | JHEP 04 (2008) 063 | 0802.1189 |
| 37 | M. Cacciari and G. P. Salam | Pileup subtraction using jet areas | PLB659 (2008) 119 | 0707.1378 |
| 38 | CMS Collaboration | Determination of jet energy calibration and transverse momentum resolution in CMS | JINST 6 (2011) 11002 | CMS-JME-10-011 1107.4277 |
| 39 | CMS Collaboration | Reconstruction and identification of $ \tau $ lepton decays to hadrons and $ \nu_\tau $ at CMS | JINST 11 (2016) P01019 | CMS-TAU-14-001 1510.07488 |
| 40 | CMS Collaboration | Identification of b-quark jets with the CMS experiment | JINST 8 (2013) P04013 | CMS-BTV-12-001 1211.4462 |
| 41 | CMS Collaboration | Identification of b quark jets at the CMS Experiment in the LHC Run 2 | CMS-PAS-BTV-15-001 | CMS-PAS-BTV-15-001 |
| 42 | S. D. Ellis, C. K. Vermilion, and J. R. Walsh | Recombination Algorithms and Jet Substructure: Pruning as a Tool for Heavy Particle Searches | PRD81 (2010) 094023 | 0912.0033 |
| 43 | J. Thaler and K. Van Tilburg | Identifying Boosted Objects with N-subjettiness | JHEP 03 (2011) 015 | 1011.2268 |
| 44 | J. Alwall et al. | The automated computation of tree-level and next-to-leading order differential cross sections, and their matching to parton shower simulations | JHEP 07 (2014) 079 | 1405.0301 |
| 45 | C. Oleari | The POWHEG-BOX | NPPS 205-206 (2010) 36 | 1007.3893 |
| 46 | T. Sj\"ostrand et al. | An Introduction to PYTHIA 8.2 | CPC 191 (2015) 159 | 1410.3012 |
| 47 | Y. Gao et al. | Spin determination of single-produced resonances at hadron colliders | PRD81 (2010) 075022 | 1001.3396 |
| 48 | S. Bolognesi et al. | On the spin and parity of a single-produced resonance at the LHC | PRD86 (2012) 095031 | 1208.4018 |
| 49 | I. Anderson et al. | Constraining anomalous HVV interactions at proton and lepton colliders | Phys.Rev. D89 (2014) 035007 | 1309.4819 |
| 50 | CMS Collaboration | Event generator tunes obtained from underlying event and multiparton scattering measurements | EPJC76 (2016) 155 | CMS-GEN-14-001 1512.00815 |
| 51 | R. Frederix and S. Frixione | Merging meets matching in MC@NLO | JHEP 12 (2012) 061 | 1209.6215 |
| 52 | M. L. Mangano, M. Moretti, F. Piccinini, and M. Treccani | Matching matrix elements and shower evolution for top-quark production in hadronic collisions | JHEP 01 (2007) 013 | hep-ph/0611129 |
| 53 | NNPDF Collaboration | Parton distributions for the LHC Run II | JHEP 04 (2015) 040 | 1410.8849 |
| 54 | GEANT4 Collaboration | GEANT4: A Simulation toolkit | NIMA506 (2003) 250 | |
| 55 | CMS Collaboration | Performance of Photon Reconstruction and Identification with the CMS Detector in Proton-Proton Collisions at $ \sqrt{s} $ = 8 TeV | JINST 10 (2015) P08010 | CMS-EGM-14-001 1502.02702 |
| 56 | CMS Collaboration | Data-Driven Estimation of the Invisible Z Background to the SUSY MET Plus Jets Search | CDS | |
| 57 | CMS Collaboration | Search for New Physics with Jets and Missing Transverse Momentum in $ pp $ collisions at $ \sqrt{s}=7 $ TeV | JHEP 08 (2011) 155 | CMS-SUS-10-005 1106.4503 |
| 58 | J. H. Kuhn, A. Kulesza, S. Pozzorini, and M. Schulze | Electroweak corrections to hadronic photon production at large transverse momenta | JHEP 03 (2006) 059 | hep-ph/0508253 |
| 59 | S. Kallweit et al. | NLO electroweak automation and precise predictions for W+multijet production at the LHC | JHEP 04 (2015) 012 | 1412.5157 |
| 60 | S. Kallweit et al. | NLO QCD+EW automation and precise predictions for V+multijet production | in 50th Rencontres de Moriond on QCD and High Energy Interactions La Thuile, Italy, March 21-28, 2015 2015 | 1505.05704 |
| 61 | S. Kallweit et al. | NLO QCD+EW predictions for V + jets including off-shell vector-boson decays and multijet merging | JHEP 04 (2016) 021 | 1511.08692 |
| 62 | CMS Collaboration | Searches for Supersymmetry using the M$ _{T2} $ Variable in Hadronic Events Produced in pp Collisions at 8 TeV | JHEP 05 (2015) 078 | CMS-SUS-13-019 1502.04358 |
| 63 | M. Czakon, D. Heymes, and A. Mitov | High-precision differential predictions for top-quark pairs at the LHC | PRL 116 (2016) 082003 | 1511.00549 |
| 64 | CMS Collaboration | Measurement of the top quark pair production cross section in proton-proton collisions at $ \sqrt{s} = $ 13 TeV | PRL 116 (2016) 052002 | CMS-TOP-15-003 1510.05302 |
| 65 | CMS Collaboration | Measurement of the ZZ production cross section and Z to l+l-l'+l'- branching fraction in pp collisions at $ \sqrt{s} $ = 13 TeV | CMS-SMP-16-001 1607.08834 |
|
| 66 | CMS Collaboration | Measurement of the WZ production cross section in pp collisions at $ \sqrt{s} $ = 13 TeV | CMS-SMP-16-002 1607.06943 |
|
| 67 | CMS Collaboration | Performance of the CMS missing transverse momentum reconstruction in pp data at $ \sqrt{s} $ = 8 TeV | JINST 10 (2015) P02006 | CMS-JME-13-003 1411.0511 |
| 68 | D. Abercrombie et al. | Dark Matter Benchmark Models for Early LHC Run-2 Searches: Report of the ATLAS/CMS Dark Matter Forum | 1507.00966 | |
| 69 | P. J. Fox, R. Harnik, J. Kopp, and Y. Tsai | Missing Energy Signatures of Dark Matter at the LHC | PRD85 (2012) 056011 | 1109.4398 |
| 70 | LHC Higgs Cross Section Working Group Collaboration | Handbook of LHC Higgs Cross Sections: 3. Higgs Properties | 1307.1347 | |
| 71 | T. Junk | Confidence level computation for combining searches with small statistics | NIMA434 (1999) 435 | hep-ex/9902006 |
| 72 | A. L. Read | Presentation of search results: the CLs technique | JPG28 (2002) 2693 | |
| 73 | G. Cowan, K. Cranmer, E. Gross, and O. Vitells | Asymptotic formulae for likelihood-based tests of new physics | EPJC71 (2011) 1554, , [Erratum: \it Eur. Phys. J. C \bf 73 (2013) 2501] | 1007.1727 |
| 74 | WMAP Collaboration | The Microwave Anisotropy Probe (MAP) mission | Astrophys.J. 583 (2003) 1 | astro-ph/0301158 |
| 75 | Planck Collaboration | Planck 2015 results. XIII. Cosmological parameters | 1502.01589 | |
| 76 | M. Backovic, K. Kong, and M. McCaskey | MadDM v.1.0: Computation of Dark Matter Relic Abundance Using MadGraph5 | Phys. Dark Univ. 5-6 (2014) 18 | 1308.4955 |
| 77 | Planck Collaboration | Planck 2013 results. XVI. Cosmological parameters | Astron. Astrophys. 571 (2014) A16 | 1303.5076 |
| 78 | Planck Collaboration | The Scientific programme of Planck | astro-ph/0604069 | |
| 79 | A. Kurylov and M. Kamionkowski | Generalized analysis of weakly interacting massive particle searches | PRD69 (2004) 063503 | hep-ph/0307185 |
| 80 | J. Hisano, K. Ishiwata, and N. Nagata | Gluon contribution to the dark matter direct detection | PRD82 (2010) 115007 | 1007.2601 |
| 81 | SuperCDMS Collaboration | New Results from the Search for Low-Mass Weakly Interacting Massive Particles with the CDMS Low Ionization Threshold Experiment | PRL 116 (2016) 071301 | 1509.02448 |
| 82 | LUX Collaboration | Improved Limits on Scattering of Weakly Interacting Massive Particles from Reanalysis of 2013 LUX Data | PRL 116 (2016) 161301 | 1512.03506 |
| 83 | PandaX-II Collaboration | Dark Matter Results from First 98.7-day Data of PandaX-II Experiment | 1607.07400 | |
| 84 | CRESST Collaboration | Results on light dark matter particles with a low-threshold CRESST-II detector | EPJC76 (2016) 25 | 1509.01515 |
| 85 | PICO Collaboration | Improved dark matter search results from PICO-2L Run 2 | PRD93 (2016) 061101 | 1601.03729 |
| 86 | PICO Collaboration | Dark matter search results from the PICO-60 CF$ _3 $I bubble chamber | PRD93 (2016) 052014 | 1510.07754 |
| 87 | IceCube Collaboration | Improved limits on dark matter annihilation in the Sun with the 79-string IceCube detector and implications for supersymmetry | JCAP 04 (2016) 022 | 1601.00653 |
| 88 | Super-Kamiokande Collaboration | Search for neutrinos from annihilation of captured low-mass dark matter particles in the Sun by Super-Kamiokande | PRL 114 (2015) 141301 | 1503.04858 |
| 89 | Fermi-LAT Collaboration | Constraining Dark Matter Models from a Combined Analysis of Milky Way Satellites with the Fermi Large Area Telescope | PRL 107 (2011) 241302 | 1108.3546 |
| 90 | Fermi-LAT Collaboration | Observations of Milky Way Dwarf Spheroidal galaxies with the Fermi-LAT detector and constraints on Dark Matter models | Astrophys. J. 712 (2010) 147 | 1001.4531 |
| 91 | Fermi-LAT Collaboration | Searching for Dark Matter Annihilation from Milky Way Dwarf Spheroidal Galaxies with Six Years of Fermi Large Area Telescope Data | PRL 115 (2015) 231301 | 1503.02641 |
|
|
Compact Muon Solenoid LHC, CERN |
|

|

|

|

|

|