

Compact Muon Solenoid
LHC, CERN
| CMS-PAS-FTR-18-027 | ||
| Constraining nuclear parton distributions with heavy ion collisions at the HL-LHC with the CMS experiment | ||
| CMS Collaboration | ||
| December 2018 | ||
| Abstract: Recent measurements in heavy ion collisions by the CERN LHC Collaborations have been used to assess nuclear effects and provide valuable data for nuclear parton distribution analyses. In this note, performance studies for measurements with the CMS detector at the High-Luminosity LHC (HL-LHC) are presented. These include the coherent $\Upsilon(1\text{S})$ photoproduction in ultraperipheral lead-lead collisions, corresponding to a total integrated luminosity of 10 nb$^{-1}$ at a nucleon-nucleon (NN) center-of-mass energy ($\sqrt{\smash [b]{s_{_{\mathrm {NN}}}}}$) of 5.5 TeV. This note also presents the performance studies at the HL-LHC for analyses of inclusive Z boson, dijet, and top quark pair production in proton-lead collisions at $\sqrt{\smash [b]{s_{_{\mathrm {NN}}}}}= $ 8.16 TeV for an integrated luminosity of 2 pb$^{-1}$. | ||
| Links: CDS record (PDF) ; inSPIRE record ; CADI line (restricted) ; | ||
| Figures | |

png pdf |
Figure 1:
Projections for gluon shadowing factor measured with $\Upsilon (1\text{S})$ photoproduction in ultraperipheral PbPb collisions at $ {\sqrt {\smash [b]{s_{_{\mathrm {NN}}}}}} =$ 5.5 TeV. The error bars represent the statistical uncertainties, and the boxes the systematic ones. The projected data is compared to the central value of the EPS09 global fit [26]. The most dominant uncertainties are those of EPS09 (not shown). |
png pdf |
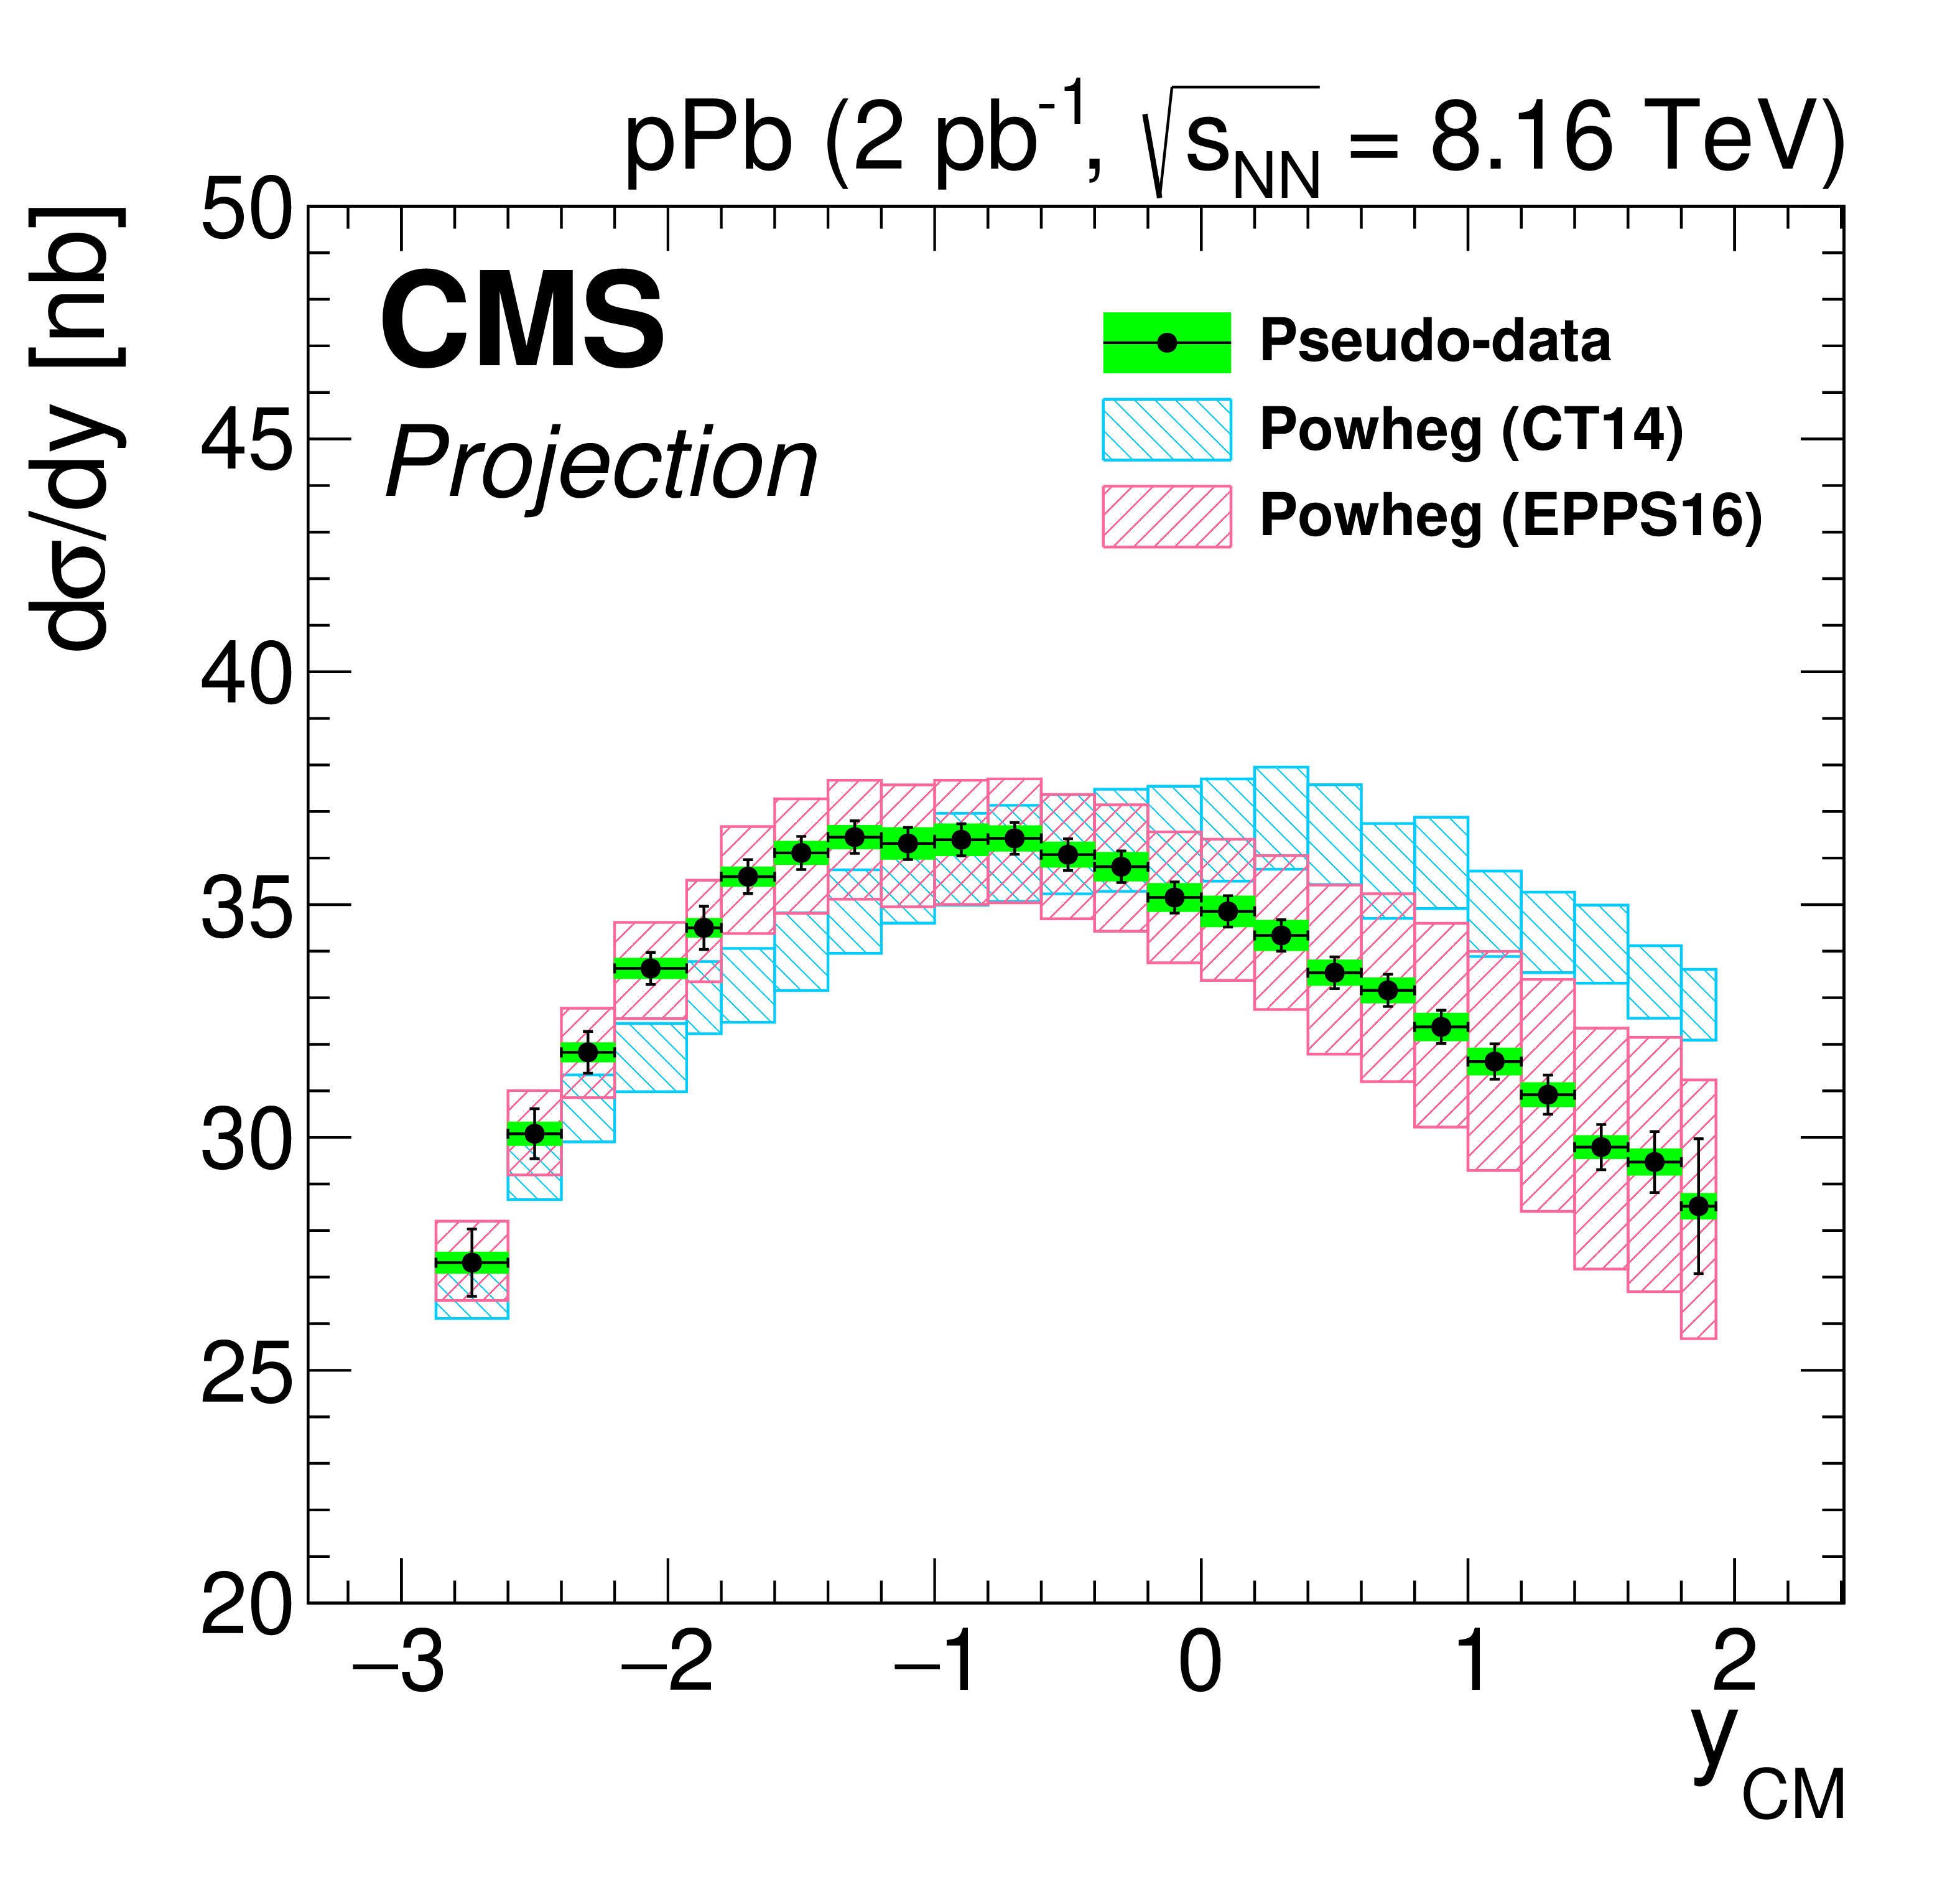
Figure 2:
Projections for Z boson differential cross section in pPb collisions at $ {\sqrt {\smash [b]{s_{_{\mathrm {NN}}}}}} =$ 8.16 TeV as a function of the Z boson rapidity in the center-of-mass (CM) frame. The expectations from CT14 PDF and EPPS16 nPDF are also shown. |

png pdf |
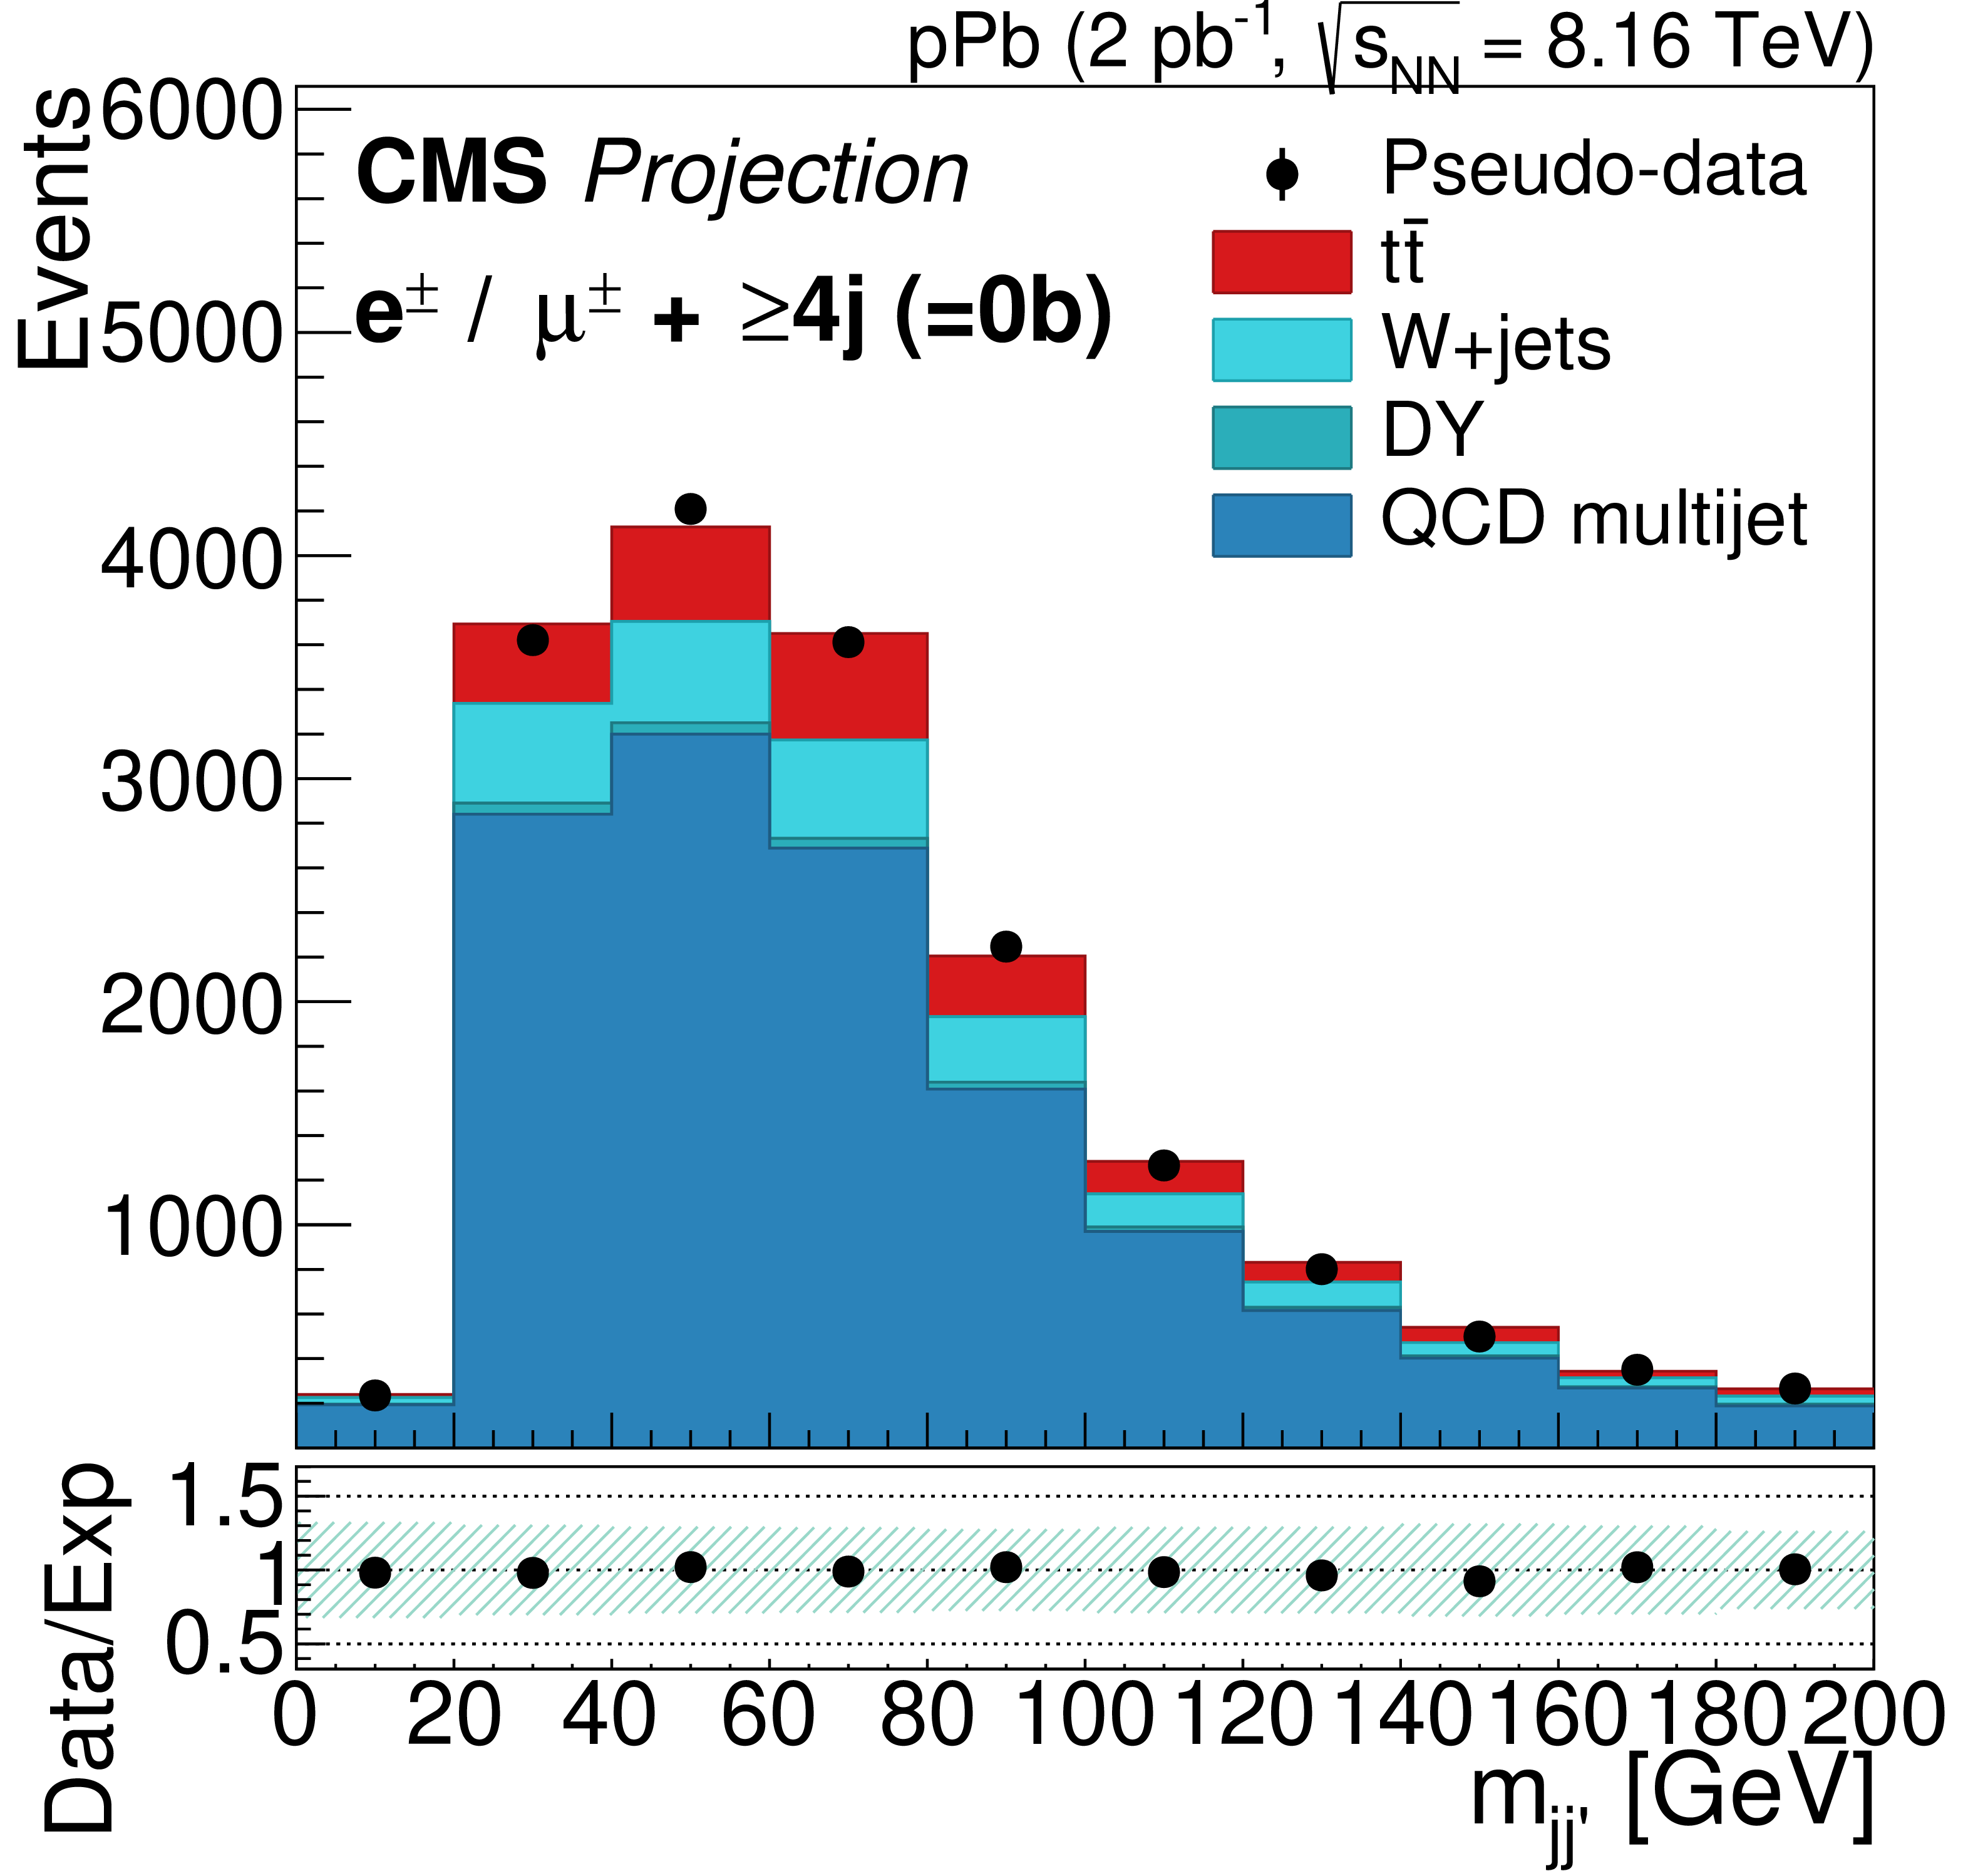
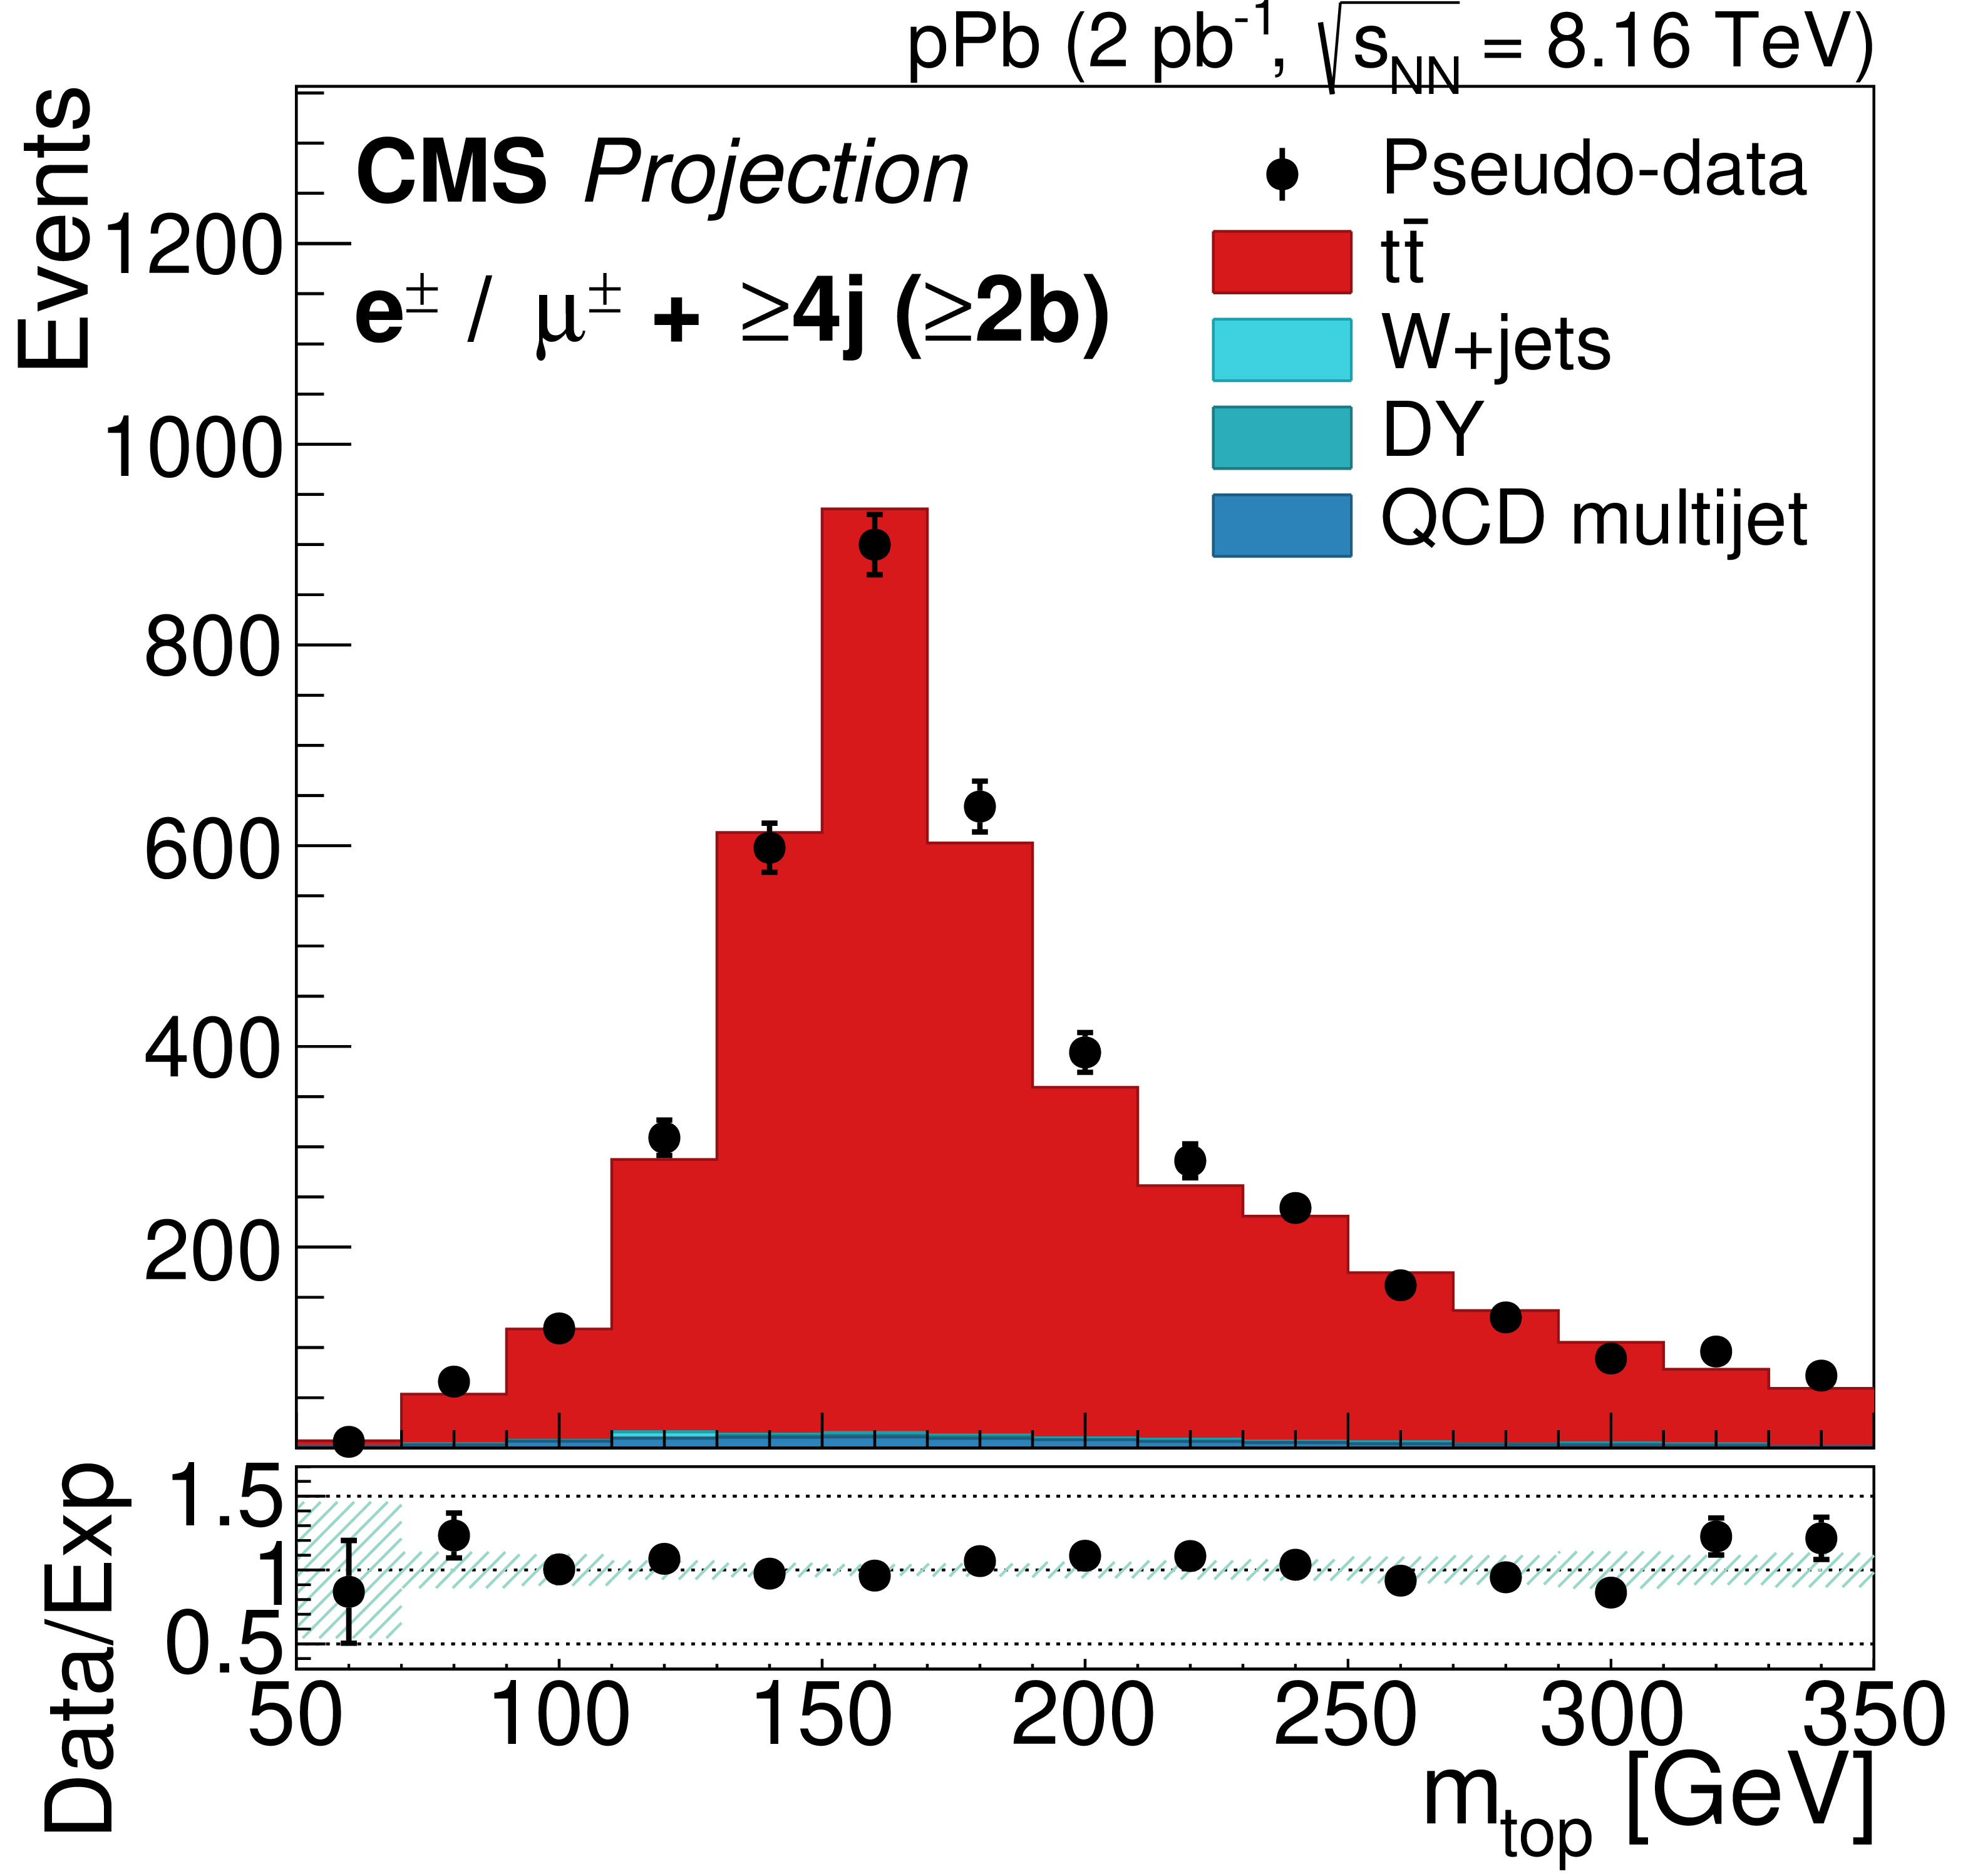
Figure 3:
Distributions of the ${m_{{\mathrm {j} \mathrm {j}^{\prime}}}}$ (top) and ${m_\text {top}}$ (bottom). From left to right the events are classified in the 0, 1, and 2 b-tagged jet categories. The sum of the predictions for the $ {{\mathrm {t}\overline {\mathrm {t}}}} $ signal and background is compared to pseudo-data (sampled randomly from the total of the predictions in each category). The bottom plots show the ratio between the pseudo-data and the sum of the predictions. The shaded band represents the relative uncertainty due to the limited event count in the simulated samples and the estimate of the normalization of the QCD multijet background. |
png pdf |
Figure 3-a:
Distribution of ${m_{{\mathrm {j} \mathrm {j}^{\prime}}}}$ for events classified in the 0 b-tagged jet category. The sum of the predictions for the $ {{\mathrm {t}\overline {\mathrm {t}}}} $ signal and background is compared to pseudo-data (sampled randomly from the total of the predictions in each category). The bottom plot shows the ratio between the pseudo-data and the sum of the predictions. The shaded band represents the relative uncertainty due to the limited event count in the simulated samples and the estimate of the normalization of the QCD multijet background. |
png pdf |
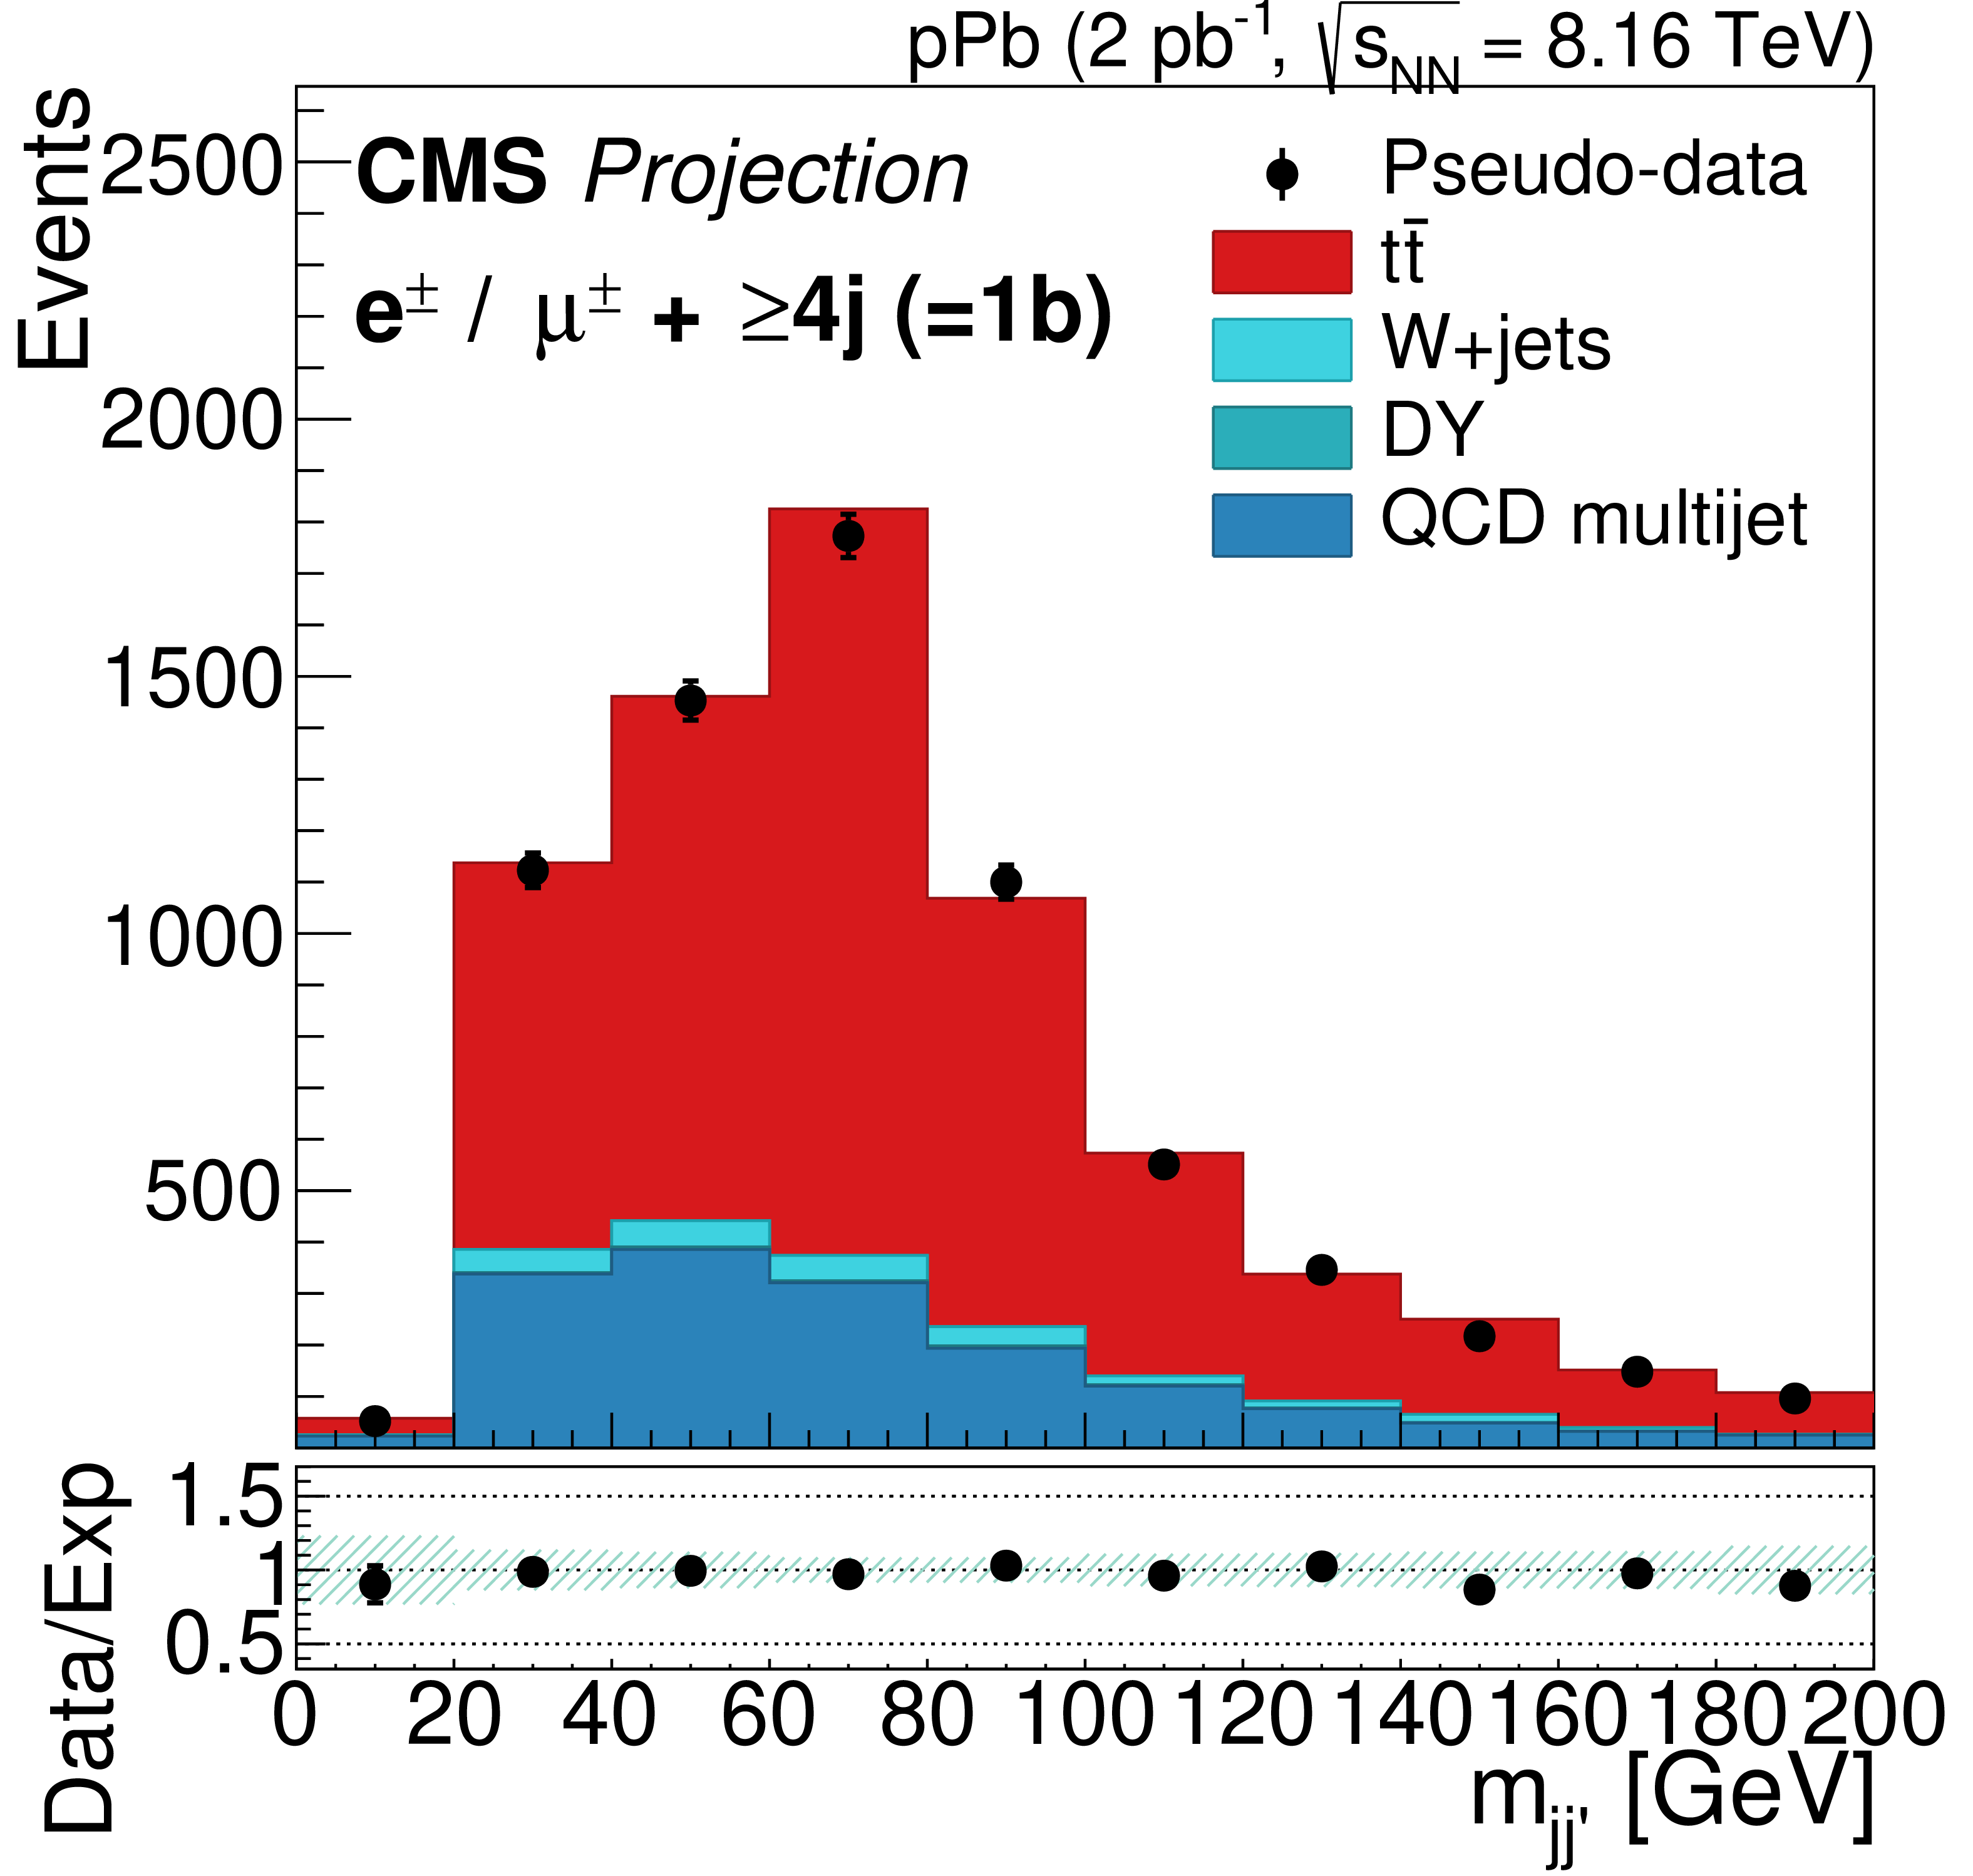
Figure 3-b:
Distribution of ${m_{{\mathrm {j} \mathrm {j}^{\prime}}}}$ for events classified in the 1 b-tagged jet category. The sum of the predictions for the $ {{\mathrm {t}\overline {\mathrm {t}}}} $ signal and background is compared to pseudo-data (sampled randomly from the total of the predictions in each category). The bottom plot shows the ratio between the pseudo-data and the sum of the predictions. The shaded band represents the relative uncertainty due to the limited event count in the simulated samples and the estimate of the normalization of the QCD multijet background. |

png pdf |
Figure 3-c:
Distribution of ${m_{{\mathrm {j} \mathrm {j}^{\prime}}}}$ for events classified in the 2 b-tagged jet category. The sum of the predictions for the $ {{\mathrm {t}\overline {\mathrm {t}}}} $ signal and background is compared to pseudo-data (sampled randomly from the total of the predictions in each category). The bottom plot shows the ratio between the pseudo-data and the sum of the predictions. The shaded band represents the relative uncertainty due to the limited event count in the simulated samples and the estimate of the normalization of the QCD multijet background. |
png pdf |
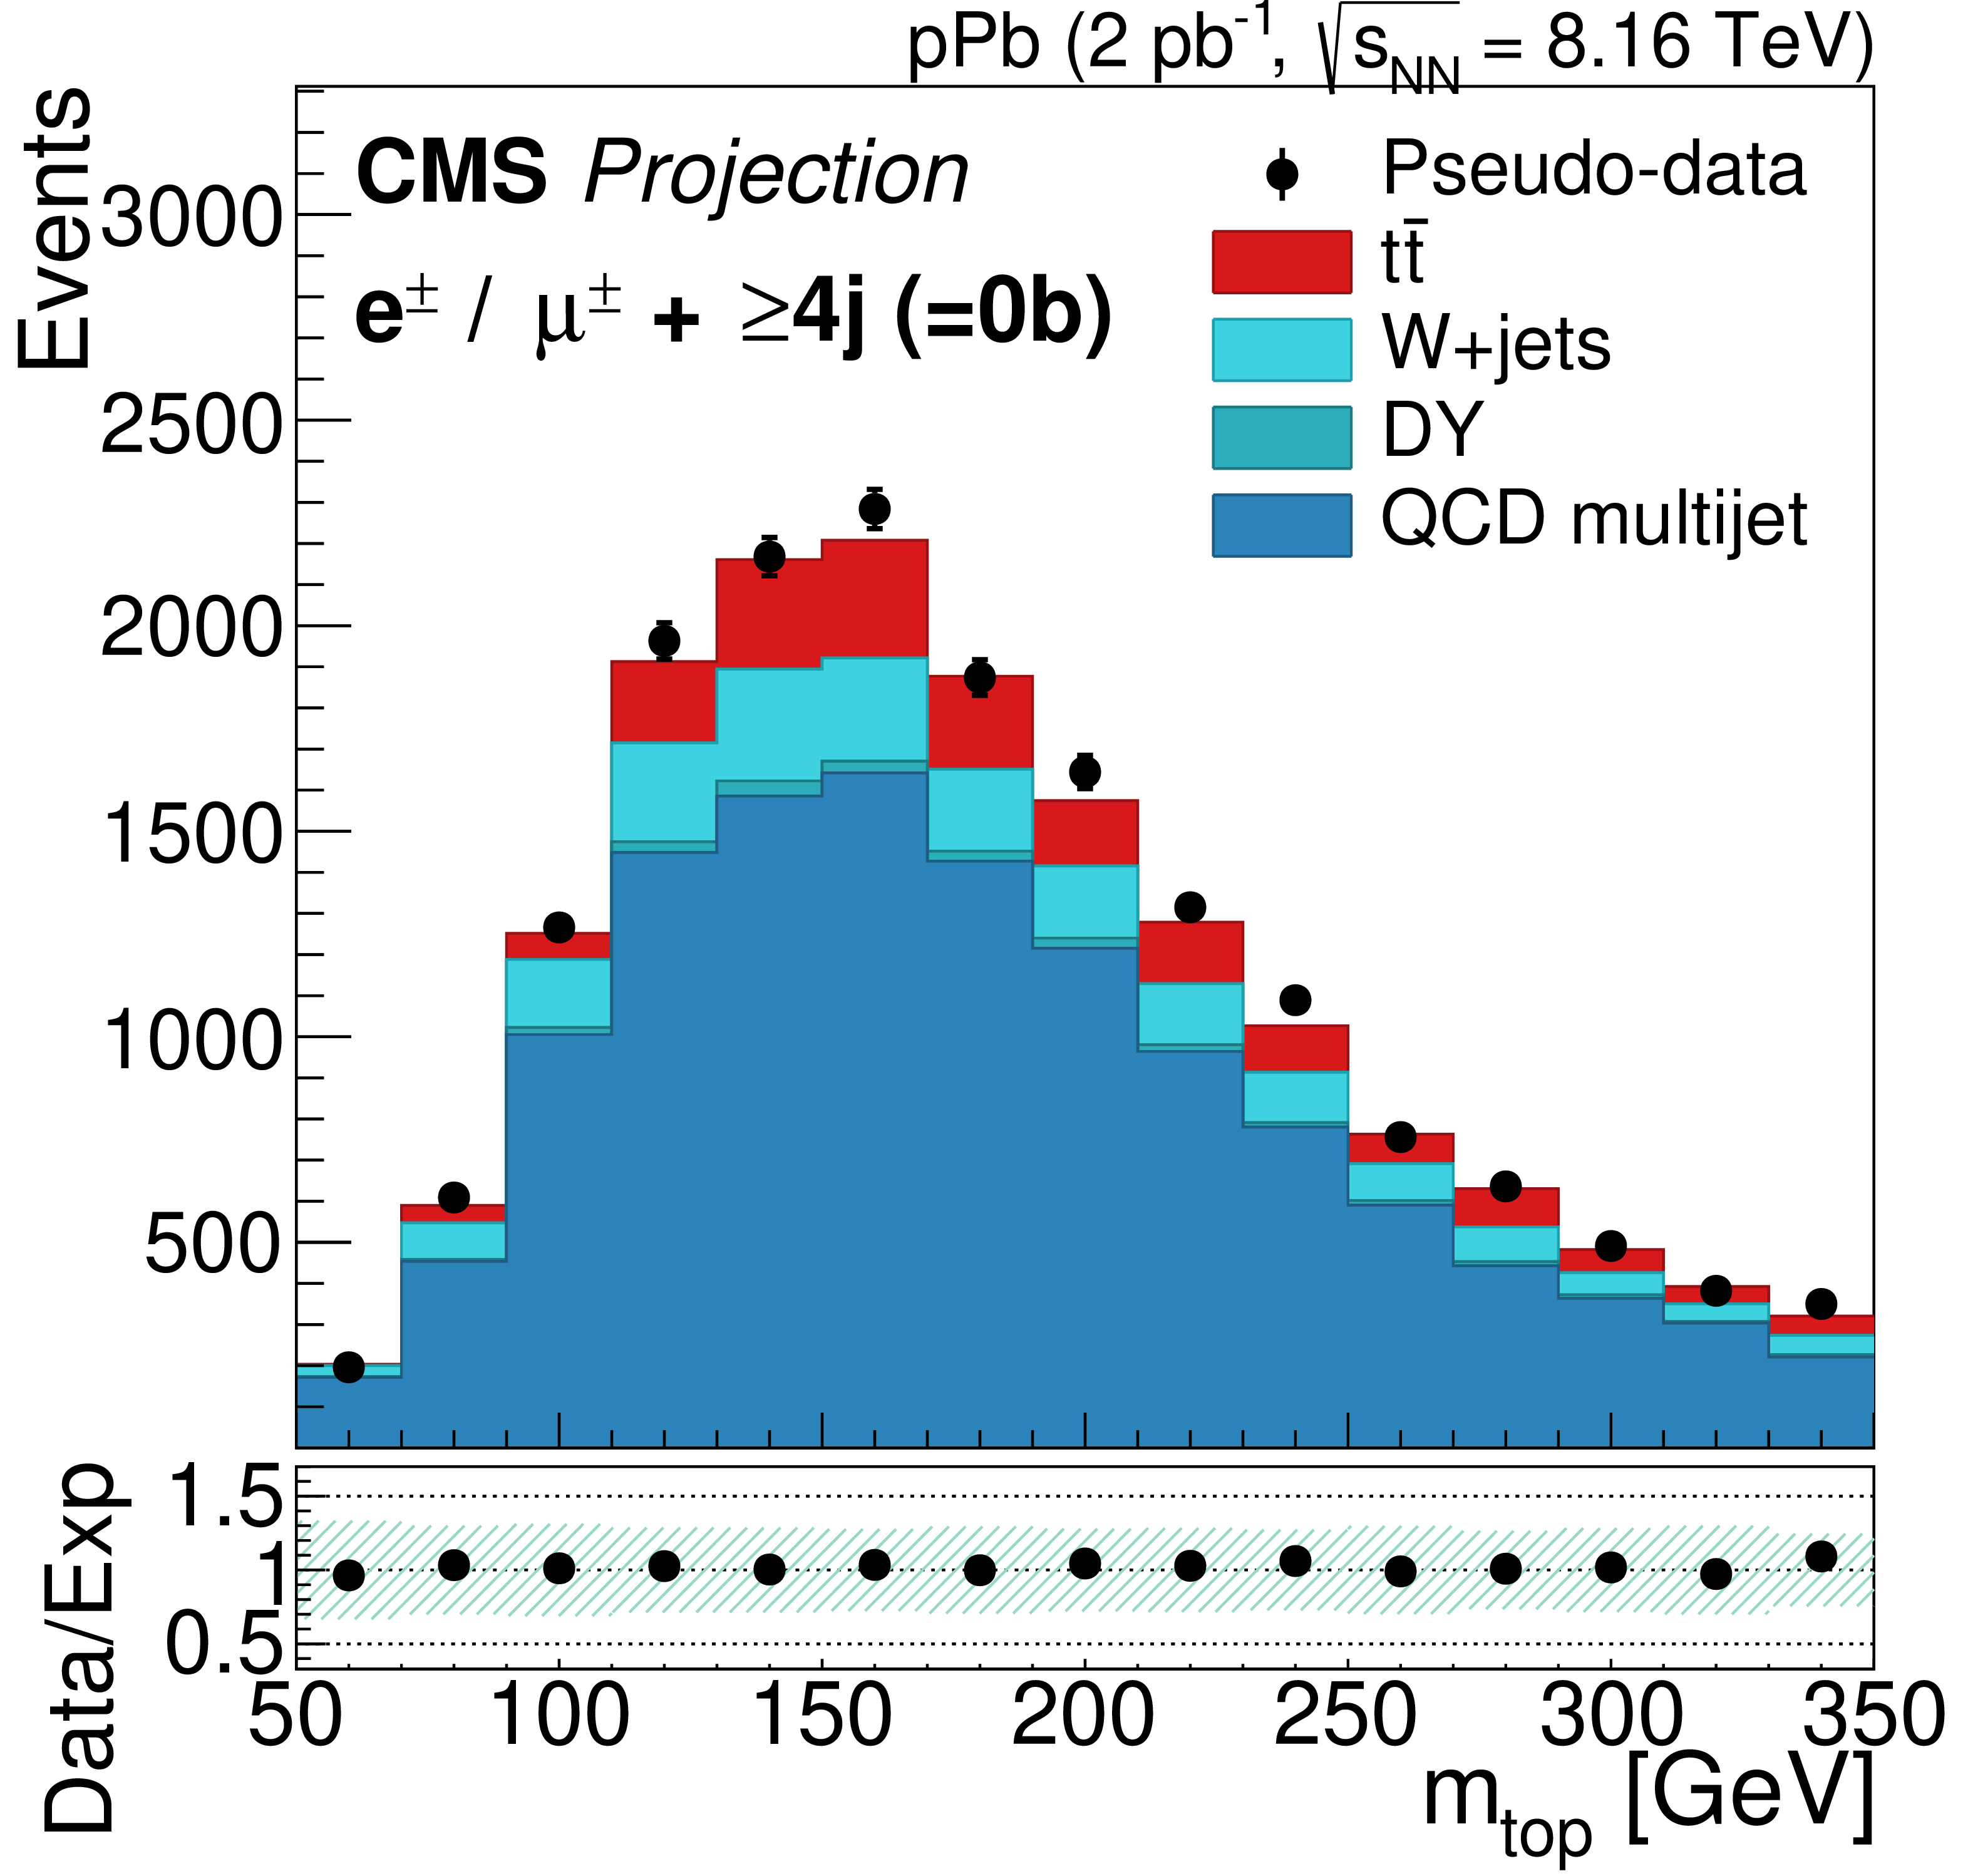
Figure 3-d:
Distribution of ${m_\text {top}}$ for events classified in the 0 b-tagged jet category. The sum of the predictions for the $ {{\mathrm {t}\overline {\mathrm {t}}}} $ signal and background is compared to pseudo-data (sampled randomly from the total of the predictions in each category). The bottom plot shows the ratio between the pseudo-data and the sum of the predictions. The shaded band represents the relative uncertainty due to the limited event count in the simulated samples and the estimate of the normalization of the QCD multijet background. |

png pdf |
Figure 3-e:
Distribution of ${m_\text {top}}$ for events classified in the 1 b-tagged jet category. The sum of the predictions for the $ {{\mathrm {t}\overline {\mathrm {t}}}} $ signal and background is compared to pseudo-data (sampled randomly from the total of the predictions in each category). The bottom plot shows the ratio between the pseudo-data and the sum of the predictions. The shaded band represents the relative uncertainty due to the limited event count in the simulated samples and the estimate of the normalization of the QCD multijet background. |
png pdf |
Figure 3-f:
Distribution of ${m_\text {top}}$ for events classified in the 2 b-tagged jet category. The sum of the predictions for the $ {{\mathrm {t}\overline {\mathrm {t}}}} $ signal and background is compared to pseudo-data (sampled randomly from the total of the predictions in each category). The bottom plot shows the ratio between the pseudo-data and the sum of the predictions. The shaded band represents the relative uncertainty due to the limited event count in the simulated samples and the estimate of the normalization of the QCD multijet background. |

png pdf |
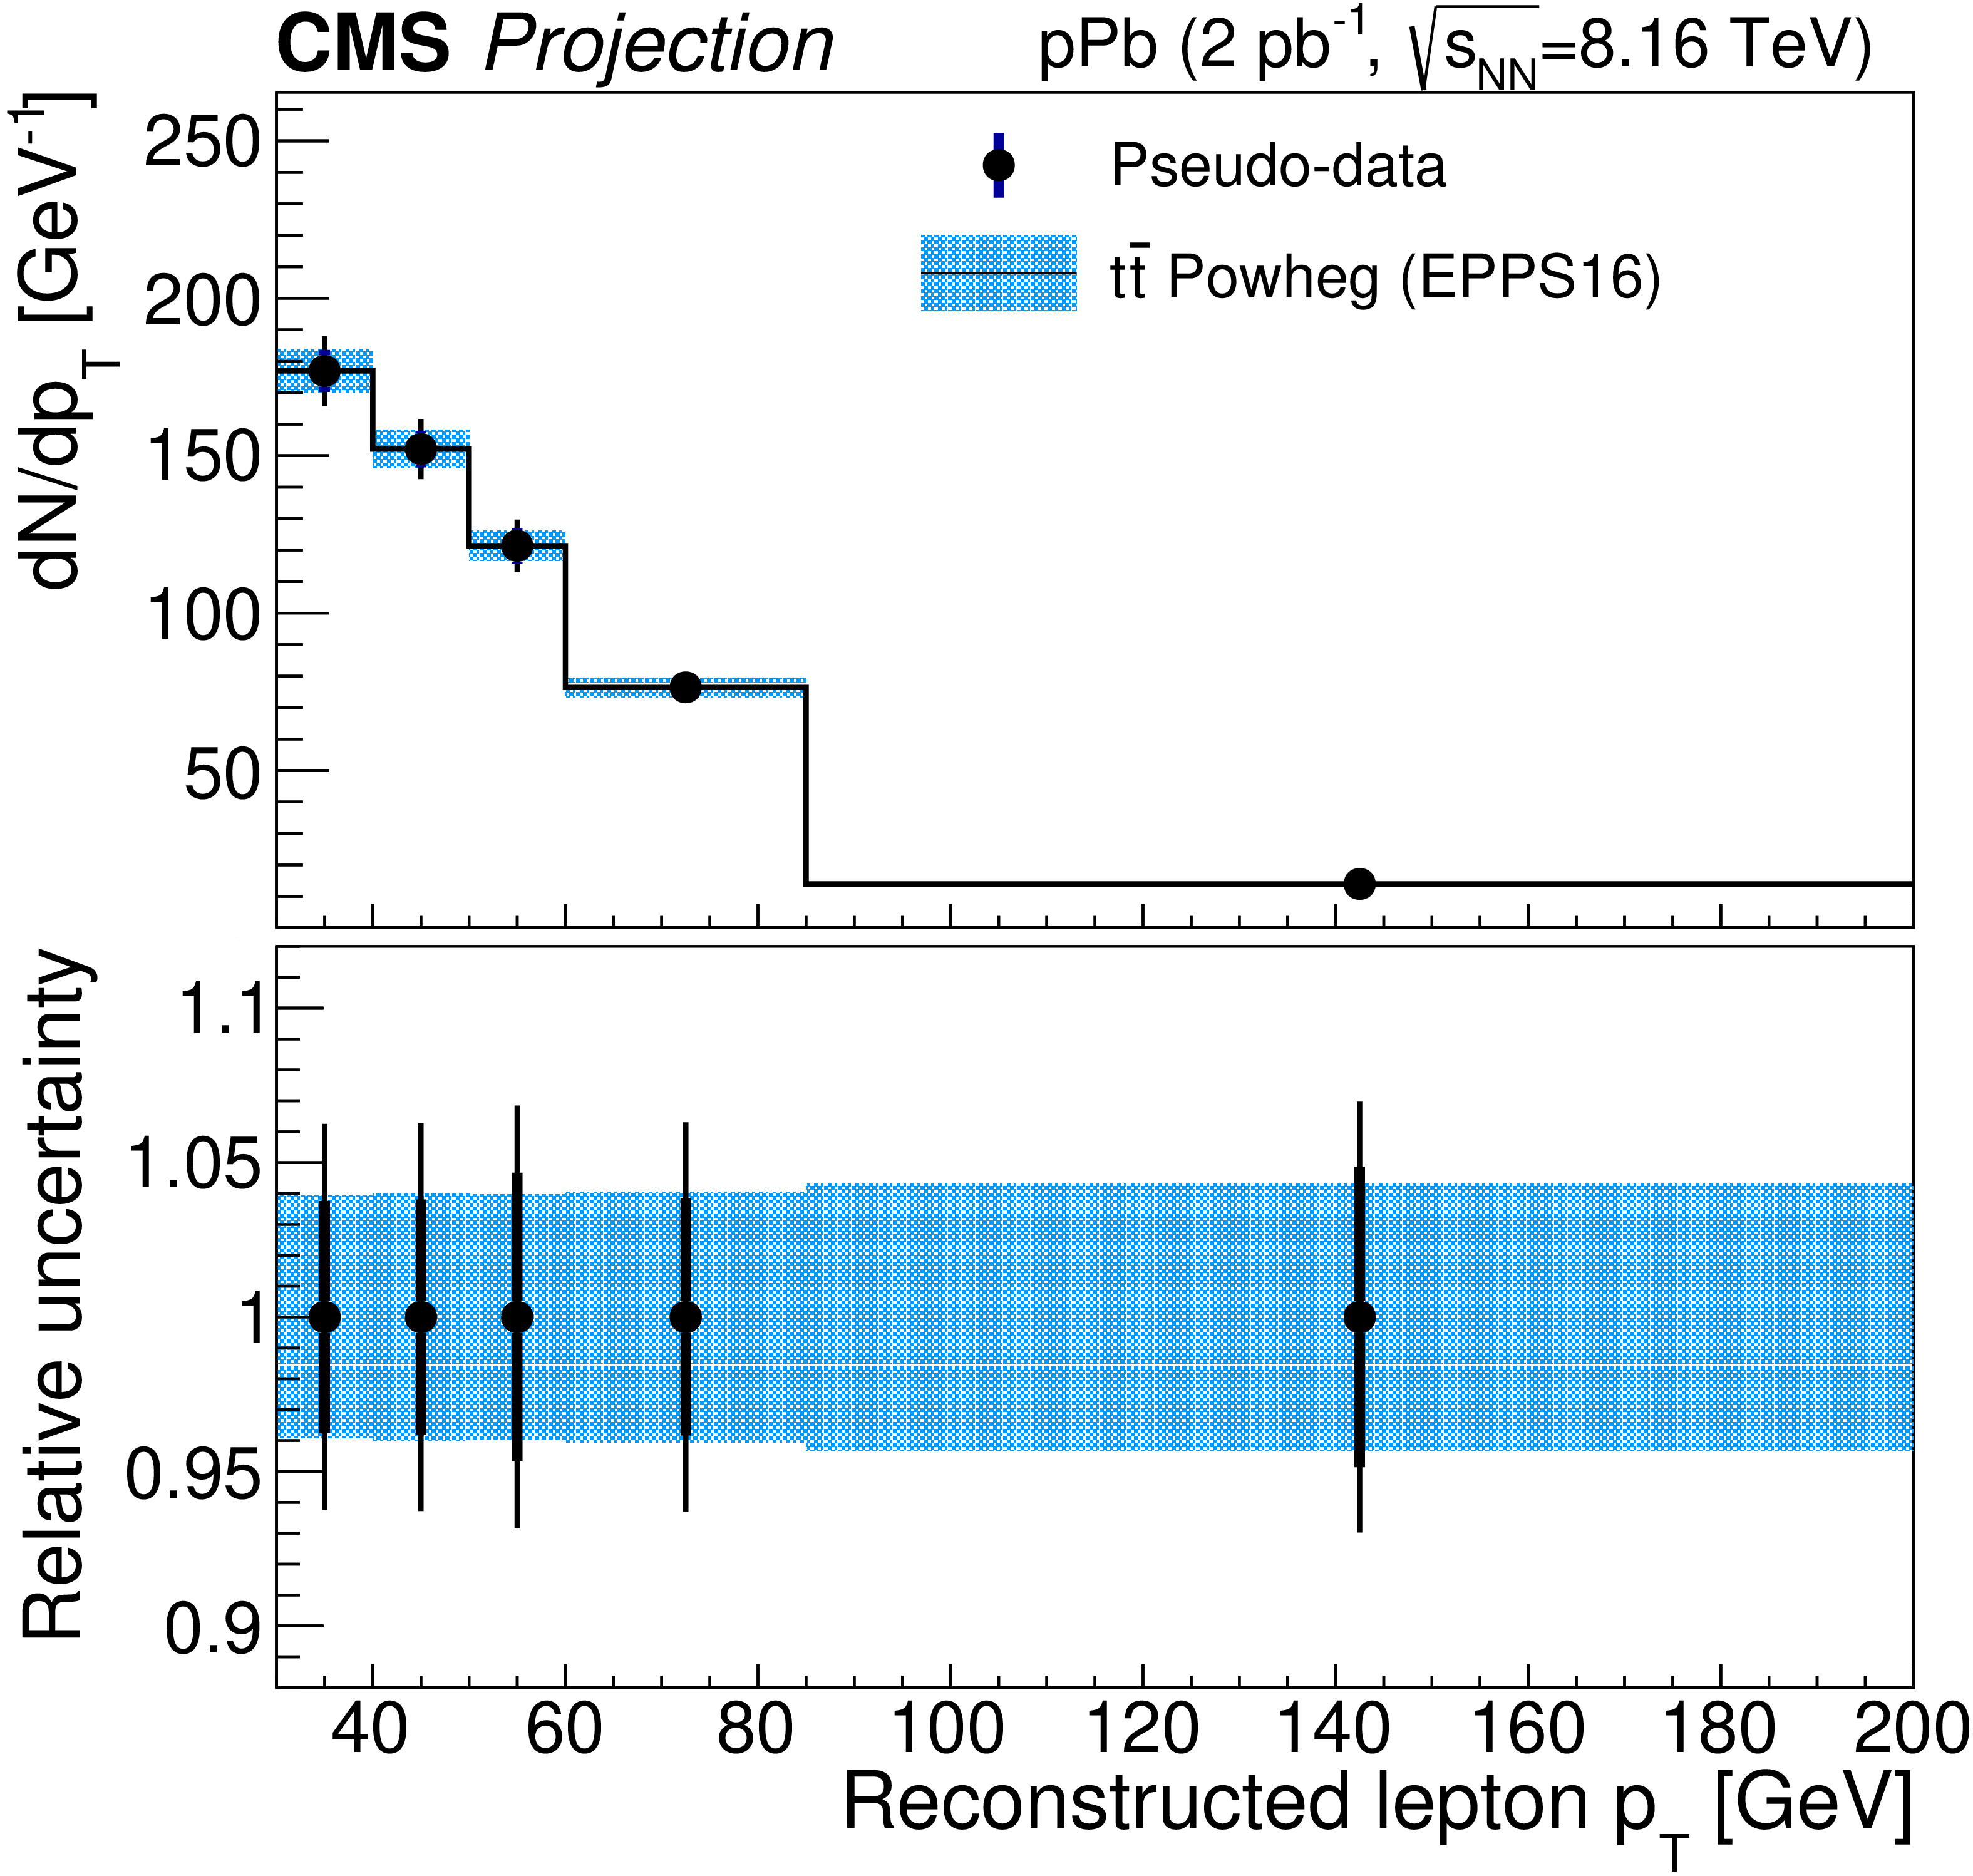
Figure 4:
The top panels represent the differential $ {{\mathrm {t}\overline {\mathrm {t}}}} $ production cross section in the visible phase space as a function of the charged lepton ${p_{\mathrm {T}}}$ (left) and rapidity (right) at reconstruction level. The statistical uncertainty in the pseudo-data, represented by the inner error bars, is estimated through the application of the sPlot technique [41]. The outer error bars represent the total uncertainty, assuming a conservative 5% systematic uncertainty envelope. The uncertainty in the {powheg+{pythia}} [36,37,38,39] prediction is shown as a band corresponding to the 68% CL variation envelope of the EPPS16 [29] nPDF eigenvalues. The bottom panels represent the relative uncertainties in the pseudo-data and theory predictions. |
png pdf |
Figure 4-a:
The top panel represents the differential $ {{\mathrm {t}\overline {\mathrm {t}}}} $ production cross section in the visible phase space as a function of the charged lepton ${p_{\mathrm {T}}}$ at reconstruction level. The statistical uncertainty in the pseudo-data, represented by the inner error bars, is estimated through the application of the sPlot technique [41]. The outer error bars represent the total uncertainty, assuming a conservative 5% systematic uncertainty envelope. The uncertainty in the {powheg+{pythia}} [36,37,38,39] prediction is shown as a band corresponding to the 68% CL variation envelope of the EPPS16 [29] nPDF eigenvalues. The bottom panel represents the relative uncertainties in the pseudo-data and theory predictions. |

png pdf |
Figure 4-b:
The top panel represents the differential $ {{\mathrm {t}\overline {\mathrm {t}}}} $ production cross section in the visible phase space as a function of the charged lepton rapidity at reconstruction level. The statistical uncertainty in the pseudo-data, represented by the inner error bars, is estimated through the application of the sPlot technique [41]. The outer error bars represent the total uncertainty, assuming a conservative 5% systematic uncertainty envelope. The uncertainty in the {powheg+{pythia}} [36,37,38,39] prediction is shown as a band corresponding to the 68% CL variation envelope of the EPPS16 [29] nPDF eigenvalues. The bottom panel represents the relative uncertainties in the pseudo-data and theory predictions. |
png pdf |
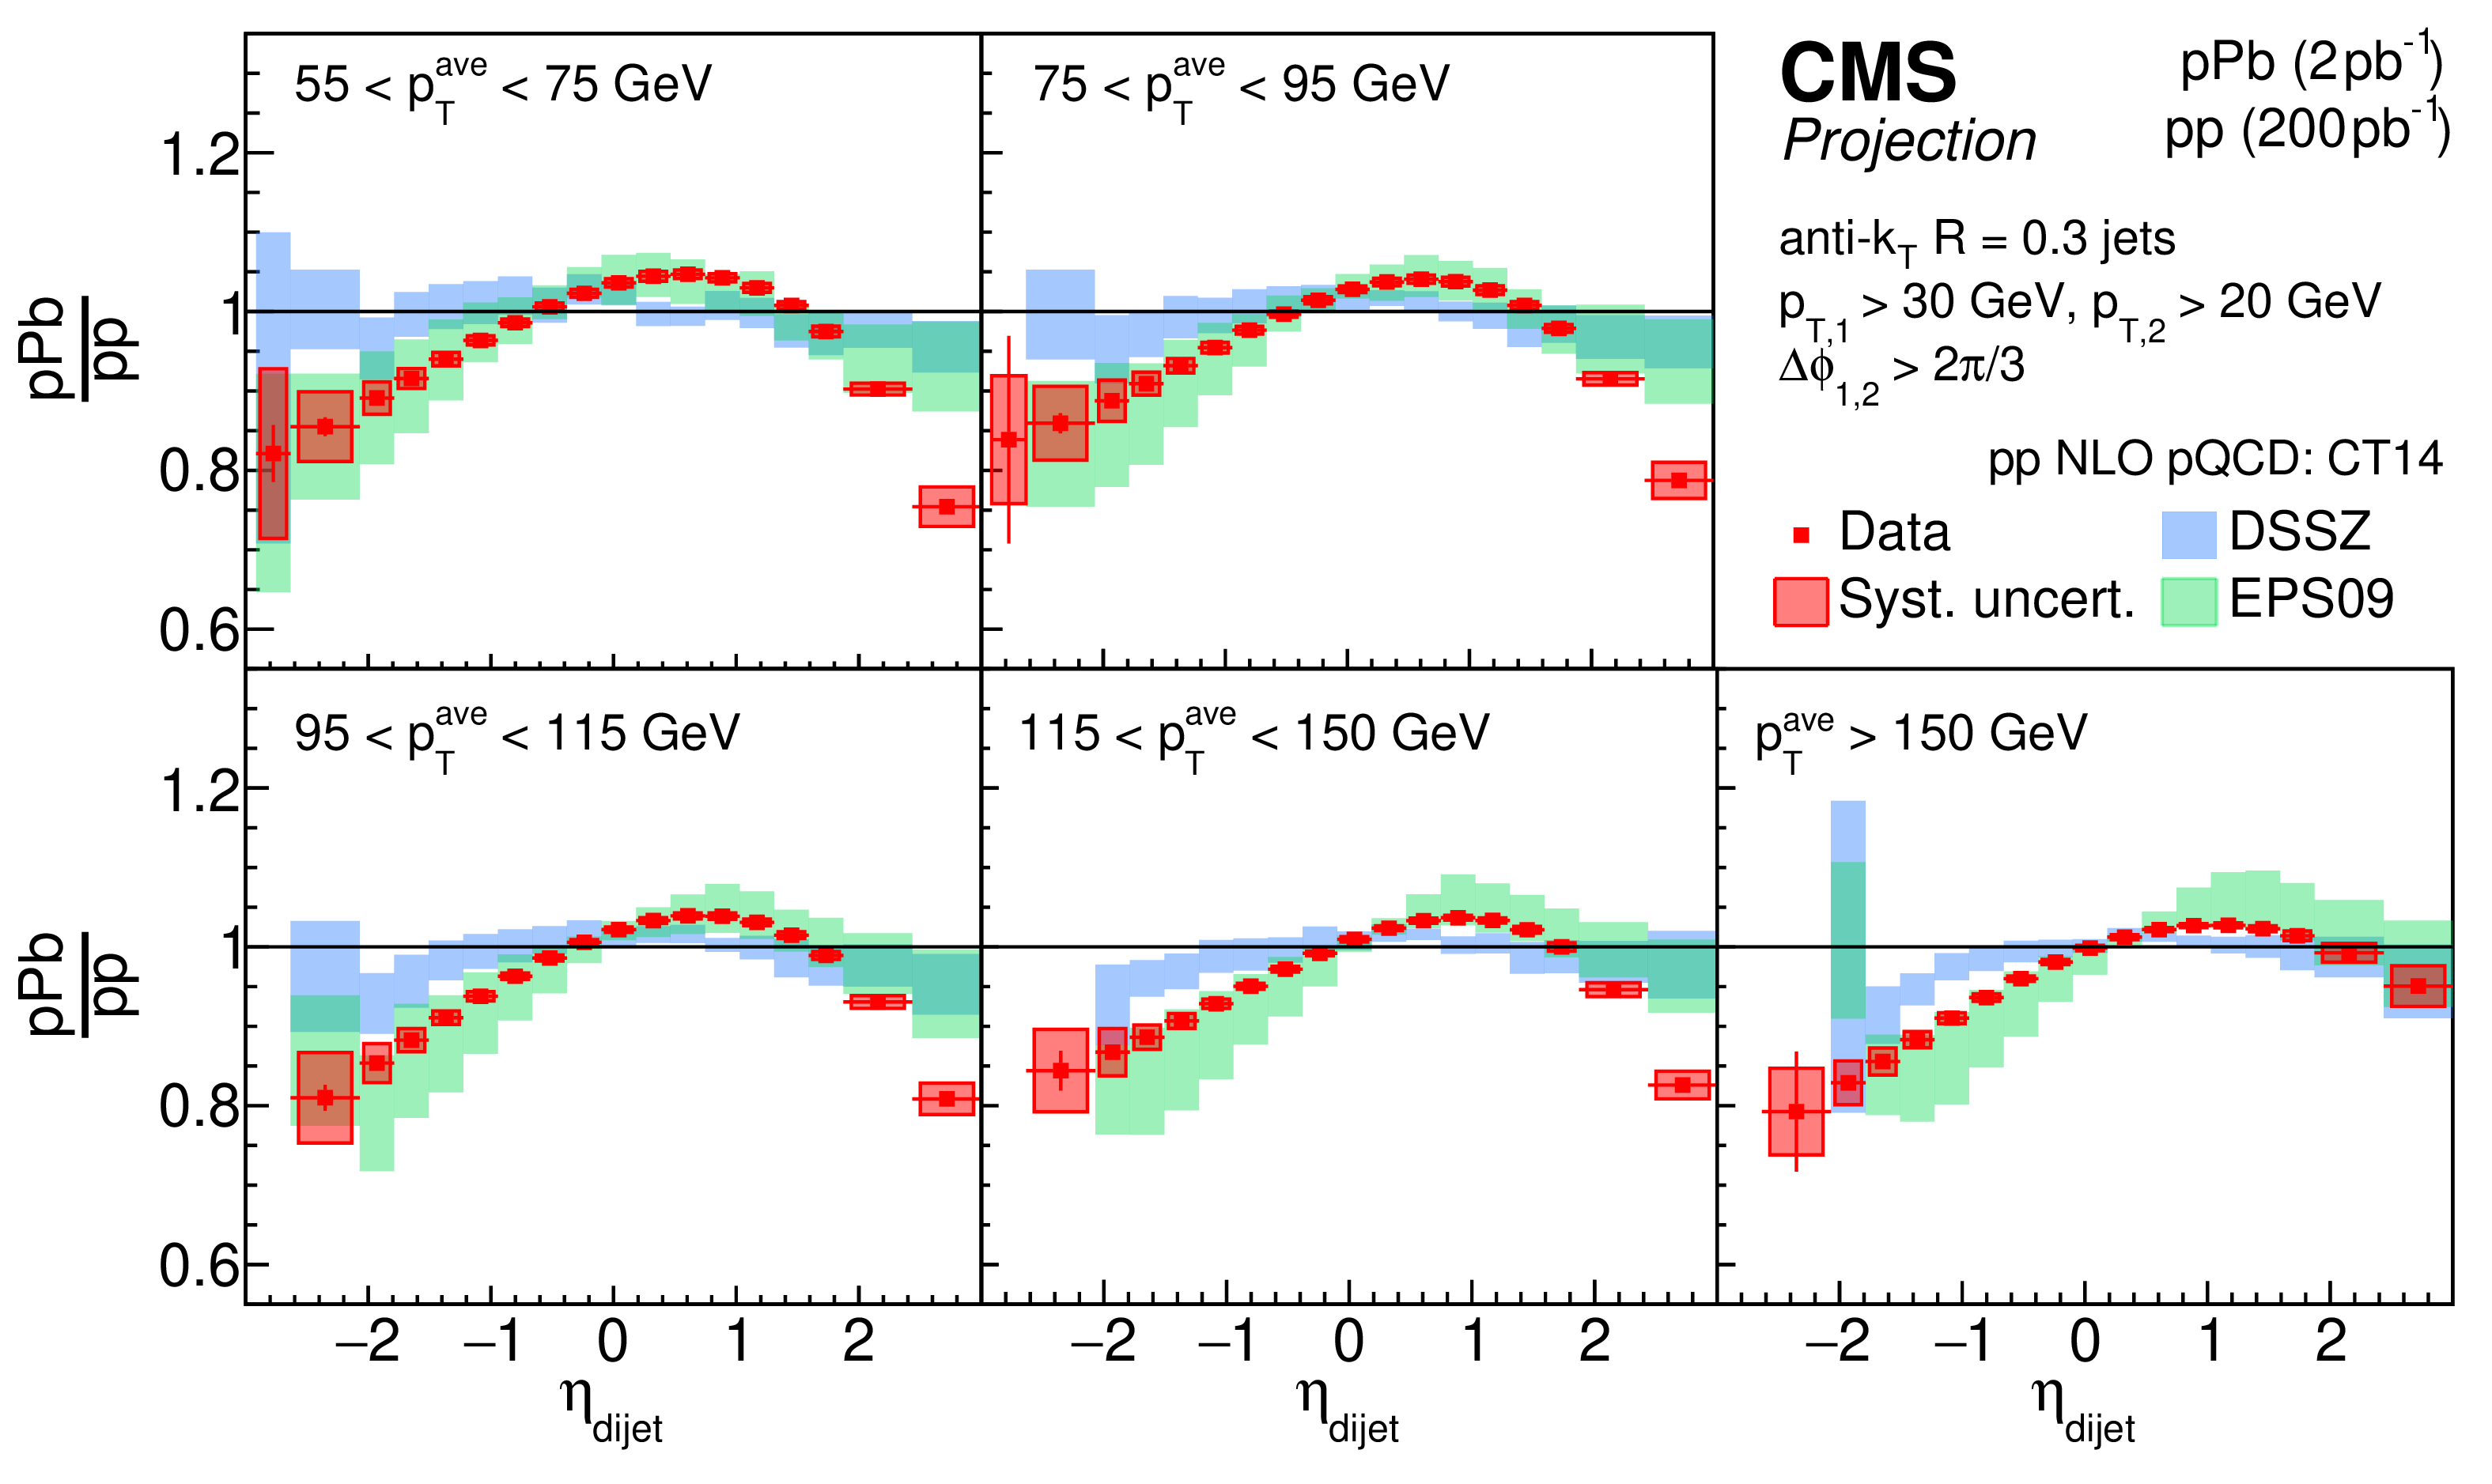
Figure 5:
Projections for dijet pseudorapidity distributions for pPb collisions with a total integrated luminosity of 2 pb$^{-1}$. |
| Summary |
| We have presented a series of performance studies for future measurements in both PbPb and pPb collisions for the High-Luminosity LHC project, putting special emphasis on a selected number of physics analyses that can serve to get insights into nuclear effects and nuclear parton distribution functions with the projected larger sample sizes that are envisaged. |
| References | ||||
| 1 | CMS Collaboration | The CMS experiment at the CERN LHC | JINST 3 (2008) S08004 | CMS-00-001 |
| 2 | G. Apollinari et al. | High-Luminosity Large Hadron Collider (HL-LHC) : Preliminary Design Report | CERN Yellow Reports: Monographs (2015) | |
| 3 | G. Apollinari et al. | High-Luminosity Large Hadron Collider (HL-LHC): Technical Design Report v0.1 | CERN Yellow Reports: Monographs (2017).%%%% | |
| 4 | D. Contardo et al. | Technical proposal for the Phase-2 upgrade of the CMS detector | CERN-LHCC-2015-010, CMS-TDR-15-02 | |
| 5 | CMS Collaboration | The Phase-2 upgrade of the CMS tracker | CDS | |
| 6 | CMS Collaboration | The Phase-2 upgrade of the CMS barrel calorimeters | CDS | |
| 7 | CMS Collaboration | The Phase-2 upgrade of the CMS endcap calorimeter | CDS | |
| 8 | CMS Collaboration | The Phase-2 upgrade of the CMS muon detectors | CDS | |
| 9 | CMS Collaboration | CMS Phase-2 object performance | ||
| 10 | A. J. Baltz | The physics of ultraperipheral collisions at the LHC | PR 458 (2008) 1--171 | 0706.3356 |
| 11 | ALICE Collaboration | Coherent $ \rho^{0} $ photoproduction in ultraperipheral PbPb collisions at $ \sqrt{\smash [b]{s_{_{\mathrm {NN}}}}} = $ 2.76 TeV | JHEP 09 (2015) 095 | 1503.09177 |
| 12 | ALICE Collaboration | Charmonium and $ \mathrm{e}^+\mathrm{e}^- $ pair photoproduction at midrapidity in ultraperipheral PbPb collisions at $ \sqrt{\smash [b]{s_{_{\mathrm {NN}}}}} = $ 2.76 TeV | EPJC 73 (2013) 2617 | 1305.1467 |
| 13 | ALICE Collaboration | Coherent $ \mathrm{J}/\psi $ photoproduction in ultraperipheral PbPb collisions at $ \sqrt{\smash [b]{s_{_{\mathrm {NN}}}}} = $ 2.76 TeV | PLB 718 (2013) 1273 | 1209.3715 |
| 14 | CMS Collaboration | Coherent $ \mathrm{J}/\psi $ photoproduction in ultraperipheral PbPb collisions at $ \sqrt{\smash [b]{s_{_{\mathrm {NN}}}}} = $ 2.76 TeV with the CMS experiment | PLB 772 (2017) 489 | CMS-HIN-12-009 1605.06966 |
| 15 | ALICE Collaboration | Coherent $ \psi $(2S) photoproduction in ultraperipheral Pb Pb collisions at $ \sqrt{\smash [b]{s_{_{\mathrm {NN}}}}} = $ 2.76 TeV | PLB 751 (2015) 358 | 1508.05076 |
| 16 | CMS Collaboration | Exclusive $ \rho(770)^{0} $ photoproduction in ultraperipheral pPb collisions at $ \sqrt{\smash [b]{s_{_{\mathrm {NN}}}}}= $ 5.02 TeV with the CMS experiment | CMS-PAS-FSQ-16-007 | CMS-PAS-FSQ-16-007 |
| 17 | CMS Collaboration | Measurement of exclusive $ \Upsilon $ photoproduction from protons in pPb collisions at $ \sqrt{\smash [b]{s_{_{\mathrm {NN}}}}} = $ 5.02 TeV | Submitted to EPJC | CMS-FSQ-13-009 1809.11080 |
| 18 | LHCb Collaboration | Central exclusive production of $ \mathrm{J}/\psi $ and $ \psi(2S) $ mesons in pp collisions at $ \sqrt{s}= $ 13 TeV | JHEP 10 (2018) 167 | 1806.04079 |
| 19 | LHCb Collaboration | Measurement of the exclusive $ \Upsilon $ production cross section in pp collisions at $ \sqrt{s}= $ 7 TeV and 8 TeV | JHEP 09 (2015) 084 | 1505.08139 |
| 20 | M. G. Ryskin | Diffractive $ \mathrm{J}/\psi $ electroproduction in LLA QCD | Z. Phys. C 57 (1993) 89 | |
| 21 | S. J. Brodsky et al. | Diffractive leptoproduction of vector mesons in QCD | PRD 50 (1994) 3134 | hep-ph/9402283 |
| 22 | V. Guzey, E. Kryshen, M. Strikman, and M. Zhalov | Evidence for nuclear gluon shadowing from the ALICE measurements of PbPb ultraperipheral exclusive $ \mathrm{J}/\psi $ production | PLB 726 (2013) 290 | 1305.1724 |
| 23 | V. Guzey, E. Kryshen, and M. Zhalov | Coherent photoproduction of vector mesons in ultraperipheral heavy ion collisions: Update for Run 2 at the CERN Large Hadron Collider | PRC 93 (2016) 055206 | 1602.01456 |
| 24 | L. Frankfurt, V. Guzey, and M. Strikman | Dynamical model of antishadowing of the nuclear gluon distribution | PRC 95 (2017) 055208 | 1612.08273 |
| 25 | CMS Collaboration | CMS luminosity measurement using 2016 proton-nucleus collisions at nucleon-nucleon center-of-mass energy of 8.16 TeV | CMS-PAS-LUM-17-002 | CMS-PAS-LUM-17-002 |
| 26 | K. J. Eskola, H. Paukkunen, and C. A. Salgado | EPS09: A New Generation of NLO and LO Nuclear Parton Distribution Functions | JHEP 04 (2009) 065 | 0902.4154 |
| 27 | J. M. Campbell and R. K. Ellis | MCFM for the Tevatron and the LHC | NPPS 205 (2010) 10 | 1007.3492 |
| 28 | S. Dulat et al. | New parton distribution functions from a global analysis of quantum chromodynamics | PRD 93 (2016) 033006 | 1506.07443 |
| 29 | K. J. Eskola, P. Paakkinen, H. Paukkunen, and C. A. Salgado | EPPS16: Nuclear parton distributions with LHC data | EPJC 77 (2017) 163 | 1612.05741 |
| 30 | CMS Collaboration | Study of Z boson production in pPb collisions at $ \sqrt{\smash [b]{s_{_{\mathrm {NN}}}}}= $ 5.02 TeV | PLB 759 (2016) 36 | CMS-HIN-15-002 1512.06461 |
| 31 | Particle Data Group Collaboration | The Review of Particle Physics | PRD 98 (2018) 030001 | |
| 32 | CMS Collaboration | Observation of top quark production in proton-nucleus collisions | PRL 119 (2017) 242001 | CMS-HIN-17-002 1709.07411 |
| 33 | D. d'Enterria, K. Krajcz\'ar, and H. Paukkunen | Top-quark production in proton--nucleus and nucleus--nucleus collisions at LHC energies and beyond | PLB 746 (2015) 64 | 1501.05879 |
| 34 | D. d'Enterria | Top-quark pair production cross sections at NNLO+NNLL in pPb collisions at $ \sqrt{\smash [b]{s_{_{\mathrm {NN}}}}} = $ 8.16 TeV | 1706.09521 | |
| 35 | M. Cacciari, G. P. Salam, and G. Soyez | The anti-$ k_{\rm T} $ jet clustering algorithm | JHEP 04 (2008) 063 | 0802.1189 |
| 36 | S. Frixione, P. Nason, and C. Oleari | Matching NLO QCD computations with parton shower simulations: the POWHEG method | JHEP 11 (2007) 070 | 0709.2092 |
| 37 | S. Alioli, P. Nason, C. Oleari, and E. Re | A general framework for implementing NLO calculations in shower Monte Carlo programs: the POWHEG BOX | JHEP 06 (2010) 043 | 1002.2581 |
| 38 | S. Frixione, P. Nason, and G. Ridolfi | A positive-weight next-to-leading-order Monte Carlo for heavy flavour hadroproduction | JHEP 09 (2007) 126 | |
| 39 | T. Sjostrand et al. | An introduction to $ PYTHIA $ 8.2 | CPC 191 (2015) 159 | 1410.3012 |
| 40 | T. Sjostrand, S. Mrenna, and P. Z. Skands | PYTHIA 6.4 Physics and Manual | JHEP 05 (2006) 026 | hep-ph/0603175 |
| 41 | M. Pivk and F. R. Le Diberder | $ _{s}\mathcal{P}lot $: A statistical tool to unfold data distributions | NIMA 555 (2005) 356 | physics/0402083 |
| 42 | CMS Collaboration | Projection of measurements of differential $ \mathrm{t\bar{t}} $ production cross sections in the e/$ \mu $+jets channels in pp collisions at the HL-LHC | CMS-PAS-FTR-18-015 | CMS-PAS-FTR-18-015 |
| 43 | CMS Collaboration | Object definitions for top quark analyses at the particle level | CDS | |
| 44 | J. Pumplin et al. | Uncertainties of predictions from parton distribution functions II: The Hessian method | PRD 65 (2001) 014013 | hep-ph/0101032 |
| 45 | K. J. Eskola, H. Paukkunen, and C. A. Salgado | A perturbative QCD study of dijets in pPb collisions at the LHC | JHEP 10 (2013) 213 | 1308.6733 |
| 46 | CMS Collaboration | Constraining gluon distributions in nuclei using dijets in proton-proton and proton-lead collisions at $ \sqrt{\smash [b]{s_{_{\mathrm {NN}}}}} = $ 5.02 TeV | PRL 121 (2018) 062002 | CMS-HIN-16-003 1805.04736 |
|
|
Compact Muon Solenoid LHC, CERN |
|

|

|

|

|

|