

Compact Muon Solenoid
LHC, CERN
| CMS-PAS-FTR-18-037 | ||
| HL-LHC searches for new physics in hadronic final states with boosted W bosons or top quarks using razor variables | ||
| CMS Collaboration | ||
| February 2019 | ||
| Abstract: We present High-Luminosity LHC (HL-LHC) projections of the Run 2 search for new physics in hadronic final states with boosted W bosons or top quarks using razor variables. Data event yields and signal/background cross sections from the 2016 analysis are scaled to obtain the HL-LHC sensitivity for center-of-mass energy of 14 TeV and integrated luminosity of 3 ab$^{-1}$. Different scenarios for systematic uncertainties are considered. The projection results are interpreted in terms of gluino pair production where each gluino decays to a top quark, an anti-top quark, and a neutralino; or to a top quark and a top squark; and direct top squark pair production where each top squark decays to a top quark and a neutralino. | ||
| Links: CDS record (PDF) ; inSPIRE record ; CADI line (restricted) ; | ||
| Figures | |
png pdf |
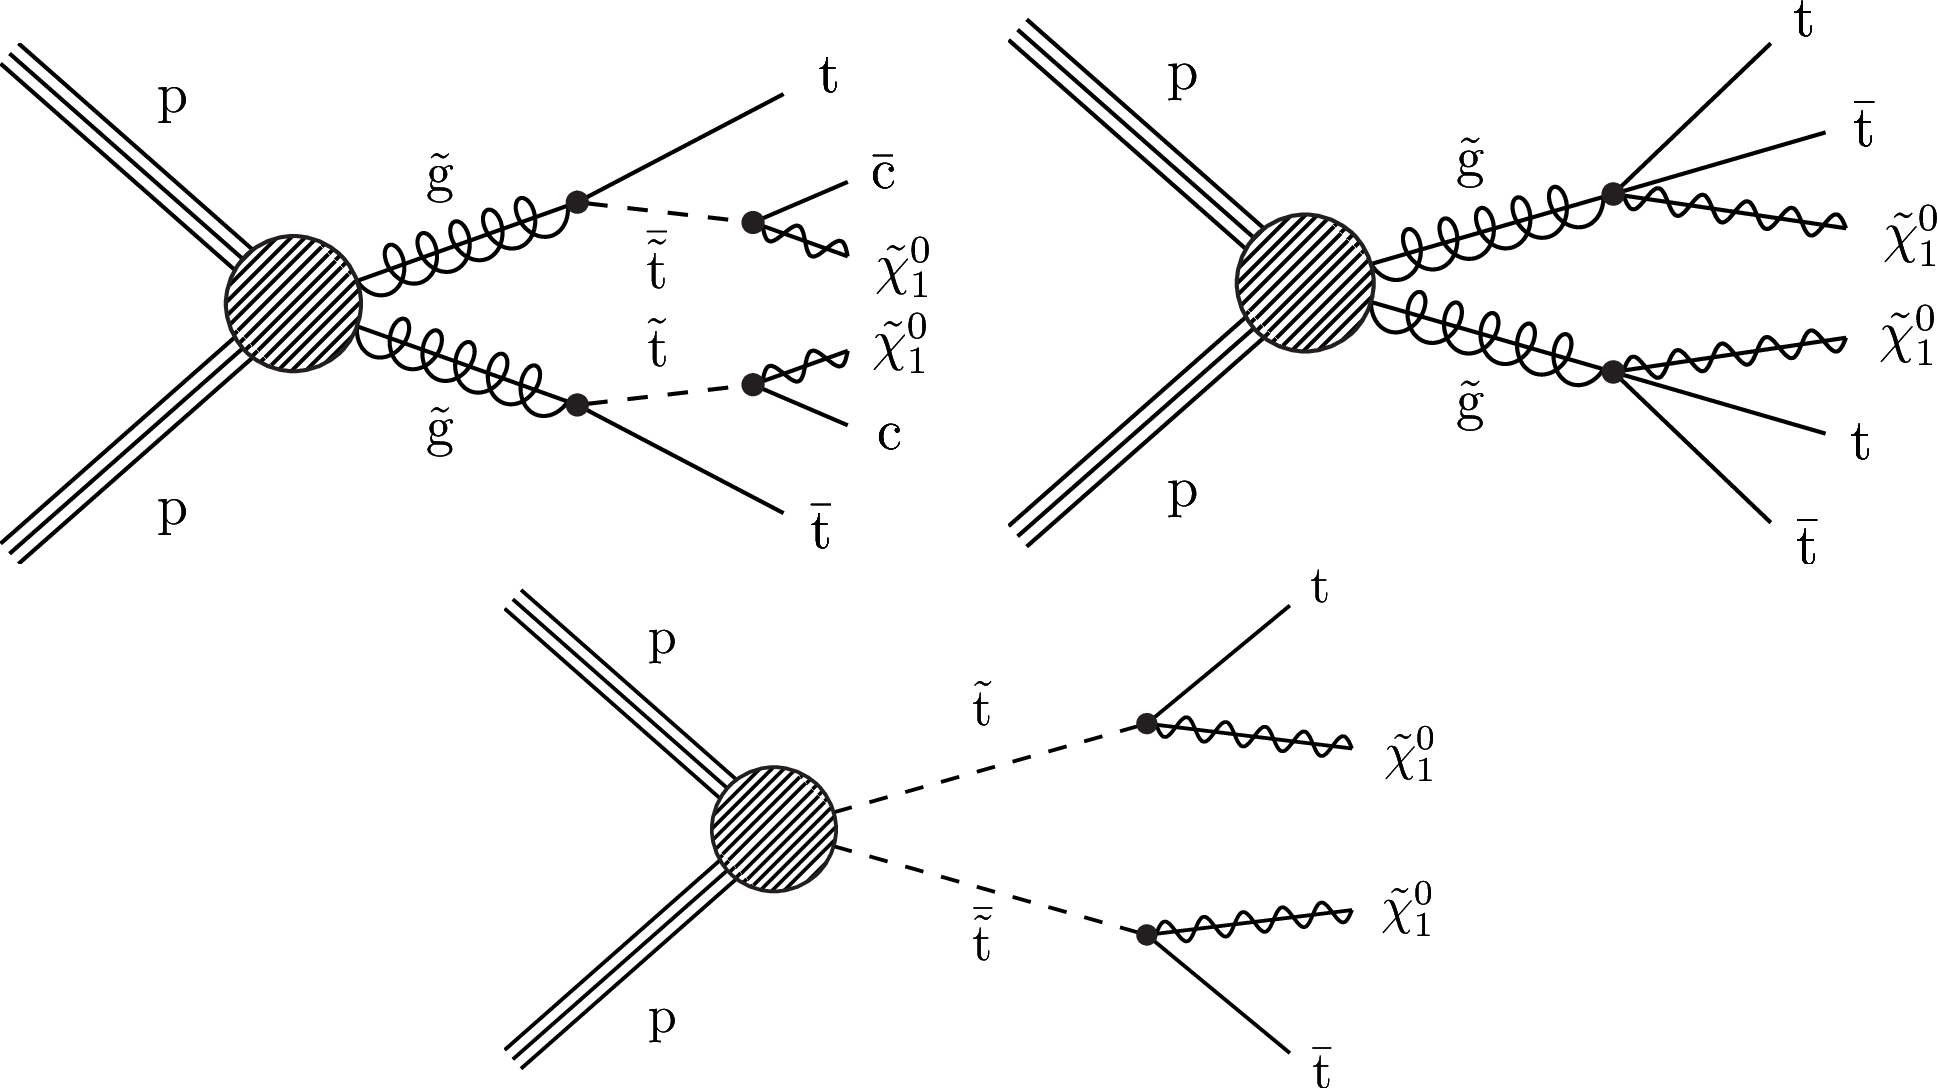
Figure 1:
Signal models considered in this analysis: T5ttcc (top left), T1tttt (top right), and T2tt (bottom). |

png pdf |
Figure 1-a:
Signal models considered in this analysis: T5ttcc (top left), T1tttt (top right), and T2tt (bottom). |

png pdf |
Figure 1-b:
Signal models considered in this analysis: T5ttcc (top left), T1tttt (top right), and T2tt (bottom). |

png pdf |
Figure 1-c:
Signal models considered in this analysis: T5ttcc (top left), T1tttt (top right), and T2tt (bottom). |

png pdf |
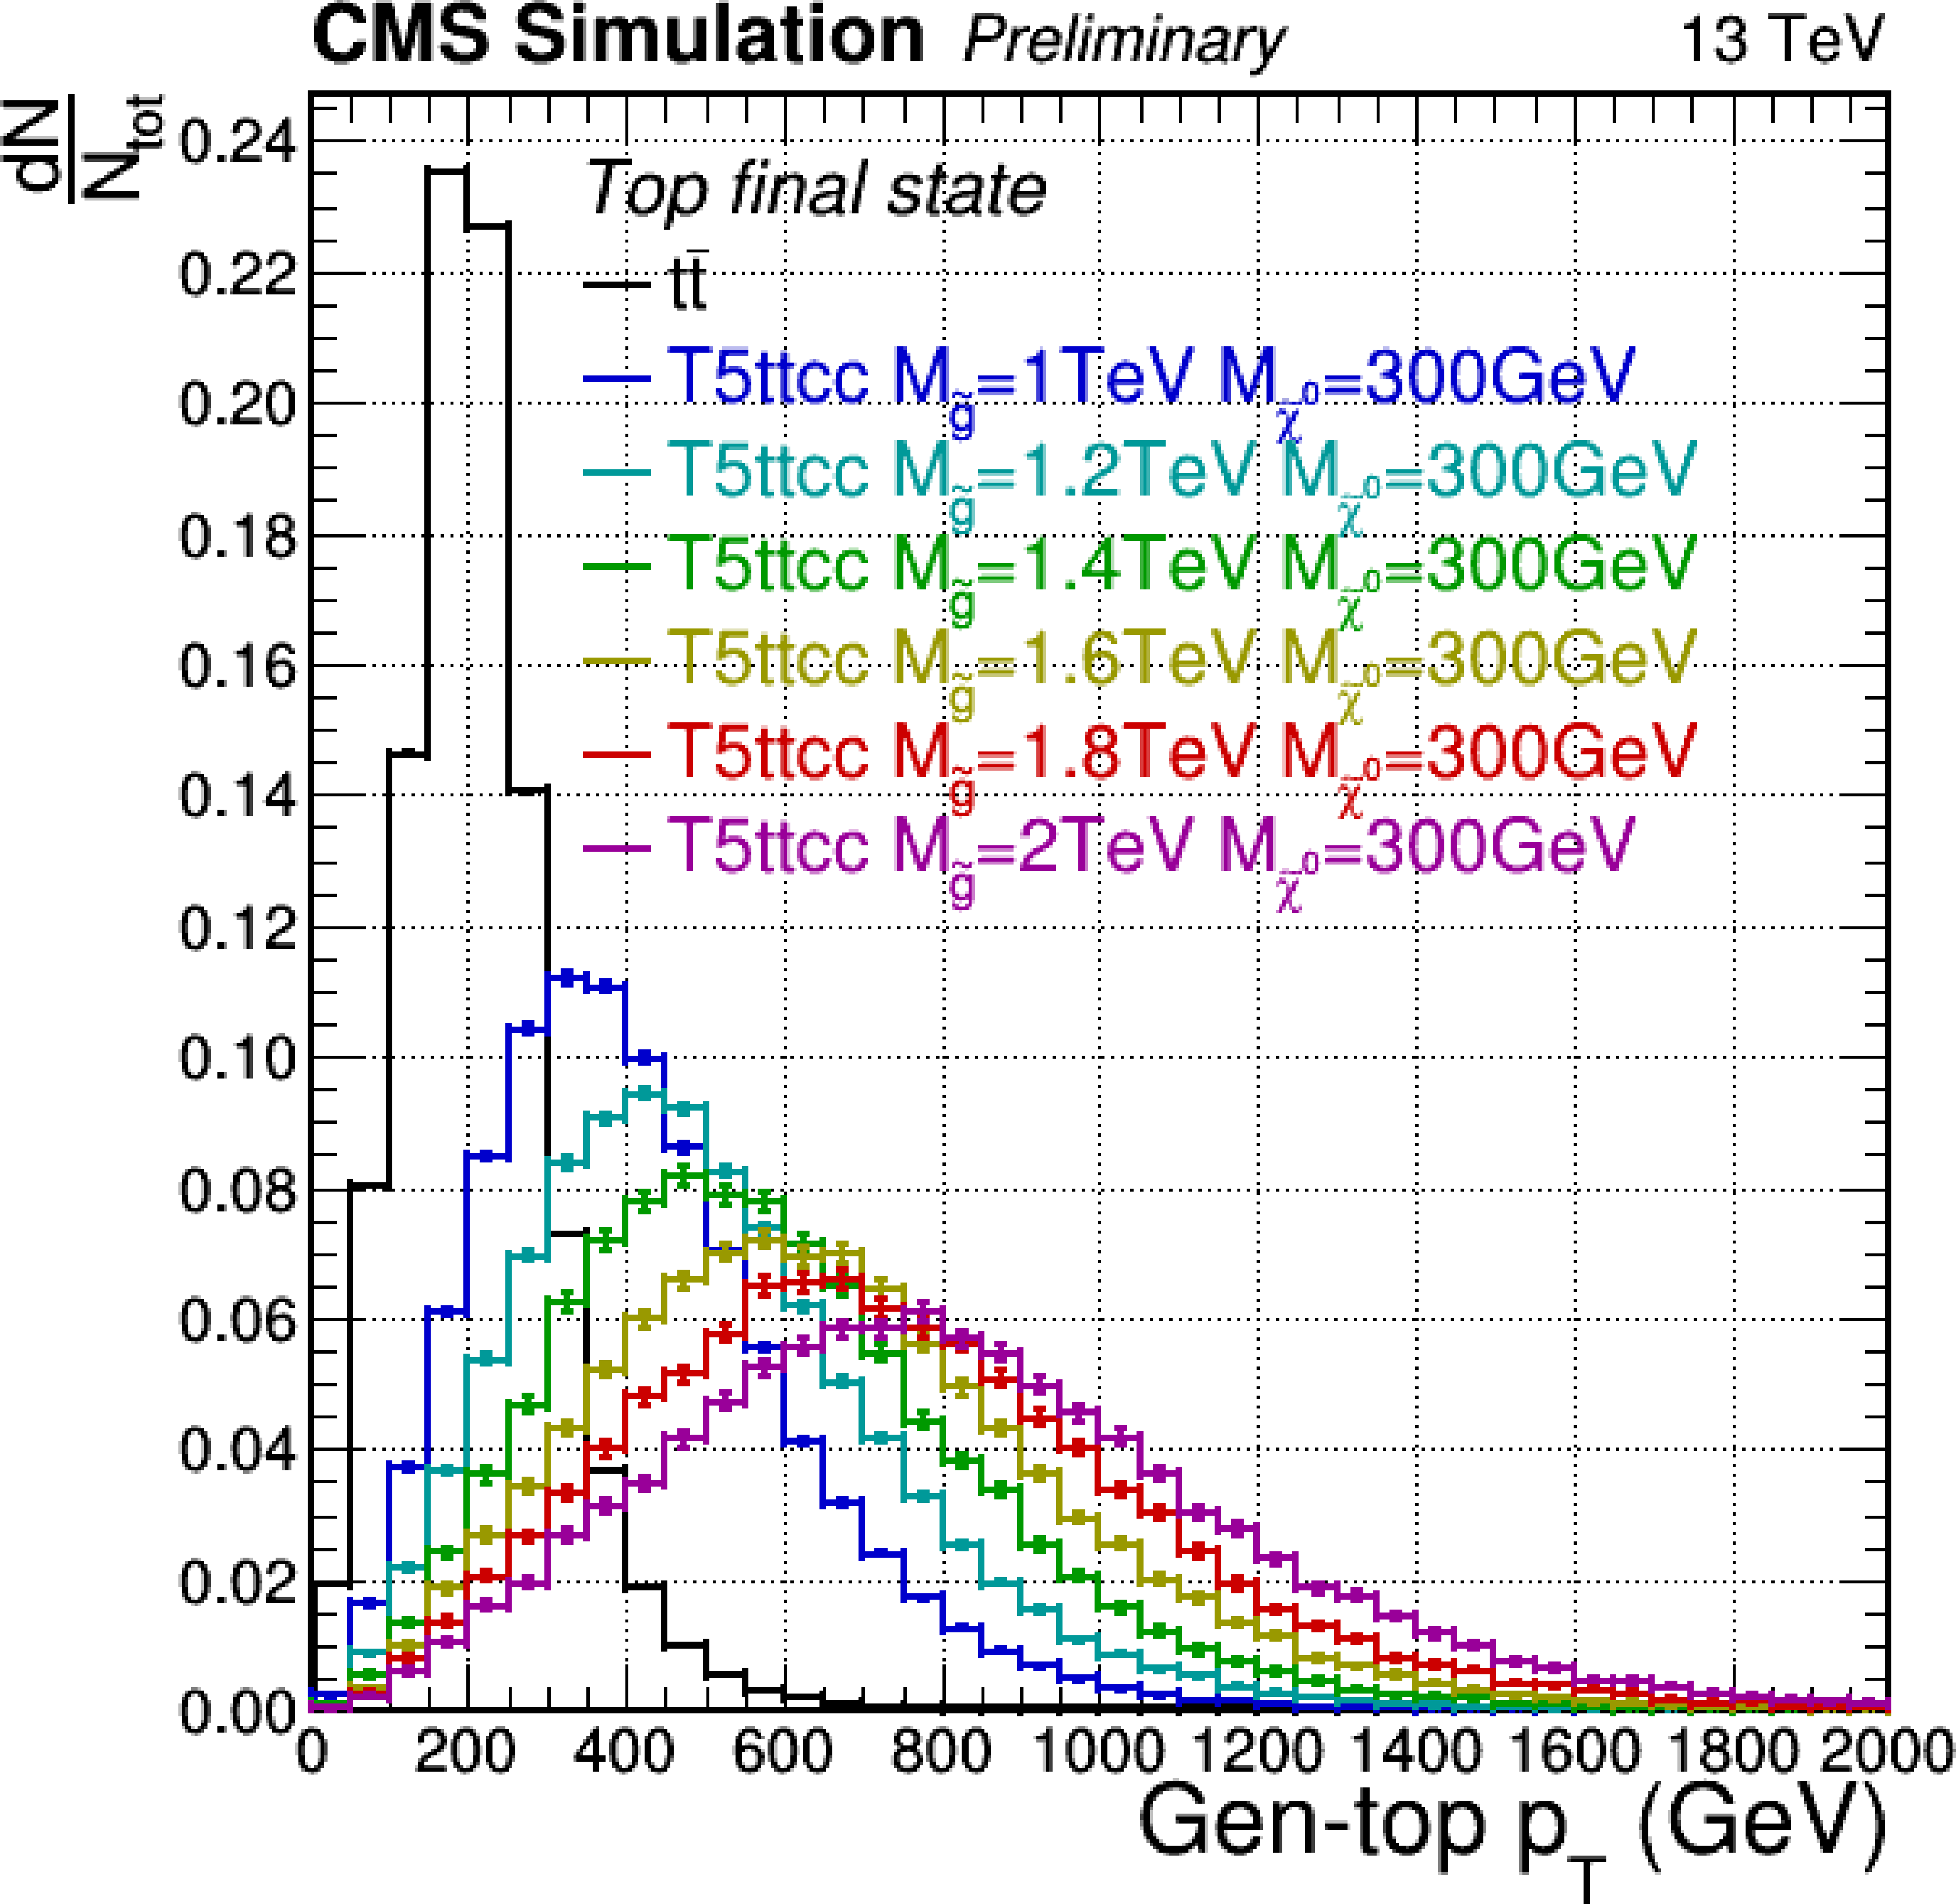
Figure 2:
Generator-level W boson and top quark ${p_{\mathrm {T}}}$ distributions for several signal points from the T5ttcc simplified model, compared to the ${{{\mathrm {t}\overline {\mathrm {t}}}}}$+jets background. Only a set of events selected with a requirement of a jet with size 0.8, ${p_{\mathrm {T}}} > $ 200 GeV, and razor variable $ {R^{2}} > 0.04$, as explained in the text, are shown. |

png pdf |
Figure 2-a:
Generator-level W boson and top quark ${p_{\mathrm {T}}}$ distributions for several signal points from the T5ttcc simplified model, compared to the ${{{\mathrm {t}\overline {\mathrm {t}}}}}$+jets background. Only a set of events selected with a requirement of a jet with size 0.8, ${p_{\mathrm {T}}} > $ 200 GeV, and razor variable $ {R^{2}} > 0.04$, as explained in the text, are shown. |
png pdf |
Figure 2-b:
Generator-level W boson and top quark ${p_{\mathrm {T}}}$ distributions for several signal points from the T5ttcc simplified model, compared to the ${{{\mathrm {t}\overline {\mathrm {t}}}}}$+jets background. Only a set of events selected with a requirement of a jet with size 0.8, ${p_{\mathrm {T}}} > $ 200 GeV, and razor variable $ {R^{2}} > 0.04$, as explained in the text, are shown. |
png pdf |
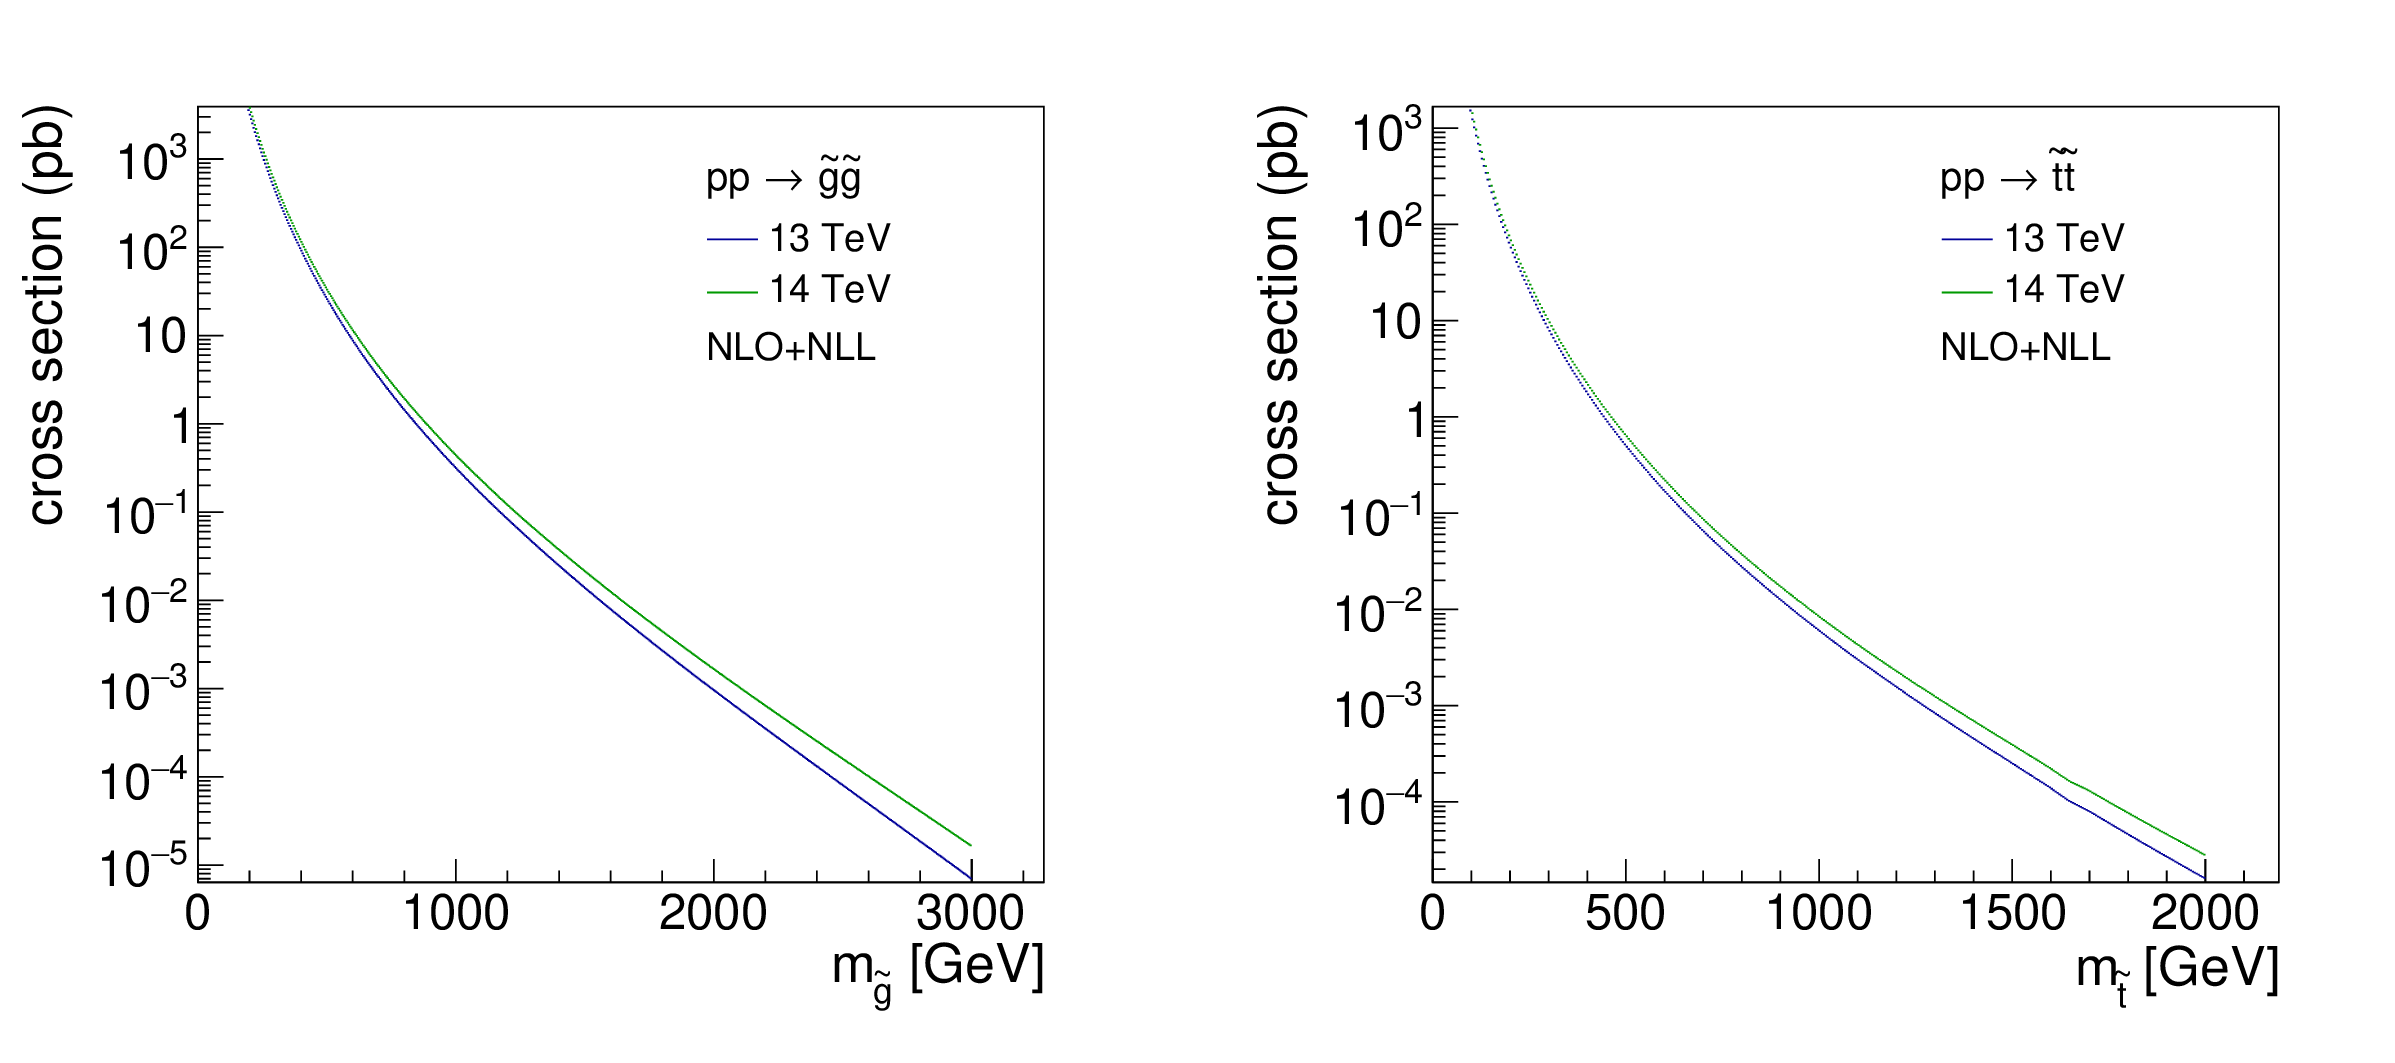
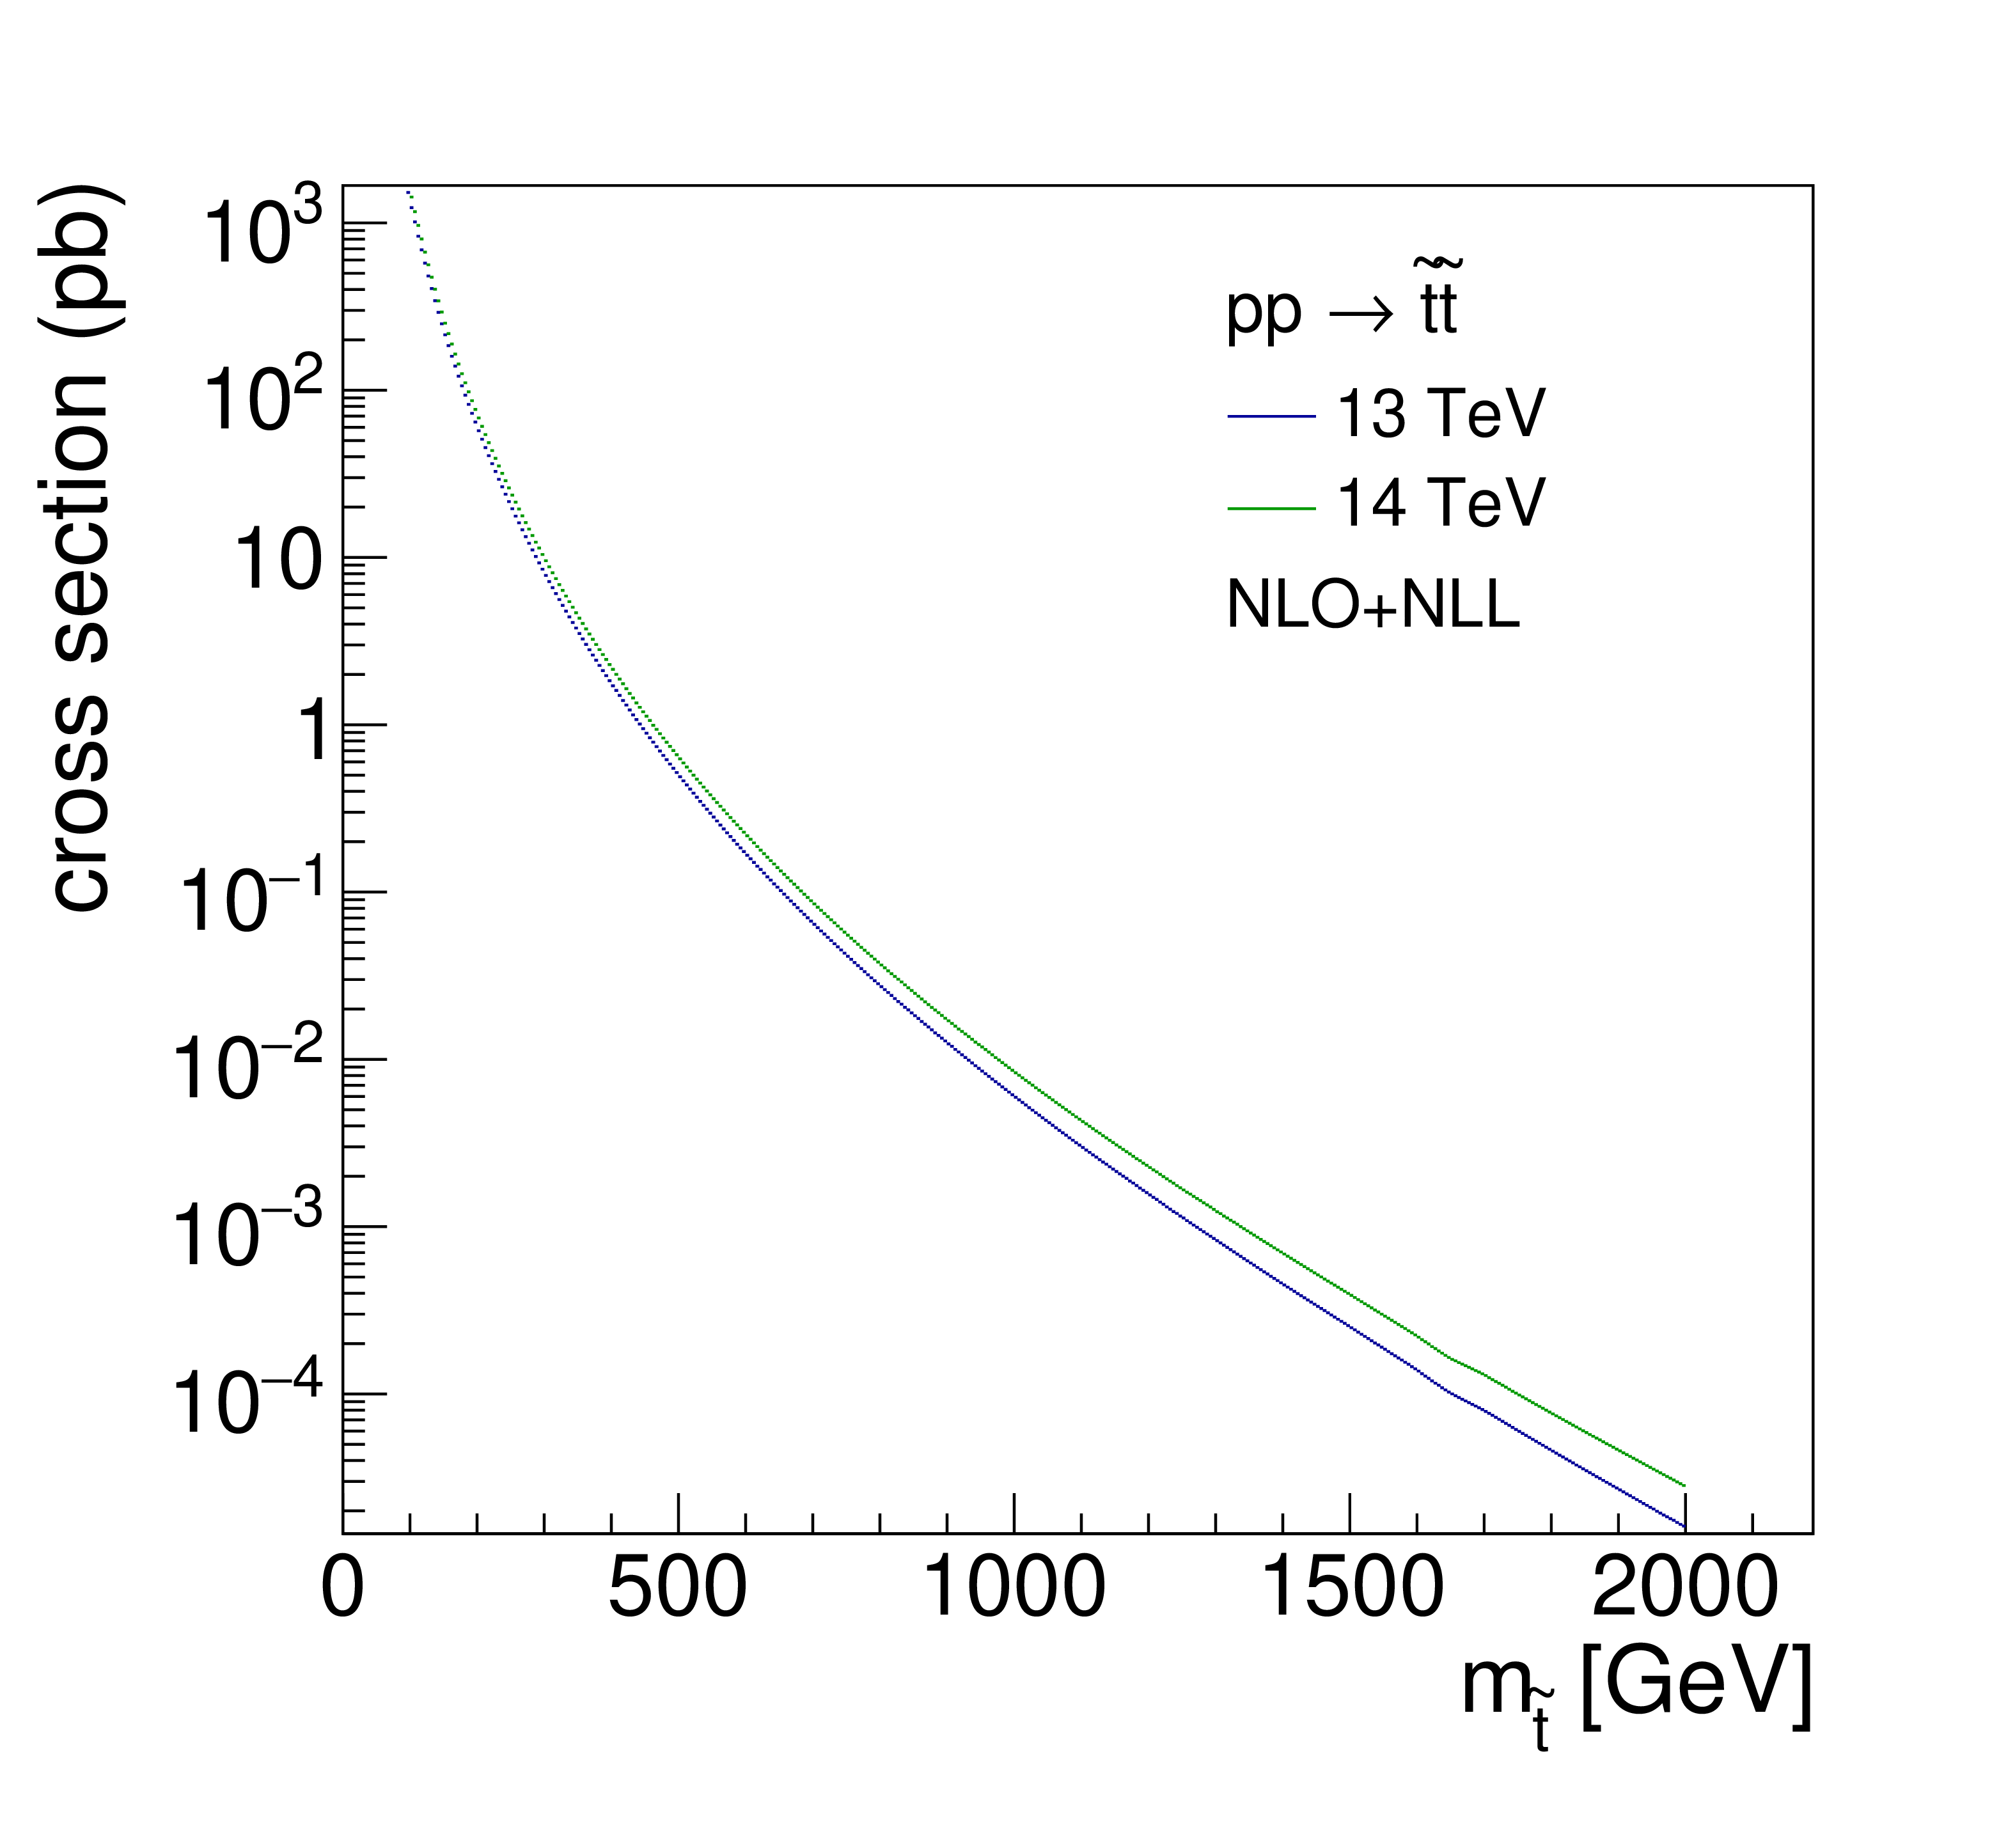
Figure 3:
The $ {\mathrm {p}} {\mathrm {p}}\to {\mathrm {\tilde{g}}}{\mathrm {\tilde{g}}}$ (left) and $ {\mathrm {p}} {\mathrm {p}}\to {\tilde{t}} {\tilde{t}} $ (right) production cross sections at NLO+NLL precision versus the gluino and top squark masses, respectively. |

png pdf |
Figure 3-a:
The $ {\mathrm {p}} {\mathrm {p}}\to {\mathrm {\tilde{g}}}{\mathrm {\tilde{g}}}$ (left) and $ {\mathrm {p}} {\mathrm {p}}\to {\tilde{t}} {\tilde{t}} $ (right) production cross sections at NLO+NLL precision versus the gluino and top squark masses, respectively. |
png pdf |
Figure 3-b:
The $ {\mathrm {p}} {\mathrm {p}}\to {\mathrm {\tilde{g}}}{\mathrm {\tilde{g}}}$ (left) and $ {\mathrm {p}} {\mathrm {p}}\to {\tilde{t}} {\tilde{t}} $ (right) production cross sections at NLO+NLL precision versus the gluino and top squark masses, respectively. |
png pdf |
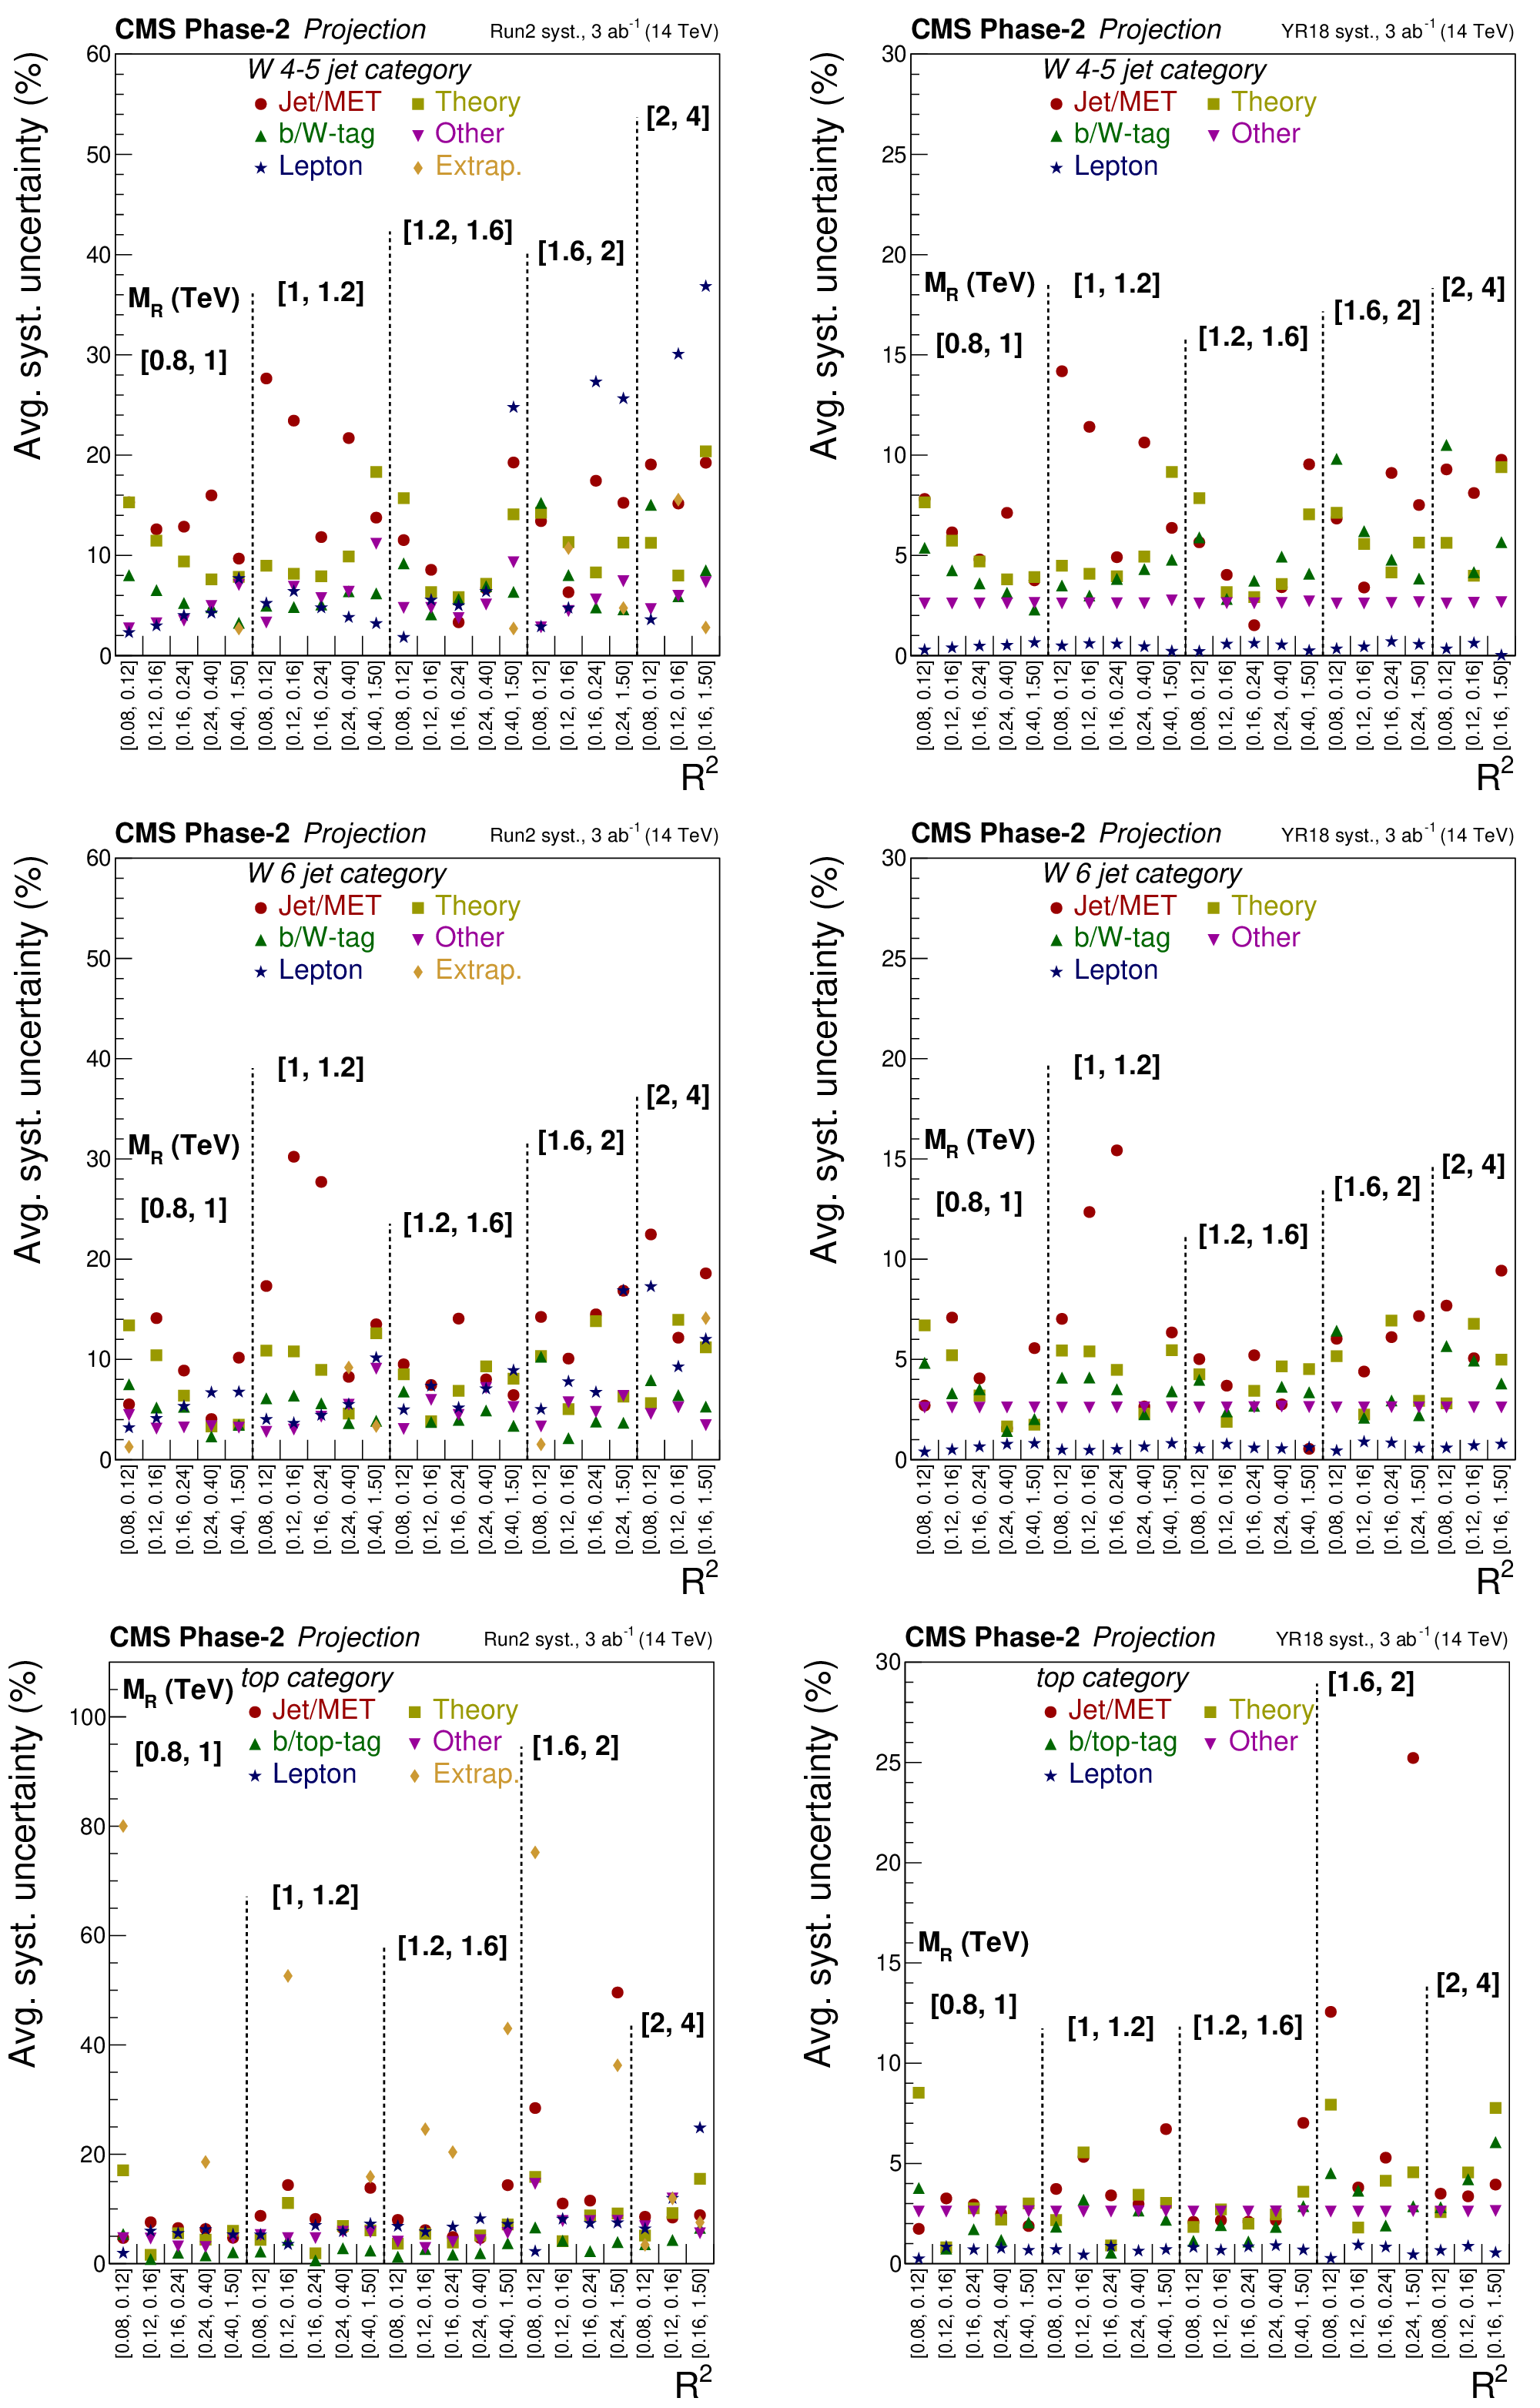
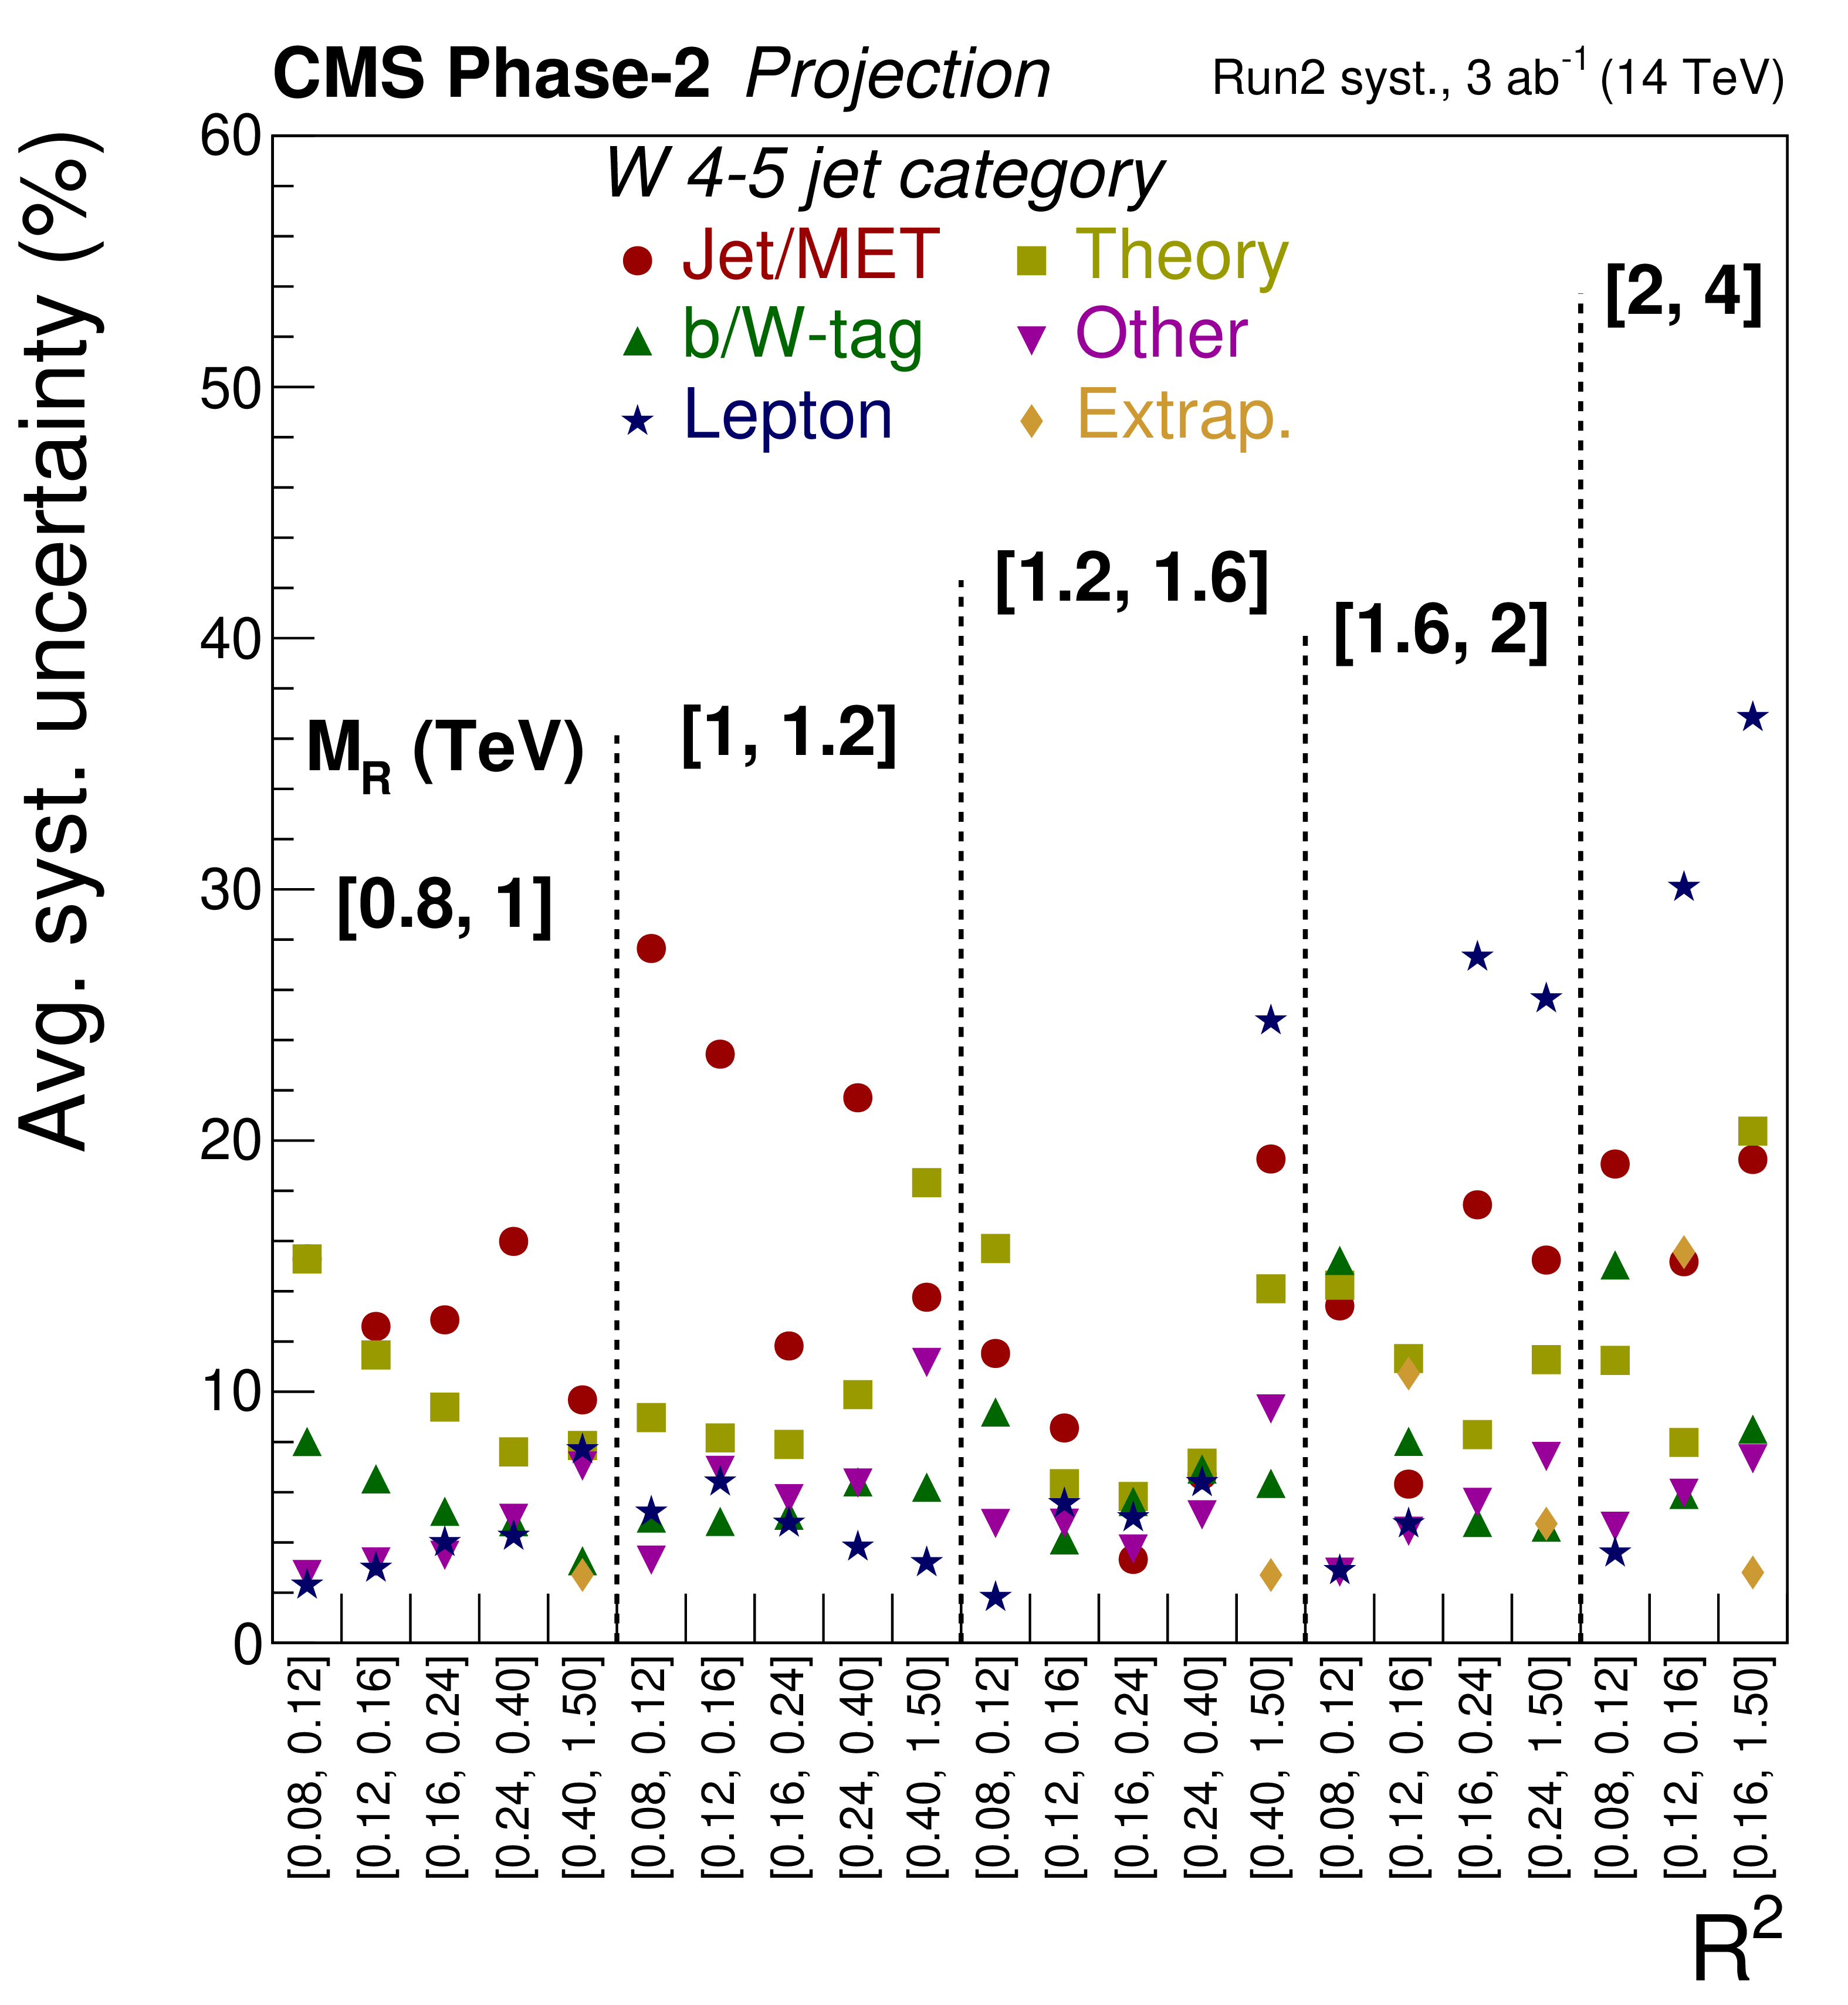
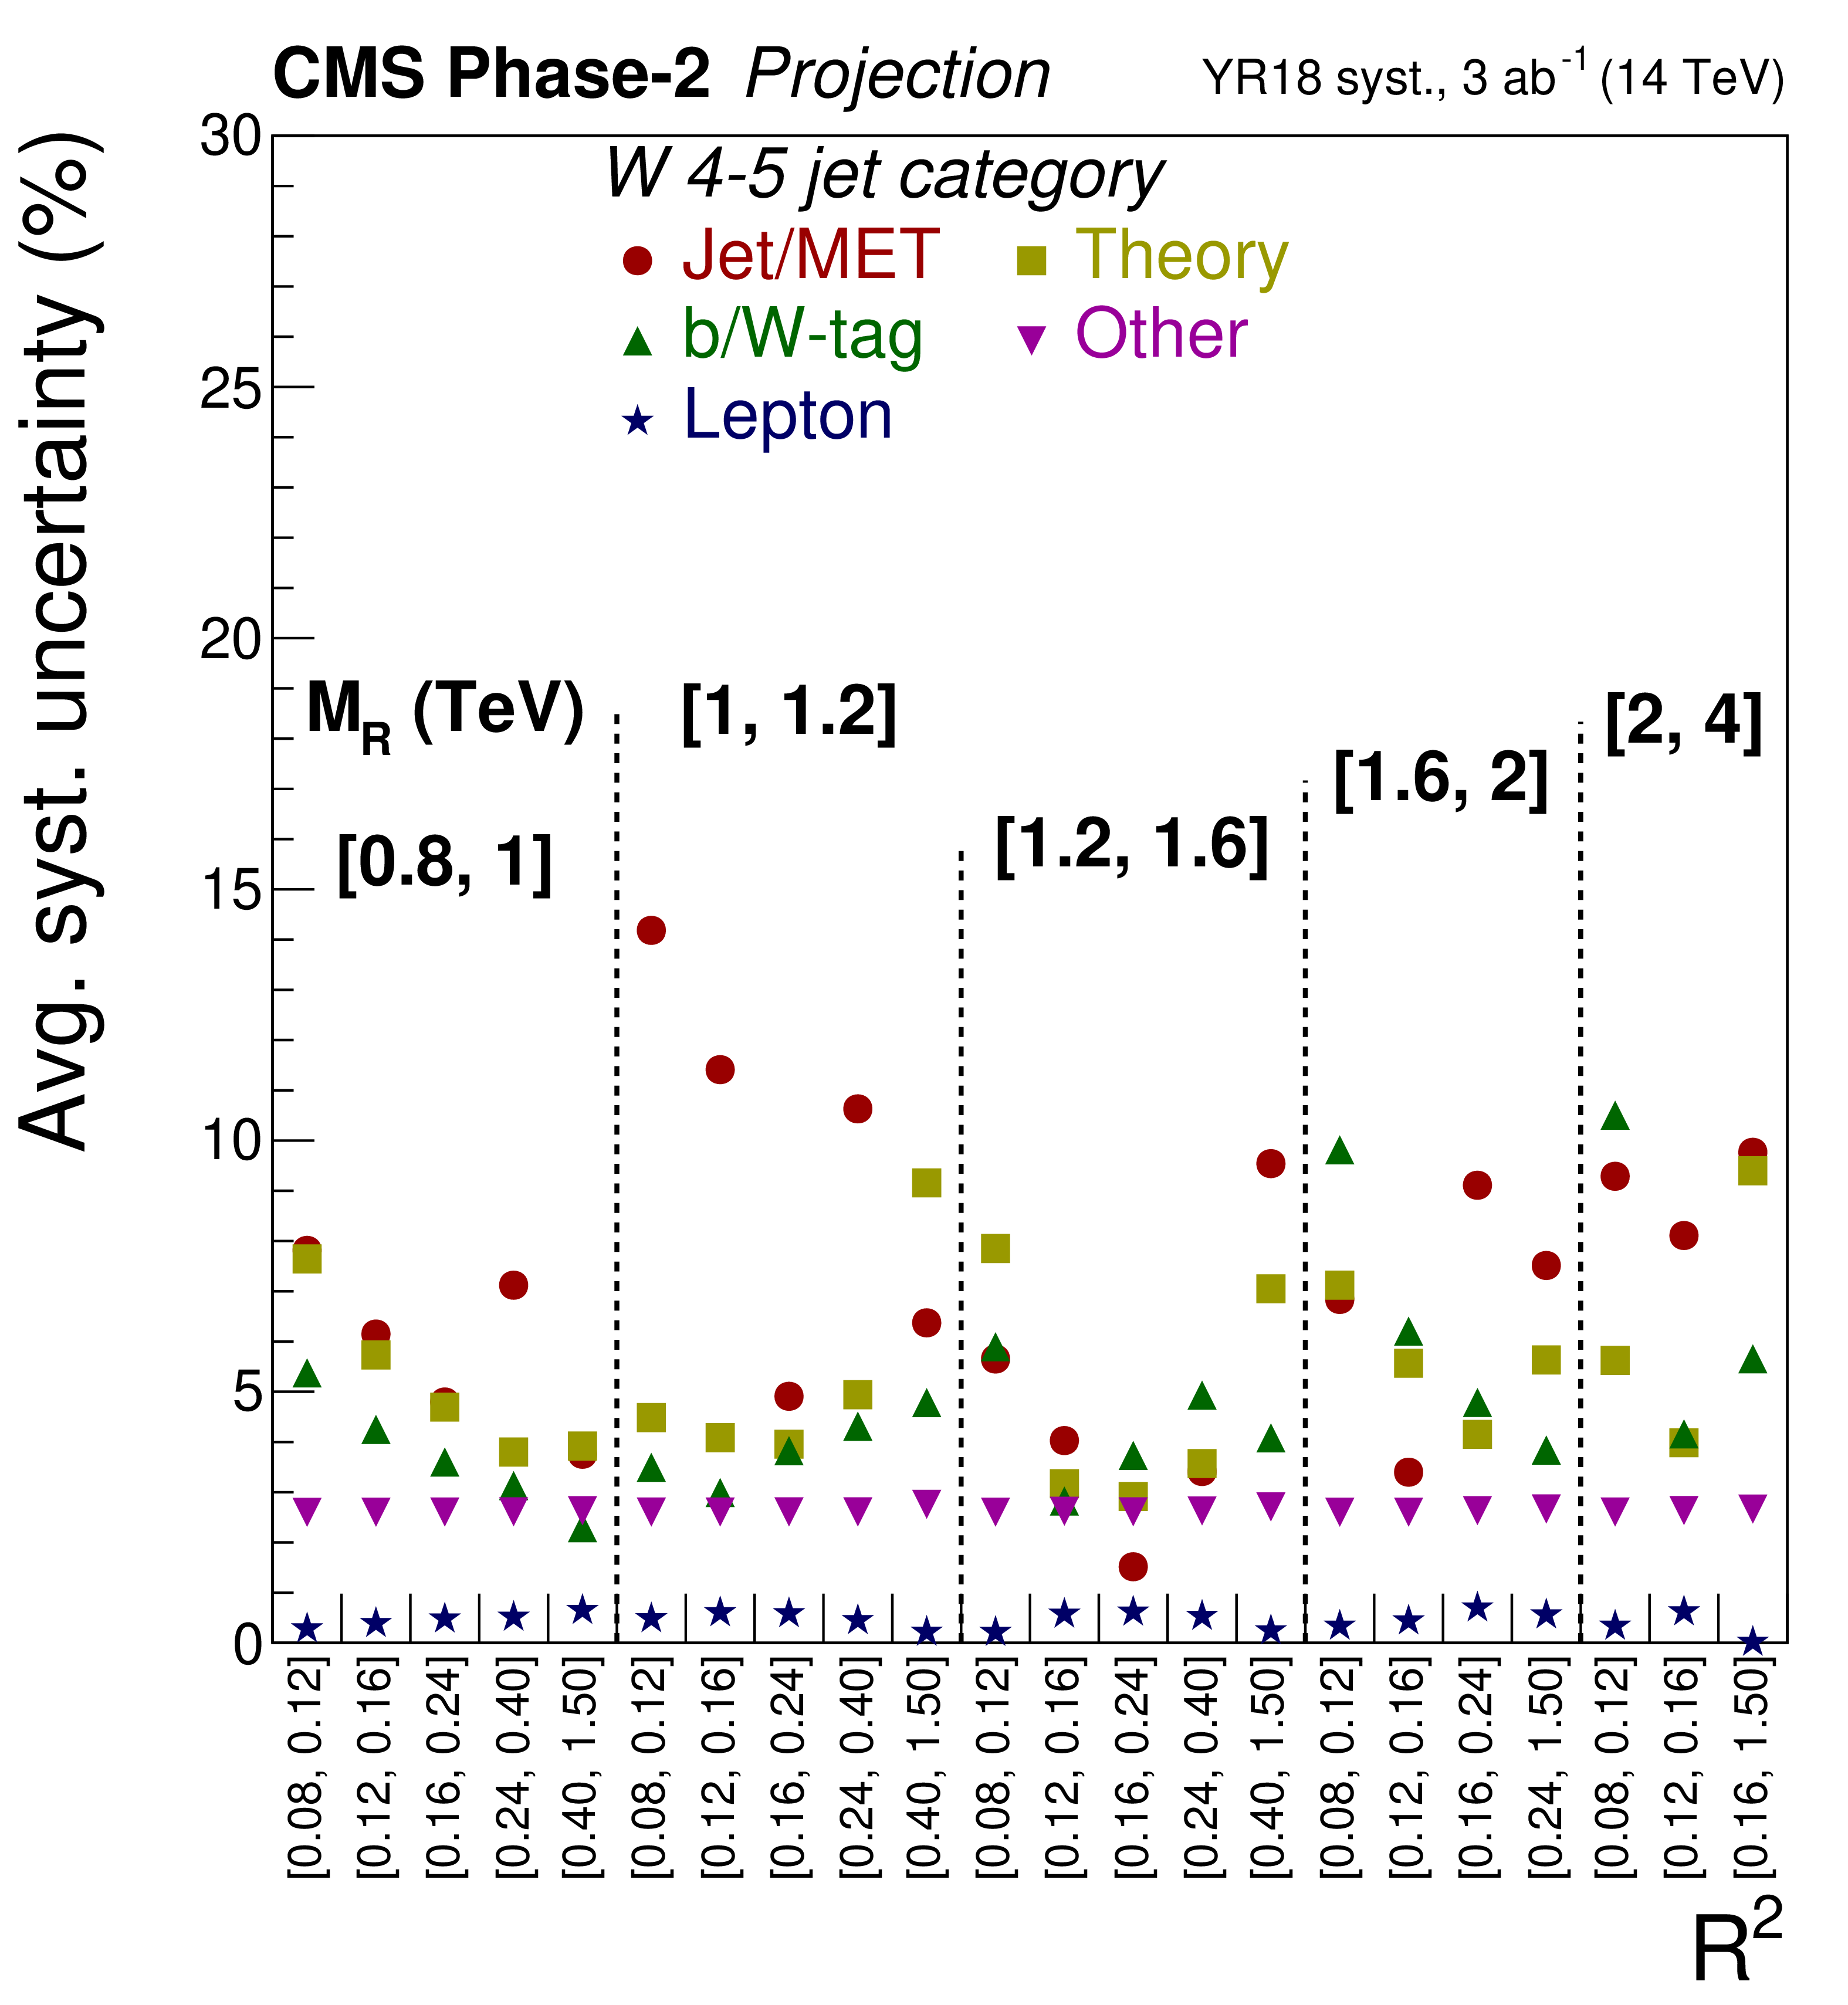
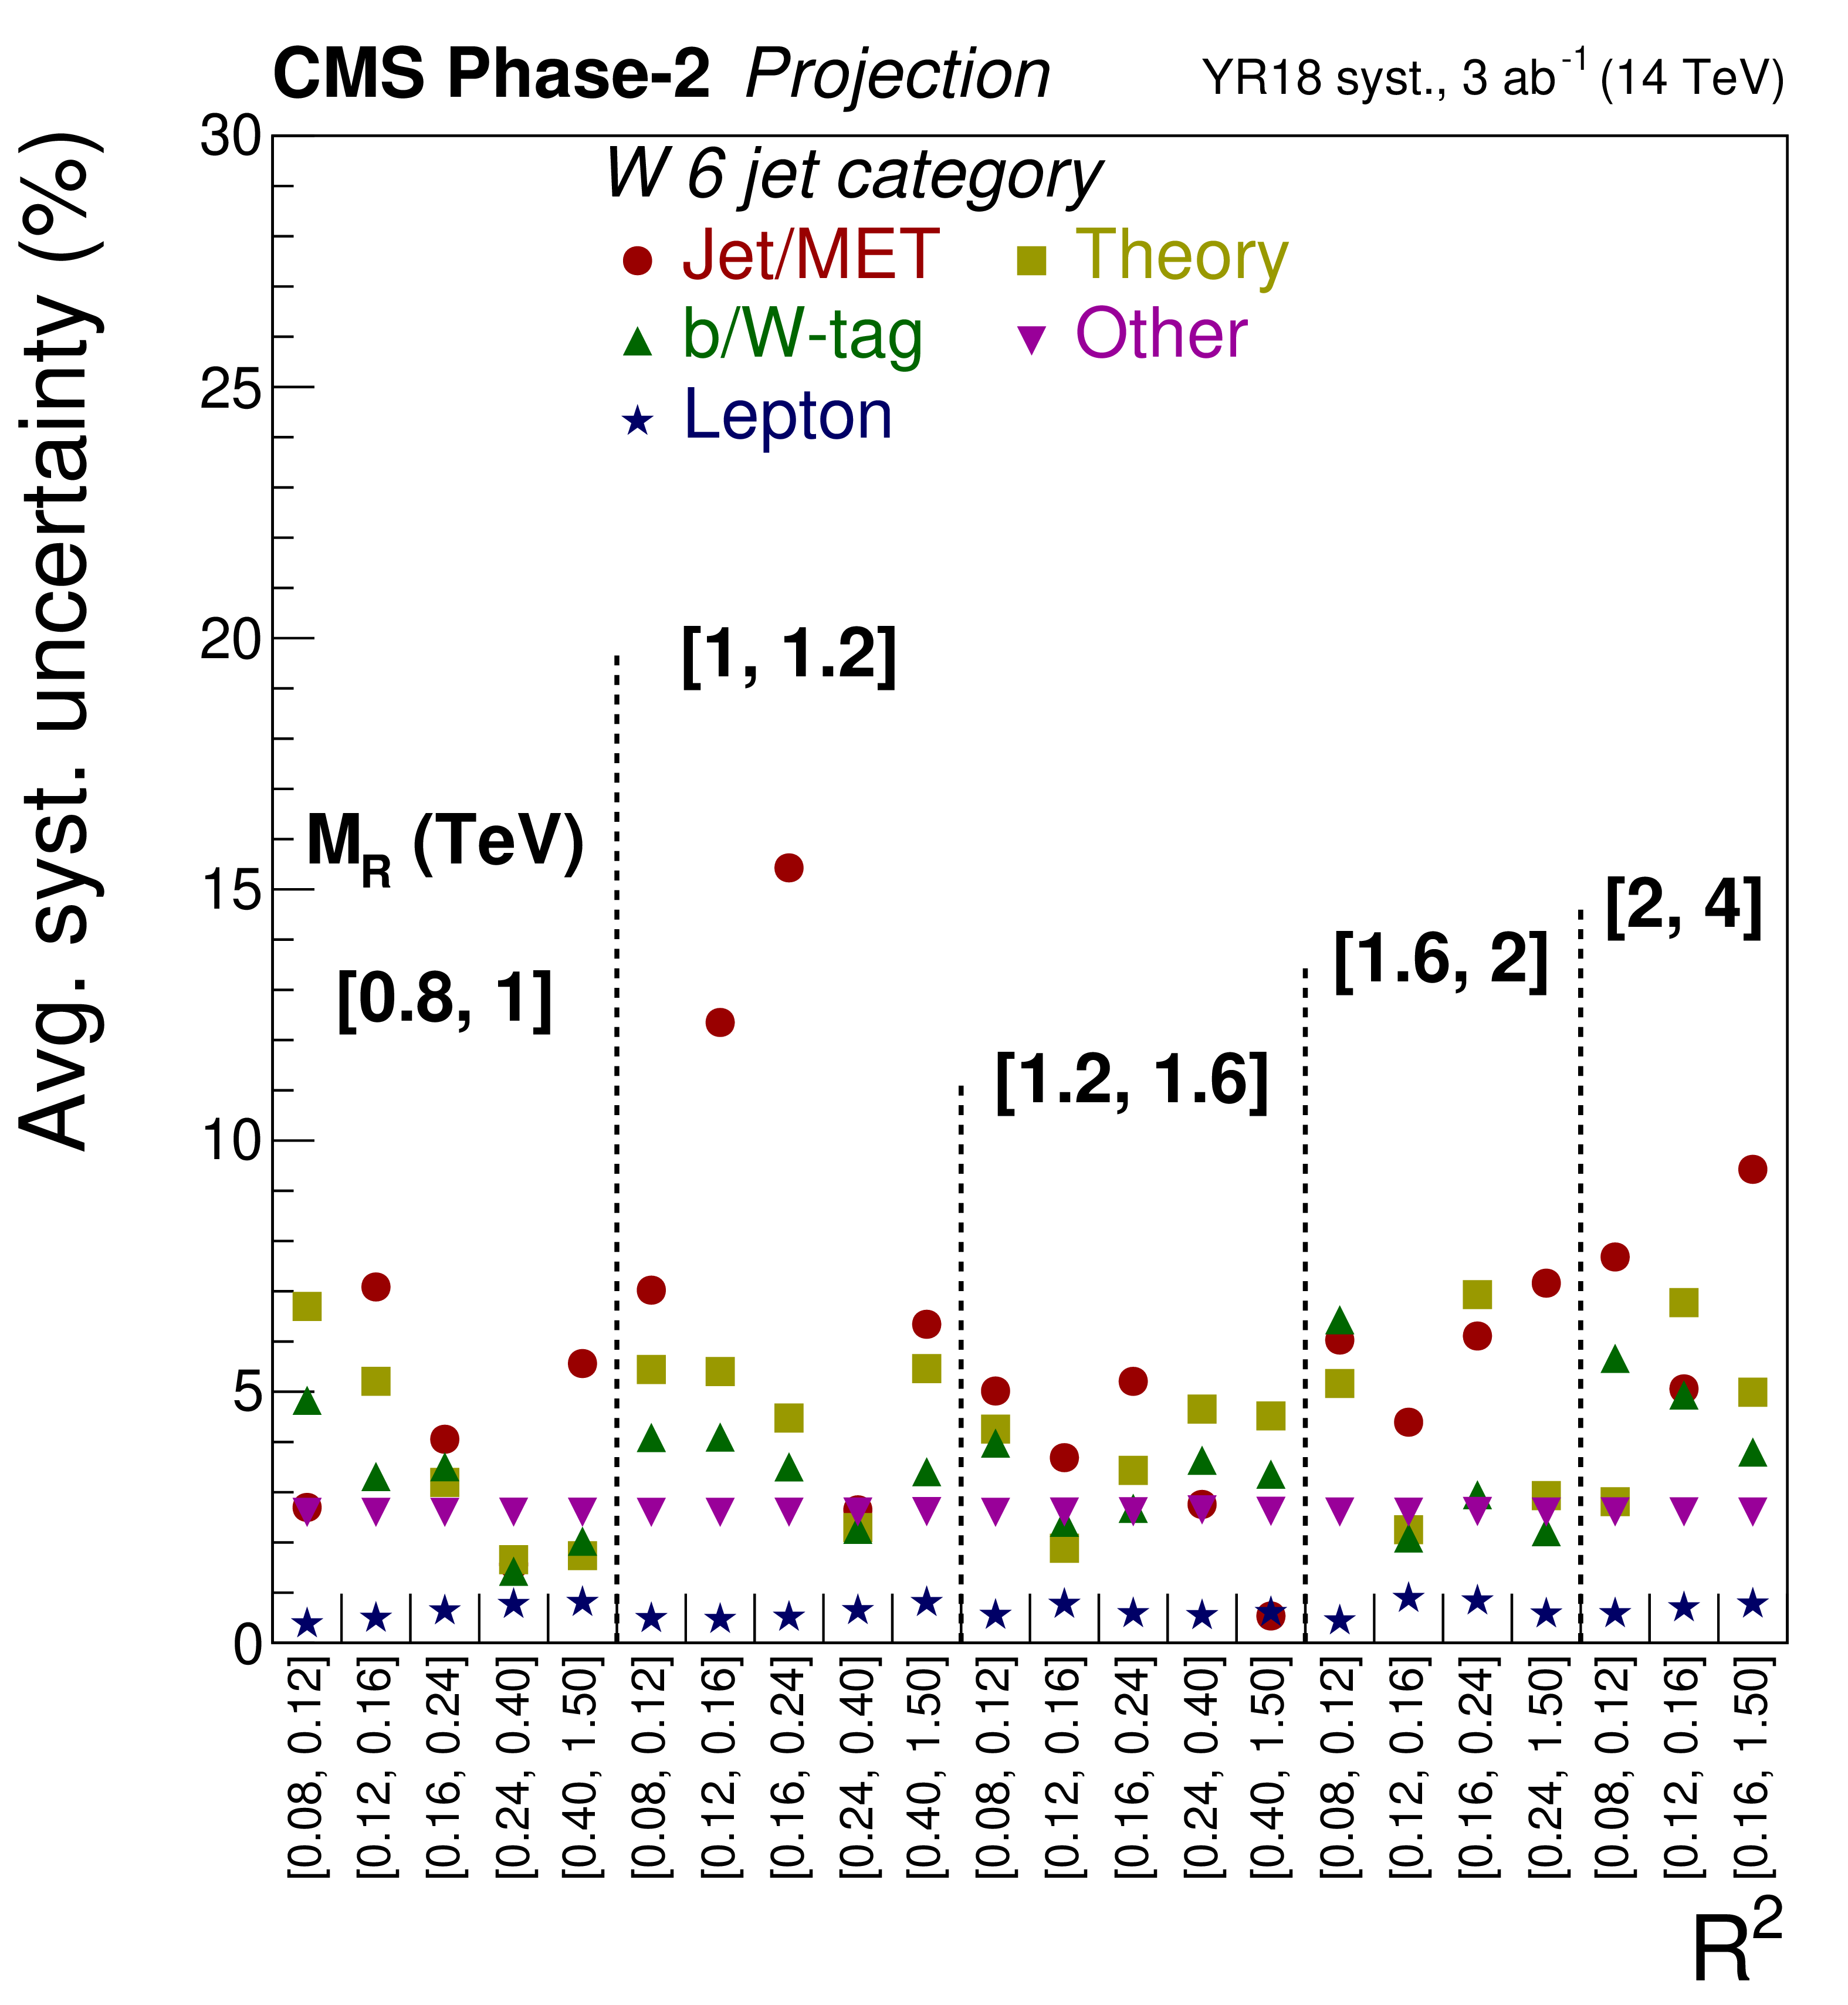
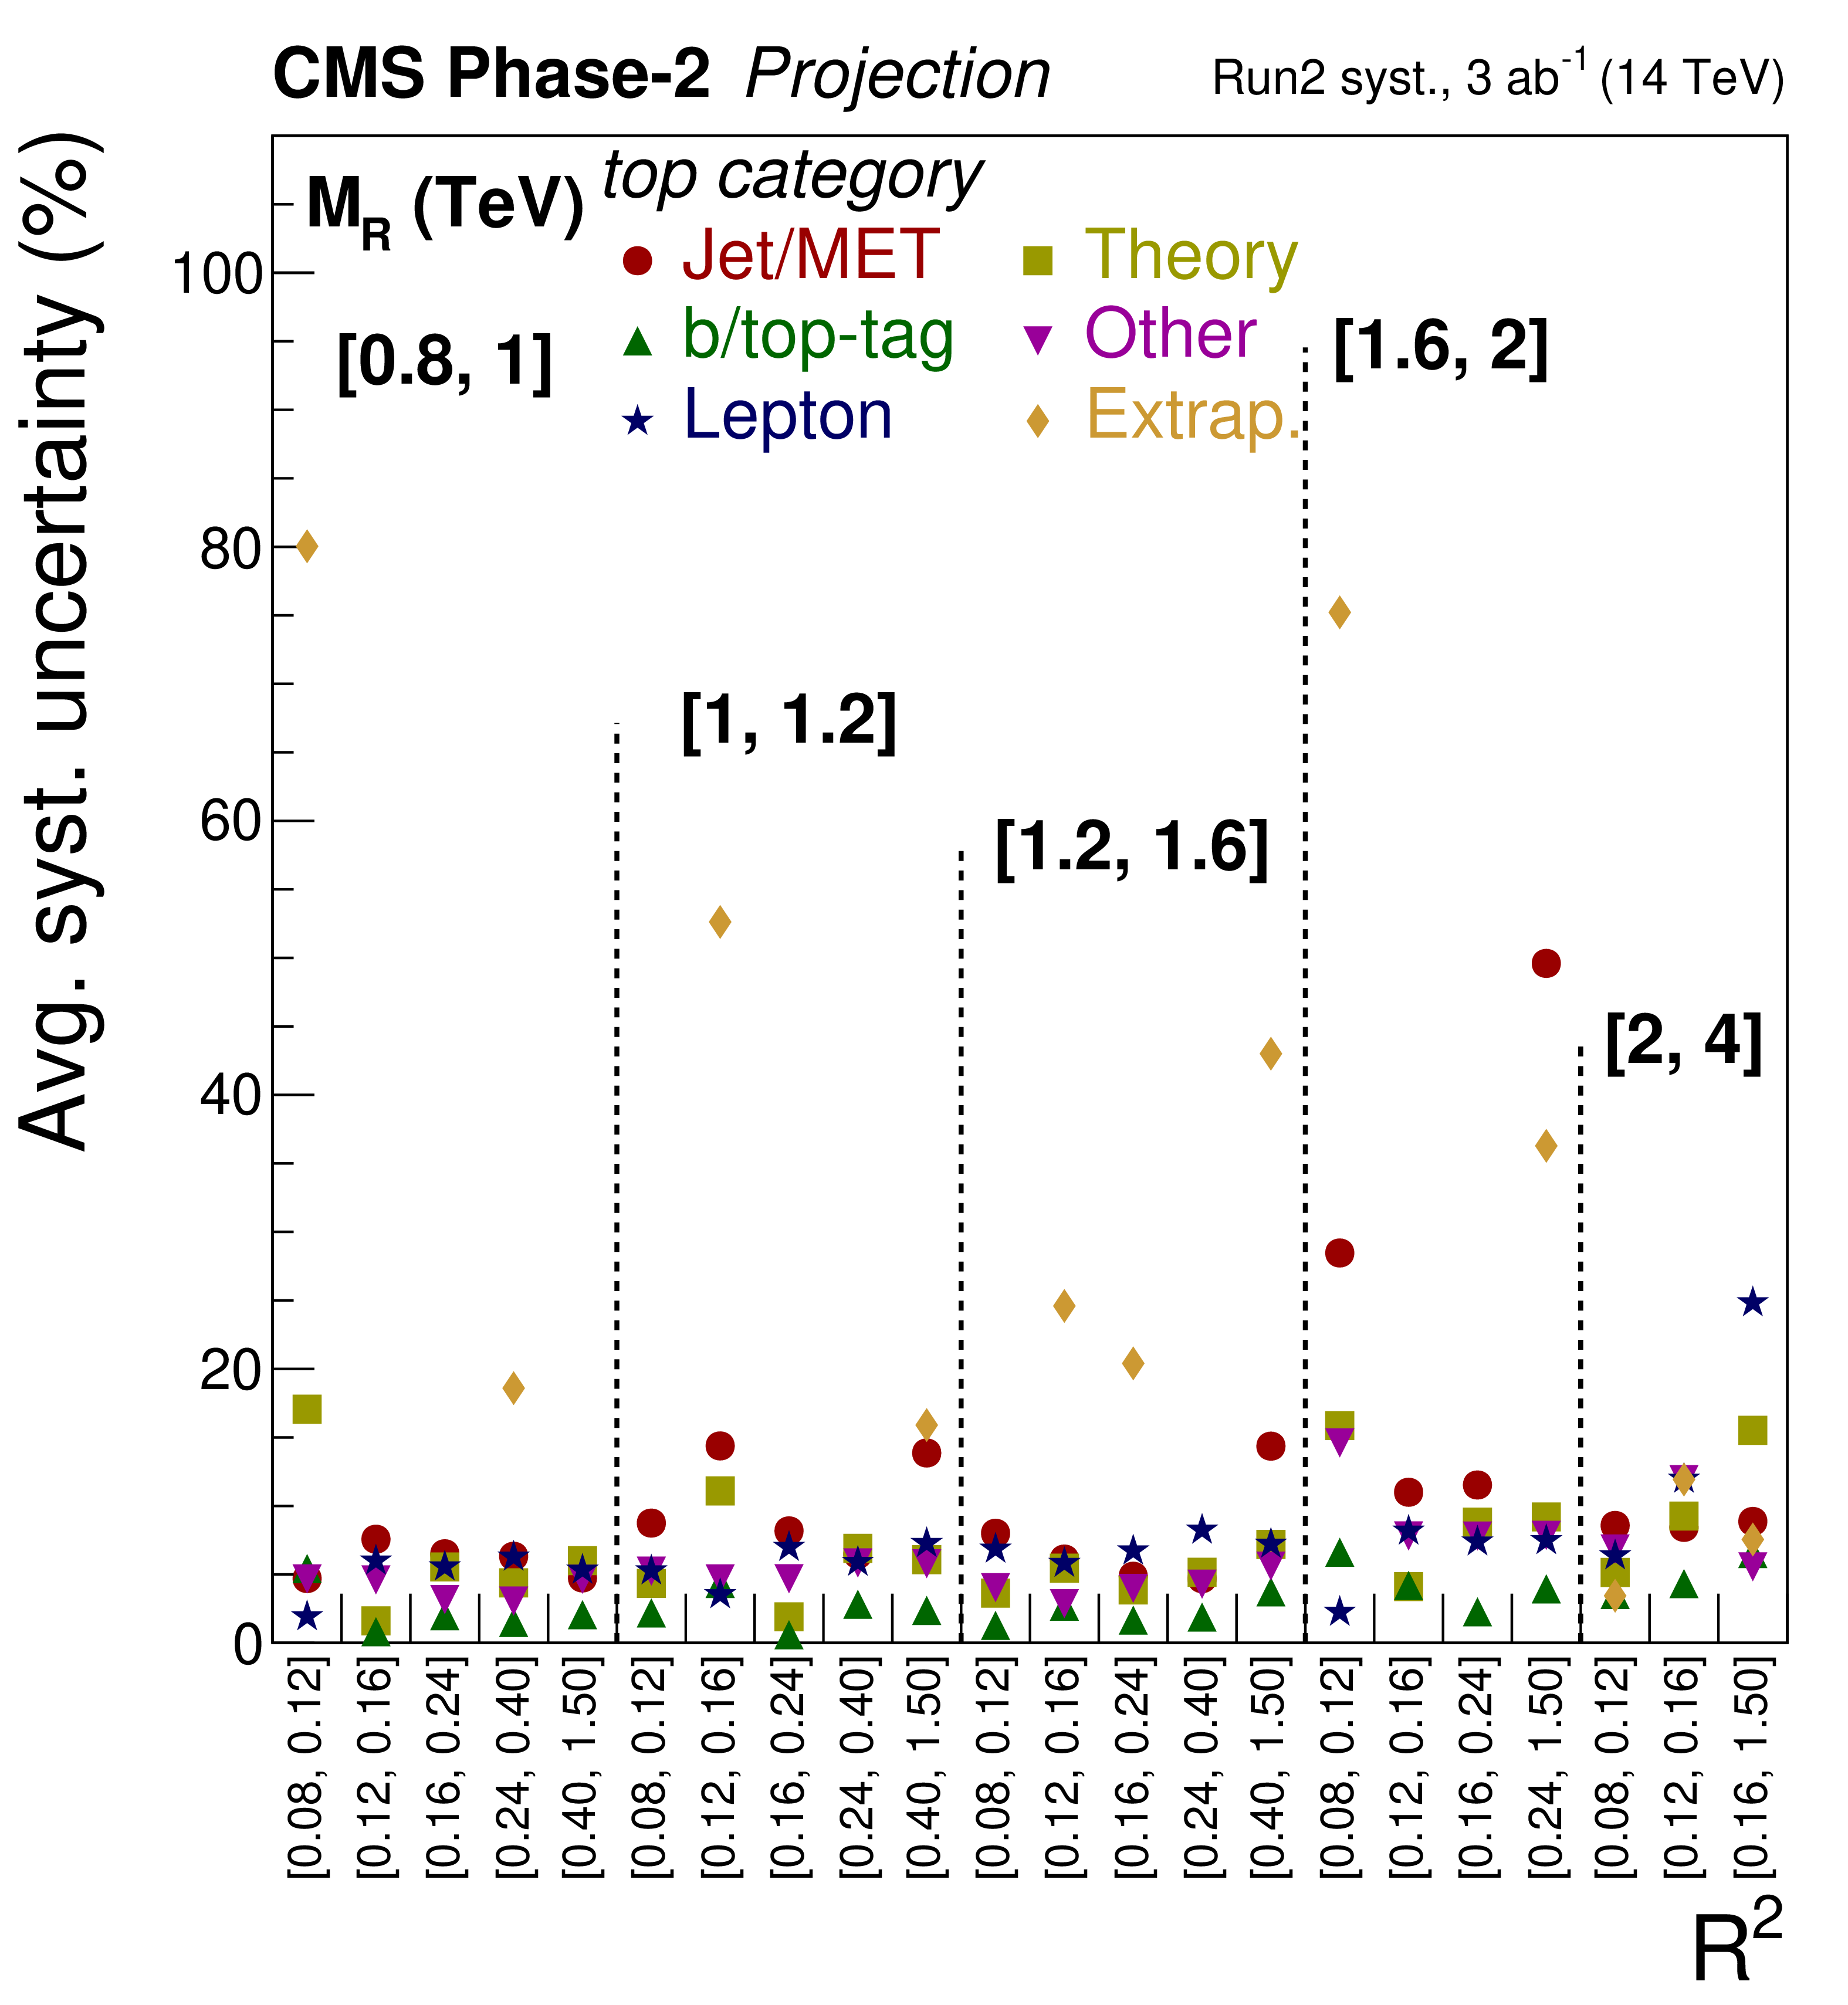
Figure 4:
Average percentage contributions of various systematic uncertainties to the overall background estimation under the background-only assumption as a function of bins in ${M_{R}}$ and ${R^{2}}$ for the W 4-5 jet (top), W 6 jet (middle), and Top (bottom) categories for the Run 2 (left) and YR18 (right) scenarios. |
png pdf |
Figure 4-a:
Average percentage contributions of various systematic uncertainties to the overall background estimation under the background-only assumption as a function of bins in ${M_{R}}$ and ${R^{2}}$ for the W 4-5 jet (top), W 6 jet (middle), and Top (bottom) categories for the Run 2 (left) and YR18 (right) scenarios. |
png pdf |
Figure 4-b:
Average percentage contributions of various systematic uncertainties to the overall background estimation under the background-only assumption as a function of bins in ${M_{R}}$ and ${R^{2}}$ for the W 4-5 jet (top), W 6 jet (middle), and Top (bottom) categories for the Run 2 (left) and YR18 (right) scenarios. |

png pdf |
Figure 4-c:
Average percentage contributions of various systematic uncertainties to the overall background estimation under the background-only assumption as a function of bins in ${M_{R}}$ and ${R^{2}}$ for the W 4-5 jet (top), W 6 jet (middle), and Top (bottom) categories for the Run 2 (left) and YR18 (right) scenarios. |
png pdf |
Figure 4-d:
Average percentage contributions of various systematic uncertainties to the overall background estimation under the background-only assumption as a function of bins in ${M_{R}}$ and ${R^{2}}$ for the W 4-5 jet (top), W 6 jet (middle), and Top (bottom) categories for the Run 2 (left) and YR18 (right) scenarios. |
png pdf |
Figure 4-e:
Average percentage contributions of various systematic uncertainties to the overall background estimation under the background-only assumption as a function of bins in ${M_{R}}$ and ${R^{2}}$ for the W 4-5 jet (top), W 6 jet (middle), and Top (bottom) categories for the Run 2 (left) and YR18 (right) scenarios. |

png pdf |
Figure 4-f:
Average percentage contributions of various systematic uncertainties to the overall background estimation under the background-only assumption as a function of bins in ${M_{R}}$ and ${R^{2}}$ for the W 4-5 jet (top), W 6 jet (middle), and Top (bottom) categories for the Run 2 (left) and YR18 (right) scenarios. |

png pdf |
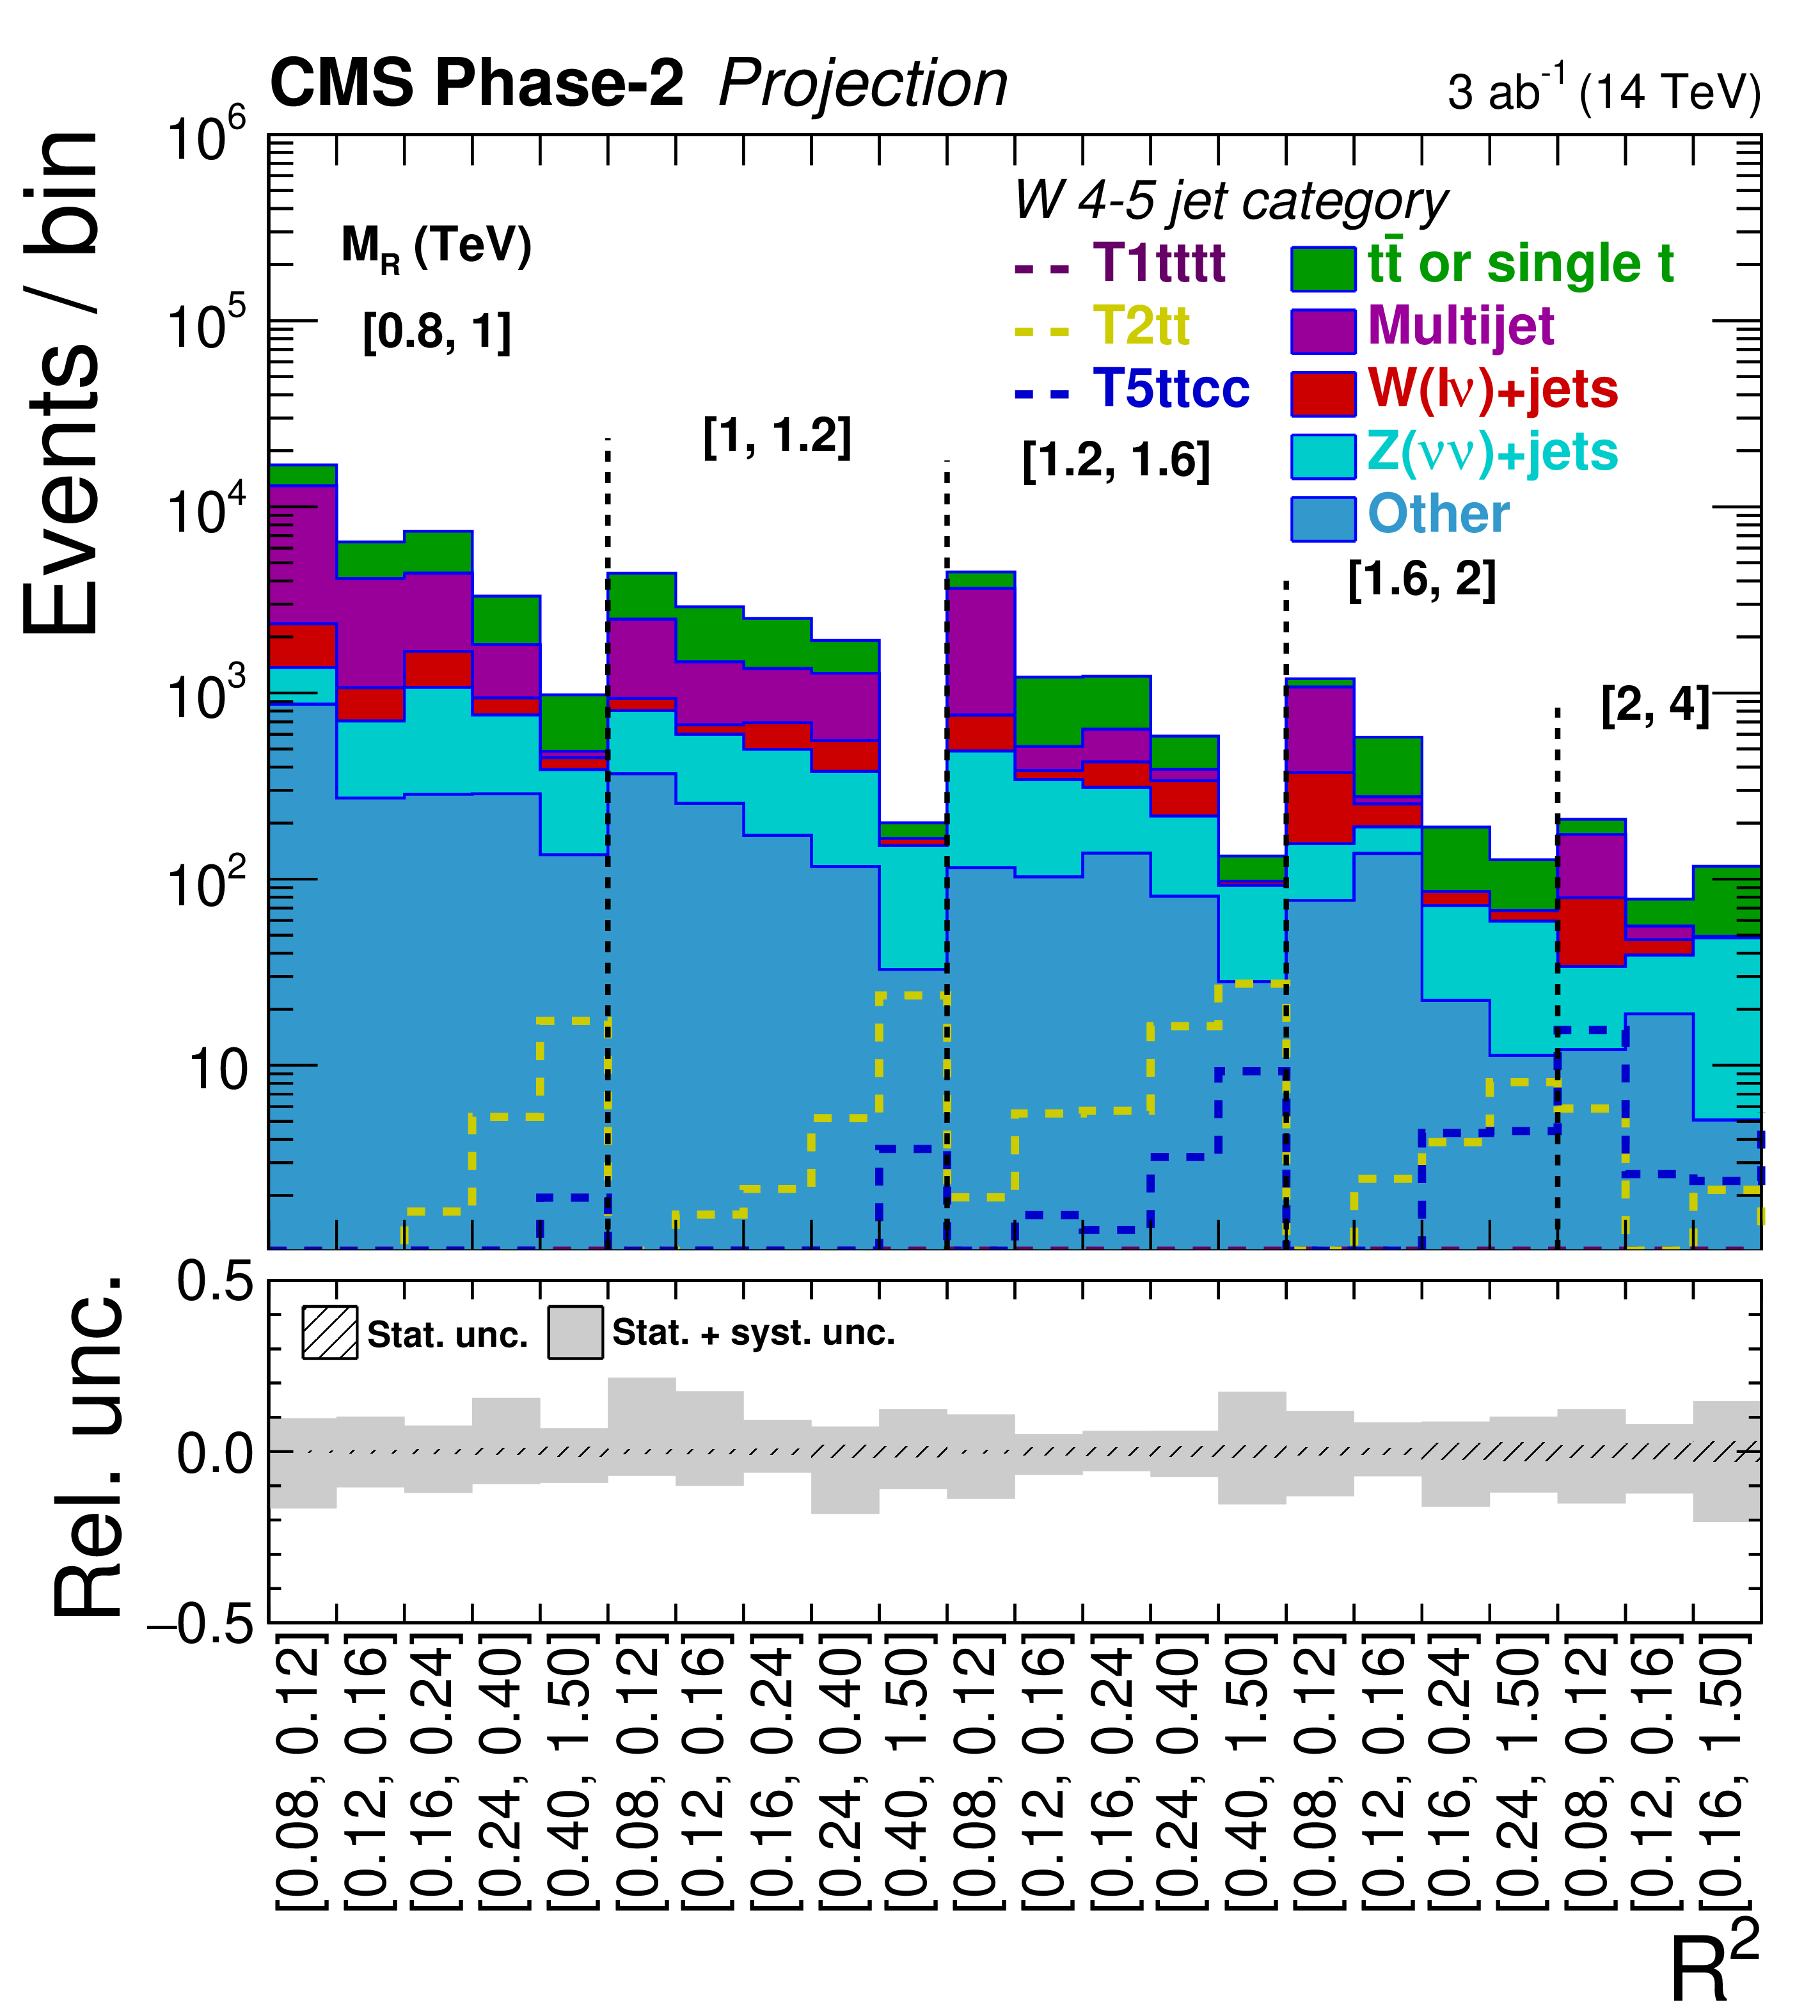
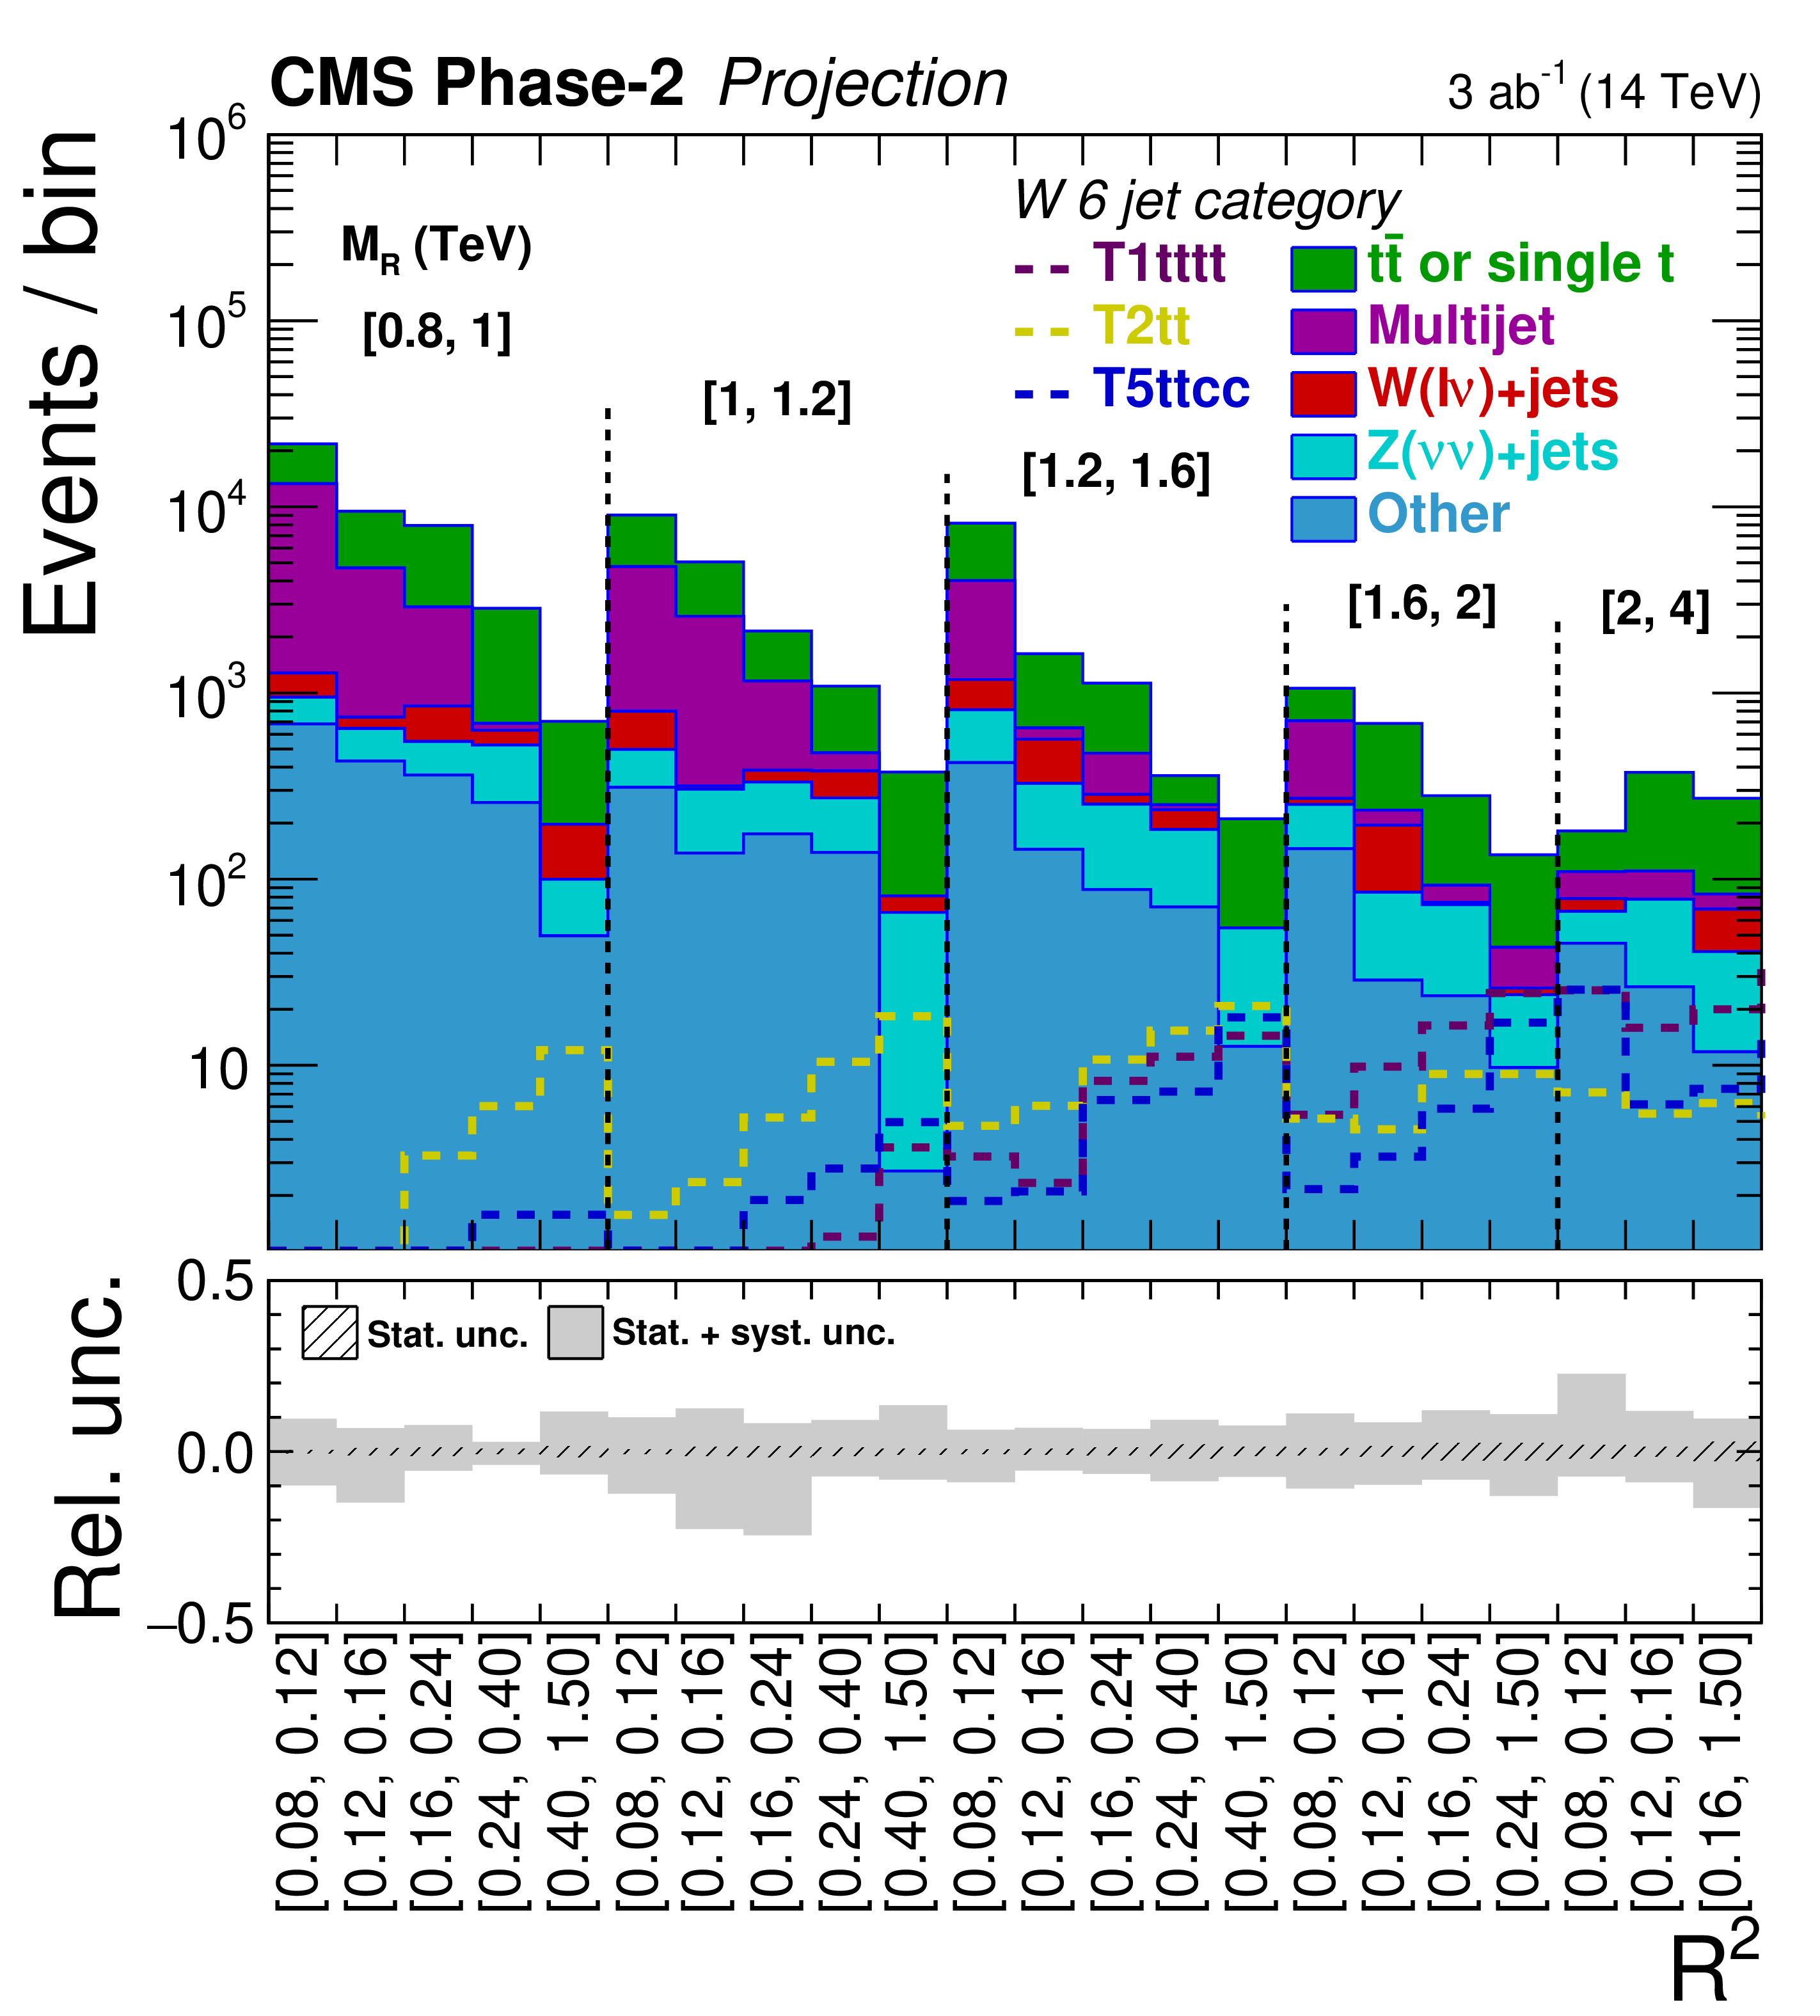
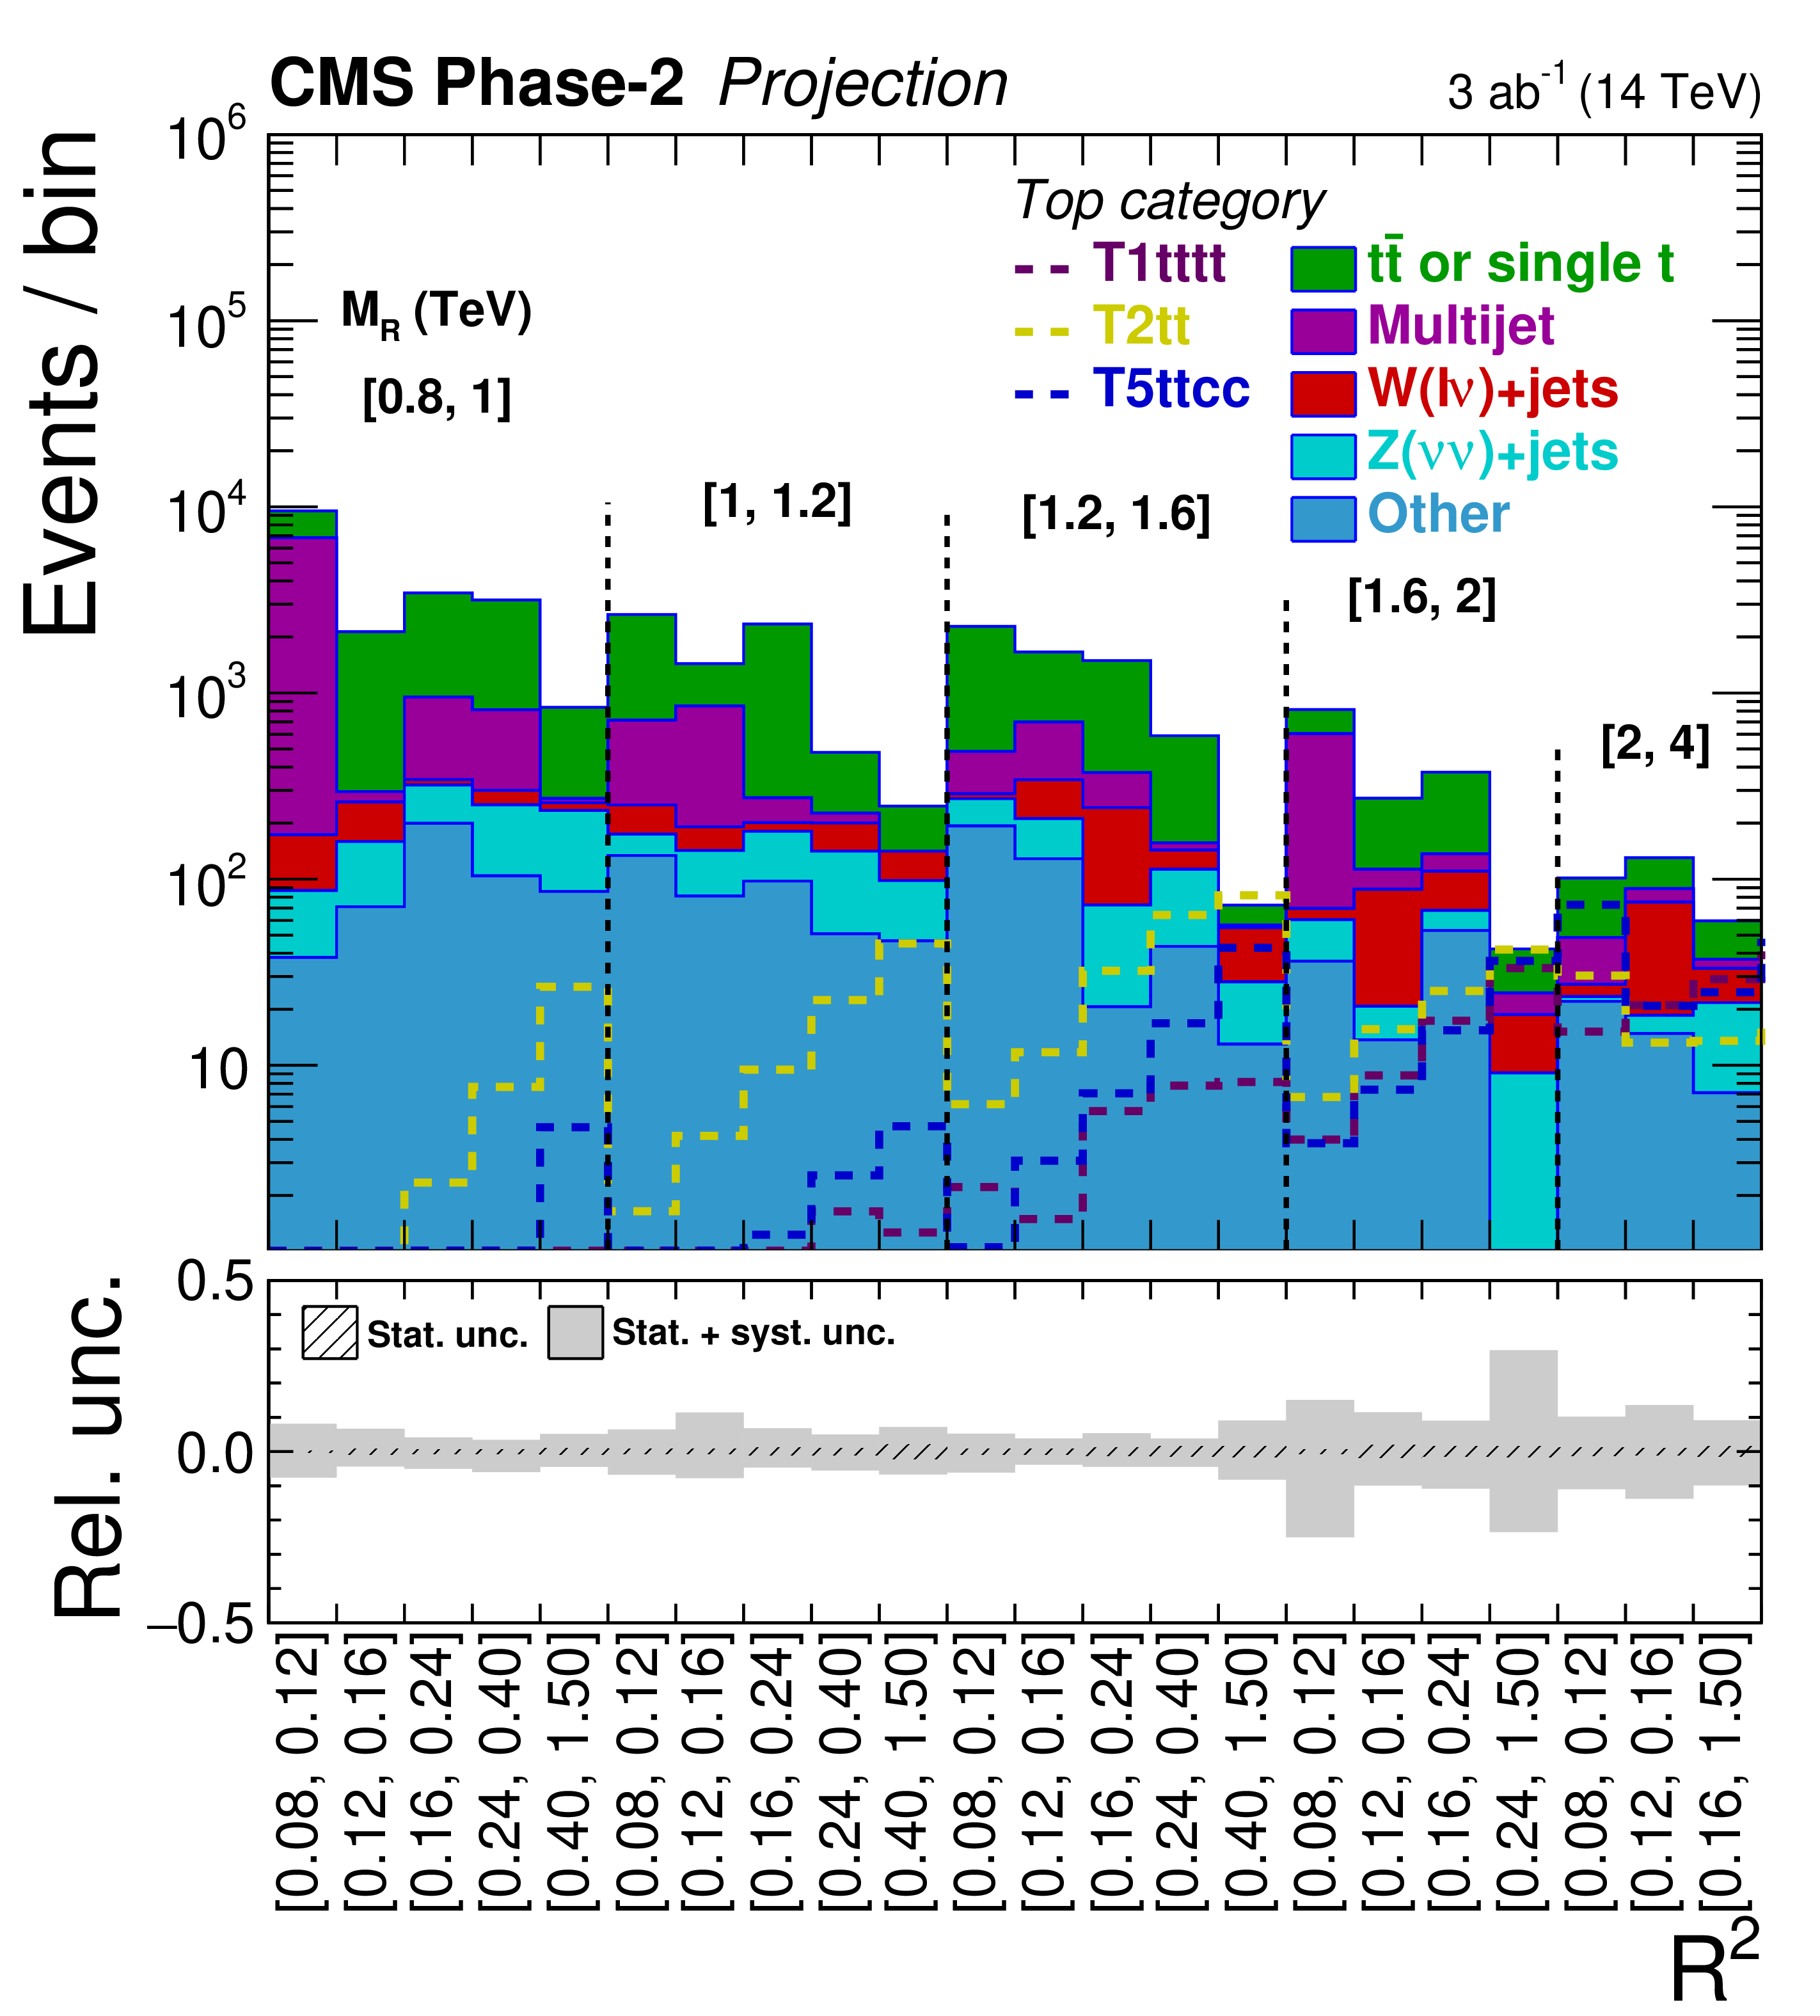
Figure 5:
${M_{R}} - {R^{2}}$ distributions shown in a one-dimensional representation for background predictions obtained for the W 4-5 jet (upper left), W 6 jet (upper right), and Top (lower) categories for the HL-LHC. Statistical and systematic uncertainties for the YR18 scenario are shown with the hatched and shaded error bars, respectively. Also shown are the signal benchmark models T5ttcc with $m_{{\mathrm {\tilde{g}}}} = $ 2 TeV, $m_{{\tilde{t}}} = $ 320 GeV and $m_{{\tilde{\chi}^{0}_{1}}} = $ 300 GeV; T1tttt with $m_{{\mathrm {\tilde{g}}}} = $ 2 TeV and $m_{{\tilde{\chi}^{0}_{1}}} = $ 300 GeV; and T2tt with $m_{{\tilde{t}}} = $ 1.2 TeV and $m_{{\tilde{\chi}^{0}_{1}}} = $ 100 GeV. |
png pdf |
Figure 5-a:
${M_{R}} - {R^{2}}$ distributions shown in a one-dimensional representation for background predictions obtained for the W 4-5 jet (upper left), W 6 jet (upper right), and Top (lower) categories for the HL-LHC. Statistical and systematic uncertainties for the YR18 scenario are shown with the hatched and shaded error bars, respectively. Also shown are the signal benchmark models T5ttcc with $m_{{\mathrm {\tilde{g}}}} = $ 2 TeV, $m_{{\tilde{t}}} = $ 320 GeV and $m_{{\tilde{\chi}^{0}_{1}}} = $ 300 GeV; T1tttt with $m_{{\mathrm {\tilde{g}}}} = $ 2 TeV and $m_{{\tilde{\chi}^{0}_{1}}} = $ 300 GeV; and T2tt with $m_{{\tilde{t}}} = $ 1.2 TeV and $m_{{\tilde{\chi}^{0}_{1}}} = $ 100 GeV. |
png pdf |
Figure 5-b:
${M_{R}} - {R^{2}}$ distributions shown in a one-dimensional representation for background predictions obtained for the W 4-5 jet (upper left), W 6 jet (upper right), and Top (lower) categories for the HL-LHC. Statistical and systematic uncertainties for the YR18 scenario are shown with the hatched and shaded error bars, respectively. Also shown are the signal benchmark models T5ttcc with $m_{{\mathrm {\tilde{g}}}} = $ 2 TeV, $m_{{\tilde{t}}} = $ 320 GeV and $m_{{\tilde{\chi}^{0}_{1}}} = $ 300 GeV; T1tttt with $m_{{\mathrm {\tilde{g}}}} = $ 2 TeV and $m_{{\tilde{\chi}^{0}_{1}}} = $ 300 GeV; and T2tt with $m_{{\tilde{t}}} = $ 1.2 TeV and $m_{{\tilde{\chi}^{0}_{1}}} = $ 100 GeV. |
png pdf |
Figure 5-c:
${M_{R}} - {R^{2}}$ distributions shown in a one-dimensional representation for background predictions obtained for the W 4-5 jet (upper left), W 6 jet (upper right), and Top (lower) categories for the HL-LHC. Statistical and systematic uncertainties for the YR18 scenario are shown with the hatched and shaded error bars, respectively. Also shown are the signal benchmark models T5ttcc with $m_{{\mathrm {\tilde{g}}}} = $ 2 TeV, $m_{{\tilde{t}}} = $ 320 GeV and $m_{{\tilde{\chi}^{0}_{1}}} = $ 300 GeV; T1tttt with $m_{{\mathrm {\tilde{g}}}} = $ 2 TeV and $m_{{\tilde{\chi}^{0}_{1}}} = $ 300 GeV; and T2tt with $m_{{\tilde{t}}} = $ 1.2 TeV and $m_{{\tilde{\chi}^{0}_{1}}} = $ 100 GeV. |

png pdf |
Figure 6:
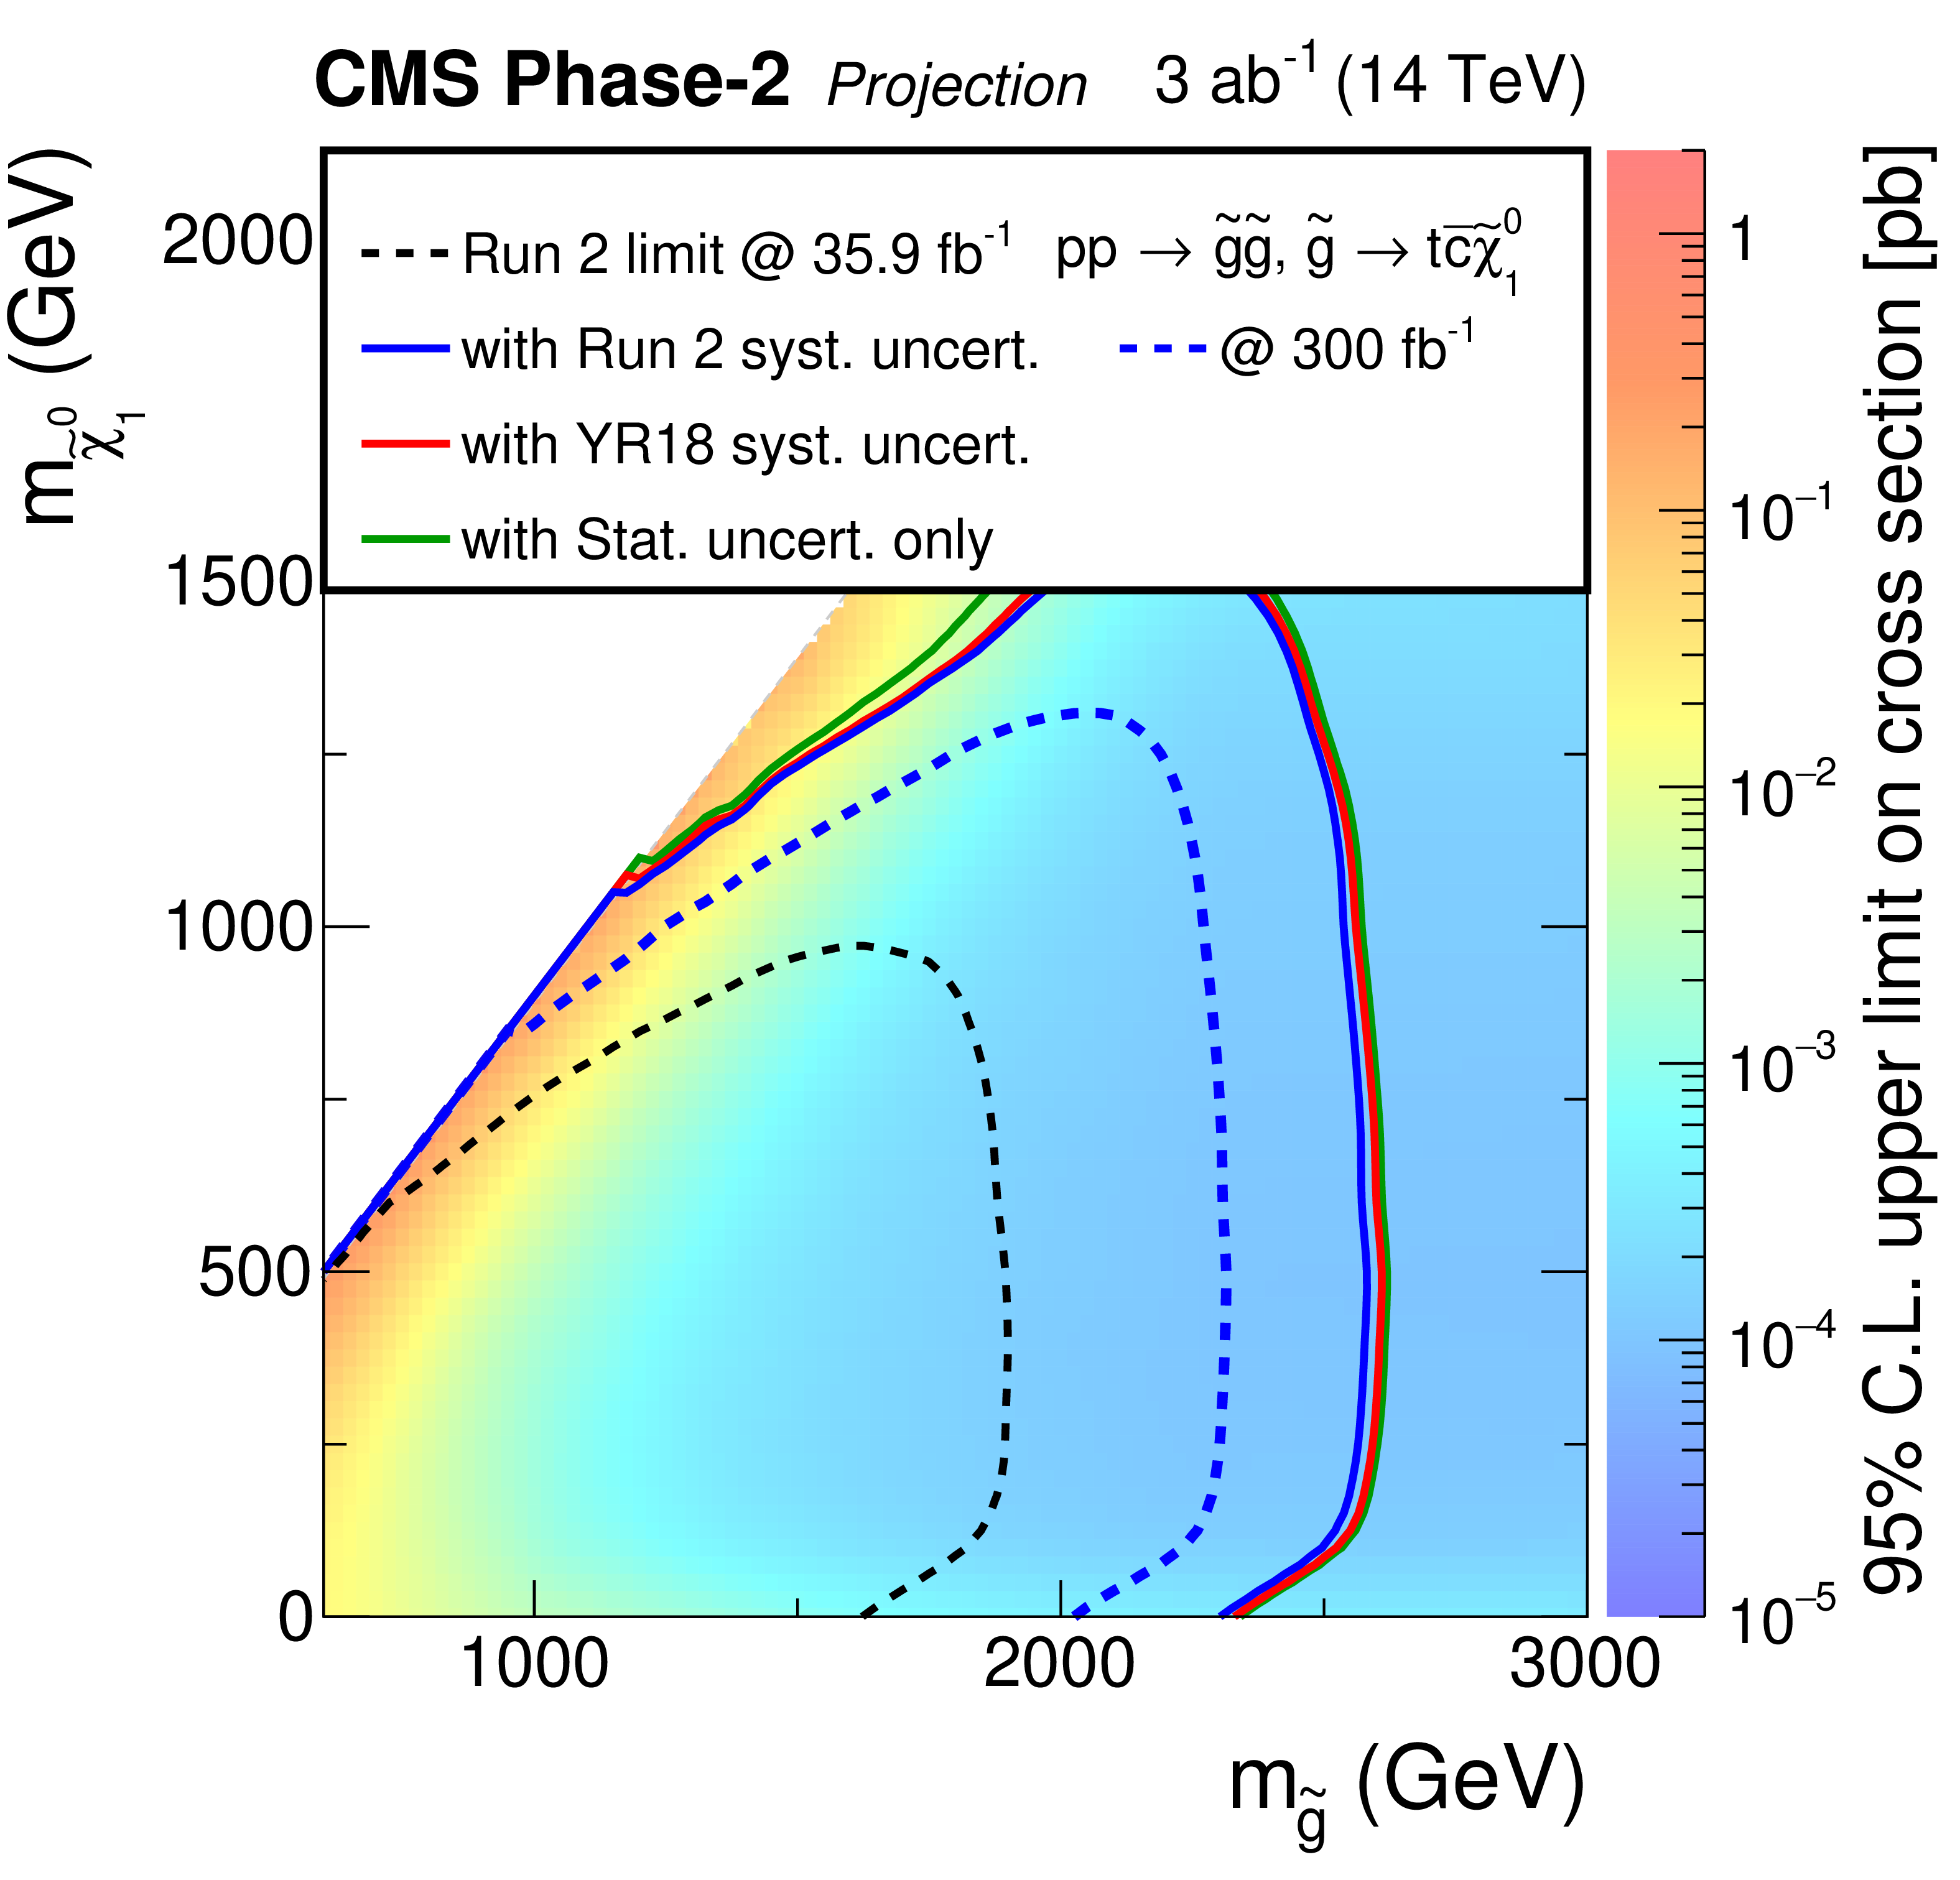
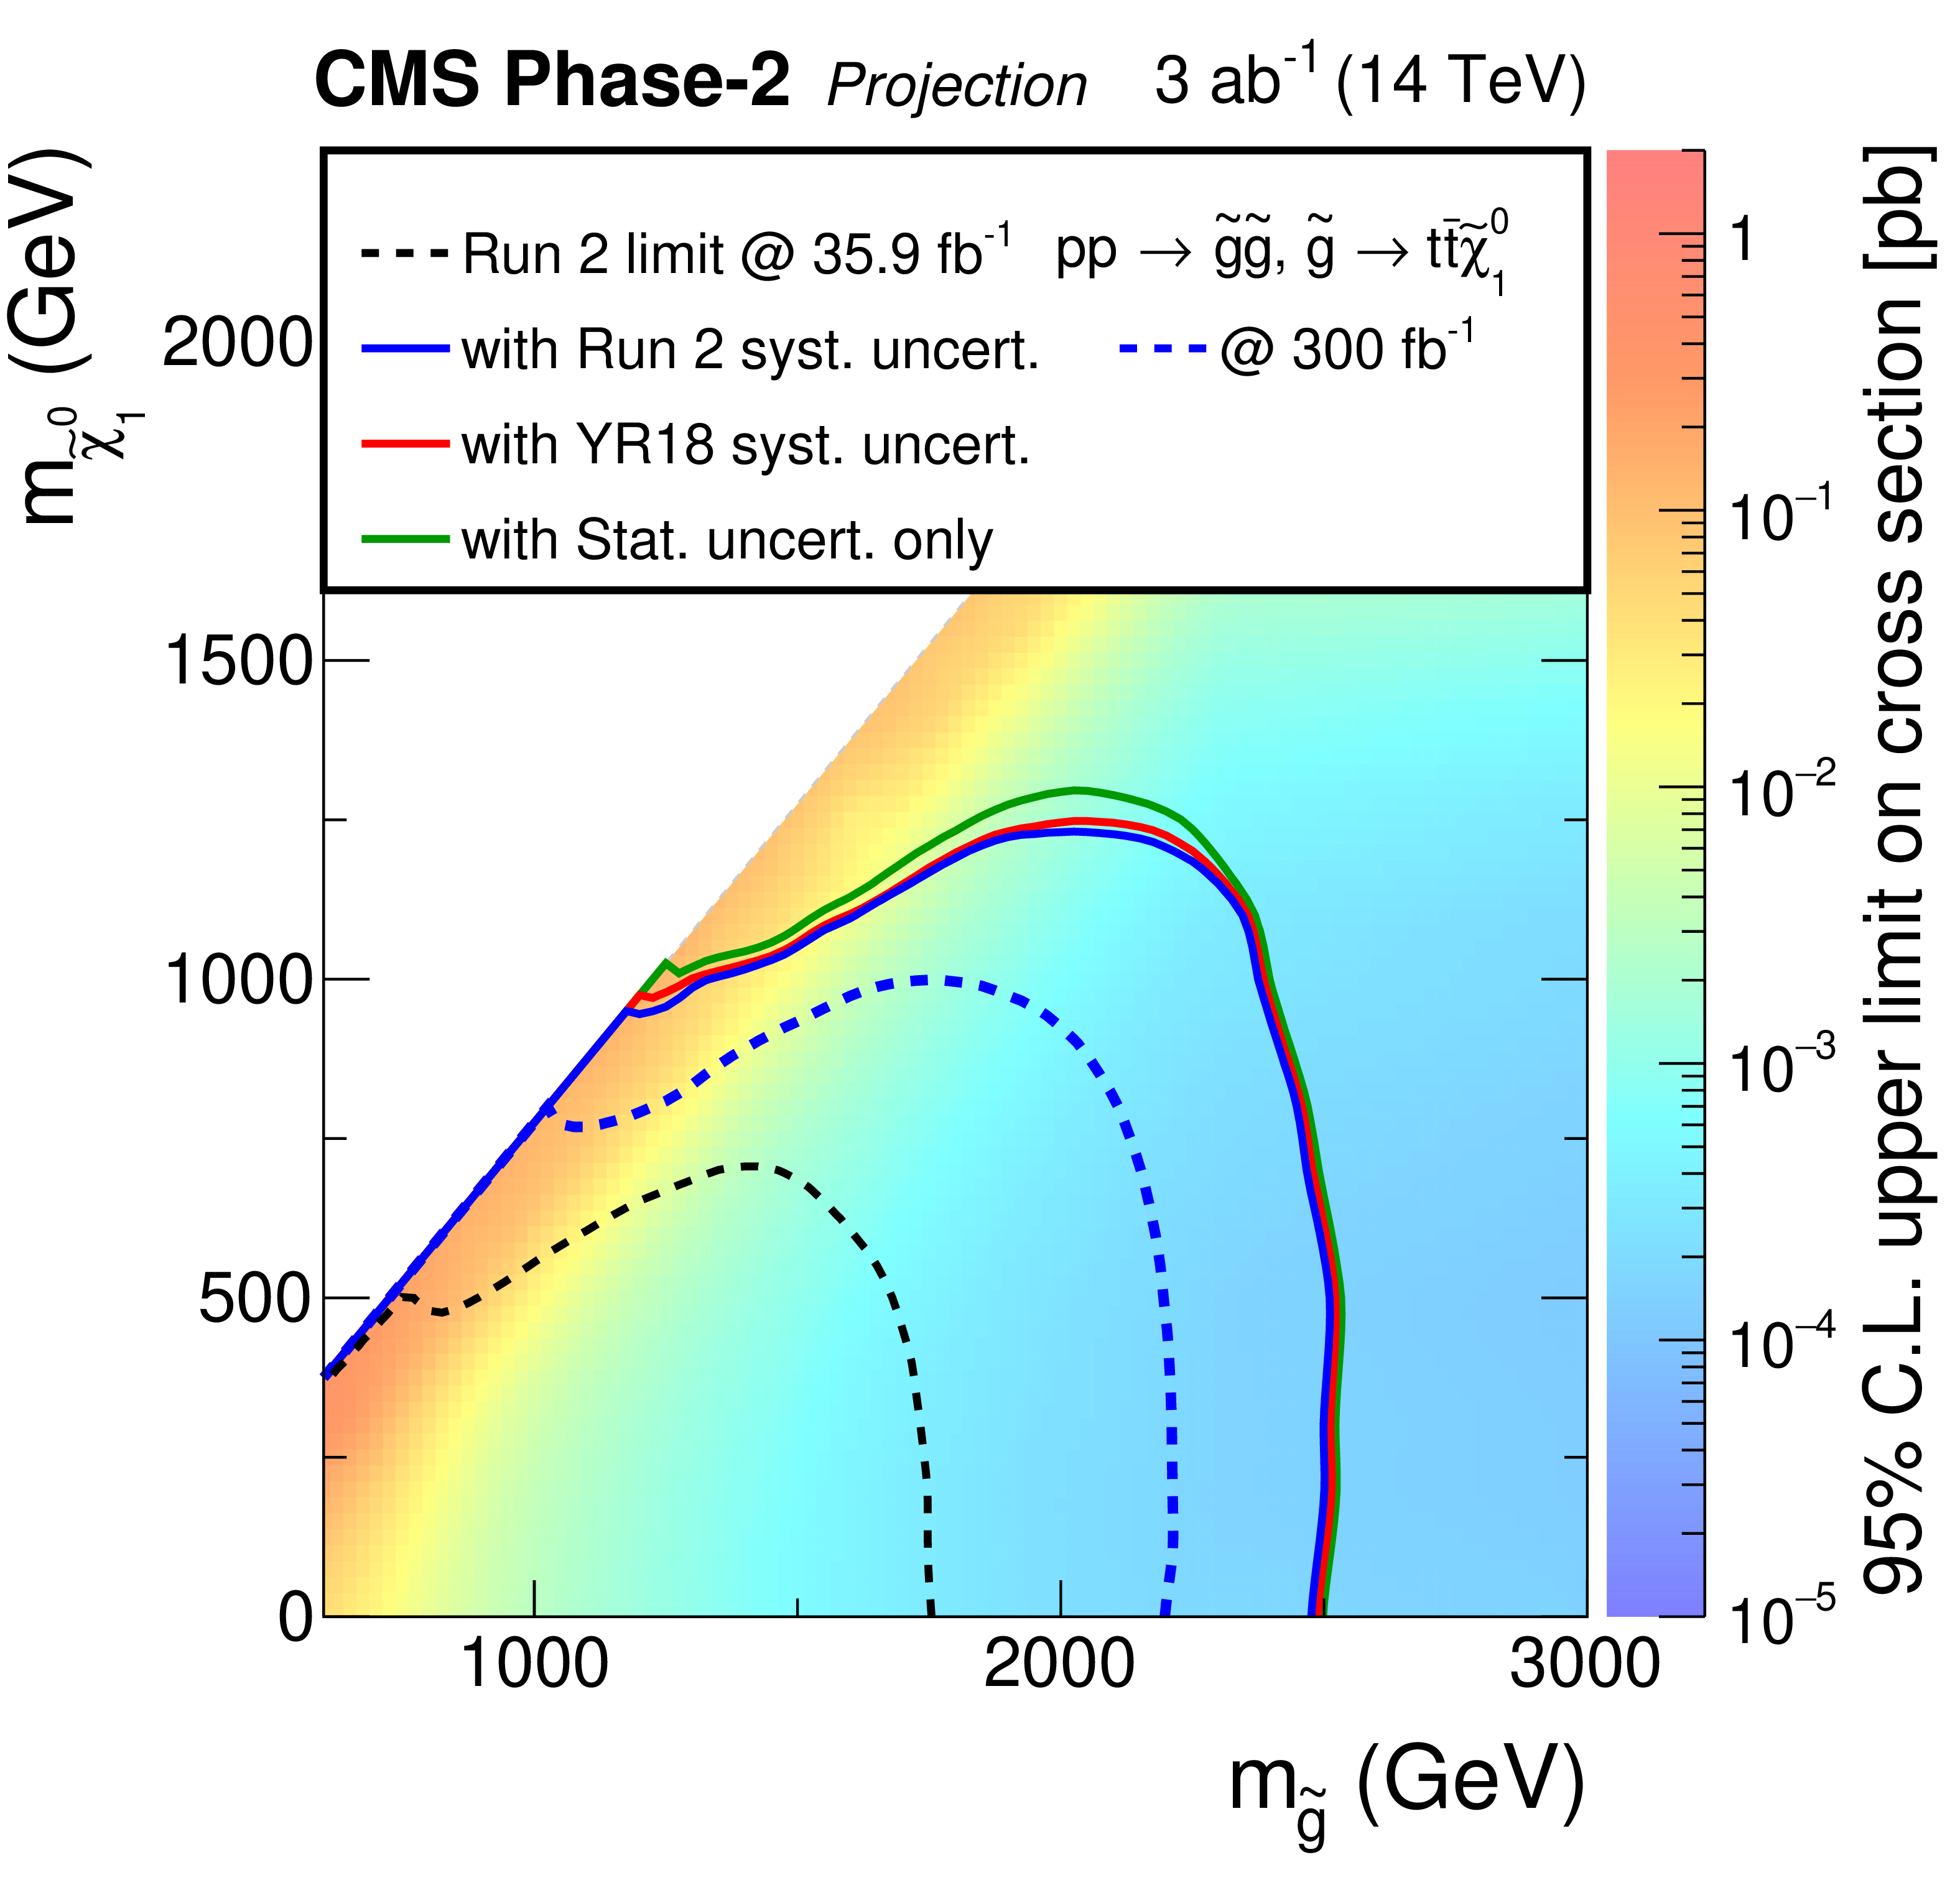
Projected expected upper limits on the signal cross sections for the HL-LHC using the asymptotic CLs method versus gluino/top squark and neutralino masses for the T5ttcc (top left), T1tttt (top right), and T2tt (bottom) models for the combined W 4-5 jet, W 6 jet, and Top categories for the YR18 scenario. The contours show the expected lower limits on the gluino/stop squark and neutralino masses based on the Run 2 systematic uncertainties, YR18 systematic uncertainties, and statistical-only scenarios, along with the 2016 analysis limit and the 300 fb$^{-1}$ limit for comparison. The lower left white diagonal band in the T2tt plot corresponds to the region $|m_{\tilde{t}} - m_t - m_{\tilde{\chi}^0_1}| < $ 25 GeV, where the mass difference between the $\tilde{t}$ and the $\tilde{\chi}^0_1$ is very close to the top quark mass. In this region, the signal acceptance depends strongly on the $\tilde{\chi}^0_1$ mass and is therefore difficult to model. |
png pdf |
Figure 6-a:
Projected expected upper limits on the signal cross sections for the HL-LHC using the asymptotic CLs method versus gluino/top squark and neutralino masses for the T5ttcc (top left), T1tttt (top right), and T2tt (bottom) models for the combined W 4-5 jet, W 6 jet, and Top categories for the YR18 scenario. The contours show the expected lower limits on the gluino/stop squark and neutralino masses based on the Run 2 systematic uncertainties, YR18 systematic uncertainties, and statistical-only scenarios, along with the 2016 analysis limit and the 300 fb$^{-1}$ limit for comparison. The lower left white diagonal band in the T2tt plot corresponds to the region $|m_{\tilde{t}} - m_t - m_{\tilde{\chi}^0_1}| < $ 25 GeV, where the mass difference between the $\tilde{t}$ and the $\tilde{\chi}^0_1$ is very close to the top quark mass. In this region, the signal acceptance depends strongly on the $\tilde{\chi}^0_1$ mass and is therefore difficult to model. |
png pdf |
Figure 6-b:
Projected expected upper limits on the signal cross sections for the HL-LHC using the asymptotic CLs method versus gluino/top squark and neutralino masses for the T5ttcc (top left), T1tttt (top right), and T2tt (bottom) models for the combined W 4-5 jet, W 6 jet, and Top categories for the YR18 scenario. The contours show the expected lower limits on the gluino/stop squark and neutralino masses based on the Run 2 systematic uncertainties, YR18 systematic uncertainties, and statistical-only scenarios, along with the 2016 analysis limit and the 300 fb$^{-1}$ limit for comparison. The lower left white diagonal band in the T2tt plot corresponds to the region $|m_{\tilde{t}} - m_t - m_{\tilde{\chi}^0_1}| < $ 25 GeV, where the mass difference between the $\tilde{t}$ and the $\tilde{\chi}^0_1$ is very close to the top quark mass. In this region, the signal acceptance depends strongly on the $\tilde{\chi}^0_1$ mass and is therefore difficult to model. |

png pdf |
Figure 6-c:
Projected expected upper limits on the signal cross sections for the HL-LHC using the asymptotic CLs method versus gluino/top squark and neutralino masses for the T5ttcc (top left), T1tttt (top right), and T2tt (bottom) models for the combined W 4-5 jet, W 6 jet, and Top categories for the YR18 scenario. The contours show the expected lower limits on the gluino/stop squark and neutralino masses based on the Run 2 systematic uncertainties, YR18 systematic uncertainties, and statistical-only scenarios, along with the 2016 analysis limit and the 300 fb$^{-1}$ limit for comparison. The lower left white diagonal band in the T2tt plot corresponds to the region $|m_{\tilde{t}} - m_t - m_{\tilde{\chi}^0_1}| < $ 25 GeV, where the mass difference between the $\tilde{t}$ and the $\tilde{\chi}^0_1$ is very close to the top quark mass. In this region, the signal acceptance depends strongly on the $\tilde{\chi}^0_1$ mass and is therefore difficult to model. |

png pdf |
Figure 7:
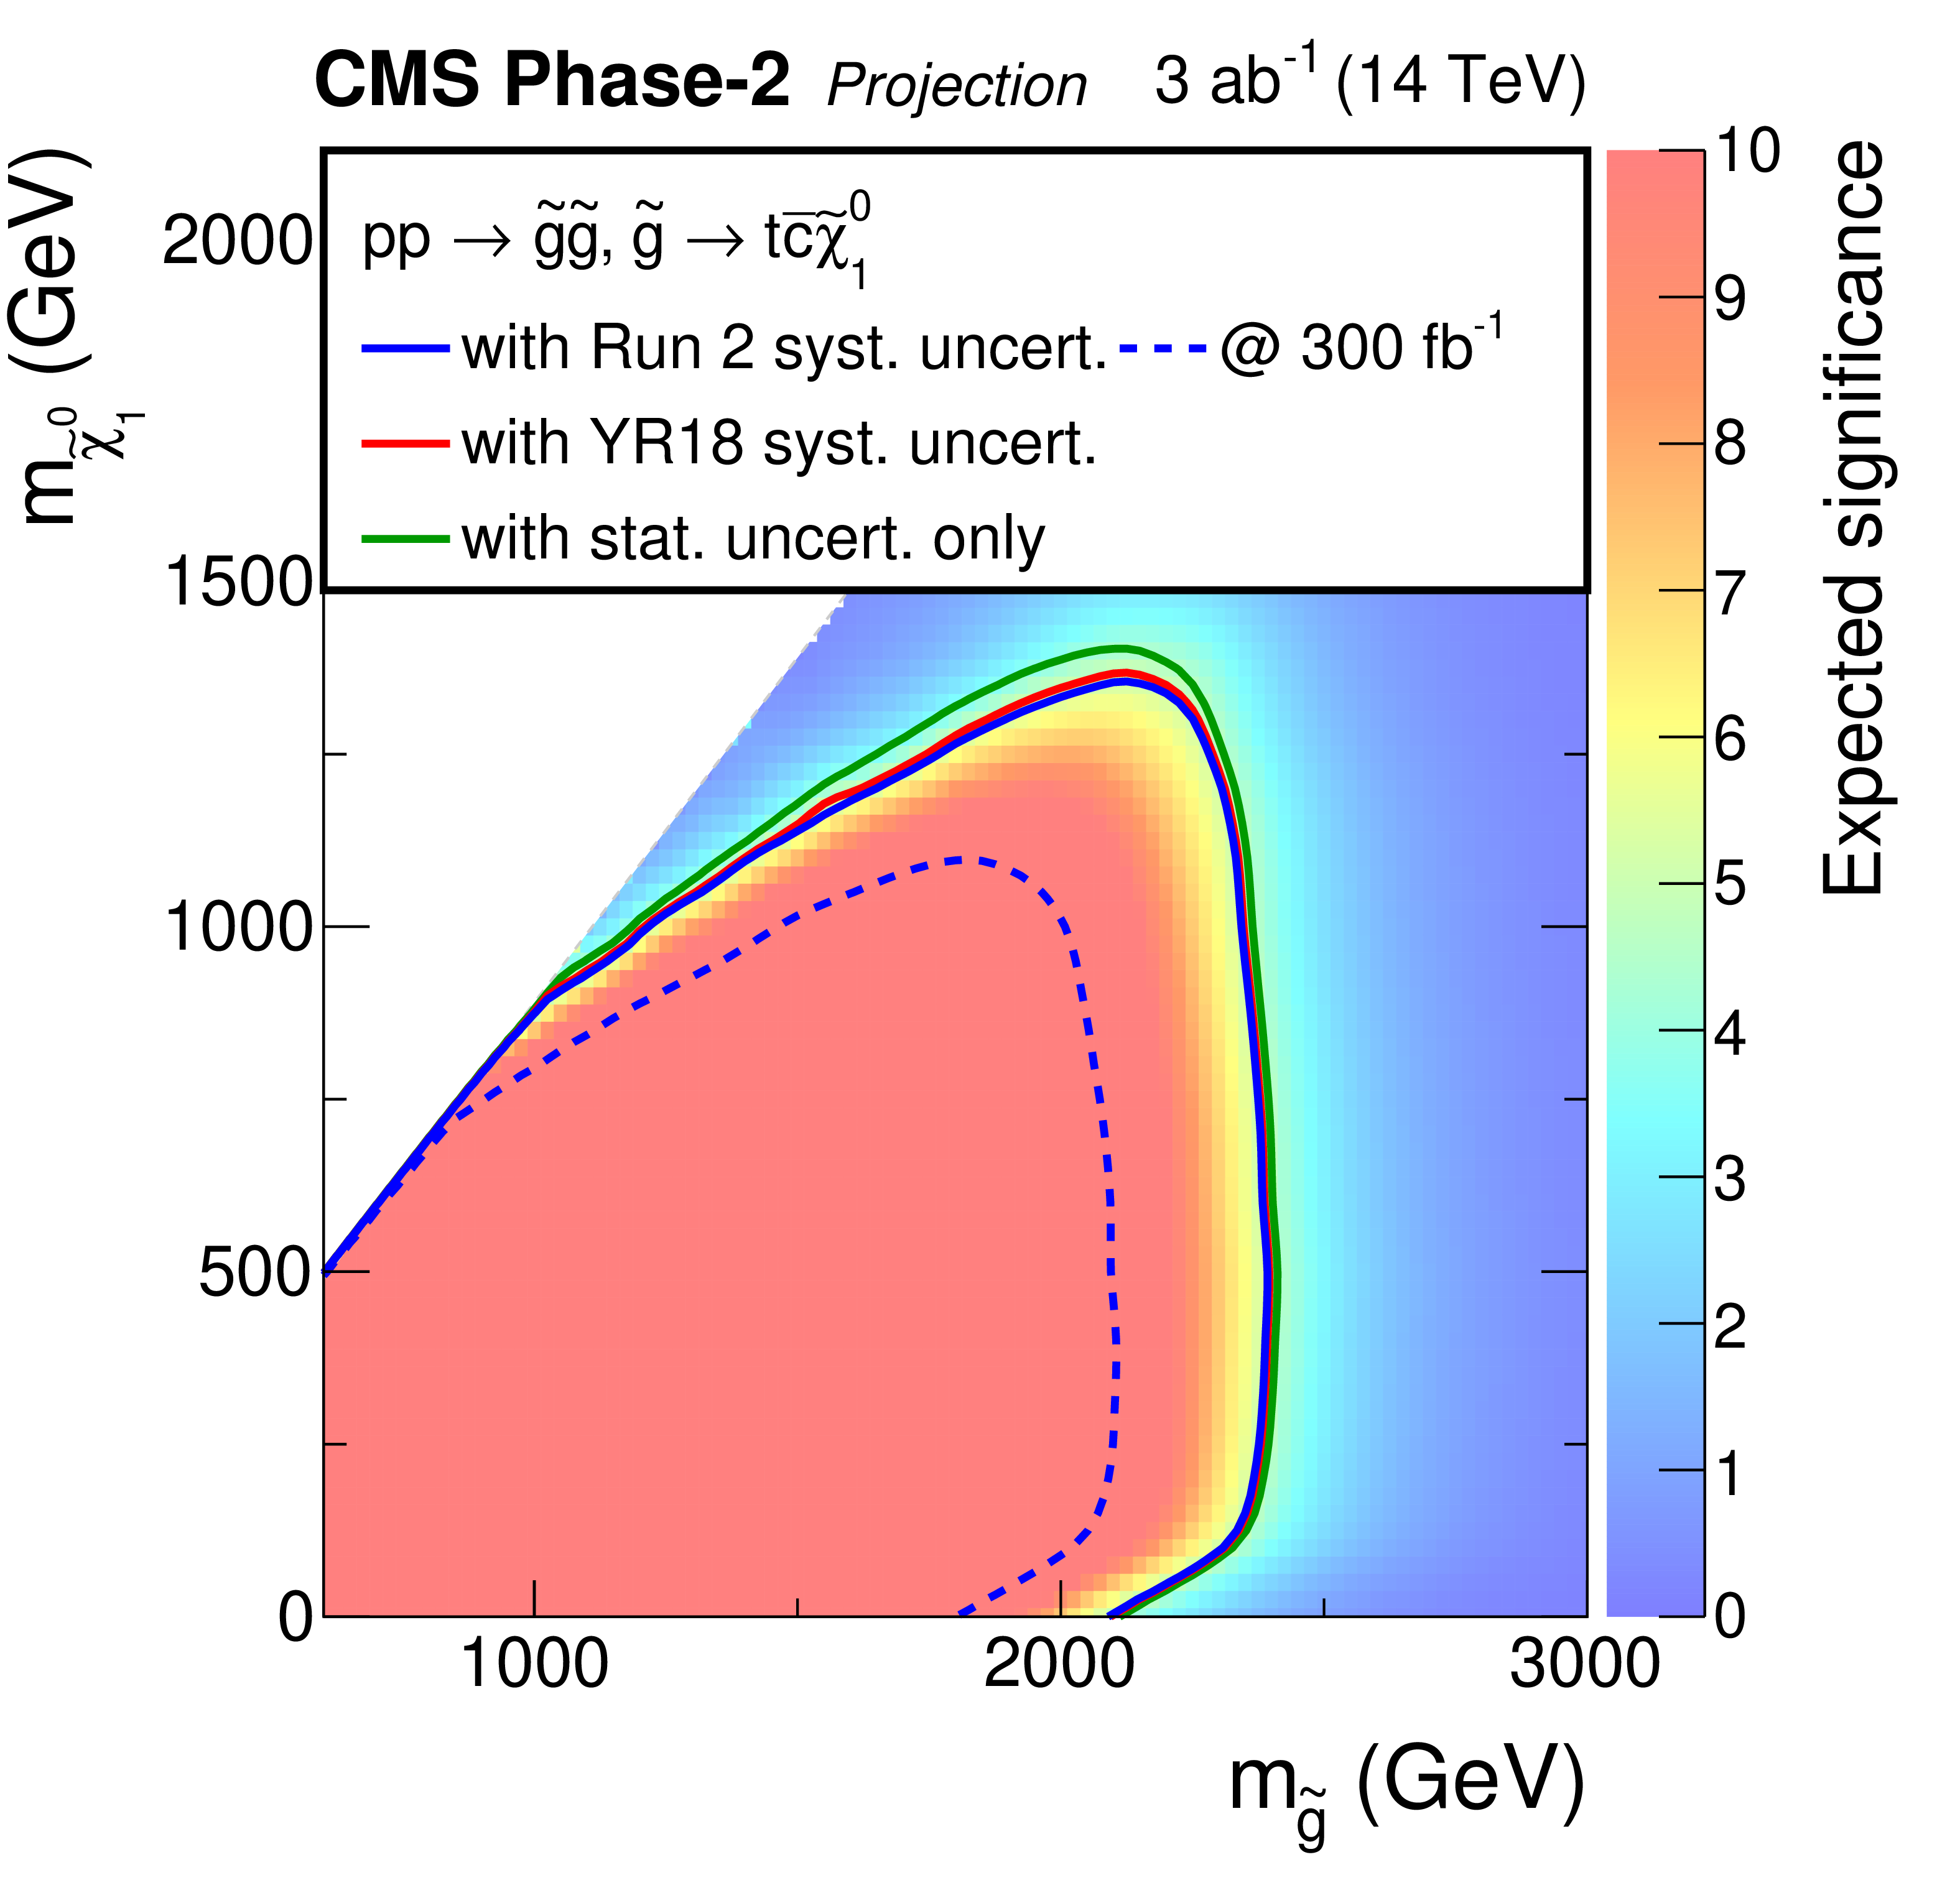
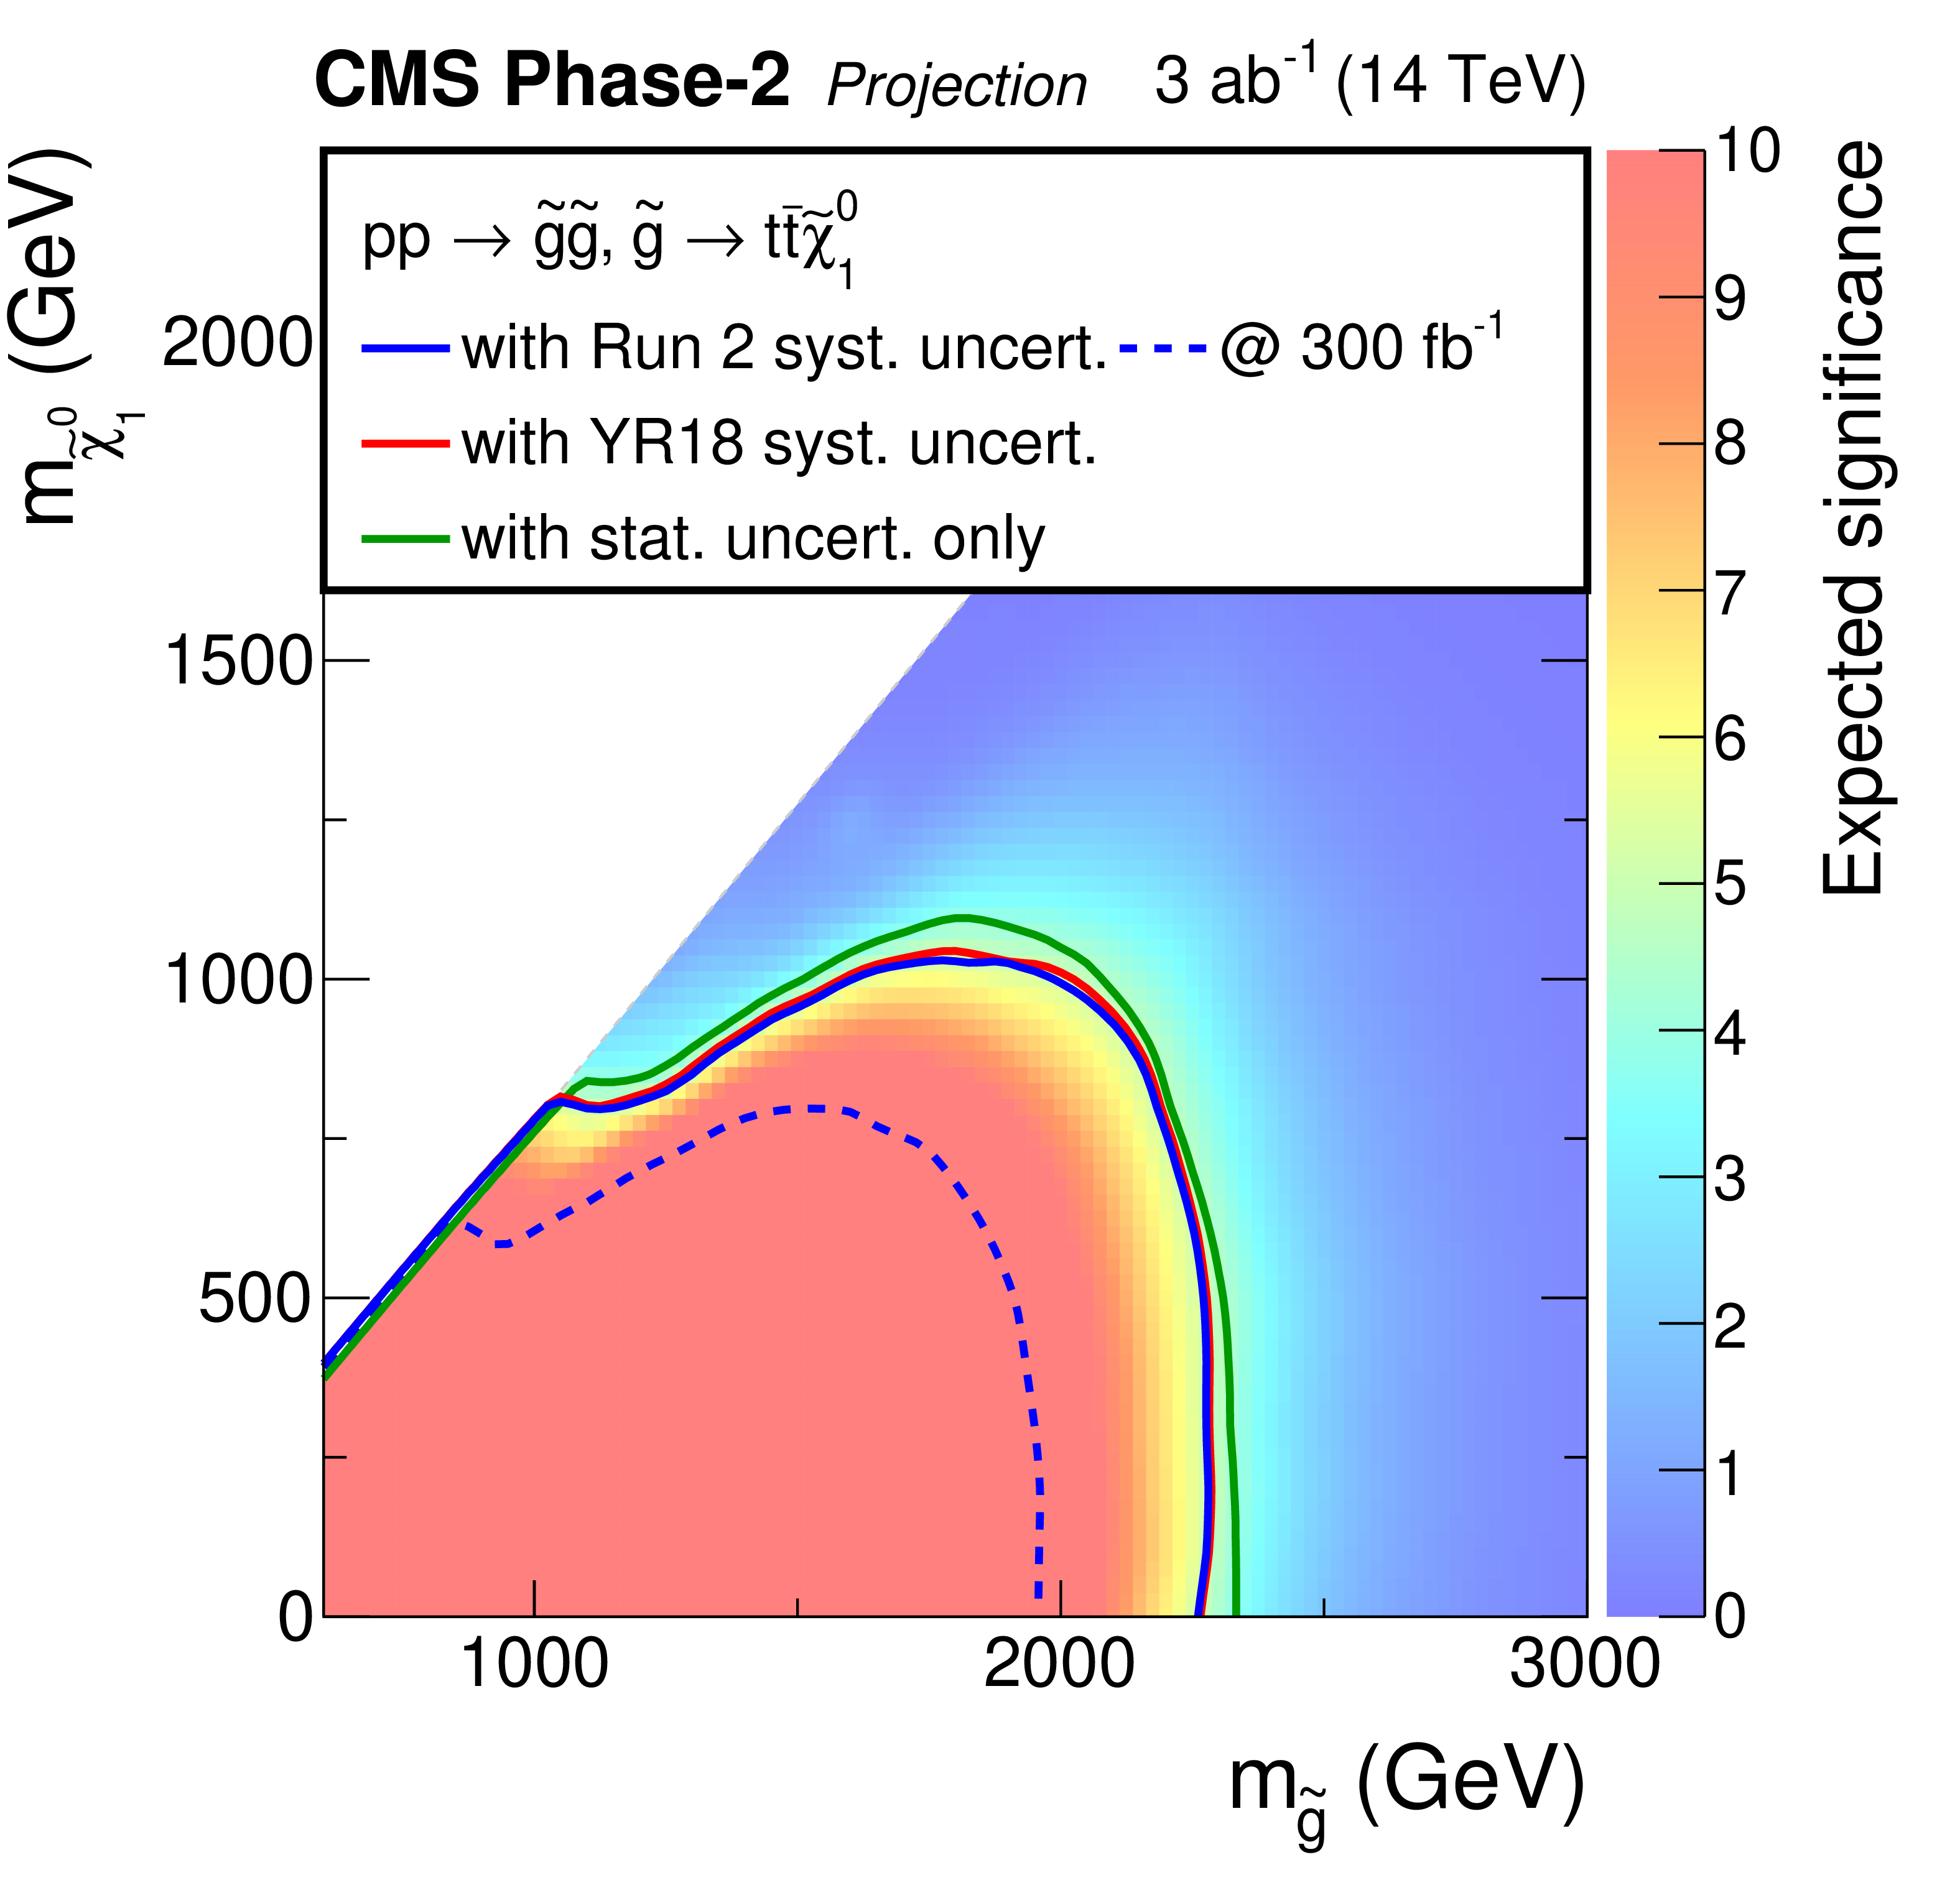
Projected expected significance for the HL-LHC versus gluino/stop and neutralino masses for the T5ttcc (top left), T2tttt (top right), and T2tt (bottom) models for the combined W 4-5 jet, W 6 jet, and Top categories for the YR18 scenario. The contours show the expected discovery bounds on the gluino/top squark and neutralino masses based on the Run 2 systematic uncertainties, YR18 systematic uncertainties, and statistical-only scenarios. The lower left white diagonal band in the T2tt plot corresponds to the region $|m_{\tilde{t}} - m_t - m_{\tilde{\chi}^0_1}| < $ 25 GeV, where the mass difference between the $\tilde{t}$ and the $\tilde{\chi}^0_1$ is very close to the top quark mass. In this region, the signal acceptance depends strongly on the $\tilde{\chi}^0_1$ mass and is therefore difficult to model. |
png pdf |
Figure 7-a:
Projected expected significance for the HL-LHC versus gluino/stop and neutralino masses for the T5ttcc (top left), T2tttt (top right), and T2tt (bottom) models for the combined W 4-5 jet, W 6 jet, and Top categories for the YR18 scenario. The contours show the expected discovery bounds on the gluino/top squark and neutralino masses based on the Run 2 systematic uncertainties, YR18 systematic uncertainties, and statistical-only scenarios. The lower left white diagonal band in the T2tt plot corresponds to the region $|m_{\tilde{t}} - m_t - m_{\tilde{\chi}^0_1}| < $ 25 GeV, where the mass difference between the $\tilde{t}$ and the $\tilde{\chi}^0_1$ is very close to the top quark mass. In this region, the signal acceptance depends strongly on the $\tilde{\chi}^0_1$ mass and is therefore difficult to model. |
png pdf |
Figure 7-b:
Projected expected significance for the HL-LHC versus gluino/stop and neutralino masses for the T5ttcc (top left), T2tttt (top right), and T2tt (bottom) models for the combined W 4-5 jet, W 6 jet, and Top categories for the YR18 scenario. The contours show the expected discovery bounds on the gluino/top squark and neutralino masses based on the Run 2 systematic uncertainties, YR18 systematic uncertainties, and statistical-only scenarios. The lower left white diagonal band in the T2tt plot corresponds to the region $|m_{\tilde{t}} - m_t - m_{\tilde{\chi}^0_1}| < $ 25 GeV, where the mass difference between the $\tilde{t}$ and the $\tilde{\chi}^0_1$ is very close to the top quark mass. In this region, the signal acceptance depends strongly on the $\tilde{\chi}^0_1$ mass and is therefore difficult to model. |

png pdf |
Figure 7-c:
Projected expected significance for the HL-LHC versus gluino/stop and neutralino masses for the T5ttcc (top left), T2tttt (top right), and T2tt (bottom) models for the combined W 4-5 jet, W 6 jet, and Top categories for the YR18 scenario. The contours show the expected discovery bounds on the gluino/top squark and neutralino masses based on the Run 2 systematic uncertainties, YR18 systematic uncertainties, and statistical-only scenarios. The lower left white diagonal band in the T2tt plot corresponds to the region $|m_{\tilde{t}} - m_t - m_{\tilde{\chi}^0_1}| < $ 25 GeV, where the mass difference between the $\tilde{t}$ and the $\tilde{\chi}^0_1$ is very close to the top quark mass. In this region, the signal acceptance depends strongly on the $\tilde{\chi}^0_1$ mass and is therefore difficult to model. |
| Tables | |

png pdf |
Table 1:
Summary of the scaling of uncertainties in the YR18 scenario for the background and signal processes for the HL-LHC projections. The "YR18 recommendation'' treatment note specifies that the scaling of the uncertainty was done based on CMS recommendations for the Yellow Report, reflecting the potential upgrade performance of the CMS detector, summarised in Ref. [14]. |
| Summary |
| We have presented the HL-LHC projection of the Run 2 search for new physics in hadronic final states with boosted W bosons or top quarks using the razor kinematic variables. Final states with boosted objects constitute an important search scenario, as they become more accessible at the increased center-of-mass energy at the HL-LHC. The projection study uses observed data yields and simulated signal and background events from the original analysis, which are scaled to obtain the HL-LHC sensitivity for center-of-mass energy of 14 TeV and integrated luminosity of 3 ab$^{-1}$. The background estimation and limit setting procedures are fully adopted from the Run 2 analysis done using 2016 data. Different scenarios for systematic uncertainties, based on a common convention with other CMS analyses and ATLAS are considered. The projection results are interpreted in terms of gluino pair production where the gluinos decay into either a top quark, an anti-top quark, and a neutralino; or to a top quark and a top squark, and direct top squark pair production where top squarks decay into top quarks and neutralinos. The HL-LHC would exclude gluinos and top squarks up to 2.6 TeV and 1.5 TeV respectively, while making discovery possible for gluinos and top squarks up to masses of 2.35 TeV and 1.4 TeV, respectively, thus providing a very strong test of naturalness scenarios for supersymmetry. |
| References | ||||
| 1 | CMS Collaboration | Inclusive search for supersymmetry in pp collisions at $ \sqrt{s}= $ 13 TeV using razor variables and boosted object identification in zero and one lepton final states | Submitted to JHEP | CMS-SUS-16-017 1812.06302 |
| 2 | R. Barbieri and D. Pappadopulo | S-particles at their naturalness limits | JHEP 10 (2009) 061 | 0906.4546 |
| 3 | M. Papucci, J. T. Ruderman, and A. Weiler | Natural SUSY endures | JHEP 09 (2012) 035 | 1110.6926 |
| 4 | J. Alwall, P. Schuster, and N. Toro | Simplified models for a first characterization of new physics at the LHC | PRD 79 (2009) 075020 | 0810.3921 |
| 5 | LHC New Physics Working Group Collaboration | Simplified models for LHC new physics searches | JPG 39 (2012) 105005 | 1105.2838 |
| 6 | J. Thaler and K. Van Tilburg | Identifying boosted objects with N-subjettiness | JHEP 03 (2011) 015 | 1011.2268 |
| 7 | C. Rogan | Kinematical variables towards new dynamics at the LHC | 1006.2727 | |
| 8 | CMS Collaboration | The CMS experiment at the CERN LHC | JINST 3 (2008) S08004 | CMS-00-001 |
| 9 | CMS Collaboration | Technical Proposal for the Phase-II Upgrade of the Compact Muon Solenoid | CMS-PAS-TDR-15-002 | CMS-PAS-TDR-15-002 |
| 10 | CMS Collaboration | The Phase-2 Upgrade of the CMS Tracker | CMS-PAS-TDR-17-001 | CMS-PAS-TDR-17-001 |
| 11 | CMS Collaboration | The Phase-2 Upgrade of the CMS Barrel Calorimeter | CDS | |
| 12 | CMS Collaboration | The Phase-2 Upgrade of the CMS Endcap Calorimeter | CDS | |
| 13 | CMS Collaboration | The Phase-2 Upgrade of the CMS Muon Detectors | CMS-PAS-TDR-17-003 | CMS-PAS-TDR-17-003 |
| 14 | CMS Collaboration | Expected performance of the physics objects with the upgraded CMS detector at the HL-LHC | CDS | |
| 15 | M. Cacciari, G. P. Salam, and G. Soyez | FastJet user manual | EPJC 72 (2012) 1896 | 1111.6097 |
| 16 | M. Cacciari, G. P. Salam, and G. Soyez | The anti-$ {k_{\mathrm{T}}} $ jet clustering algorithm | JHEP 04 (2008) 063 | 0802.1189 |
| 17 | CMS Collaboration | Identification of heavy-flavour jets with the CMS detector in pp collisions at 13 TeV | JINST 13 (2018) P05011 | CMS-BTV-16-002 1712.07158 |
| 18 | W. Beenakker, R. Hopker, M. Spira, and P. M. Zerwas | Squark and gluino production at hadron colliders | NPB 492 (1997) 51 | hep-ph/9610490 |
| 19 | A. Kulesza and L. Motyka | Threshold resummation for squark-antisquark and gluino-pair production at the LHC | PRL 102 (2009) 111802 | 0807.2405 |
| 20 | A. Kulesza and L. Motyka | Soft gluon resummation for the production of gluino-gluino and squark-antisquark pairs at the LHC | PRD 80 (2009) 095004 | 0905.4749 |
| 21 | W. Beenakker et al. | Soft-gluon resummation for squark and gluino hadroproduction | JHEP 12 (2009) 041 | 0909.4418 |
| 22 | W. Beenakker et al. | Squark and gluino hadroproduction | Int. J. Mod. Phys. A 26 (2011) 2637 | 1105.1110 |
| 23 | A. L. Read | Presentation of search results: The CLs technique | JPG 28 (2002) 2693 | |
| 24 | T. Junk | Confidence level computation for combining searches with small statistics | NIMA 434 (1999) 435 | hep-ex/9902006 |
| 25 | ATLAS and CMS Collaborations | Procedure for the LHC Higgs boson search combination in summer 2011 | CMS-NOTE-2011-005 | |
|
|
Compact Muon Solenoid LHC, CERN |
|

|

|

|

|

|