

Compact Muon Solenoid
LHC, CERN
| CMS-PAS-HIG-16-030 | ||
| Search for ${\rm H^{+} \rightarrow c\bar{b}}$ in lepton+jets channel using top quark pair events | ||
| CMS Collaboration | ||
| August 2016 | ||
| Abstract: Results on the search for a light charged Higgs boson ${\rm H^{+}}$ decaying to ${\rm c\bar{b}}$ in top quark pair events using the CMS detector at the LHC are presented. The total dataset corresponds to 19.7 fb$^{-1}$ of proton-proton collisions at $\sqrt{s} =$ 8 TeV. In ${\rm t\bar{t}}$ decays, if one top quark decays to ${\rm H^{+} b}$, instead of ${\rm W b}$, and the ${\rm H^{+}}$ subsequently decays to ${\rm c \bar{b}}$, while other top quark decays leptonically (${\rm \bar{t} \rightarrow W^{-}\bar{b}} \rightarrow \ell \bar{\nu} {\rm \bar{b}})$), the final state then consists of four jets (three ${\rm b}$ quark jets), one lepton (electron or muon), and missing energy: ${\rm t\bar{t} \rightarrow (H^{+}b)(W^{-}\bar{b})}$ $ \rightarrow {\rm (c\bar{b} b)} (\ell \bar{\nu} {\rm \bar{b}})$. The main observable used in the analysis is an invariant mass of two jets, one of which is identified as a b quark jet. The dijet pair is selected from at least four jets in an event by a dedicated kinematic fitter. No signal for the presence of a charged Higgs boson is observed and upper limits are set at 95% confidence level on the branching ratio for ${\rm t \rightarrow H^{+} b}$ from 1.1-0.4% for the charged Higgs boson mass in the range 90-150 GeV in the assumption of branching ratio of ${\rm B(H^{+} \rightarrow c\bar{b})= } $ 100% for the first time. | ||
|
Links:
CDS record (PDF) ;
inSPIRE record ;
CADI line (restricted) ;
These preliminary results are superseded in this paper, JHEP 11 (2018) 115. The superseded preliminary plots can be found here. |
||
| Figures | |
png pdf |
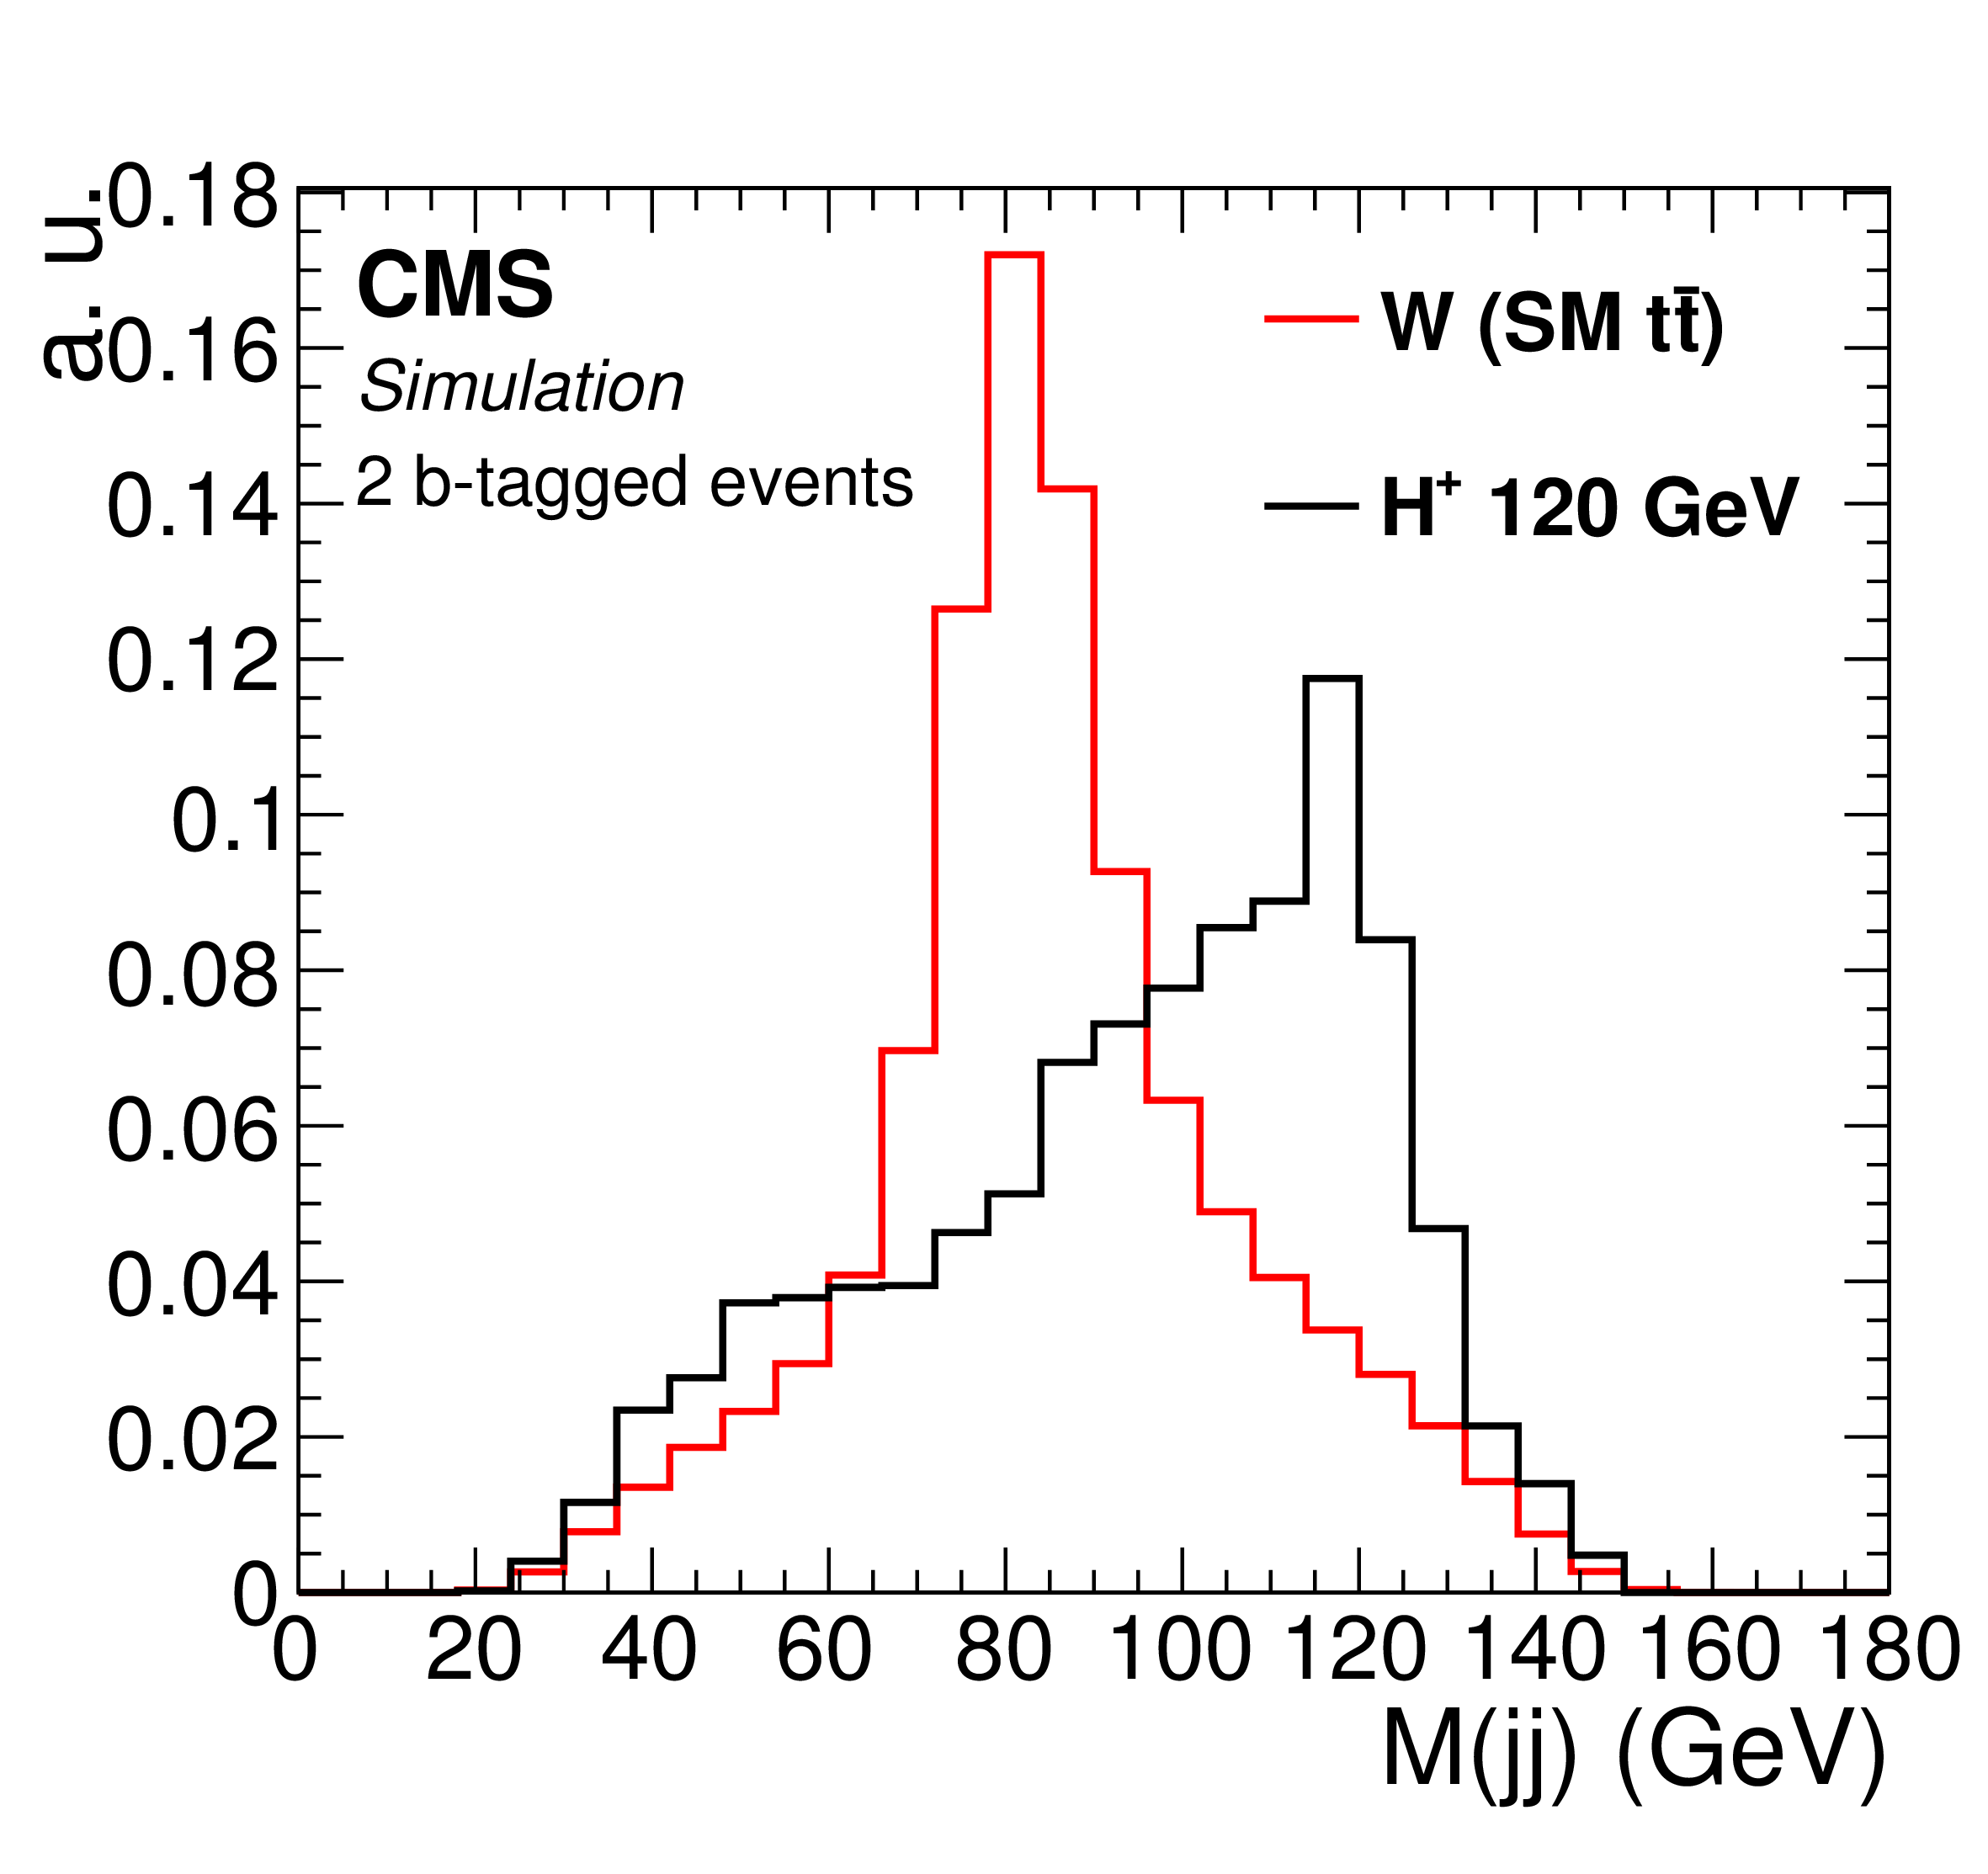
Figure 1-a:
Expected dijet mass distribution for W from SM $ {\mathrm {t}\overline {\mathrm {t}}} $ and from ${\rm H^{+}}$ signal $ {\mathrm {t}\overline {\mathrm {t}}} $ in the events with two b-tagged jets (a), and with more than two b-tagged events (b). |

png pdf |
Figure 1-b:
Expected dijet mass distribution for W from SM $ {\mathrm {t}\overline {\mathrm {t}}} $ and from ${\rm H^{+}}$ signal $ {\mathrm {t}\overline {\mathrm {t}}} $ in the events with two b-tagged jets (a), and with more than two b-tagged events (b). |
png pdf |
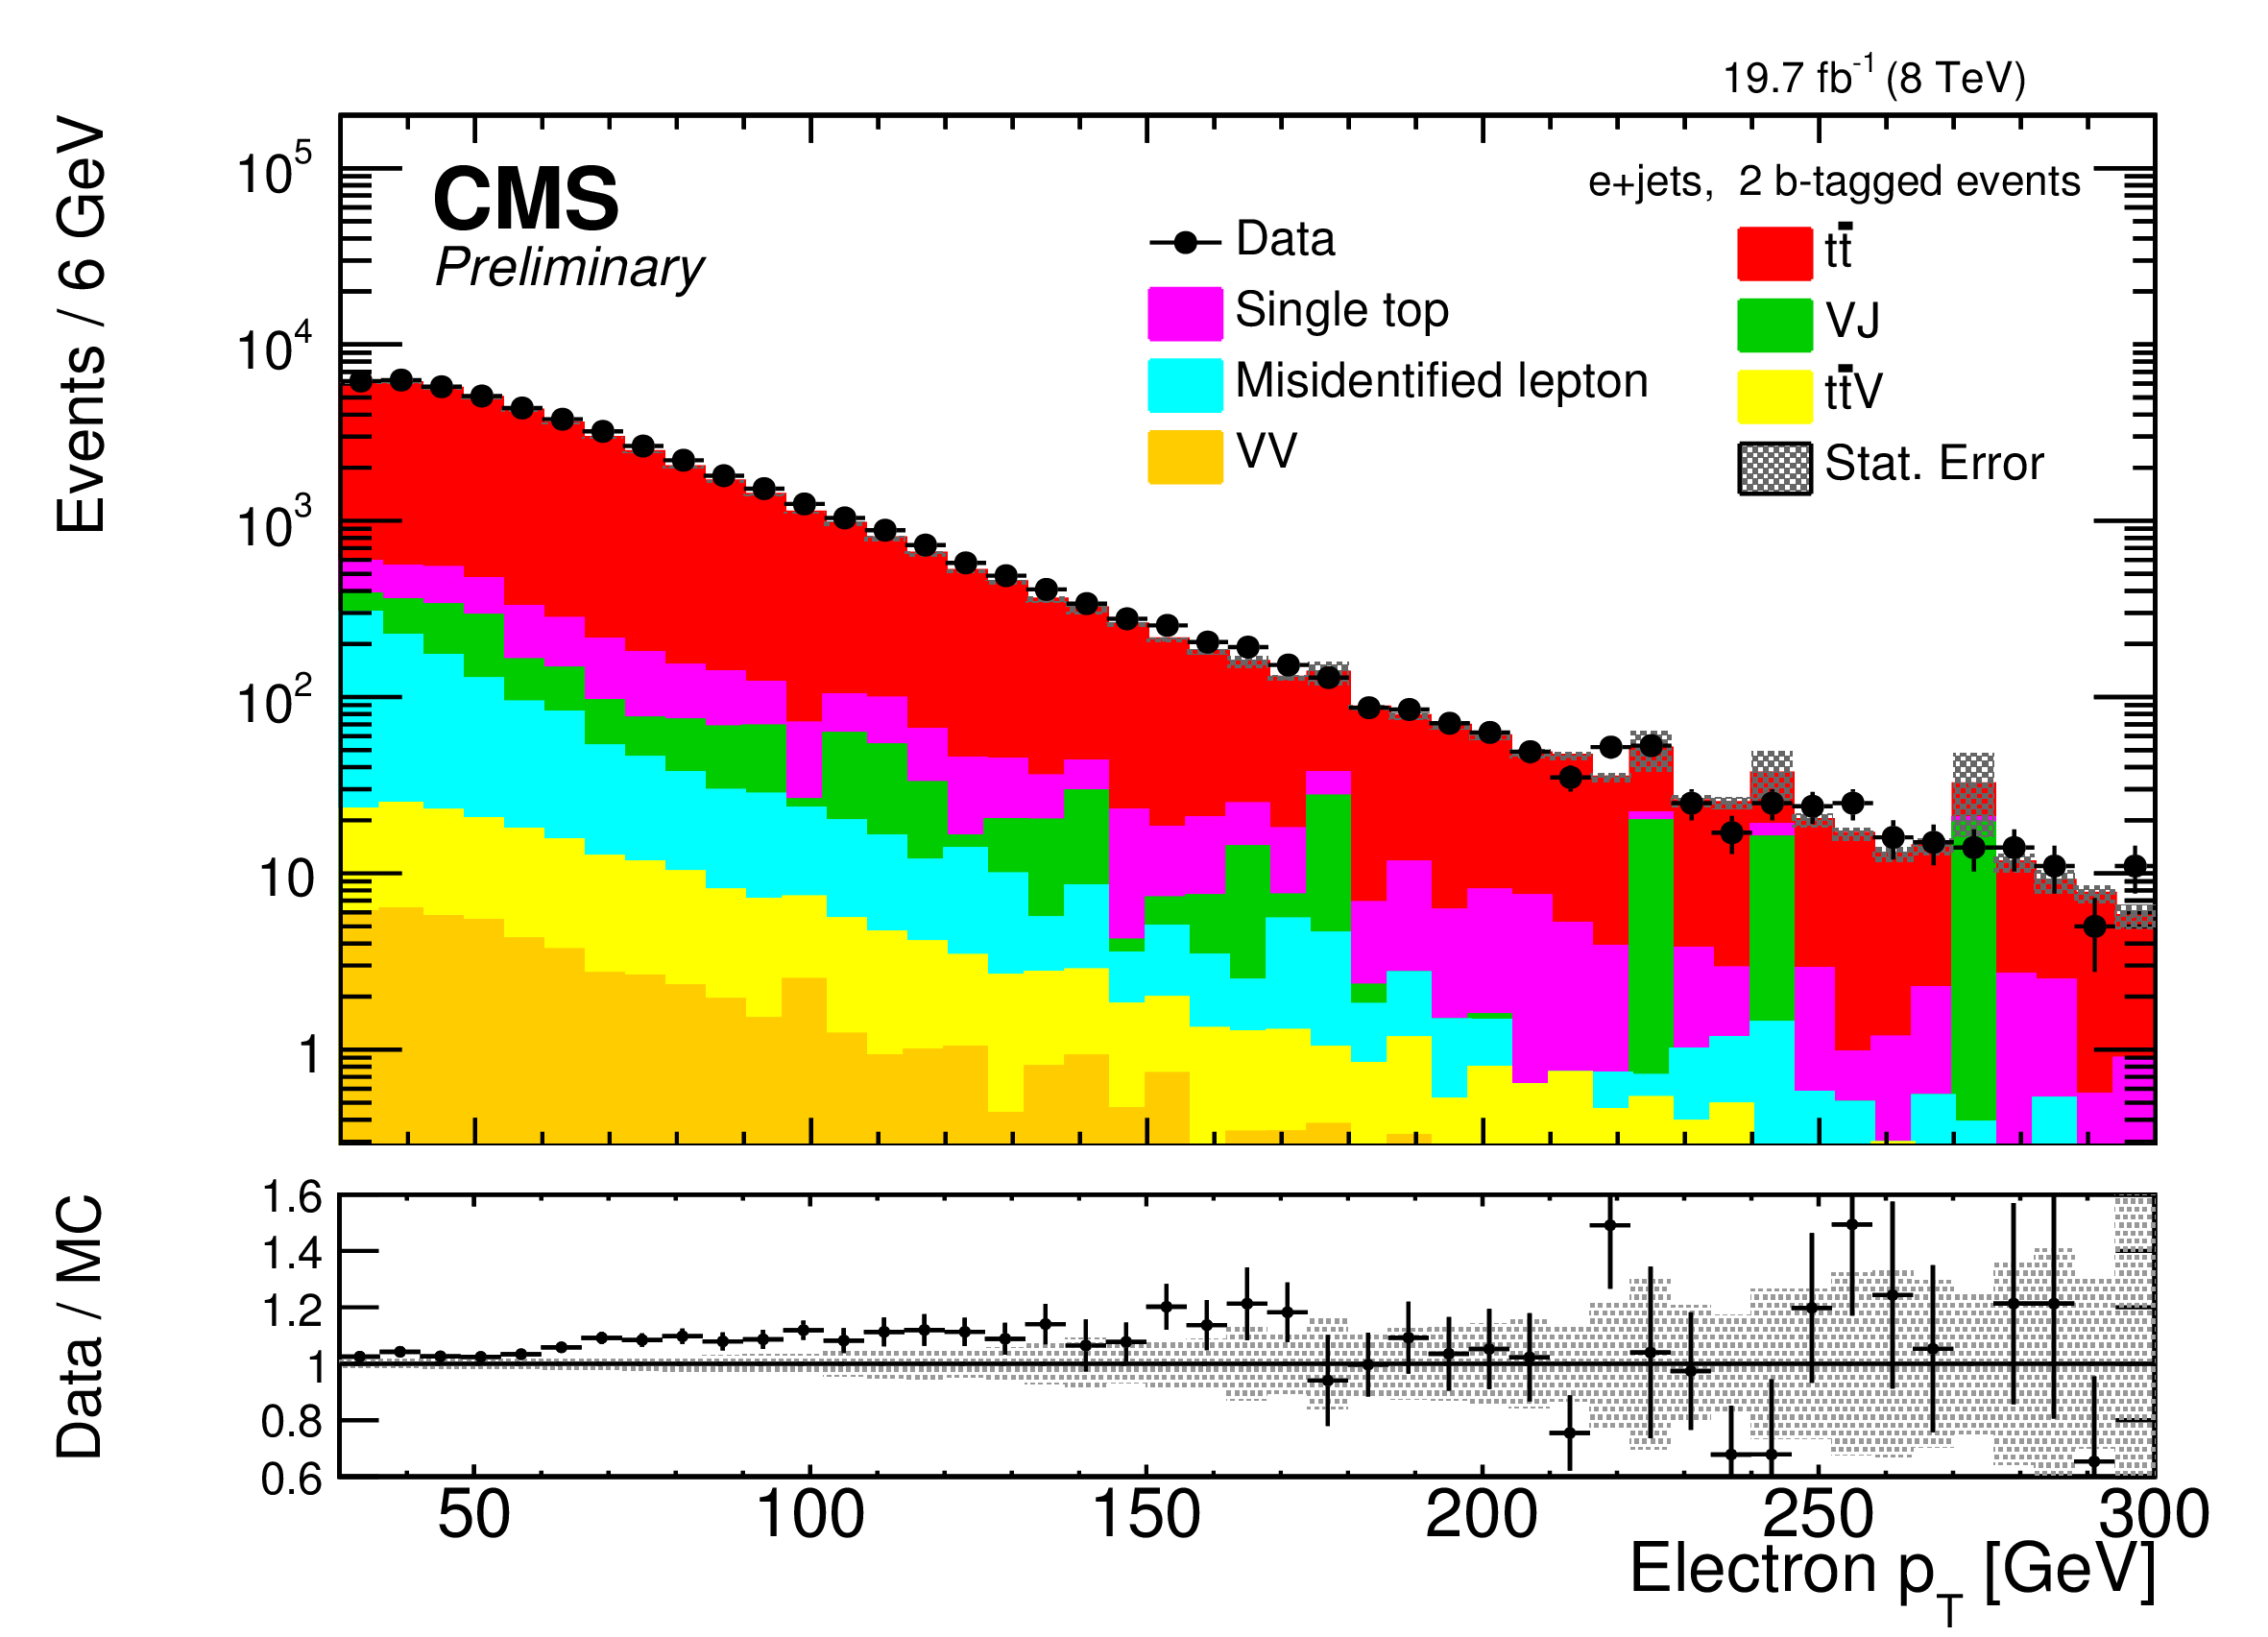
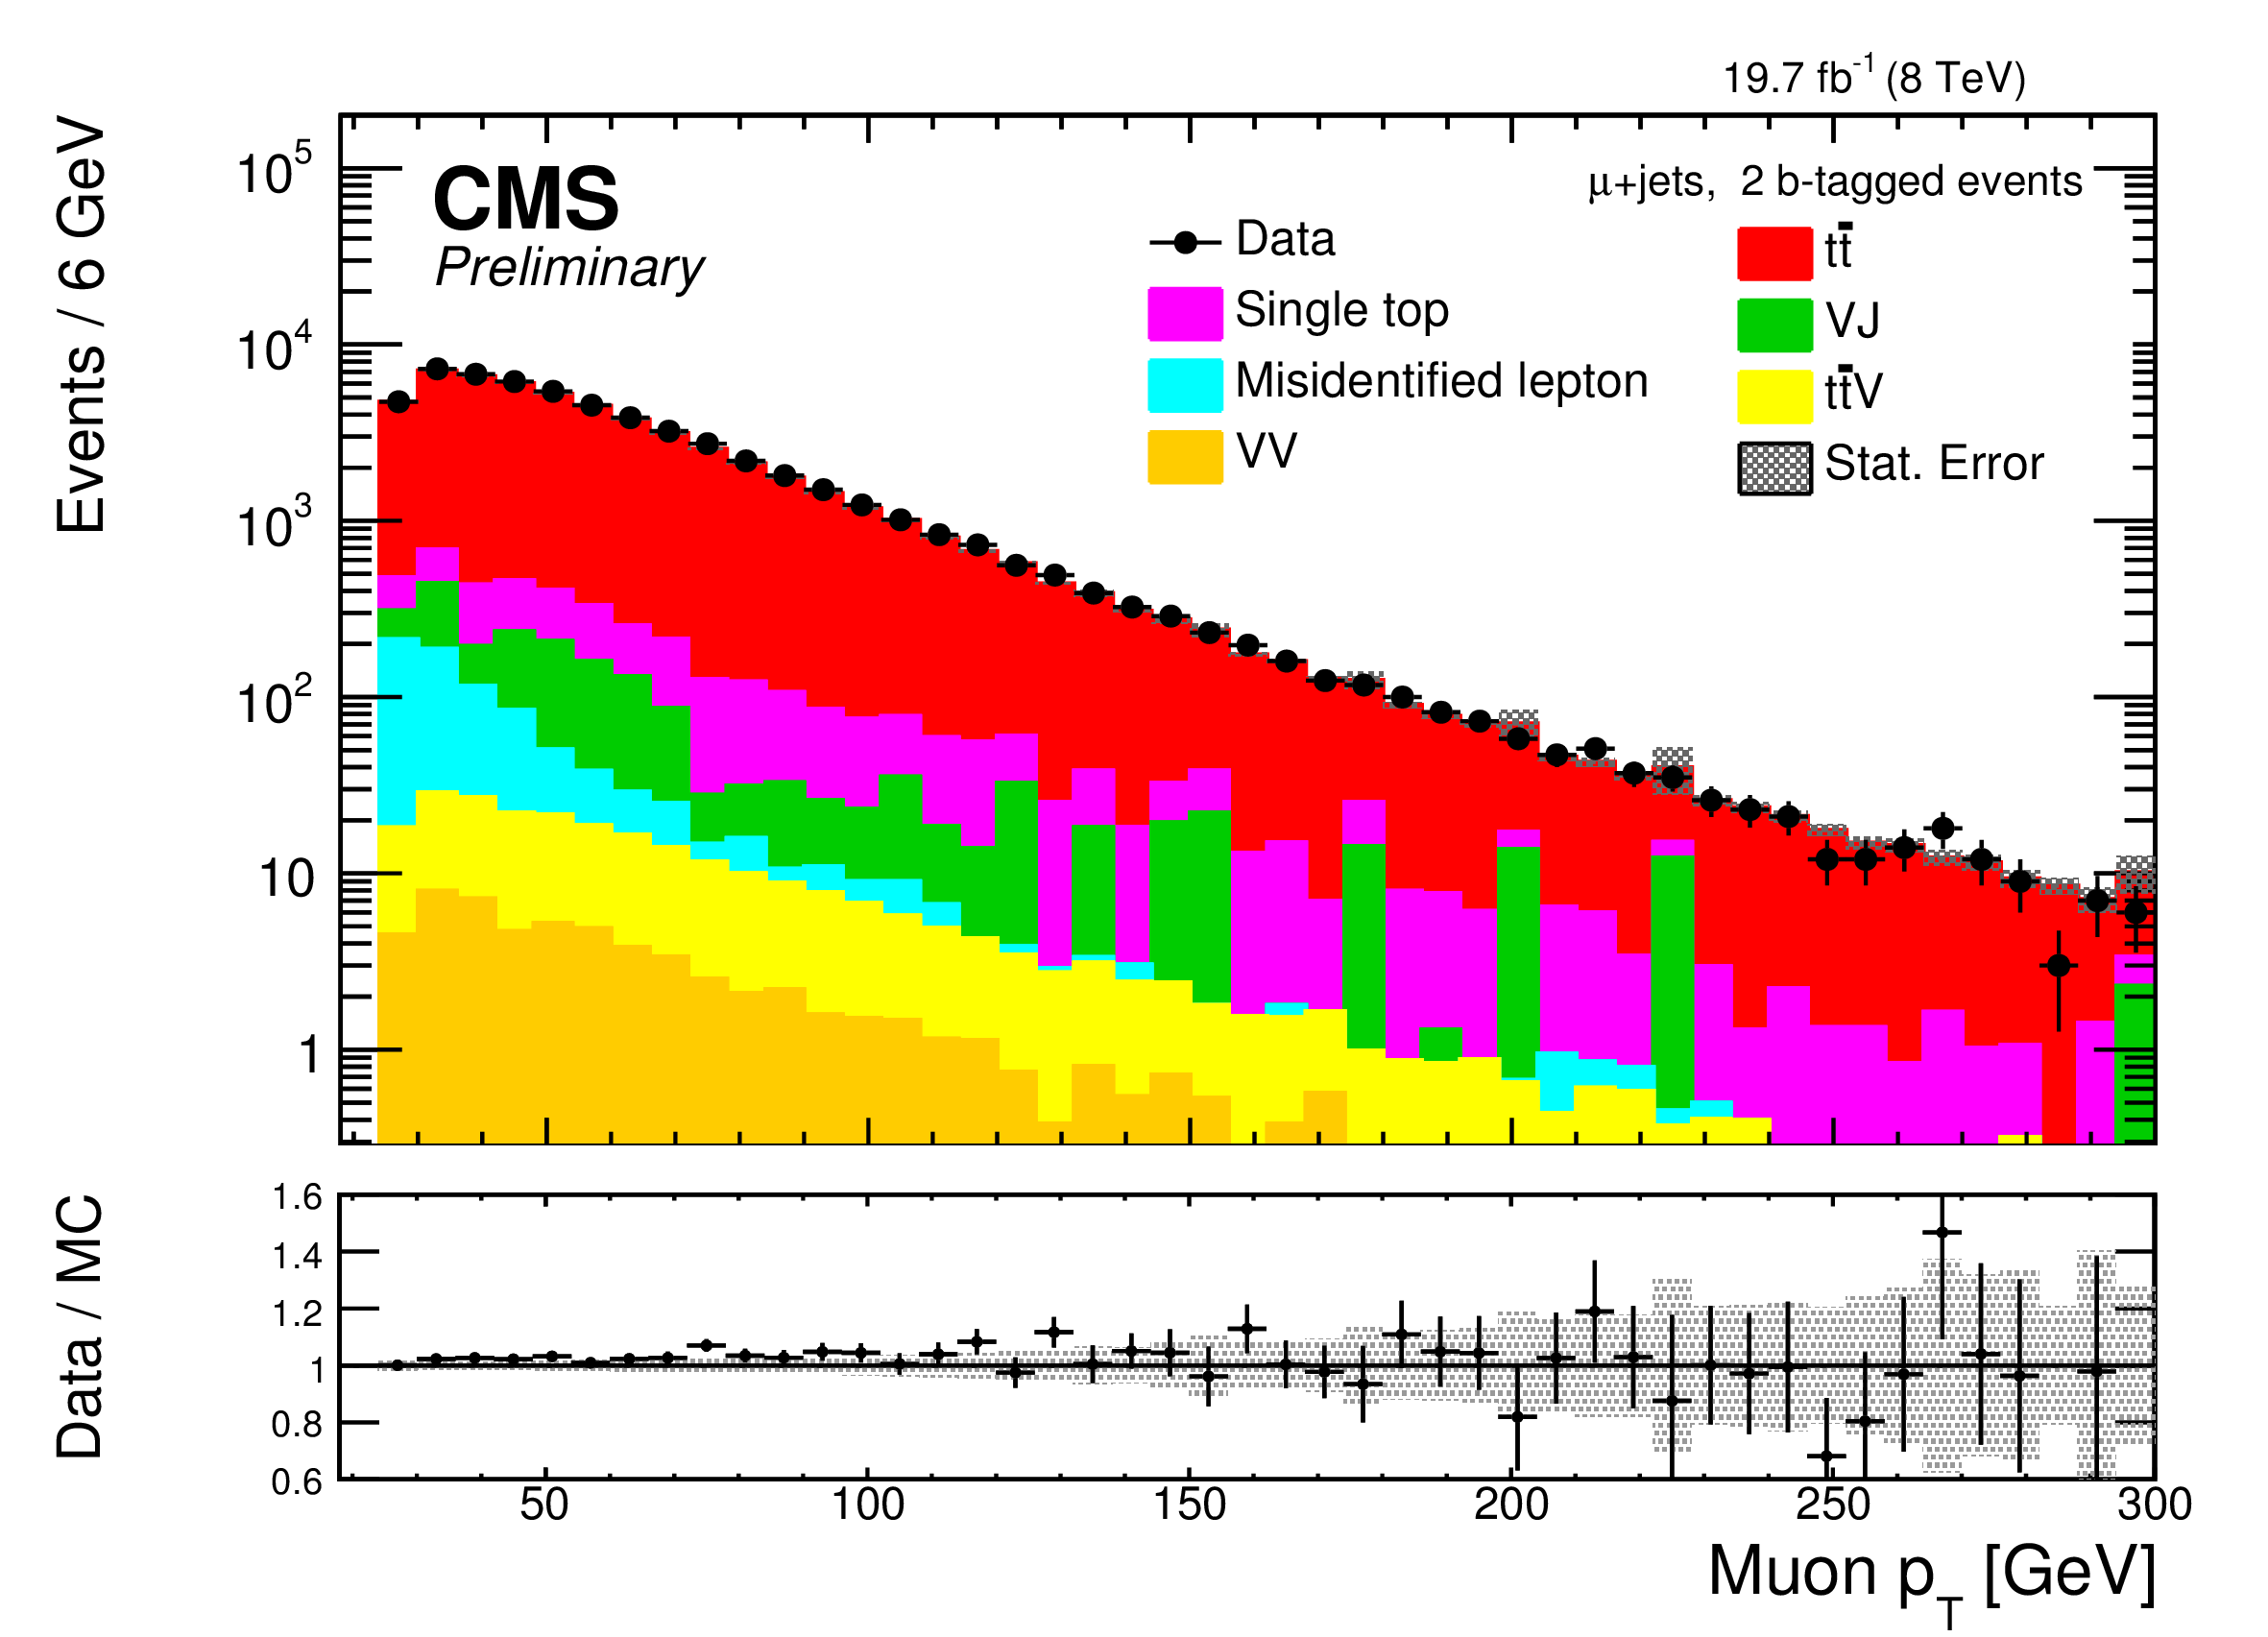
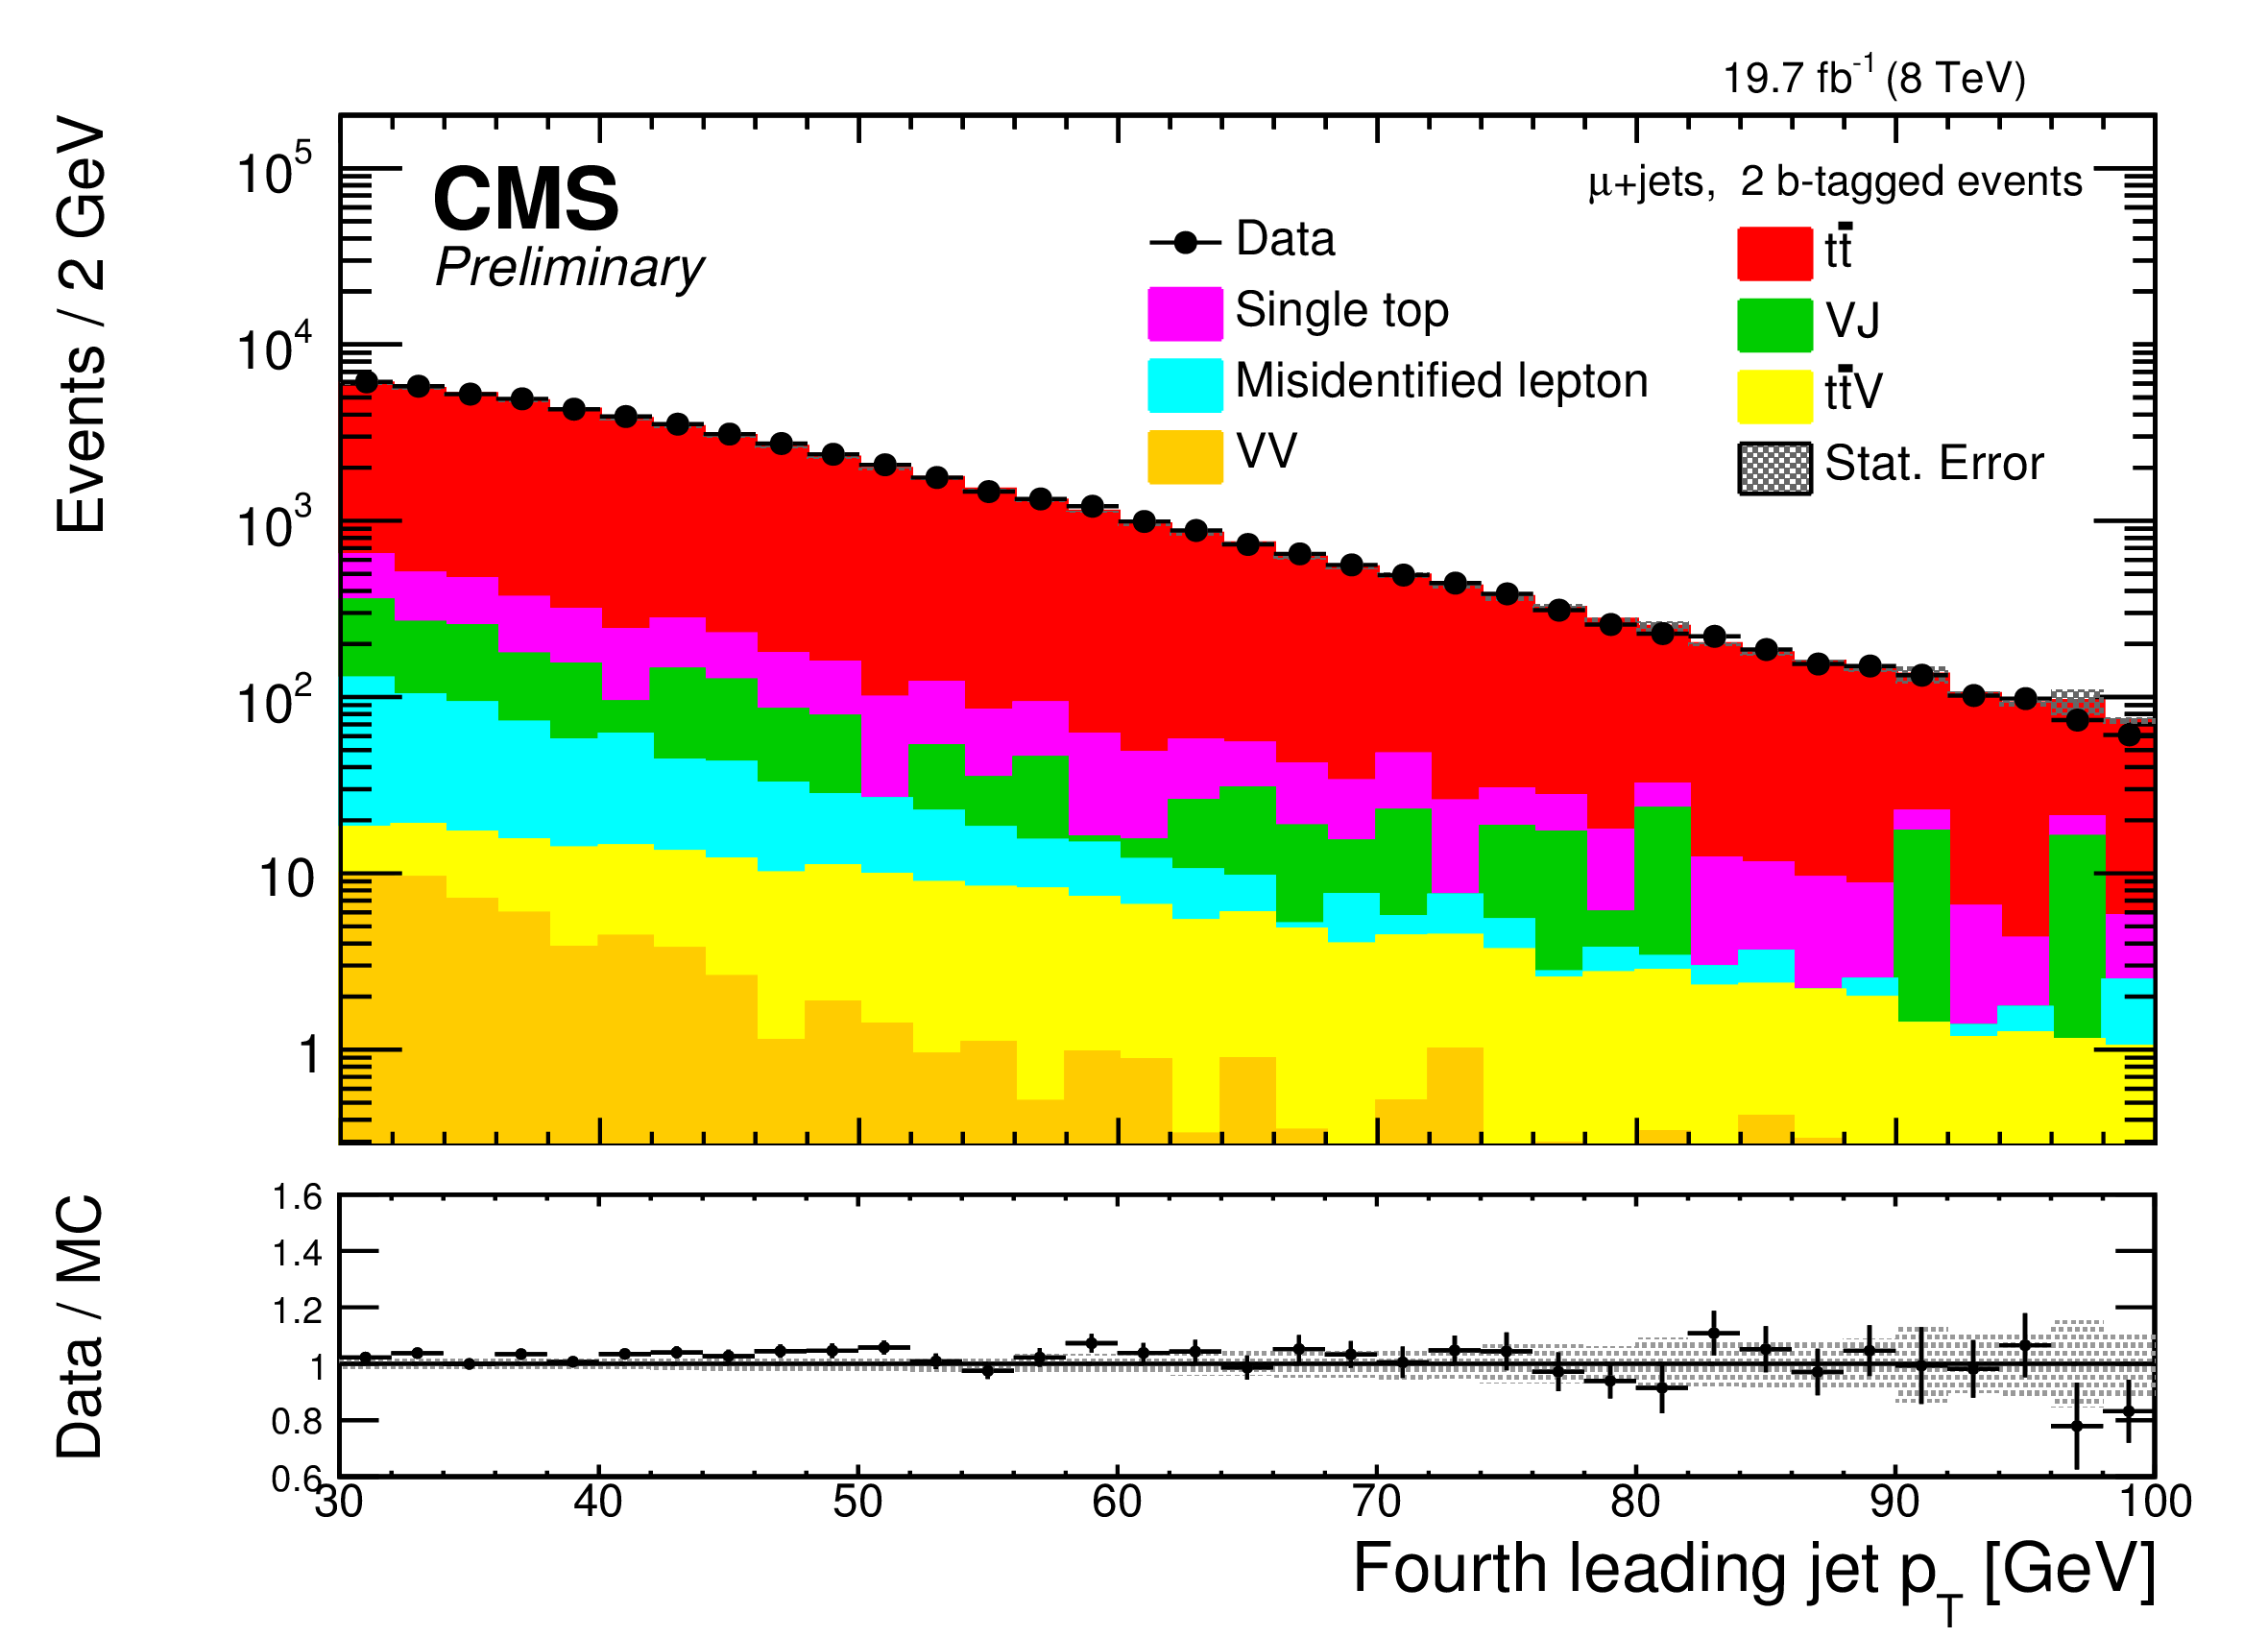
Figure 2-a:
Lepton and jet ${p_{\mathrm {T}}}$ distributions for data and background-only in the 2b-tag category: (a) electron; (b) muon; the other four plots are for the four leading jets. The data-driven correction to the $ {\mathrm {t}\overline {\mathrm {t}}} $ simulation in the 3 b-tag region is not applied in these plots. |
png pdf |
Figure 2-b:
Lepton and jet ${p_{\mathrm {T}}}$ distributions for data and background-only in the 2b-tag category: (a) electron; (b) muon; the other four plots are for the four leading jets. The data-driven correction to the $ {\mathrm {t}\overline {\mathrm {t}}} $ simulation in the 3 b-tag region is not applied in these plots. |

png pdf |
Figure 2-c:
Lepton and jet ${p_{\mathrm {T}}}$ distributions for data and background-only in the 2b-tag category: (a) electron; (b) muon; the other four plots are for the four leading jets. The data-driven correction to the $ {\mathrm {t}\overline {\mathrm {t}}} $ simulation in the 3 b-tag region is not applied in these plots. |

png pdf |
Figure 2-d:
Lepton and jet ${p_{\mathrm {T}}}$ distributions for data and background-only in the 2b-tag category: (a) electron; (b) muon; the other four plots are for the four leading jets. The data-driven correction to the $ {\mathrm {t}\overline {\mathrm {t}}} $ simulation in the 3 b-tag region is not applied in these plots. |

png pdf |
Figure 2-e:
Lepton and jet ${p_{\mathrm {T}}}$ distributions for data and background-only in the 2b-tag category: (a) electron; (b) muon; the other four plots are for the four leading jets. The data-driven correction to the $ {\mathrm {t}\overline {\mathrm {t}}} $ simulation in the 3 b-tag region is not applied in these plots. |
png pdf |
Figure 2-f:
Lepton and jet ${p_{\mathrm {T}}}$ distributions for data and background-only in the 2b-tag category: (a) electron; (b) muon; the other four plots are for the four leading jets. The data-driven correction to the $ {\mathrm {t}\overline {\mathrm {t}}} $ simulation in the 3 b-tag region is not applied in these plots. |
png pdf |
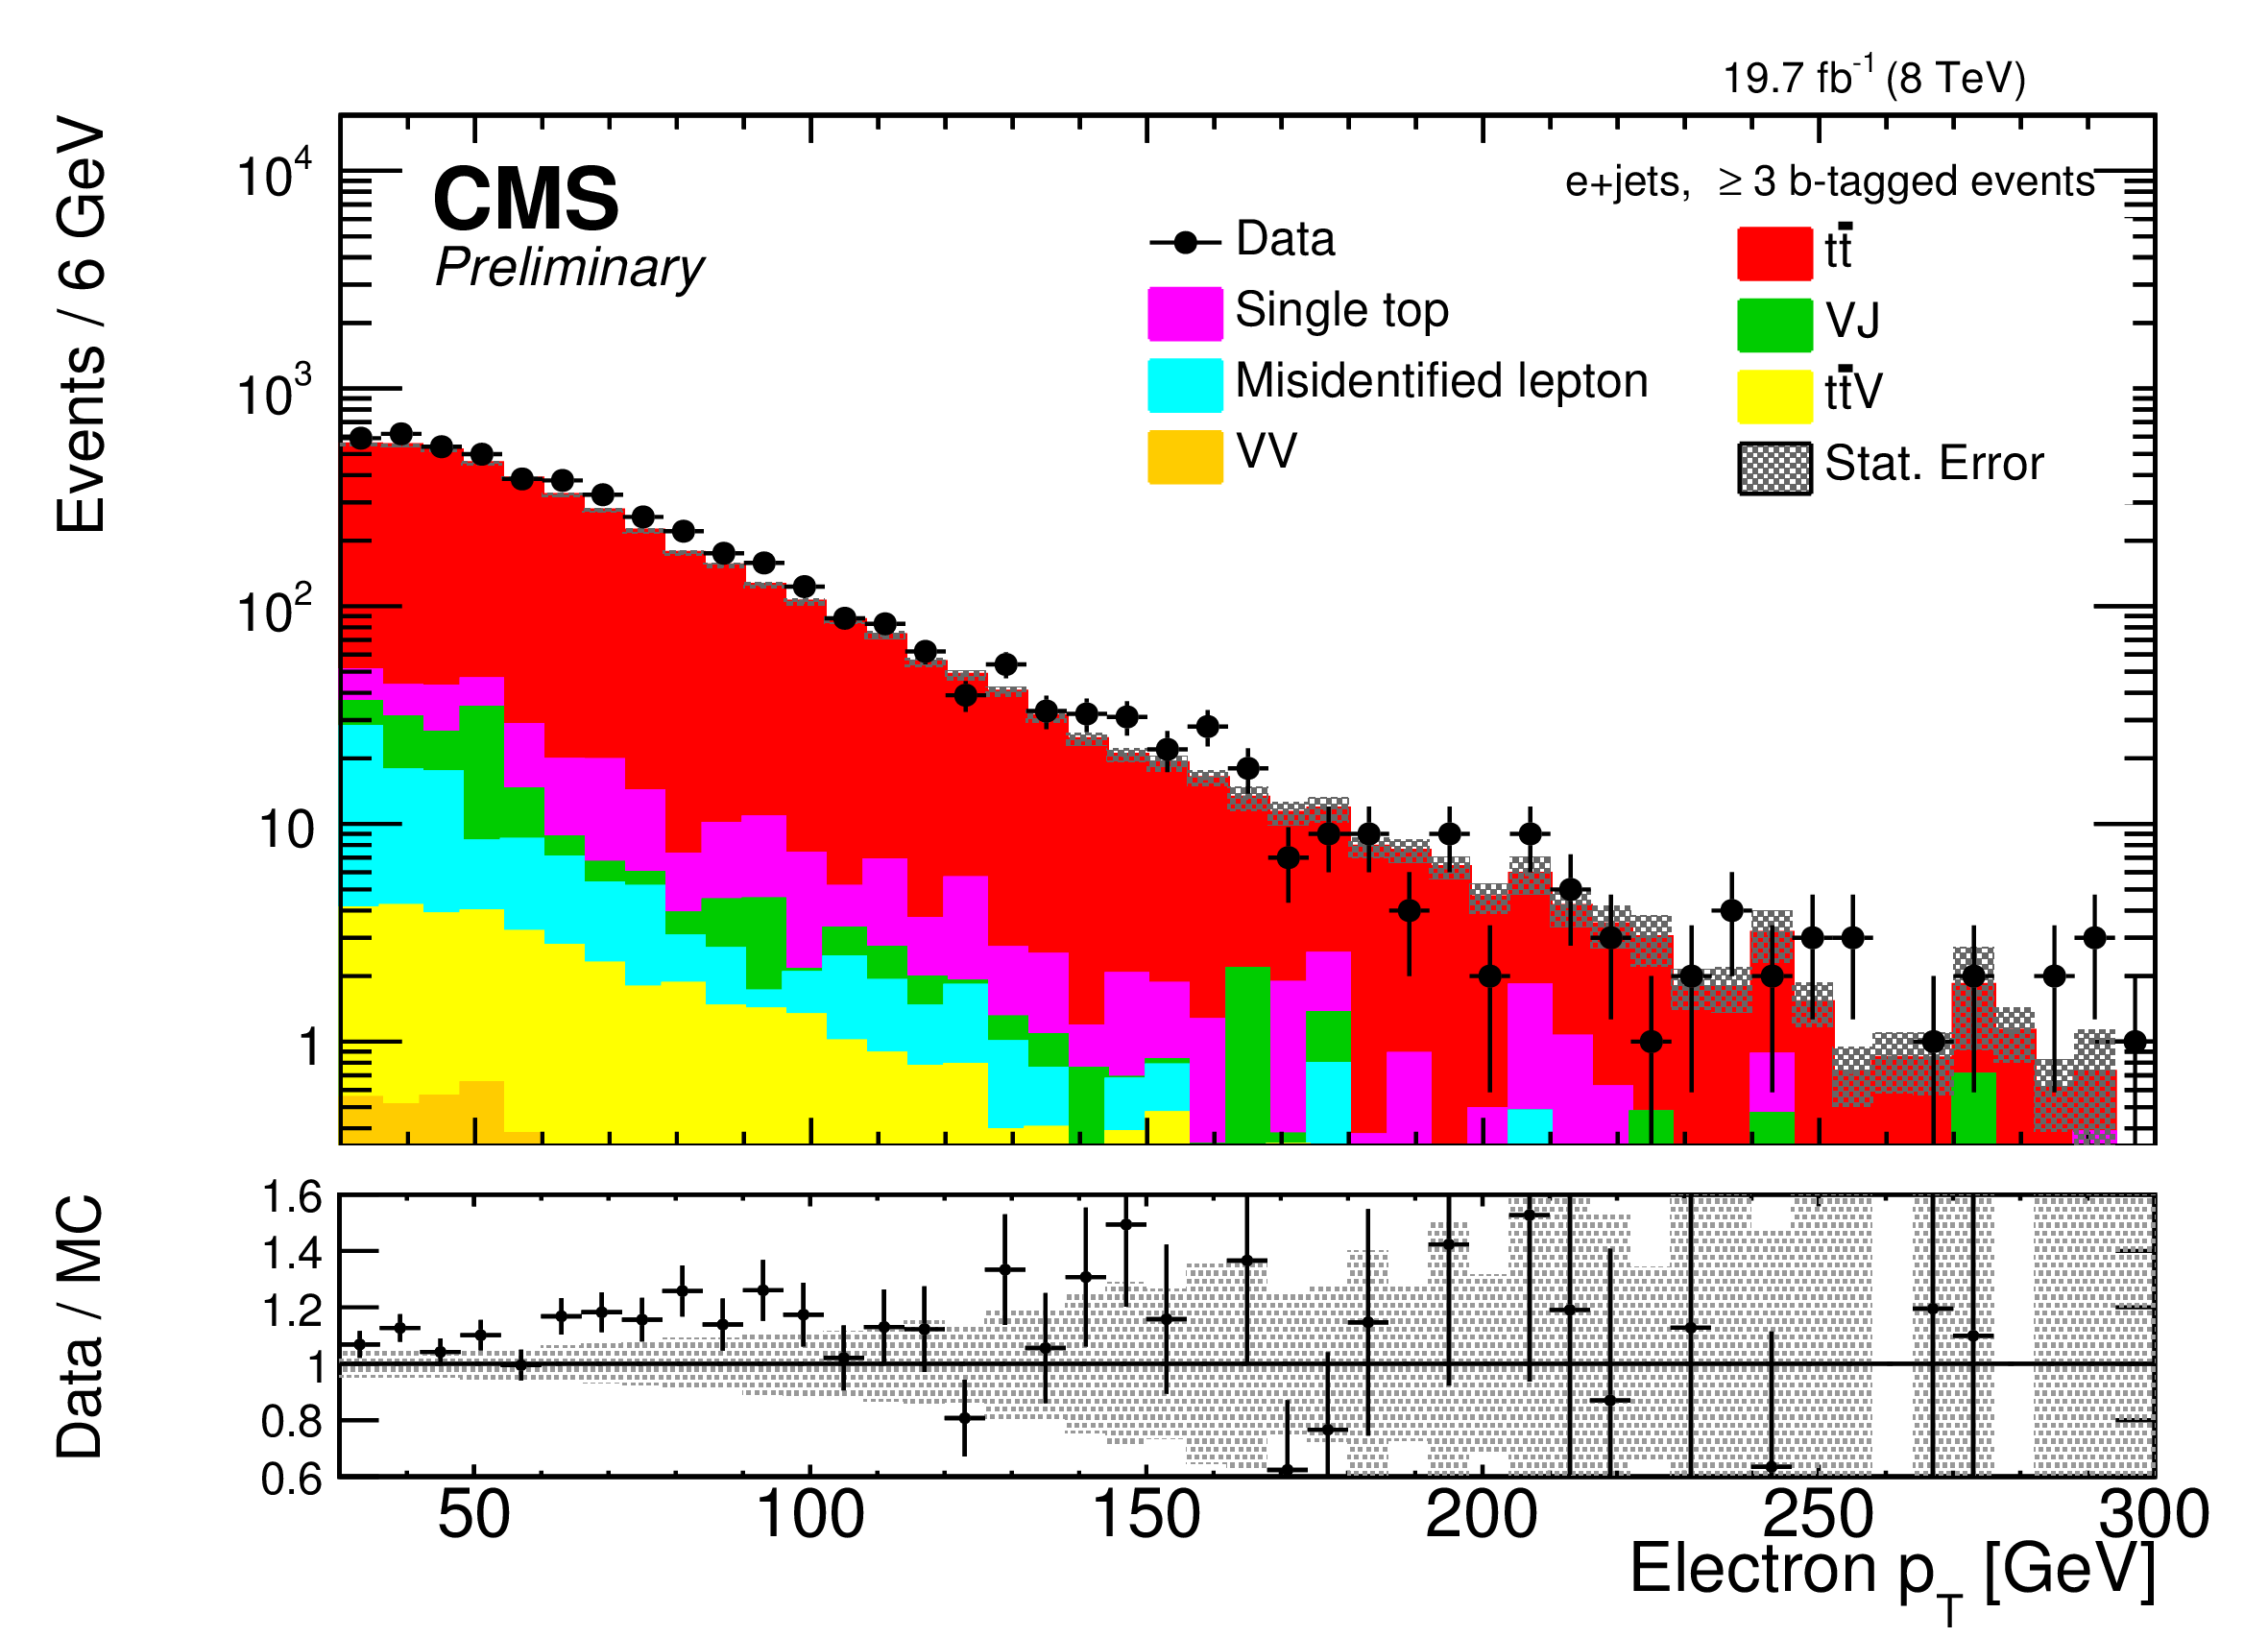
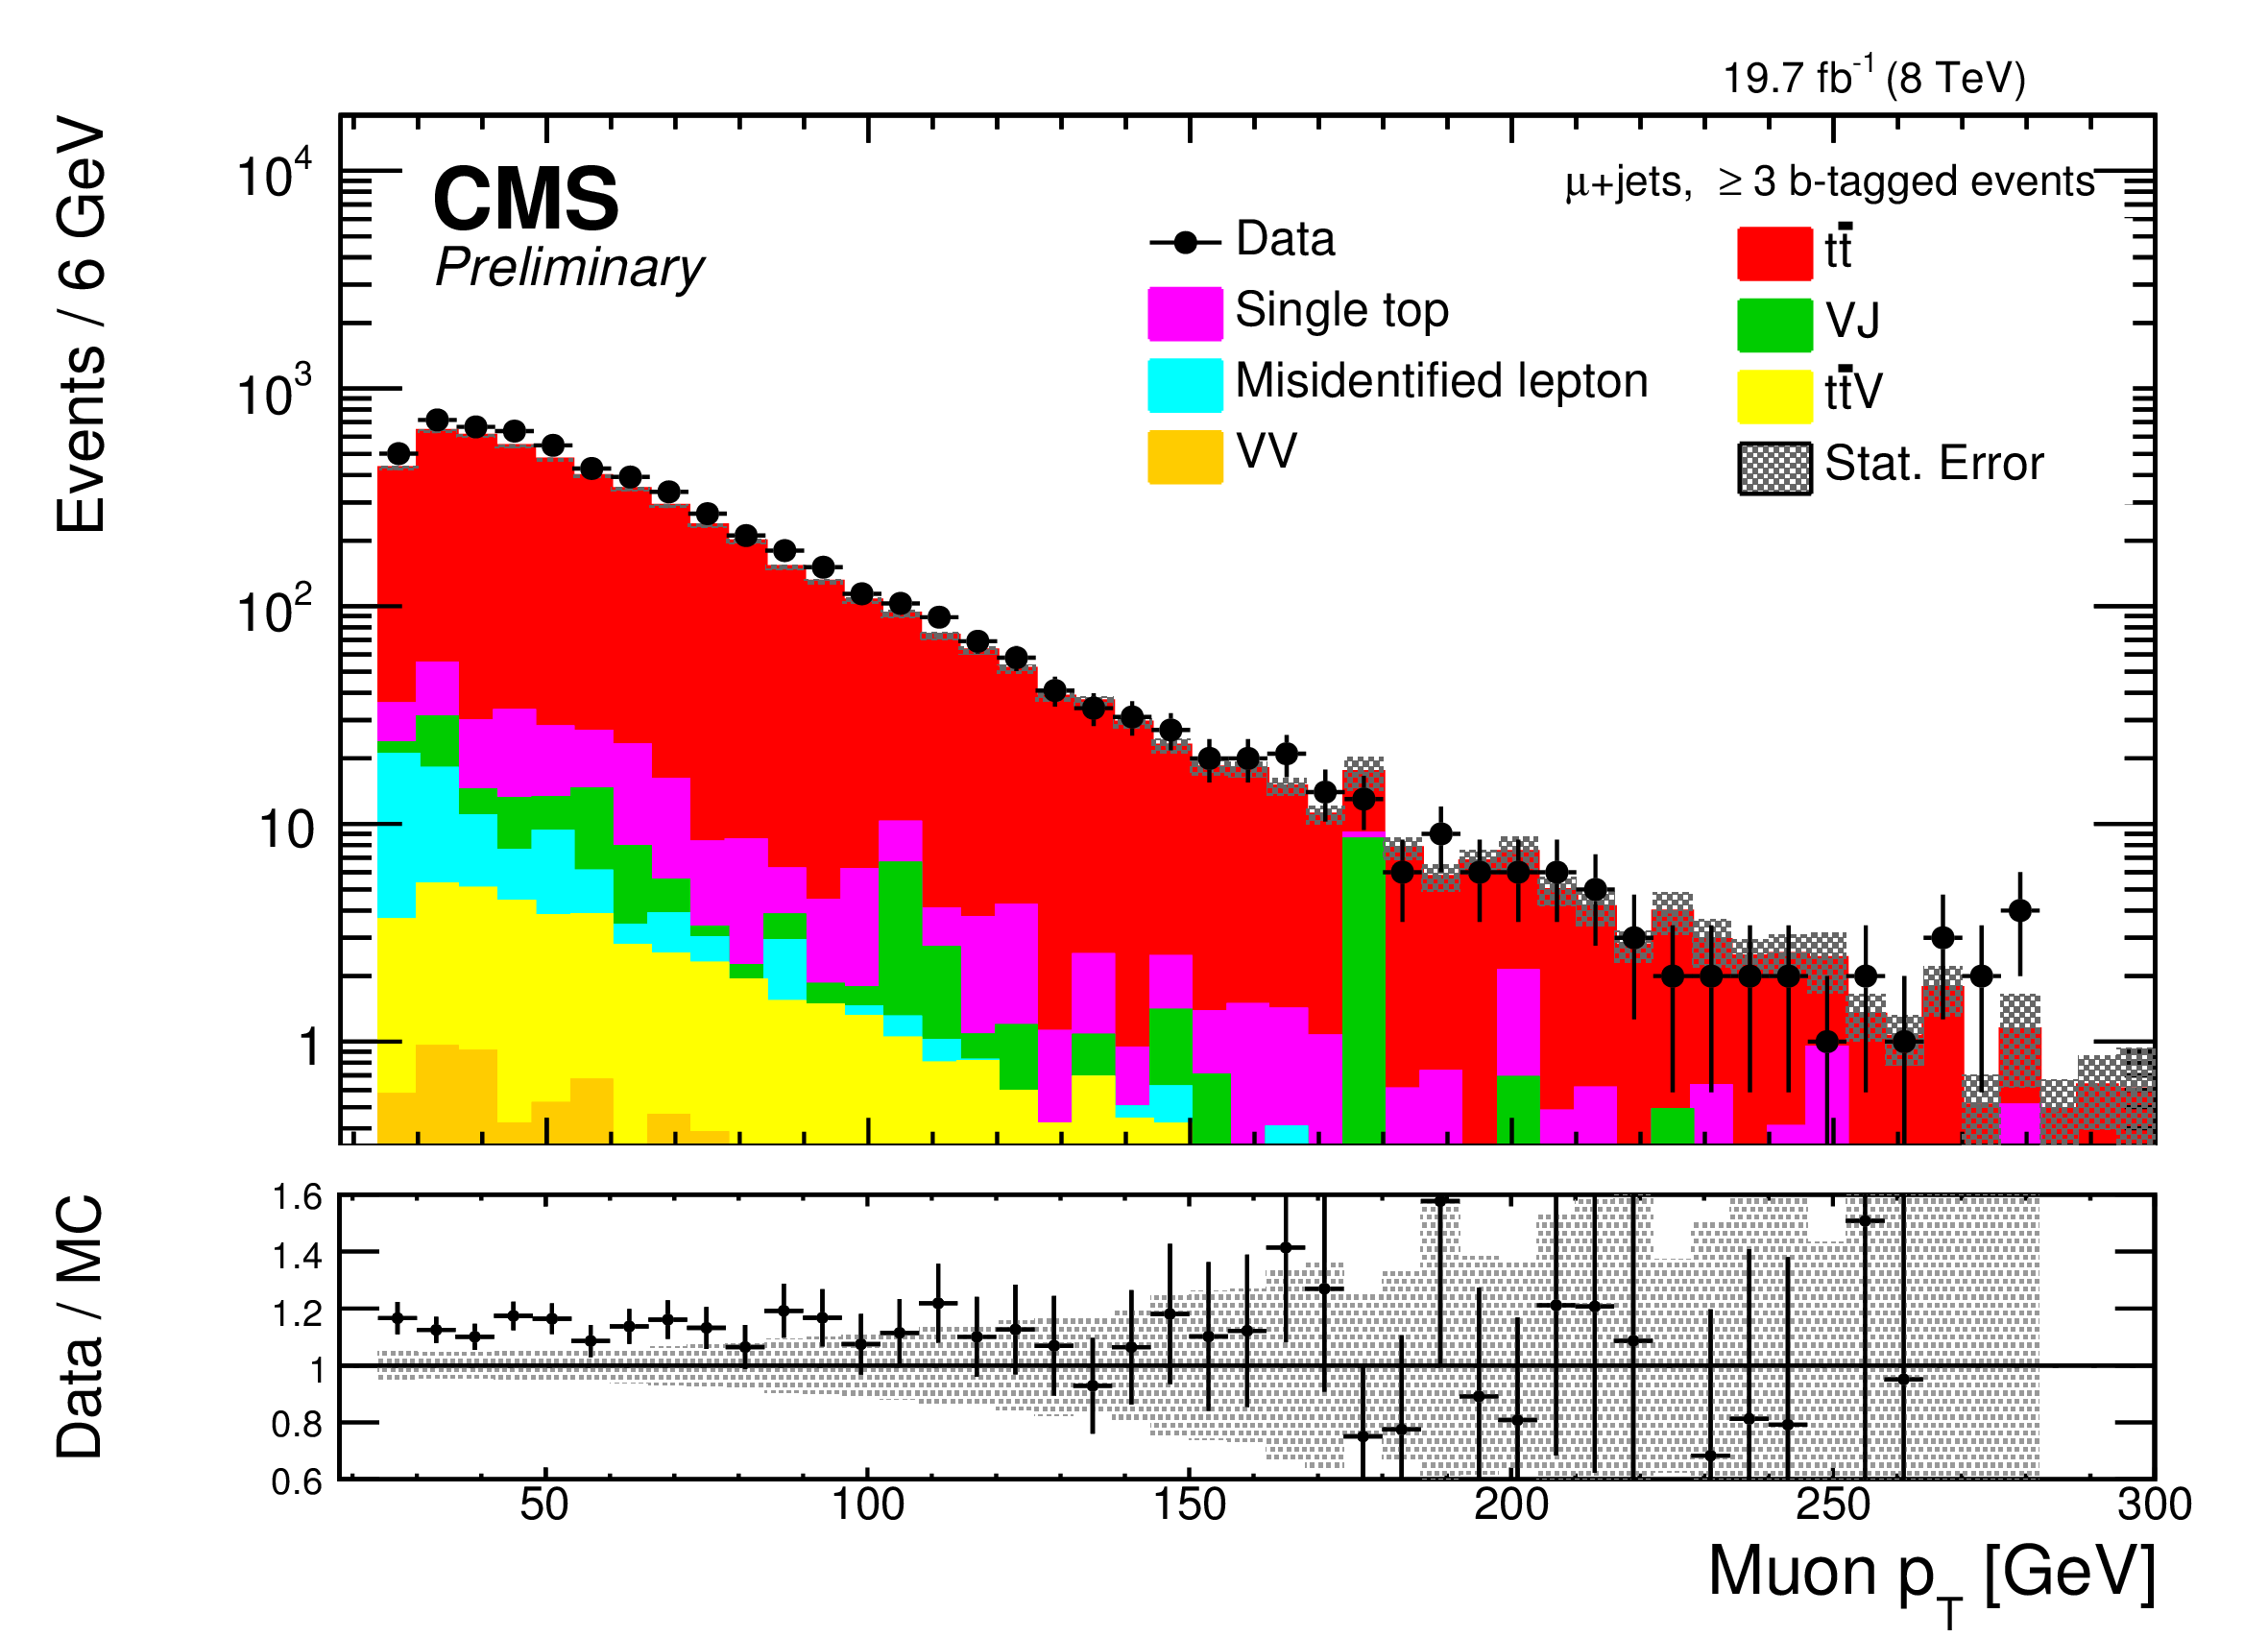
Figure 3-a:
Lepton and jet $ {p_{\mathrm {T}}} $ distributions for data and background-only in the 3b-tag category: (top left) electron; (top-right) muon; the four bottom plots are for the four leading jets. |
png pdf |
Figure 3-b:
Lepton and jet $ {p_{\mathrm {T}}} $ distributions for data and background-only in the 3b-tag category: (top left) electron; (top-right) muon; the four bottom plots are for the four leading jets. |

png pdf |
Figure 3-c:
Lepton and jet $ {p_{\mathrm {T}}} $ distributions for data and background-only in the 3b-tag category: (top left) electron; (top-right) muon; the four bottom plots are for the four leading jets. |

png pdf |
Figure 3-d:
Lepton and jet $ {p_{\mathrm {T}}} $ distributions for data and background-only in the 3b-tag category: (top left) electron; (top-right) muon; the four bottom plots are for the four leading jets. |

png pdf |
Figure 3-e:
Lepton and jet $ {p_{\mathrm {T}}} $ distributions for data and background-only in the 3b-tag category: (top left) electron; (top-right) muon; the four bottom plots are for the four leading jets. |

png pdf |
Figure 3-f:
Lepton and jet $ {p_{\mathrm {T}}} $ distributions for data and background-only in the 3b-tag category: (top left) electron; (top-right) muon; the four bottom plots are for the four leading jets. |

png pdf |
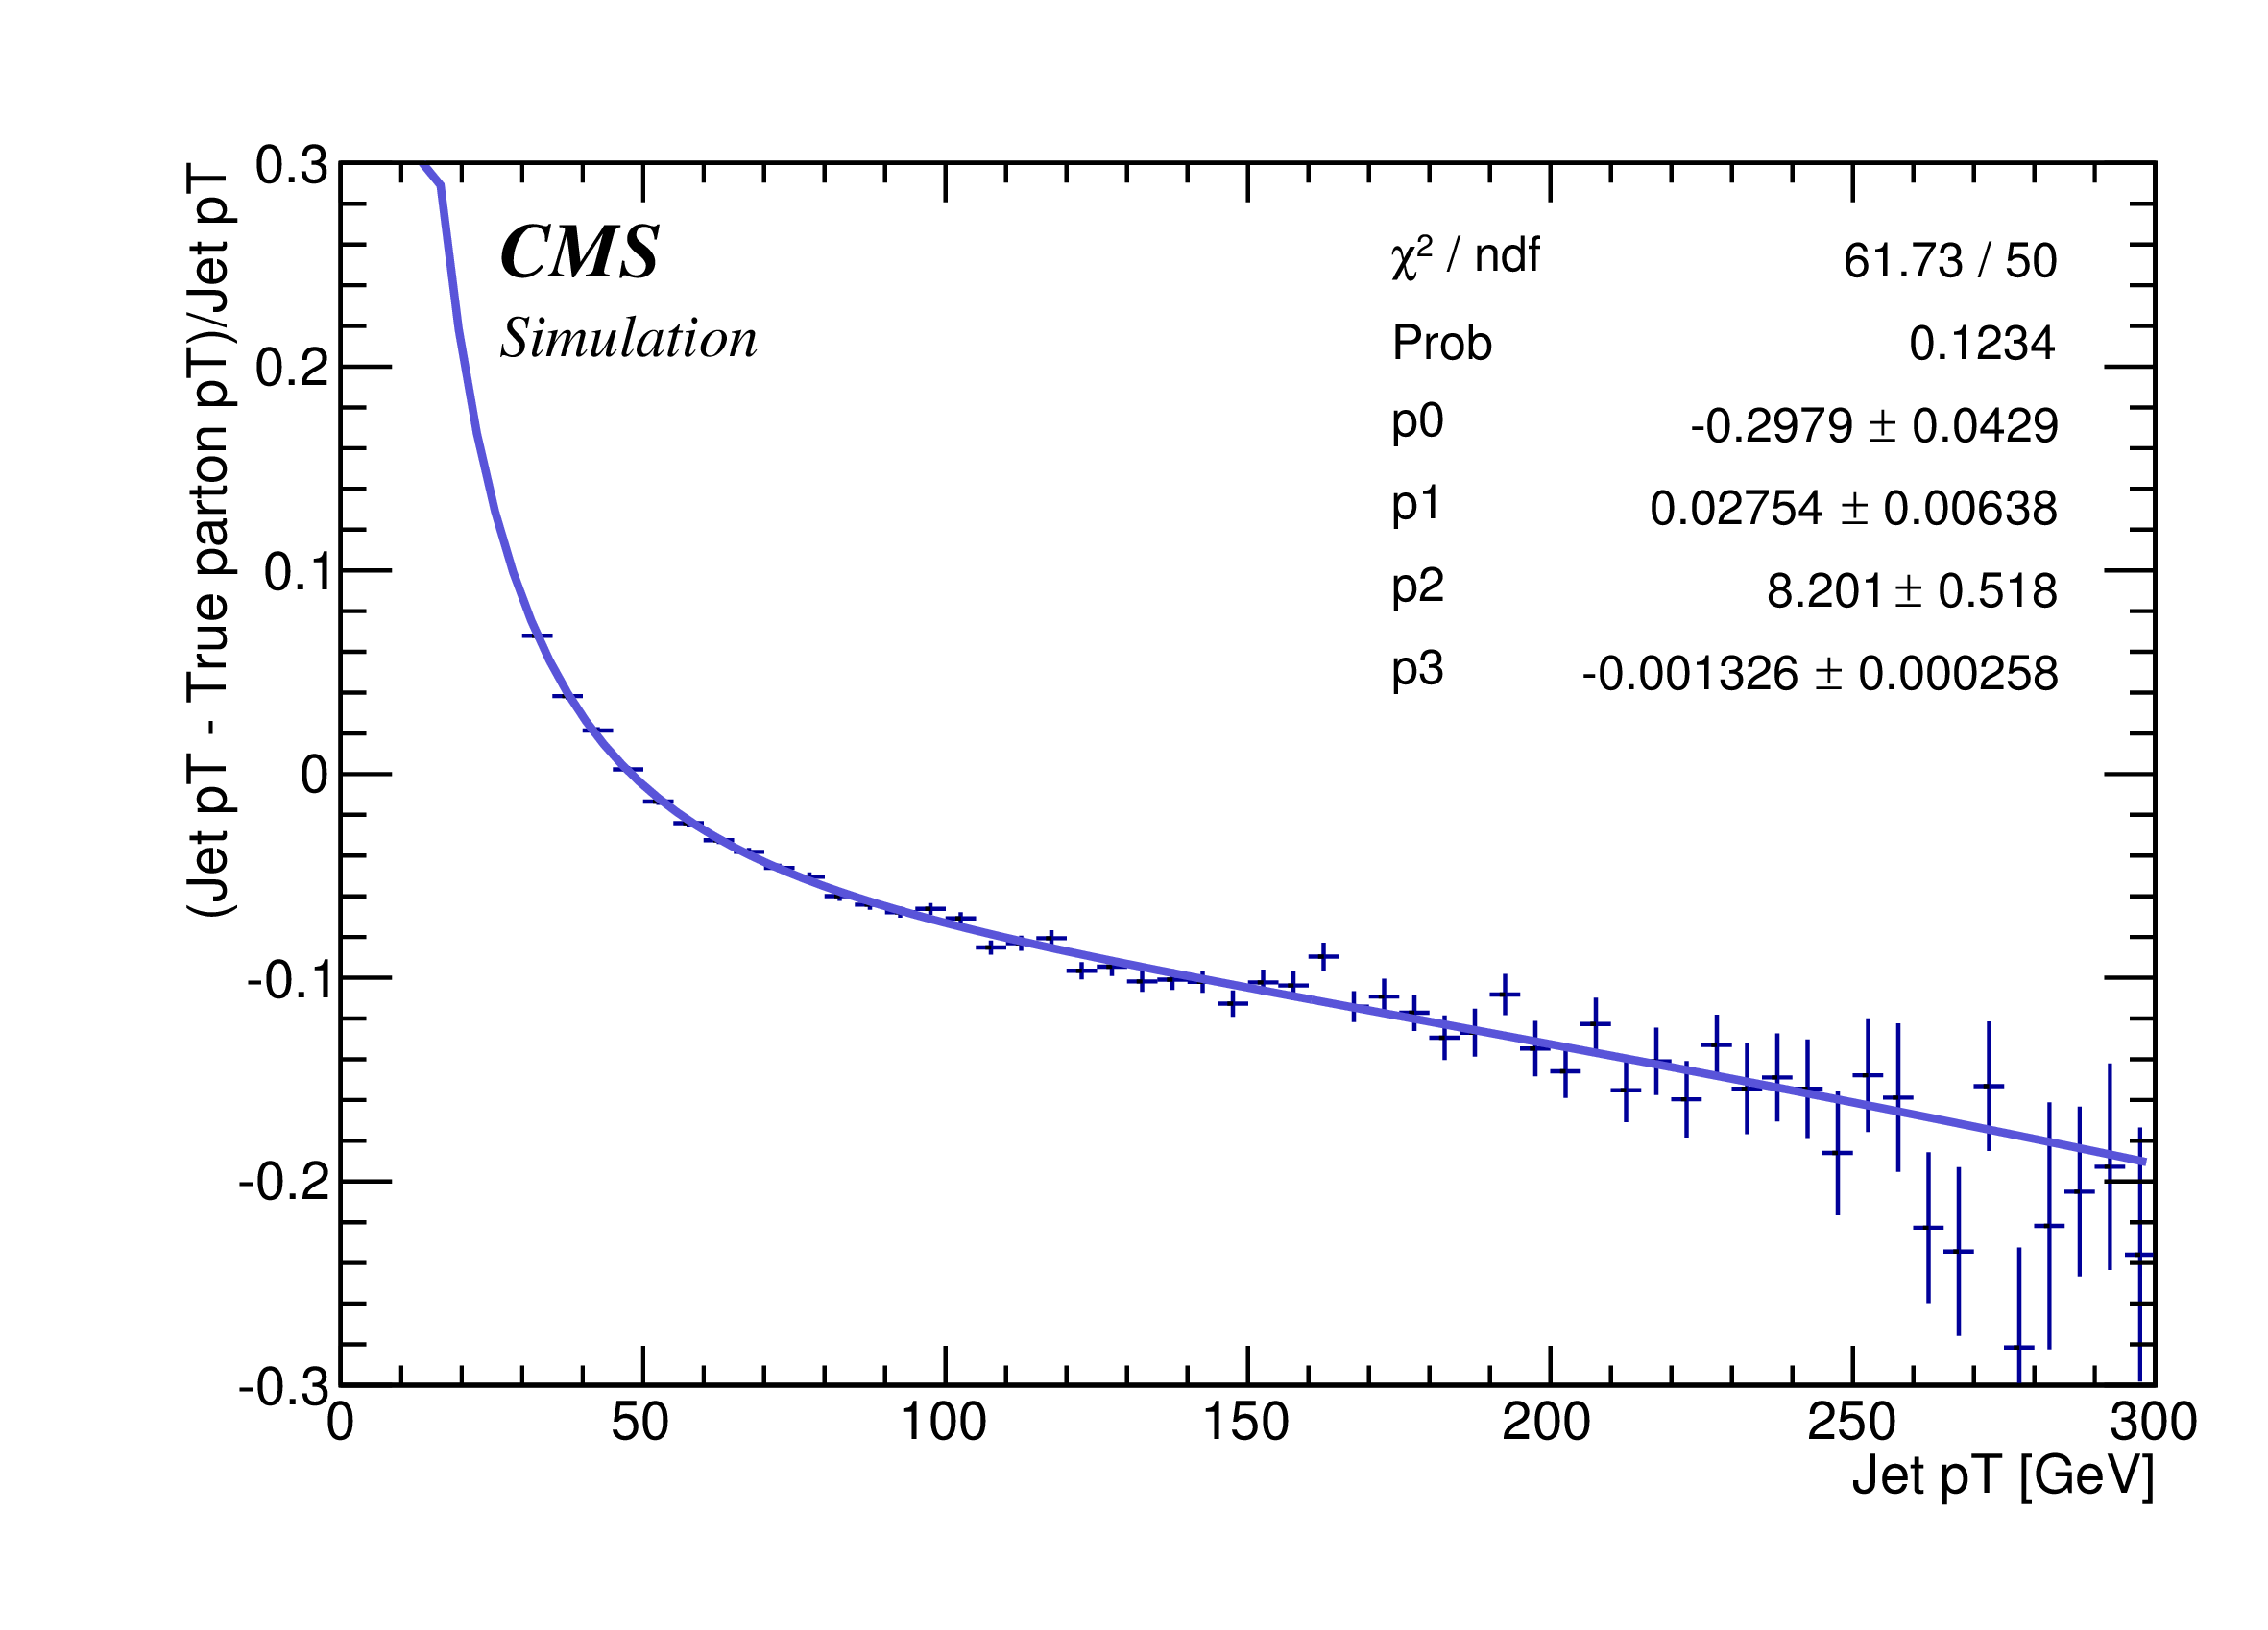
Figure 4-a:
Jet $ {p_{\mathrm {T}}} $ response as a function of reconstructed $ {p_{\mathrm {T}}} $ for a b quark jet, c quark jet, and light-flavour jets in $|\eta | <$ 0.174. |

png pdf |
Figure 4-b:
Jet $ {p_{\mathrm {T}}} $ response as a function of reconstructed $ {p_{\mathrm {T}}} $ for a b quark jet, c quark jet, and light-flavour jets in $|\eta | <$ 0.174. |
png pdf |
Figure 4-c:
Jet $ {p_{\mathrm {T}}} $ response as a function of reconstructed $ {p_{\mathrm {T}}} $ for a b quark jet, c quark jet, and light-flavour jets in $|\eta | <$ 0.174. |

png pdf |
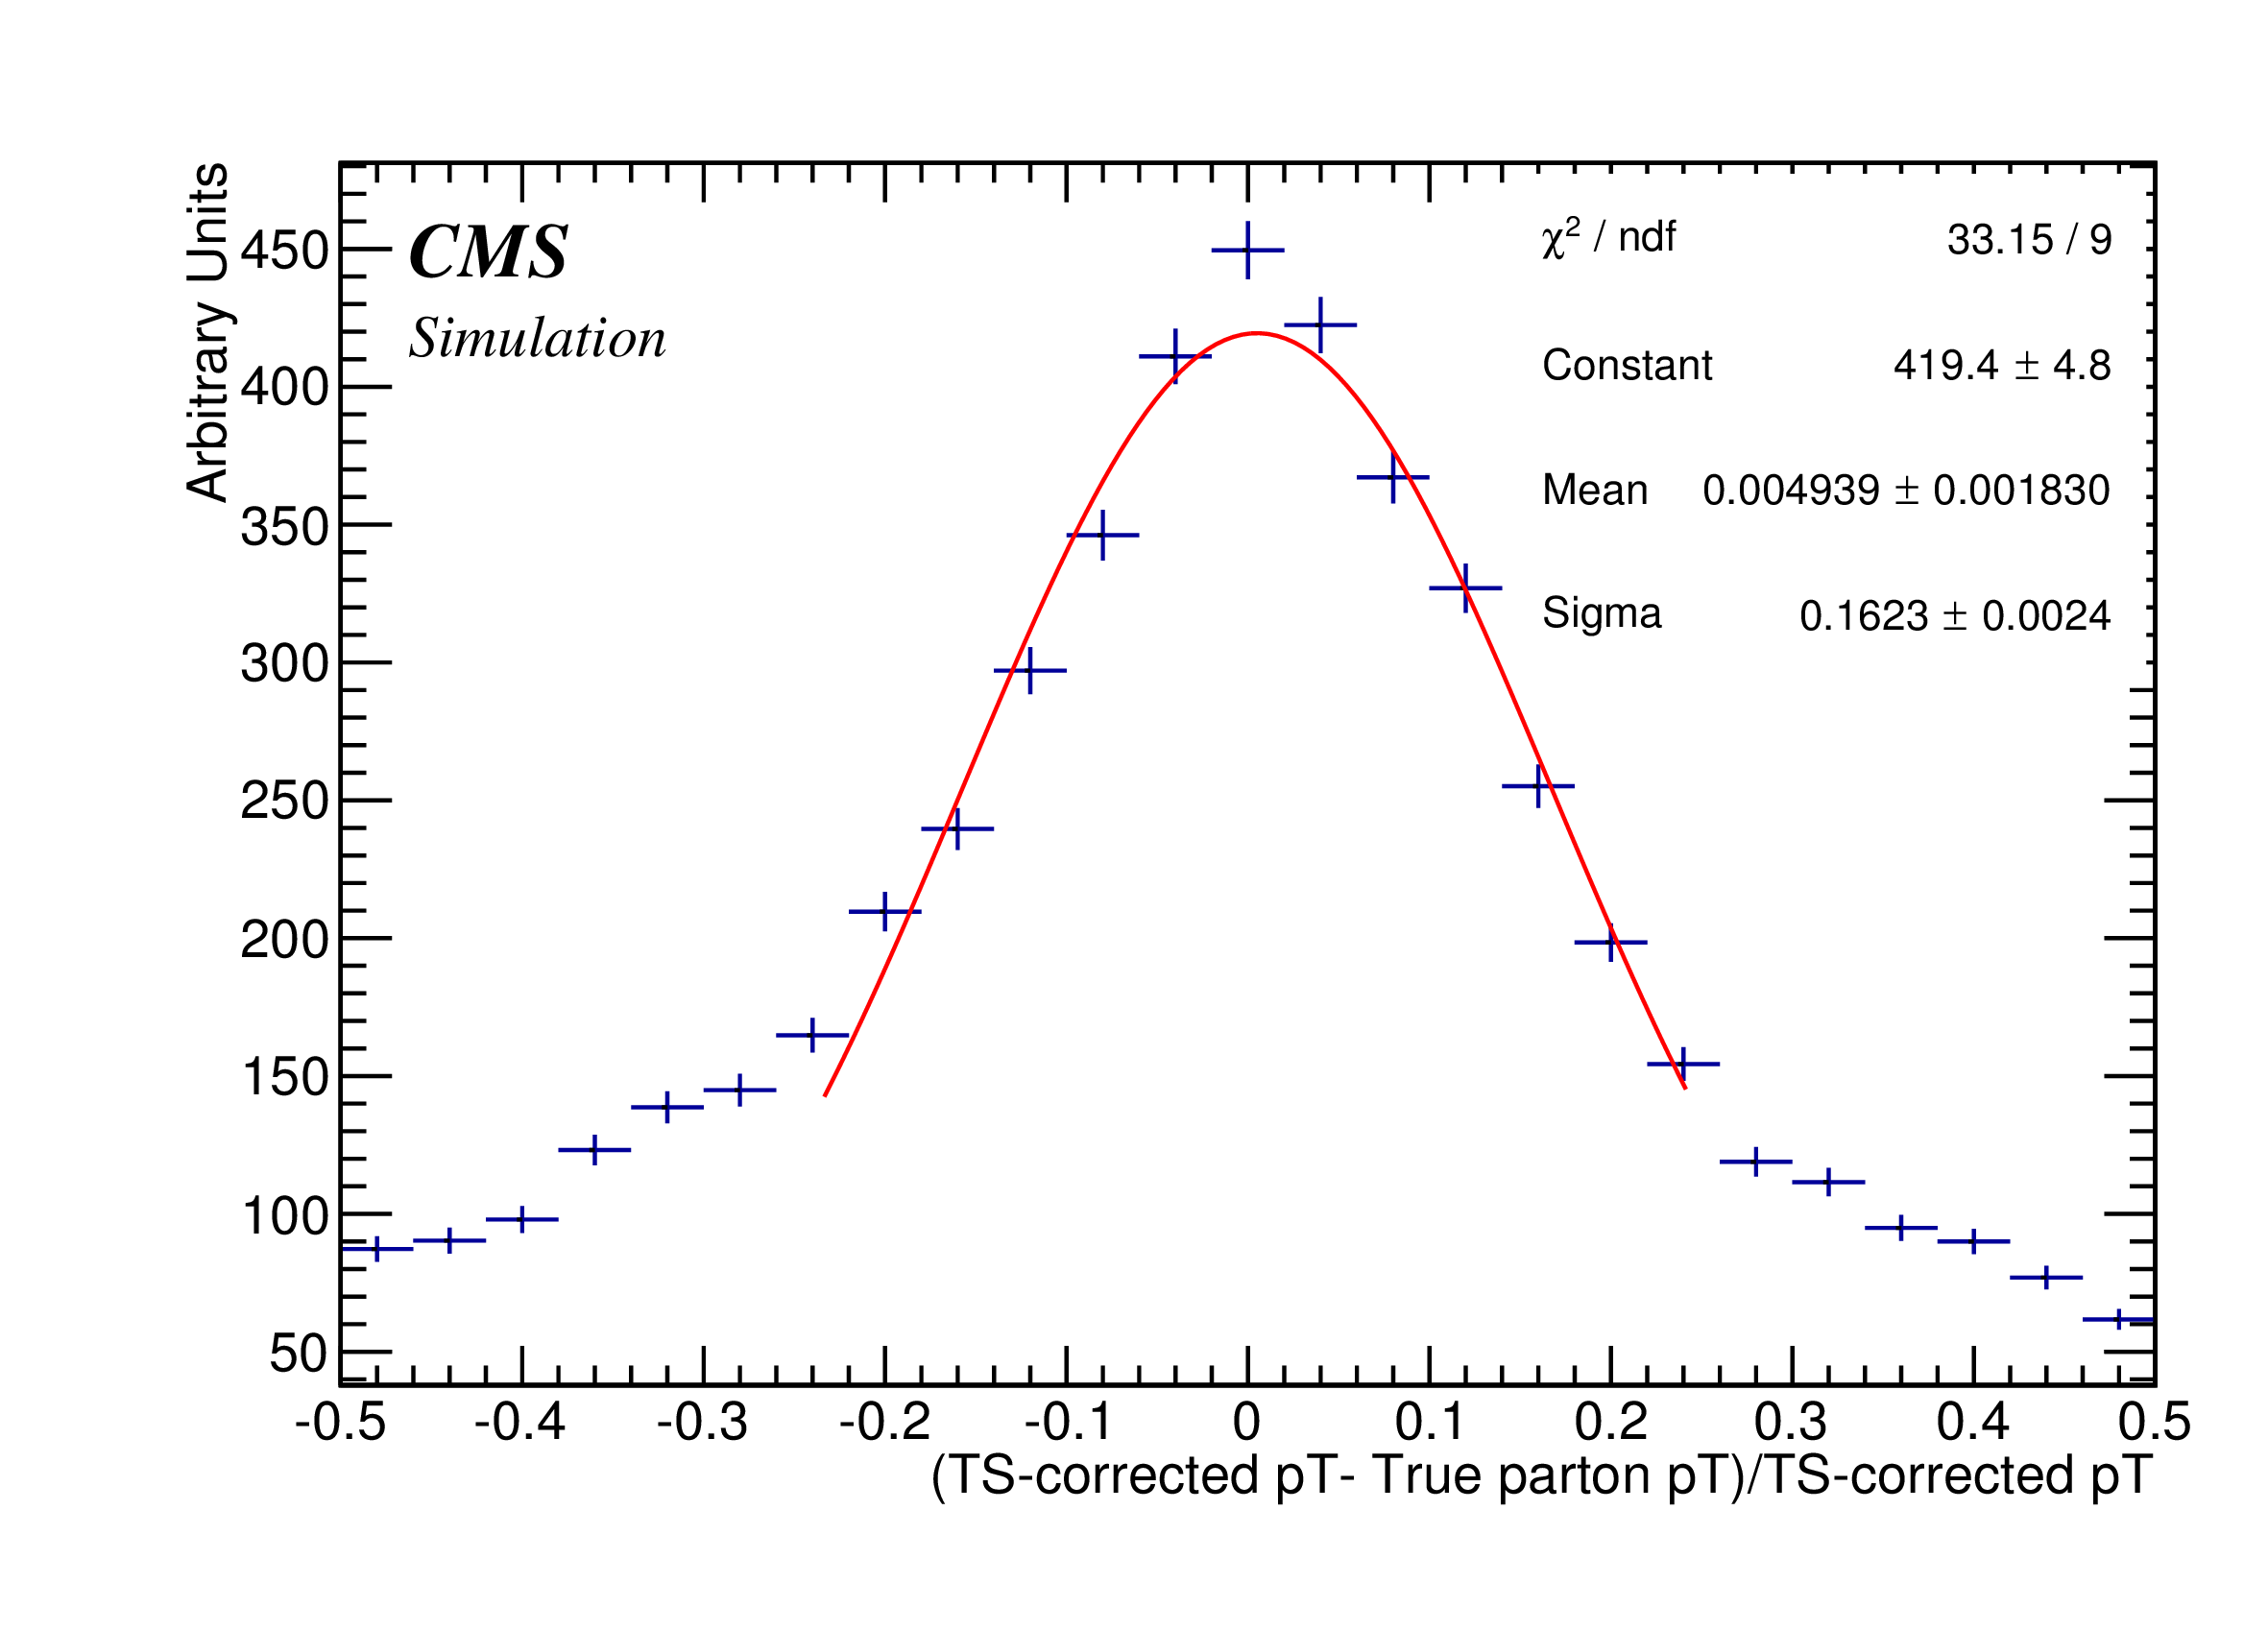
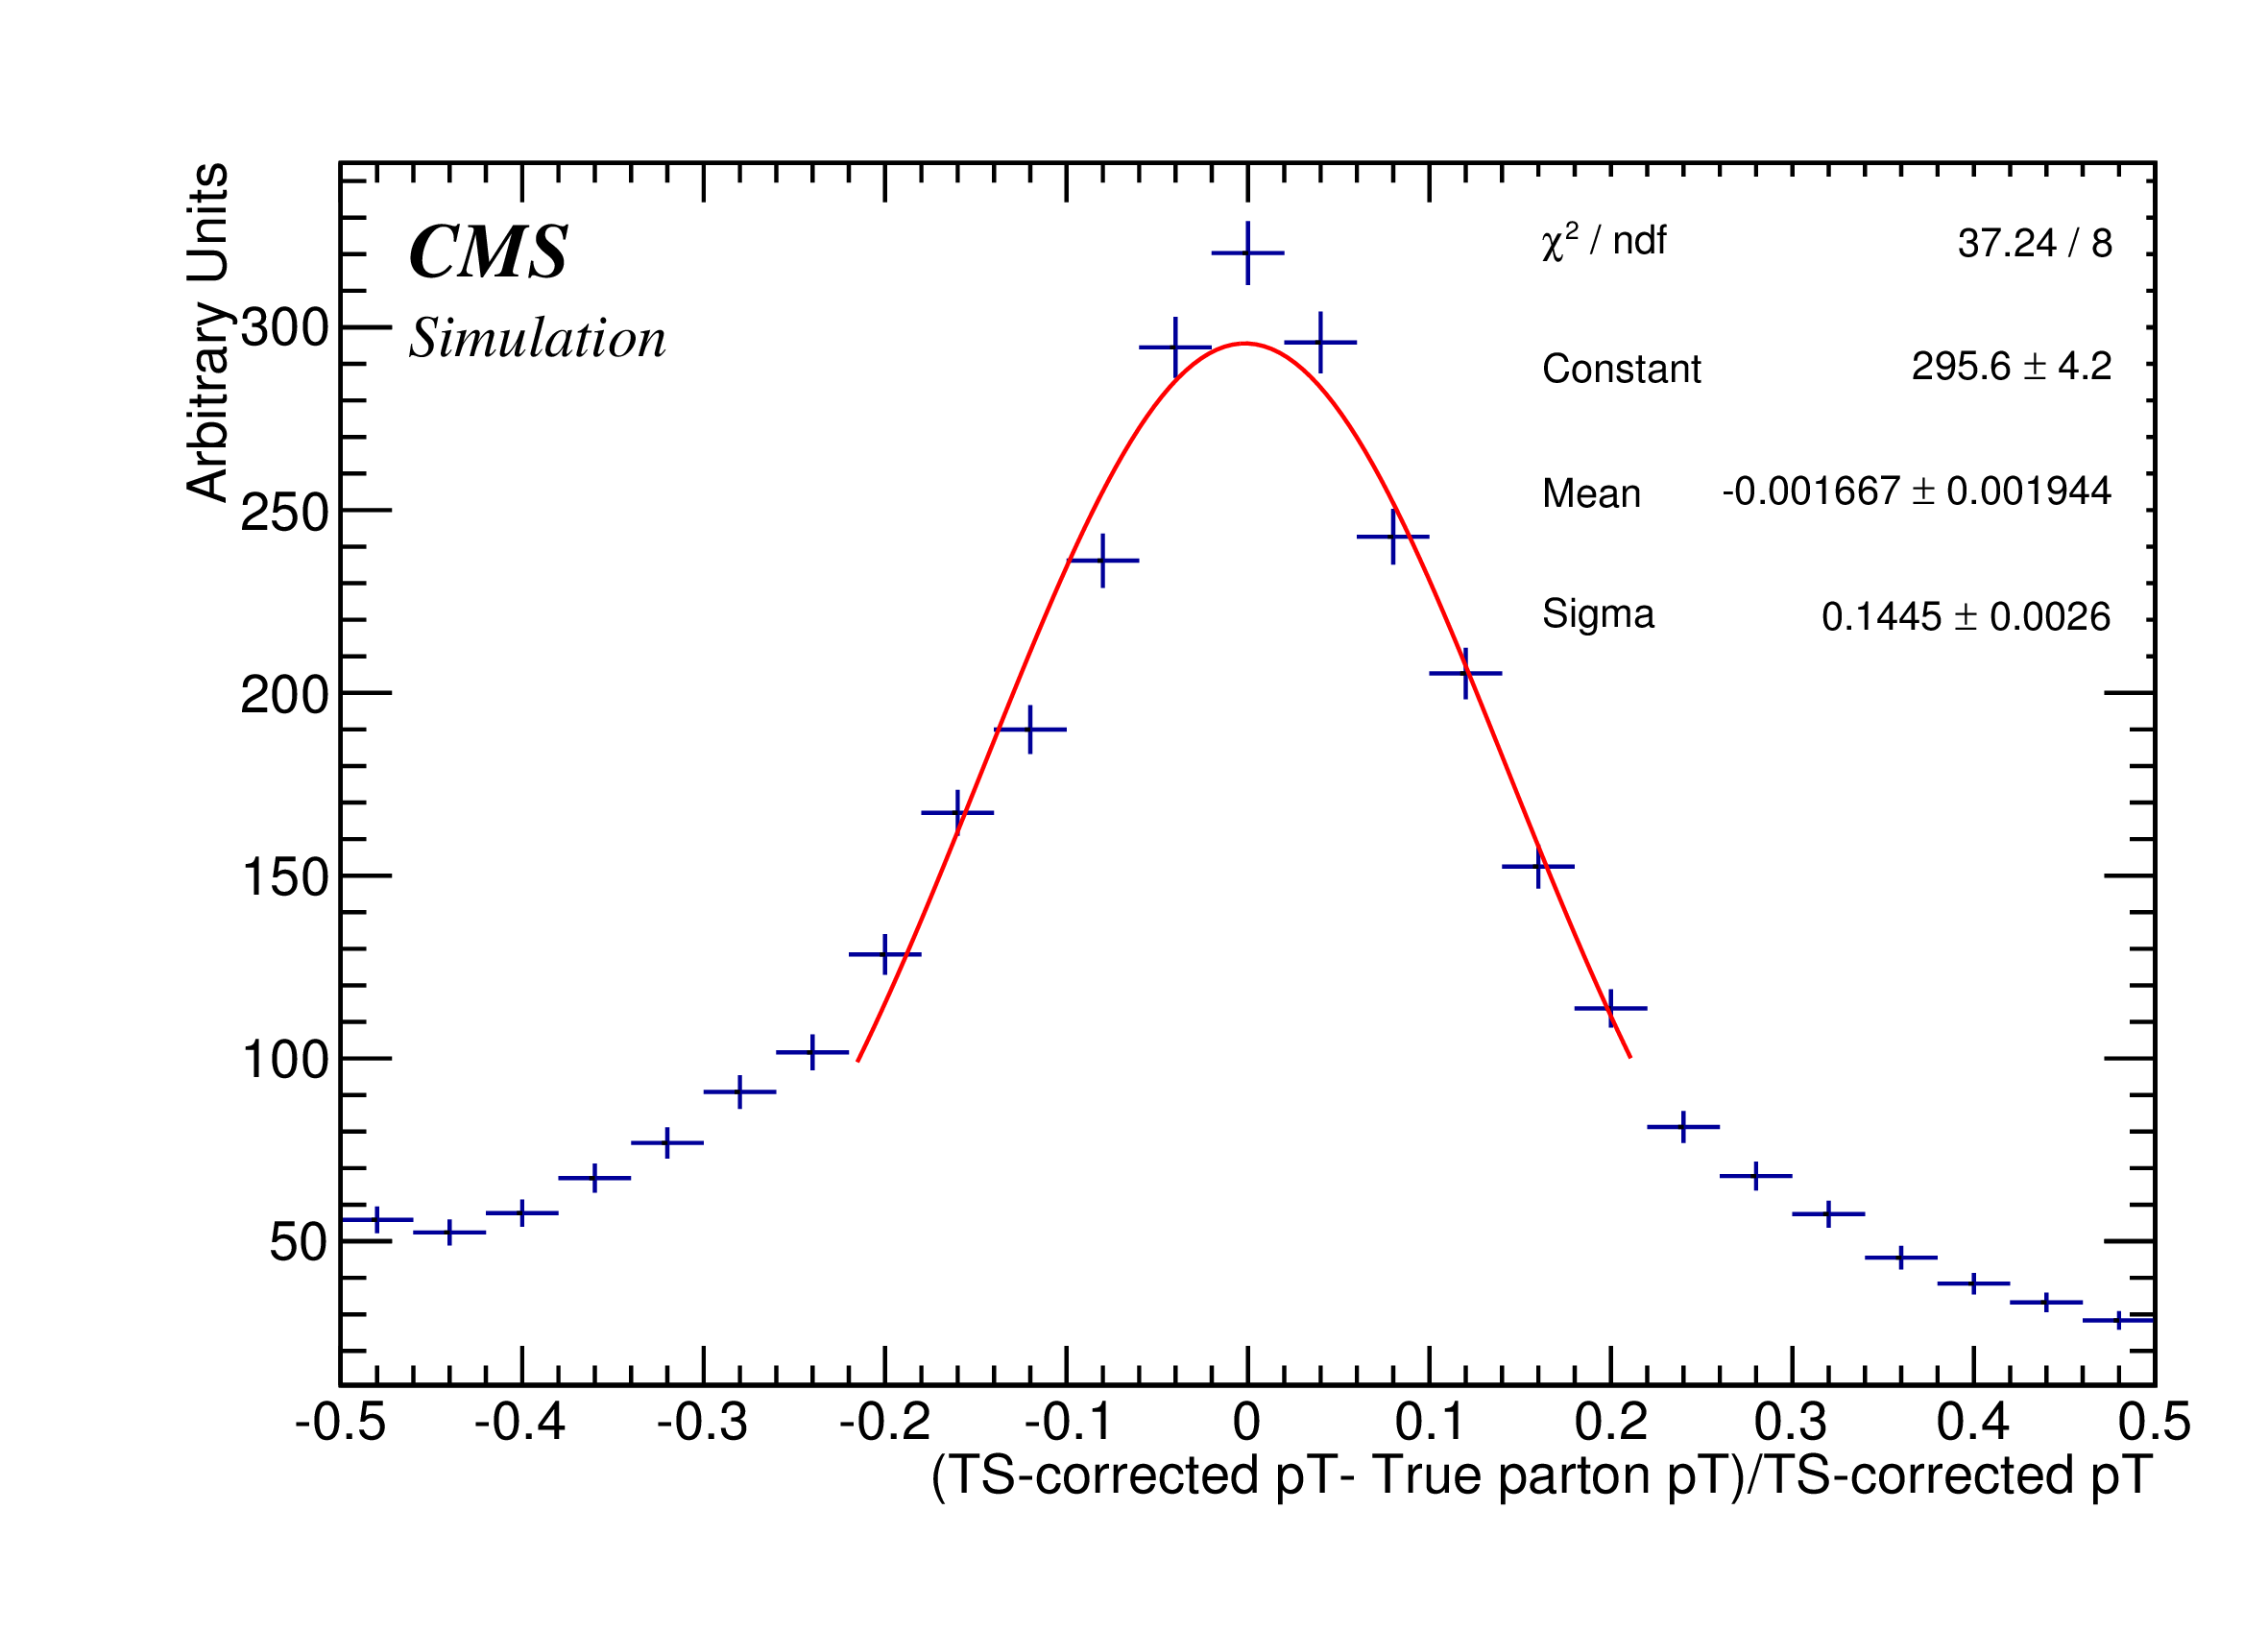
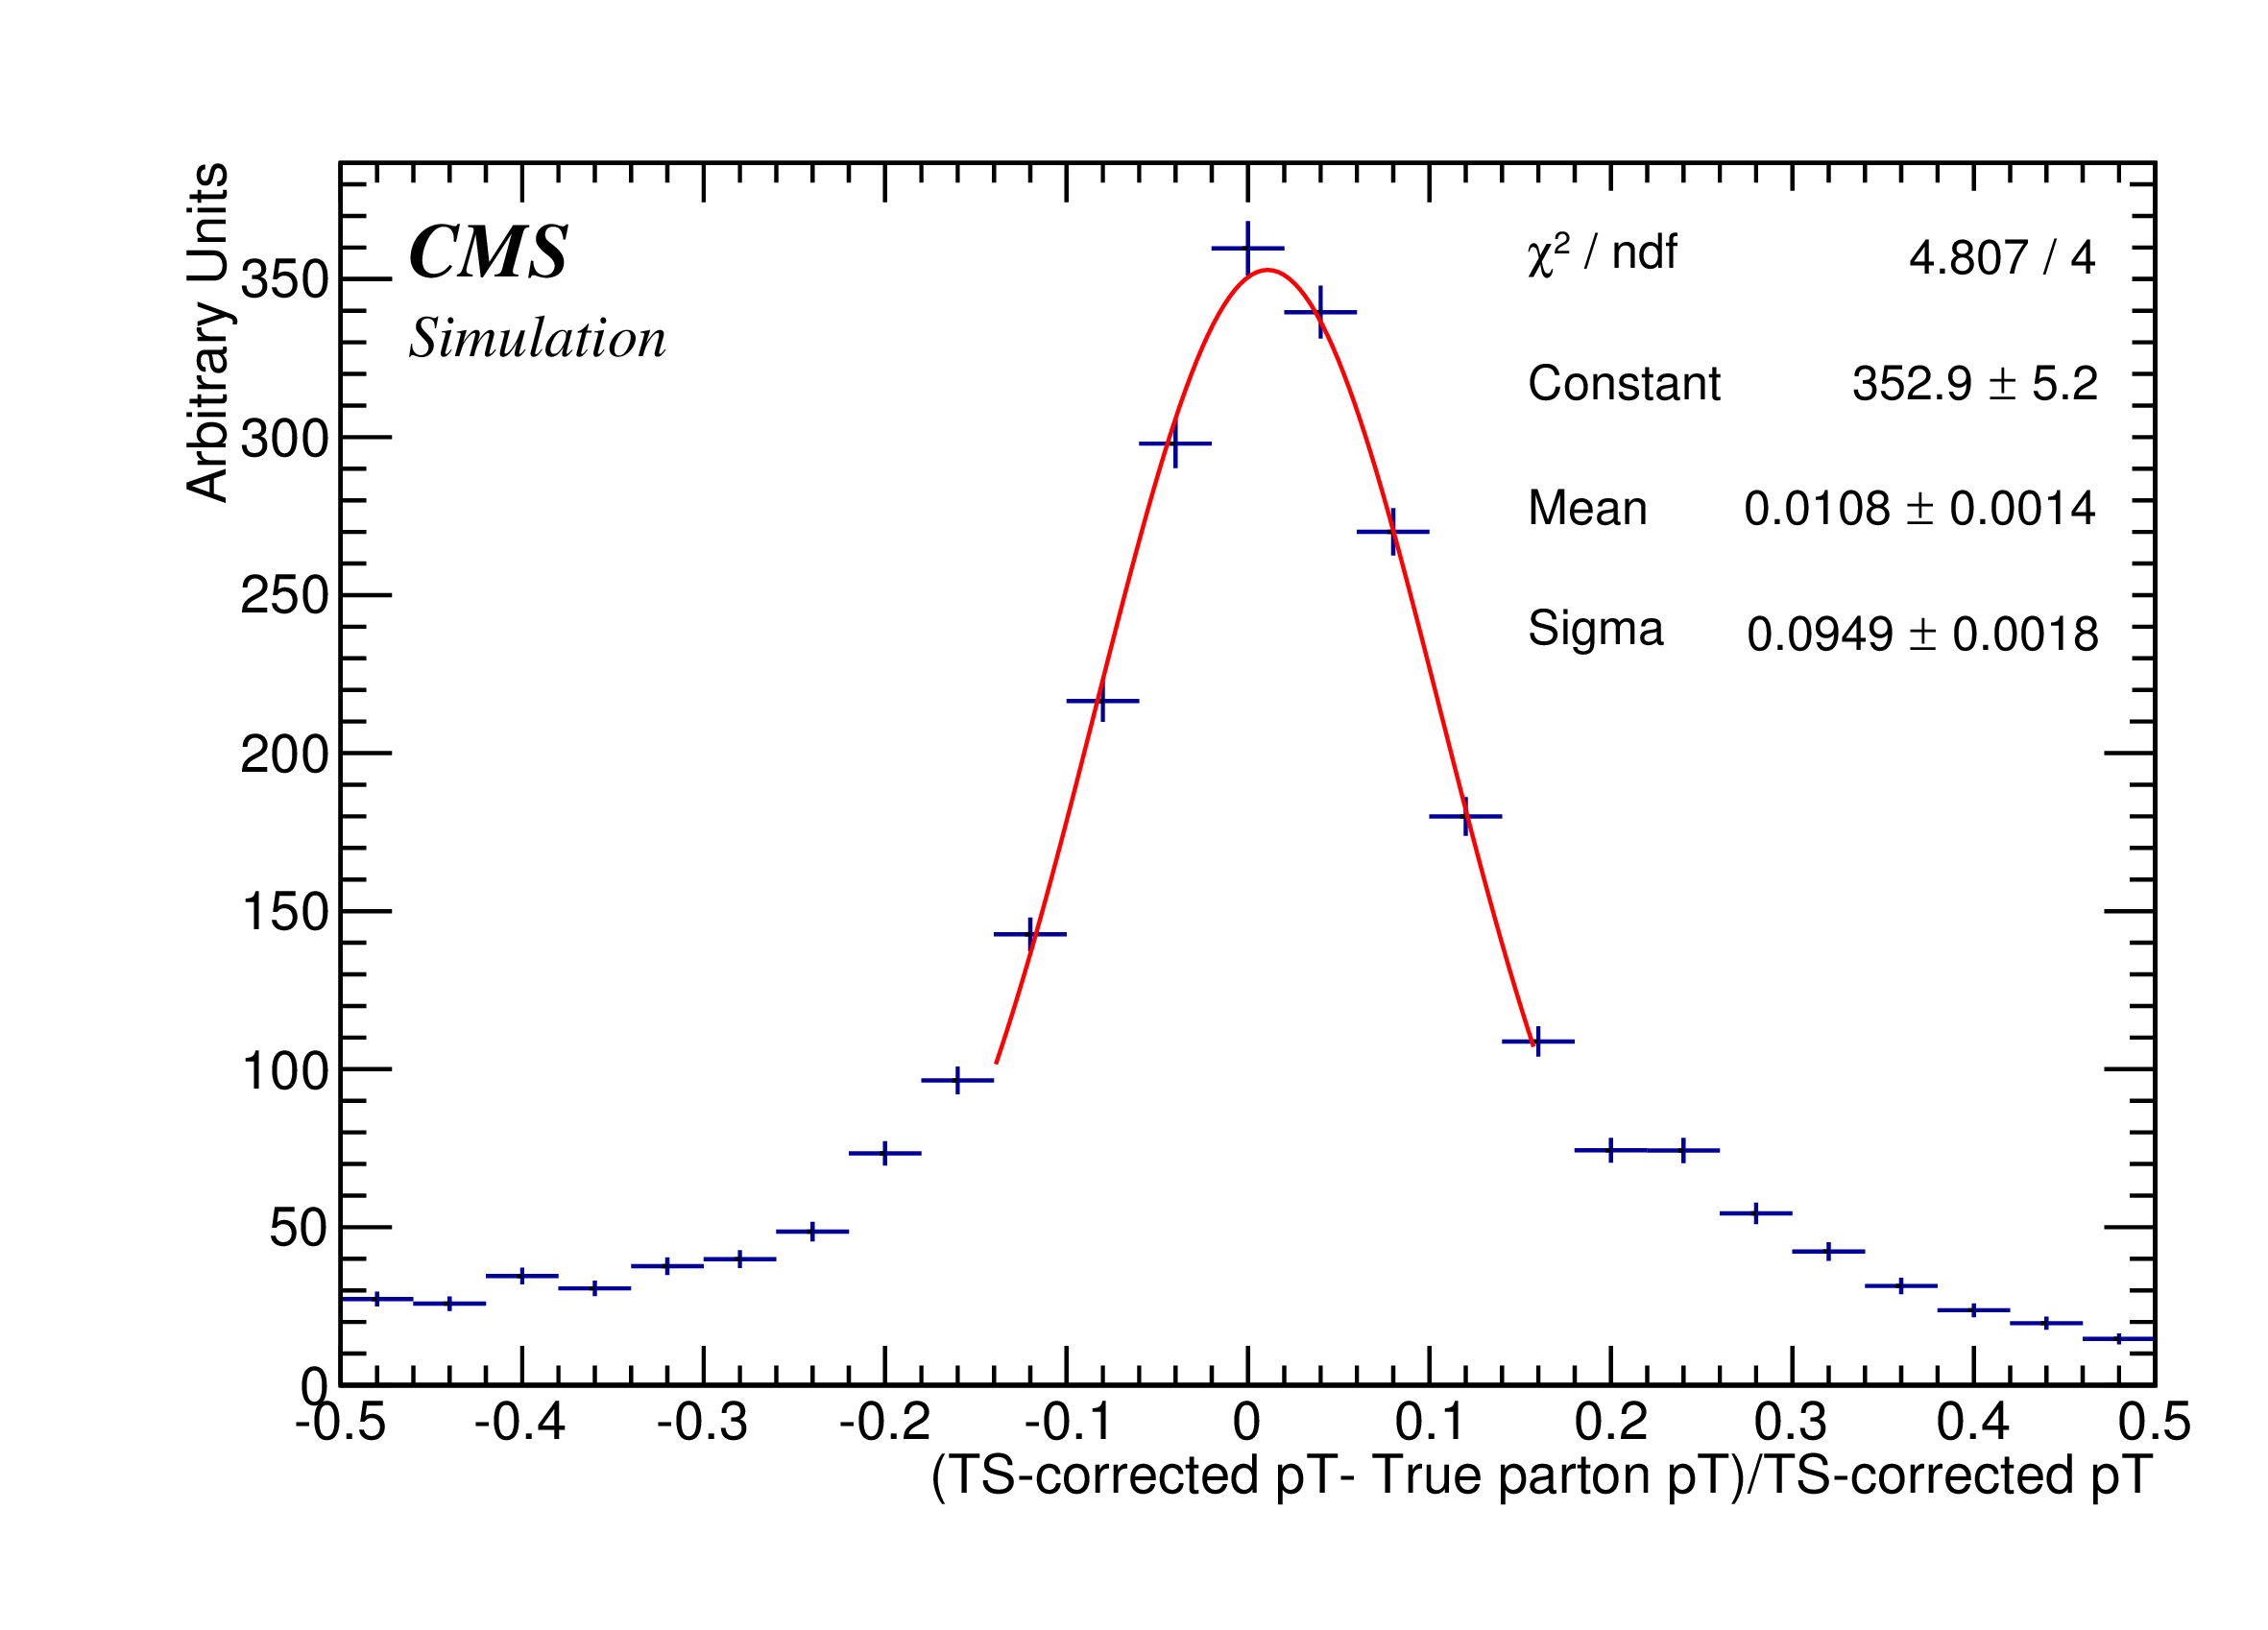
Figure 5-a:
Corrected $ {p_{\mathrm {T}}} $ response distributions for b quark jets for $|\eta | < 0.174$. From (a) to (d), some selected plots for different $ {p_{\mathrm {T}}} $ ranges: (50,60), (70,80), (90,100), and (150,300). |
png pdf |
Figure 5-b:
Corrected $ {p_{\mathrm {T}}} $ response distributions for b quark jets for $|\eta | < 0.174$. From (a) to (d), some selected plots for different $ {p_{\mathrm {T}}} $ ranges: (50,60), (70,80), (90,100), and (150,300). |
png pdf |
Figure 5-c:
Corrected $ {p_{\mathrm {T}}} $ response distributions for b quark jets for $|\eta | < 0.174$. From (a) to (d), some selected plots for different $ {p_{\mathrm {T}}} $ ranges: (50,60), (70,80), (90,100), and (150,300). |
png pdf |
Figure 5-d:
Corrected $ {p_{\mathrm {T}}} $ response distributions for b quark jets for $|\eta | < 0.174$. From (a) to (d), some selected plots for different $ {p_{\mathrm {T}}} $ ranges: (50,60), (70,80), (90,100), and (150,300). |
png pdf |
Figure 7b quark-a:
$ {p_{\mathrm {T}}} $ distribution of the top-b-parton in the hadronic side top quark. The b-quark $ {p_{\mathrm {T}}} $ distribution in the SM ${\mathrm {t}\overline {\mathrm {t}}}$ sample (red) is compared with the $\mathrm{H}^{+}$ signal ${\mathrm {t}\overline {\mathrm {t}}}$ sample with $M(\mathrm{H}^{+}) = $ 90, 100, 110, 120, 130, 140, and 150 GeV. |

png pdf |
Figure 7b quark-b:
$ {p_{\mathrm {T}}} $ distribution of the top-b-parton in the hadronic side top quark. The b-quark $ {p_{\mathrm {T}}} $ distribution in the SM ${\mathrm {t}\overline {\mathrm {t}}}$ sample (red) is compared with the $\mathrm{H}^{+}$ signal ${\mathrm {t}\overline {\mathrm {t}}}$ sample with $M(\mathrm{H}^{+}) = $ 90, 100, 110, 120, 130, 140, and 150 GeV. |

png pdf |
Figure 7b quark-c:
$ {p_{\mathrm {T}}} $ distribution of the top-b-parton in the hadronic side top quark. The b-quark $ {p_{\mathrm {T}}} $ distribution in the SM ${\mathrm {t}\overline {\mathrm {t}}}$ sample (red) is compared with the $\mathrm{H}^{+}$ signal ${\mathrm {t}\overline {\mathrm {t}}}$ sample with $M(\mathrm{H}^{+}) = $ 90, 100, 110, 120, 130, 140, and 150 GeV. |

png pdf |
Figure 7b quark-d:
$ {p_{\mathrm {T}}} $ distribution of the top-b-parton in the hadronic side top quark. The b-quark $ {p_{\mathrm {T}}} $ distribution in the SM ${\mathrm {t}\overline {\mathrm {t}}}$ sample (red) is compared with the $\mathrm{H}^{+}$ signal ${\mathrm {t}\overline {\mathrm {t}}}$ sample with $M(\mathrm{H}^{+}) = $ 90, 100, 110, 120, 130, 140, and 150 GeV. |

png pdf |
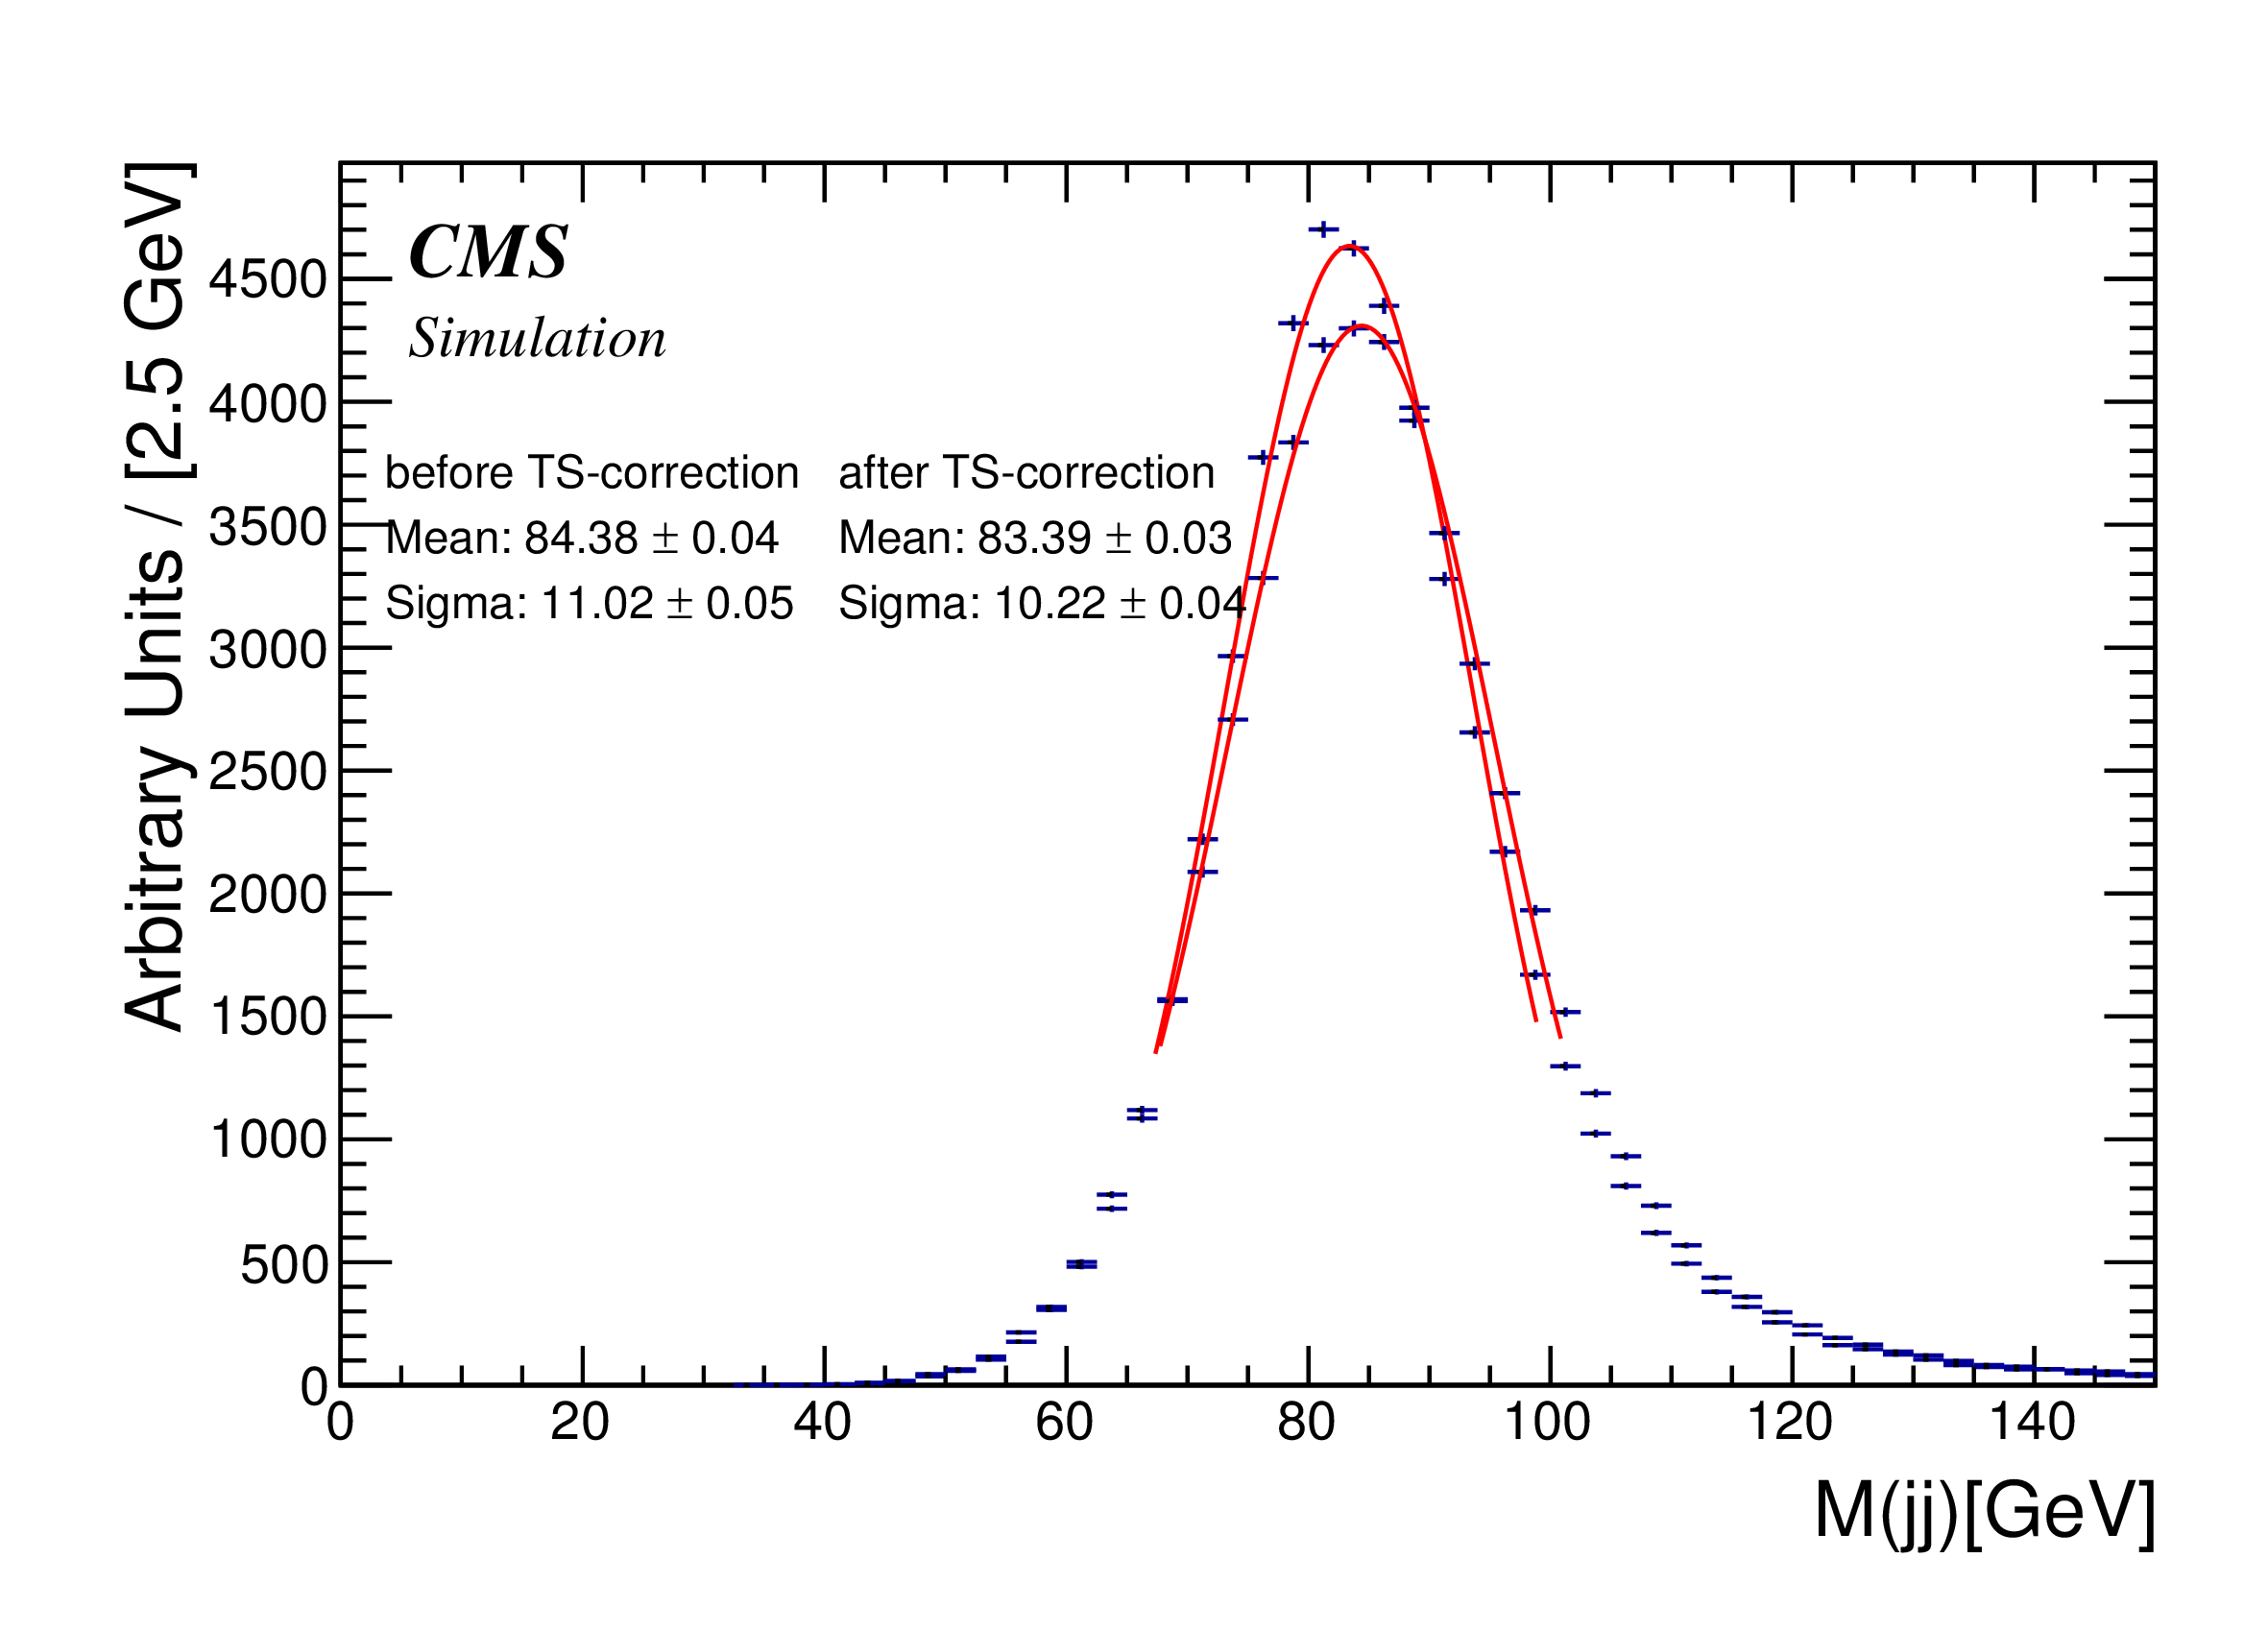
Figure 8-a:
Dijet mass distribution MC background stack in the two b-tagged jets events in e+jets (a) and $ {{\mu }}$+jets (b) channel. Dijet mass distribution of $\mathrm{H}^{+}$ signal sample with $\mathrm{H}^{+}$ mass 110 GeV (140 GeV ) are compared on top of the background stack. |

png pdf |
Figure 8-b:
Dijet mass distribution MC background stack in the two b-tagged jets events in e+jets (a) and $ {{\mu }}$+jets (b) channel. Dijet mass distribution of $\mathrm{H}^{+}$ signal sample with $\mathrm{H}^{+}$ mass 110 GeV (140 GeV ) are compared on top of the background stack. |
png pdf |
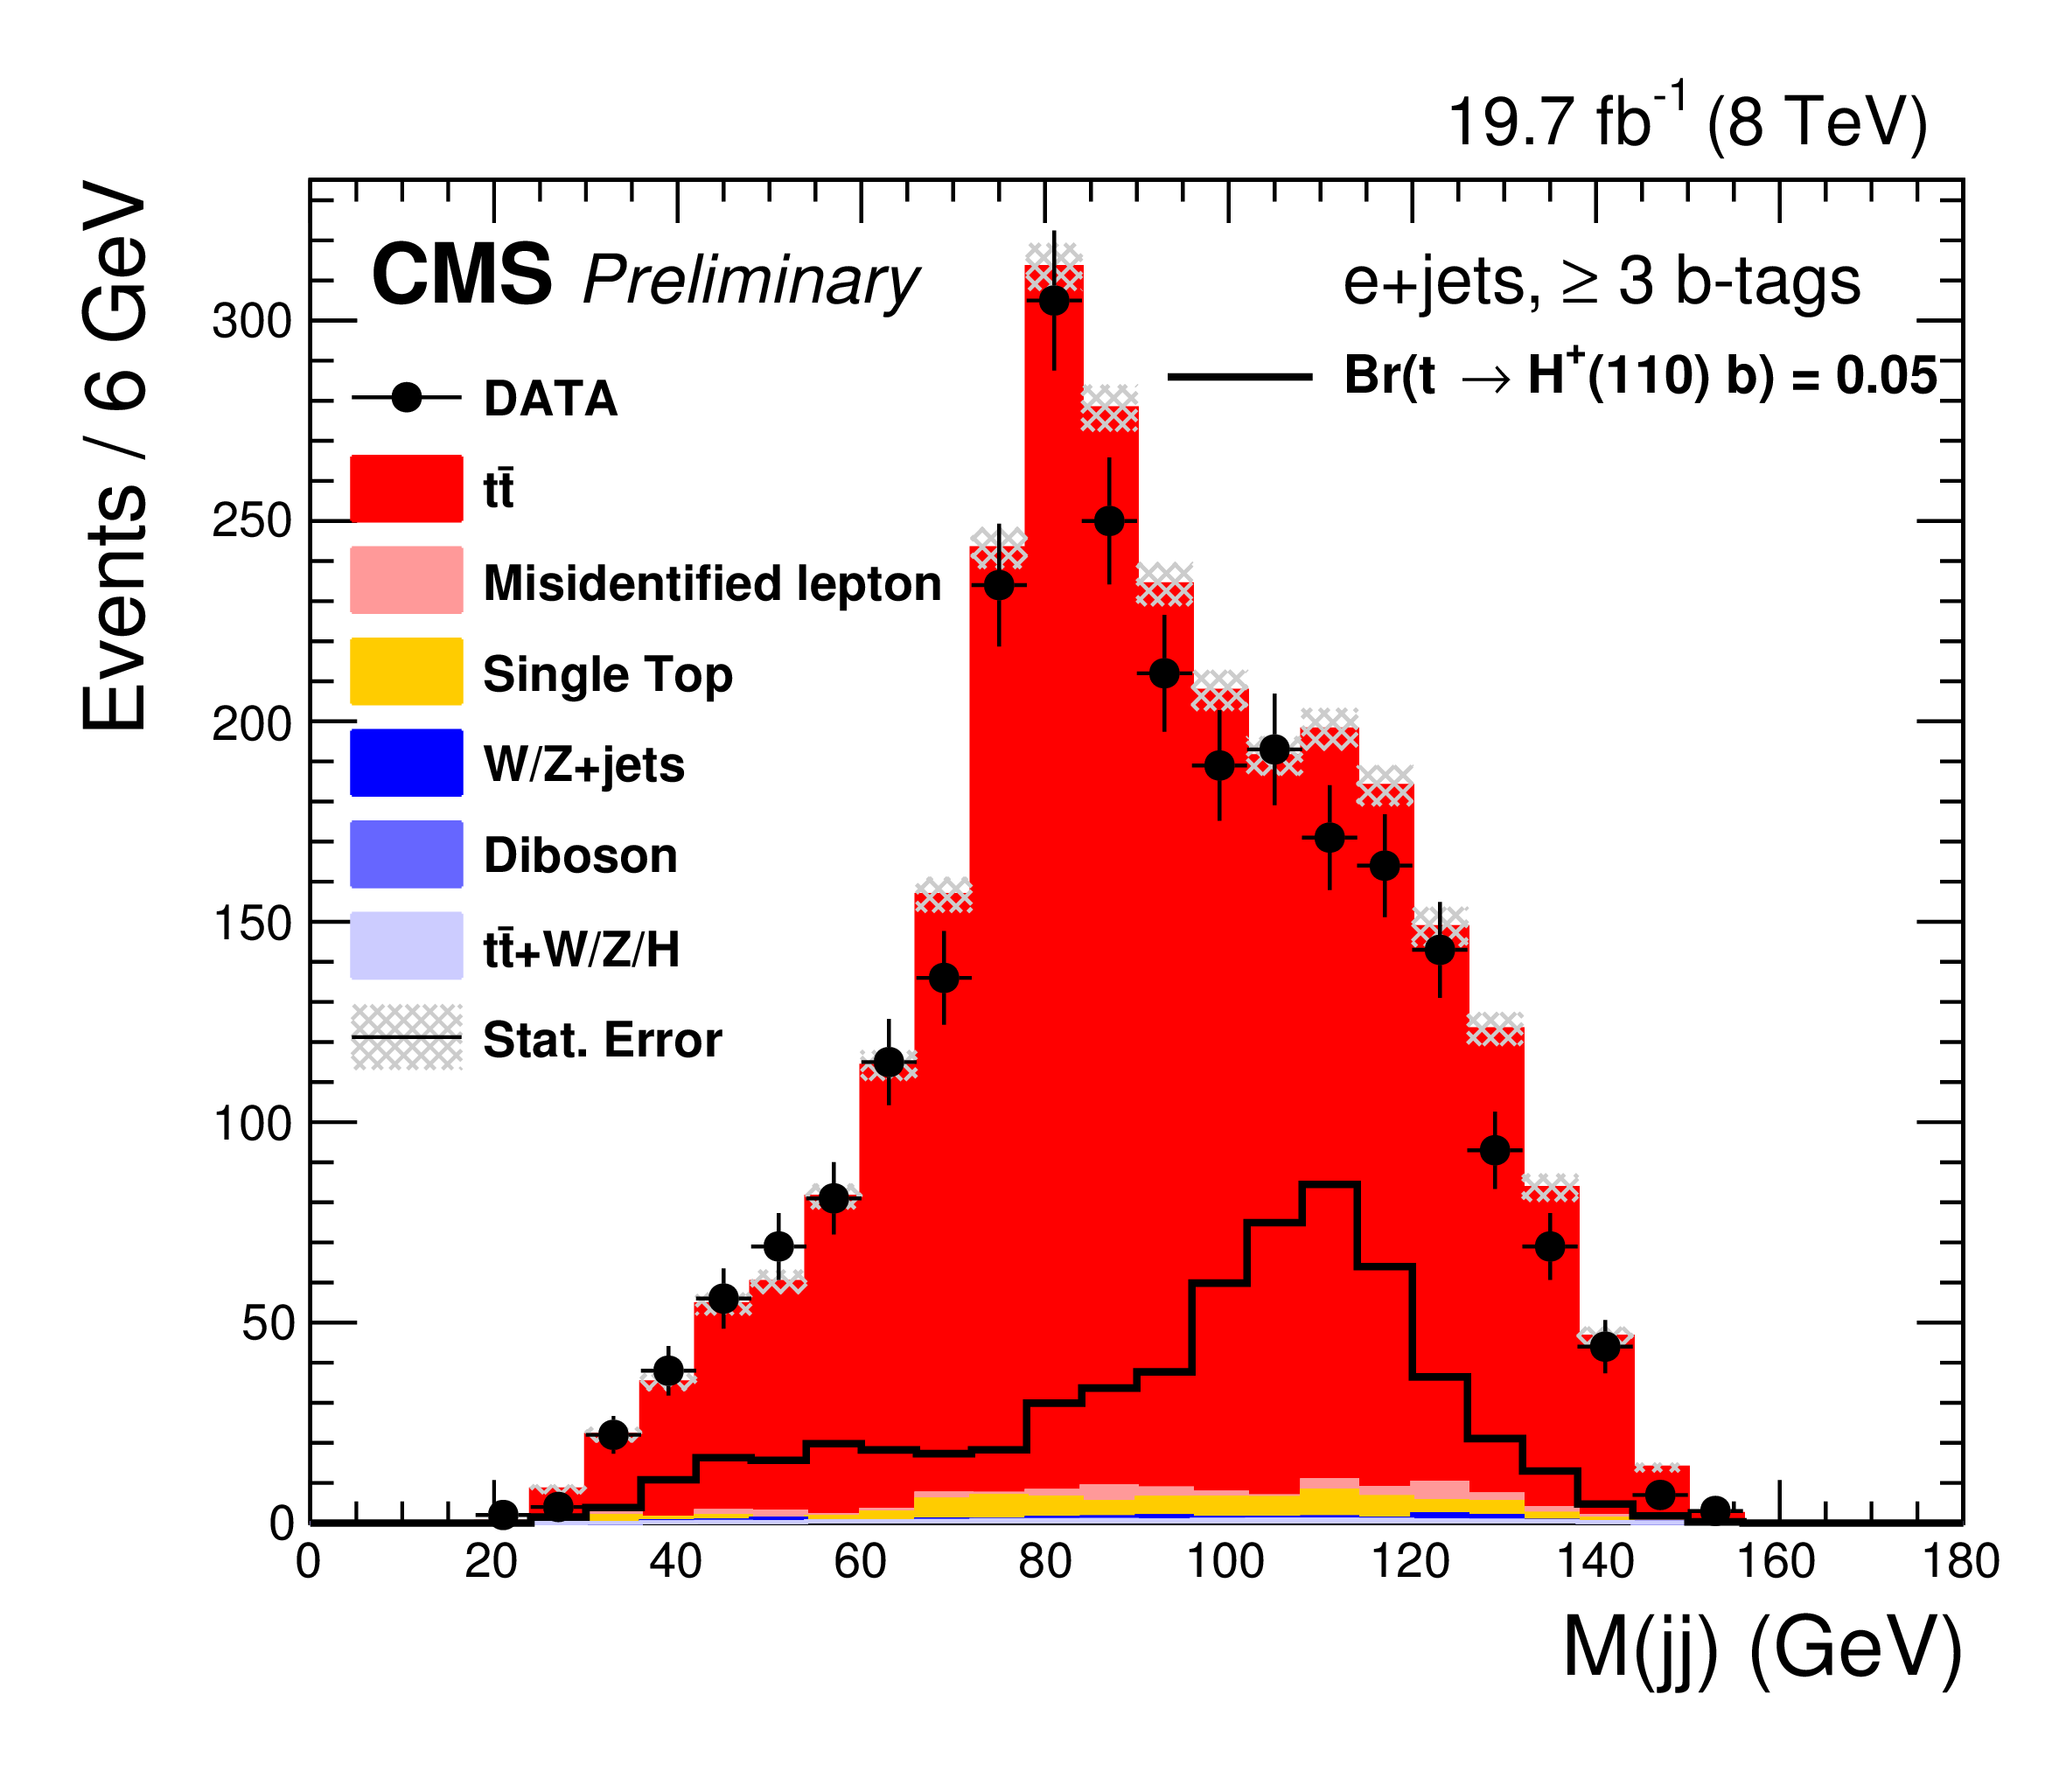
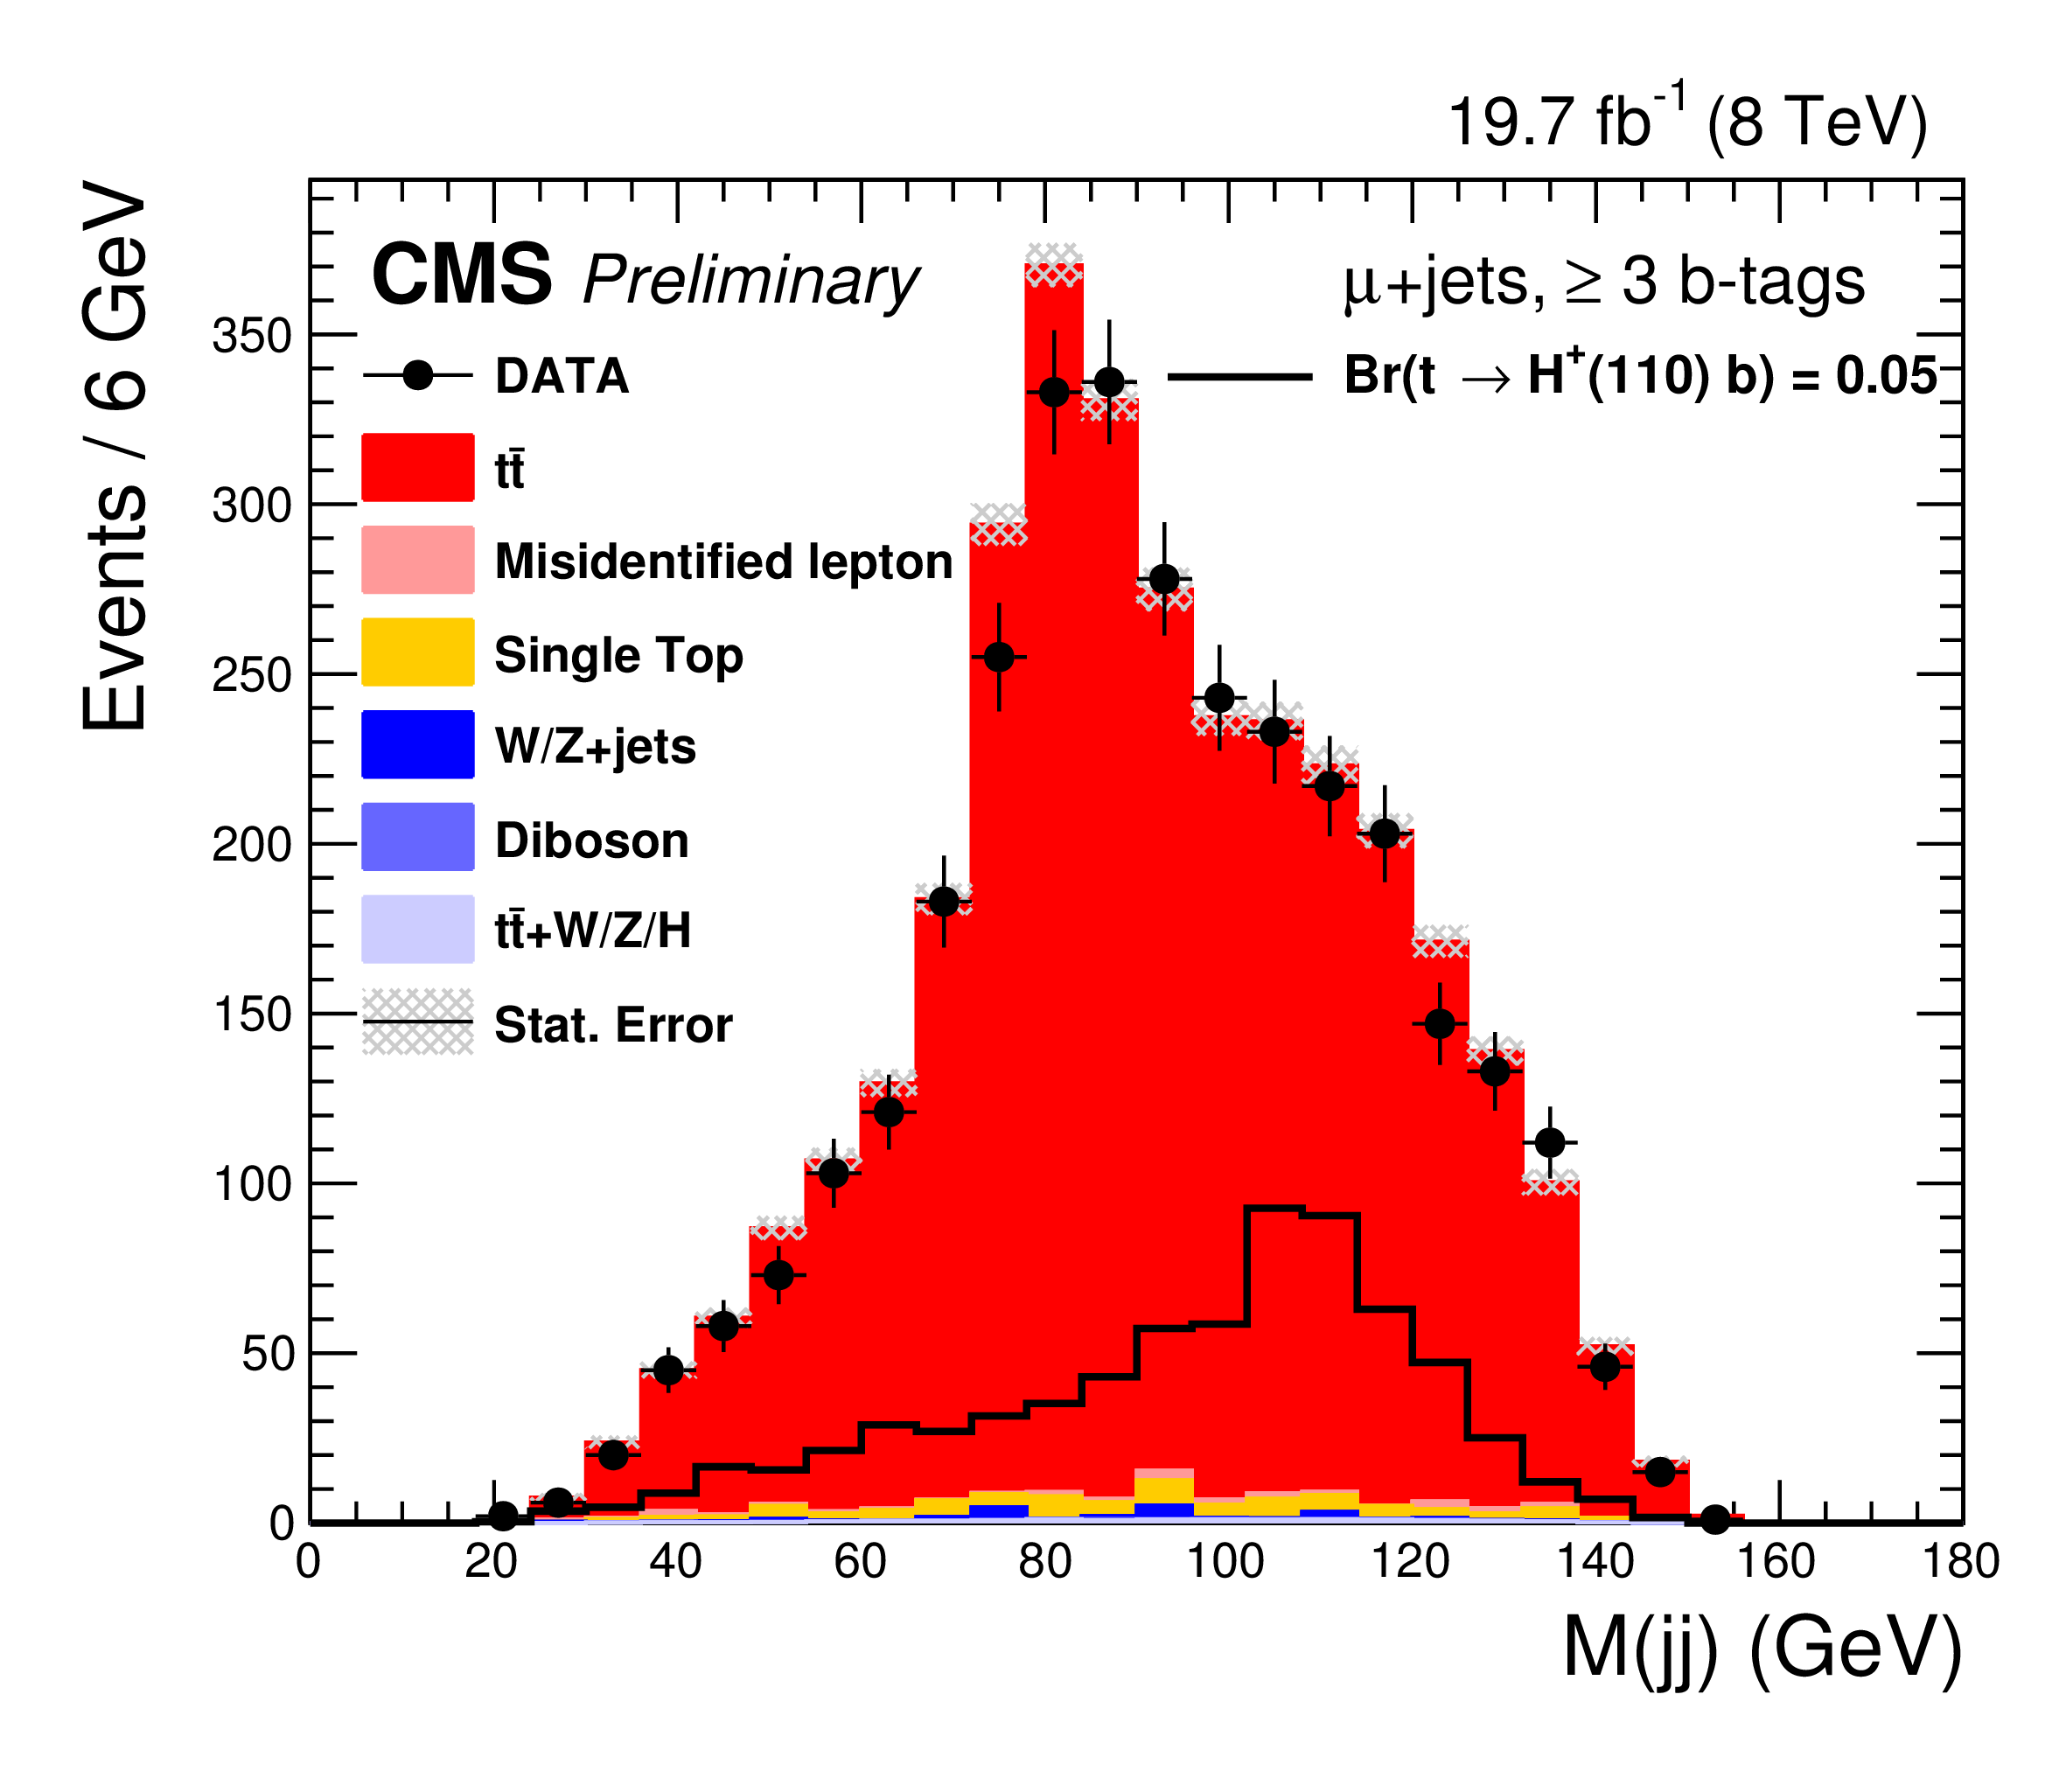
Figure 9-a:
Dijet mass distribution MC background stack in the three b-tagged jets events in e+jets (a) and ${{\mu }}$+jets (b) channel with the normal fitter. Dijet mass distribution of $\mathrm{H}^{+}$ signal sample with $\mathrm{H}^{+}$ mass of 110 GeV is compared on top of the background stack. |
png pdf |
Figure 9-b:
Dijet mass distribution MC background stack in the three b-tagged jets events in e+jets (a) and ${{\mu }}$+jets (b) channel with the normal fitter. Dijet mass distribution of $\mathrm{H}^{+}$ signal sample with $\mathrm{H}^{+}$ mass of 110 GeV is compared on top of the background stack. |
png pdf |
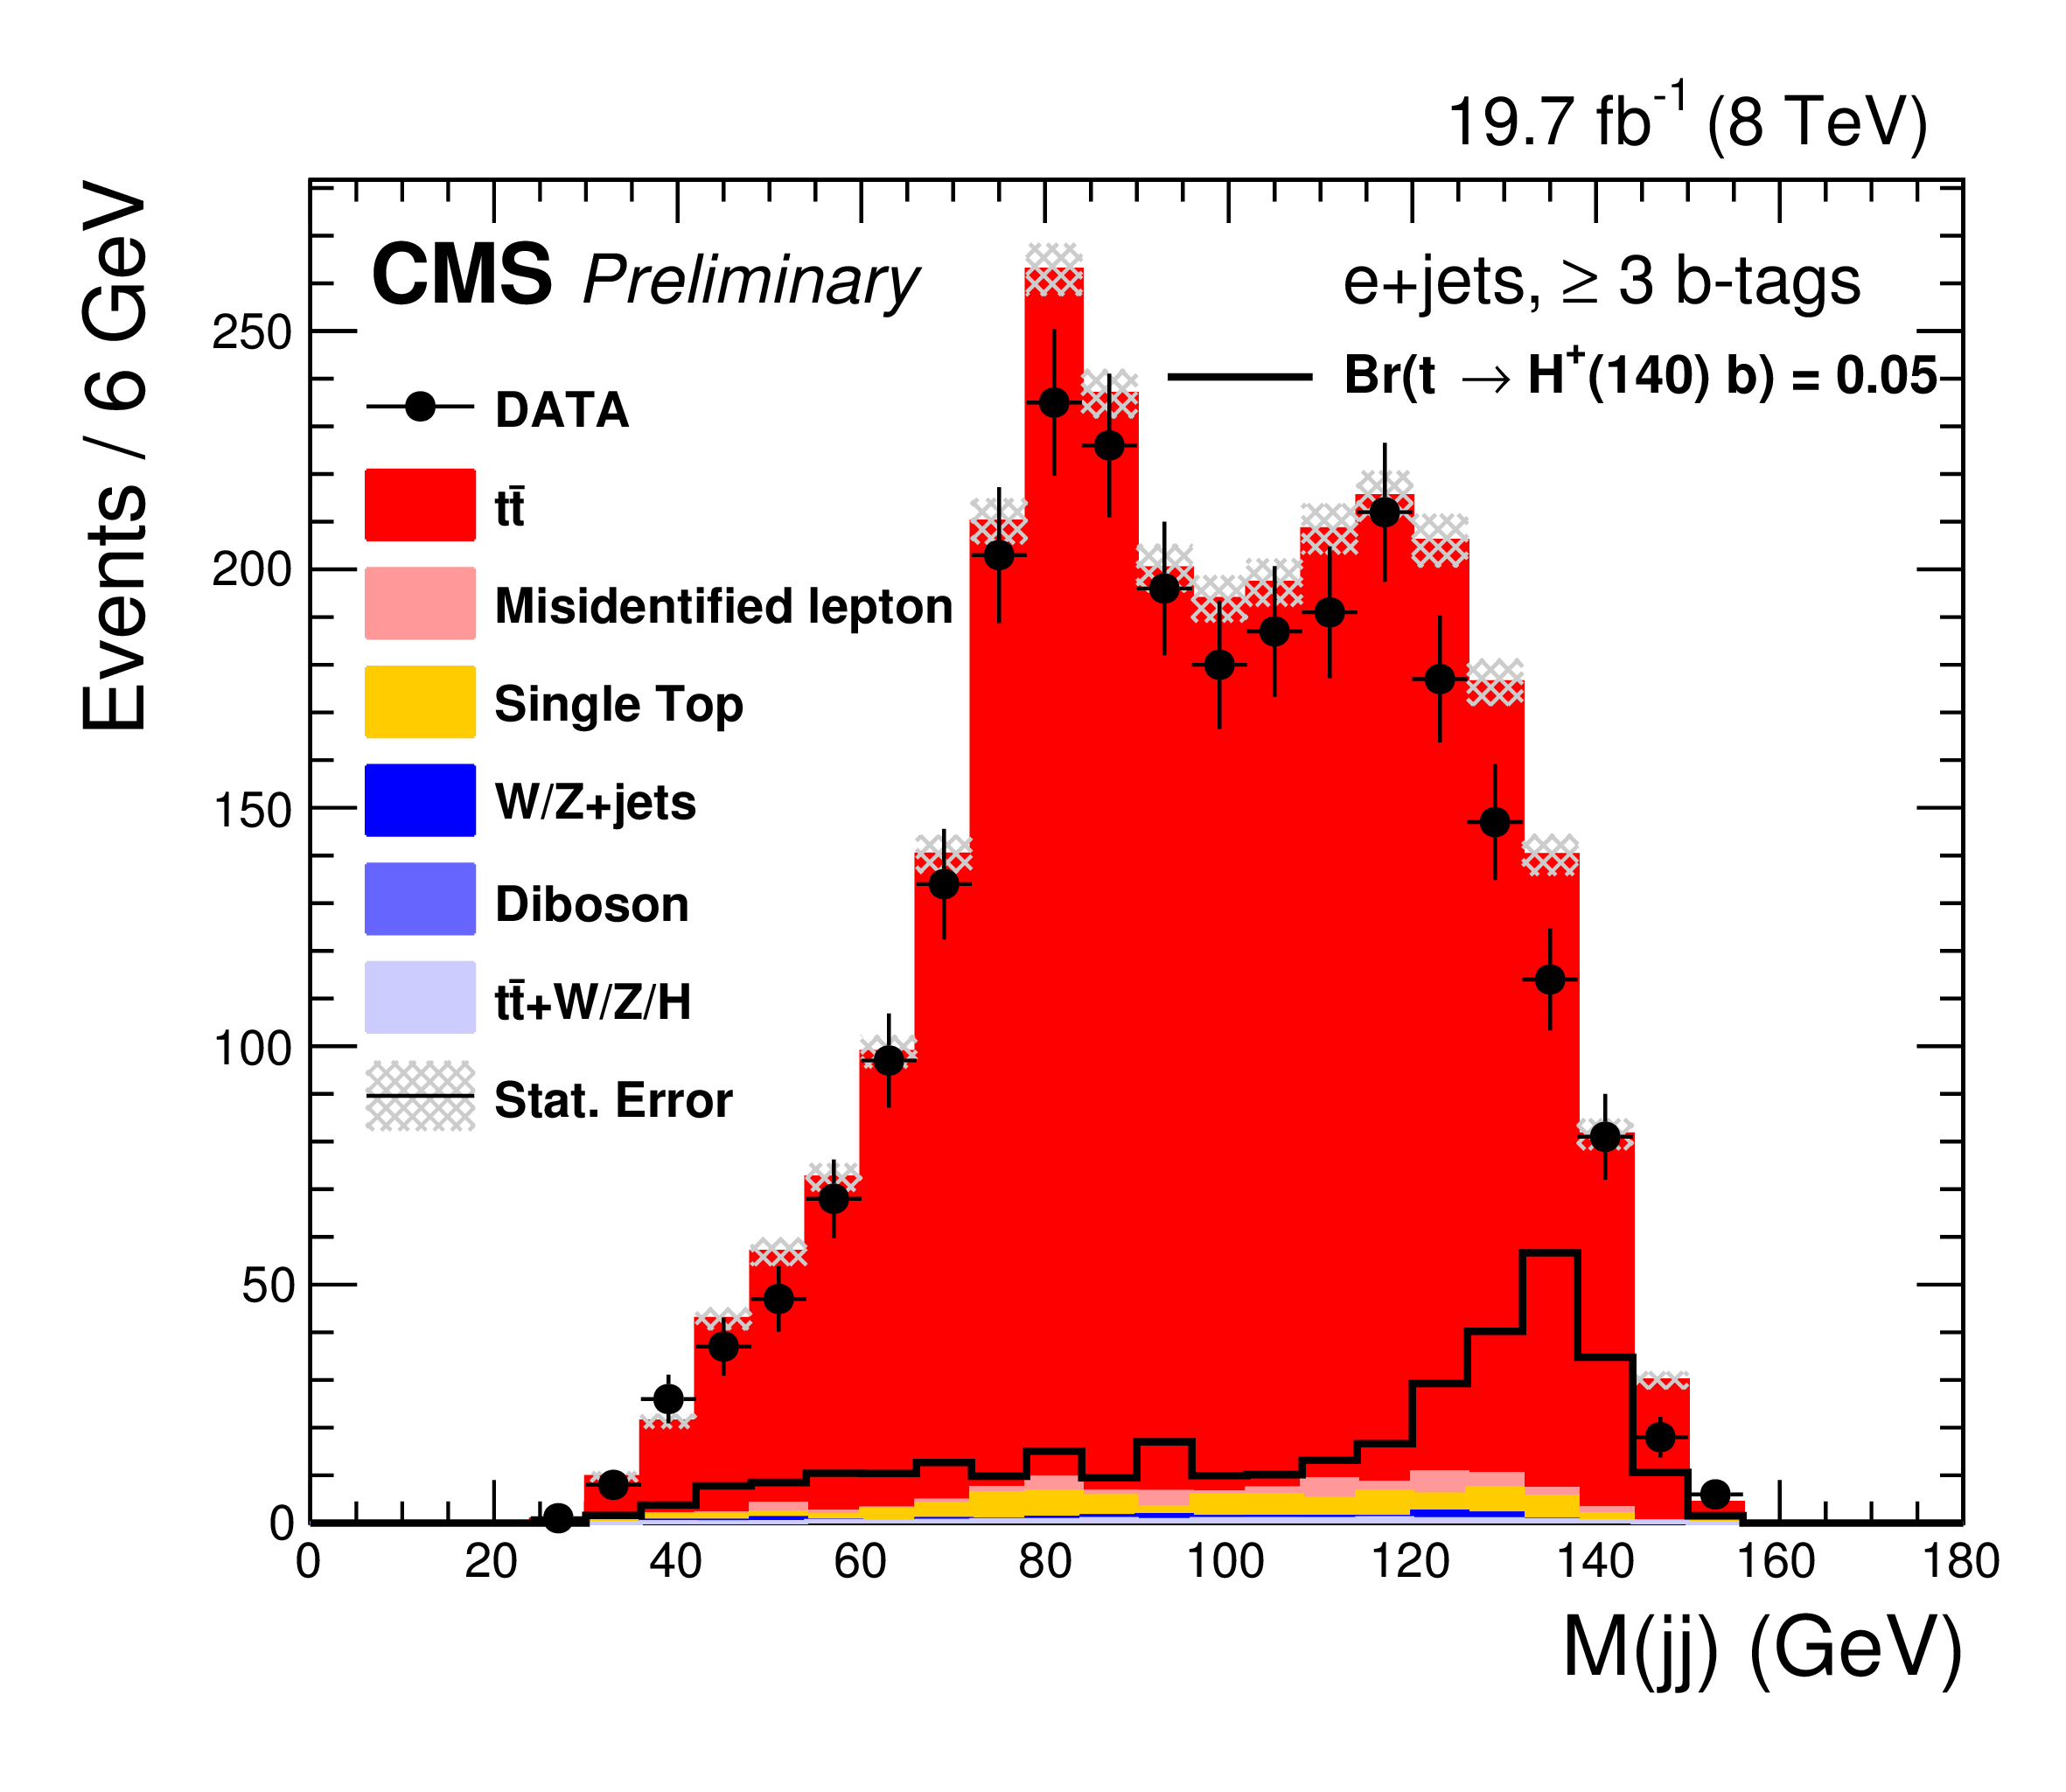
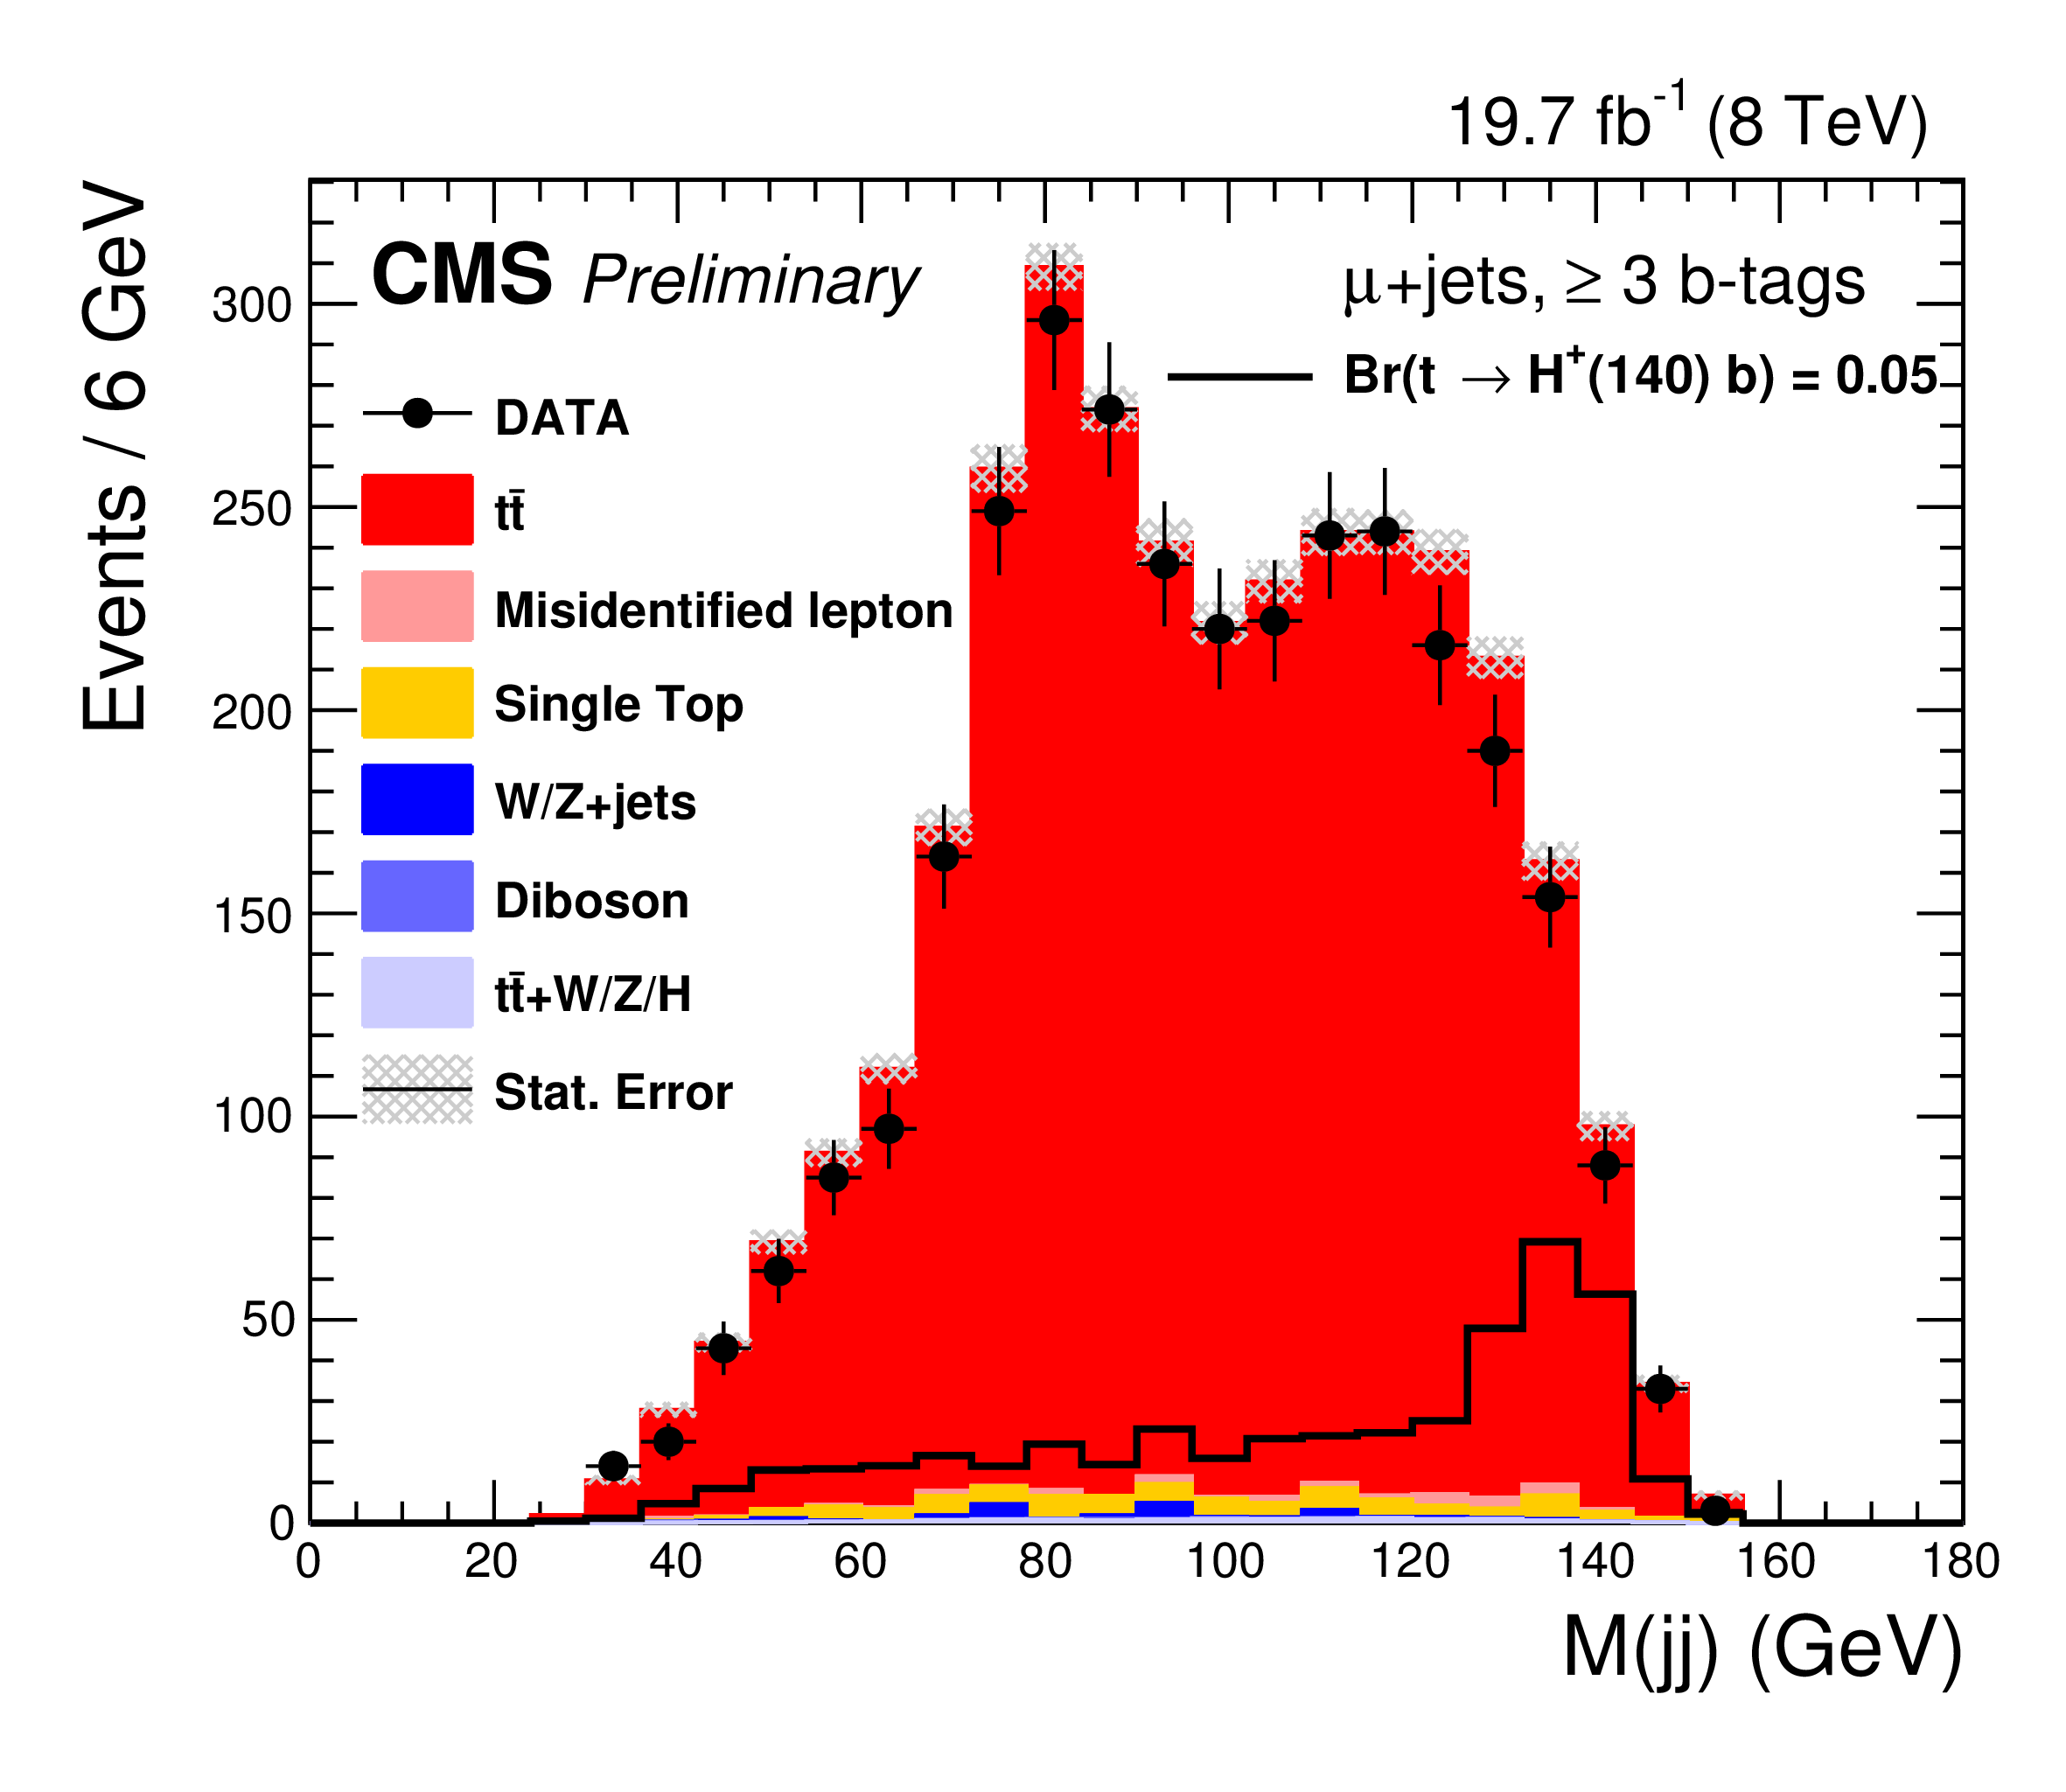
Figure 10-a:
Dijet mass distribution MC background stack in the three b-tagged jets events in e+jets (a) and ${{\mu }}$+jets (b) channel with the high mass fitter. Dijet mass distribution of $\mathrm{H}^{+}$ signal sample with $\mathrm{H}^{+}$ mass 140 GeV is compared on top of the background stack. |
png pdf |
Figure 10-b:
Dijet mass distribution MC background stack in the three b-tagged jets events in e+jets (a) and ${{\mu }}$+jets (b) channel with the high mass fitter. Dijet mass distribution of $\mathrm{H}^{+}$ signal sample with $\mathrm{H}^{+}$ mass 140 GeV is compared on top of the background stack. |

png pdf |
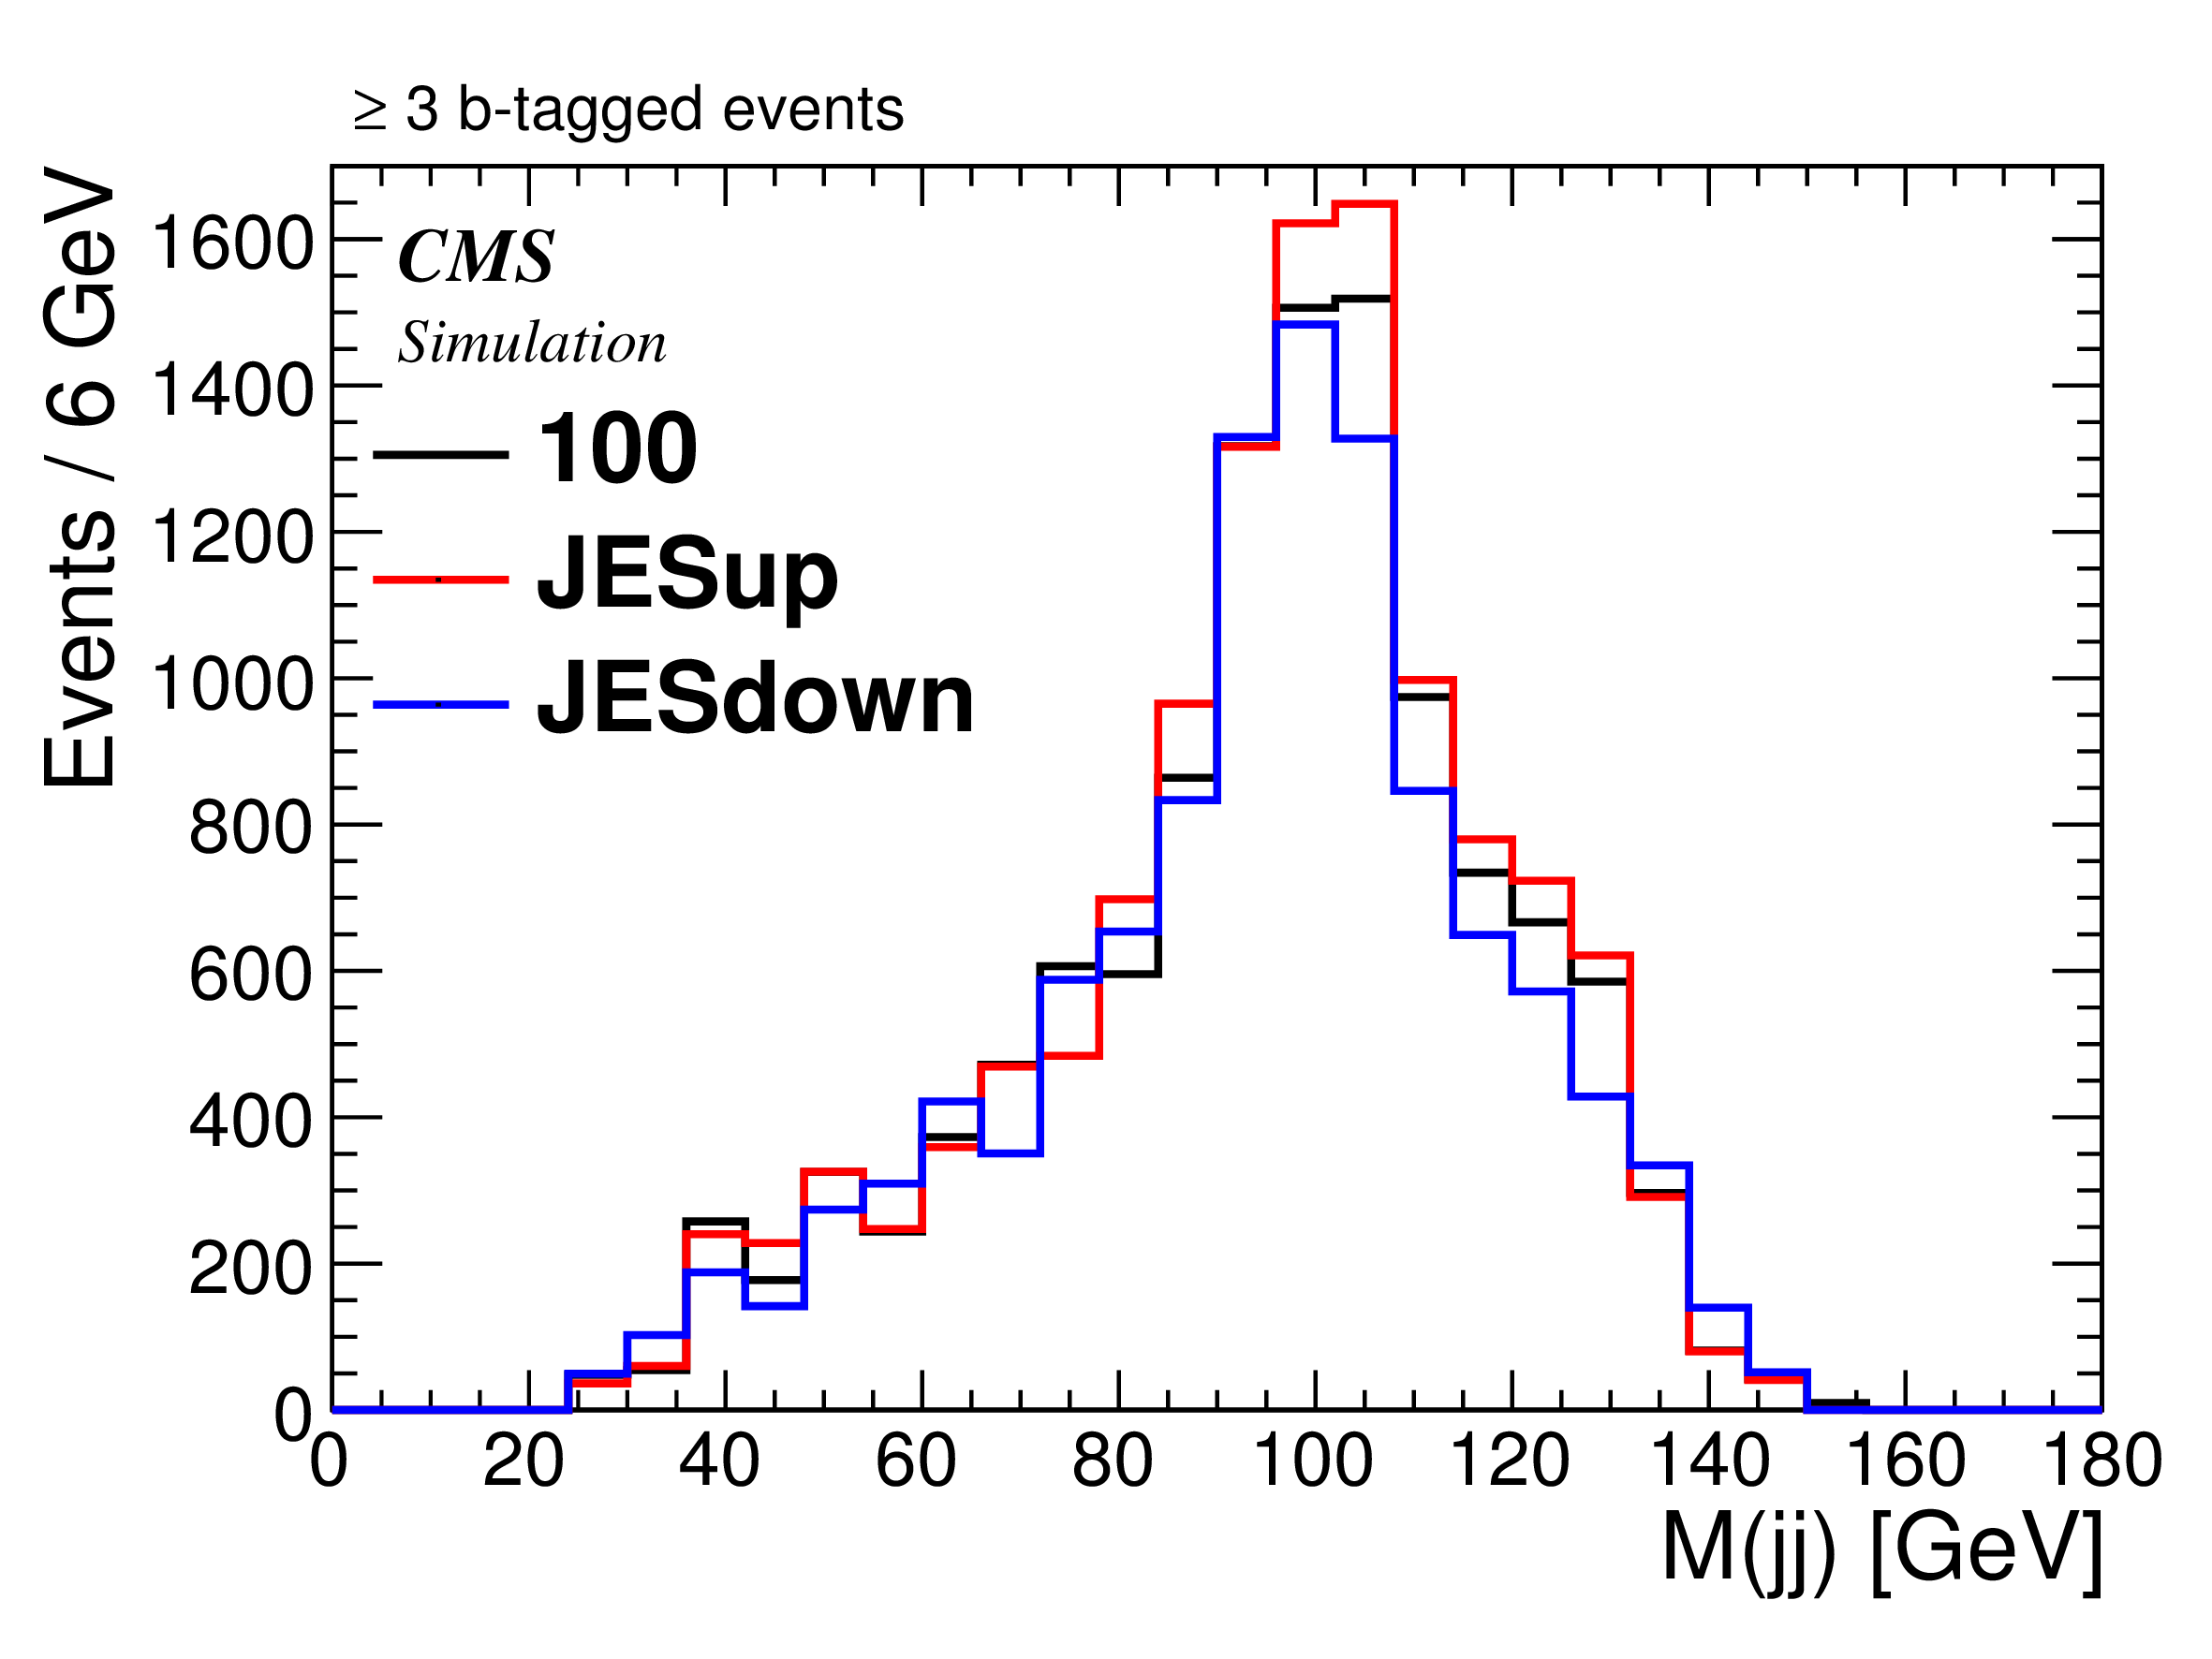
Figure 11-a:
Comparison of dijet mass distribution using low mass fitter for the SM $ {\mathrm {t}\overline {\mathrm {t}}} $ (a) and for charged Higgs boson signal at 100 $ GeV $ (b) in 3 b-tags e+jets channel: shifts due to jet energy scale: ${\mathrm {t}\overline {\mathrm {t}}}$ (a), signal (b), ${\mathrm {t}\overline {\mathrm {t}}}$ MC generator (c). |
png pdf |
Figure 11-b:
Comparison of dijet mass distribution using low mass fitter for the SM $ {\mathrm {t}\overline {\mathrm {t}}} $ (a) and for charged Higgs boson signal at 100 $ GeV $ (b) in 3 b-tags e+jets channel: shifts due to jet energy scale: ${\mathrm {t}\overline {\mathrm {t}}}$ (a), signal (b), ${\mathrm {t}\overline {\mathrm {t}}}$ MC generator (c). |

png pdf |
Figure 11-c:
Comparison of dijet mass distribution using low mass fitter for the SM $ {\mathrm {t}\overline {\mathrm {t}}} $ (a) and for charged Higgs boson signal at 100 $ GeV $ (b) in 3 b-tags e+jets channel: shifts due to jet energy scale: ${\mathrm {t}\overline {\mathrm {t}}}$ (a), signal (b), ${\mathrm {t}\overline {\mathrm {t}}}$ MC generator (c). |
png pdf |
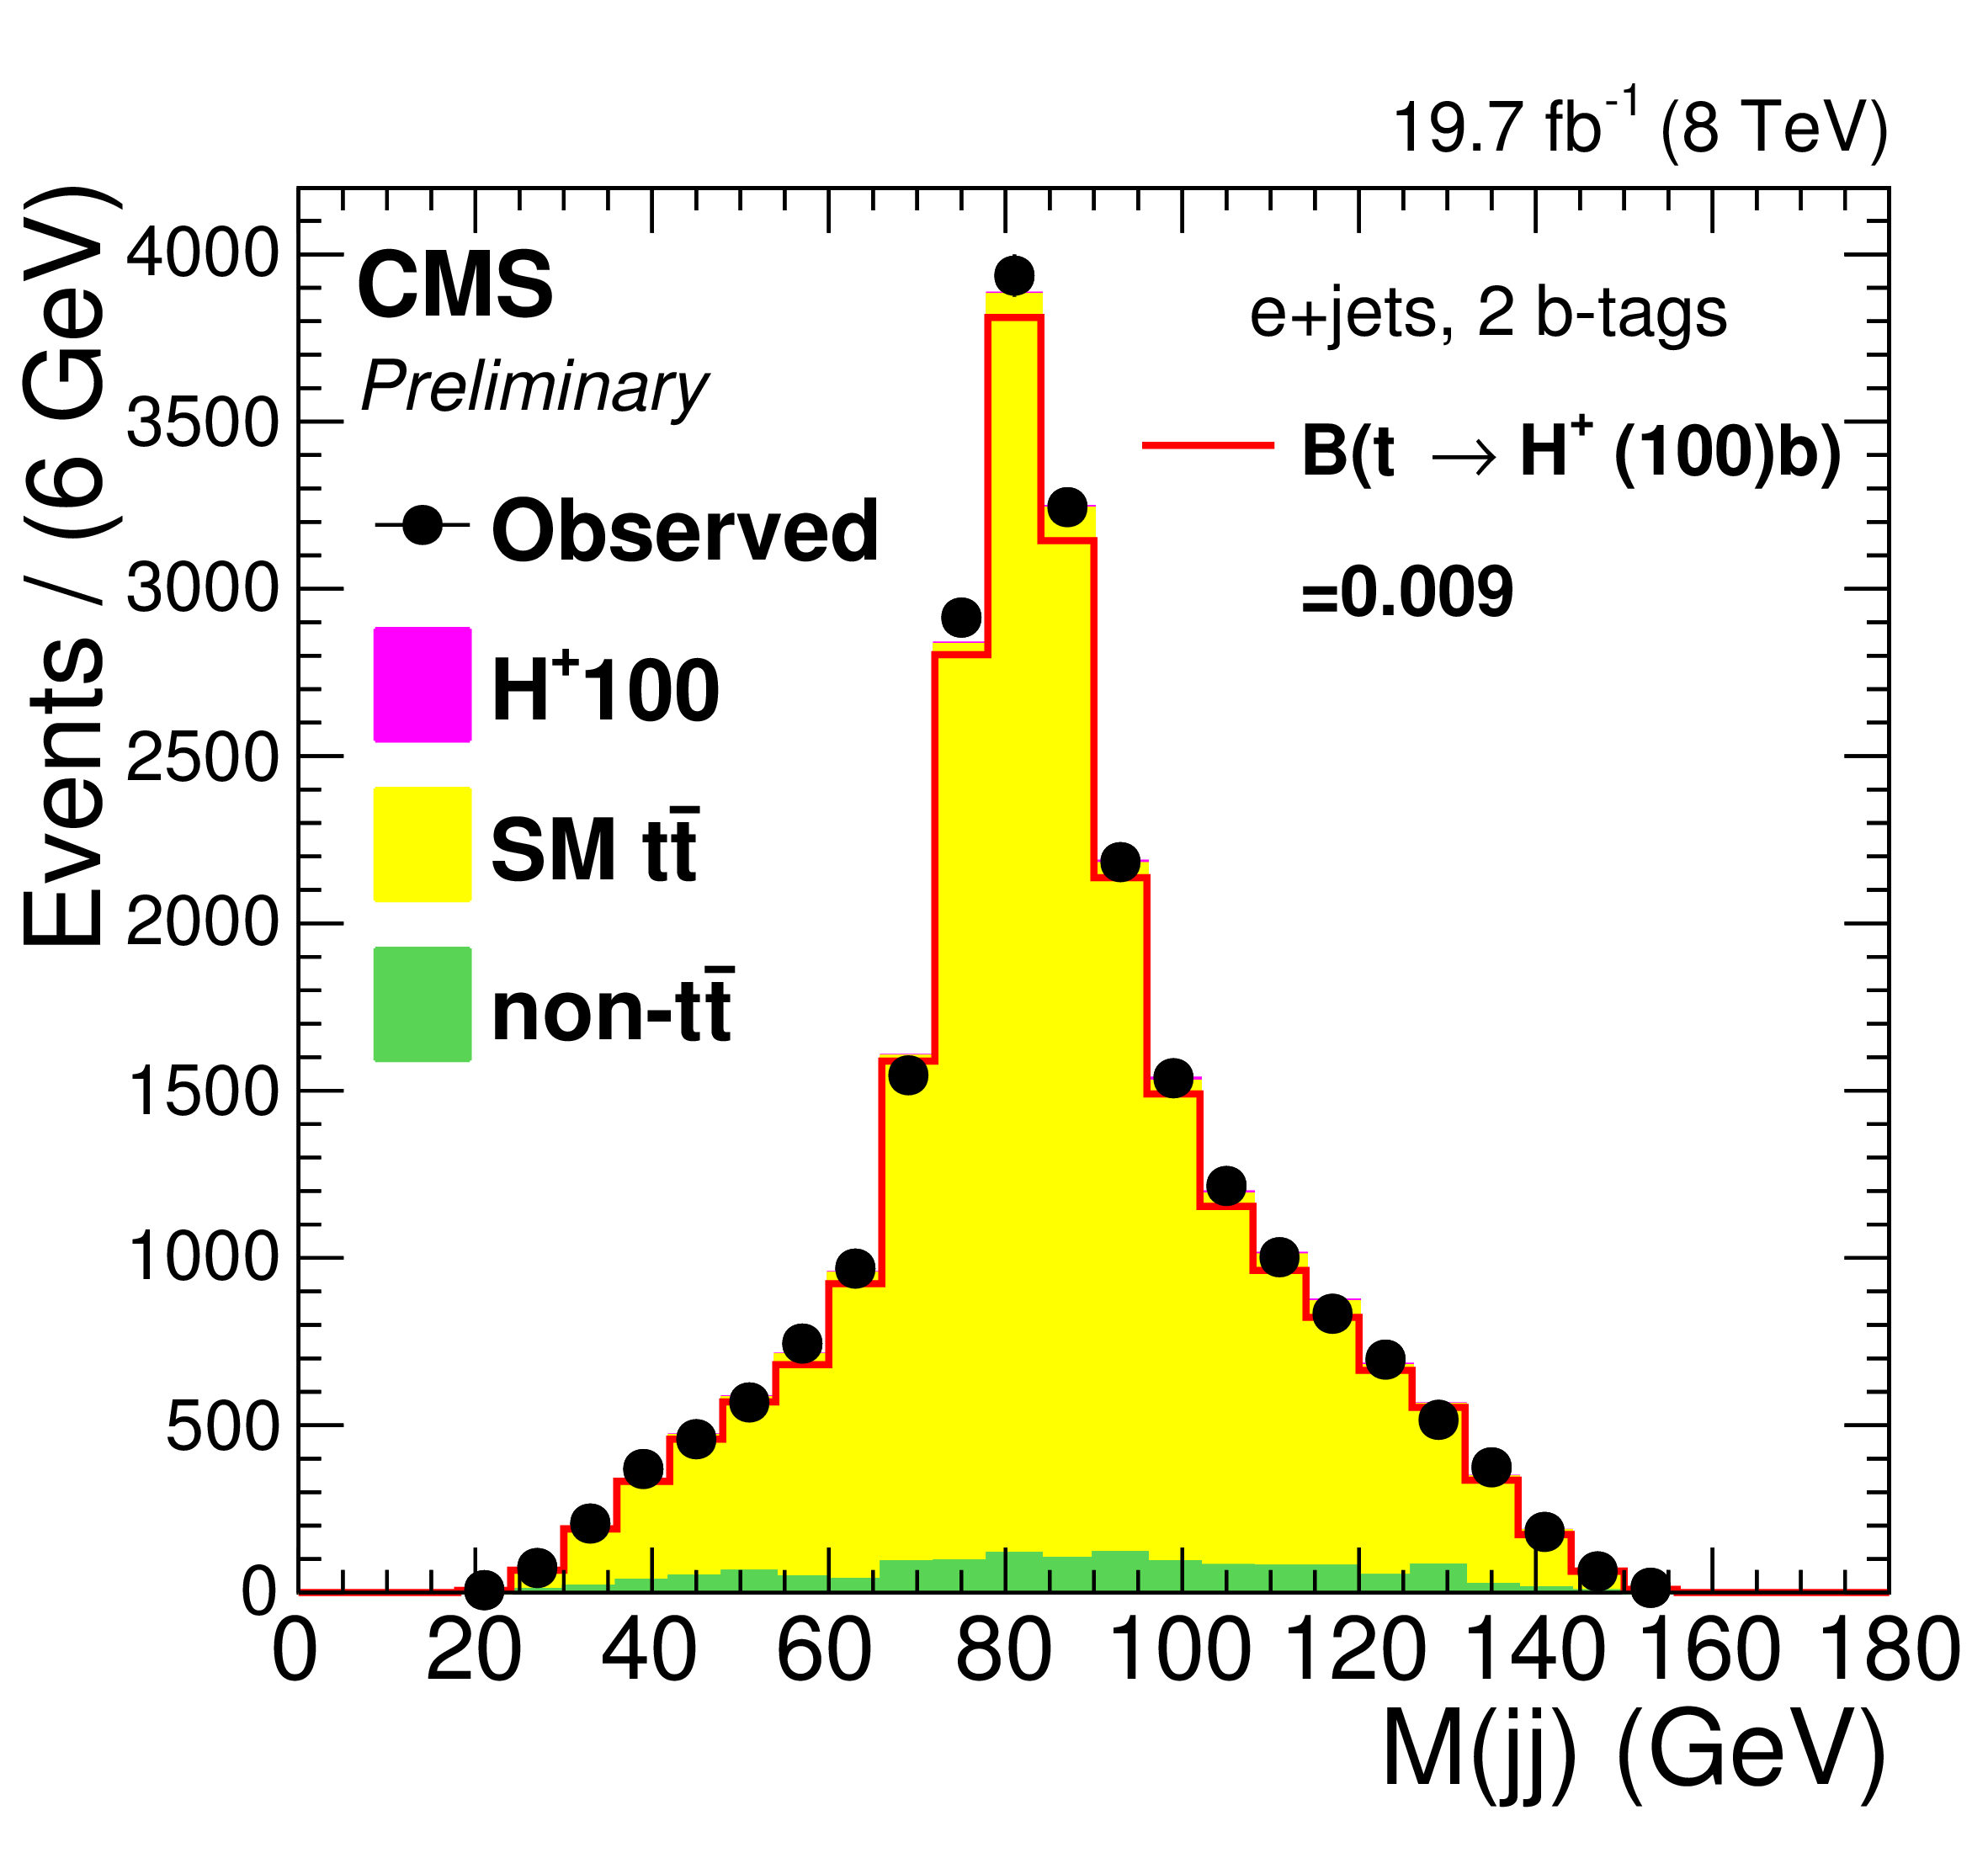
Figure 12-a:
Dijet mass distribution MC stack in the two b-tagged jets events are fitted on the observed data by maximum likelihood fit in e+jets (a) and $ {{\mu }}$+jets (b) channel. The best branching ratio from the fit is written on the figure for a 100 GeV (a) and a 140 GeV (b) $\mathrm{H}^{+}$ mass. Dijet mass distribution with injecting signal B($ {\mathrm {t}} \rightarrow \mathrm{H}^{+} \mathrm {b} $) equal to the expected limit is overlaid. |
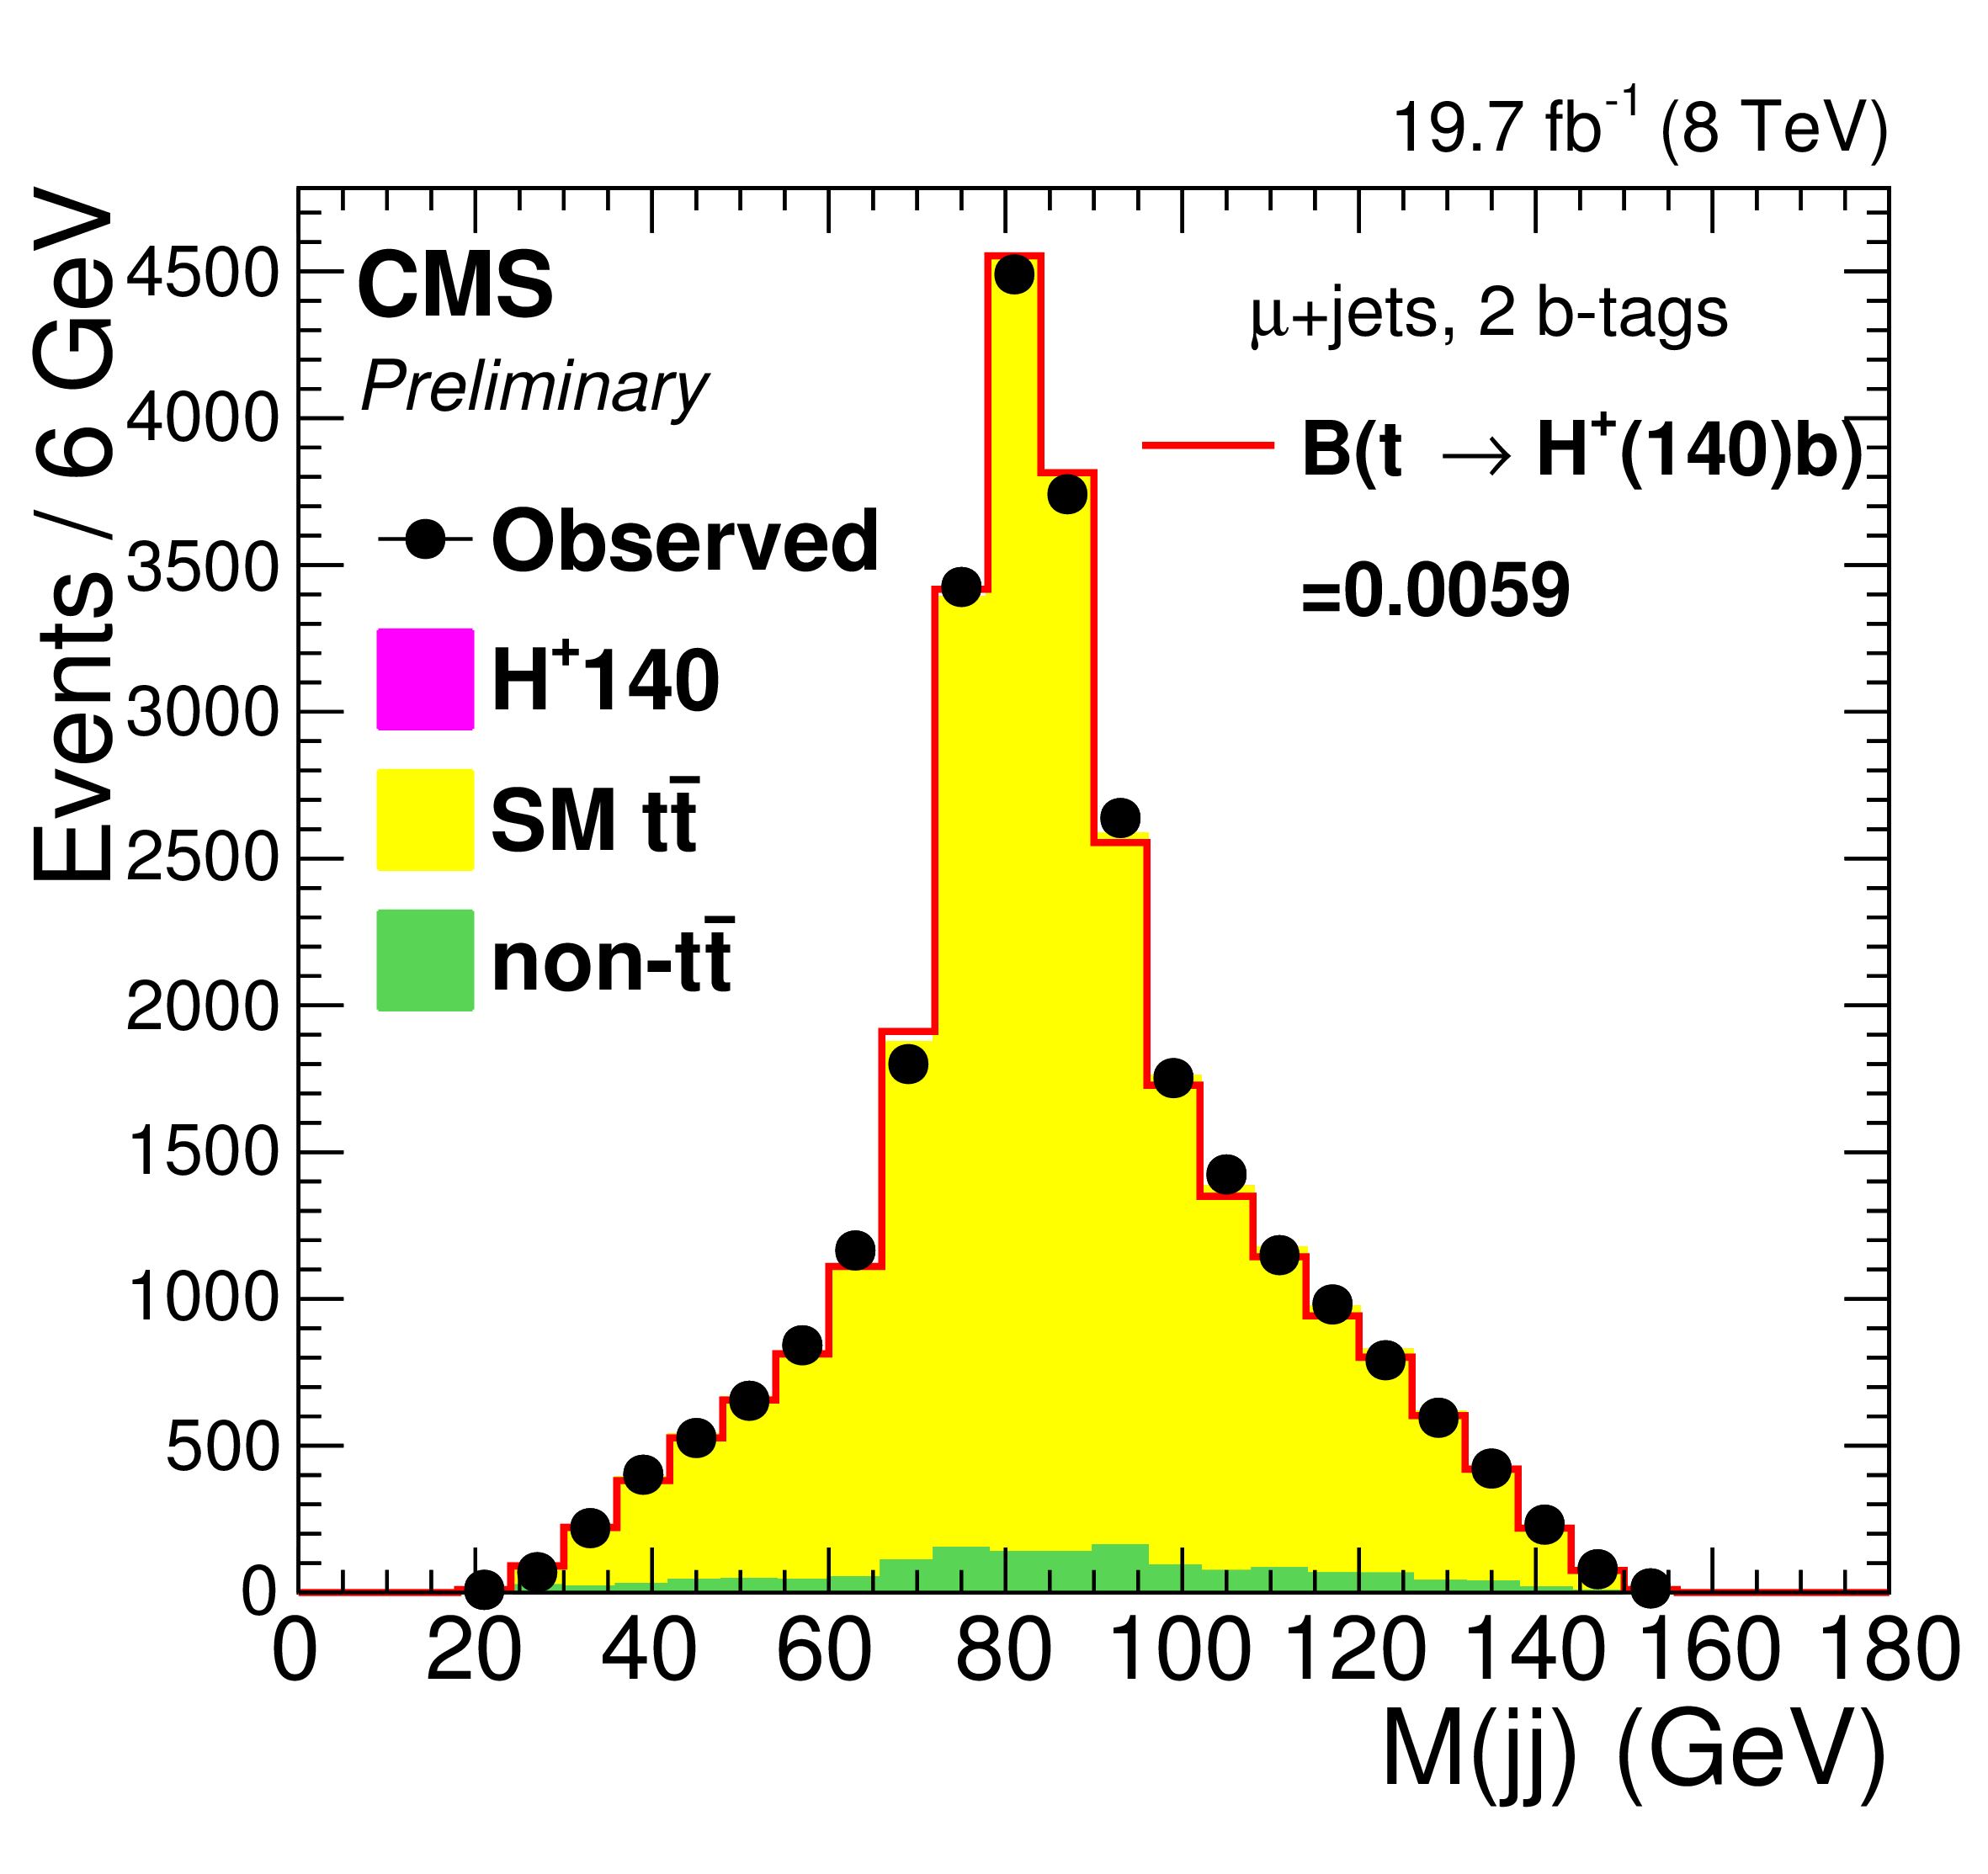
png pdf |
Figure 12-b:
Dijet mass distribution MC stack in the two b-tagged jets events are fitted on the observed data by maximum likelihood fit in e+jets (a) and $ {{\mu }}$+jets (b) channel. The best branching ratio from the fit is written on the figure for a 100 GeV (a) and a 140 GeV (b) $\mathrm{H}^{+}$ mass. Dijet mass distribution with injecting signal B($ {\mathrm {t}} \rightarrow \mathrm{H}^{+} \mathrm {b} $) equal to the expected limit is overlaid. |

png pdf |
Figure 13-a:
Dijet mass distribution MC stack in the at least three b-tagged jets events are fitted on the observed data by maximum likelihood fit in e+jets (a) and $ {{\mu }}$+jets (b) channel with the low (a) and high mass (b) fitter. Dijet mass distribution with injecting signal B($ {\mathrm {t}} \rightarrow \mathrm{H}^{+} {\mathrm {b}} $) equal to the expected limit is overlaid. |

png pdf |
Figure 13-b:
Dijet mass distribution MC stack in the at least three b-tagged jets events are fitted on the observed data by maximum likelihood fit in e+jets (a) and $ {{\mu }}$+jets (b) channel with the low (a) and high mass (b) fitter. Dijet mass distribution with injecting signal B($ {\mathrm {t}} \rightarrow \mathrm{H}^{+} {\mathrm {b}} $) equal to the expected limit is overlaid. |

png pdf |
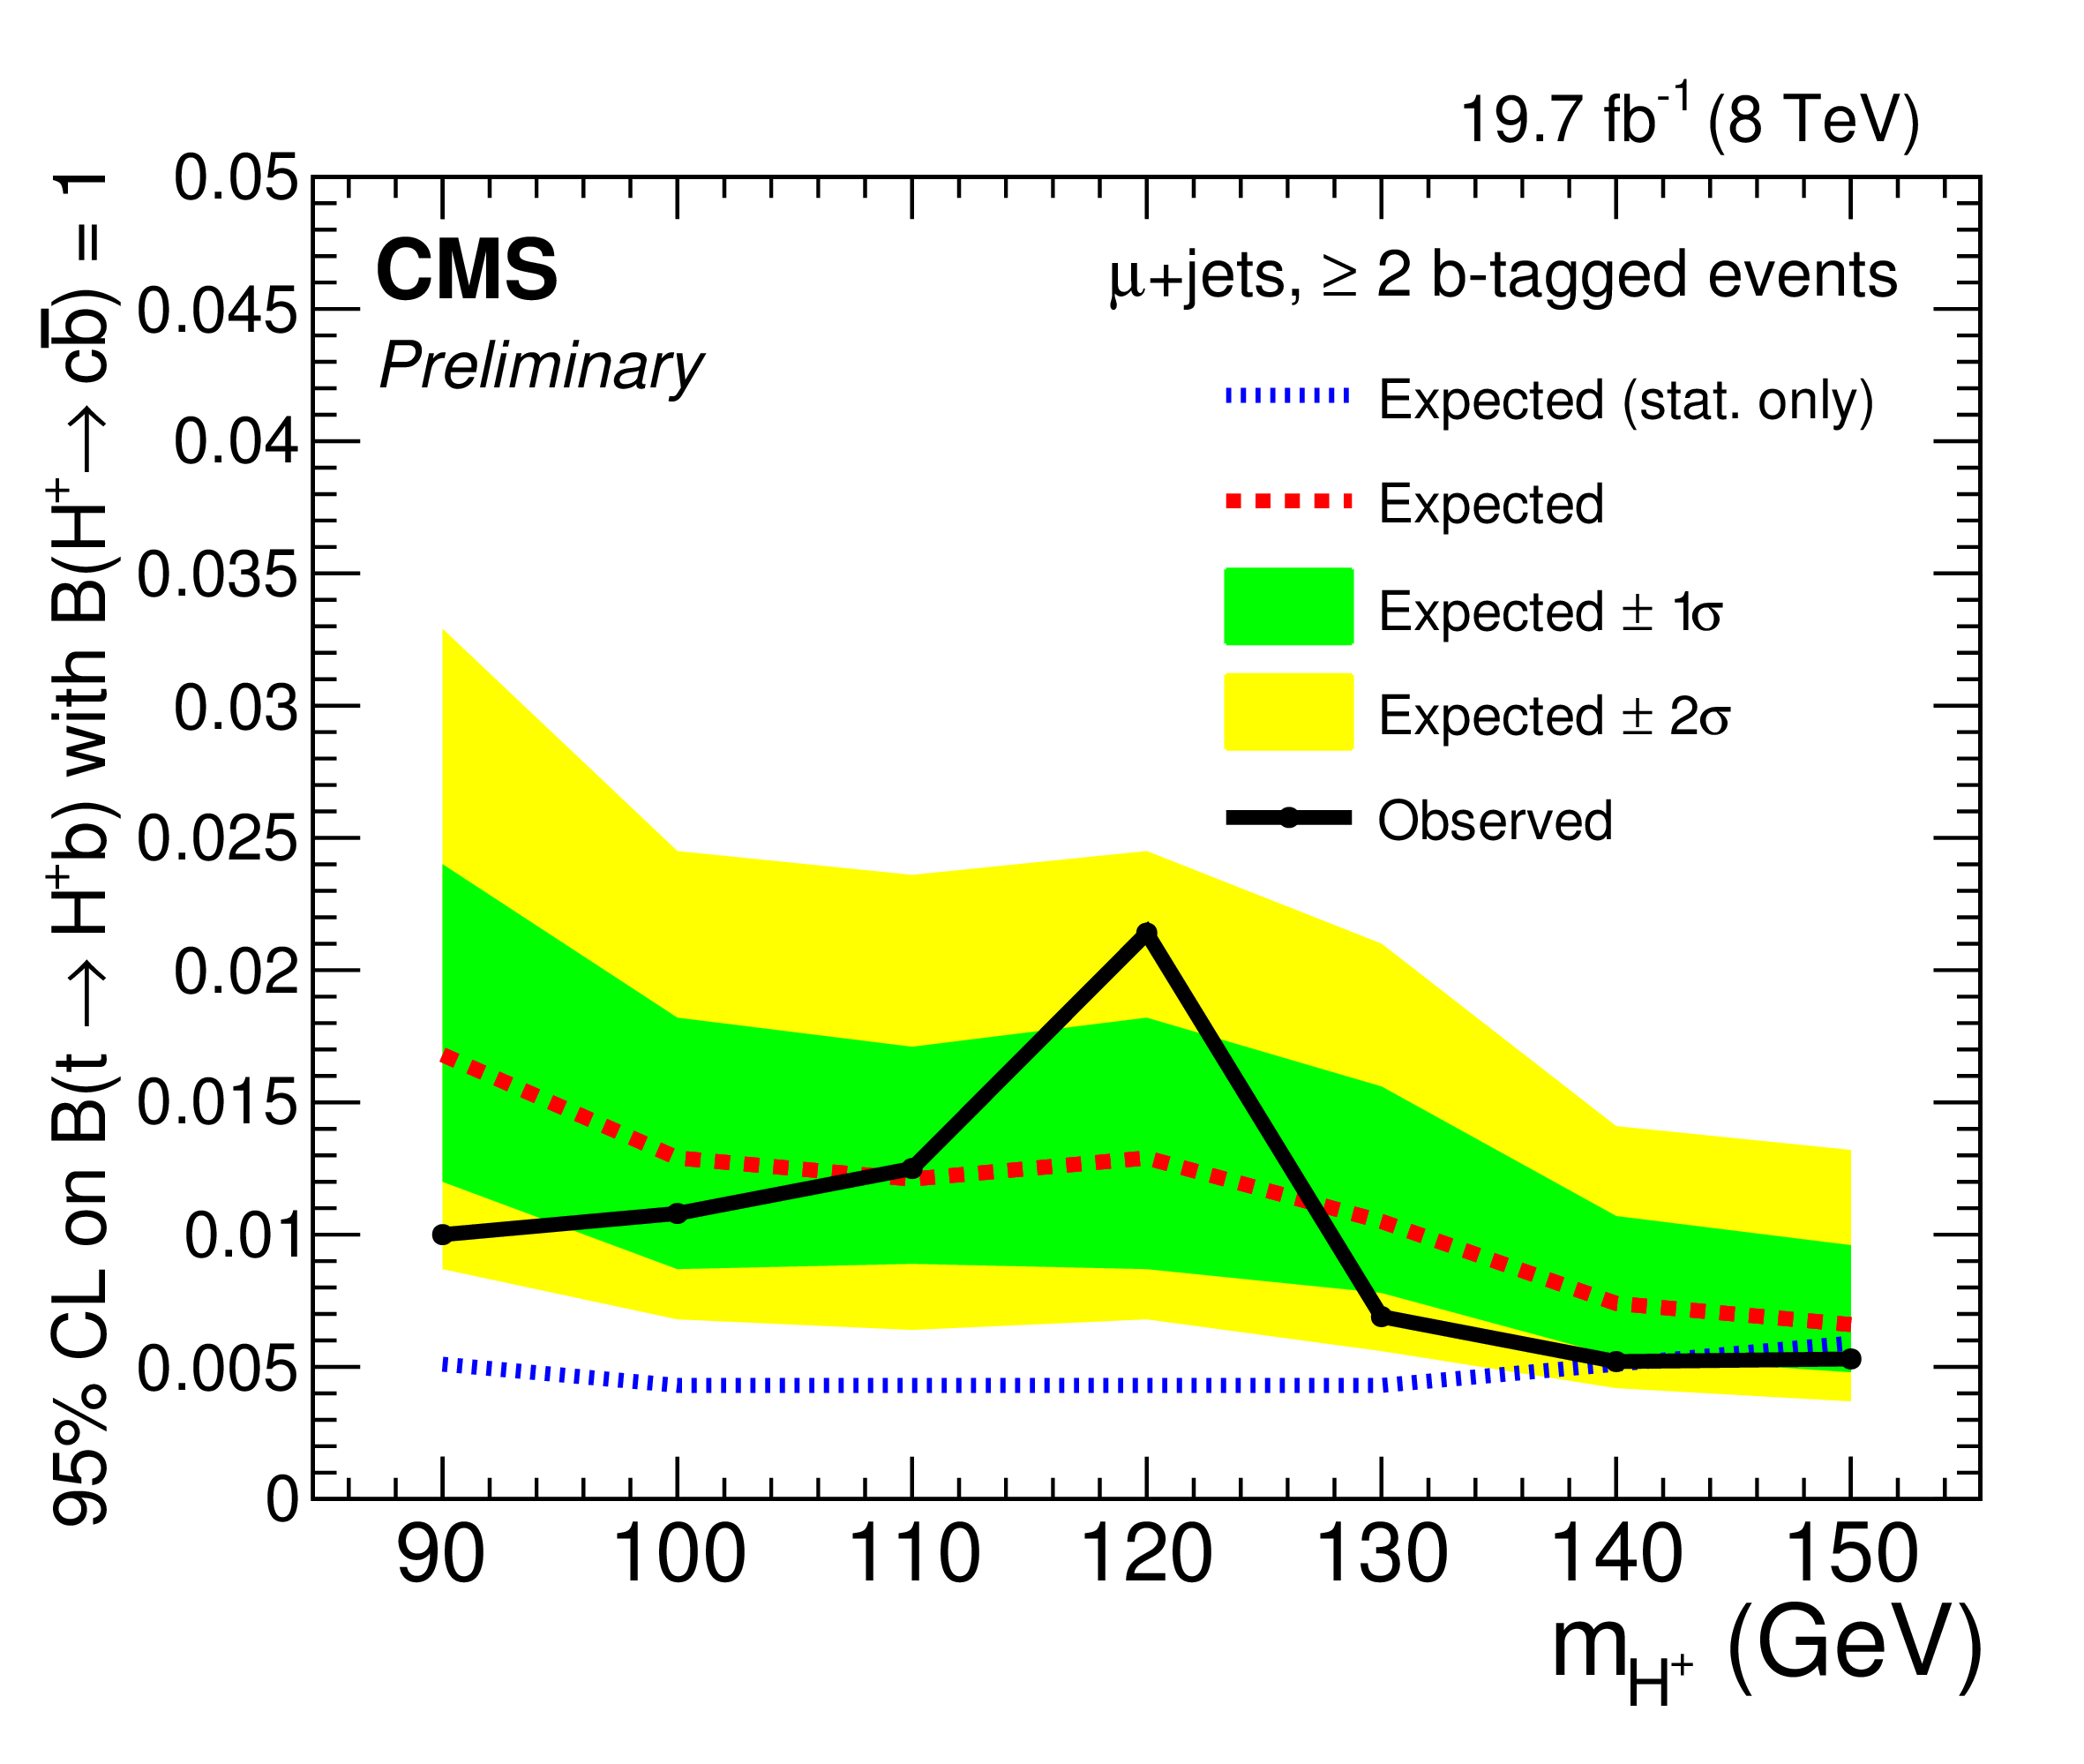
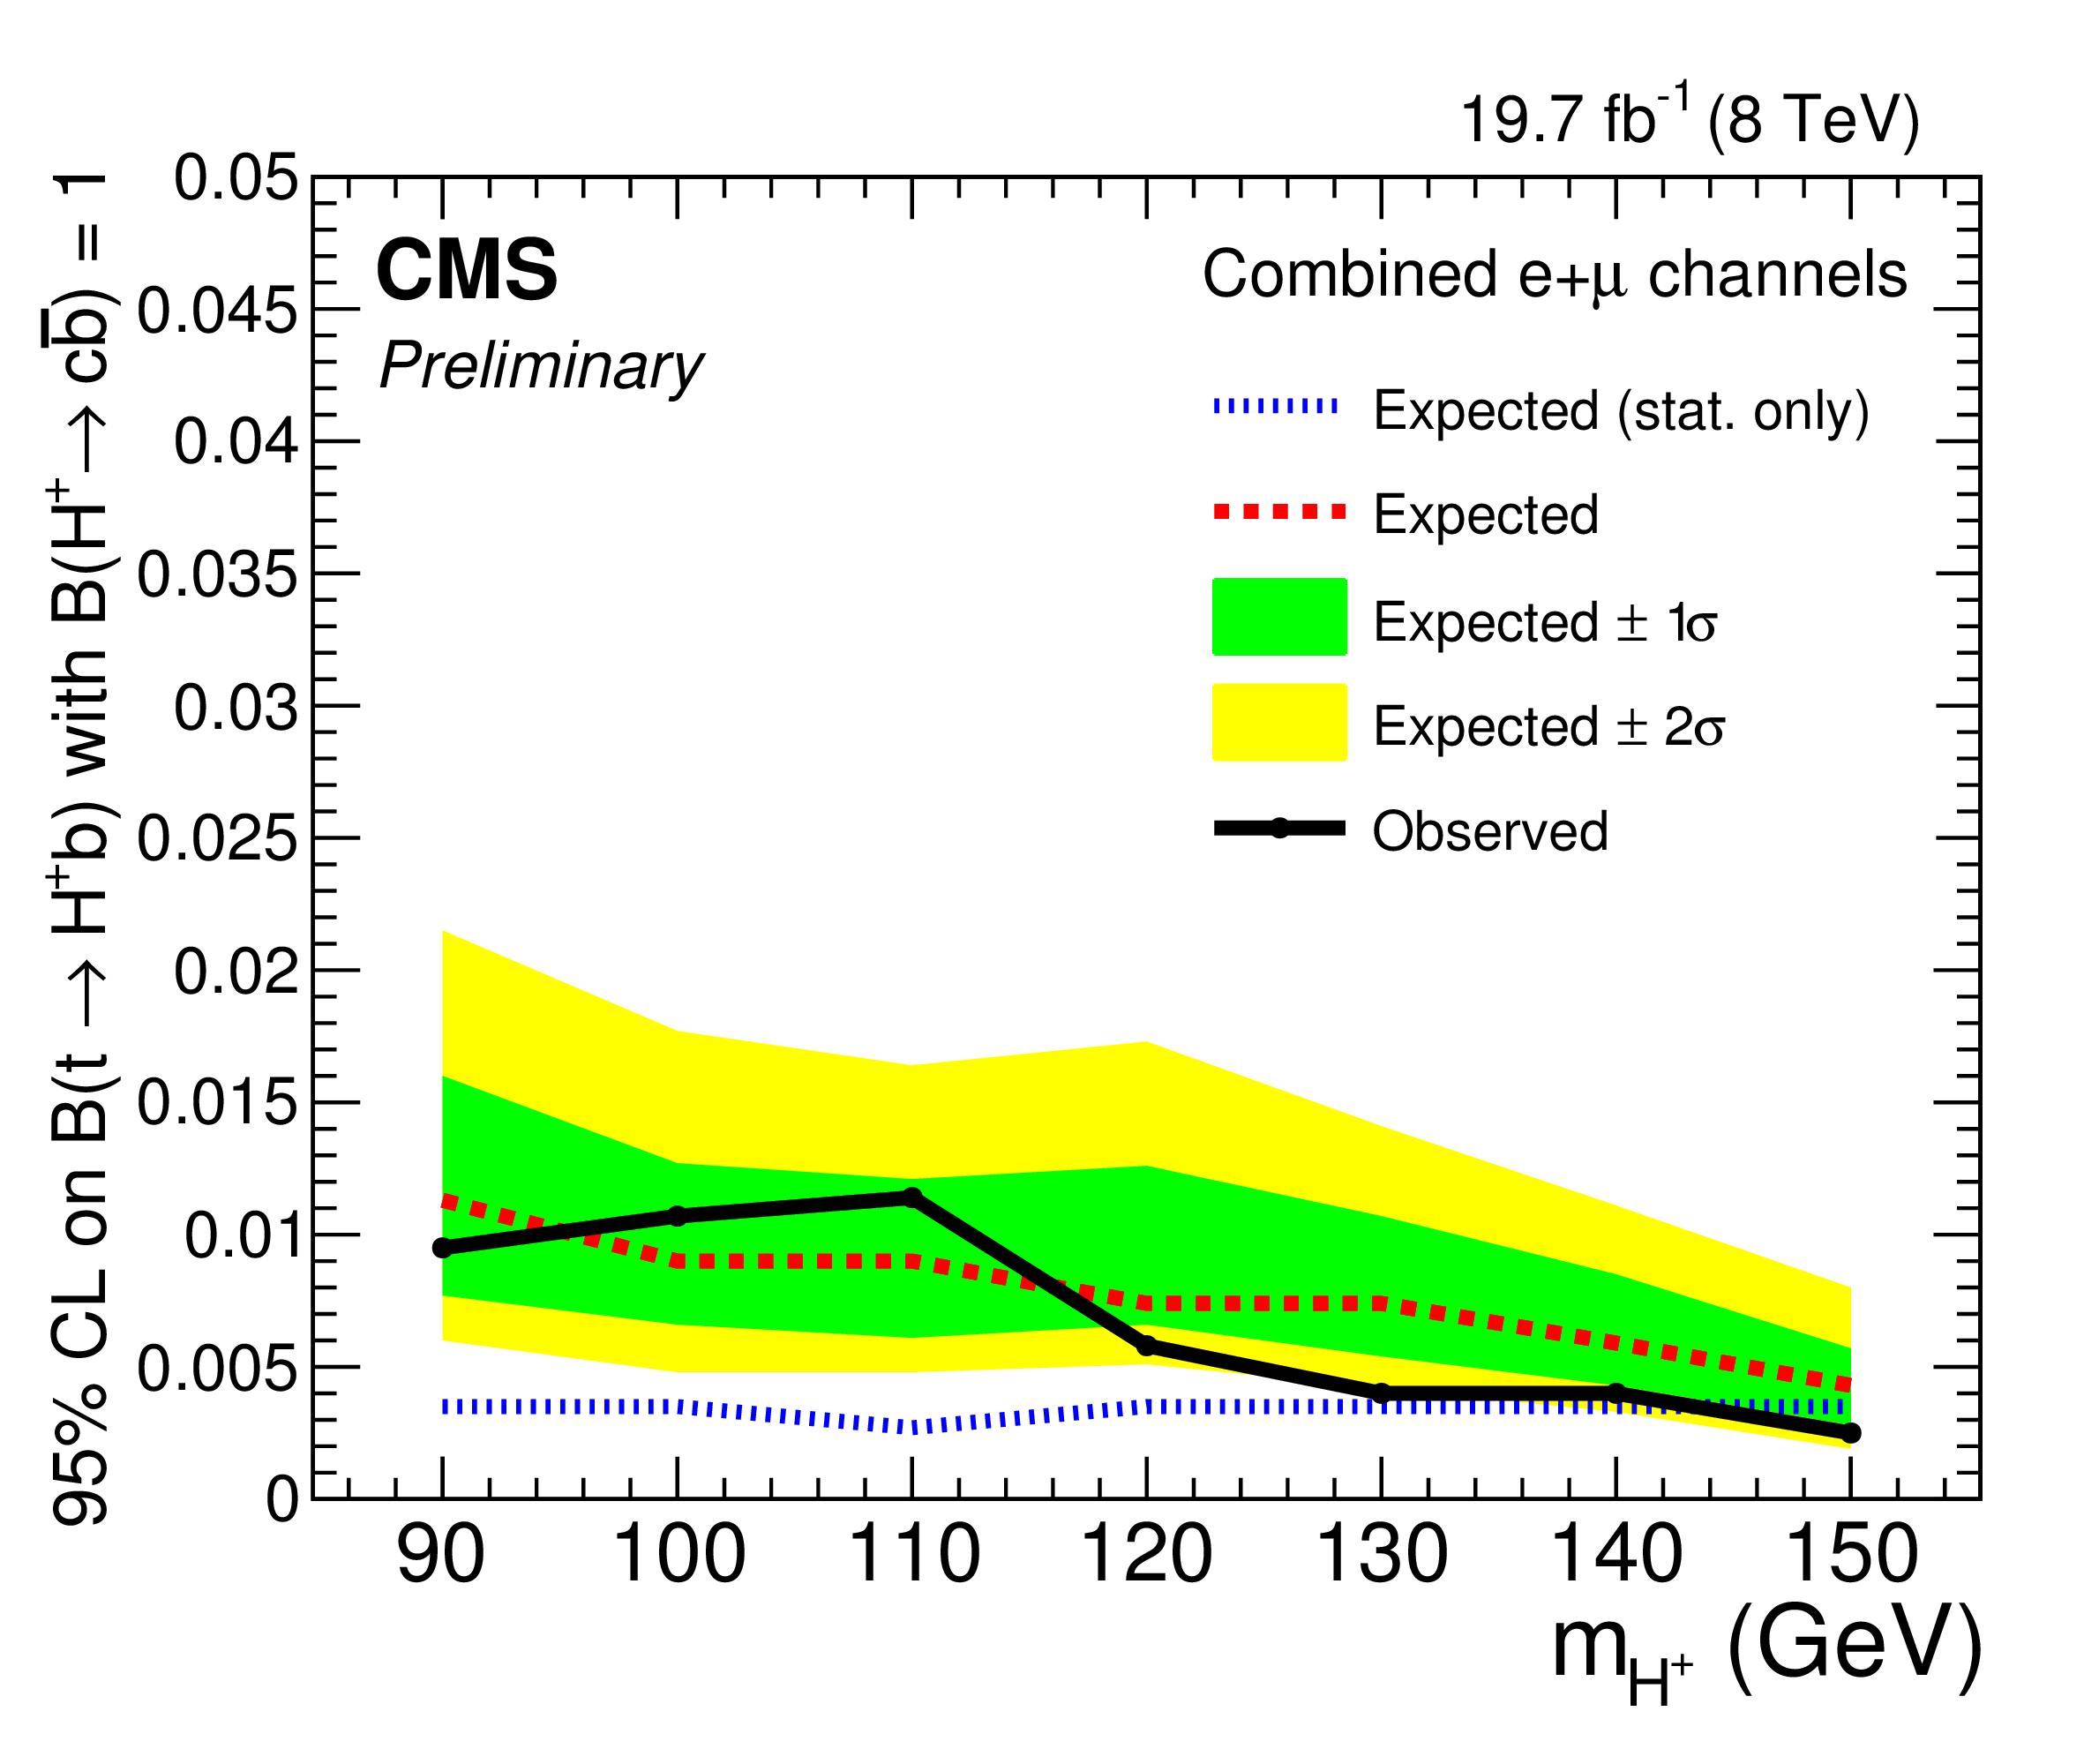
Figure 14-a:
Observed upper limits on B($ {\mathrm {t}} \rightarrow \mathrm{H}^{+} {\mathrm {b}} $) with 95% C.L. are shown for electron channel (a), muon channel (b), and combined channel (c) with expected limits including all systematic uncertainties. The limits with statistical uncertainty only are overlaid in blue dots to show the effect of systematic uncertainties. |
png pdf |
Figure 14-b:
Observed upper limits on B($ {\mathrm {t}} \rightarrow \mathrm{H}^{+} {\mathrm {b}} $) with 95% C.L. are shown for electron channel (a), muon channel (b), and combined channel (c) with expected limits including all systematic uncertainties. The limits with statistical uncertainty only are overlaid in blue dots to show the effect of systematic uncertainties. |
png pdf |
Figure 14-c:
Observed upper limits on B($ {\mathrm {t}} \rightarrow \mathrm{H}^{+} {\mathrm {b}} $) with 95% C.L. are shown for electron channel (a), muon channel (b), and combined channel (c) with expected limits including all systematic uncertainties. The limits with statistical uncertainty only are overlaid in blue dots to show the effect of systematic uncertainties. |
| Tables | |
png pdf |
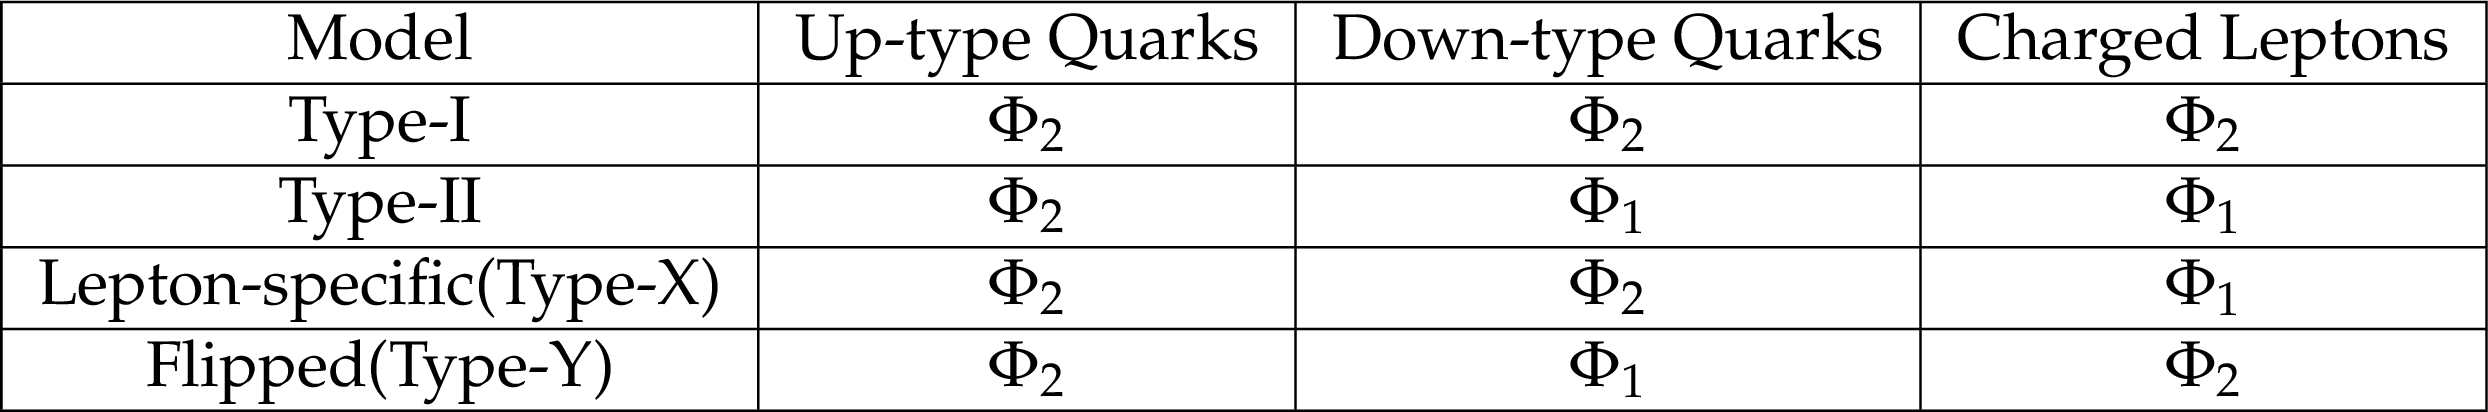
Table 1:
Four 2HDM models with each right-handed fermions coupling to each of two Higgs doublets. Each model leads to natural flavour conservation. |

png pdf |
Table 2:
Event yields with the e+jets selection from simulation and data corresponding to 19.7 fb$^{-1}$ at $\sqrt {s} =$ 8 TeV. The correction to the ${\mathrm {t}\overline {\mathrm {t}}}$ simulation in the 3 b-tag region is not applied here. |

png pdf |
Table 3:
Event yields with the ${{\mu }}$+jets selection from simulation and data corresponding to 19.7 fb$^{-1}$ at $\sqrt {s} =$ 8 TeV. The correction to the ${\mathrm {t}\overline {\mathrm {t}}}$ simulation in the 3 b-tag region is not applied here. |

png pdf |
Table 4:
Summary of the systematic uncertainties in the search for a charged Higgs boson covering both the $ {{\mu }}$+jet and e+jet channels. For cases where the uncertainties in the $ {{\mu }}$+jet and e+jet channels differ, range is given. Rate uncertainties for the $ {\mathrm {H}^{\pm }} $ signal, $ {\mathrm {t}\overline {\mathrm {t}}} $, non-$ {\mathrm {t}\overline {\mathrm {t}}} $ are listed for the 2 b-tag and 3 b-tag selections, and the uncertainties marked with (s) are used for shape systematic uncertainties. |
| Summary |
| Results on the search for a light charged Higgs boson ${\rm H^{+}}$ decaying to ${\rm c\bar{b}}$ in top quark pair events using the CMS detector at the LHC are presented. The total dataset corresponds to 19.7 fb$^{-1}$ of proton-proton collisions at $\sqrt{s} =$ 8 TeV. In ${\rm t\bar{t}}$ decays, if one top quark decays to ${\rm H^{+} b}$, instead of ${\rm W b}$, and the ${\rm H^{+}}$ subsequently decays to ${\rm c \bar{b}}$, while other top quark decays leptonically (${\rm \bar{t} \rightarrow W^{-}\bar{b}} \rightarrow \ell \bar{\nu} {\rm \bar{b}}$), the final state then consists of four jets (three ${\rm b}$ quark jets), one lepton (electron or muon), and missing energy: ${\rm t\bar{t} \rightarrow (H^{+}b)(W^{-}\bar{b})}$ $ \rightarrow {\rm (c\bar{b} b)} (\ell \bar{\nu} {\rm \bar{b}})$. The main observable used in the analysis is an invariant mass of two jets, one of which is identified as a b quark jet. The dijet pair is selected from at least four jets in an event by a dedicated kinematic fitter. No signal for the presence of a charged Higgs boson is observed and upper limits are set at 95% confidence level on the branching ratio for ${\rm t \rightarrow H^{+} b}$ from 1.1-0.4% for the charged Higgs boson mass in the range 90-150 GeV in the assumption of branching ratio of ${\rm B(H^{+} \rightarrow c\bar{b}) } = $ 100% for the first time. |
| References | ||||
| 1 | CMS Collaboration | Observation of a new boson at a mass of 125 GeV with the CMS experiment at the LHC | PLB716 (2012) 30--61 | CMS-HIG-12-028 1207.7235 |
| 2 | ATLAS Collaboration | Observation of a new particle in the search for the Standard Model Higgs boson with the ATLAS detector at the LHC | PLB716 (2012) 1--29 | 1207.7214 |
| 3 | CMS Collaboration | Precise determination of the mass of the Higgs boson and tests of compatibility of its couplings with the standard model predictions using proton collisions at 7 and 8 $ \,\text {TeV} $ | EPJC75 (2015), no. 5, 212 | CMS-HIG-14-009 1412.8662 |
| 4 | ATLAS Collaboration | Measurements of the Higgs boson production and decay rates and coupling strengths using pp collision data at $ \sqrt{s}=7 $ and 8 TeV in the ATLAS experiment | EPJC76 (2016), no. 1, 6 | 1507.04548 |
| 5 | ATLAS and CMS Collaborations | Combined Measurement of the Higgs Boson Mass in $ pp $ Collisions at $ \sqrt{s}=7 $ and 8 TeV with the ATLAS and CMS Experiments | PRL 114 (2015) 191803 | CMS-HIG-14-042 1503.07589 |
| 6 | ATLAS and CMS Collaborations | Measurements of the Higgs boson production and decay rates and constraints on its couplings from a combined ATLAS and CMS analysis of the LHC $ pp $ collision data at $ \sqrt{s}= $ 7 and 8 TeV | Submitted to JHEP | CMS-HIG-15-002 1606.02266 |
| 7 | S. L. Glashow | Partial Symmetries of Weak Interactions | Nucl. Phys. 22 (1961) 579--588 | |
| 8 | S. Weinberg | A Model of Leptons | PRL 19 (1967) 1264--1266 | |
| 9 | A. Salam | Weak and Electromagnetic Interactions | Conf. Proc. C680519 (1968)367--377 | |
| 10 | F. Englert and R. Brout | Broken Symmetry and the Mass of Gauge Vector Mesons | PRL 13 (1964) 321--323 | |
| 11 | P. W. Higgs | Broken symmetries, massless particles and gauge fields | PL12 (1964) 132--133 | |
| 12 | P. W. Higgs | Broken Symmetries and the Masses of Gauge Bosons | PRL 13 (1964) 508--509 | |
| 13 | G. S. Guralnik, C. R. Hagen, and T. W. B. Kibble | Global Conservation Laws and Massless Particles | PRL 13 (1964) 585--587 | |
| 14 | P. W. Higgs | Spontaneous Symmetry Breakdown without Massless Bosons | PR145 (1966) 1156--1163 | |
| 15 | T. W. B. Kibble | Symmetry breaking in nonAbelian gauge theories | PR155 (1967) 1554--1561 | |
| 16 | J. F. Gunion, S. Dawson, H. E. Haber, and G. L. Kane | The Higgs hunter's guide | volume 80 Brookhaven Nat. Lab., Upton, NY, 1989 | |
| 17 | G. C. Branco et al. | Theory and phenomenology of two-Higgs-doublet models | PR 516 (2012) 1--102 | 1106.0034 |
| 18 | E. A. Paschos | Diagonal Neutral Currents | PRD15 (1977) 1966 | |
| 19 | S. L. Glashow and S. Weinberg | Natural Conservation Laws for Neutral Currents | PRD15 (1977) 1958 | |
| 20 | CDF Collaboration | Search for charged Higgs bosons from top quark decays in $ p\bar{p} $ collisions at $ \sqrt{s} = $ 1.96-TeV. | PRL 96 (2006) 042003 | hep-ex/0510065 |
| 21 | D0 Collaboration | Search for charged Higgs bosons in decays of top quarks | PRD80 (2009) 051107 | 0906.5326 |
| 22 | CMS Collaboration | Search for a light charged Higgs boson in top quark decays in $ pp $ collisions at $ \sqrt{s}=7 $ TeV | JHEP 07 (2012) 143 | CMS-HIG-11-019 1205.5736 |
| 23 | ATLAS Collaboration | Search for charged Higgs bosons decaying via $ H^{\pm} \rightarrow \tau^{\pm}\nu $ in fully hadronic final states using $ pp $ collision data at $ \sqrt{s} = 8 $ TeV with the ATLAS detector | JHEP 03 (2015) 088 | 1412.6663 |
| 24 | ATLAS Collaboration | Search for charged Higgs bosons decaying via $ H^{+} \to \tau \nu $ in top quark pair events using $ pp $ collision data at $ \sqrt{s}=7 $ TeV with the ATLAS detector | JHEP 06 (2012) 039 | 1204.2760 |
| 25 | CDF Collaboration | Search for charged Higgs bosons in decays of top quarks in p anti-p collisions at s**(1/2) = 1.96 TeV | PRL 103 (2009) 101803 | 0907.1269 |
| 26 | D0 Collaboration | Search for Charged Higgs Bosons in Top Quark Decays | PLB682 (2009) 278--286 | 0908.1811 |
| 27 | CMS Collaboration | Search for a light charged Higgs boson decaying to $ \mathrm{c}\overline{\mathrm{s}} $ in pp collisions at $ \sqrt{s}=8 $ TeV | JHEP 12 (2015) 178 | CMS-HIG-13-035 1510.04252 |
| 28 | ATLAS Collaboration | Search for a light charged Higgs boson in the decay channel $ H^+ \to c\bar{s} $ in $ t\bar{t} $ events using pp collisions at $ \sqrt{s} $ = 7 TeV with the ATLAS detector | EPJC73 (2013), no. 6 | 1302.3694 |
| 29 | M. Aoki, S. Kanemura, K. Tsumura, and K. Yagyu | Models of Yukawa interaction in the two Higgs doublet model, and their collider phenomenology | PRD80 (2009) 015017 | 0902.4665 |
| 30 | H. E. Logan and D. MacLennan | Charged Higgs phenomenology in the flipped two Higgs doublet model | PRD81 (2010) 075016 | 1002.4916 |
| 31 | CMS Collaboration | The CMS experiment at the CERN LHC | JINST 3 (2008) S08004 | CMS-00-001 |
| 32 | CMS Collaboration | Commissioning of the Particle-Flow reconstruction in Minimum-Bias and Jet Events from pp Collisions at 7 TeV | CDS | |
| 33 | M. Cacciari, G. P. Salam, and G. Soyez | The Anti-k(t) jet clustering algorithm | JHEP 0804 (2008) 063 | 0802.1189 |
| 34 | CMS Collaboration | Jet energy scale and resolution in the CMS experiment in pp collisions at 8 TeV | CMS-JME-13-004 1607.03663 |
|
| 35 | T. Sjostrand, S. Mrenna, and P. Z. Skands | PYTHIA 6.4 Physics and Manual | JHEP 05 (2006) 026 | hep-ph/0603175 |
| 36 | J. Alwall et al. | MadGraph 5 : Going Beyond | JHEP 06 (2011) 128 | 1106.0522 |
| 37 | S. Alioli, P. Nason, C. Oleari, and E. Re | A general framework for implementing NLO calculations in shower Monte Carlo programs: the POWHEG BOX | JHEP 06 (2010) 043 | 1002.2581 |
| 38 | J. Allison et al. | Geant4 developments and applications | IEEE Trans. Nucl. Sci. 53 (2006) 270 | |
| 39 | CMS Collaboration | Performance of muon identification in pp collisions at s**0.5 = 7 TeV | CDS | |
| 40 | CMS Collaboration | Identification of b-quark jets with the CMS experiment | JINST 8 (2013) P04013 | CMS-BTV-12-001 1211.4462 |
| 41 | CMS Collaboration | Measurement of $ \mathrm {t}\overline{\mathrm {t}} $ production with additional jet activity, including $ \mathrm {b} $ quark jets, in the dilepton decay channel using pp collisions at $ \sqrt{s} = 8\,\text {TeV} $ | EPJC76 (2016), no. 7, 379 | CMS-TOP-12-041 1510.03072 |
| 42 | CMS Collaboration | Measurement of the cross section ratio $ \sigma_\mathrm{t \bar{t} b \bar{b}} / \sigma_\mathrm{t \bar{t} jj } $ in pp collisions at $ \sqrt{s} $ = 8 TeV | PLB746 (2015) 132--153 | CMS-TOP-13-010 1411.5621 |
| 43 | CMS Collaboration | Measurement of the top quark mass using proton-proton data at $ {\sqrt{(s)}} $ = 7 and 8 TeV | PRD93 (2016), no. 7, 072004 | CMS-TOP-14-022 1509.04044 |
| 44 | M. Czakon and A. Mitov | Top++: A Program for the Calculation of the Top-Pair Cross-Section at Hadron Colliders | CPC 185 (2014) 2930 | 1112.5675 |
| 45 | CMS Collaboration | Measurement of the differential cross section for top quark pair production in pp collisions at $ \sqrt{s} = 8\,\text {TeV} $ | EPJC75 (2015), no. 11, 542 | CMS-TOP-12-028 1505.04480 |
| 46 | M. Czakon, D. Heymes, and A. Mitov | High-precision differential predictions for top-quark pairs at the LHC | PRL 116 (2016), no. 8, 082003 | 1511.00549 |
| 47 | N. Kidonakis | NNLL threshold resummation for top-pair and single-top production | Phys. Part. Nucl. 45 (2014), no. 4, 714--722 | 1210.7813 |
| 48 | CMS Collaboration | Determination of jet energy calibration and transverse momentum resolution in CMS | Journal of Instrumentation 6 (November, 2011) 11002 | CMS-JME-10-011 1107.4277 |
| 49 | CMS Collaboration | Performance of b tagging at sqrt(s)=8 TeV in multijet, ttbar and boosted topology events | CMS-PAS-BTV-13-001 | CMS-PAS-BTV-13-001 |
| 50 | CMS Collaboration | CMS Luminosity Based on Pixel Cluster Counting - Summer 2013 Update | Technical Report CMS-PAS-LUM-13-001, CERN, Geneva | CMS-PAS-LUM-13-001 |
| 51 | L. Moneta et al. | The RooStats Project | PoS ACAT2010 (2010) 057 | 1009.1003 |
|
|
Compact Muon Solenoid LHC, CERN |
|

|

|

|

|

|