

Compact Muon Solenoid
LHC, CERN
| CMS-PAS-JME-16-003 | ||
| Jet algorithms performance in 13 TeV data | ||
| CMS Collaboration | ||
| March 2017 | ||
| Abstract: The performance of jet algorithms with data collected by the CMS detector at the LHC in 2015 with a center-of-mass energy of 13 TeV, corresponding to 2.3 fb$^{-1}$ of integrated luminosity, is reported. The criteria used to reject jets originating from detector noise are discussed and the efficiency and noise jet rejection rate are measured. A likelihood discriminant designed to differentiate jets initiated by light-quark partons from jets initiated from gluons is studied. A multivariate discriminator is built to distinguish jets initiated by a single high $p_{\mathrm{T}}$ quark or gluon from jets originating from the overlap of multiple low $p_{\mathrm{T}}$ particles from non-primary vertices (pileup jets). Algorithms used to identify large radius jets reconstructed from the decay products of highly Lorentz boosted W bosons and top quarks are discussed, and the efficiency and background rejection rates of these algorithms are measured. | ||
| Links: CDS record (PDF) ; inSPIRE record ; CADI line (restricted) ; | ||
| Figures & Tables | Summary | Additional Figures | References | CMS Publications |
|---|
| Figures | |

png pdf |
Figure 1:
The distributions of $ {E_{\mathrm {T}}^{\text {miss}}} $ over $\Sigma p_{\mathrm{T}}$ for signal enriched back-to-back dijet events (black) and for noise enriched events from a minimum bias selection (red) before applying the PF jet ID. |

png pdf |
Figure 2:
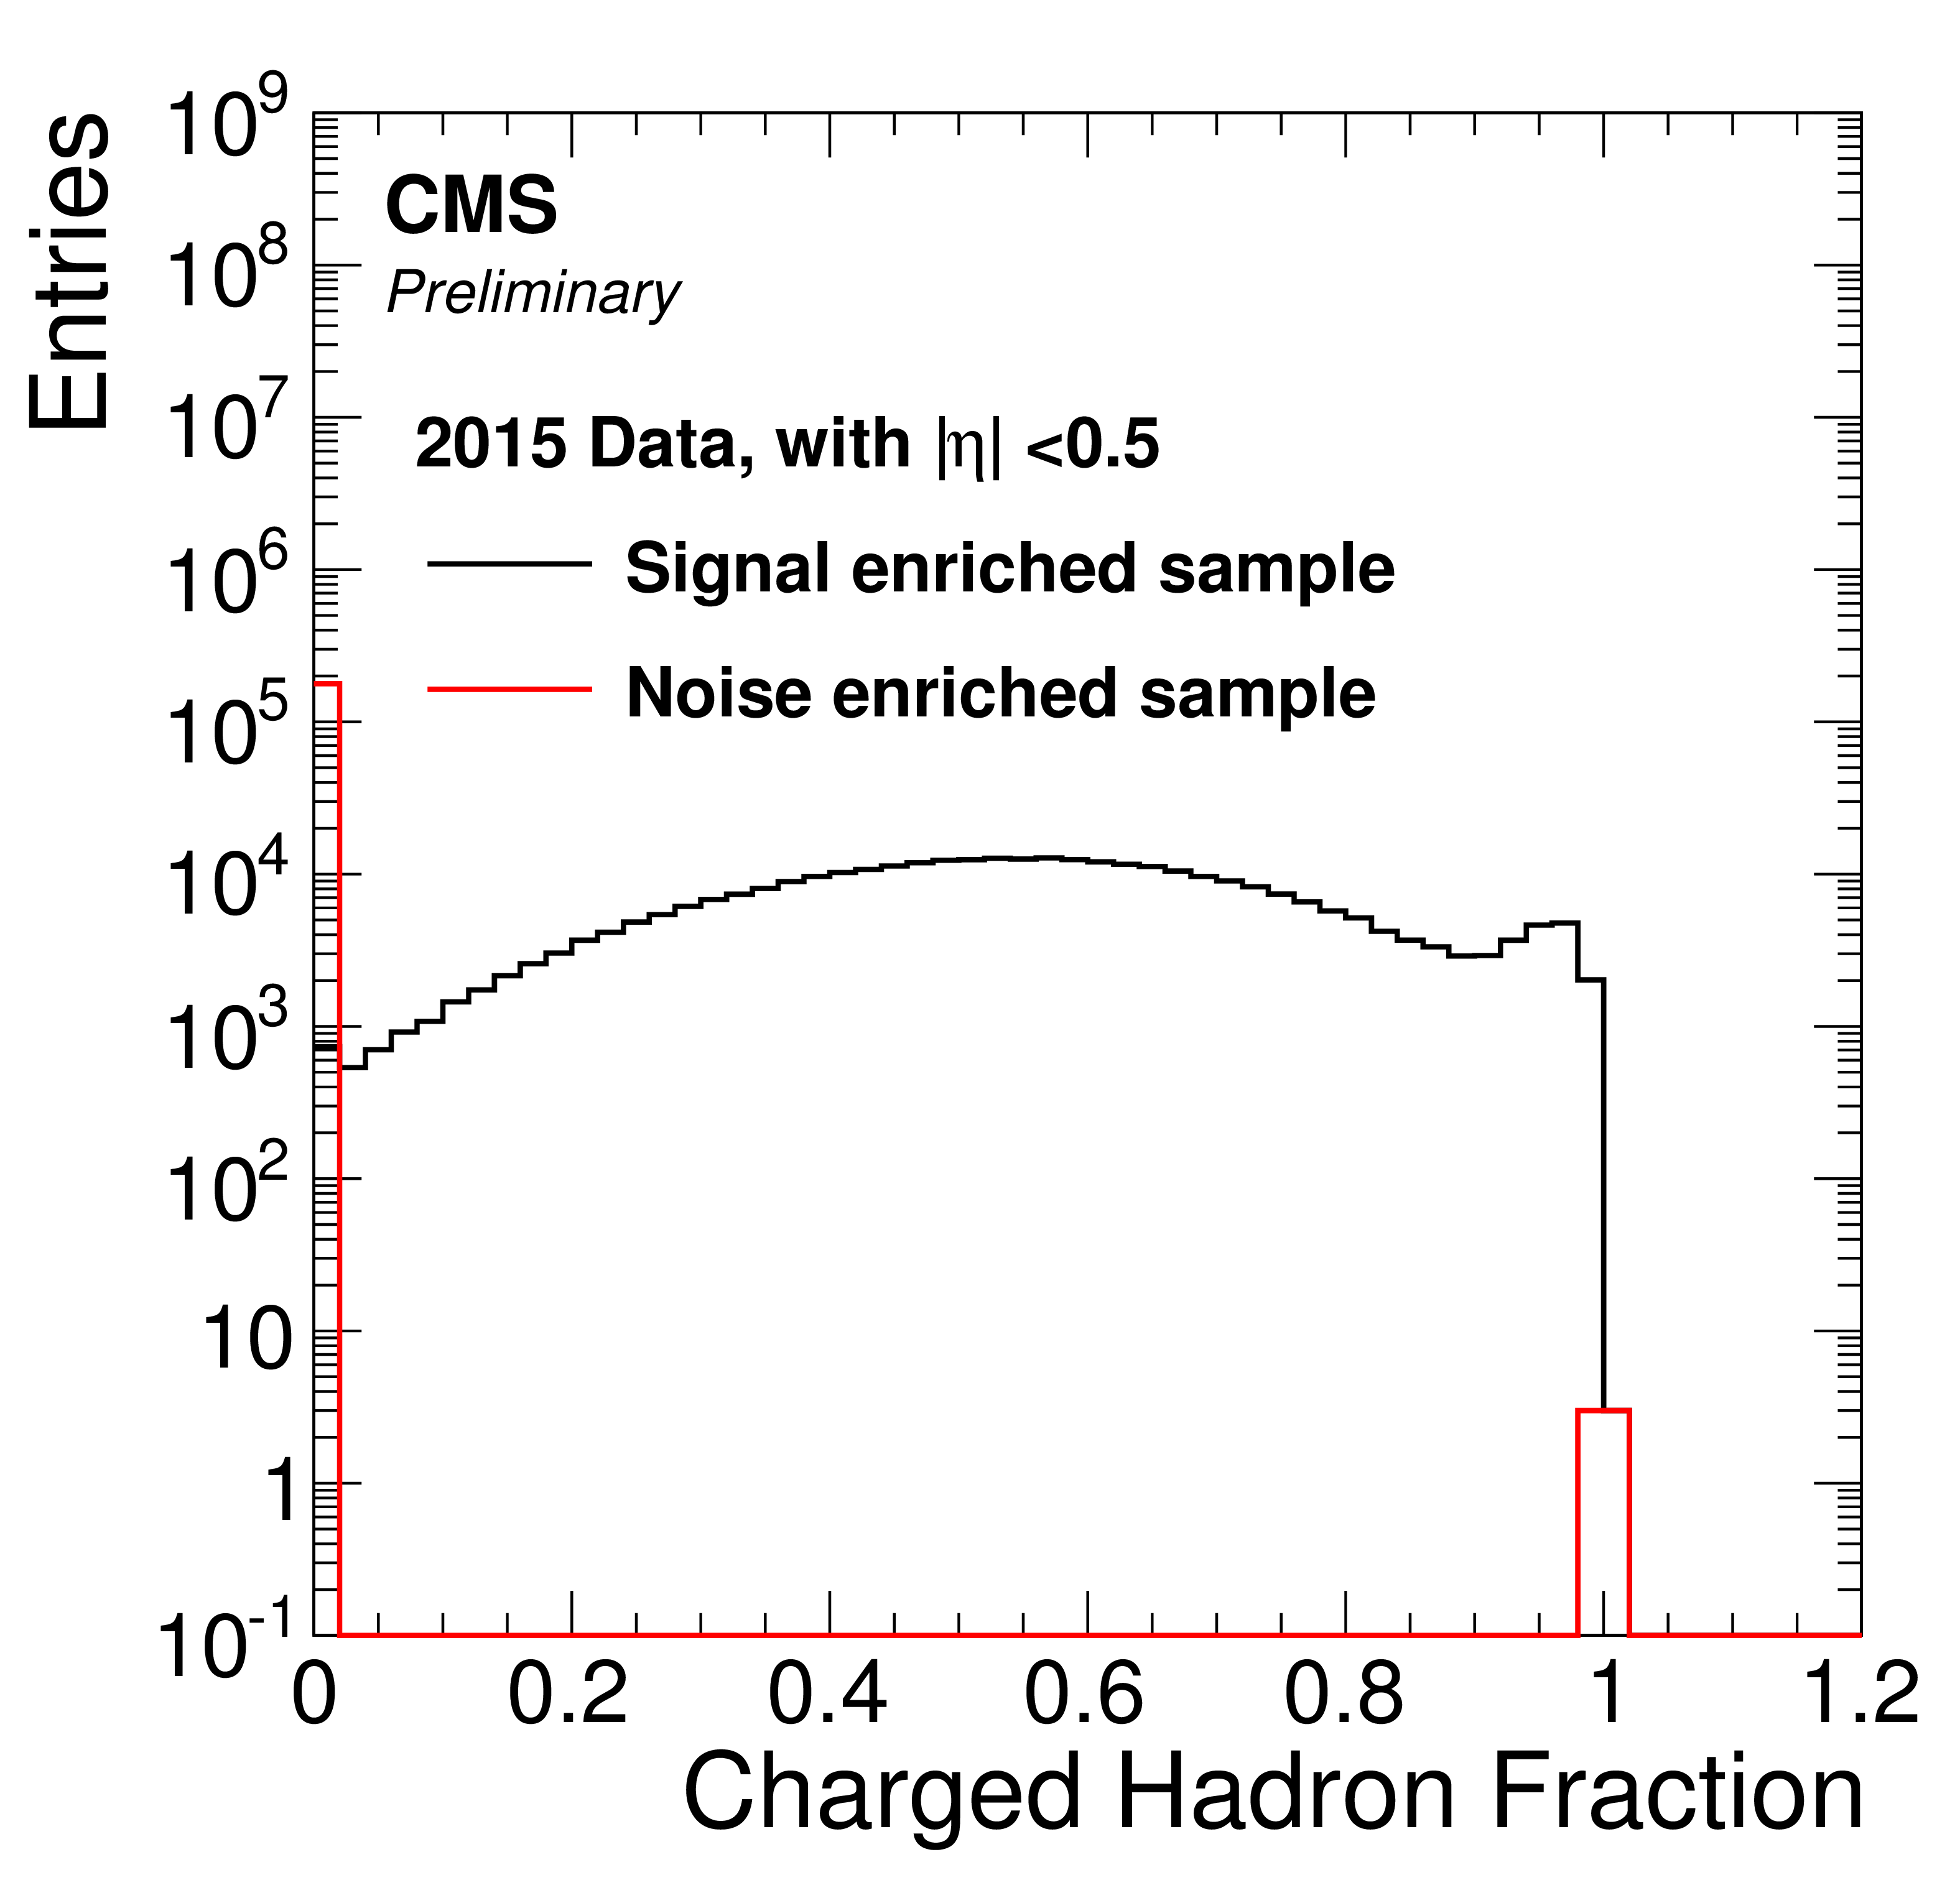
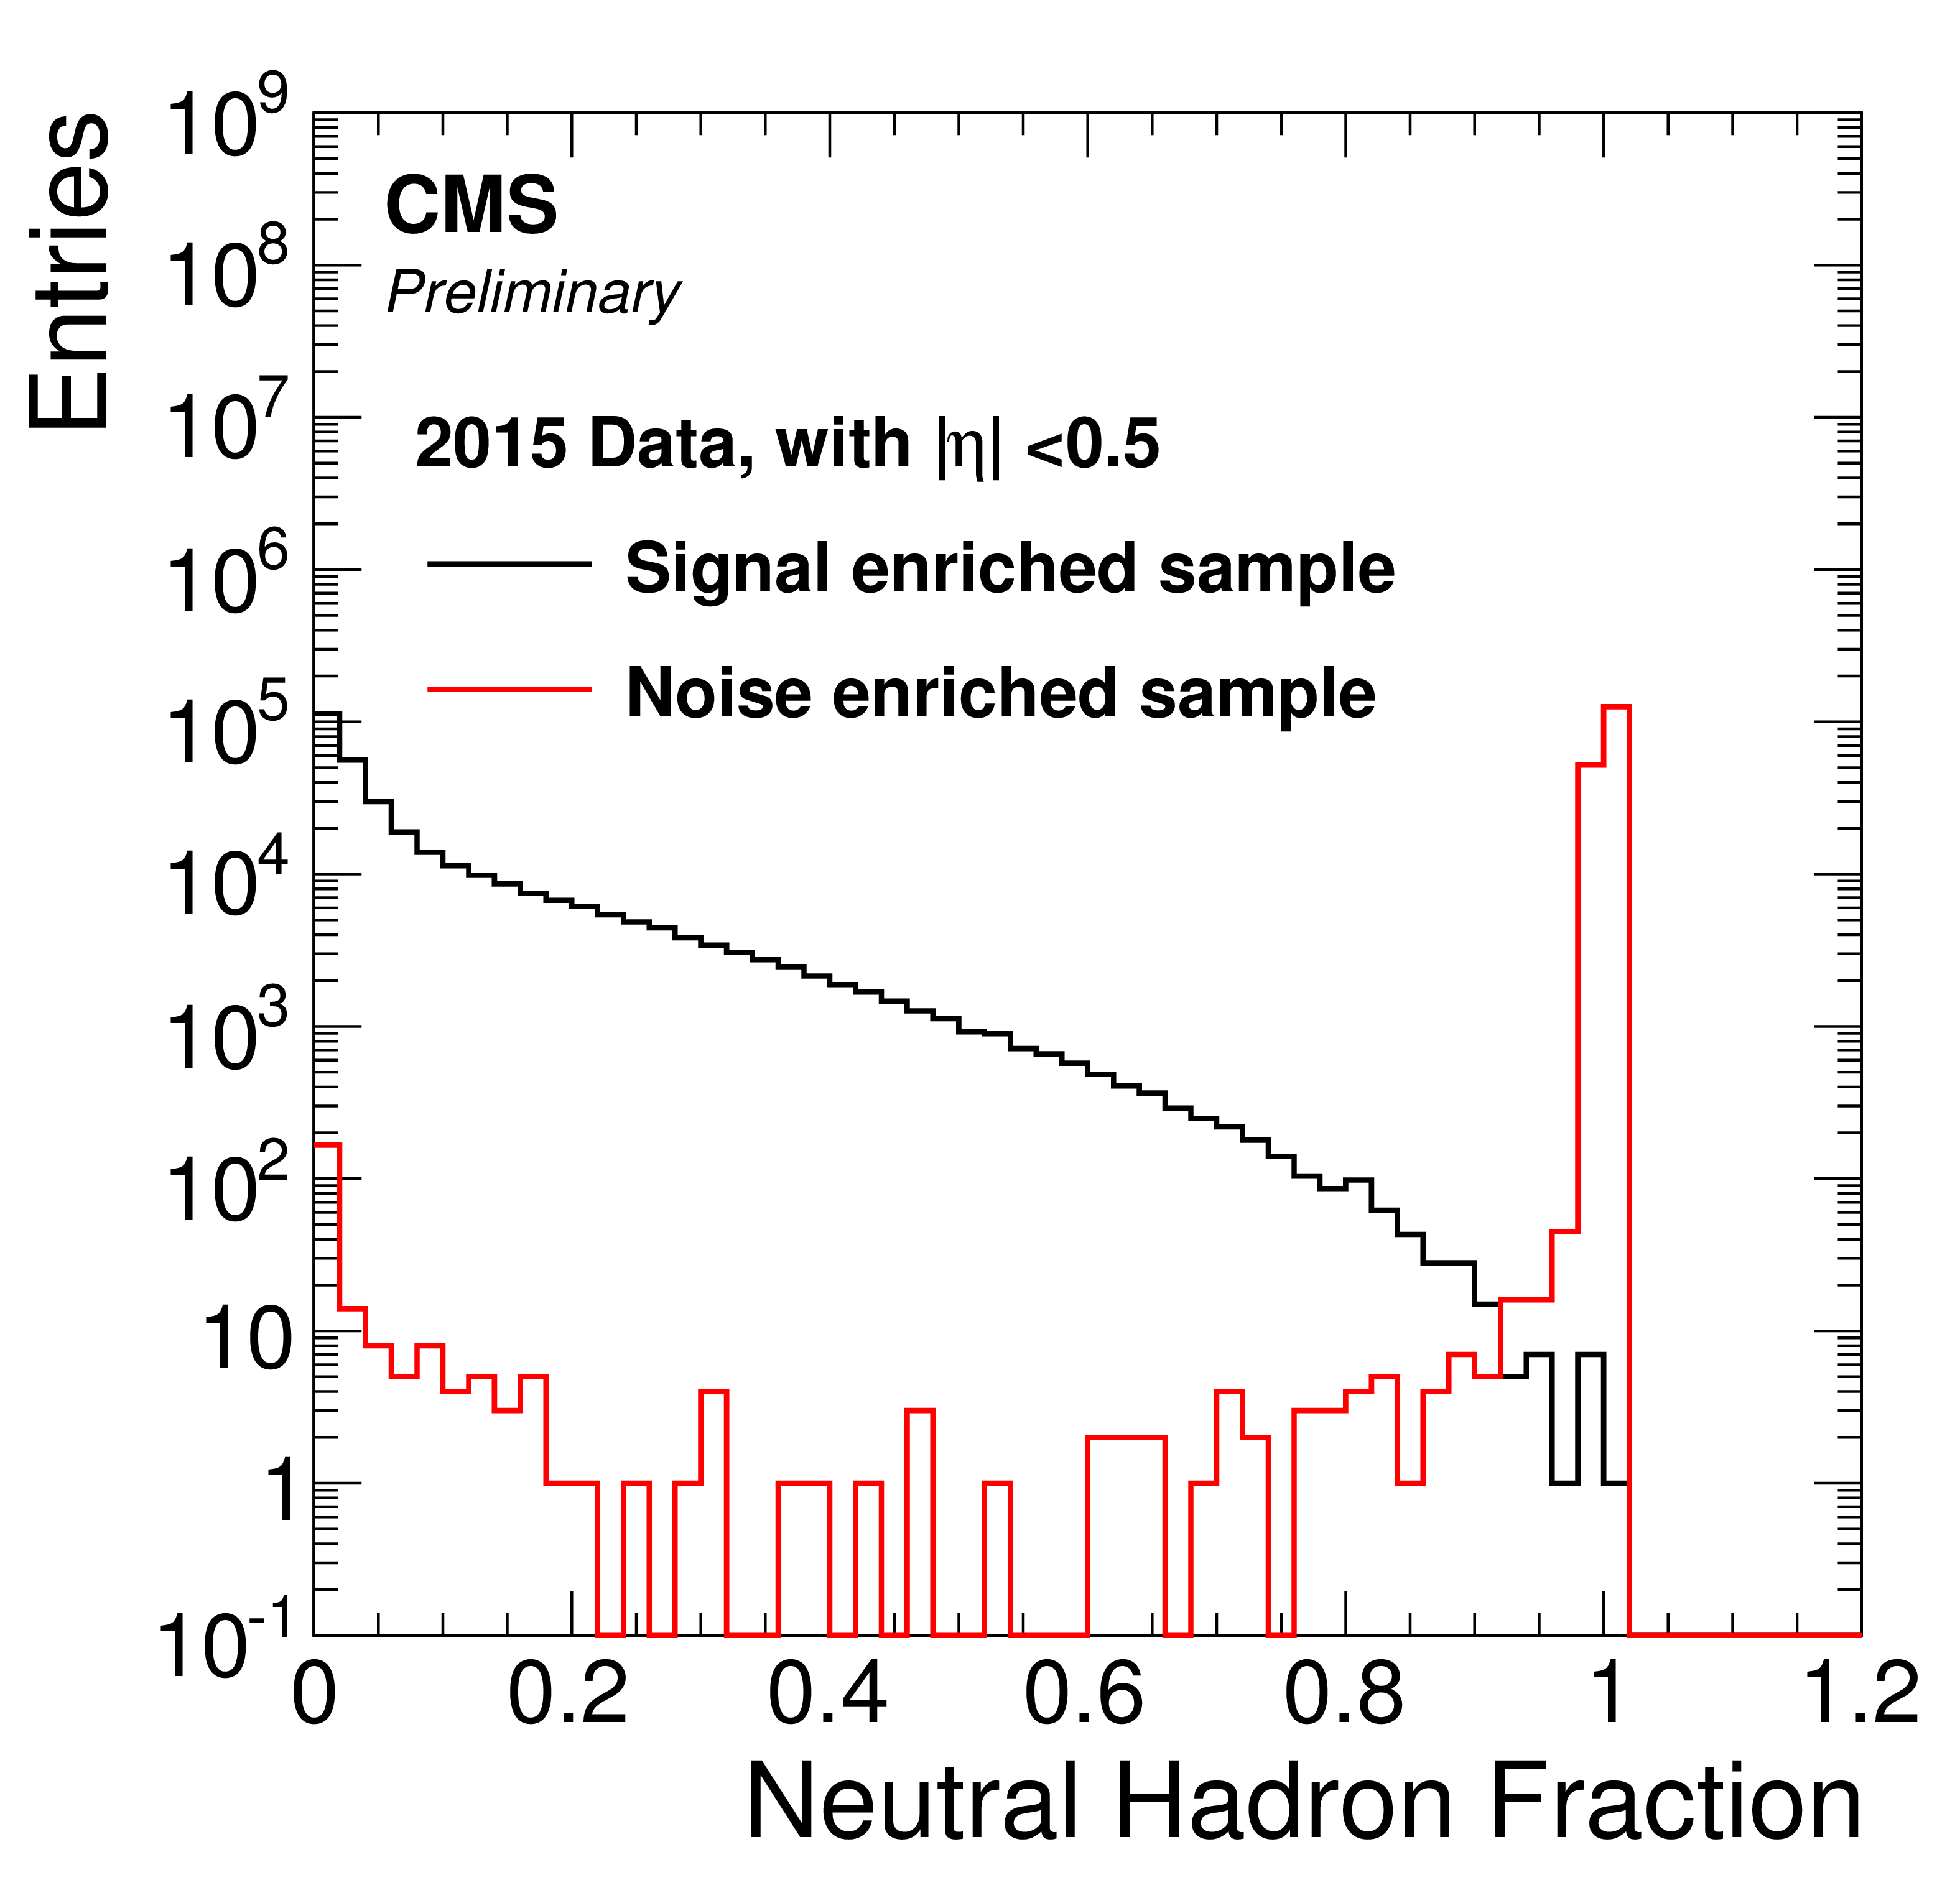
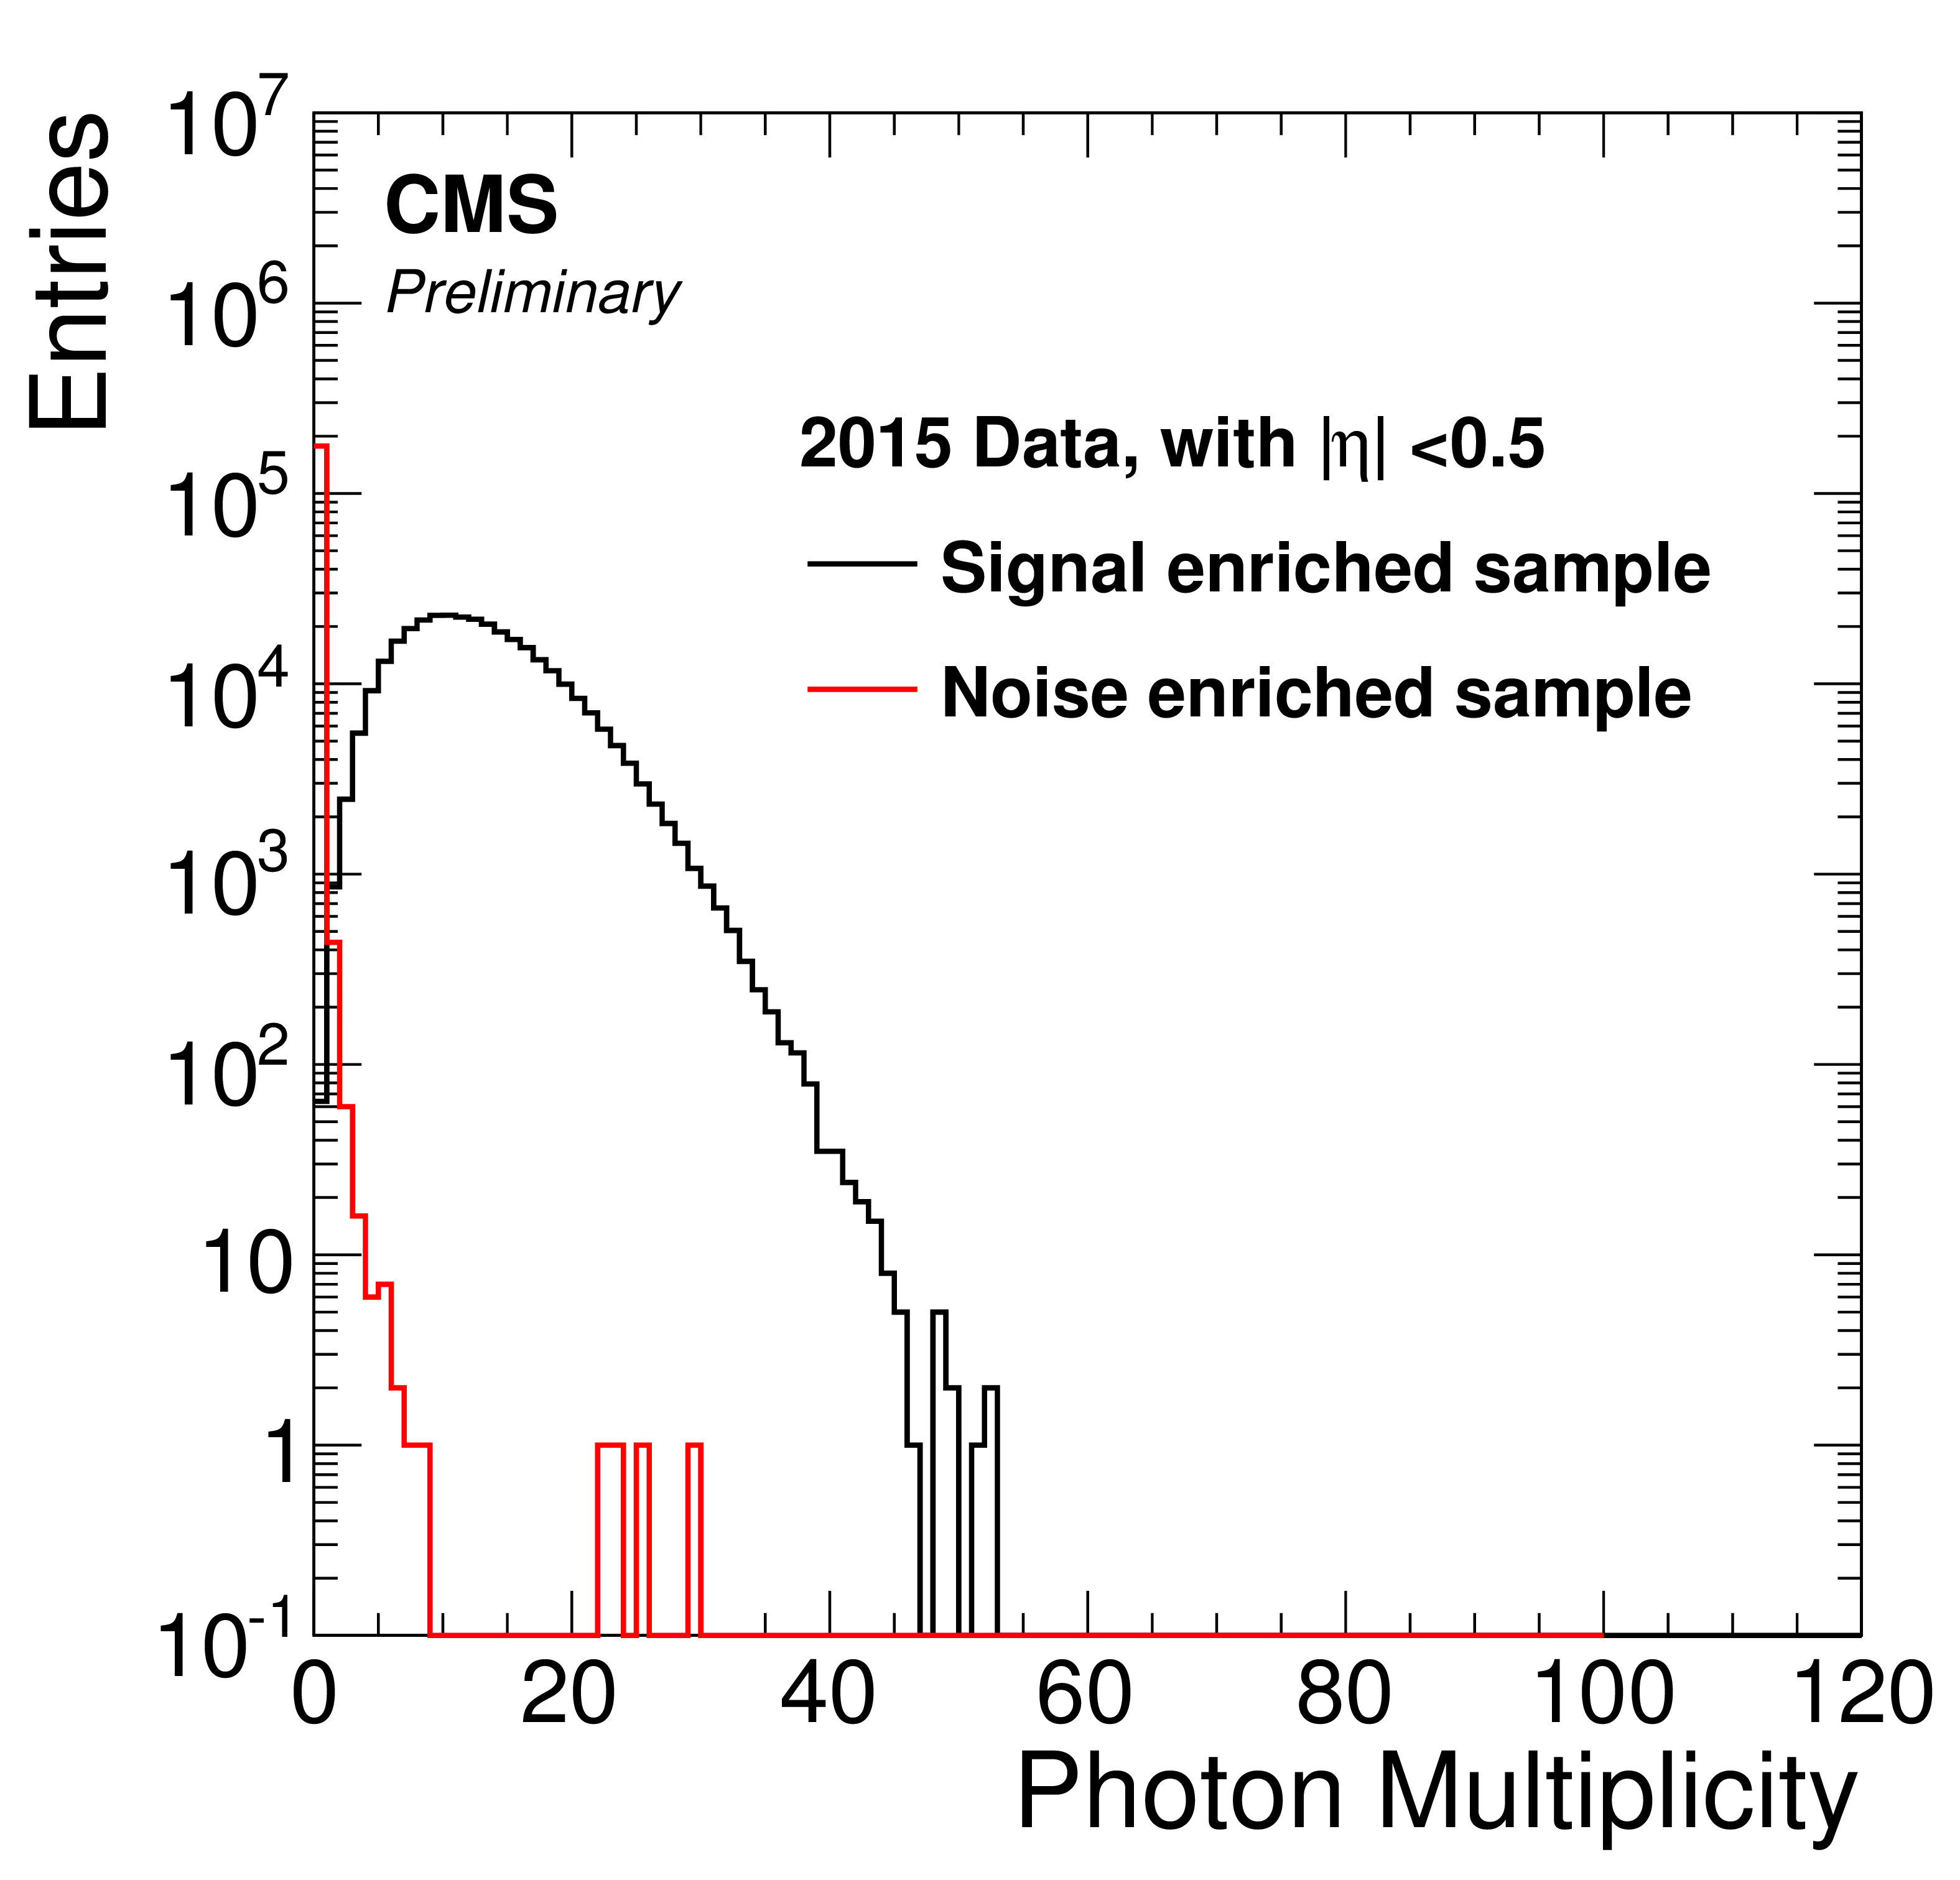
Distributions of PF jet variables for central jets ($|\eta | < $ 0.5) as measured in signal enriched back-to-back dijet events (black) and for noise enriched events from a minimum bias selection (red) before applying the PF jet ID. The quantities plotted are: (a) charged hadron energy fraction, (b) neutral hadron energy fraction, (c) charged electromagnetic energy fraction, (d) neutral electromagnetic energy fraction, (e) muon energy fraction, (f) photon multiplicity, (g) charged multiplicity, (h) neutral multiplicity. |
png pdf |
Figure 2-a:
Distribution of the charged hadron energy fraction for central jets ($|\eta | < $ 0.5) as measured in signal enriched back-to-back dijet events (black) and for noise enriched events from a minimum bias selection (red) before applying the PF jet ID. |
png pdf |
Figure 2-b:
Distribution of the neutral hadron energy fraction for central jets ($|\eta | < $ 0.5) as measured in signal enriched back-to-back dijet events (black) and for noise enriched events from a minimum bias selection (red) before applying the PF jet ID. |

png pdf |
Figure 2-c:
Distribution of the charged electromagnetic energy fraction for central jets ($|\eta | < $ 0.5) as measured in signal enriched back-to-back dijet events (black) and for noise enriched events from a minimum bias selection (red) before applying the PF jet ID. |

png pdf |
Figure 2-d:
Distribution of the neutral electromagnetic energy fraction for central jets ($|\eta | < $ 0.5) as measured in signal enriched back-to-back dijet events (black) and for noise enriched events from a minimum bias selection (red) before applying the PF jet ID. |

png pdf |
Figure 2-e:
Distribution of the muon energy fraction for central jets ($|\eta | < $ 0.5) as measured in signal enriched back-to-back dijet events (black) and for noise enriched events from a minimum bias selection (red) before applying the PF jet ID. |
png pdf |
Figure 2-f:
Distribution of the photon multiplicity for central jets ($|\eta | < $ 0.5) as measured in signal enriched back-to-back dijet events (black) and for noise enriched events from a minimum bias selection (red) before applying the PF jet ID. |

png pdf |
Figure 2-g:
Distribution of the charged multiplicity for central jets ($|\eta | < $ 0.5) as measured in signal enriched back-to-back dijet events (black) and for noise enriched events from a minimum bias selection (red) before applying the PF jet ID. |

png pdf |
Figure 2-h:
Distribution of the neutral multiplicity for central jets ($|\eta | < $ 0.5) as measured in signal enriched back-to-back dijet events (black) and for noise enriched events from a minimum bias selection (red) before applying the PF jet ID. |

png pdf |
Figure 3:
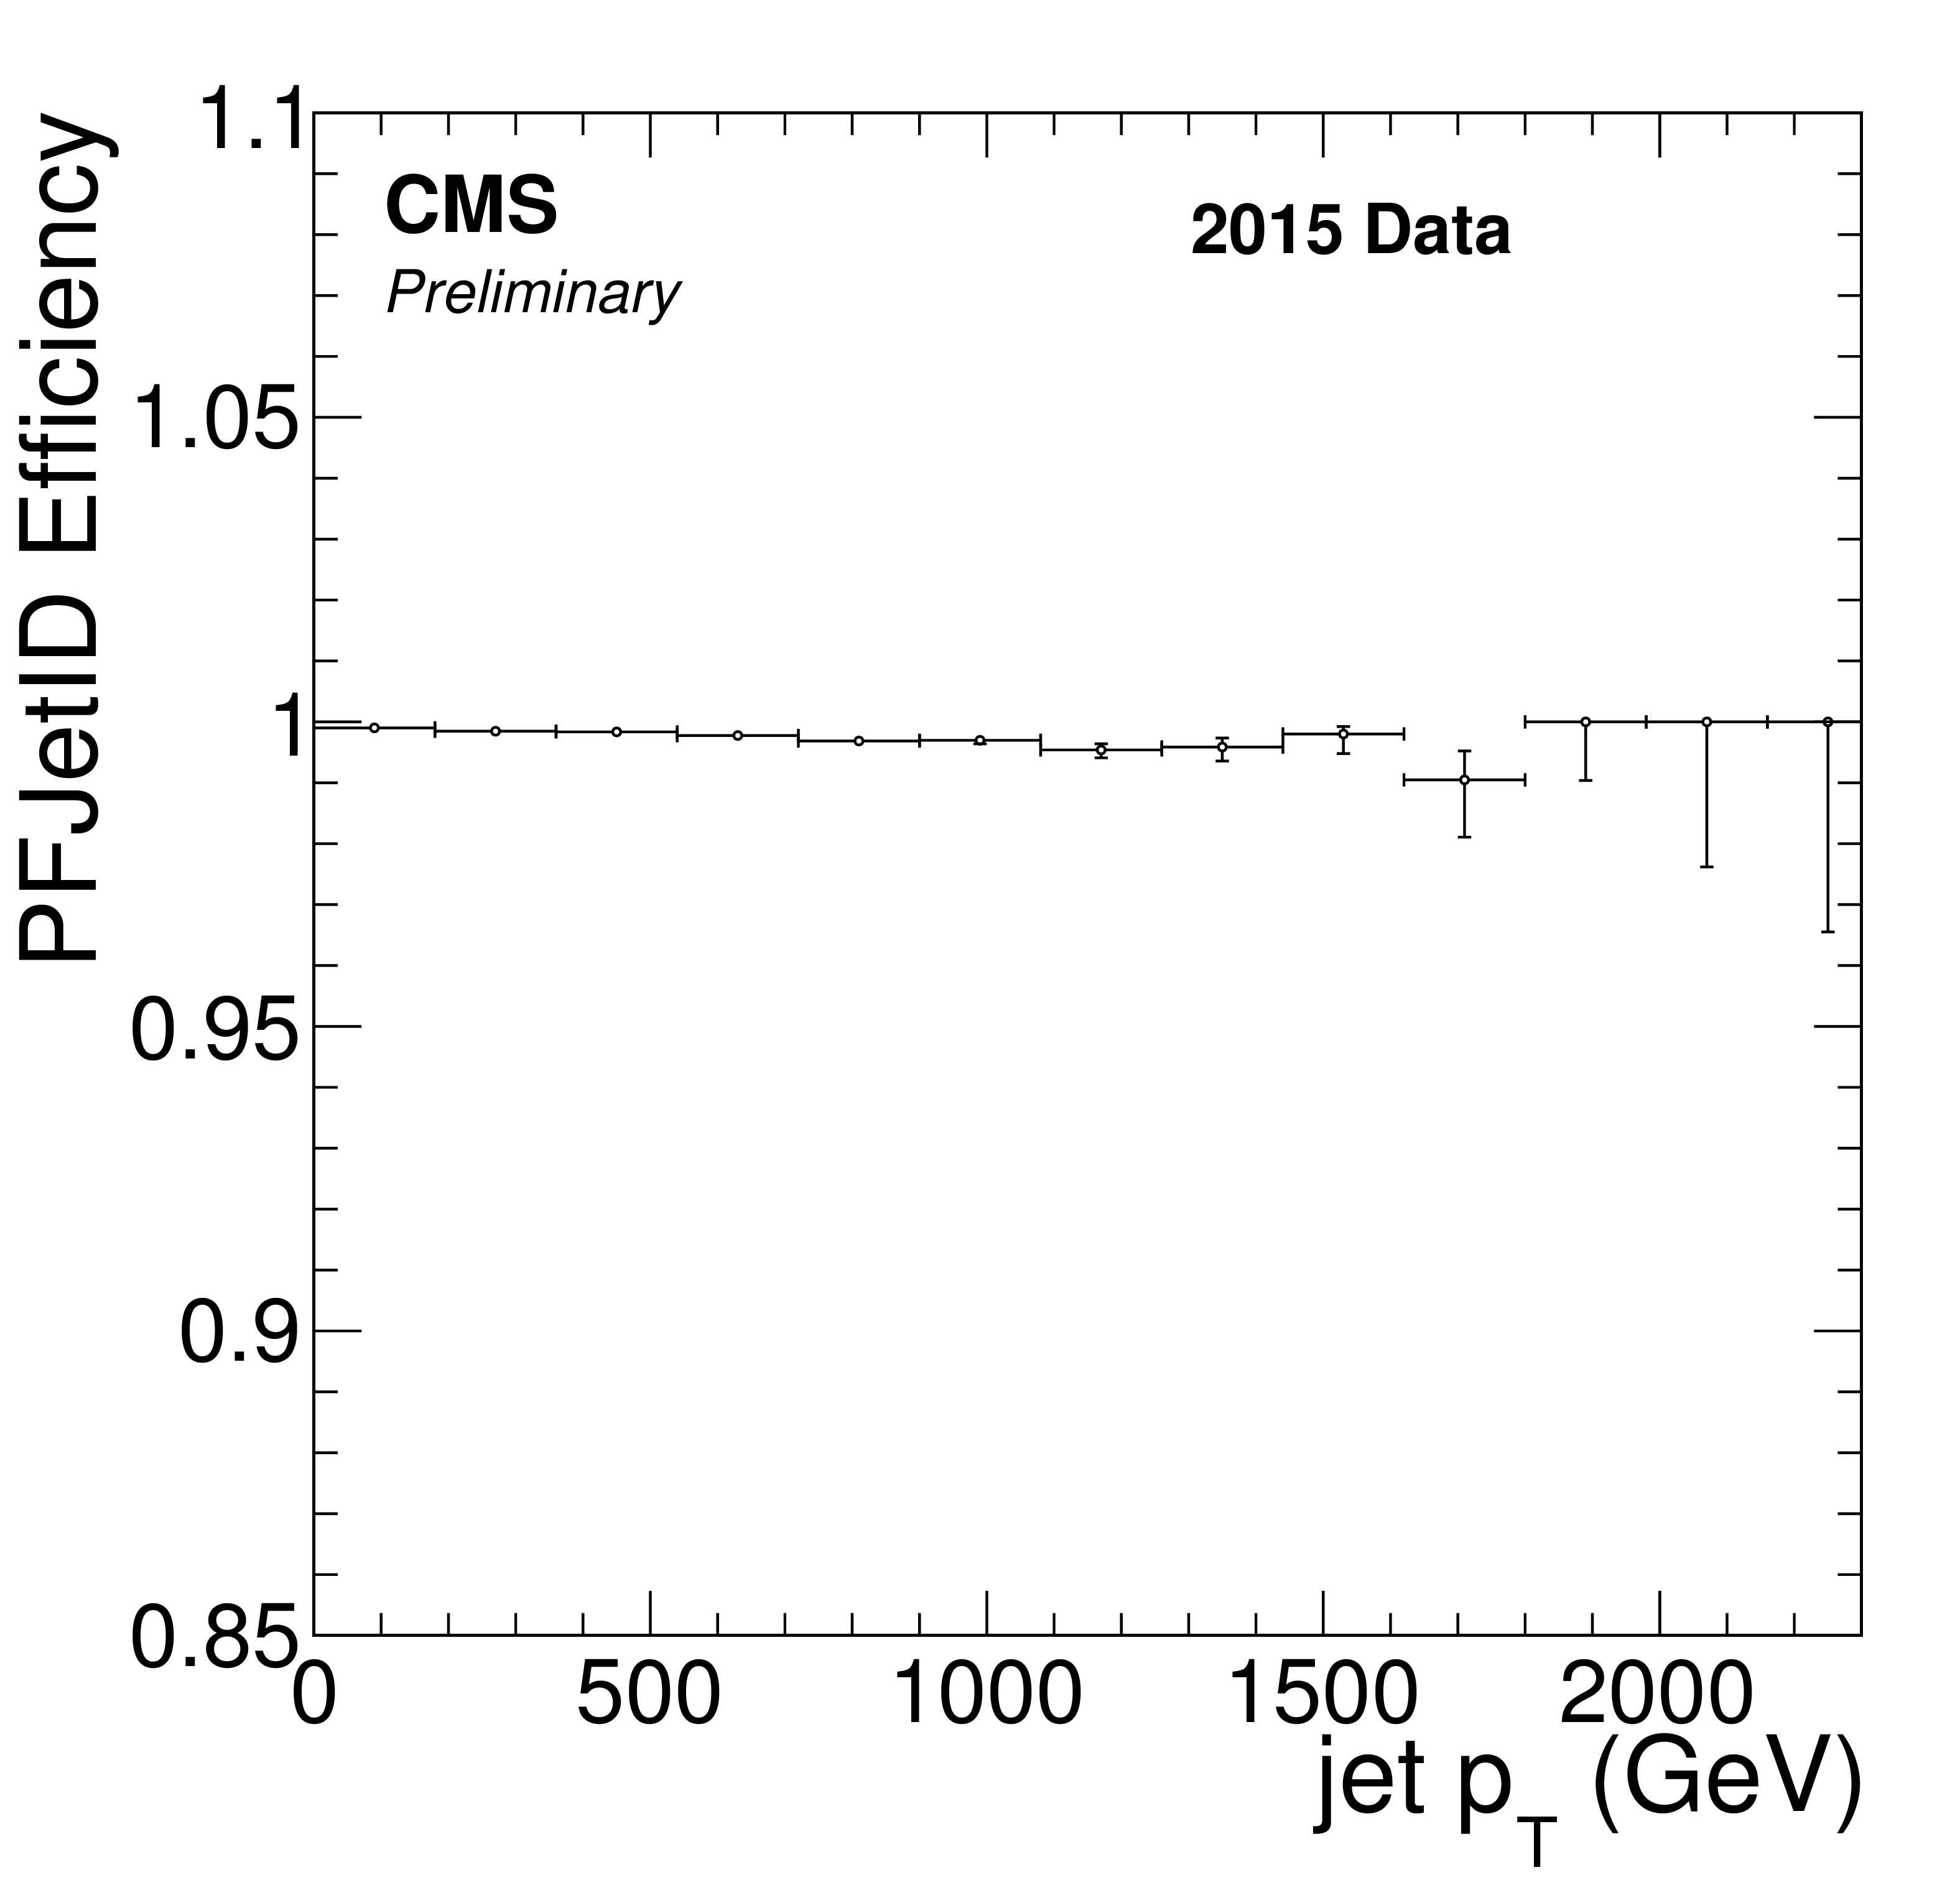
The tight PF jet ID efficiency (a) as a function of $ {p_{\mathrm {T}}} $ for central jets ($|\eta | < $ 0.5) and (b) as a function of $|\eta |$ for 30 $ < {p_{\mathrm {T}}} < $ 100 GeV. |
png pdf |
Figure 3-a:
The tight PF jet ID efficiency as a function of $ {p_{\mathrm {T}}} $ for central jets ($|\eta | < $ 0.5). |
png pdf |
Figure 3-b:
The tight PF jet ID efficiency as a function of $|\eta |$ for 30 $ < {p_{\mathrm {T}}} < $ 100 GeV. |
png pdf |
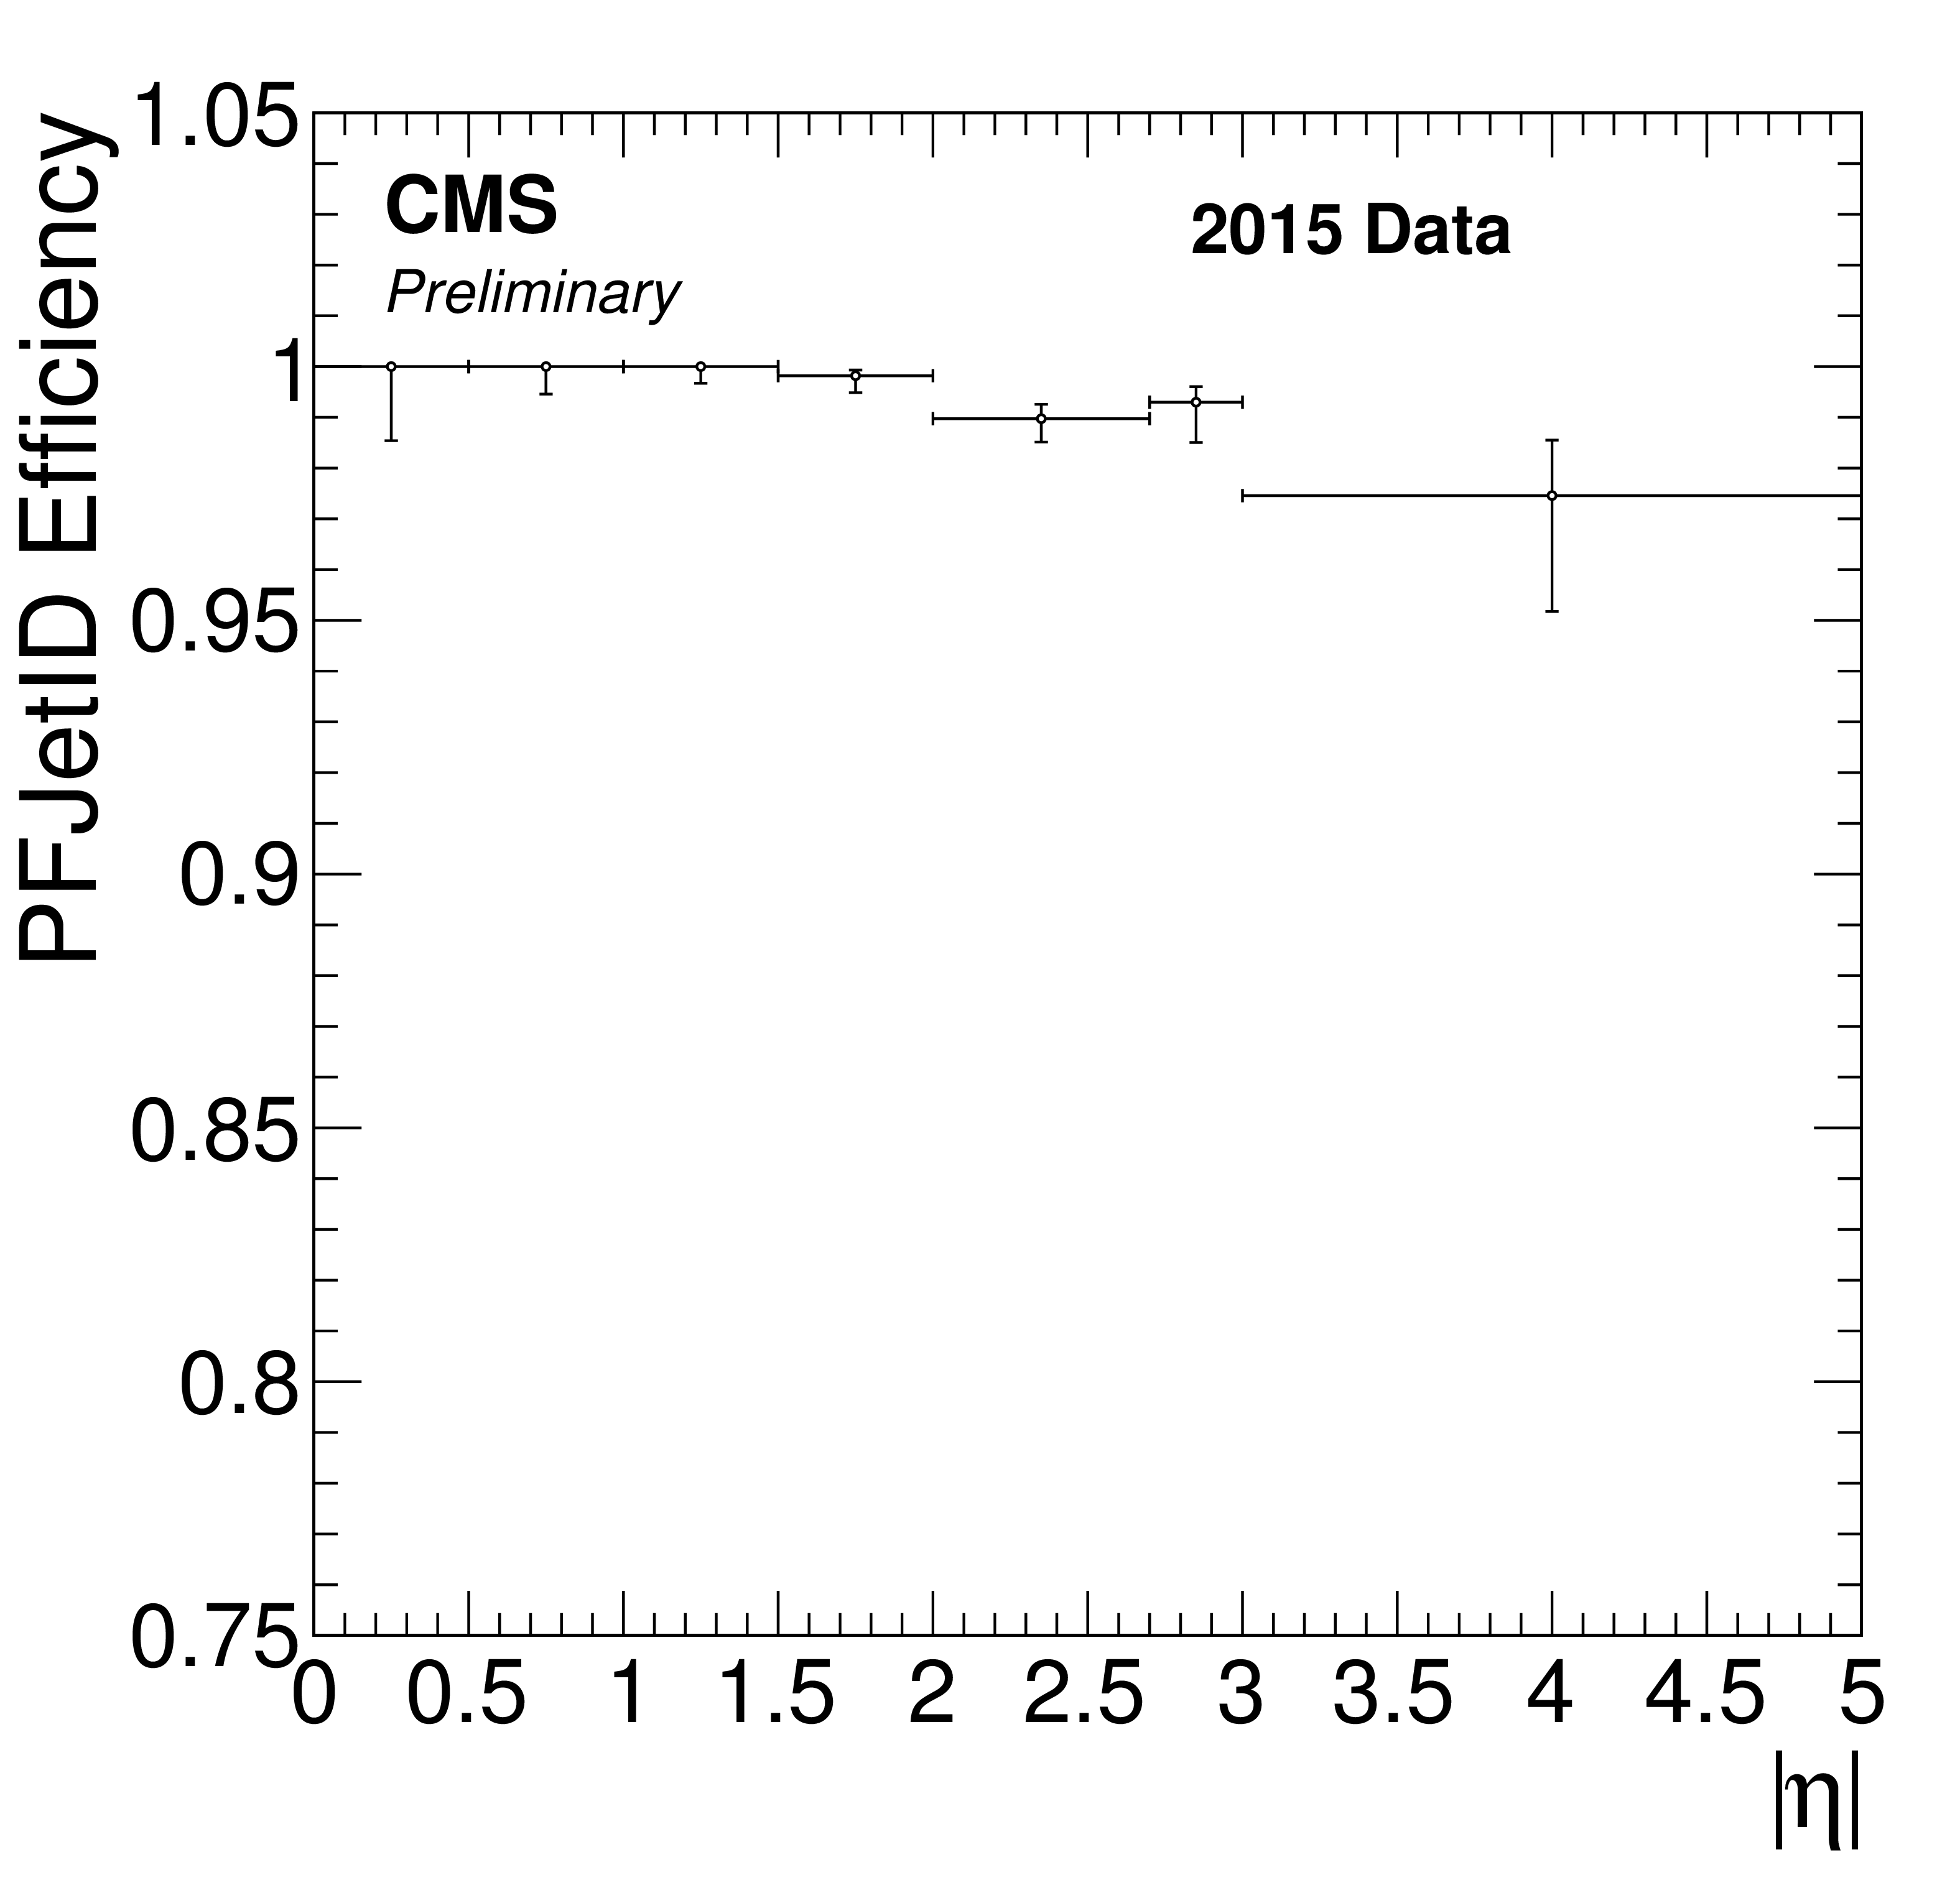
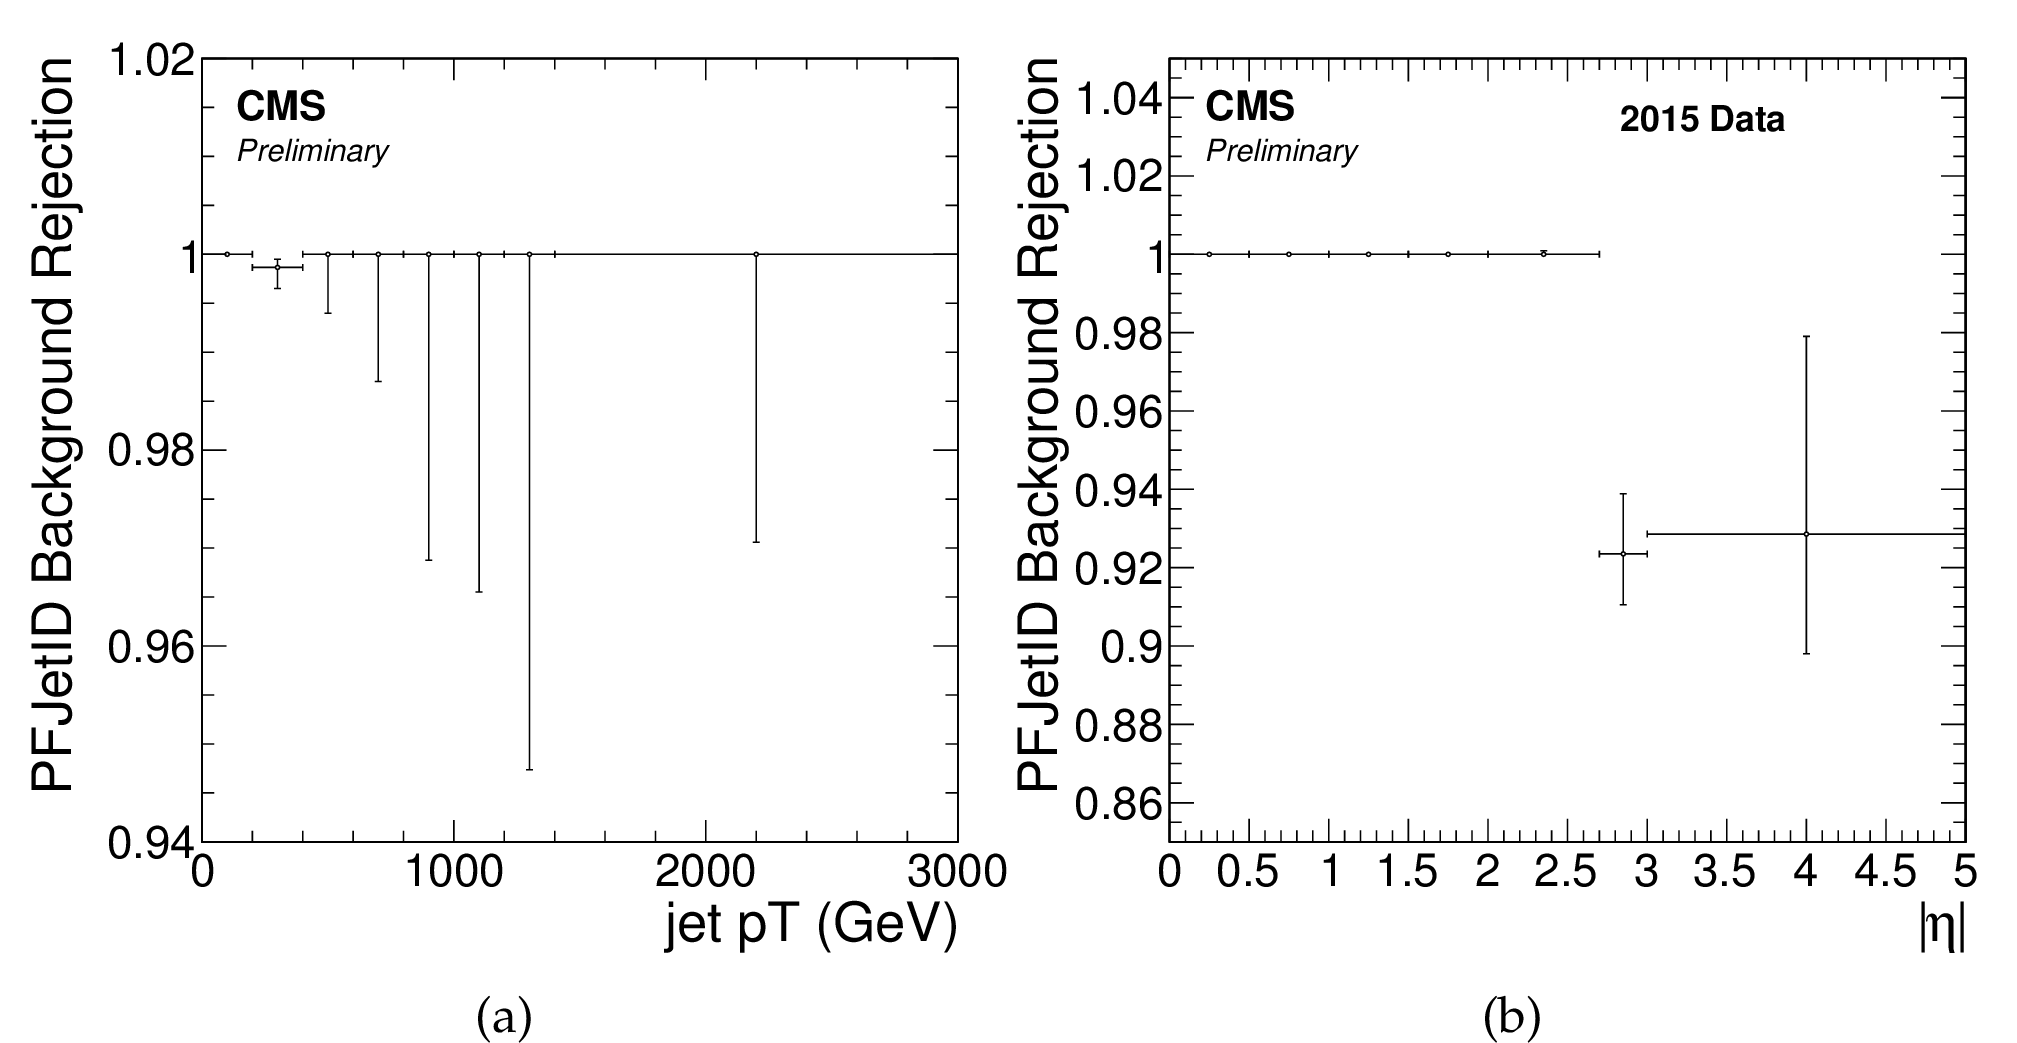
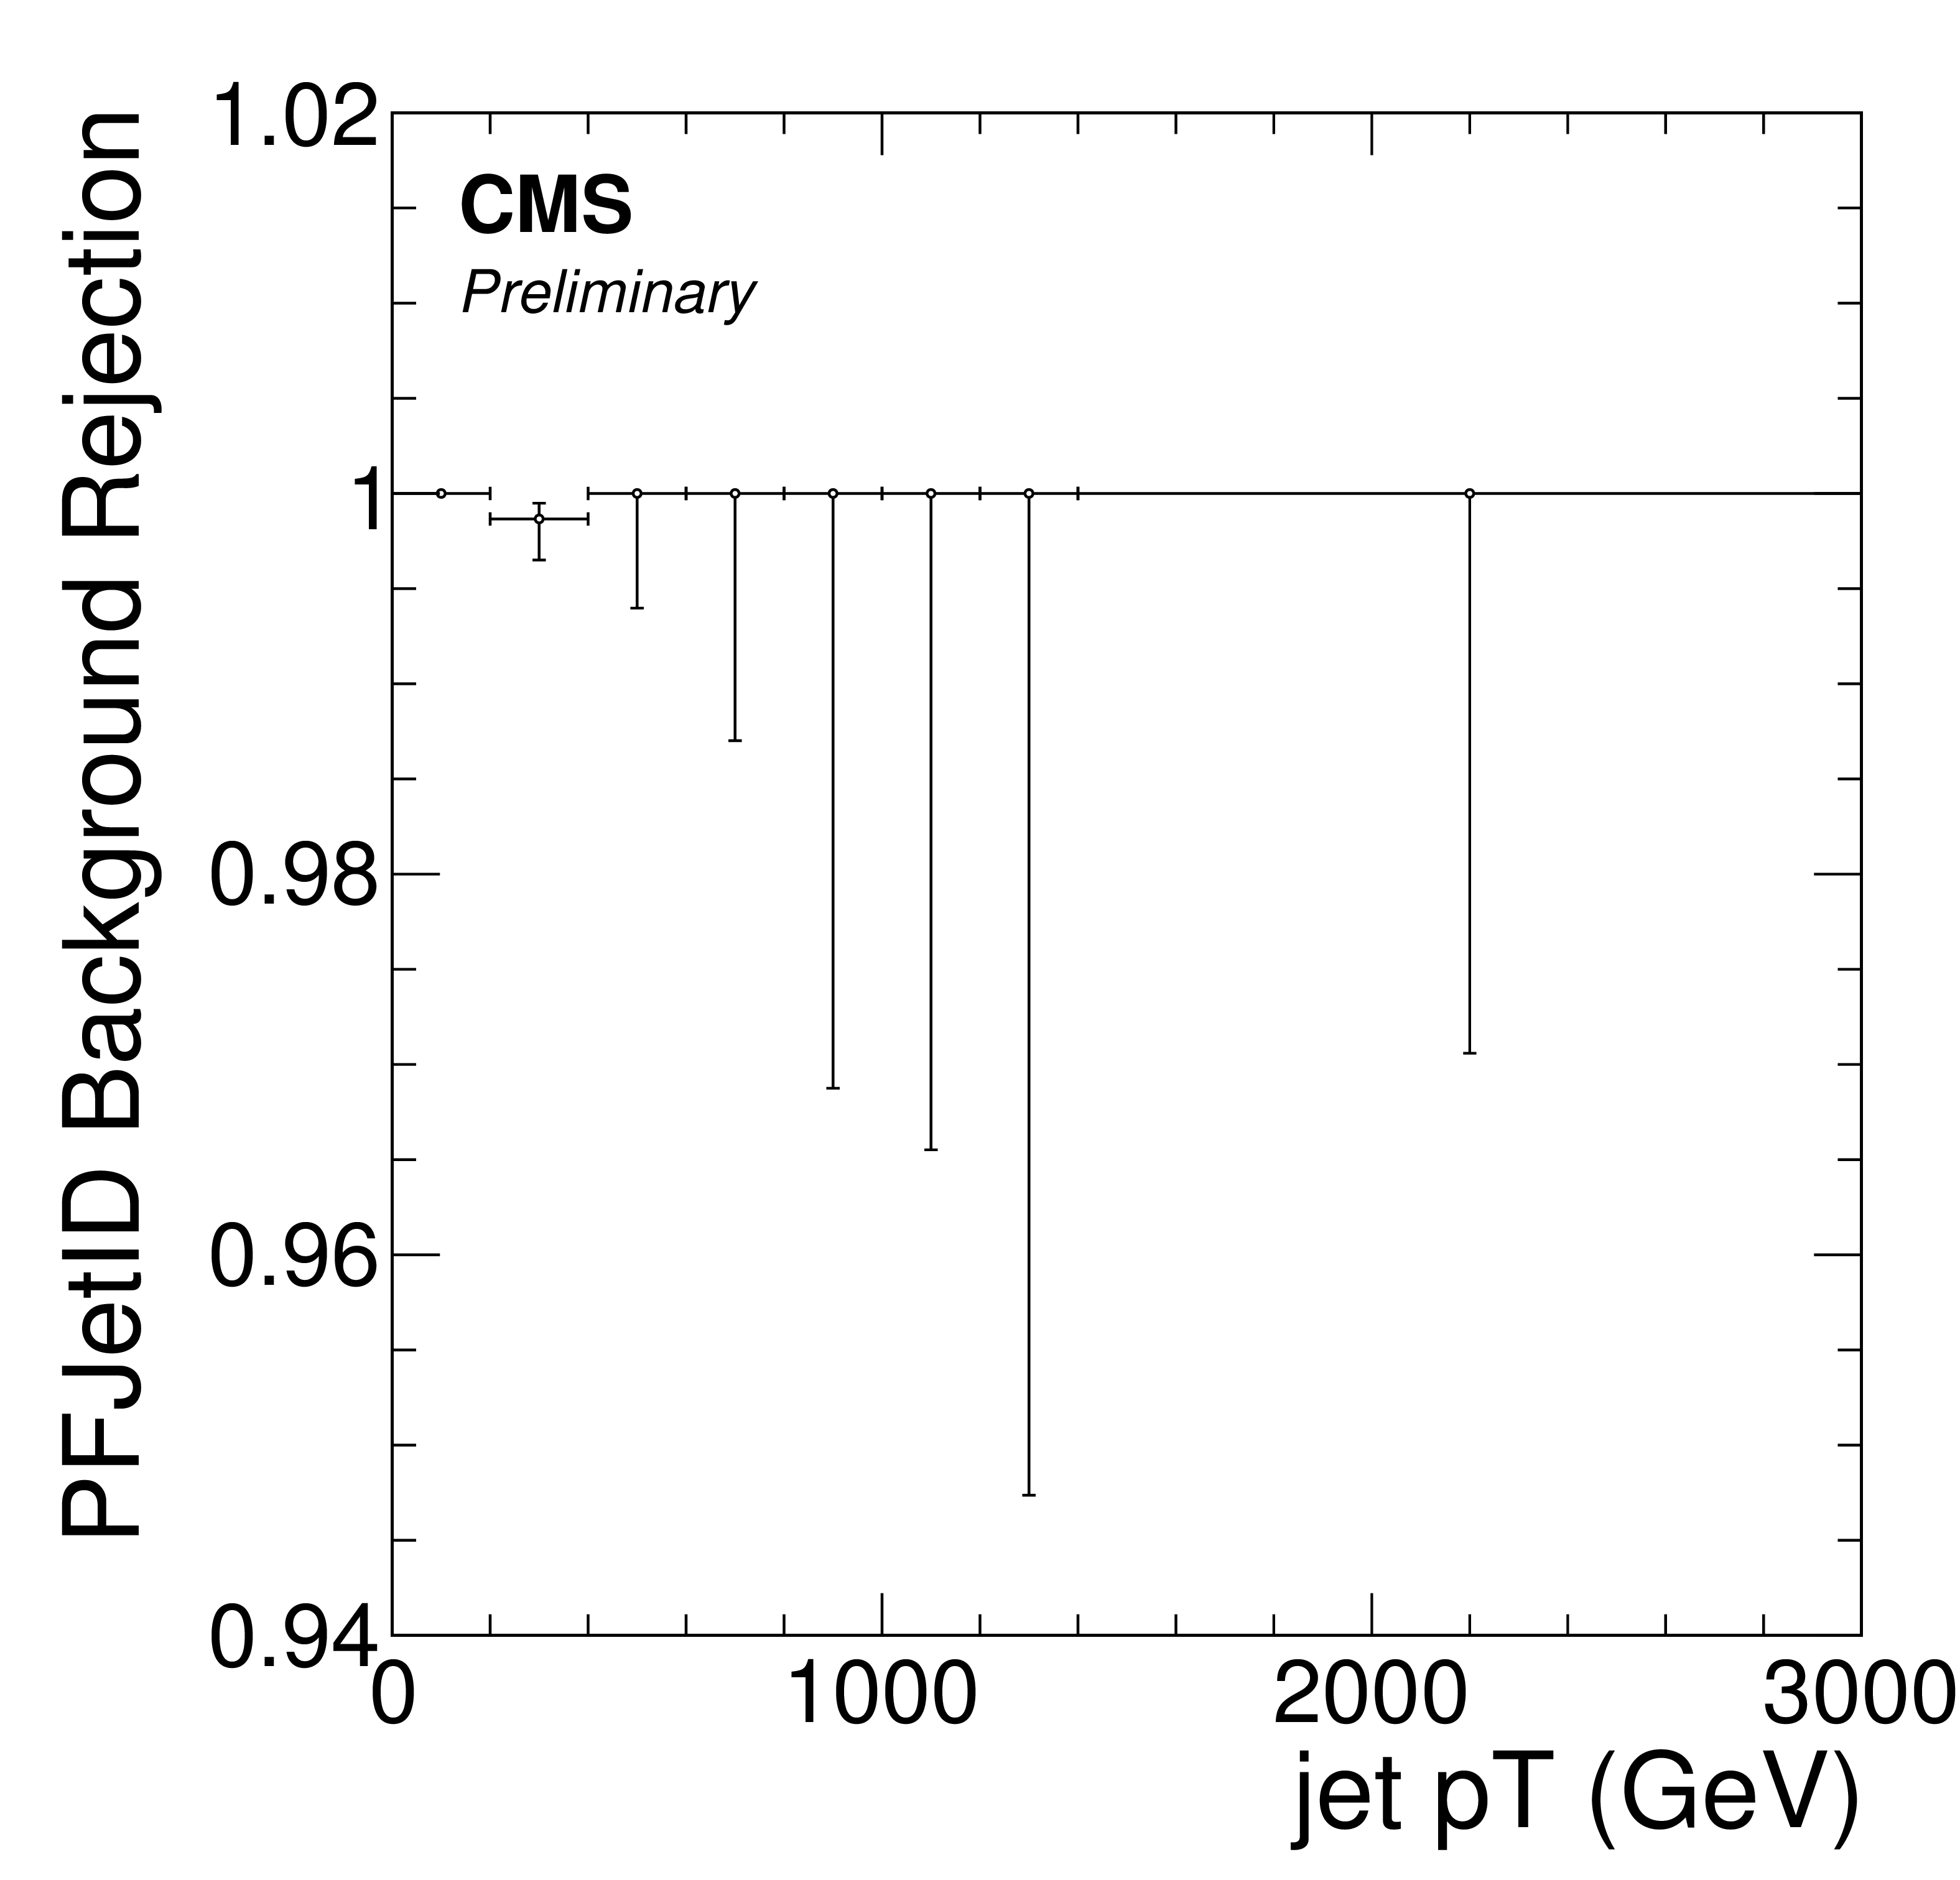
Figure 4:
The noise jet background rejection rate for the tight PF jet ID criteria (a) as a function of $ {p_{\mathrm {T}}} $ for central jets ($|\eta | < $ 0.5) and (b) as a function of $\eta $ for 30 $ < {p_{\mathrm {T}}} < $ 100 GeV. |
png pdf |
Figure 4-a:
The noise jet background rejection rate for the tight PF jet ID criteria as a function of $ {p_{\mathrm {T}}} $ for central jets ($|\eta | < $ 0.5). |

png pdf |
Figure 4-b:
The noise jet background rejection rate for the tight PF jet ID criteria as a function of $\eta $ for 30 $ < {p_{\mathrm {T}}} < $ 100 GeV. |

png pdf |
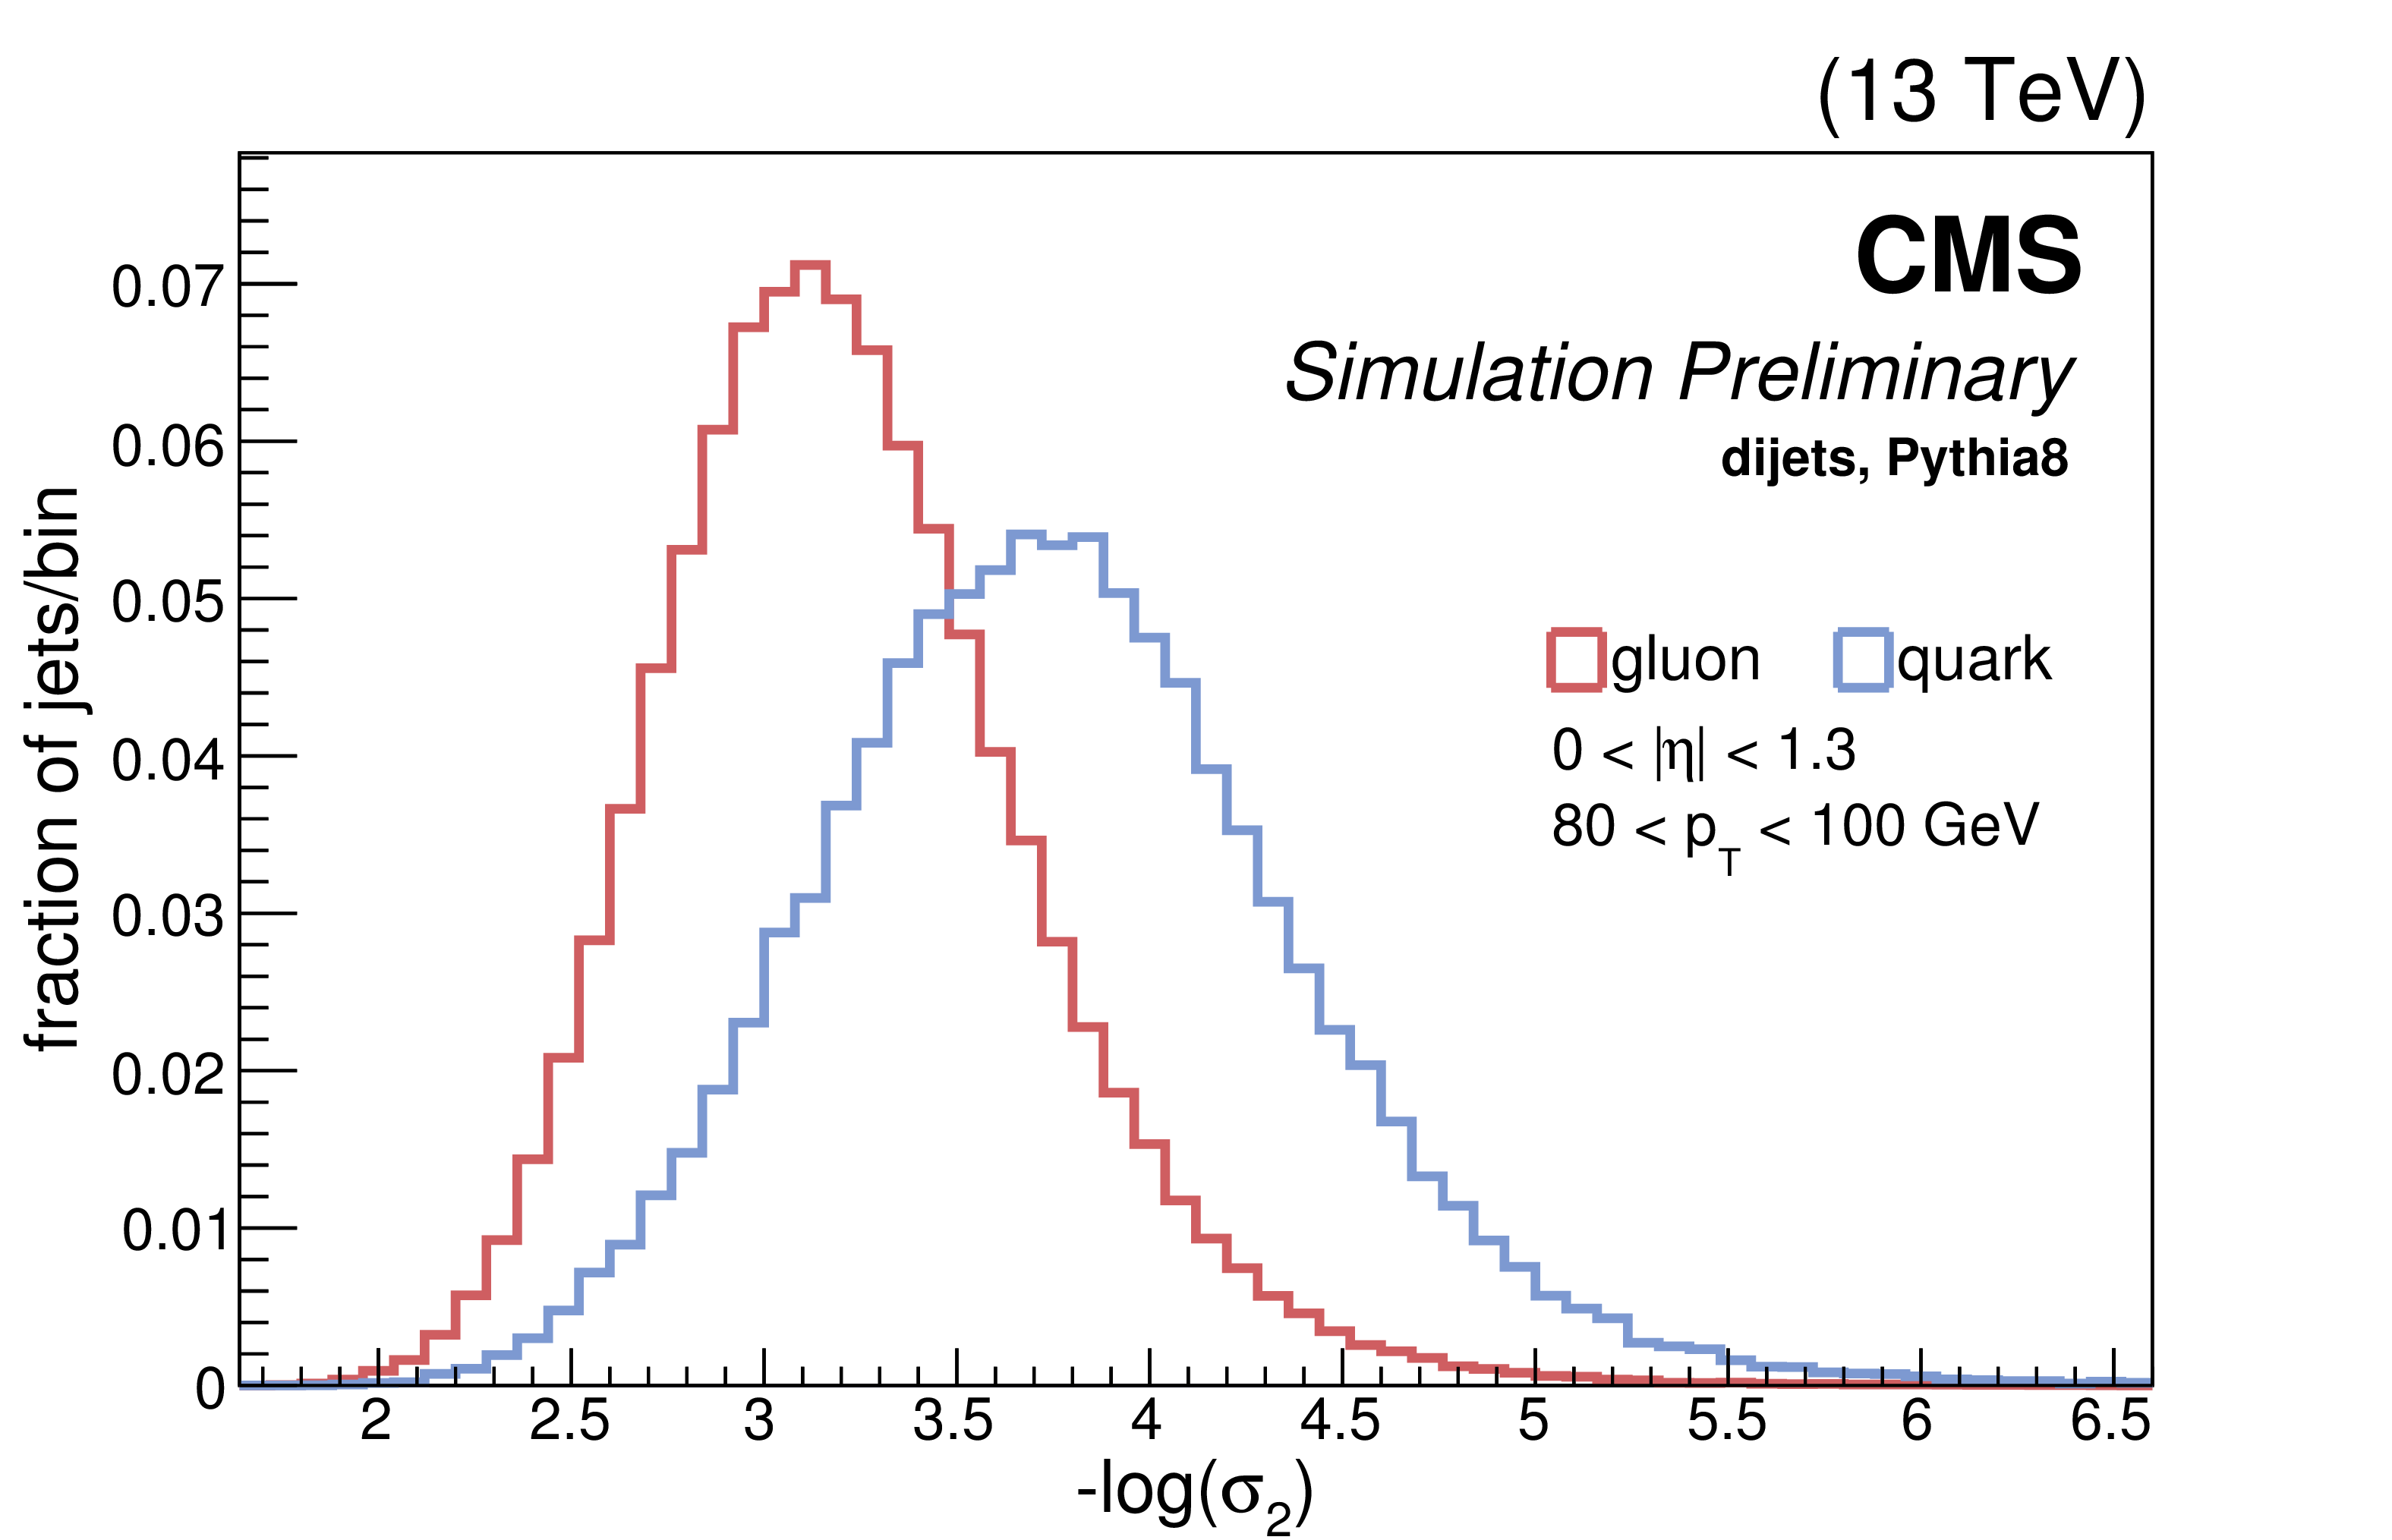
Figure 5:
Quark-gluon discrimination variables from simulation: (a) $ {p_{\mathrm {T}}} {D}$ (b) multiplicity (c) $\sigma _{2}$ (d) the quark-gluon likelihood. |

png pdf |
Figure 5-a:
Quark-gluon discrimination variable from simulation: $ {p_{\mathrm {T}}} {D}$. |

png pdf |
Figure 5-b:
Quark-gluon discrimination variable from simulation: multiplicity. |
png pdf |
Figure 5-c:
Quark-gluon discrimination variable from simulation: $\sigma _{2}$. |

png pdf |
Figure 5-d:
Quark-gluon discrimination variable from simulation: the quark-gluon likelihood. |

png pdf |
Figure 6:
Quark jet tagging efficiency as a function of the gluon jet rejection rate: (a) individual variable discrimination rate compared to the full likelihood (b) likelihood performance in different kinematic regions. |

png pdf |
Figure 6-a:
Quark jet tagging efficiency as a function of the gluon jet rejection rate: individual variable discrimination rate compared to the full likelihood. |

png pdf |
Figure 6-b:
Quark jet tagging efficiency as a function of the gluon jet rejection rate: likelihood performance in different kinematic regions. |

png pdf |
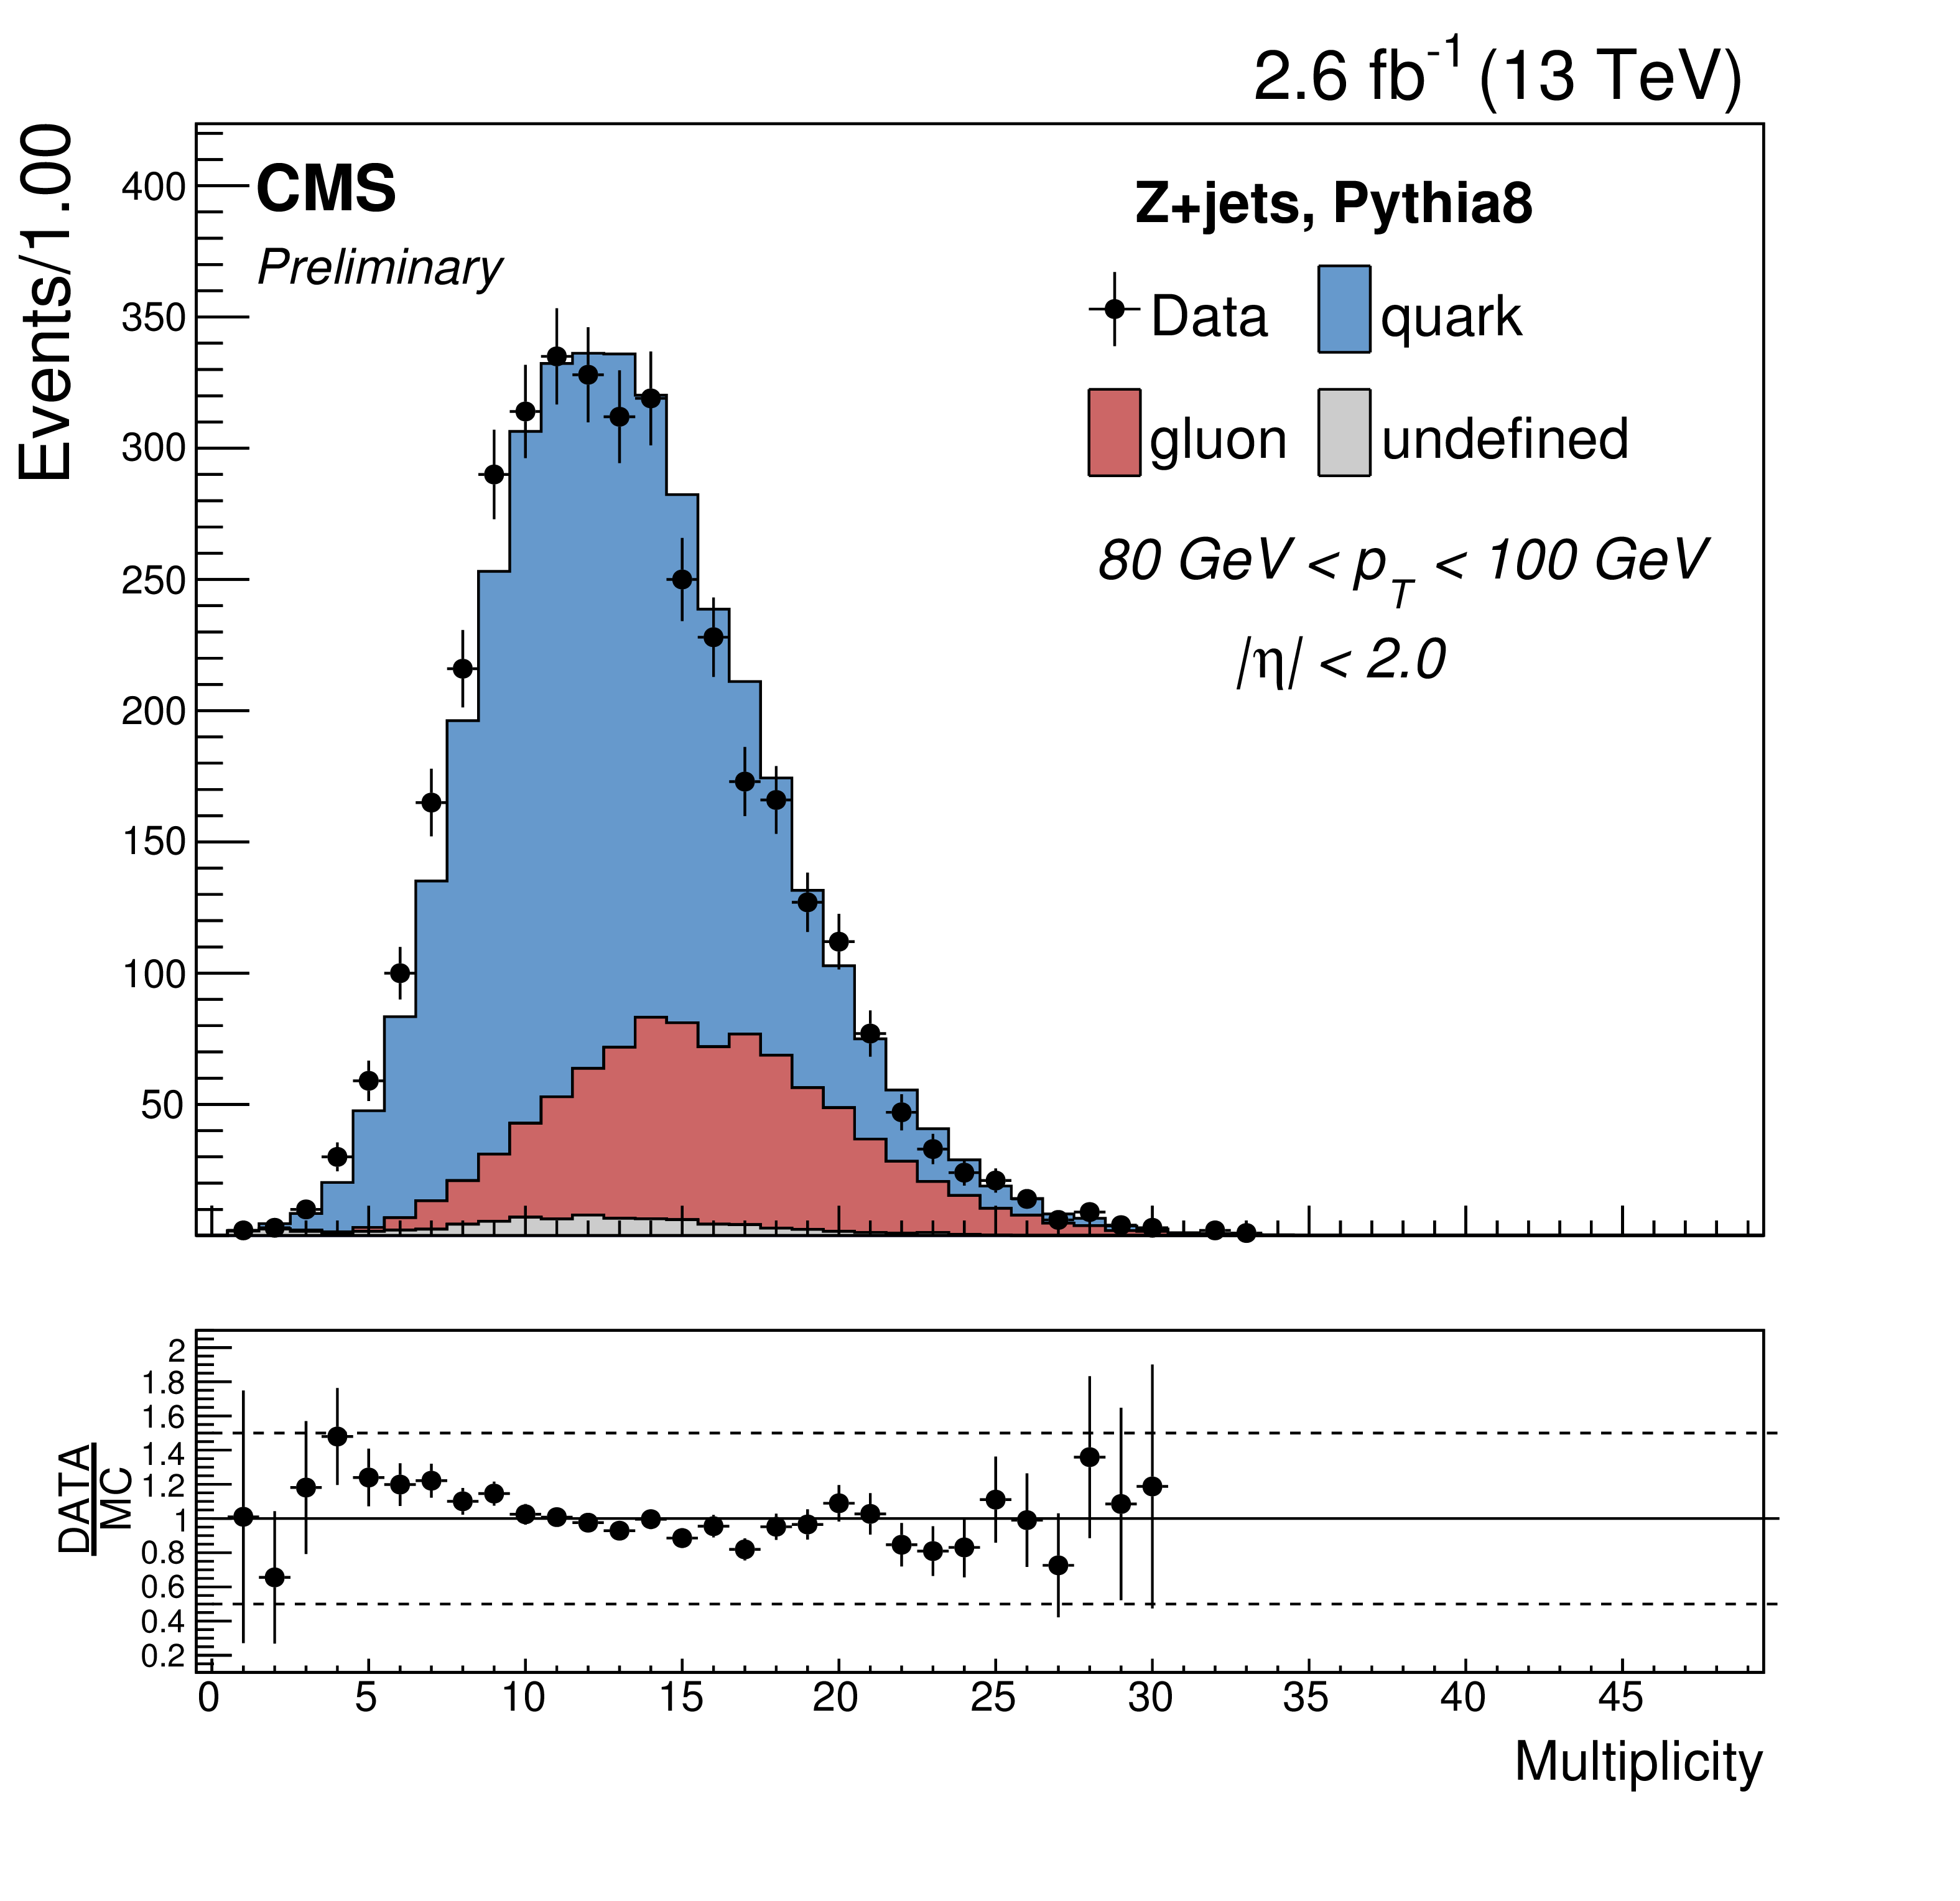
Figure 7:
Data-MC comparisons, for jets with 80 $ < p_{\mathrm {T}} < $ 100 GeV and $|\eta |< $ 2 in Z+jets events, of the three input variables used in the discriminator: multiplicity (right), $ {p_{\mathrm {T}}} D$ (center) and $\sigma _2$ (right). The data (black markers) are compared to the MadGraph /PYTHIA simulation, on which the different components are shown: quarks (blue), gluon (red) and unmatched/pileup (grey). |
png pdf |
Figure 7-a:
Data-MC comparisons, for jets with 80 $ < p_{\mathrm {T}} < $ 100 GeV and $|\eta |< $ 2 in Z+jets events, of one of the three input variables used in the discriminator: multiplicity. The data (black markers) are compared to the MadGraph /PYTHIA simulation, on which the different components are shown: quarks (blue), gluon (red) and unmatched/pileup (grey). |
png pdf |
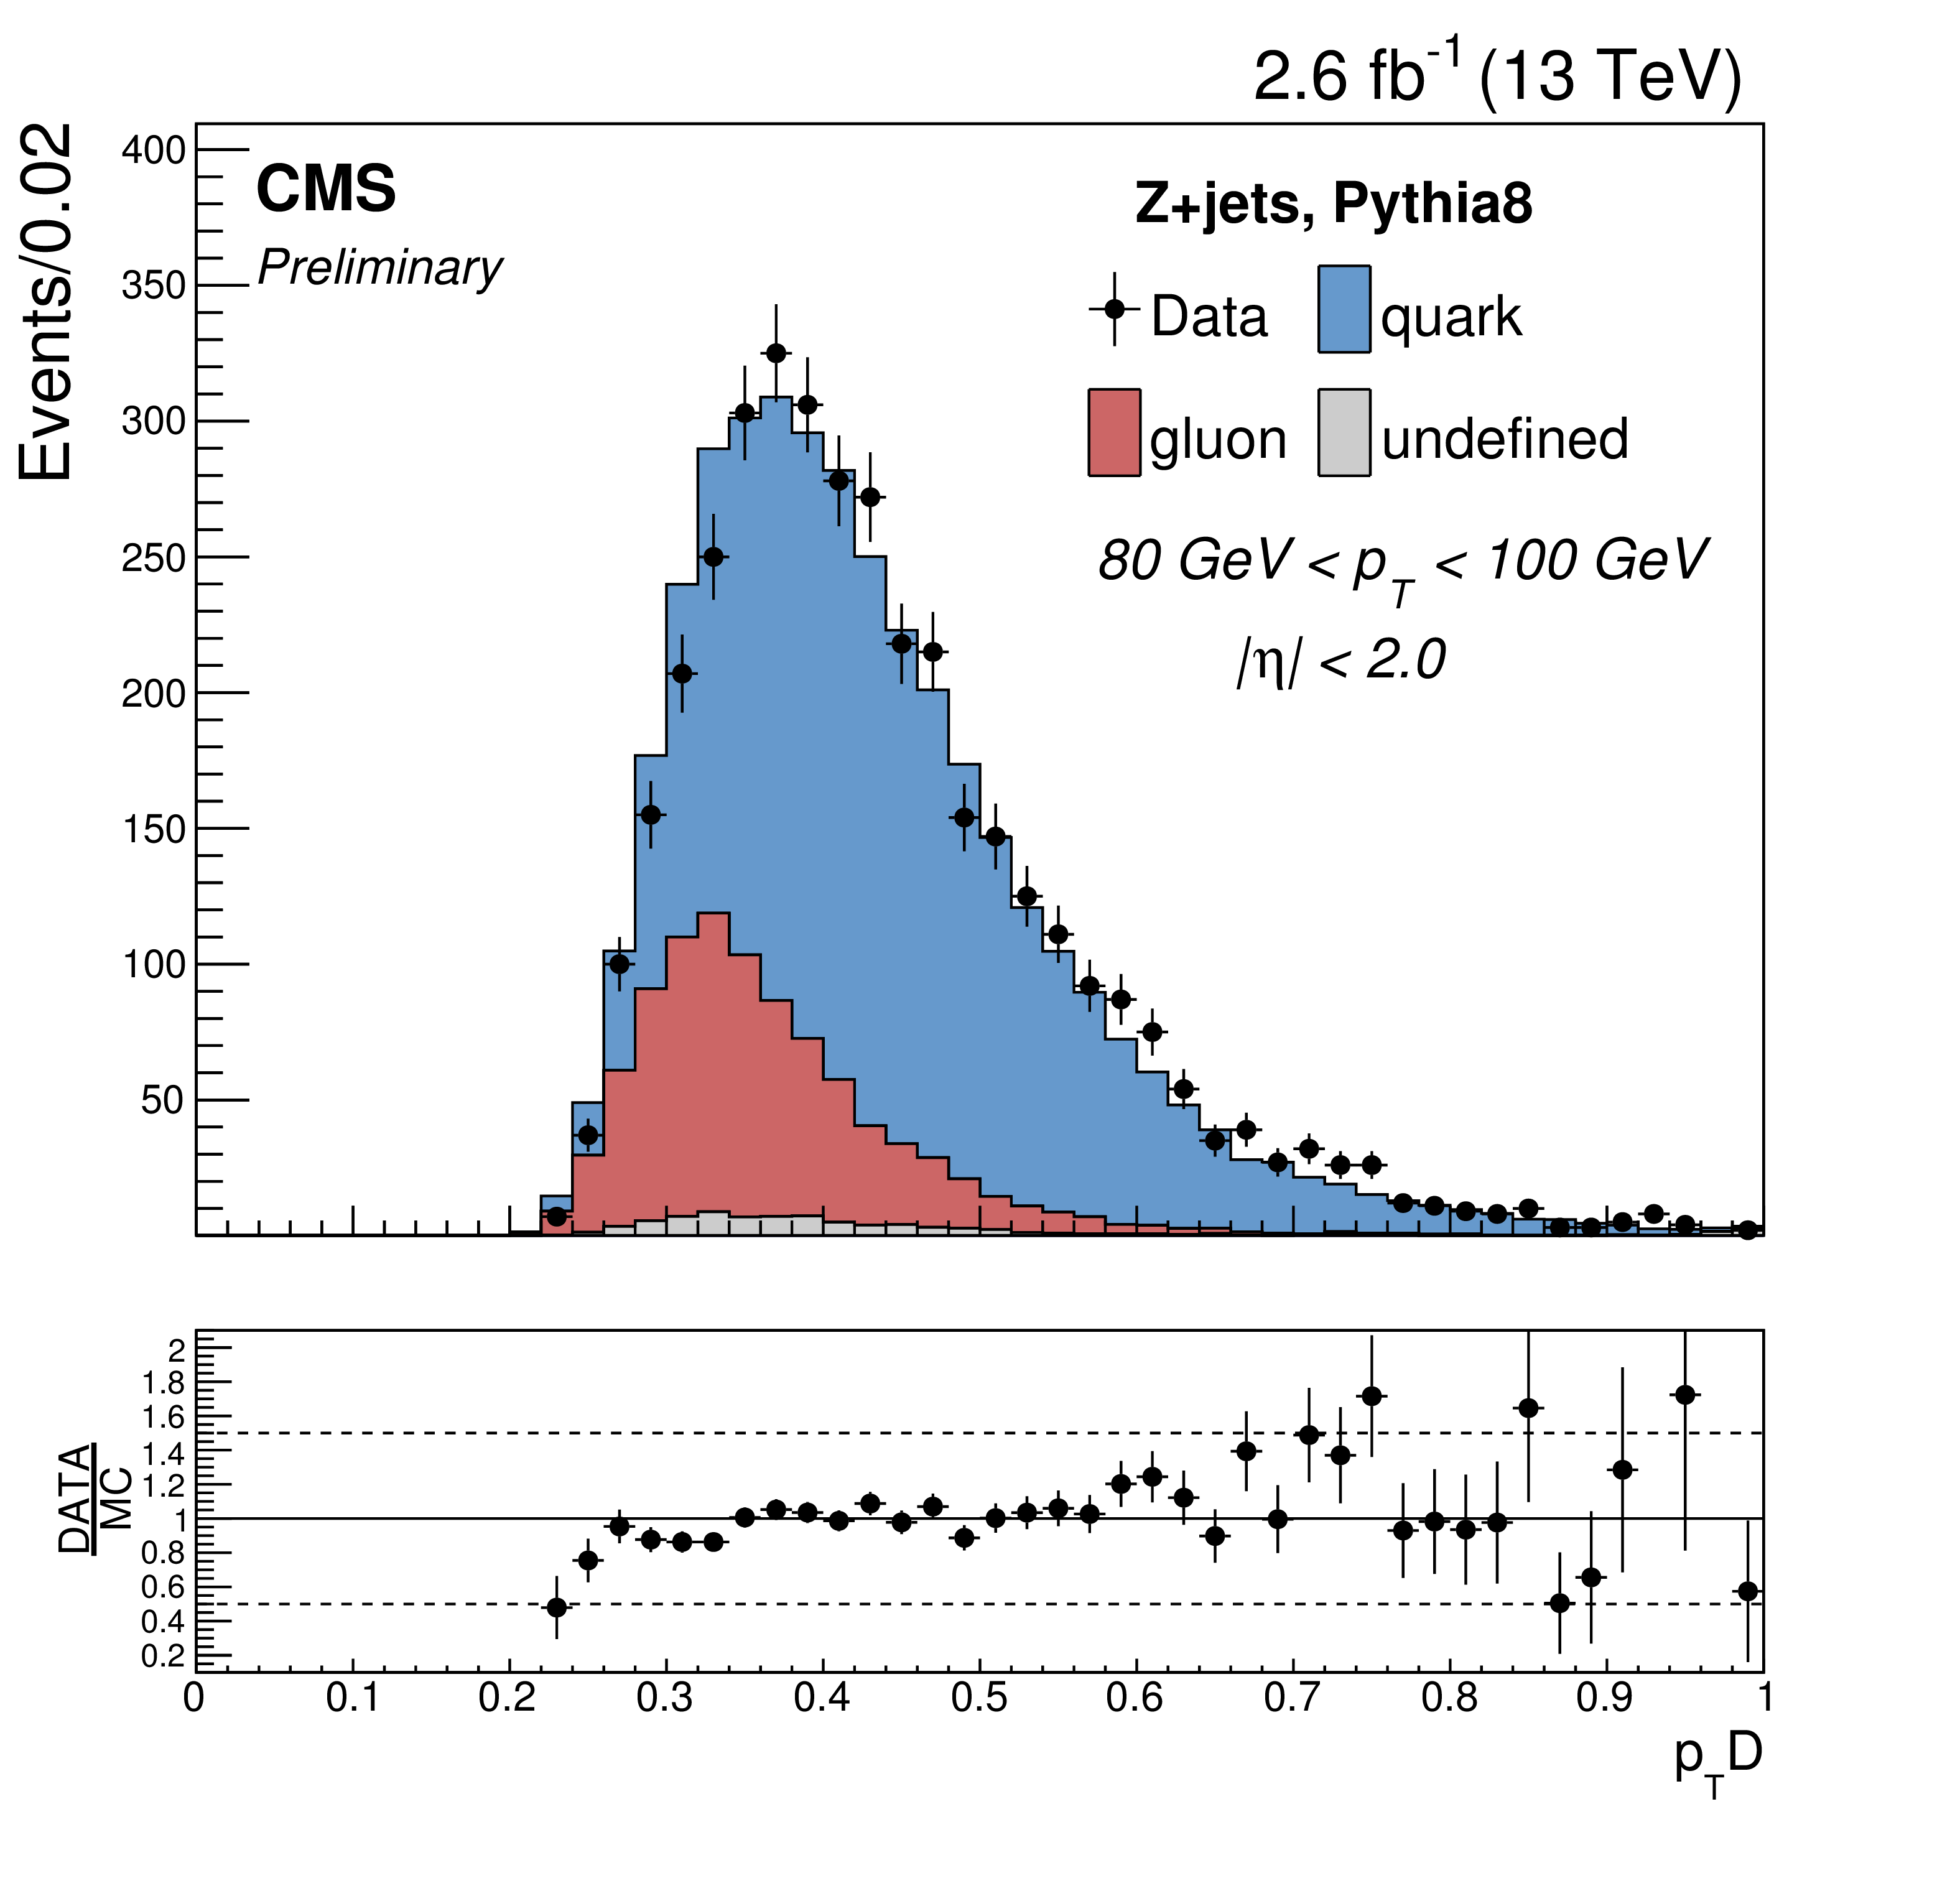
Figure 7-b:
Data-MC comparisons, for jets with 80 $ < p_{\mathrm {T}} < $ 100 GeV and $|\eta |< $ 2 in Z+jets events, of one of the three input variables used in the discriminator: $ {p_{\mathrm {T}}} D$. The data (black markers) are compared to the MadGraph /PYTHIA simulation, on which the different components are shown: quarks (blue), gluon (red) and unmatched/pileup (grey). |

png pdf |
Figure 7-c:
Data-MC comparisons, for jets with 80 $ < p_{\mathrm {T}} < $ 100 GeV and $|\eta |< $ 2 in Z+jets events, of one of the three input variables used in the discriminator: $\sigma _2$. The data (black markers) are compared to the MadGraph /PYTHIA simulation, on which the different components are shown: quarks (blue), gluon (red) and unmatched/pileup (grey). |
png pdf |
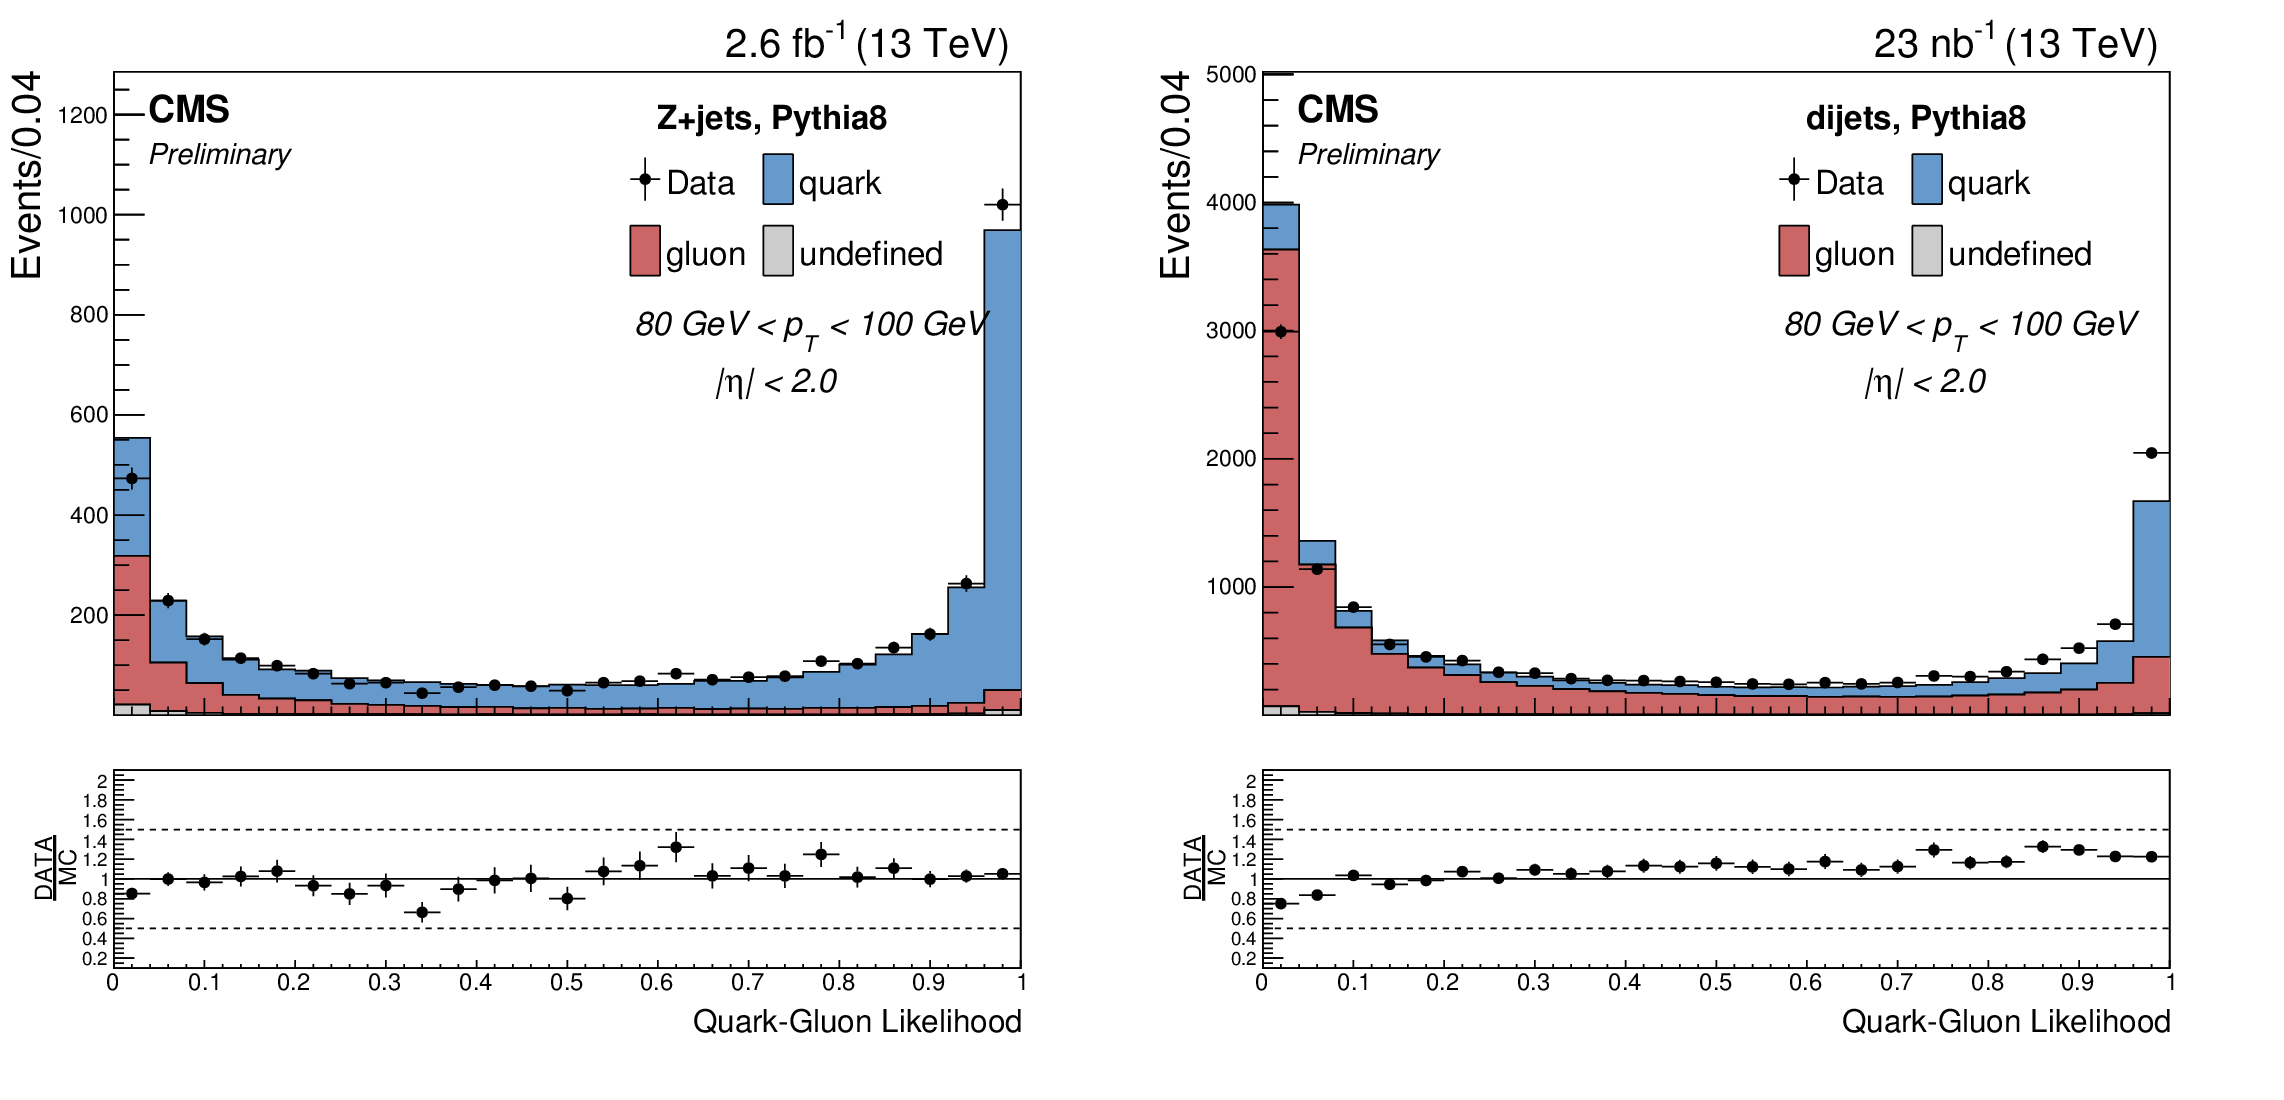
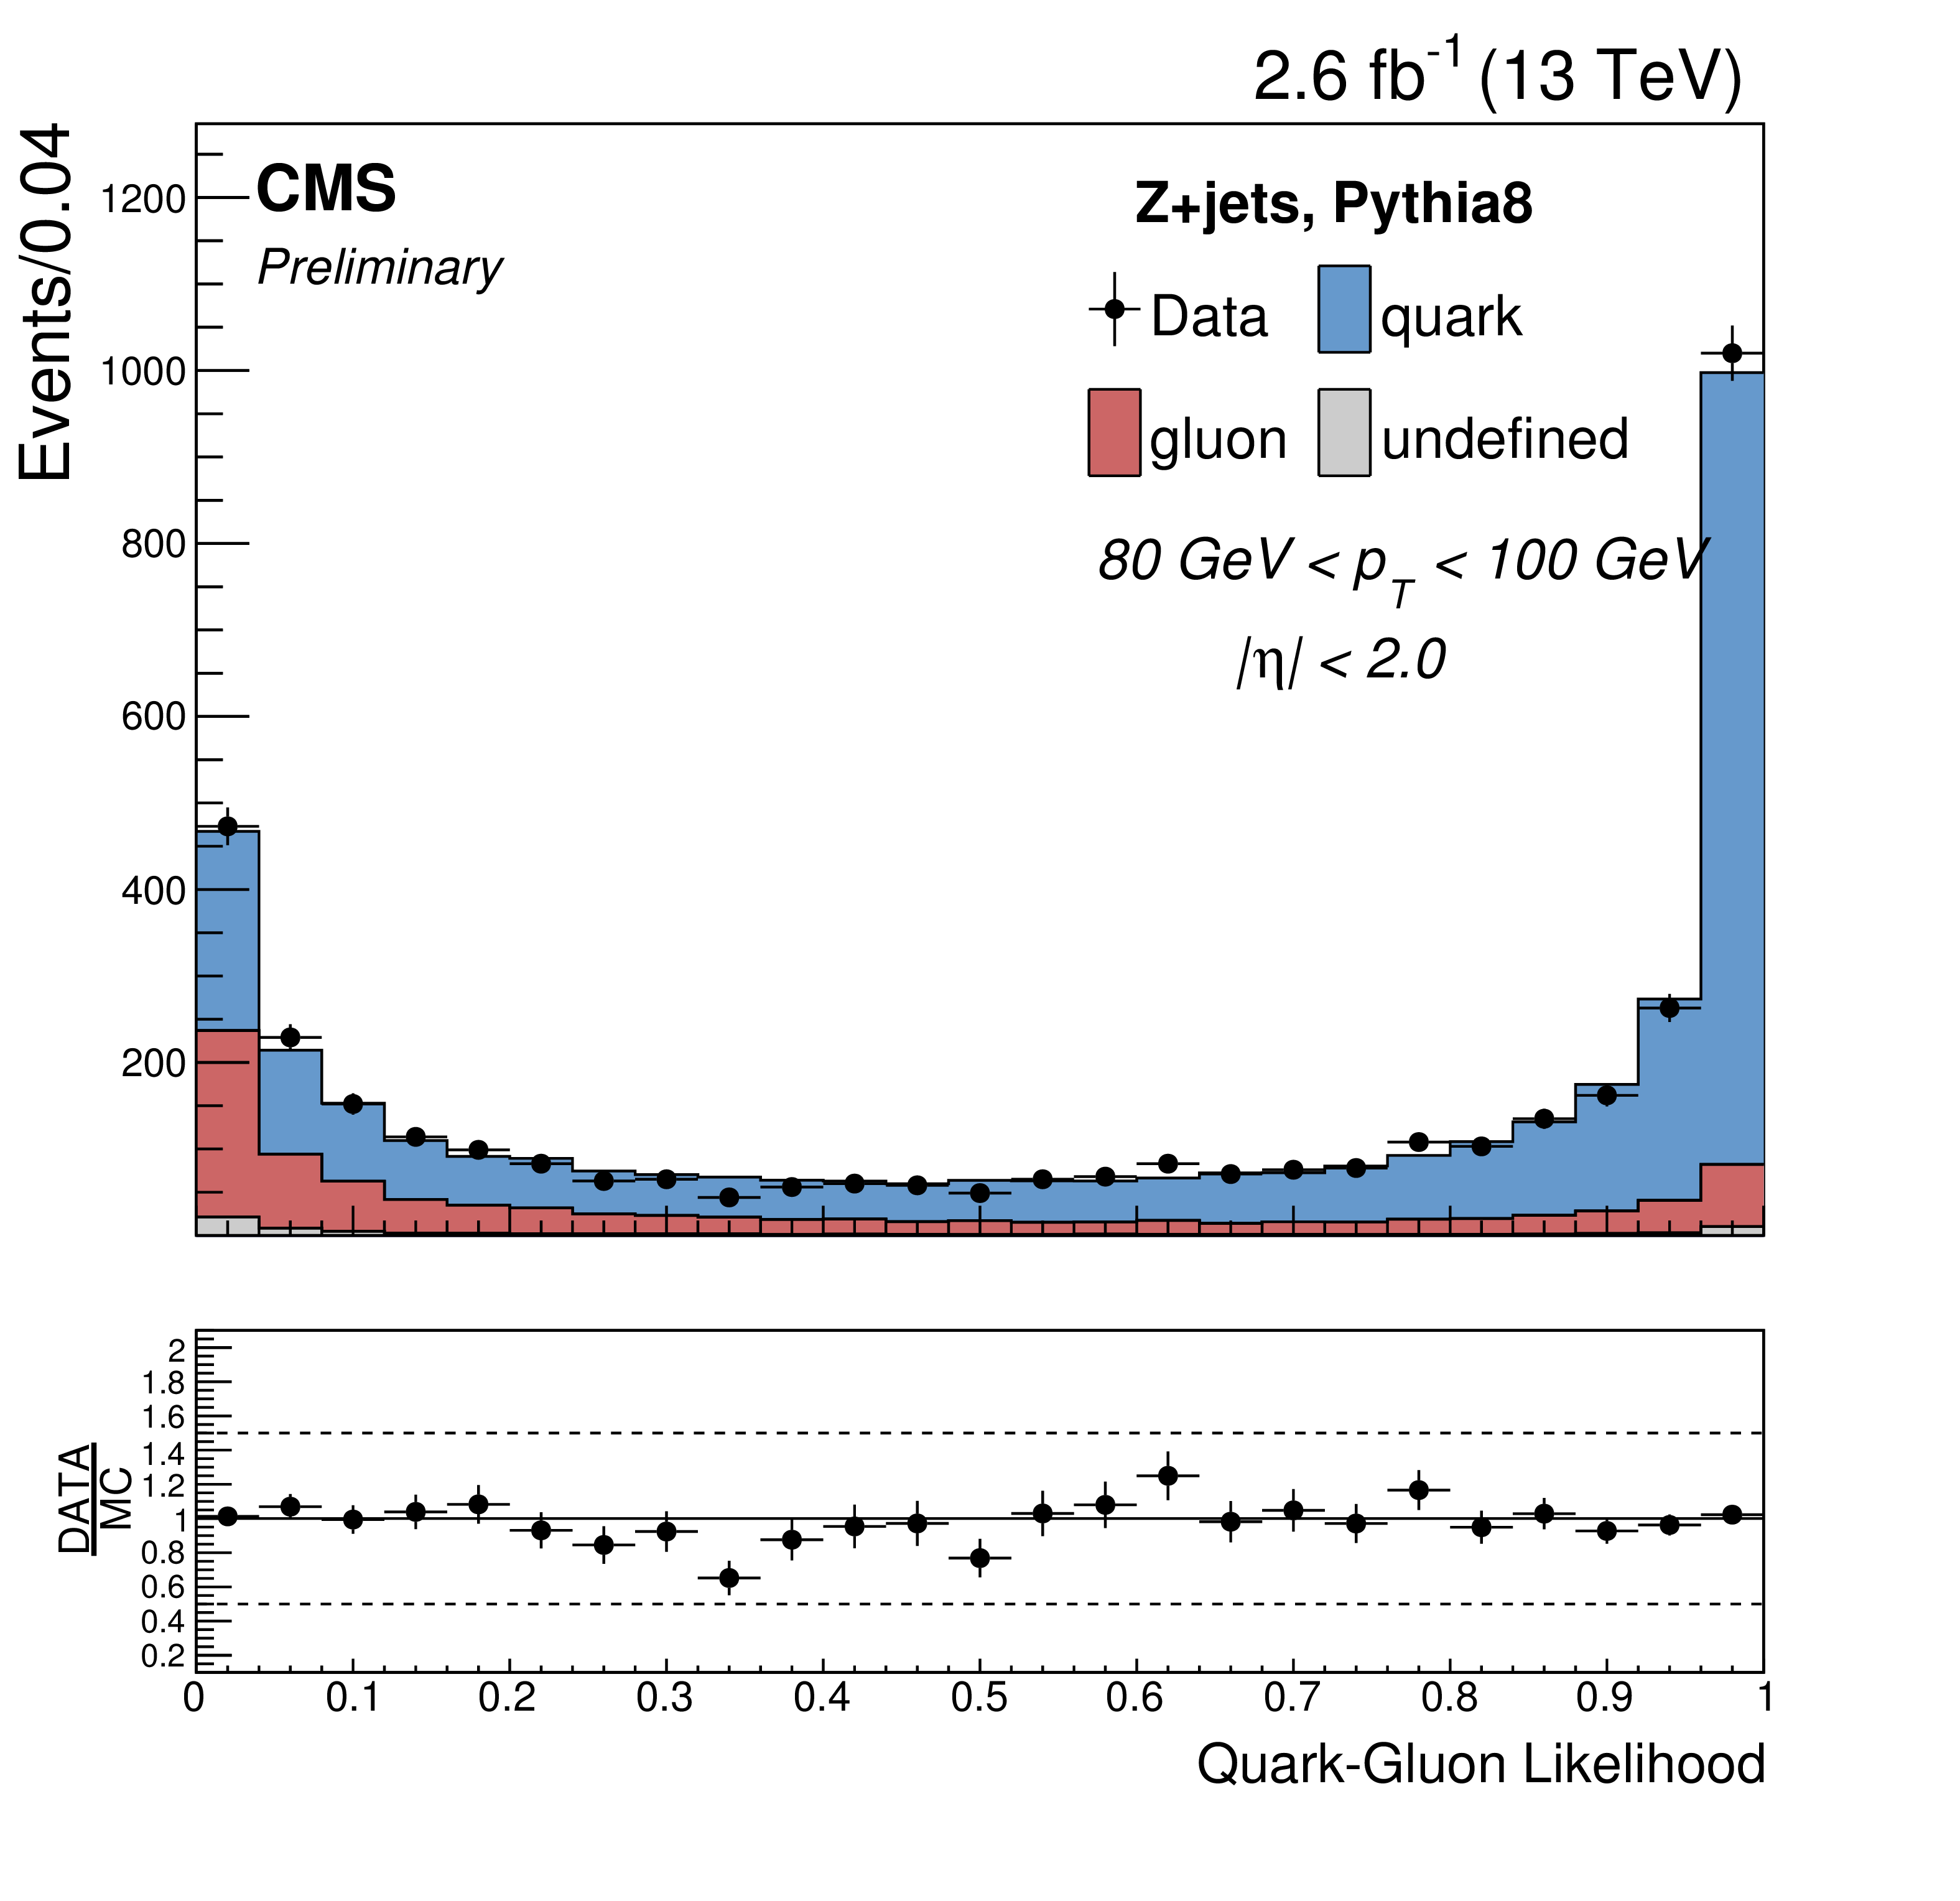
Figure 8:
Data-MC comparison for the quark-gluon discriminant in Z+jets (left) and dijet (right) events for jets in the central region with 80 $ < p_{\mathrm {T}} < $ 100 GeV. The data(black markers) are compared to the MadGraph /PYTHIA simulation, on which the different components are shown: quarks (blue), gluon (red) and unmatched/pileup (grey). |
png pdf |
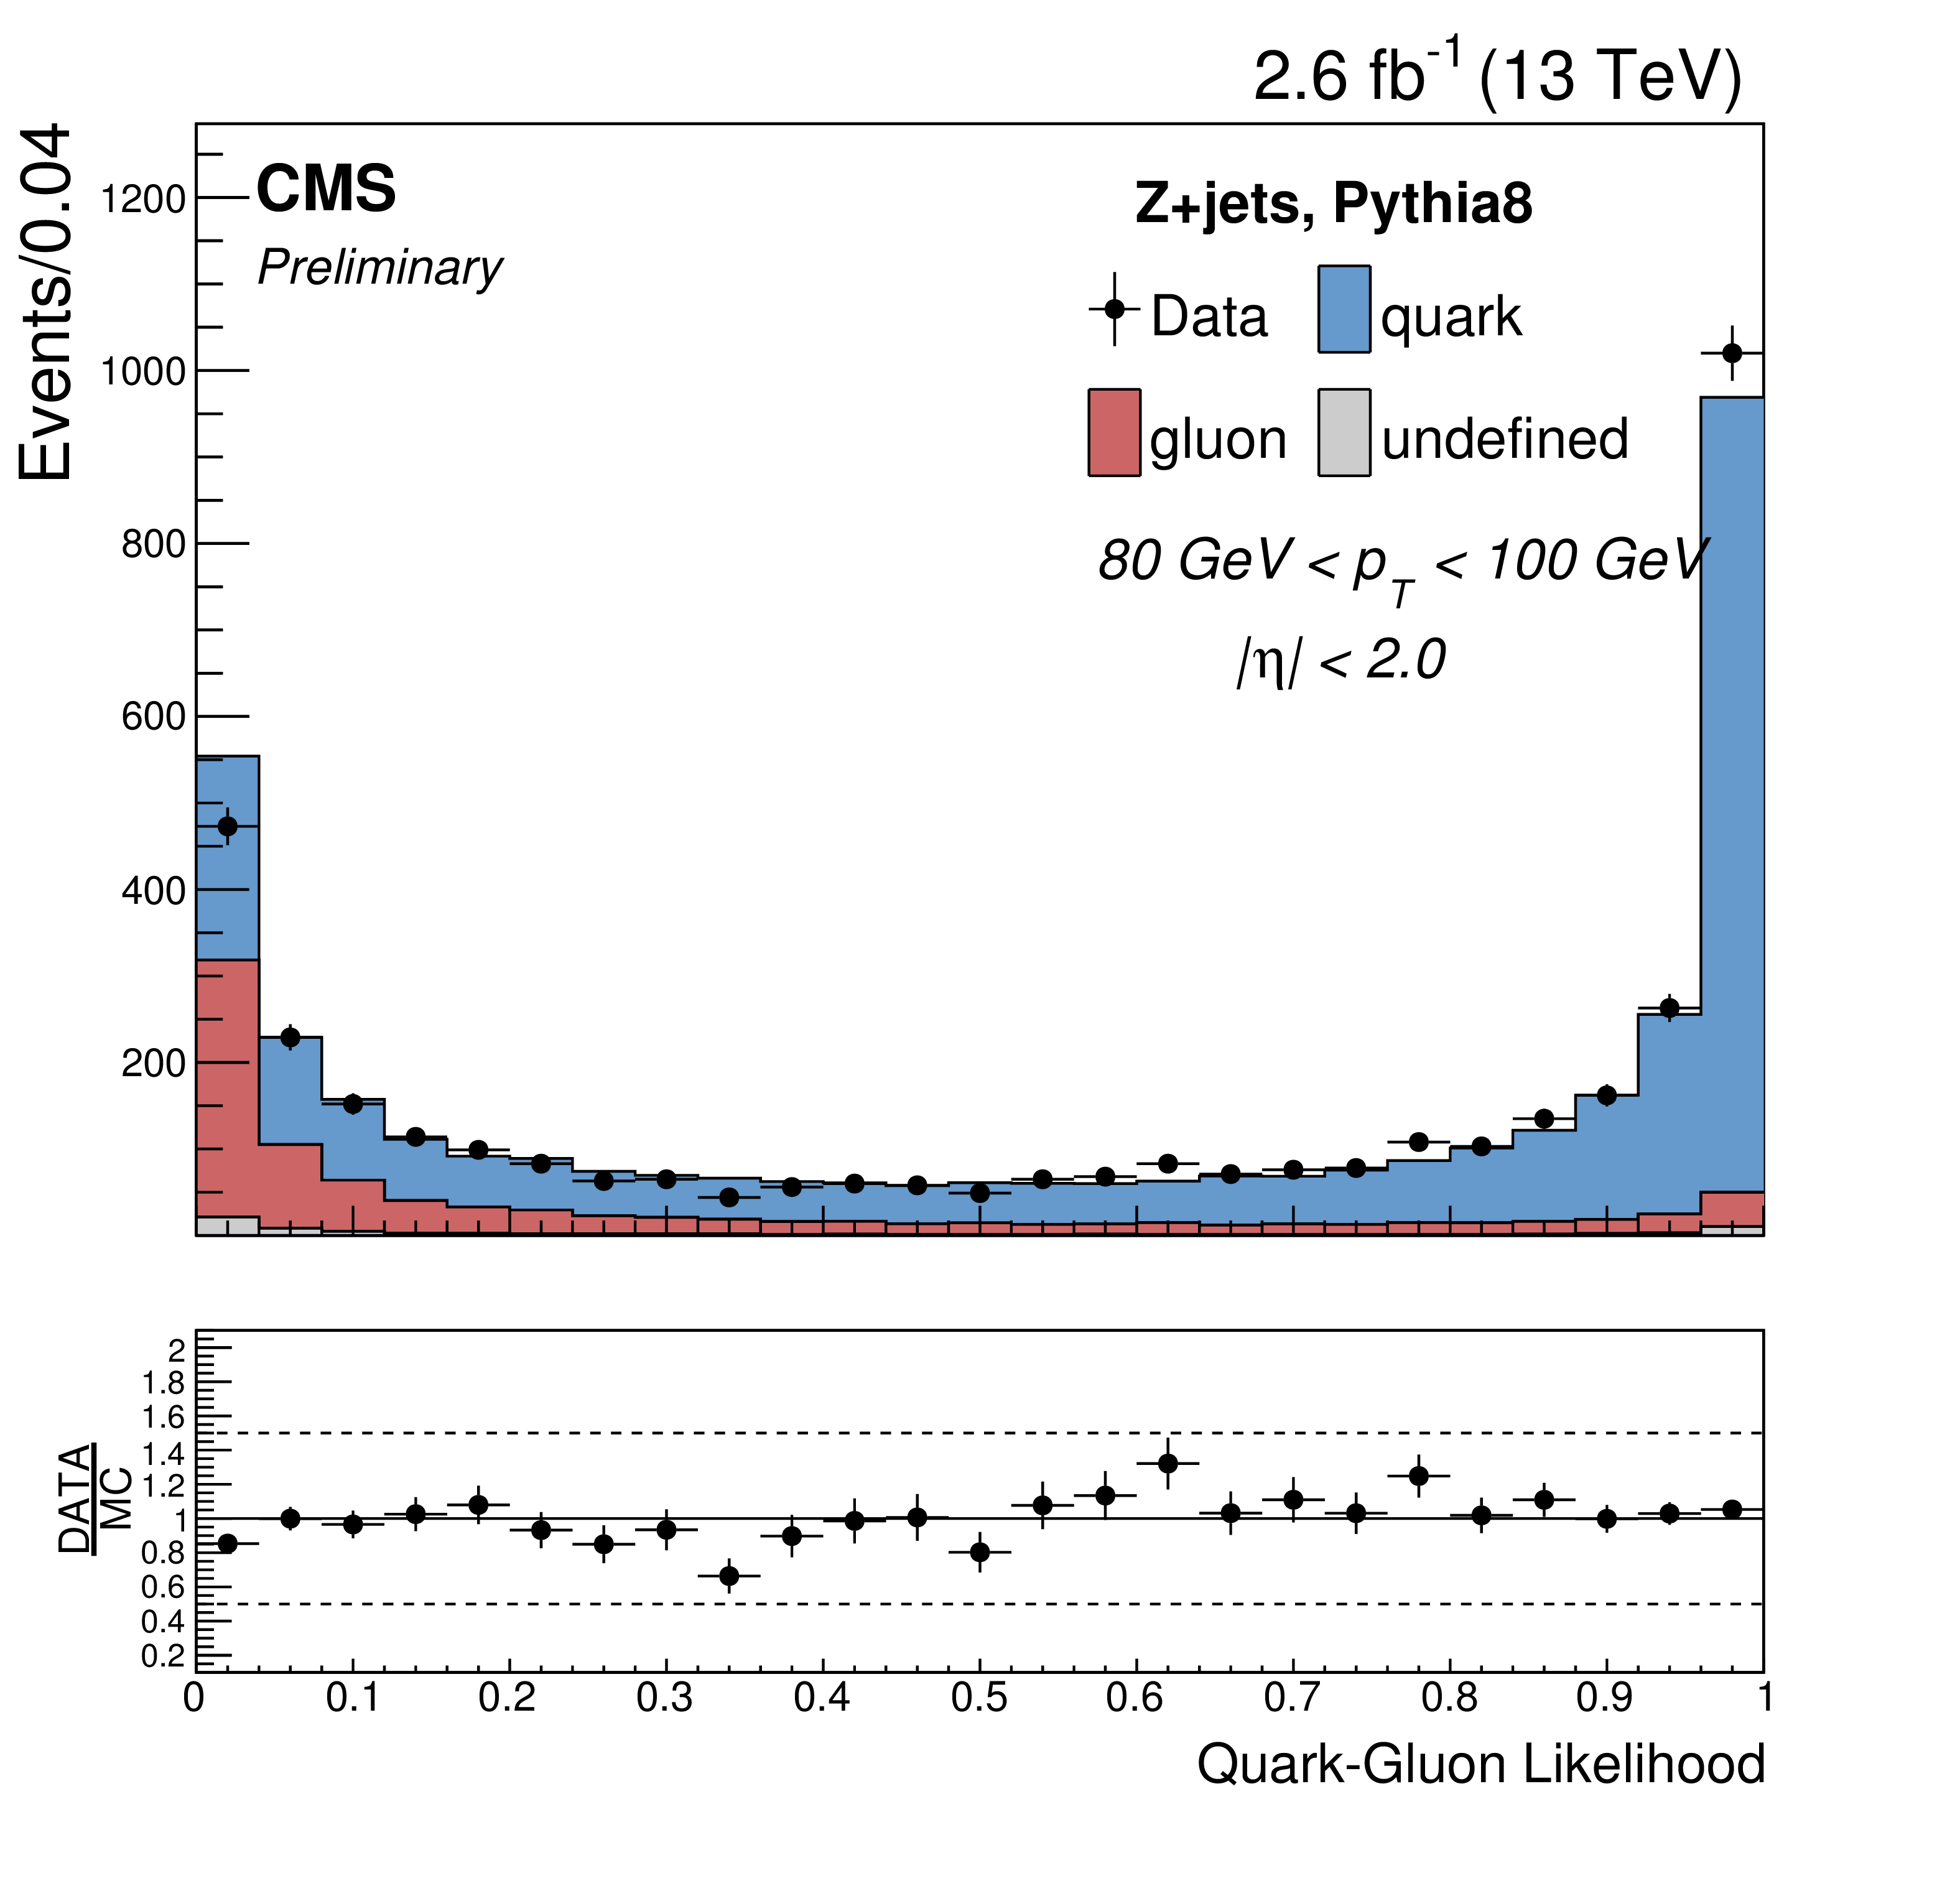
Figure 8-a:
Data-MC comparison for the quark-gluon discriminant in Z+jets events for jets in the central region with 80 $ < p_{\mathrm {T}} < $ 100 GeV. The data (black markers) are compared to the MadGraph /PYTHIA simulation, on which the different components are shown: quarks (blue), gluon (red) and unmatched/pileup (grey). |

png pdf |
Figure 8-b:
Data-MC comparison for the quark-gluon discriminant in dijet events for jets in the central region with 80 $ < p_{\mathrm {T}} < $ 100 GeV. The data (black markers) are compared to the MadGraph /PYTHIA simulation, on which the different components are shown: quarks (blue), gluon (red) and unmatched/pileup (grey). |

png pdf |
Figure 9:
Data-MC comparison for the quark-gluon discriminant in Z+jets (left) and dijet (right) events for jets in the central region with 80 $ < p_{\mathrm {T}} < $ 100 GeV, after the data-driven systematics reshaping procedure. The data (black markers) are compared to the reshaped MadGraph /PYTHIA simulation, on which the different components are shown: quarks (blue), gluon (red) and unmatched/pileup (grey). |
png pdf |
Figure 9-a:
Data-MC comparison for the quark-gluon discriminant in Z+jets events for jets in the central region with 80 $ < p_{\mathrm {T}} < $ 100 GeV, after the data-driven systematics reshaping procedure. The data (black markers) are compared to the reshaped MadGraph /PYTHIA simulation, on which the different components are shown: quarks (blue), gluon (red) and unmatched/pileup (grey). |

png pdf |
Figure 9-b:
Data-MC comparison for the quark-gluon discriminant in dijet events for jets in the central region with 80 $ < p_{\mathrm {T}} < $ 100 GeV, after the data-driven systematics reshaping procedure. The data (black markers) are compared to the reshaped MadGraph /PYTHIA simulation, on which the different components are shown: quarks (blue), gluon (red) and unmatched/pileup (grey). |
png pdf |
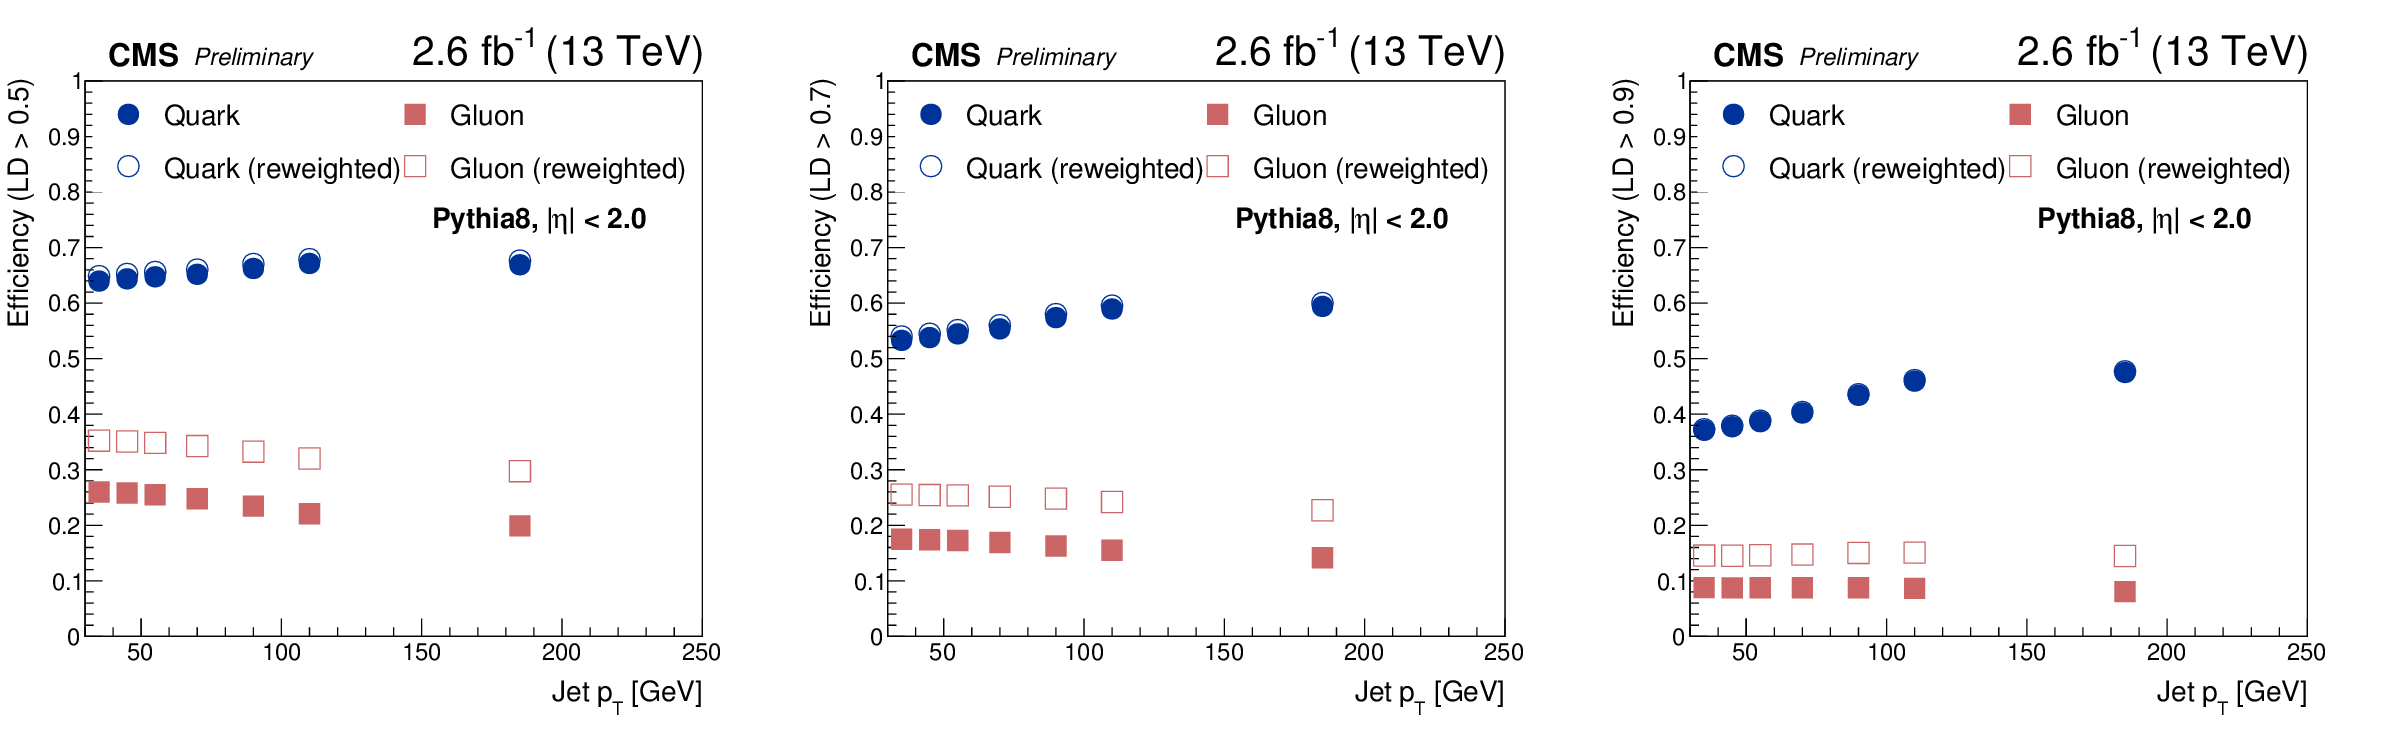
Figure 10:
Gluon- and quark-jet selection efficiencies by applying a fixed cut on the likelihood output LD $>$ 0.5 (left), 0.7 (center) and 0.9 (right). Efficiencies are evaluated in dijet events, as a function of the jet $ {p_{\mathrm {T}}} $, before and after the reshaping of the outputs. |
png pdf |
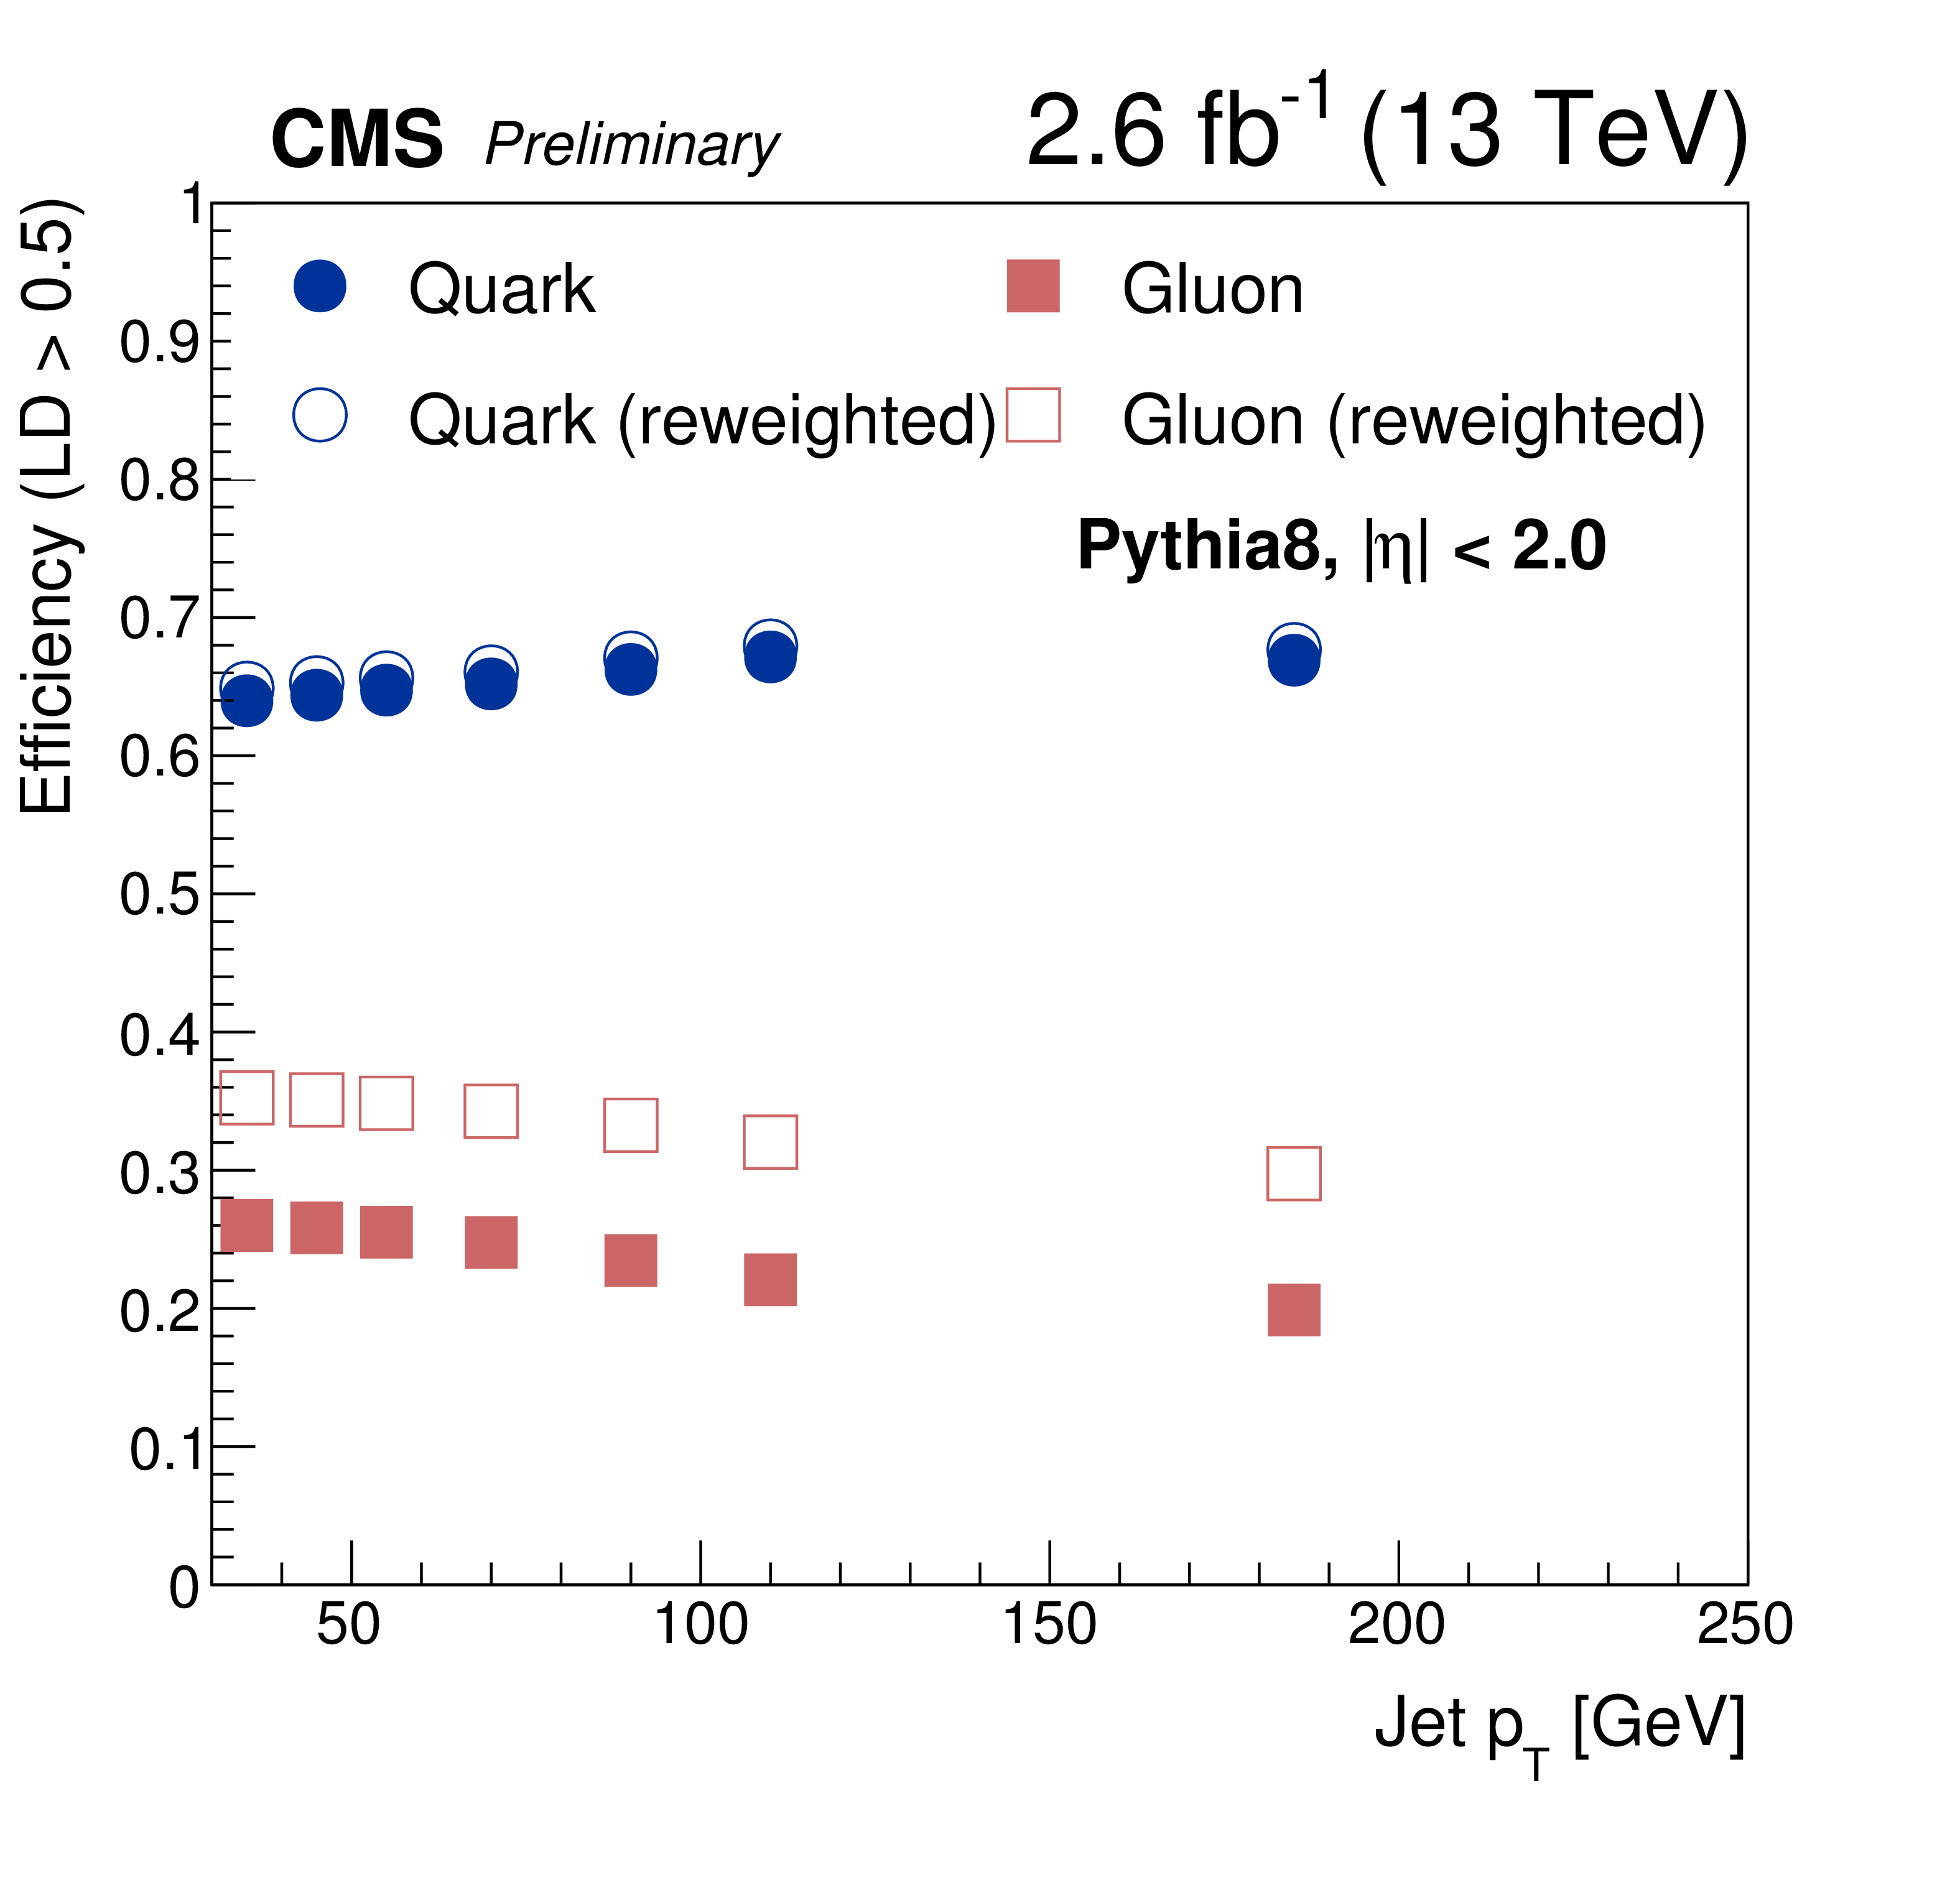
Figure 10-a:
Gluon- and quark-jet selection efficiencies by applying a fixed cut on the likelihood output LD $>$ 0.5. Efficiencies are evaluated in dijet events, as a function of the jet $ {p_{\mathrm {T}}} $, before and after the reshaping of the outputs. |

png pdf |
Figure 10-b:
Gluon- and quark-jet selection efficiencies by applying a fixed cut on the likelihood output LD $>$ 0.7. Efficiencies are evaluated in dijet events, as a function of the jet $ {p_{\mathrm {T}}} $, before and after the reshaping of the outputs. |
png pdf |
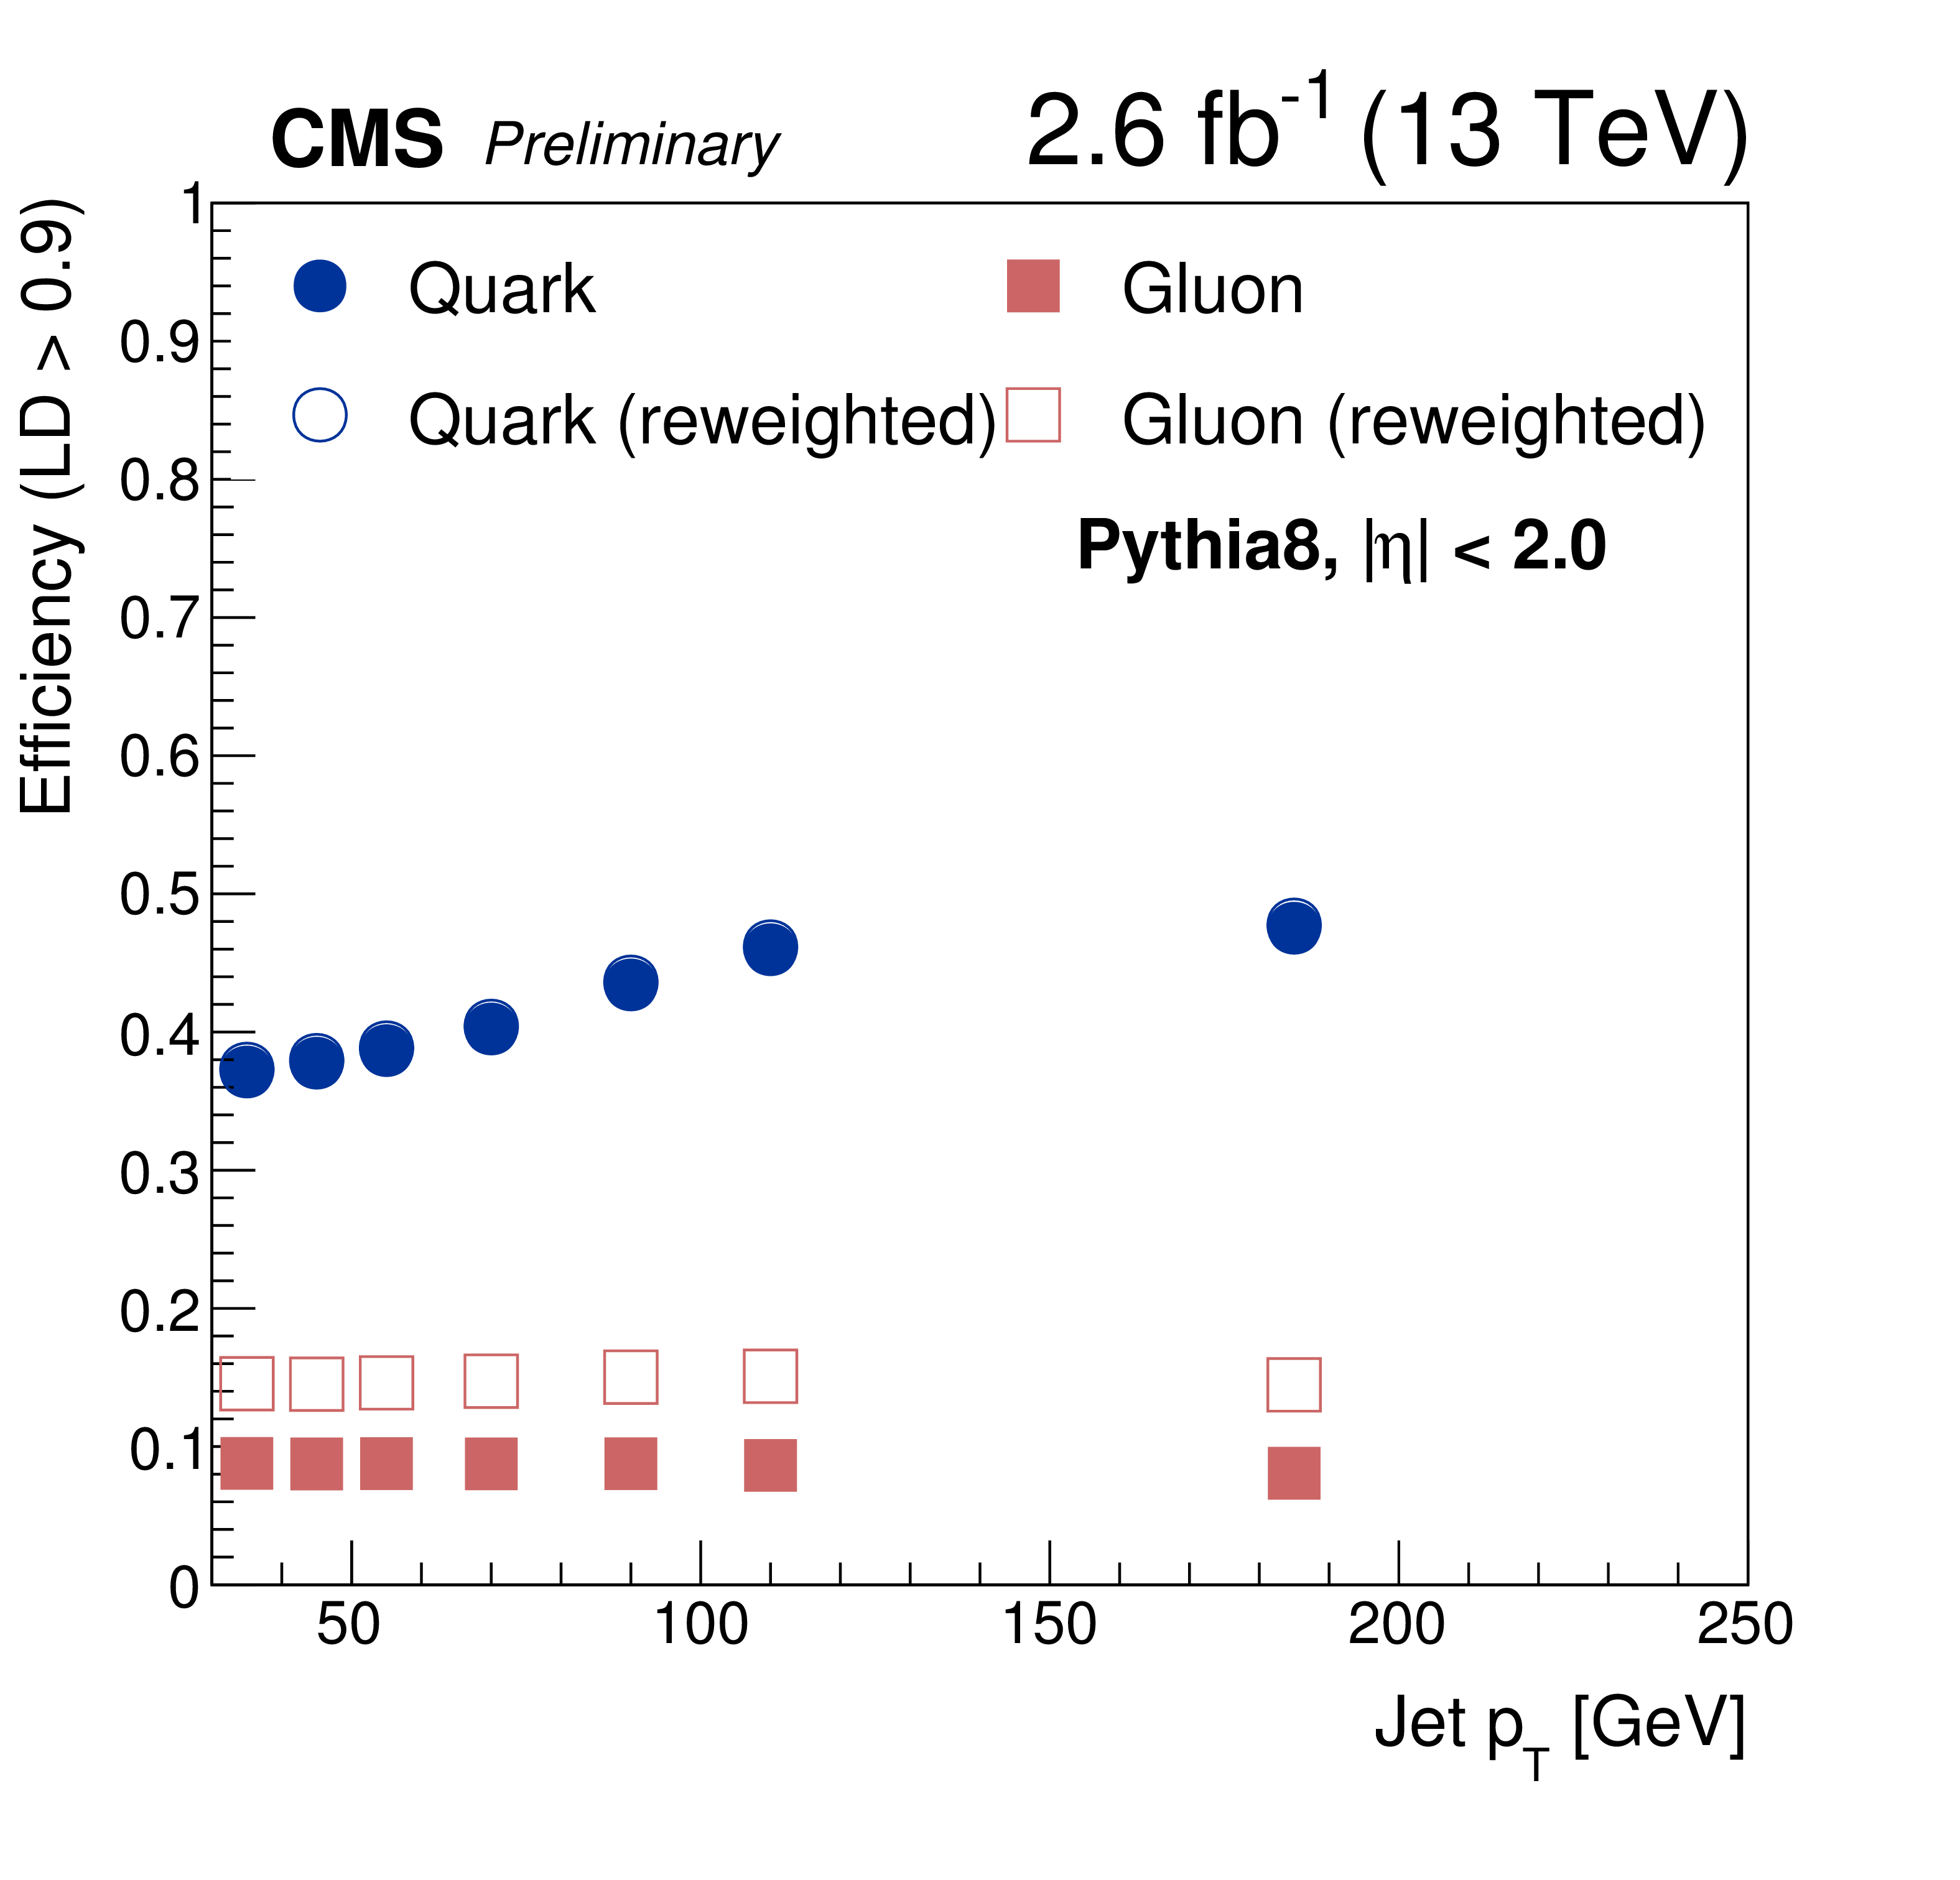
Figure 10-c:
Gluon- and quark-jet selection efficiencies by applying a fixed cut on the likelihood output LD $>$ 0.9. Efficiencies are evaluated in dijet events, as a function of the jet $ {p_{\mathrm {T}}} $, before and after the reshaping of the outputs. |

png pdf |
Figure 11:
HERWIG++ (v2.7.0 with CUETHS1 tune) and PYTHIA-8 (v8.205 with CUETP8M1 tune) gluon- and quark-jet selection efficiencies by applying a fixed cut on the likelihood output LD $>$ 0.5. Efficiencies are evaluated in dijet events (left) or Z+jet events (right), as a function of the jet $ {p_{\mathrm {T}}} $ with or without the data-driven reshaping of the outputs. |

png pdf |
Figure 11-a:
HERWIG++ (v2.7.0 with CUETHS1 tune) and PYTHIA-8 (v8.205 with CUETP8M1 tune) gluon- and quark-jet selection efficiencies by applying a fixed cut on the likelihood output LD $>$ 0.5. Efficiencies are evaluated in dijet events, as a function of the jet $ {p_{\mathrm {T}}} $ with or without the data-driven reshaping of the outputs. |

png pdf |
Figure 11-b:
HERWIG++ (v2.7.0 with CUETHS1 tune) and PYTHIA-8 (v8.205 with CUETP8M1 tune) gluon- and quark-jet selection efficiencies by applying a fixed cut on the likelihood output LD $>$ 0.5. Efficiencies are evaluated in Z+jet events, as a function of the jet $ {p_{\mathrm {T}}} $ with or without the data-driven reshaping of the outputs. |
png pdf |
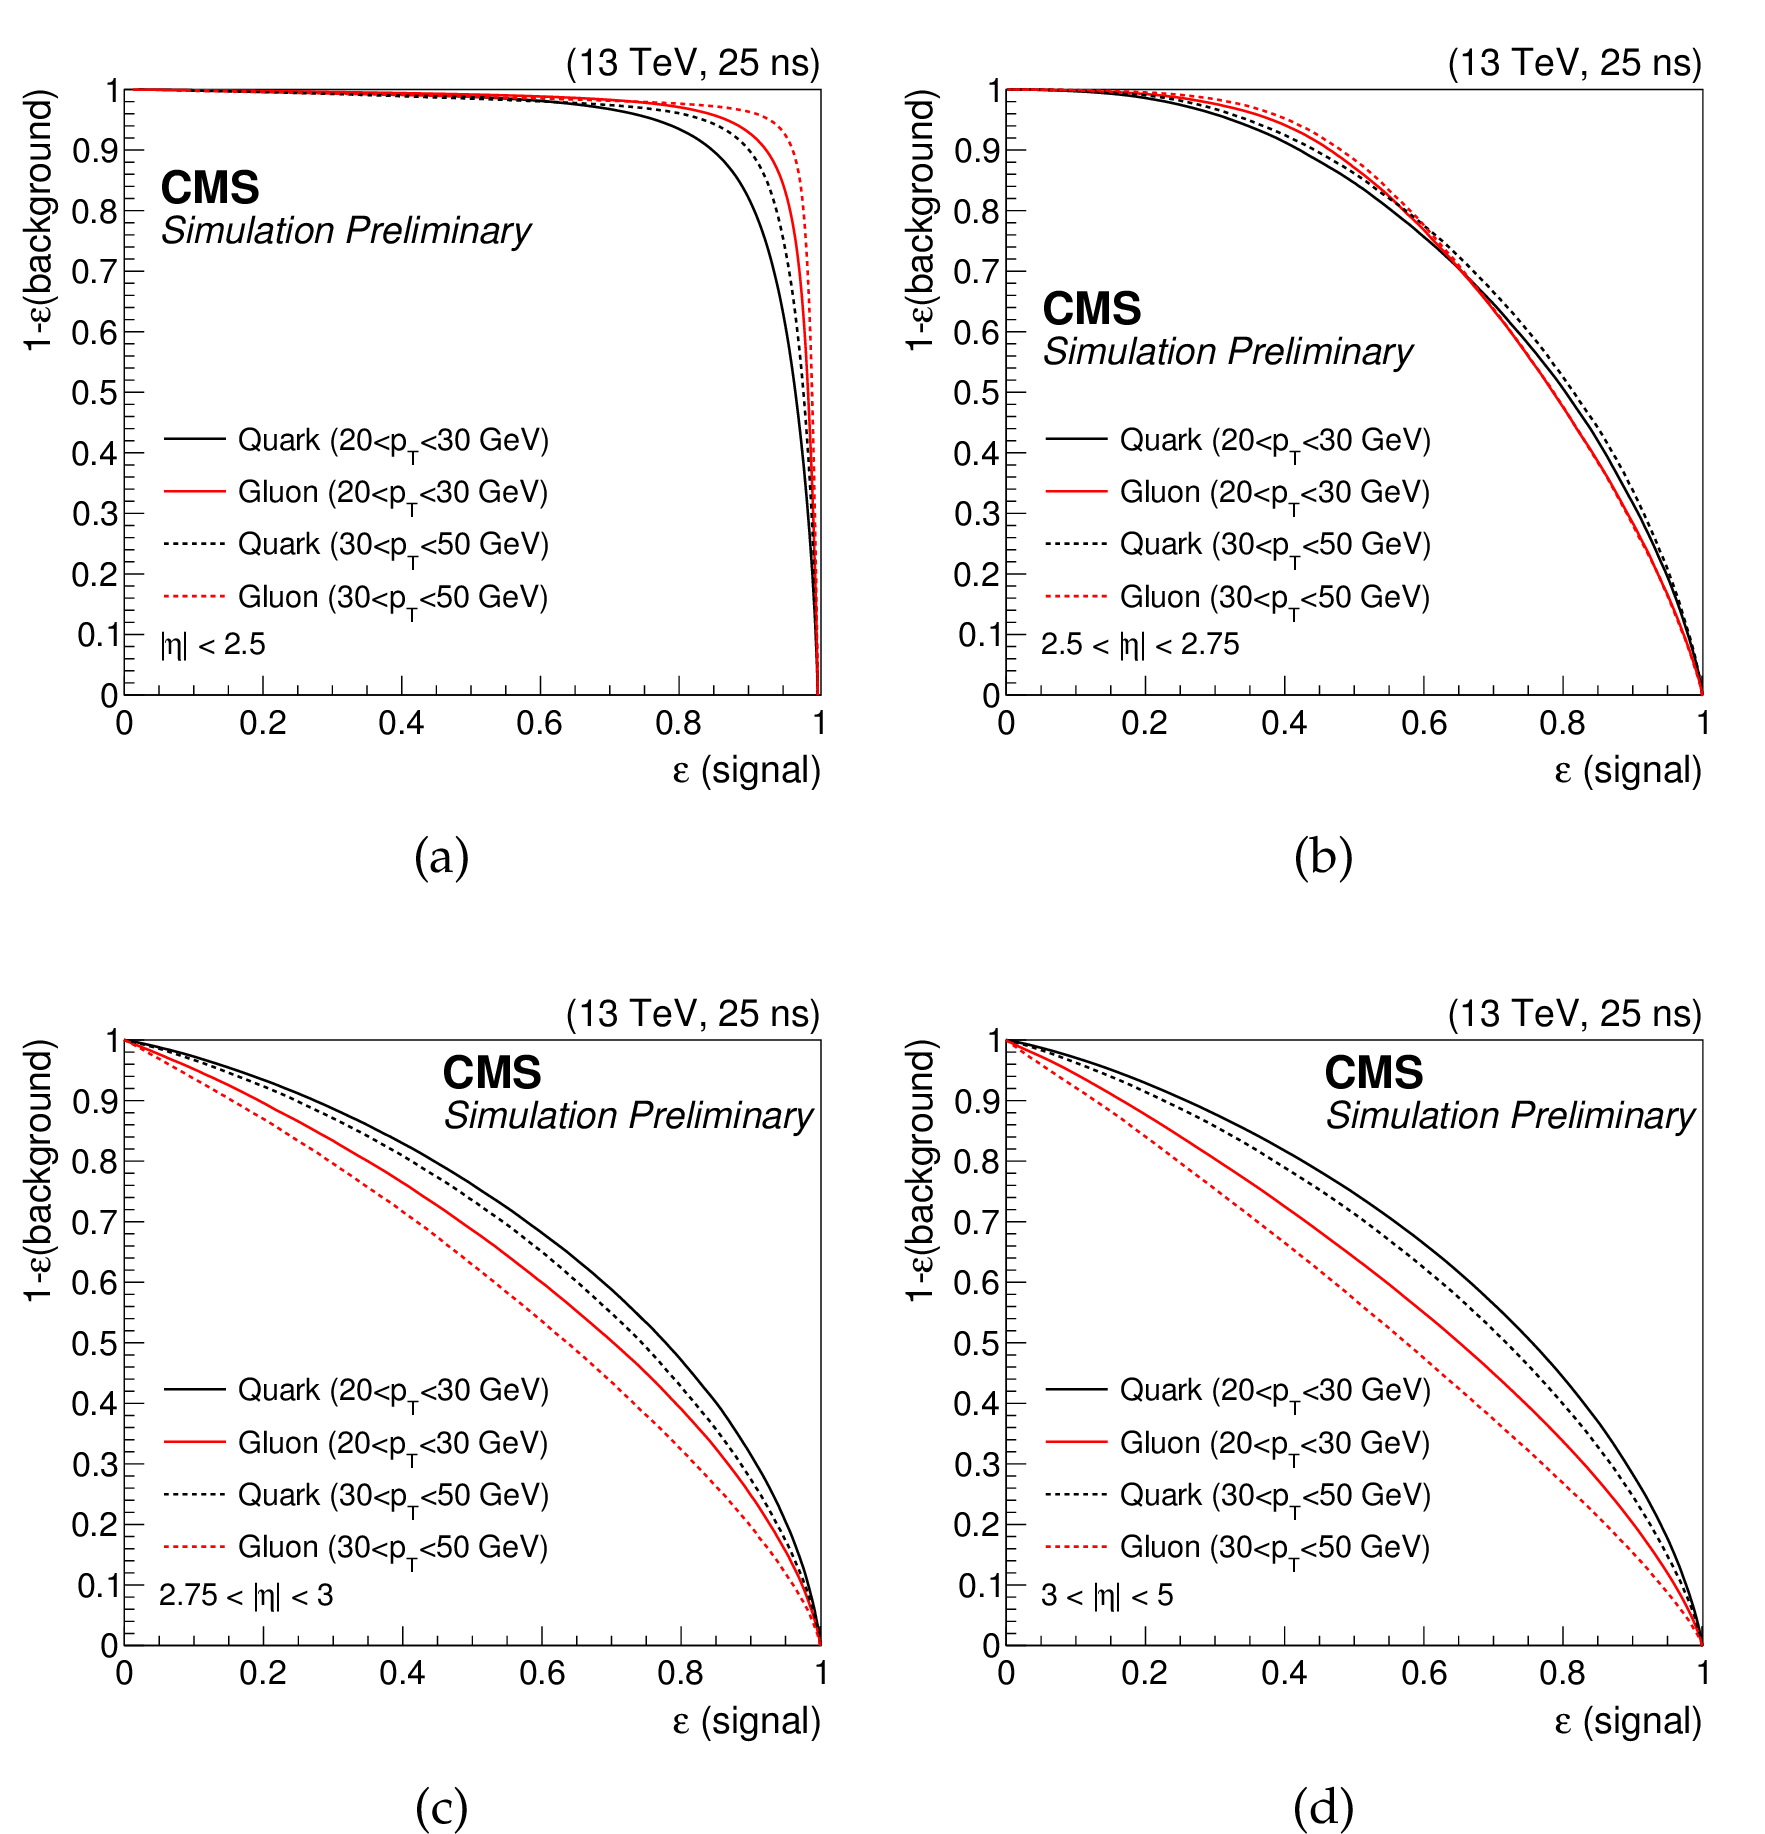
Figure 12:
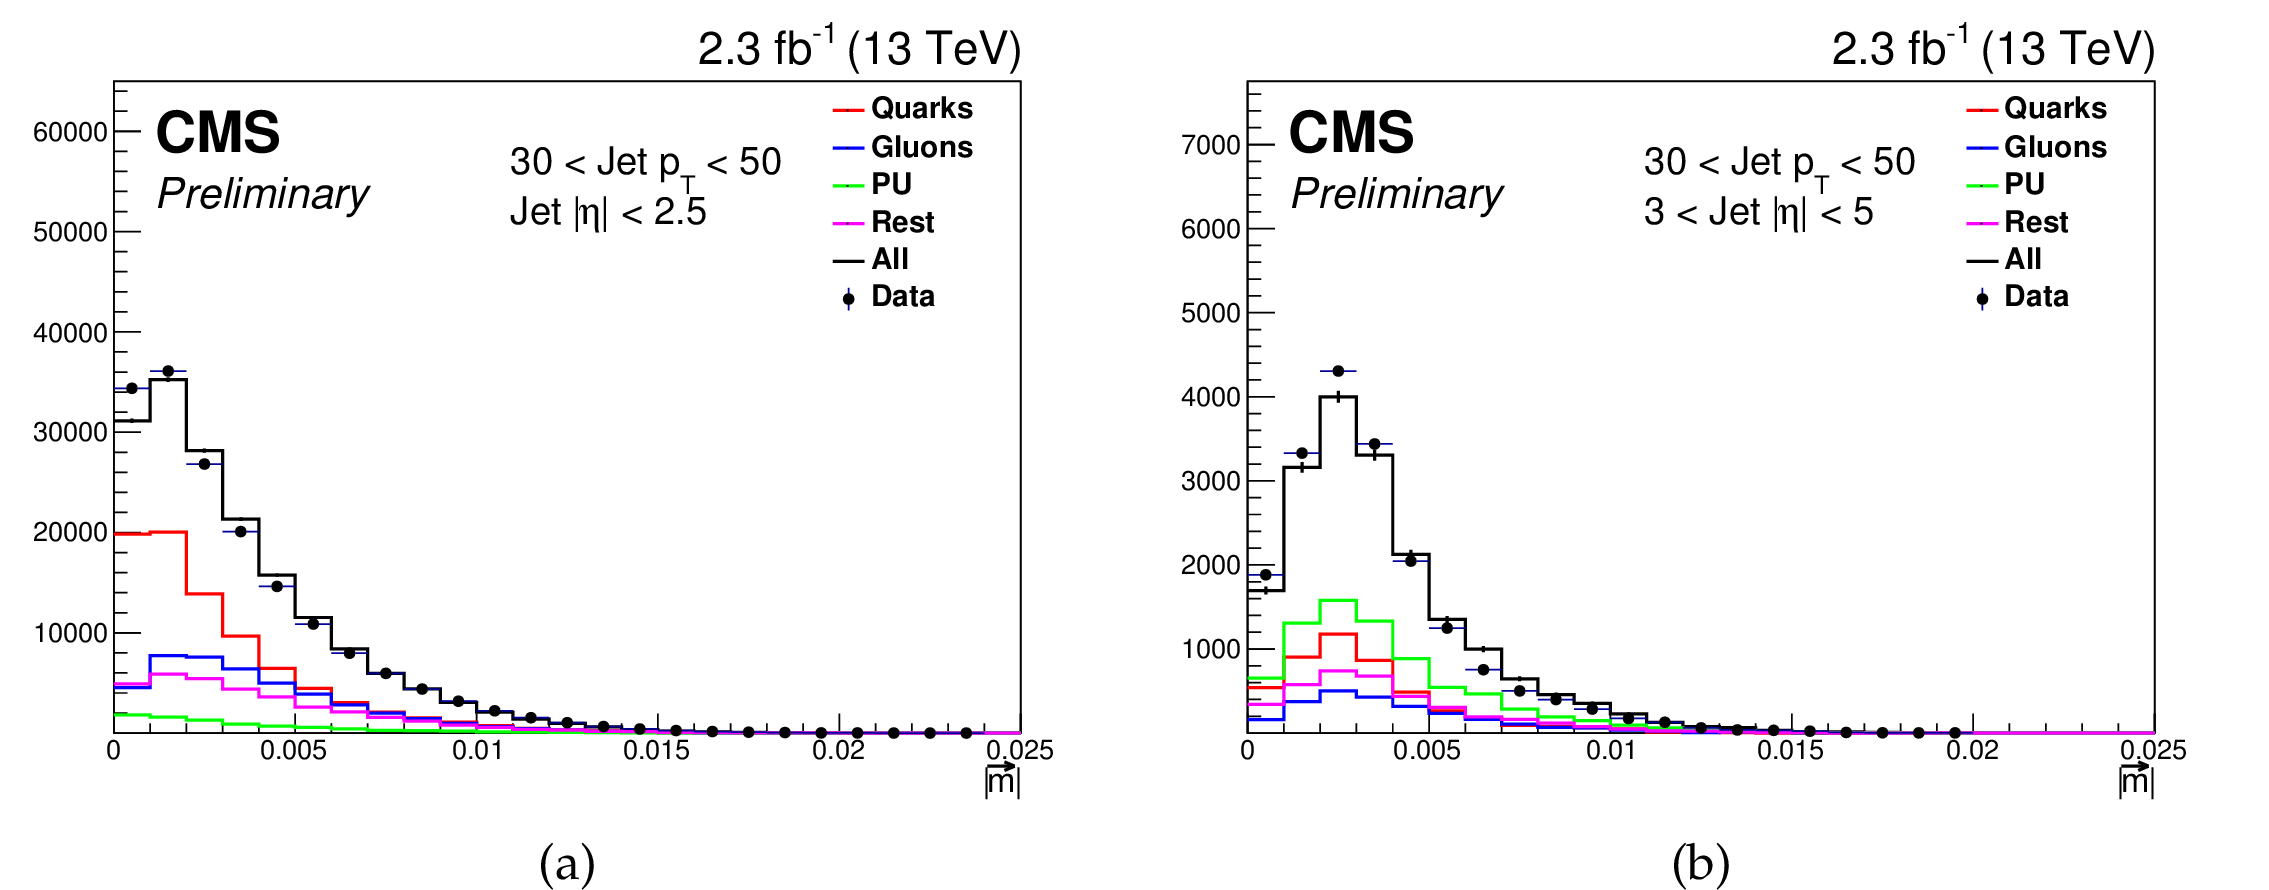
Fraction of rejected pileup jets as a function of the fraction of true quark and gluon jets which are correctly tagged for jets. Curves are shown for both quark initiated and gluon initiated jets in bins of 20 $ < {p_{\mathrm {T}}} < $ 30 GeV and 30 $ < {p_{\mathrm {T}}} < $ 50 GeV in four different $|\eta |$ regions: (a) $|\eta |< $ 2.5, (b) 2.5 $ < |\eta | < $ 2.75, (c) 2.75 $ < |\eta | < $ 3, (d) 3 $ < |\eta | < $ 5. |

png pdf |
Figure 12-a:
Fraction of rejected pileup jets as a function of the fraction of true quark and gluon jets which are correctly tagged for jets. Curves are shown for both quark initiated and gluon initiated jets in bins of 20 $ < {p_{\mathrm {T}}} < $ 30 GeV and 30 $ < {p_{\mathrm {T}}} < $ 50 GeV for $|\eta |< $ 2.5. |

png pdf |
Figure 12-b:
Fraction of rejected pileup jets as a function of the fraction of true quark and gluon jets which are correctly tagged for jets. Curves are shown for both quark initiated and gluon initiated jets in bins of 20 $ < {p_{\mathrm {T}}} < $ 30 GeV and 30 $ < {p_{\mathrm {T}}} < $ 50 GeV for 2.5 $ < |\eta | < $ 2.75. |
png pdf |
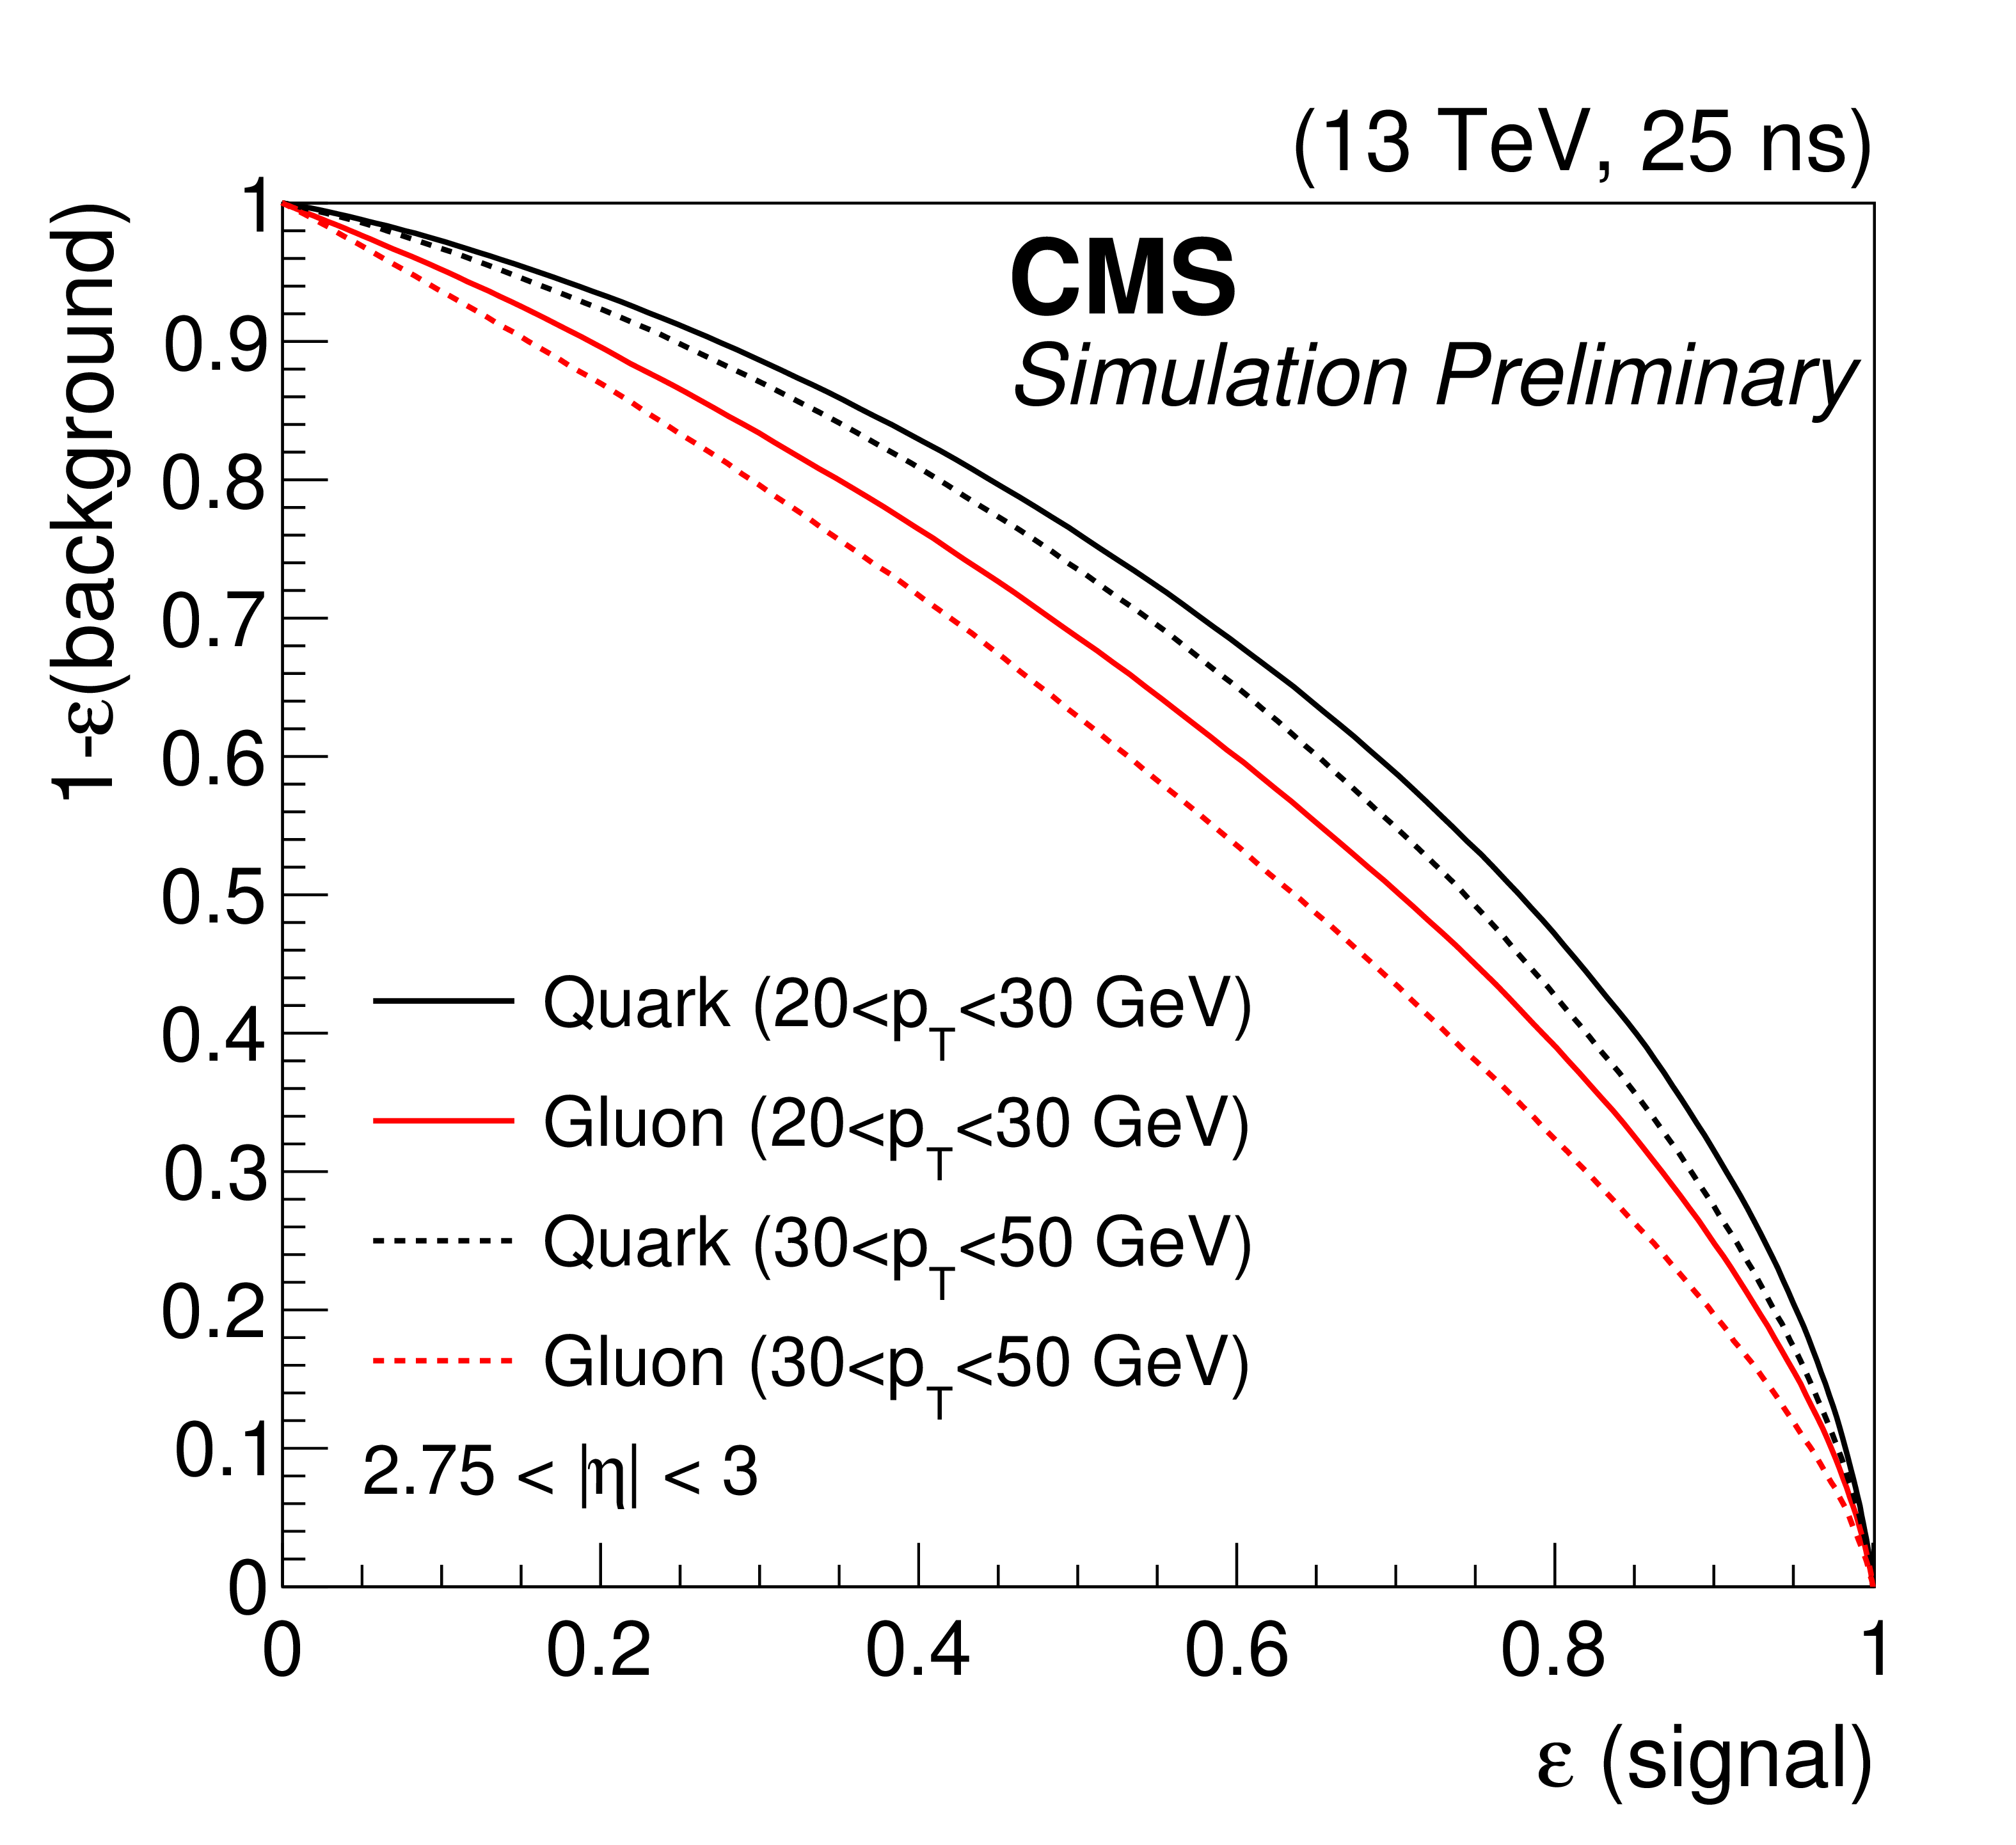
Figure 12-c:
Fraction of rejected pileup jets as a function of the fraction of true quark and gluon jets which are correctly tagged for jets. Curves are shown for both quark initiated and gluon initiated jets in bins of 20 $ < {p_{\mathrm {T}}} < $ 30 GeV and 30 $ < {p_{\mathrm {T}}} < $ 50 GeV for 2.75 $ < |\eta | < $ 3. |

png pdf |
Figure 12-d:
Fraction of rejected pileup jets as a function of the fraction of true quark and gluon jets which are correctly tagged for jets. Curves are shown for both quark initiated and gluon initiated jets in bins of 20 $ < {p_{\mathrm {T}}} < $ 30 GeV and 30 $ < {p_{\mathrm {T}}} < $ 50 GeV for 3 $ < |\eta | < $ 5. |

png pdf |
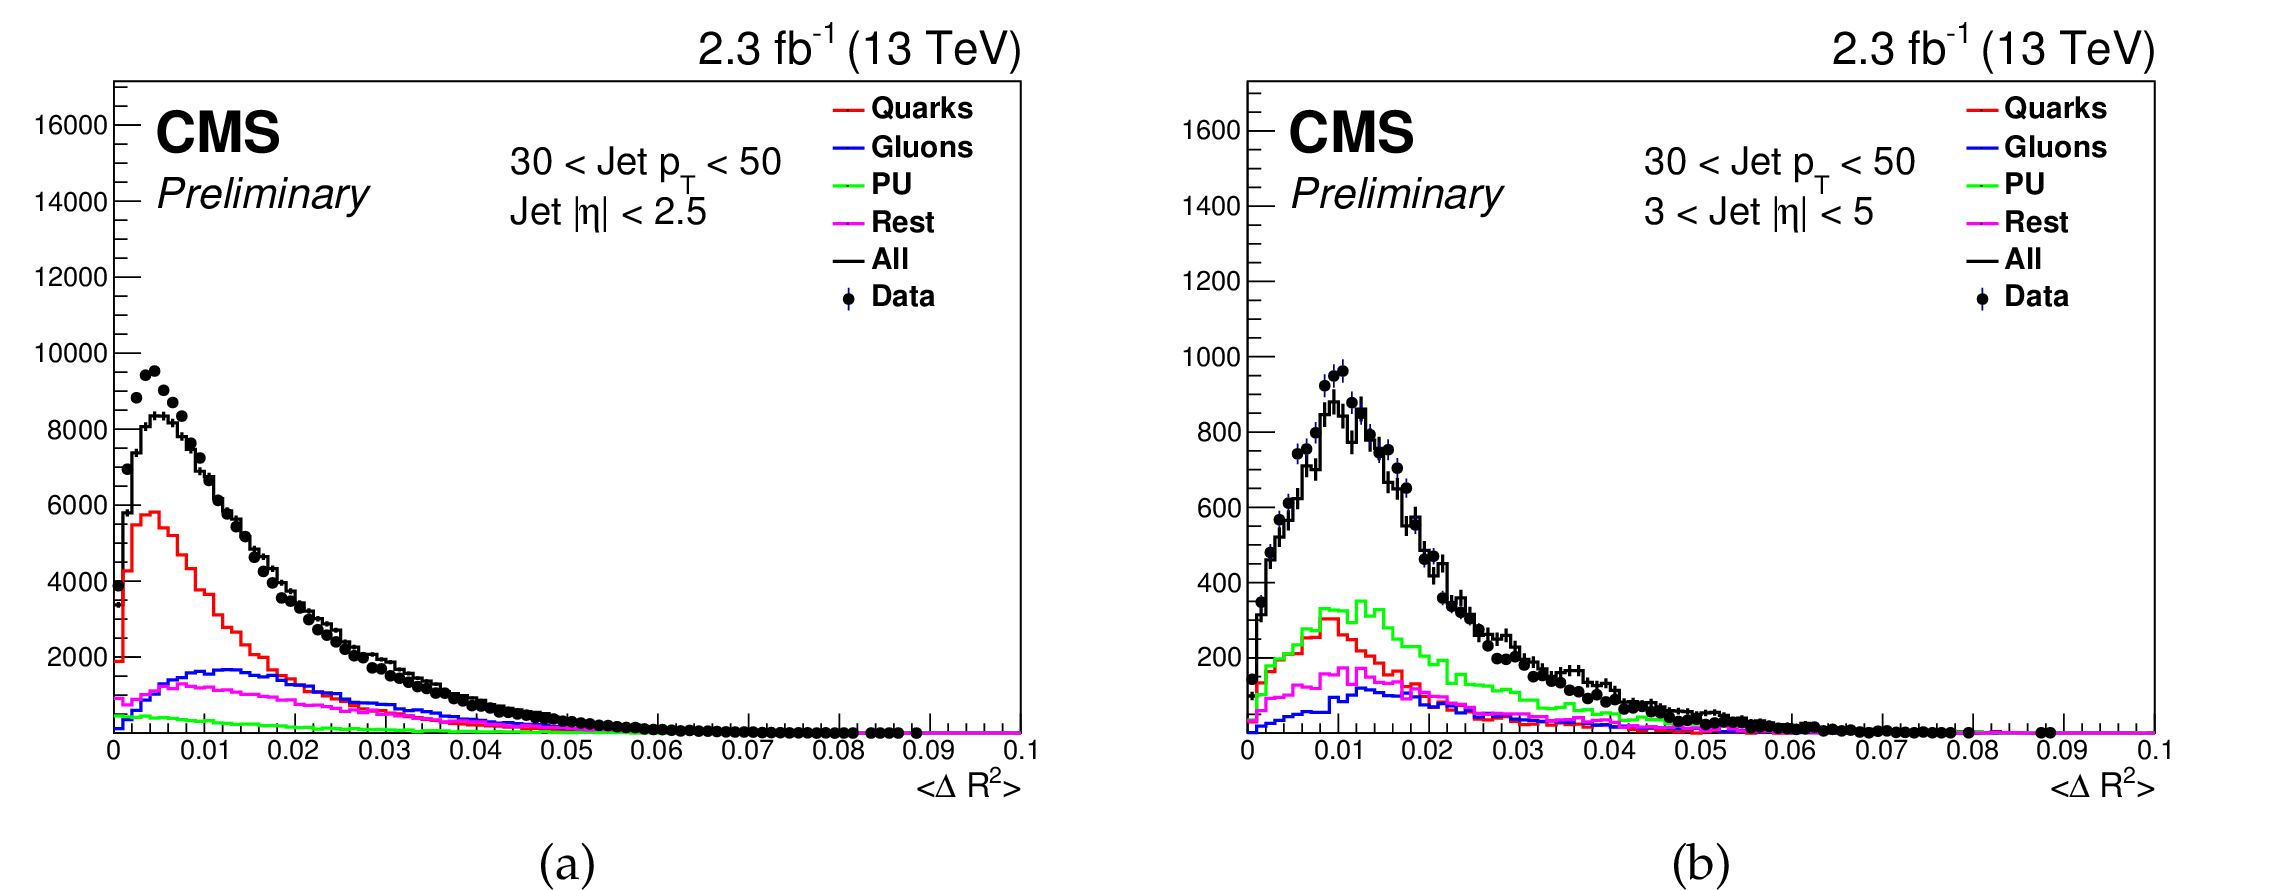
Figure 13:
Pileup jet MVA discriminant (left) $\beta $ measured in central region (right) $ < \Delta R^2 > $ measured in forward region. |

png pdf |
Figure 13-a:
Pileup jet MVA discriminant $\beta $ measured in central region. |

png pdf |
Figure 13-b:
Pileup jet MVA discriminant $ < \Delta R^2 > $ measured in forward region. |
png pdf |
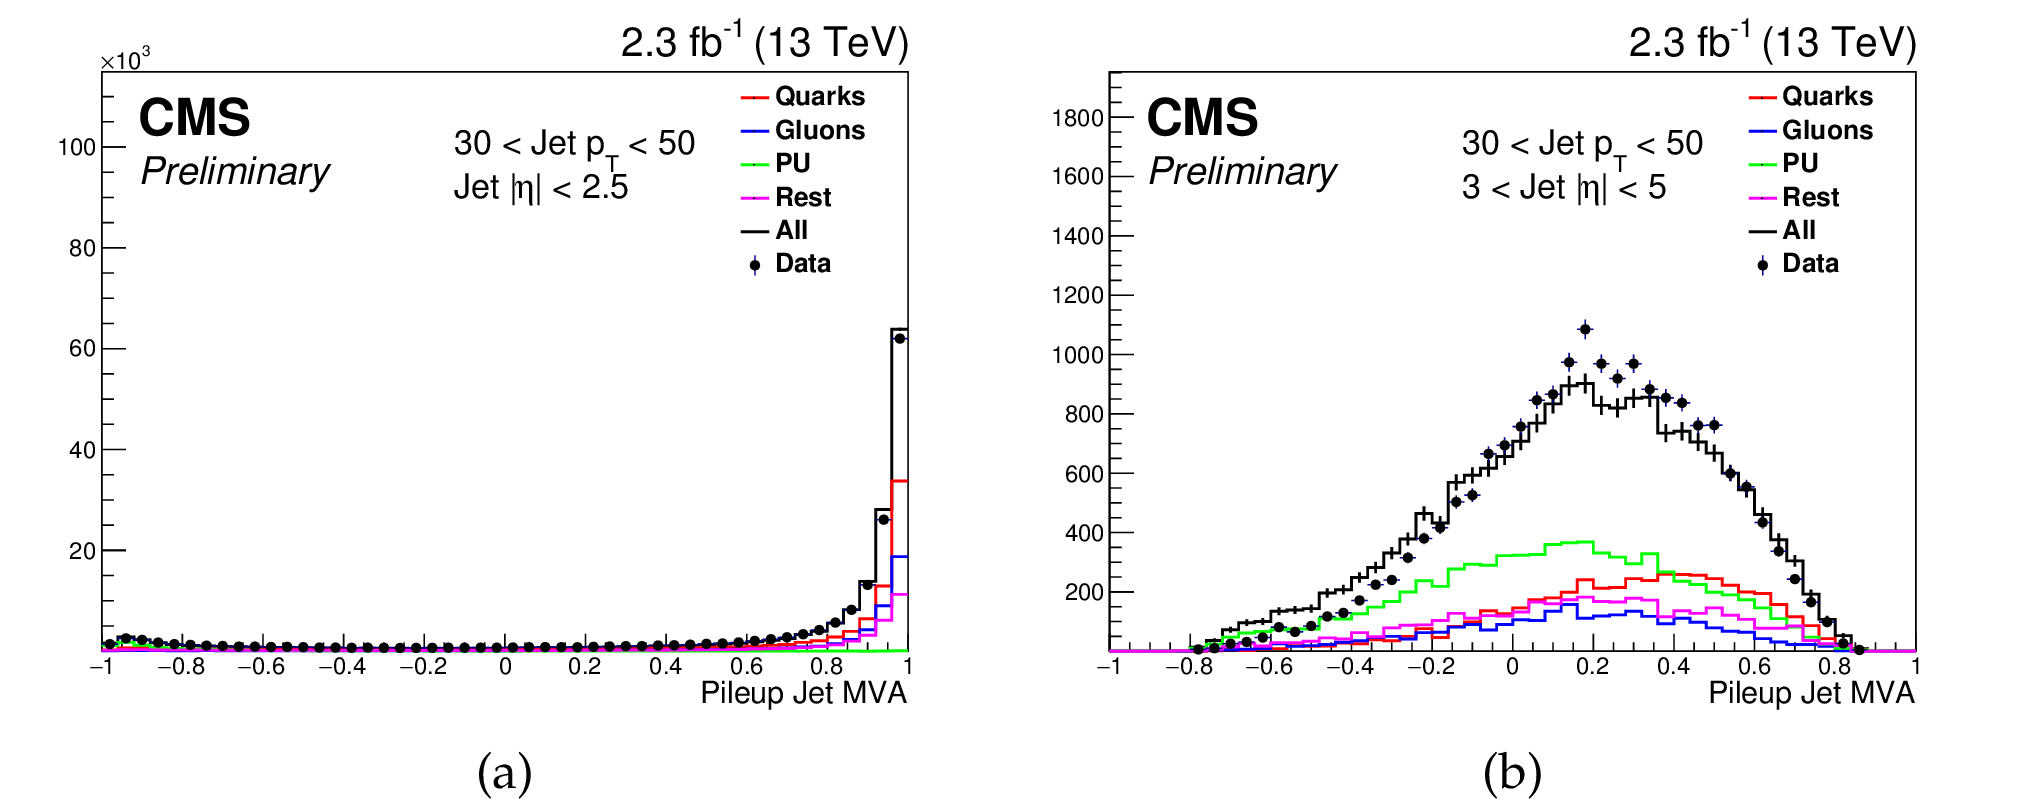
Figure 14:
Pileup jet MVA discriminant for forward jets. |

png pdf |
Figure 14-a:
Pileup jet MVA discriminant for central jets. |
png pdf |
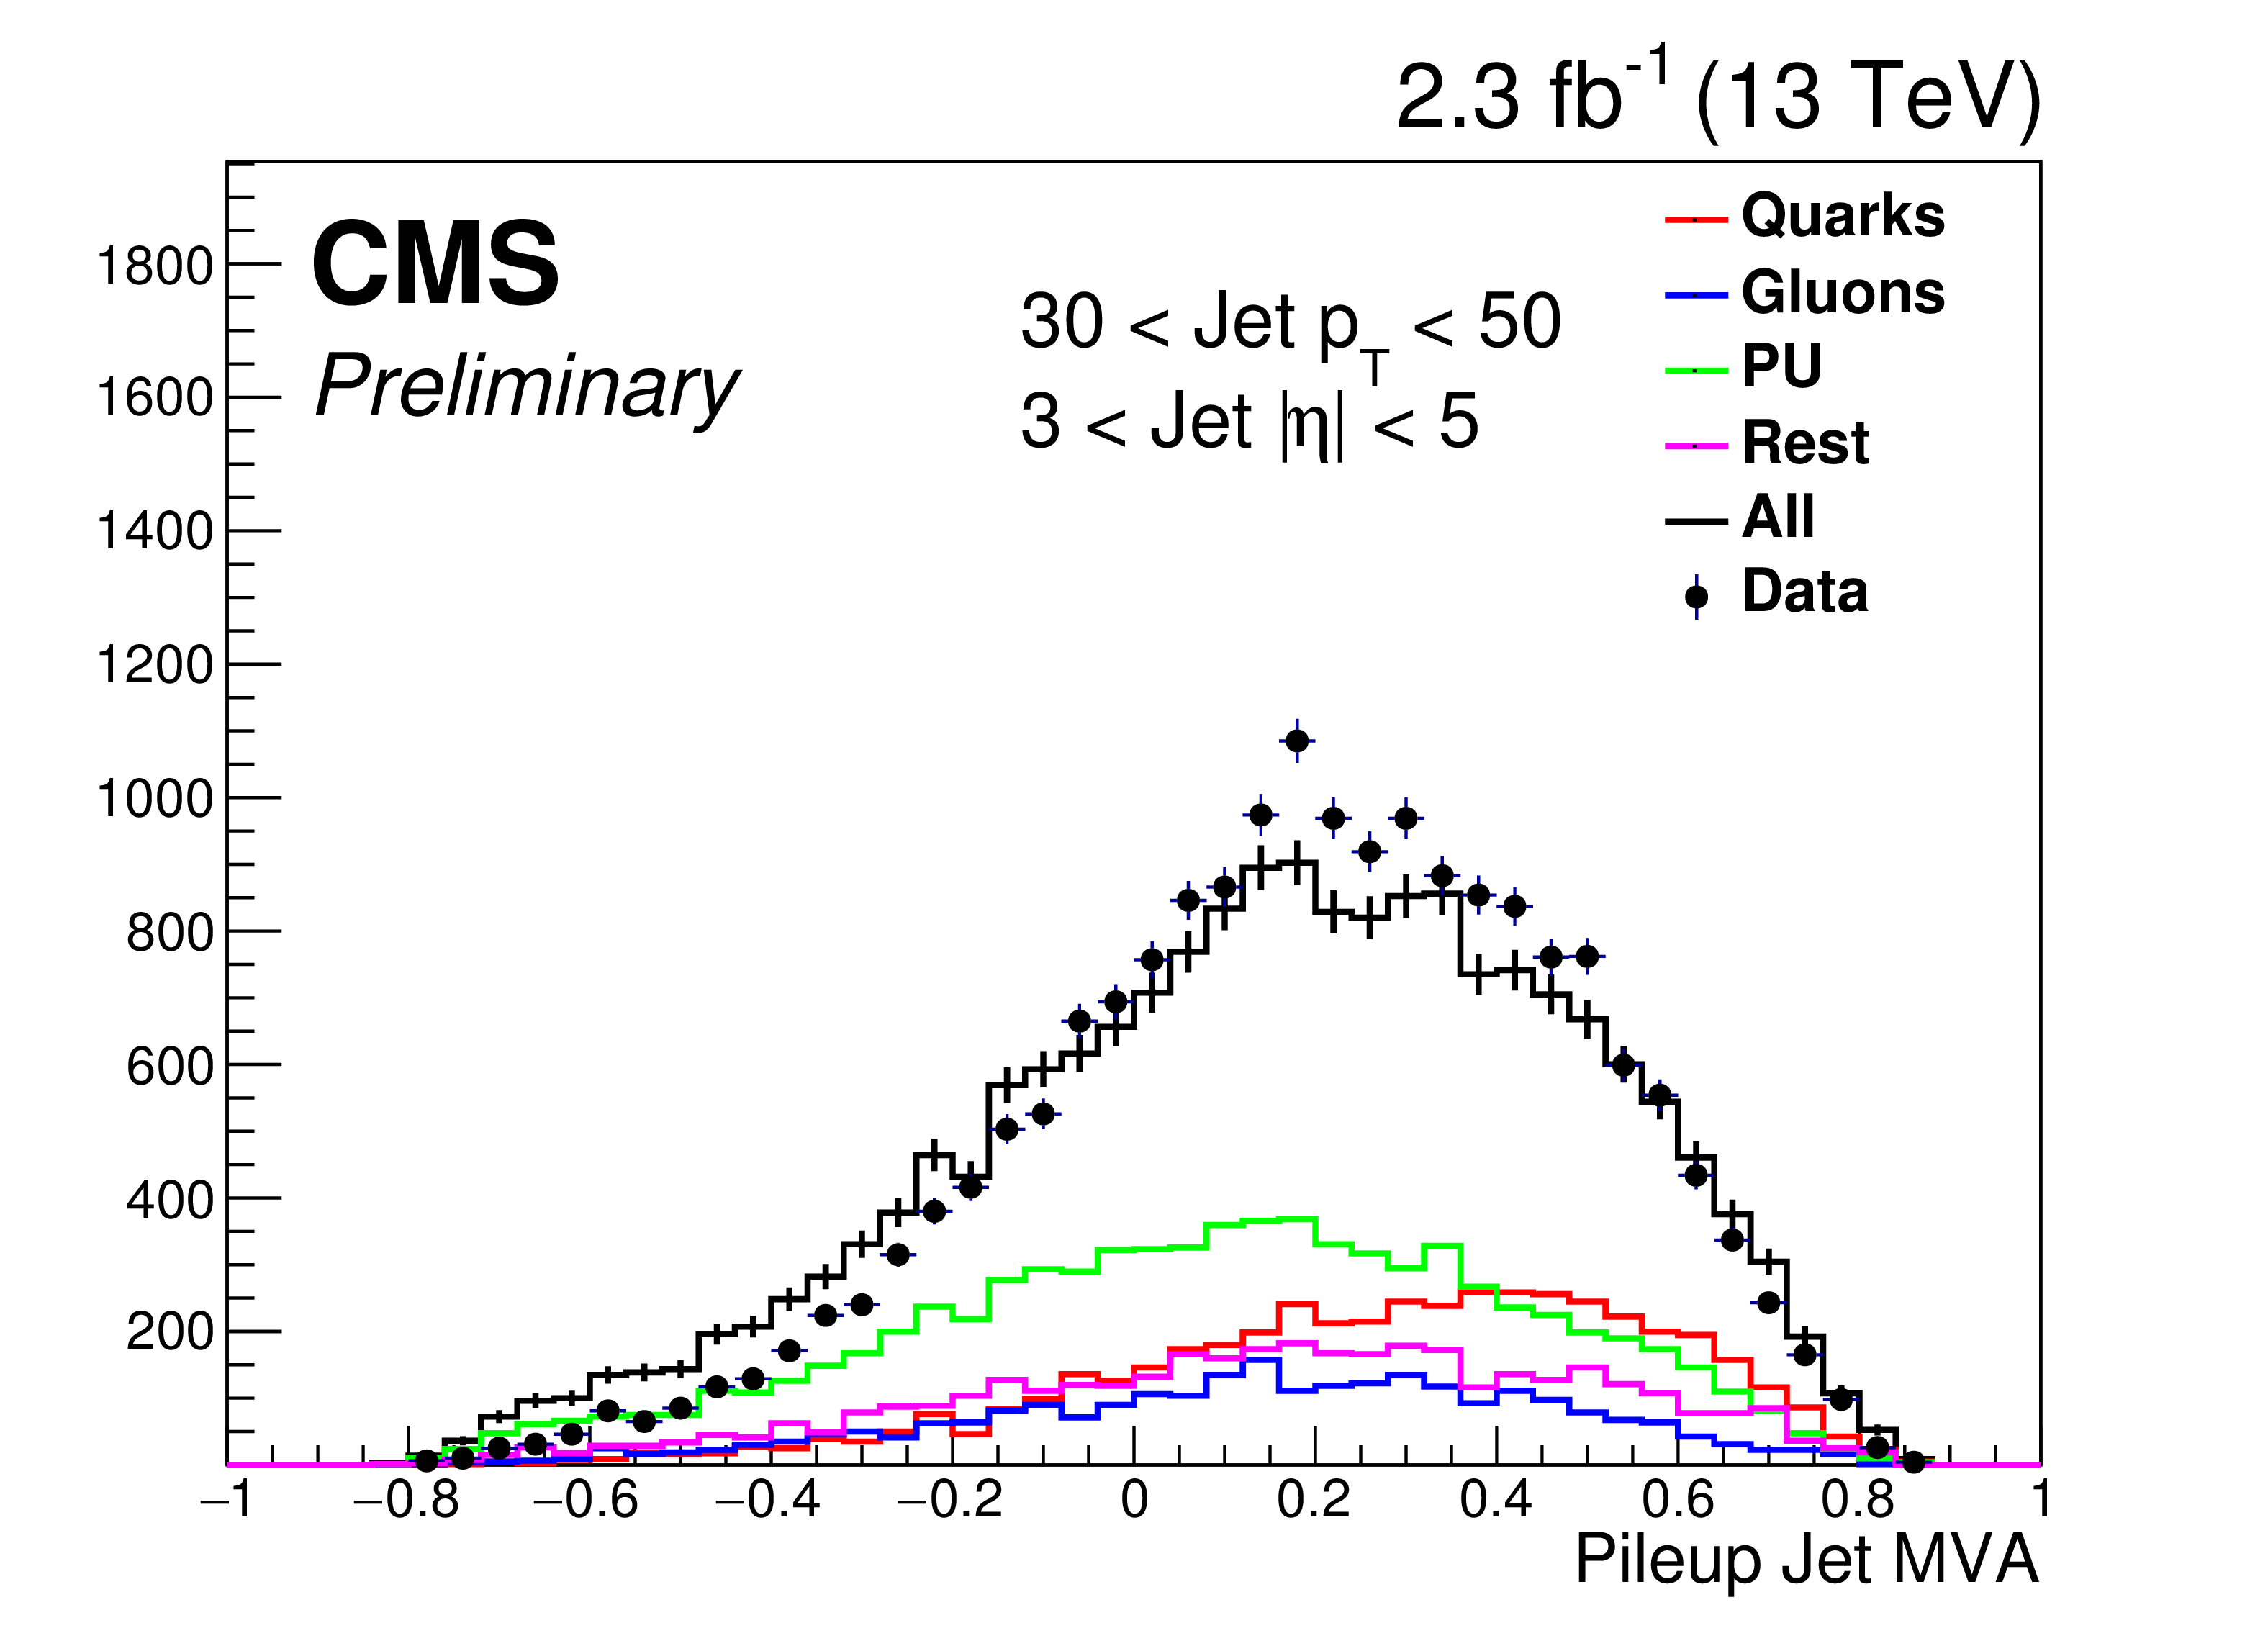
Figure 14-b:
Pileup jet MVA discriminant for forward jets. |

png pdf |
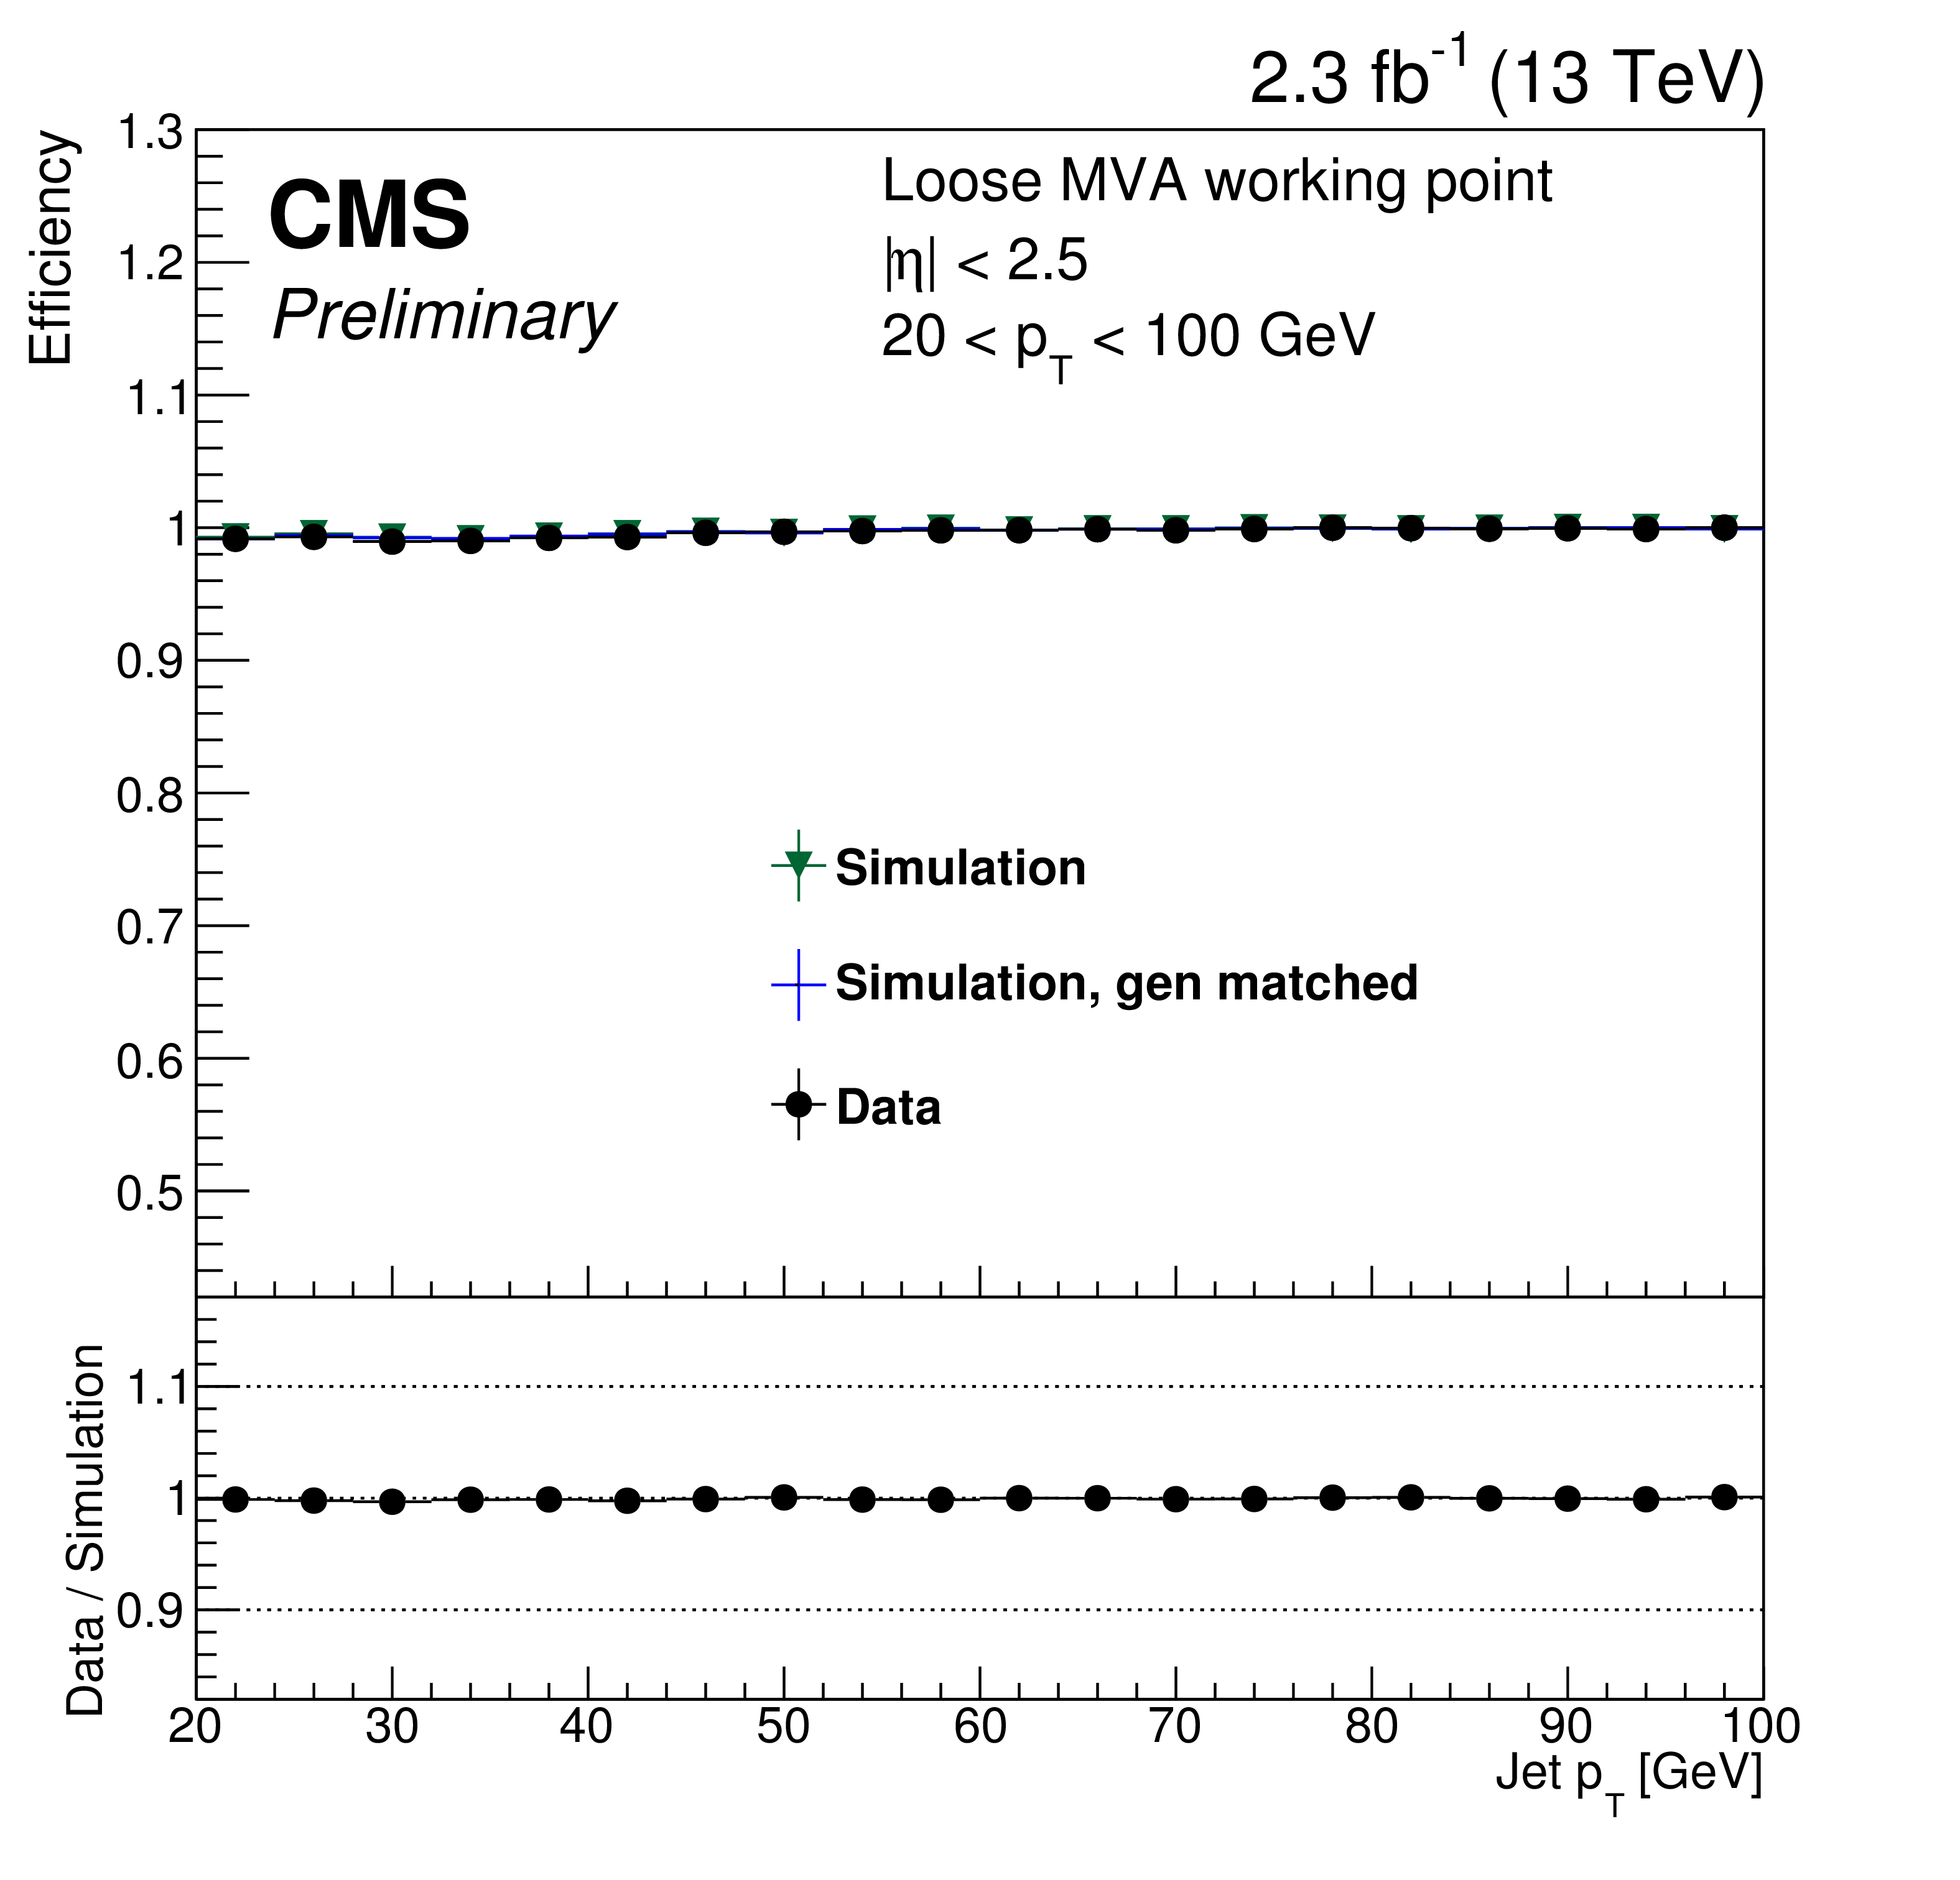
Figure 15:
Data-MC comparison of the MVA (loose working point) pileup jet identification efficiency on the Z$(\to \mu \mu )+$jets sample for PF jets with $ {p_{\mathrm {T}}} > $ 20 GeV: the efficiency is shown as a function of the jet pseudorapidity (top) and as a function of $ {p_{\mathrm {T}}} $ for jets with $|\eta |< $ 2.5 (bottom-left) and 3 $ < |\eta | < $ 5 (bottom-right). |

png pdf |
Figure 15-a:
Data-MC comparison of the MVA (loose working point) pileup jet identification efficiency on the Z$(\to \mu \mu )+$jets sample for PF jets with $ {p_{\mathrm {T}}} > $ 20 GeV: the efficiency is shown as a function of the jet pseudorapidity. |
png pdf |
Figure 15-b:
Data-MC comparison of the MVA (loose working point) pileup jet identification efficiency on the Z$(\to \mu \mu )+$jets sample for PF jets with $ {p_{\mathrm {T}}} > $ 20 GeV: the efficiency is shown as a function of $ {p_{\mathrm {T}}} $ for jets with $|\eta |< $ 2.5. |

png pdf |
Figure 15-c:
Data-MC comparison of the MVA (loose working point) pileup jet identification efficiency on the Z$(\to \mu \mu )+$jets sample for PF jets with $ {p_{\mathrm {T}}} > $ 20 GeV: the efficiency is shown as a function of $ {p_{\mathrm {T}}} $ for jets with 3 $ < |\eta | < $ 5. |

png pdf |
Figure 16:
Performance of several discriminants in the background-signal efficiency plane. The baseline selection for W tagging requiring a PF+CHS pruned or PF+PUPPI softdrop jet mass of 65 $ < m_{\mathrm {jet}} < $ 105 GeV, and N-subjettiness ratio (PF+CHS inputs) of $\tau _2/\tau _1 < $ 0.45 or N-subjettiness ratio (PF+PUPPI inputs) of $\tau _2/\tau _1 < $ 0.4 or $\tau _{21}^\text {DDT} < $ 0.52 are indicated with symbols. |

png pdf |
Figure 17:
Efficiency of the PF+CHS pruned jet mass and PF+PUPPI softdrop jet mass selection and the combined (PUPPI) $\tau _2/\tau _1$ (DDT) and $m_{\mathrm {jet}}$ selection on WW signal samples as a function of (a) $ {p_{\mathrm {T}}} $ and (b) the number of reconstructed vertices. Reconstructed jets enter (the denominator and numerator of) the efficiency only if at generator level both quarks from the W decay are within $\Delta R< $ 0.8 of the jet axis. (c) Mistag rate of the PF+CHS pruned jet mass and PF+PUPPI softdrop jet mass selection and the combined (PUPPI) $\tau _2/\tau _1$ (DDT) and $m_{\mathrm {jet}}$ selection on WW signal samples as a function of (c) $ {p_{\mathrm {T}}} $ and (d) the number of reconstructed vertices. The error bars represent the statistical uncertainty in the MC simulation and the horizontal ones the binning. |

png pdf |
Figure 17-a:
Efficiency of the PF+CHS pruned jet mass and PF+PUPPI softdrop jet mass selection and the combined (PUPPI) $\tau _2/\tau _1$ (DDT) and $m_{\mathrm {jet}}$ selection on WW signal samples as a function of $ {p_{\mathrm {T}}} $. Reconstructed jets enter (the denominator and numerator of) the efficiency only if at generator level both quarks from the W decay are within $\Delta R< $ 0.8 of the jet axis. |

png pdf |
Figure 17-b:
Efficiency of the PF+CHS pruned jet mass and PF+PUPPI softdrop jet mass selection and the combined (PUPPI) $\tau _2/\tau _1$ (DDT) and $m_{\mathrm {jet}}$ selection on WW signal samples as a function of the number of reconstructed vertices. Reconstructed jets enter (the denominator and numerator of) the efficiency only if at generator level both quarks from the W decay are within $\Delta R< $ 0.8 of the jet axis. |

png pdf |
Figure 17-c:
Mistag rate of the PF+CHS pruned jet mass and PF+PUPPI softdrop jet mass selection and the combined (PUPPI) $\tau _2/\tau _1$ (DDT) and $m_{\mathrm {jet}}$ selection on WW signal samples as a function of $ {p_{\mathrm {T}}} $. The error bars represent the statistical uncertainty in the MC simulation and the horizontal ones the binning. |
png pdf |
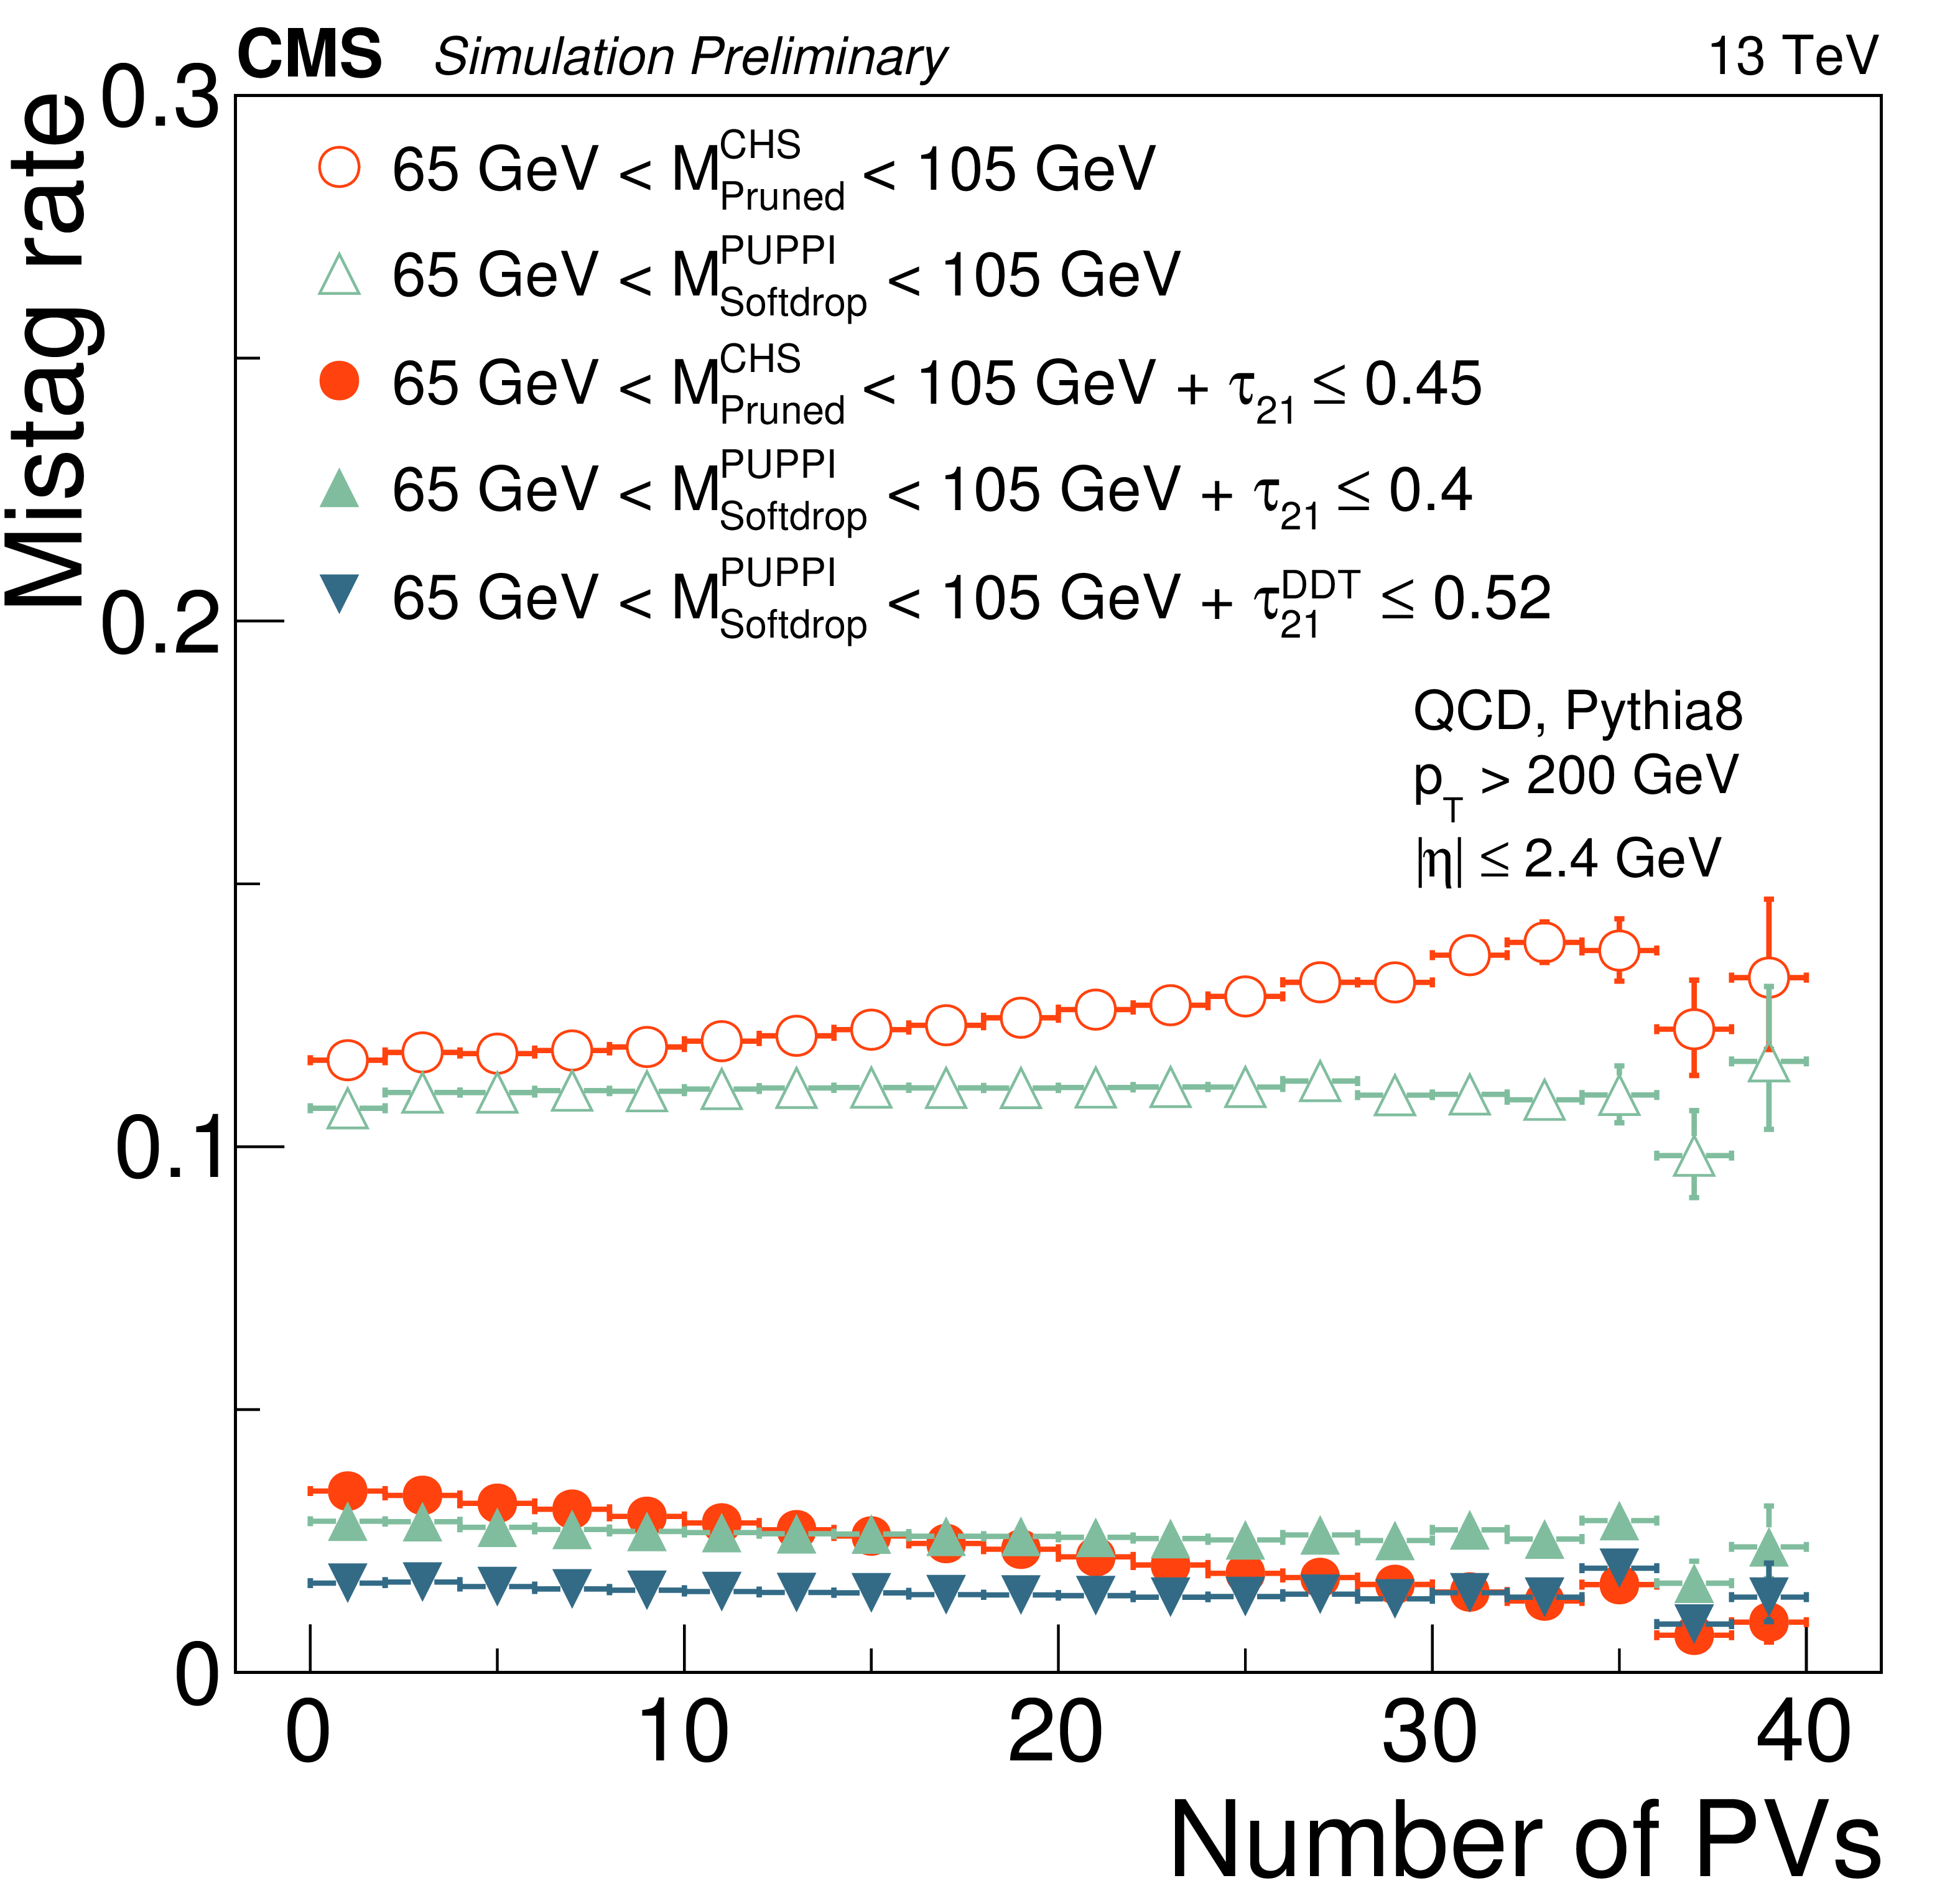
Figure 17-d:
Mistag rate of the PF+CHS pruned jet mass and PF+PUPPI softdrop jet mass selection and the combined (PUPPI) $\tau _2/\tau _1$ (DDT) and $m_{\mathrm {jet}}$ selection on WW signal samples as a function of the number of reconstructed vertices. The error bars represent the statistical uncertainty in the MC simulation and the horizontal ones the binning. |

png pdf |
Figure 18:
PF+CHS pruned jet mass distribution that (a) pass and (b) fail the PF+CHS $\tau _2 / \tau _1 < $ 0.45 selection in the $\mathrm {t\overline {t}}$ control sample. PF+PUPPI softdrop jet mass distribution that (c) pass and (d) fail the PF+PUPPI $\tau _2 / \tau _1 < $ 0.40 selection. The result of the fit to data and simulation are shown, respectively, by the solid and long-dashed line and the background components of the fit are shown as dashed-dotted and short-dashed line. |

png pdf |
Figure 18-a:
PF+CHS pruned jet mass distribution that pass the PF+CHS $\tau _2 / \tau _1 < $ 0.45 selection in the $\mathrm {t\overline {t}}$ control sample. The result of the fit to data and simulation are shown, respectively, by the solid and long-dashed line and the background components of the fit are shown as dashed-dotted and short-dashed line. |

png pdf |
Figure 18-b:
PF+CHS pruned jet mass distribution that fail the PF+CHS $\tau _2 / \tau _1 < $ 0.45 selection in the $\mathrm {t\overline {t}}$ control sample. The result of the fit to data and simulation are shown, respectively, by the solid and long-dashed line and the background components of the fit are shown as dashed-dotted and short-dashed line. |

png pdf |
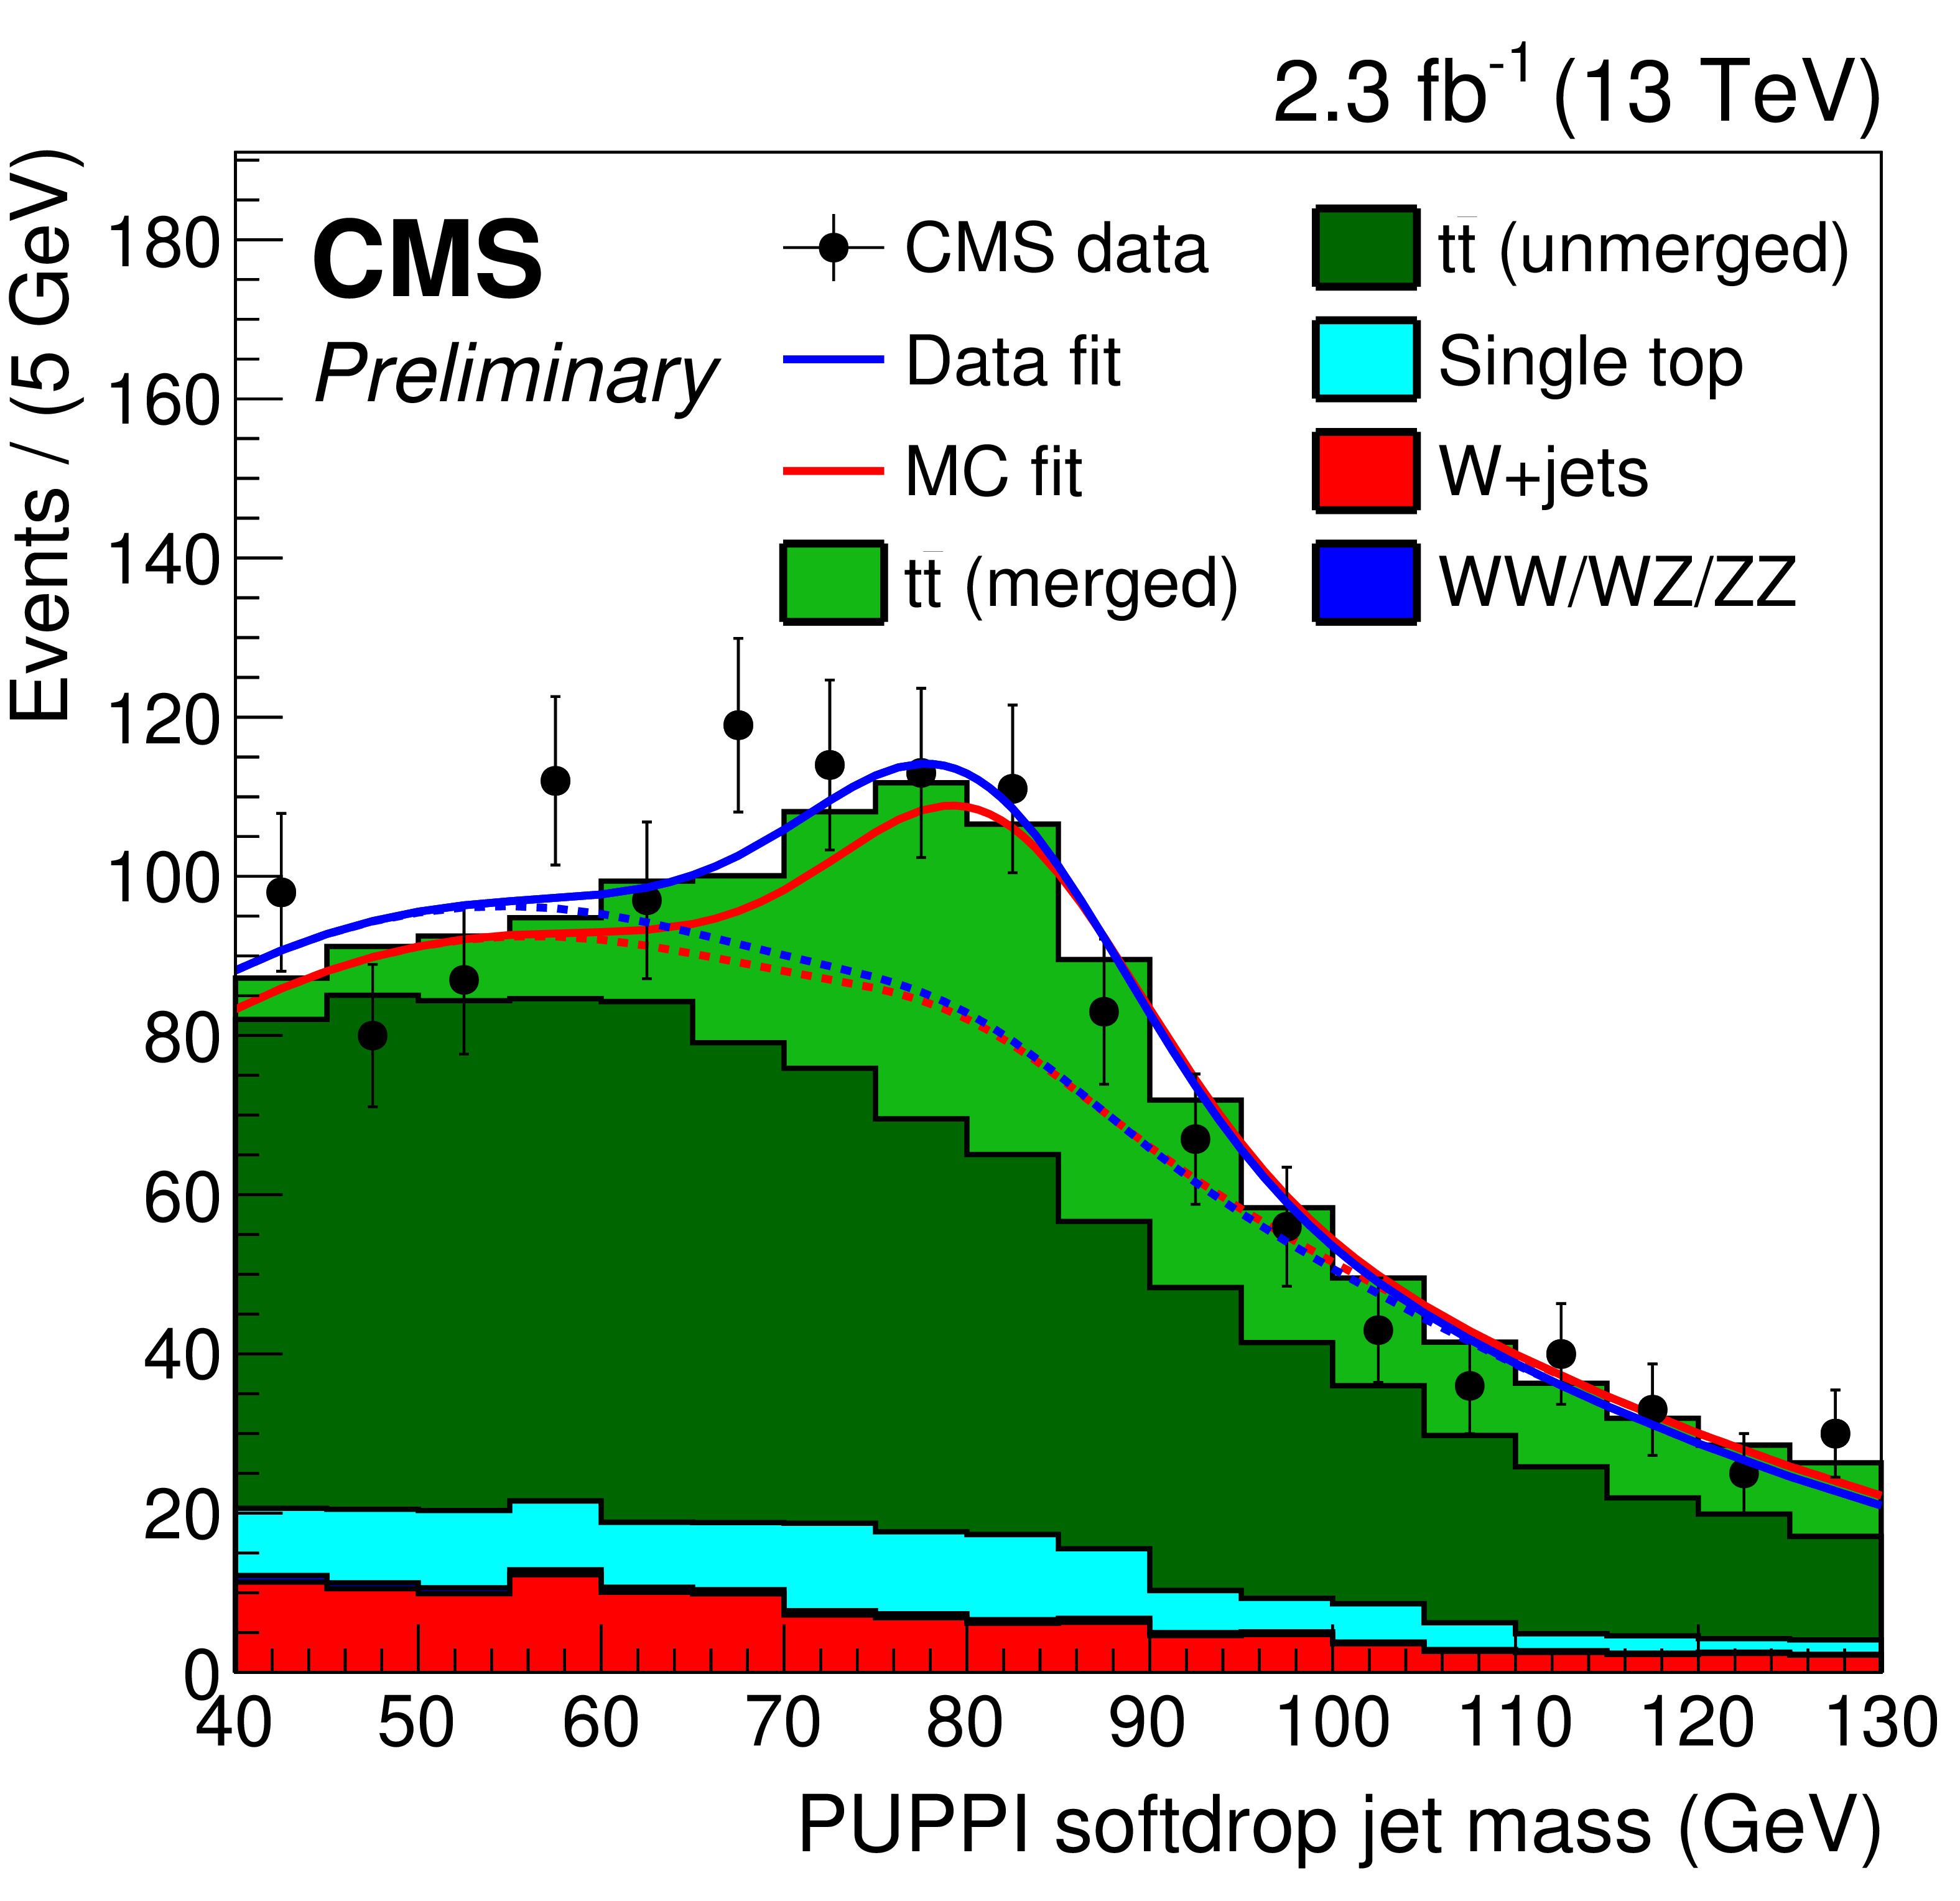
Figure 18-c:
PF+PUPPI softdrop jet mass distribution that pass the PF+PUPPI $\tau _2 / \tau _1 < $ 0.40 selection. The result of the fit to data and simulation are shown, respectively, by the solid and long-dashed line and the background components of the fit are shown as dashed-dotted and short-dashed line. |

png pdf |
Figure 18-d:
PF+PUPPI softdrop jet mass distribution that fail the PF+PUPPI $\tau _2 / \tau _1 < $ 0.40 selection. The result of the fit to data and simulation are shown, respectively, by the solid and long-dashed line and the background components of the fit are shown as dashed-dotted and short-dashed line. |
png pdf |
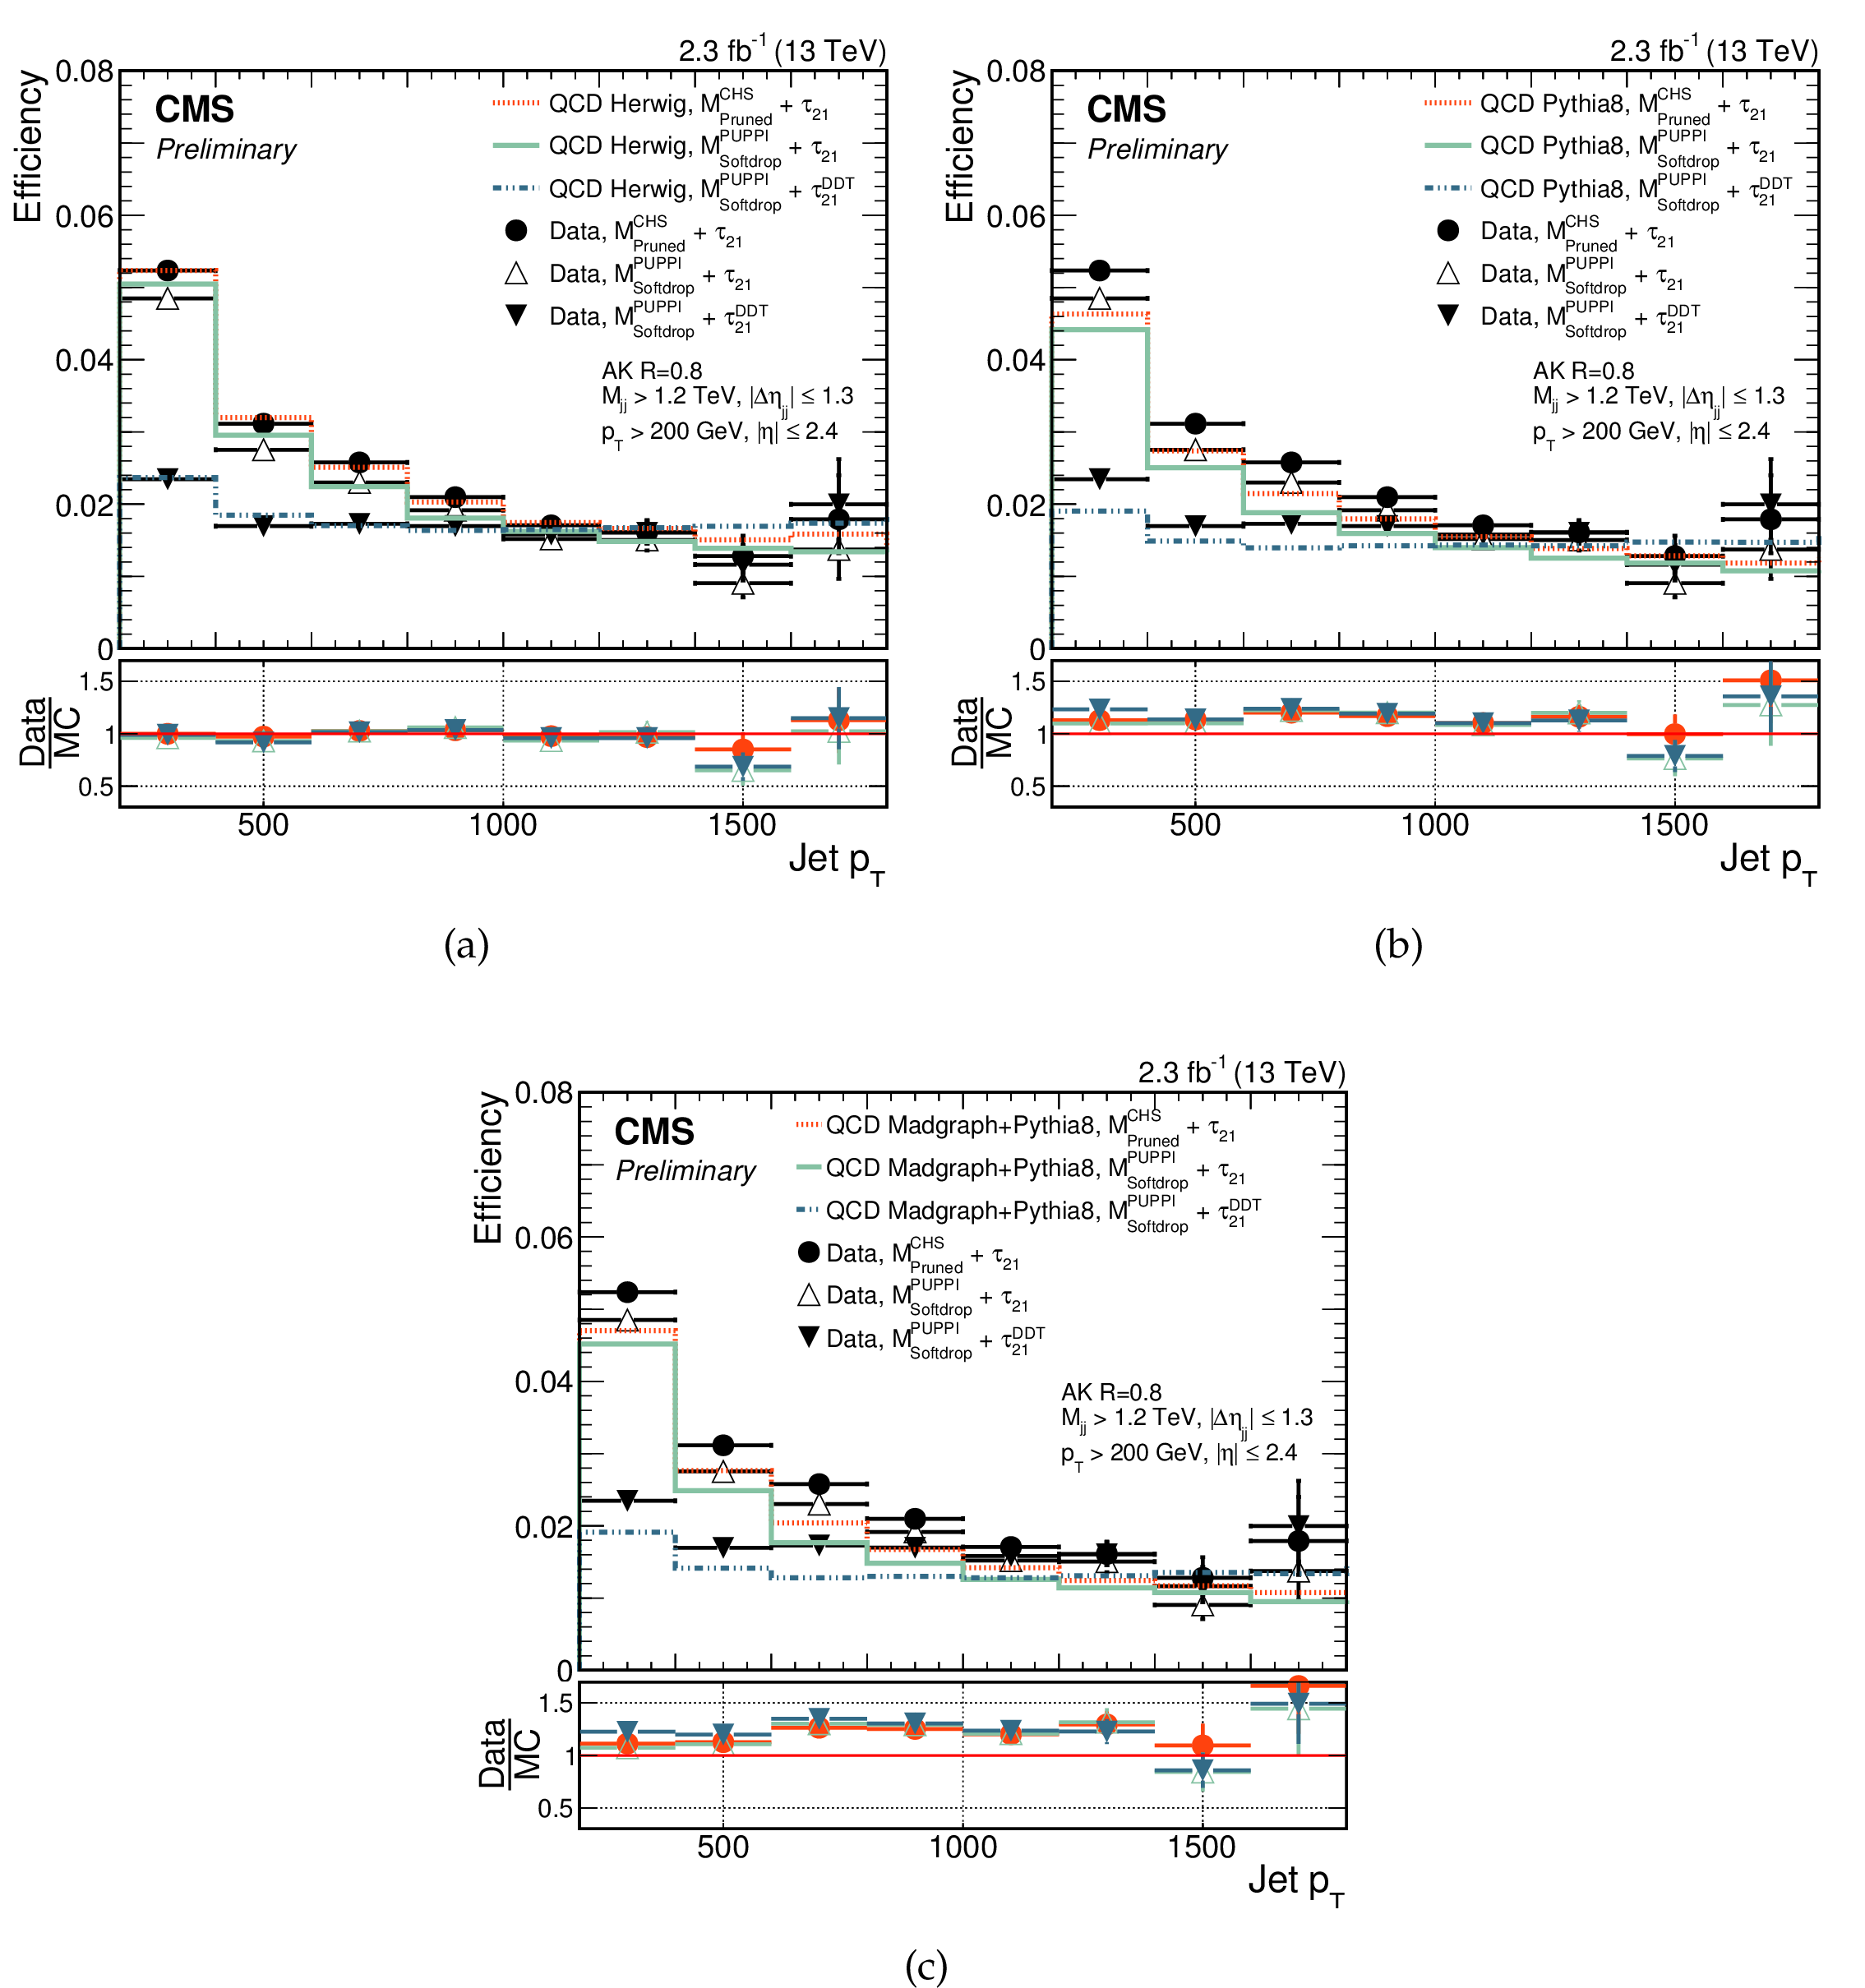
Figure 19:
Fraction of jets passing the $m_{\mathrm {jet}}$ and $\tau _2/\tau _1$ selections in a dijet data sample and in simulation as a function of $ {p_{\mathrm {T}}} $ , comparing (a) HERWIG++, (b) PYTHIA-8 and (c) PYTHIA-8 with MadGraph as matrix-element generator. The data over simulation ratio is shown for the combination of the $m_{\mathrm {jet}}$ and $\tau _2/\tau _1$ selections. |
png pdf |
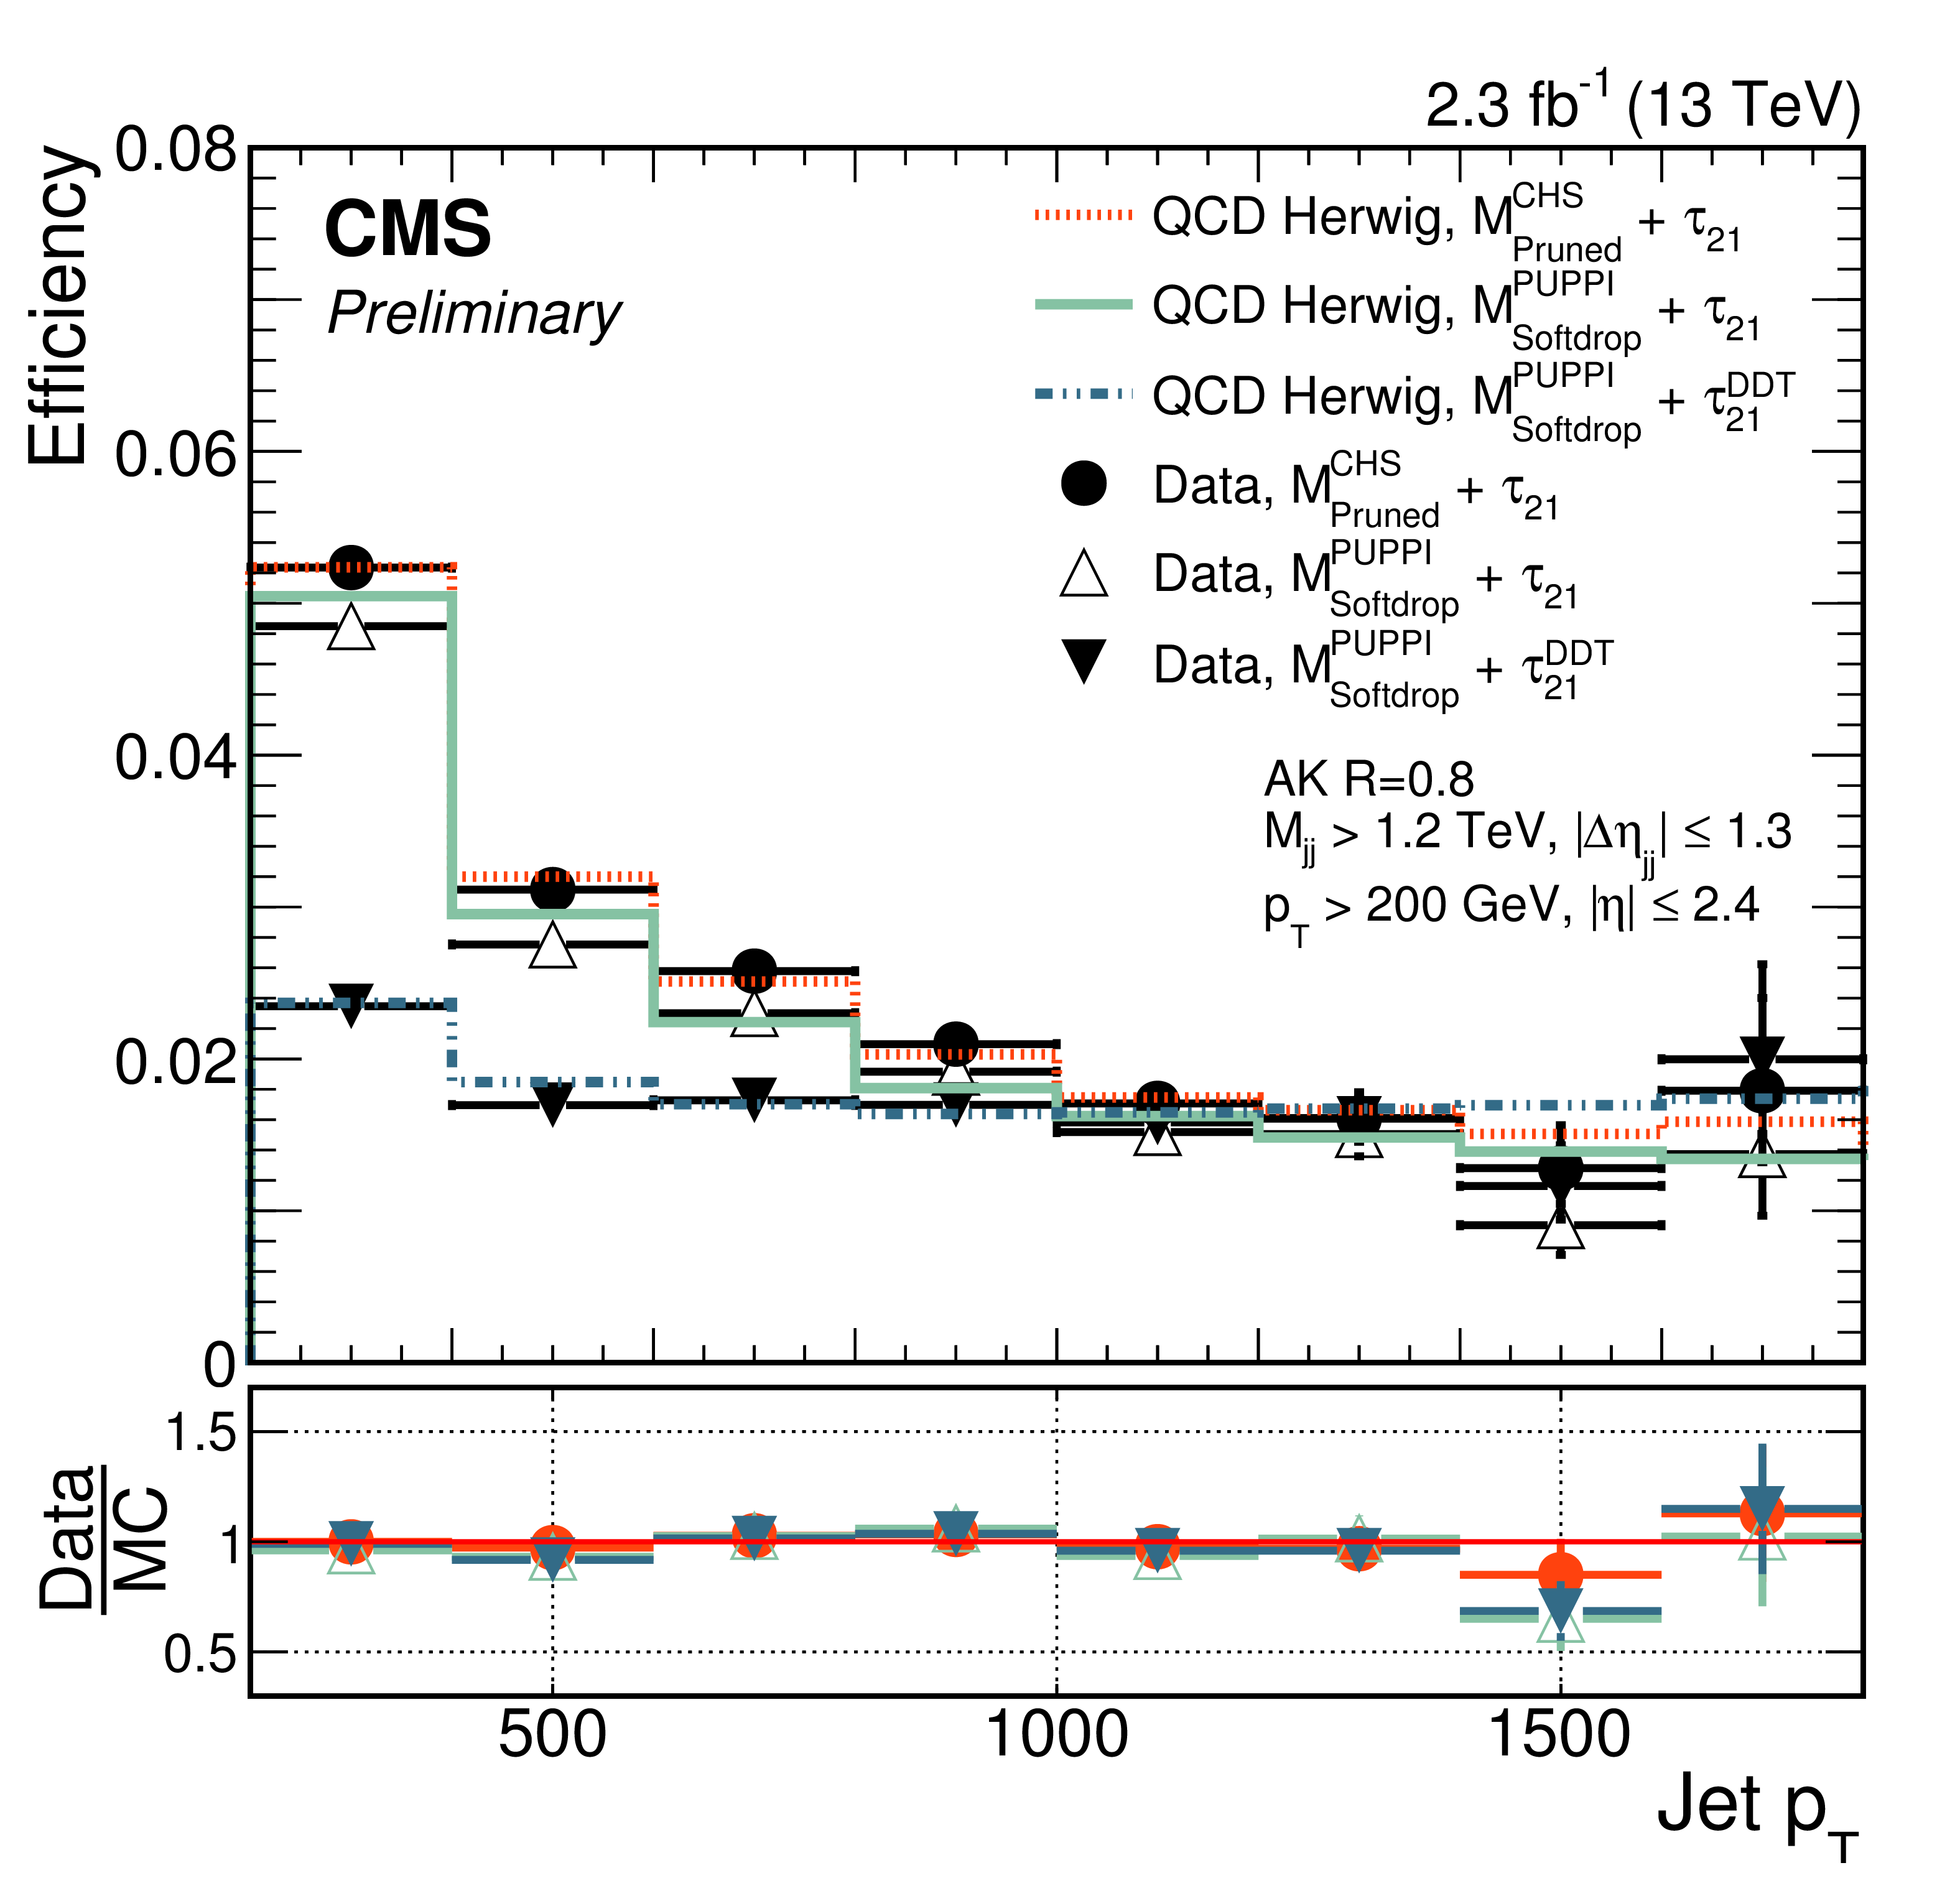
Figure 19-a:
Fraction of jets passing the $m_{\mathrm {jet}}$ and $\tau _2/\tau _1$ selections in a dijet data sample and in simulation as a function of $ {p_{\mathrm {T}}} $ , comparing HERWIG++. The data over simulation ratio is shown for the combination of the $m_{\mathrm {jet}}$ and $\tau _2/\tau _1$ selections. |

png pdf |
Figure 19-b:
Fraction of jets passing the $m_{\mathrm {jet}}$ and $\tau _2/\tau _1$ selections in a dijet data sample and in simulation as a function of $ {p_{\mathrm {T}}} $ , comparing PYTHIA-8. The data over simulation ratio is shown for the combination of the $m_{\mathrm {jet}}$ and $\tau _2/\tau _1$ selections. |

png pdf |
Figure 19-c:
Fraction of jets passing the $m_{\mathrm {jet}}$ and $\tau _2/\tau _1$ selections in a dijet data sample and in simulation as a function of $ {p_{\mathrm {T}}} $ , comparing PYTHIA-8 with MadGraph as matrix-element generator. The data over simulation ratio is shown for the combination of the $m_{\mathrm {jet}}$ and $\tau _2/\tau _1$ selections. |
png pdf |
Figure 20:
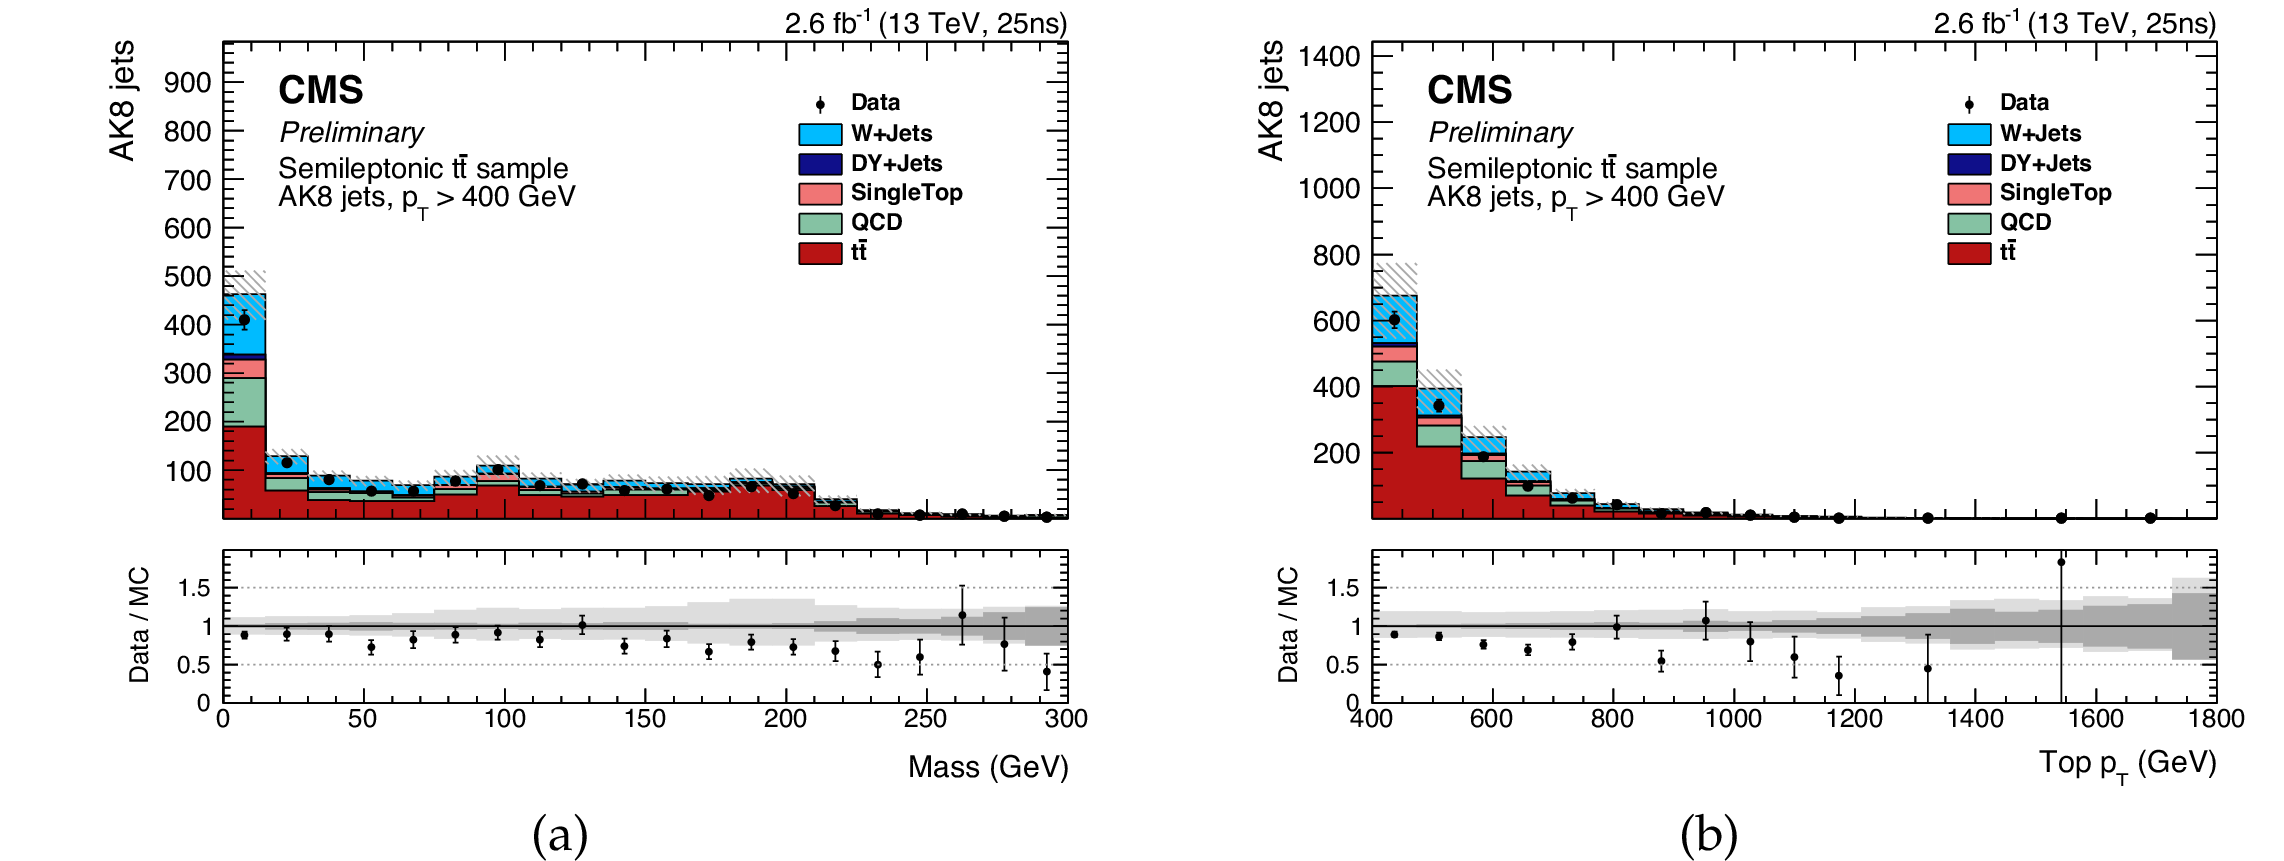
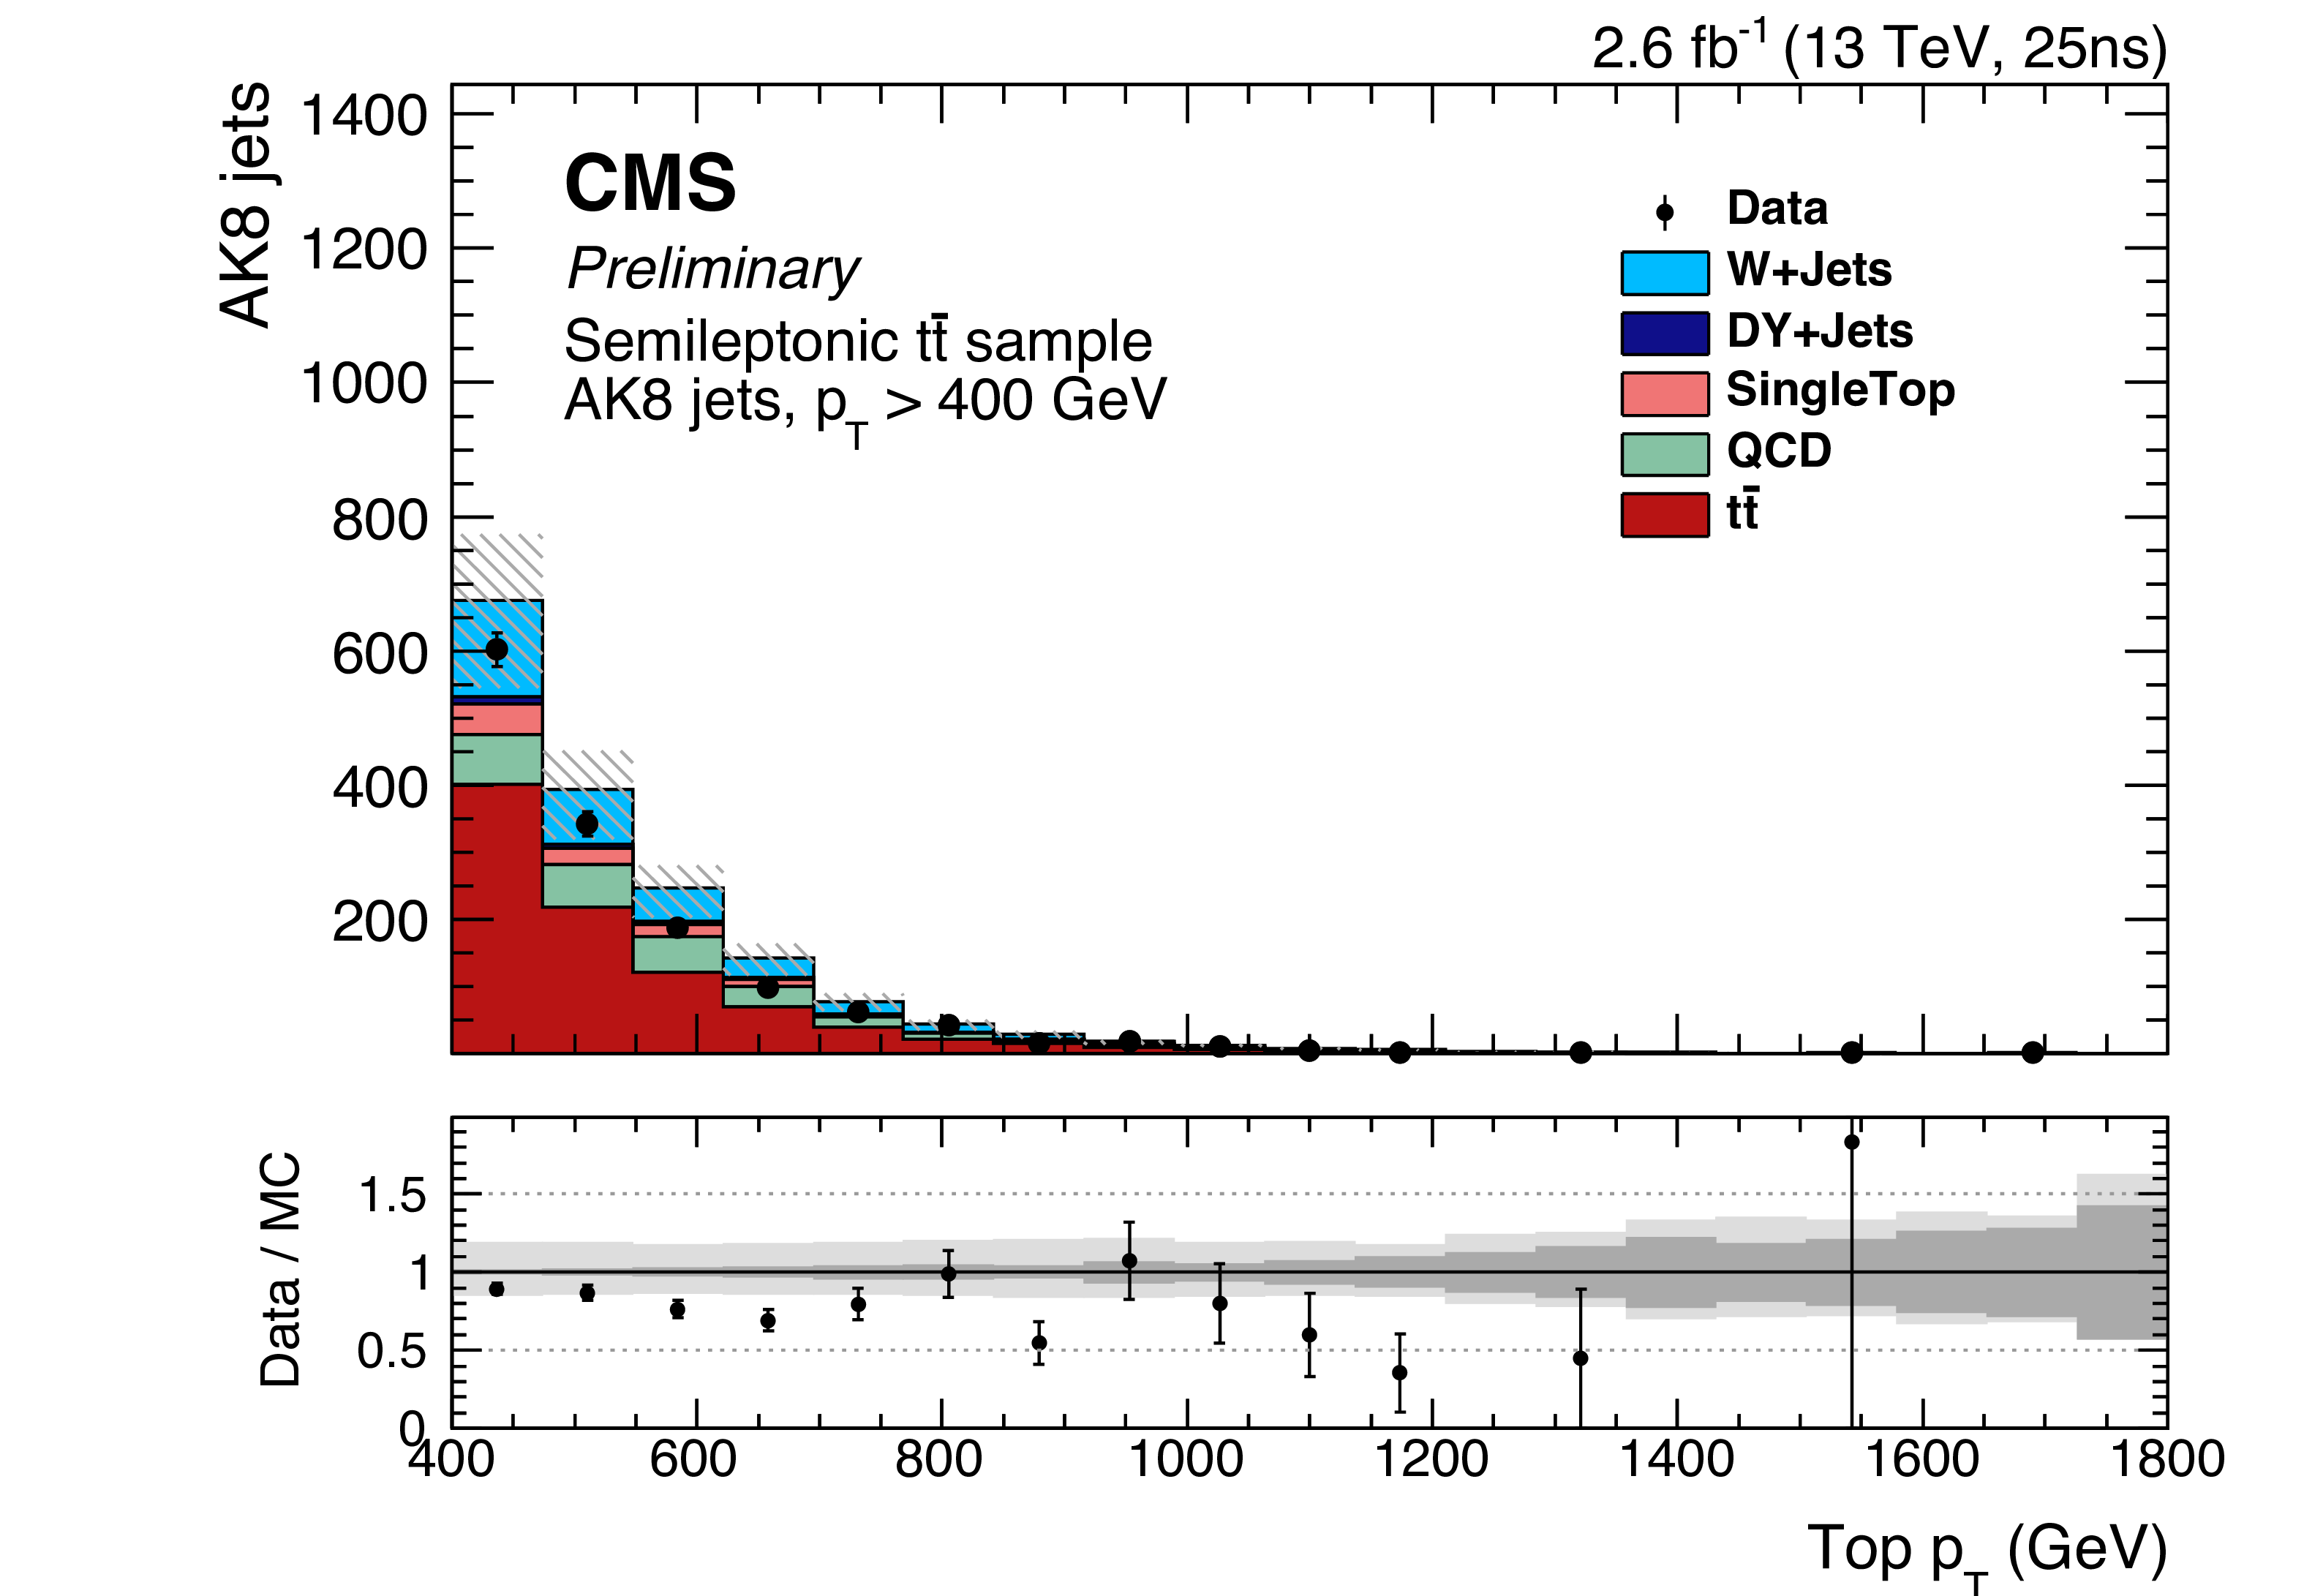
Kinematic distributions for the AK8 jet associated to the boosted top hadronic decay in selected semi-leptonic ${\mathrm{ t } {}\mathrm{ \bar{t} } } $ events. The ${\mathrm{ t } {}\mathrm{ \bar{t} } } $ MC and the selected backgrounds are stacked. The distributions are: (a) Corrected softdrop mass, (b) Transverse momentum. A hashed band indicates the sum in quadrature of the statistical and systematic uncertainties of the simulation. The ratio of data to simulation is displayed below the distribution. A dark shaded and a light shaded band indicate the statistical uncertainty of the simulation and the systematic uncertainty of the modeling of top $ {p_{\mathrm {T}}} $ spectrum, respectively. |

png pdf |
Figure 20-a:
Distribution of the corrected softdrop mass for the AK8 jet associated to the boosted top hadronic decay in selected semi-leptonic ${\mathrm{ t } {}\mathrm{ \bar{t} } } $ events. The ${\mathrm{ t } {}\mathrm{ \bar{t} } } $ MC and the selected backgrounds are stacked. A hashed band indicates the sum in quadrature of the statistical and systematic uncertainties of the simulation. The ratio of data to simulation is displayed below the distribution. A dark shaded and a light shaded band indicate the statistical uncertainty of the simulation and the systematic uncertainty of the modeling of top $ {p_{\mathrm {T}}} $ spectrum, respectively. |
png pdf |
Figure 20-b:
Distribution of the transverse momentum for the AK8 jet associated to the boosted top hadronic decay in selected semi-leptonic ${\mathrm{ t } {}\mathrm{ \bar{t} } } $ events. The ${\mathrm{ t } {}\mathrm{ \bar{t} } } $ MC and the selected backgrounds are stacked. A hashed band indicates the sum in quadrature of the statistical and systematic uncertainties of the simulation. The ratio of data to simulation is displayed below the distribution. A dark shaded and a light shaded band indicate the statistical uncertainty of the simulation and the systematic uncertainty of the modeling of top $ {p_{\mathrm {T}}} $ spectrum, respectively. |

png pdf |
Figure 21:
Top tagging variable distributions for the AK8 jet associated to the boosted top hadronic decay in selected semi-leptonic ${\mathrm{ t } {}\mathrm{ \bar{t} } } $ events for the loose (3.0% nominal background mistag rate) high $ p_{\mathrm{T}} $ softdrop/PUPPI working point. The ${\mathrm{ t } {}\mathrm{ \bar{t} } } $ MC and the selected backgrounds are stacked. (a) Corrected softdrop mass (b) ungroomed N-subjettiness. A hashed band indicates the sum in quadrature of the statistical and systematic uncertainties of the simulation. The ratio of data to simulation is displayed below the distribution. A dark shaded and a light shaded band indicate the statistical uncertainty of the simulation and the systematic uncertainty of the modeling of top $ p_{\mathrm{T}} $ spectrum, respectively. |

png pdf |
Figure 21-a:
Corrected softdrop mass distribution for the AK8 jet associated to the boosted top hadronic decay in selected semi-leptonic ${\mathrm{ t } {}\mathrm{ \bar{t} } } $ events for the loose (3.0% nominal background mistag rate) high $ p_{\mathrm{T}} $ softdrop/PUPPI working point. The ${\mathrm{ t } {}\mathrm{ \bar{t} } } $ MC and the selected backgrounds are stacked. A hashed band indicates the sum in quadrature of the statistical and systematic uncertainties of the simulation. The ratio of data to simulation is displayed below the distribution. A dark shaded and a light shaded band indicate the statistical uncertainty of the simulation and the systematic uncertainty of the modeling of top $ p_{\mathrm{T}} $ spectrum, respectively. |

png pdf |
Figure 21-b:
Ungroomed N-subjettiness distribution for the AK8 jet associated to the boosted top hadronic decay in selected semi-leptonic ${\mathrm{ t } {}\mathrm{ \bar{t} } } $ events for the loose (3.0% nominal background mistag rate) high $ p_{\mathrm{T}} $ softdrop/PUPPI working point. The ${\mathrm{ t } {}\mathrm{ \bar{t} } } $ MC and the selected backgrounds are stacked. A hashed band indicates the sum in quadrature of the statistical and systematic uncertainties of the simulation. The ratio of data to simulation is displayed below the distribution. A dark shaded and a light shaded band indicate the statistical uncertainty of the simulation and the systematic uncertainty of the modeling of top $ p_{\mathrm{T}} $ spectrum, respectively. |

png pdf |
Figure 22:
Top tagging variable distributions for the CA15 jet associated to the boosted top hadronic decay in selected semi-leptonic ${\mathrm{ t } {}\mathrm{ \bar{t} } } $ events for the loose (1.0 % nominal background mis-tag rate) low $ {p_{\mathrm {T}}} $ HTT V2/CHS working point. The ${\mathrm{ t } {}\mathrm{ \bar{t} } } $ MC and the selected backgrounds are stacked. The distributions are: (a) HTT V2 mass. (b) $f_{Rec}$. (c) softdrop groomed N-subjettiness A hashed band indicates the sum in quadrature of the statistical and systematic uncertainties of the simulation. The ratio of data to simulation is displayed below the distribution. A dark shaded and a light shaded band indicate the statistical uncertainty of the simulation and the systematic uncertainty of the modeling of top $ {p_{\mathrm {T}}} $ spectrum, respectively. |

png pdf |
Figure 22-a:
HTT V2 mass distribution for the CA15 jet associated to the boosted top hadronic decay in selected semi-leptonic ${\mathrm{ t } {}\mathrm{ \bar{t} } } $ events for the loose (1.0 % nominal background mis-tag rate) low $ {p_{\mathrm {T}}} $ HTT V2/CHS working point. The ${\mathrm{ t } {}\mathrm{ \bar{t} } } $ MC and the selected backgrounds are stacked. |

png pdf |
Figure 22-b:
$f_{Rec}$ distribution for the CA15 jet associated to the boosted top hadronic decay in selected semi-leptonic ${\mathrm{ t } {}\mathrm{ \bar{t} } } $ events for the loose (1.0 % nominal background mis-tag rate) low $ {p_{\mathrm {T}}} $ HTT V2/CHS working point. The ${\mathrm{ t } {}\mathrm{ \bar{t} } } $ MC and the selected backgrounds are stacked. A hashed band indicates the sum in quadrature of the statistical and systematic uncertainties of the simulation. The ratio of data to simulation is displayed below the distribution. A dark shaded and a light shaded band indicate the statistical uncertainty of the simulation and the systematic uncertainty of the modeling of top $ {p_{\mathrm {T}}} $ spectrum, respectively. |

png pdf |
Figure 22-c:
Softdrop groomed N-subjettiness distribution for the CA15 jet associated to the boosted top hadronic decay in selected semi-leptonic ${\mathrm{ t } {}\mathrm{ \bar{t} } } $ events for the loose (1.0 % nominal background mis-tag rate) low $ {p_{\mathrm {T}}} $ HTT V2/CHS working point. The ${\mathrm{ t } {}\mathrm{ \bar{t} } } $ MC and the selected backgrounds are stacked. |
png pdf |
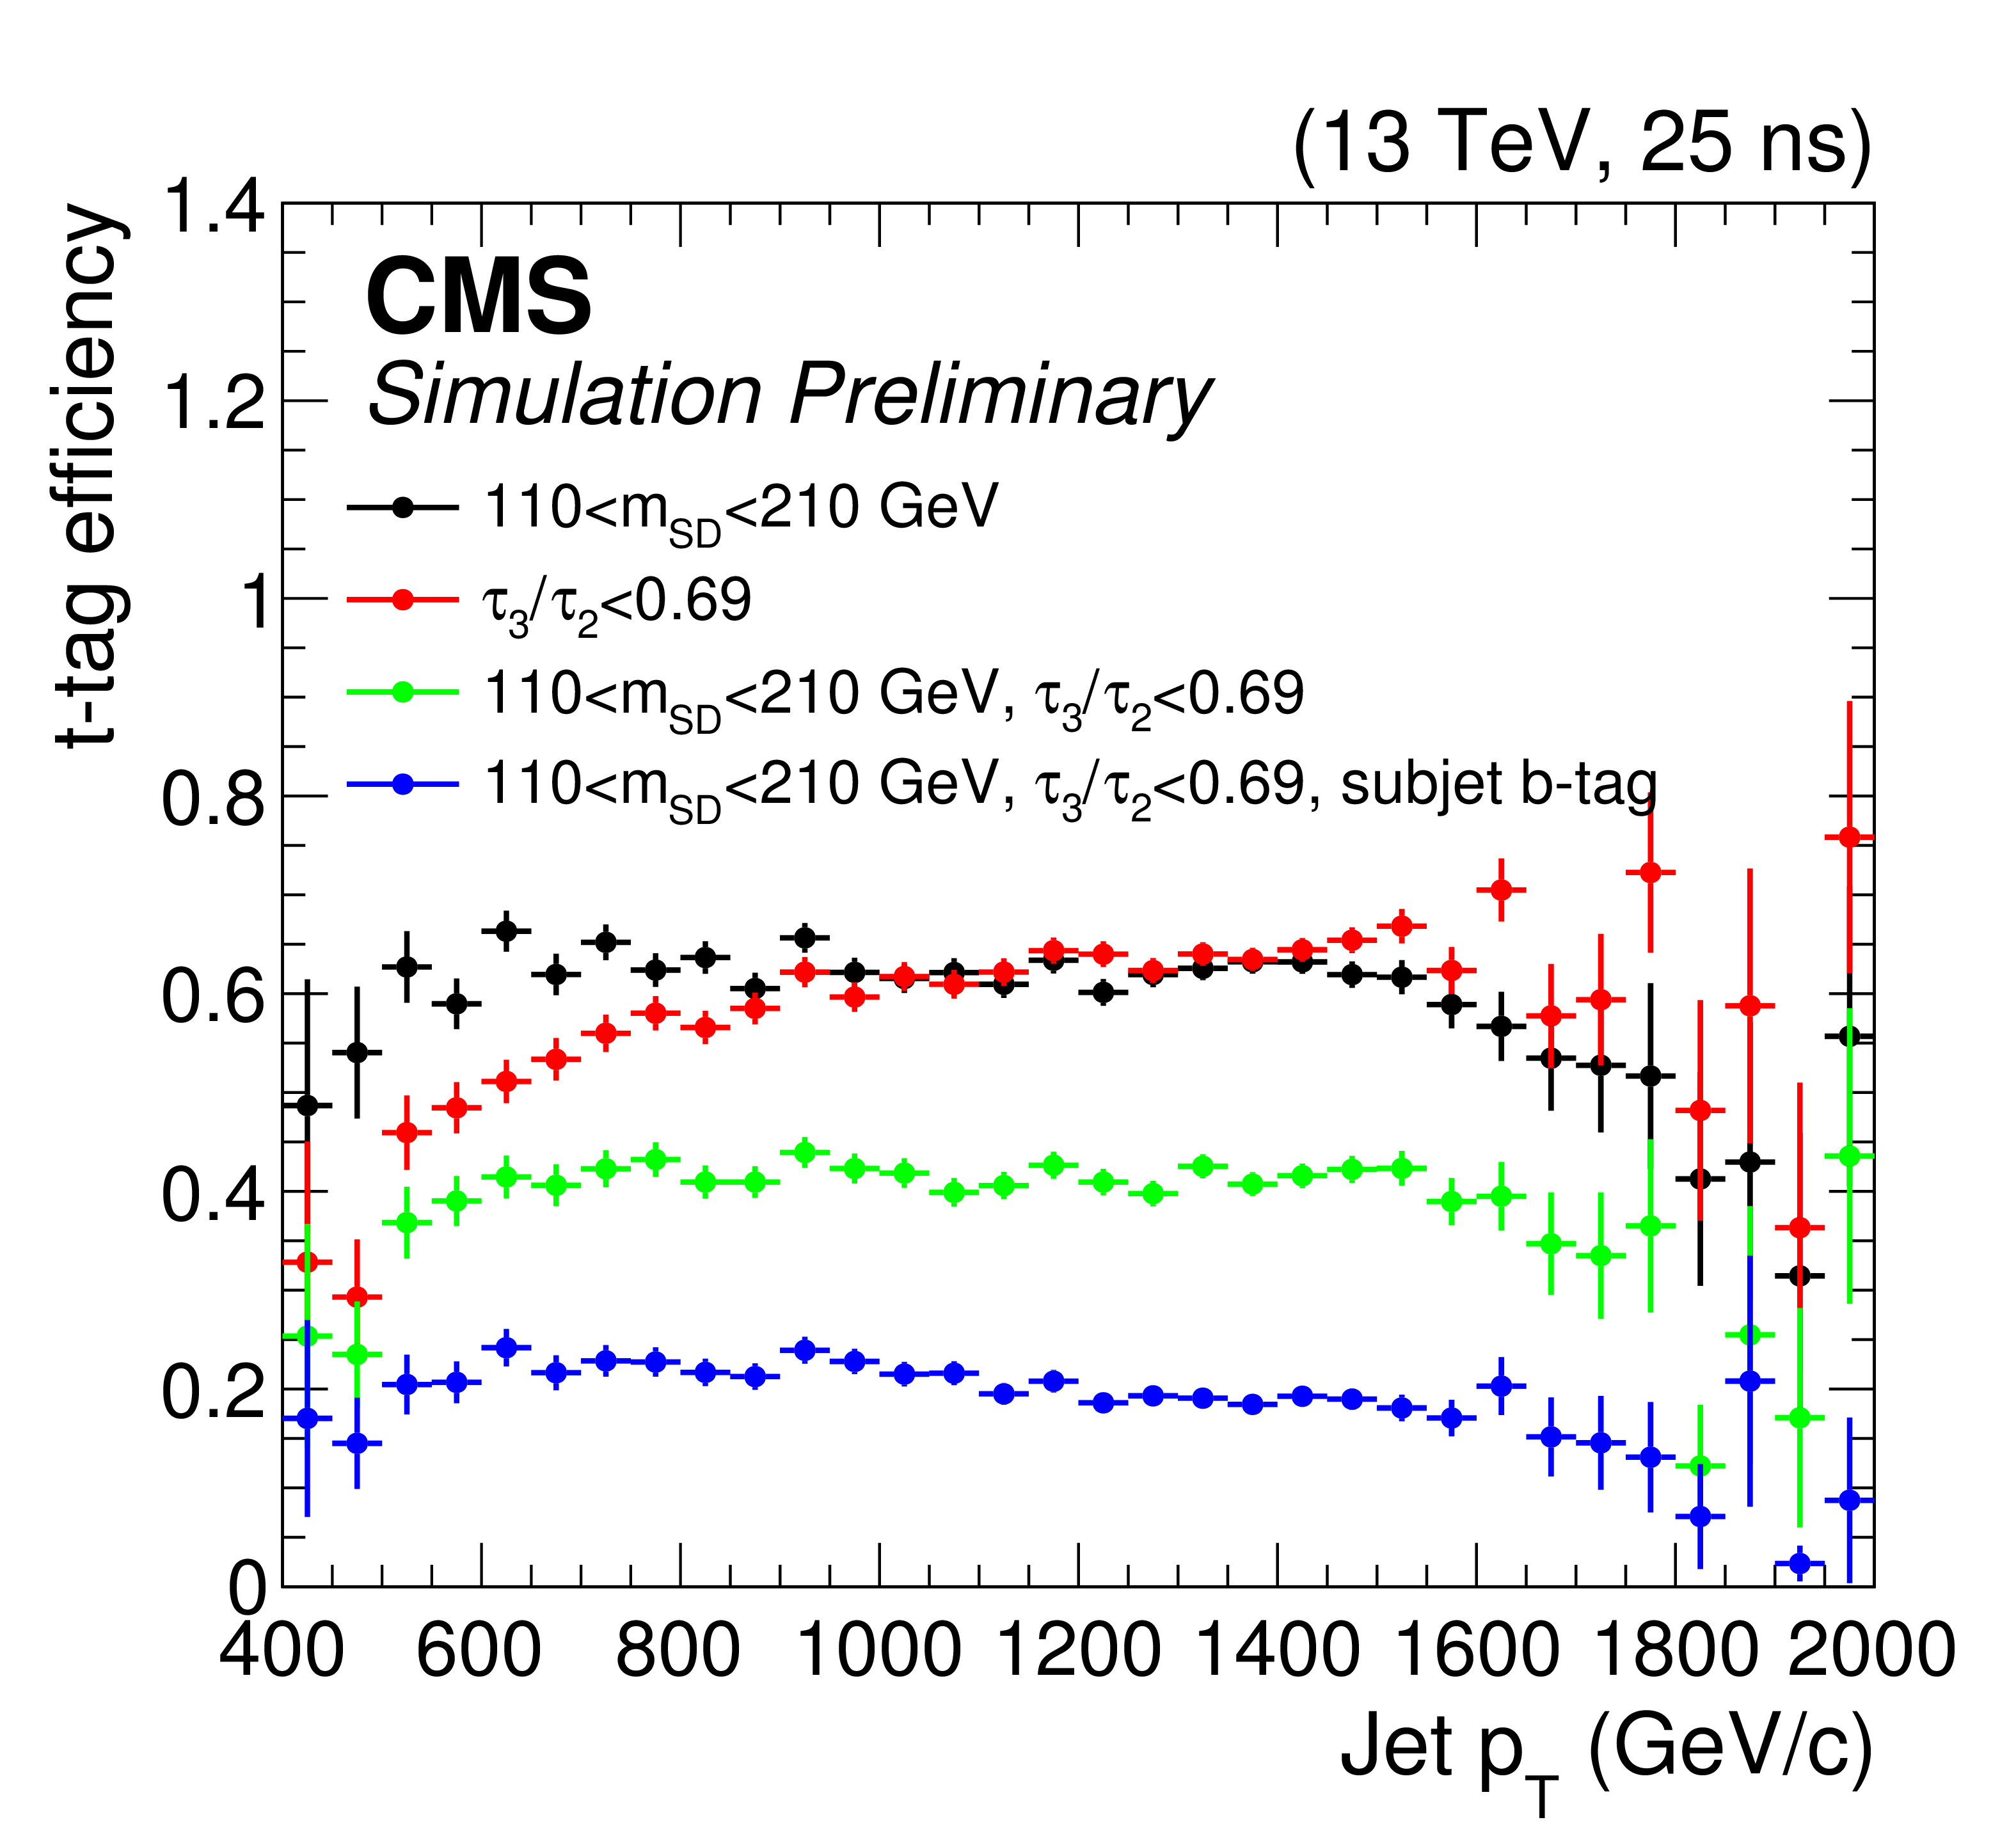
Figure 23:
Top tagging efficiency as measured in ${\mathrm{ t } {}\mathrm{ \bar{t} } } $ simulation. |
| Tables | |
png pdf |
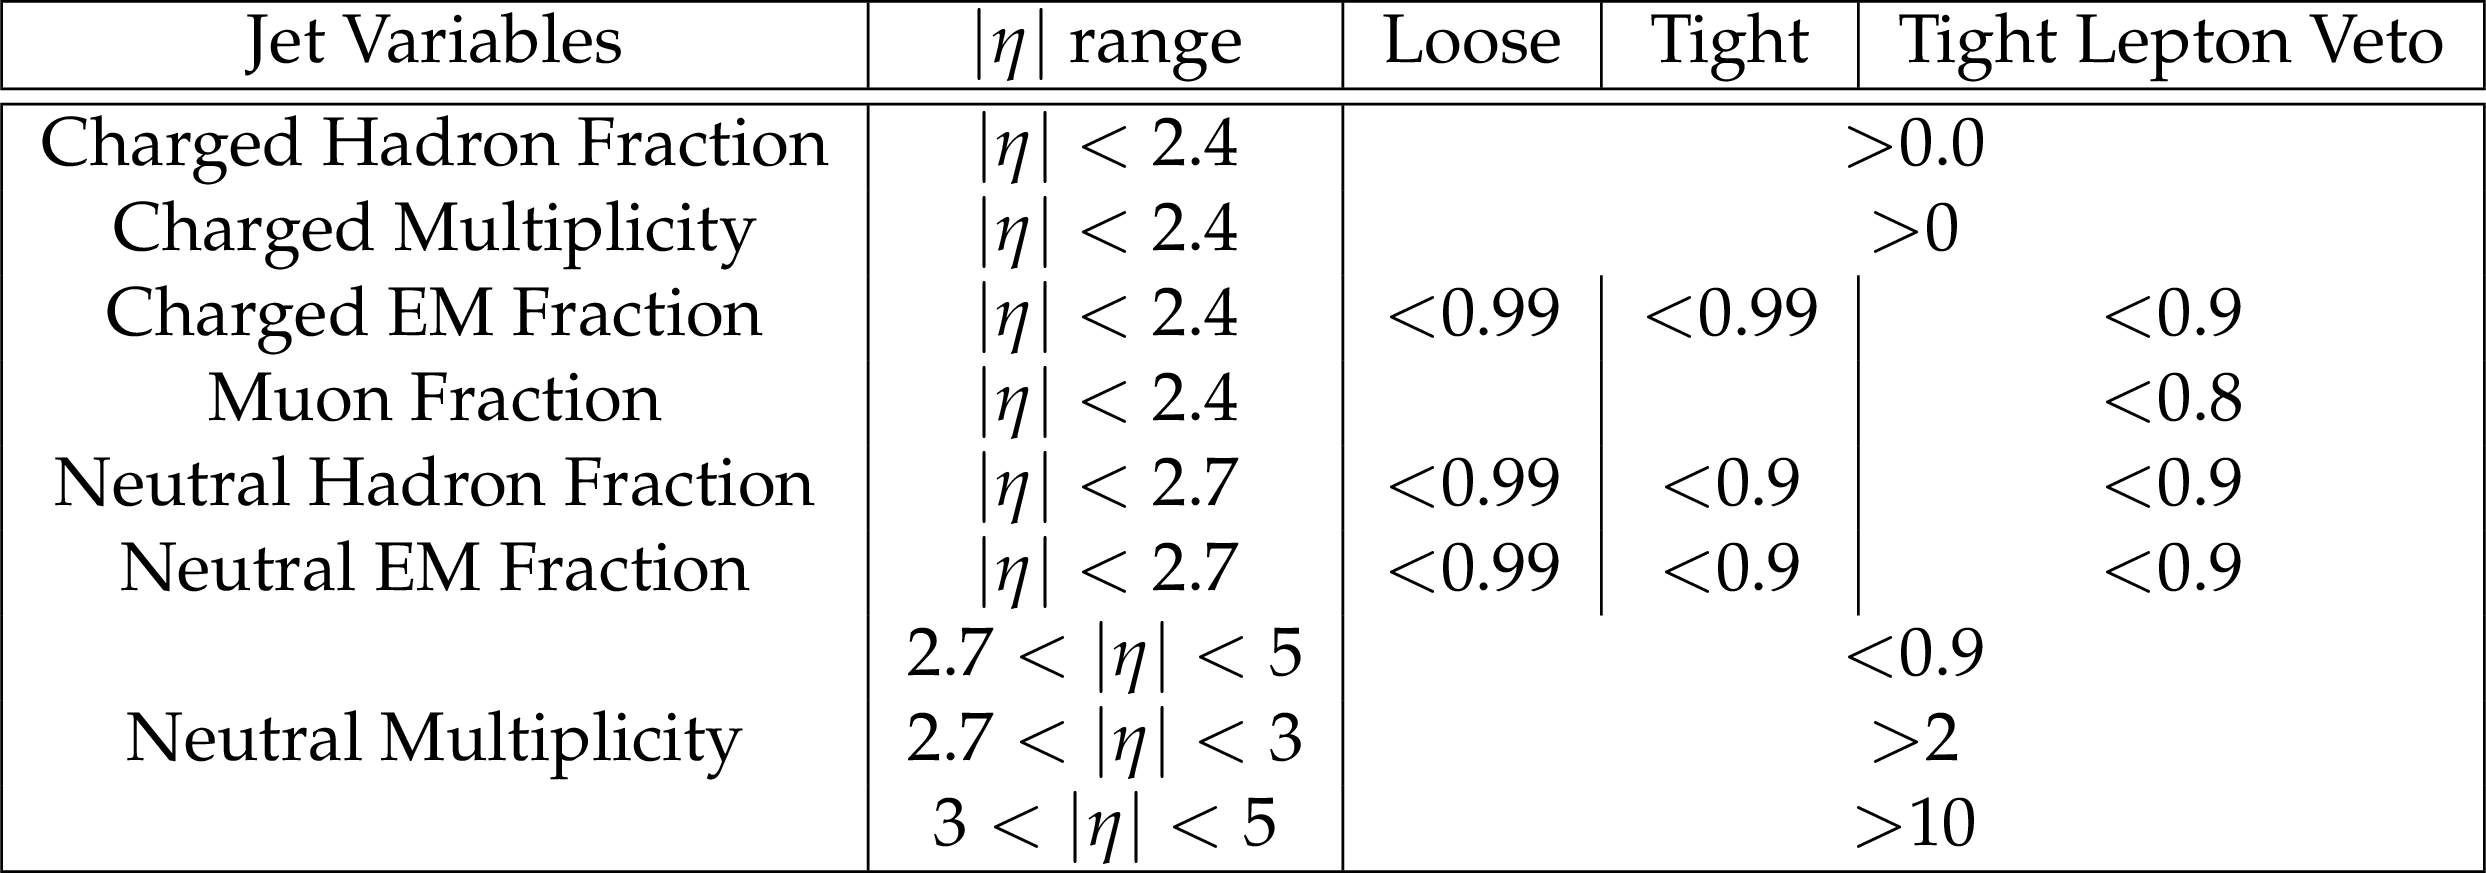
Table 1:
The PF jet ID criteria for the whole $\eta $ region from $-5$ up to $5$. |

png pdf |
Table 2:
Data-to-simulation scale factors for the W-tagging procedure, as extracted from a top enriched data sample and from simulation, for both categories (high purity and low purity) for two different working points. The systematic uncertainties on the scale factor due to the simulation of the $ {\mathrm{ t } {}\mathrm{ \bar{t} } } $ topology and the choice of the signal and background fit model are listed as well. |
png pdf |
Table 4:
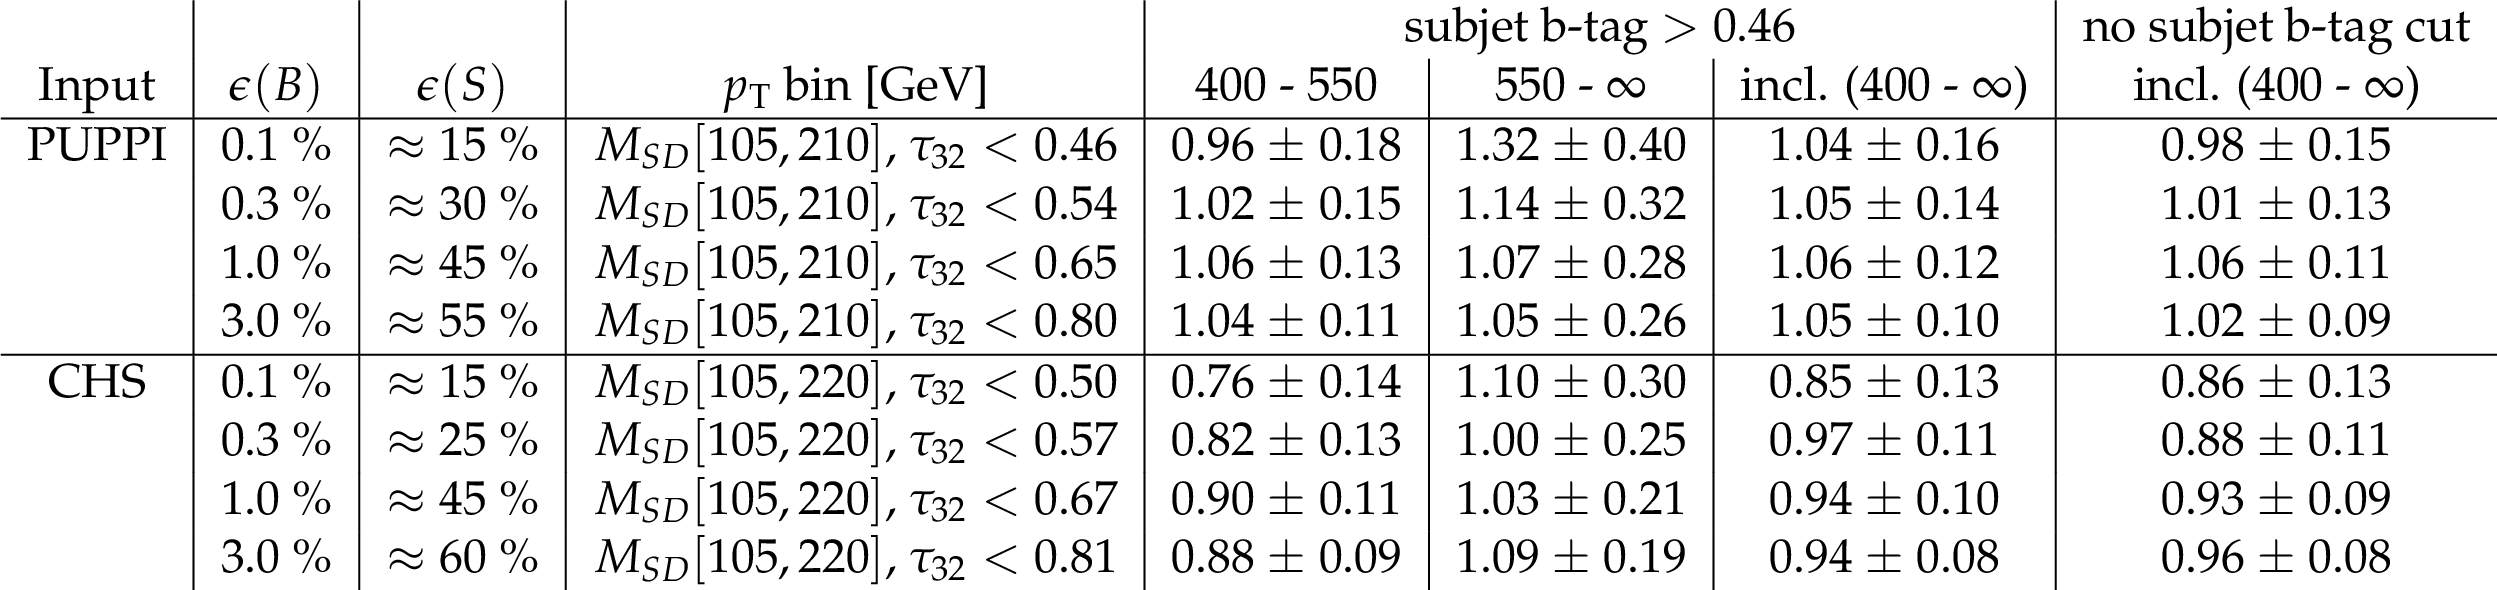
Result scale factors for the for softdrop high $ {p_{\mathrm {T}}} $ working points and different $ {p_{\mathrm {T}}} $ ranges. The reported uncertainties are statistical only. The scale factors are labelled by expected background mistag rate $\epsilon (B)$ and expected signal efficiency $\epsilon (S)$ on MC simulated events for the selection including the b-tag requirement. For comparison the inclusive scale factor is also presented without this cut. |

png pdf |
Table 5:
Result scale factors for the for HEPTo$ p_{\mathrm{T}} $aggerV2/CHS low $ {p_{\mathrm {T}}} $ working points and different $ {p_{\mathrm {T}}} $ ranges. The reported uncertainties are statistical only. The scale factors are labelled by expected background mistag rate $\epsilon (B)$ and expected signal efficiency $\epsilon (S)$ on MC simulated events for the selection including the b-tag requirement. For comparison the inclusive scale factor is also presented without this cut. |
| Summary |
| The performance of jet and jet substructure algorithms has been studied in data collected by the CMS experiment at the LHC with a center-of-mass energy of 13 TeV. The rejection rate of jet identification criteria against noise has been measured using a noise enriched minimum bias event selection, while the efficiency for identifying real physical jets has been meaured in data using a tag-and-probe procedure. The background rejection rejection rate has been measured to be greater than 99.999% in the barrel region and greater than 92% in the forward detector region. A multivariate BDT which uses vertex and jet shape information to discriminate pileup jets has been discussed, and its performance has been measured in data and in simulation. For central jets with $|\eta| < $ 2.5 and 30 $ < p_{\mathrm{T}} < $ 50 GeV, the pileup jet identification BDT rejects 89% of pileup jets while maintaining 96% of gluon jets. A likelihood-based tagger which relies on the internal structure of jets to discriminate jets initiated by light-quark partons from those initiated by gluons has been studied. A recipe to evaluate the systematic uncertainties associated to the use of the quark/gluon discriminator has been given, based on the observed data versus MC differences in the validation samples. The efficiency and mistag rate of W tagging and top tagging algorithms has been discussed, and scale factors have been measured. A new W tagger based on DDT corrected N-subjettiness has been studied and found to yield a mistag rate that is independent of $p_{\mathrm{T}}$. W tagging and top tagging techniques relying on PUPPI pileup suppression have been validated in data for the first time and were found to maintain W and top tagging performance up to at least 40 simultaneous interactions. |
| Additional Figures | |
png pdf |
Additional Figure 1:
$< \Delta R^2 > $ (left) central (right) forward. |

png pdf |
Additional Figure 1-a:
$< \Delta R^2 > $ central. |

png pdf |
Additional Figure 1-b:
$< \Delta R^2 > $ forward. |

png pdf |
Additional Figure 2:
Major axis (left) central (right) forward. |

png pdf |
Additional Figure 2-a:
Major axis central. |

png pdf |
Additional Figure 2-b:
Major axis forward. |
png pdf |
Additional Figure 3:
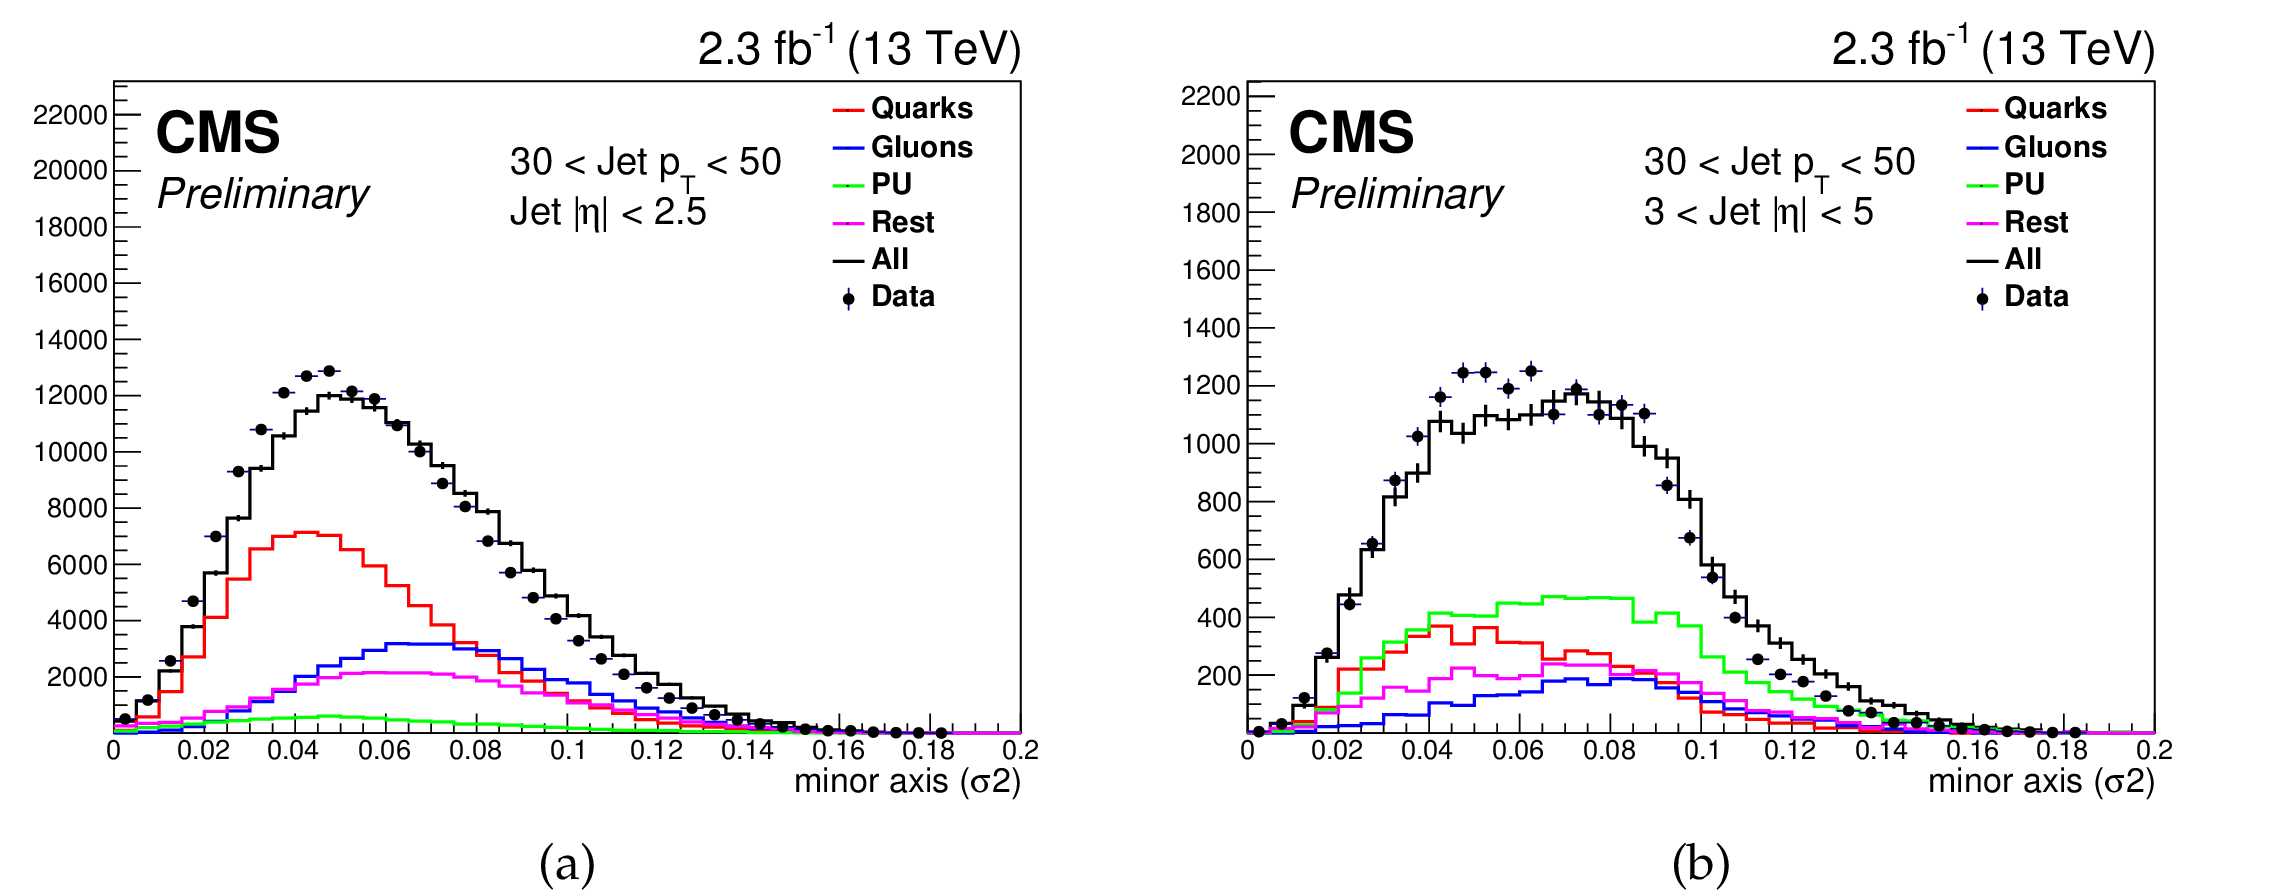
Minor axis (left) central (right) forward. |

png pdf |
Additional Figure 3-a:
Minor axis central. |

png pdf |
Additional Figure 3-b:
Minor axis forward. |
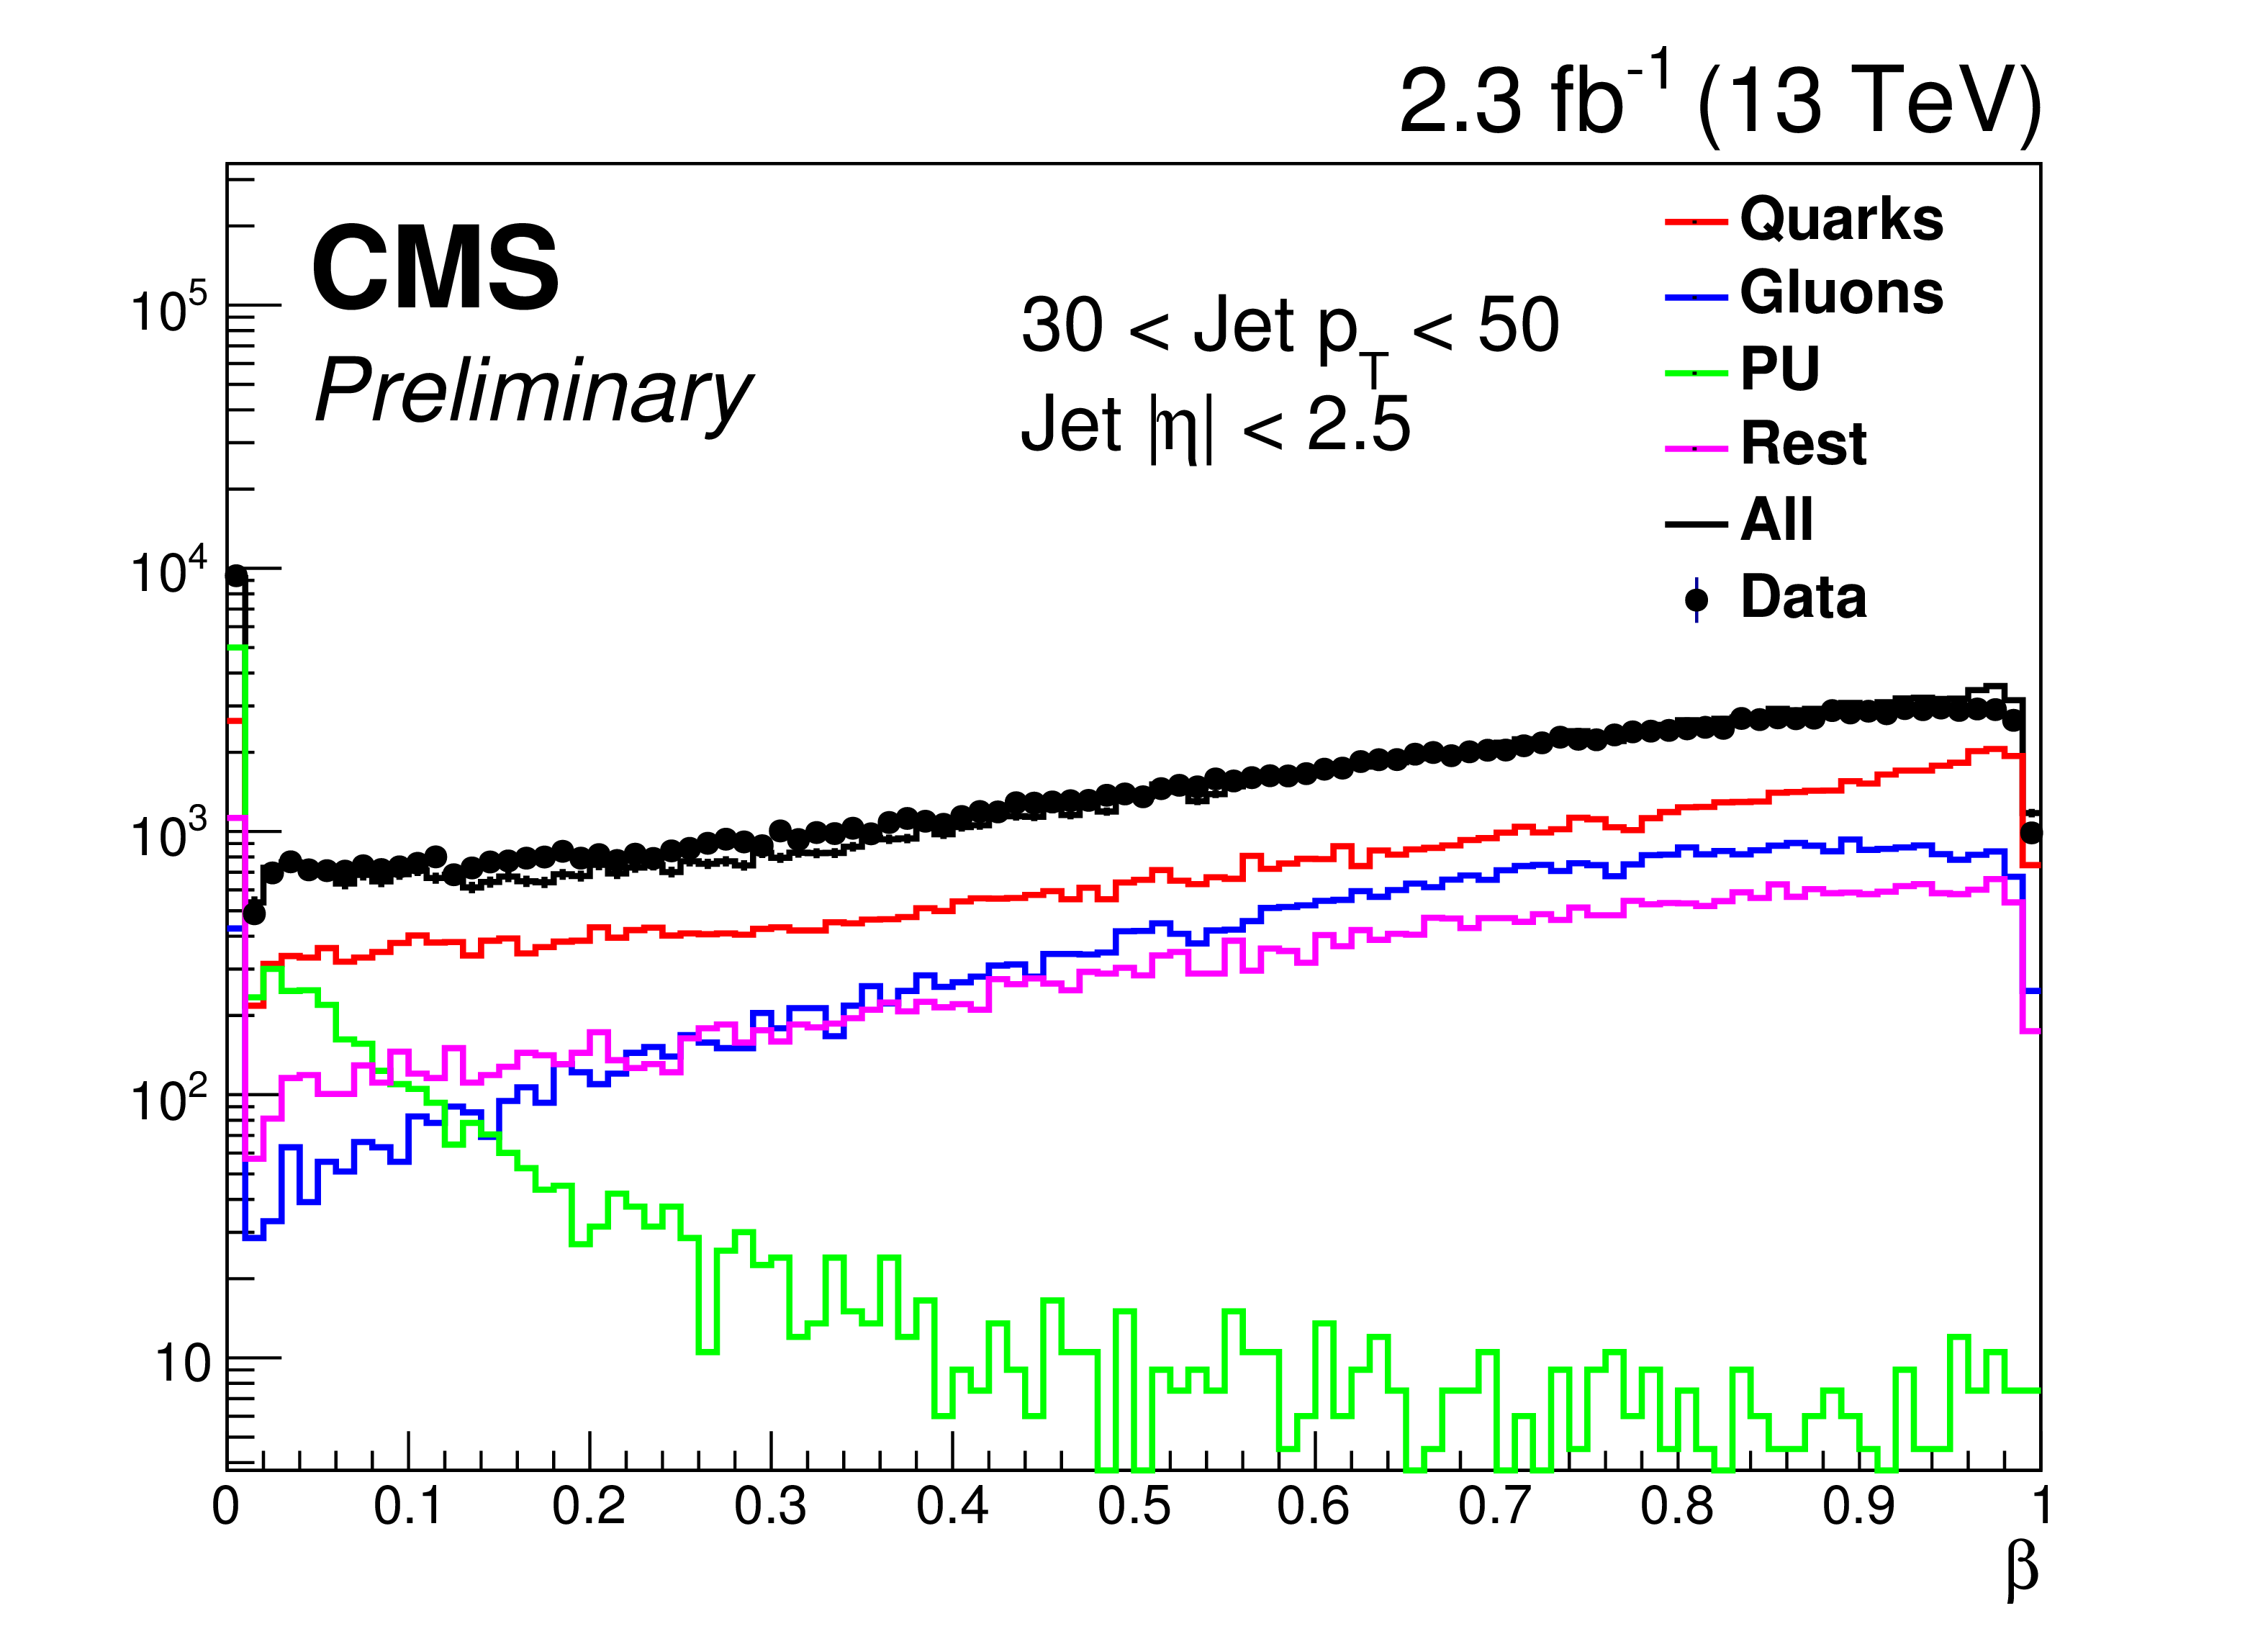
png pdf |
Additional Figure 4:
$\beta $ central. |
png pdf |
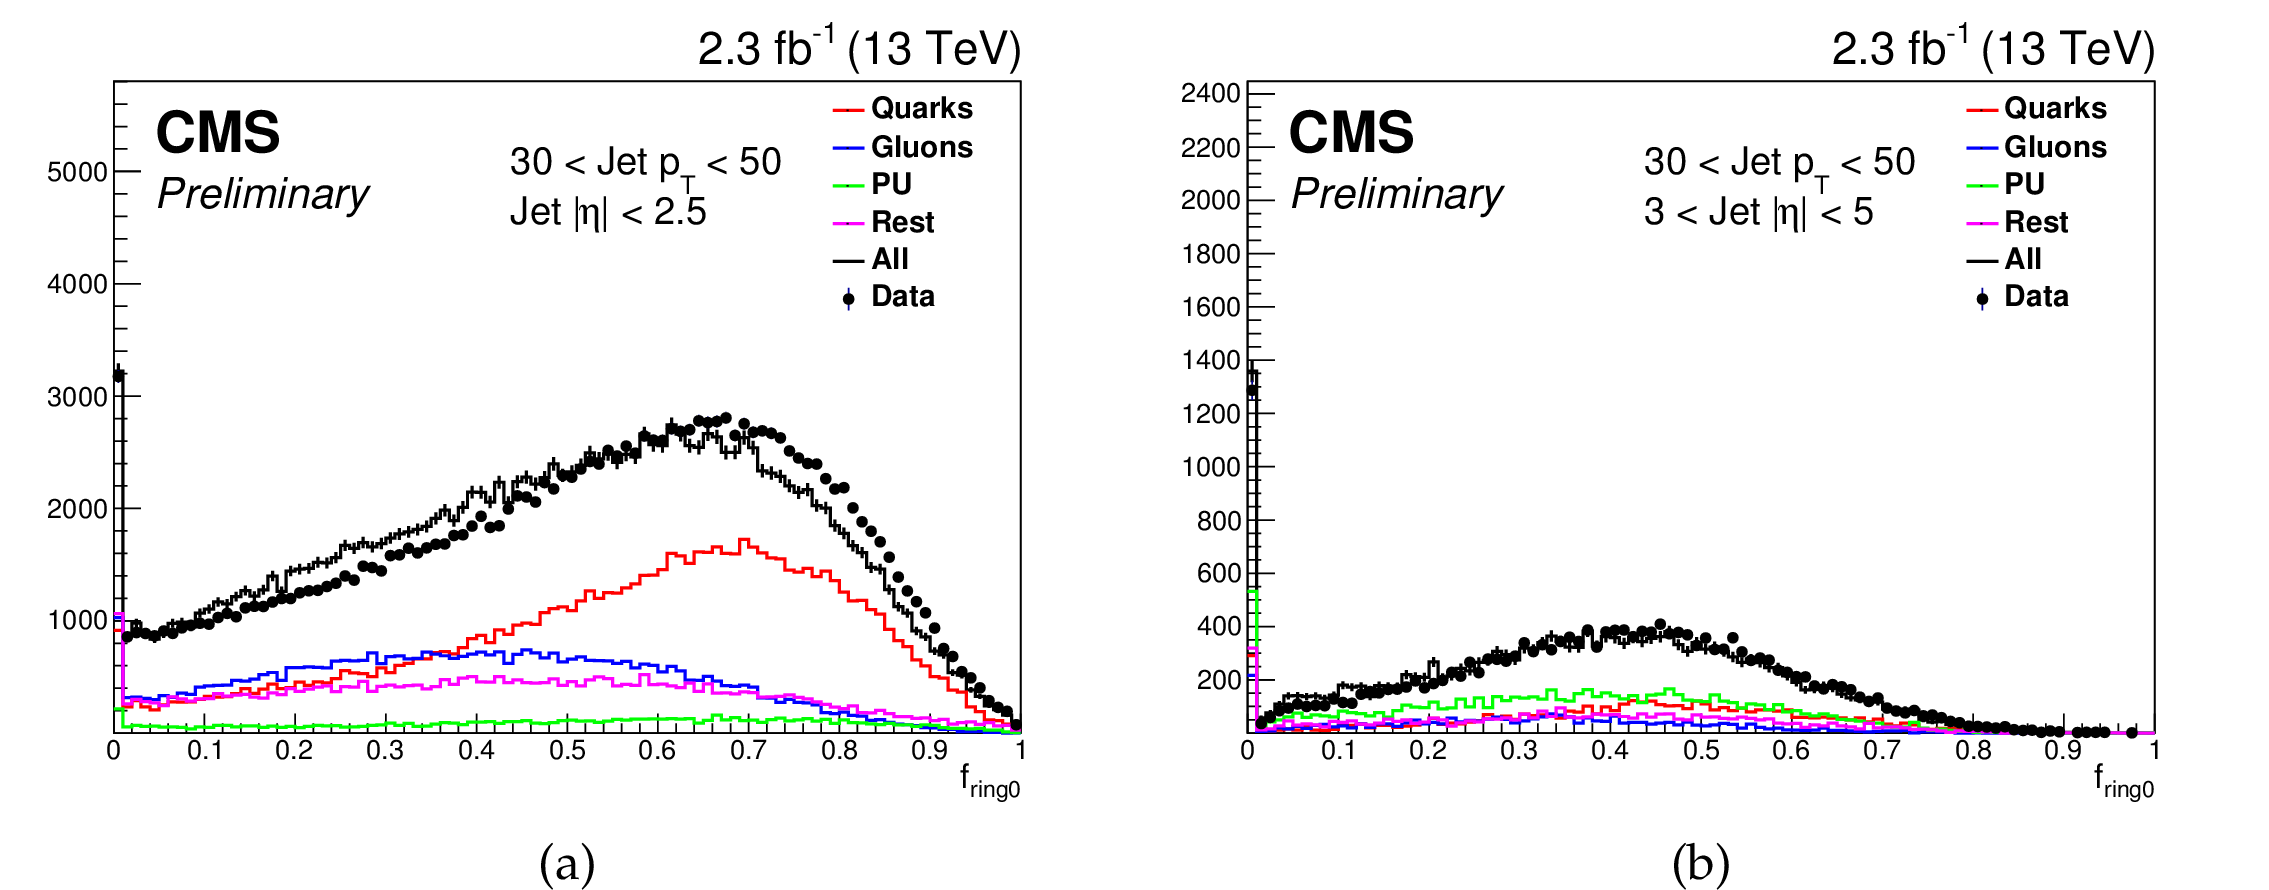
Additional Figure 5:
$f_{ring0}$ (left) central (right) forward. |

png pdf |
Additional Figure 5-a:
$f_{ring0}$ central. |
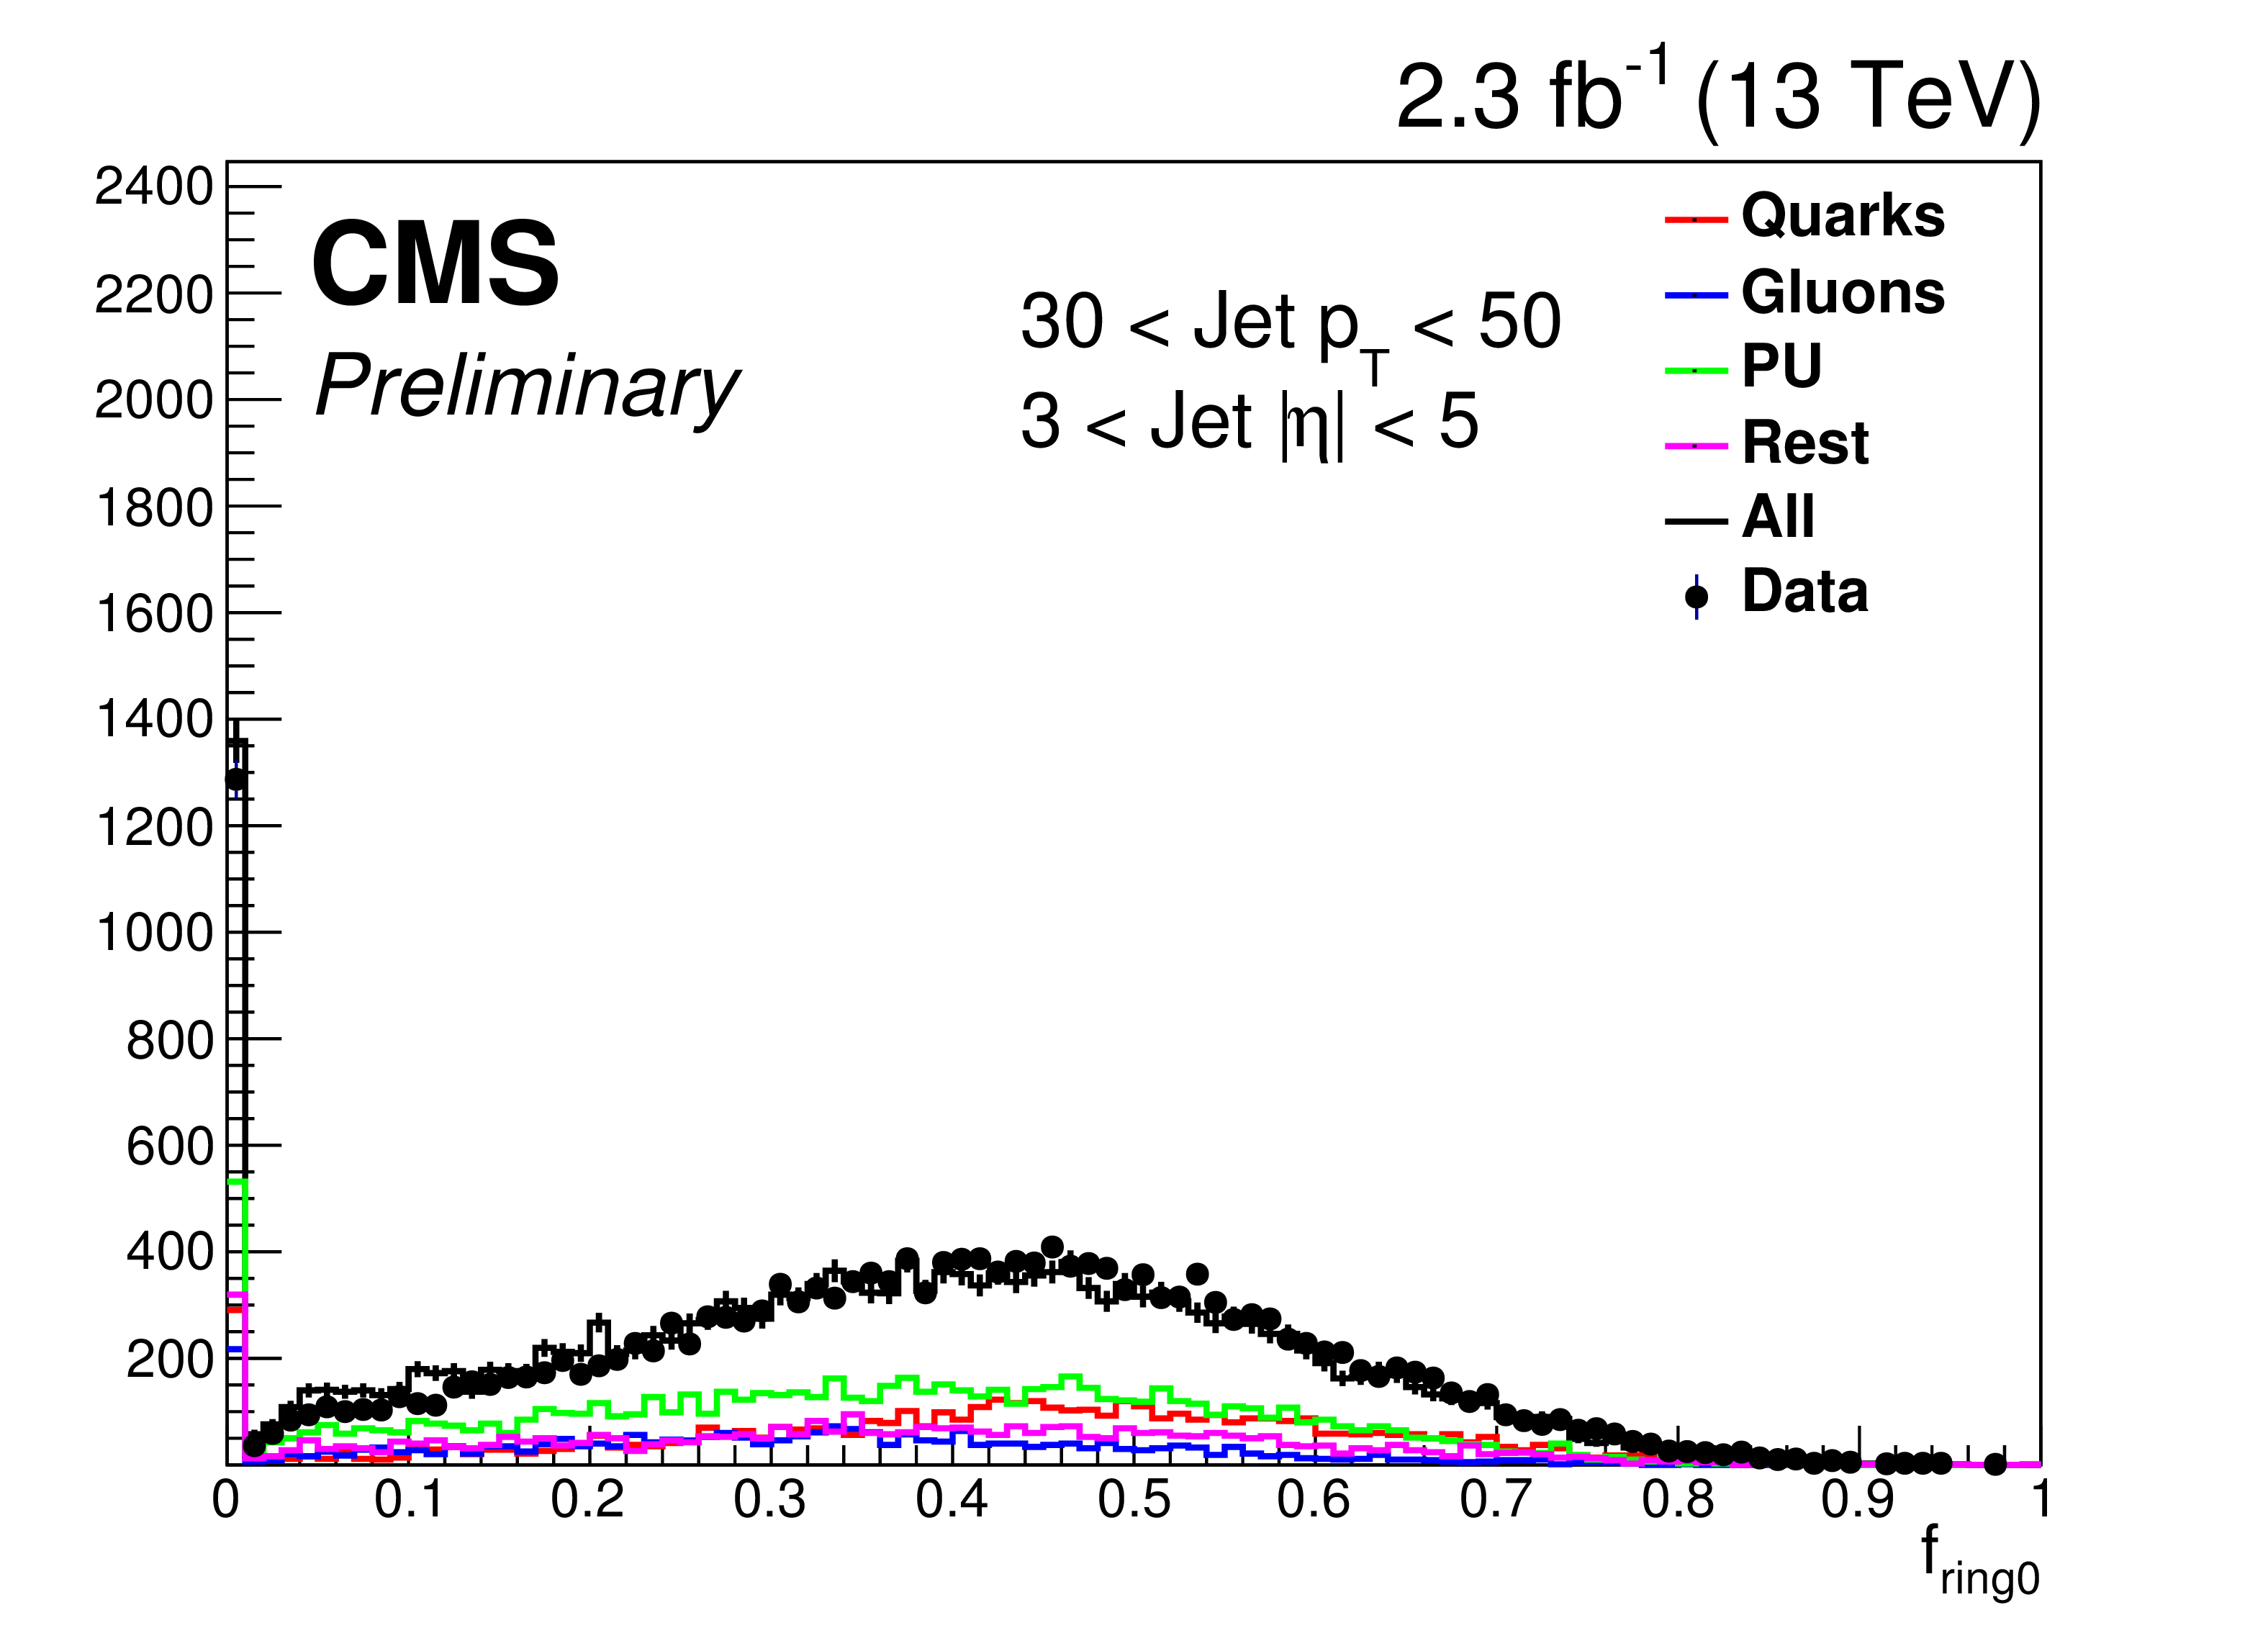
png pdf |
Additional Figure 5-b:
$f_{ring0}$ forward. |
png pdf |
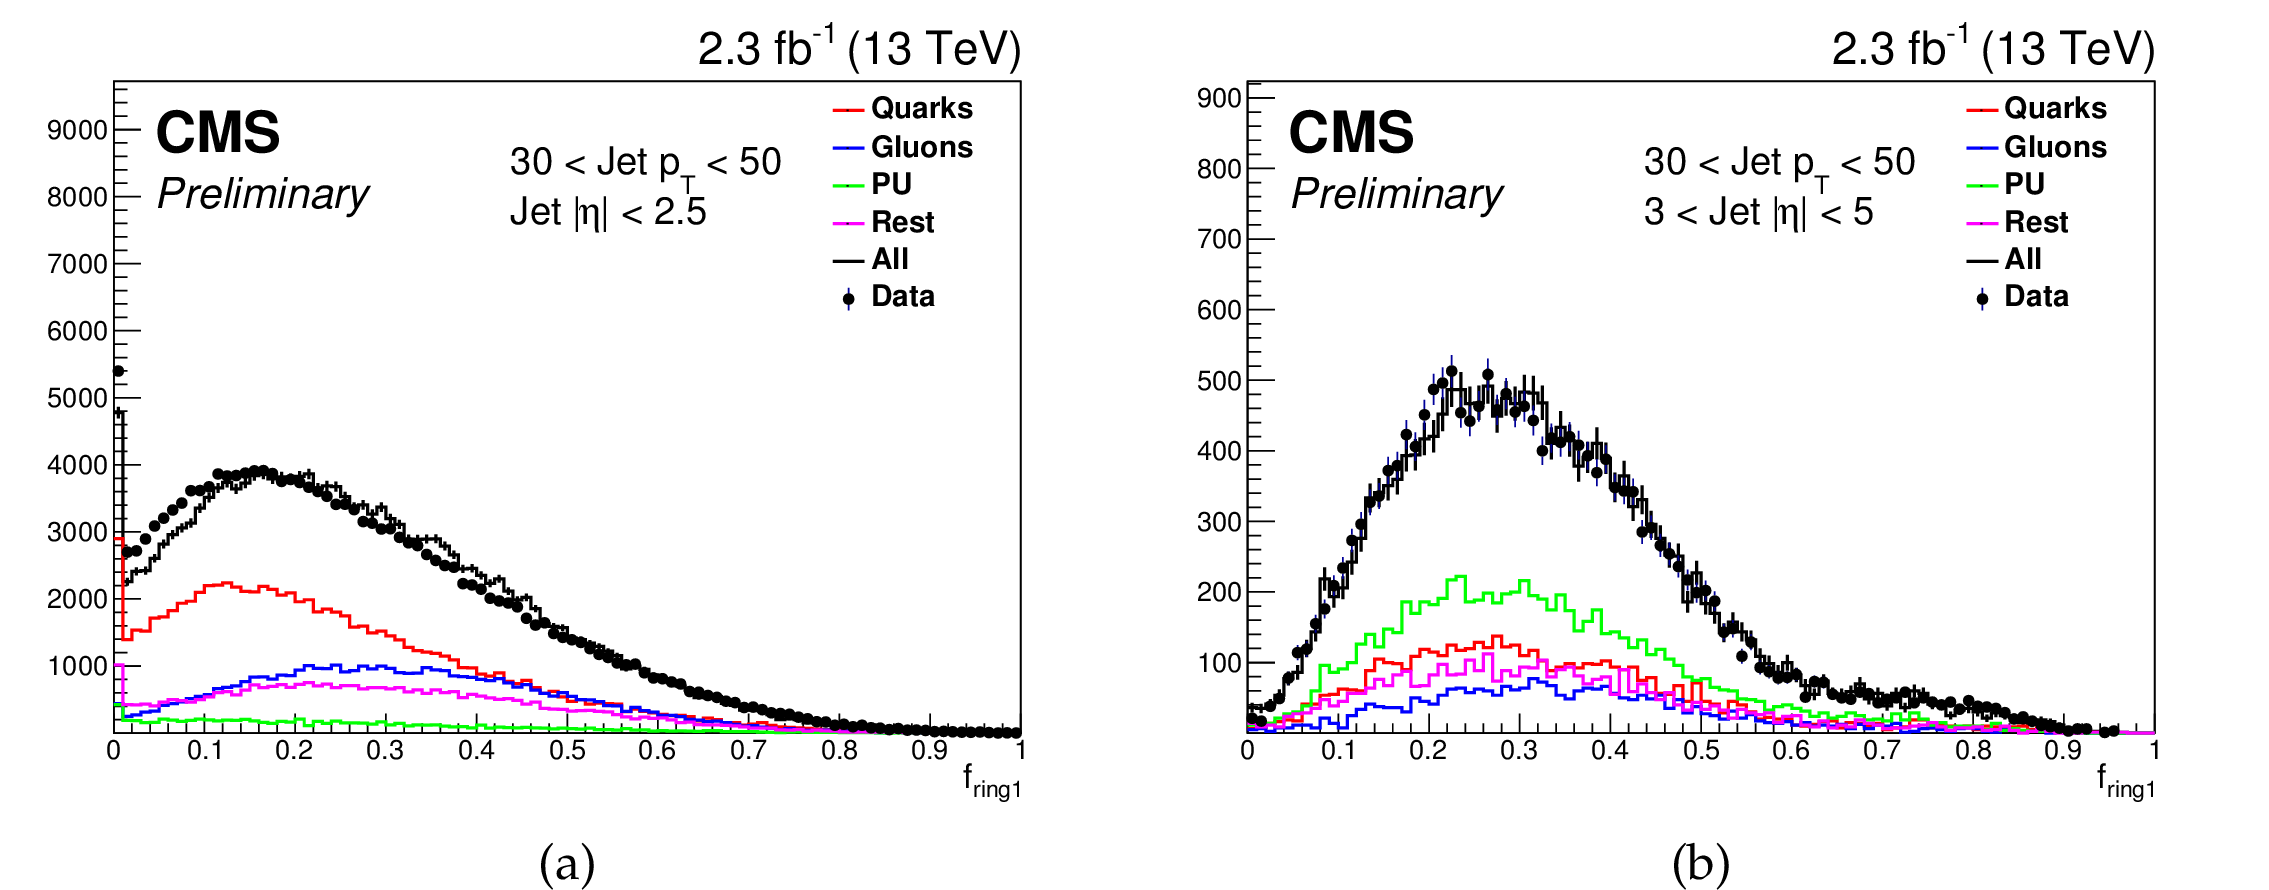
Additional Figure 6:
$f_{ring1}$ (left) central (right) forward. |

png pdf |
Additional Figure 6-a:
$f_{ring1}$ central. |

png pdf |
Additional Figure 6-b:
$f_{ring1}$ forward. |
png pdf |
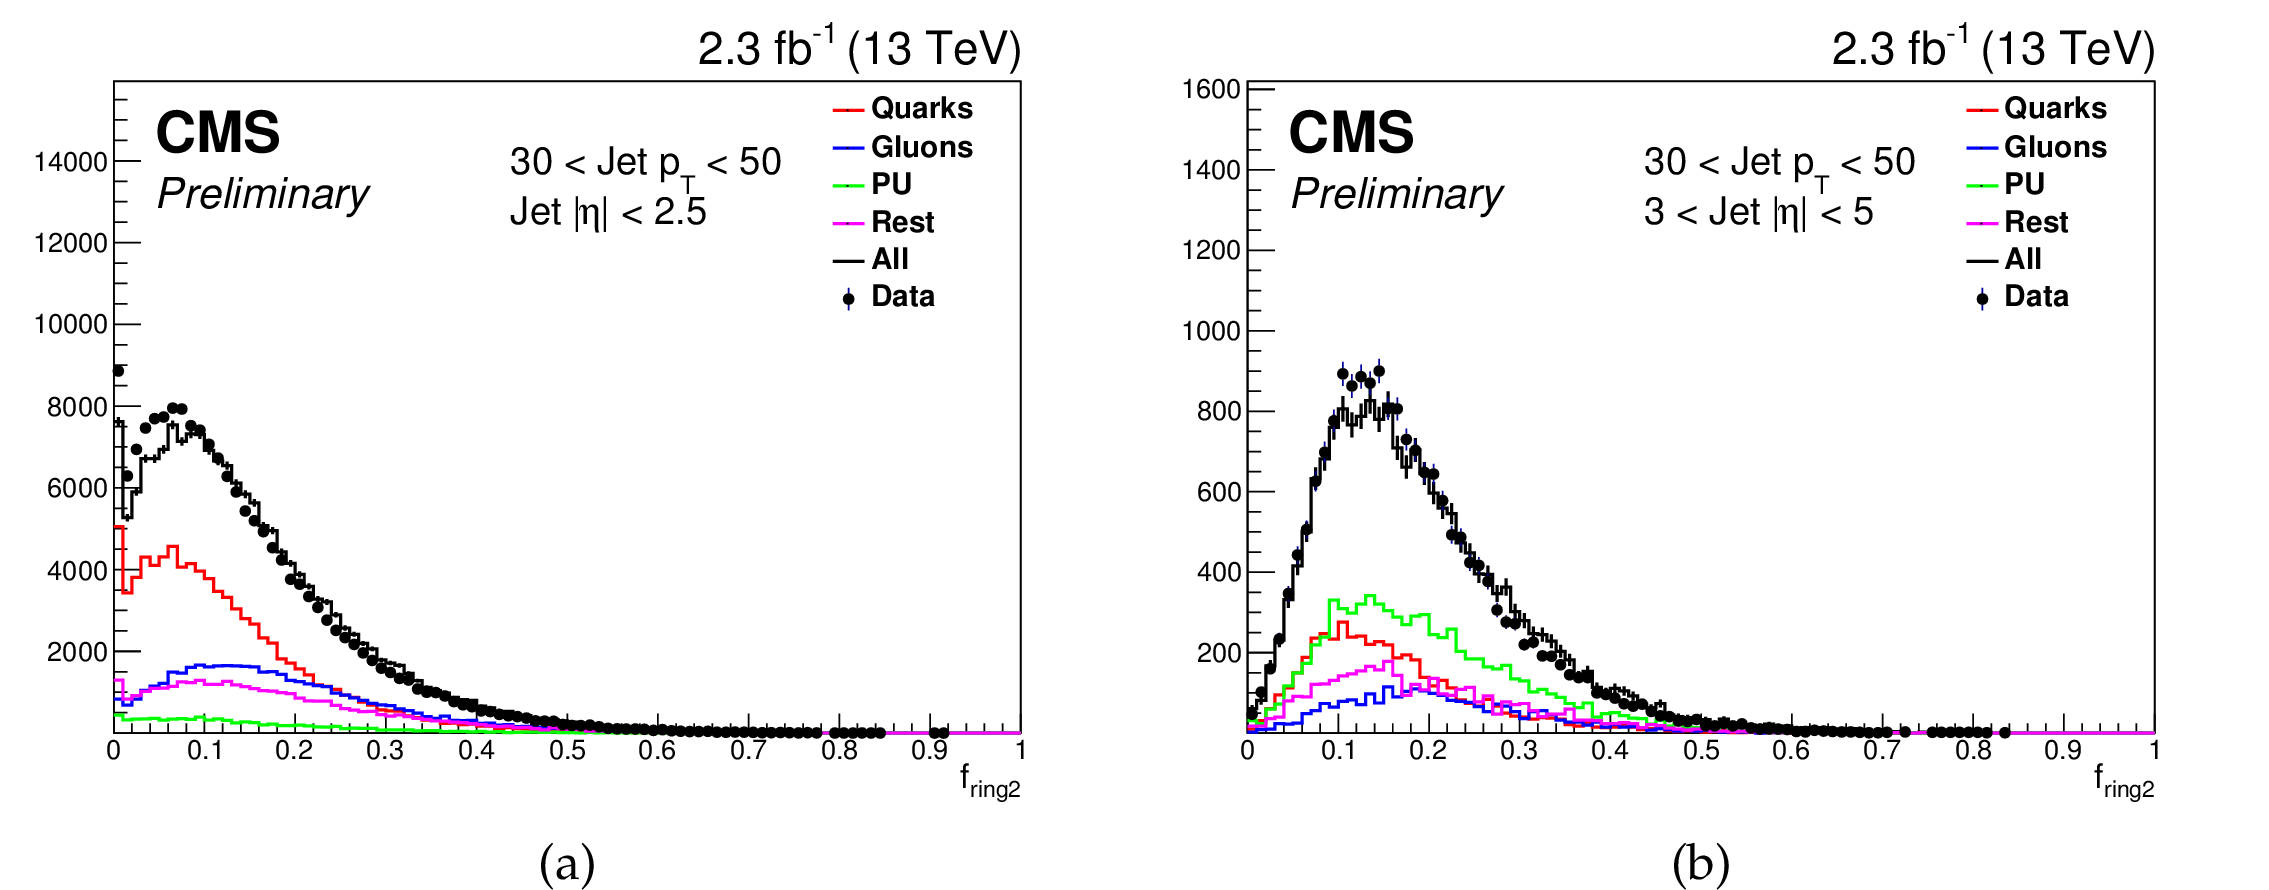
Additional Figure 7:
$f_{ring2}$ (left) central (right) forward. |

png pdf |
Additional Figure 7-a:
$f_{ring2}$ central. |

png pdf |
Additional Figure 7-b:
$f_{ring2}$ forward. |

png pdf |
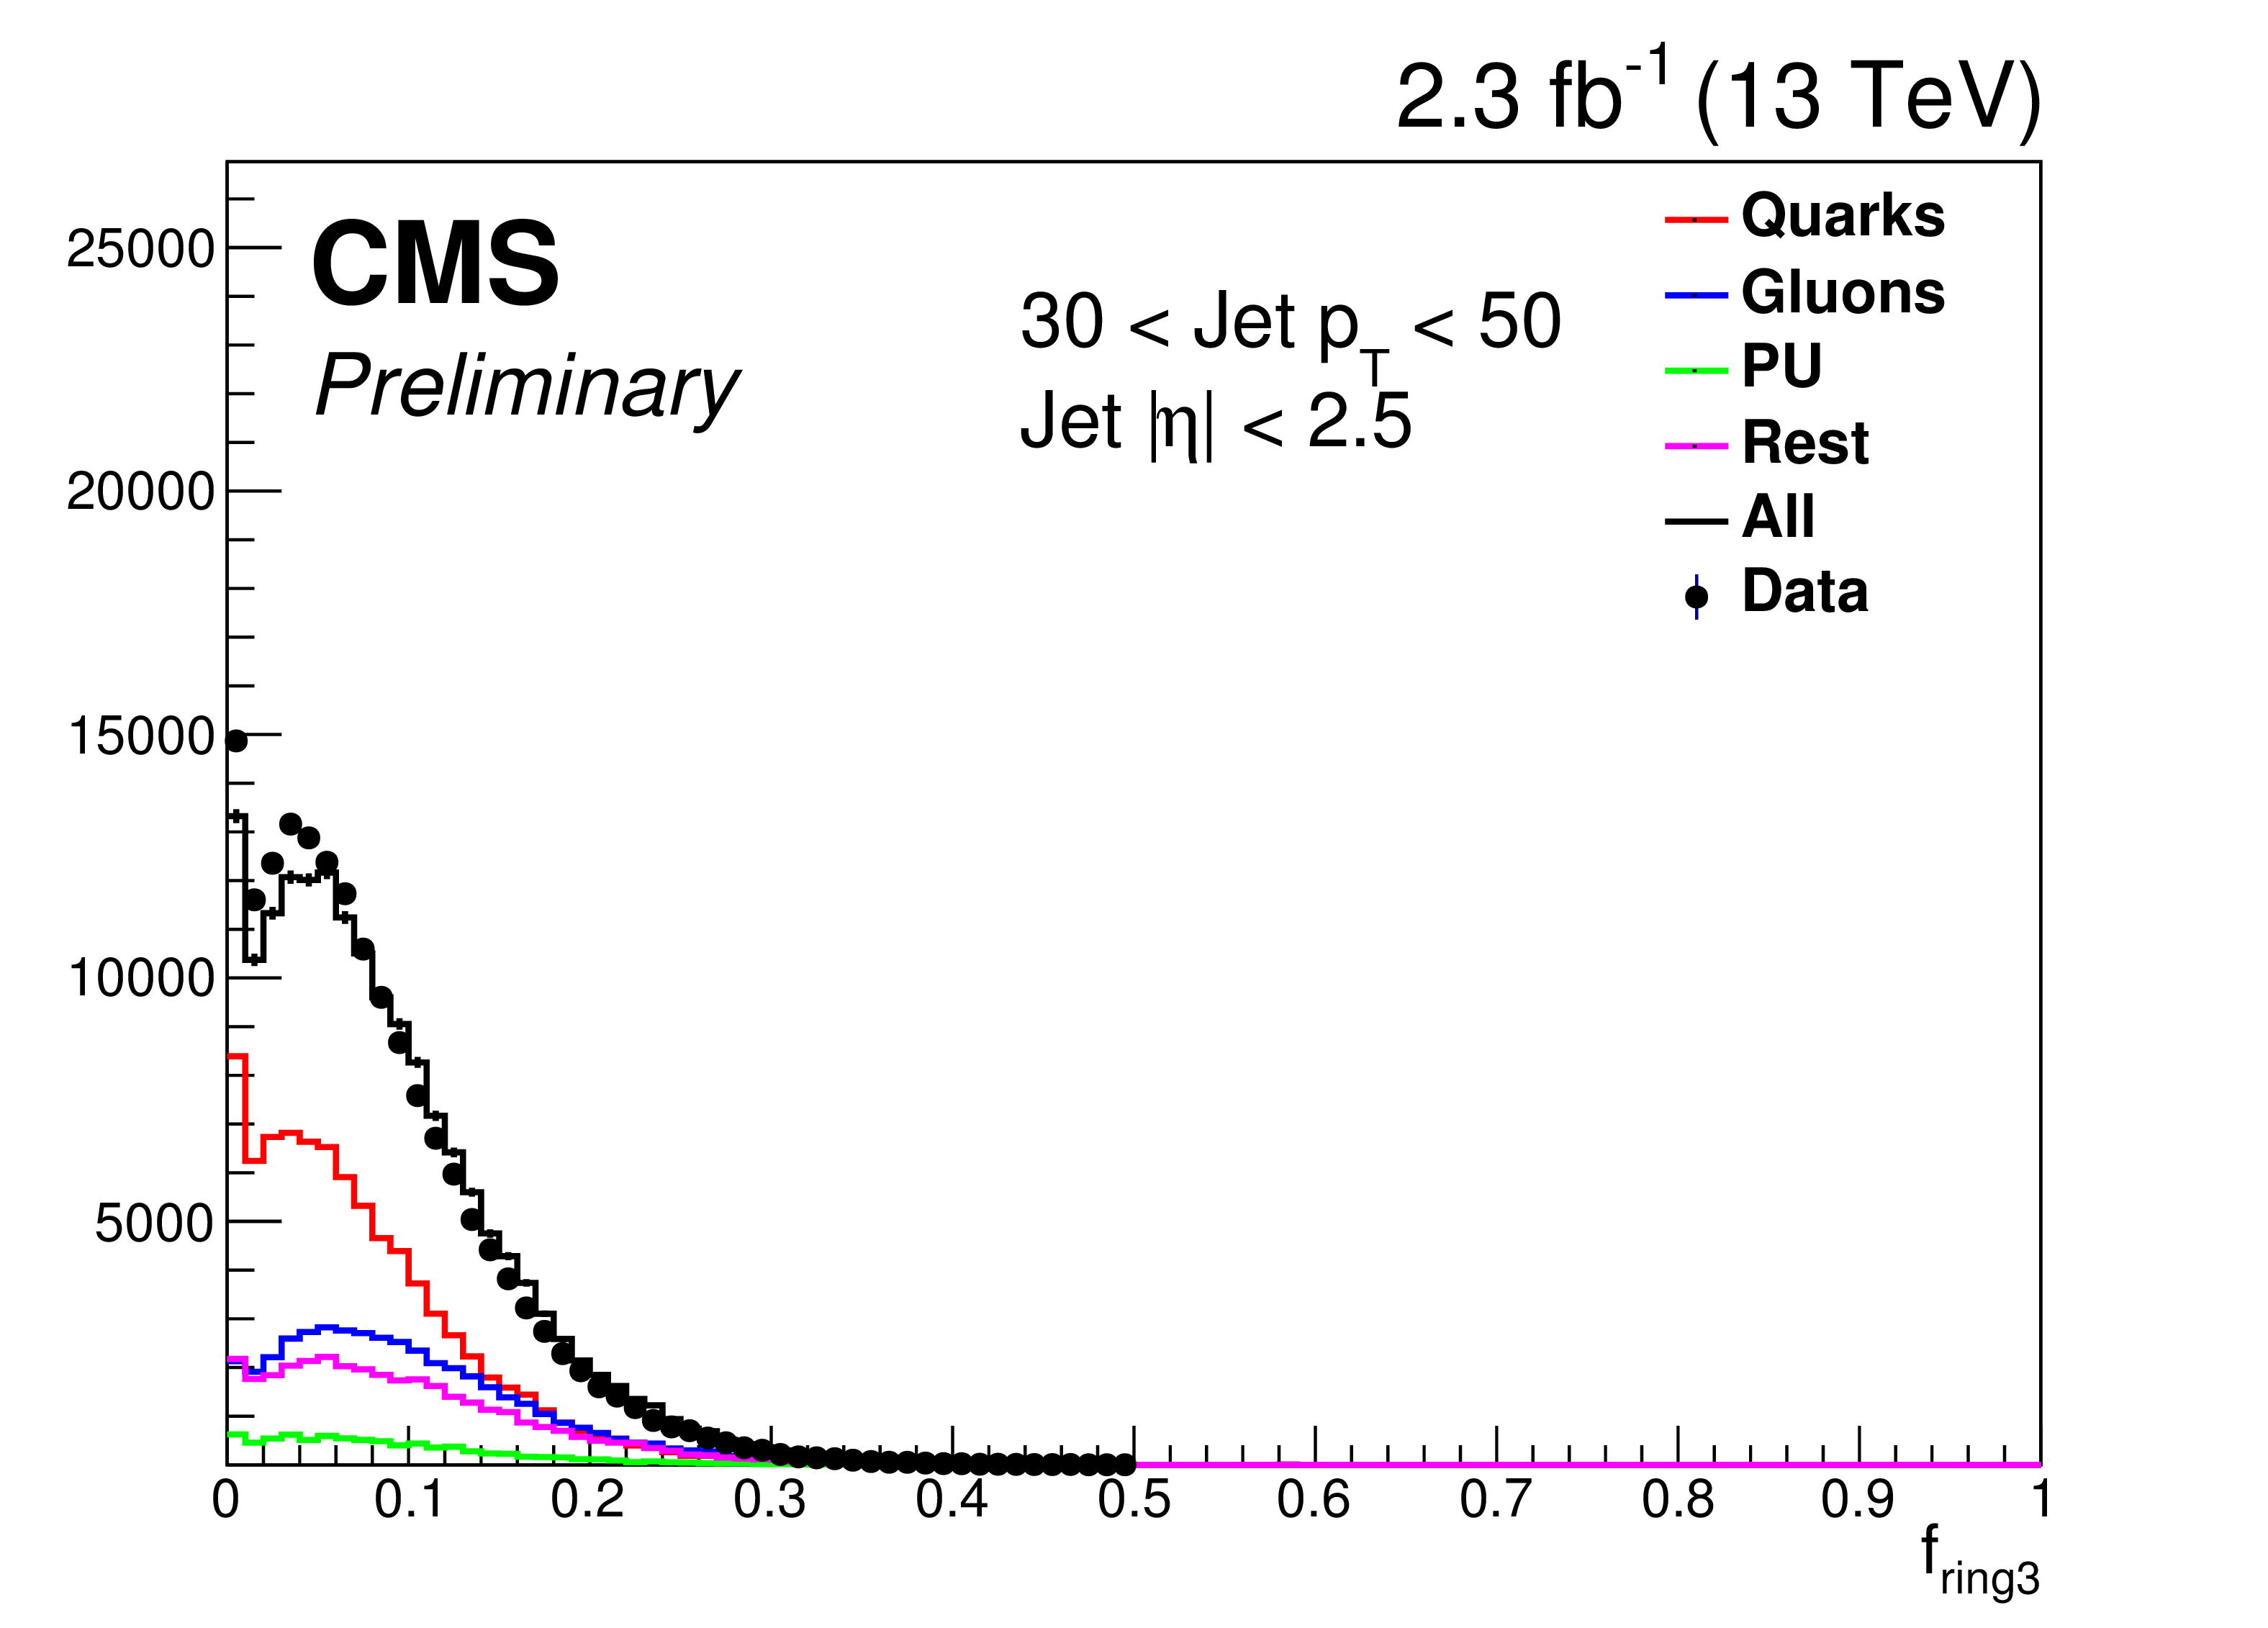
Additional Figure 8:
$f_{ring3}$ (left) central (right) forward. |
png pdf |
Additional Figure 8-a:
$f_{ring3}$ central. |

png pdf |
Additional Figure 8-b:
$f_{ring3}$ forward. |

png pdf |
Additional Figure 9:
Leading jet constituent $ p_{\mathrm{T}} $ fraction (left) central (right) forward. |

png pdf |
Additional Figure 9-a:
Leading jet constituent $ p_{\mathrm{T}} $ fraction central. |

png pdf |
Additional Figure 9-b:
Leading jet constituent $ p_{\mathrm{T}} $ fraction forward. |

png pdf |
Additional Figure 10:
Leading jet charged constituent $ p_{\mathrm{T}} $ fraction central. |

png pdf |
Additional Figure 11:
Charged multiplicity central. |

png pdf |
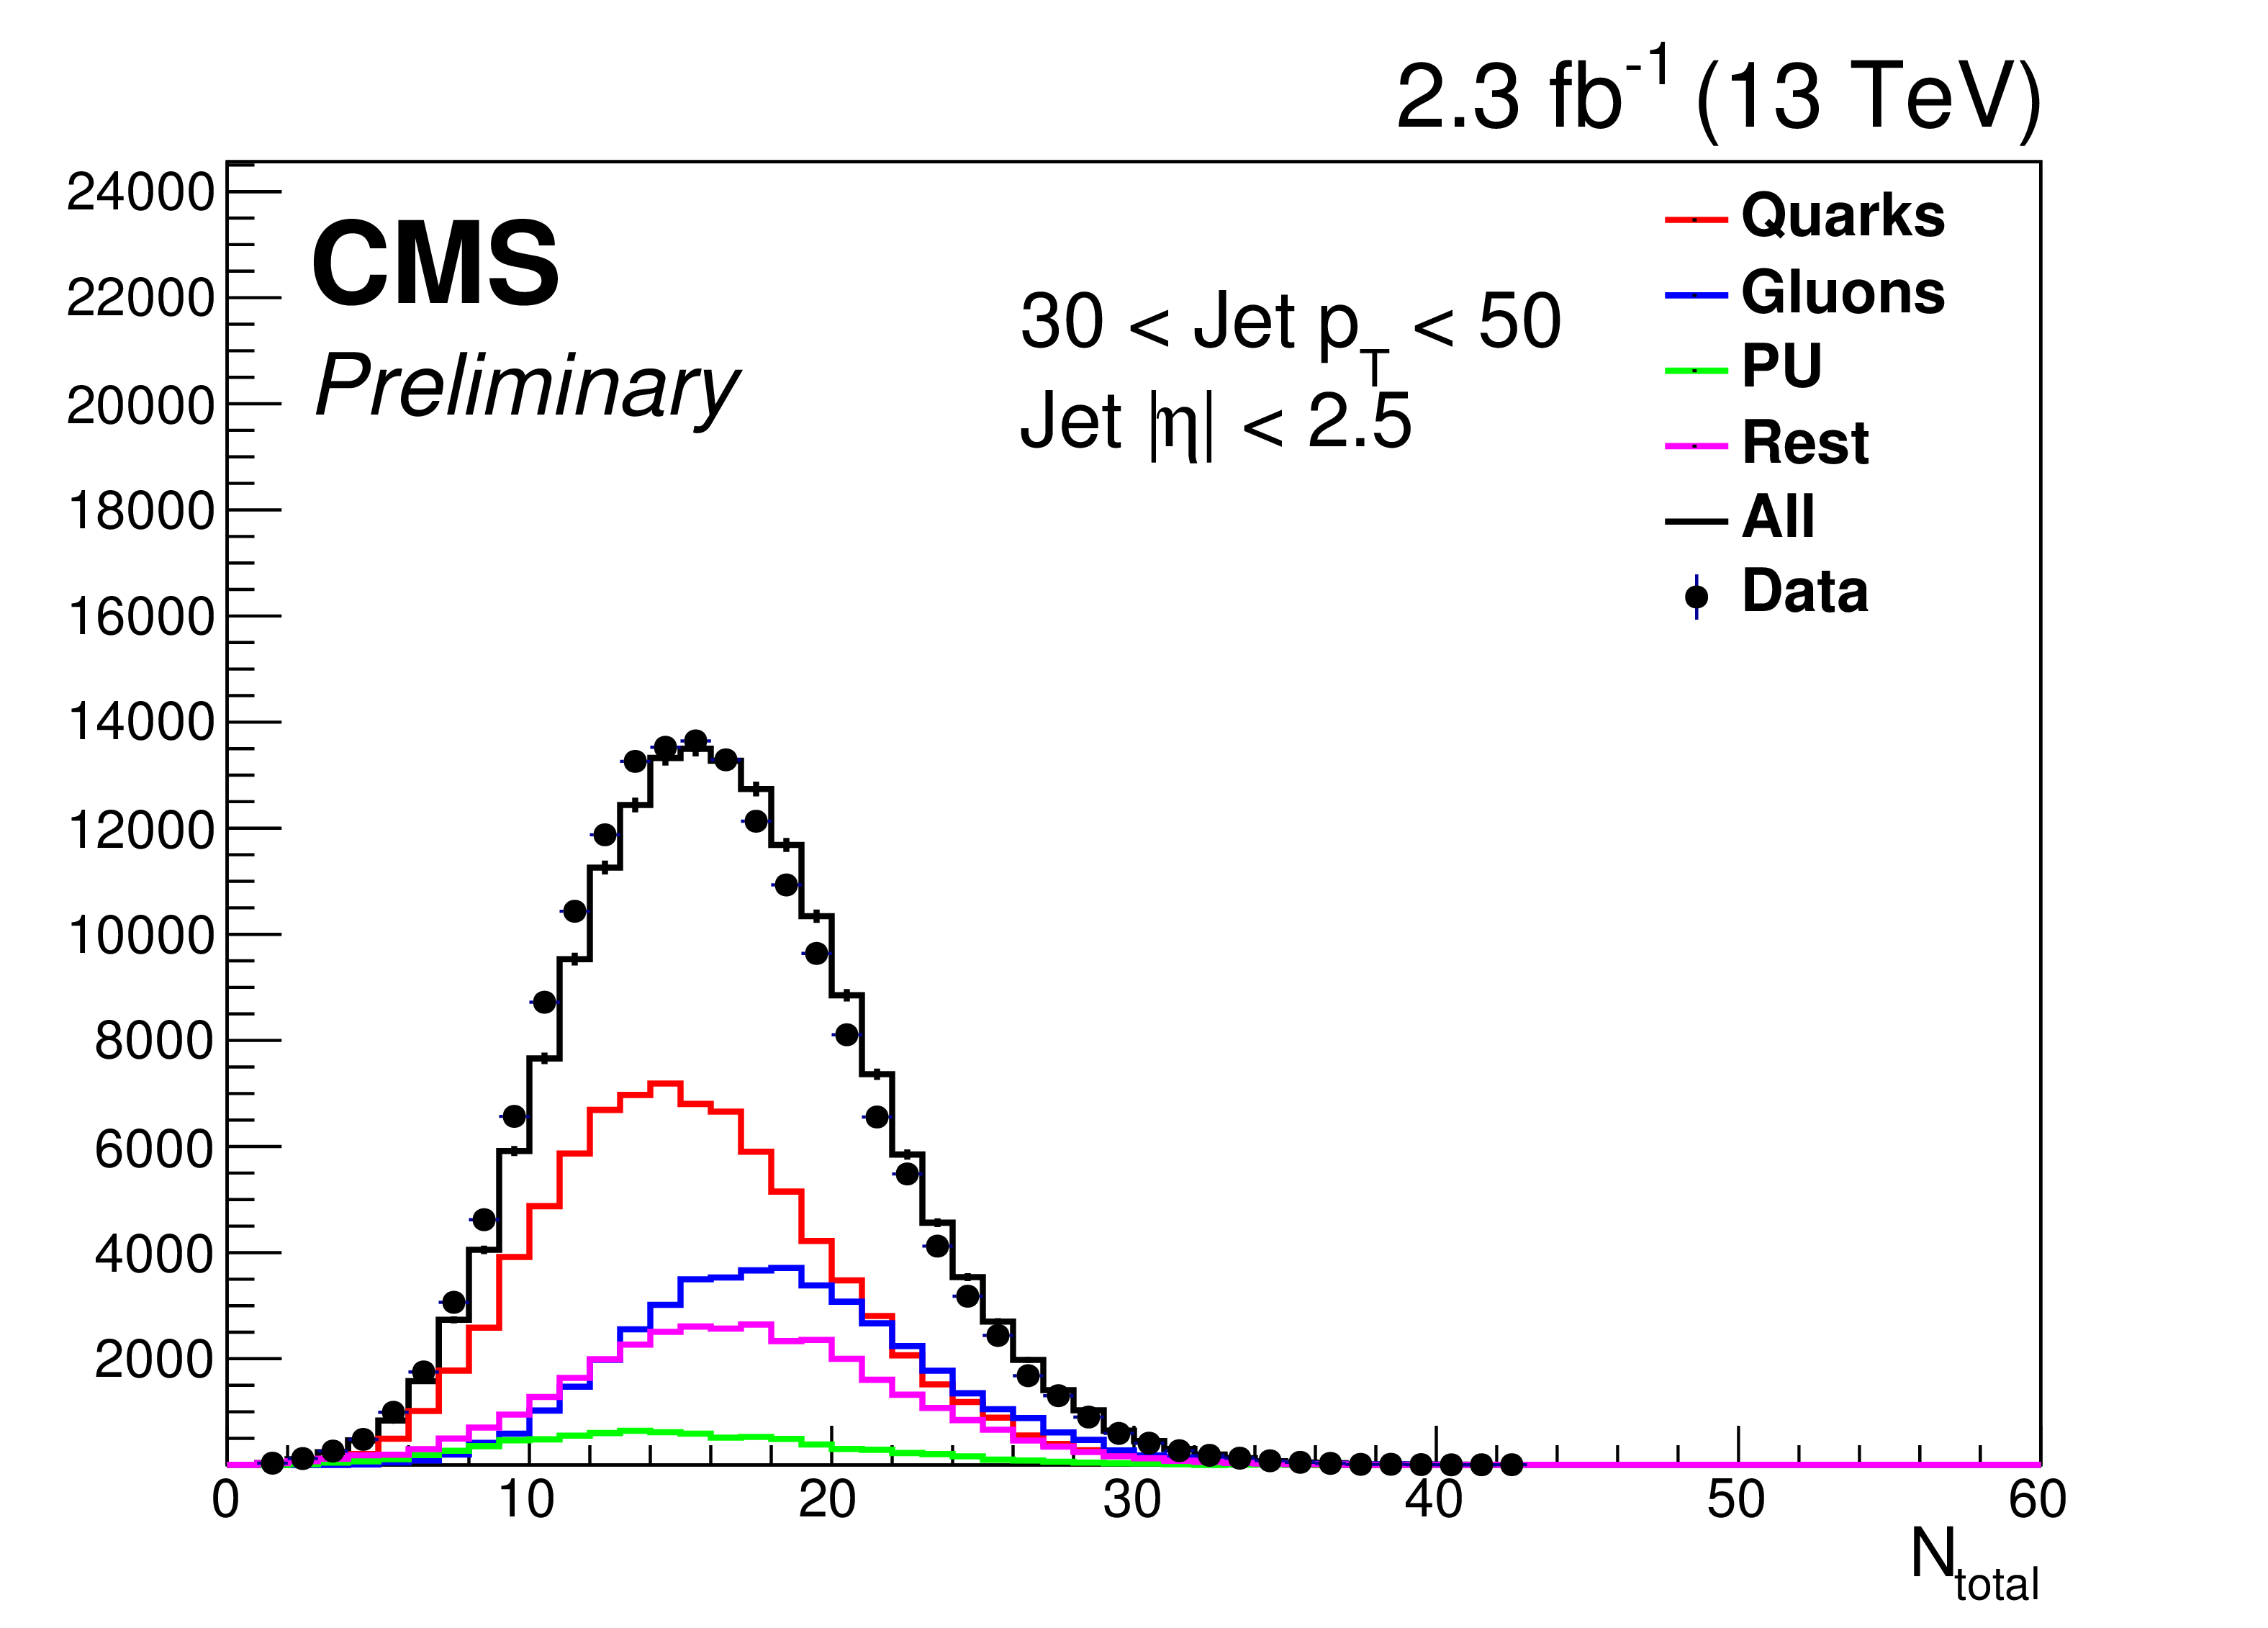
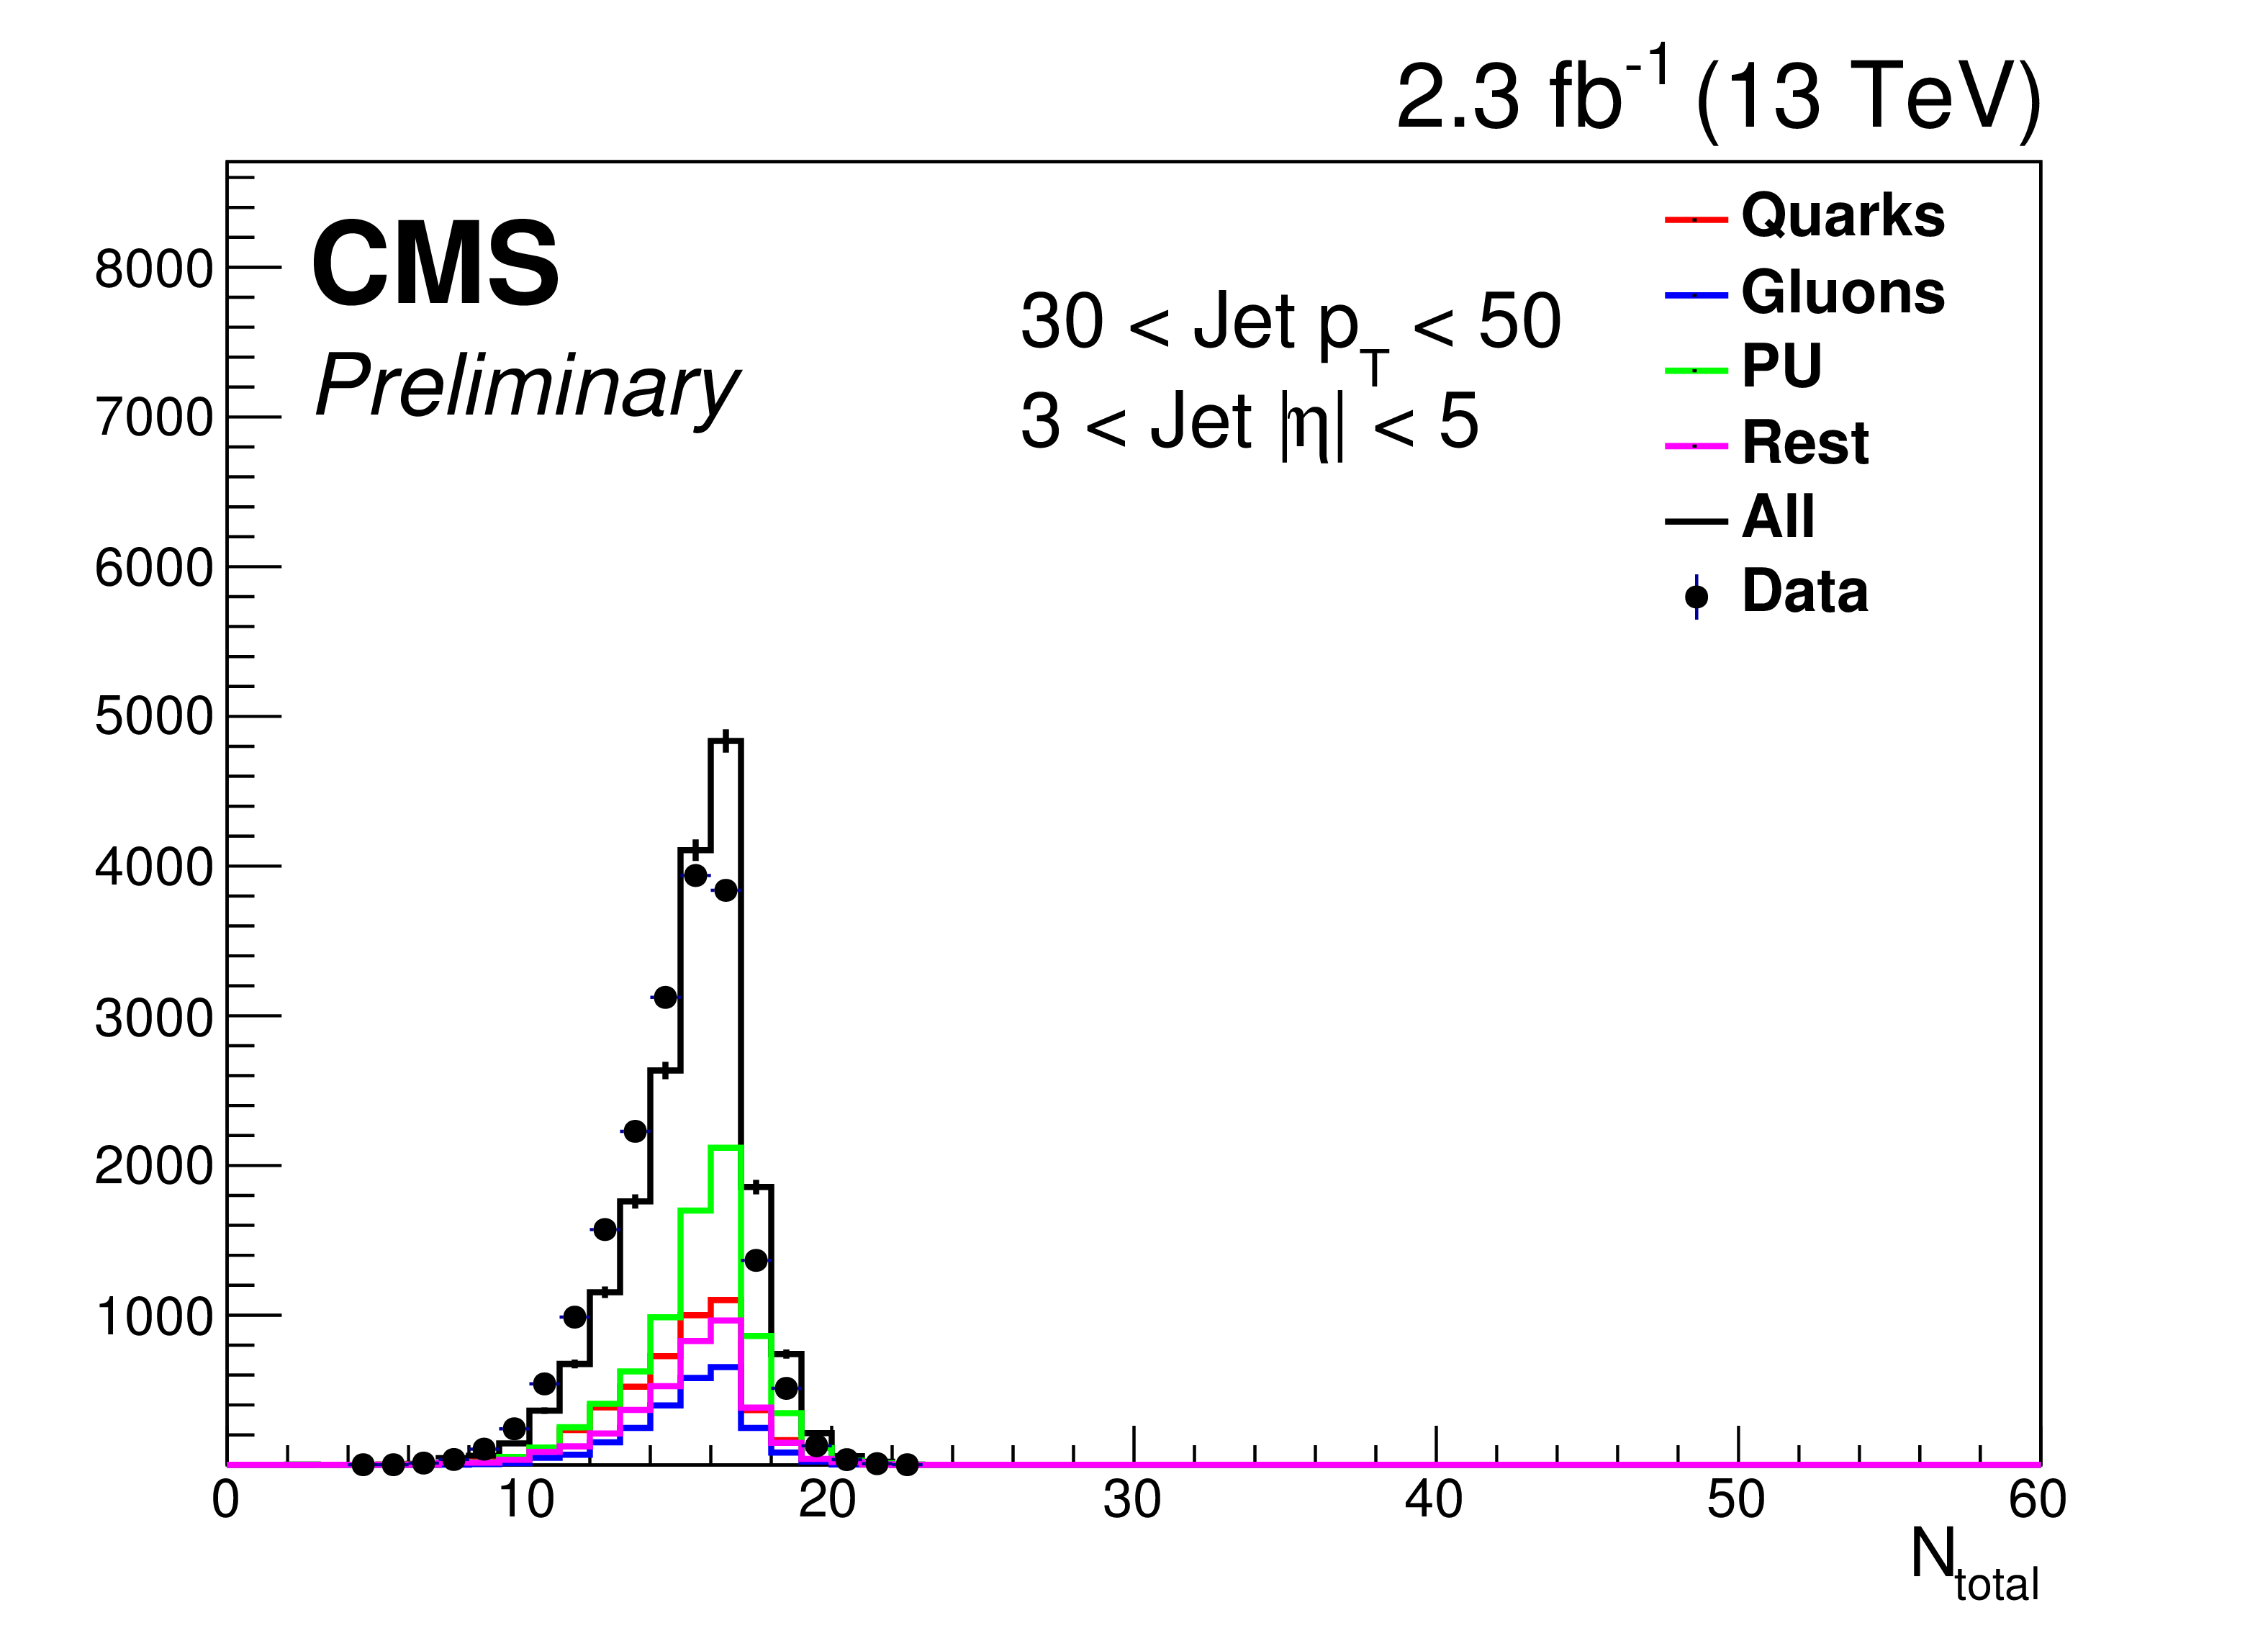
Additional Figure 12:
Multiplicity (left) central (right) forward. |
png pdf |
Additional Figure 12-a:
Multiplicity central. |
png pdf |
Additional Figure 12-b:
Multiplicity forward. |

png pdf |
Additional Figure 13:
Nvtx (left) central (right) forward. |

png pdf |
Additional Figure 13-a:
Nvtx central. |

png pdf |
Additional Figure 13-b:
Nvtx forward. |

png pdf |
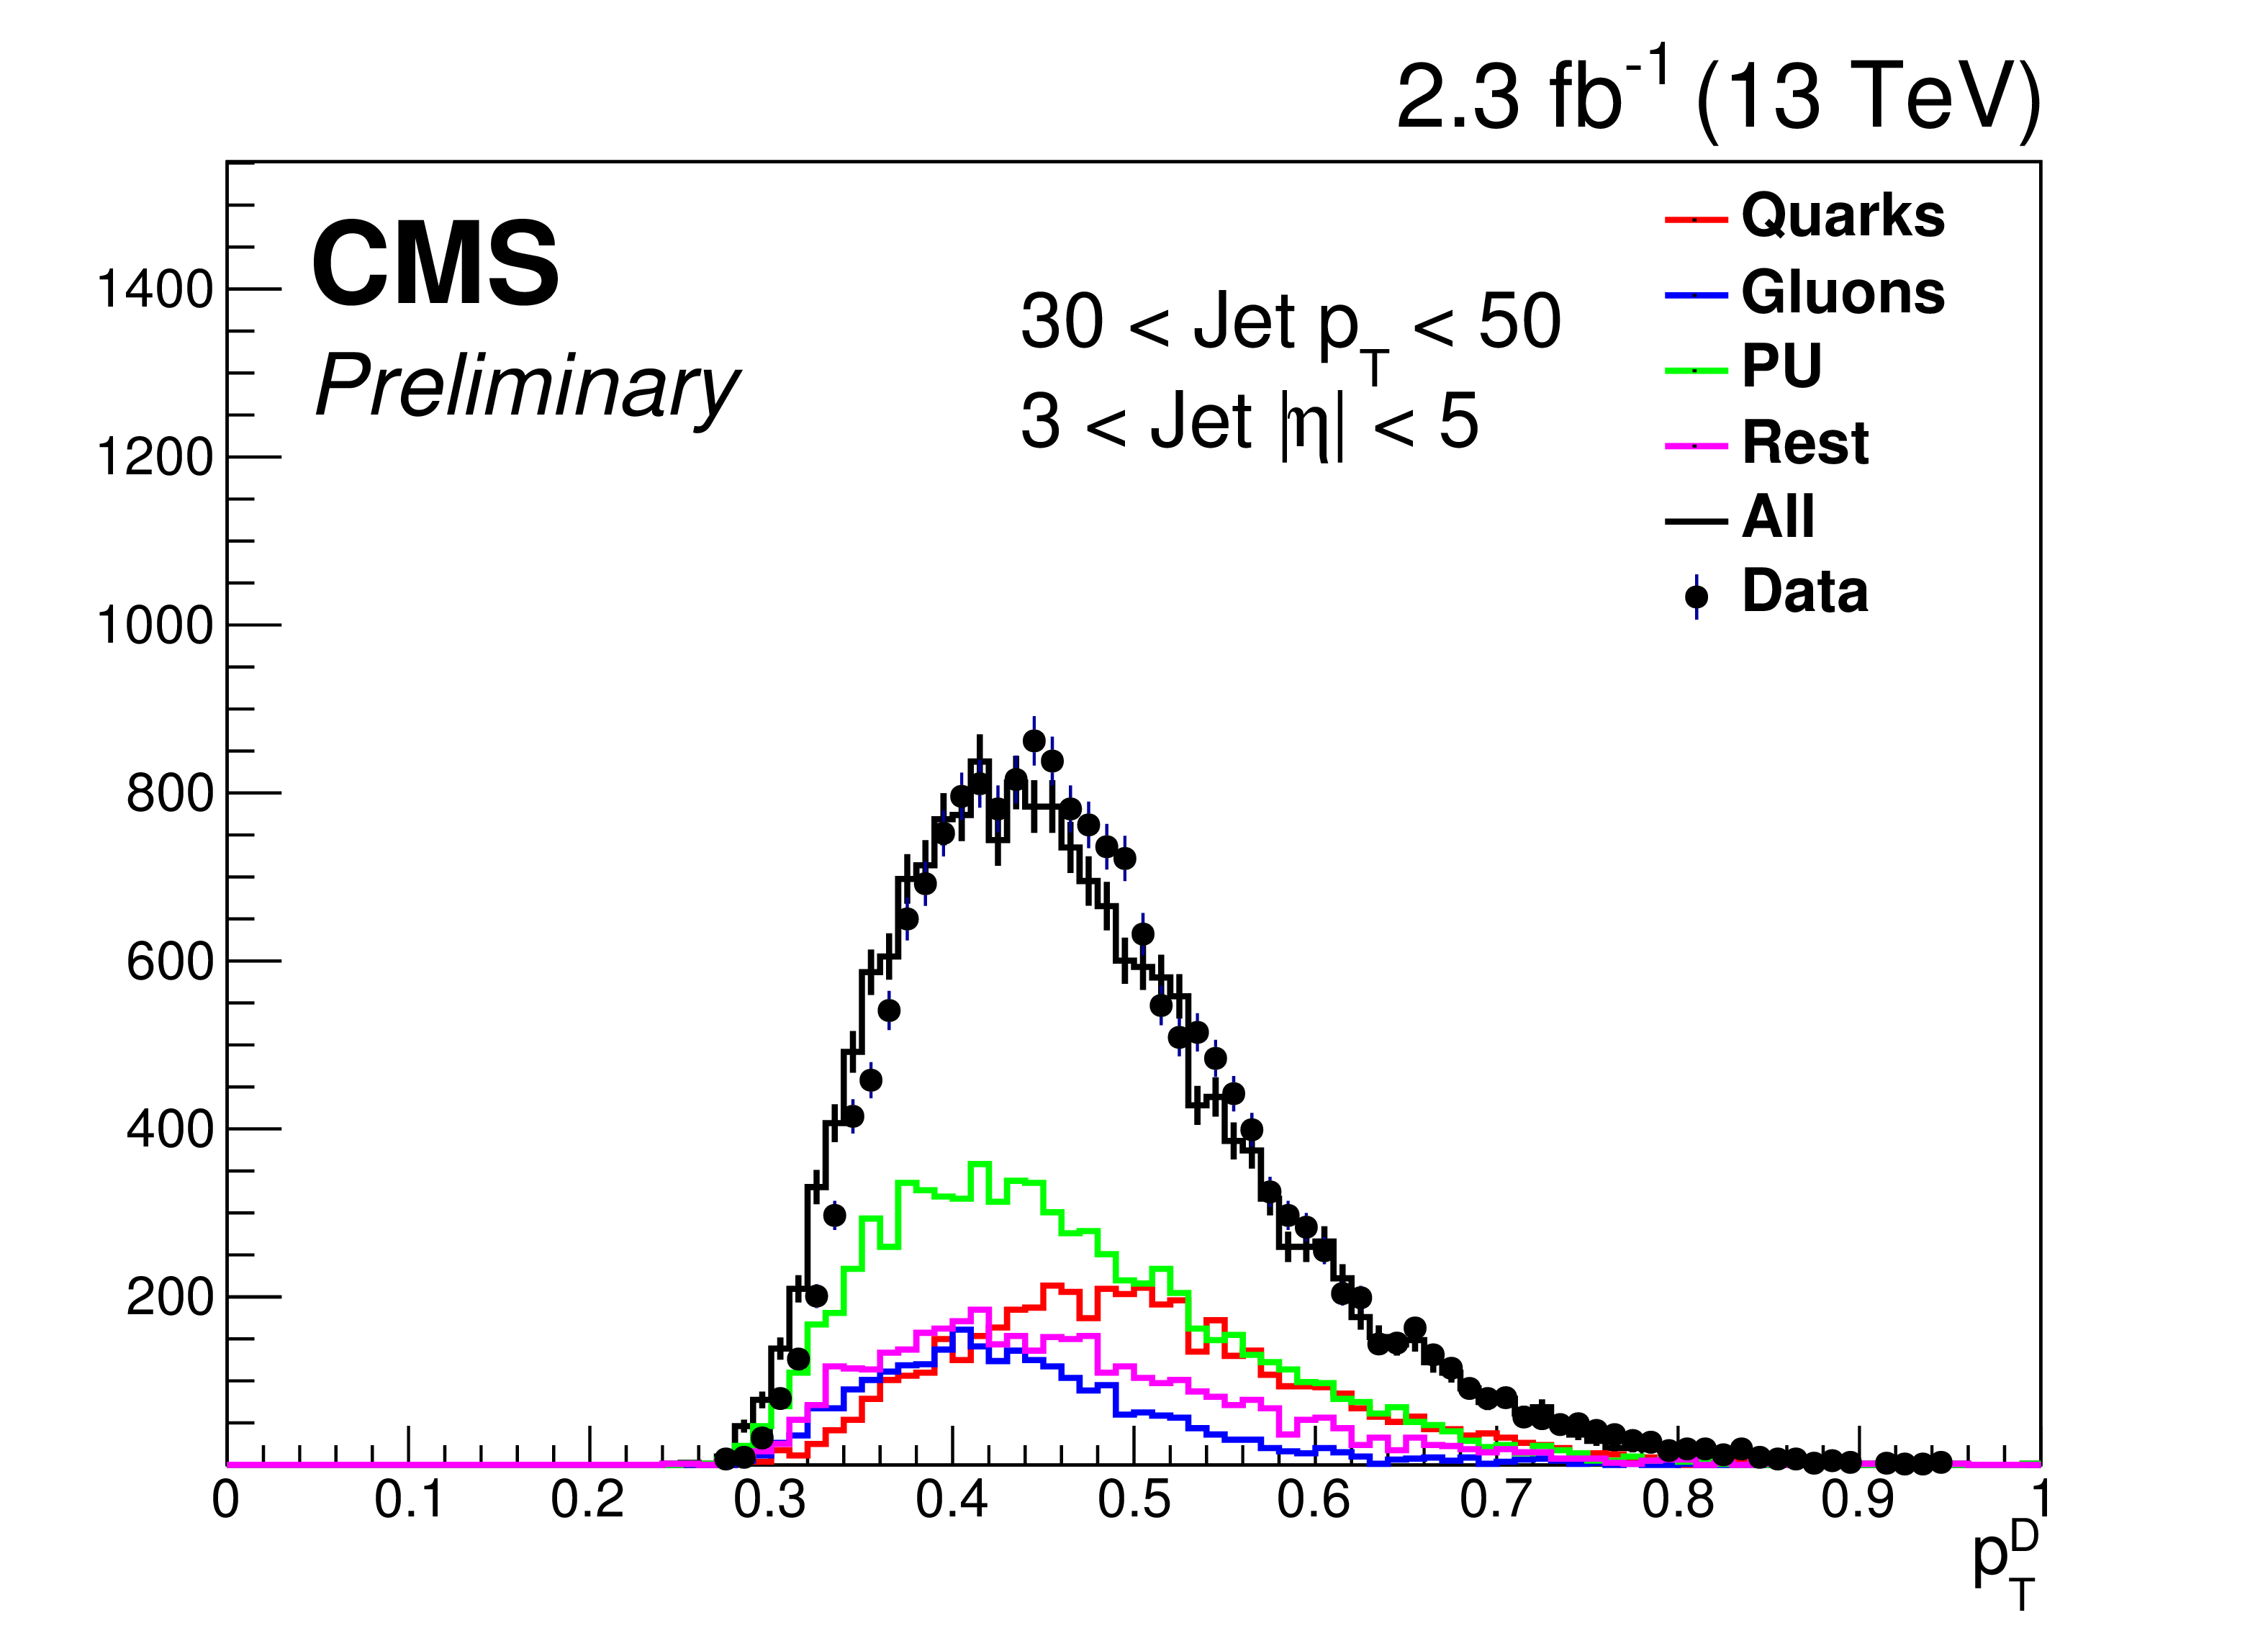
Additional Figure 14:
$ {p_{\mathrm {T}}} {D}$ (left) central (right) forward. |

png pdf |
Additional Figure 14-a:
$ {p_{\mathrm {T}}} {D}$ central. |
png pdf |
Additional Figure 14-b:
$ {p_{\mathrm {T}}} {D}$ forward. |
png pdf |
Additional Figure 15:
pull (left) central (right) forward. |

png pdf |
Additional Figure 15-a:
pull central. |

png pdf |
Additional Figure 15-b:
pull forward. |

png pdf |
Additional Figure 16:
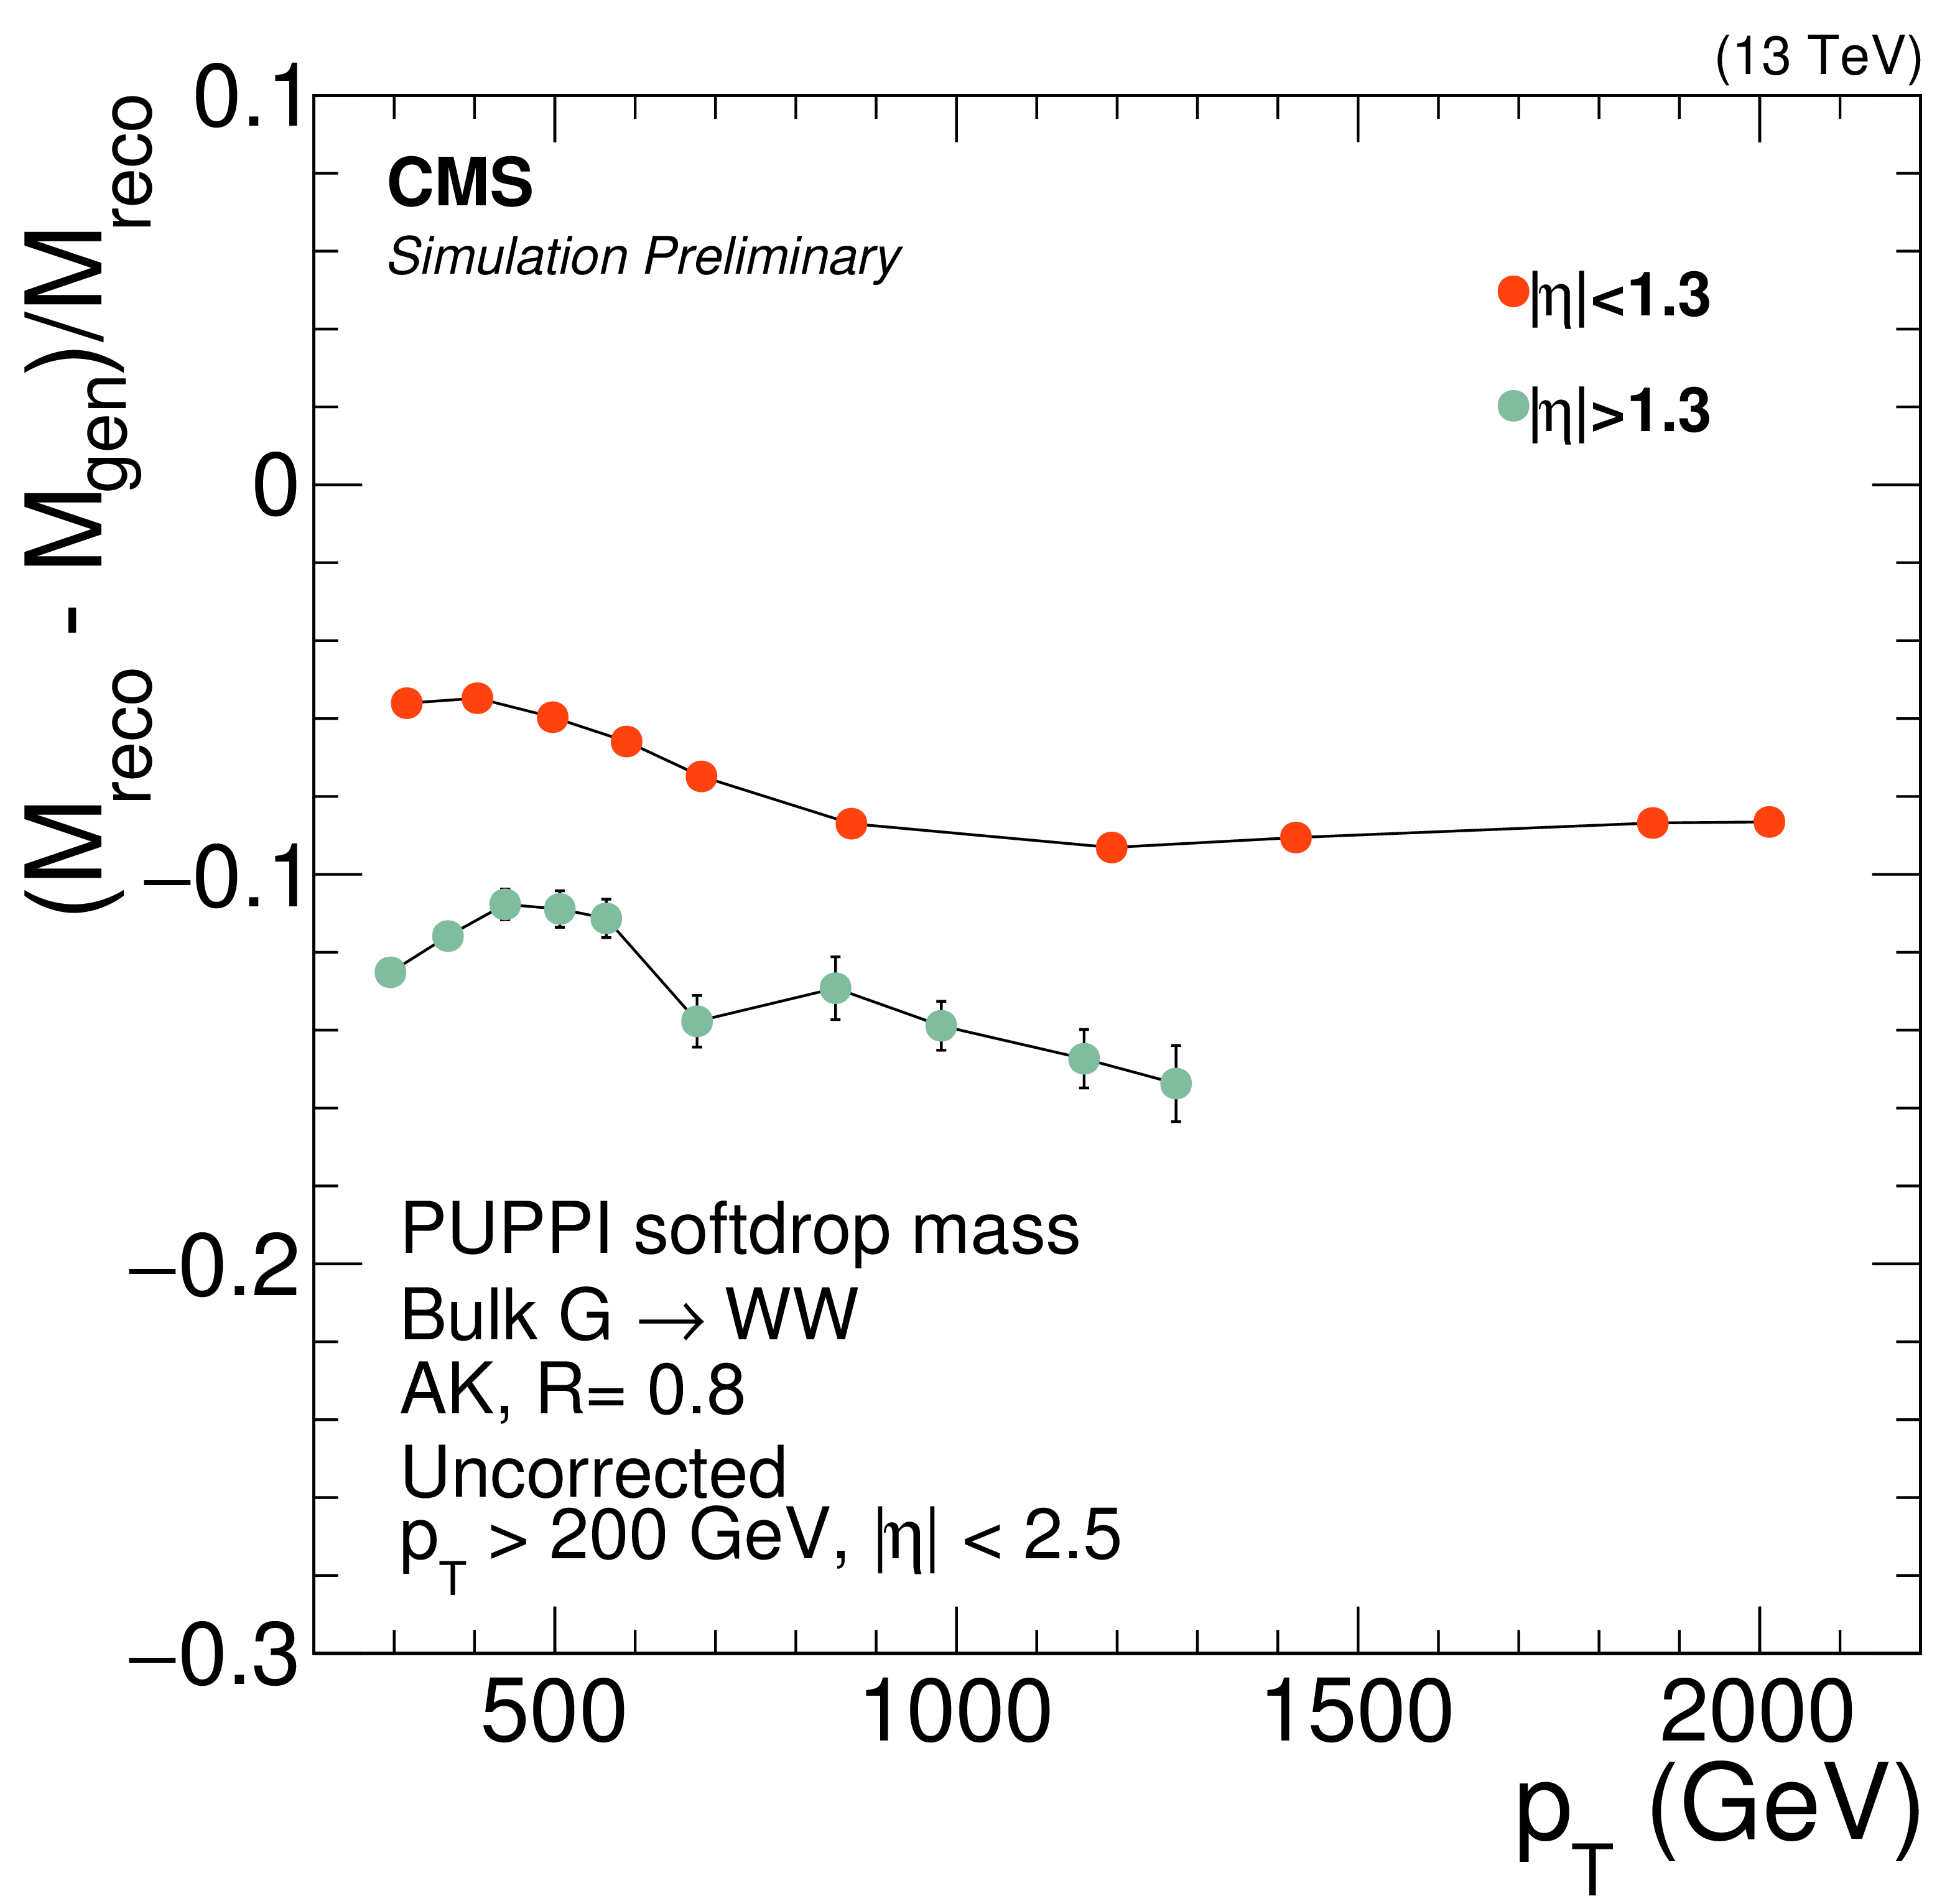
The (a) Gaussian peak position of the fitted generator level W-jet softdrop mass distribution as a function of jet $ {p_{\mathrm {T}}} $ and (b) difference in reconstructed PUPPI softdrop mass and generated softdrop mass normalized by reconstructed PUPPI softdrop mass as a function of jet $ {p_{\mathrm {T}}} $ in two $\eta $ bins (right). |

png pdf |
Additional Figure 16-a:
The Gaussian peak position of the fitted generator level W-jet softdrop mass distribution as a function of jet $ {p_{\mathrm {T}}} $ as a function of jet $ {p_{\mathrm {T}}} $ in two $\eta $ bins. |
png pdf |
Additional Figure 16-b:
The difference in reconstructed PUPPI softdrop mass and generated softdrop mass normalized by reconstructed PUPPI softdrop mass as a function of jet $ {p_{\mathrm {T}}} $ in two $\eta $ bins. |
png pdf |
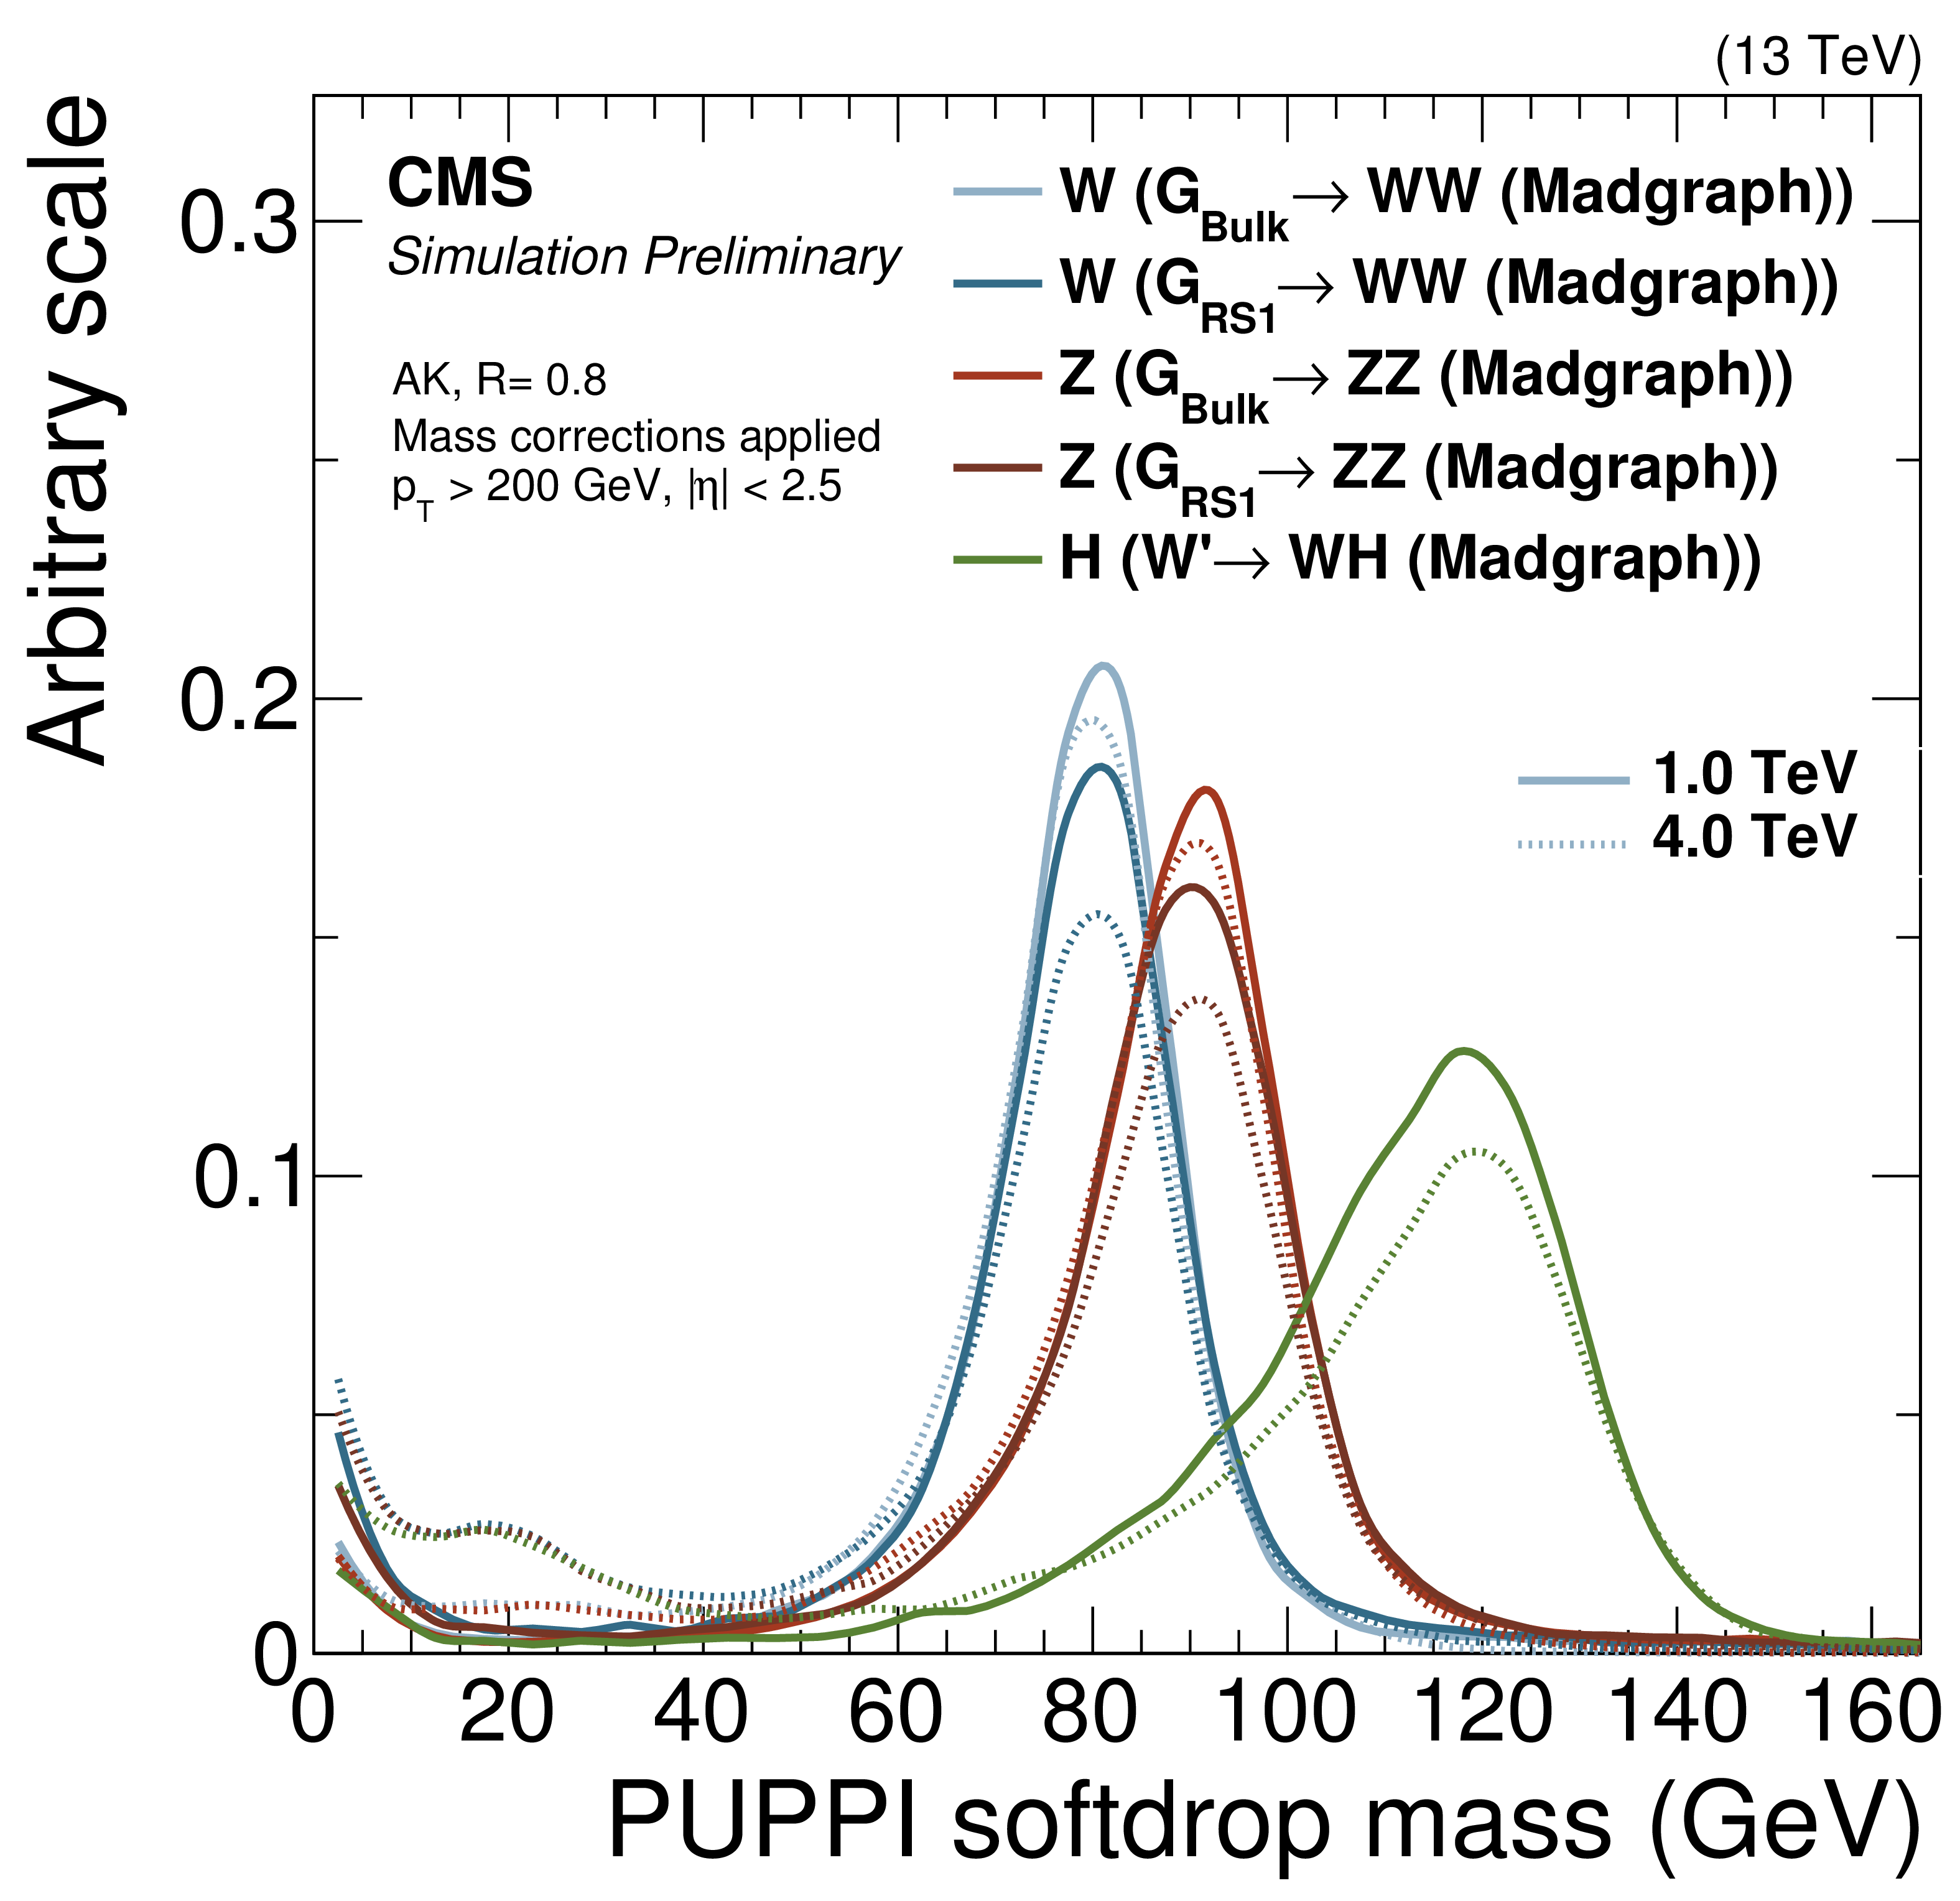
Additional Figure 17:
The W/Z/H-jet PUPPI softdrop mass after jet mass corrections have been applied for jets from different signal samples with masses of 1 and 4 TeV. |

png pdf |
Additional Figure 18:
PUPPI softdrop jet mass distribution that (a) pass and (b) fail the PUPPI $\tau _2 / \tau _1$ DDT $ < $ 0.52 selection. The result of the fit to data and simulation are shown, respectively, by the solid and long-dashed line and the background components of the fit are shown as dashed-dotted and short-dashed line. |

png pdf |
Additional Figure 18-a:
PUPPI softdrop jet mass distribution that passes the PUPPI $\tau _2 / \tau _1$ DDT $ < $ 0.52 selection. The result of the fit to data and simulation are shown, respectively, by the solid and long-dashed line and the background components of the fit are shown as dashed-dotted and short-dashed line. |
png pdf |
Additional Figure 18-b:
PUPPI softdrop jet mass distribution that fails the PUPPI $\tau _2 / \tau _1$ DDT $ < $ 0.52 selection. The result of the fit to data and simulation are shown, respectively, by the solid and long-dashed line and the background components of the fit are shown as dashed-dotted and short-dashed line. |
| References | ||||
| 1 | CMS Collaboration | The CMS experiment at the CERN LHC | JINST 3 (2008) S08004 | CMS-00-001 |
| 2 | CMS Collaboration | Performance of quark/gluon discrimination in 8 TeV pp data | CMS-PAS-JME-13-002 | CMS-PAS-JME-13-002 |
| 3 | ATLAS Collaboration | Light-quark and gluon jet discrimination in $ pp $ collisions at $ \sqrt{s}= $ 7 TeV with the ATLAS detector | EPJC74 (2014), no. 8 | 1405.6583 |
| 4 | CMS Collaboration | Pileup Jet Identification | CMS-PAS-JME-13-005 | CMS-PAS-JME-13-005 |
| 5 | ATLAS Collaboration | Tagging and suppression of pileup jets with the ATLAS detector | ATLAS Note ATLAS-CONF-2014-018 | |
| 6 | A. J. Larkoski, S. Marzani, G. Soyez, and J. Thaler | Soft Drop | JHEP 1405 (2014) 146 | 1402.2657 |
| 7 | J. Thaler and K. Van Tilburg | Maximizing Boosted Top Identification by Minimizing N-subjettiness | JHEP 1202 (2012) 093 | 1108.2701 |
| 8 | J. Dolen et al. | Thinking outside the ROCs: Designing Decorrelated Taggers (DDT) for jet substructure | 1603.00027 | |
| 9 | CMS Collaboration | Identification techniques for highly boosted W bosons that decay into hadrons | JHEP 12 (2014) 017 | CMS-JME-13-006 1410.4227 |
| 10 | CMS Collaboration | Studies of jet mass in dijet and W/Z+jet events | JHEP 05 (2013) 090 | CMS-SMP-12-019 1303.4811 |
| 11 | CMS Collaboration | V Tagging Observables and Correlations | CMS-PAS-JME-14-002 | CMS-PAS-JME-14-002 |
| 12 | CMS Collaboration | Study of jet substructure in pp Collisions at 7 TeV in CMS | CDS | |
| 13 | ATLAS Collaboration | Identification of boosted, hadronically decaying W bosons and comparisons with ATLAS data taken at $ \sqrt{s}= $ 8 TeV | EPJC76 (2016), no. 3, 154 | 1510.05821 |
| 14 | ATLAS Collaboration | A new method to distinguish hadronically decaying boosted $ Z $ bosons from $ W $ bosons using the ATLAS detector | EPJC76 (2016), no. 5, 238 | 1509.04939 |
| 15 | ATLAS Collaboration | Jet mass and substructure of inclusive jets in sqrt(s) = 7 TeV pp collisions with the ATLAS experiment | JHEP 05 (2012) 128 | 1203.4606 |
| 16 | ATLAS Collaboration | Performance of jet substructure techniques for large-R jets in proton-proton collisions at sqrt(s) = 7 TeV using the ATLAS detector | JHEP 09 (2013) 076 | 1306.4945 |
| 17 | G. Kasieczka et al. | Resonance Searches with an Updated Top Tagger | 1503.05921 | |
| 18 | CMS Collaboration | Jet Substructure Algorithms | CDS | |
| 19 | CMS Collaboration | Boosted Top Jet Tagging at CMS | CMS-PAS-JME-13-007 | CMS-PAS-JME-13-007 |
| 20 | CMS Collaboration | Top Tagging with New Approaches | CDS | |
| 21 | ATLAS Collaboration | Identification of high transverse momentum top quarks in $ pp $ collisions at $ \sqrt{s} $ = 8 TeV with the ATLAS detector | 1603.03127 | |
| 22 | ATLAS Collaboration | Boosted hadronic top identification at ATLAS for early 13 TeV data | ATLAS Note ATL-PHYS-PUB-2015-053 | |
| 23 | ATLAS Collaboration | Performance of boosted top quark identification in 2012 ATLAS data | ATLAS Note ATLAS-CONF-2013-084 | |
| 24 | CMS Collaboration | Jet performance in pp collisions at $ \sqrt{s} $ = 7 TeV | CDS | |
| 25 | CMS Collaboration | Particle--flow event reconstruction in CMS and performance for jets, taus, and $ E_{\mathrm{T}}^{\text{miss}} $ | CDS | |
| 26 | CMS Collaboration | Commissioning of the particle-flow event reconstruction with the first LHC collisions recorded in the CMS detector | CDS | |
| 27 | CMS Collaboration | Energy calibration and resolution of the CMS electromagnetic calorimeter in pp collisions at $ \sqrt{s} $ = 7 TeV | JINST 8 (2013) P09009 | CMS-EGM-11-001 1306.2016 |
| 28 | M. Cacciari, G. P. Salam, and G. Soyez | The anti-$ k_T $ jet clustering algorithm | JHEP 04 (2008) 063 | 0802.1189 |
| 29 | Y. L. Dokshitzer, G. D. Leder, S. Moretti, and B. R. Webber | Better jet clustering algorithms | JHEP 08 (1997) 001 | hep-ph/9707323 |
| 30 | M. Wobisch and T. Wengler | Hadronization corrections to jet cross sections in deep-inelastic scattering | hep-ph/9907280 | |
| 31 | M. Cacciari, G. P. Salam, and G. Soyez | FastJet user manual | EPJC 72 (2012) 1896 | 1111.6097 |
| 32 | CMS Collaboration | Jet energy scale and resolution in the CMS experiment in pp collisions at 8 TeV | JINST 12 (2017), no. 02, P02014 | CMS-JME-13-004 1607.03663 |
| 33 | CMS Collaboration | Pileup Removal Algorithms | CMS-PAS-JME-14-001 | CMS-PAS-JME-14-001 |
| 34 | M. Cacciari, G. P. Salam, and G. Soyez | The catchment area of jets | JHEP 04 (2008) 005 | 0802.1188 |
| 35 | M. Cacciari and G. P. Salam | Pileup subtraction using jet areas | PLB 659 (2008) 119 | 0707.1378 |
| 36 | D. Bertolini, P. Harris, M. Low, and N. Tran | Pileup Per Particle Identification | JHEP 10 (2014) 059 | 1407.6013 |
| 37 | CMS Collaboration | Performance of CMS muon reconstruction in $ pp $ collision events at $ \sqrt{s}= $ 7 TeV | JINST 7 (2012) P10002 | CMS-MUO-10-004 1206.4071 |
| 38 | CMS Collaboration | Performance of Electron Reconstruction and Selection with the CMS Detector in Proton-Proton Collisions at $ \sqrt{s}= $ 8 TeV | JINST 10 (2015), no. 06, P06005 | CMS-EGM-13-001 1502.02701 |
| 39 | J. Alwall et al. | The automated computation of tree-level and next-to-leading order differential cross sections, and their matching to parton shower simulations | JHEP 07 (2014) 079 | 1405.0301 |
| 40 | T. Sjostrand, S. Mrenna, and P. Z. Skands | PYTHIA 6.4 Physics and Manual | JHEP 05 (2006) 026 | hep-ph/0603175 |
| 41 | T. Sjostrand, S. Mrenna, and P. Z. Skands | A Brief Introduction to PYTHIA 8.1 | CPC 178 (2008) 852--867 | 0710.3820 |
| 42 | B. Andersson, G. Gustafson, G. Ingelman, and T. Sjostrand | Parton Fragmentation and String Dynamics | PR 97 (1983) 31--145 | |
| 43 | T. Sjostrand | The Merging of Jets | PLB 142 (1984) 420--424 | |
| 44 | P. Skands, S. Carrazza, and J. Rojo | Tuning PYTHIA 8.1: the Monash 2013 Tune | EPJC74 (2014), no. 8 | 1404.5630 |
| 45 | CMS Collaboration | Underlying Event Tunes and Double Parton Scattering | CDS | |
| 46 | P. Nason | A New method for combining NLO QCD with shower Monte Carlo algorithms | JHEP 11 (2004) 040 | hep-ph/0409146 |
| 47 | S. Frixione, P. Nason, and C. Oleari | Matching NLO QCD computations with Parton Shower simulations: the POWHEG method | JHEP 11 (2007) 070 | 0709.2092 |
| 48 | S. Alioli, P. Nason, C. Oleari, and E. Re | A general framework for implementing NLO calculations in shower Monte Carlo programs: the POWHEG BOX | JHEP 06 (2010) 043 | 1002.2581 |
| 49 | NNPDF Collaboration | Parton distributions for the LHC Run II | JHEP 04 (2015) 040 | 1410.8849 |
| 50 | CMS Collaboration | Search for a Higgs boson in the decay channel $ H $ to ZZ(*) to $ q $ qbar $ \ell^- $ l+ in $ pp $ collisions at $ \sqrt{s}= $ 7 TeV | JHEP 04 (2012) 036 | CMS-HIG-11-027 1202.1416 |
| 51 | CMS Collaboration | Search for the standard model Higgs boson produced through vector boson fusion and decaying to $ b \overline{b} $ | PRD92 (2015), no. 3, 032008 | CMS-HIG-14-004 1506.01010 |
| 52 | CMS Collaboration | Measurement of the hadronic activity in events with a Z and two jets and extraction of the cross section for the electroweak production of a Z with two jets in pp collisions at $ \sqrt{s} $ = 7 TeV | JHEP 10 (2013) 062 | CMS-FSQ-12-019 1305.7389 |
| 53 | CMS Collaboration | Measurement of electroweak production of two jets in association with a Z boson in proton-proton collisions at $ \sqrt{s}= $ 8 TeV | EPJC75 (2015), no. 2, 66 | CMS-FSQ-12-035 1410.3153 |
| 54 | P. Richardson and A. Wilcock | Monte Carlo Simulation of Hard Radiation in Decays in Beyond the Standard Model Physics in Herwig++ | EPJC74 (2014) 2713 | 1303.4563 |
| 55 | J. Bellm et al. | Herwig++ 2.7 Release Note | 1310.6877 | |
| 56 | J. Gallicchio and M. D. Schwartz | Seeing in Color: Jet Superstructure | PRL 105 (2010) 022001 | 1001.5027 |
| 57 | J. Gallicchio and M. D. Schwartz | Quark and Gluon Jet Substructure | JHEP 04 (2013) 090 | 1211.7038 |
| 58 | S. D. Ellis, C. K. Vermilion, and J. R. Walsh | Techniques for improved heavy particle searches with jet substructure | Phys.Rev. D80 (2009) 051501 | 0903.5081 |
| 59 | S. D. Ellis, C. K. Vermilion, and J. R. Walsh | Recombination Algorithms and Jet Substructure: Pruning as a Tool for Heavy Particle Searches | Phys.Rev. D81 (2010) 094023 | 0912.0033 |
| 60 | M. Dasgupta, A. Fregoso, S. Marzani, and G. P. Salam | Towards an understanding of jet substructure | JHEP 1309 (2013) 029 | 1307.0007 |
| 61 | M. Dasgupta, A. Fregoso, S. Marzani, and A. Powling | Jet substructure with analytical methods | Eur.Phys.J. C73 (2013), no. 11 | 1307.0013 |
| 62 | J. M. Butterworth, A. R. Davison, M. Rubin, and G. P. Salam | Jet substructure as a new Higgs search channel at the LHC | PRL 100 (2008) 242001 | 0802.2470 |
| 63 | J. Thaler and K. Van Tilburg | Maximizing Boosted Top Identification by Minimizing N-subjettiness | JHEP 02 (2012) 093 | 1108.2701 |
| 64 | CMS Collaboration | Identification of b quark jets at the CMS Experiment in the LHC Run 2 | CMS-PAS-BTV-15-001 | CMS-PAS-BTV-15-001 |
| 65 | T. Plehn, G. P. Salam, and M. Spannowsky | Fat Jets for a Light Higgs | PRL 104 (2010) 111801 | 0910.5472 |
| 66 | T. Plehn, M. Spannowsky, M. Takeuchi, and D. Zerwas | Stop Reconstruction with Tagged Tops | JHEP 1010 (2010) 078 | 1006.2833 |
| 67 | CMS Collaboration | Measurement of differential cross sections for top quark pair production using the lepton+jets final state in proton-proton collisions at 13 TeV | Submitted to: PRD (2016) | CMS-TOP-16-008 1610.04191 |
| 68 | CMS Collaboration | Measurement of the differential cross section for $ \mathrm{t \bar t} $ production in the dilepton final state at $ \sqrt{s}= $ 13 TeV | CDS | |
|
|
Compact Muon Solenoid LHC, CERN |
|

|

|

|

|

|