

Compact Muon Solenoid
LHC, CERN
| CMS-PAS-SMP-16-012 | ||
| Search for anomalous couplings in semileptonic WW and WZ decays at $ \sqrt{s} = $ 13 TeV | ||
| CMS Collaboration | ||
| August 2016 | ||
| Abstract: The increased center of mass energy of the LHC Run II allows for a much larger reach to study possible deviations from the standard model in a generic manner, using an effective field theory approach. In this analysis we constrain additional operators that would lead to anomalous WW$\gamma$ or WWZ couplings by studying events with one W boson decaying to an electron or muon and neutrino and one W or Z boson decaying hadronically. The study uses a sample of proton-proton collisions collected with the CMS experiment at a center-of-mass energy of $\sqrt{s}=$ 13 TeV corresponding to an integrated luminosity of 2.3 fb$^{-1}$. Using di-boson mass distributions we derive 95% confidence intervals for the anomalous coupling parameters $\frac{c_{\mathrm{WWW}}}{\Lambda ^2}$ ($ [-9.46 , 9.42]$ TeV$^{-2}$), $\frac{c_\mathrm{W}}{\Lambda ^2}$ ($ [-12.6, 12.0]$ TeV$^{-2}$) and $\frac{c_\mathrm{B}}{\Lambda ^2}$ ($ [-56.1, 55.4]$ TeV$^{-2}$), in agreement with standard model expectations. | ||
| Links: CDS record (PDF) ; inSPIRE record ; CADI line (restricted) ; | ||
| Figures & Tables | Summary | Additional Figures | References | CMS Publications |
|---|
| Figures | |
png pdf |
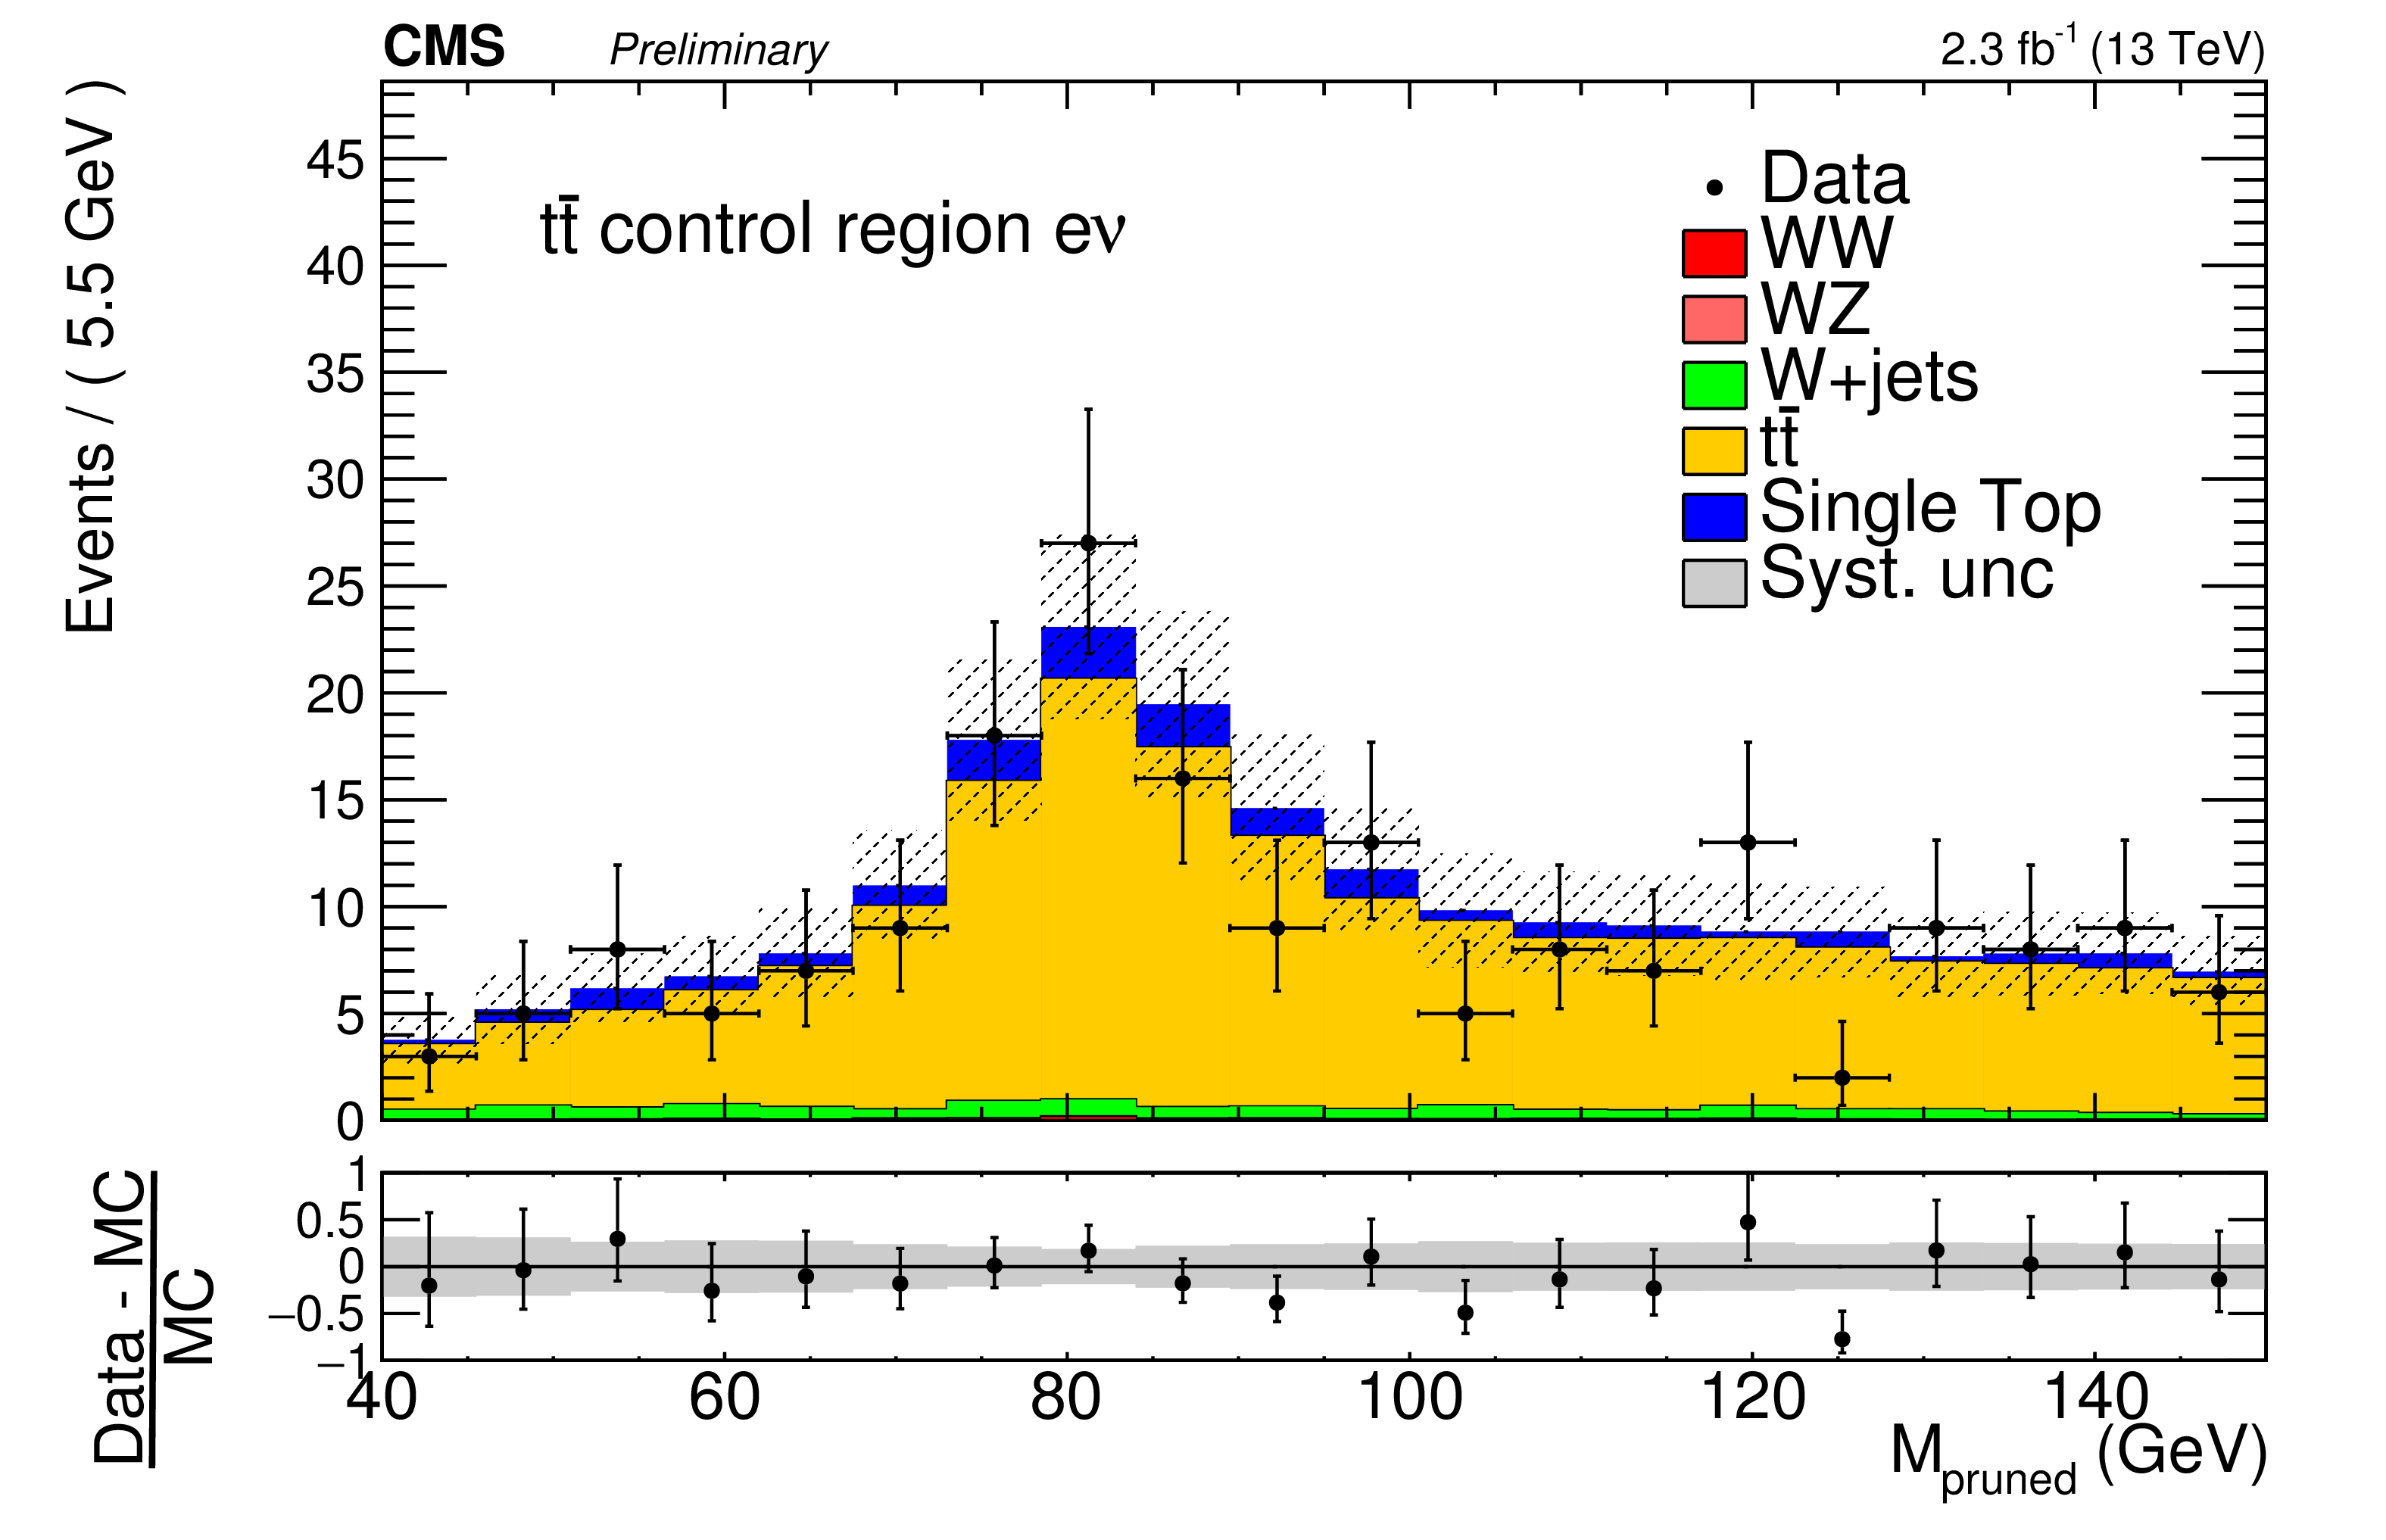
Figure 1-a:
Comparison between data and simulation of the ${M_\mathrm {pruned}}$ (a,b) and $M_\mathrm{WV}$ (c,d) distributions in the ${\mathrm {t}\overline {\mathrm {t}}}$ control region. The electron channel is shown on (a,c), while the muon channel is shown on (b,d). Details concerning the systematic uncertainties can be found in section 6. |

png pdf |
Figure 1-b:
Comparison between data and simulation of the ${M_\mathrm {pruned}}$ (a,b) and $M_\mathrm{WV}$ (c,d) distributions in the ${\mathrm {t}\overline {\mathrm {t}}}$ control region. The electron channel is shown on (a,c), while the muon channel is shown on (b,d). Details concerning the systematic uncertainties can be found in section 6. |
png pdf |
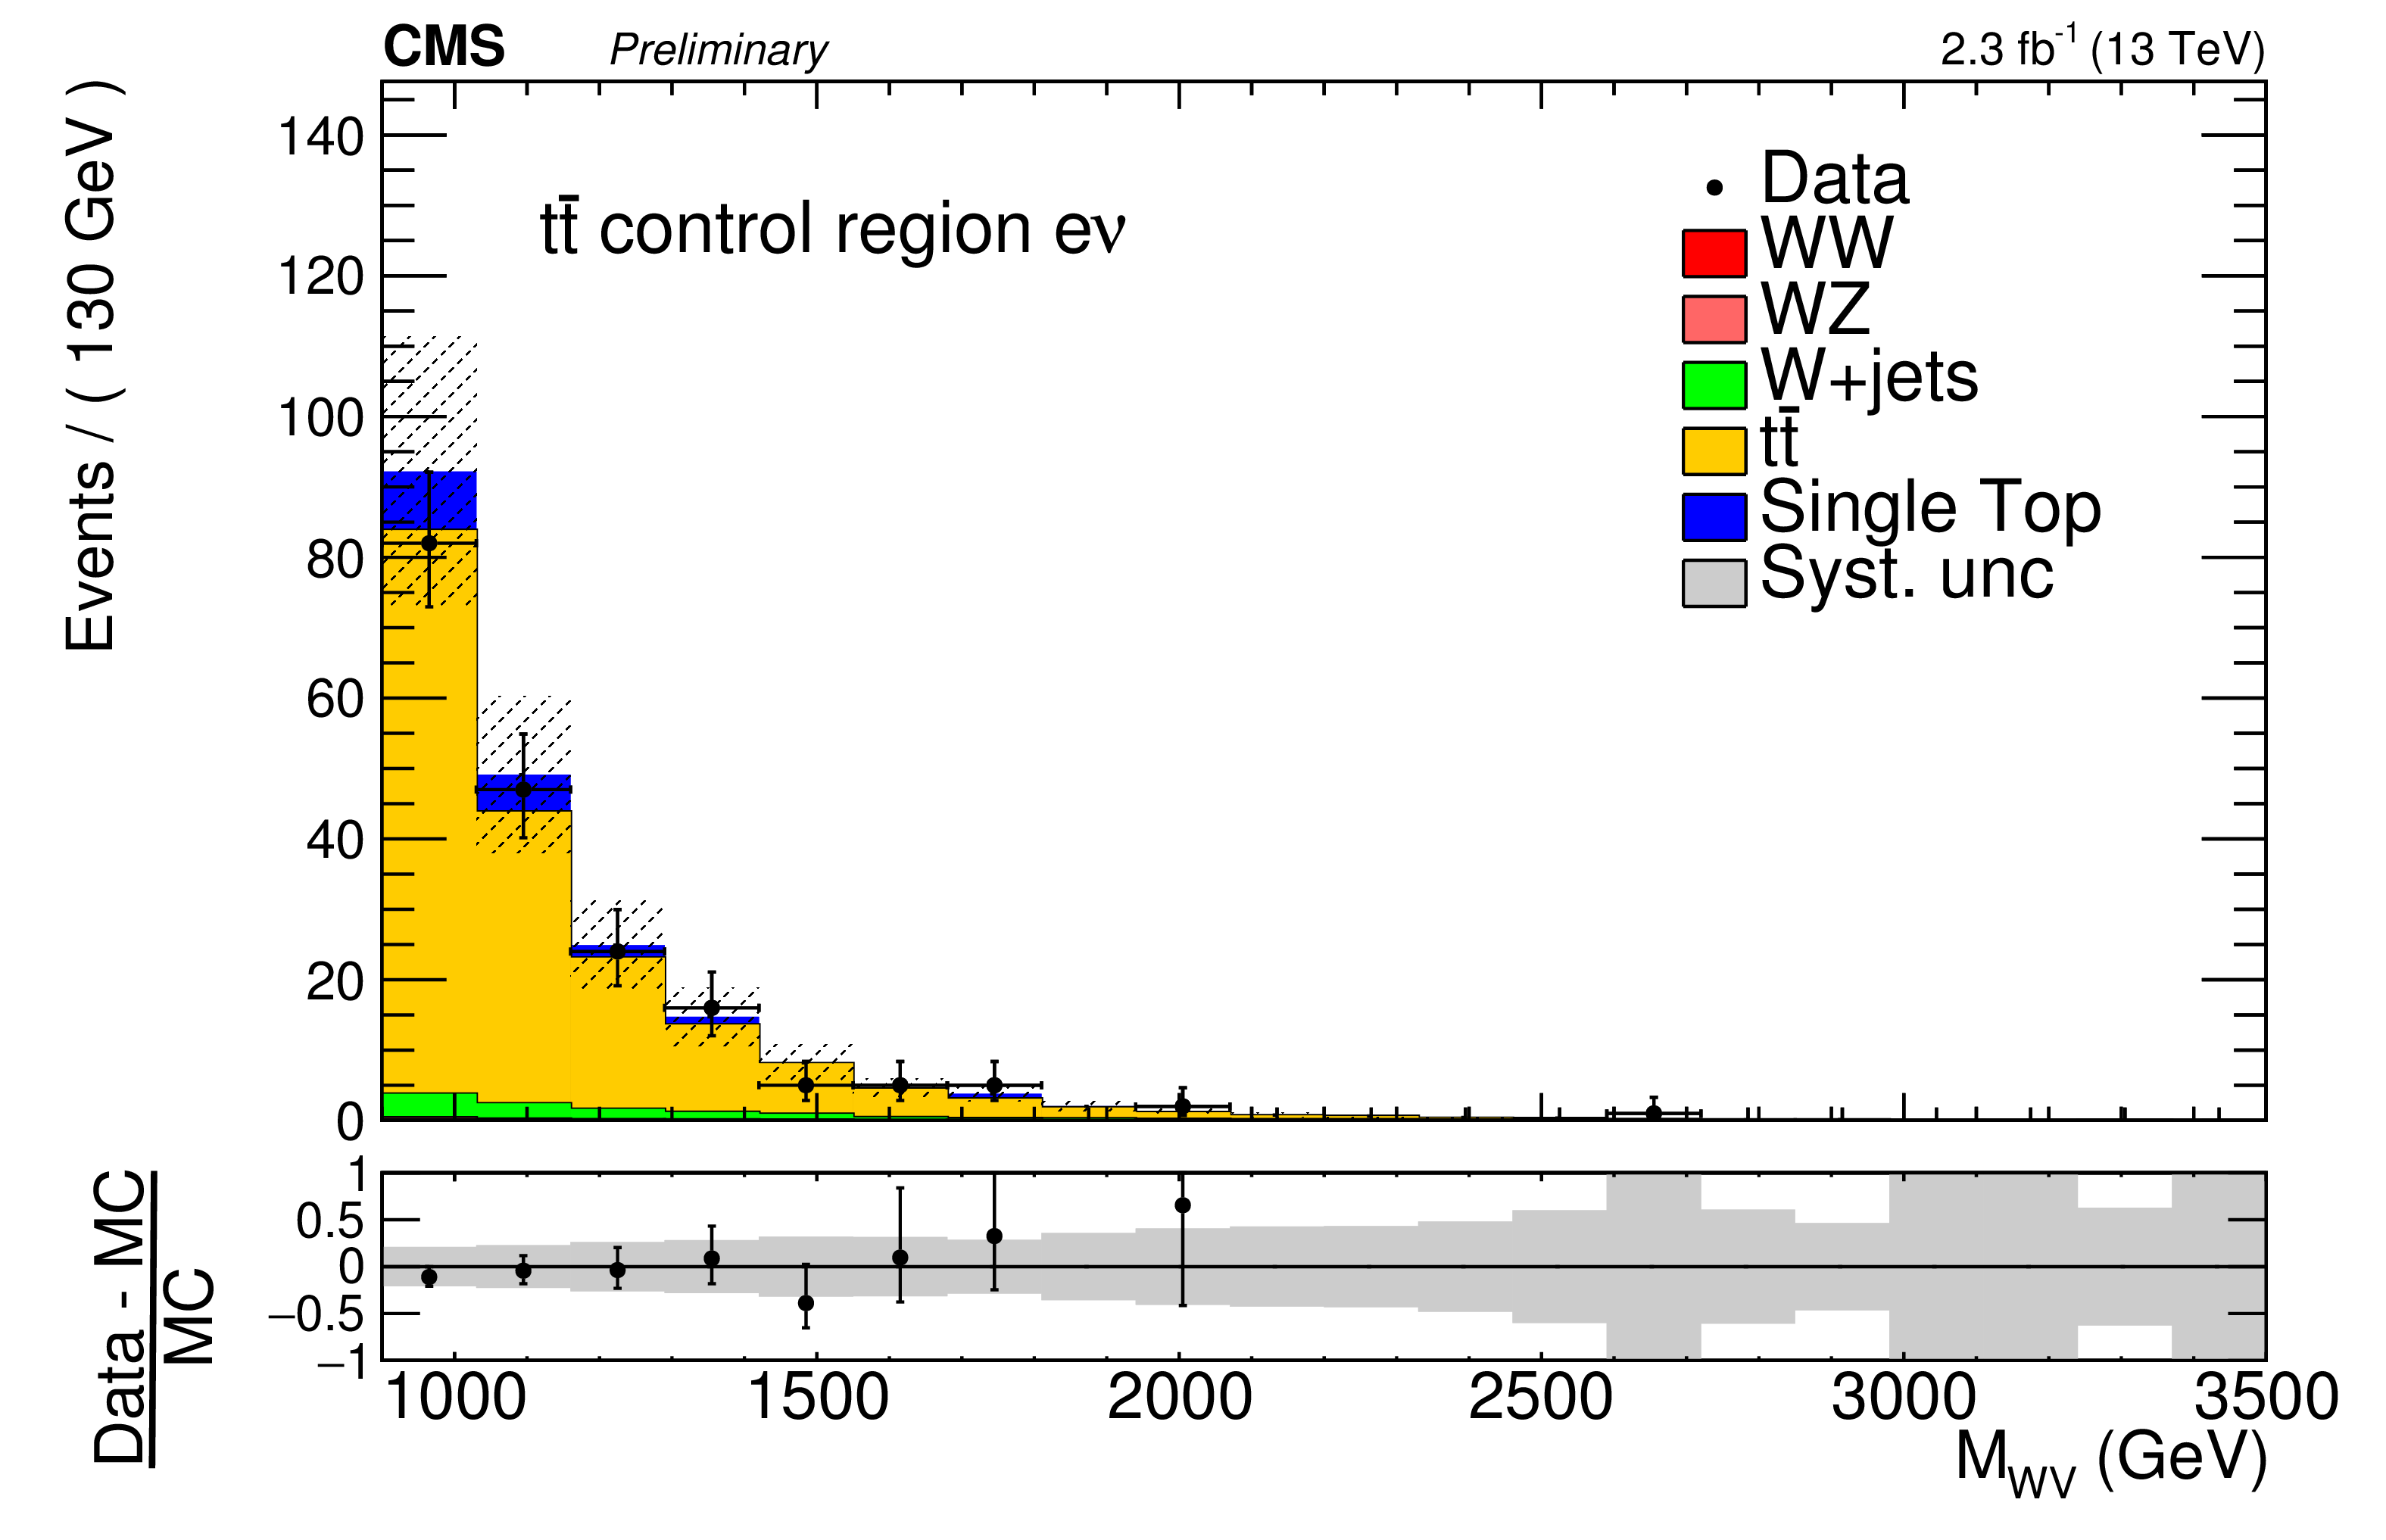
Figure 1-c:
Comparison between data and simulation of the ${M_\mathrm {pruned}}$ (a,b) and $M_\mathrm{WV}$ (c,d) distributions in the ${\mathrm {t}\overline {\mathrm {t}}}$ control region. The electron channel is shown on (a,c), while the muon channel is shown on (b,d). Details concerning the systematic uncertainties can be found in section 6. |

png pdf |
Figure 1-d:
Comparison between data and simulation of the ${M_\mathrm {pruned}}$ (a,b) and $M_\mathrm{WV}$ (c,d) distributions in the ${\mathrm {t}\overline {\mathrm {t}}}$ control region. The electron channel is shown on (a,c), while the muon channel is shown on (b,d). Details concerning the systematic uncertainties can be found in section 6. |

png pdf |
Figure 2-a:
Result of the template fit to the ${M_\mathrm {pruned}}$-distributions, electron channel on (a), muon channel on (b). |

png pdf |
Figure 2-b:
Result of the template fit to the ${M_\mathrm {pruned}}$-distributions, electron channel on (a), muon channel on (b). |

png pdf |
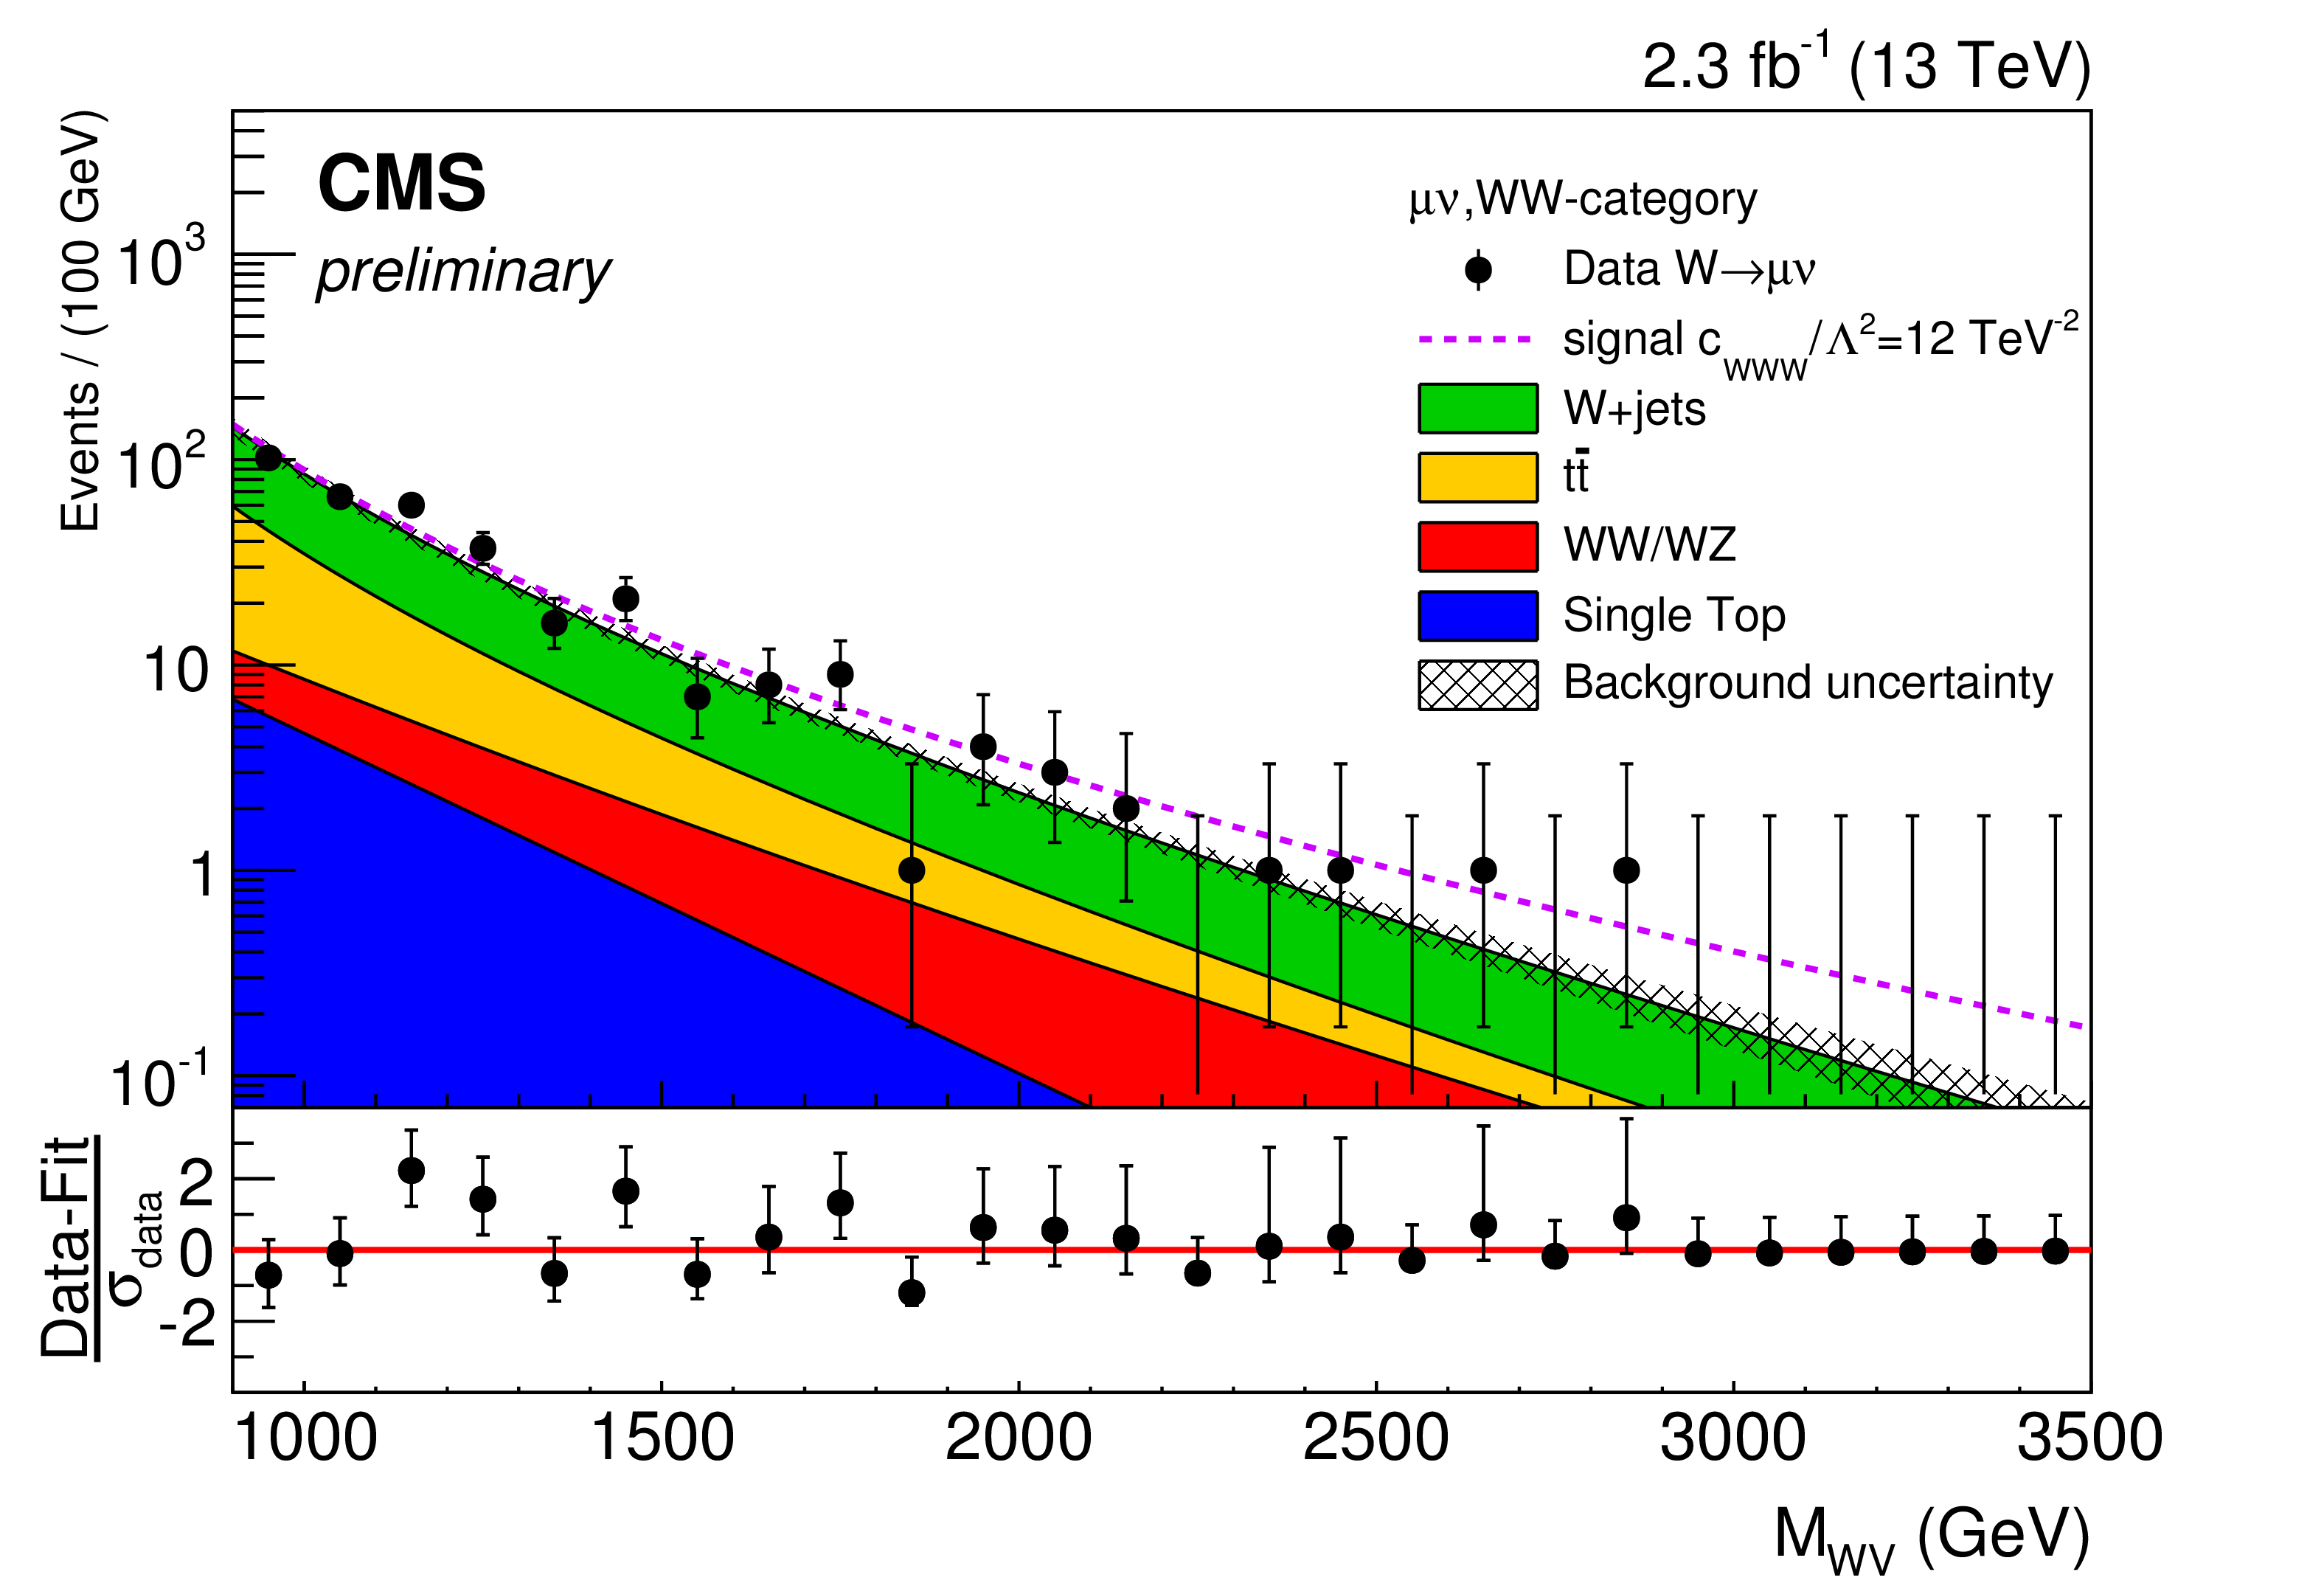
Figure 3-a:
Comparison of the $M_\mathrm{WV}$ distribution in the data and background estimate for the electron (a,c) and muon channel (b,d) in the WW- (a,b) and WZ-category (c,d). The pink line represents the sum of the backgrounds and a signal with an aTGC value of $c_{\mathrm{WWW}}=$ 12 TeV$^{-2}$. Each figure also shows the difference between data and the SM prediction, divided by the statistical uncertainty of the data-points. |
png pdf |
Figure 3-b:
Comparison of the $M_\mathrm{WV}$ distribution in the data and background estimate for the electron (a,c) and muon channel (b,d) in the WW- (a,b) and WZ-category (c,d). The pink line represents the sum of the backgrounds and a signal with an aTGC value of $c_{\mathrm{WWW}}=$ 12 TeV$^{-2}$. Each figure also shows the difference between data and the SM prediction, divided by the statistical uncertainty of the data-points. |

png pdf |
Figure 3-c:
Comparison of the $M_\mathrm{WV}$ distribution in the data and background estimate for the electron (a,c) and muon channel (b,d) in the WW- (a,b) and WZ-category (c,d). The pink line represents the sum of the backgrounds and a signal with an aTGC value of $c_{\mathrm{WWW}}=$ 12 TeV$^{-2}$. Each figure also shows the difference between data and the SM prediction, divided by the statistical uncertainty of the data-points. |
png pdf |
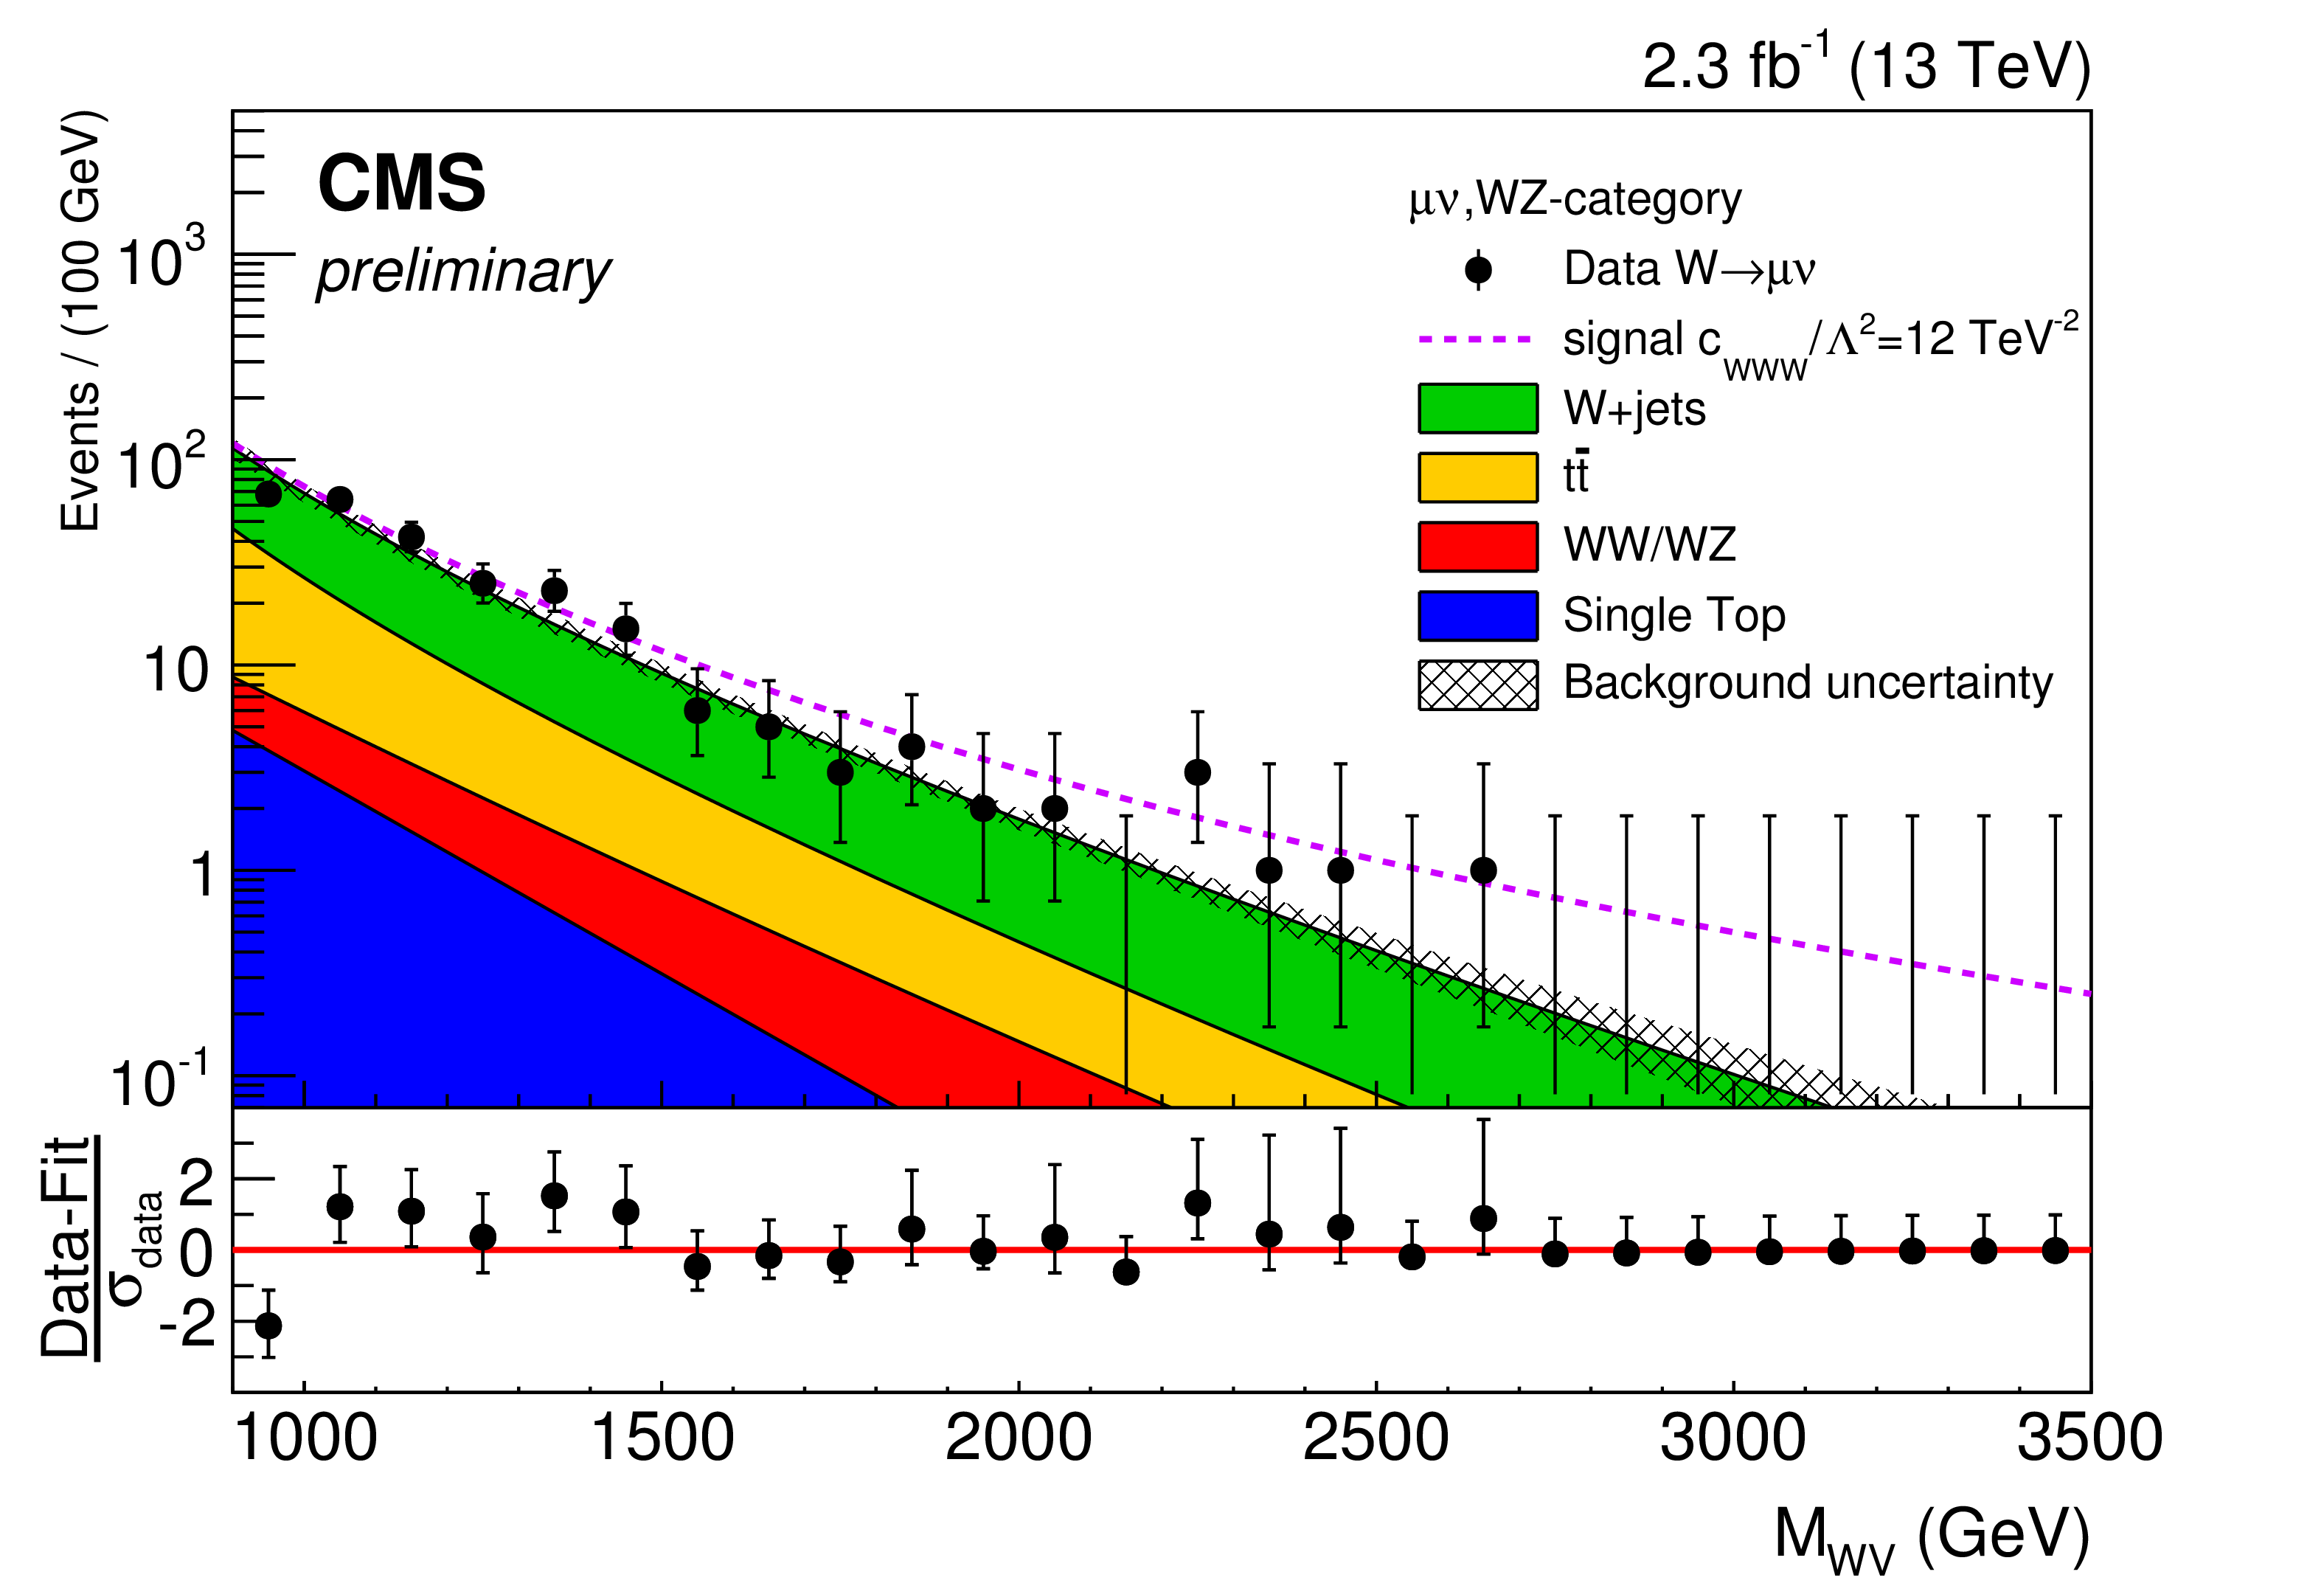
Figure 3-d:
Comparison of the $M_\mathrm{WV}$ distribution in the data and background estimate for the electron (a,c) and muon channel (b,d) in the WW- (a,b) and WZ-category (c,d). The pink line represents the sum of the backgrounds and a signal with an aTGC value of $c_{\mathrm{WWW}}=$ 12 TeV$^{-2}$. Each figure also shows the difference between data and the SM prediction, divided by the statistical uncertainty of the data-points. |

png pdf |
Figure 4-a:
Two dimensional limits on the aTGC-parameters. Shown are the expected contours for 68% C.L. (blue), 95% C.L. (green) and 99% C.L. (red), for $\frac {c_{\mathrm{WWW}}}{\Lambda ^2}-\frac {c_\mathrm{W}}{\Lambda ^2}$ (a), $\frac {c_{\mathrm{WWW}}}{\Lambda ^2}-\frac {c_\mathrm{B}}{\Lambda ^2}$ (b) and $\frac {c_\mathrm{W}}{\Lambda ^2}-\frac {c_\mathrm{B}}{\Lambda ^2}$ (c). The black line shows the region compatible with the observed data at 95% C.L. |

png pdf |
Figure 4-b:
Two dimensional limits on the aTGC-parameters. Shown are the expected contours for 68% C.L. (blue), 95% C.L. (green) and 99% C.L. (red), for $\frac {c_{\mathrm{WWW}}}{\Lambda ^2}-\frac {c_\mathrm{W}}{\Lambda ^2}$ (a), $\frac {c_{\mathrm{WWW}}}{\Lambda ^2}-\frac {c_\mathrm{B}}{\Lambda ^2}$ (b) and $\frac {c_\mathrm{W}}{\Lambda ^2}-\frac {c_\mathrm{B}}{\Lambda ^2}$ (c). The black line shows the region compatible with the observed data at 95% C.L. |
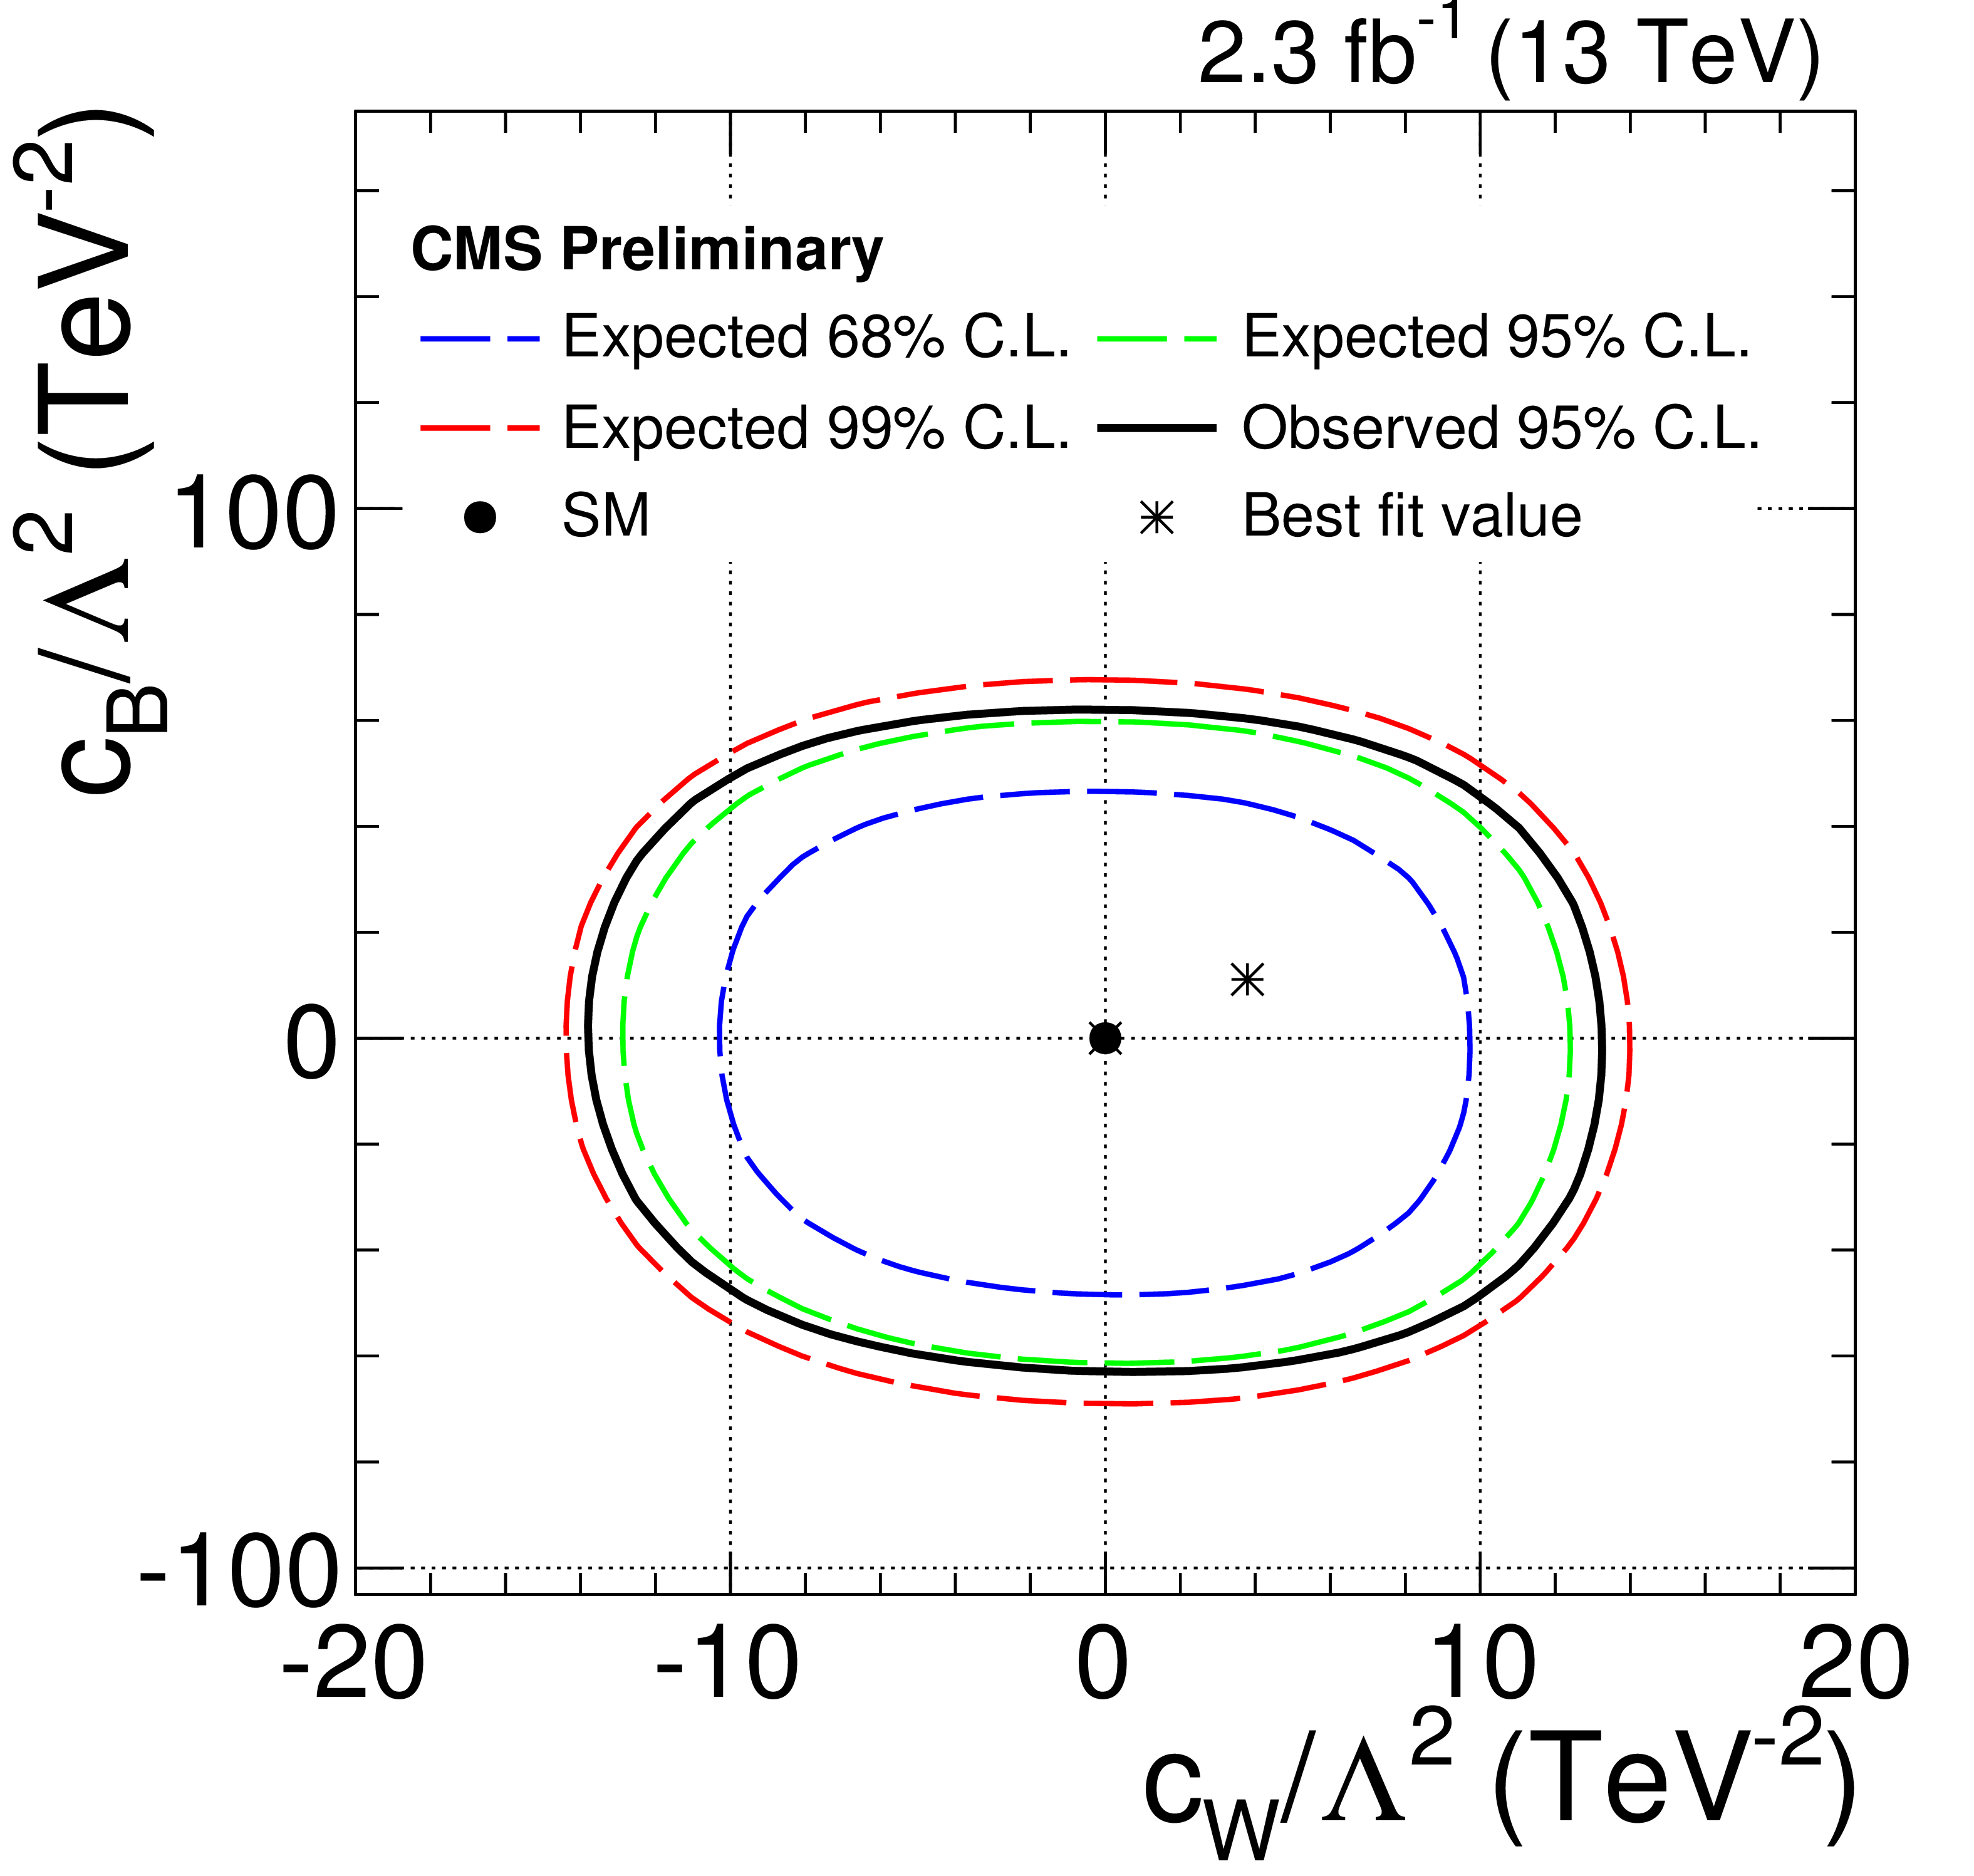
png pdf |
Figure 4-c:
Two dimensional limits on the aTGC-parameters. Shown are the expected contours for 68% C.L. (blue), 95% C.L. (green) and 99% C.L. (red), for $\frac {c_{\mathrm{WWW}}}{\Lambda ^2}-\frac {c_\mathrm{W}}{\Lambda ^2}$ (a), $\frac {c_{\mathrm{WWW}}}{\Lambda ^2}-\frac {c_\mathrm{B}}{\Lambda ^2}$ (b) and $\frac {c_\mathrm{W}}{\Lambda ^2}-\frac {c_\mathrm{B}}{\Lambda ^2}$ (c). The black line shows the region compatible with the observed data at 95% C.L. |
| Tables | |

png pdf |
Table 1:
Results of the fit to the ${M_\mathrm {pruned}}$ distributions in the range [40, 150] GeV. The pre- and post-fit yields are presented together with their constraints (pre-fit) and resulting total uncertainties (post-fit). The W+jets contribution is allowed to float in the fit, therefore the prefit values do not have any constraint shown. The single top contribution is fixed in the fit. |

png pdf |
Table 2:
Estimated normalization uncertainties in % for MC derived contributions. Uncertainties smaller than 0.05% for all processes are not listed. |
png pdf |
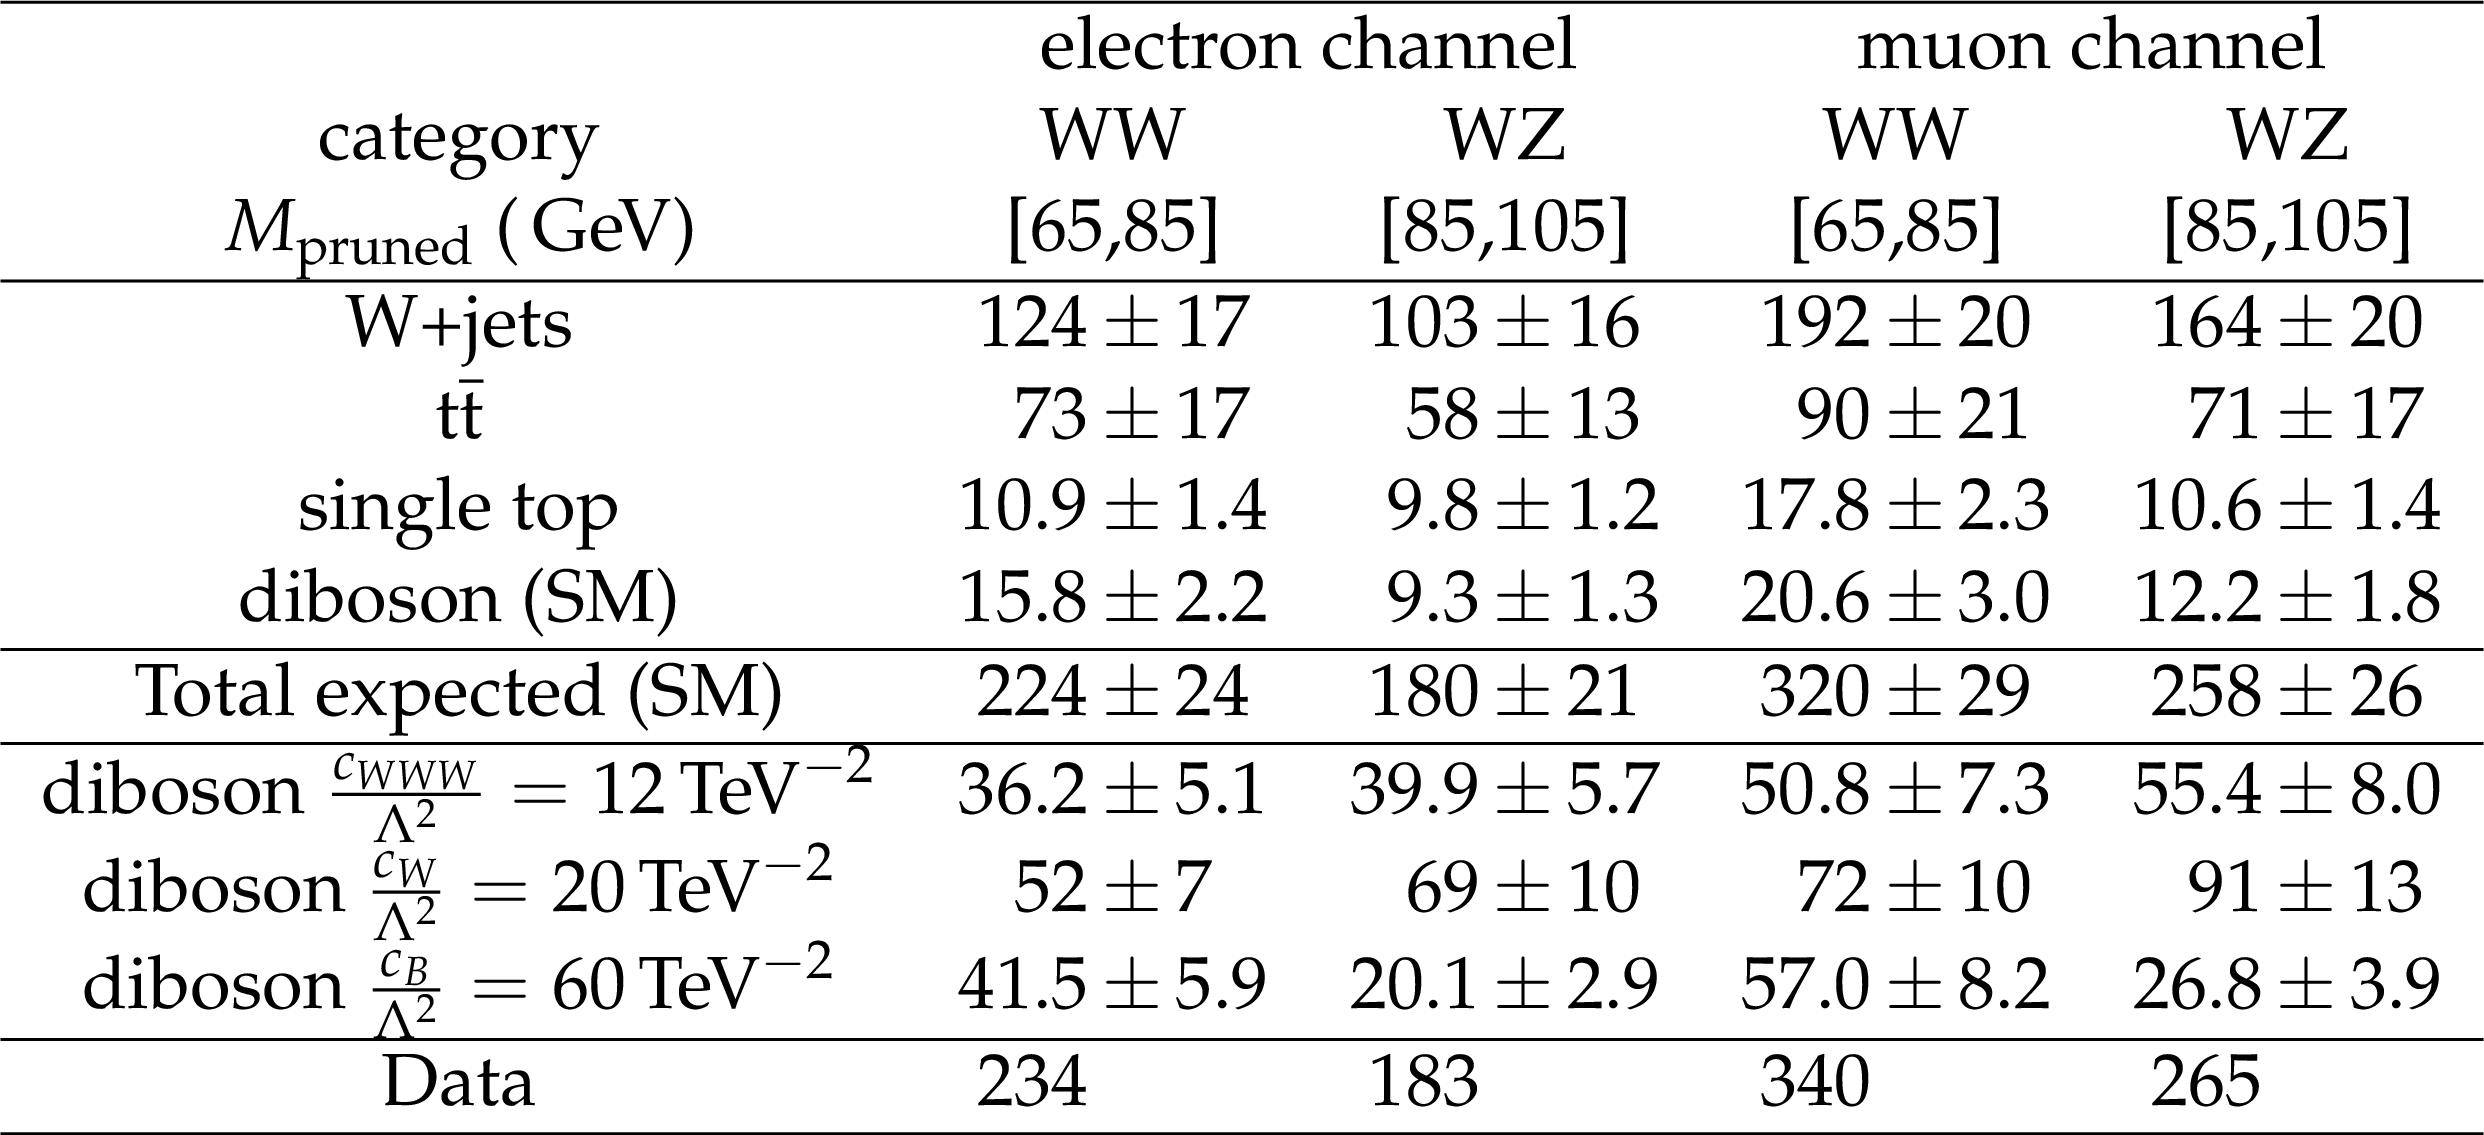
Table 3:
Summary of background and signal yields in WW- and WZ-categories. Uncertainties for the single-top, diboson and ${\mathrm {t}\overline {\mathrm {t}}}$ contributions are evaluated as described in section 6, while the uncertainty on W+jets is derived from the statistical uncertainty of the ${M_\mathrm {pruned}}$-fit and the fit with the alternative function. |

png pdf |
Table 4:
Expected and observed limits at 95% C.L. on single anomalous couplings (other couplings set to zero). |
| Summary |
| While the current limits cannot supersede the results from the LHC Run I [3], it is expected that limits will substantially improve with accumulating luminosity. |
| Additional Figures | |

png pdf |
Additional Figure 1-a:
The transfer function $\alpha $ used to transport the W+jets background from the sideband to the signal region for the WW-category (a,b) and the WZ-category (c,d) in the electron- (a,c) and muon-channel (b,d). The green shaded bands show the uncertainty on $\alpha $ as obtained from the covariance matrix of the simultaneous fit in the W+jets simulation in the signal and sideband regions. The red and blue lines show the functions $F_{\mathrm{W}+\text{jets}}^{\text{SR,MC}}$ and $F_{\mathrm{W}+\text{jets}}^{SB,MC}$, respectively. The left $y$-axis corresponds to the functions $F_{\mathrm{W}+\text{jets}}^{\text{SR,MC}}$ and $F_{\mathrm{W}+\text{jets}}^{\text{SB,MC}}$, while the right $y$-axis corresponds to the transfer function $\alpha $. |

png pdf |
Additional Figure 1-b:
The transfer function $\alpha $ used to transport the W+jets background from the sideband to the signal region for the WW-category (a,b) and the WZ-category (c,d) in the electron- (a,c) and muon-channel (b,d). The green shaded bands show the uncertainty on $\alpha $ as obtained from the covariance matrix of the simultaneous fit in the W+jets simulation in the signal and sideband regions. The red and blue lines show the functions $F_{\mathrm{W}+\text{jets}}^{\text{SR,MC}}$ and $F_{\mathrm{W}+\text{jets}}^{SB,MC}$, respectively. The left $y$-axis corresponds to the functions $F_{\mathrm{W}+\text{jets}}^{\text{SR,MC}}$ and $F_{\mathrm{W}+\text{jets}}^{\text{SB,MC}}$, while the right $y$-axis corresponds to the transfer function $\alpha $. |

png pdf |
Additional Figure 1-c:
The transfer function $\alpha $ used to transport the W+jets background from the sideband to the signal region for the WW-category (a,b) and the WZ-category (c,d) in the electron- (a,c) and muon-channel (b,d). The green shaded bands show the uncertainty on $\alpha $ as obtained from the covariance matrix of the simultaneous fit in the W+jets simulation in the signal and sideband regions. The red and blue lines show the functions $F_{\mathrm{W}+\text{jets}}^{\text{SR,MC}}$ and $F_{\mathrm{W}+\text{jets}}^{SB,MC}$, respectively. The left $y$-axis corresponds to the functions $F_{\mathrm{W}+\text{jets}}^{\text{SR,MC}}$ and $F_{\mathrm{W}+\text{jets}}^{\text{SB,MC}}$, while the right $y$-axis corresponds to the transfer function $\alpha $. |

png pdf |
Additional Figure 1-d:
The transfer function $\alpha $ used to transport the W+jets background from the sideband to the signal region for the WW-category (a,b) and the WZ-category (c,d) in the electron- (a,c) and muon-channel (b,d). The green shaded bands show the uncertainty on $\alpha $ as obtained from the covariance matrix of the simultaneous fit in the W+jets simulation in the signal and sideband regions. The red and blue lines show the functions $F_{\mathrm{W}+\text{jets}}^{\text{SR,MC}}$ and $F_{\mathrm{W}+\text{jets}}^{SB,MC}$, respectively. The left $y$-axis corresponds to the functions $F_{\mathrm{W}+\text{jets}}^{\text{SR,MC}}$ and $F_{\mathrm{W}+\text{jets}}^{\text{SB,MC}}$, while the right $y$-axis corresponds to the transfer function $\alpha $. |

png pdf |
Additional Figure 2-a:
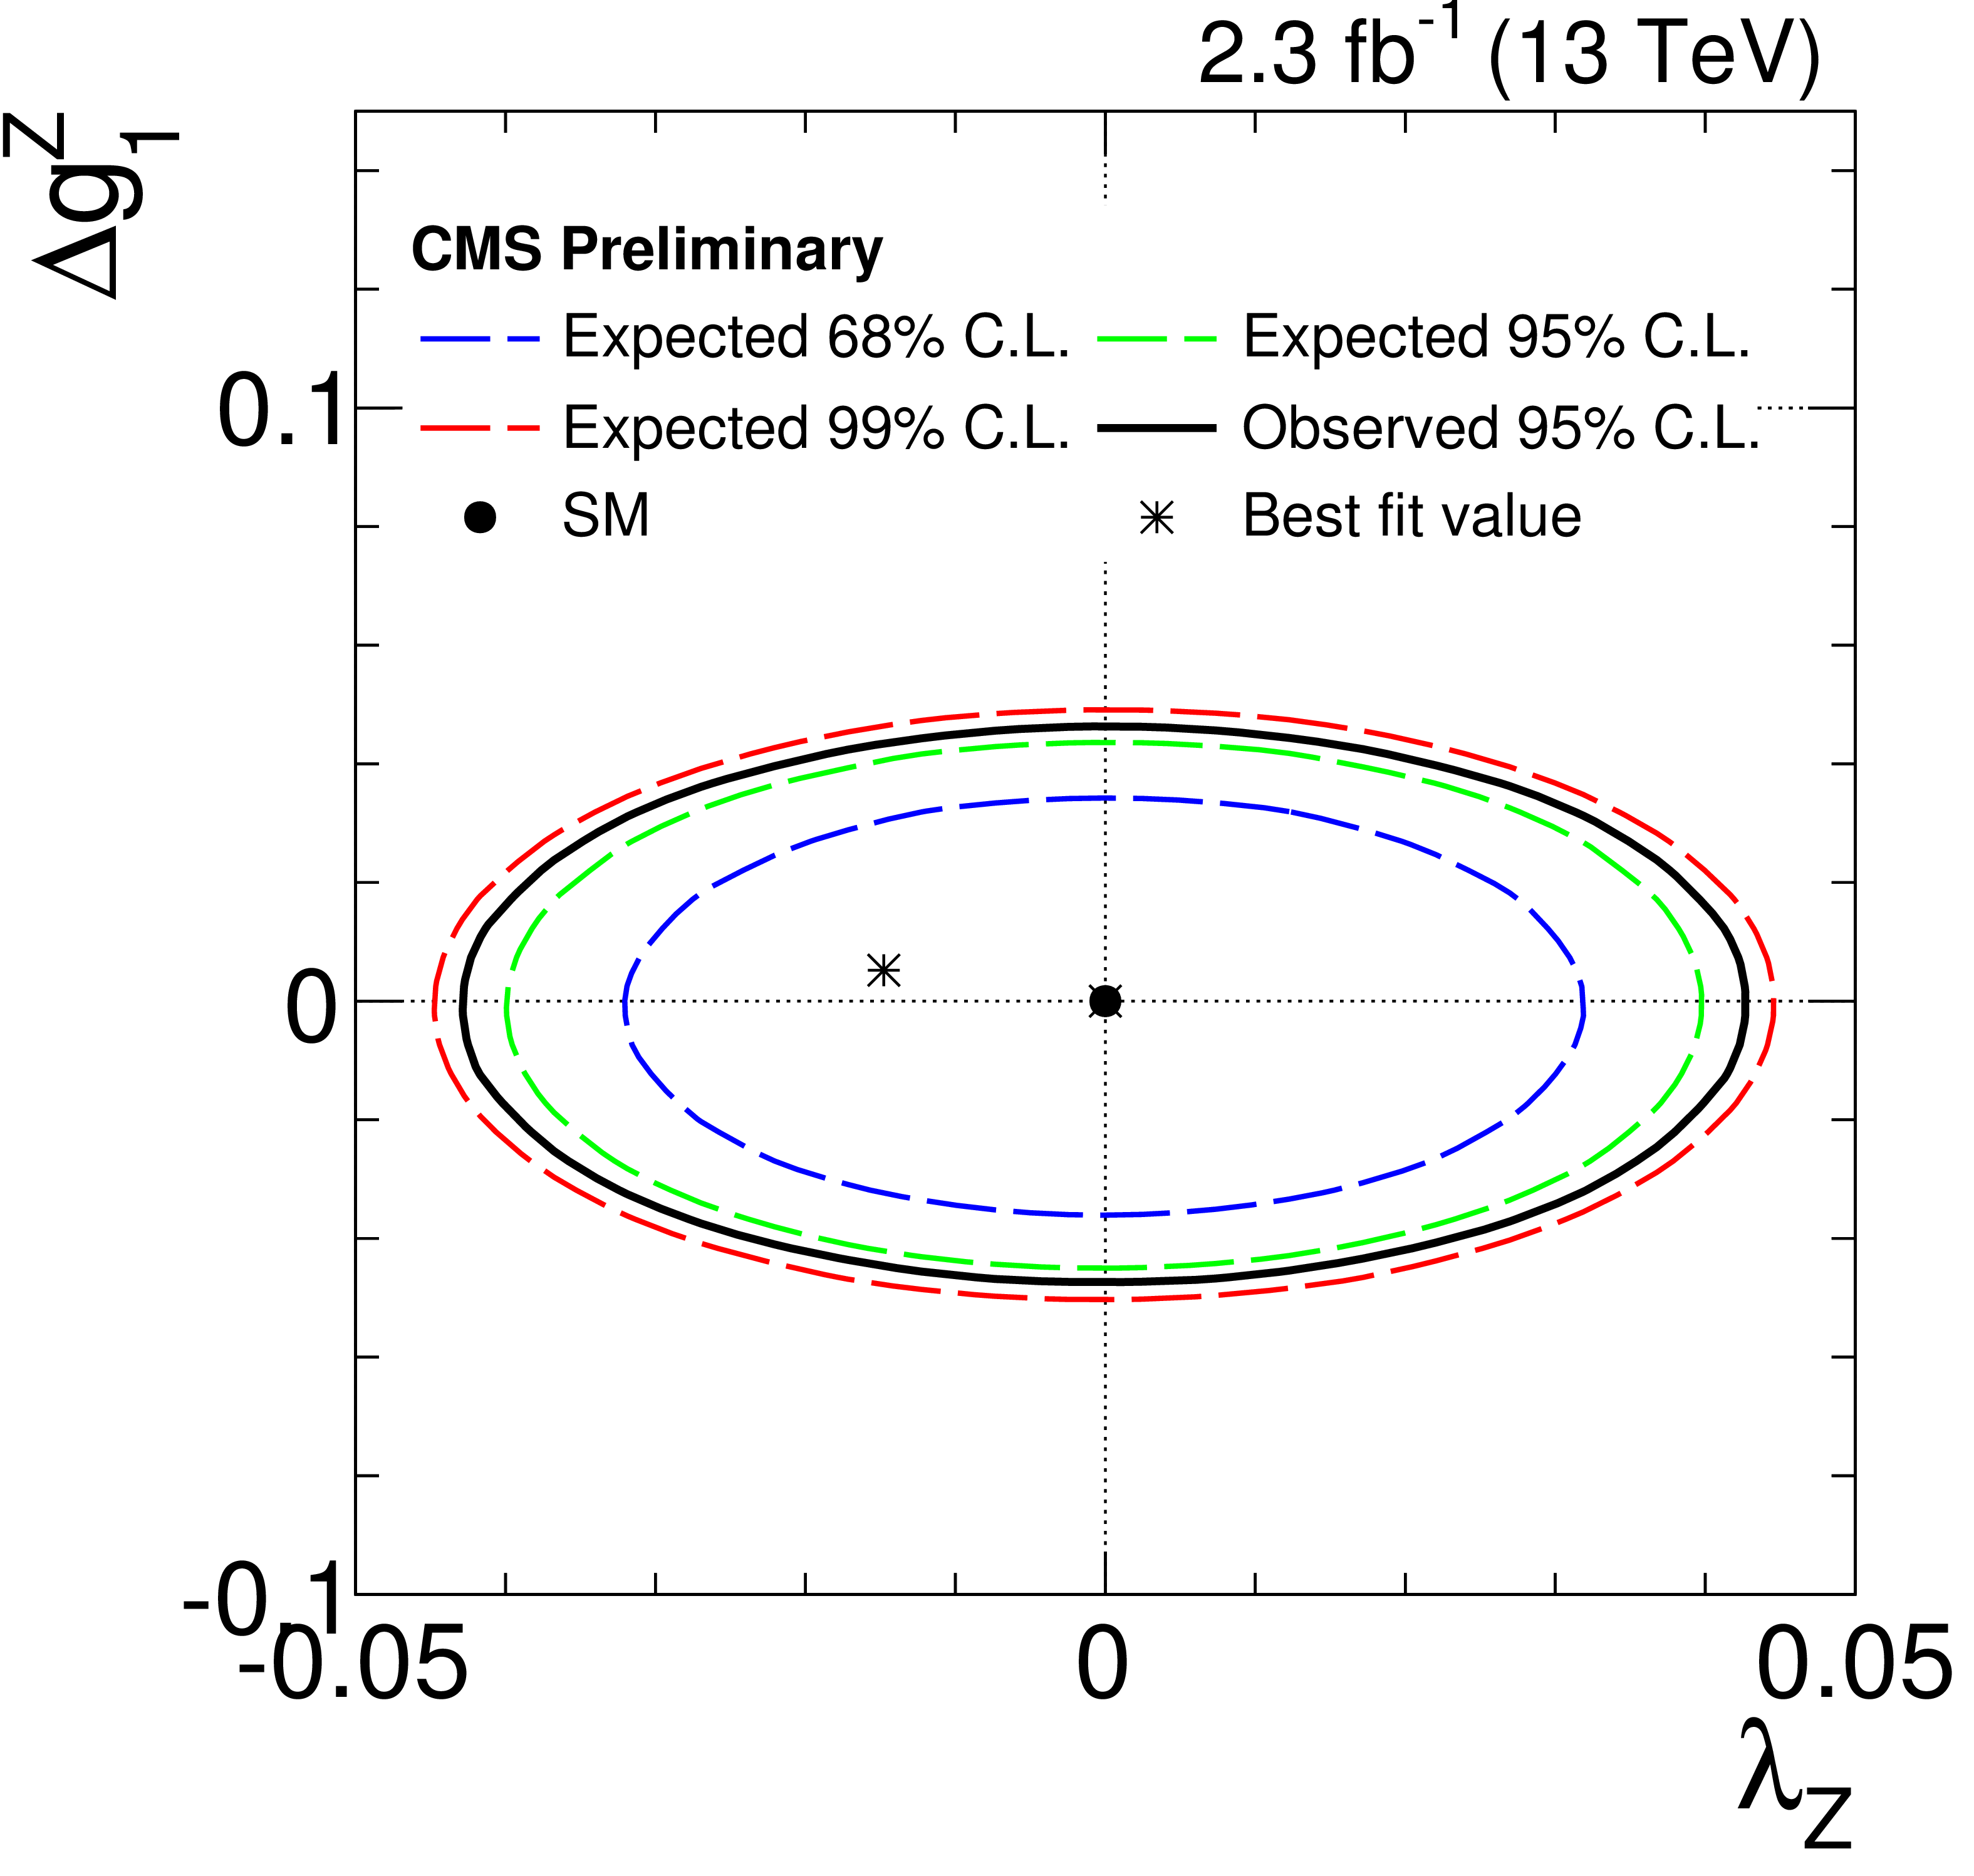
Two dimensional limits on the aTGC-parameters in the vertex parameterization. Shown are the expeted contours for 68% C.L. (blue), 95% C.L. (green) and 99% C.L. (red), for $\lambda _{\mathrm{Z}} - \Delta \kappa _{\mathrm{Z}}$ (a), $\lambda _{\mathrm{Z}} - \Delta g_1^{\mathrm{Z}}$(center) and$\Delta \kappa _{\mathrm{Z}} - \Delta g_1^{\mathrm{Z}}$ (b). The black line shows the region compatible with the observed data at 95% C.L. |
png pdf |
Additional Figure 2-b:
Two dimensional limits on the aTGC-parameters in the vertex parameterization. Shown are the expeted contours for 68% C.L. (blue), 95% C.L. (green) and 99% C.L. (red), for $\lambda _{\mathrm{Z}} - \Delta \kappa _{\mathrm{Z}}$ (a), $\lambda _{\mathrm{Z}} - \Delta g_1^{\mathrm{Z}}$(center) and$\Delta \kappa _{\mathrm{Z}} - \Delta g_1^{\mathrm{Z}}$ (b). The black line shows the region compatible with the observed data at 95% C.L. |
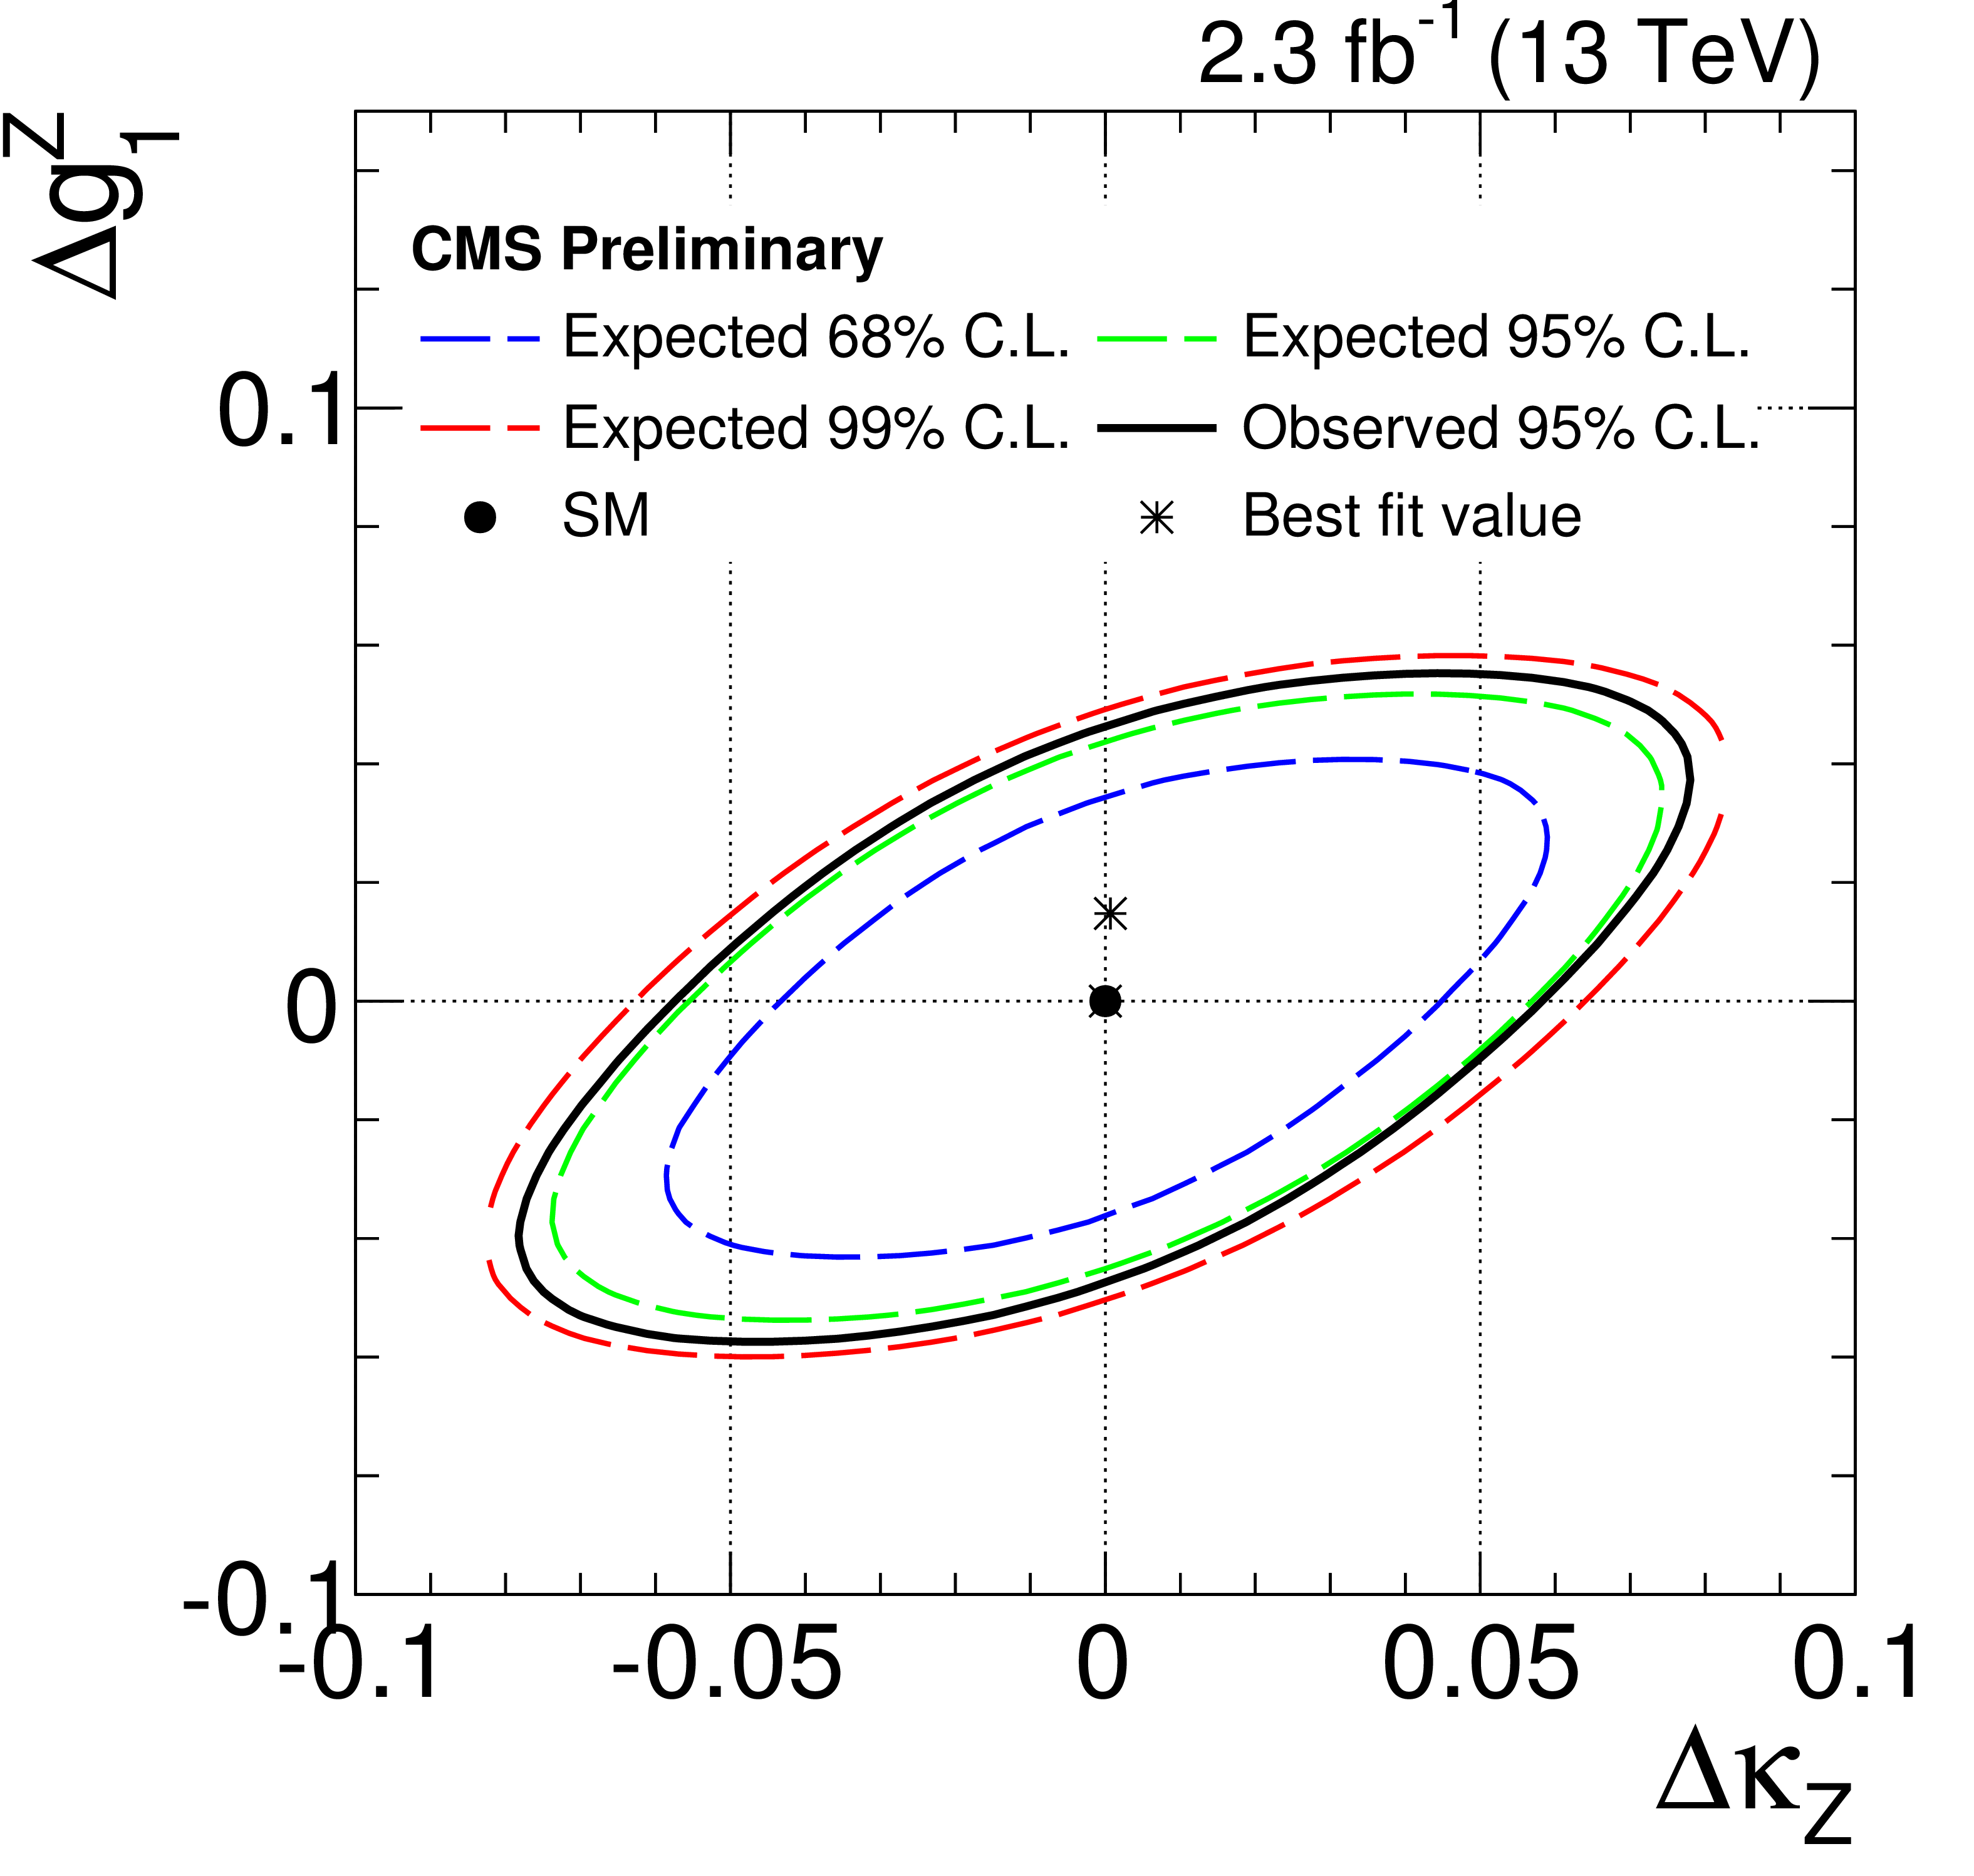
png pdf |
Additional Figure 2-c:
Two dimensional limits on the aTGC-parameters in the vertex parameterization. Shown are the expeted contours for 68% C.L. (blue), 95% C.L. (green) and 99% C.L. (red), for $\lambda _{\mathrm{Z}} - \Delta \kappa _{\mathrm{Z}}$ (a), $\lambda _{\mathrm{Z}} - \Delta g_1^{\mathrm{Z}}$(center) and$\Delta \kappa _{\mathrm{Z}} - \Delta g_1^{\mathrm{Z}}$ (b). The black line shows the region compatible with the observed data at 95% C.L. |
| References | ||||
| 1 | C. Degrande et al. | Effective Field Theory: A Modern Approach to Anomalous Couplings | Annals Phys. 335 (2013) 21 | 1205.4231 |
| 2 | CMS Collaboration | Measurement of the $ W^+W^- $ Cross section in $ pp $ Collisions at $ \sqrt{s} = 7 $ TeV and Limits on Anomalous $ WW\gamma $ and $ WWZ $ couplings | EPJC 73 (2013), no. 10 | CMS-SMP-12-005 1306.1126 |
| 3 | CMS Collaboration | Measurement of the $ {{\mathrm{W} }^{+} }\mathrm{W}^{-} $ cross section in pp collisions at $ \sqrt{s} = 8 $ TeV and limits on anomalous gauge couplings | EPJC 76 (2016), no. 7, 401 | CMS-SMP-14-016 1507.03268 |
| 4 | ATLAS Collaboration | Measurement of total and differential $ W^+W^- $ production cross sections in proton-proton collisions at $ \sqrt{s}= $ 8 TeV with the ATLAS detector and limits on anomalous triple-gauge-boson couplings | 1603.01702 | |
| 5 | ATLAS Collaboration | Measurements of $ W^\pm Z $ production cross sections in $ pp $ collisions at $ \sqrt{s} = 8 $ TeV with the ATLAS detector and limits on anomalous gauge boson self-couplings | PRD 93 (2016), no. 9, 092004 | 1603.02151 |
| 6 | ATLAS Collaboration | Measurement of $ W^+W^- $ production in pp collisions at $ \sqrt{s} $=7 TeV with the ATLAS detector and limits on anomalous WWZ and WW$ \gamma $ couplings | PRD 87 (2013), no. 11, 112001, , [Erratum: Phys. Rev.D88,no.7,079906(2013)] | 1210.2979 |
| 7 | ATLAS Collaboration | Measurement of the $ WW+WZ $ cross section and limits on anomalous triple gauge couplings using final states with one lepton, missing transverse momentum, and two jets with the ATLAS detector at $ \sqrt{\rm{s}} = 7 $ TeV | JHEP 01 (2015) 049 | 1410.7238 |
| 8 | CMS Collaboration | Measurement of the sum of $ W W $ and $ WZ $ production with $ W+ $dijet events in $ pp $ collisions at $ \sqrt{s}=7 $ TeV | EPJC 73 (2013), no. 2 | CMS-SMP-12-015 1210.7544 |
| 9 | CMS Collaboration | Search for massive resonances decaying into pairs of boosted W and Z bosons at $ \sqrt{s} = $ 13 TeV | CMS-PAS-EXO-15-002 | CMS-PAS-EXO-15-002 |
| 10 | J. Alwall et al. | The automated computation of tree-level and next-to-leading order differential cross sections, and their matching to parton shower simulations | JHEP 07 (2014) 079 | 1405.0301 |
| 11 | NNPDF Collaboration | Parton distributions for the LHC Run II | JHEP 04 (2015) 040 | 1410.8849 |
| 12 | P. Nason | A New method for combining NLO QCD with shower Monte Carlo algorithms | JHEP 11 (2004) 040 | hep-ph/0409146 |
| 13 | S. Frixione, P. Nason, and C. Oleari | Matching NLO QCD computations with Parton Shower simulations: the POWHEG method | JHEP 11 (2007) 070 | 0709.2092 |
| 14 | S. Alioli, P. Nason, C. Oleari, and E. Re | A general framework for implementing NLO calculations in shower Monte Carlo programs: the POWHEG BOX | JHEP 06 (2010) 043 | 1002.2581 |
| 15 | S. Alioli, P. Nason, C. Oleari, and E. Re | NLO single-top production matched with shower in POWHEG: s- and t-channel contributions | JHEP 09 (2009) 111, , [Erratum: JHEP02,011(2010)] | 0907.4076 |
| 16 | E. Re | Single-top Wt-channel production matched with parton showers using the POWHEG method | EPJC 71 (2011) 1547 | 1009.2450 |
| 17 | S. Alioli, S.-O. Moch, and P. Uwer | Hadronic top-quark pair-production with one jet and parton showering | JHEP 01 (2012) 137 | 1110.5251 |
| 18 | T. Sj\"ostrand, S. Mrenna, and P. Skands | PYTHIA 6.4 physics and manual | JHEP 05 (2006) 026 | hep-ph/0603175 |
| 19 | T. Sjostrand, S. Mrenna, and P. Z. Skands | A Brief Introduction to PYTHIA 8.1 | CPC 178 (2008) 852 | 0710.3820 |
| 20 | P. Skands, S. Carrazza, and J. Rojo | Tuning PYTHIA 8.1: the Monash 2013 Tune | EPJC 74 (2014), no. 8 | 1404.5630 |
| 21 | CMS Collaboration | Event generator tunes obtained from underlying event and multiparton scattering measurements | EPJC 76 (2016), no. 3, 155 | CMS-GEN-14-001 1512.00815 |
| 22 | J. M. Campbell, R. K. Ellis, and D. L. Rainwater | Next-to-leading order QCD predictions for $ W $ + 2 jet and $ Z $ + 2 jet production at the CERN LHC | PRD 68 (2003) 094021 | hep-ph/0308195 |
| 23 | J. M. Campbell, R. K. Ellis, and F. Tramontano | Single top production and decay at next-to-leading order | PRD 70 (2004) 094012 | hep-ph/0408158 |
| 24 | M. Czakon and A. Mitov | Top++: A Program for the Calculation of the Top-Pair Cross-Section at Hadron Colliders | CPC 185 (2014) 2930 | 1112.5675 |
| 25 | M. Grazzini, S. Kallweit, D. Rathlev, and M. Wiesemann | $ W^{\pm}Z $ production at hadron colliders in NNLO QCD | 1604.08576 | |
| 26 | T. Gehrmann et al. | $ W^+W^- $ Production at Hadron Colliders in Next to Next to Leading Order QCD | PRL 113 (2014), no. 21, 212001 | 1408.5243 |
| 27 | GEANT4 Collaboration | GEANT4: A Simulation toolkit | NIMA 506 (2003) 250 | |
| 28 | CMS Collaboration | Energy Calibration and Resolution of the CMS Electromagnetic Calorimeter in $ pp $ Collisions at $ \sqrt{s} = 7 $ TeV | JINST 8 (2013) P09009 | CMS-EGM-11-001 1306.2016 |
| 29 | CMS Collaboration | Performance of electron reconstruction and selection with the CMS detector in proton-proton collisions at $ \sqrt{s} = 8 $$ TeV $ | JINST 10 (2015) P06005 | CMS-EGM-13-001 1502.02701 |
| 30 | CMS Collaboration | Performance of CMS muon reconstruction in $ pp $ collision events at $ \sqrt{s}=7 $ TeV | JINST 7 (2012) P10002 | CMS-MUO-10-004 1206.4071 |
| 31 | CMS Collaboration | Particle-Flow Event Reconstruction in CMS and Performance for Jets, Taus, and MET | CDS | |
| 32 | CMS Collaboration | Commissioning of the Particle-flow Event Reconstruction with the first LHC collisions recorded in the CMS detector | CDS | |
| 33 | M. Cacciari, G. P. Salam, and G. Soyez | The anti-$ k_t $ jet clustering algorithm | JHEP 04 (2008) 063 | 0802.1189 |
| 34 | M. Cacciari, G. P. Salam, and G. Soyez | FastJet User Manual | EPJC 72 (2012) 1896 | 1111.6097 |
| 35 | CMS Collaboration | Jet energy scale and resolution in the CMS experiment in pp collisions at 8 TeV | CMS-JME-13-004 1607.03663 |
|
| 36 | CMS Collaboration | Identification of b quark jets at the CMS Experiment in the LHC Run 2 | CDS | |
| 37 | S. D. Ellis, C. K. Vermilion, and J. R. Walsh | Techniques for improved heavy particle searches with jet substructure | PRD 80 (2009) 051501 | 0903.5081 |
| 38 | S. D. Ellis, C. K. Vermilion, and J. R. Walsh | Recombination Algorithms and Jet Substructure: Pruning as a Tool for Heavy Particle Searches | PRD 81 (2010) 094023 | 0912.0033 |
| 39 | M. Wobisch and T. Wengler | Hadronization corrections to jet cross-sections in deep inelastic scattering | in Monte Carlo generators for HERA physics. Proceedings, Workshop, Hamburg, Germany, 1998-1999, p. 270 1998 | hep-ph/9907280 |
| 40 | J. Thaler and K. Van Tilburg | Identifying Boosted Objects with N-subjettiness | JHEP 03 (2011) 015 | 1011.2268 |
| 41 | CMS Collaboration | CMS Luminosity Measurement for the 2015 Data Taking Period | CMS-PAS-LUM-15-001 | CMS-PAS-LUM-15-001 |
| 42 | J. Butterworth et al. | PDF4LHC recommendations for LHC Run II | JPG 43 (2016) 023001 | 1510.03865 |
| 43 | CMS Collaboration | Identification of b quark jets at the CMS Experiment in the LHC Run 2 | CMS-PAS-BTV-15-001 | CMS-PAS-BTV-15-001 |
| 44 | ATLAS and CMS Collaborations Collaboration | Procedure for the LHC Higgs boson search combination in Summer 2011 | ATL-PHYS-PUB-2011-11, CMS NOTE-2011/005 (2011) | |
| 45 | R. Contino et al. | On the Validity of the Effective Field Theory Approach to SM Precision Tests | JHEP 07 (2016) 144 | 1604.06444 |
| 46 | K. Hagiwara, R. D. Peccei, D. Zeppenfeld, and K. Hikasa | Probing the Weak Boson Sector in $ e^+ e^- \rightarrow W^+ W^- $ | Nucl. Phys. B 282 (1987) 253 | |
|
|
Compact Muon Solenoid LHC, CERN |
|

|

|

|

|

|