

Compact Muon Solenoid
LHC, CERN
| CMS-PAS-SUS-16-029 | ||
| Search for direct top squark pair production in the fully hadronic final state in proton-proton collisions at $ \sqrt{s} = $ 13 TeV corresponding to an integrated luminosity of 12.9 fb$^{-1}$ | ||
| CMS Collaboration | ||
| August 2016 | ||
| Abstract: A search for direct production of top squark pairs in events with jets and large transverse momentum imbalance is presented. The data were collected in proton-proton collisions at a center-of-mass energy of 13 TeV and correspond to an integrated luminosity of 12.9 fb$^{-1}$. Two analyses are performed, a ``low $\Delta m$" analysis that targets scenarios with a very small difference in mass between the top squark and the neutralino, and a ``high $\Delta m$" analysis that targets topologies typical for larger mass splittings. No significant excess of events above the expected background from standard model processes is observed. Exclusion limits are set in the context of simplified models of top squark pair production under various decay hypotheses, ranging up to 860 GeV in the case of the high $\Delta m$ analysis and up to 450 GeV in the case of the low $\Delta m$ analysis. | ||
| Links: CDS record (PDF) ; inSPIRE record ; CADI line (restricted) ; | ||
| Figures | |
png pdf |
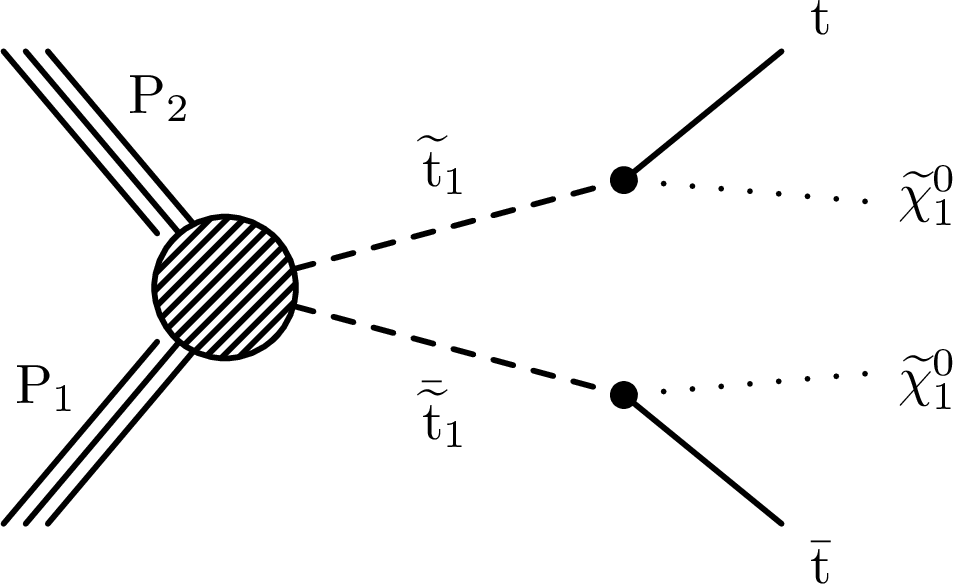
Figure 1-a:
Diagrams representing the pair production of top squarks and their subsequent decay modes that are studied in this document. |

png pdf |
Figure 1-b:
Diagrams representing the pair production of top squarks and their subsequent decay modes that are studied in this document. |

png pdf |
Figure 1-c:
Diagrams representing the pair production of top squarks and their subsequent decay modes that are studied in this document. |
png pdf |
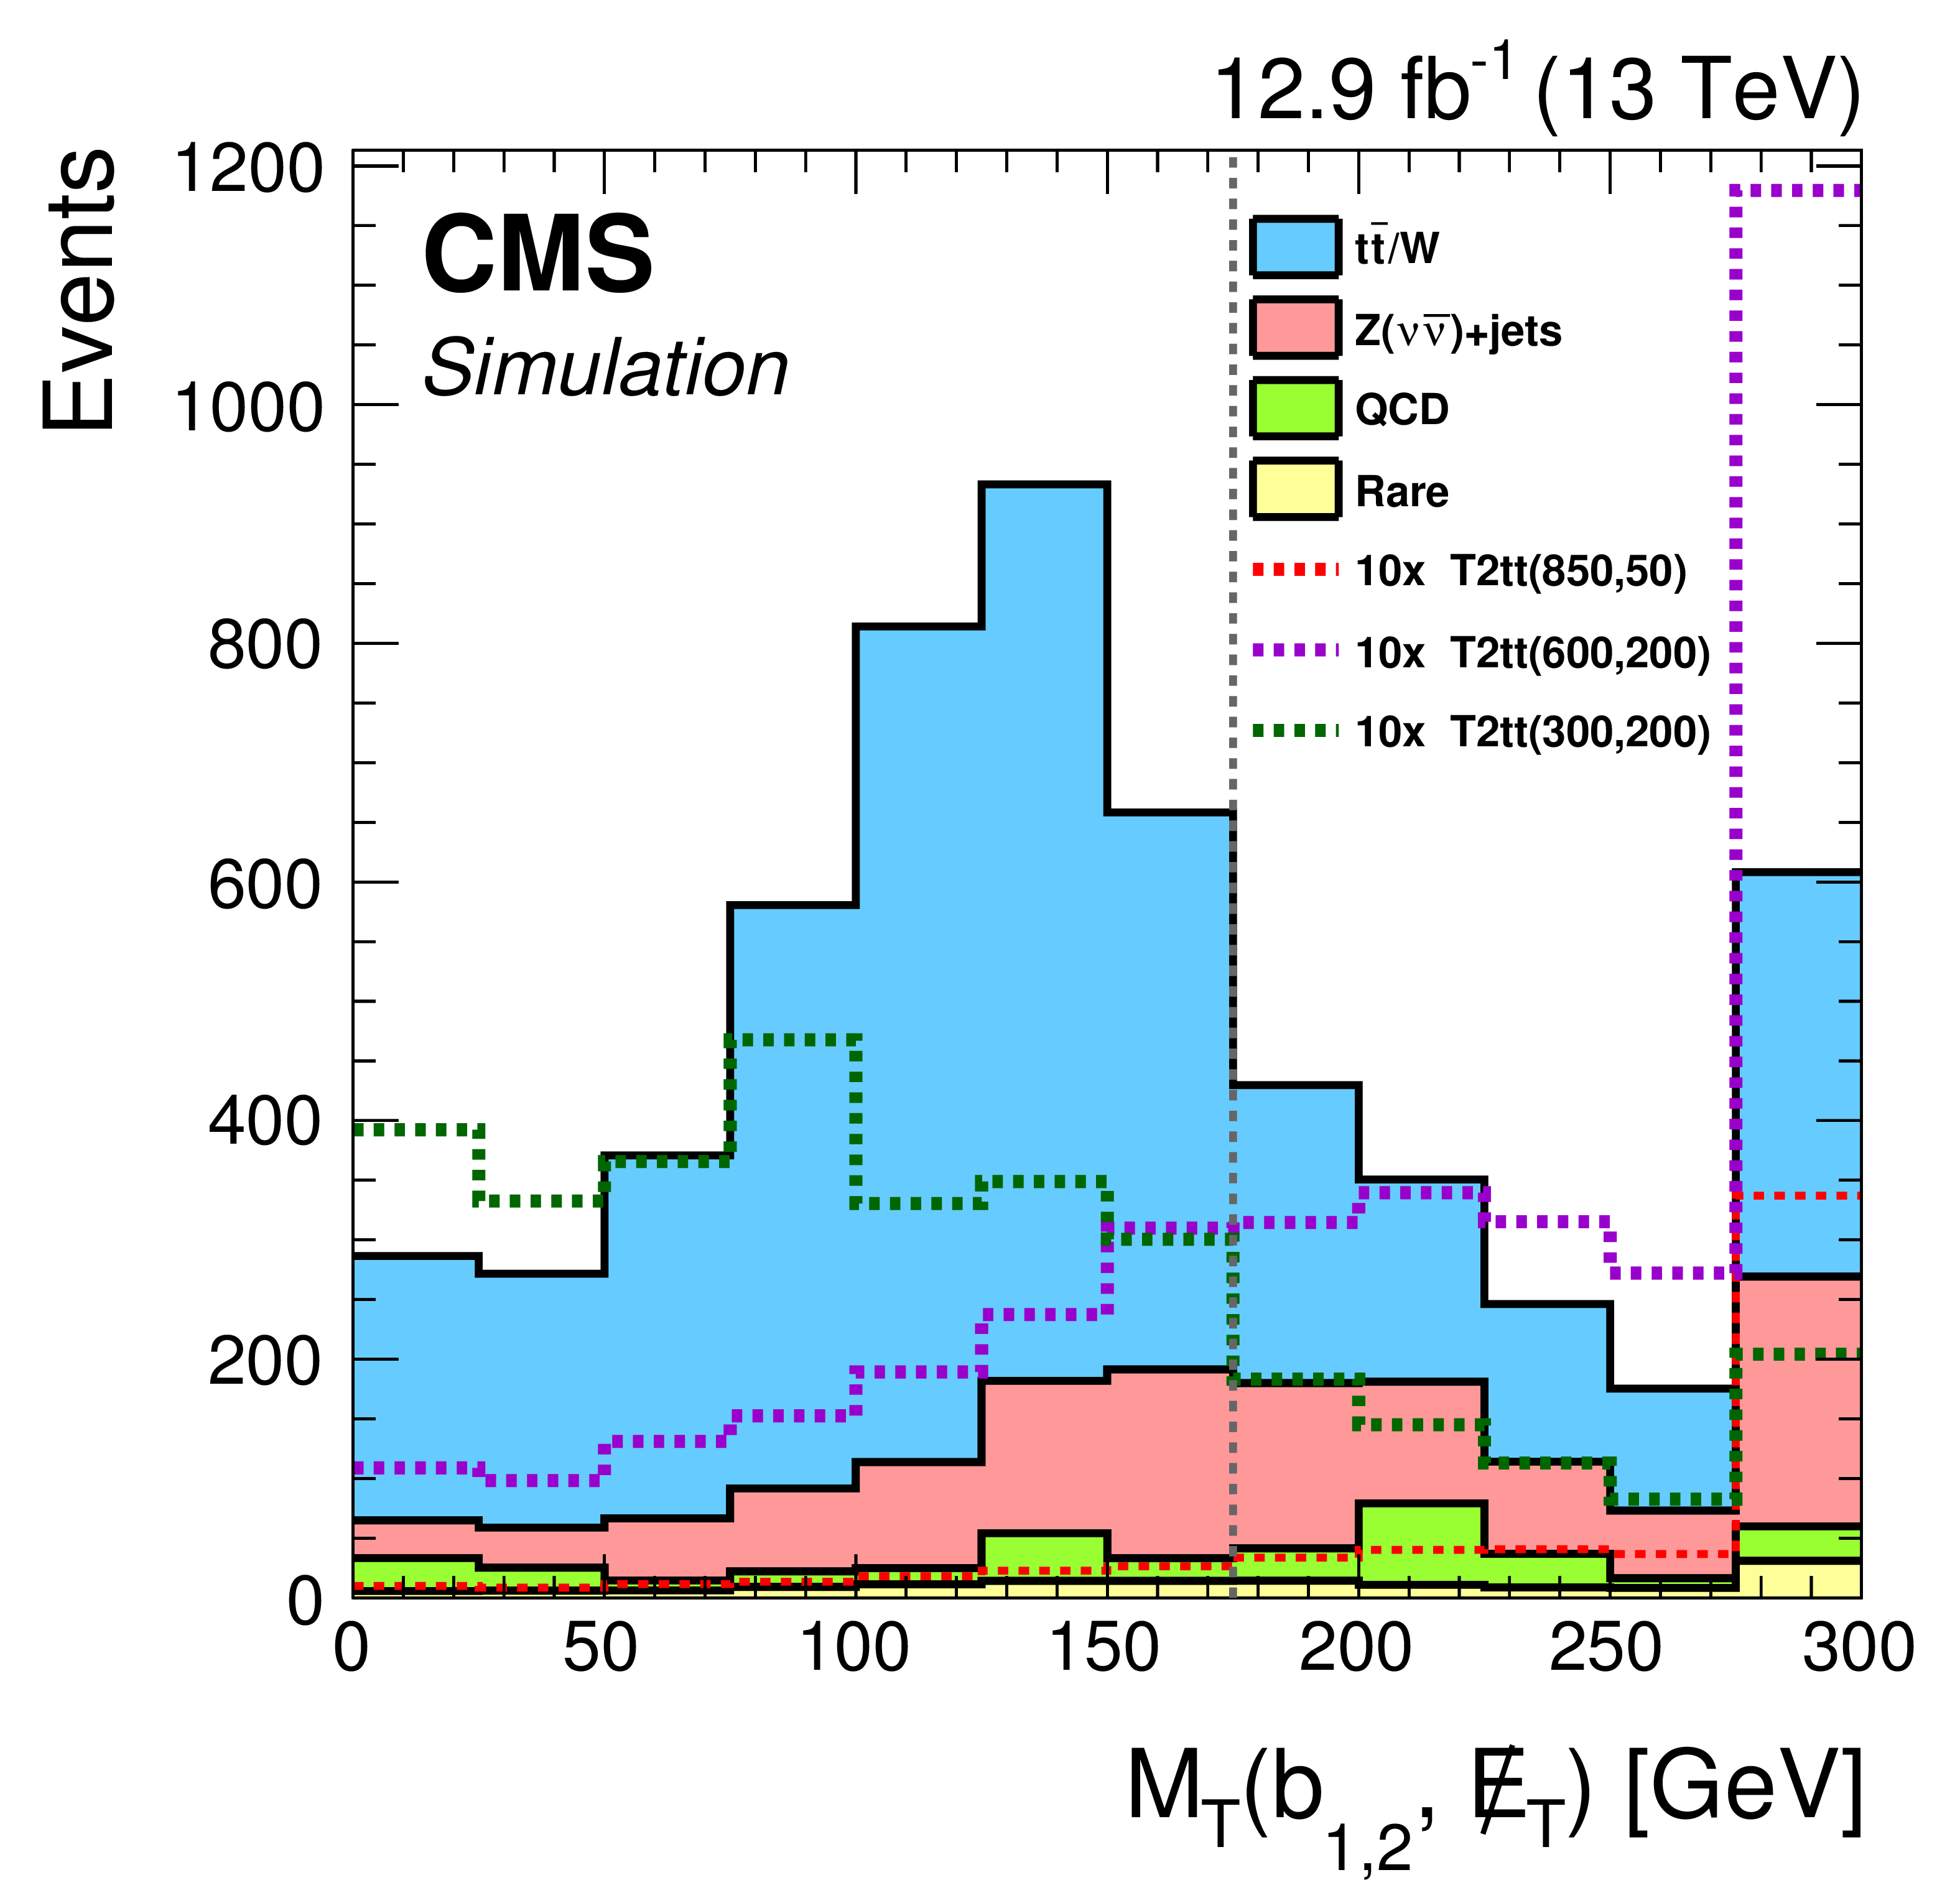
Figure 2:
$M_{\mathrm {T}}( {\mathrm {b}}_{1,2}$, ${E_{\mathrm {T}}^{\text {miss}}} )$ distribution after the high ${\Delta m}$ baseline selection for simulated events, normalized to an integrated luminosity of 12.9 fb$^{-1}$. The expected signal yields are scaled by a factor of ten to facilitate a comparison with the expected SM backgrounds. Events surviving the high ${\Delta m}$ baseline selection are separated into categories defined by $M_{\mathrm {T}}( {\mathrm {b}}_{1,2}$, ${E_{\mathrm {T}}^{\text {miss}}} ) < $ 175 GeV and $M_{\mathrm {T}}( {\mathrm {b}}_{1,2}$, ${E_{\mathrm {T}}^{\text {miss}}} )\geq $ 175 GeV. |
png pdf |
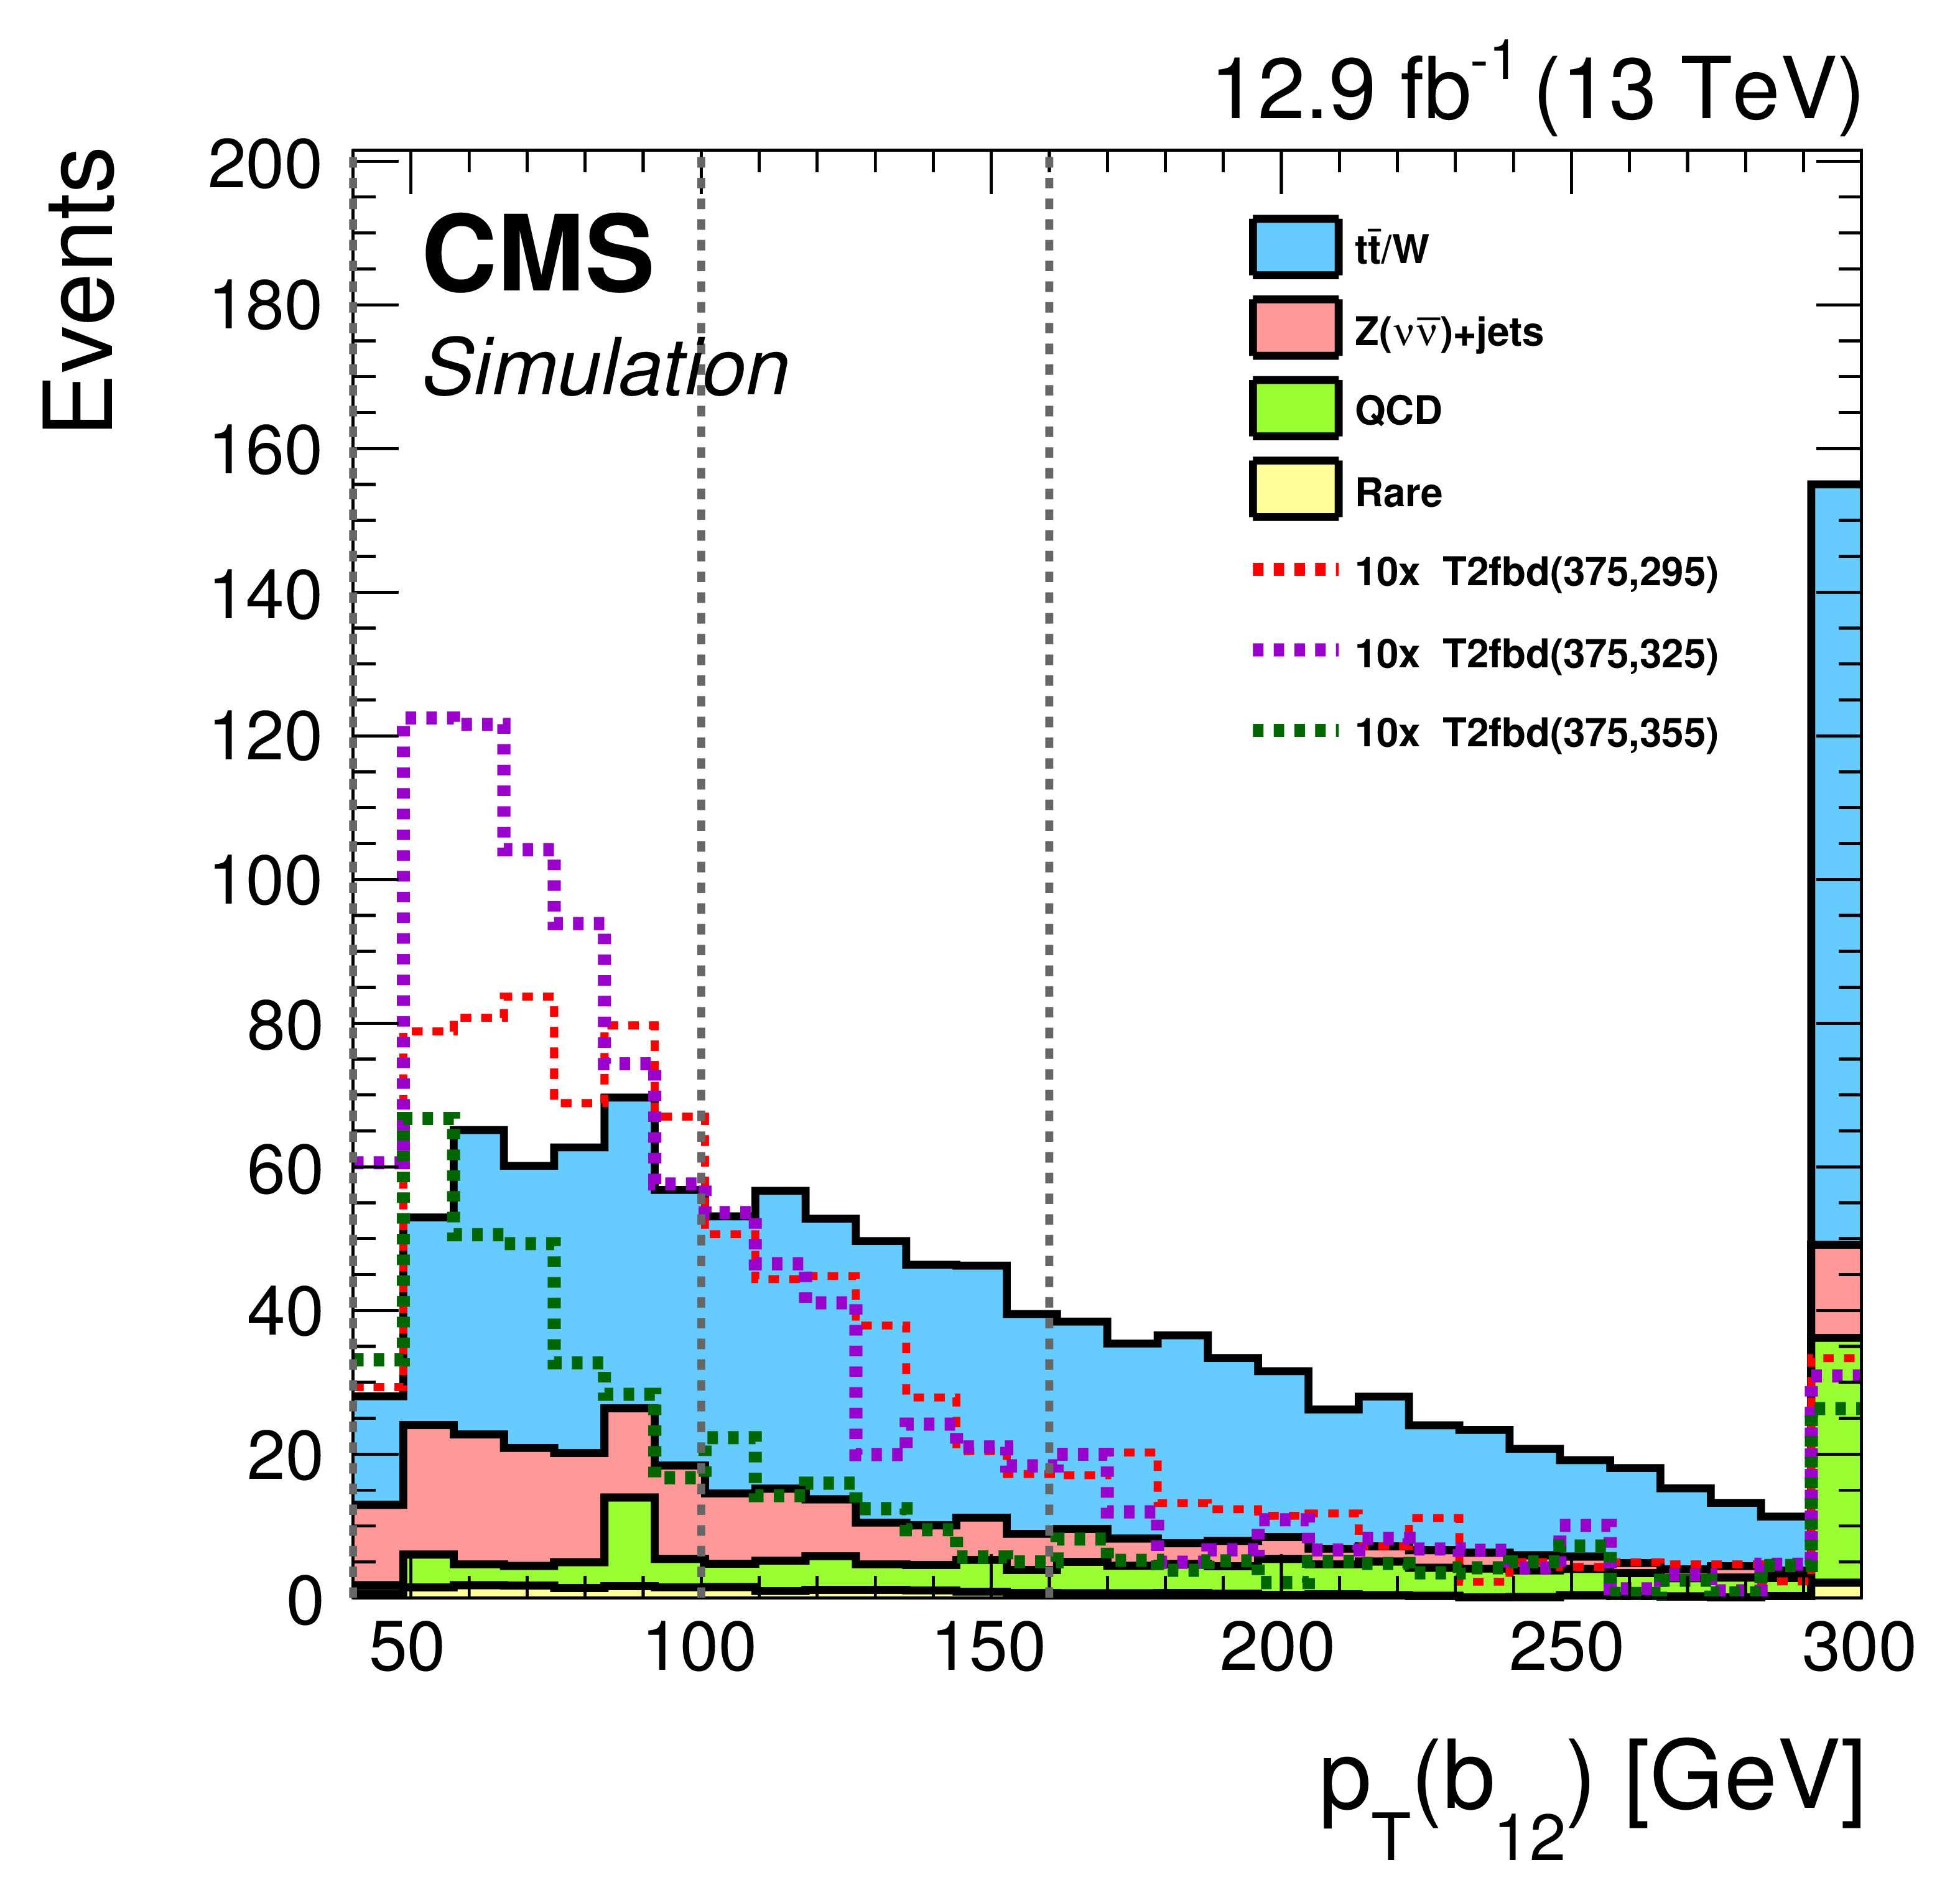
Figure 3:
$ { {p_{\mathrm {T}}} ( {\mathrm {b}}_{12})}$ distribution after the low ${\Delta m}$ baseline selection in the two b-tag category for simulated events, normalized to an integrated luminosity of 12.9 fb$^{-1}$. The expected signal yields are scaled by a factor of ten to facilitate a comparison with the expected SM backgrounds. Events entering the two b-tag category of the low ${\Delta m}$ analysis are subdivided into categories defined by $ { {p_{\mathrm {T}}} ( {\mathrm {b}}_{12})}\in [40, 100), [100, 160)$ GeV. |
png pdf |
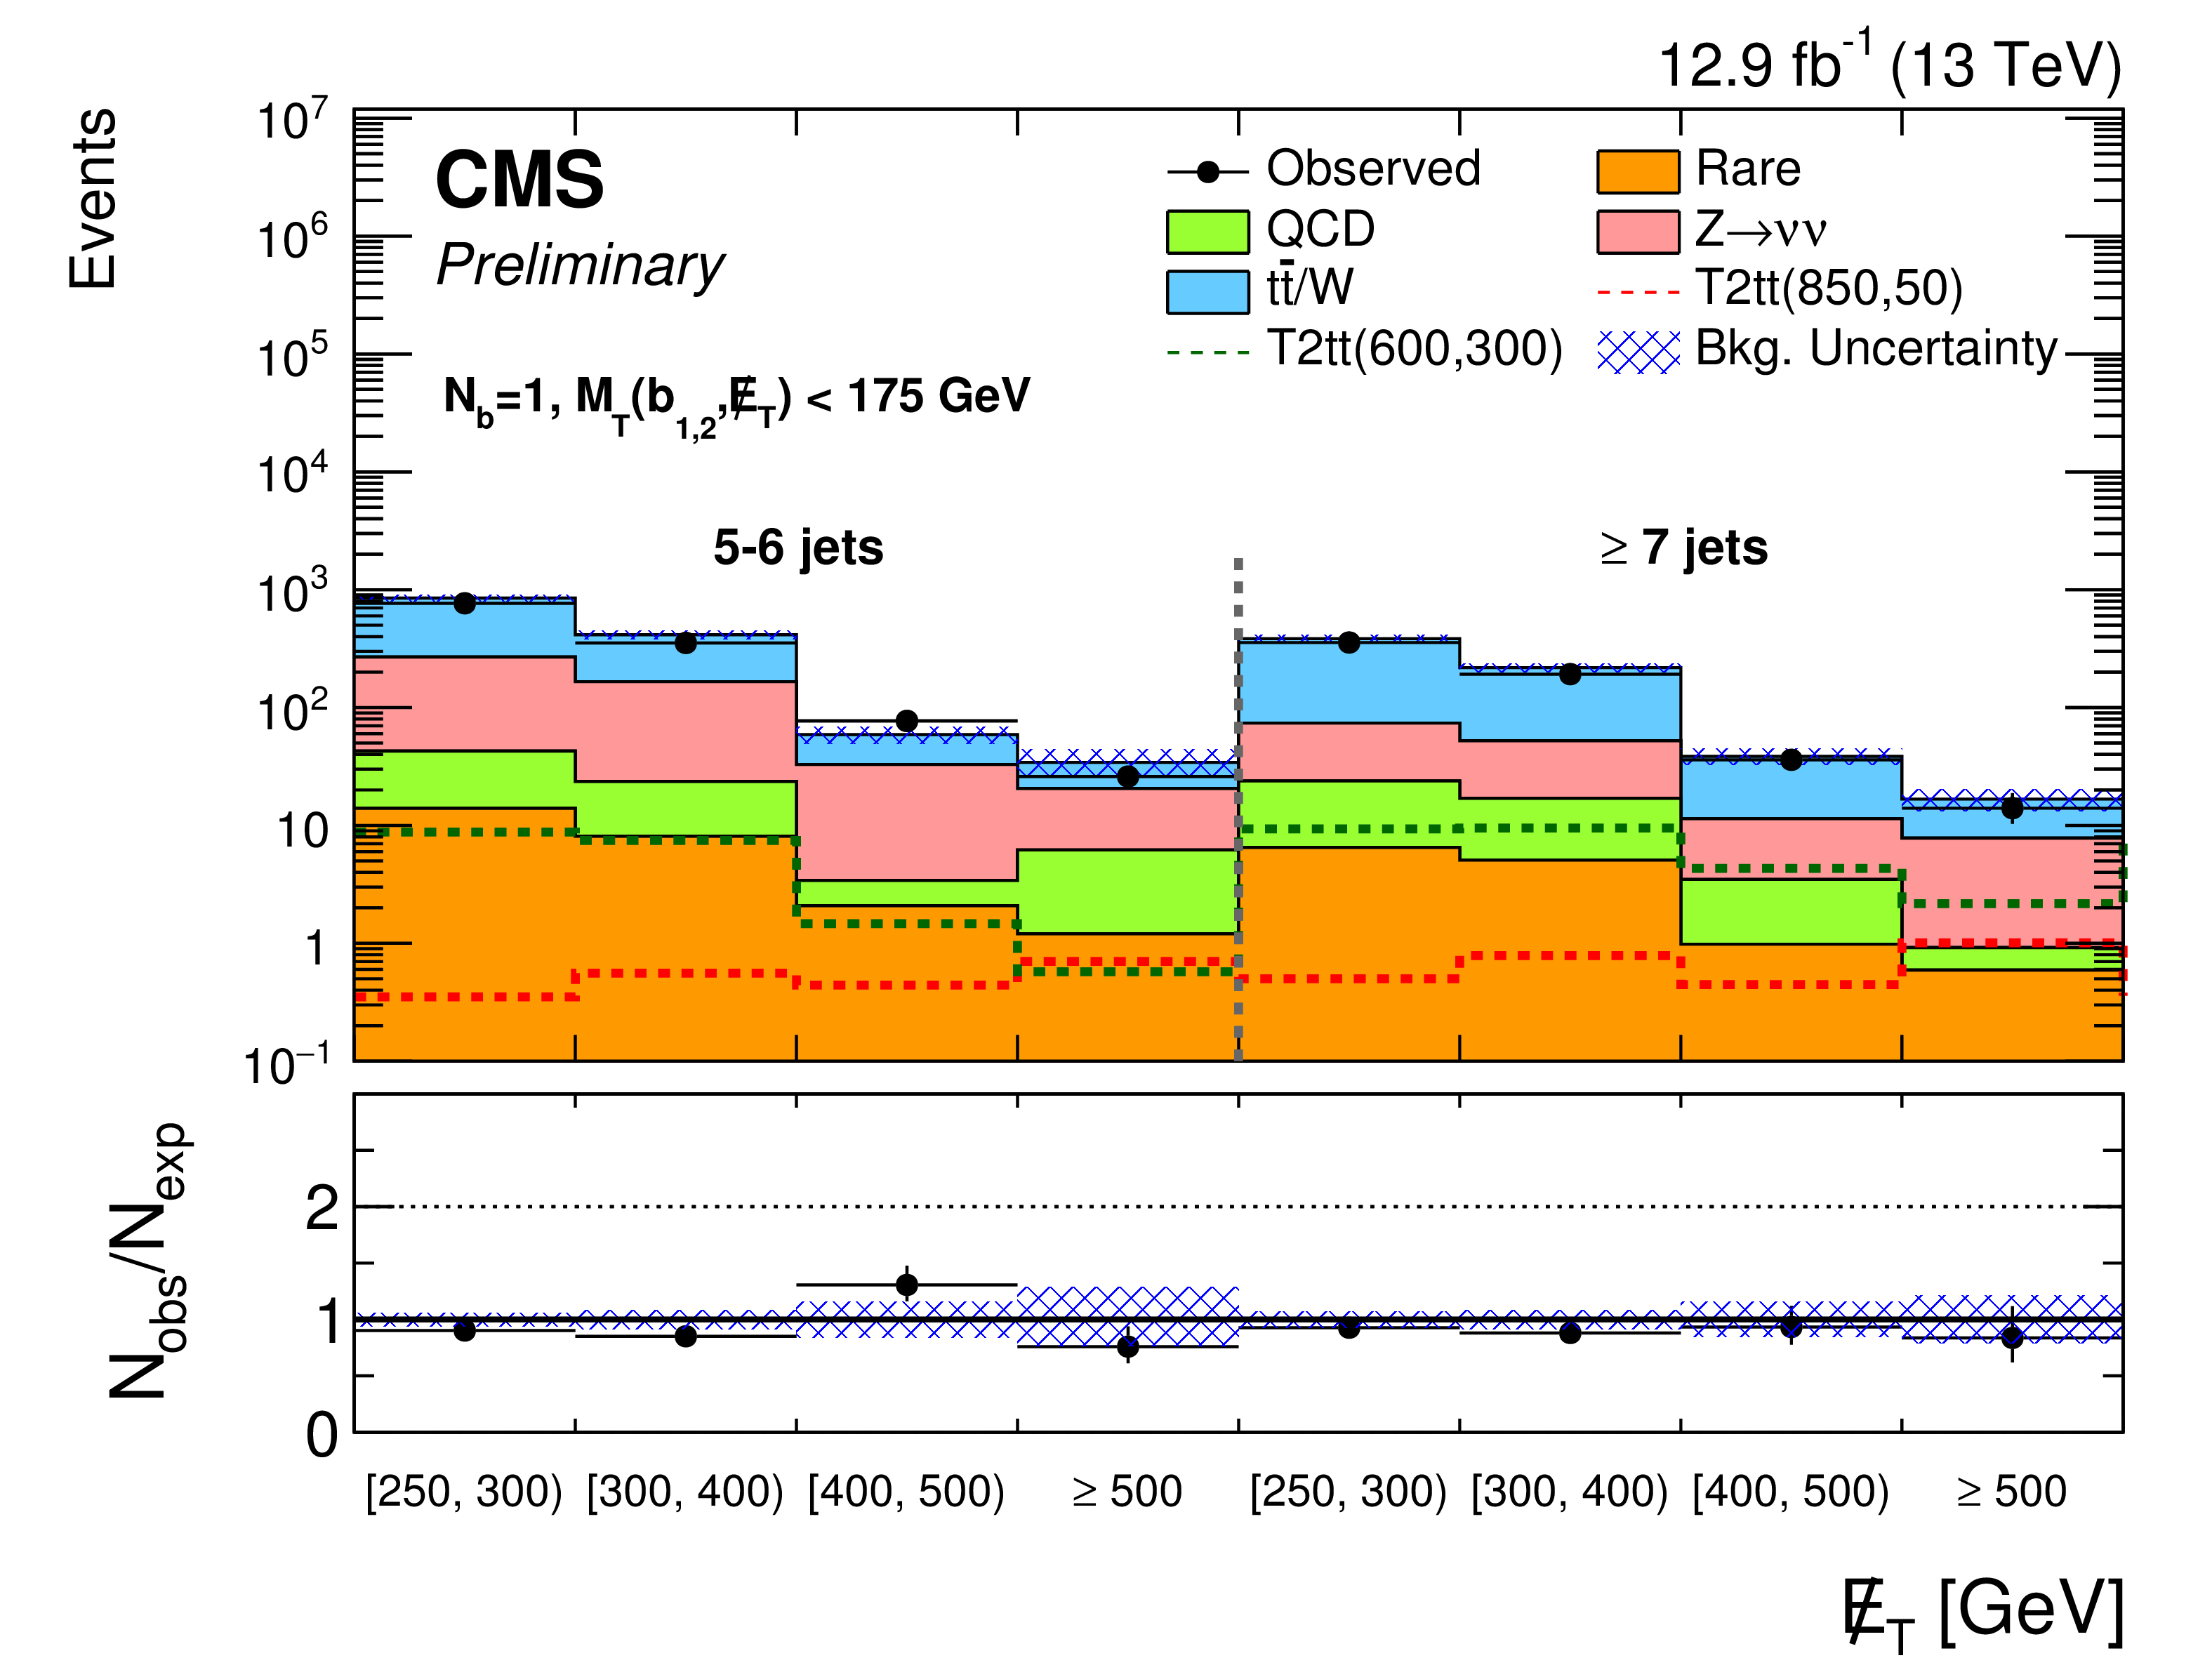
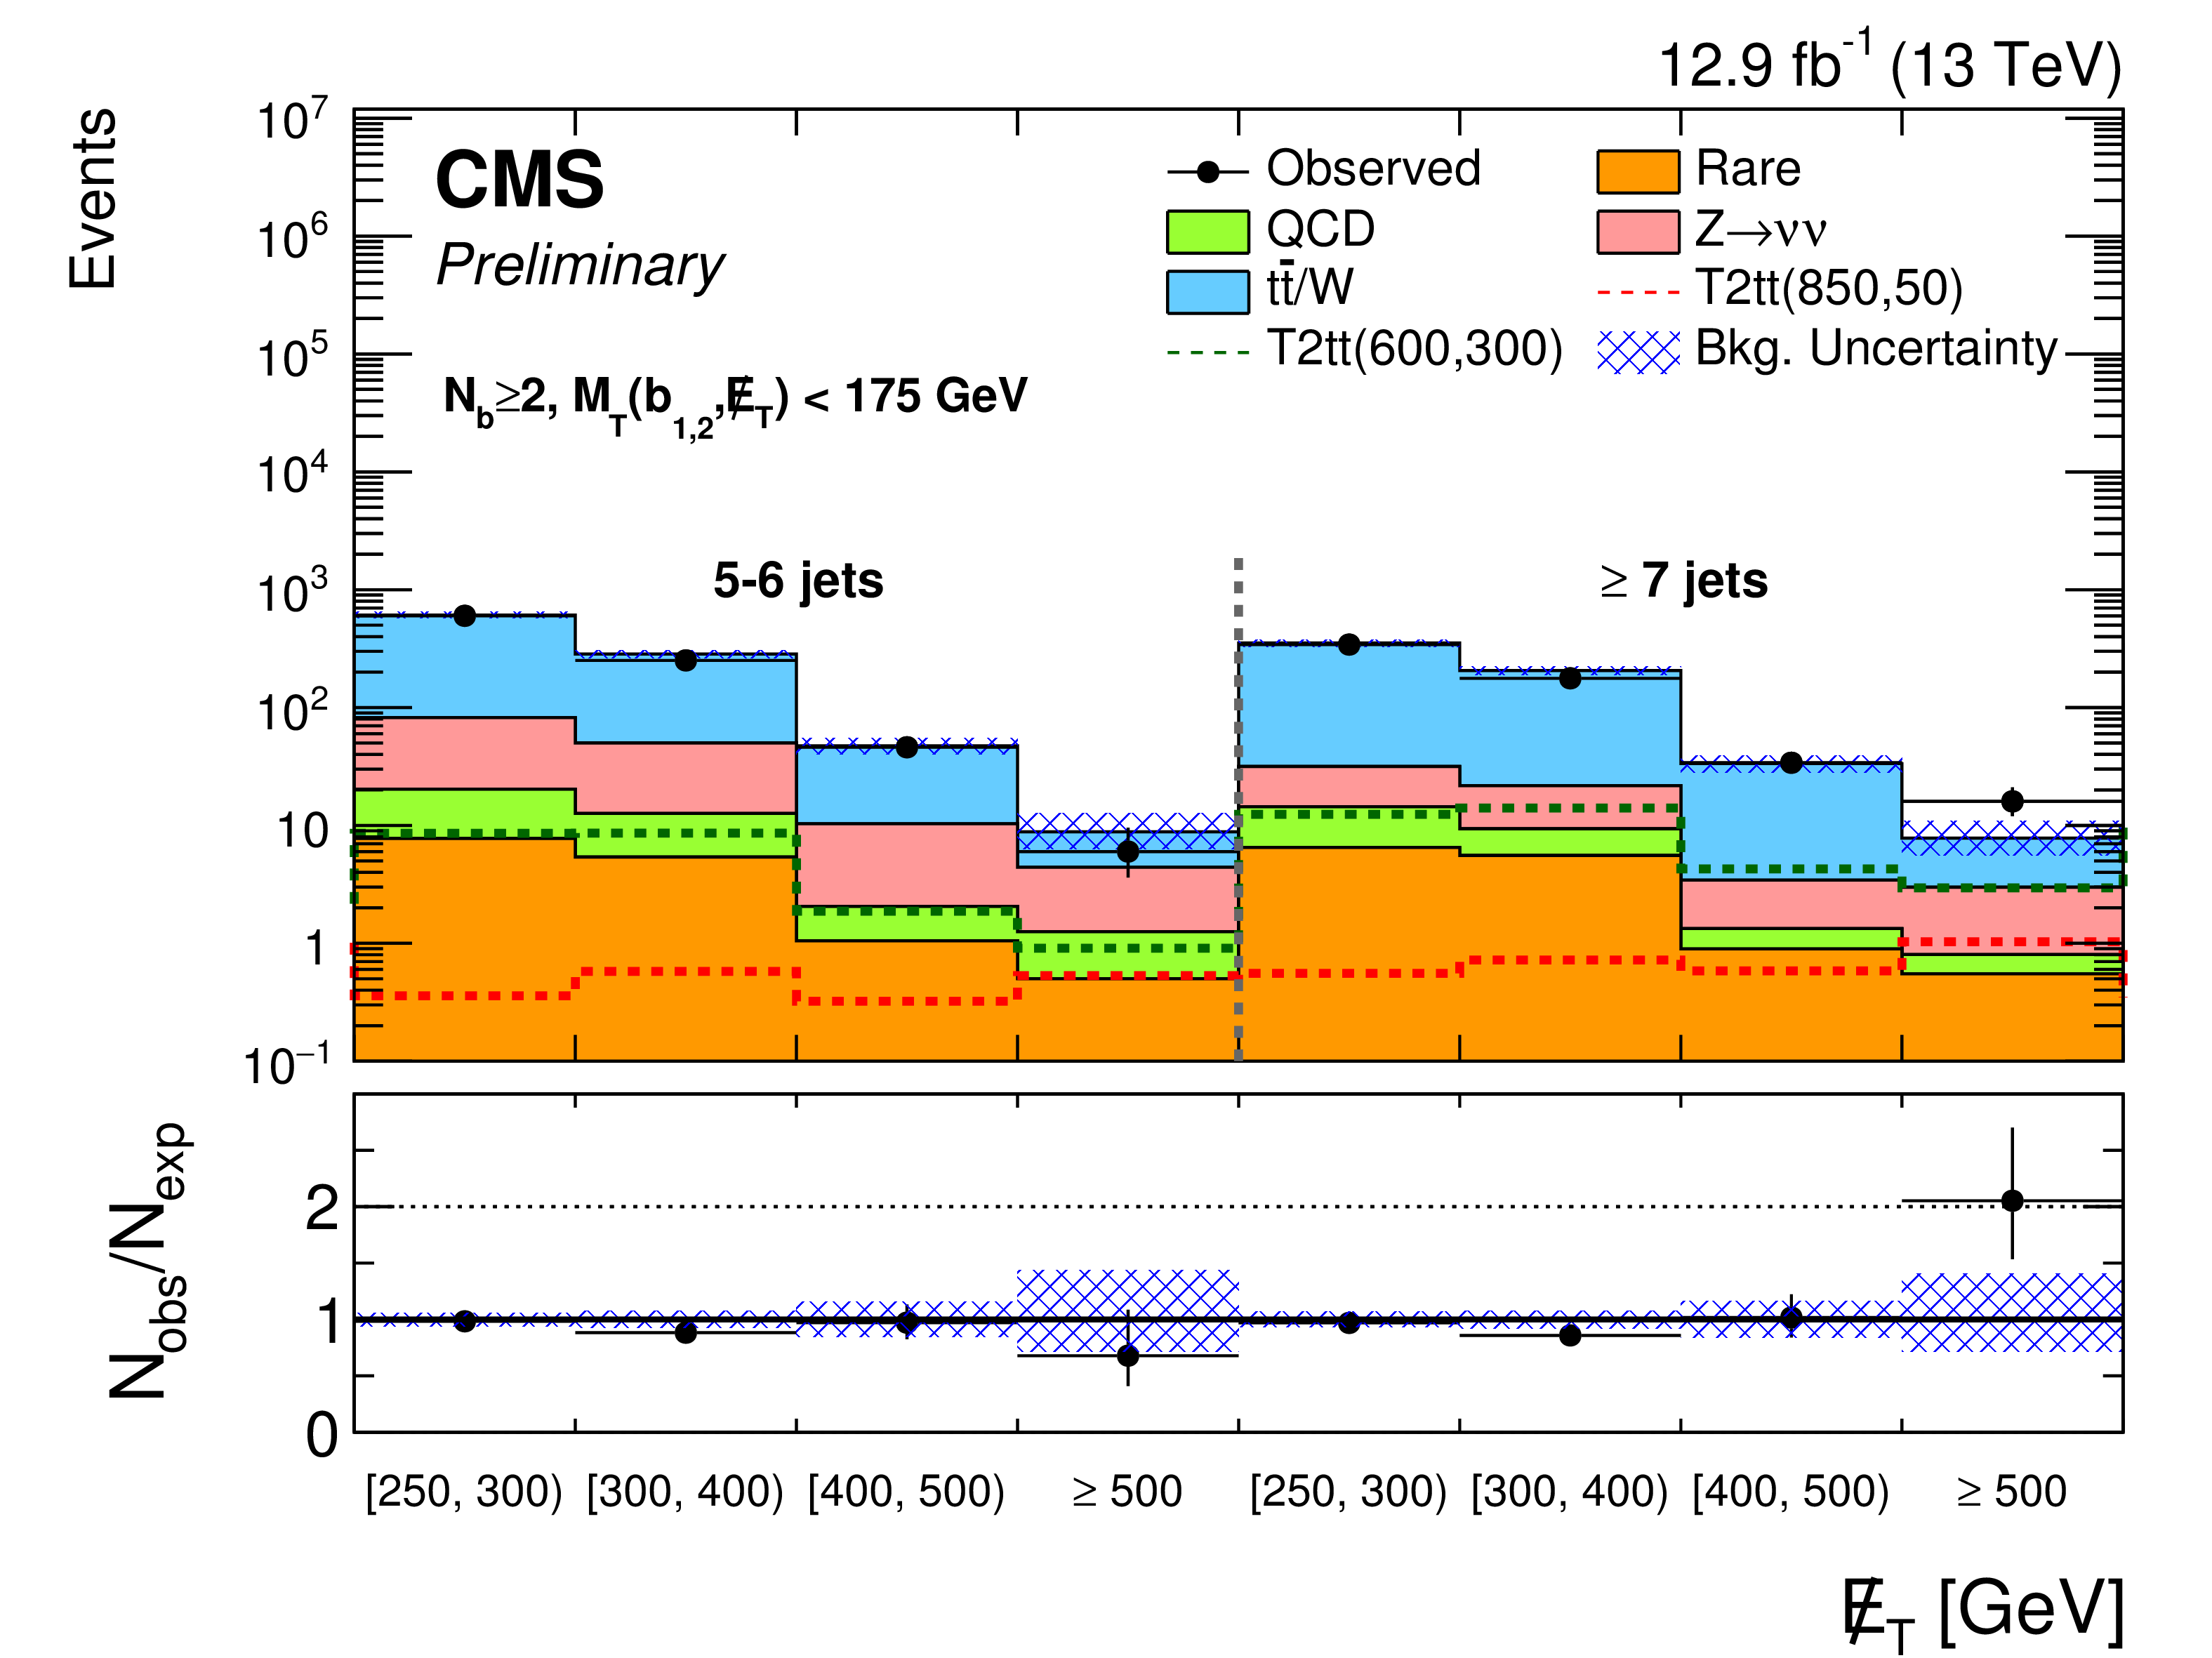
Figure 4-a:
Observed events and SM estimates for the high ${\Delta m}$ search regions with $M_{\mathrm {T}}( {\mathrm {b}}_{1,2}$, ${E_{\mathrm {T}}^{\text {miss}}} )< $ 175 GeV (a,b) and $M_{\mathrm {T}}( {\mathrm {b}}_{1,2}$, ${E_{\mathrm {T}}^{\text {miss}}} )> $ 175 GeV, $N_{ {\mathrm {t}}}=$ 0, $N_{ {\mathrm {W}}}= $ 0 (c,d), for events with $N_{ {\mathrm {b}}}= $ 1 (a,c) and $N_{ {\mathrm {b}}}\geq $ 2 (b,d). The SM background predictions shown do not include the effects of the maximum likelihood fit to the data. The ratio of the observed data to the SM prediction (black points, with error bars corresponding to the data statistical uncertainty) are shown in the ratio plots. The shaded blue band represents the statistical and systematic uncertainty on the background prediction. |
png pdf |
Figure 4-b:
Observed events and SM estimates for the high ${\Delta m}$ search regions with $M_{\mathrm {T}}( {\mathrm {b}}_{1,2}$, ${E_{\mathrm {T}}^{\text {miss}}} )< $ 175 GeV (a,b) and $M_{\mathrm {T}}( {\mathrm {b}}_{1,2}$, ${E_{\mathrm {T}}^{\text {miss}}} )> $ 175 GeV, $N_{ {\mathrm {t}}}=$ 0, $N_{ {\mathrm {W}}}= $ 0 (c,d), for events with $N_{ {\mathrm {b}}}= $ 1 (a,c) and $N_{ {\mathrm {b}}}\geq $ 2 (b,d). The SM background predictions shown do not include the effects of the maximum likelihood fit to the data. The ratio of the observed data to the SM prediction (black points, with error bars corresponding to the data statistical uncertainty) are shown in the ratio plots. The shaded blue band represents the statistical and systematic uncertainty on the background prediction. |
png pdf |
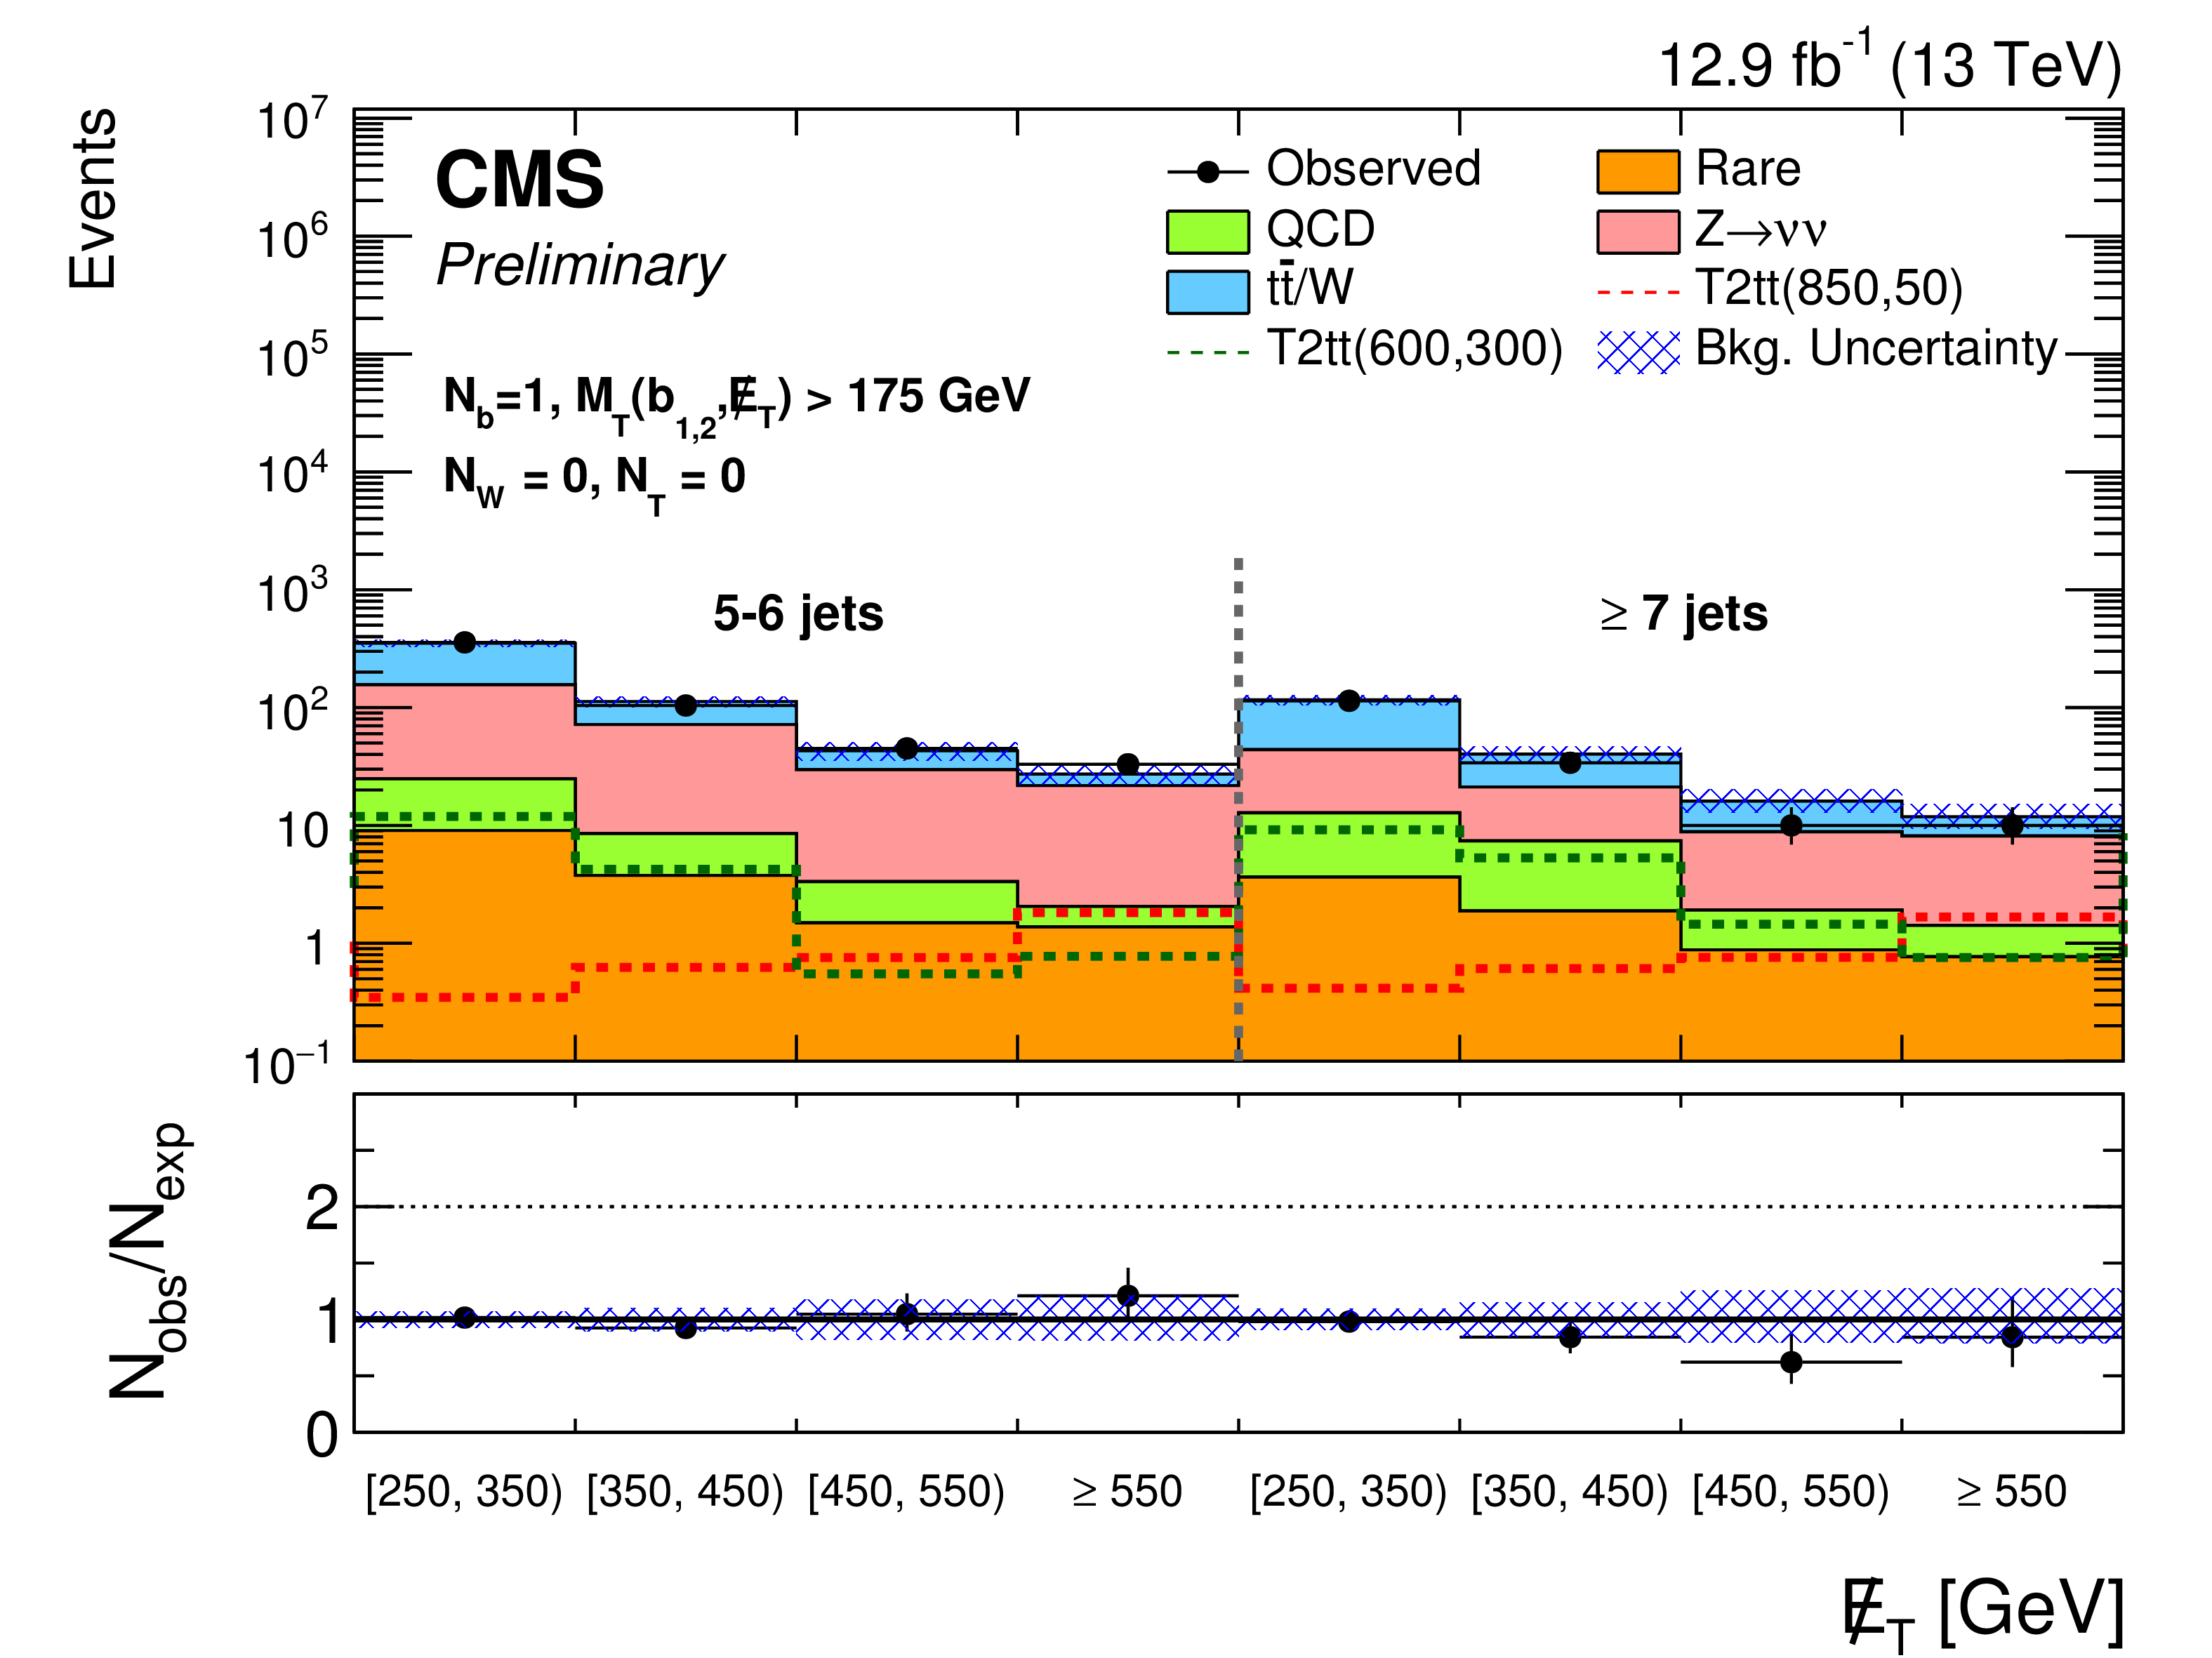
Figure 4-c:
Observed events and SM estimates for the high ${\Delta m}$ search regions with $M_{\mathrm {T}}( {\mathrm {b}}_{1,2}$, ${E_{\mathrm {T}}^{\text {miss}}} )< $ 175 GeV (a,b) and $M_{\mathrm {T}}( {\mathrm {b}}_{1,2}$, ${E_{\mathrm {T}}^{\text {miss}}} )> $ 175 GeV, $N_{ {\mathrm {t}}}=$ 0, $N_{ {\mathrm {W}}}= $ 0 (c,d), for events with $N_{ {\mathrm {b}}}= $ 1 (a,c) and $N_{ {\mathrm {b}}}\geq $ 2 (b,d). The SM background predictions shown do not include the effects of the maximum likelihood fit to the data. The ratio of the observed data to the SM prediction (black points, with error bars corresponding to the data statistical uncertainty) are shown in the ratio plots. The shaded blue band represents the statistical and systematic uncertainty on the background prediction. |

png pdf |
Figure 4-d:
Observed events and SM estimates for the high ${\Delta m}$ search regions with $M_{\mathrm {T}}( {\mathrm {b}}_{1,2}$, ${E_{\mathrm {T}}^{\text {miss}}} )< $ 175 GeV (a,b) and $M_{\mathrm {T}}( {\mathrm {b}}_{1,2}$, ${E_{\mathrm {T}}^{\text {miss}}} )> $ 175 GeV, $N_{ {\mathrm {t}}}=$ 0, $N_{ {\mathrm {W}}}= $ 0 (c,d), for events with $N_{ {\mathrm {b}}}= $ 1 (a,c) and $N_{ {\mathrm {b}}}\geq $ 2 (b,d). The SM background predictions shown do not include the effects of the maximum likelihood fit to the data. The ratio of the observed data to the SM prediction (black points, with error bars corresponding to the data statistical uncertainty) are shown in the ratio plots. The shaded blue band represents the statistical and systematic uncertainty on the background prediction. |

png pdf |
Figure 5-a:
Observed events and SM estimates for the high ${\Delta m}$ search regions with $M_{\mathrm {T}}( {\mathrm {b}}_{1,2}$, ${E_{\mathrm {T}}^{\text {miss}}} )> $ 175 GeV , $N_{\text {j}}\geq $ 5, and at least one top- or W-tagged candidate for events with $N_{ {\mathrm {b}}}= $ 1 (a) and $N_{ {\mathrm {b}}}\geq $ 2 (b). The SM background predictions shown do not include the effects of the maximum likelihood fit to the data. The ratio of the observed data to the SM prediction (black points, with error bars corresponding to the data statistical uncertainty) are shown in the ratio plots. The shaded blue band represents the statistical and systematic uncertainty on the background prediction. |

png pdf |
Figure 5-b:
Observed events and SM estimates for the high ${\Delta m}$ search regions with $M_{\mathrm {T}}( {\mathrm {b}}_{1,2}$, ${E_{\mathrm {T}}^{\text {miss}}} )> $ 175 GeV , $N_{\text {j}}\geq $ 5, and at least one top- or W-tagged candidate for events with $N_{ {\mathrm {b}}}= $ 1 (a) and $N_{ {\mathrm {b}}}\geq $ 2 (b). The SM background predictions shown do not include the effects of the maximum likelihood fit to the data. The ratio of the observed data to the SM prediction (black points, with error bars corresponding to the data statistical uncertainty) are shown in the ratio plots. The shaded blue band represents the statistical and systematic uncertainty on the background prediction. |
png pdf |
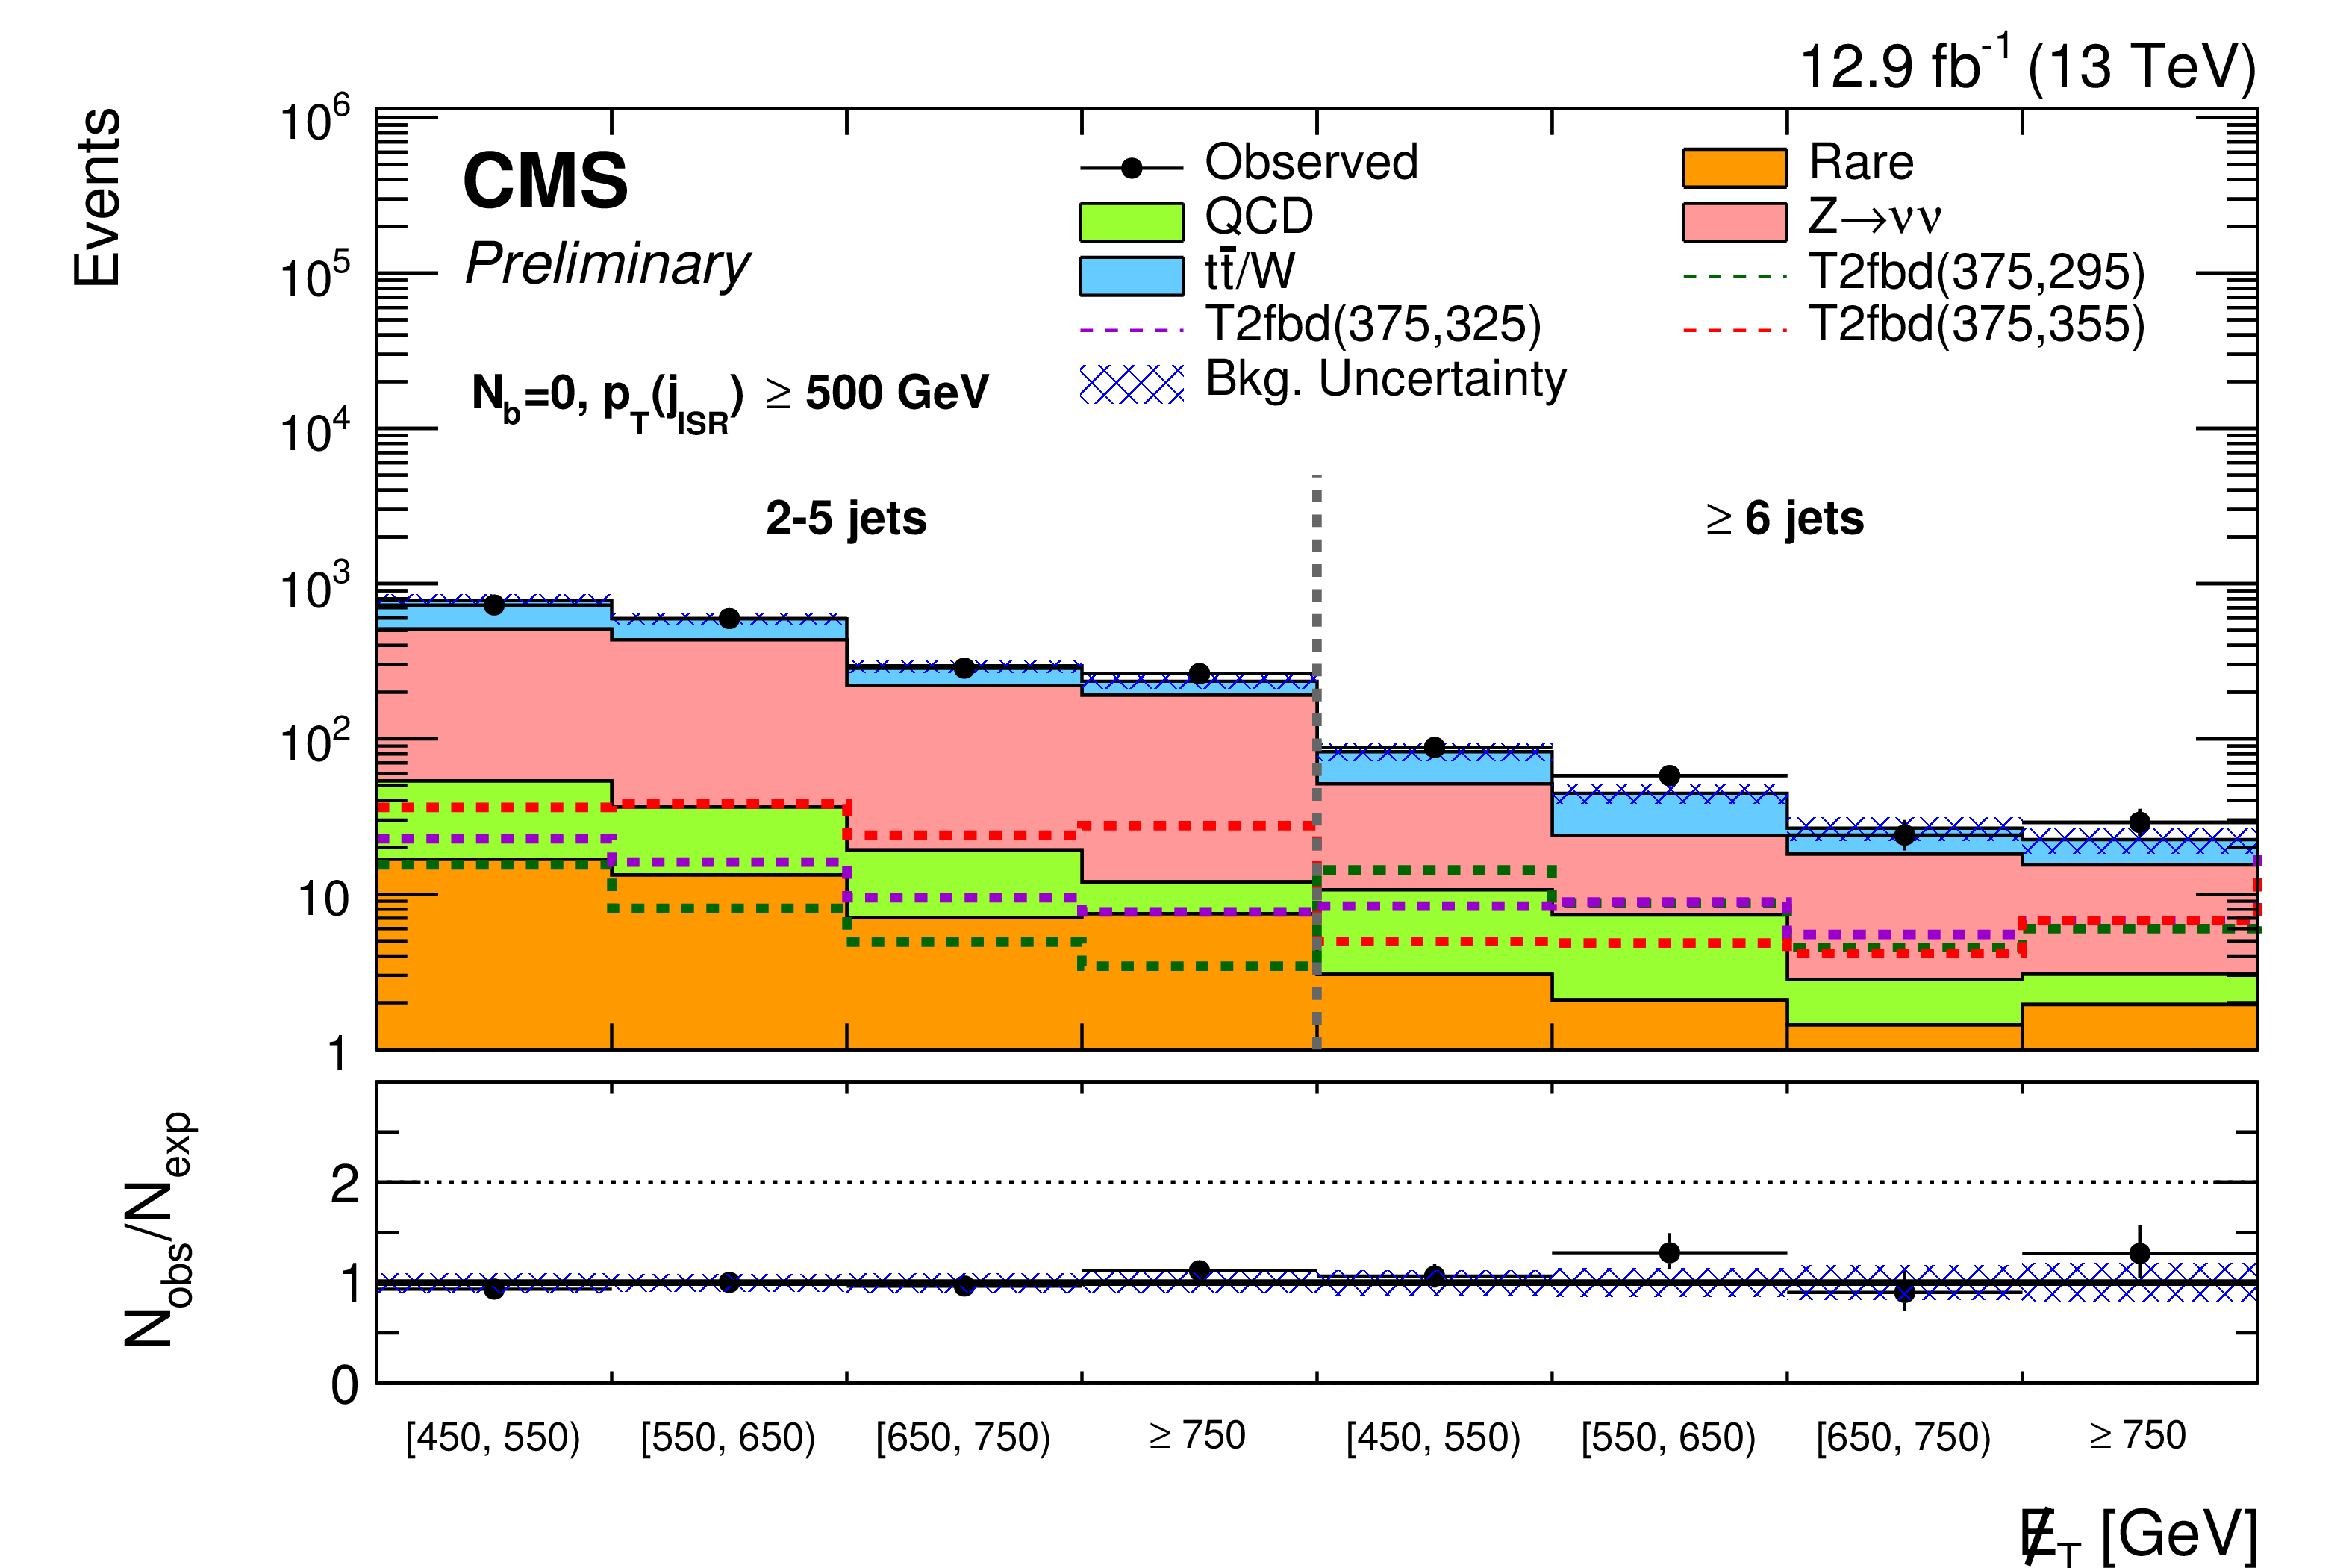
Figure 6-a:
Observed events and SM estimates for the low ${\Delta m}$ search regions. The SM background predictions shown do not include the effects of the maximum likelihood fit to the data. The ratio of the observed data to the SM prediction (black points, with error bars corresponding to the data statistical uncertainty) is shown in the ratio plots. The shaded blue band represents the statistical and systematic uncertainty on the background prediction. Top: for $N_{ {\mathrm {b}}}= $ 0; Middle: for $N_{ {\mathrm {b}}}= $ 1; Bottom: for $N_{ {\mathrm {b}}}\geq $ 2. |
png pdf |
Figure 6-b:
Observed events and SM estimates for the low ${\Delta m}$ search regions. The SM background predictions shown do not include the effects of the maximum likelihood fit to the data. The ratio of the observed data to the SM prediction (black points, with error bars corresponding to the data statistical uncertainty) is shown in the ratio plots. The shaded blue band represents the statistical and systematic uncertainty on the background prediction. Top: for $N_{ {\mathrm {b}}}= $ 0; Middle: for $N_{ {\mathrm {b}}}= $ 1; Bottom: for $N_{ {\mathrm {b}}}\geq $ 2. |
png pdf |
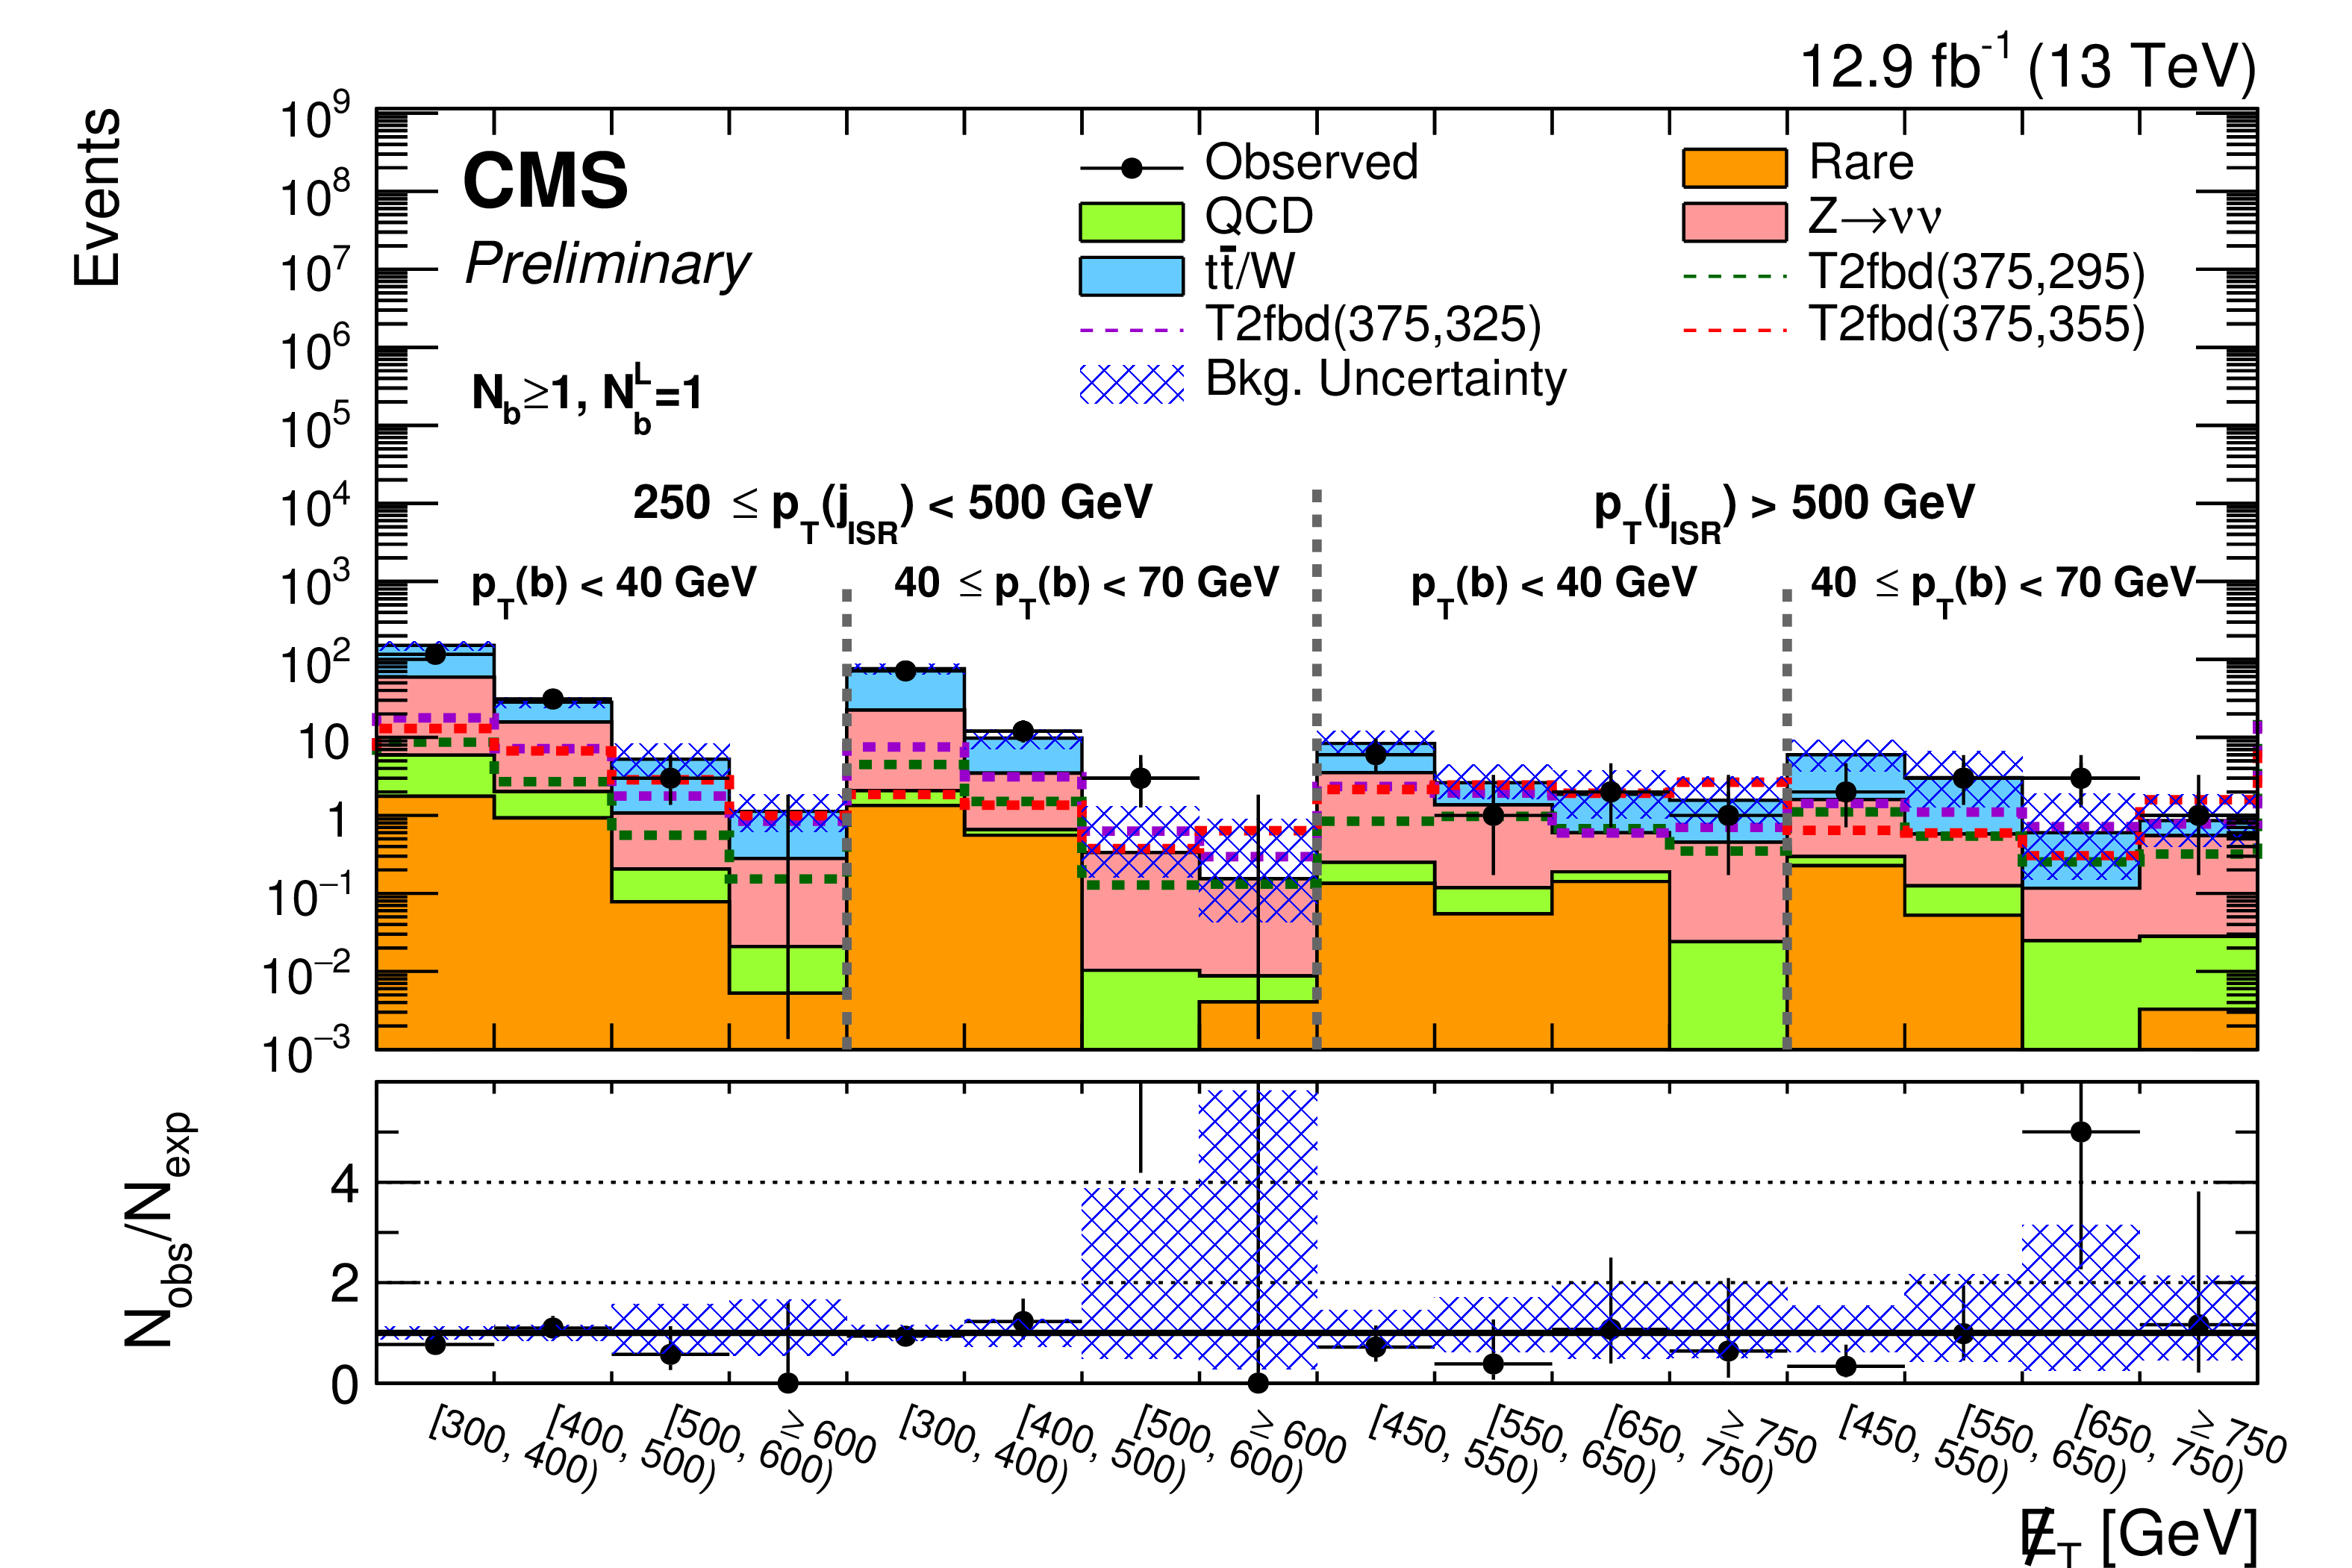
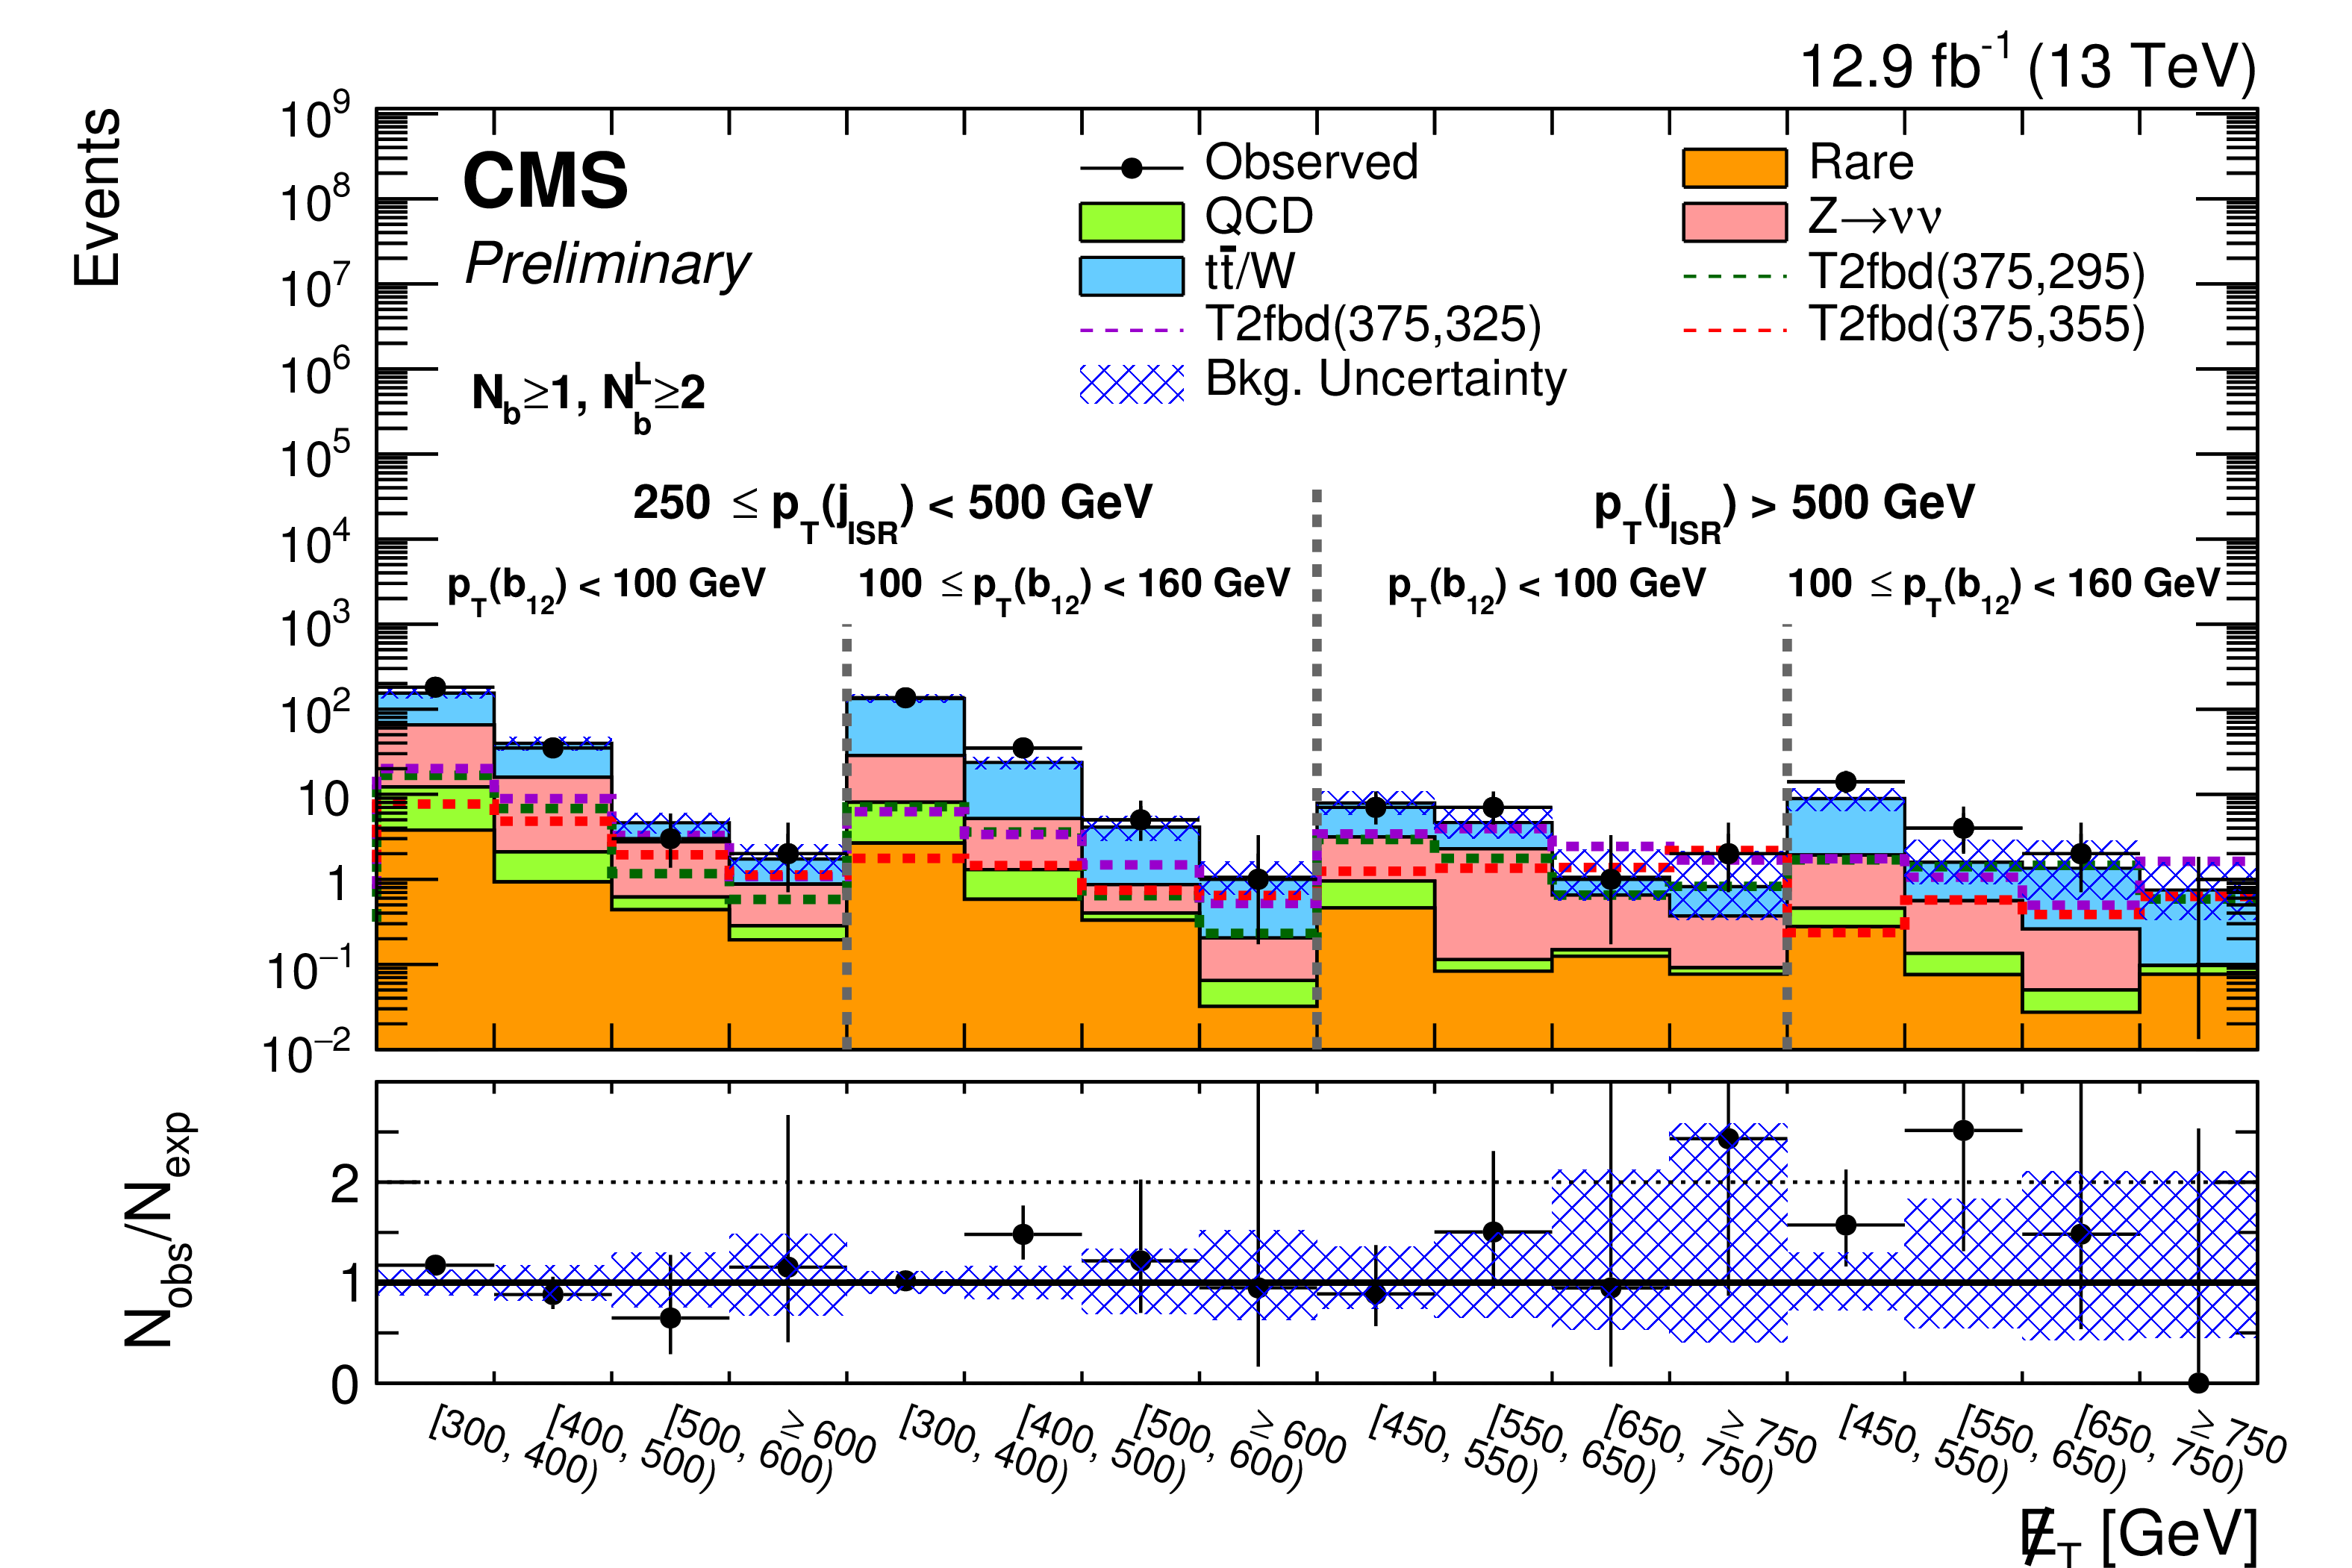
Figure 6-c:
Observed events and SM estimates for the low ${\Delta m}$ search regions. The SM background predictions shown do not include the effects of the maximum likelihood fit to the data. The ratio of the observed data to the SM prediction (black points, with error bars corresponding to the data statistical uncertainty) is shown in the ratio plots. The shaded blue band represents the statistical and systematic uncertainty on the background prediction. Top: for $N_{ {\mathrm {b}}}= $ 0; Middle: for $N_{ {\mathrm {b}}}= $ 1; Bottom: for $N_{ {\mathrm {b}}}\geq $ 2. |
png pdf |
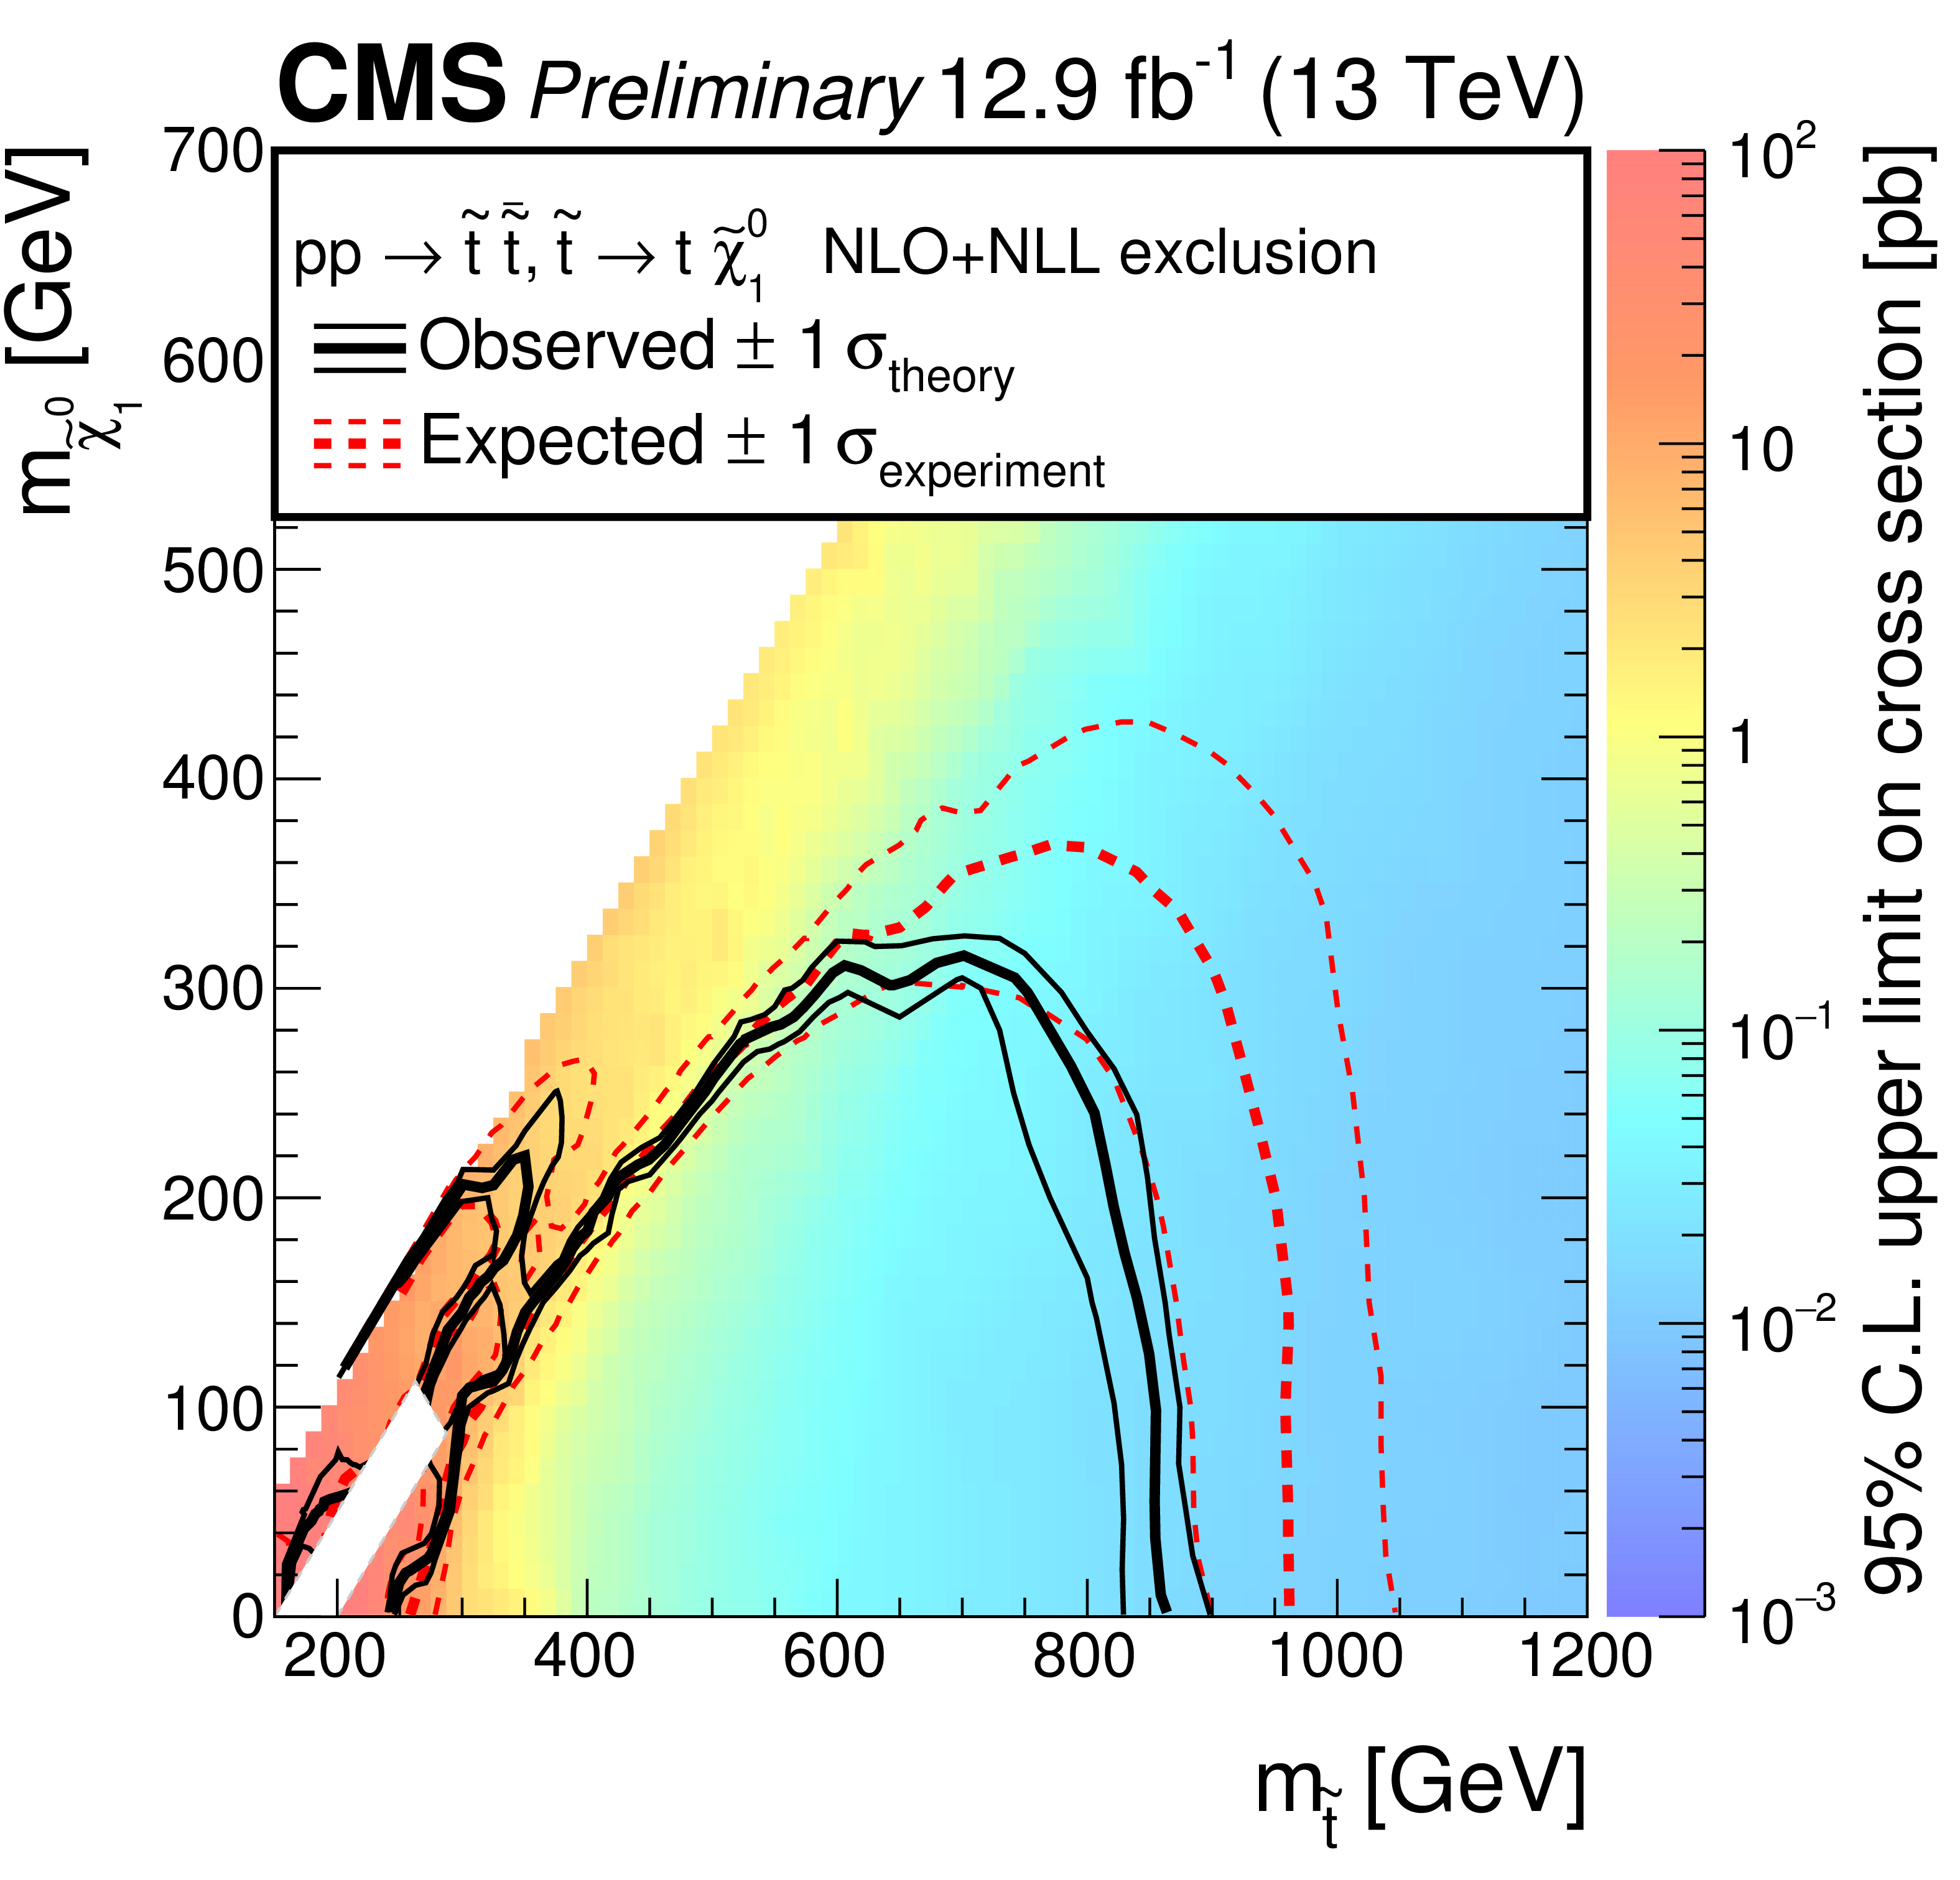
Figure 7:
Exclusion limits at 95% CL for simplified models of top squark pair production in the pure $ {\tilde{t}} _{1}\to {\mathrm {t}} {\tilde{\chi}^{0}_{1}} $ (``T2tt") decay scenario. The solid black curves represent the observed exclusion contours with respect to NLO+NLL cross section calculations [22] and the corresponding $\pm$1 standard deviations. The dashed red curves indicate the expected exclusion contour and the $\pm$1 standard deviations with experimental uncertainties. |
png pdf |
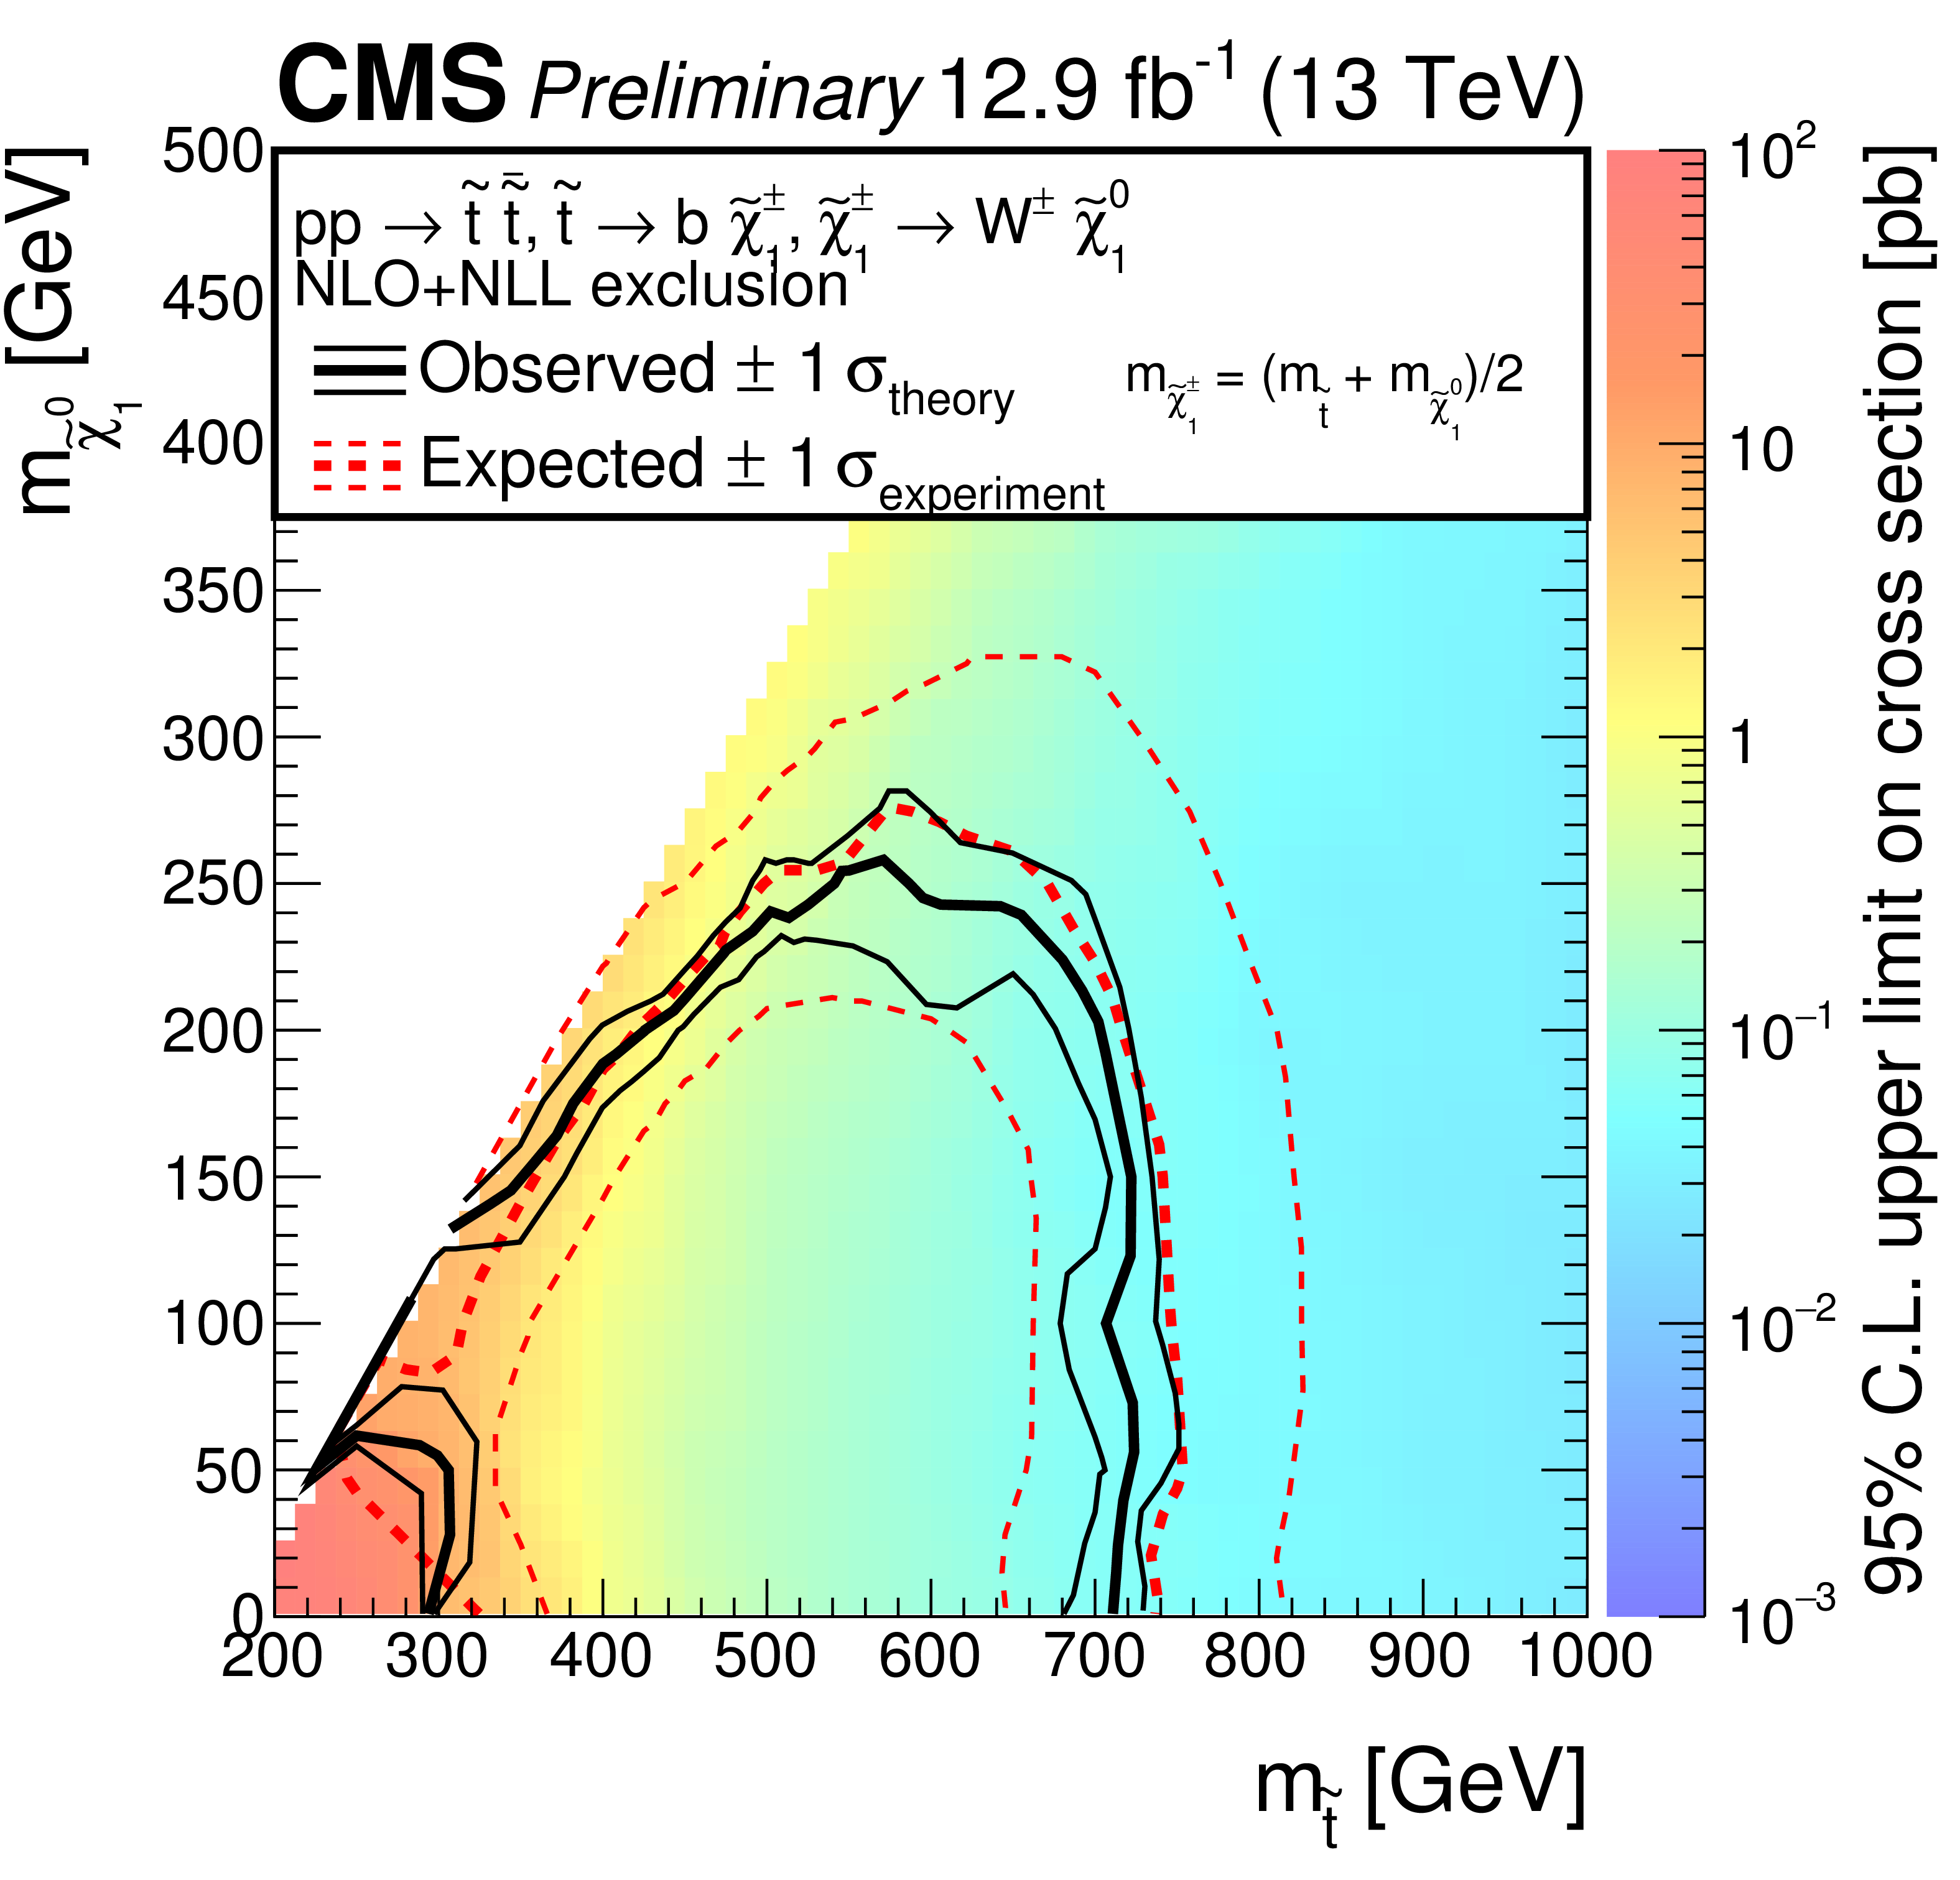
Figure 8:
Exclusion limits at 95% CL for simplified models of top squark pair production in the pure $ {\tilde{t}} _{1}\to {\mathrm {b}} {\tilde{\chi}^\pm _{1}} \rightarrow {\mathrm {b}} {\mathrm {W}}^{\pm (*)} {\tilde{\chi}^{0}_{1}} $ (``T2bW") decay scenario. The solid black curves represent the observed exclusion contours with respect to NLO+NLL cross section calculations [22] and the corresponding $\pm$1 standard deviations. The dashed red curves indicate the expected exclusion contour and the $\pm$1 standard deviations with experimental uncertainties. |
png pdf |
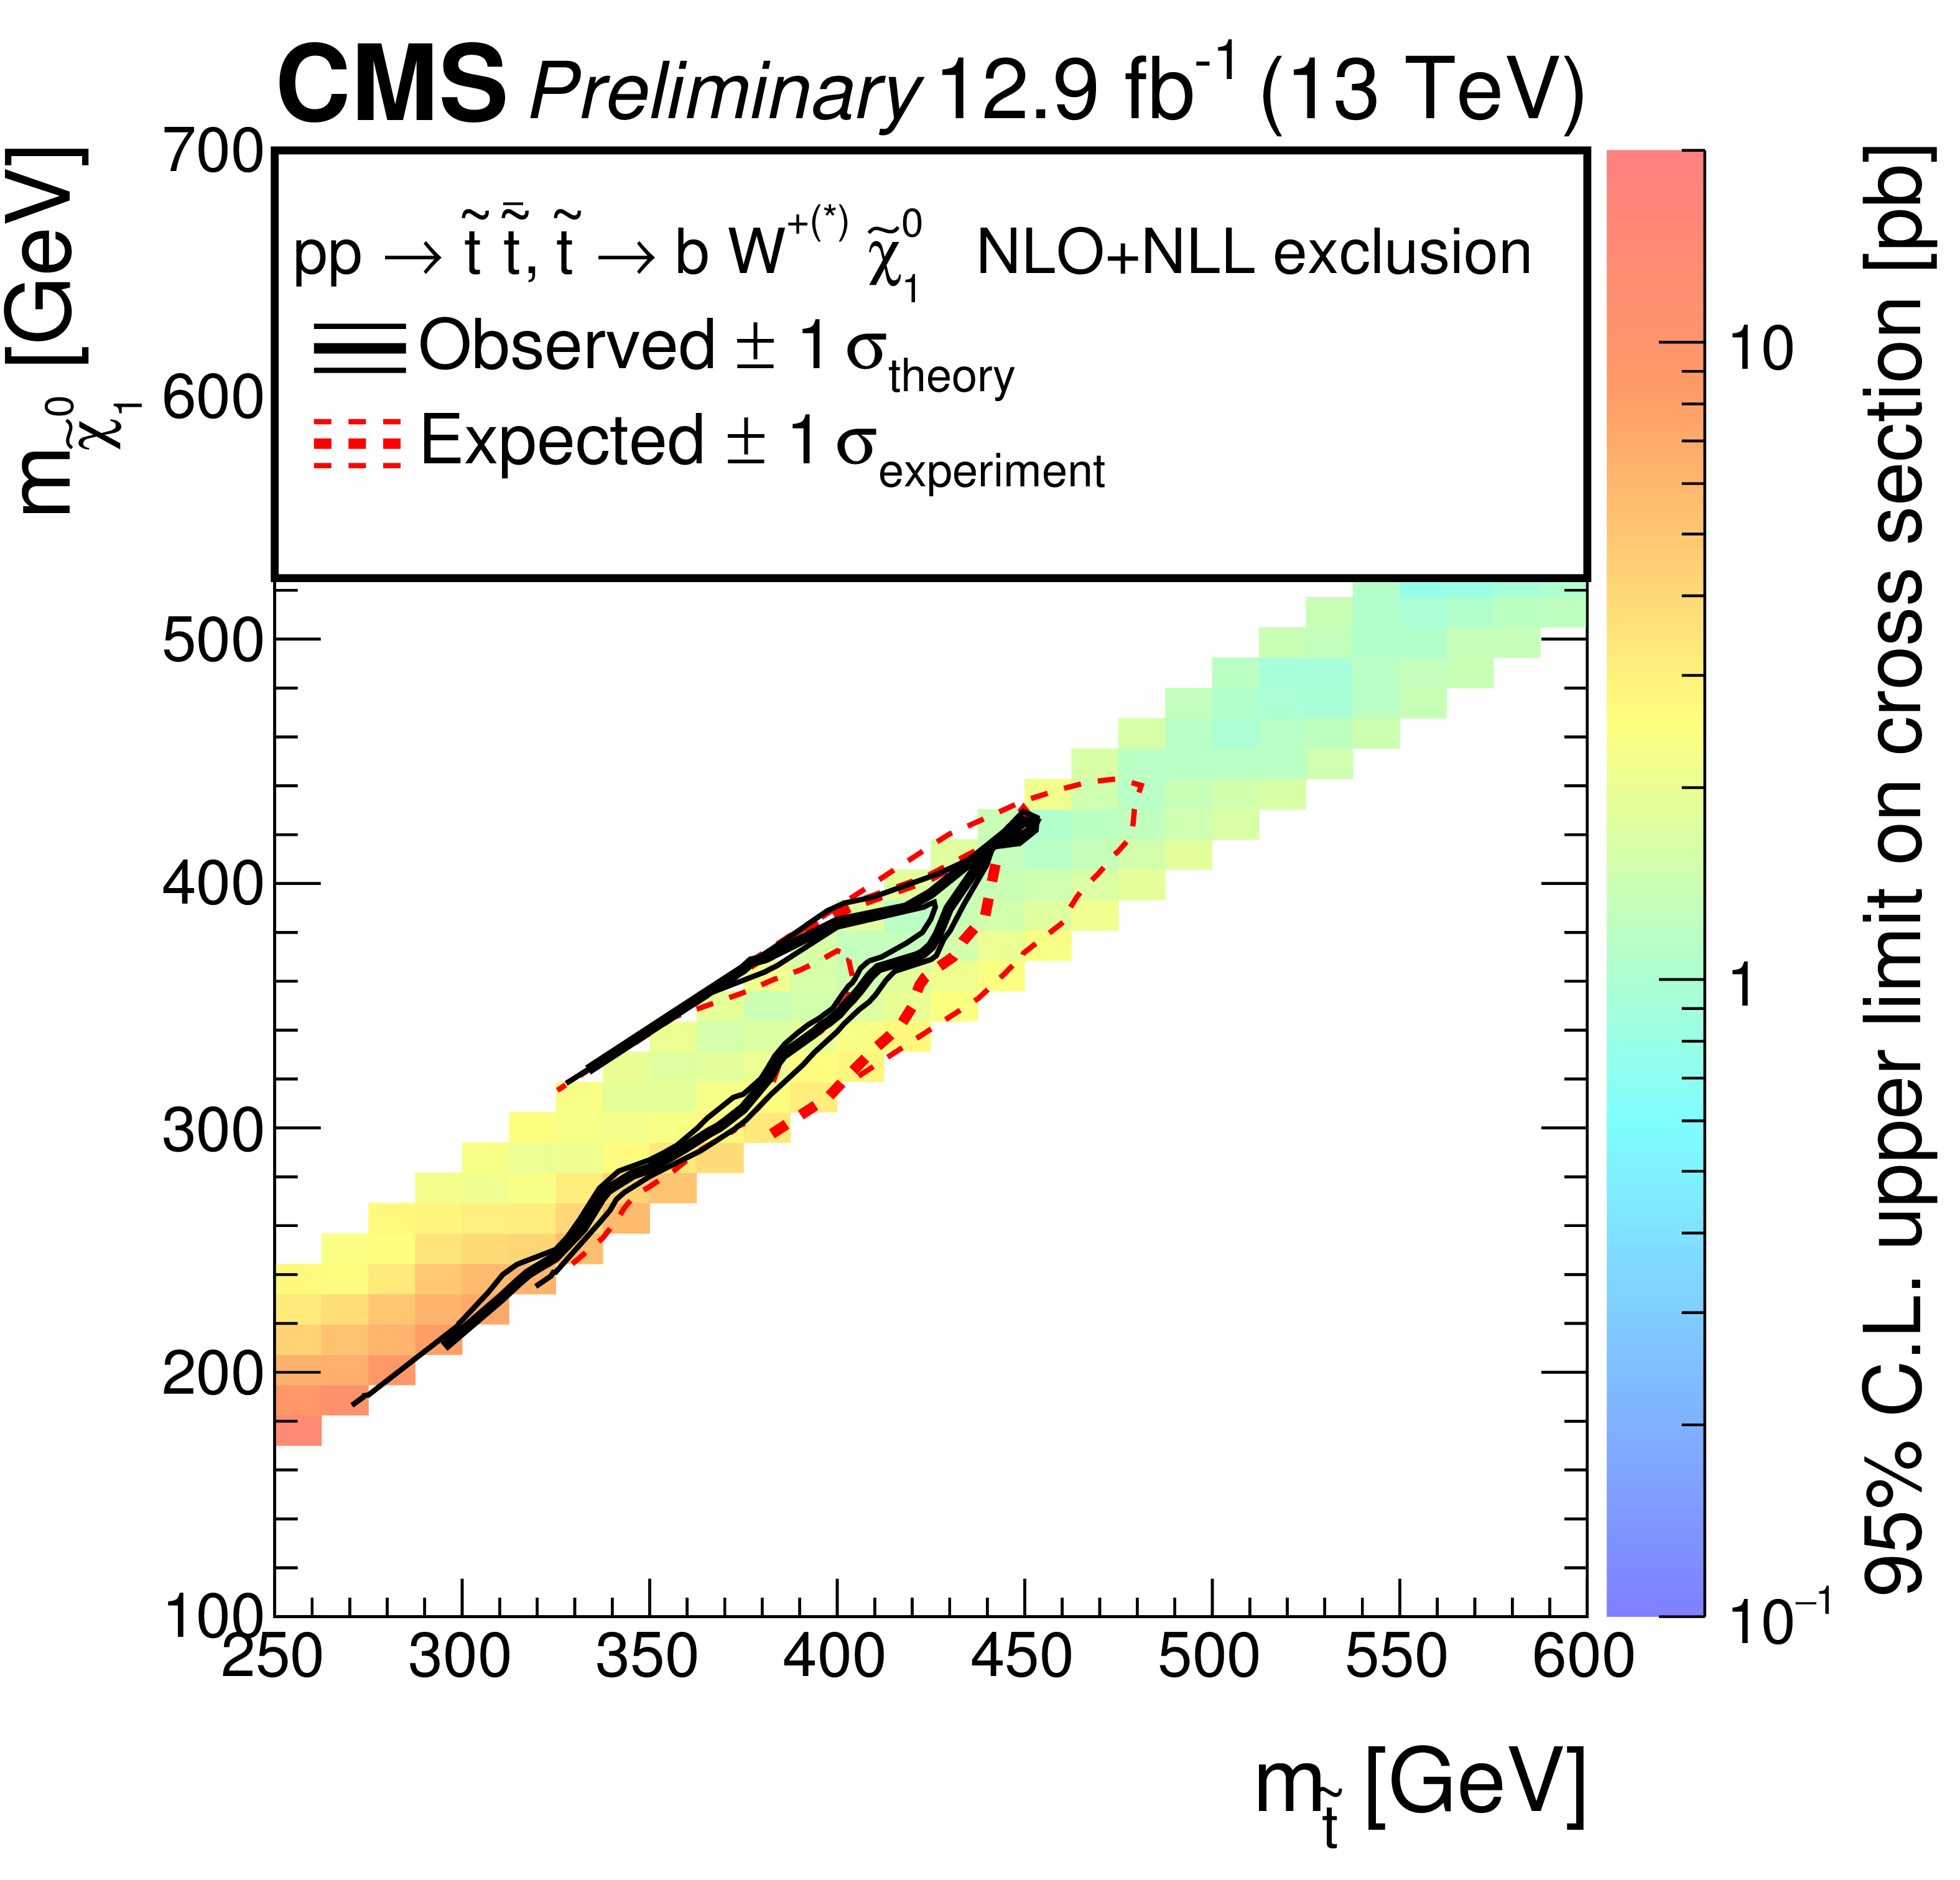
Figure 9:
Exclusion limits at 95% CL for simplified models of top squark pair production in the $ {\tilde{t}} _{1} \to {\mathrm {b}}\mathrm {f} \tilde{\mathrm {f}} {\tilde{\chi}^{0}_{1}} $ (``T2fbd") four-body decay scenario. The solid black curves represent the observed exclusion contours with respect to NLO+NLL cross section calculations [22] and the corresponding $\pm$1 standard deviations. The dashed red curves indicate the expected exclusion contour and the $\pm$1 standard deviations with experimental uncertainties. |

png pdf |
Figure 10-a:
Observed events and SM estimates for the aggregate search regions defined for the high ${\Delta m}$ (a) and low ${\Delta m}$ (b) analyses. The ratios of the observed data to the SM prediction derived from control regions (black points, with error bars corresponding to the data statistical uncertainty) are shown in the ratio plots. The shaded blue band represents the statistical and systematic uncertainty on the background prediction. |

png pdf |
Figure 10-b:
Observed events and SM estimates for the aggregate search regions defined for the high ${\Delta m}$ (a) and low ${\Delta m}$ (b) analyses. The ratios of the observed data to the SM prediction derived from control regions (black points, with error bars corresponding to the data statistical uncertainty) are shown in the ratio plots. The shaded blue band represents the statistical and systematic uncertainty on the background prediction. |
| Tables | |

png pdf |
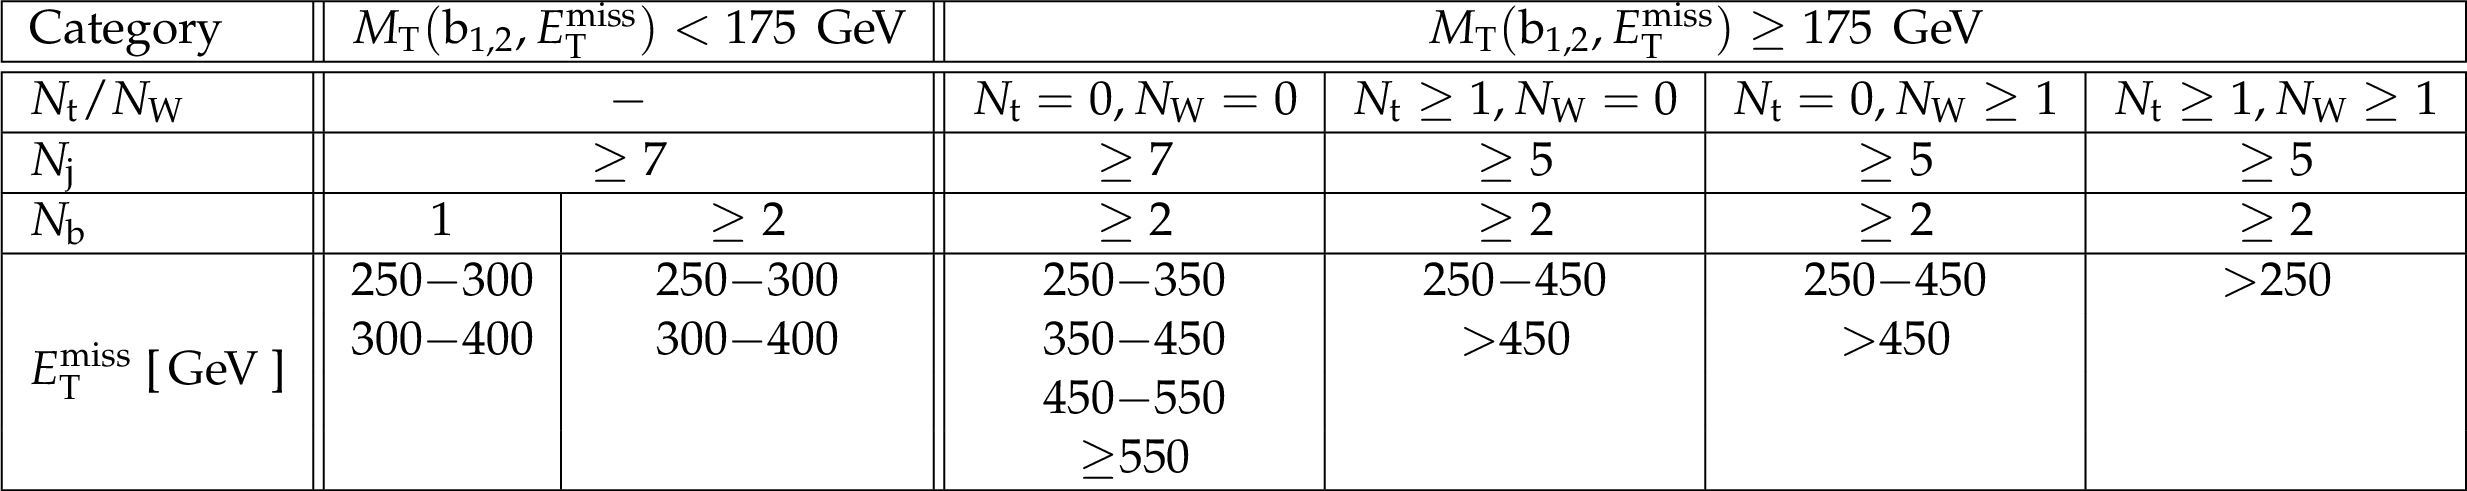
Table 1:
Summary of the 60 disjoint search regions used in the high ${\Delta m}$ analysis. |

png pdf |
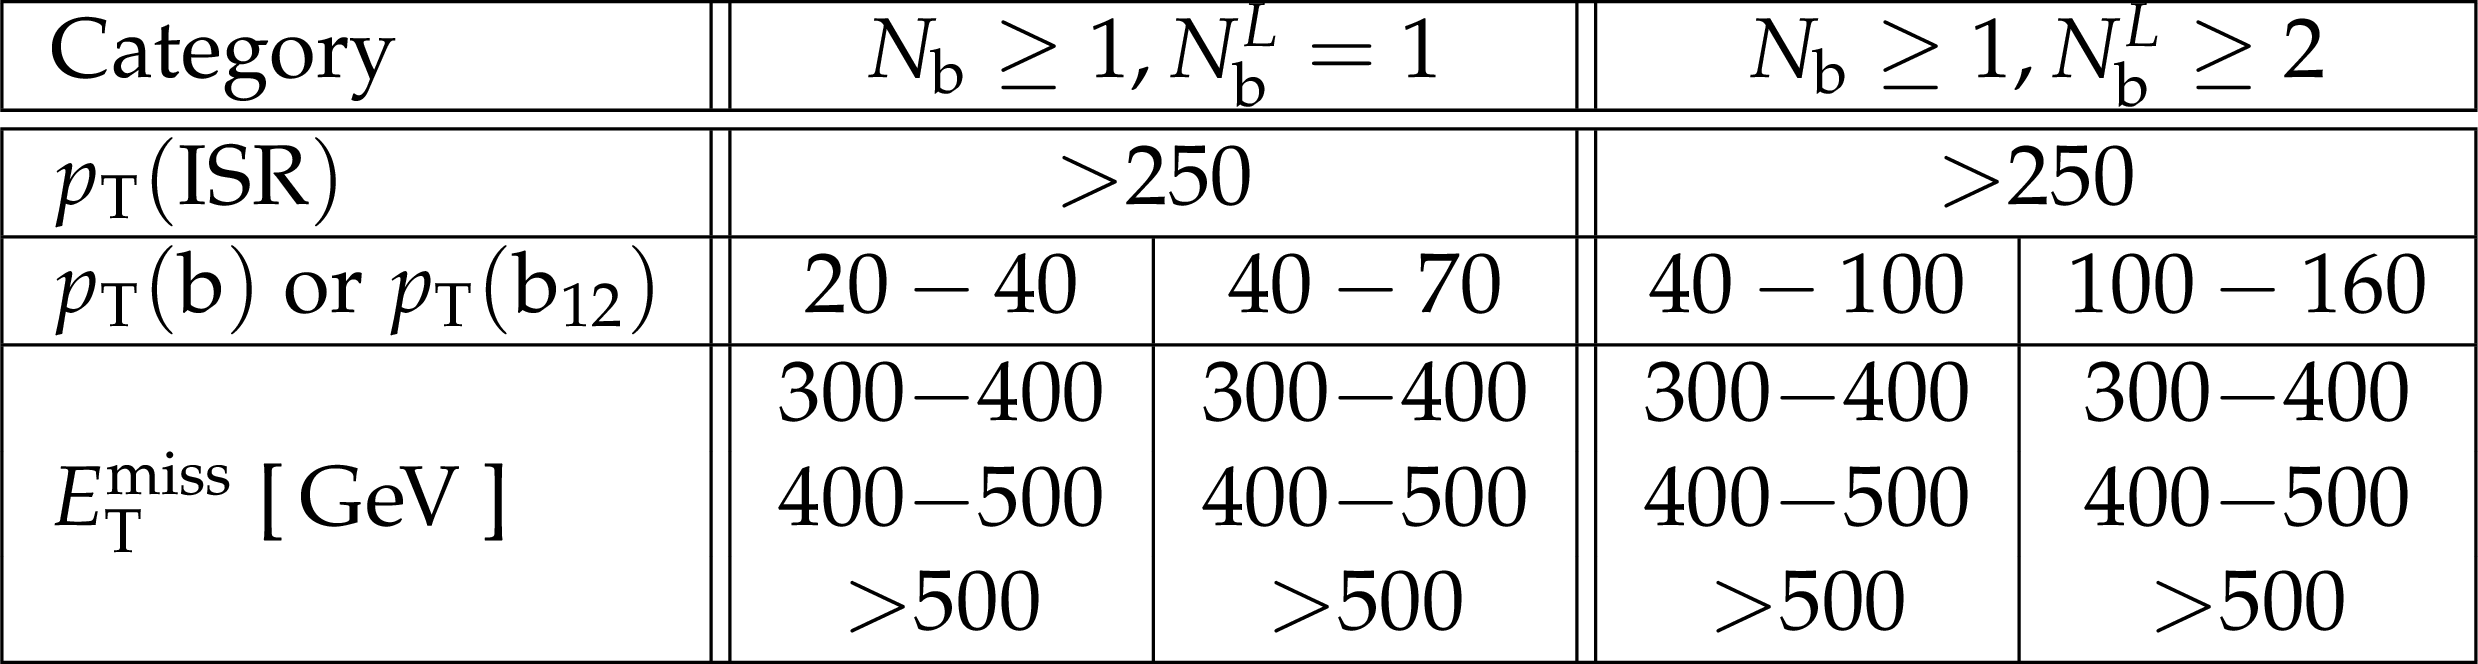
Table 2:
Summary of the 40 search regions used in the low ${\Delta m}$ analysis. |
png pdf |
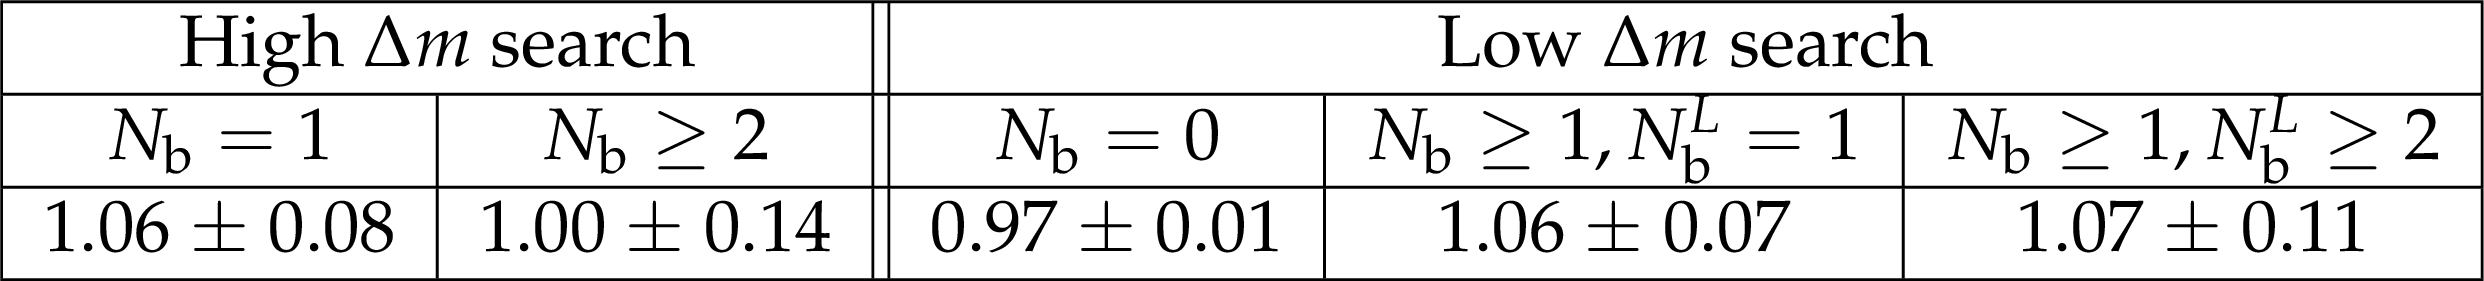
Table 3:
The $R_{Z}$ factors obtained from $ { {\mathrm {Z}}\rightarrow \ell \ell }$+jets events that are used to normalize the ${ {\mathrm {Z}}\rightarrow {\nu } {\nu }}$ simulation sample. The factors are obtained using 12.9 fb$^{-1}$ of data and calculated for different $N_{ {\mathrm {b}}}$ selections in order to account for differences in heavy flavor production between data and simulation. |
png pdf |
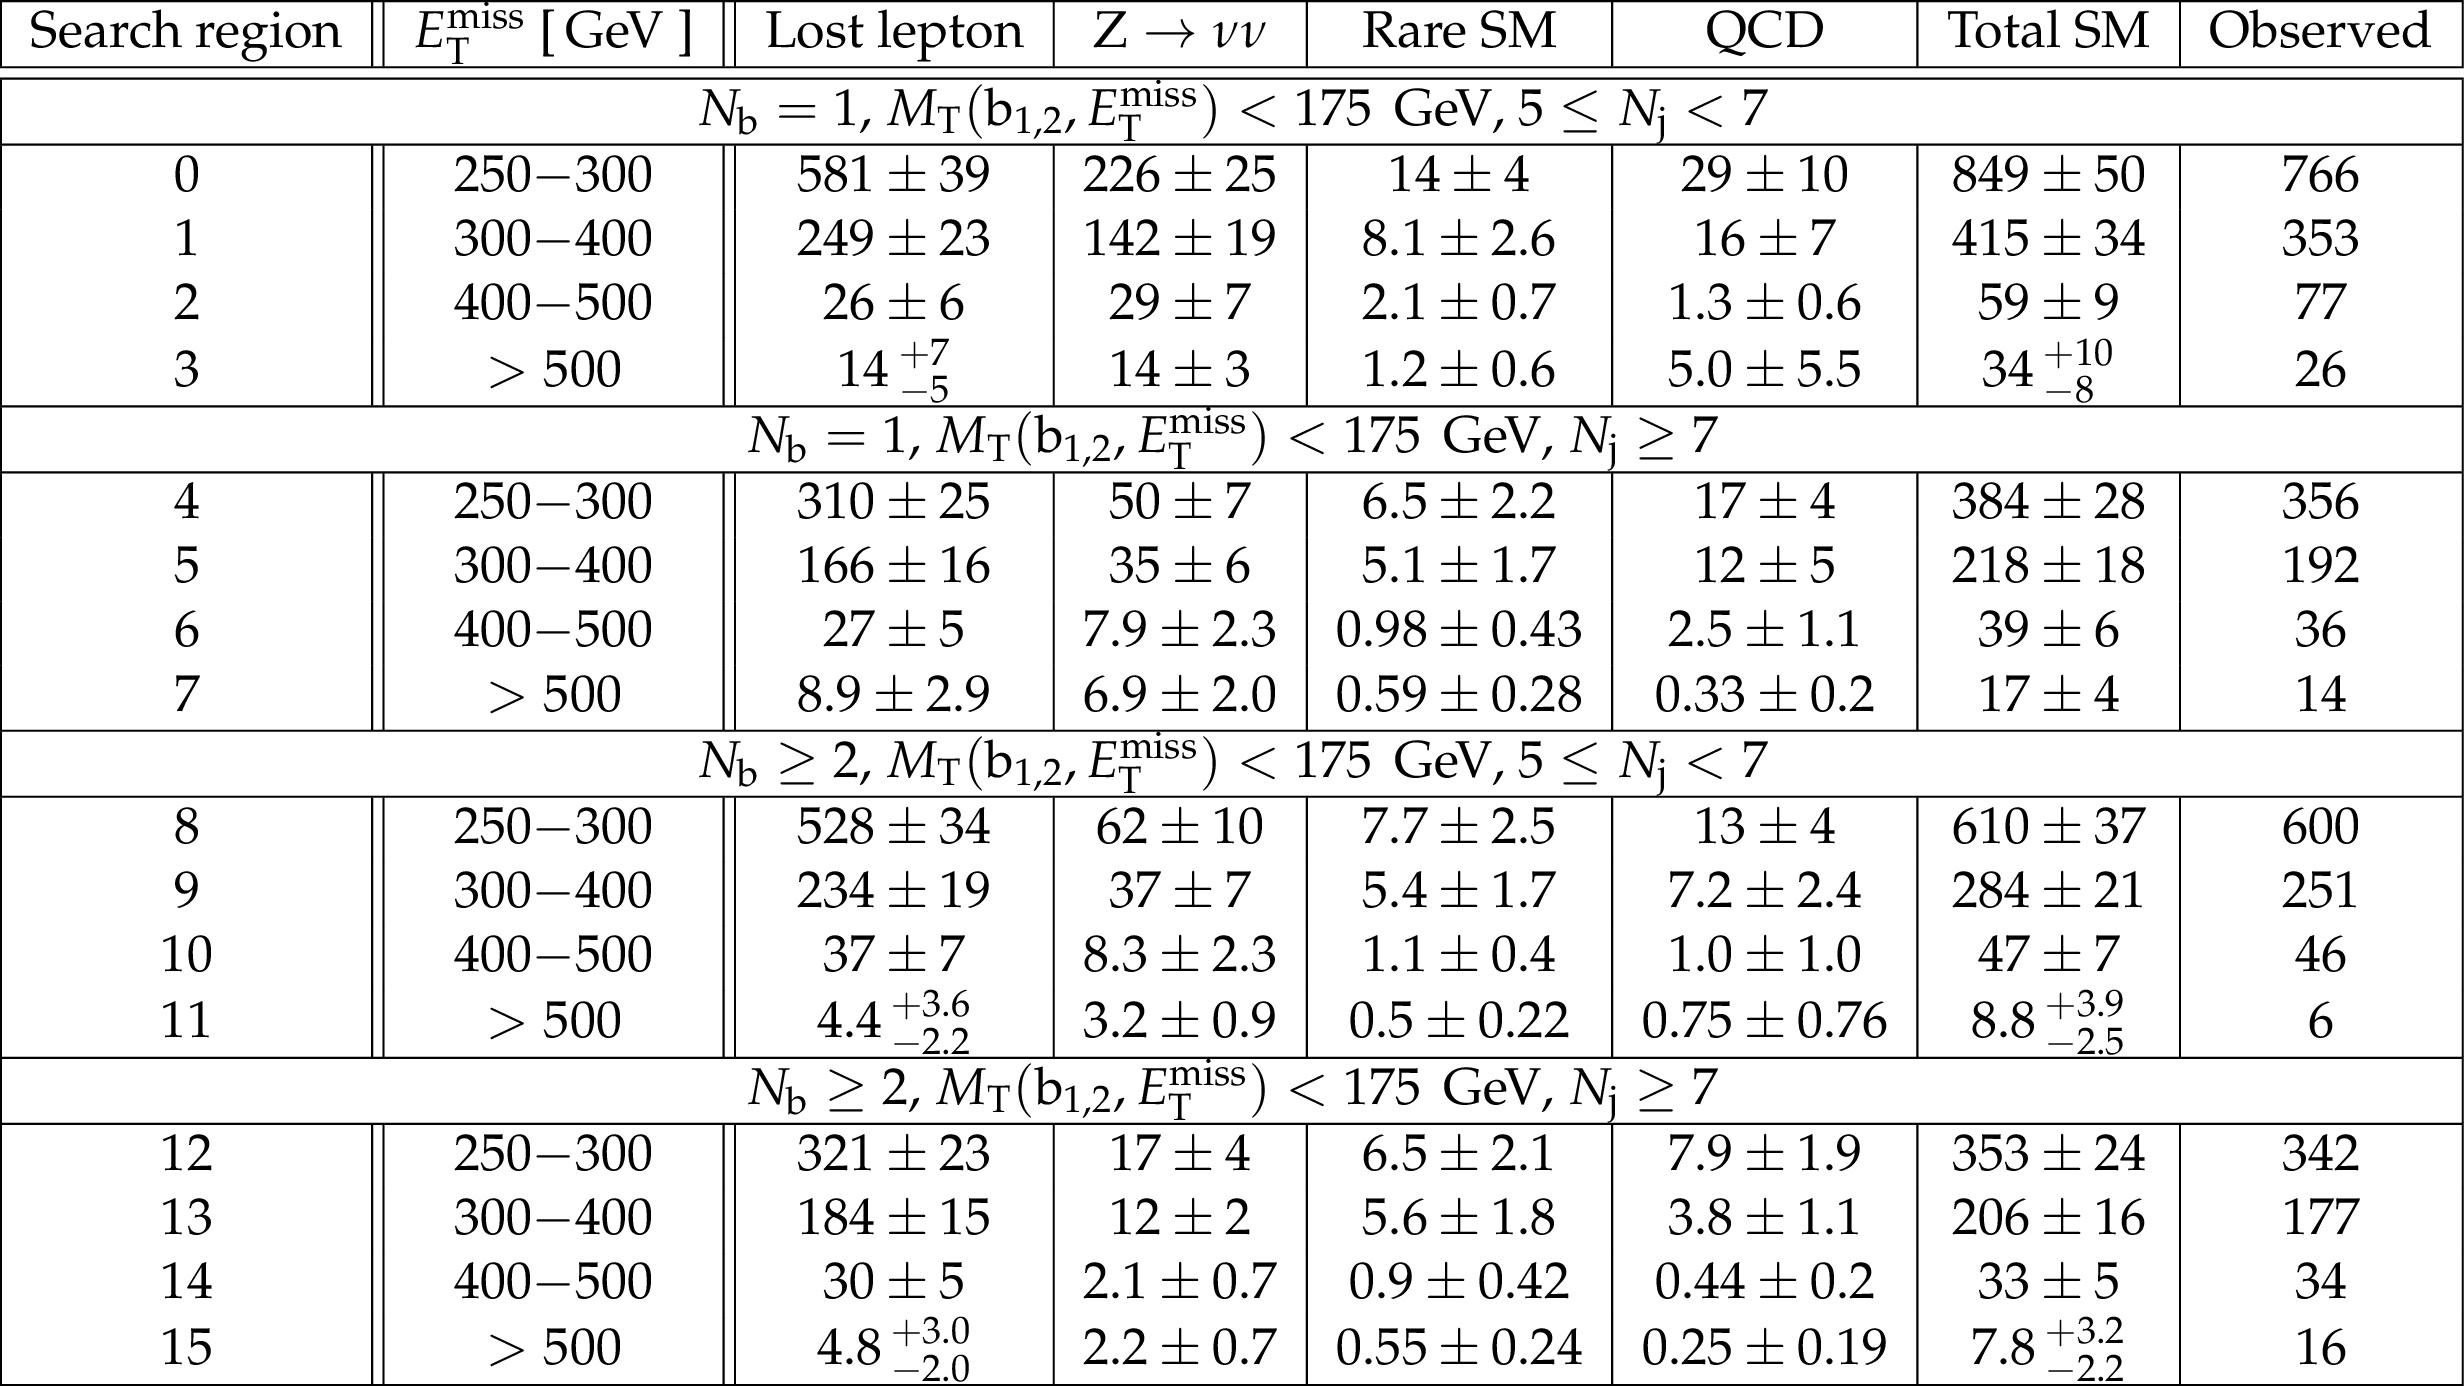
Table 4:
Predicted yields for each background with uncertainties in the $M_{\mathrm {T}}( {\mathrm {b}}_{1,2}$, ${E_{\mathrm {T}}^{\text {miss}}} )< $ 175 GeV regions of the high ${\Delta m}$ search. The number of events observed in data is given in the last column. |
png pdf |
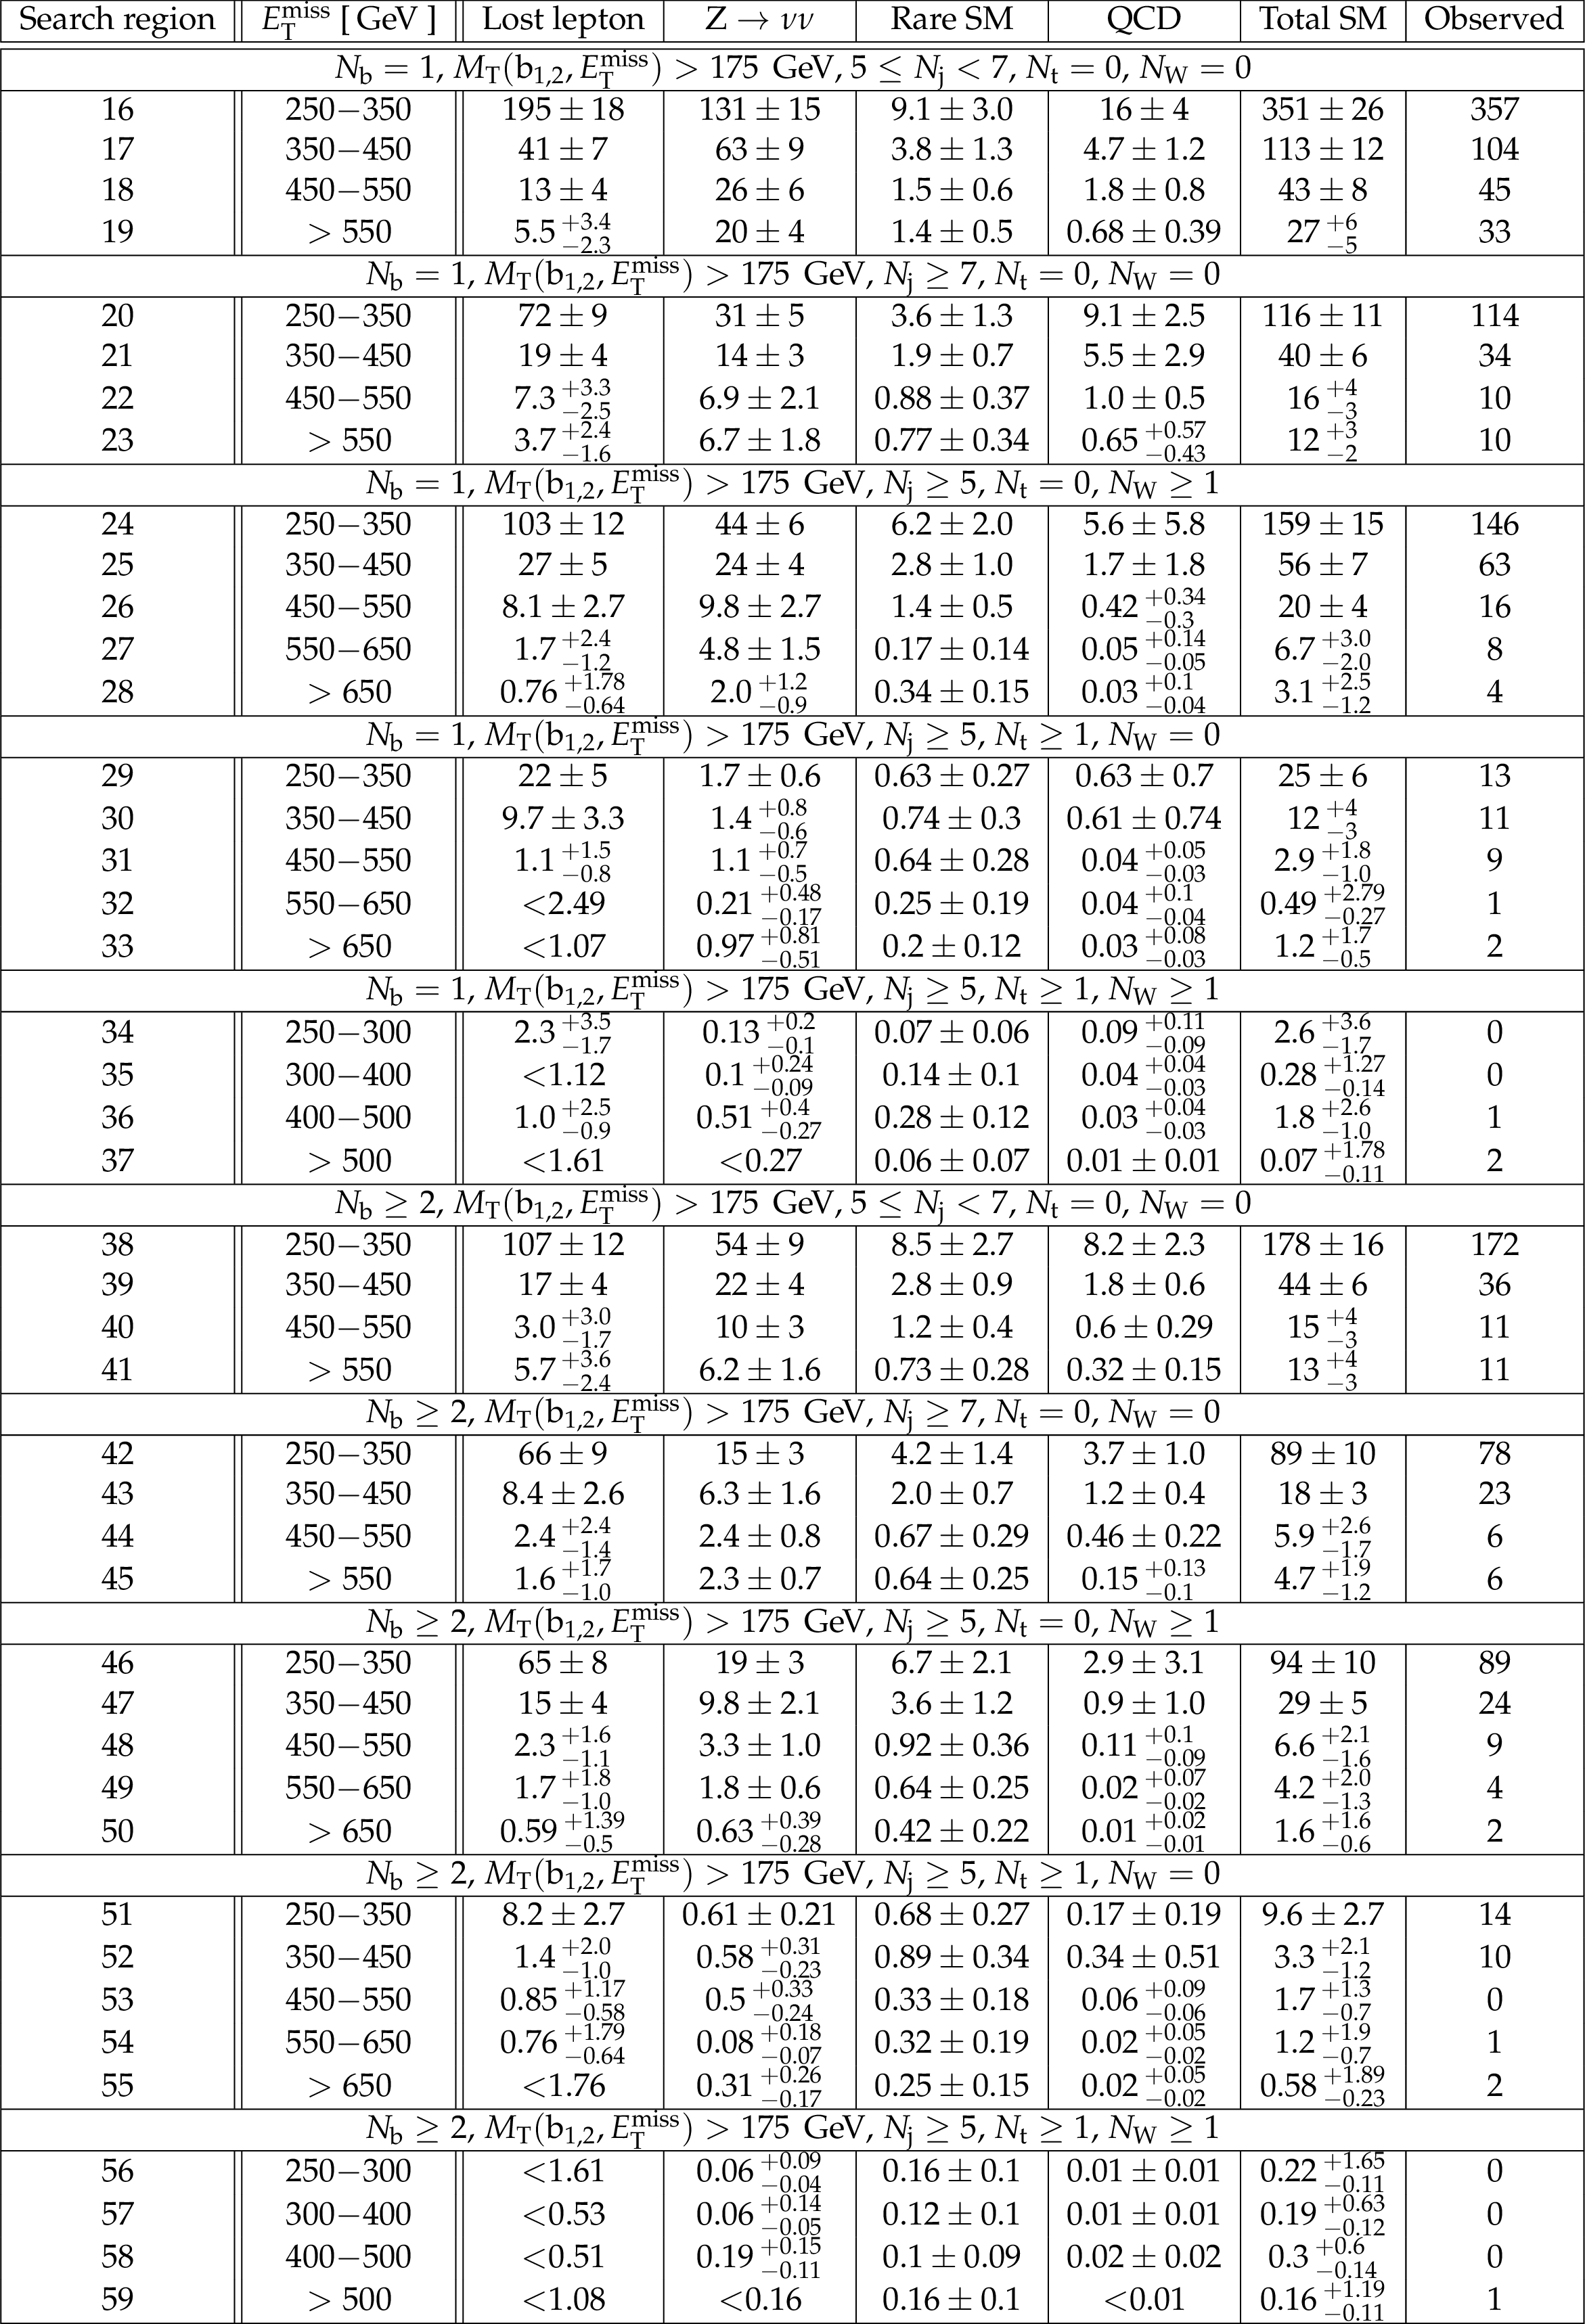
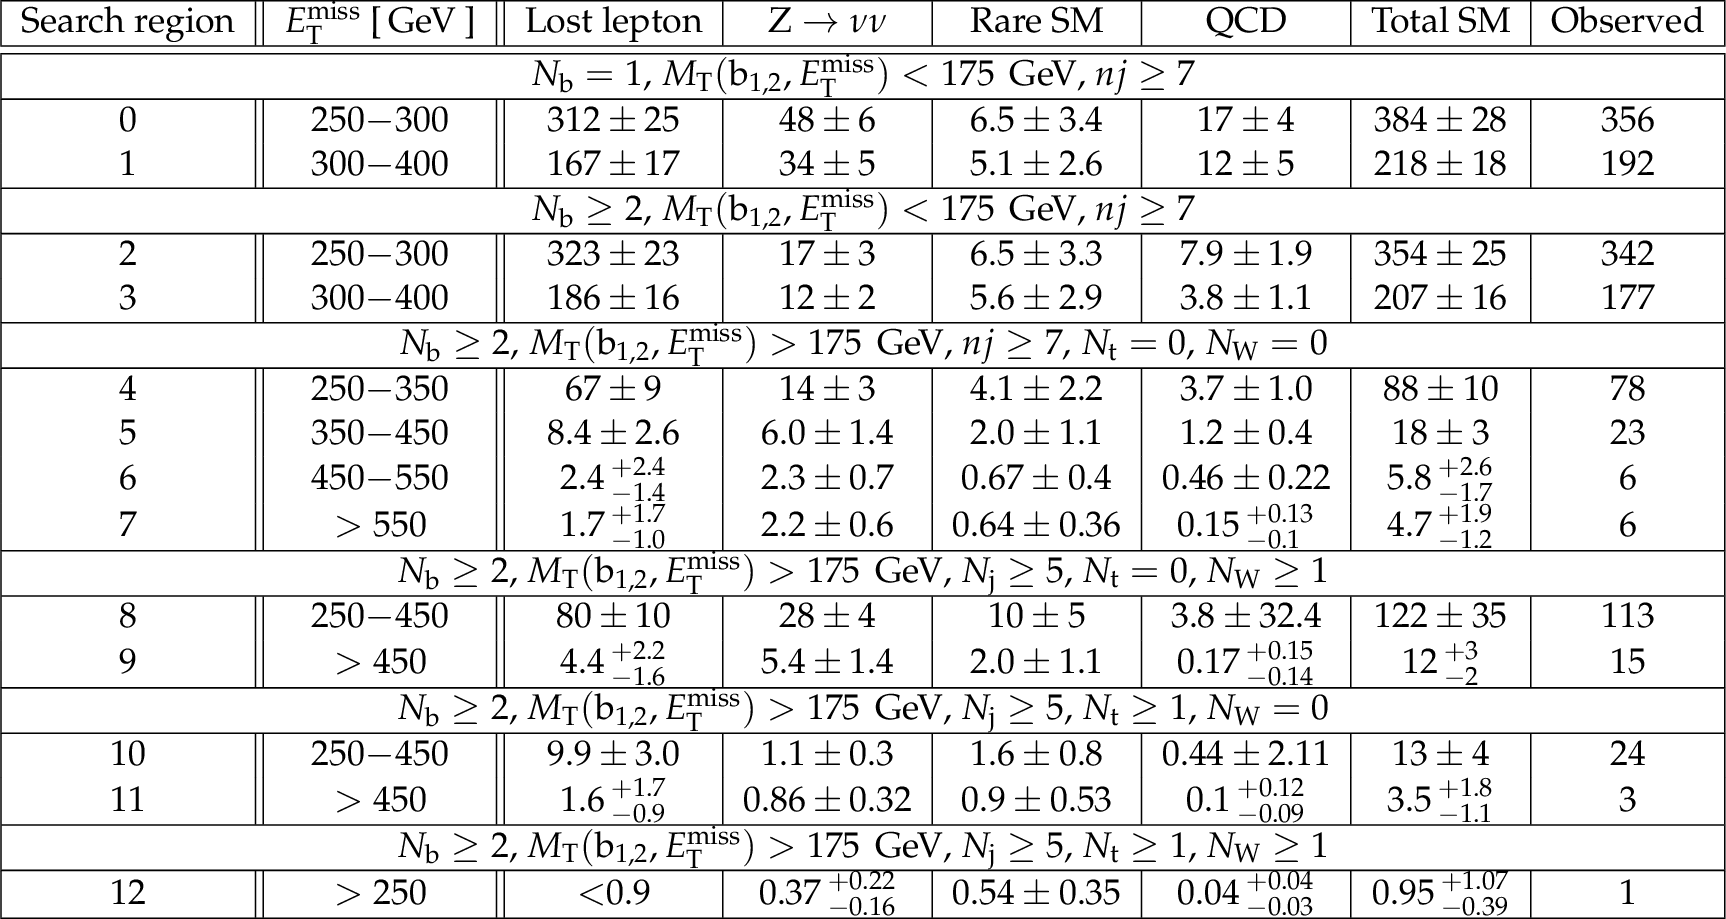
Table 5:
Predicted yields for each background with uncertainties in the $M_{\mathrm {T}}( {\mathrm {b}}_{1,2}$, ${E_{\mathrm {T}}^{\text {miss}}} )> $ 175 GeV regions of the high ${\Delta m}$ search. The number of events observed in data is given in the last column. |
png pdf |
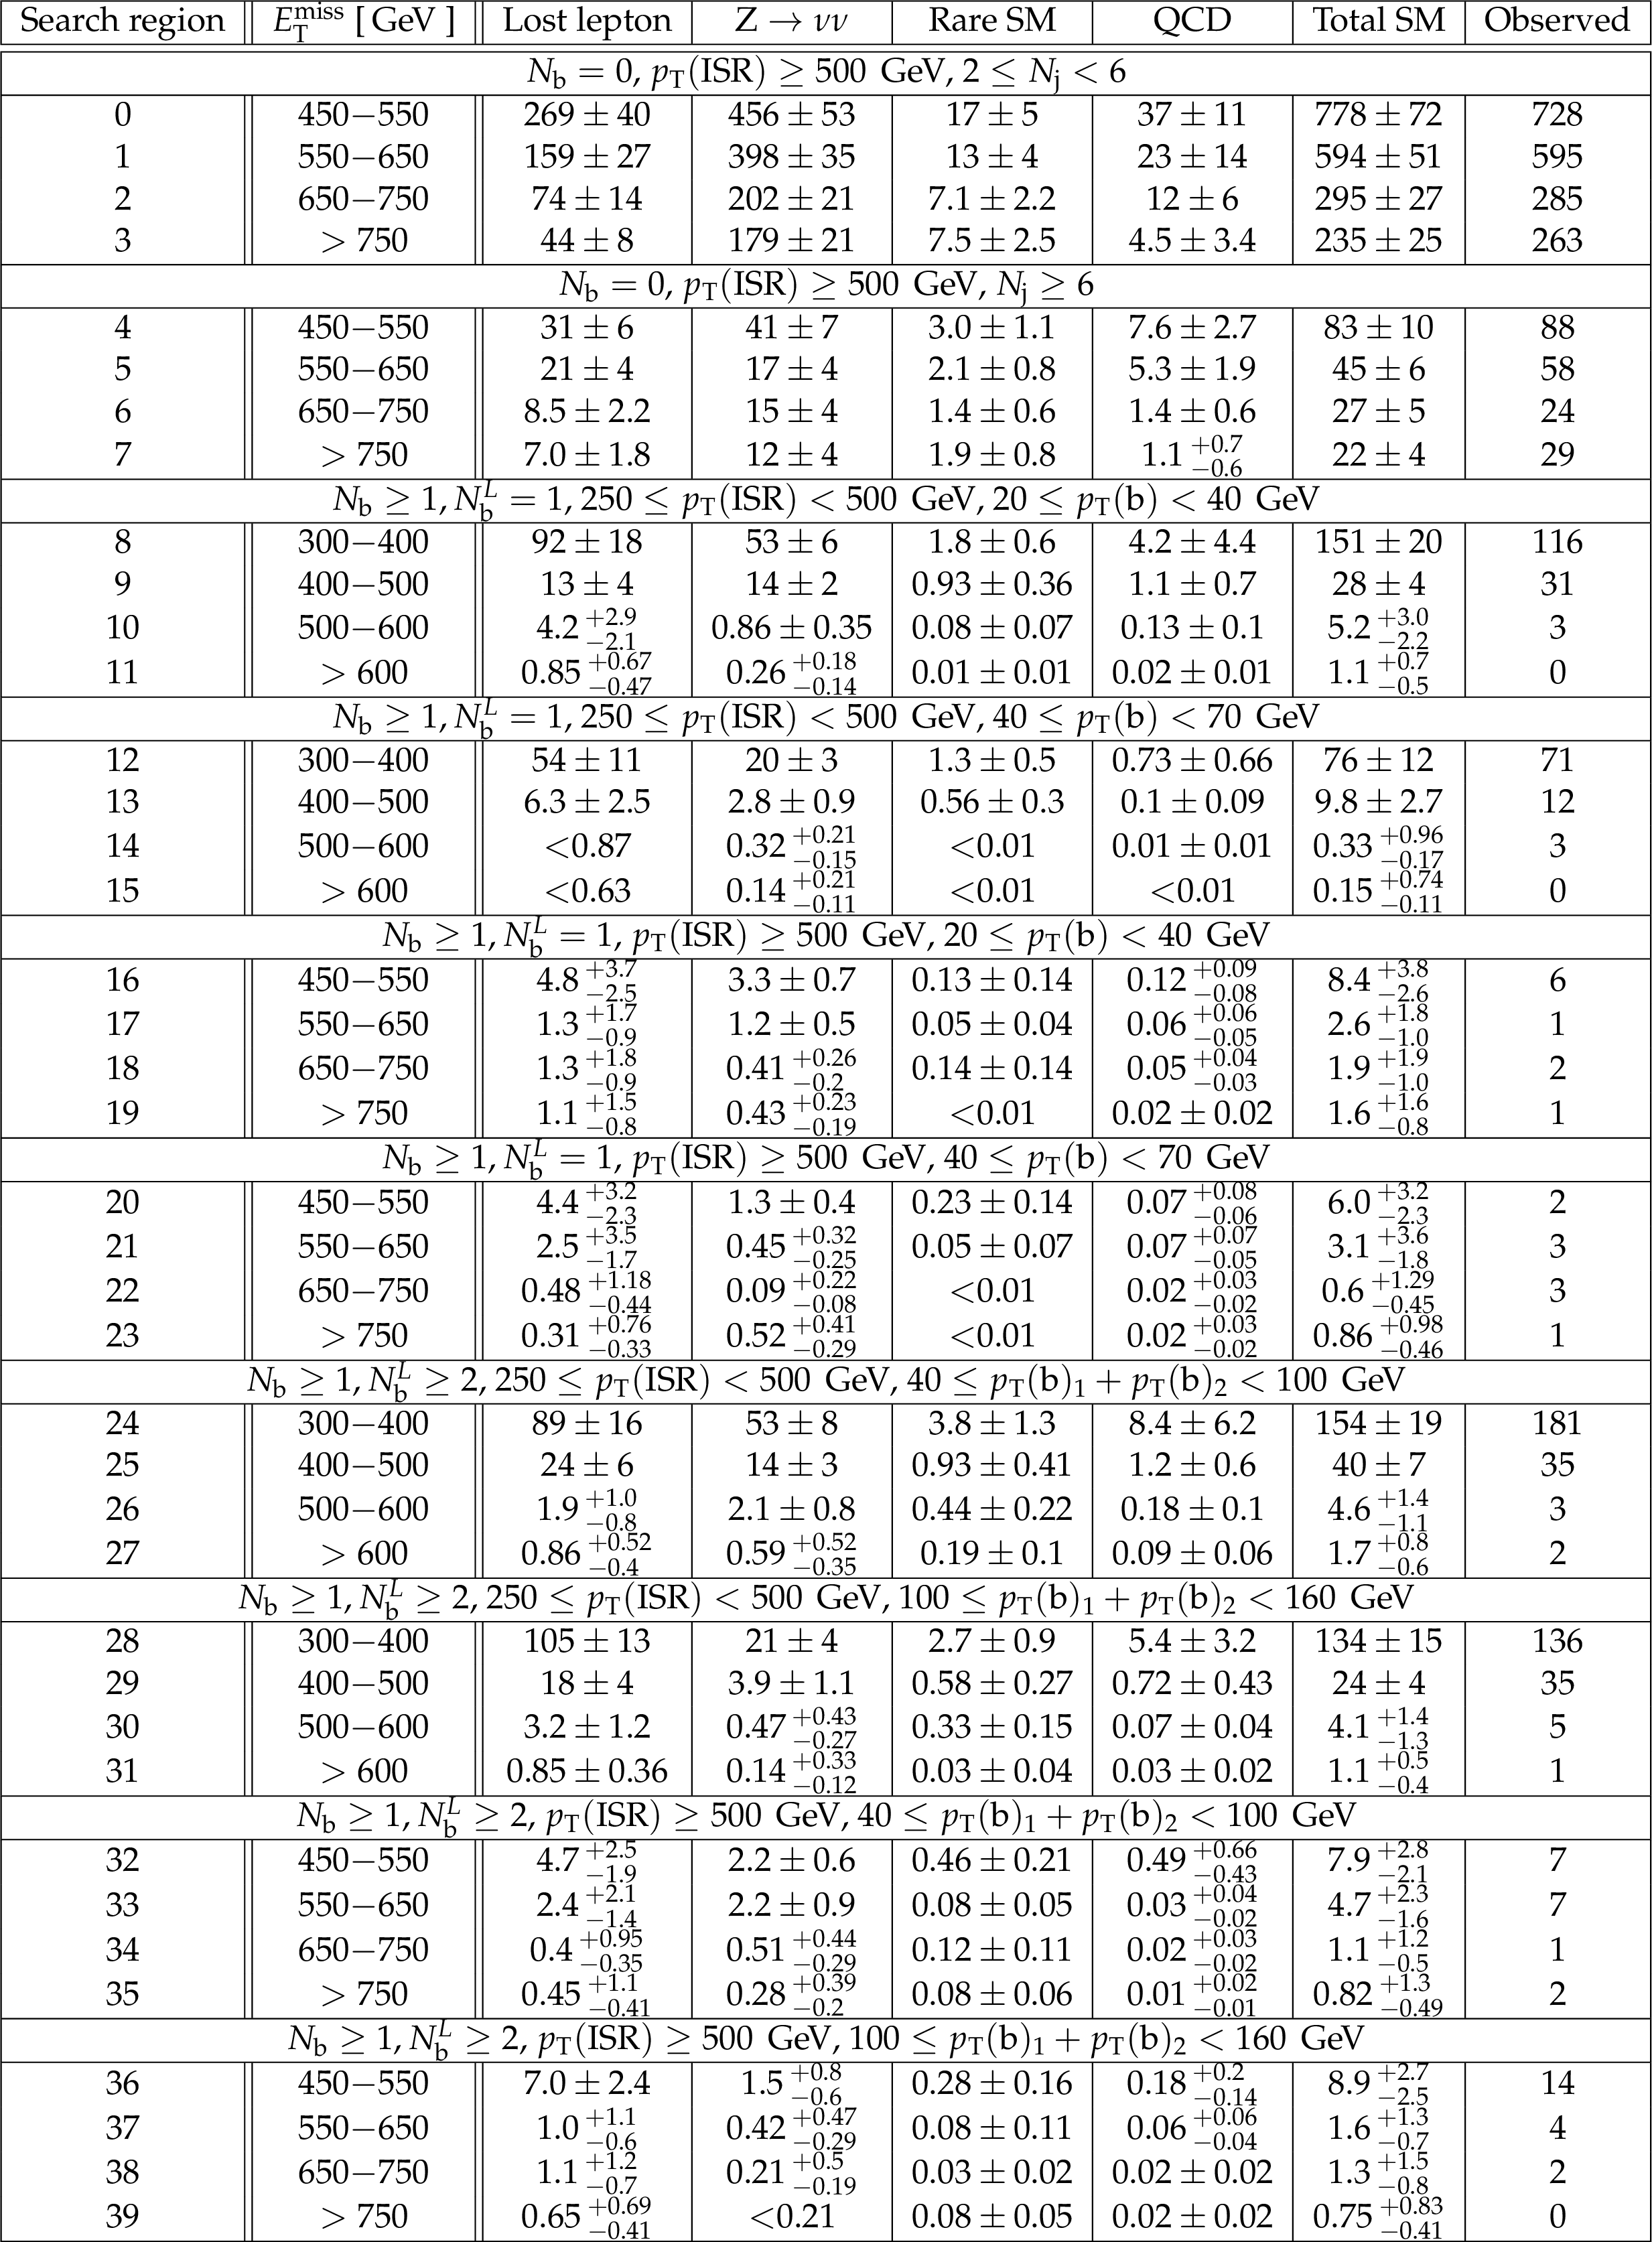
Table 6:
Predicted yields for each background with uncertainties in the low ${\Delta m}$ search regions. The number of events observed in data is given in the last column. |
png pdf |
Table 7:
Summary of the 13 disjoint aggregate search regions defined for the high ${\Delta m}$ analysis. |
png pdf |
Table 8:
Summary of the 12 disjoint aggregate search regions defined for the low ${\Delta m}$ analysis. |
png pdf |
Table 9:
Observed events and SM estimates for the aggregate search regions of the high ${\Delta m}$ analysis. |

png pdf |
Table 10:
Observed events and SM estimates for the aggregate search regions of the low ${\Delta m}$ analysis. |
| Summary |
| The results of a search for direct production of top squark pairs in the fully-hadronic final state have been presented, based on data collected in 2016 by the CMS detector in proton-proton collisions at a center-of-mass energy of 13 TeV. The data correspond to an integrated luminosity of 12.9 fb$^{-1}$. No significant excess of events beyond the expected contribution from standard model processes is observed, and exclusion limits are set in the context of simplified models of top squark production. Top squark masses up to 450 GeV are probed for a neutralino mass of 430 GeV in the scenario of a very compressed mass spectrum between the $\tilde{\mathrm{t}}_{1}$ and $\tilde{\chi}^0_1$ where the $\tilde{\mathrm{t}}_{1}$ decays via a four body decay. In the scenario of larger mass differences between the $\tilde{\mathrm{t}}_{1}$ and $\tilde{\chi}^0_1$ when the top squark decays to an on-shell top quark and a neutralino, top squark masses up to 860 GeV, and $\tilde{\chi}^0_1$ masses up to 320 GeV are probed. When the top squarks decay to a bottom quark and a $\tilde{\chi}^{\pm}_1$, top squark masses up to 740 GeV, and $\tilde{\chi}^0_1$ masses up to 260 GeV are probed. |
| References | ||||
| 1 | CMS Collaboration | Search for direct production of top squark pairs decaying to all-hadronic final states in pp collisions at sqrt(s) = 13 TeV | CMS-PAS-SUS-16-007 | CMS-PAS-SUS-16-007 |
| 2 | C. Balazs, M. Carena, and C. E. M. Wagner | Dark matter, light stops and electroweak baryogenesis | PRD 70 (2004) 015007 | hep-ph/0403224 |
| 3 | CMS Collaboration | Particle-Flow Event Reconstruction in CMS and Performance for Jets, Taus, and $ E_{\mathrm{T}}^{\text{miss}} $ | CDS | |
| 4 | CMS Collaboration | Commissioning of the Particle-flow Event Reconstruction with the first LHC collisions recorded in the CMS detector | CDS | |
| 5 | M. Cacciari, G. P. Salam, and G. Soyez | The anti-$ k_t $ jet clustering algorithm | JHEP 04 (2008) 063 | 0802.1189 |
| 6 | CMS Collaboration | Identification of b-quark jets with the CMS experiment | JINST 8 (2013) P04013 | CMS-BTV-12-001 1211.4462 |
| 7 | CMS Collaboration | Performance of $ \mathrm{b } $ tagging at $ \sqrt{s} = $ 8 TeV in multijet, $ \mathrm{ t \bar{t} } $ and boosted topology events | CMS-PAS-BTV-13-001 | CMS-PAS-BTV-13-001 |
| 8 | CMS Collaboration | Performance of electron reconstruction and selection with the CMS detector in proton-proton collisions at $ \sqrt{s} = 8 $$ TeV $ | JINST 10 (2015) P06005 | CMS-EGM-13-001 1502.02701 |
| 9 | CMS Collaboration | Performance of CMS muon reconstruction in $ pp $ collision events at $ \sqrt{s} = 7 $$ TeV $ | JINST 7 (2012) P10002 | CMS-MUO-10-004 1206.4071 |
| 10 | A. J. Larkoski, S. Marzani, G. Soyez, and J. Thaler | Soft Drop | JHEP 05 (2014) 146 | 1402.2657 |
| 11 | J. Thaler and K. Van Tilburg | Maximizing Boosted Top Identification by Minimizing N-subjettiness | JHEP 1202 (2012) 093 | 1108.2701 |
| 12 | J. Alwall et al. | MadGraph5: going beyond | JHEP 06 (2011) 128 | 1106.0522 |
| 13 | NNPDF Collaboration | Parton distributions for the LHC Run II | JHEP 04 (2015) 040 | 1410.8849 |
| 14 | P. Nason | A New method for combining NLO QCD with shower Monte Carlo algorithms | JHEP 11 (2004) 040 | hep-ph/0409146 |
| 15 | S. Frixione, P. Nason, and C. Oleari | Matching NLO QCD computations with Parton Shower simulations: the POWHEG method | JHEP 11 (2007) 070 | 0709.2092 |
| 16 | S. Alioli, P. Nason, C. Oleari, and E. Re | A general framework for implementing NLO calculations in shower Monte Carlo programs: the POWHEG BOX | JHEP 06 (2010) 043 | 1002.2581 |
| 17 | E. Re | Single-top Wt-channel production matched with parton showers using the POWHEG method | EPJC 71 (2011) 1547 | 1009.2450 |
| 18 | J. Alwall et al. | The automated computation of tree-level and next-to-leading order differential cross sections, and their matching to parton shower simulations | JHEP 07 (2014) 079 | 1405.0301 |
| 19 | T. Sjostrand, S. Mrenna, and P. Z. Skands | A Brief Introduction to PYTHIA 8.1 | CPC 178 (2008) 852--867 | 0710.3820 |
| 20 | GEANT4 Collaboration | GEANT4---a simulation toolkit | NIMA 506 (2003) 250 | |
| 21 | S. Abdullin et al. | The fast simulation of the CMS detector at LHC | J. Phys. Conf. Ser. 331 (2011) 032049 | |
| 22 | C. Borschensky et al. | Squark and gluino production cross sections in pp collisions at $ \sqrt{s} $ = 13, 14, 33 and 100 TeV | EPJC 74 (2014) 3174 | 1407.5066 |
| 23 | CMS Collaboration | Identification of b quark jets at the CMS Experiment in the LHC Run 2 | CMS-PAS-BTV-15-001 | CMS-PAS-BTV-15-001 |
| 24 | CMS Collaboration | Observation of top quark pairs produced in association with a vector boson in pp collisions at $ \sqrt{s}=8 $ TeV | JHEP 01 (2016) 096 | CMS-TOP-14-021 1510.01131 |
| 25 | ATLAS and CMS Collaborations | Procedure for the LHC Higgs boson search combination in summer 2011 | Technical Report ATL-PHYS-PUB-2011-011, CMS NOTE-2011/005 | |
|
|
Compact Muon Solenoid LHC, CERN |
|

|

|

|

|

|