

Compact Muon Solenoid
LHC, CERN
| CMS-PAS-TOP-16-003 | ||
| Measurement of the inclusive cross section of single top-quark production in the $t$-channel at 13 TeV | ||
| CMS Collaboration | ||
| March 2016 | ||
| Abstract: The $t$ channel single top quark production cross section is measured in proton proton collisions at 13 TeV with the CMS detector at the CERN LHC. The analyzed data correspond to an integrated luminosity of 2.3 fb$^{-1}$. After a selection optimized for the $t$ channel single top quark production with a muon+jets signature in the final state, several kinematic variables are combined into one multivariate discriminator optimized to separate signal from background events. A fit to the distribution of the discriminating variable yields cross sections of $\sigma_{t\textrm{-ch.,t}} =$ 141.5 $\pm$ 6.7 (stat) $\pm$ 9.4 (exp) $^{+19.3}_{-19.6}$ (theo) $\pm$ 3.8 (lumi) pb and $\sigma_{t\textrm{-ch.,}\bar{\textrm{t}}} =$ 81.0 $\pm$ 6.2 (stat) $\pm$ 8.1 (exp) $^{+10.9}_{-10.9}$ (theo) $\pm$ 2.2 (lumi) pb for the production of single top quarks and single top anti-quarks, respectively. From the measured inclusive cross section, $\sigma_{t\textrm{-ch.}} =$ 227.8 $\pm$ 9.1 (stat) $\pm$ 14.0 (exp) $^{+28.7}_{-27.7}$ (theo) $\pm$ 6.2 (lumi) pb, and the predicted value the CKM matrix element $V_{\mathrm{tb}}$ is calculated to be $|V_{\mathrm{tb}}| =$ 1.02 $\pm$ 0.07 (exp) $\pm$ 0.02 (theo). All results are in agreement with the standard model predictions. | ||
|
Links:
CDS record (PDF) ;
inSPIRE record ;
CADI line (restricted) ;
These preliminary results are superseded in this paper, PLB 772 (2017) 752. The superseded preliminary plots can be found here. |
||
| Figures | |
png pdf |
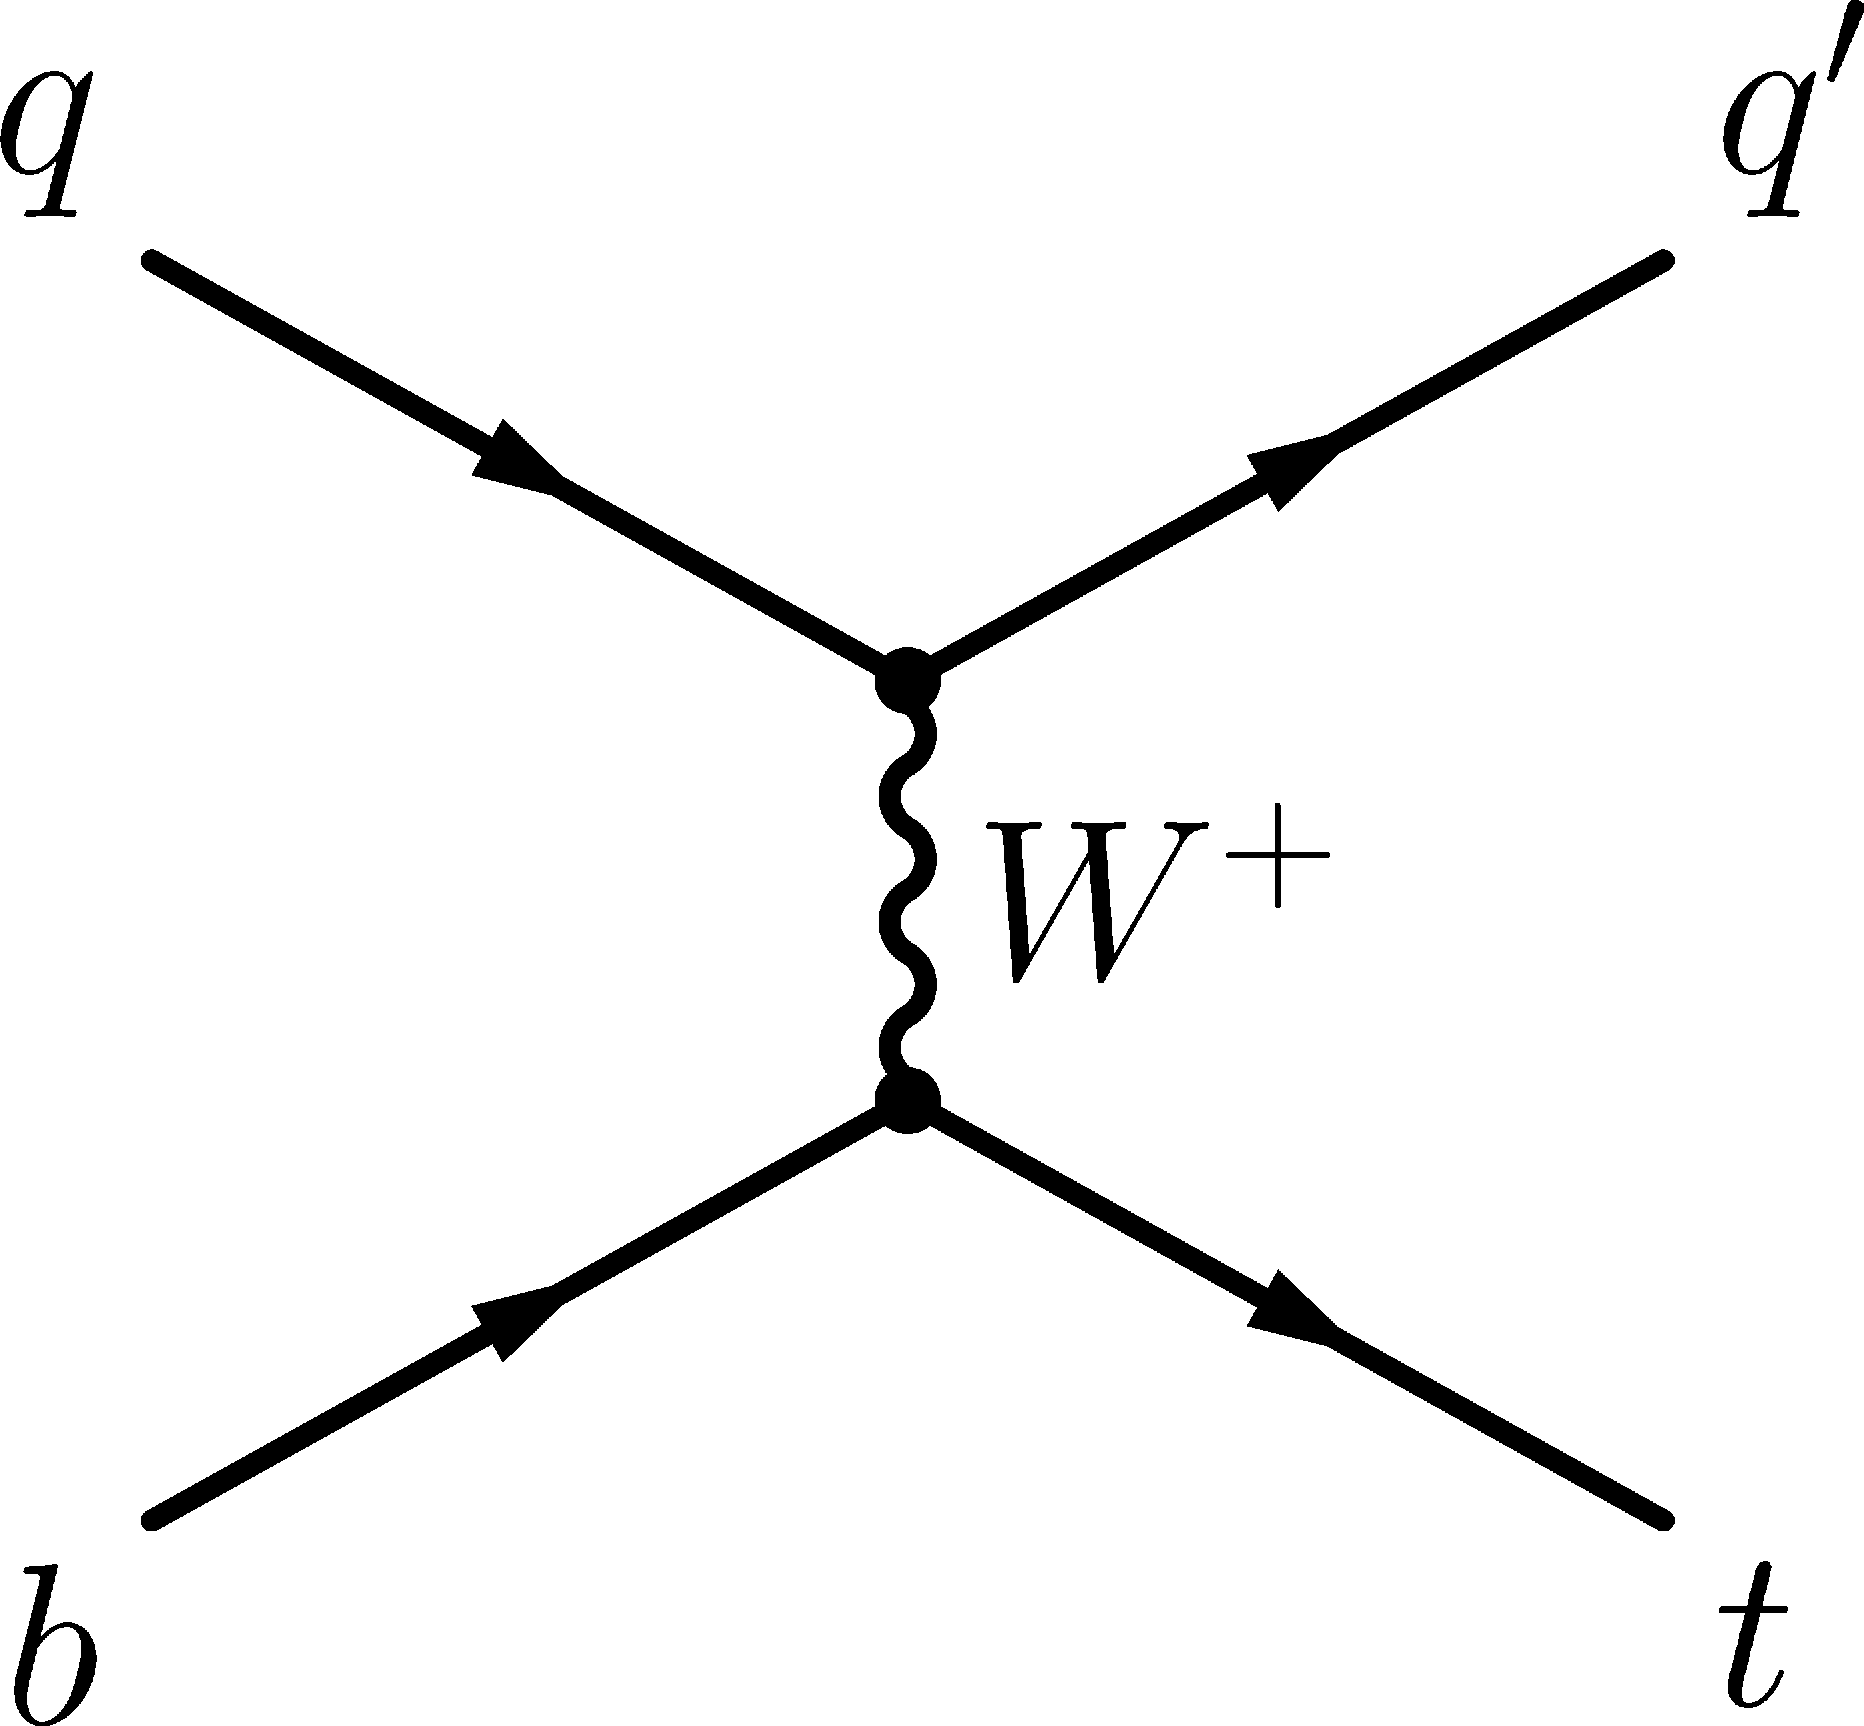
Figure 1-a:
Feynman diagrams for single top quark production in the $t$ channel: (a) 2$\rightarrow $2 and (b) 2$\rightarrow $3 processes. |

png pdf |
Figure 1-b:
Feynman diagrams for single top quark production in the $t$ channel: (a) 2$\rightarrow $2 and (b) 2$\rightarrow $3 processes. |

png pdf |
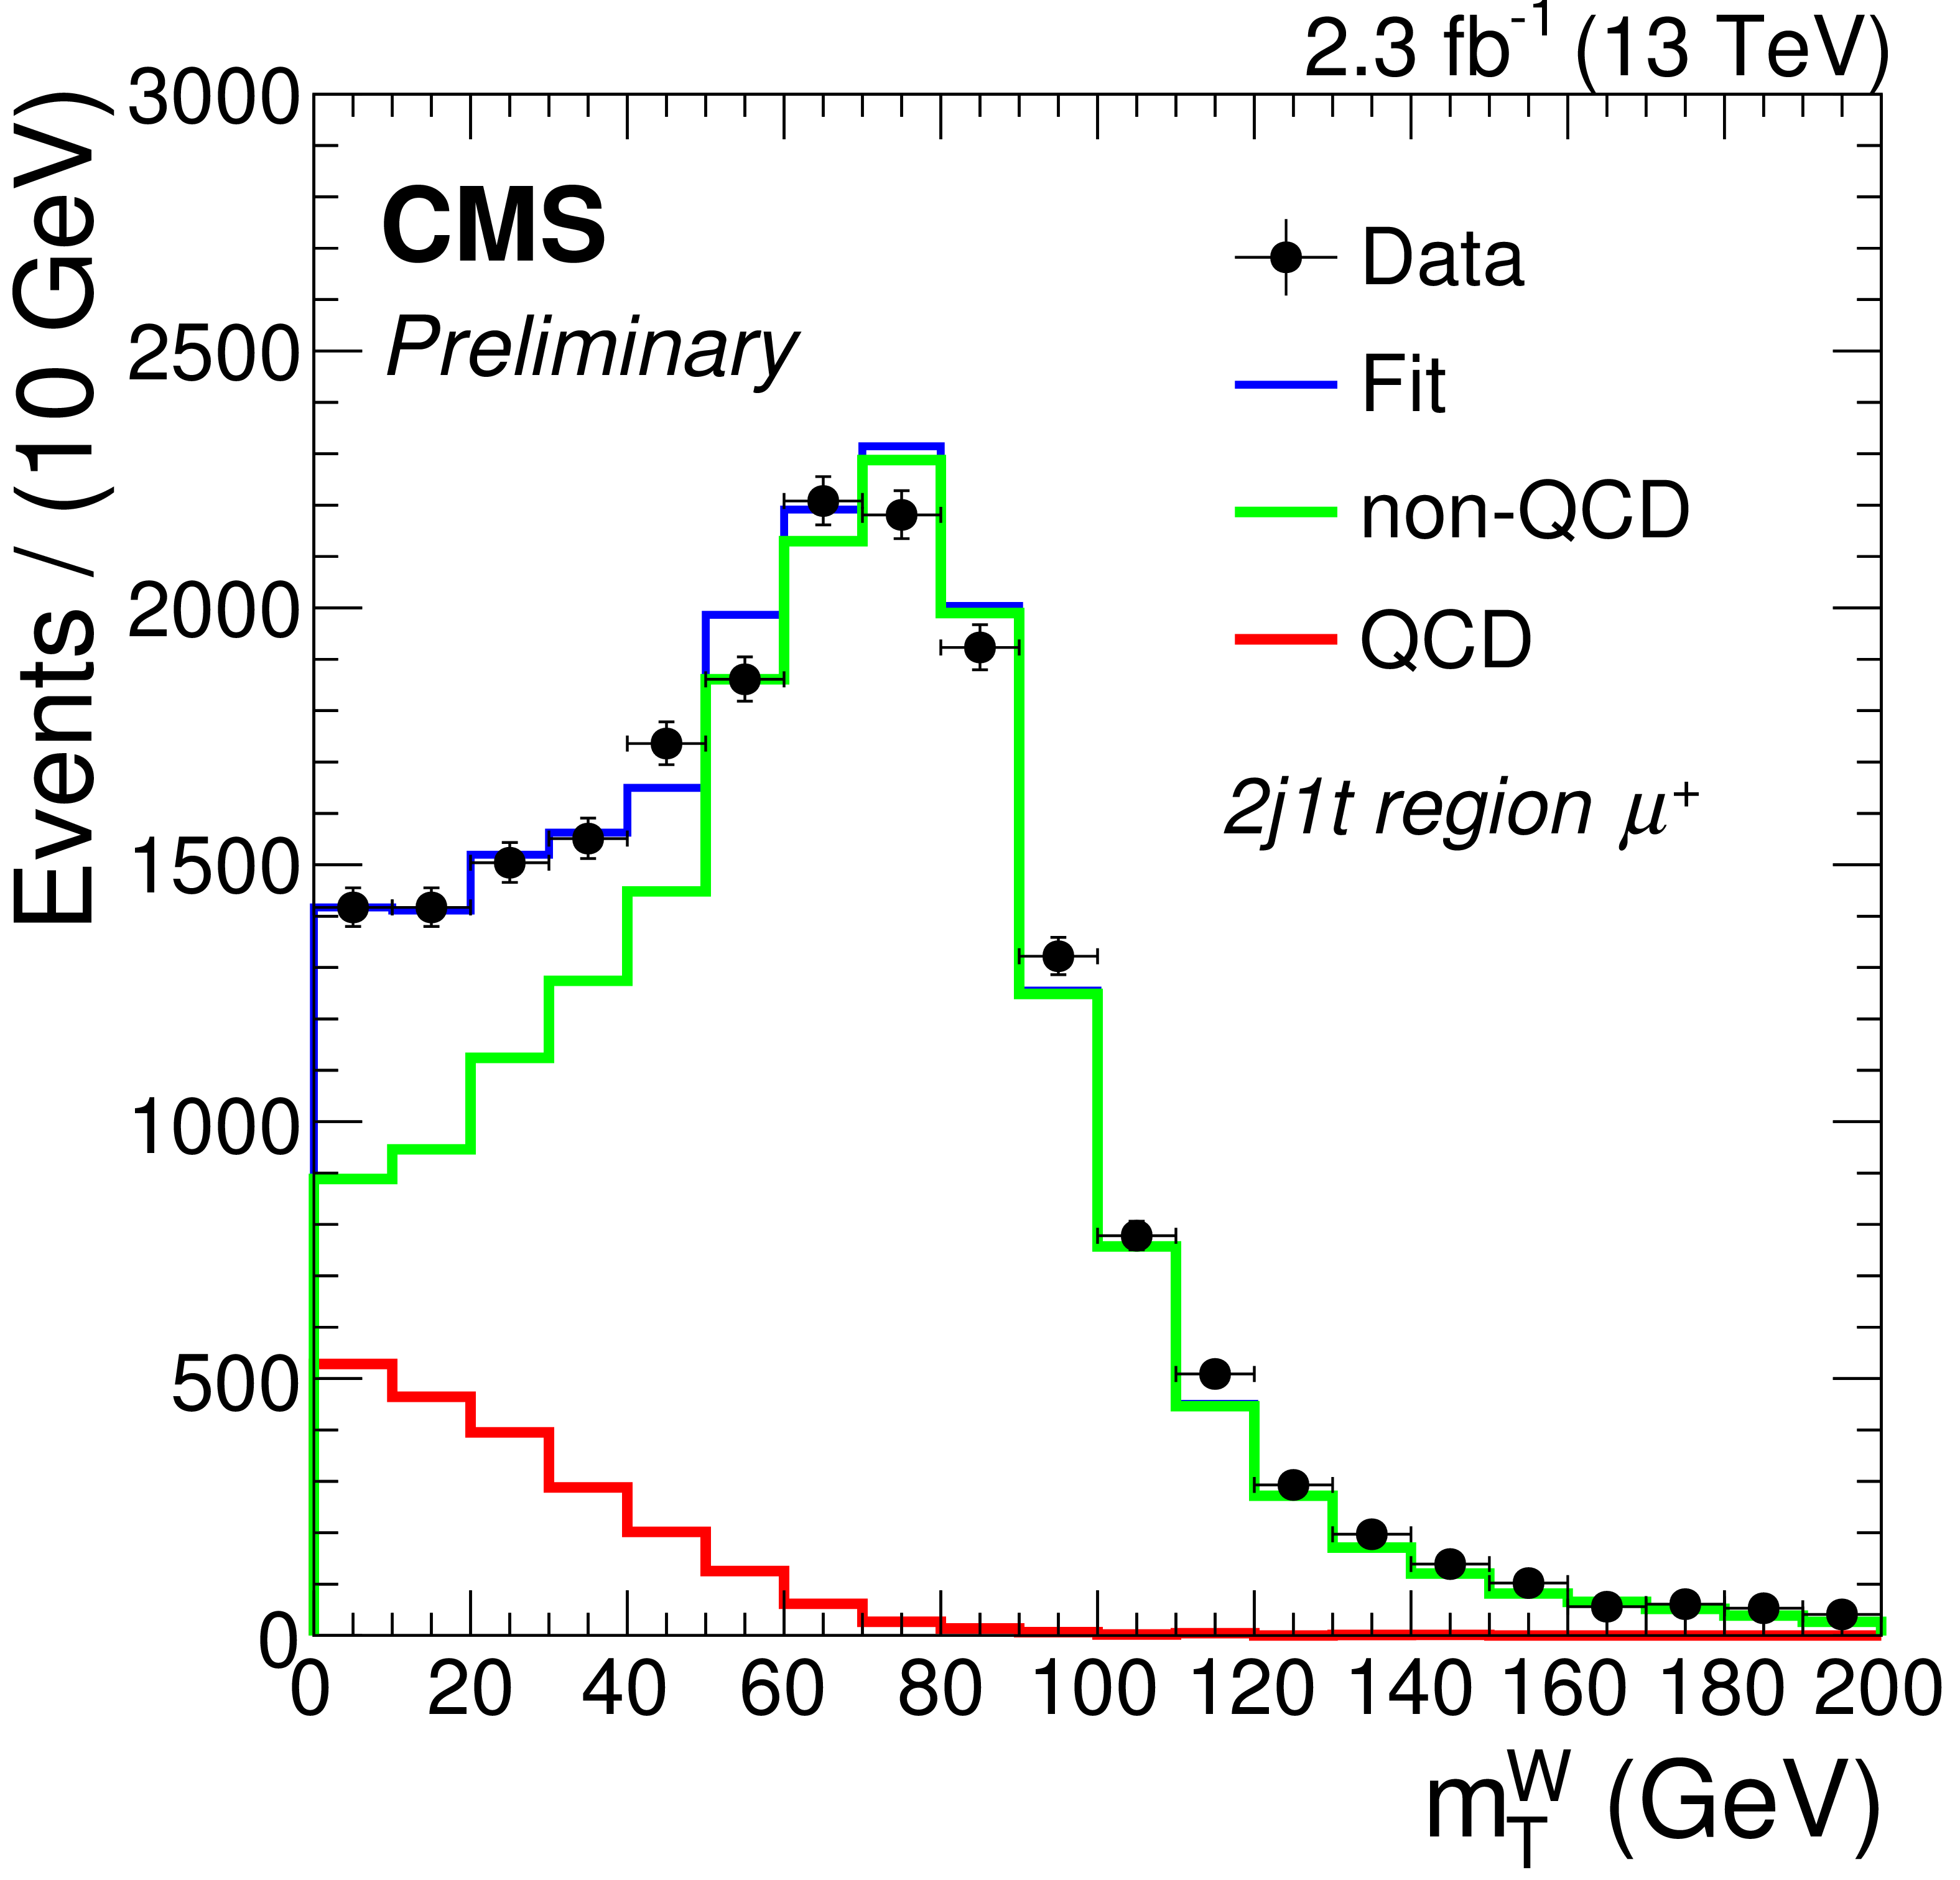
Figure 2-a:
Fit to the $ {m_{\mathrm {\rm T}}^{\rm W}} $ distributions in the 2-jets-1-tag sample (a), for positively charged muons only (b), and for negatively charged muons only (c). The QCD fit template is derived from a sideband region in data. Only statistical uncertainties are taken into account in the fit. |
png pdf |
Figure 2-b:
Fit to the $ {m_{\mathrm {\rm T}}^{\rm W}} $ distributions in the 2-jets-1-tag sample (a), for positively charged muons only (b), and for negatively charged muons only (c). The QCD fit template is derived from a sideband region in data. Only statistical uncertainties are taken into account in the fit. |
png pdf |
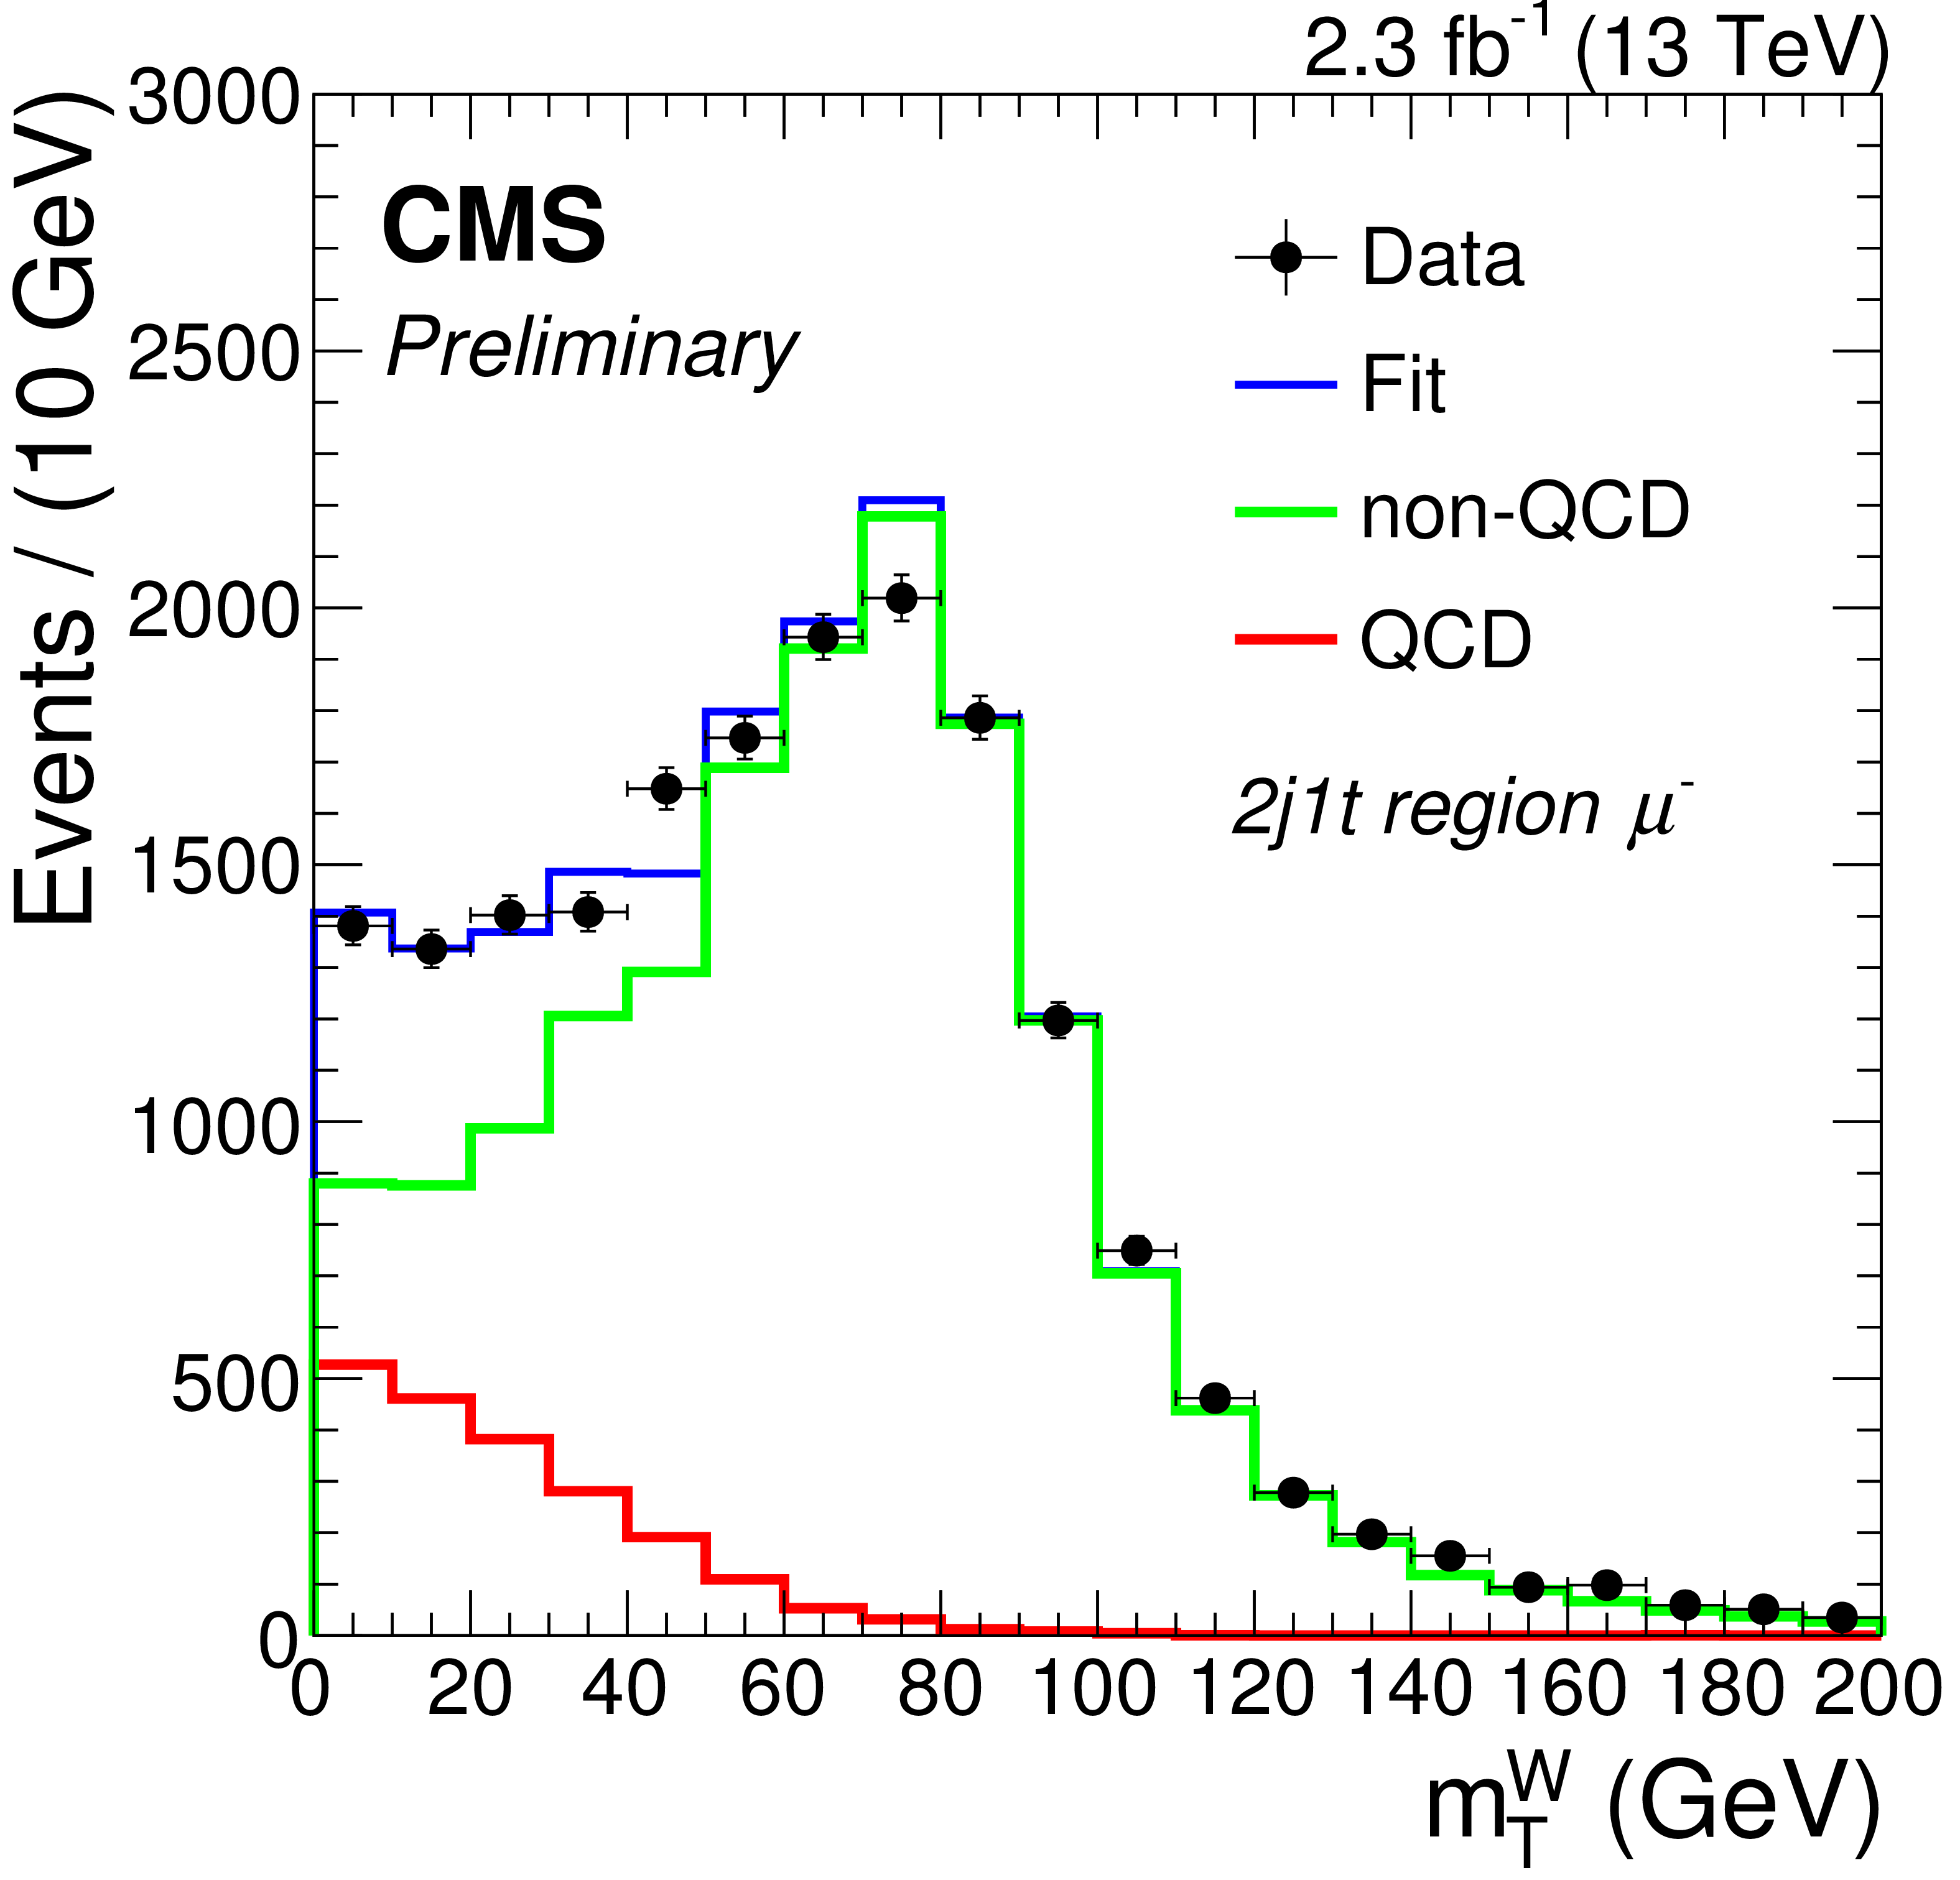
Figure 2-c:
Fit to the $ {m_{\mathrm {\rm T}}^{\rm W}} $ distributions in the 2-jets-1-tag sample (a), for positively charged muons only (b), and for negatively charged muons only (c). The QCD fit template is derived from a sideband region in data. Only statistical uncertainties are taken into account in the fit. |
png pdf |
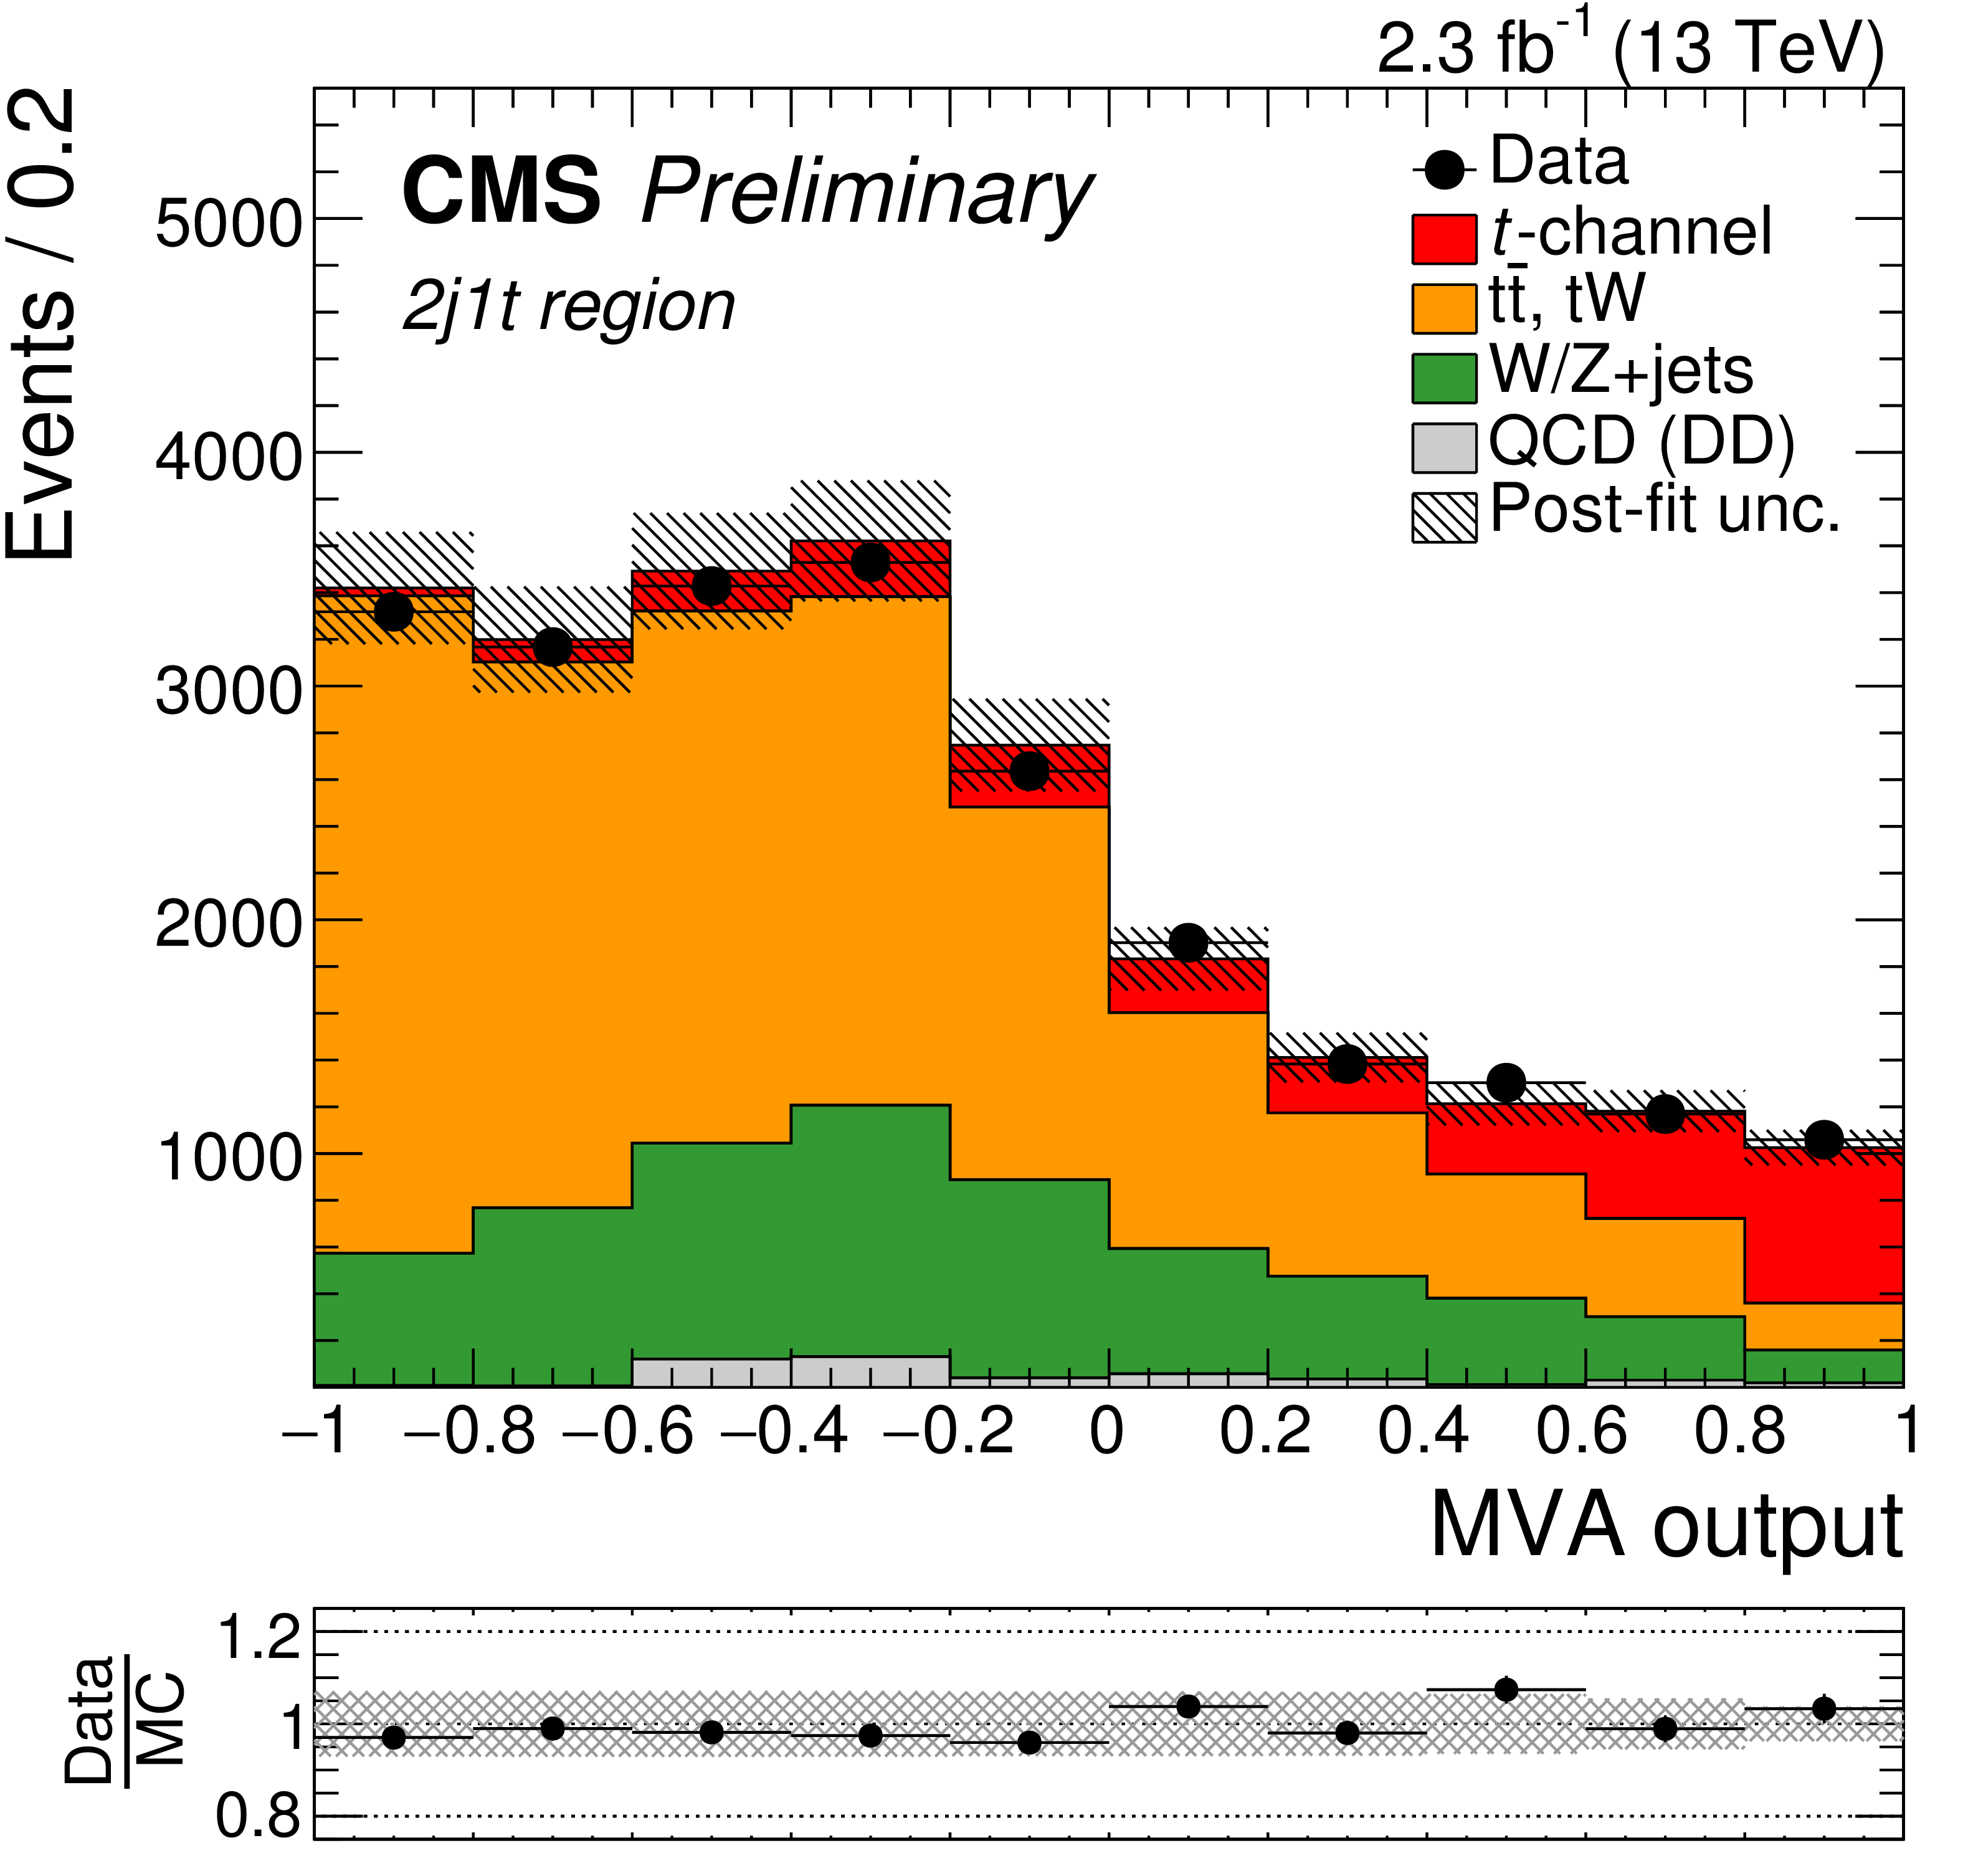
Figure 3-a:
Neural network distributions for all (a,d,g), positively (b,e,h) and negatively charged muons (c,f,i) normalized to the yields obtained from the simultaneous fit in the 2j1t (a,b,c), 3j1t (d,e,f) and 3j2t region (g,h,i). The shaded areas indicate the post-fit uncertainties. |

png pdf |
Figure 3-b:
Neural network distributions for all (a,d,g), positively (b,e,h) and negatively charged muons (c,f,i) normalized to the yields obtained from the simultaneous fit in the 2j1t (a,b,c), 3j1t (d,e,f) and 3j2t region (g,h,i). The shaded areas indicate the post-fit uncertainties. |
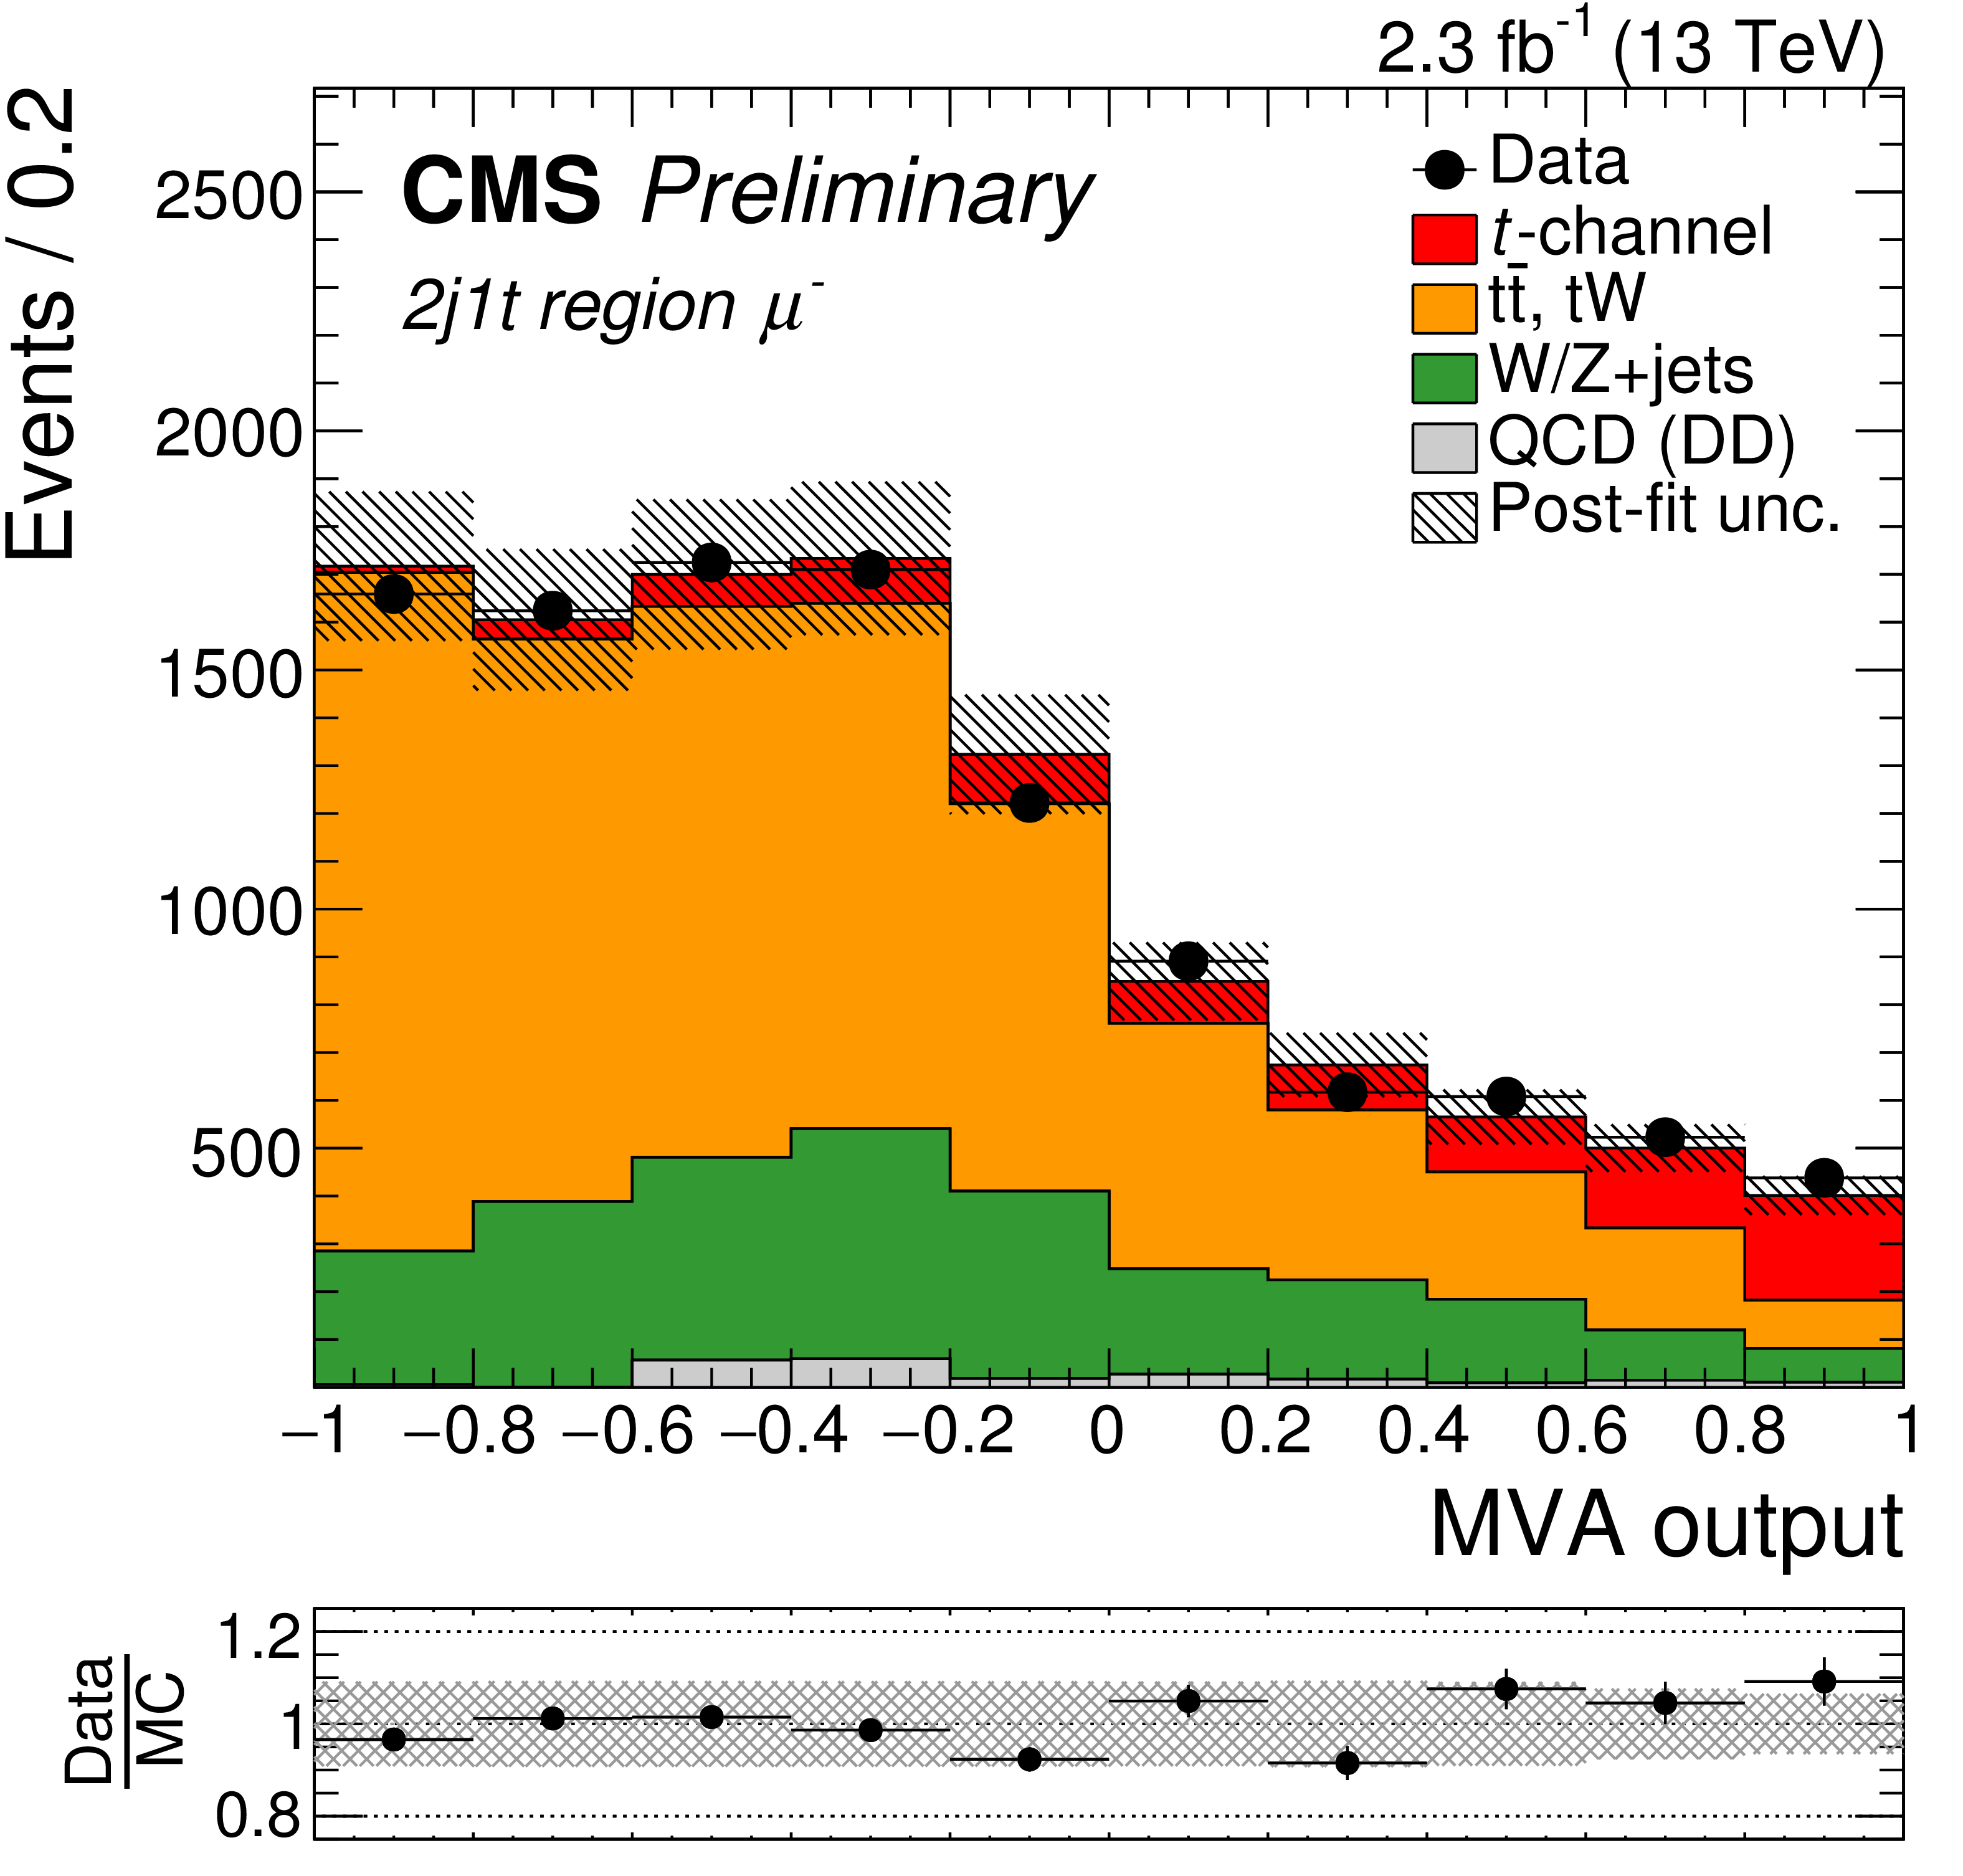
png pdf |
Figure 3-c:
Neural network distributions for all (a,d,g), positively (b,e,h) and negatively charged muons (c,f,i) normalized to the yields obtained from the simultaneous fit in the 2j1t (a,b,c), 3j1t (d,e,f) and 3j2t region (g,h,i). The shaded areas indicate the post-fit uncertainties. |

png pdf |
Figure 3-d:
Neural network distributions for all (a,d,g), positively (b,e,h) and negatively charged muons (c,f,i) normalized to the yields obtained from the simultaneous fit in the 2j1t (a,b,c), 3j1t (d,e,f) and 3j2t region (g,h,i). The shaded areas indicate the post-fit uncertainties. |

png pdf |
Figure 3-e:
Neural network distributions for all (a,d,g), positively (b,e,h) and negatively charged muons (c,f,i) normalized to the yields obtained from the simultaneous fit in the 2j1t (a,b,c), 3j1t (d,e,f) and 3j2t region (g,h,i). The shaded areas indicate the post-fit uncertainties. |

png pdf |
Figure 3-f:
Neural network distributions for all (a,d,g), positively (b,e,h) and negatively charged muons (c,f,i) normalized to the yields obtained from the simultaneous fit in the 2j1t (a,b,c), 3j1t (d,e,f) and 3j2t region (g,h,i). The shaded areas indicate the post-fit uncertainties. |

png pdf |
Figure 3-g:
Neural network distributions for all (a,d,g), positively (b,e,h) and negatively charged muons (c,f,i) normalized to the yields obtained from the simultaneous fit in the 2j1t (a,b,c), 3j1t (d,e,f) and 3j2t region (g,h,i). The shaded areas indicate the post-fit uncertainties. |

png pdf |
Figure 3-h:
Neural network distributions for all (a,d,g), positively (b,e,h) and negatively charged muons (c,f,i) normalized to the yields obtained from the simultaneous fit in the 2j1t (a,b,c), 3j1t (d,e,f) and 3j2t region (g,h,i). The shaded areas indicate the post-fit uncertainties. |
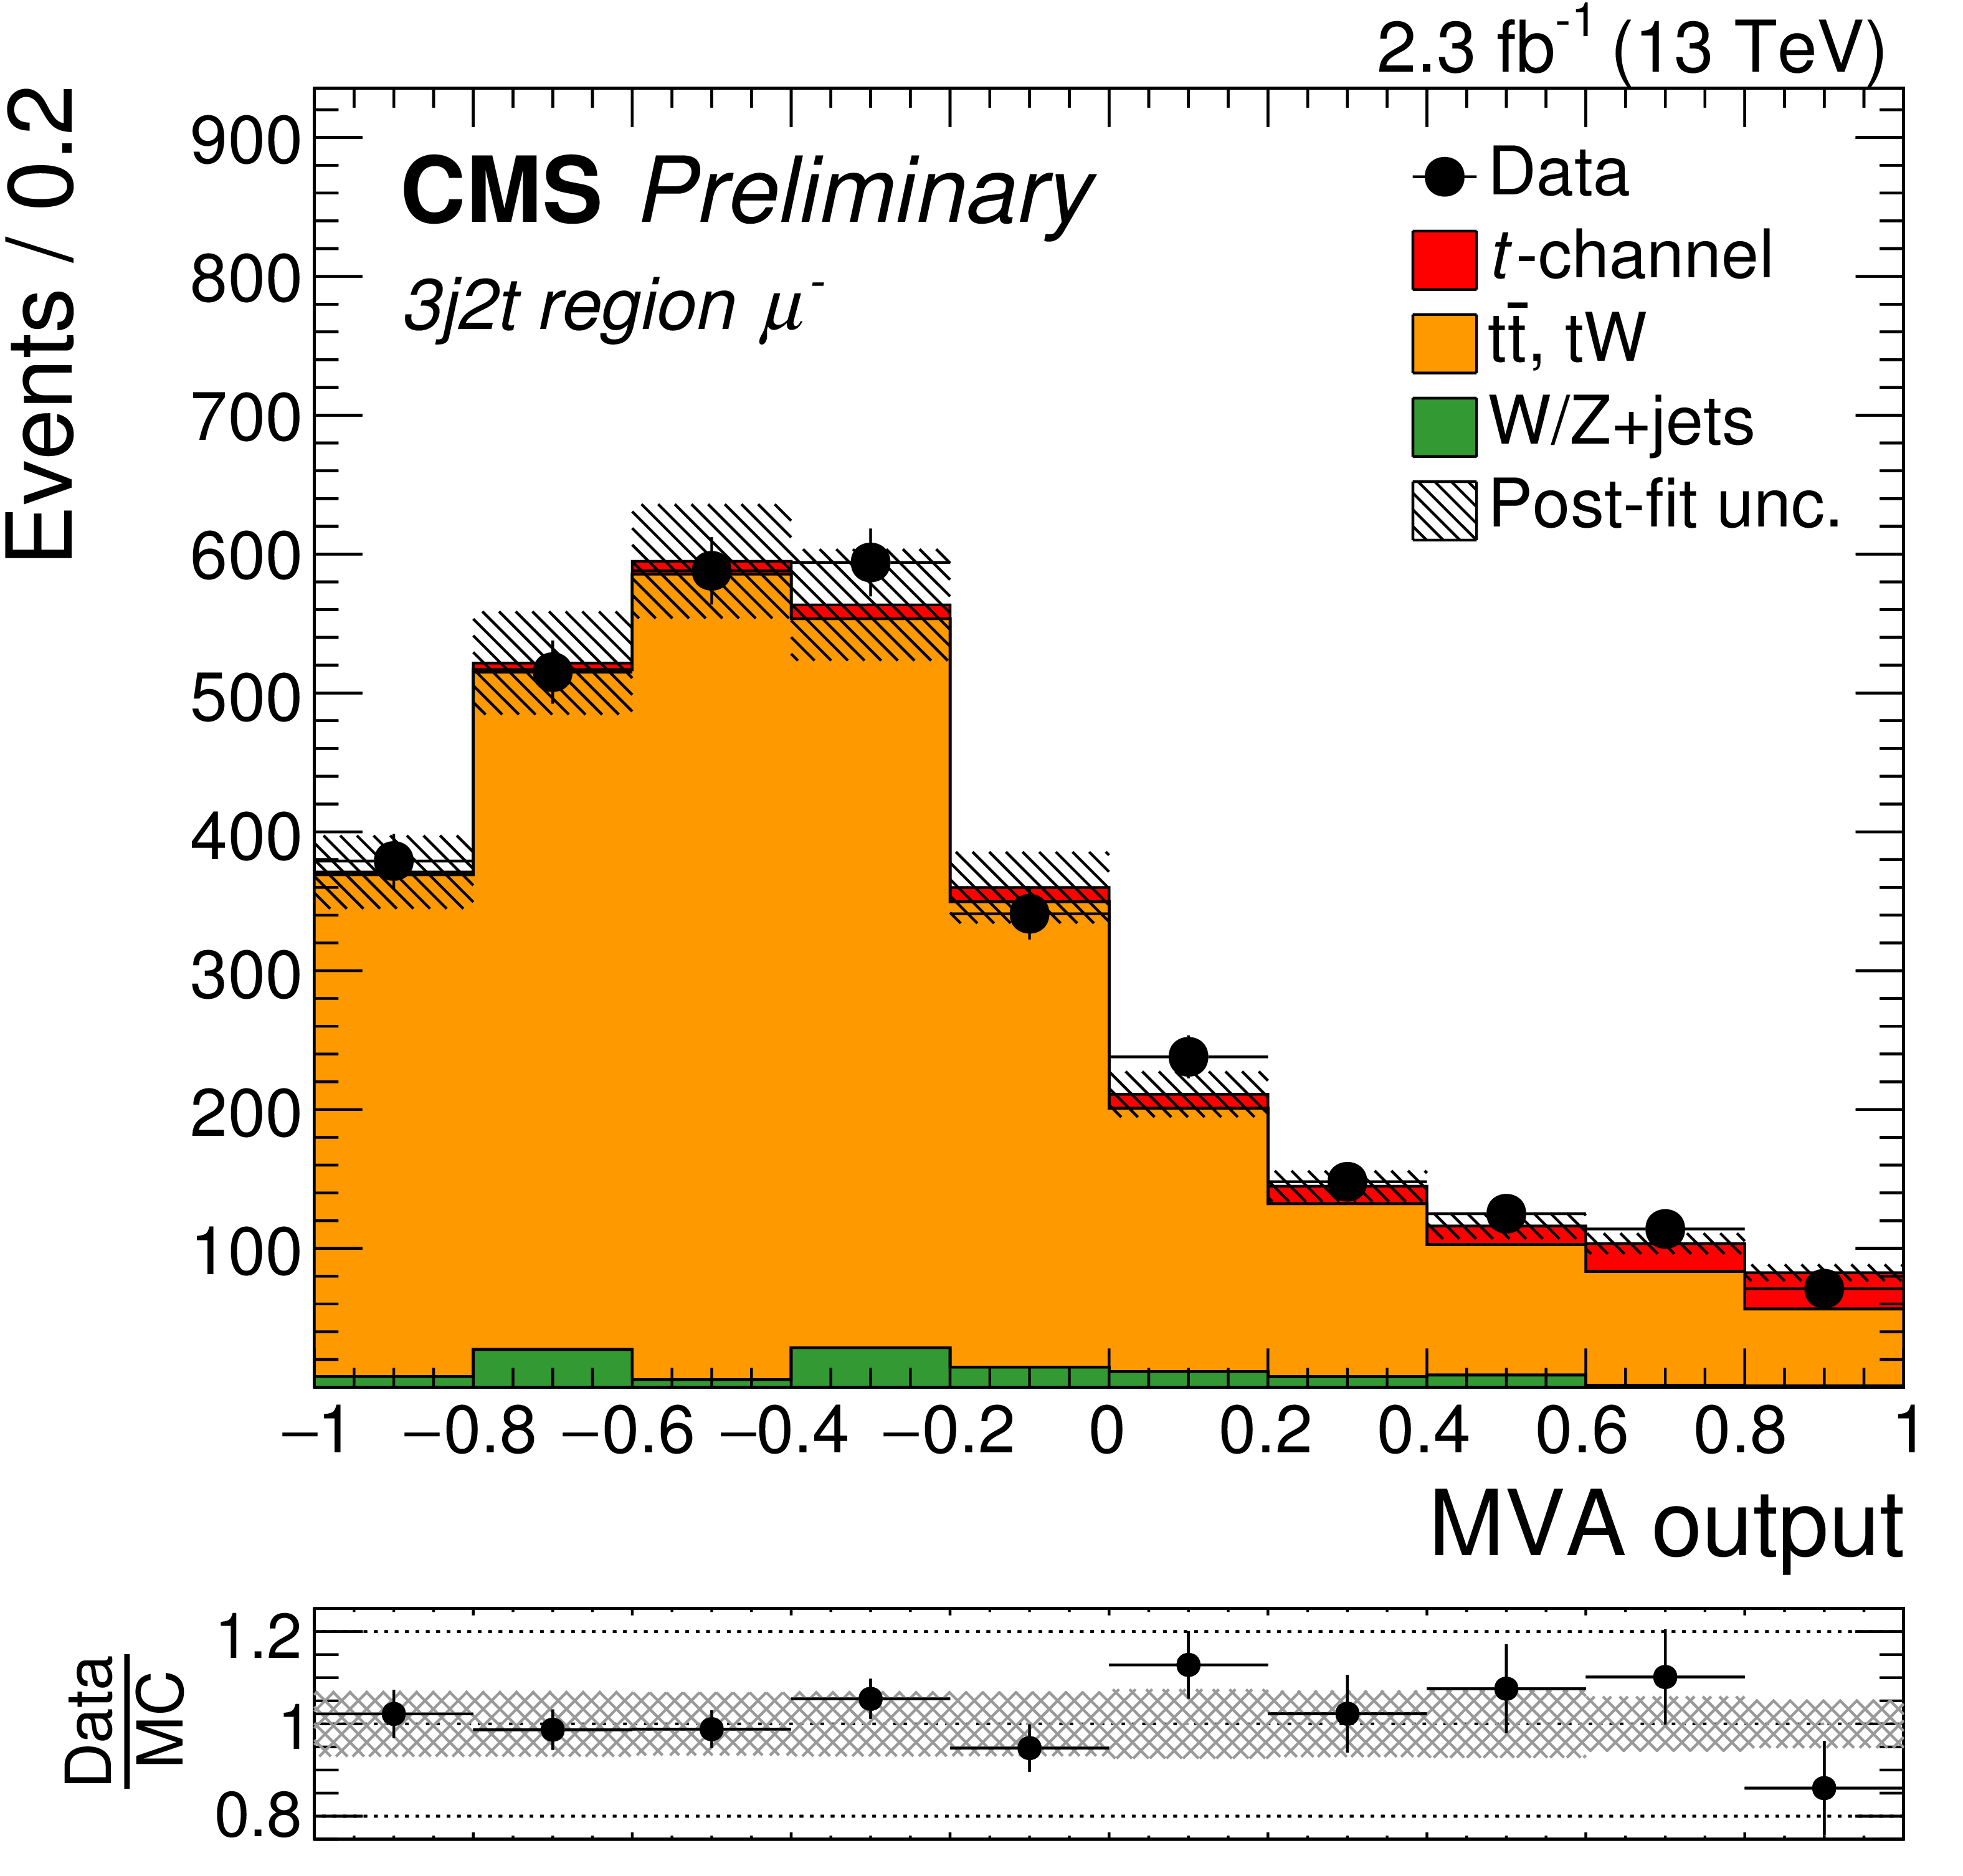
png pdf |
Figure 3-i:
Neural network distributions for all (a,d,g), positively (b,e,h) and negatively charged muons (c,f,i) normalized to the yields obtained from the simultaneous fit in the 2j1t (a,b,c), 3j1t (d,e,f) and 3j2t region (g,h,i). The shaded areas indicate the post-fit uncertainties. |
png pdf |
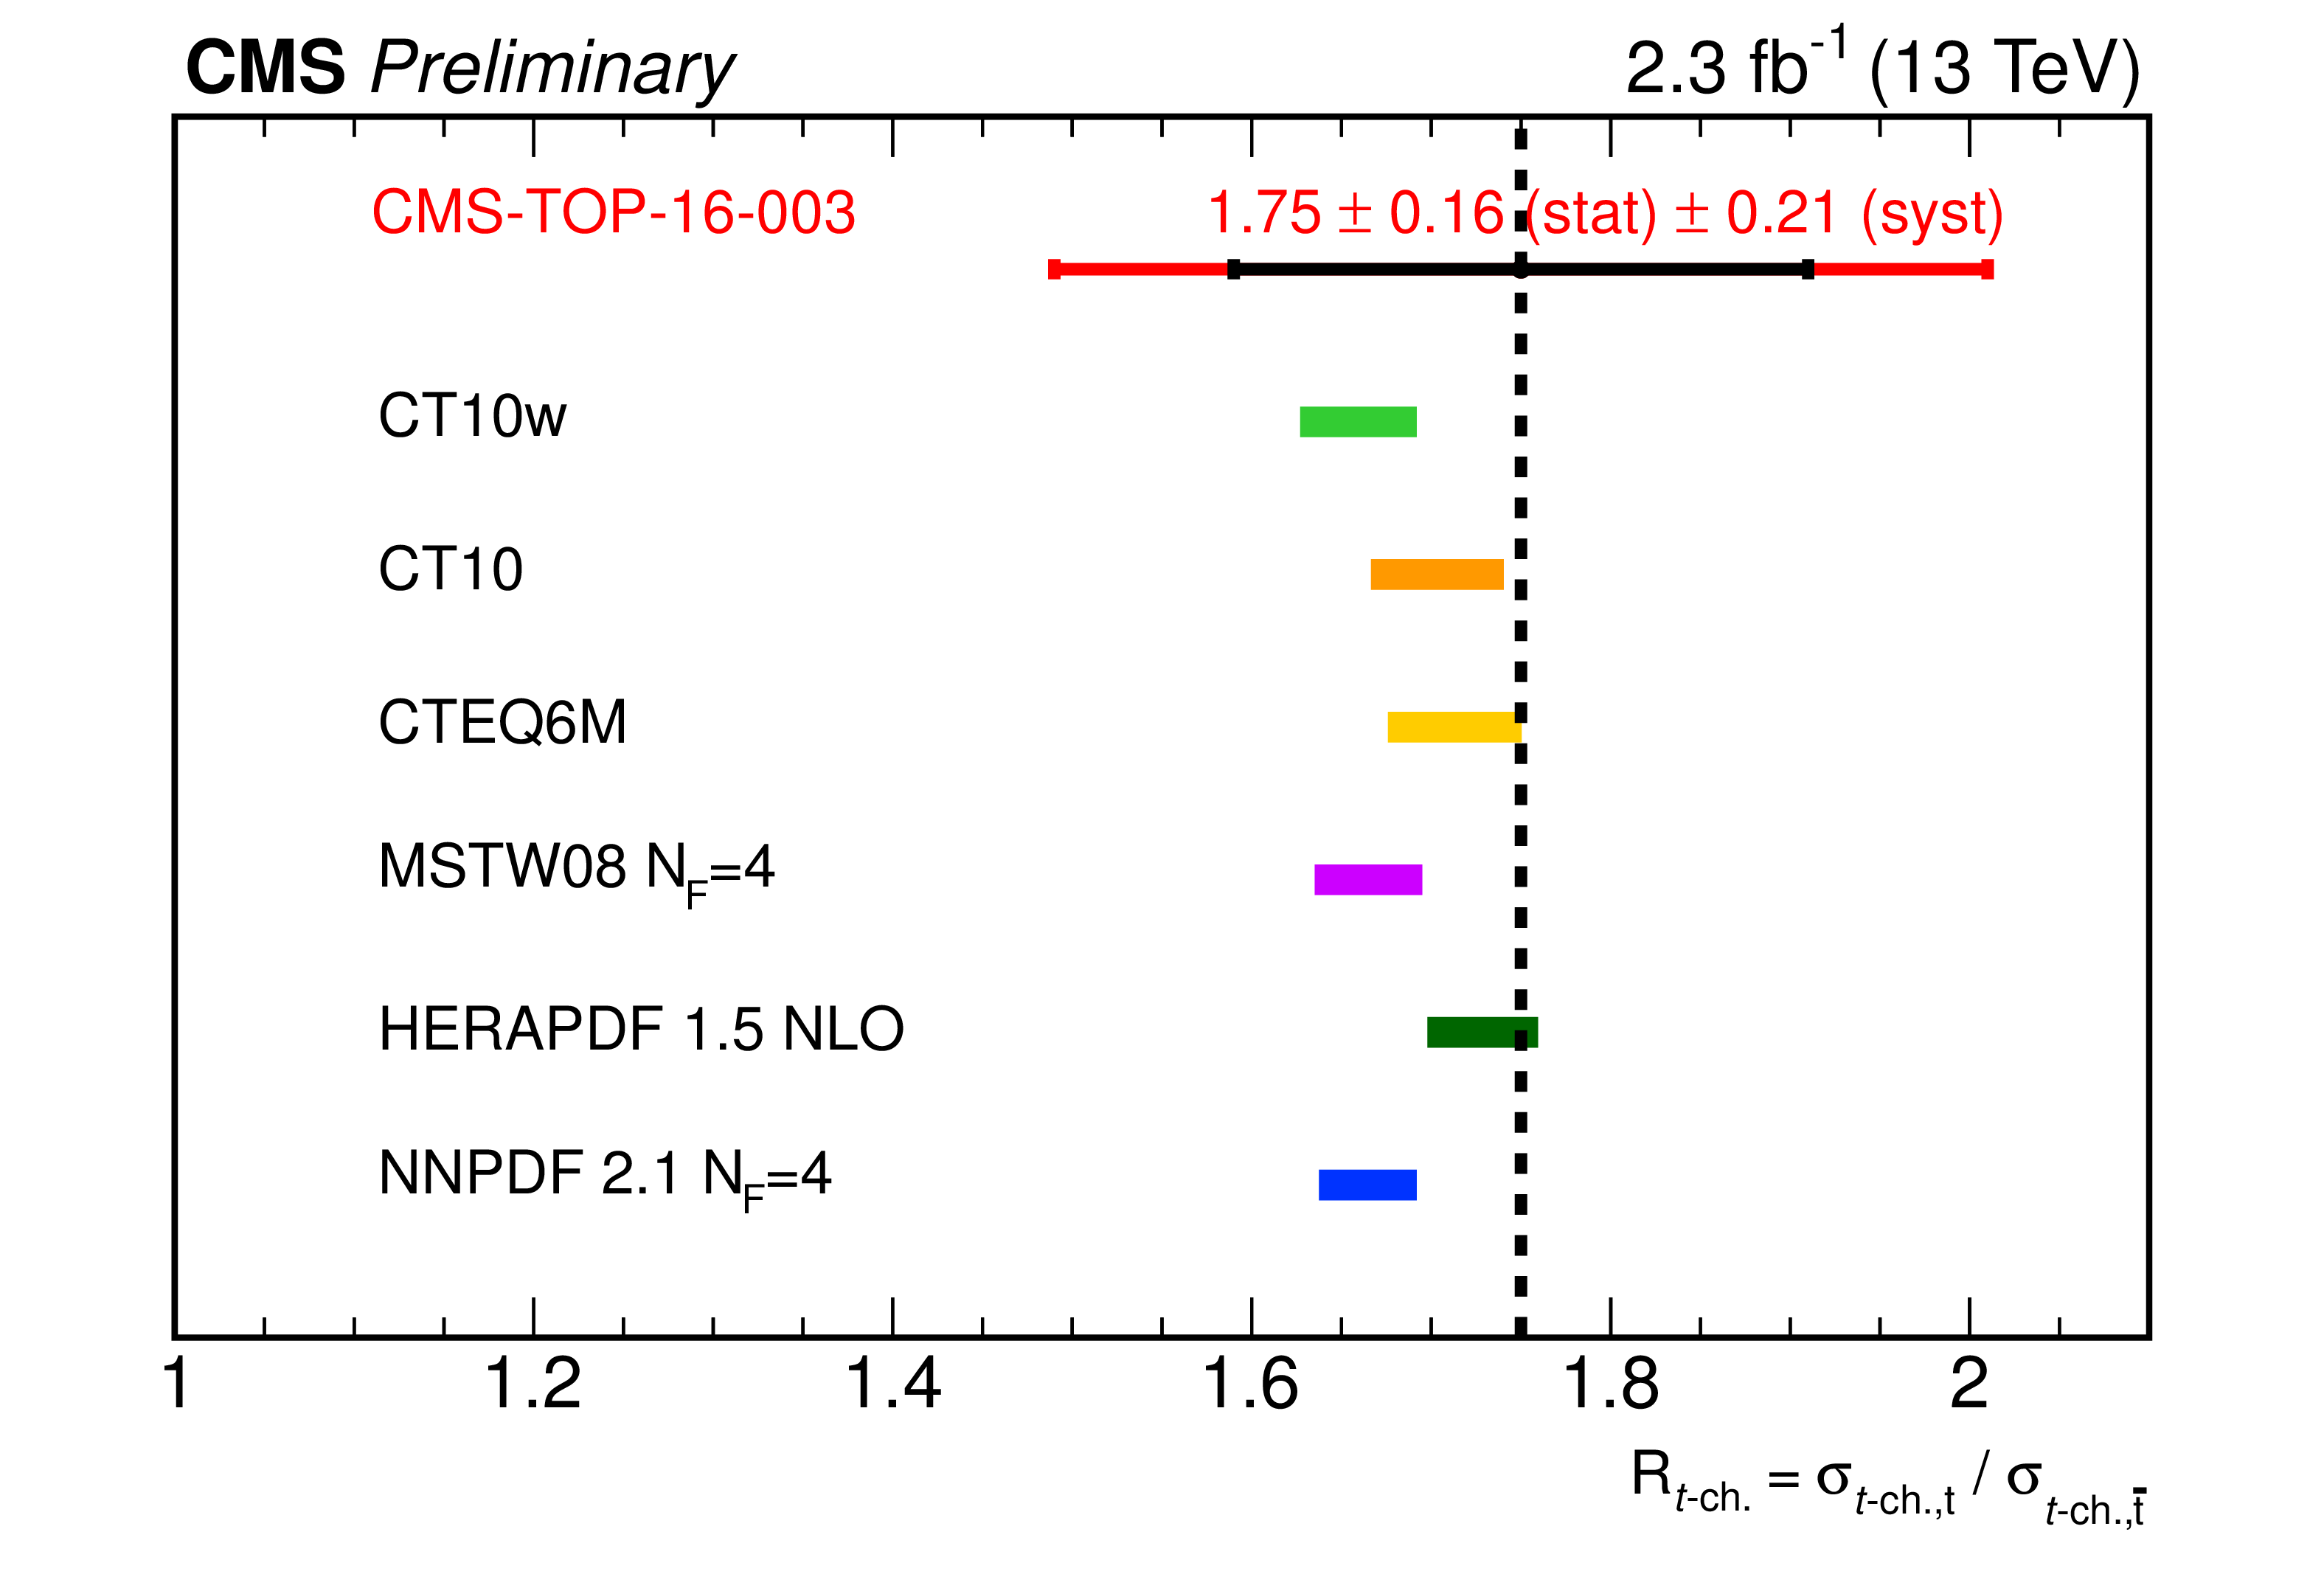
Figure 4:
Comparison of the measured $R_{t\textrm {-ch.}}$ with the prediction obtained using different PDF sets: MRST2006 [46], MSTW2008NLO [47], HERAPDF[48], CTEQ6.6 [49], CT10 [50], and NNPDF [51]. In case of MSTW2008NLO and of NNPDF the fixed four-flavour scheme PDFs are used together with the POWHEG 4FS calculation. The POWHEG calculation in the 5FS is used for all other PDFs, as they are are variable flavor scheme PDFs. The nominal value for the top quark mass is 173.0 GeV. Error bars for the different PDF sets include the statistical uncertainty, the uncertainty on the factorisation and renormalization scales, derived varying both of them them by a factor 0.5 and 2, and the uncertainty on the top quark mass, derived varying the top quark mass between 172.0 and 174.0 GeV. |

png pdf |
Figure 5:
The $t$ channel single top quark cross section summary of the most precise CMS measurements in comparison with NLO+NNLL QCD calculations. The Tevatron measurements are also shown. |
| Tables | |

png pdf |
Table 1:
Event yields for the main processes in the 2-jets-1-tag sample. Except for the number of QCD multi-jet events all yields are taken from simulation. The quoted uncertainties are statistical uncertainties only and are due to the limited size of the samples of simulated events. The yield of QCD multi-jet events is determined from the data (see Sec. 3). The W+jets process is modelled using the LO MadGraph generator, rescaled to NLO accuracy using the selection efficiency observed in events generated with MG5-aMC@NLO. |

png pdf |
Table 2:
Input variables used in the neural network ranked according to their importance. |

png pdf |
Table 3:
Scale factors from the fits for the signal process and the background categories. The uncertainties include the statistical uncertainty and the experimental sources of uncertainty that are considered as nuisance parameters in the fit. |
png pdf |
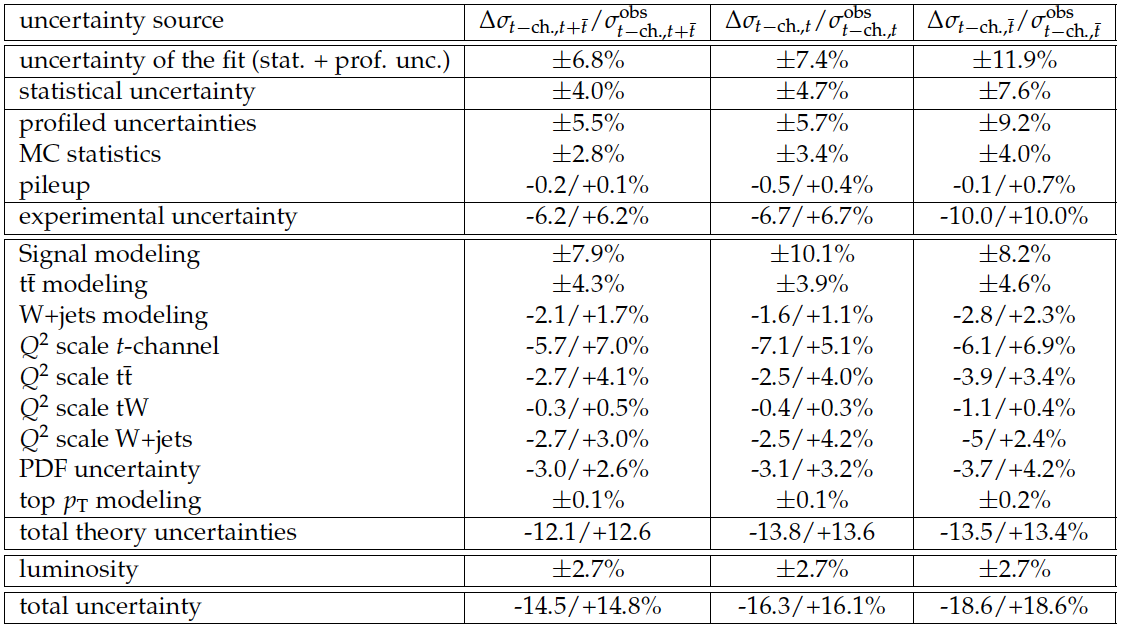
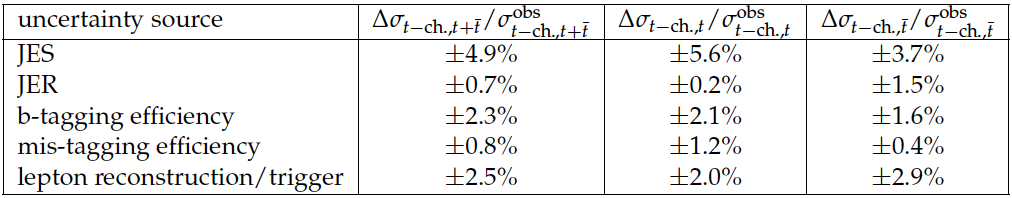
Table 4:
Relative impact of systematic uncertainties with respect to the observed cross section value $\sigma _{t{\rm -ch.},\mathrm{ t + \bar{t} }}^{\rm {obs}}$, $\sigma _{t{\rm -ch.},t}^{\rm {obs}}$ and $\sigma _{t{\rm -ch.},\mathrm{ \bar{t} }}^{\rm {obs}}$, given in percent. Uncertainties are grouped and summed together with the method suggested in [39]. |
png pdf |
Table 5:
Relative impact of the experimental systematic uncertainties with respect to the observed cross section value $\sigma _{t{\rm -ch.},\mathrm{ t + \bar{t} }}^{\rm {obs}}$, $\sigma _{t{\rm -ch.},t}^{\rm {obs}}$ and $\sigma _{t{\rm -ch.},\mathrm{ \bar{t} }}^{\rm {obs}}$, given in percent. These estimates are obtained by fixing one uncertainty at a time and considering all others as nuisance parameters in the fit and comparing to the uncertainty obtained when treating all uncertainty sources as nuisance parameters. These numbers are for illustration purpose only, the uncertainty quoted for the result is the total experimental uncertainty from the fit. |
| References | ||||
| 1 | CDF Collaboration | First Observation of Electroweak Single Top Quark Production | PRL 103 (2009) 092002 | 0903.0885 |
| 2 | D0 Collaboration | Observation of Single Top-Quark Production | PRL 103 (2009) 092001 | 0903.0850 |
| 3 | CMS Collaboration | Measurement of the single-top-quark $ t $-channel cross section in $ pp $ collisions at $ \sqrt{s}=7 $ TeV | JHEP 1212 (2012) 035 | CMS-TOP-11-021 1209.4533 |
| 4 | ATLAS Collaboration | Measurement of the $ t $-channel single top-quark production cross section in $ \rm pp $ collisions at $ \sqrt{s}=7 $ TeV with the ATLAS detector | PLB 717 (2012) 330 | 1205.3130 |
| 5 | CMS Collaboration | Measurement of the $ t $-channel single-top-quark production cross section and of the $ |{\rm V}_{\rm tb}| $ CKM matrix element in pp collisions at $ \sqrt{s} $ = 8 TeV | JHEP 06 (2014) | CMS-TOP-12-038 1403.7366 |
| 6 | ATLAS Collaboration | Measurement of the top quark mass in topologies enhanced with single top-quarks produced in the t-channel in $ \sqrt{s}=8\,\mathrm{TeV} $ ATLAS data | ATLAS Conference Note ATLAS-CONF-2014-055 | |
| 7 | CMS Collaboration | Observation of the Associated Production of a Single Top Quark and a $ \rm W $ Boson in $ \rm pp $ Collisions at $ \sqrt{s}=8\text{\,}\text{\,}\mathrm{TeV} $ | PRL 112 (2014) 231802 | CMS-TOP-12-040 1401.2942 |
| 8 | L. Evans and P. Bryant | LHC Machine | JINST 3 (2008) S08001 | |
| 9 | N. Kidonakis | Differential and total cross sections for top pair and single top production | 1205.3453 | |
| 10 | CMS Collaboration | Single top t-channel differential cross section at 8 TeV | CMS-PAS-TOP-14-004 | CMS-PAS-TOP-14-004 |
| 11 | CMS Collaboration | Measurement of top quark polarisation in t-channel single top quark production | CMS-TOP-13-001 1511.02138 |
|
| 12 | CMS Collaboration | Measurement of the W boson helicity in events with a single reconstructed top quark in pp collisions at $ \sqrt{s}=8 $ TeV | JHEP 1501 (2015) 053 | CMS-TOP-12-020 1410.1154 |
| 13 | CMS Collaboration | Measurement of the t-channel single top-quark cross section at 13 TeV | CMS-PAS-TOP-15-004 | CMS-PAS-TOP-15-004 |
| 14 | J. Campbell, R. Frederix, F. Maltoni, and F. Tramontano | NLO predictions for t-channel production of single top and fourth generation quarks at hadron colliders | JHEP 0910 (2009) 042 | 0907.3933 |
| 15 | F. Maltoni, G. Ridolfi, and M. Ubiali | b-initiated processes at the LHC: a reappraisal | JHEP 04 (2012) 022 | 1203.6393 |
| 16 | R. Frederix, E. Re, and P. Torrielli | Single-top t-channel hadroproduction in the four-flavour scheme with POWHEG and aMC@NLO | JHEP 09 (2012) 130 | 1207.5391 |
| 17 | M. Aliev et al. | HATHOR - HAdronic Top and Heavy quarks crOss section calculatoR | 1007.1327 | |
| 18 | M. Brucherseifer, F. Caola, and K. Melnikov | On the NNLO QCD corrections to single-top production at the LHC | PLB 736 (2014) 58--63 | 1404.7116 |
| 19 | N. Kidonakis | Next-to-next-to-leading-order collinear and soft gluon corrections for t-channel single top quark production | PRD83 (2011) 091503 | 1103.2792 |
| 20 | J. Alwall et al. | The automated computation of tree-level and next-to-leading order differential cross sections, and their matching to parton shower simulations | JHEP 07 (2014) 079 | 1405.0301 |
| 21 | E. Re | Single-top Wt-channel production matched with parton showers using the POWHEG method | EPJC71 (2011) 1547 | 1009.2450 |
| 22 | S. Alioli, P. Nason, C. Oleari, and E. Re | A general framework for implementing NLO calculations in shower Monte Carlo programs: the POWHEG BOX | JHEP 06 (2010) 043 | 1002.2581 |
| 23 | S. Alioli, P. Nason, C. Oleari, and E. Re | NLO single-top production matched with shower in POWHEG: s- and t-channel contributions | JHEP 09 (2009) 111 | 0907.4076 |
| 24 | S. Frixione, P. Nason, and C. Oleari | Matching NLO QCD computations with Parton Shower simulations: the POWHEG method | JHEP 0711 (2007) 070 | 0709.2092 |
| 25 | T. Sj\"ostrand, S. Mrenna, and P. Skands | PYTHIA 6.4 physics and manual | JHEP 05 (2006) 026 | hep-ph/0603175 |
| 26 | P. Skands, S. Carrazza, and J. Rojo | Tuning PYTHIA 8.1: the Monash 2013 Tune | EPJC74 (2014), no. 8 | 1404.5630 |
| 27 | J. Alwall et al. | MadGraph 5: Going Beyond | JHEP 06 (2011) 128 | 1106.0522 |
| 28 | M. L. Mangano, M. Moretti, F. Piccinini, and M. Treccani | Matching matrix elements and shower evolution for top-quark production in hadronic collisions | JHEP 01 (2007) 013 | hep-ph/0611129 |
| 29 | R. Frederix and S. Frixione | Merging meets matching in MC@NLO | JHEP 12 (2012) 061 | 1209.6215 |
| 30 | J. Allison et al. | Geant4 developments and applications | IEEE Transactions on Nuclear Science 53, 1 (2006) 270 | |
| 31 | CMS Collaboration | Particle--Flow Event Reconstruction in CMS and Performance for Jets, Taus, and $ E_{\mathrm{T}}^{\text{miss}} $ | CDS | |
| 32 | CMS Collaboration | Commissioning of the particle-flow event with the first LHC collisions recorded in the CMS detector | CDS | |
| 33 | M. Cacciari, G. P. Salam, and G. Soyez | The anti-$ k_t $ jet clustering algorithm | JHEP 04 (2008) 063 | 0802.1189 |
| 34 | CMS Collaboration | Identification of b-quark jets with the CMS experiment | JINST 8 (2013) P04013 | CMS-BTV-12-001 1211.4462 |
| 35 | Particle Data Group Collaboration | Review of Particle Physics | CPC38 (2014) 090001 | |
| 36 | M. Feindt and U. Kerzel | The NeuroBayes neural network package | Nuclear Instruments and Methods in Physics Research A 559 (April, 2006) 190--194 | |
| 37 | A. Hoecker et al. | TMVA - Toolkit for Multivariate Data Analysis | physics/0703039 | |
| 38 | R. J. Barlow and C. Beeston | Fitting using finite Monte Carlo samples | CPC 77 (1993) 219--228 | |
| 39 | R. Barlow | Asymmetric systematic errors | physics/0306138 | |
| 40 | CMS Collaboration | Determination of jet energy calibration and transverse momentum resolution in CMS | JINST 6 (2011) P11002 | CMS-JME-10-011 1107.4277 |
| 41 | CMS Collaboration | Identification of b quark jets at the CMS Experiment in the LHC Run 2 | CMS-PAS-BTV-15-001 | CMS-PAS-BTV-15-001 |
| 42 | CMS Collaboration | Measurement of the WZ production cross section in pp collisions at $ \sqrt{s} = 13 $ TeV | CMS-PAS-SMP-15-006 | CMS-PAS-SMP-15-006 |
| 43 | CMS Collaboration | Measurement of the differential cross section for top quark pair production in pp collisions at $ \sqrt{s} = $ 8 TeV | Submitted to EPJC (2015) | CMS-TOP-12-028 1505.04480 |
| 44 | NNPDF Collaboration | Parton distributions for the LHC Run II | JHEP 04 (2015) 040 | 1410.8849 |
| 45 | CMS Collaboration | CMS Luminosity Measurement for the 2015 Data Taking Period | ||
| 46 | A. Martin, W. Stirling, and G. Watt | Update of Parton Distributions at NNLO | PLB 652 (2007) 292--299 | hep-ph/07060459 |
| 47 | A. Martin, W. Stirling, and G. Watt | Parton distributions for the LHC | EPJC 63 (2009) 189 | |
| 48 | H1 and Z. Collaborations | Combined Measurement and QCD Analysis of the inclusive $ e^{\pm} $ Scattering Cross Sections at $ HERA $ | JHEP 01 (2010) 109 | hep-ph/09110884 |
| 49 | P. Nadolsky et al. | Implications of CTEQ global analysis for collider observables | PRD 78 (2008) 013004 | hep-ph/08020007 |
| 50 | H.-L. Lai et al. | New parton distributions for collider physics | PRD 82 (2010) 074024 | hep-ph/10072241 |
| 51 | R. Ball, V. Bertone, F. Cerutti et al. | Reweighting and Unweighting of Parton Distributions and the LHC W lepton asymmetry data | Nucl. Phys. B 855 (2012) 608 | hep-ph/11081758 |
|
|
Compact Muon Solenoid LHC, CERN |
|

|

|

|

|

|