

Compact Muon Solenoid
LHC, CERN
| CMS-PAS-TOP-16-014 | ||
| Measurement of the differential cross sections of top quark pair production as a function of kinematic event variables in pp collisions at $\sqrt{s} = $ 13 TeV | ||
| CMS Collaboration | ||
| July 2017 | ||
| Abstract: Measurements of the differential $\mathrm{t}\overline{\mathrm{t}}$ production cross section are presented in the single lepton decay channel, with respect to a number of global event observables. The measurements are performed with 35.9 fb$^{-1}$ of proton-proton collision data collected by the CMS experiment at the LHC during 2016 at $\sqrt{s}= $ 13 TeV. The differential cross sections are measured at the particle level in a phase space similar to that accessible by the CMS detector, and are compared to state-of-the-art leading order and next-to-leading order $\mathrm{t}\overline{\mathrm{t}}$ simulations. | ||
|
Links:
CDS record (PDF) ;
inSPIRE record ;
CADI line (restricted) ;
These preliminary results are superseded in this paper, JHEP 06 (2018) 002. The superseded preliminary plots can be found here. |
||
| Figures | |

png pdf |
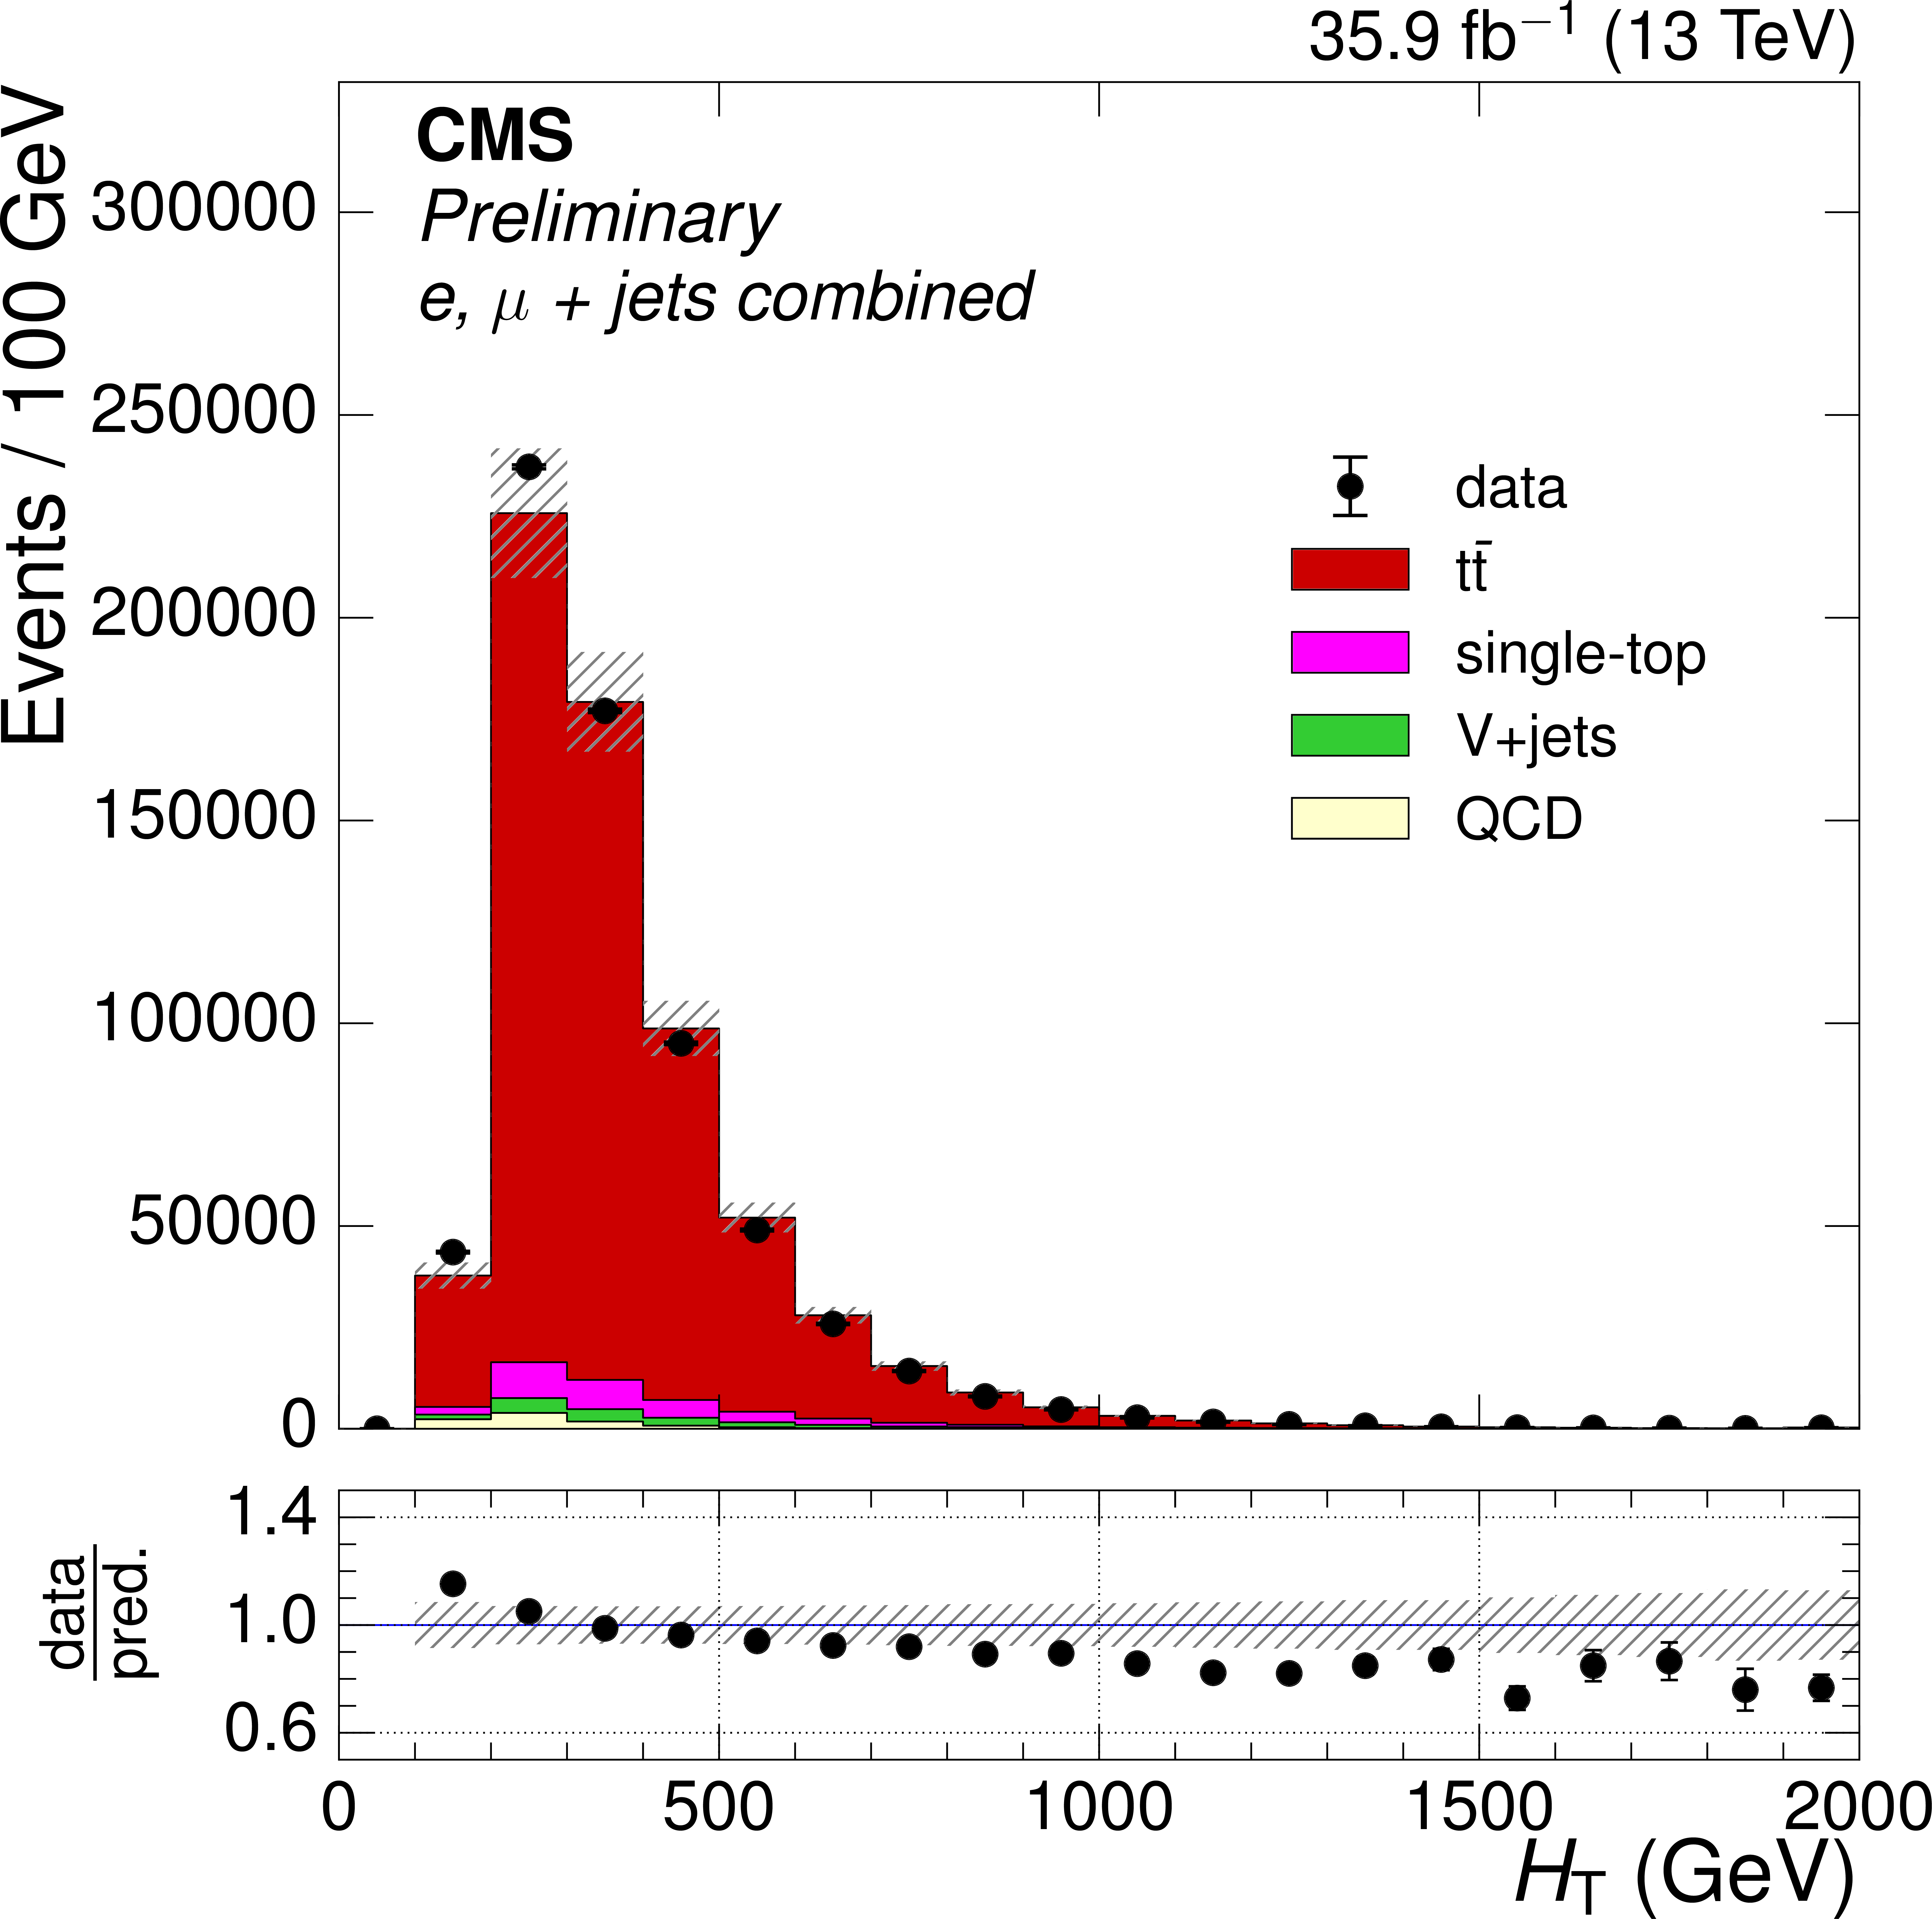
Figure 1:
The distributions of $ {H_{\mathrm {T}}} $, $ {S_{\text {T}}} $, $ { {p_{\mathrm {T}}} ^\text {miss}} $ and $ {p_{\text {T}}^{\mathrm{ W } }} $ after full event selection. The $ {\mathrm{ t } {}\mathrm{ \bar{t} } } $ simulation is normalized to the NNLO prediction. The ratio of the number of events in data to that in simulation is shown below each of the distributions, with the statistical uncertainty in the data being shown by the vertical uncertainty bars. The statistical uncertainty in the number of simulation events and the uncertainties in the modeling in simulation are shown by the hatched band. |
png pdf |
Figure 1-a:
Distributions of $ {H_{\mathrm {T}}} $ after full event selection. The $ {\mathrm{ t } {}\mathrm{ \bar{t} } } $ simulation is normalized to the NNLO prediction. The ratio of the number of events in data to that in simulation is shown below the distribution, with the statistical uncertainty in the data being shown by the vertical uncertainty bars. The statistical uncertainty in the number of simulation events and the uncertainties in the modeling in simulation are shown by the hatched band. |

png pdf |
Figure 1-b:
Distributions of $ {S_{\text {T}}} $ after full event selection. The $ {\mathrm{ t } {}\mathrm{ \bar{t} } } $ simulation is normalized to the NNLO prediction. The ratio of the number of events in data to that in simulation is shown below the distribution, with the statistical uncertainty in the data being shown by the vertical uncertainty bars. The statistical uncertainty in the number of simulation events and the uncertainties in the modeling in simulation are shown by the hatched band. |
png pdf |
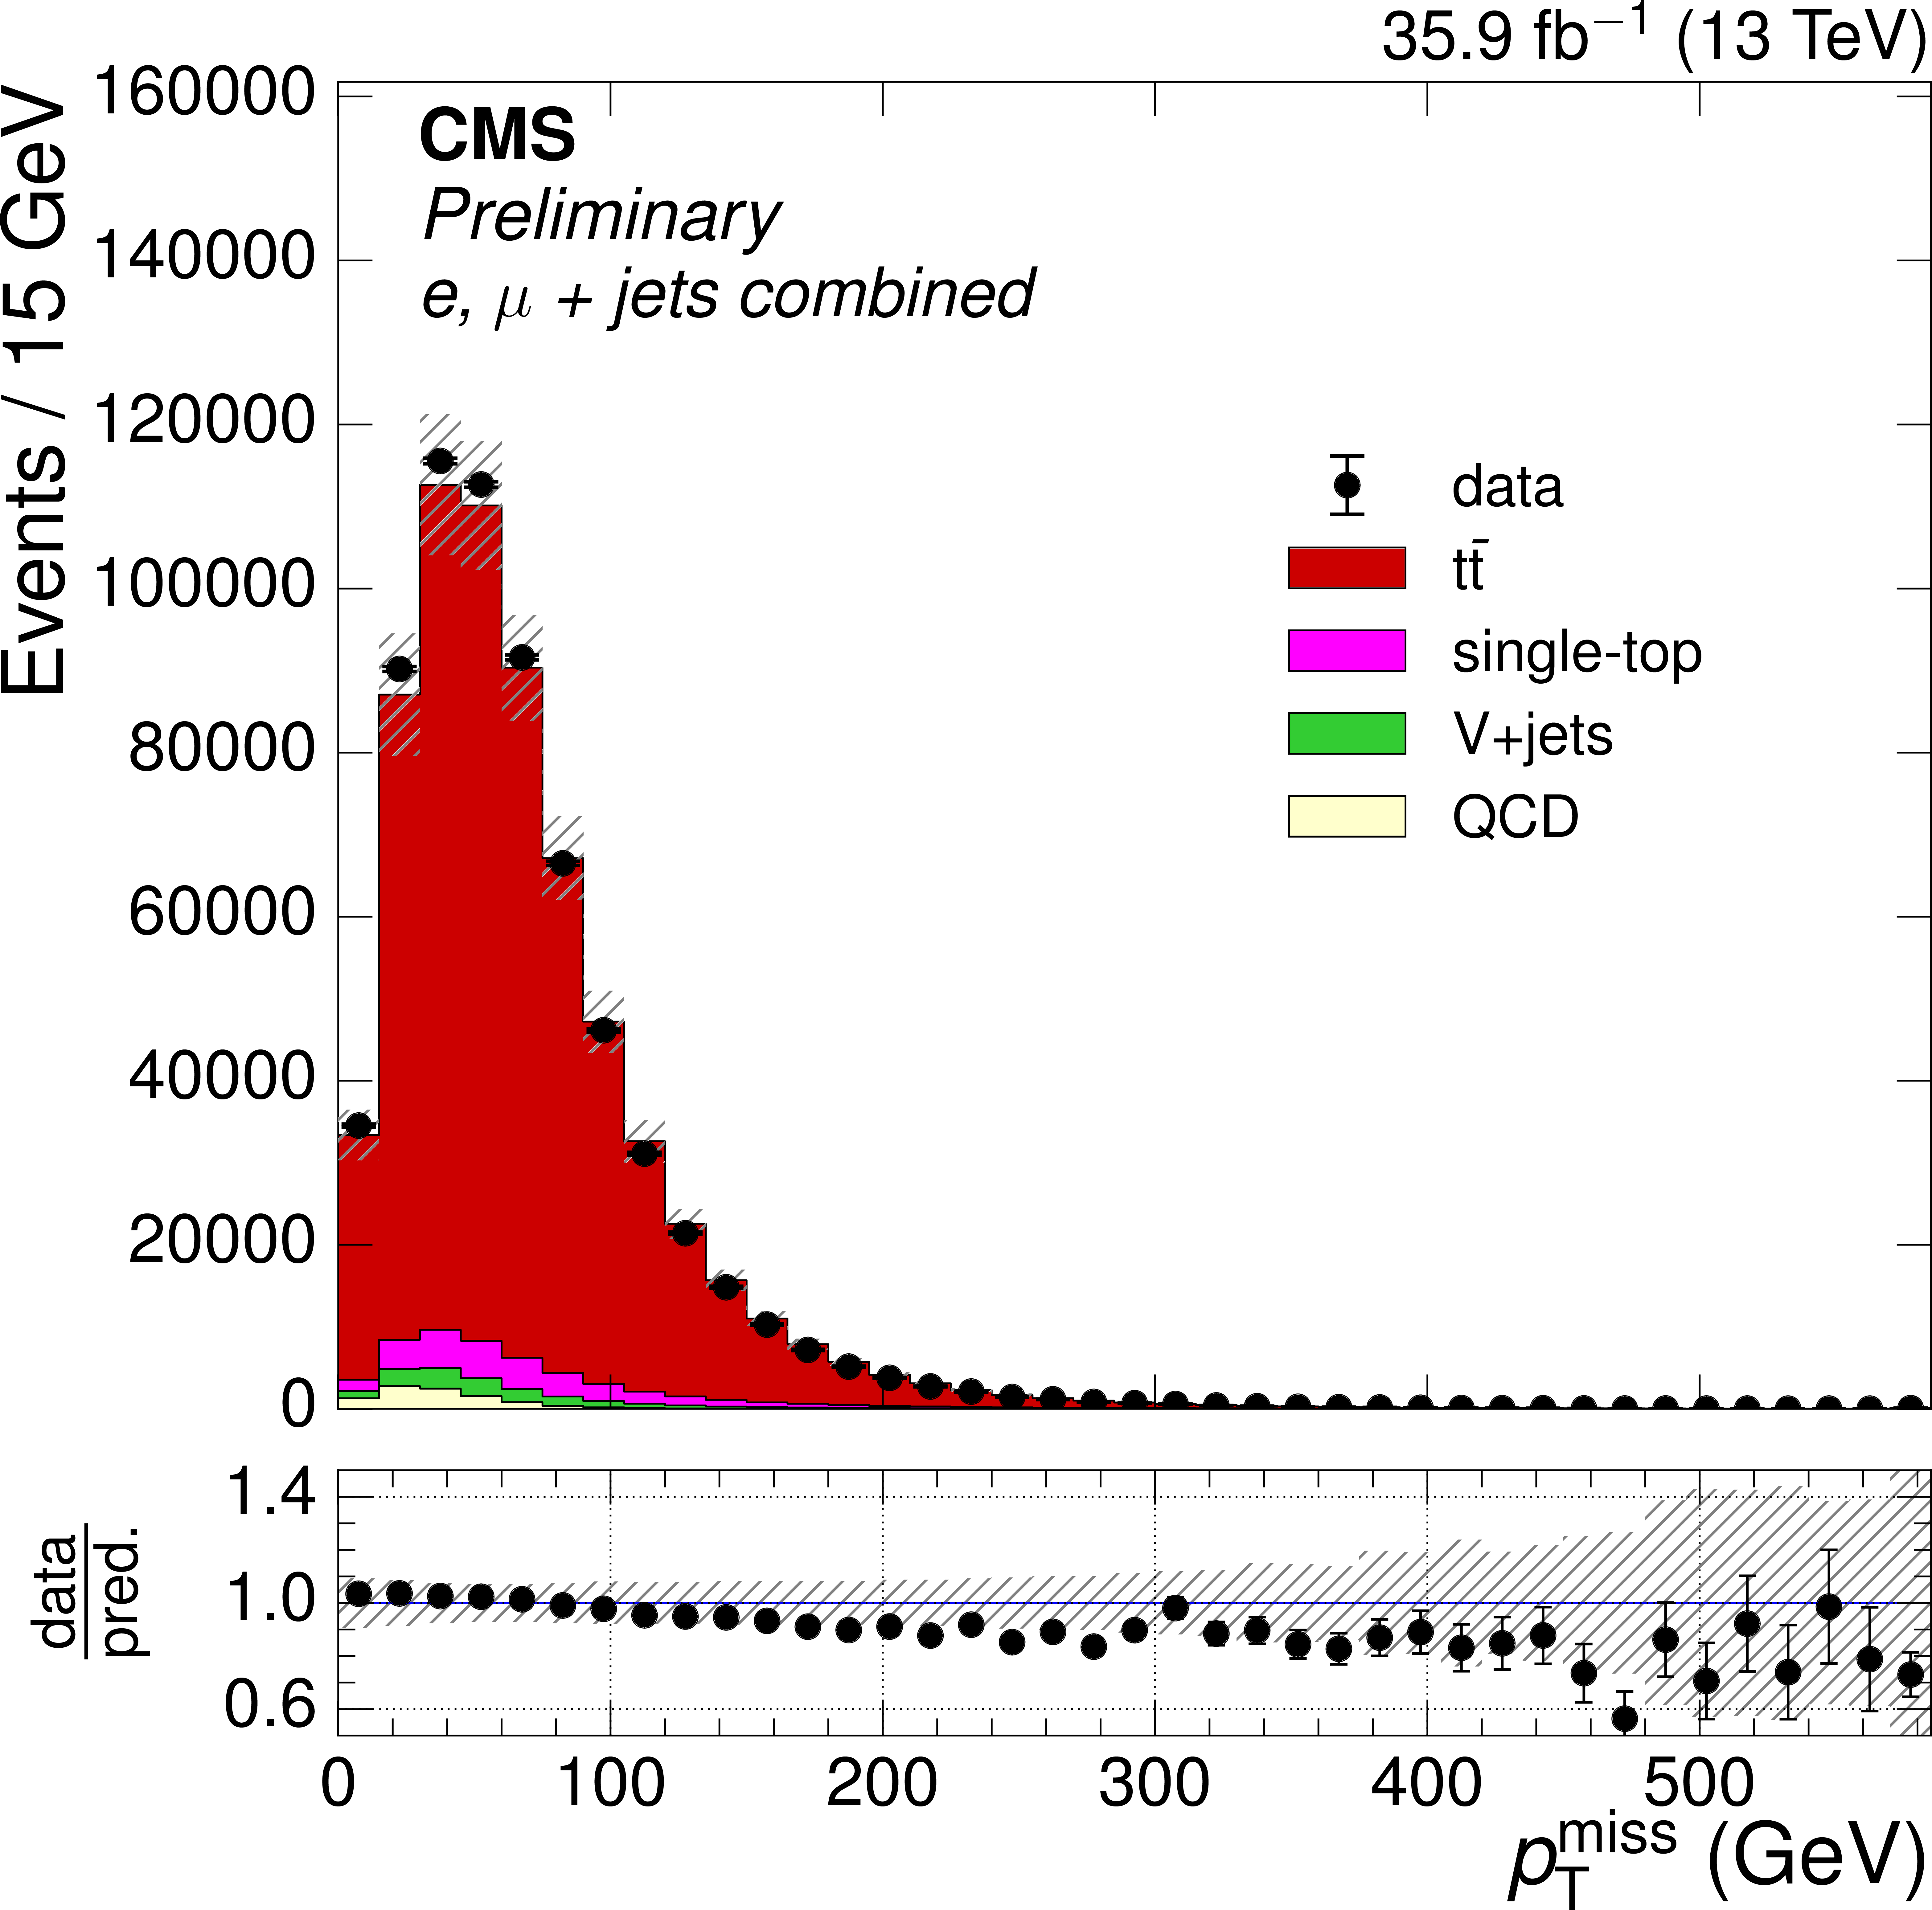
Figure 1-c:
Distributions of $ { {p_{\mathrm {T}}} ^\text {miss}} $ after full event selection. The $ {\mathrm{ t } {}\mathrm{ \bar{t} } } $ simulation is normalized to the NNLO prediction. The ratio of the number of events in data to that in simulation is shown below the distribution, with the statistical uncertainty in the data being shown by the vertical uncertainty bars. The statistical uncertainty in the number of simulation events and the uncertainties in the modeling in simulation are shown by the hatched band. |

png pdf |
Figure 1-d:
Distributions of $ {p_{\text {T}}^{\mathrm{ W } }} $ after full event selection. The $ {\mathrm{ t } {}\mathrm{ \bar{t} } } $ simulation is normalized to the NNLO prediction. The ratio of the number of events in data to that in simulation is shown below the distribution, with the statistical uncertainty in the data being shown by the vertical uncertainty bars. The statistical uncertainty in the number of simulation events and the uncertainties in the modeling in simulation are shown by the hatched band. |

png pdf |
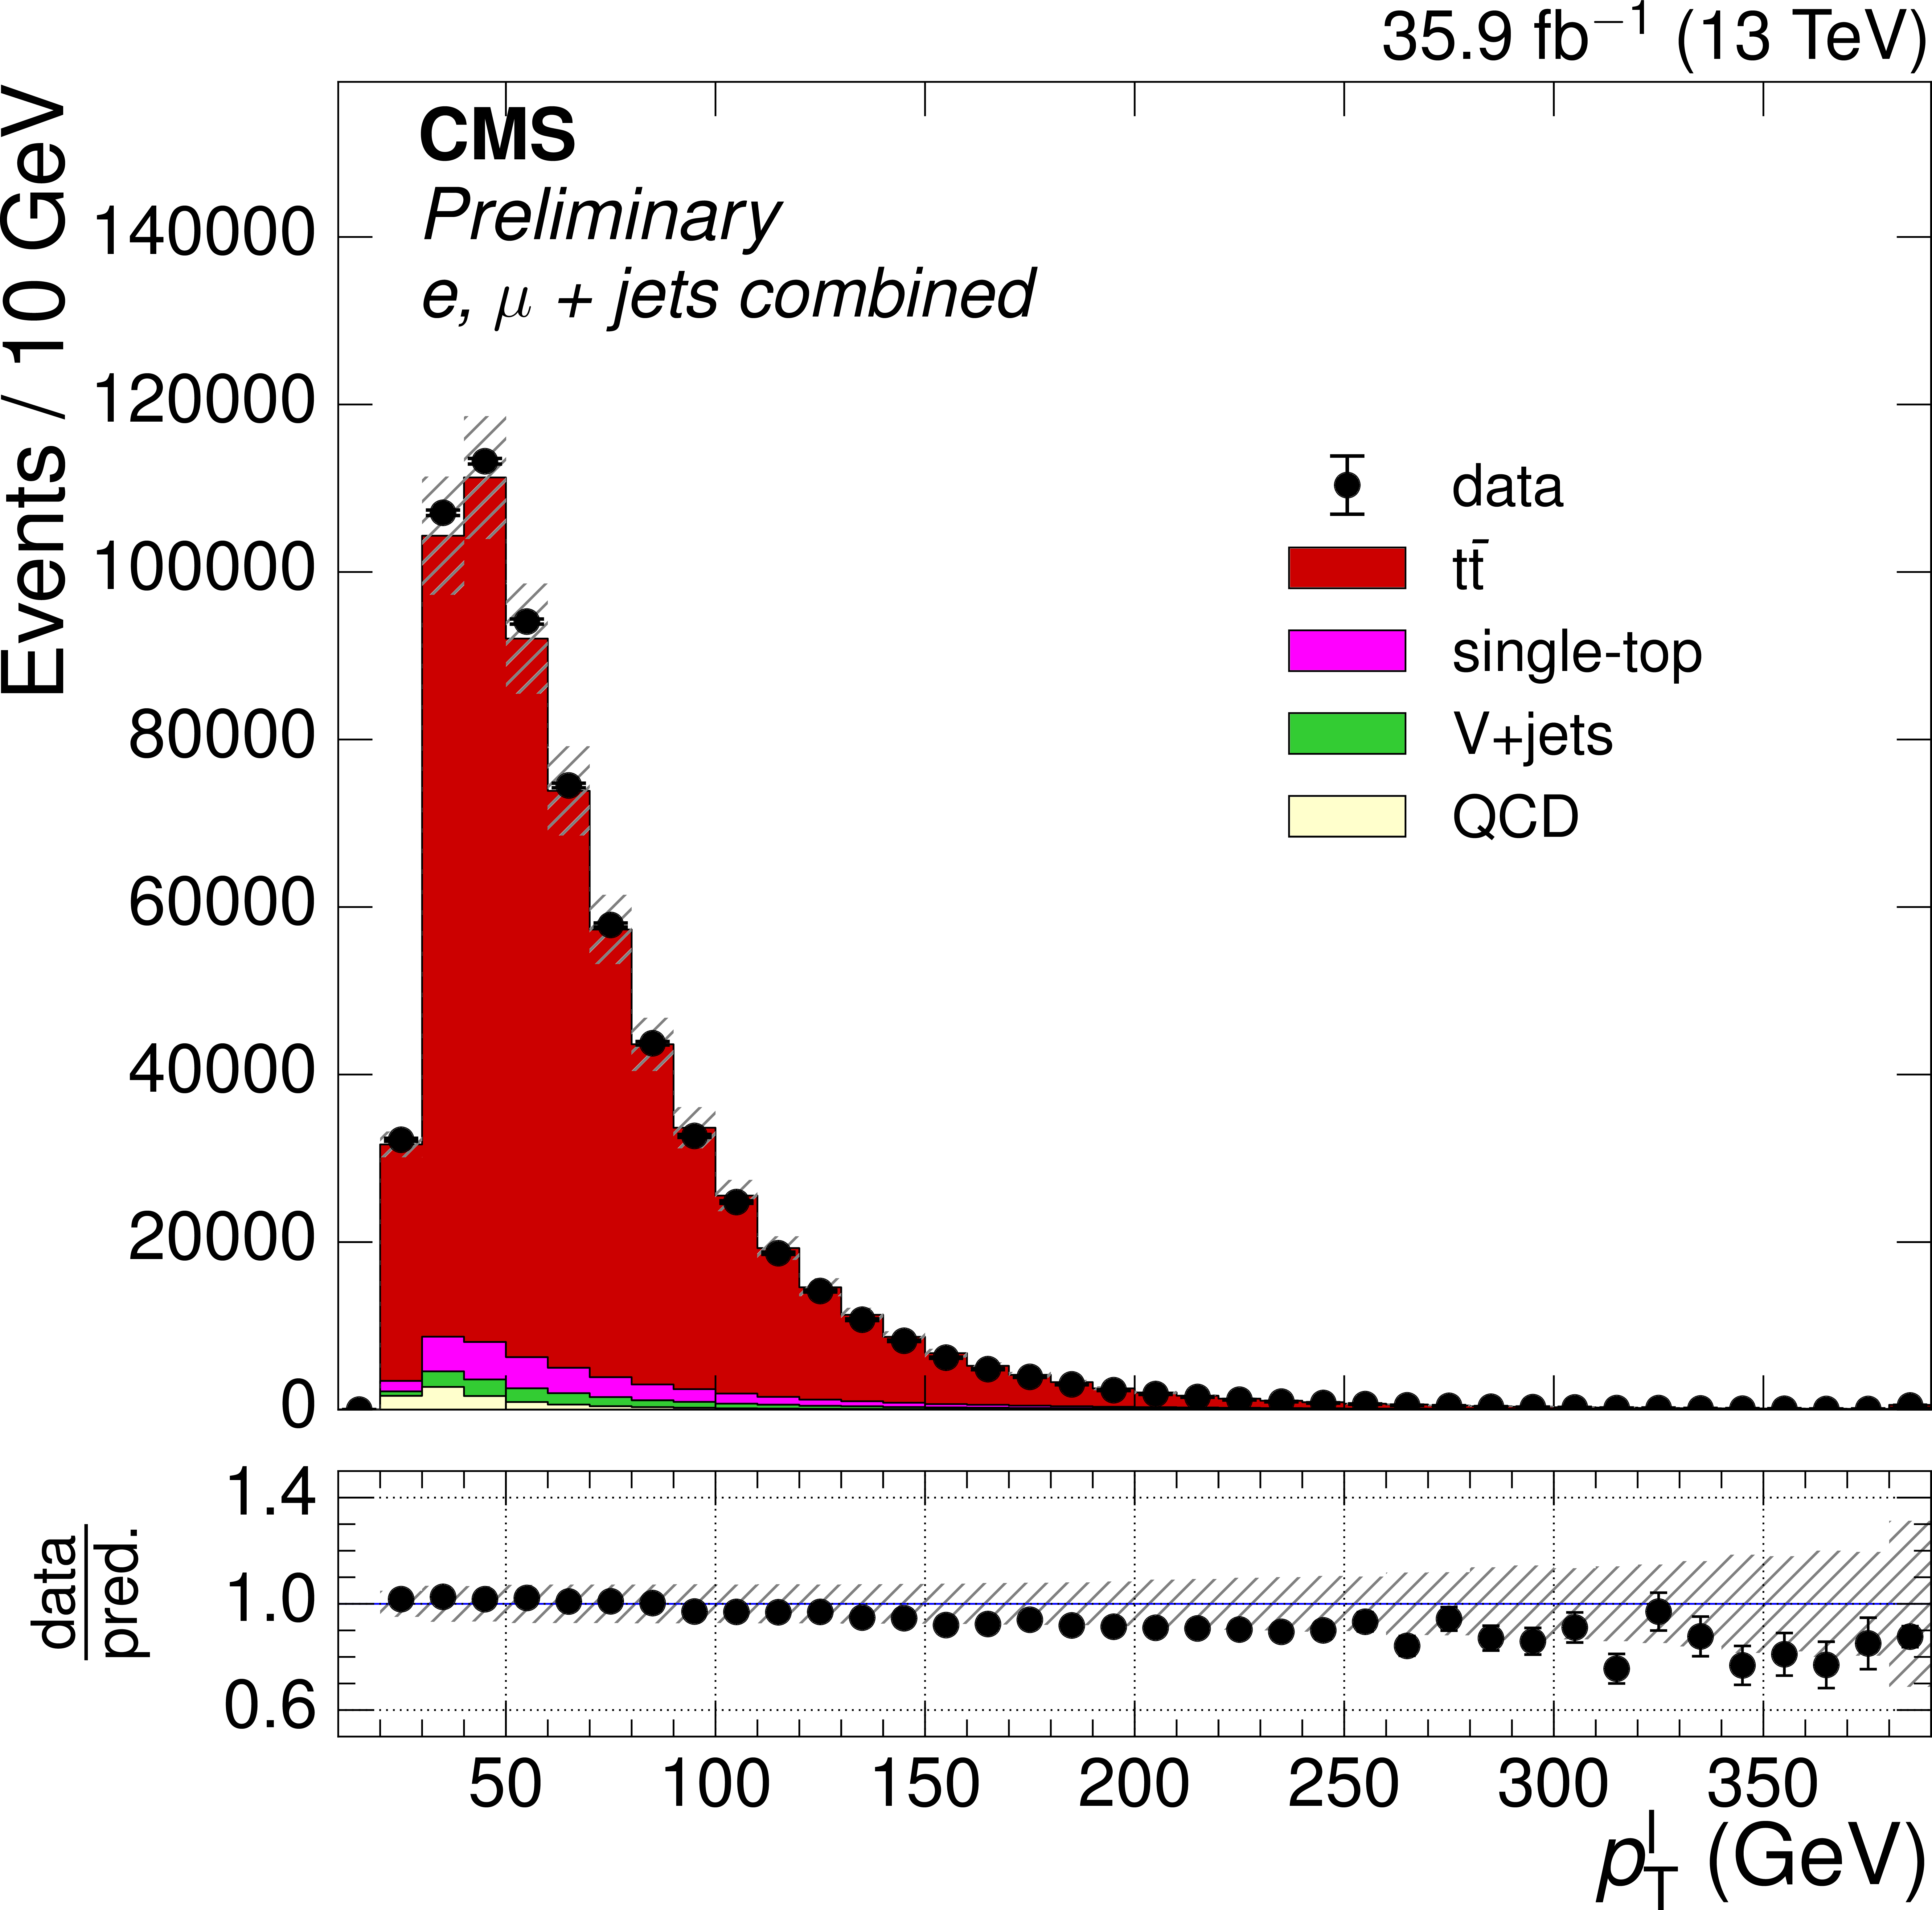
Figure 2:
The distributions of $ {p_{\text {T}}^{\ell}} $, and $ {N_{\text {jets}}} $ after full event selection. The $ {\mathrm{ t } {}\mathrm{ \bar{t} } } $ simulation is normalized to the NNLO prediction. The ratio of the number of events in data to that in simulation is shown below each of the distributions, with the statistical uncertainty in the data being shown by the vertical uncertainty bars. The statistical uncertainty in the number of simulation events, and the uncertainties in modeling in simulation are shown by the hatched band. |
png pdf |
Figure 2-a:
The distributions of $ {p_{\text {T}}^{\ell}} $ after full event selection. The $ {\mathrm{ t } {}\mathrm{ \bar{t} } } $ simulation is normalized to the NNLO prediction. The ratio of the number of events in data to that in simulation is shown below the distribution, with the statistical uncertainty in the data being shown by the vertical uncertainty bars. The statistical uncertainty in the number of simulation events, and the uncertainties in modeling in simulation are shown by the hatched band. |
png pdf |
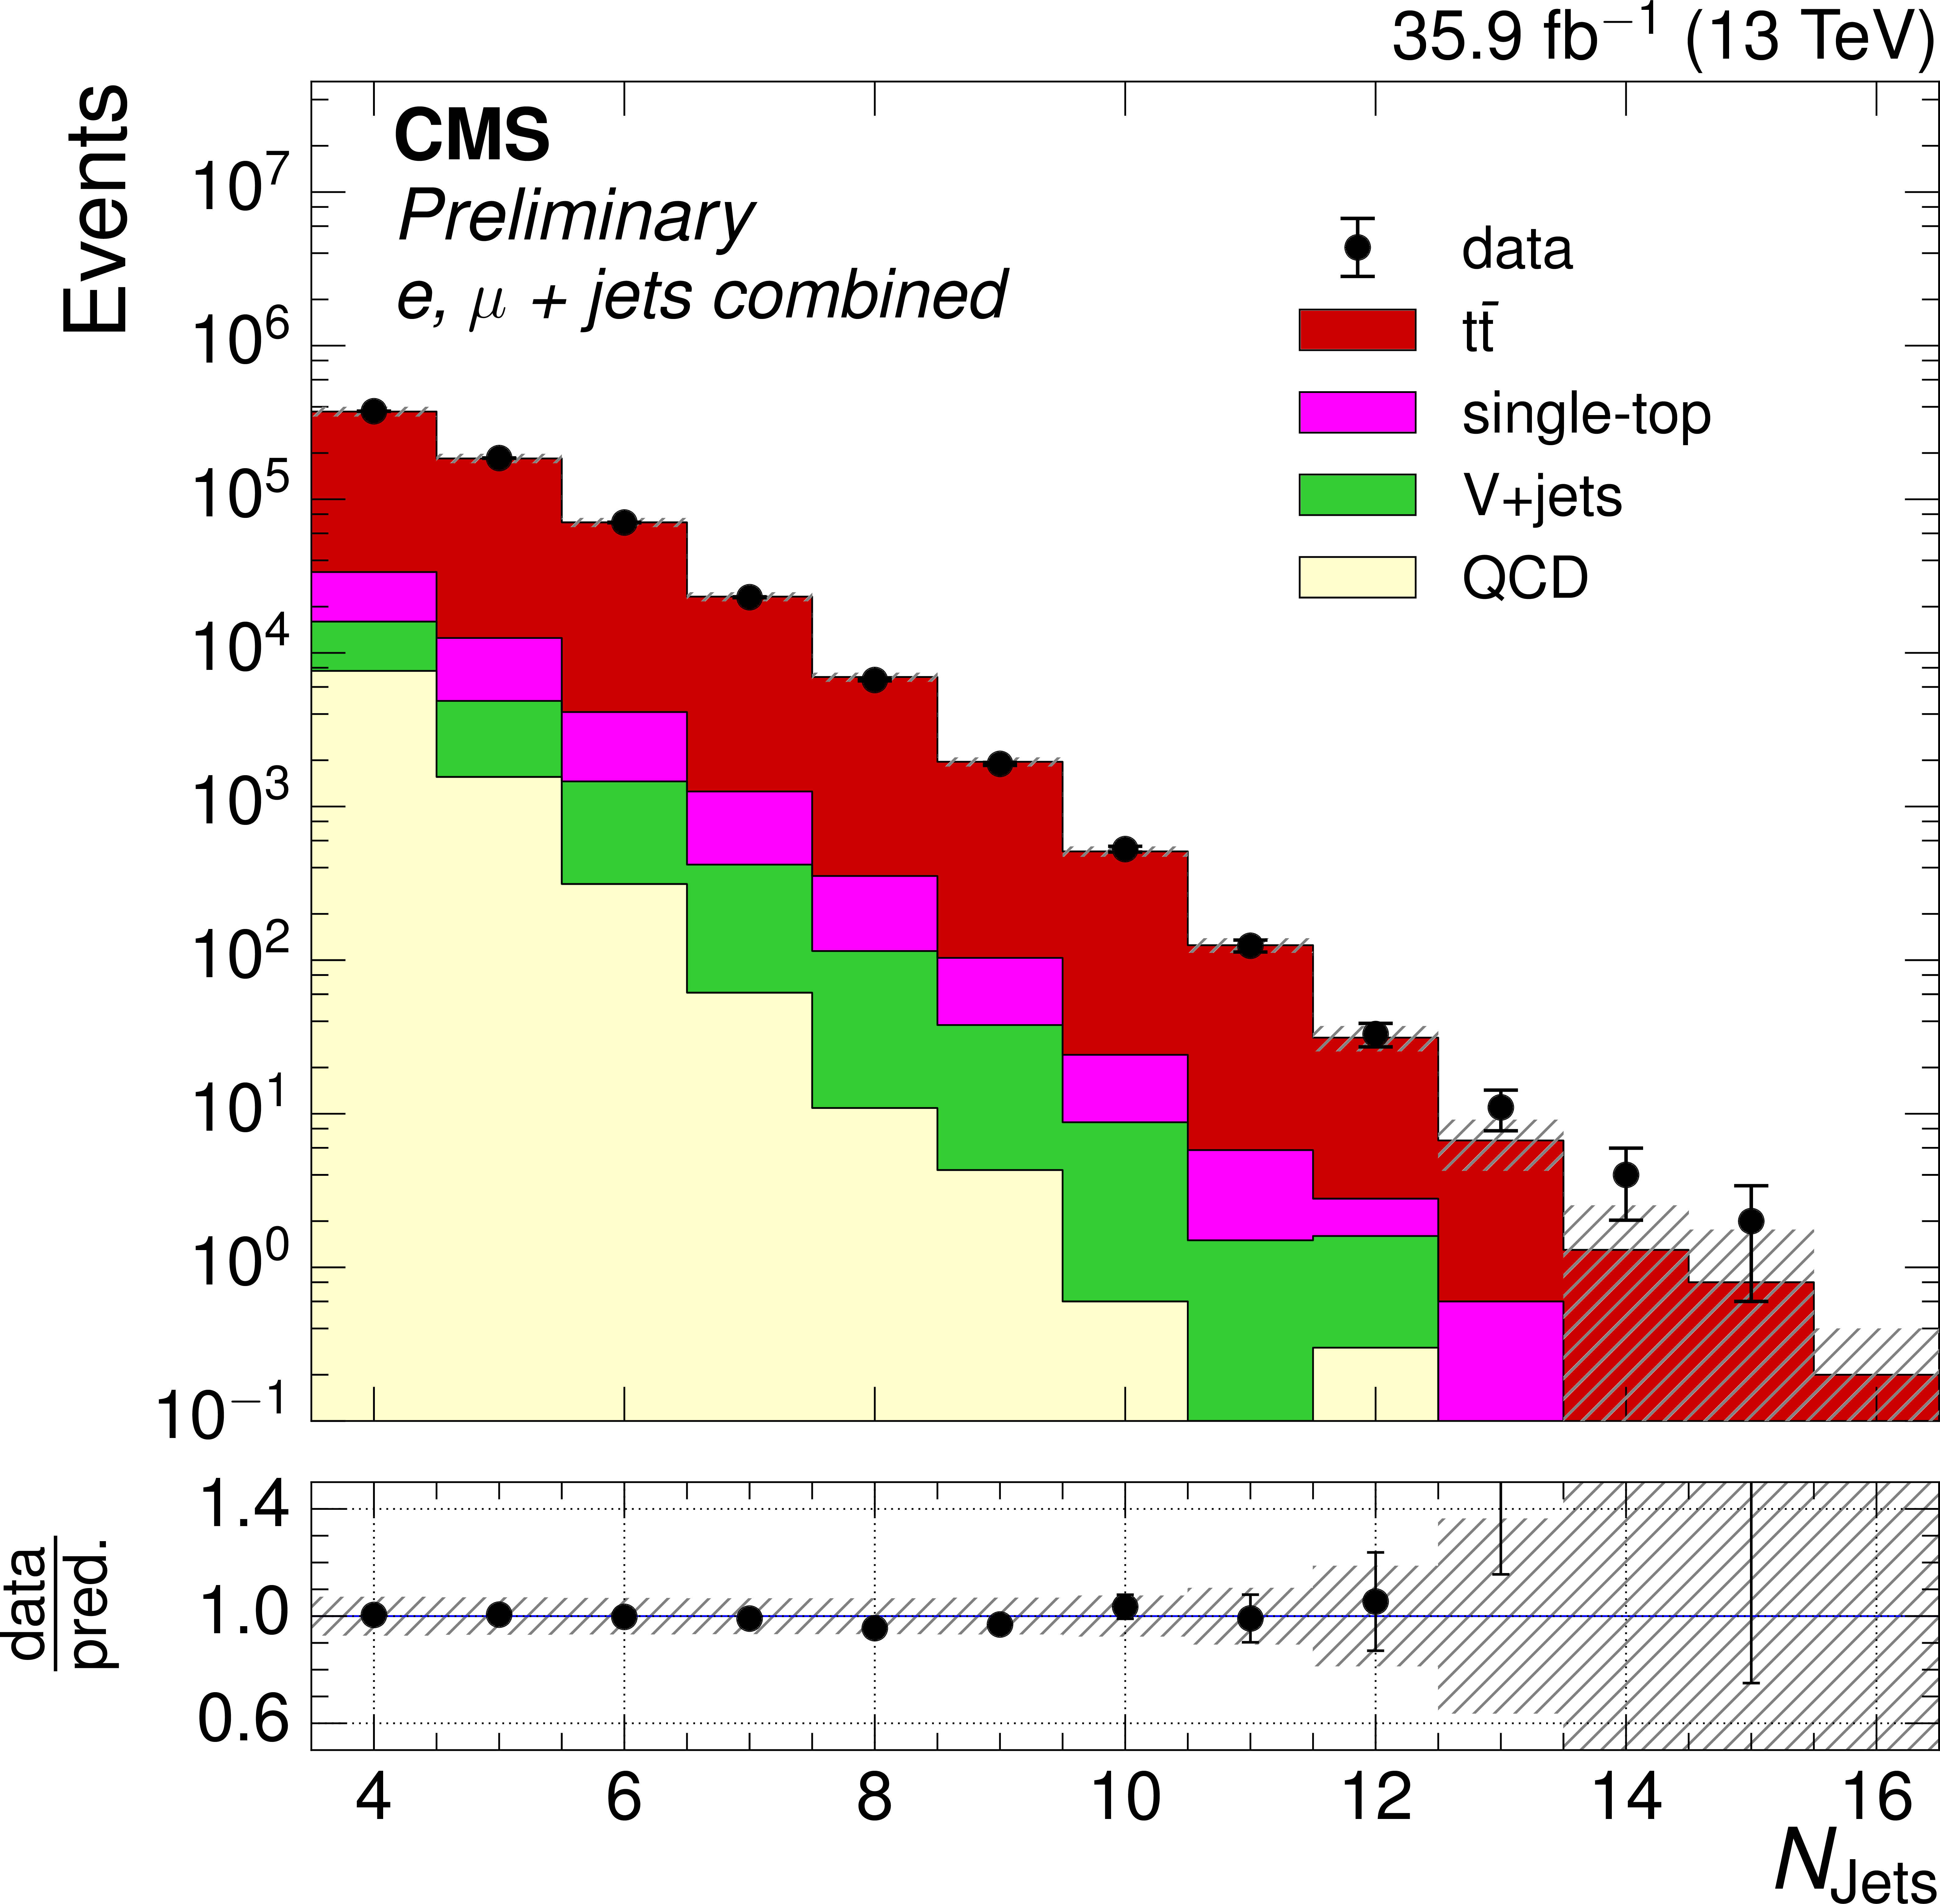
Figure 2-b:
The distributions of $ {N_{\text {jets}}} $ after full event selection. The $ {\mathrm{ t } {}\mathrm{ \bar{t} } } $ simulation is normalized to the NNLO prediction. The ratio of the number of events in data to that in simulation is shown below the distribution, with the statistical uncertainty in the data being shown by the vertical uncertainty bars. The statistical uncertainty in the number of simulation events, and the uncertainties in modeling in simulation are shown by the hatched band. |
png pdf |
Figure 3:
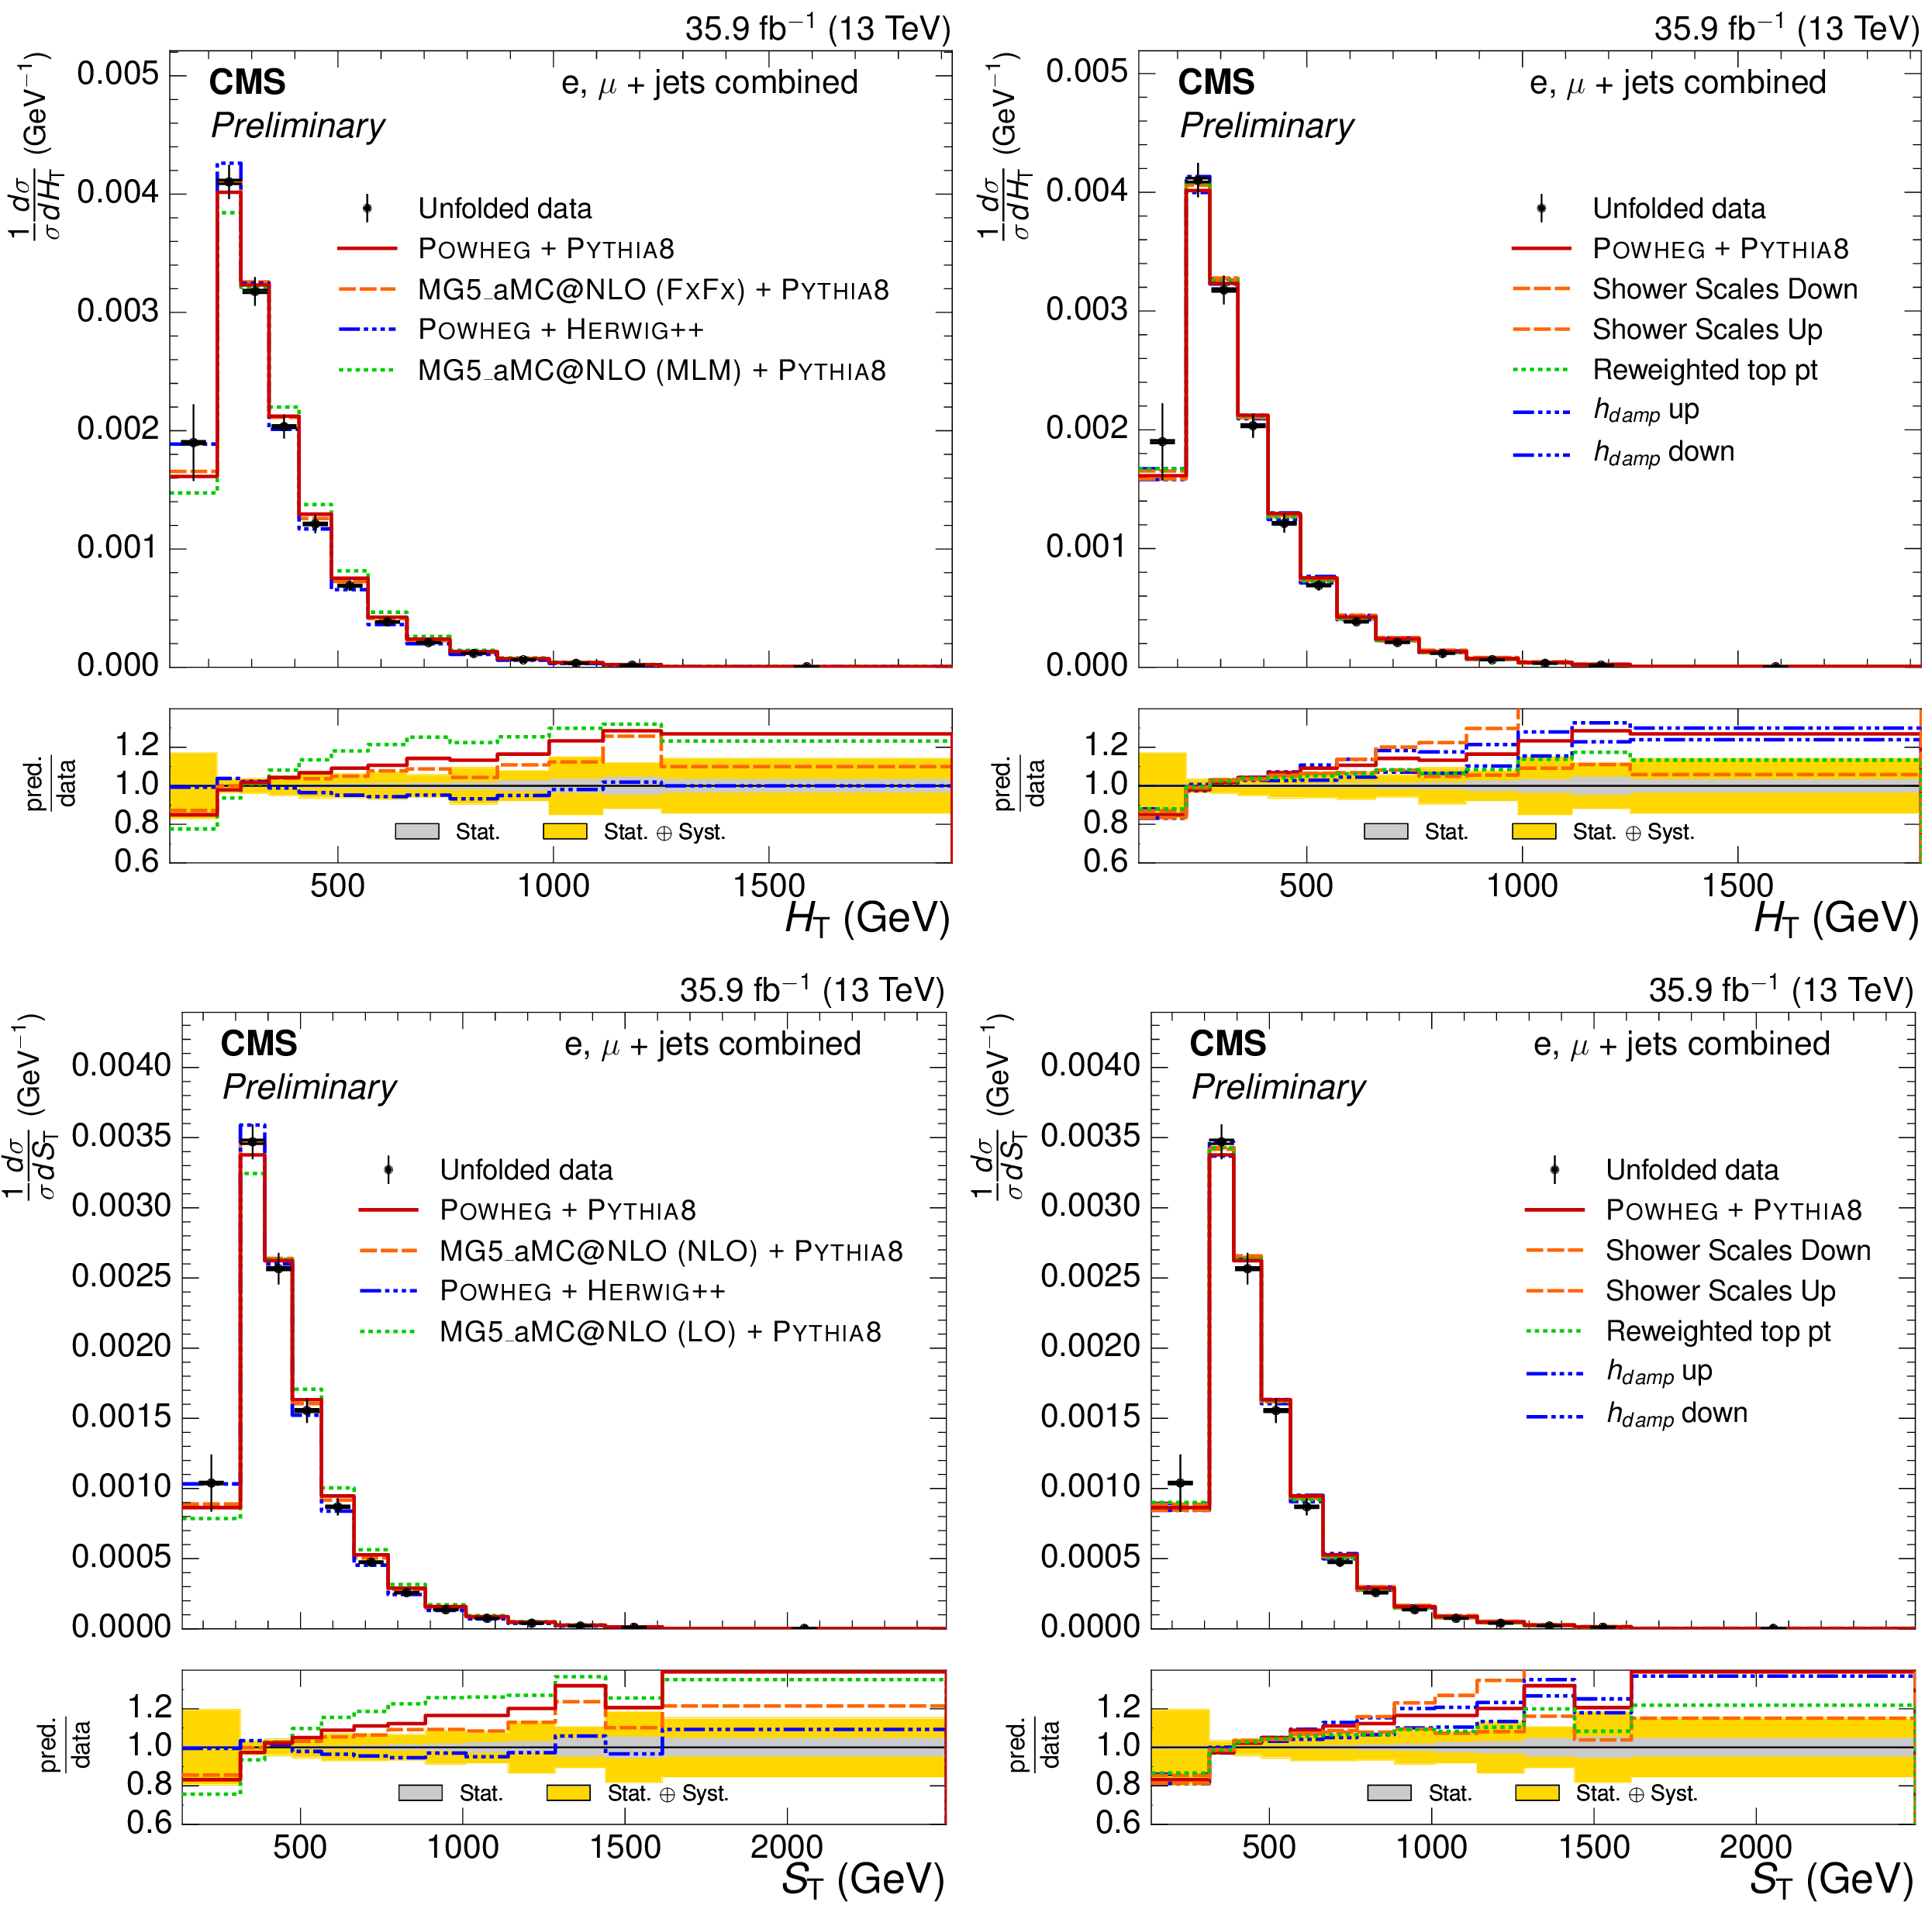
Normalized $ {H_{\mathrm {T}}} $ and $ {S_{\text {T}}} $ differential $ {\mathrm{ t } {}\mathrm{ \bar{t} } } $ cross sections, compared to different $ {\mathrm{ t } {}\mathrm{ \bar{t} } } $ simulations in the left plots, and compared to the POWHEG+PYTHIA-8 simulation after varying the shower scales, and $ {h_{\text {damp}}} $ parameter, within their uncertainties in the right plots. The vertical bars on the data represent the statistical and systematic uncertainties added in quadrature. The lower plots show the ratio of the predictions to the data. |

png pdf |
Figure 3-a:
Normalized $ {H_{\mathrm {T}}} $ differential $ {\mathrm{ t } {}\mathrm{ \bar{t} } } $ cross sections, compared to different $ {\mathrm{ t } {}\mathrm{ \bar{t} } } $ simulations. The vertical bars on the data represent the statistical and systematic uncertainties added in quadrature. The lower plot shows the ratio of the predictions to the data. |
png pdf |
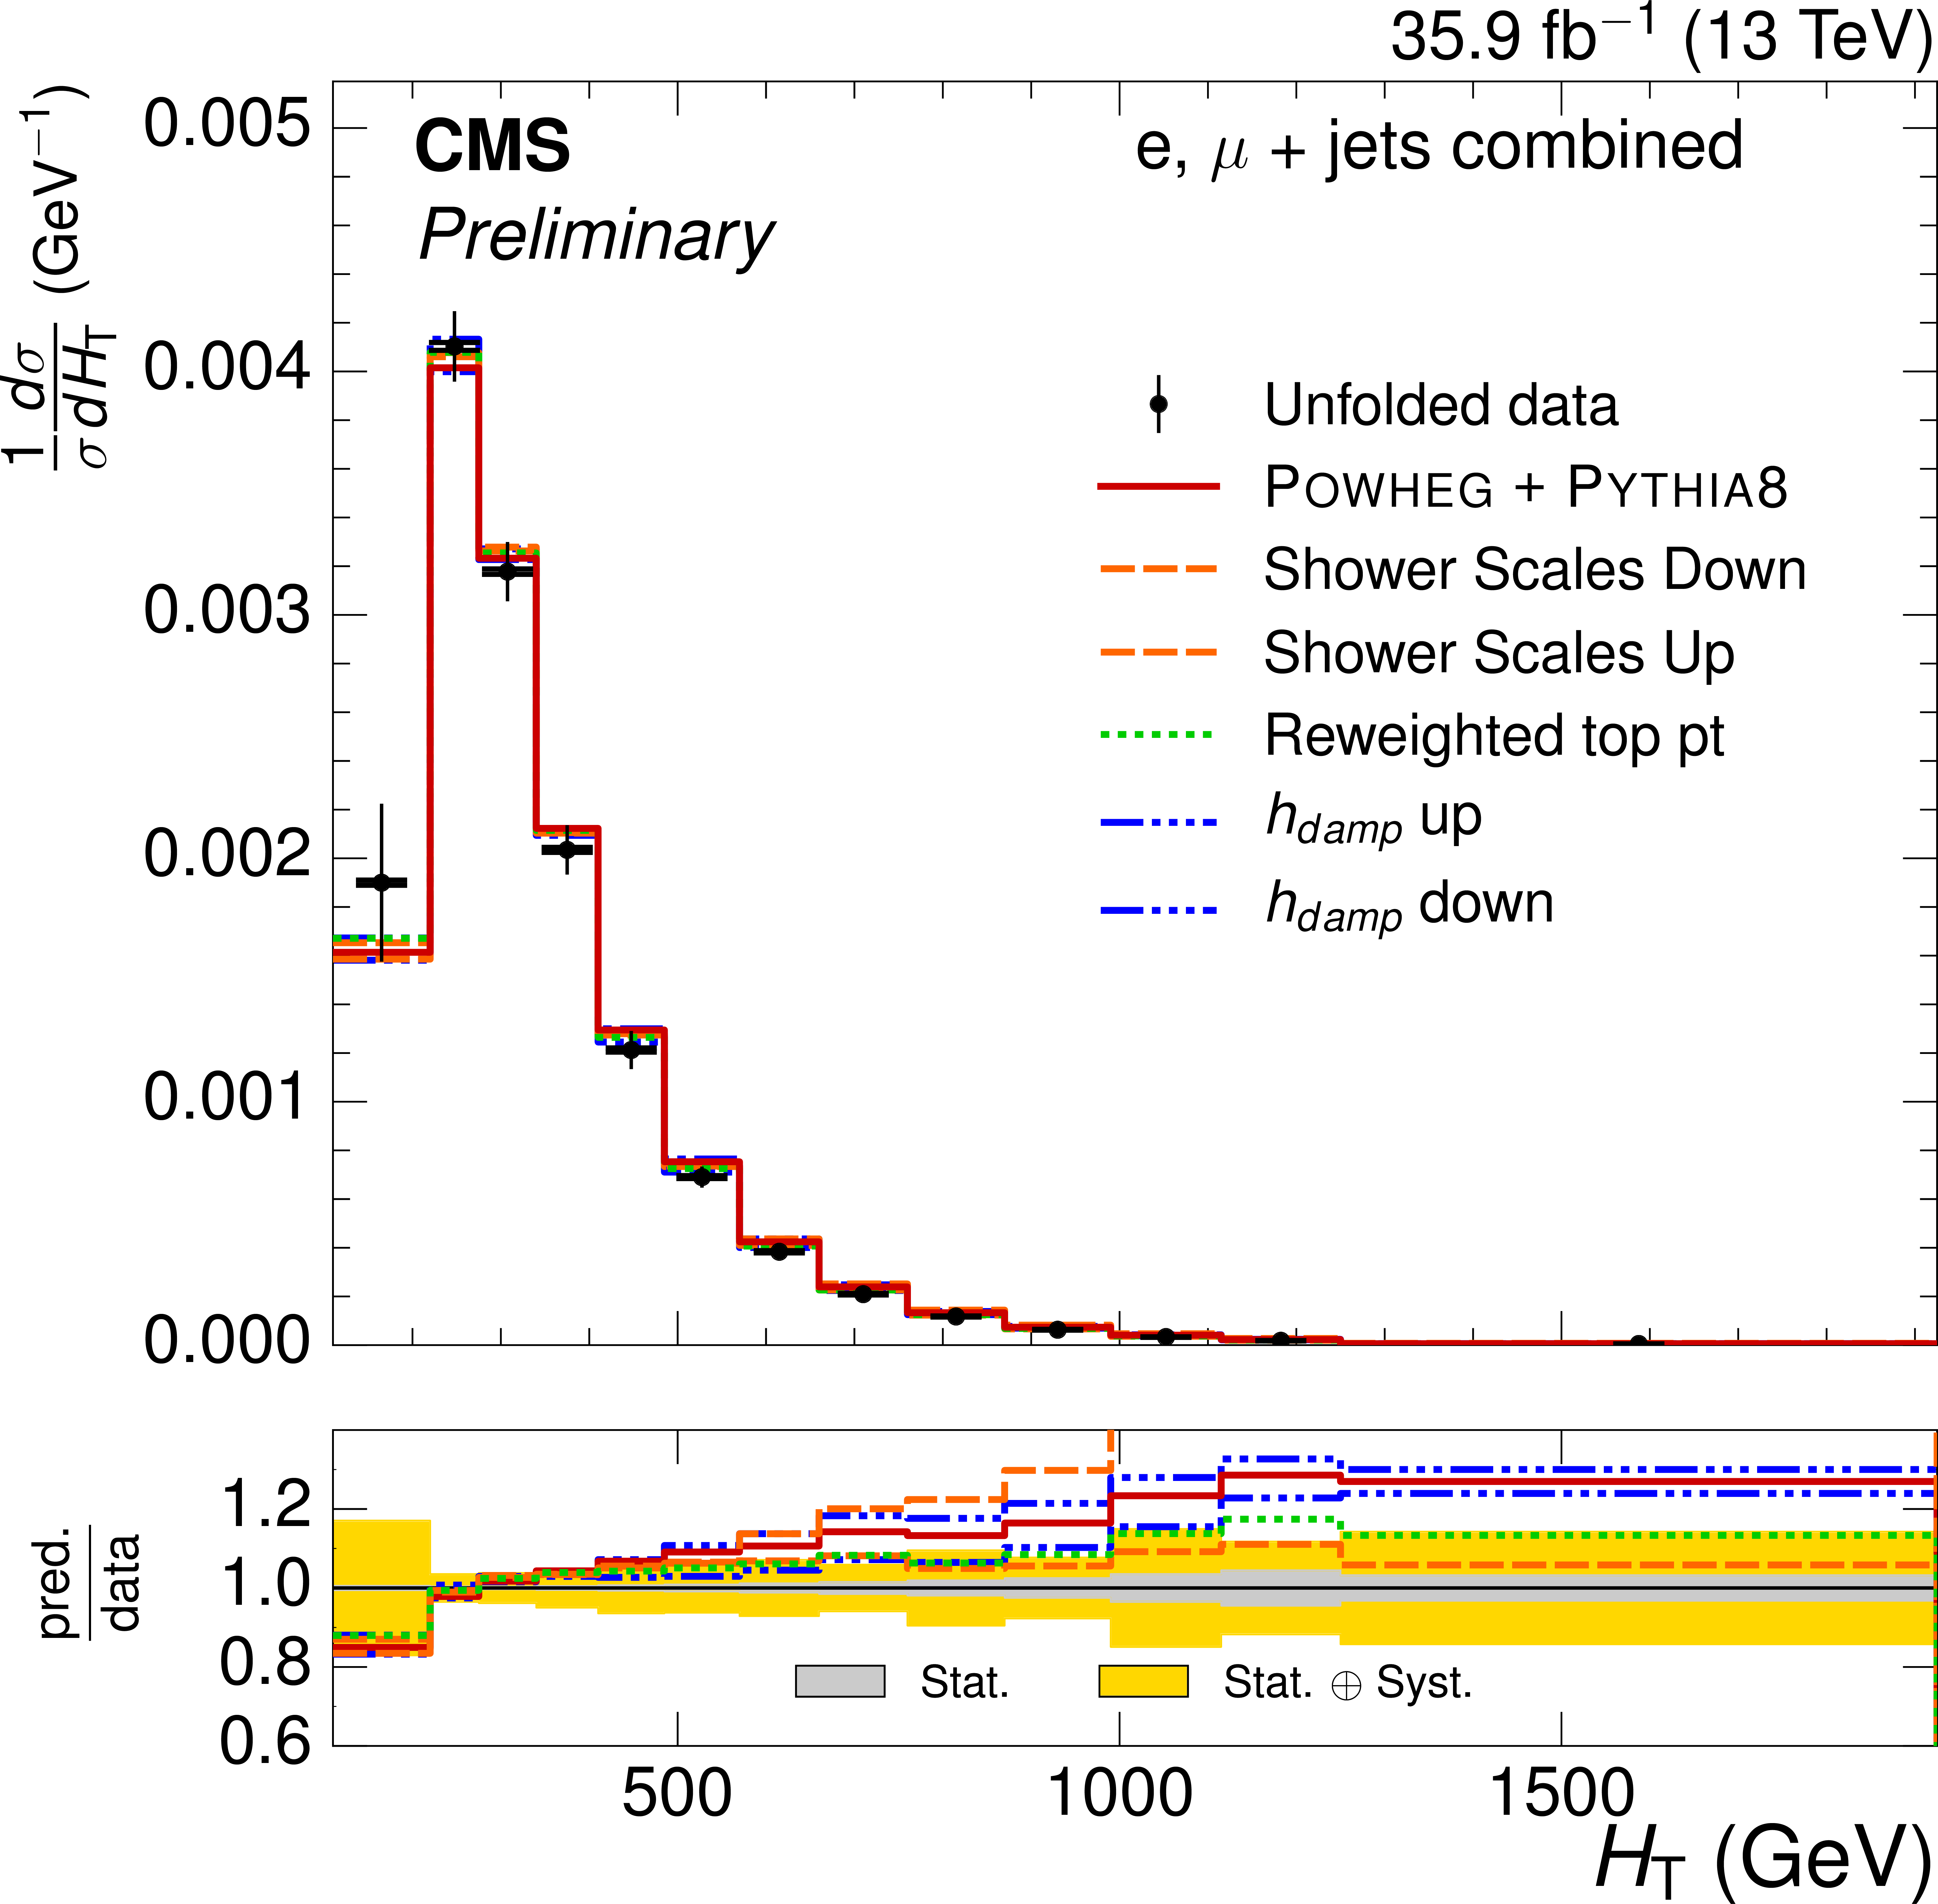
Figure 3-b:
Normalized $ {H_{\mathrm {T}}} $ differential $ {\mathrm{ t } {}\mathrm{ \bar{t} } } $ cross sections, compared to the POWHEG+PYTHIA-8 simulation after varying the shower scales, and $ {h_{\text {damp}}} $ parameter, within their uncertainties. The vertical bars on the data represent the statistical and systematic uncertainties added in quadrature. The lower plot shows the ratio of the predictions to the data. |
png pdf |
Figure 3-c:
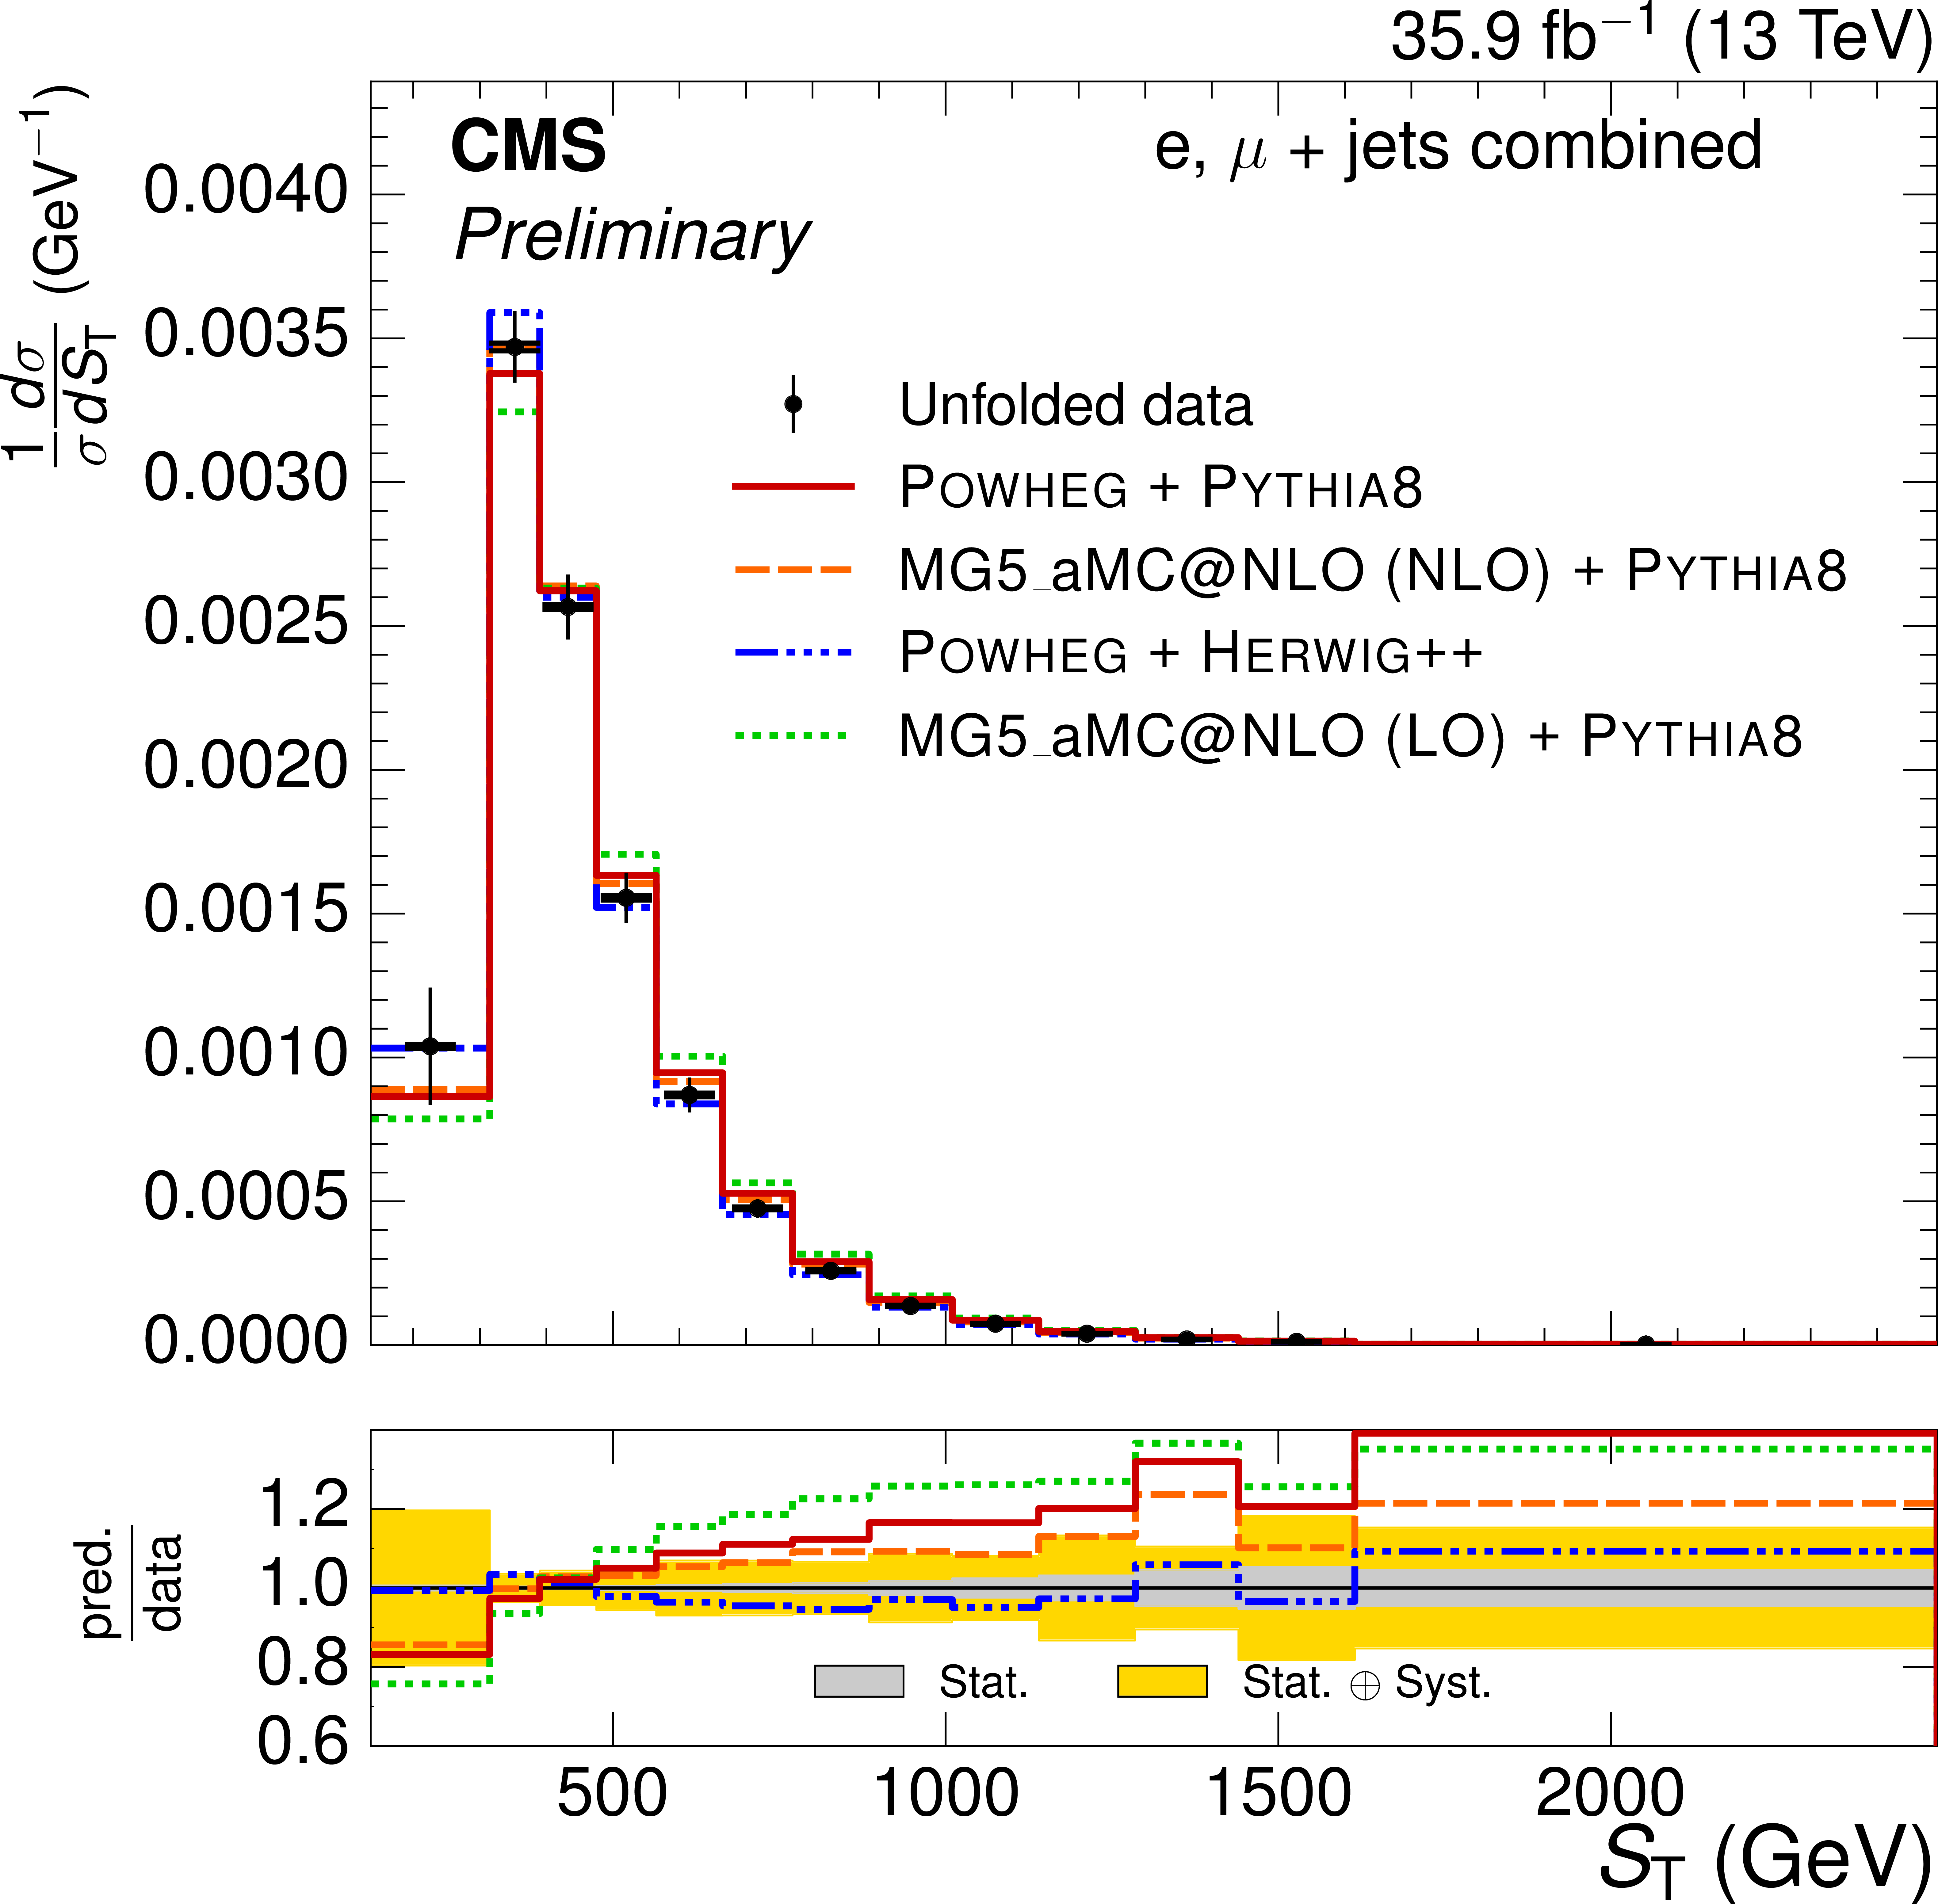
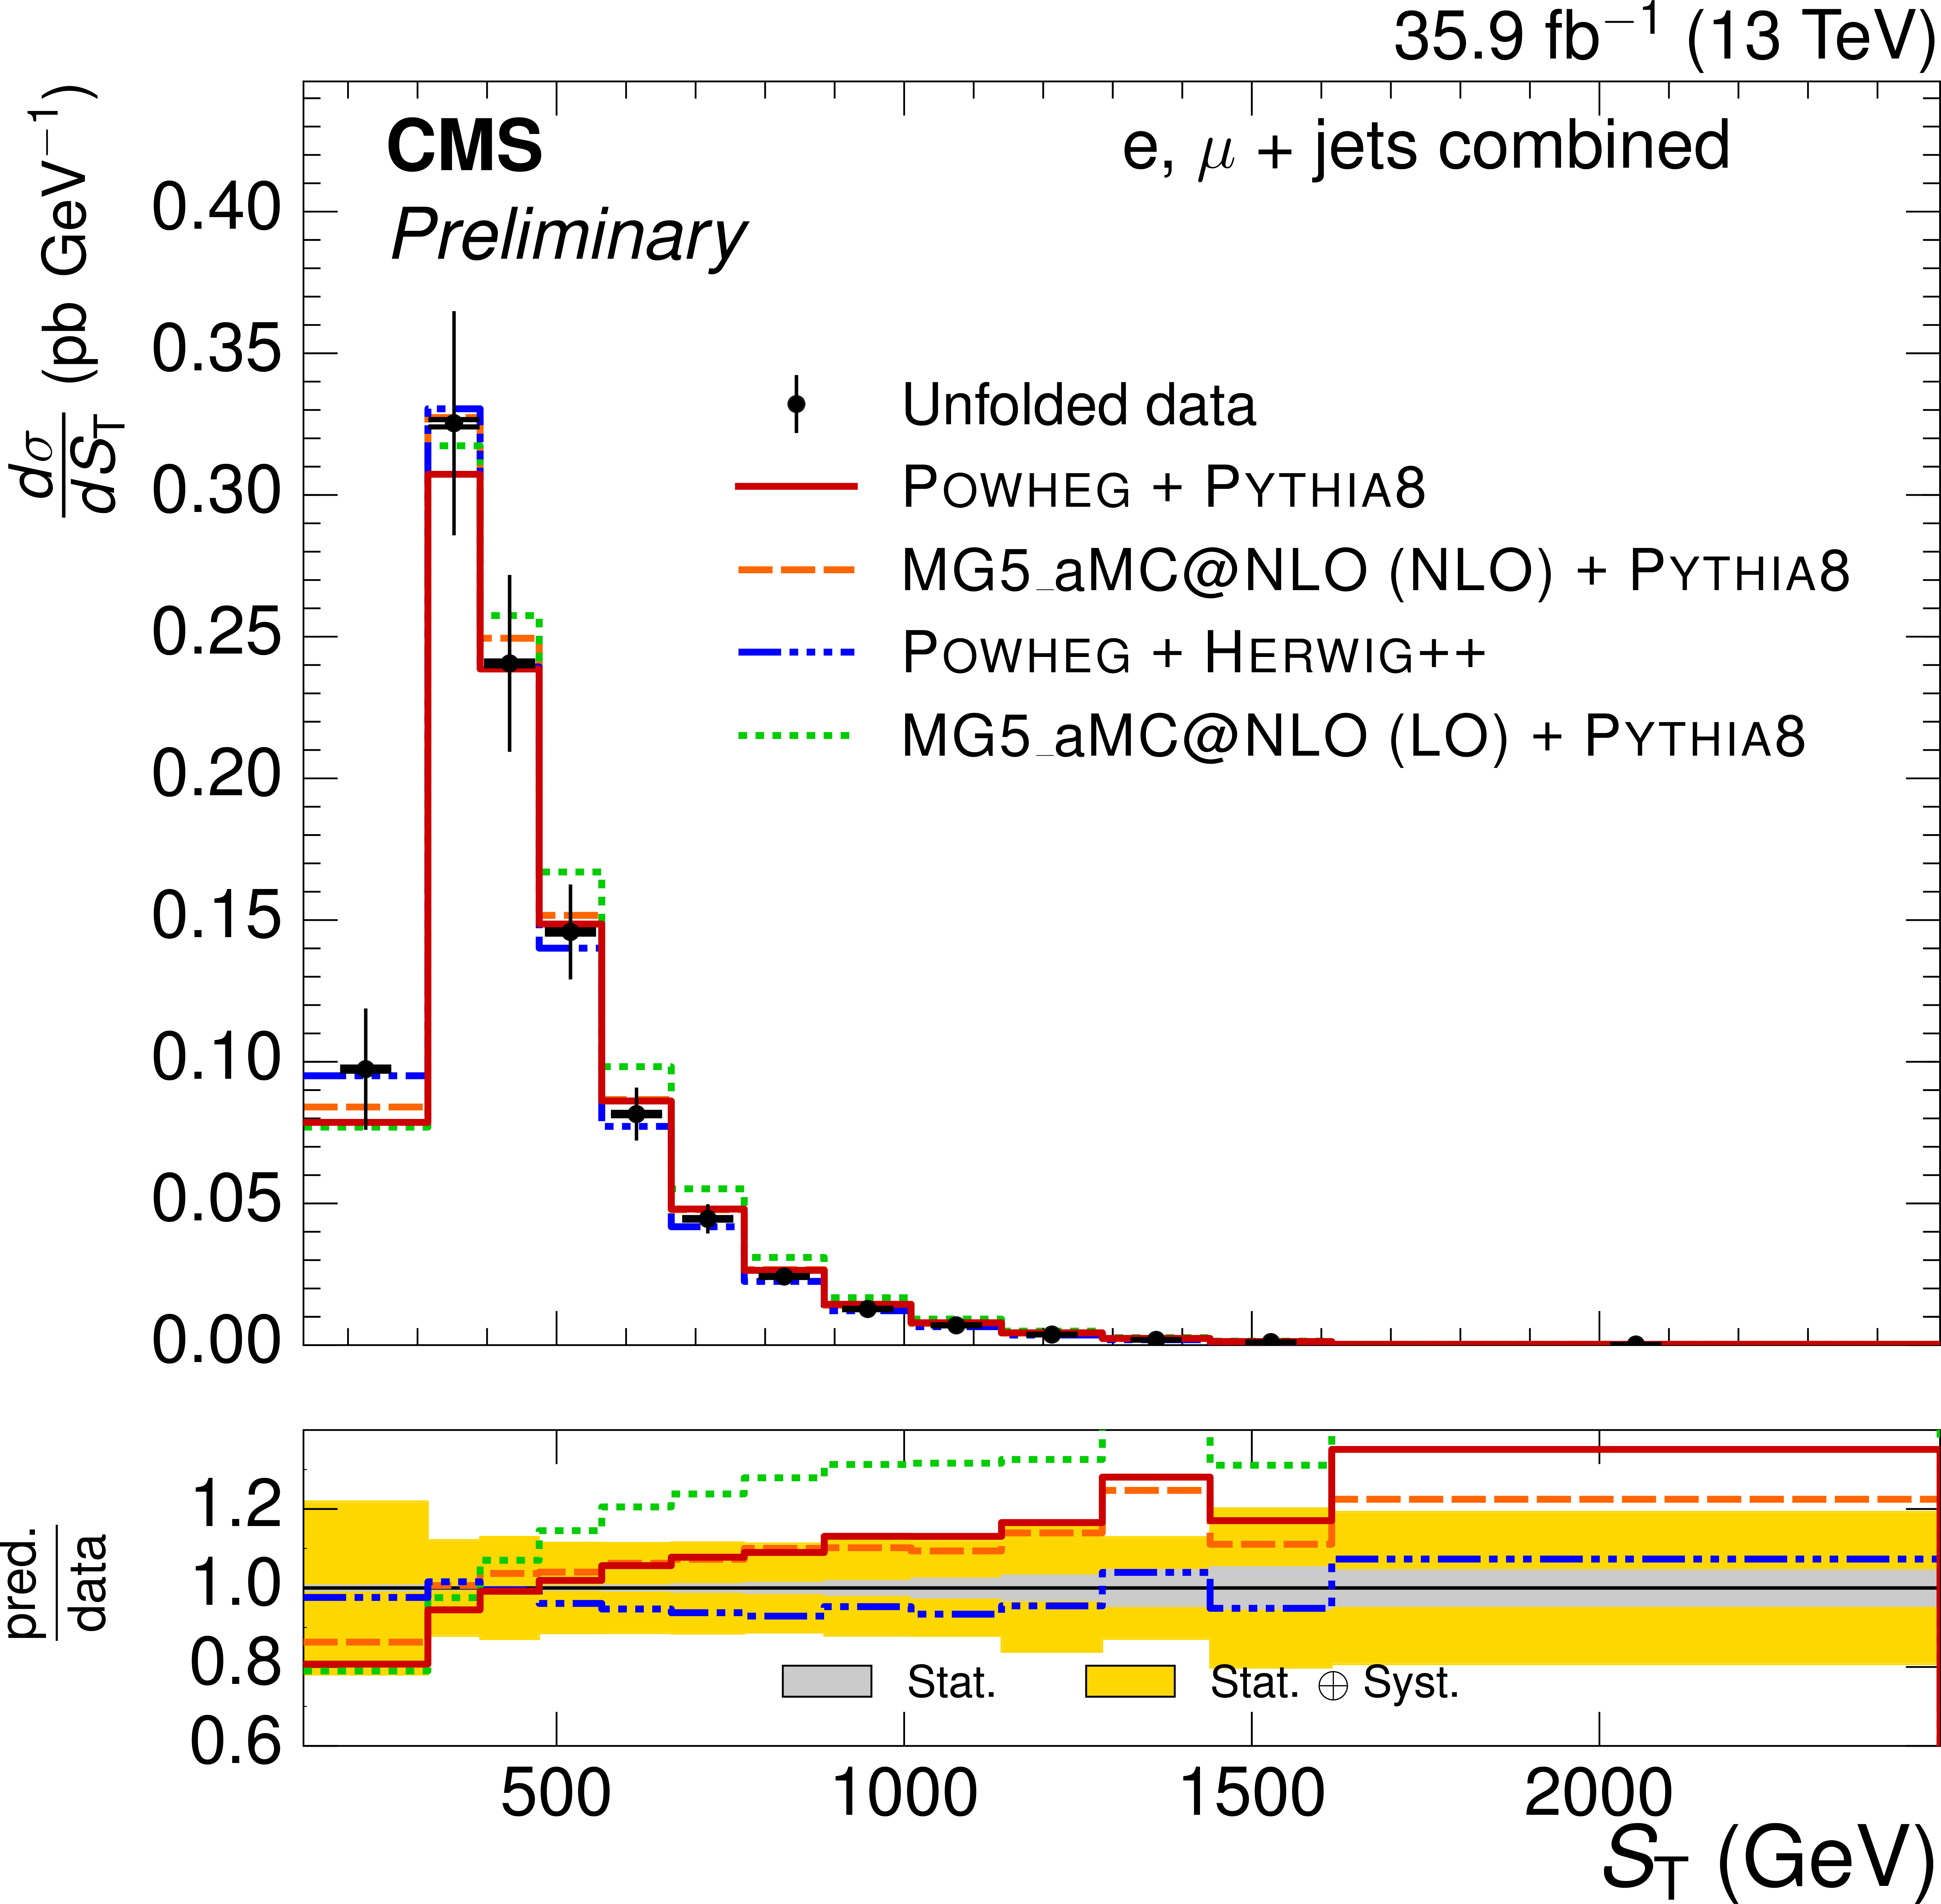
Normalized $ {S_{\text {T}}} $ differential $ {\mathrm{ t } {}\mathrm{ \bar{t} } } $ cross sections, compared to different $ {\mathrm{ t } {}\mathrm{ \bar{t} } } $ simulations. The vertical bars on the data represent the statistical and systematic uncertainties added in quadrature. The lower plot shows the ratio of the predictions to the data. |

png pdf |
Figure 3-d:
Normalized $ {S_{\text {T}}} $ differential $ {\mathrm{ t } {}\mathrm{ \bar{t} } } $ cross sections, compared to the POWHEG+PYTHIA-8 simulation after varying the shower scales, and $ {h_{\text {damp}}} $ parameter, within their uncertainties. The vertical bars on the data represent the statistical and systematic uncertainties added in quadrature. The lower plot shows the ratio of the predictions to the data. |
png pdf |
Figure 4:
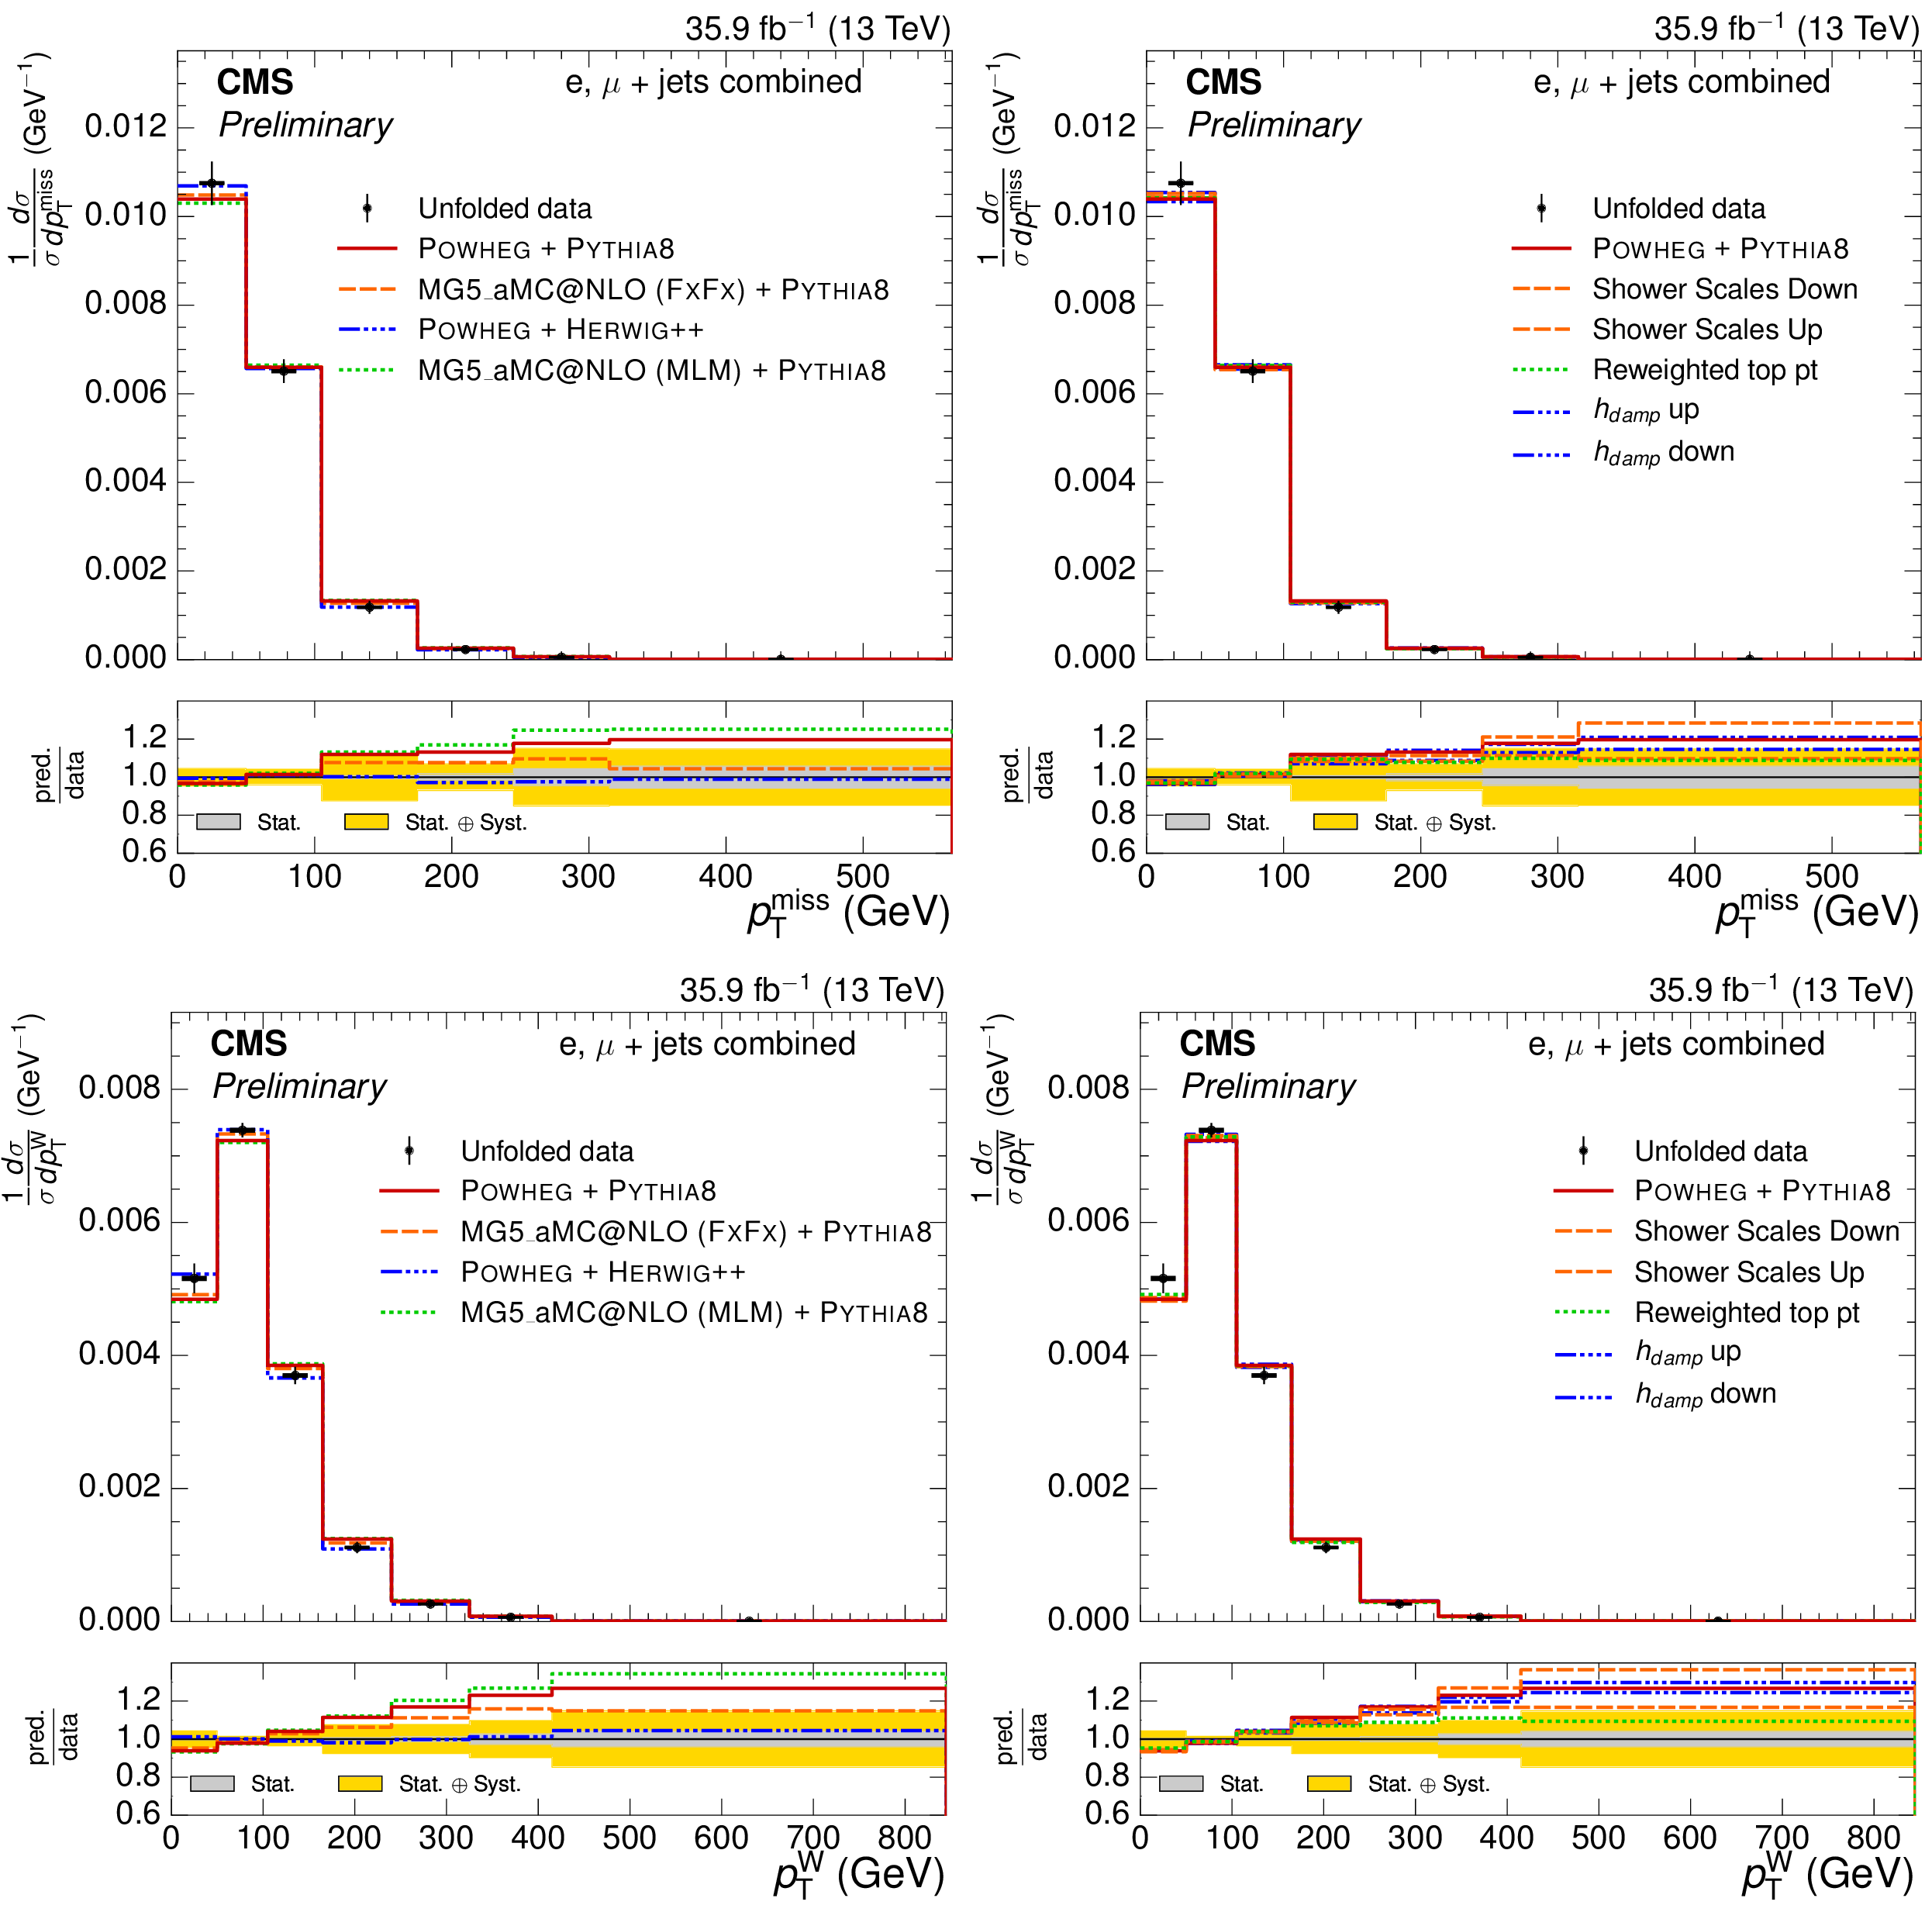
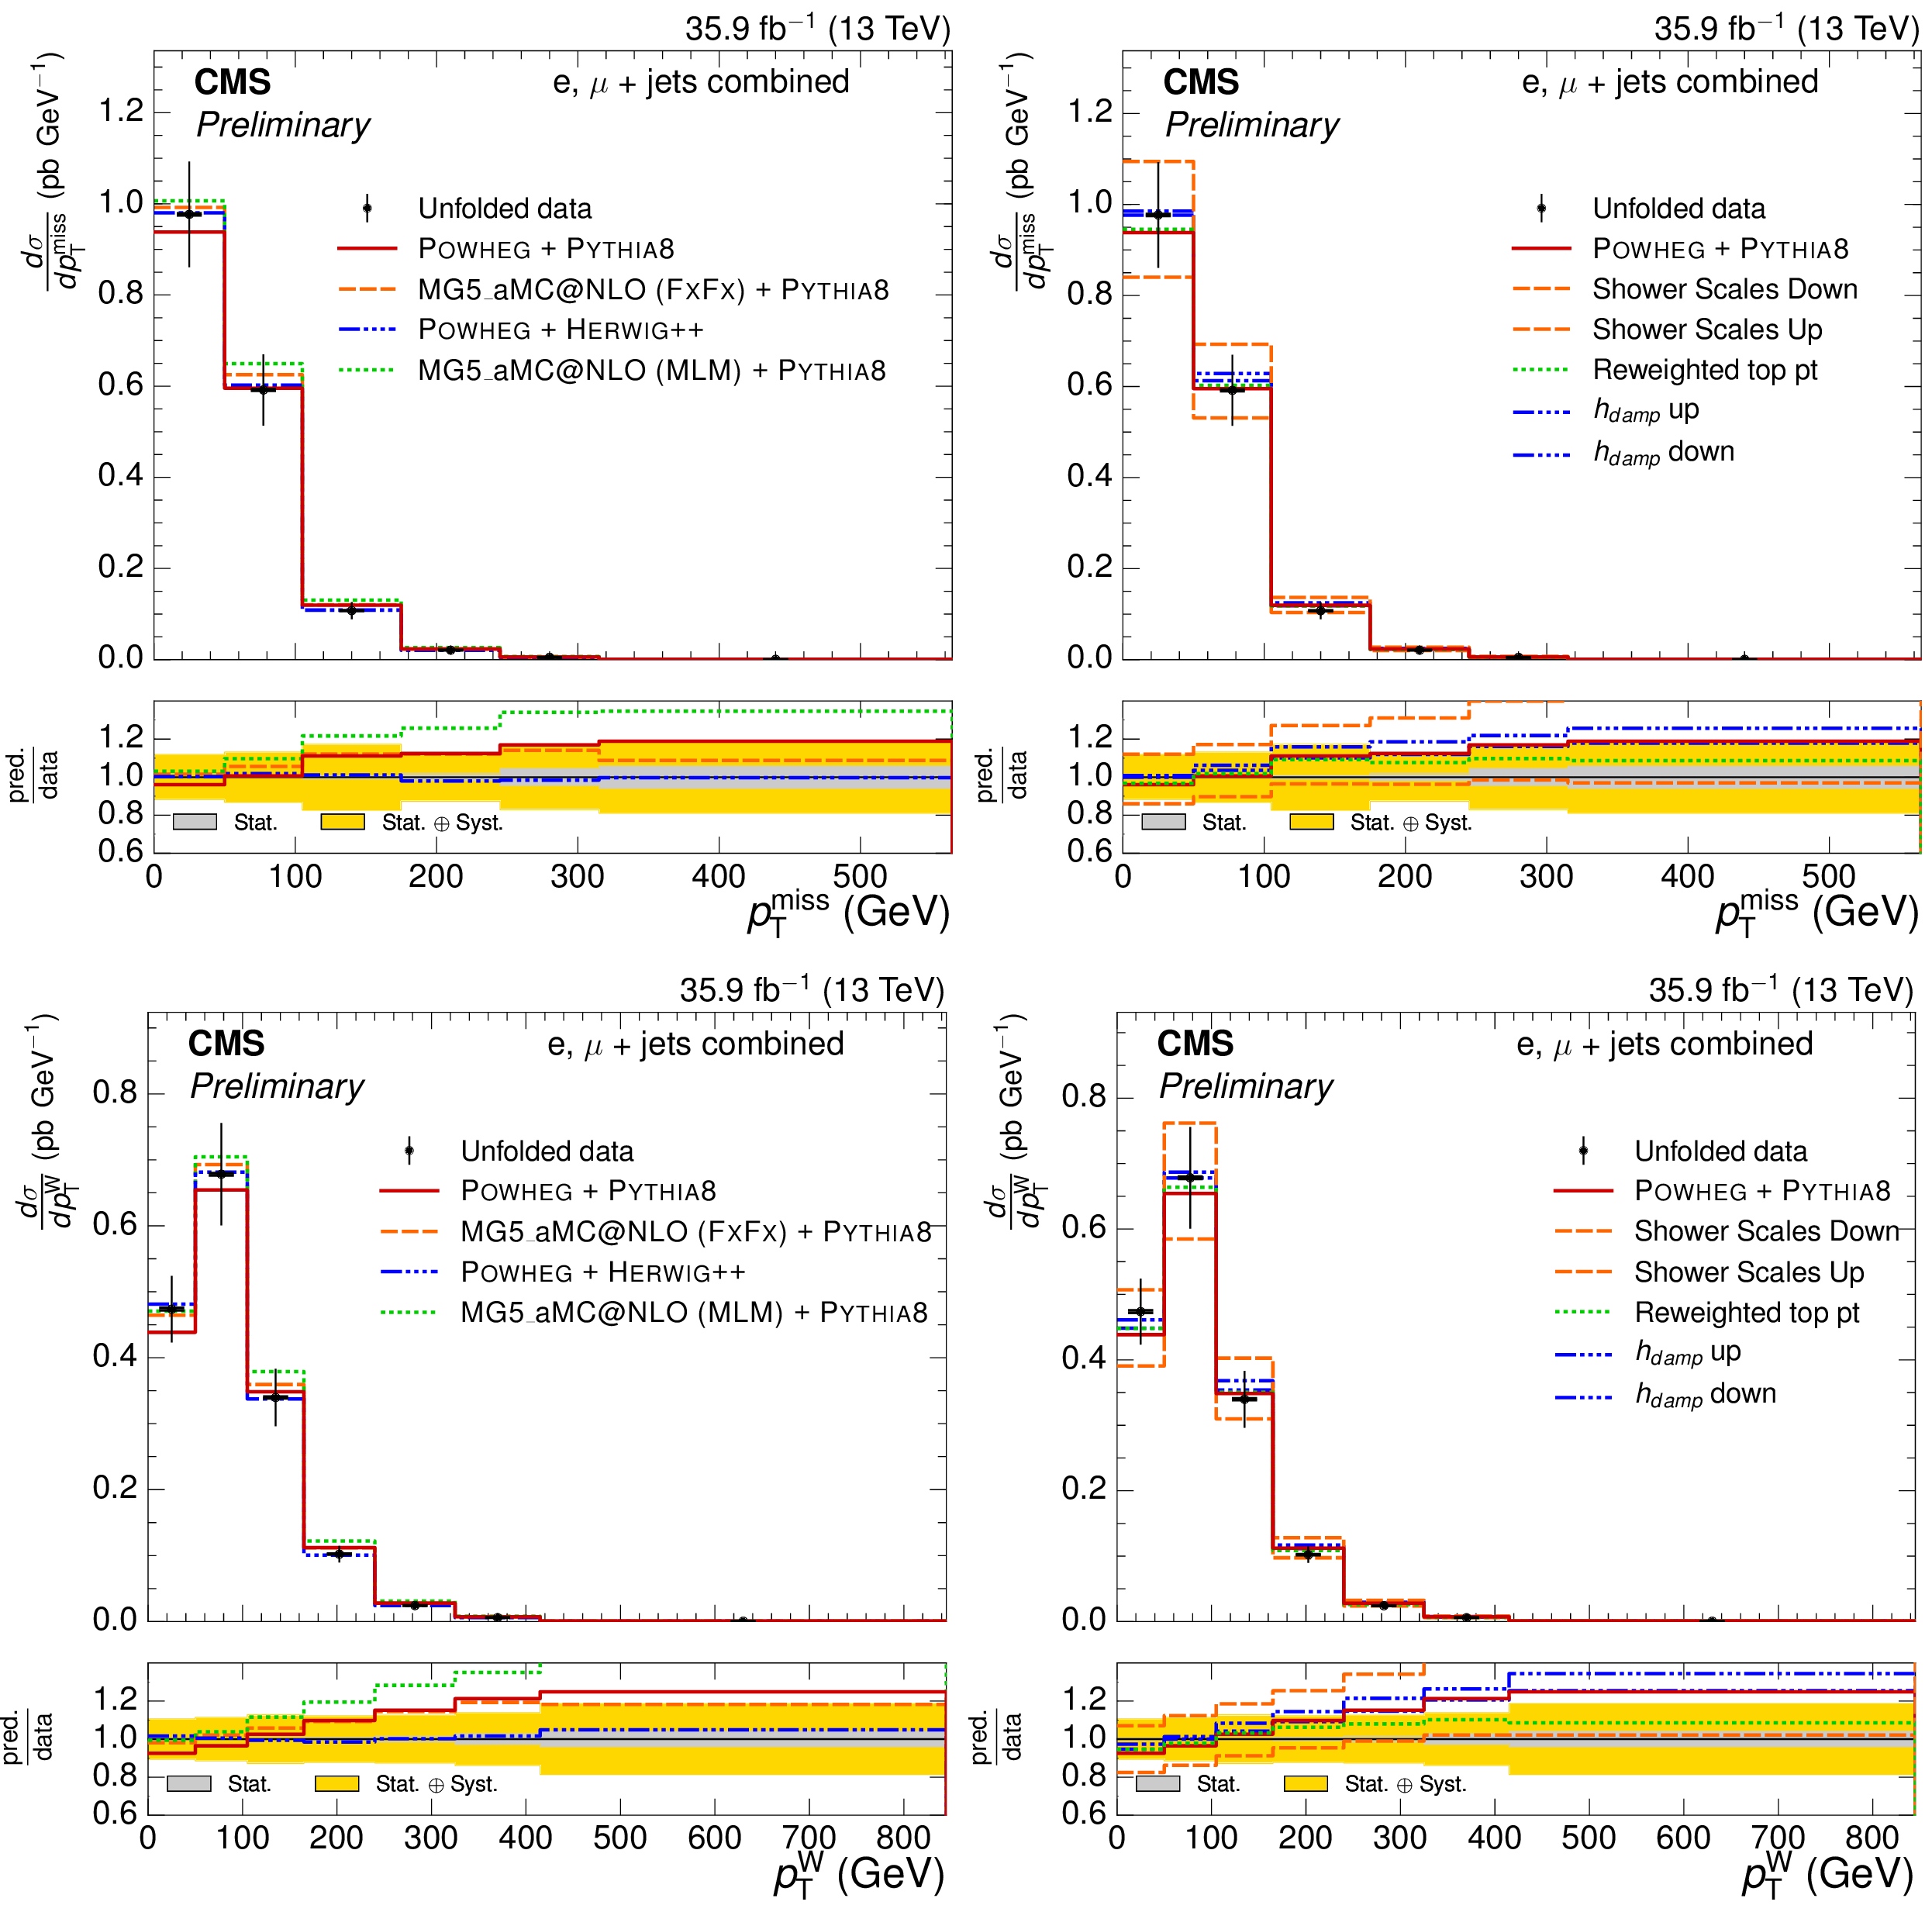
Normalized $ { {p_{\mathrm {T}}} ^\text {miss}} $ and $ {p_{\text {T}}^{\mathrm{ W } }} $ differential $ {\mathrm{ t } {}\mathrm{ \bar{t} } } $ cross sections, compared to different $ {\mathrm{ t } {}\mathrm{ \bar{t} } } $ simulations in the left plots, and compared to the POWHEG+PYTHIA-8 simulation after varying the shower scales, and $ {h_{\text {damp}}} $ parameter, within their uncertainties in the right plots. The vertical bars on the data represent the statistical and systematic uncertainties added in quadrature. The lower plots show the ratio of the predictions to the data. |

png pdf |
Figure 4-a:
Normalized $ { {p_{\mathrm {T}}} ^\text {miss}} $ differential $ {\mathrm{ t } {}\mathrm{ \bar{t} } } $ cross section, compared to different $ {\mathrm{ t } {}\mathrm{ \bar{t} } } $ simulations. The vertical bars on the data represent the statistical and systematic uncertainties added in quadrature. The lower plot shows the ratio of the predictions to the data. |

png pdf |
Figure 4-b:
Normalized $ { {p_{\mathrm {T}}} ^\text {miss}} $ differential $ {\mathrm{ t } {}\mathrm{ \bar{t} } } $ cross section, compared to the POWHEG+PYTHIA-8 simulation after varying the shower scales, and $ {h_{\text {damp}}} $ parameter, within their uncertainties. The vertical bars on the data represent the statistical and systematic uncertainties added in quadrature. The lower plot shows the ratio of the predictions to the data. |
png pdf |
Figure 4-c:
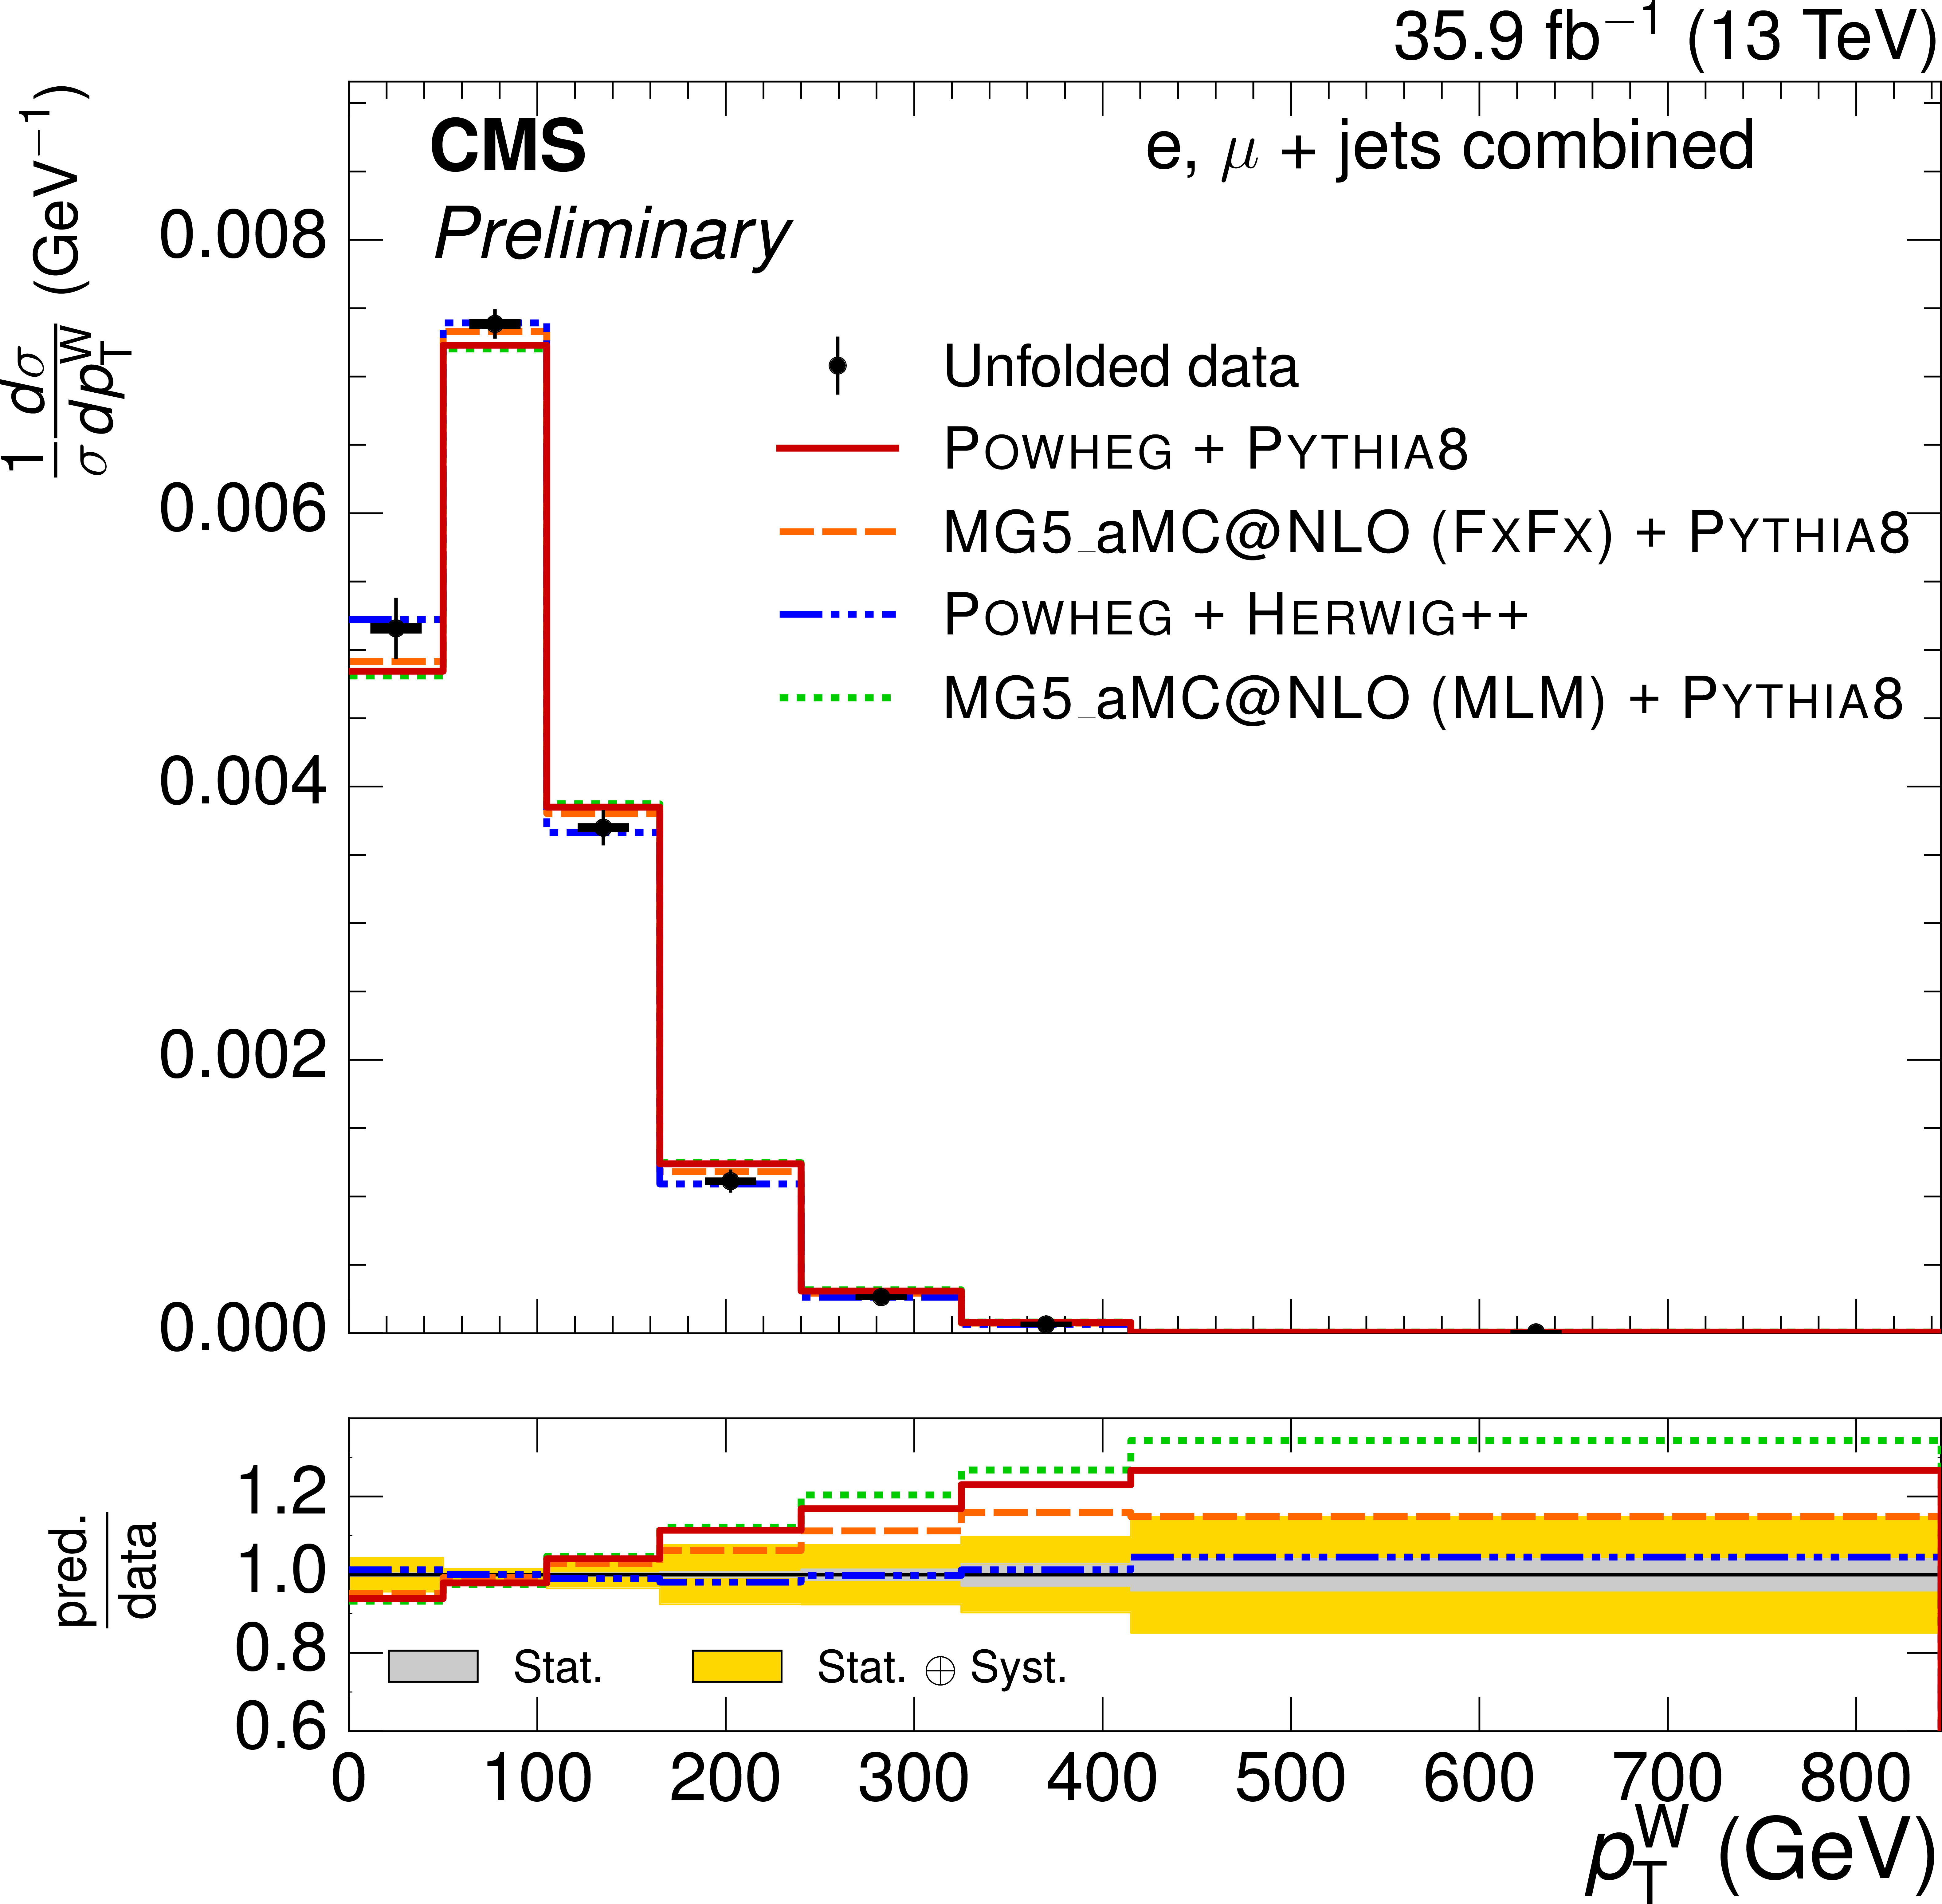
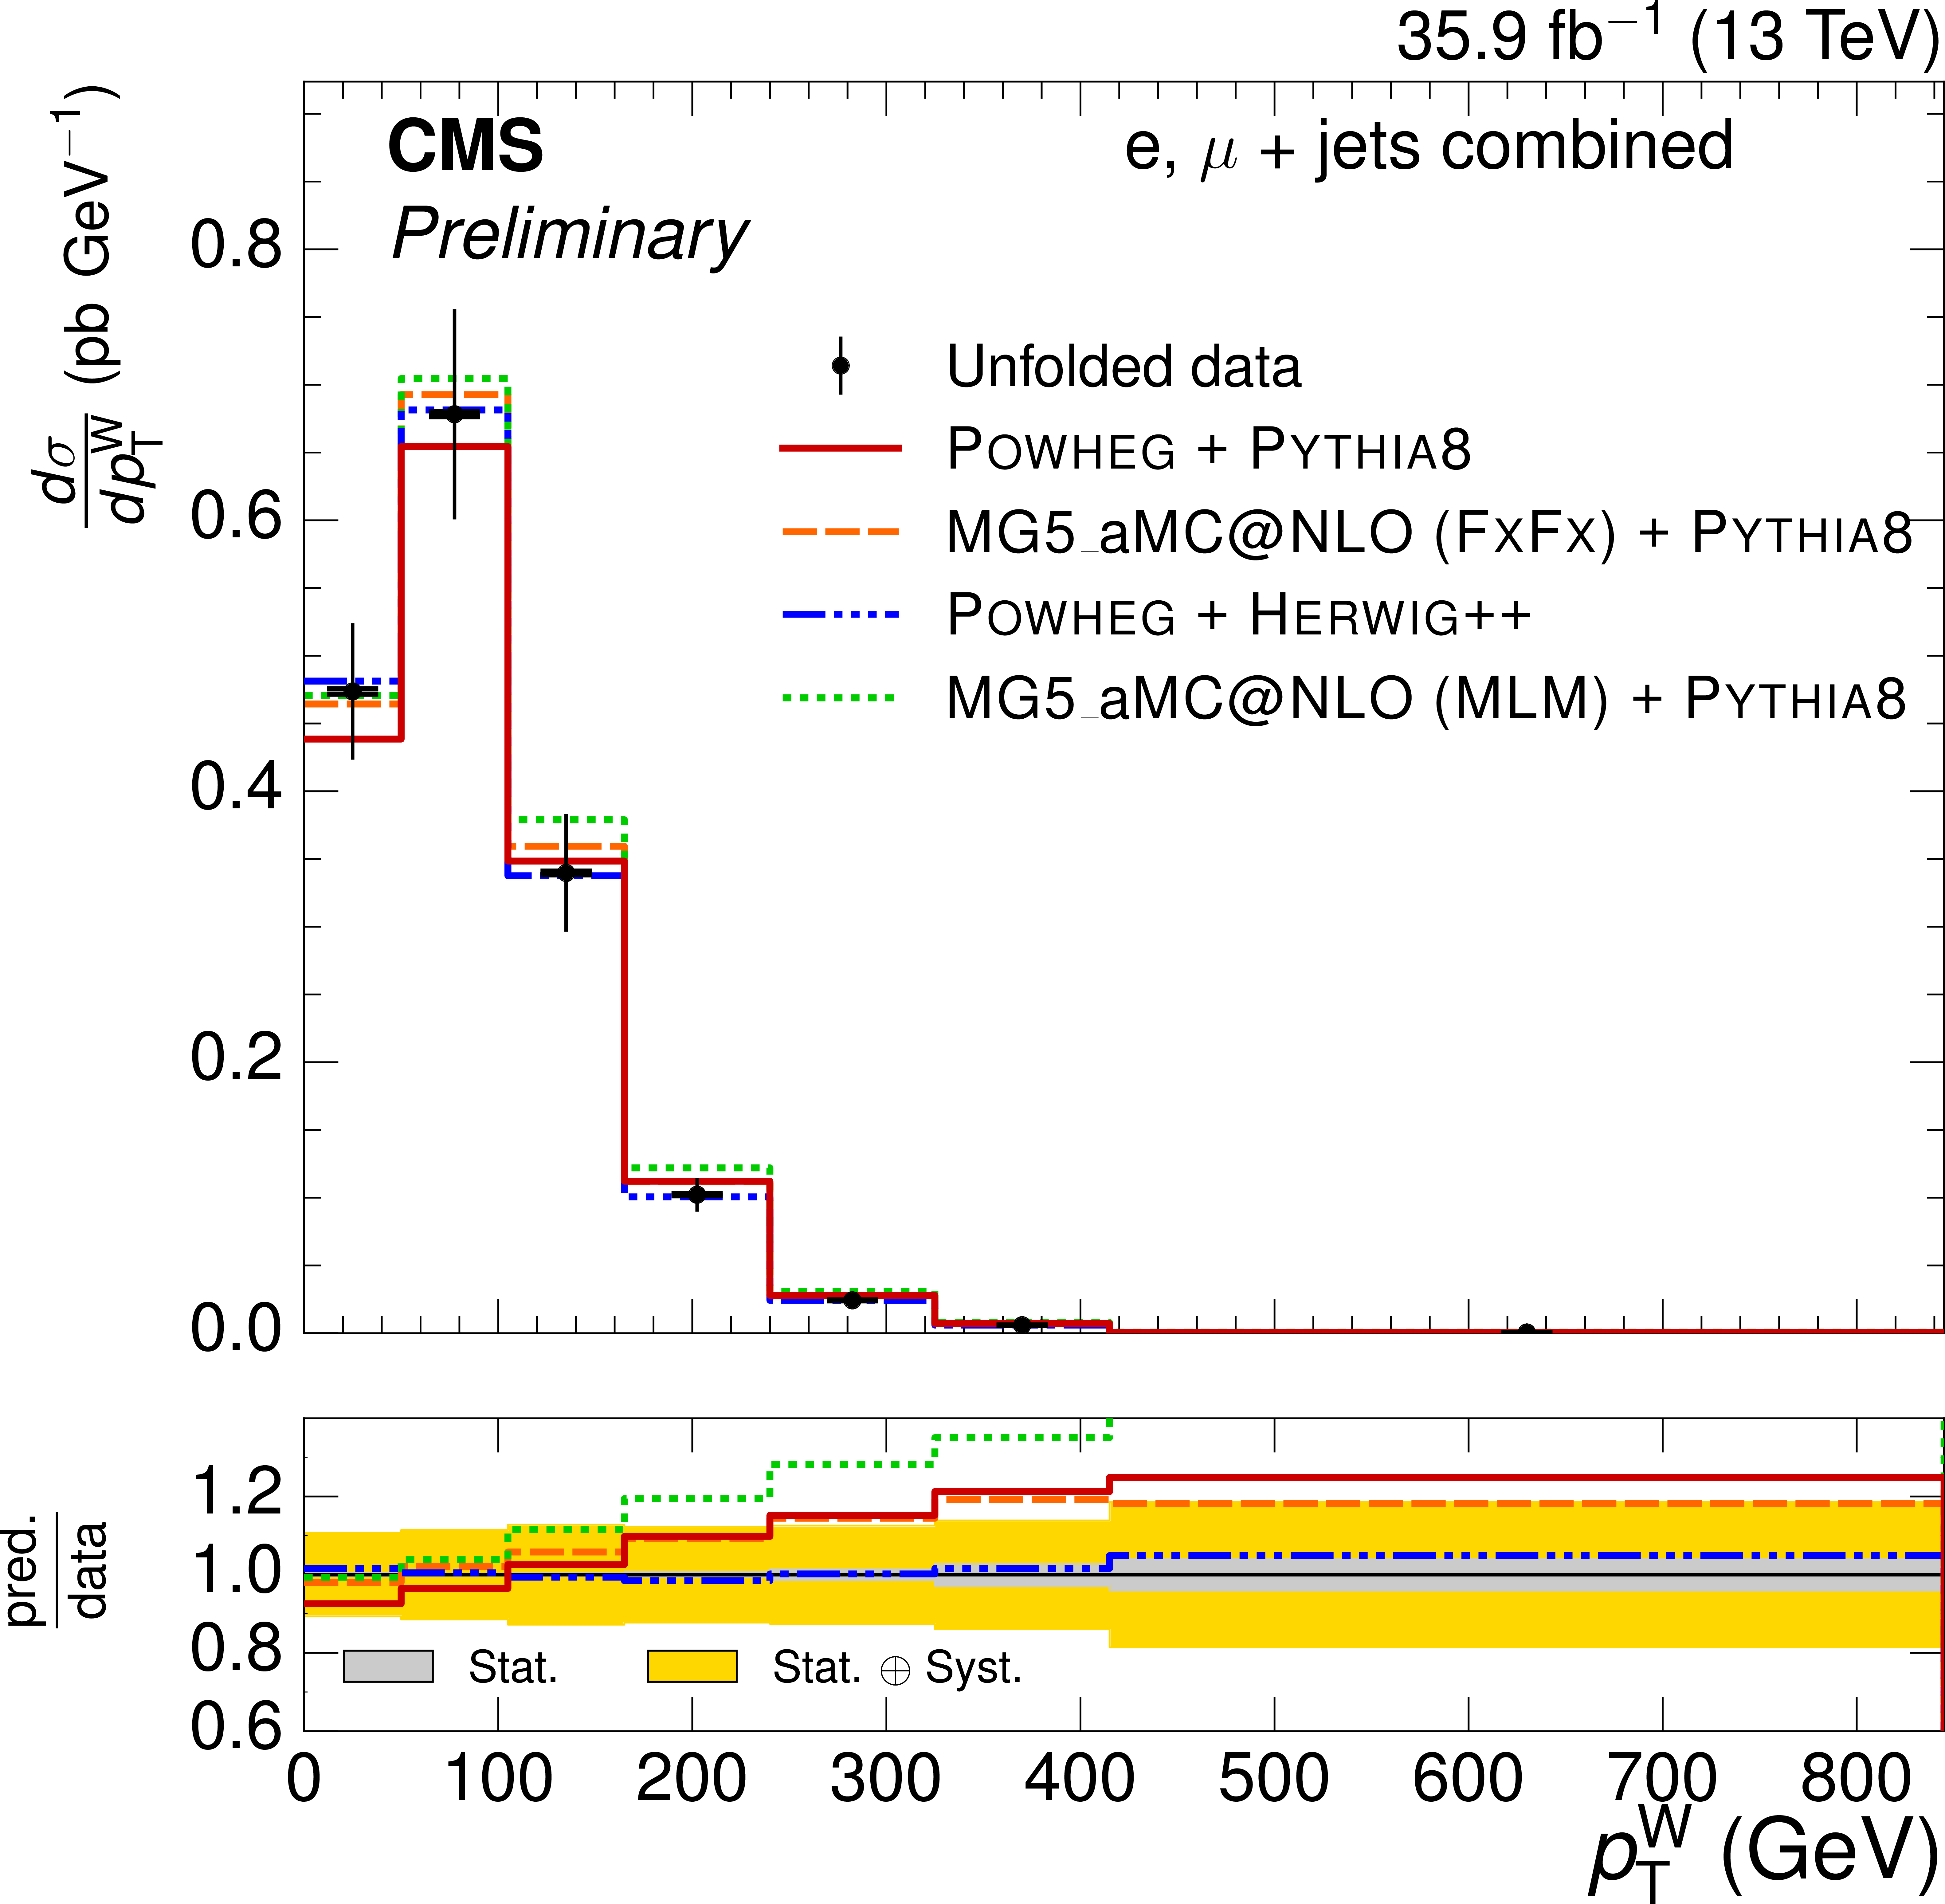
Normalized $ {p_{\text {T}}^{\mathrm{ W } }} $ differential $ {\mathrm{ t } {}\mathrm{ \bar{t} } } $ cross section, compared to different $ {\mathrm{ t } {}\mathrm{ \bar{t} } } $ simulations. The vertical bars on the data represent the statistical and systematic uncertainties added in quadrature. The lower plot shows the ratio of the predictions to the data. |

png pdf |
Figure 4-d:
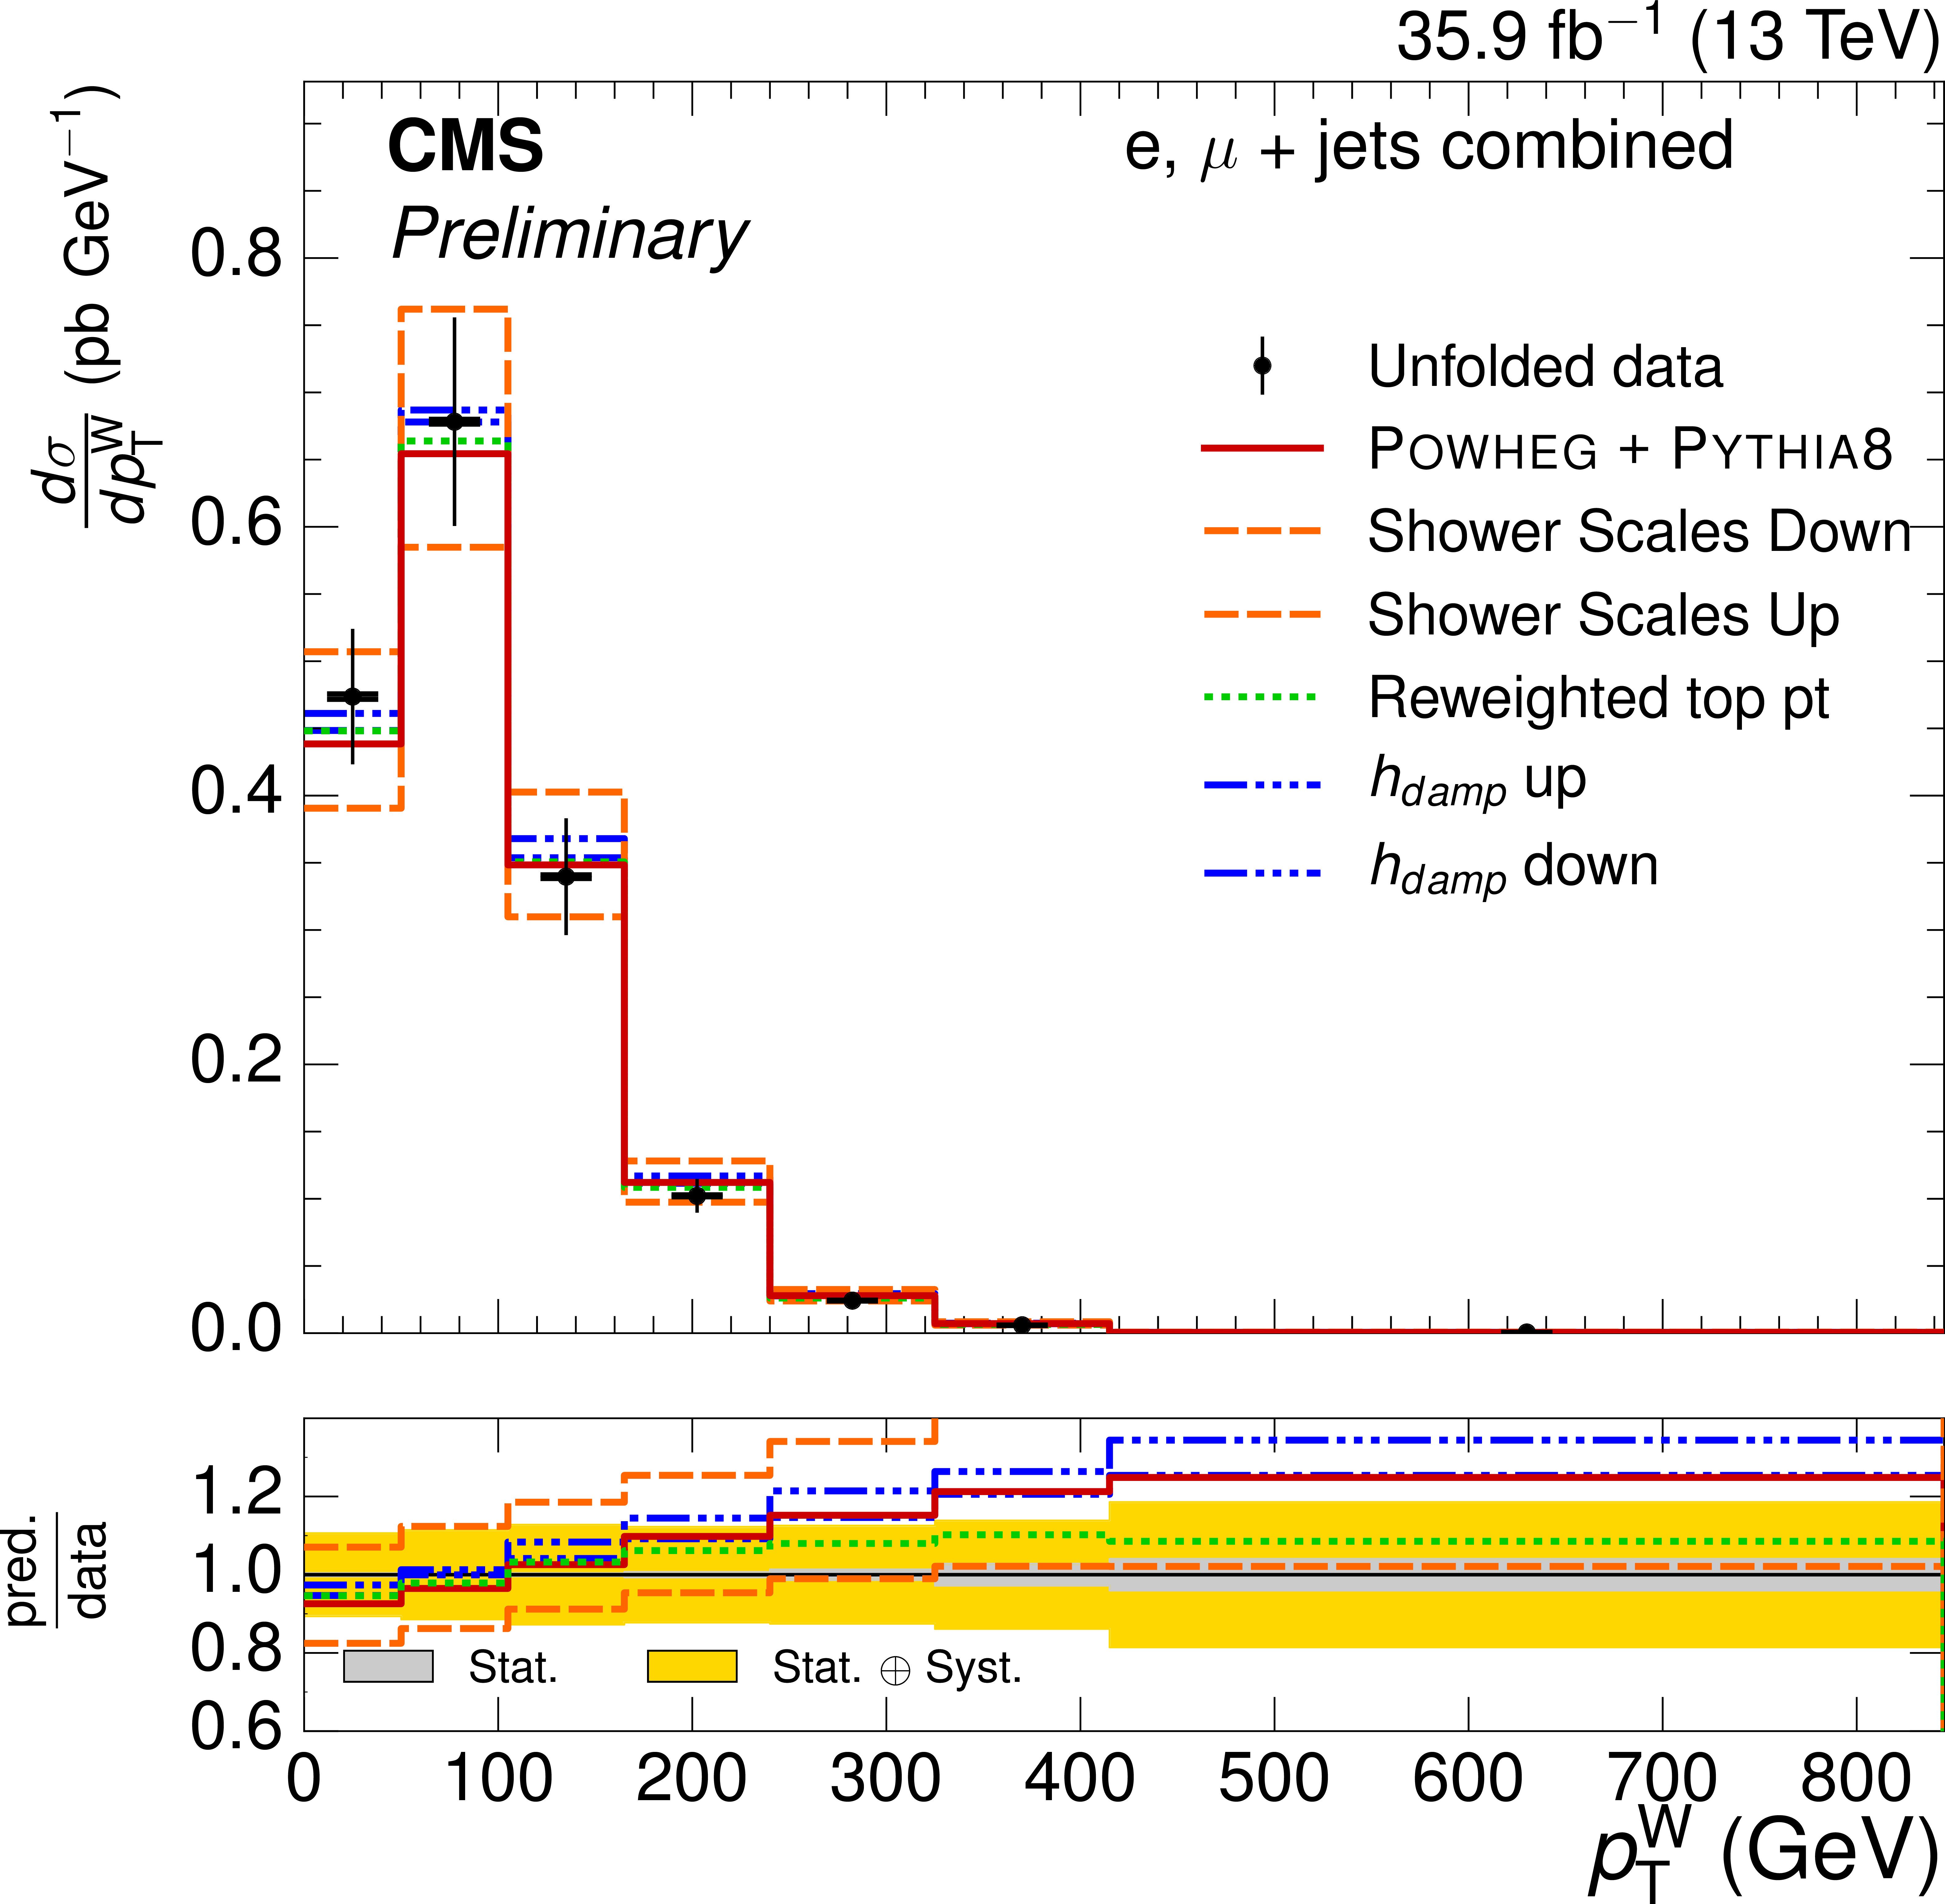
Normalized $ {p_{\text {T}}^{\mathrm{ W } }} $ differential $ {\mathrm{ t } {}\mathrm{ \bar{t} } } $ cross section, compared to the POWHEG+PYTHIA-8 simulation after varying the shower scales, and $ {h_{\text {damp}}} $ parameter, within their uncertainties. The vertical bars on the data represent the statistical and systematic uncertainties added in quadrature. The lower plot shows the ratio of the predictions to the data. |

png pdf |
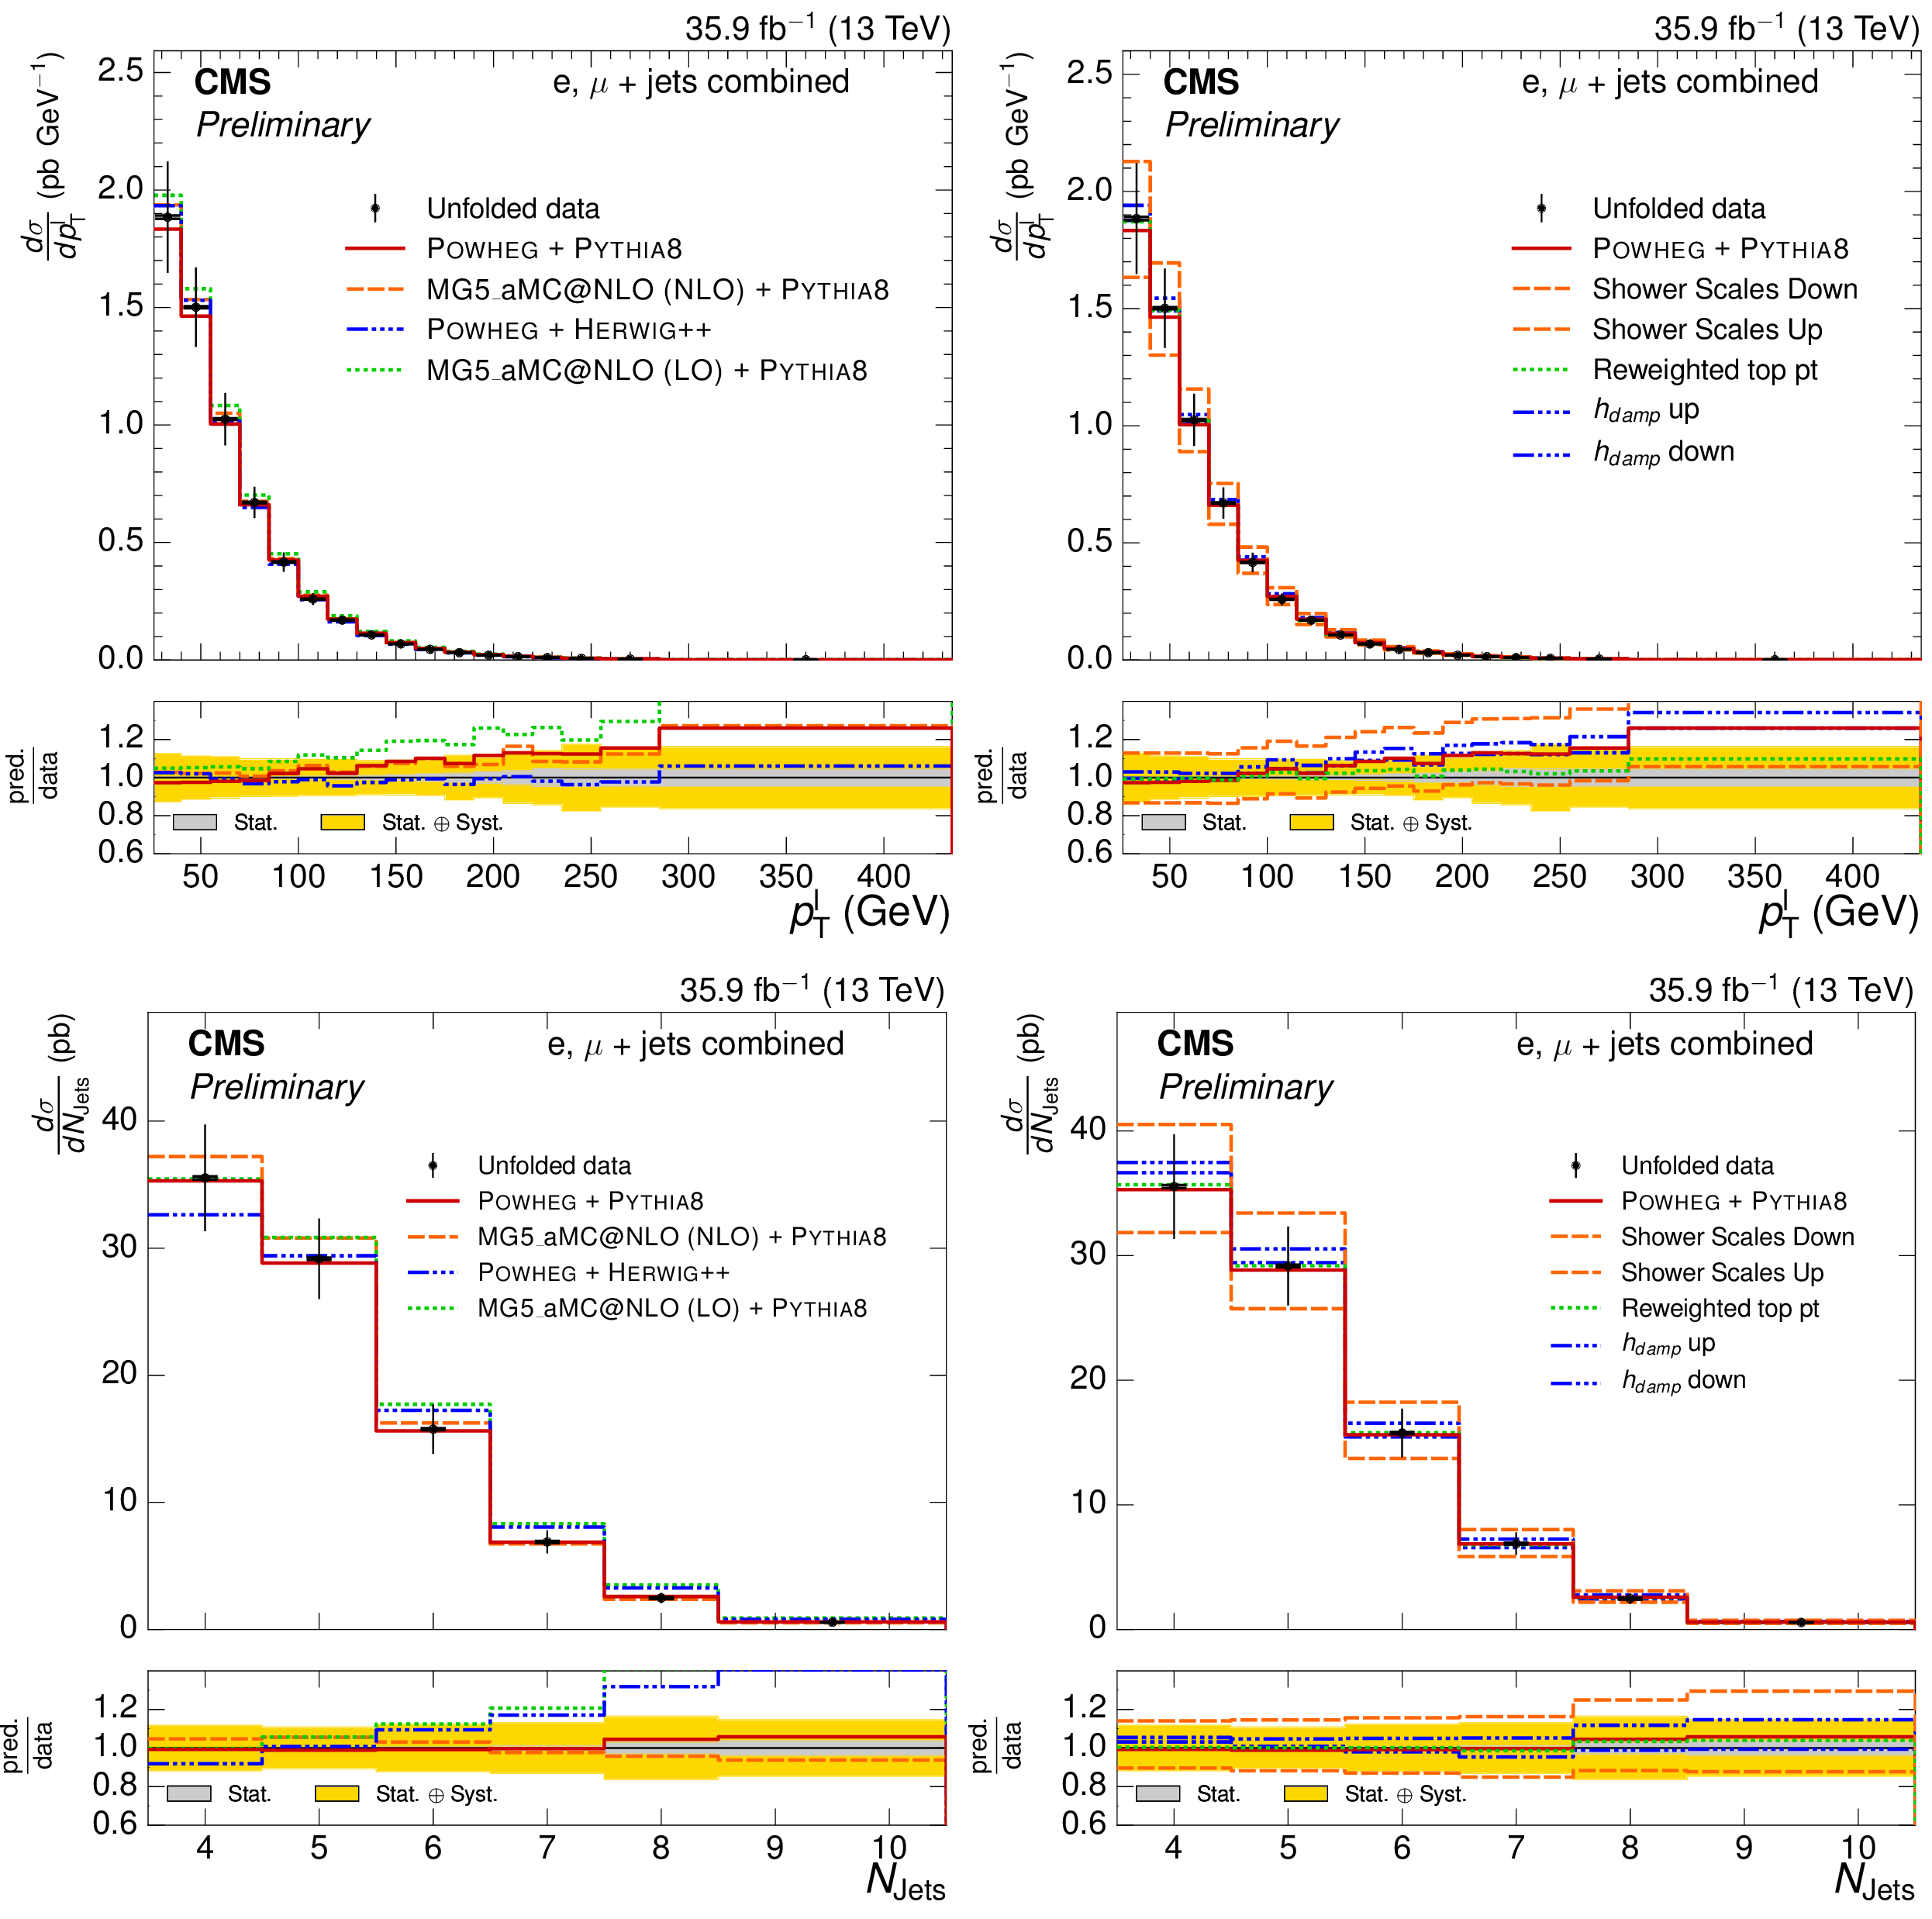
Figure 5:
Normalized $ {p_{\text {T}}^{\ell}} $ and $ {N_{\text {jets}}} $ differential $ {\mathrm{ t } {}\mathrm{ \bar{t} } } $ cross sections, compared to different $ {\mathrm{ t } {}\mathrm{ \bar{t} } } $ simulations in the left plots, and compared to the POWHEG+PYTHIA-8 simulation after varying the shower scales, and $ {h_{\text {damp}}} $ parameter, within their uncertainties in the right plots. The vertical bars on the data represent the statistical and systematic uncertainties added in quadrature. The lower plots show the ratio of the predictions to the data. |
png pdf |
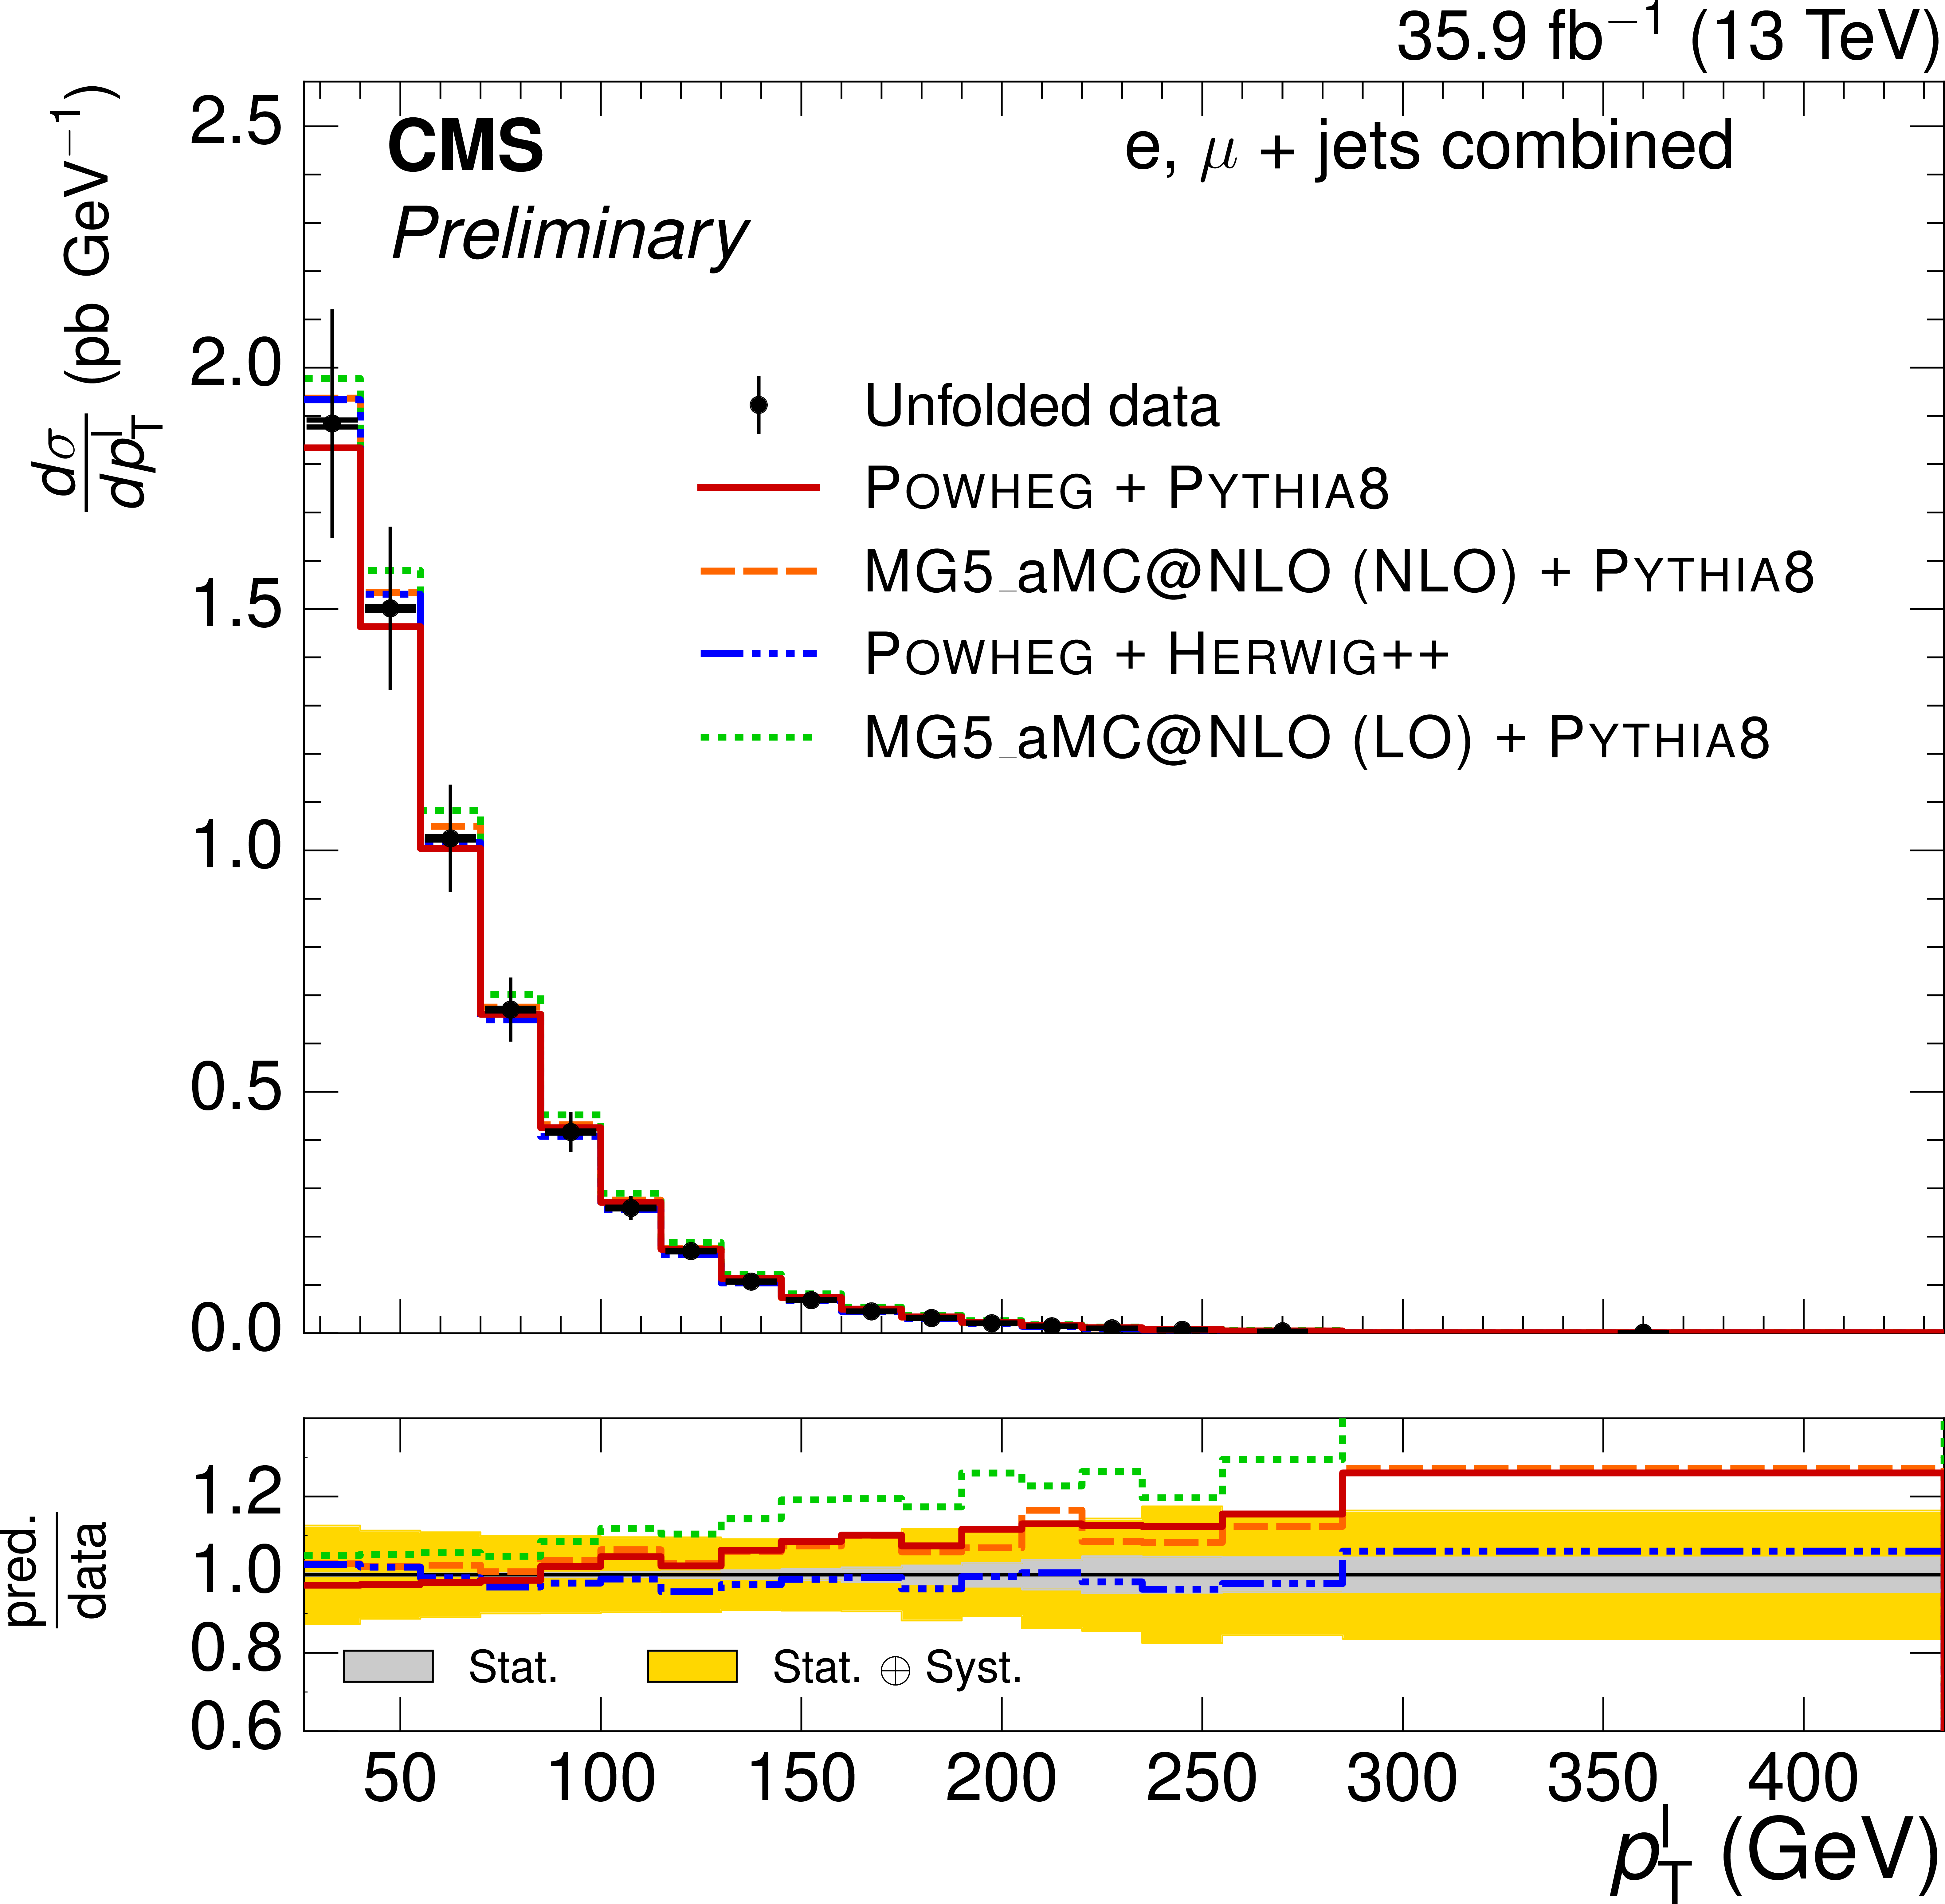
Figure 5-a:
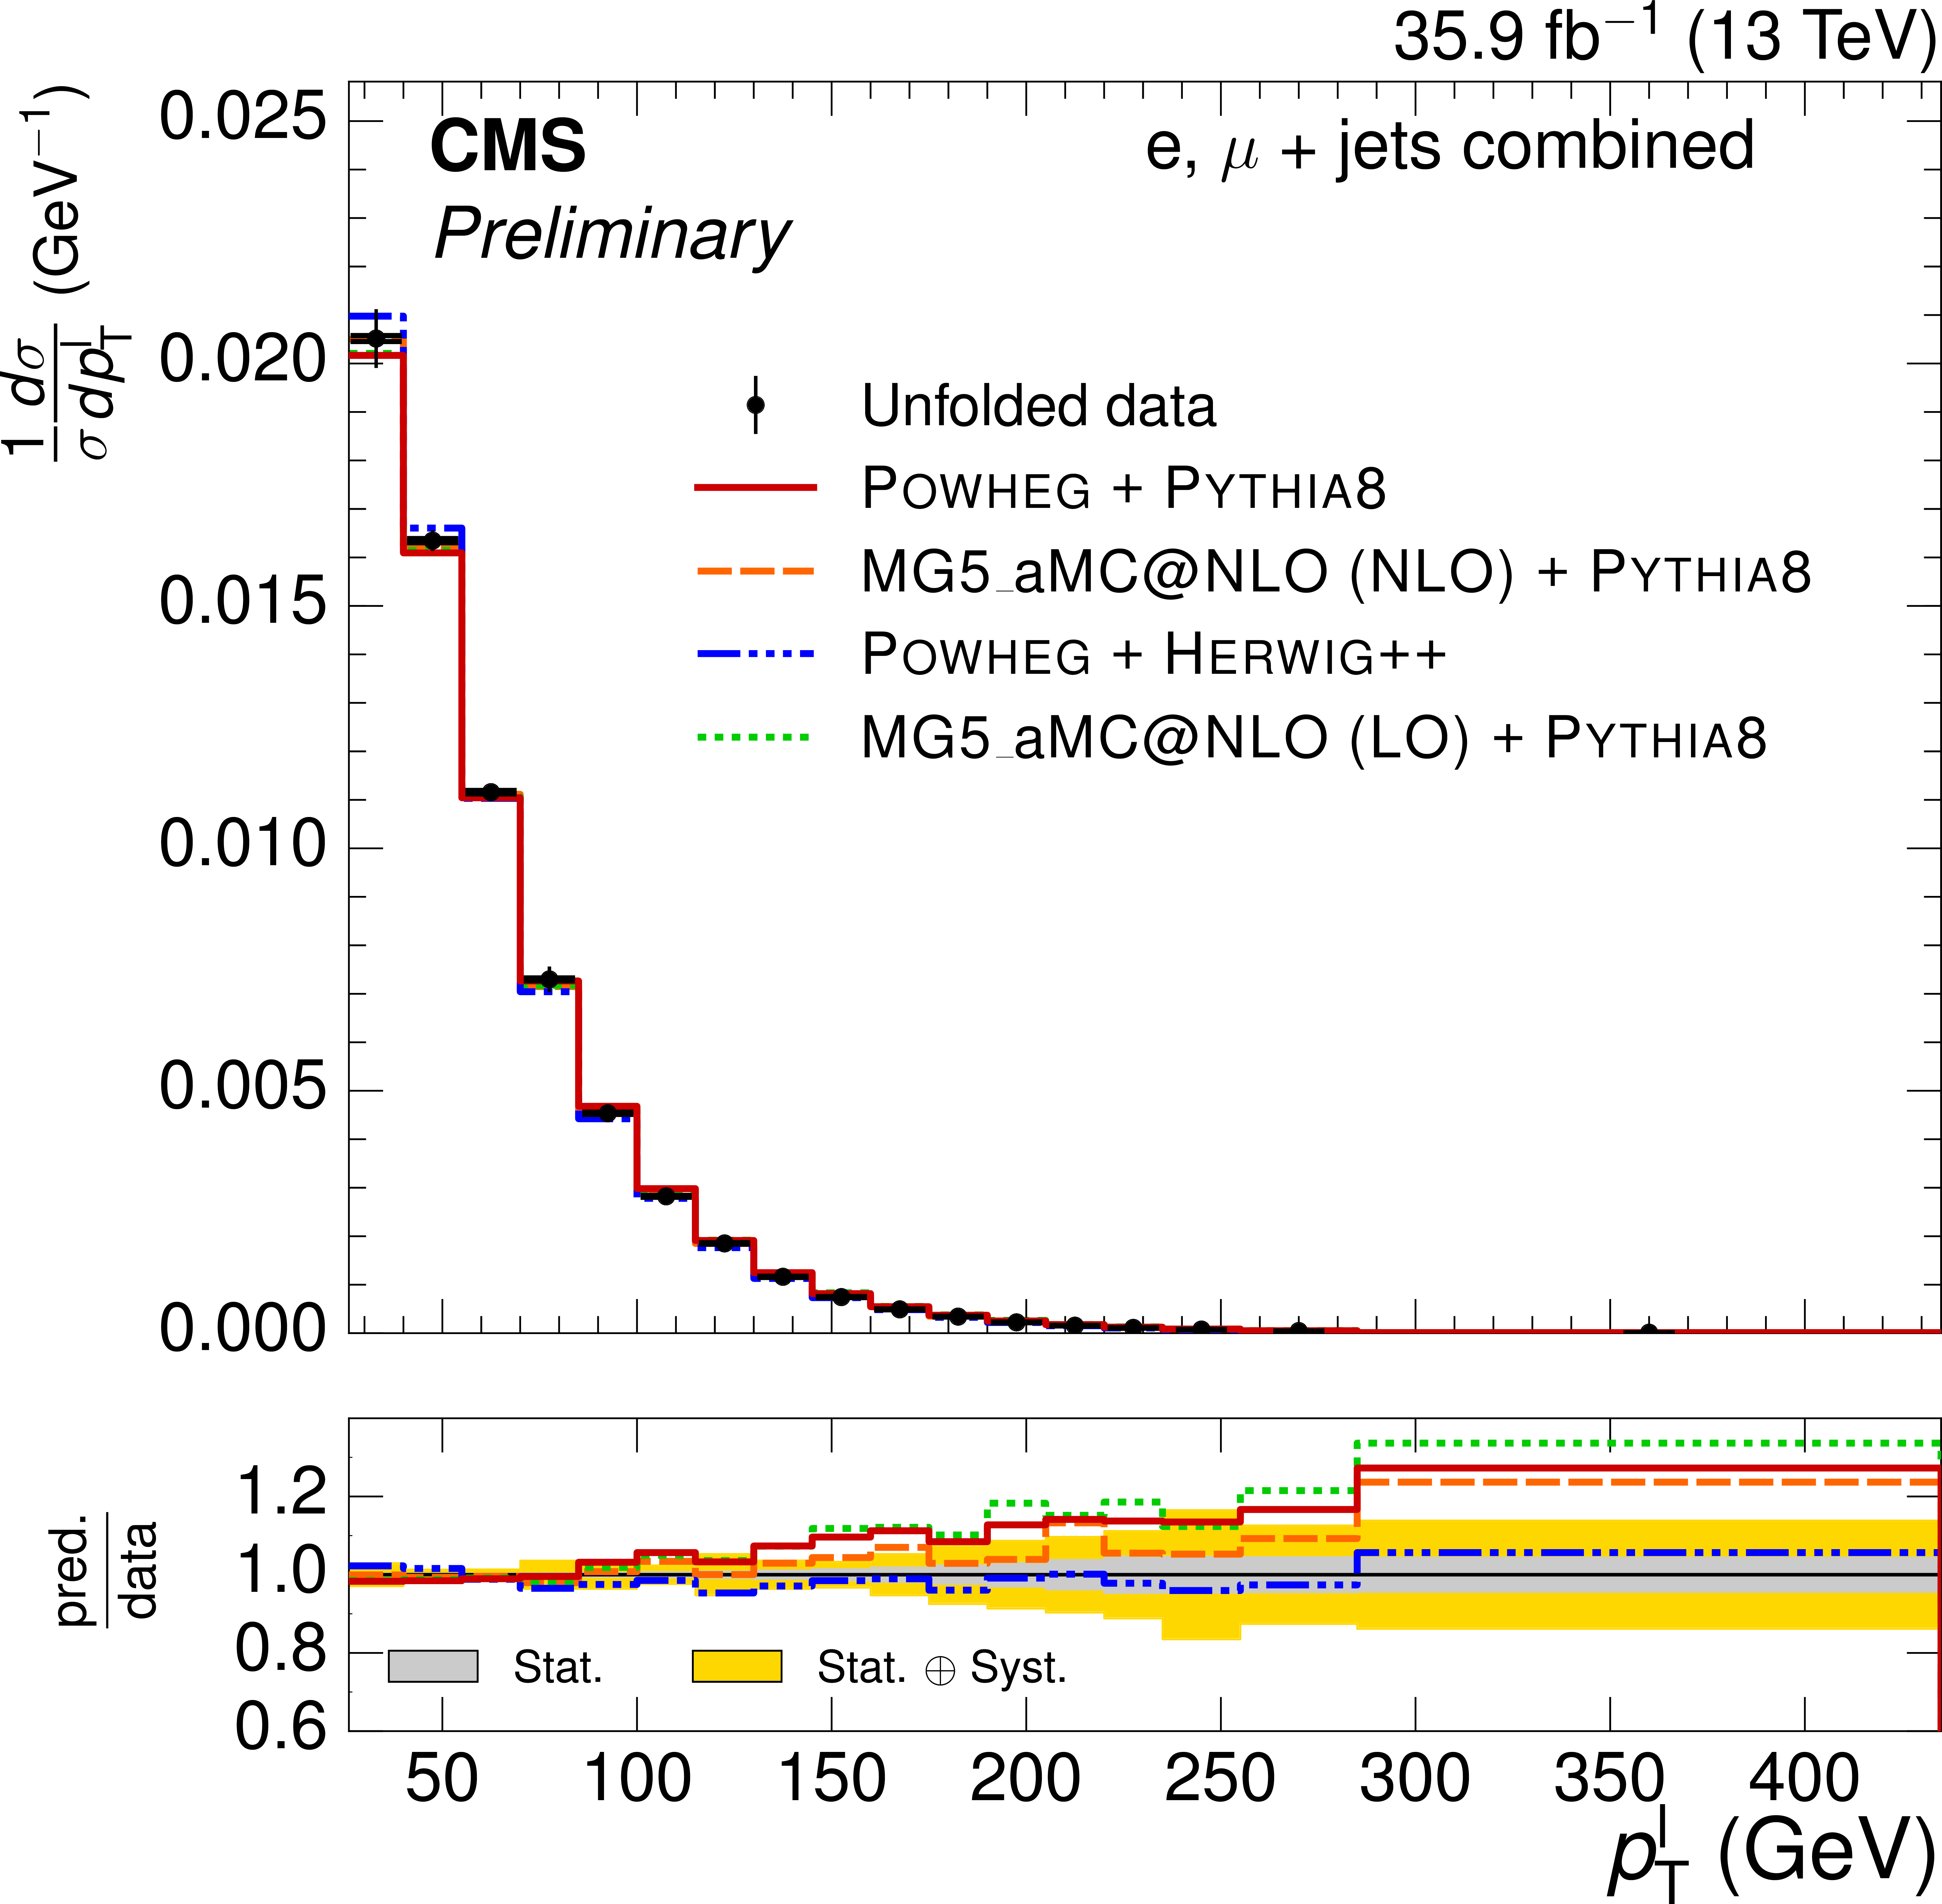
Normalized $ {p_{\text {T}}^{\ell}} $ differential $ {\mathrm{ t } {}\mathrm{ \bar{t} } } $ cross section, compared to different $ {\mathrm{ t } {}\mathrm{ \bar{t} } } $ simulations. The vertical bars on the data represent the statistical and systematic uncertainties added in quadrature. The lower plot shows the ratio of the predictions to the data. |
png pdf |
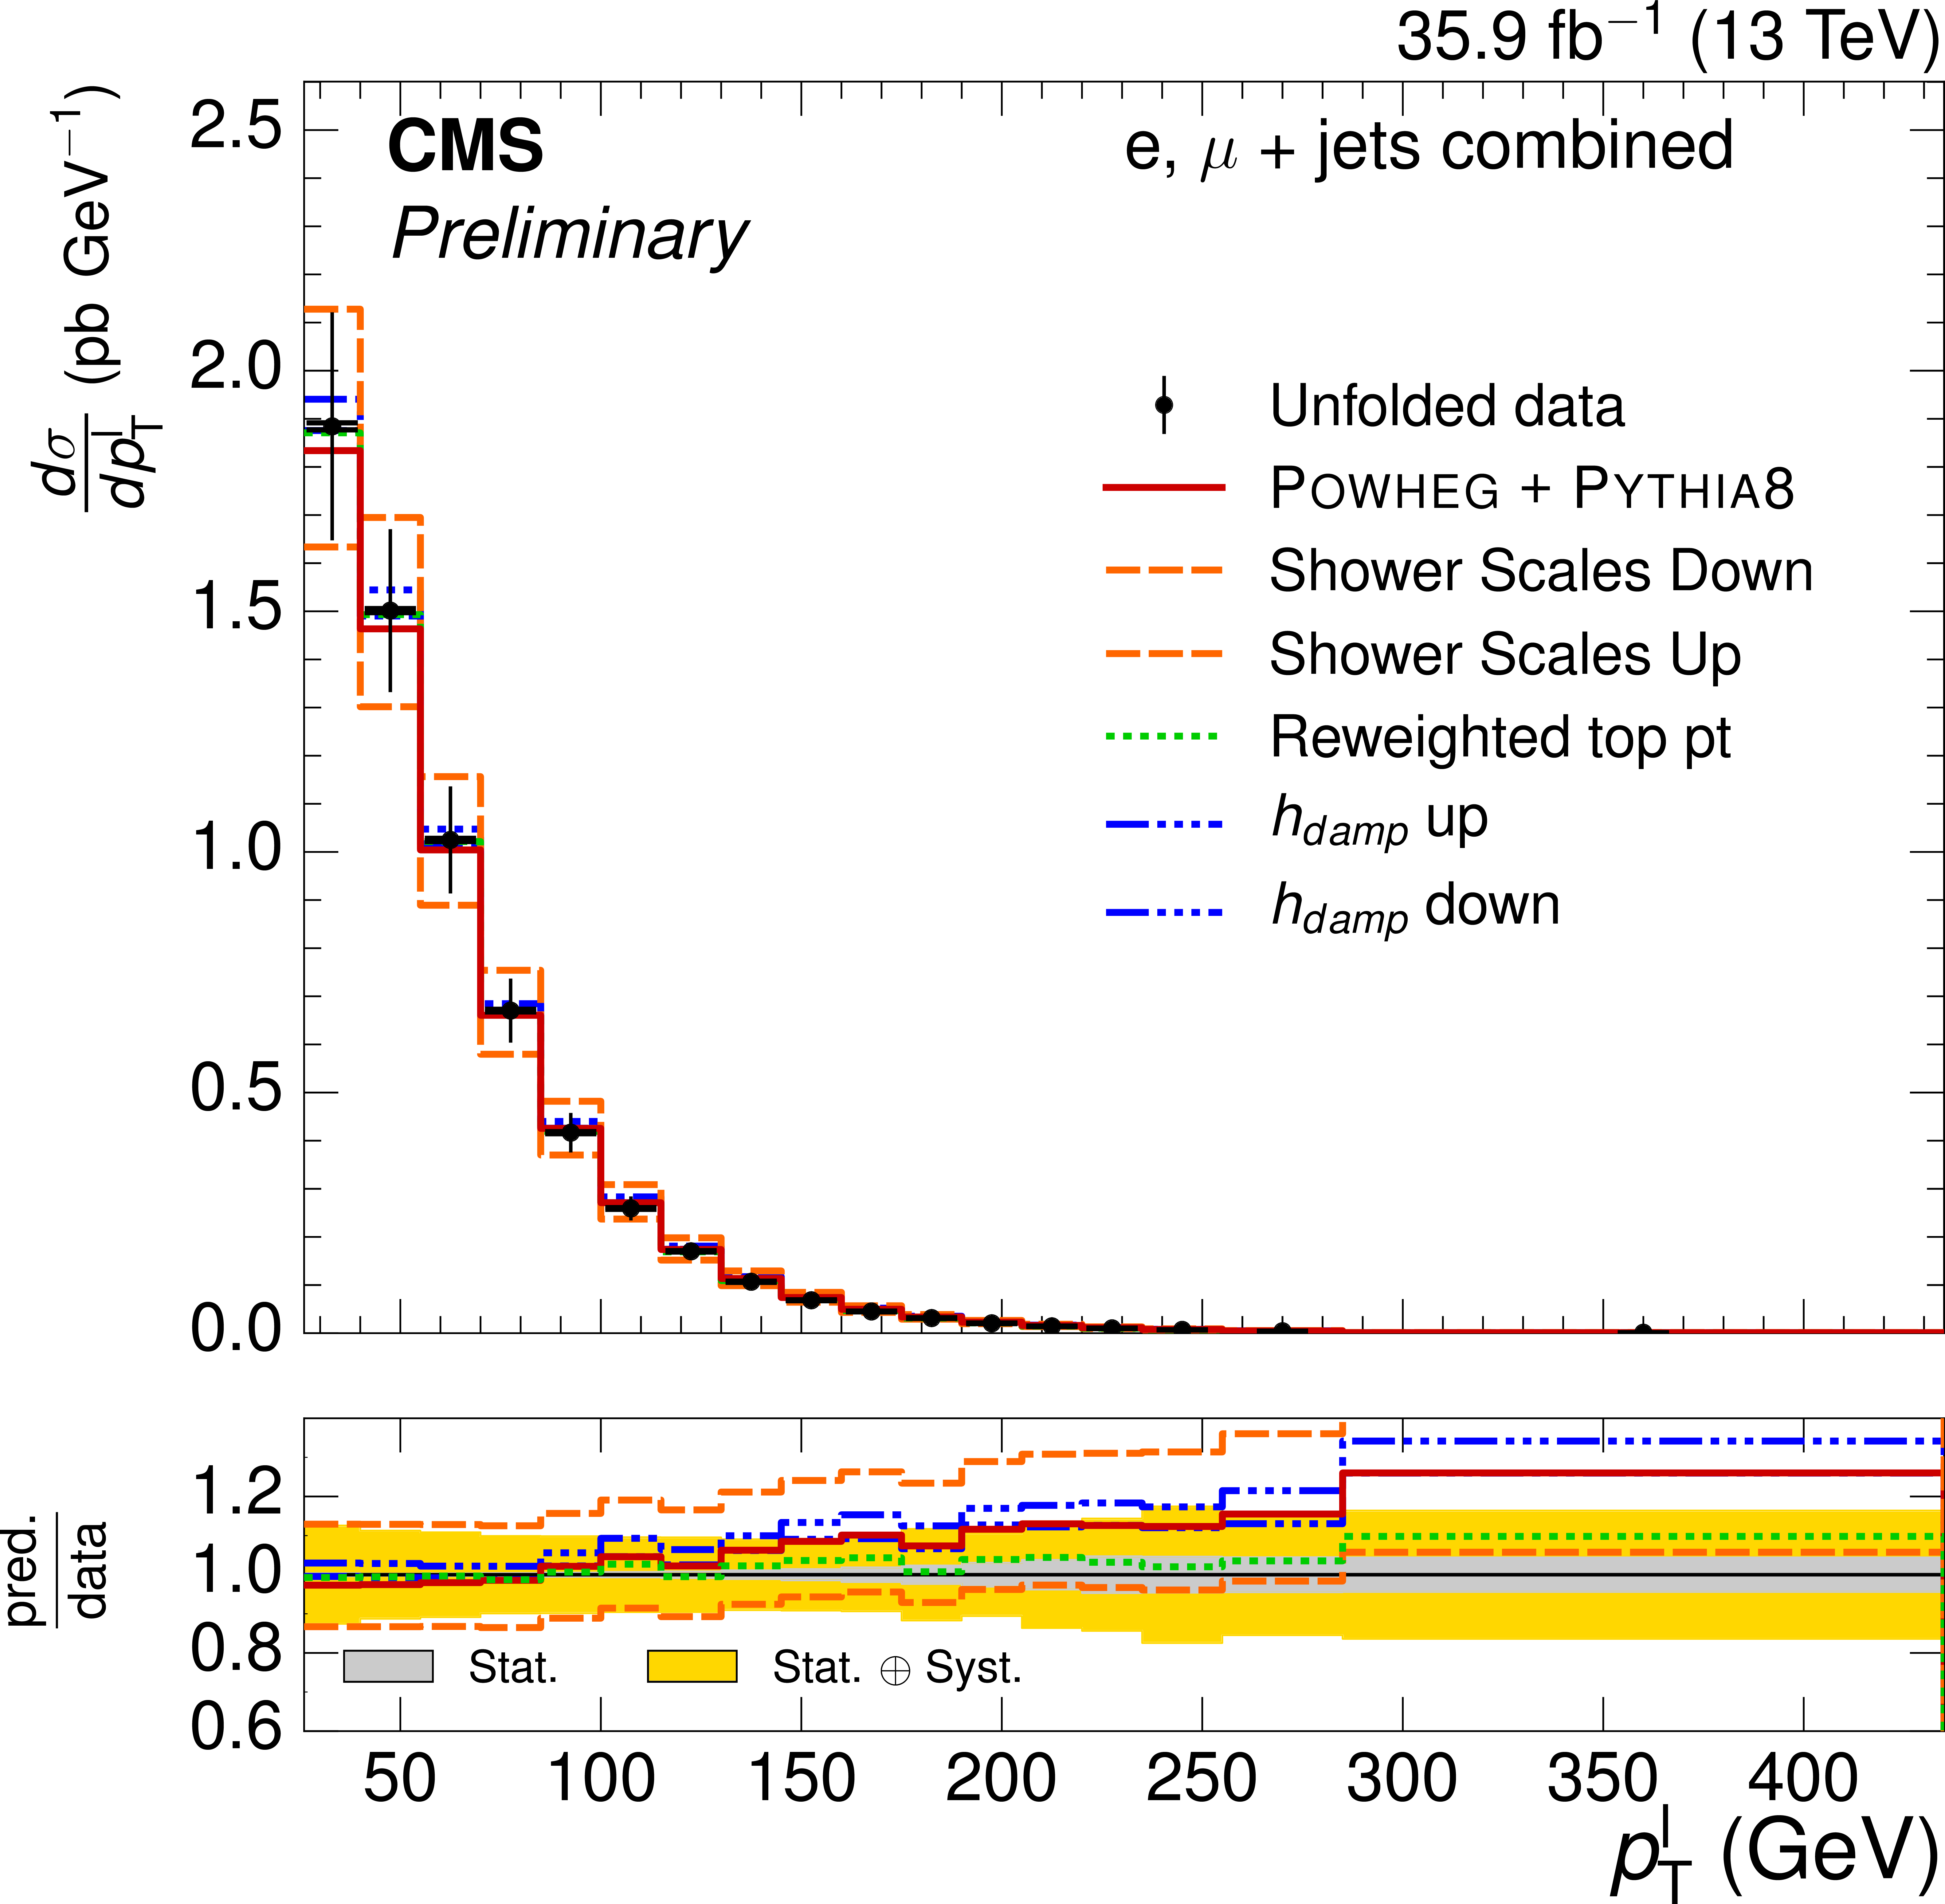
Figure 5-b:
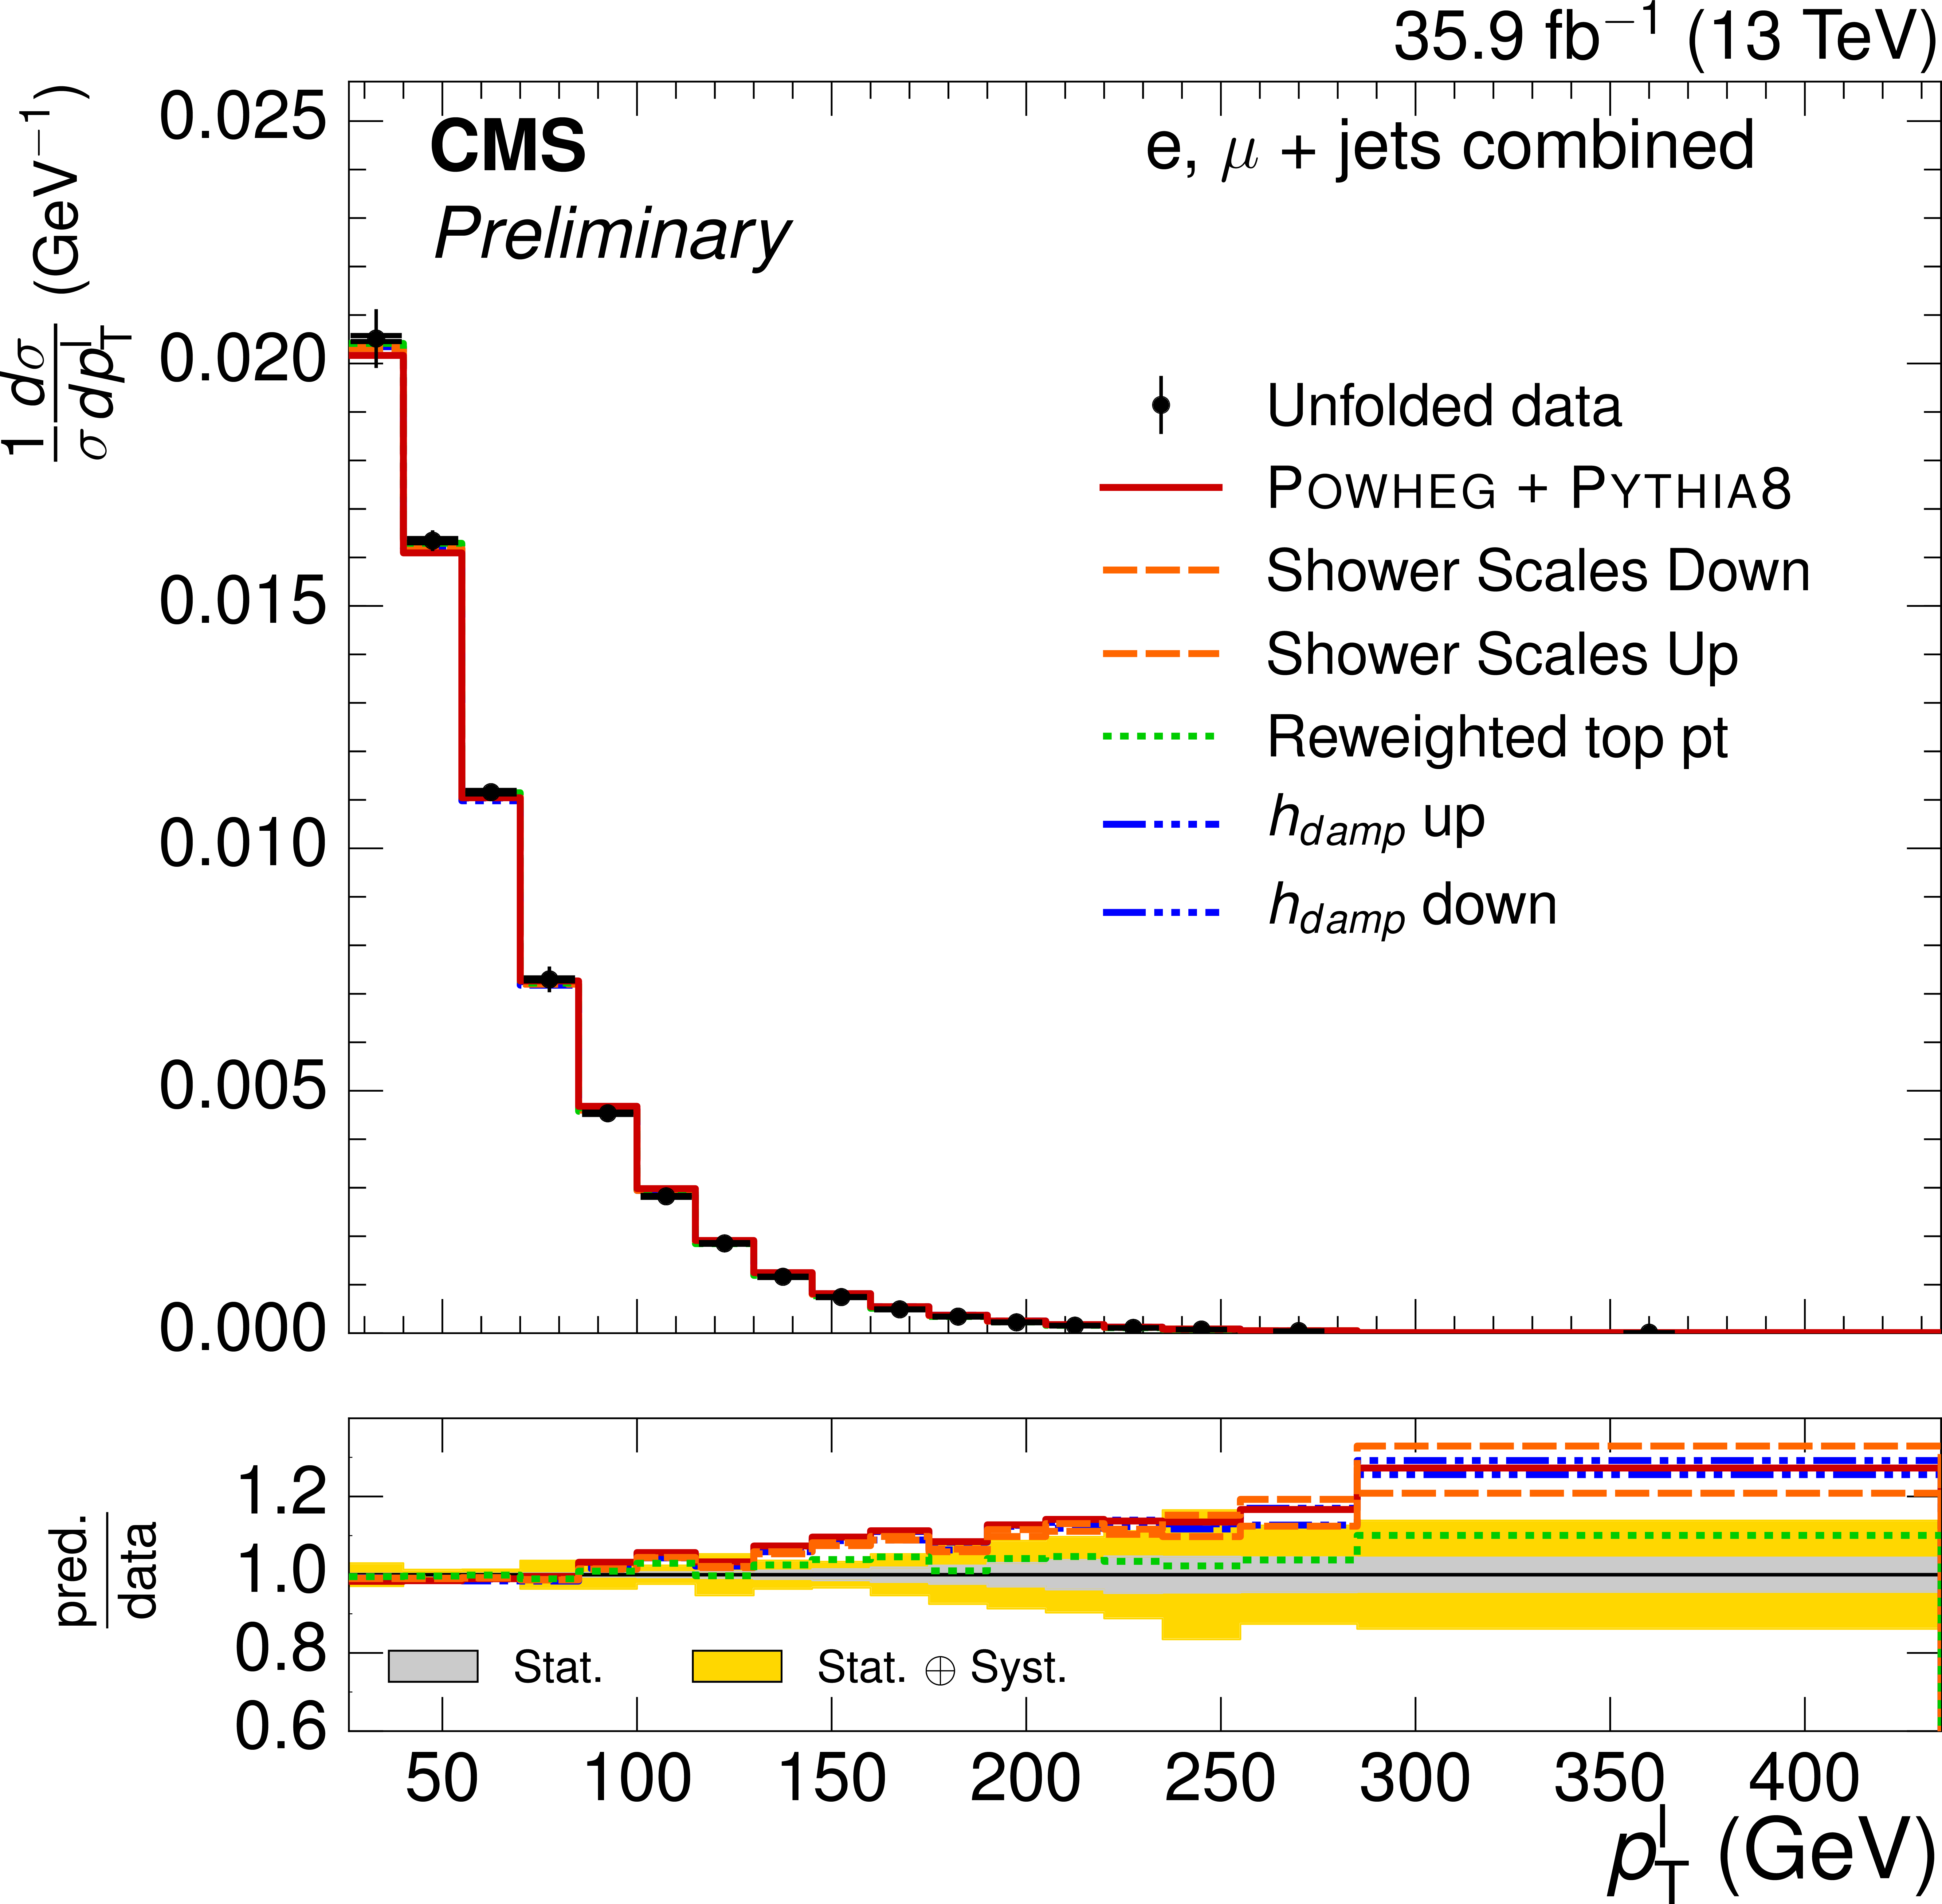
Normalized $ {p_{\text {T}}^{\ell}} $ differential $ {\mathrm{ t } {}\mathrm{ \bar{t} } } $ cross section,compared to the POWHEG+PYTHIA-8 simulation after varying the shower scales, and $ {h_{\text {damp}}} $ parameter, within their uncertainties. The vertical bars on the data represent the statistical and systematic uncertainties added in quadrature. The lower plot shows the ratio of the predictions to the data. |
png pdf |
Figure 5-c:
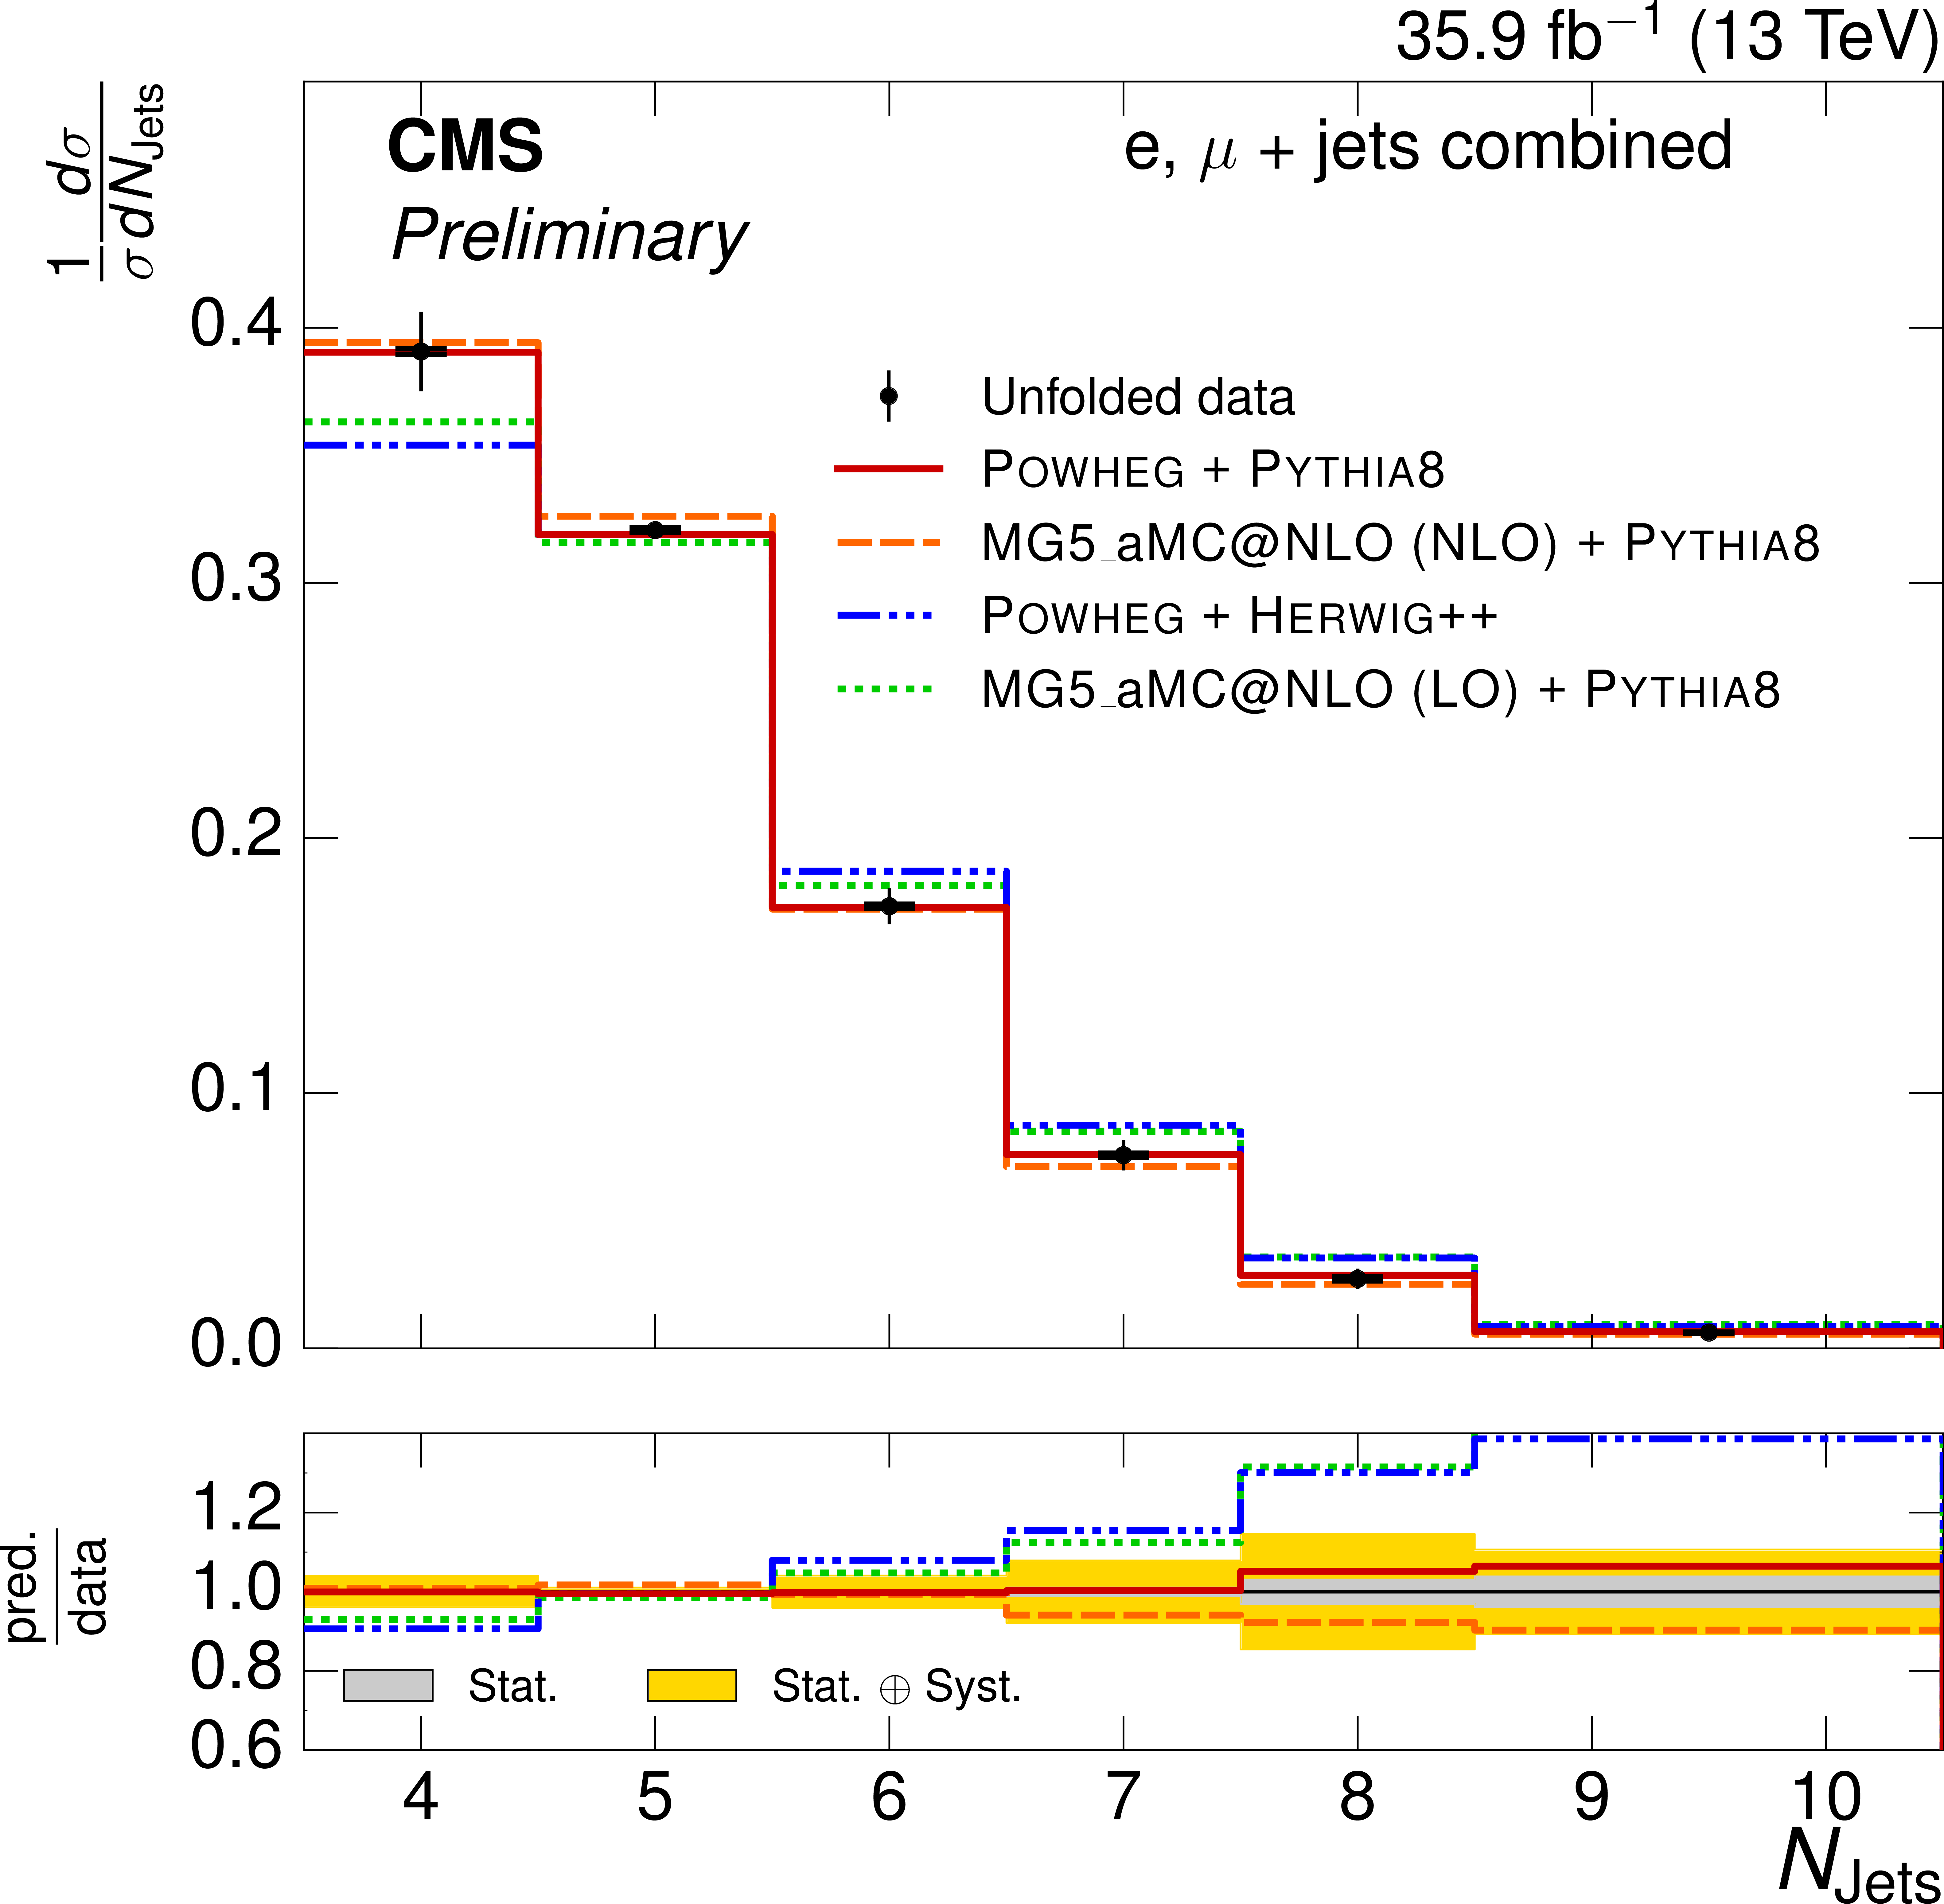
Normalized $ {N_{\text {jets}}} $ differential $ {\mathrm{ t } {}\mathrm{ \bar{t} } } $ cross section, compared to different $ {\mathrm{ t } {}\mathrm{ \bar{t} } } $ simulations. The vertical bars on the data represent the statistical and systematic uncertainties added in quadrature. The lower plot shows the ratio of the predictions to the data. |

png pdf |
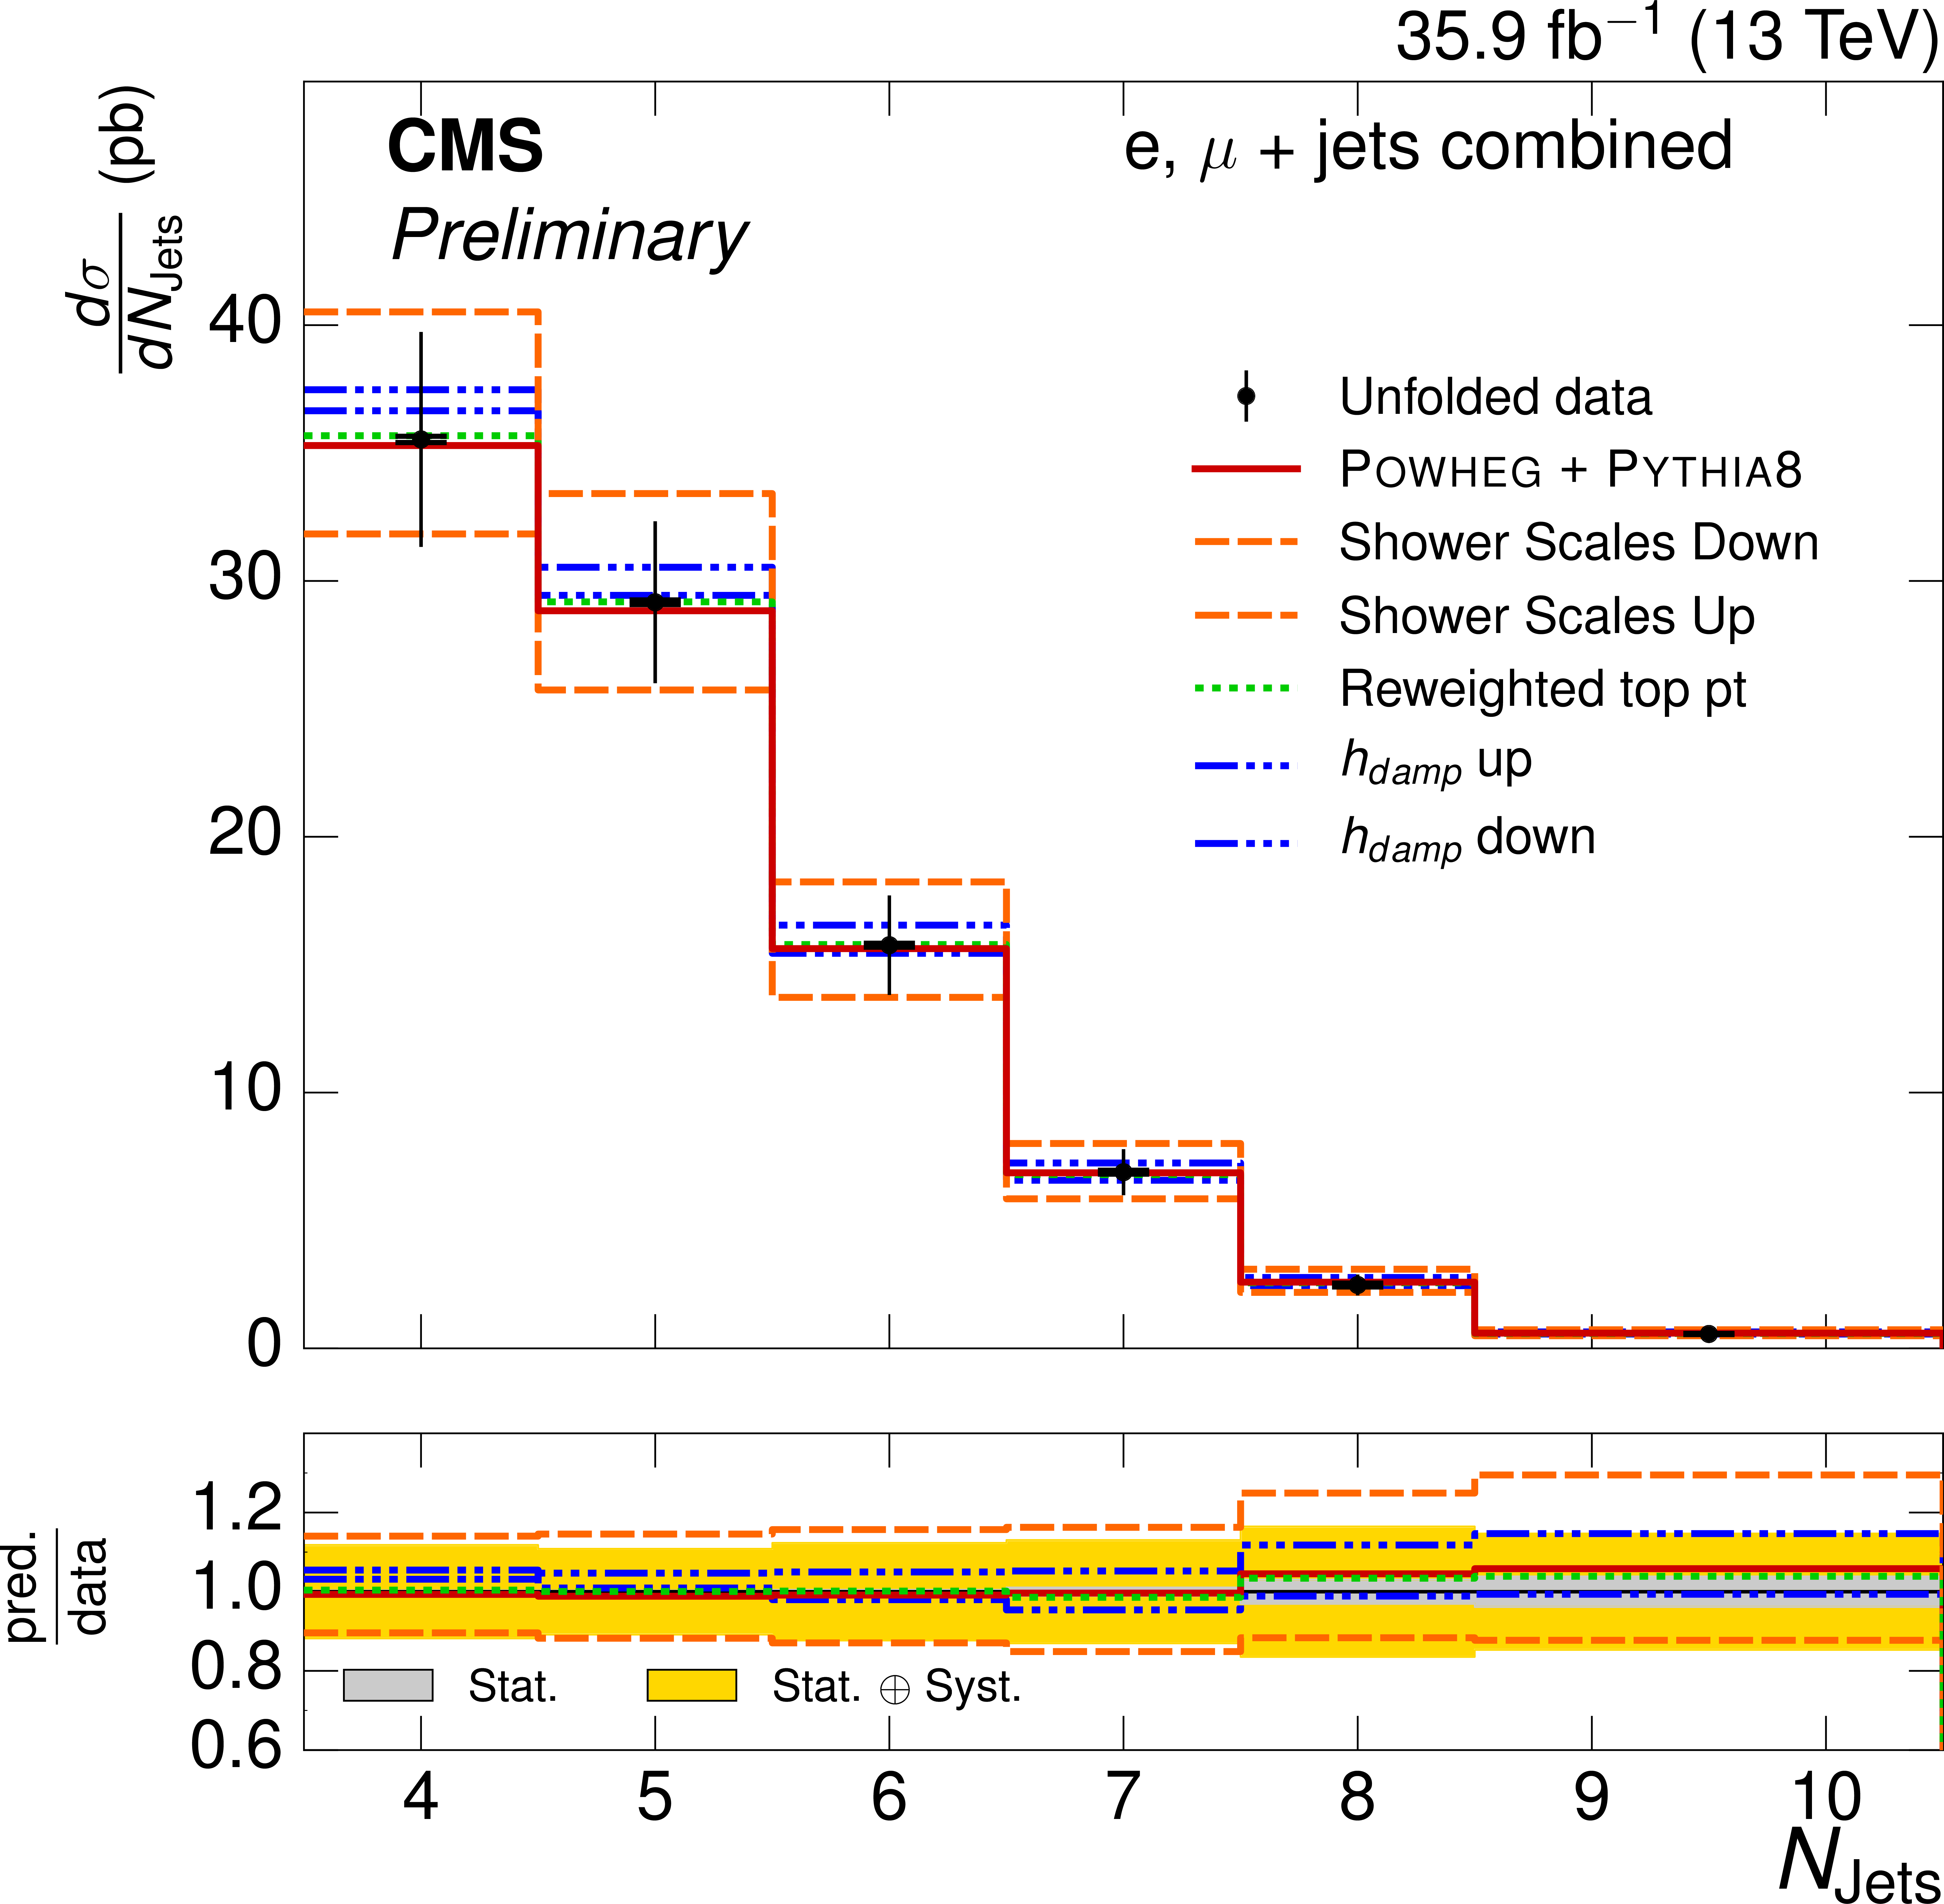
Figure 5-d:
Normalized $ {N_{\text {jets}}} $ differential $ {\mathrm{ t } {}\mathrm{ \bar{t} } } $ cross section,compared to the POWHEG+PYTHIA-8 simulation after varying the shower scales, and $ {h_{\text {damp}}} $ parameter, within their uncertainties. The vertical bars on the data represent the statistical and systematic uncertainties added in quadrature. The lower plot shows the ratio of the predictions to the data. |

png pdf |
Figure 6:
Absolute $ {H_{\mathrm {T}}} $ and $ {S_{\text {T}}} $ differential $ {\mathrm{ t } {}\mathrm{ \bar{t} } } $ cross sections, compared to different $ {\mathrm{ t } {}\mathrm{ \bar{t} } } $ simulations in the left plots, and compared to the POWHEG+PYTHIA-8 simulation after varying the shower scales, and $ {h_{\text {damp}}} $ parameter, within their uncertainties in the right plots. The vertical bars on the data represent the statistical and systematic uncertainties added in quadrature. The lower plots show the ratio of the predictions to the data. |

png pdf |
Figure 6-a:
Absolute $ {H_{\mathrm {T}}} $ differential $ {\mathrm{ t } {}\mathrm{ \bar{t} } } $ cross section, compared to different $ {\mathrm{ t } {}\mathrm{ \bar{t} } } $ simulations. The vertical bars on the data represent the statistical and systematic uncertainties added in quadrature. The lower plot shows the ratio of the predictions to the data. |

png pdf |
Figure 6-b:
Absolute $ {H_{\mathrm {T}}} $ differential $ {\mathrm{ t } {}\mathrm{ \bar{t} } } $ cross section, compared to the POWHEG+PYTHIA-8 simulation after varying the shower scales, and $ {h_{\text {damp}}} $ parameter, within their uncertainties. The vertical bars on the data represent the statistical and systematic uncertainties added in quadrature. The lower plot shows the ratio of the predictions to the data. |
png pdf |
Figure 6-c:
Absolute $ {S_{\text {T}}} $ differential $ {\mathrm{ t } {}\mathrm{ \bar{t} } } $ cross section, compared to different $ {\mathrm{ t } {}\mathrm{ \bar{t} } } $ simulations. The vertical bars on the data represent the statistical and systematic uncertainties added in quadrature. The lower plot shows the ratio of the predictions to the data. |

png pdf |
Figure 6-d:
Absolute $ {S_{\text {T}}} $ differential $ {\mathrm{ t } {}\mathrm{ \bar{t} } } $ cross section, compared to different $ {\mathrm{ t } {}\mathrm{ \bar{t} } } $ simulations. The vertical bars on the data represent the statistical and systematic uncertainties added in quadrature. The lower plot shows the ratio of the predictions to the data. |
png pdf |
Figure 7:
Absolute $ { {p_{\mathrm {T}}} ^\text {miss}} $ and $ {p_{\text {T}}^{\mathrm{ W } }} $ differential $ {\mathrm{ t } {}\mathrm{ \bar{t} } } $ cross sections, compared to different $ {\mathrm{ t } {}\mathrm{ \bar{t} } } $ simulations in the left plots, and compared to the POWHEG+PYTHIA-8 simulation after varying the shower scales, and $ {h_{\text {damp}}} $ parameter, within their uncertainties in the right plots. The vertical bars on the data represent the statistical and systematic uncertainties added in quadrature. The lower plots show the ratio of the predictions to the data. |

png pdf |
Figure 7-a:
Absolute $ { {p_{\mathrm {T}}} ^\text {miss}} $ differential $ {\mathrm{ t } {}\mathrm{ \bar{t} } } $ cross section, compared to different $ {\mathrm{ t } {}\mathrm{ \bar{t} } } $ simulations. The vertical bars on the data represent the statistical and systematic uncertainties added in quadrature. The lower plot shows the ratio of the predictions to the data. |

png pdf |
Figure 7-b:
Absolute $ { {p_{\mathrm {T}}} ^\text {miss}} $ differential $ {\mathrm{ t } {}\mathrm{ \bar{t} } } $ cross section, compared to the POWHEG+PYTHIA-8 simulation after varying the shower scales, and $ {h_{\text {damp}}} $ parameter, within their uncertainties.The vertical bars on the data represent the statistical and systematic uncertainties added in quadrature. The lower plot shows the ratio of the predictions to the data. |
png pdf |
Figure 7-c:
Absolute $ {p_{\text {T}}^{\mathrm{ W } }} $ differential $ {\mathrm{ t } {}\mathrm{ \bar{t} } } $ cross section, compared to different $ {\mathrm{ t } {}\mathrm{ \bar{t} } } $ simulations. The vertical bars on the data represent the statistical and systematic uncertainties added in quadrature. The lower plot shows the ratio of the predictions to the data. |
png pdf |
Figure 7-d:
Absolute $ {p_{\text {T}}^{\mathrm{ W } }} $ differential $ {\mathrm{ t } {}\mathrm{ \bar{t} } } $ cross section, compared to the POWHEG+PYTHIA-8 simulation after varying the shower scales, and $ {h_{\text {damp}}} $ parameter, within their uncertainties. The vertical bars on the data represent the statistical and systematic uncertainties added in quadrature. The lower plot shows the ratio of the predictions to the data. |
png pdf |
Figure 8:
Absolute $ {p_{\text {T}}^{\ell}} $ and $ {N_{\text {jets}}} $ differential $ {\mathrm{ t } {}\mathrm{ \bar{t} } } $ cross sections, compared to different $ {\mathrm{ t } {}\mathrm{ \bar{t} } } $ simulations in the left plots, and compared to the POWHEG+PYTHIA-8 simulation after varying the shower scales, and $ {h_{\text {damp}}} $ parameter, within their uncertainties in the right plots. The vertical bars on the data represent the statistical and systematic uncertainties added in quadrature. The lower plots show the ratio of the predictions to the data. |
png pdf |
Figure 8-a:
Absolute $ {p_{\text {T}}^{\ell}} $ differential $ {\mathrm{ t } {}\mathrm{ \bar{t} } } $ cross section, compared to different $ {\mathrm{ t } {}\mathrm{ \bar{t} } } $ simulations. The vertical bars on the data represent the statistical and systematic uncertainties added in quadrature. The lower plot shows the ratio of the predictions to the data. |
png pdf |
Figure 8-b:
Absolute $ {p_{\text {T}}^{\ell}} $ differential $ {\mathrm{ t } {}\mathrm{ \bar{t} } } $ cross section, compared to the POWHEG+PYTHIA-8 simulation after varying the shower scales, and $ {h_{\text {damp}}} $ parameter, within their uncertainties. The vertical bars on the data represent the statistical and systematic uncertainties added in quadrature. The lower plot shows the ratio of the predictions to the data. |

png pdf |
Figure 8-c:
Absolute $ {N_{\text {jets}}} $ differential $ {\mathrm{ t } {}\mathrm{ \bar{t} } } $ cross section, compared to different $ {\mathrm{ t } {}\mathrm{ \bar{t} } } $ simulations. The vertical bars on the data represent the statistical and systematic uncertainties added in quadrature. The lower plot shows the ratio of the predictions to the data. |
png pdf |
Figure 8-d:
Absolute $ {N_{\text {jets}}} $ differential $ {\mathrm{ t } {}\mathrm{ \bar{t} } } $ cross section, compared to the POWHEG+PYTHIA-8 simulation after varying the shower scales, and $ {h_{\text {damp}}} $ parameter, within their uncertainties. The vertical bars on the data represent the statistical and systematic uncertainties added in quadrature. The lower plot shows the ratio of the predictions to the data. |
| Tables | |
png pdf |
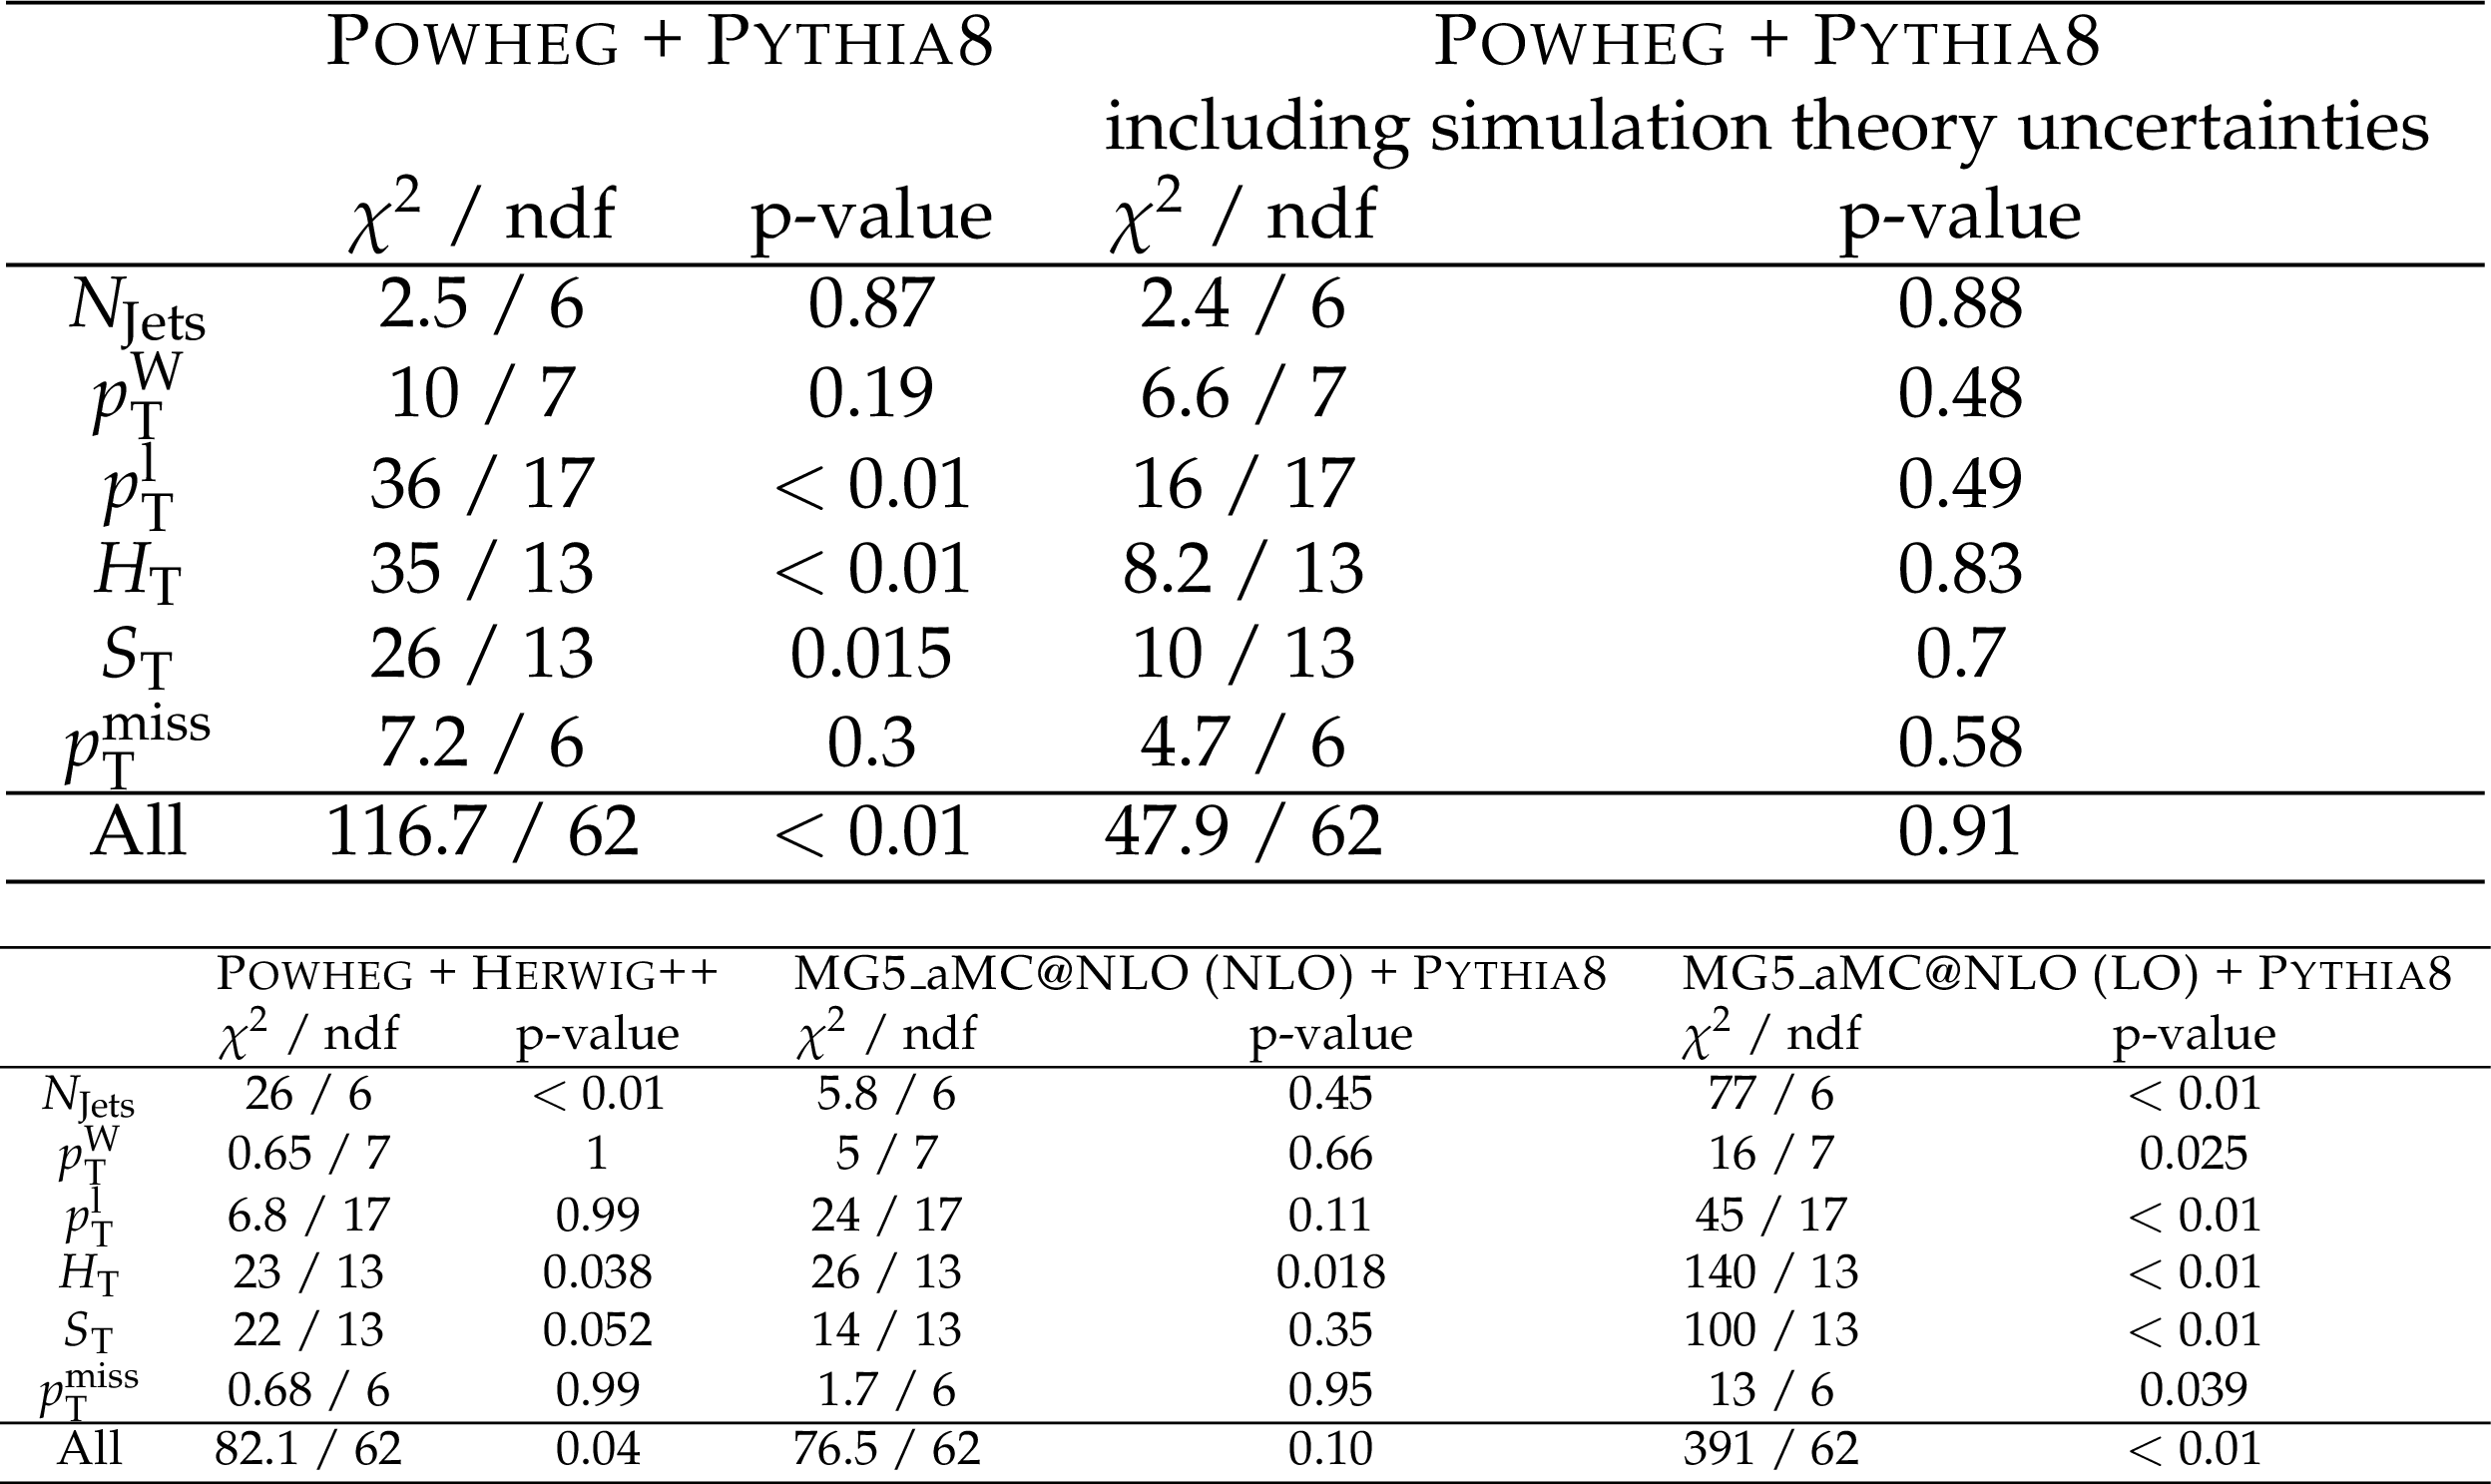
Table 1:
Results of a $\chi ^{2}$ test between the normalised cross sections in data and several simulation models. |

png pdf |
Table 2:
Results of a $\chi ^{2}$ test between the absolute cross sections in data and several simulation models. |
| Summary |
|
Normalized and absolute differential $ \mathrm{ t \bar{t} } $ production cross sections with respect to the kinematic event variables $ H_{\mathrm{T}} $, $ { {p_{\mathrm {T}}} ^\text {miss}} $, $ {S_{\text {T}}} $, $ {p_{\text {T}}^{\mathrm{ W } }} $, $ {p_{\text {T}}^{\ell}} $, and $ {N_{\text {jets}}} $ have been measured using 35.9 fb$^{-1}$ of proton-proton collision data at $\sqrt{s}= $ 13 TeV collected by the CMS experiment and have been presented at particle level in a fiducial phase space. The total cross section was observed to be consistent with previous results, and the differential measurements have been compared to several $\mathrm{ t \bar{t} }$ production simulations: powheg+pythia, powheg+herwig, MadGRAPH+aMCCatNLO (leading order), and MadGRAPH+aMCCatNLO (next-to-leading order). The powheg+pythia simulation was shown to be consistent with the data with a p-value of 0.96, including theoretical uncertainties. The $ {N_{\text {jets}}} $ distribution was particularly well-modeled, having been tuned on LHC 8 TeV data. Modeling of variables correlated with the top quark $p_{\mathrm{T}} $ were found to less consistent, as has been noted in other measurements. Comparing different simulations, the best agreement between the unfolded data and $\mathrm{ t \bar{t} } $ simulation was found with powheg+herwig, particularly in the top $p_{\mathrm{T}}$-correlated variables. The next-to-leading MadGRAPH+aMCCatNLO modeling was shown to have a similar level of consistency to powheg+herwig, and significantly better than that from leading order MadGRAPH+aMCCatNLO. |
| References | ||||
| 1 | CMS Collaboration | The CMS experiment at the CERN LHC | JINST 3 (2008) S08004 | CMS-00-001 |
| 2 | CMS Collaboration | Measurement of differential top-quark pair production cross sections in $ pp $ collisions at $ \sqrt{s}=$ 7 TeV | EPJC 73 (2013), no. 3 | CMS-TOP-11-013 1211.2220 |
| 3 | CMS Collaboration | Measurement of the differential cross section for top quark pair production in pp collisions at $ \sqrt{s} = $ 8 TeV | EPJC 75 (2015), no. 11, 542 | CMS-TOP-12-028 1505.04480 |
| 4 | CMS Collaboration | Measurement of double-differential cross sections for top quark pair production in pp collisions at $ \sqrt{s} = $8 TeV and impact on parton distribution functions | CMS-TOP-14-013 1703.01630 |
|
| 5 | CMS Collaboration | Measurement of the integrated and differential $ t \bar t $ production cross sections for high-$ p_t $ top quarks in $ pp $ collisions at $ \sqrt s = $ 8 TeV | PRD 94 (2016), no. 7, 072002 | CMS-TOP-14-012 1605.00116 |
| 6 | CMS Collaboration | Measurement of the $ \mathrm{ t \bar{t} } $ production cross section in the all-jets final state in pp collisions at $ \sqrt{s} = $ 8 TeV | CDS | |
| 7 | CMS Collaboration | Measurement of differential cross sections for top quark pair production using the lepton+jets final state in proton-proton collisions at 13 TeV | Submitted to: PRD (2016) | CMS-TOP-16-008 1610.04191 |
| 8 | CMS Collaboration | Measurement of particle level differential ttbar cross sections in the dilepton channel at $ \sqrt{s} = $ 13 TeV | CMS-PAS-TOP-16-007 | CMS-PAS-TOP-16-007 |
| 9 | ATLAS Collaboration | Measurements of top-quark pair differential cross-sections in the lepton+jets channel in pp collisions at $ \sqrt{s}=$ 13 TeV using the ATLAS detector | Technical Report ATLAS-CONF-2016-040, CERN, Geneva | |
| 10 | ATLAS Collaboration | Measurements of top-quark pair differential cross-sections in the $ e\mu $ channel in $ pp $ collisions at $ \sqrt{s} = $ 13 TeV using the ATLAS detector | 1612.05220 | |
| 11 | CMS Collaboration | Measurement of the differential cross sections for top quark pair production as a function of kinematic event variables in pp collisions at $ \sqrt s = $ 7 and 8 TeV | PRD 94 (2016), no. 5, 052006 | CMS-TOP-12-042 1607.00837 |
| 12 | S. Frixione, P. Nason, and C. Oleari | Matching NLO QCD computations with Parton Shower simulations: the POWHEG method | JHEP 11 (2007) 070 | 0709.2092 |
| 13 | P. Nason | A New method for combining NLO QCD with shower Monte Carlo algorithms | JHEP 11 (2004) 040 | hep-ph/0409146 |
| 14 | S. Alioli, P. Nason, C. Oleari, and E. Re | A general framework for implementing NLO calculations in shower Monte Carlo programs: the POWHEG BOX | JHEP 06 (2010) 043 | 1002.2581 |
| 15 | T. Sj\"ostrand, S. Mrenna, and P. Skands | PYTHIA 6.4 physics and manual | JHEP 05 (2006) 026 | hep-ph/0603175 |
| 16 | T. Sj\"ostrand, S. Mrenna, and P. Skands | A Brief Introduction to PYTHIA 8.1 | CPC 178 (2008) 852 | 0710.3820 |
| 17 | CMS Collaboration | Investigations of the impact of the parton shower tuning in Pythia 8 in the modelling of $ \mathrm{t\overline{t}} $ at $ \sqrt{s}=$ 8 and 13 TeV | CMS-PAS-TOP-16-021 | CMS-PAS-TOP-16-021 |
| 18 | M. Bahr et al. | Herwig++ Physics and Manual | EPJC 58 (2008) 639 | 0803.0883 |
| 19 | S. Gieseke, C. Rohr, and A. Siodmok | Colour reconnections in Herwig++ | EPJC 72 (2012) 2225 | 1206.0041 |
| 20 | J. Alwall et al. | The automated computation of tree-level and next-to-leading order differential cross sections, and their matching to parton shower simulations | JHEP 07 (2014) 079 | 1405.0301 |
| 21 | CMS Collaboration | Event generator tunes obtained from underlying event and multiparton scattering measurements | EPJC 76 (2016), no. 3, 155 | CMS-GEN-14-001 1512.00815 |
| 22 | J. Alwall et al. | Comparative study of various algorithms for the merging of parton showers and matrix elements in hadronic collisions | EPJC 53 (2008) 473 | 0706.2569 |
| 23 | R. Frederix and S. Frixione | Merging meets matching in MC@NLO | JHEP 12 (2012) 061 | 1209.6215 |
| 24 | NNPDF Collaboration | Parton distributions for the LHC Run II | JHEP 04 (2015) 040 | 1410.8849 |
| 25 | M. Beneke, P. Falgari, S. Klein, and C. Schwinn | Hadronic top-quark pair production with NNLL threshold resummation | Nucl. Phys. B 855 (2012) 695 | 1109.1536 |
| 26 | M. Cacciari et al. | Top-pair production at hadron colliders with next-to-next-to-leading logarithmic soft-gluon resummation | PLB 710 (2012) 612 | 1111.5869 |
| 27 | P. B\"arnreuther, M. Czakon, and A. Mitov | Percent Level Precision Physics at the Tevatron: First Genuine NNLO QCD Corrections to $ q \bar{q} \to t \bar{t} + X $ | PRL 109 (2012) 132001 | 1204.5201 |
| 28 | M. Czakon and A. Mitov | NNLO corrections to top-pair production at hadron colliders: the all-fermionic scattering channels | JHEP 12 (2012) 054 | 1207.0236 |
| 29 | M. Czakon and A. Mitov | NNLO corrections to top pair production at hadron colliders: the quark-gluon reaction | JHEP 01 (2013) 080 | 1210.6832 |
| 30 | M. Czakon, P. Fiedler, and A. Mitov | Total Top-Quark Pair-Production Cross Section at Hadron Colliders Through $ O(\alpha^{4}_{S}) $ | PRL 110 (2013) 252004 | 1303.6254 |
| 31 | M. Czakon and A. Mitov | Top++: A Program for the Calculation of the Top-Pair Cross-Section at Hadron Colliders | CPC 185 (2014) 2930 | 1112.5675 |
| 32 | M. Aliev et al. | HATHOR: HAdronic Top and Heavy quarks crOss section calculatoR | CPC 182 (2011) 1034 | 1007.1327 |
| 33 | P. Kant et al. | HatHor for single top-quark production: Updated predictions and uncertainty estimates for single top-quark production in hadronic collisions | CPC 191 (2015) 74 | 1406.4403 |
| 34 | Y. Li and F. Petriello | Combining QCD and electroweak corrections to dilepton production in FEWZ | PRD 86 (2012) 094034 | 1208.5967 |
| 35 | S. Agostinelli et al. | Geant4‚ a simulation toolkit | NIMA 506 (2003) 250 | |
| 36 | CMS Collaboration | Particle-flow reconstruction and global event description with the CMS detector | CMS-PRF-14-001 1706.04965 |
|
| 37 | M. Cacciari, G. P. Salam, and G. Soyez | The anti-$ k_t $ jet clustering algorithm | JHEP 04 (2008) 063 | 0802.1189 |
| 38 | M. Cacciari, G. P. Salam, and G. Soyez | FastJet user manual | EPJC 72 (2012) 1896 | 1111.6097 |
| 39 | CMS Collaboration | Identification of b-quark jets with the CMS experiment | JINST 8 (2013) P04013 | CMS-BTV-12-001 1211.4462 |
| 40 | CMS Collaboration | Identification of b quark jets at the CMS Experiment in the LHC Run 2 | CMS-PAS-BTV-15-001 | CMS-PAS-BTV-15-001 |
| 41 | A. Buckley et al. | Rivet user manual | CPC 184 (2013) 2803 | 1003.0694 |
| 42 | CMS Collaboration | Object definitions for top quark analyses at the particle level | CDS | |
| 43 | S. Schmitt | Tunfold, an algorithm for correcting migration effects in high energy physics | Journal of Instrumentation 7 (2012), no. 10, T10003 | |
| 44 | CMS Collaboration | Performance of heavy flavour identification algorithms in proton-proton collisions at 13 TeV at the CMS experiment | CDS | |
| 45 | CMS Collaboration | Measurement of the Inclusive $ W $ and $ Z $ Production Cross Sections in $ pp $ Collisions at $ \sqrt{s}=$ 7 TeV | JHEP 10 (2011) 132 | CMS-EWK-10-005 1107.4789 |
| 46 | CMS Collaboration | Jet energy scale and resolution in the CMS experiment in pp collisions at 8 TeV | JINST 12 (2017) P02014 | CMS-JME-13-004 1607.03663 |
| 47 | CMS Collaboration | CMS Luminosity Measurements for the 2016 Data Taking Period | CMS-PAS-LUM-17-001 | CMS-PAS-LUM-17-001 |
| 48 | C. Patrignani and P. D. Group | Review of particle physics | Chinese Physics C 40 (2016), no. 10, 100001 | |
| 49 | M. Czakon, P. Fiedler, D. Heymes, and A. Mitov | NNLO QCD predictions for fully-differential top-quark pair production at the Tevatron | JHEP 05 (2016) 034 | 1601.05375 |
| 50 | P. Skands, S. Carrazza, and J. Rojo | Tuning PYTHIA 8.1: the Monash 2013 Tune | EPJC 74 (2014), no. 8 | 1404.5630 |
| 51 | C. Peterson, D. Schlatter, I. Schmitt, and P. M. Zerwas | Scaling violations in inclusive $ {e}^{+}{e}^{ {-}} $ annihilation spectra | PRD 27 (1983) 105 | |
| 52 | J. R. Christiansen and P. Z. Skands | String Formation Beyond Leading Colour | JHEP 08 (2015) 003 | 1505.01681 |
| 53 | S. Argyropoulos and T. Sj\"ostrand | Effects of color reconnection on $ t\bar{t} $ final states at the LHC | JHEP 11 (2014) 043 | 1407.6653 |
|
|
Compact Muon Solenoid LHC, CERN |
|

|

|

|

|

|