

Compact Muon Solenoid
LHC, CERN
| CMS-PAS-TOP-16-019 | ||
| Bounding the top quark width using final states with two charged leptons and two jets at $\sqrt{s} = $ 13 TeV | ||
| CMS Collaboration | ||
| September 2016 | ||
| Abstract: A direct bound on the top quark decay width is presented, obtained by analysing 12.9 fb$^{-1}$ of proton-proton collision data collected at $ \sqrt{s} = $ 13 TeV by the CMS experiment at the LHC. The measurement is performed by partially reconstructing the kinematics of top quark candidates from final states containing at least two charged leptons (electrons or muons) and at least two jets, where at least one jet is identified as stemming from the fragmentation and hadronization of a b quark. The observable is compared to the simulated expectations for different top quark width scenarios using a likelihood technique. Under the hypothesis of a standard model-like top quark the measurement yields limits at the 95% CL of 0.6 $ \leq \Gamma_{\rm t} \leq $ 2.5 GeV, with an expected limit at 0.6 $ \leq \Gamma_{\rm t} \leq $ 2.4 GeV for a top quark mass of 172.5 GeV. | ||
| Links: CDS record (PDF) ; inSPIRE record ; CADI line (restricted) ; | ||
| Figures | |

png pdf |
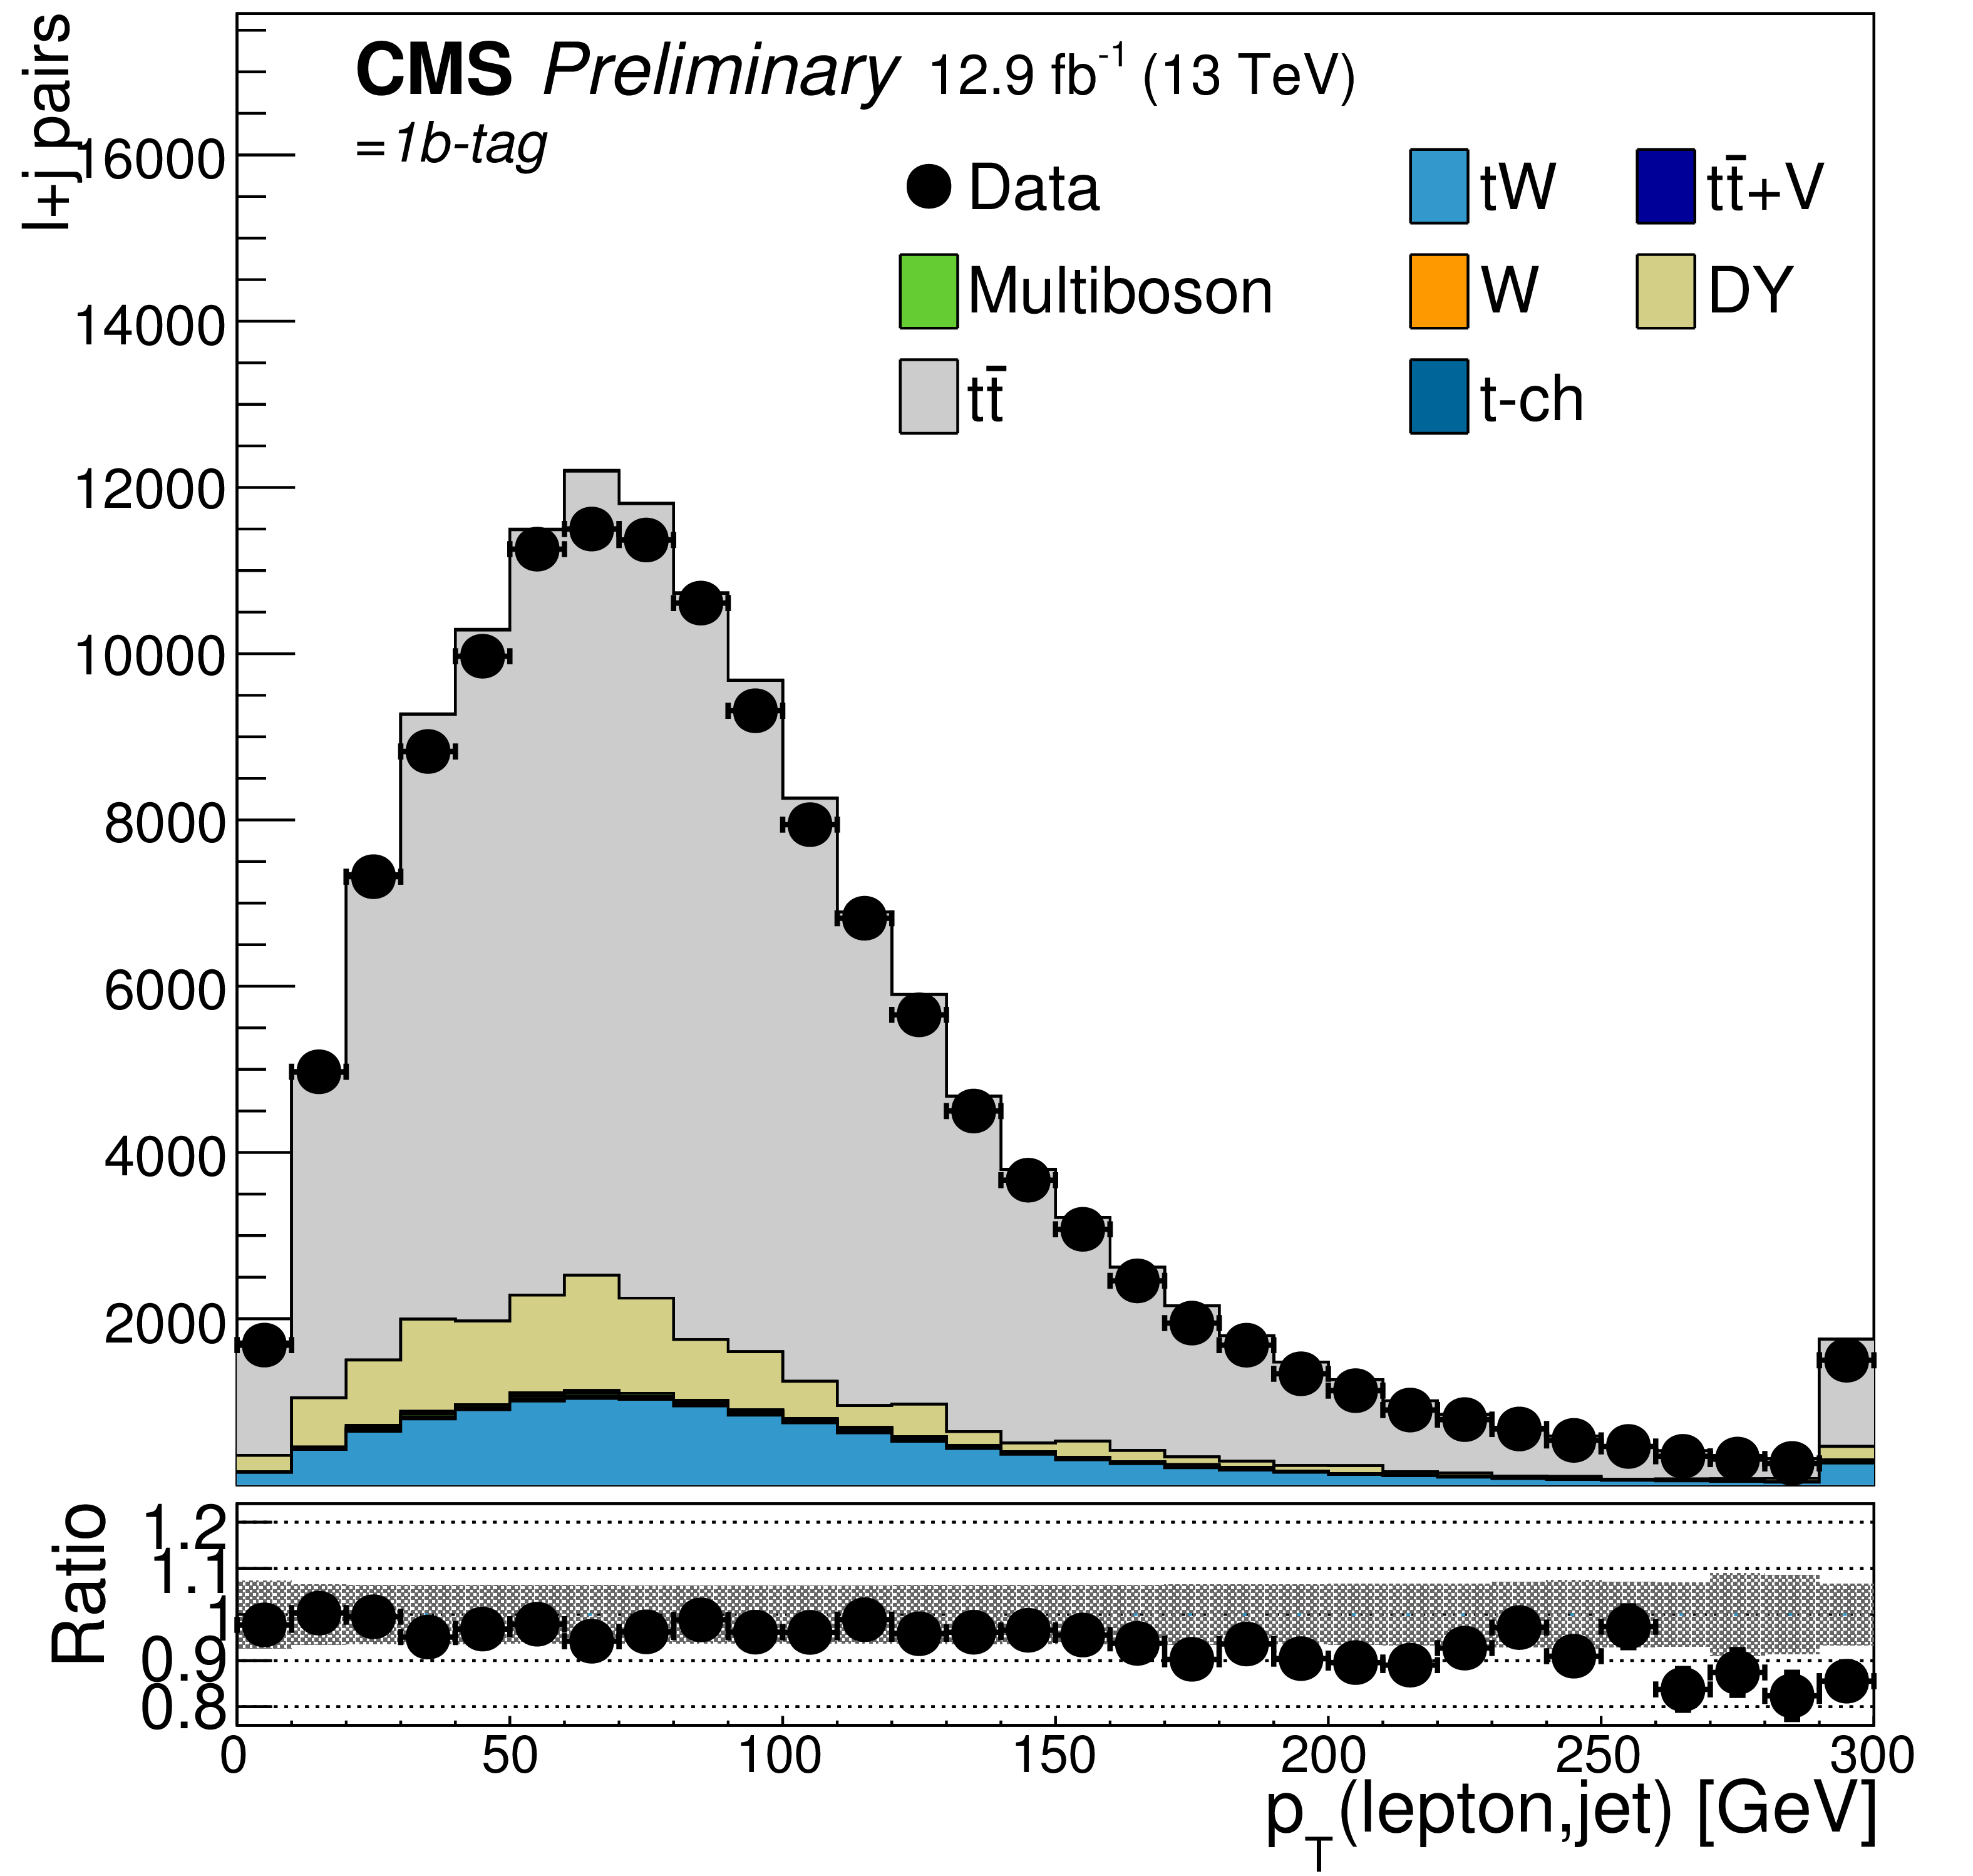
Figure 1:
Distributions of the inclusive lepton-b-jet transverse momentum, $ {p_{\mathrm {T}}} (\ell ,\mathrm{ b } )$, for events with $=1$ (left) or $\geq $2 (right) b-tagged jets. All dilepton channels are combined. The top panels compare the distribution in the data to the simulated expectations, while the bottom panels display the ratio of the two. The shaded band in the bottom panel represents the uncertainty in the prediction due to the limited statistics in the simulation and due to the integrated luminosity. |
png pdf |
Figure 1-a:
Distribution of the inclusive lepton-b-jet transverse momentum, $ {p_{\mathrm {T}}} (\ell ,\mathrm{ b } )$, for events with $=1$ b-tagged jet. All dilepton channels are combined. The top panel compares the distribution in the data to the simulated expectations, while the bottom panel displays the ratio of the two. The shaded band in the bottom panel represents the uncertainty in the prediction due to the limited statistics in the simulation and due to the integrated luminosity. |

png pdf |
Figure 1-b:
Distribution of the inclusive lepton-b-jet transverse momentum, $ {p_{\mathrm {T}}} (\ell ,\mathrm{ b } )$, for events with $\geq $2 b-tagged jets. All dilepton channels are combined. The top panel compares the distribution in the data to the simulated expectations, while the bottom panel displays the ratio of the two. The shaded band in the bottom panel represents the uncertainty in the prediction due to the limited statistics in the simulation and due to the integrated luminosity. |

png pdf |
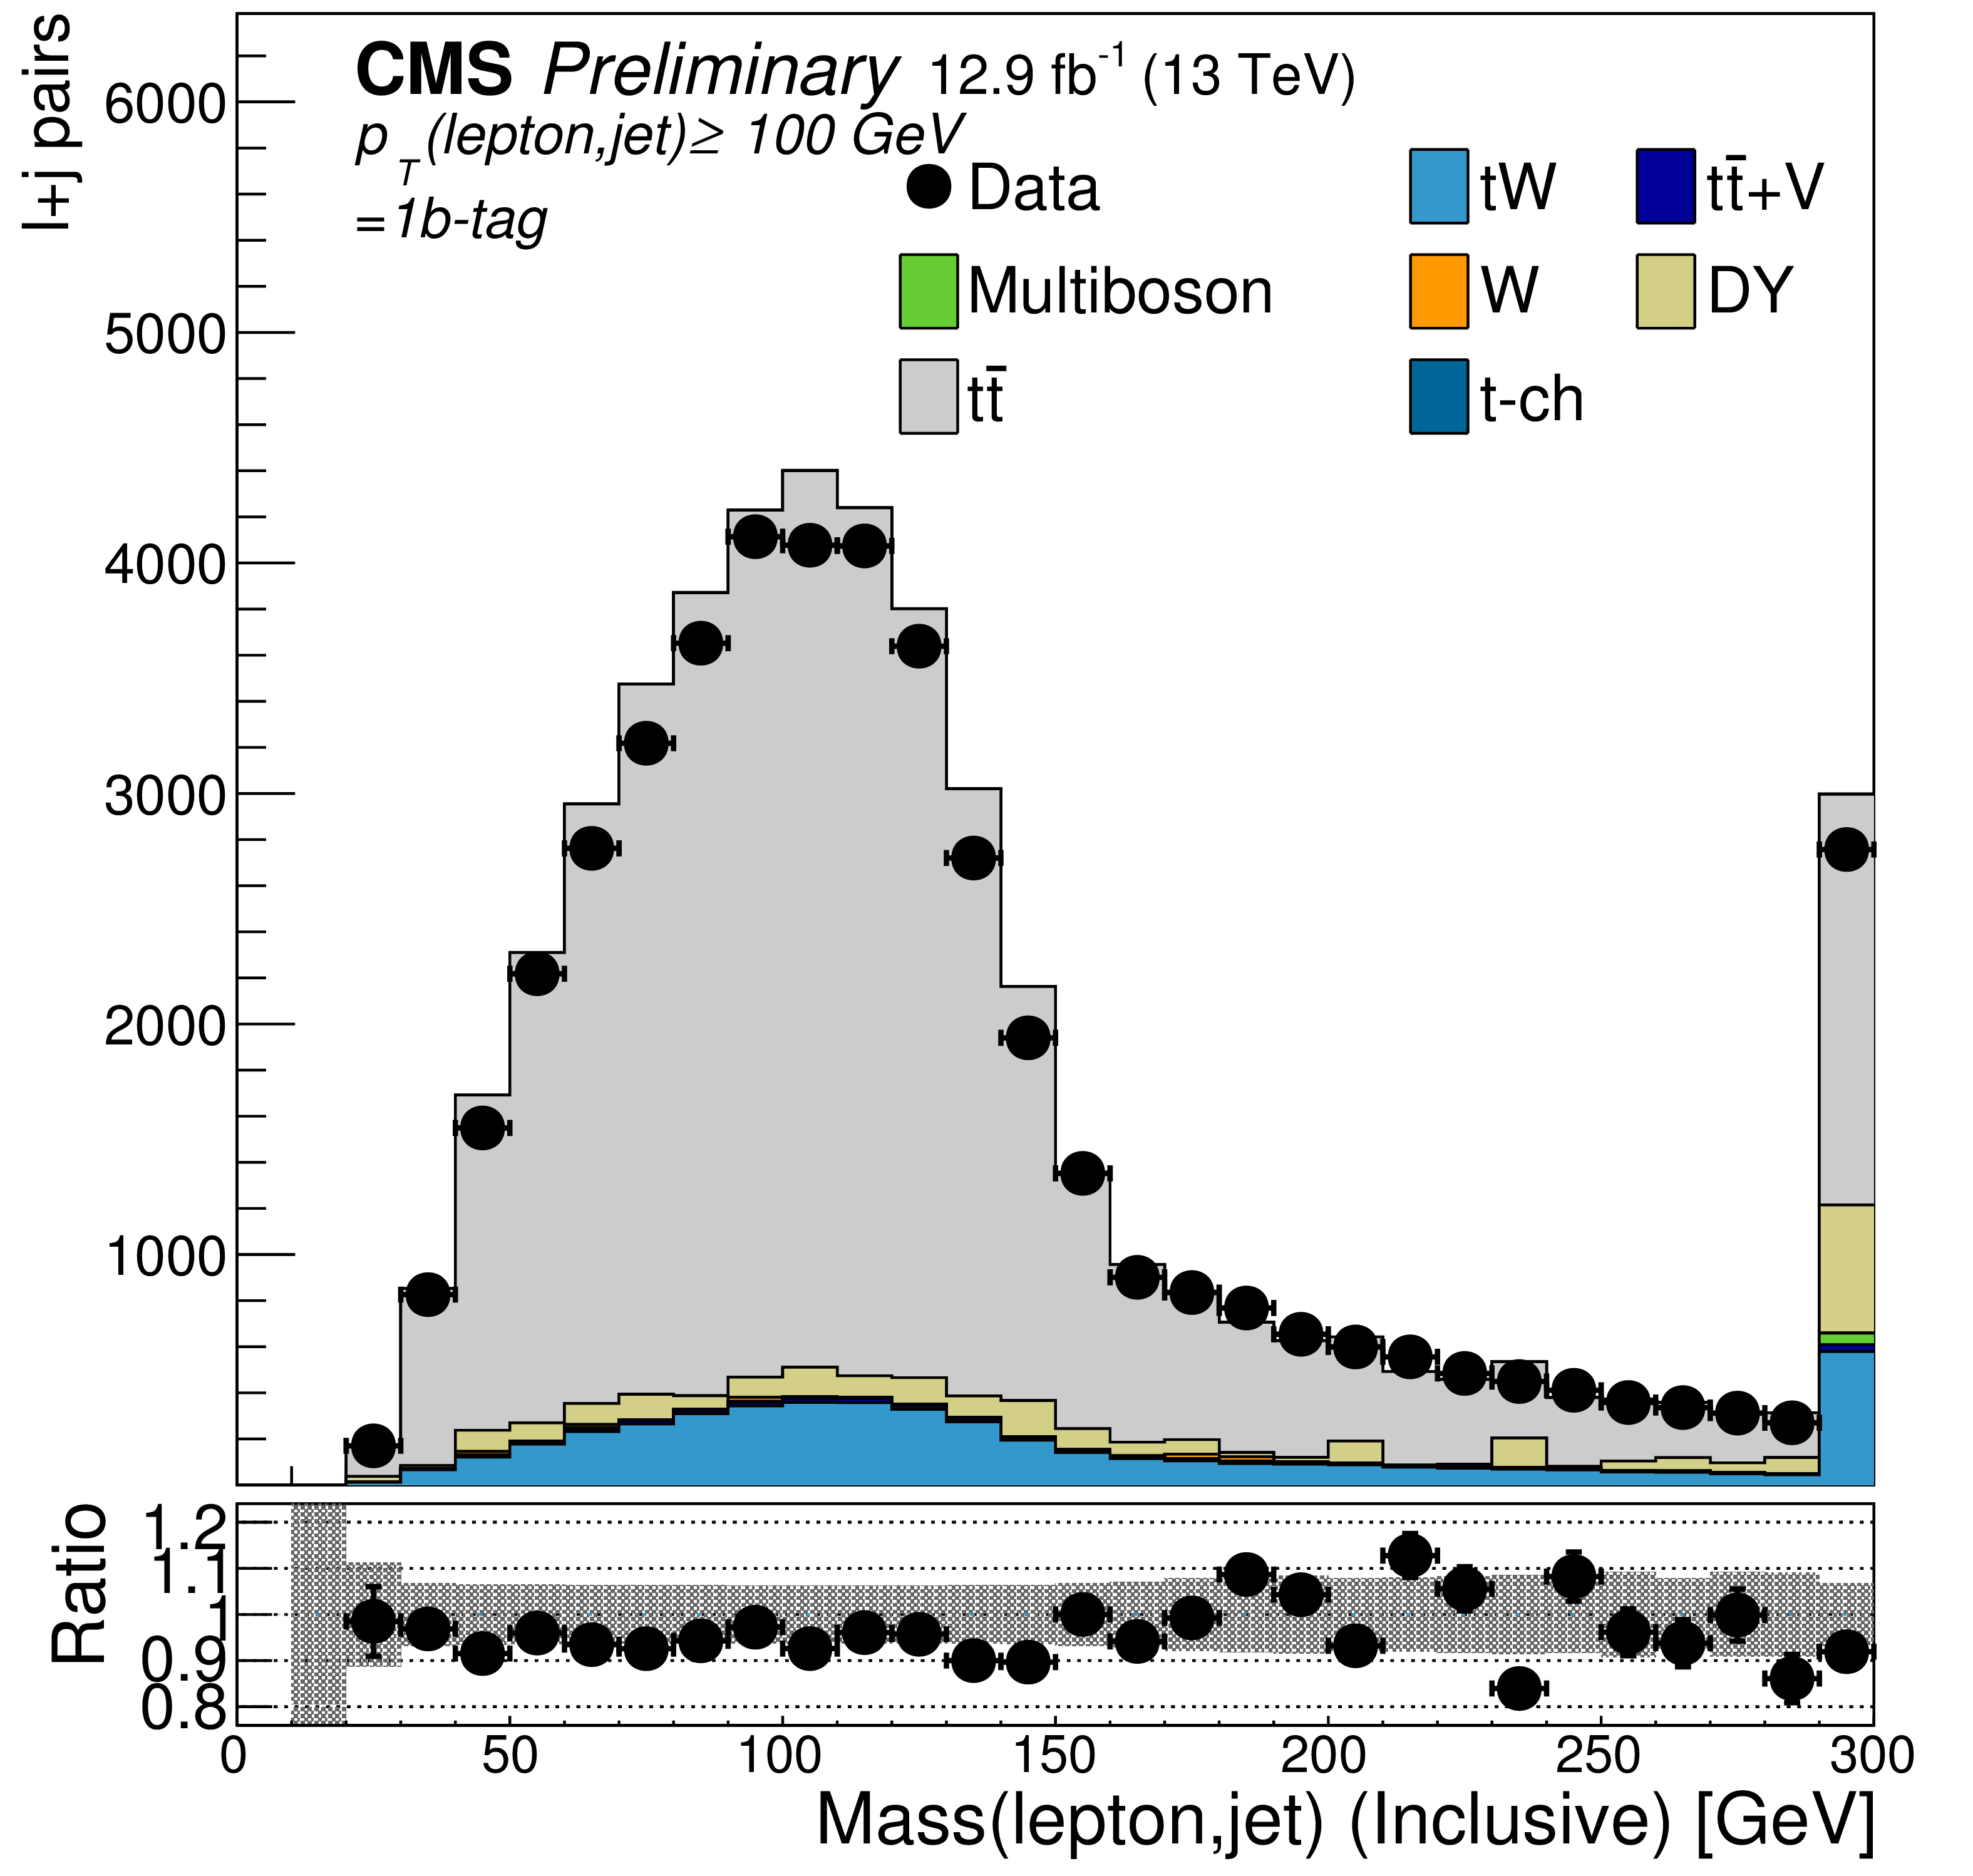
Figure 2:
Distribution of the $M_{\ell \mathrm{ b } }$ observable calculated using up to two leptons and two b-tagged jets per event, for all dilepton channels combined. The plots on the top (bottom) refer to the boosted (non-boosted) category, and the plots on the left (right) correspond to the =1-b ($\geq $2-b ) event category. In each plot the top panels compare the distribution in the data to the simulated expectations, while the bottom panels display the ratio of the two. The last bin includes the overflow of the distributions. The shaded band in the bottom panel represents the uncertainty in the prediction due to the limited statistics in the simulation and due to the integrated luminosity. |
png pdf |
Figure 2-a:
Distribution of the $M_{\ell \mathrm{ b } }$ observable calculated using up to two leptons and two b-tagged jets per event, for all dilepton channels combined. The plot refers to the boosted category, in the 1-b event category. The top panel compares the distribution in the data to the simulated expectations, while the bottom panel displays the ratio of the two. The last bin includes the overflow of the distributions. The shaded band in the bottom panel represents the uncertainty in the prediction due to the limited statistics in the simulation and due to the integrated luminosity. |
png pdf |
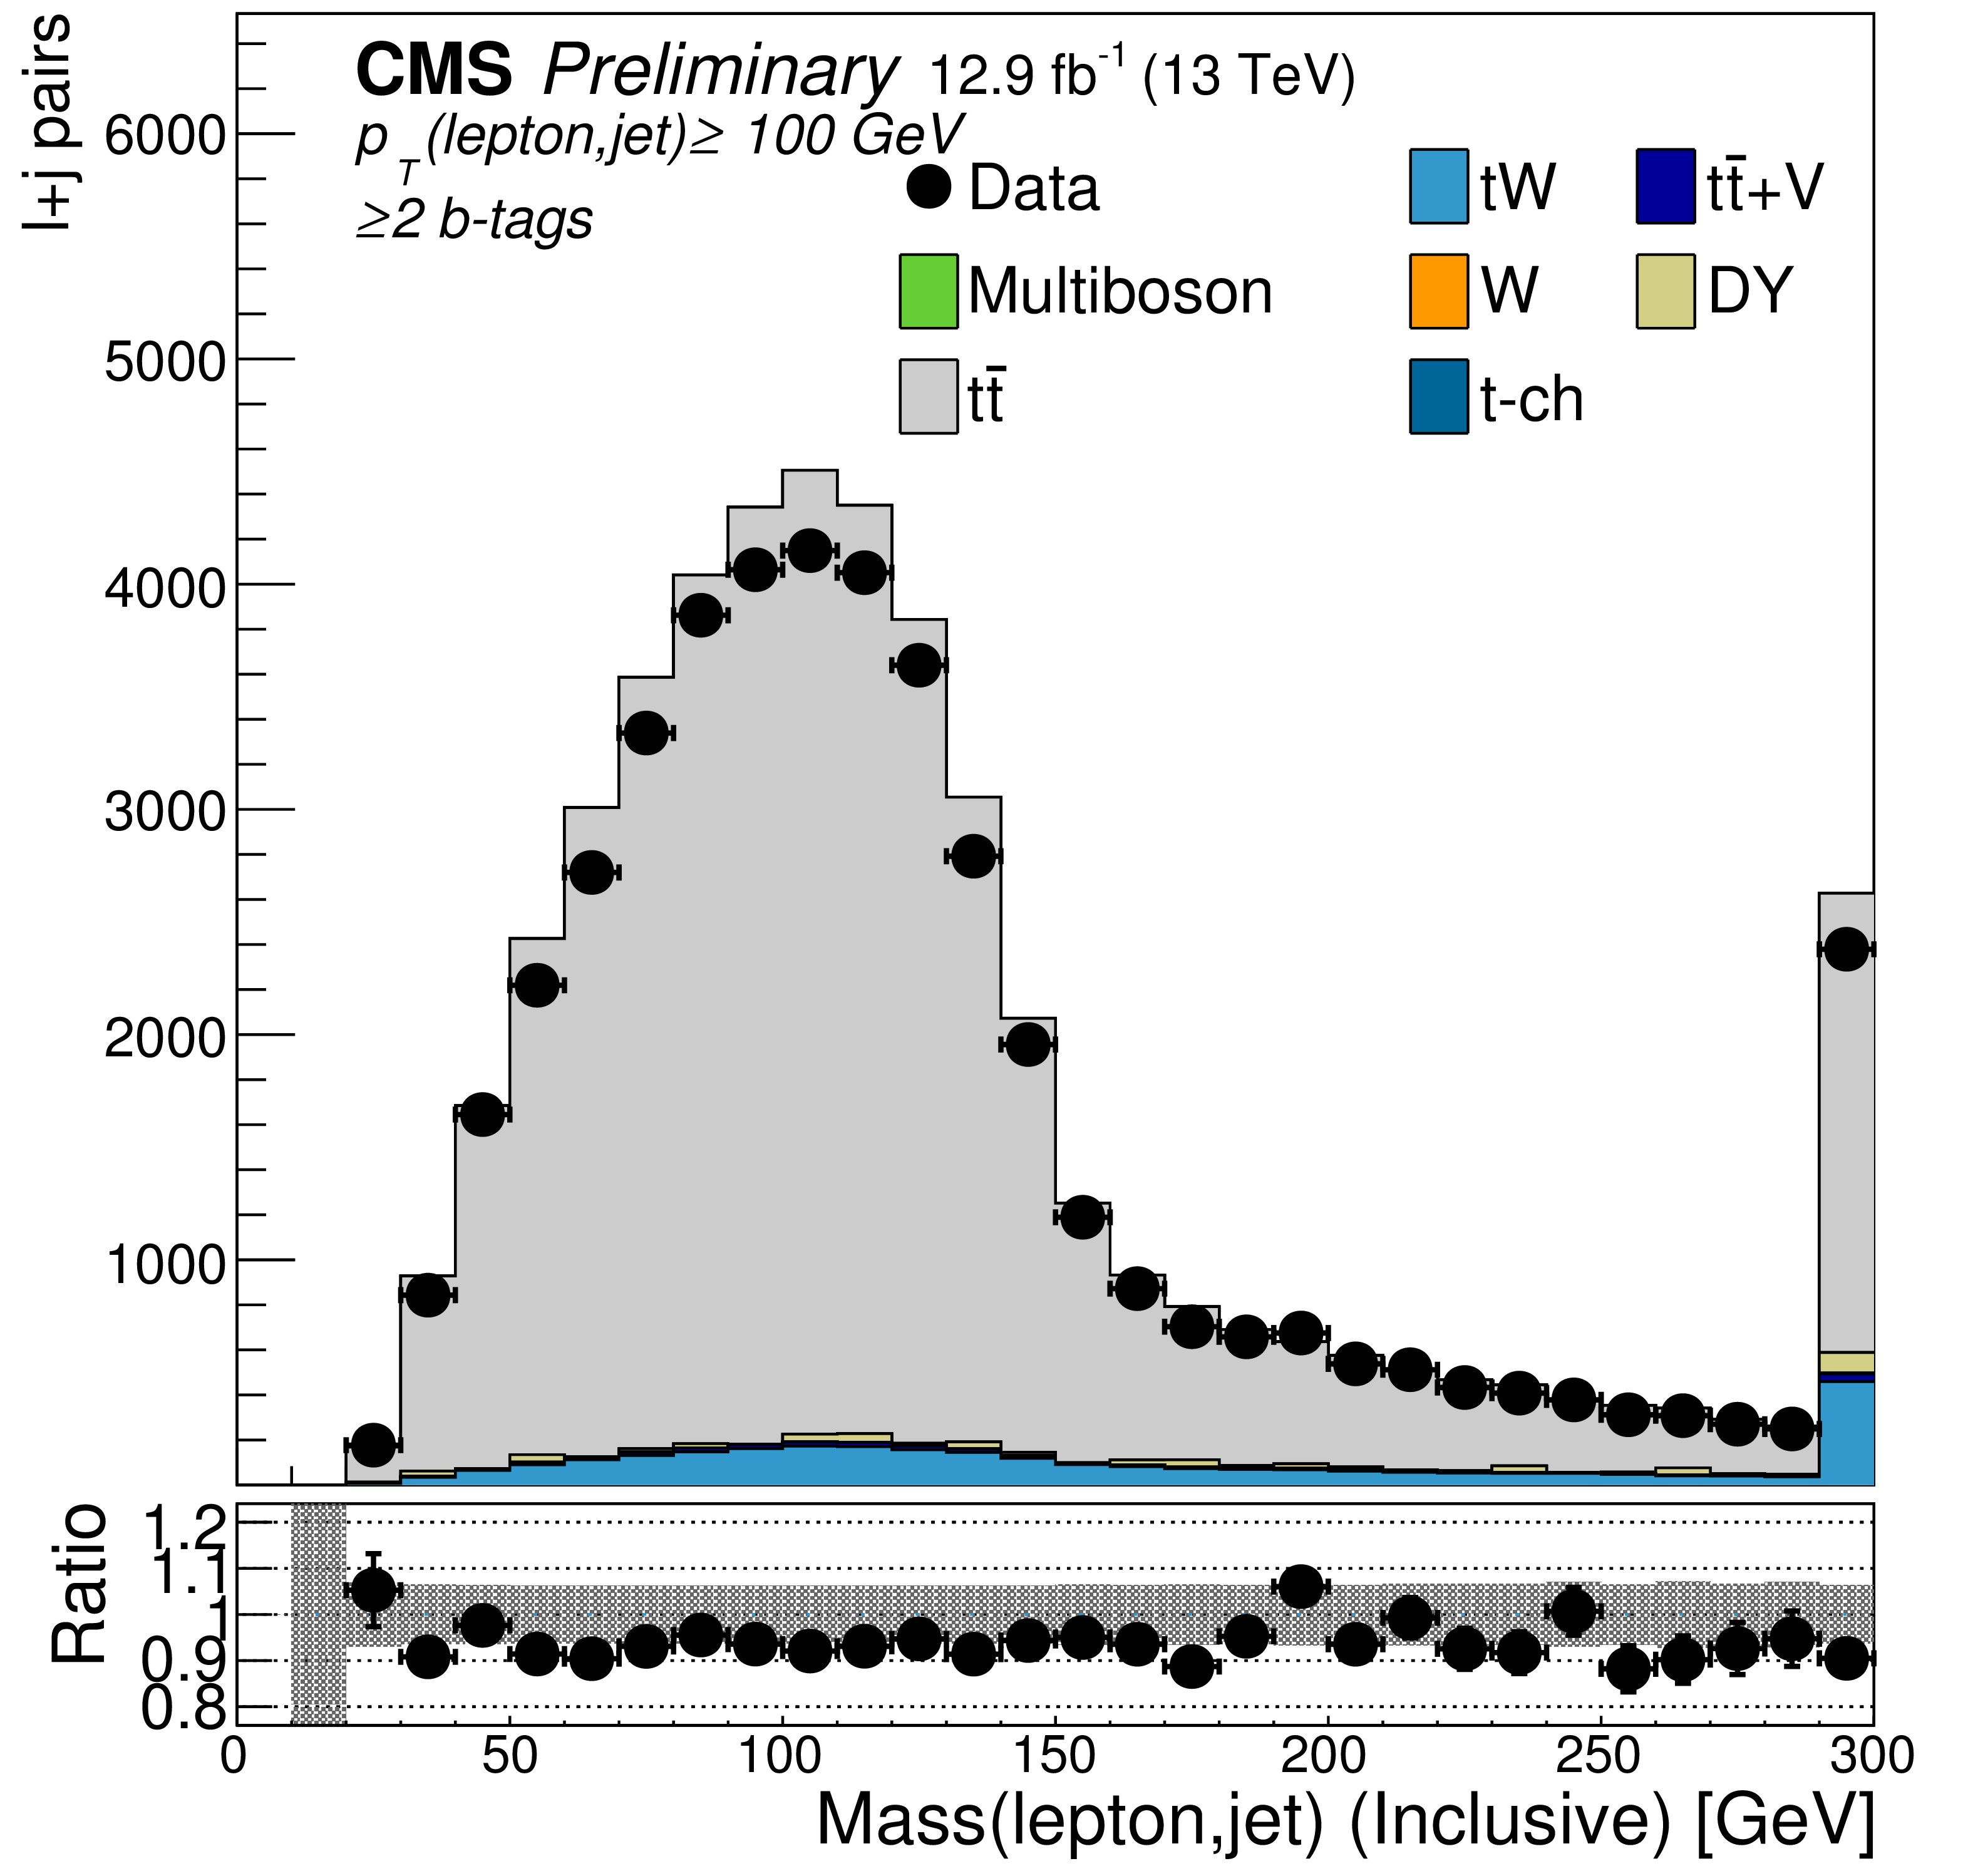
Figure 2-b:
Distribution of the $M_{\ell \mathrm{ b } }$ observable calculated using up to two leptons and two b-tagged jets per event, for all dilepton channels combined. The plot refers to the boosted category, in the $\geq $2-b event category. The top panel compares the distribution in the data to the simulated expectations, while the bottom panel displays the ratio of the two. The last bin includes the overflow of the distributions. The shaded band in the bottom panel represents the uncertainty in the prediction due to the limited statistics in the simulation and due to the integrated luminosity. |
png pdf |
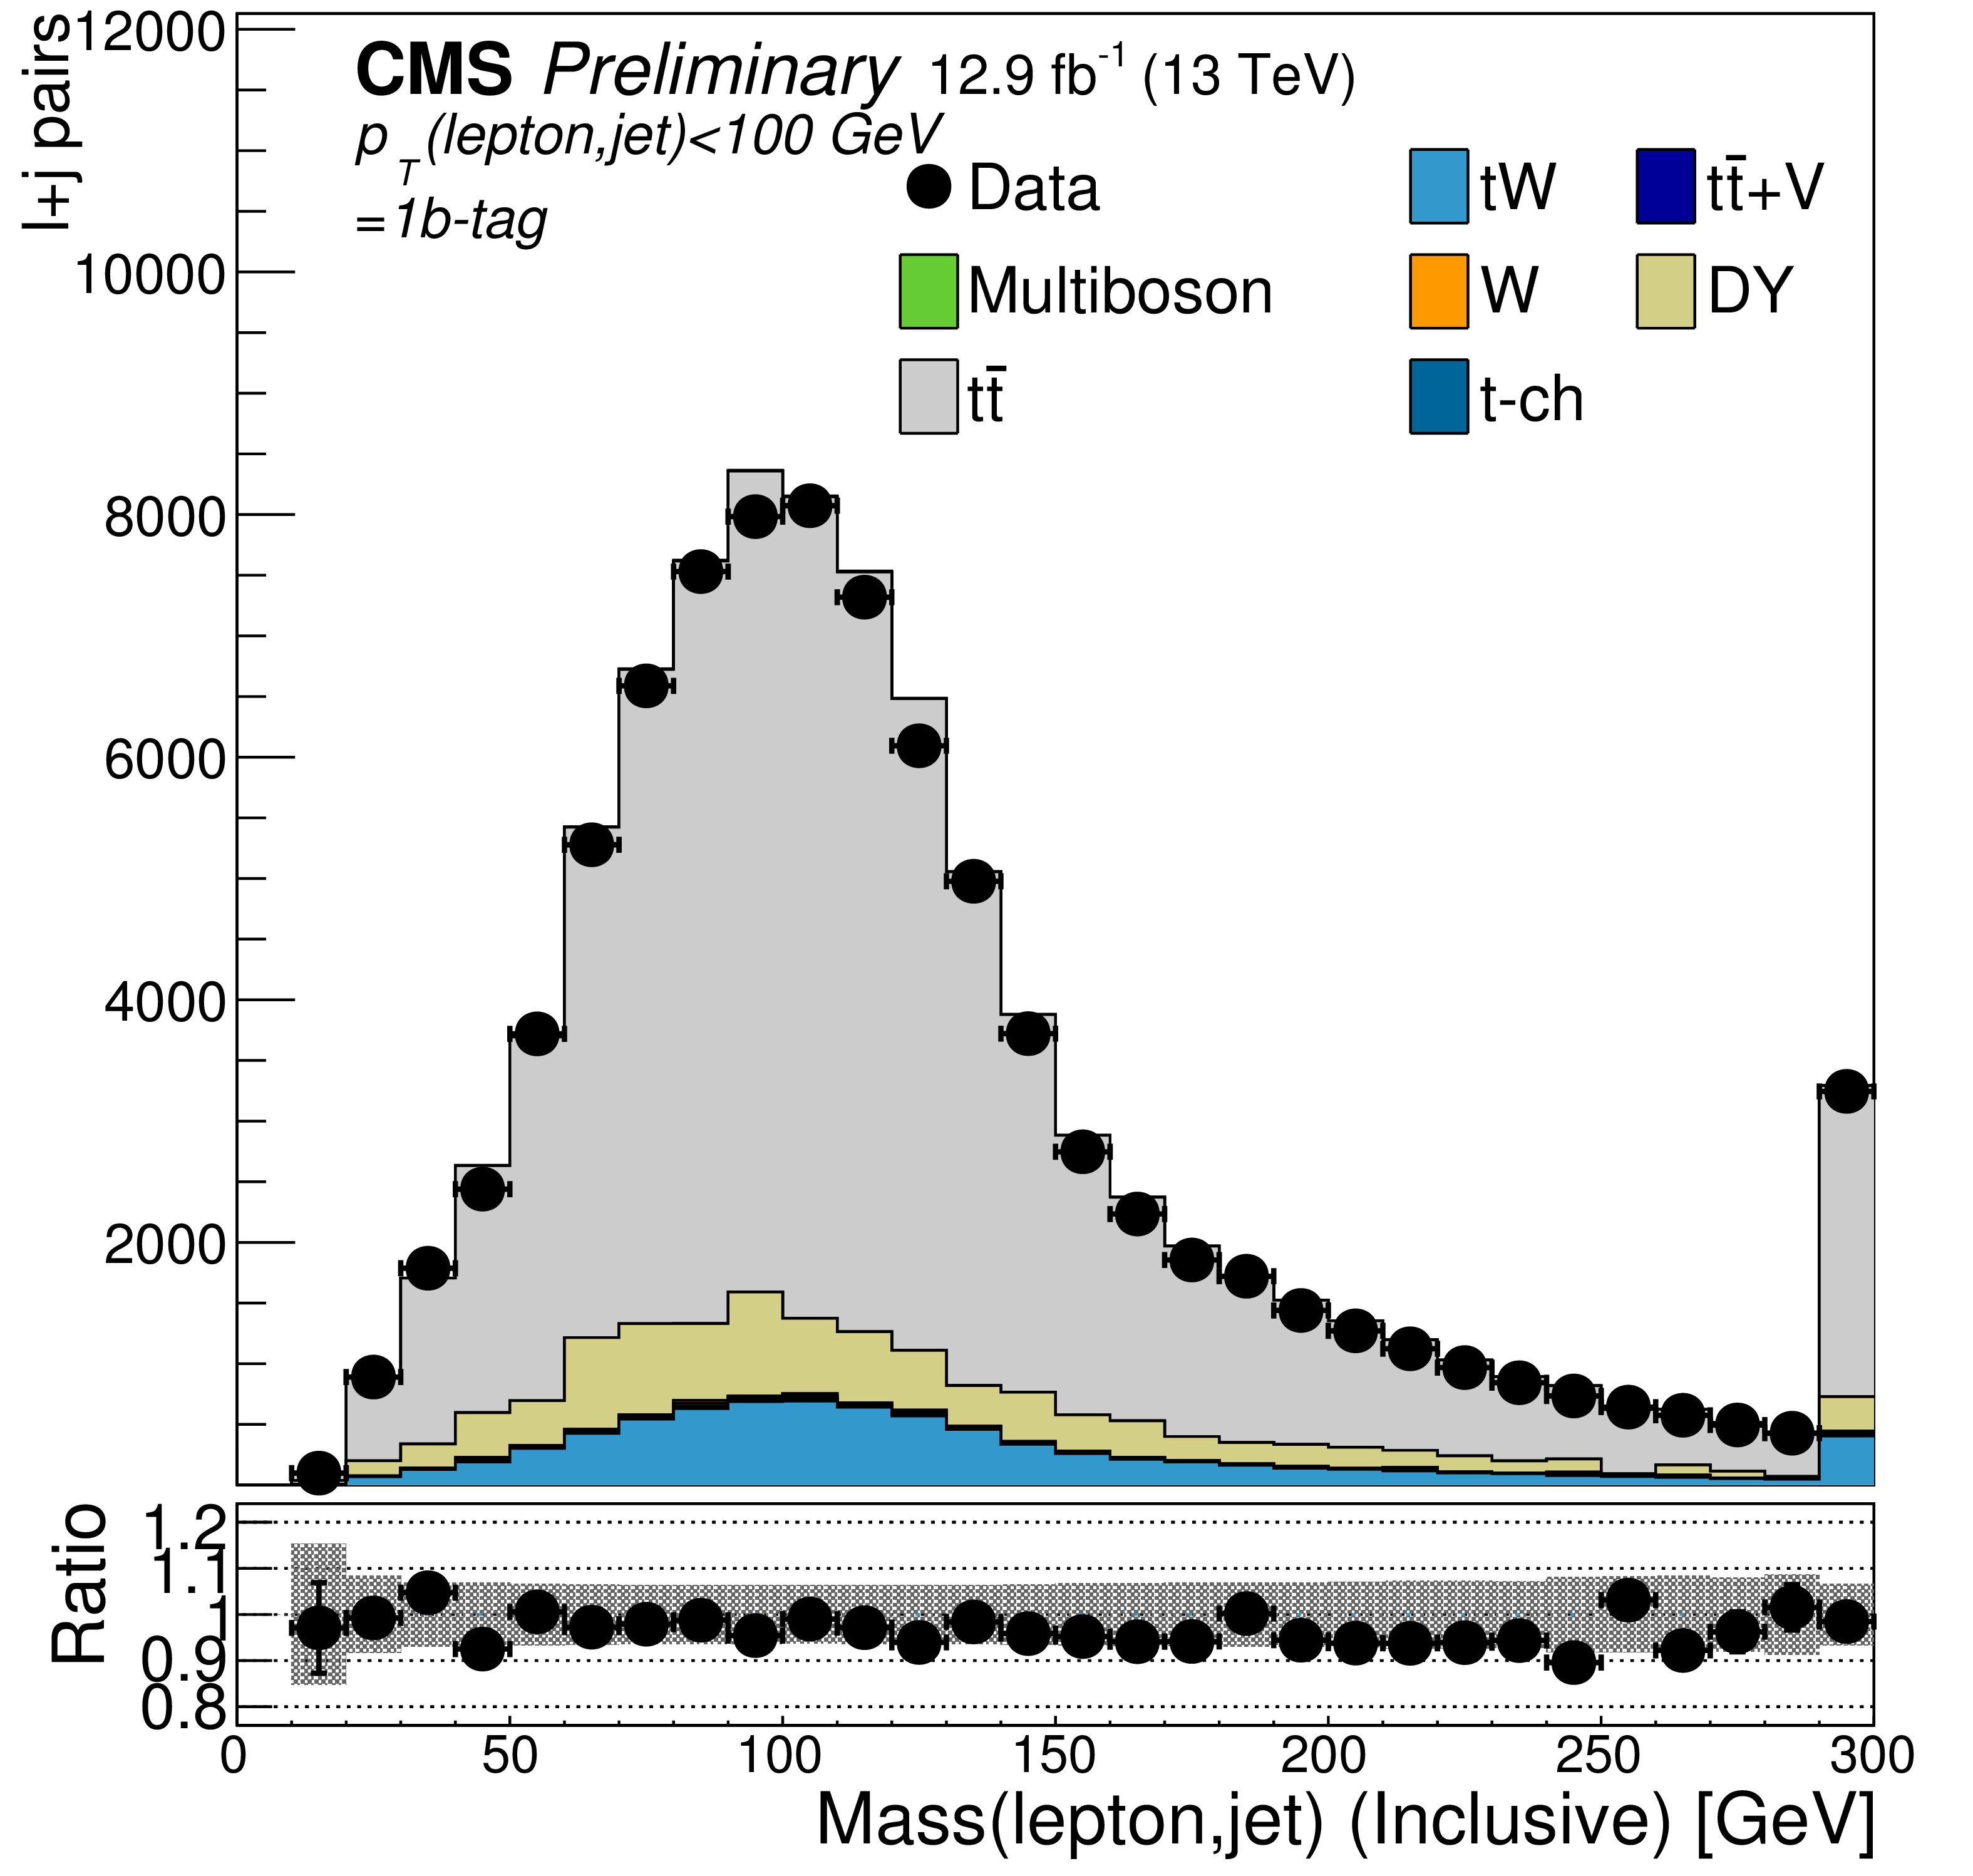
Figure 2-c:
Distribution of the $M_{\ell \mathrm{ b } }$ observable calculated using up to two leptons and two b-tagged jets per event, for all dilepton channels combined. The plot refers to the non-boosted category, in the 1-b event category. The top panel compares the distribution in the data to the simulated expectations, while the bottom panel displays the ratio of the two. The last bin includes the overflow of the distributions. The shaded band in the bottom panel represents the uncertainty in the prediction due to the limited statistics in the simulation and due to the integrated luminosity. |

png pdf |
Figure 2-d:
Distribution of the $M_{\ell \mathrm{ b } }$ observable calculated using up to two leptons and two b-tagged jets per event, for all dilepton channels combined. The plot refers to the non-boosted category, in the $\geq $2-b event category. The top panel compares the distribution in the data to the simulated expectations, while the bottom panel displays the ratio of the two. The last bin includes the overflow of the distributions. The shaded band in the bottom panel represents the uncertainty in the prediction due to the limited statistics in the simulation and due to the integrated luminosity. |

png pdf |
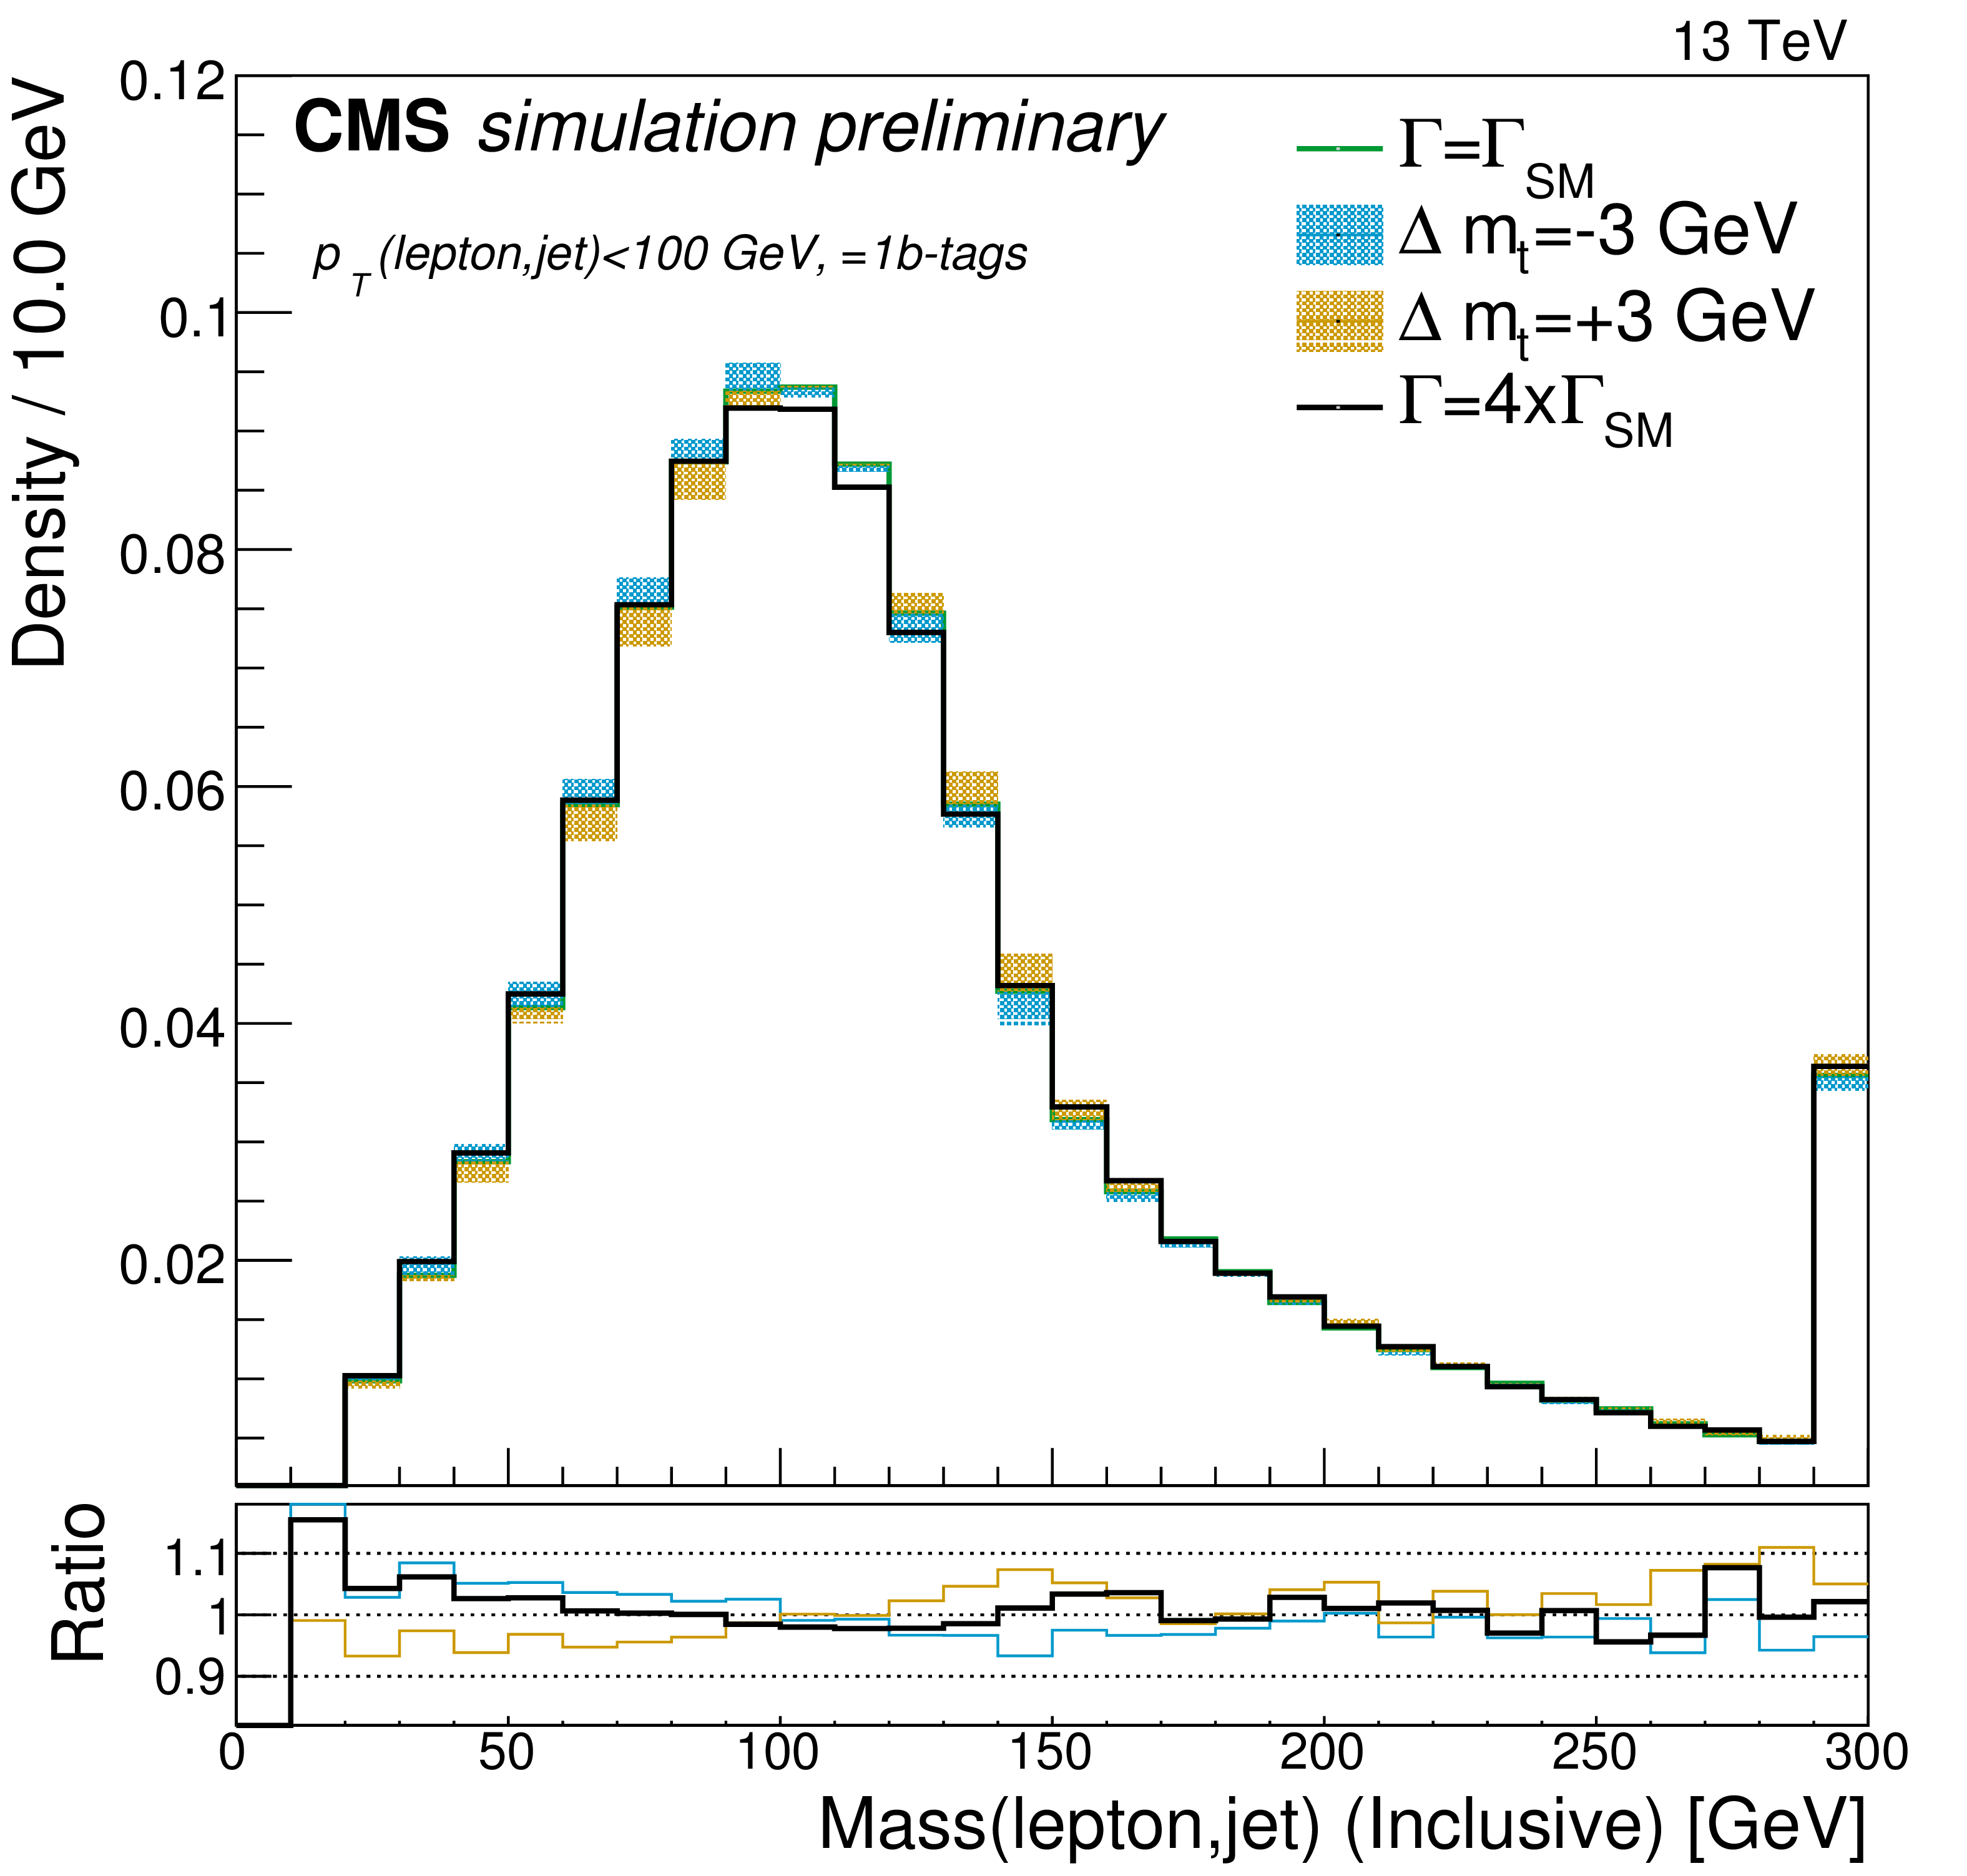
Figure 3:
Distribution of the $M_{\ell \mathrm{ b } }$ variable for simulated POWHEG+PYTHIA-8 events where the top quark mass is varied by $\pm $3 GeV with respect to 172.5 GeV and the width is varied by a factor of 4 with respect to the SM value. The upper (lower) row of plots describes boosted (unboosted) events, while the left (right) column displays information in the 1-b ($\geq $2-b) category. The top panels show the distributions with the last bin displaying the overflow of the histograms while the bottom plot show the ratio with respect to the $m_\mathrm{ t } =$ 172.5 GeV and $\Gamma _\mathrm{ t } =\Gamma _{\rm SM}$ scenario. |

png pdf |
Figure 3-a:
Distribution of the $M_{\ell \mathrm{ b } }$ variable for simulated POWHEG+PYTHIA-8 events where the top quark mass is varied by $\pm $3 GeV with respect to 172.5 GeV and the width is varied by a factor of 4 with respect to the SM value. The plot describes boosted events, in the 1-b category. The top panel shows the distribution with the last bin displaying the overflow of the histograms while the bottom plot shows the ratio with respect to the $m_\mathrm{ t } =$ 172.5 GeV and $\Gamma _\mathrm{ t } =\Gamma _{\rm SM}$ scenario. |

png pdf |
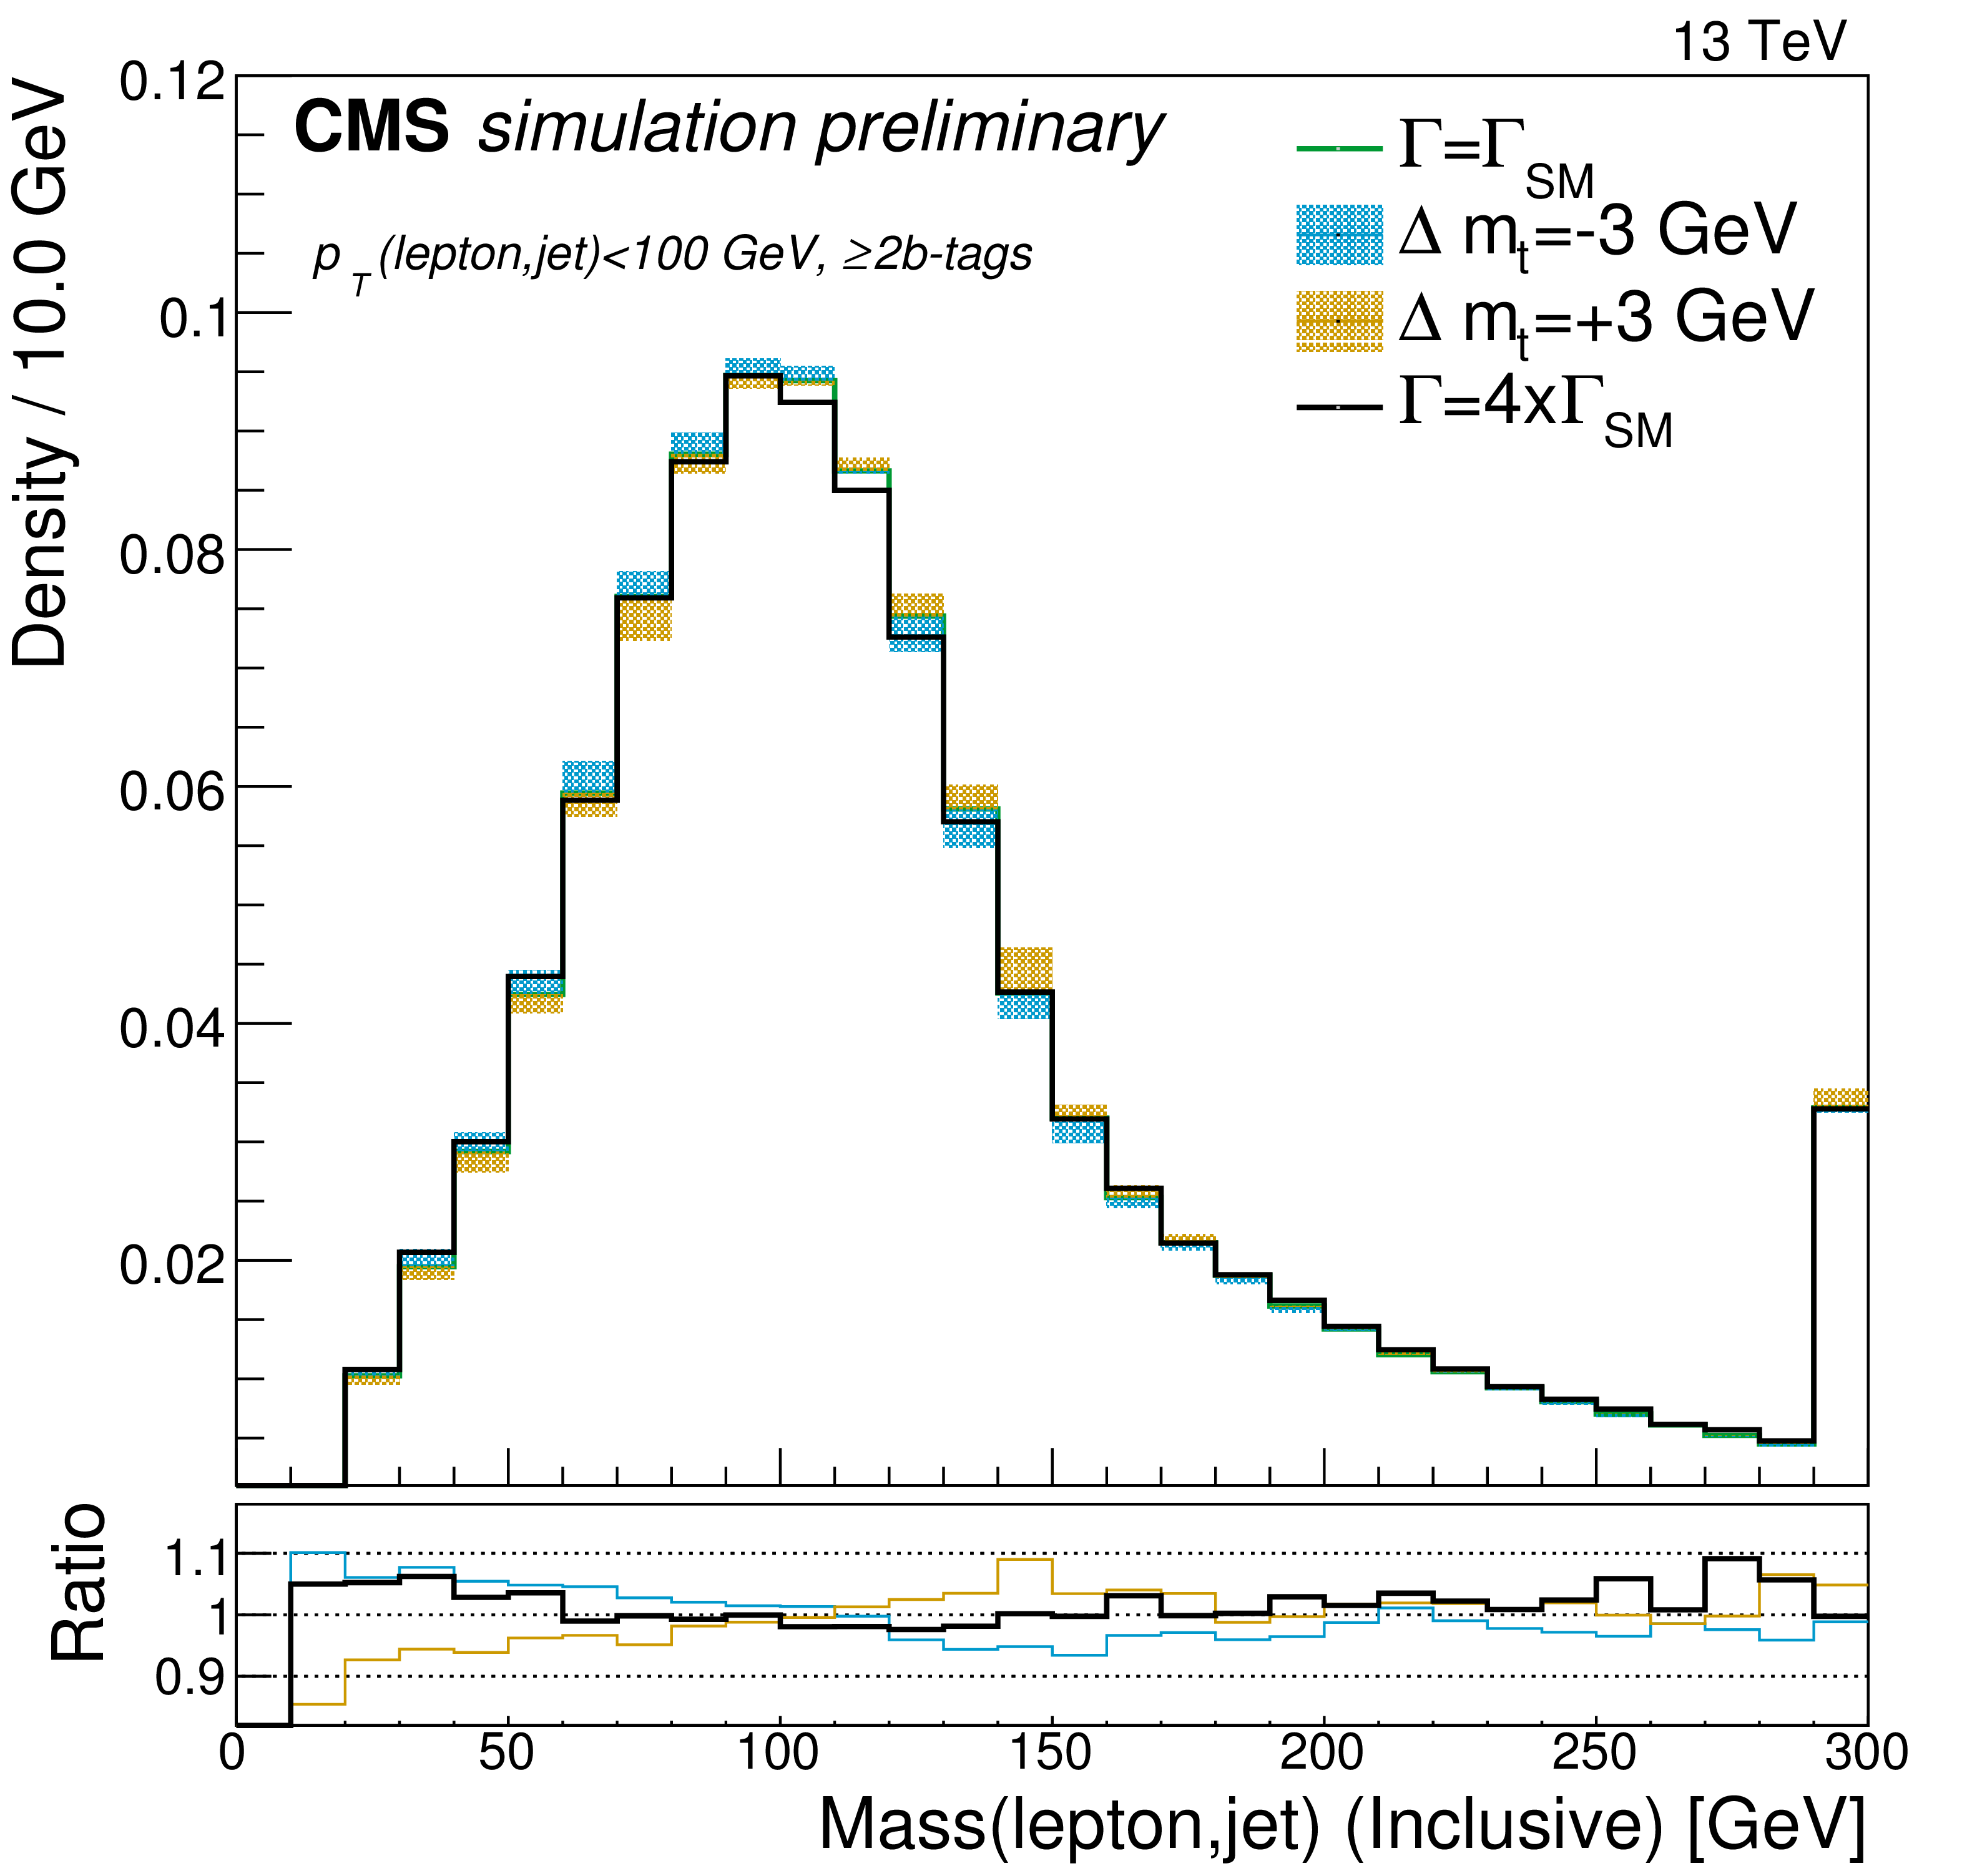
Figure 3-b:
Distribution of the $M_{\ell \mathrm{ b } }$ variable for simulated POWHEG+PYTHIA-8 events where the top quark mass is varied by $\pm $3 GeV with respect to 172.5 GeV and the width is varied by a factor of 4 with respect to the SM value. The plot describes boosted events, in the $\geq $2-b category. The top panel shows the distribution with the last bin displaying the overflow of the histograms while the bottom plot shows the ratio with respect to the $m_\mathrm{ t } =$ 172.5 GeV and $\Gamma _\mathrm{ t } =\Gamma _{\rm SM}$ scenario. |
png pdf |
Figure 3-c:
Distribution of the $M_{\ell \mathrm{ b } }$ variable for simulated POWHEG+PYTHIA-8 events where the top quark mass is varied by $\pm $3 GeV with respect to 172.5 GeV and the width is varied by a factor of 4 with respect to the SM value. The plot describes unboosted events, in the 1-b category. The top panel shows the distribution with the last bin displaying the overflow of the histograms while the bottom plot shows the ratio with respect to the $m_\mathrm{ t } =$ 172.5 GeV and $\Gamma _\mathrm{ t } =\Gamma _{\rm SM}$ scenario. |
png pdf |
Figure 3-d:
Distribution of the $M_{\ell \mathrm{ b } }$ variable for simulated POWHEG+PYTHIA-8 events where the top quark mass is varied by $\pm $3 GeV with respect to 172.5 GeV and the width is varied by a factor of 4 with respect to the SM value. The plot describes unboosted events, in the $\geq $2-b category. The top panel shows the distribution with the last bin displaying the overflow of the histograms while the bottom plot shows the ratio with respect to the $m_\mathrm{ t } =$ 172.5 GeV and $\Gamma _\mathrm{ t } =\Gamma _{\rm SM}$ scenario. |
png pdf |
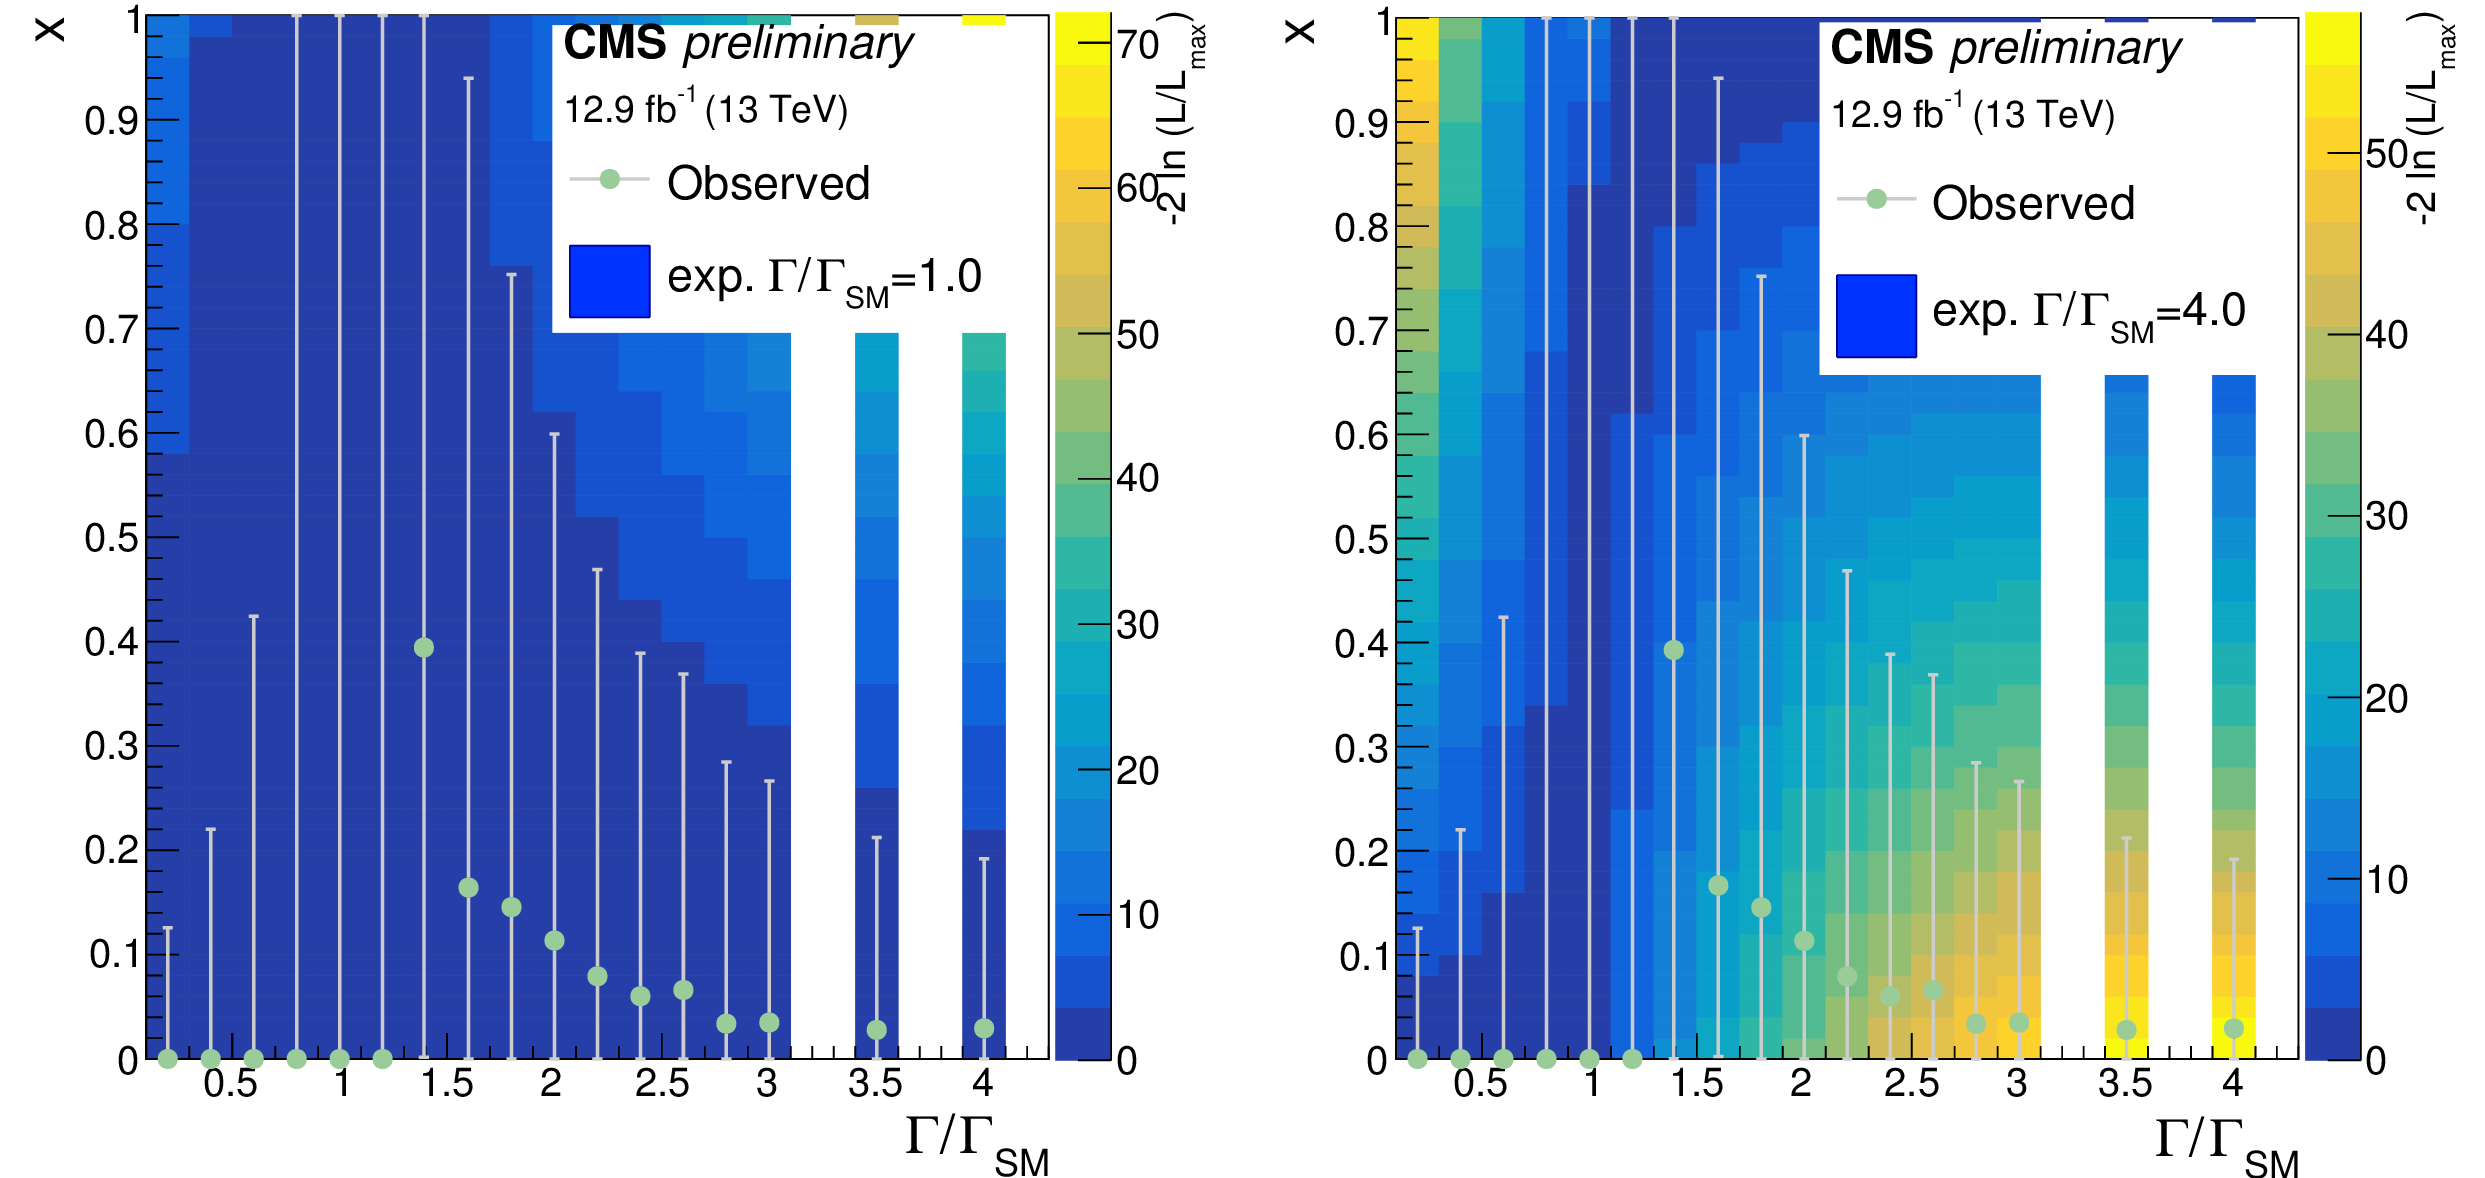
Figure 4:
Scan of the likelihood as function of $x$ (the fraction of the alternative width hypothesis) for different top quark width hypothesis. The plot on the left (right) displays the scan expected when $\Gamma _\mathrm{ t } =\Gamma _{\rm SM}$ ($\Gamma _\mathrm{ t } =4 \Gamma _{\rm SM}$) pseudo-data is used. In both cases the result of the fit to $x$ in the data, after profiling $\mu $, is overlaid for comparison. |
png pdf |
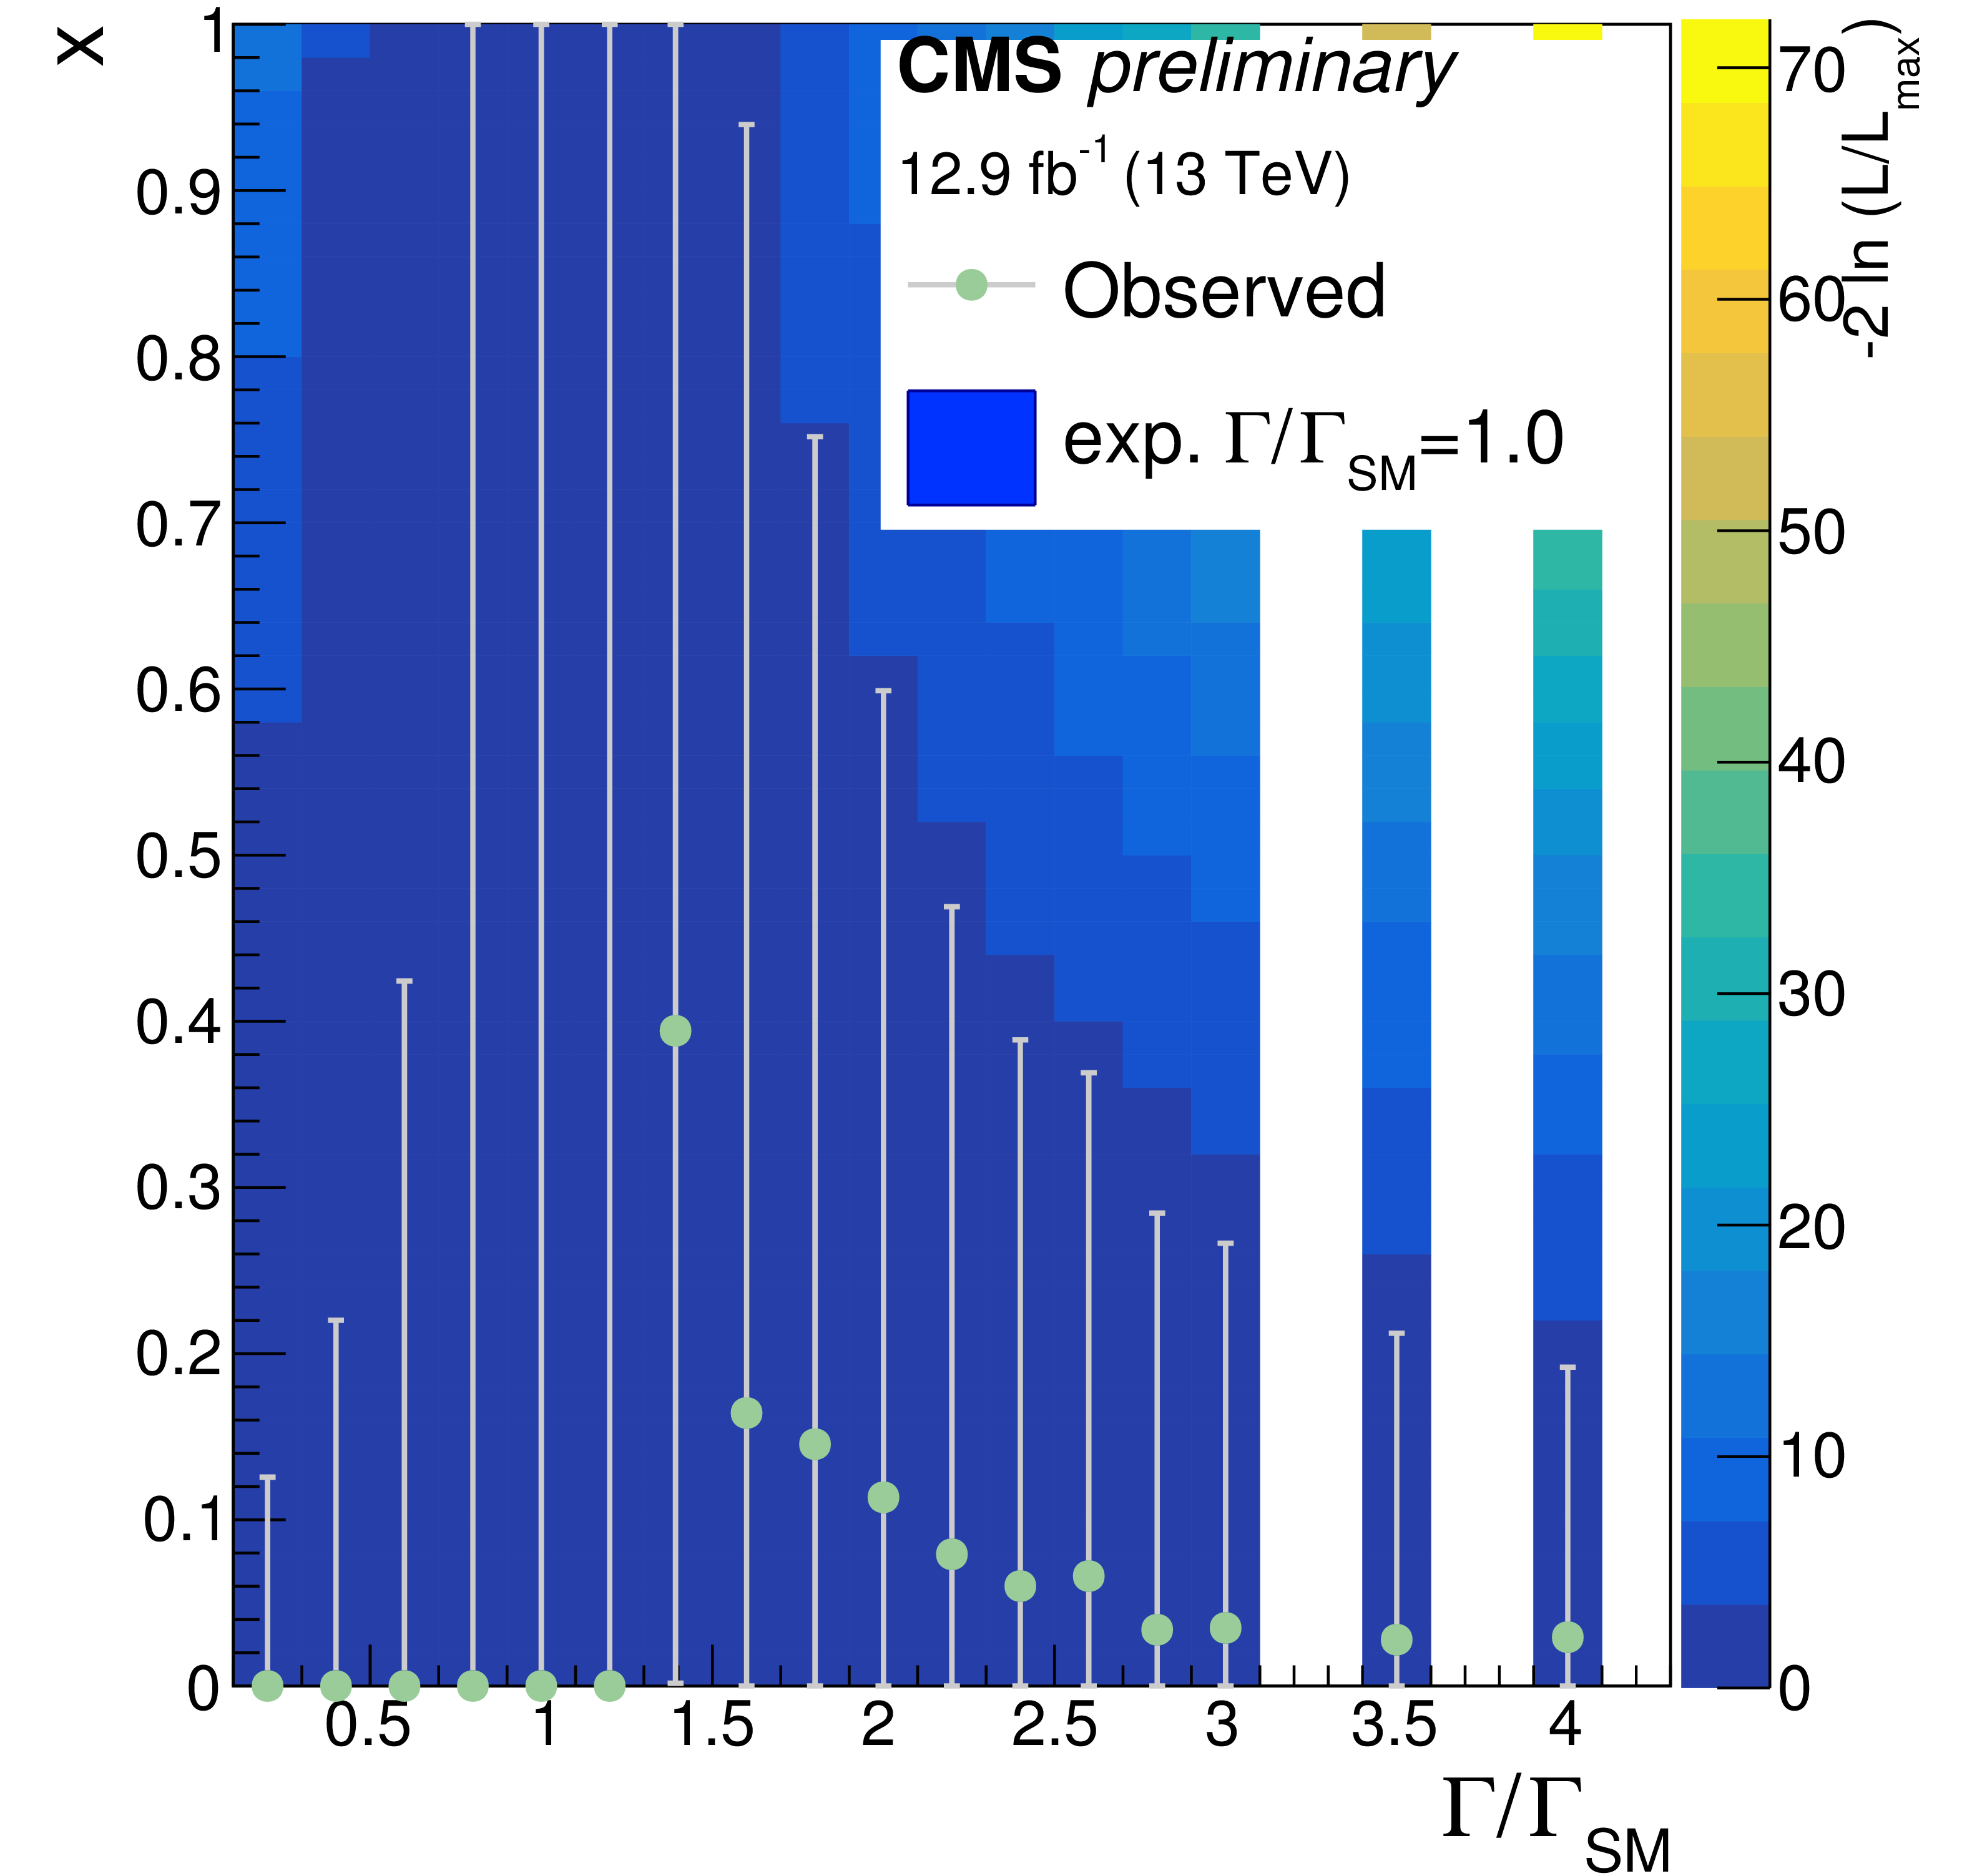
Figure 4-a:
Scan of the likelihood as function of $x$ (the fraction of the alternative width hypothesis) for different top quark width hypothesis. The plot displays the scan expected when $\Gamma _\mathrm{ t } =\Gamma _{\rm SM}$ pseudo-data is used. The result of the fit to $x$ in the data, after profiling $\mu $, is overlaid for comparison. |

png pdf |
Figure 4-b:
Scan of the likelihood as function of $x$ (the fraction of the alternative width hypothesis) for different top quark width hypothesis. The plot displays the scan expected when $\Gamma _\mathrm{ t } =4 \Gamma _{\rm SM}$ pseudo-data is used. The result of the fit to $x$ in the data, after profiling $\mu $, is overlaid for comparison. |

png pdf |
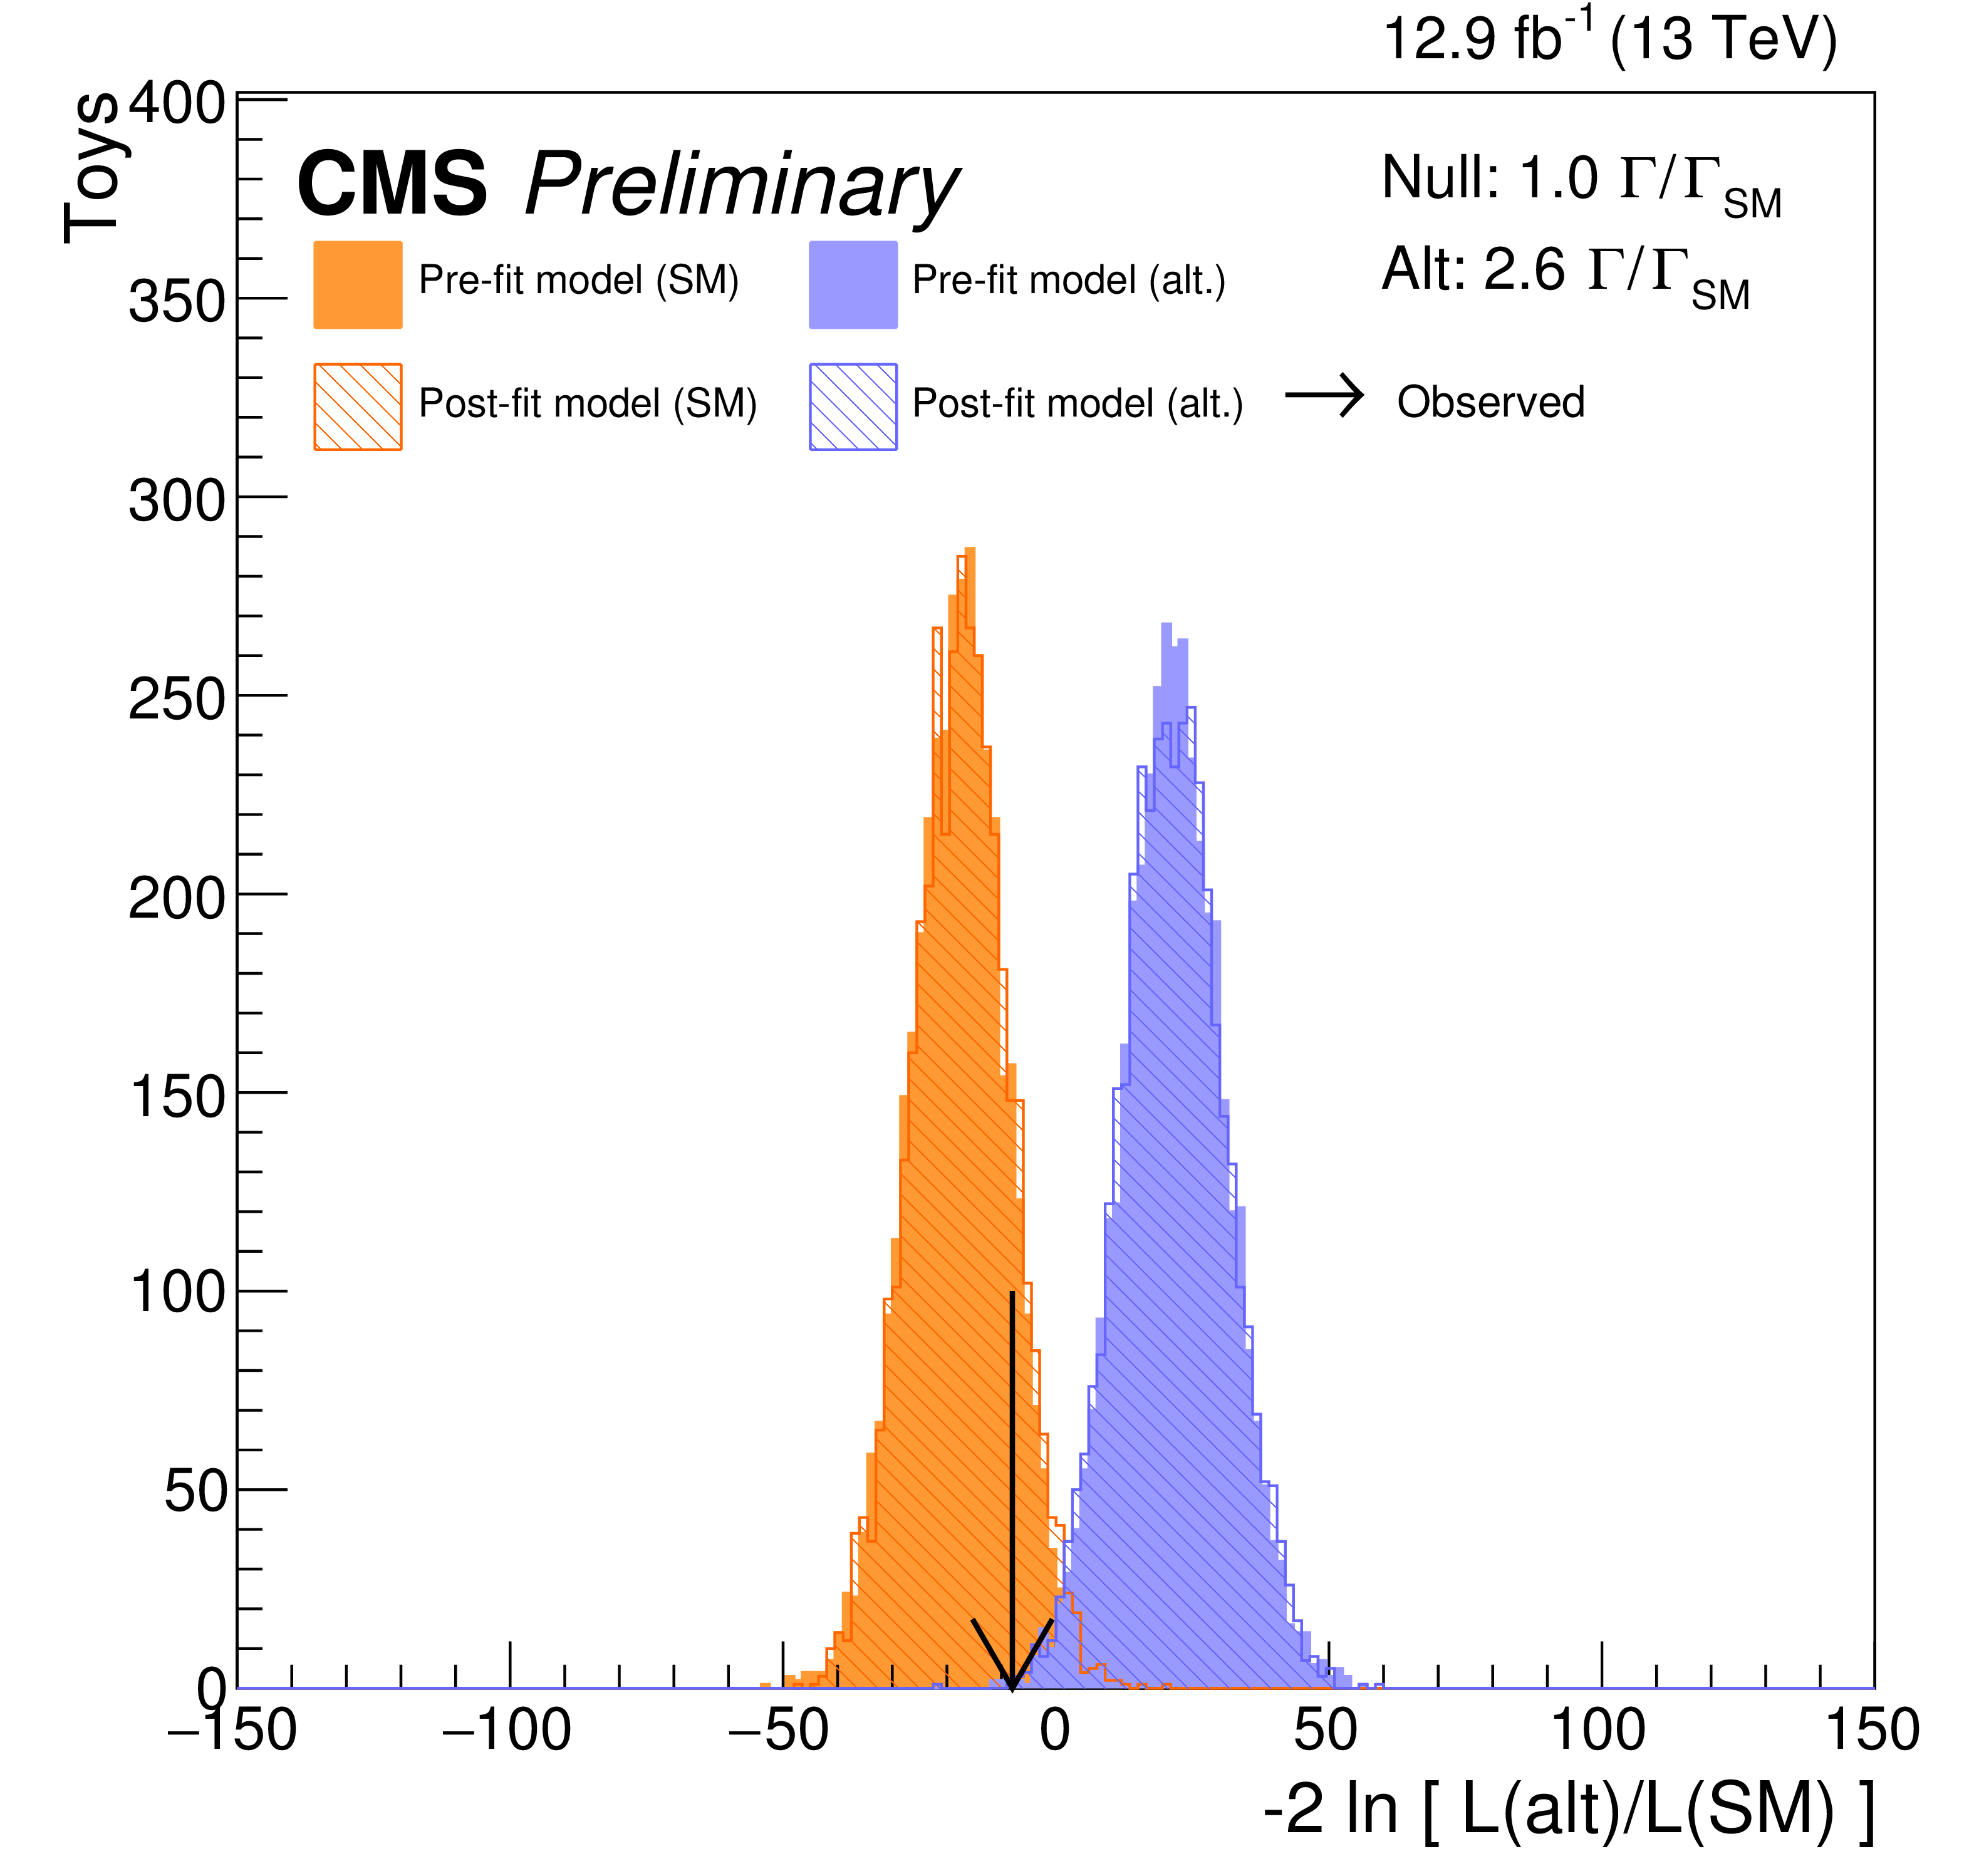
Figure 5:
Distributions of the test statistic for pseudoexperiments run on the full with two different alternate hypotheses assuming $\Gamma _t = 0.2 \times \Gamma _{\rm SM}$ (left) and $\Gamma _t = 2.6 \times \Gamma _{\rm SM}$ (right). In both cases the distributions are shown when obtained with the pre-fit model at fixed signal strength and when obtained with the post-fit model after profiling the signal strength. The values of the test statistics observed in the data are represented by arrows. In both hypotheses, $m_\mathrm{ t } = $ 172.5 GeV is assumed. |

png pdf |
Figure 5-a:
Distribution of the test statistic for pseudoexperiments run on the full with two different alternate hypotheses assuming $\Gamma _t = 0.2 \times \Gamma _{\rm SM}$. The distribution is shown when obtained with the pre-fit model at fixed signal strength and when obtained with the post-fit model after profiling the signal strength. The values of the test statistics observed in the data are represented by arrows. In both hypotheses, $m_\mathrm{ t } = $ 172.5 GeV is assumed. |
png pdf |
Figure 5-b:
Distribution of the test statistic for pseudoexperiments run on the full with two different alternate hypotheses assuming $\Gamma _t = 2.6 \times \Gamma _{\rm SM}$. The distribution is shown when obtained with the pre-fit model at fixed signal strength and when obtained with the post-fit model after profiling the signal strength. The values of the test statistics observed in the data are represented by arrows. In both hypotheses, $m_\mathrm{ t } = $ 172.5 GeV is assumed. |

png pdf |
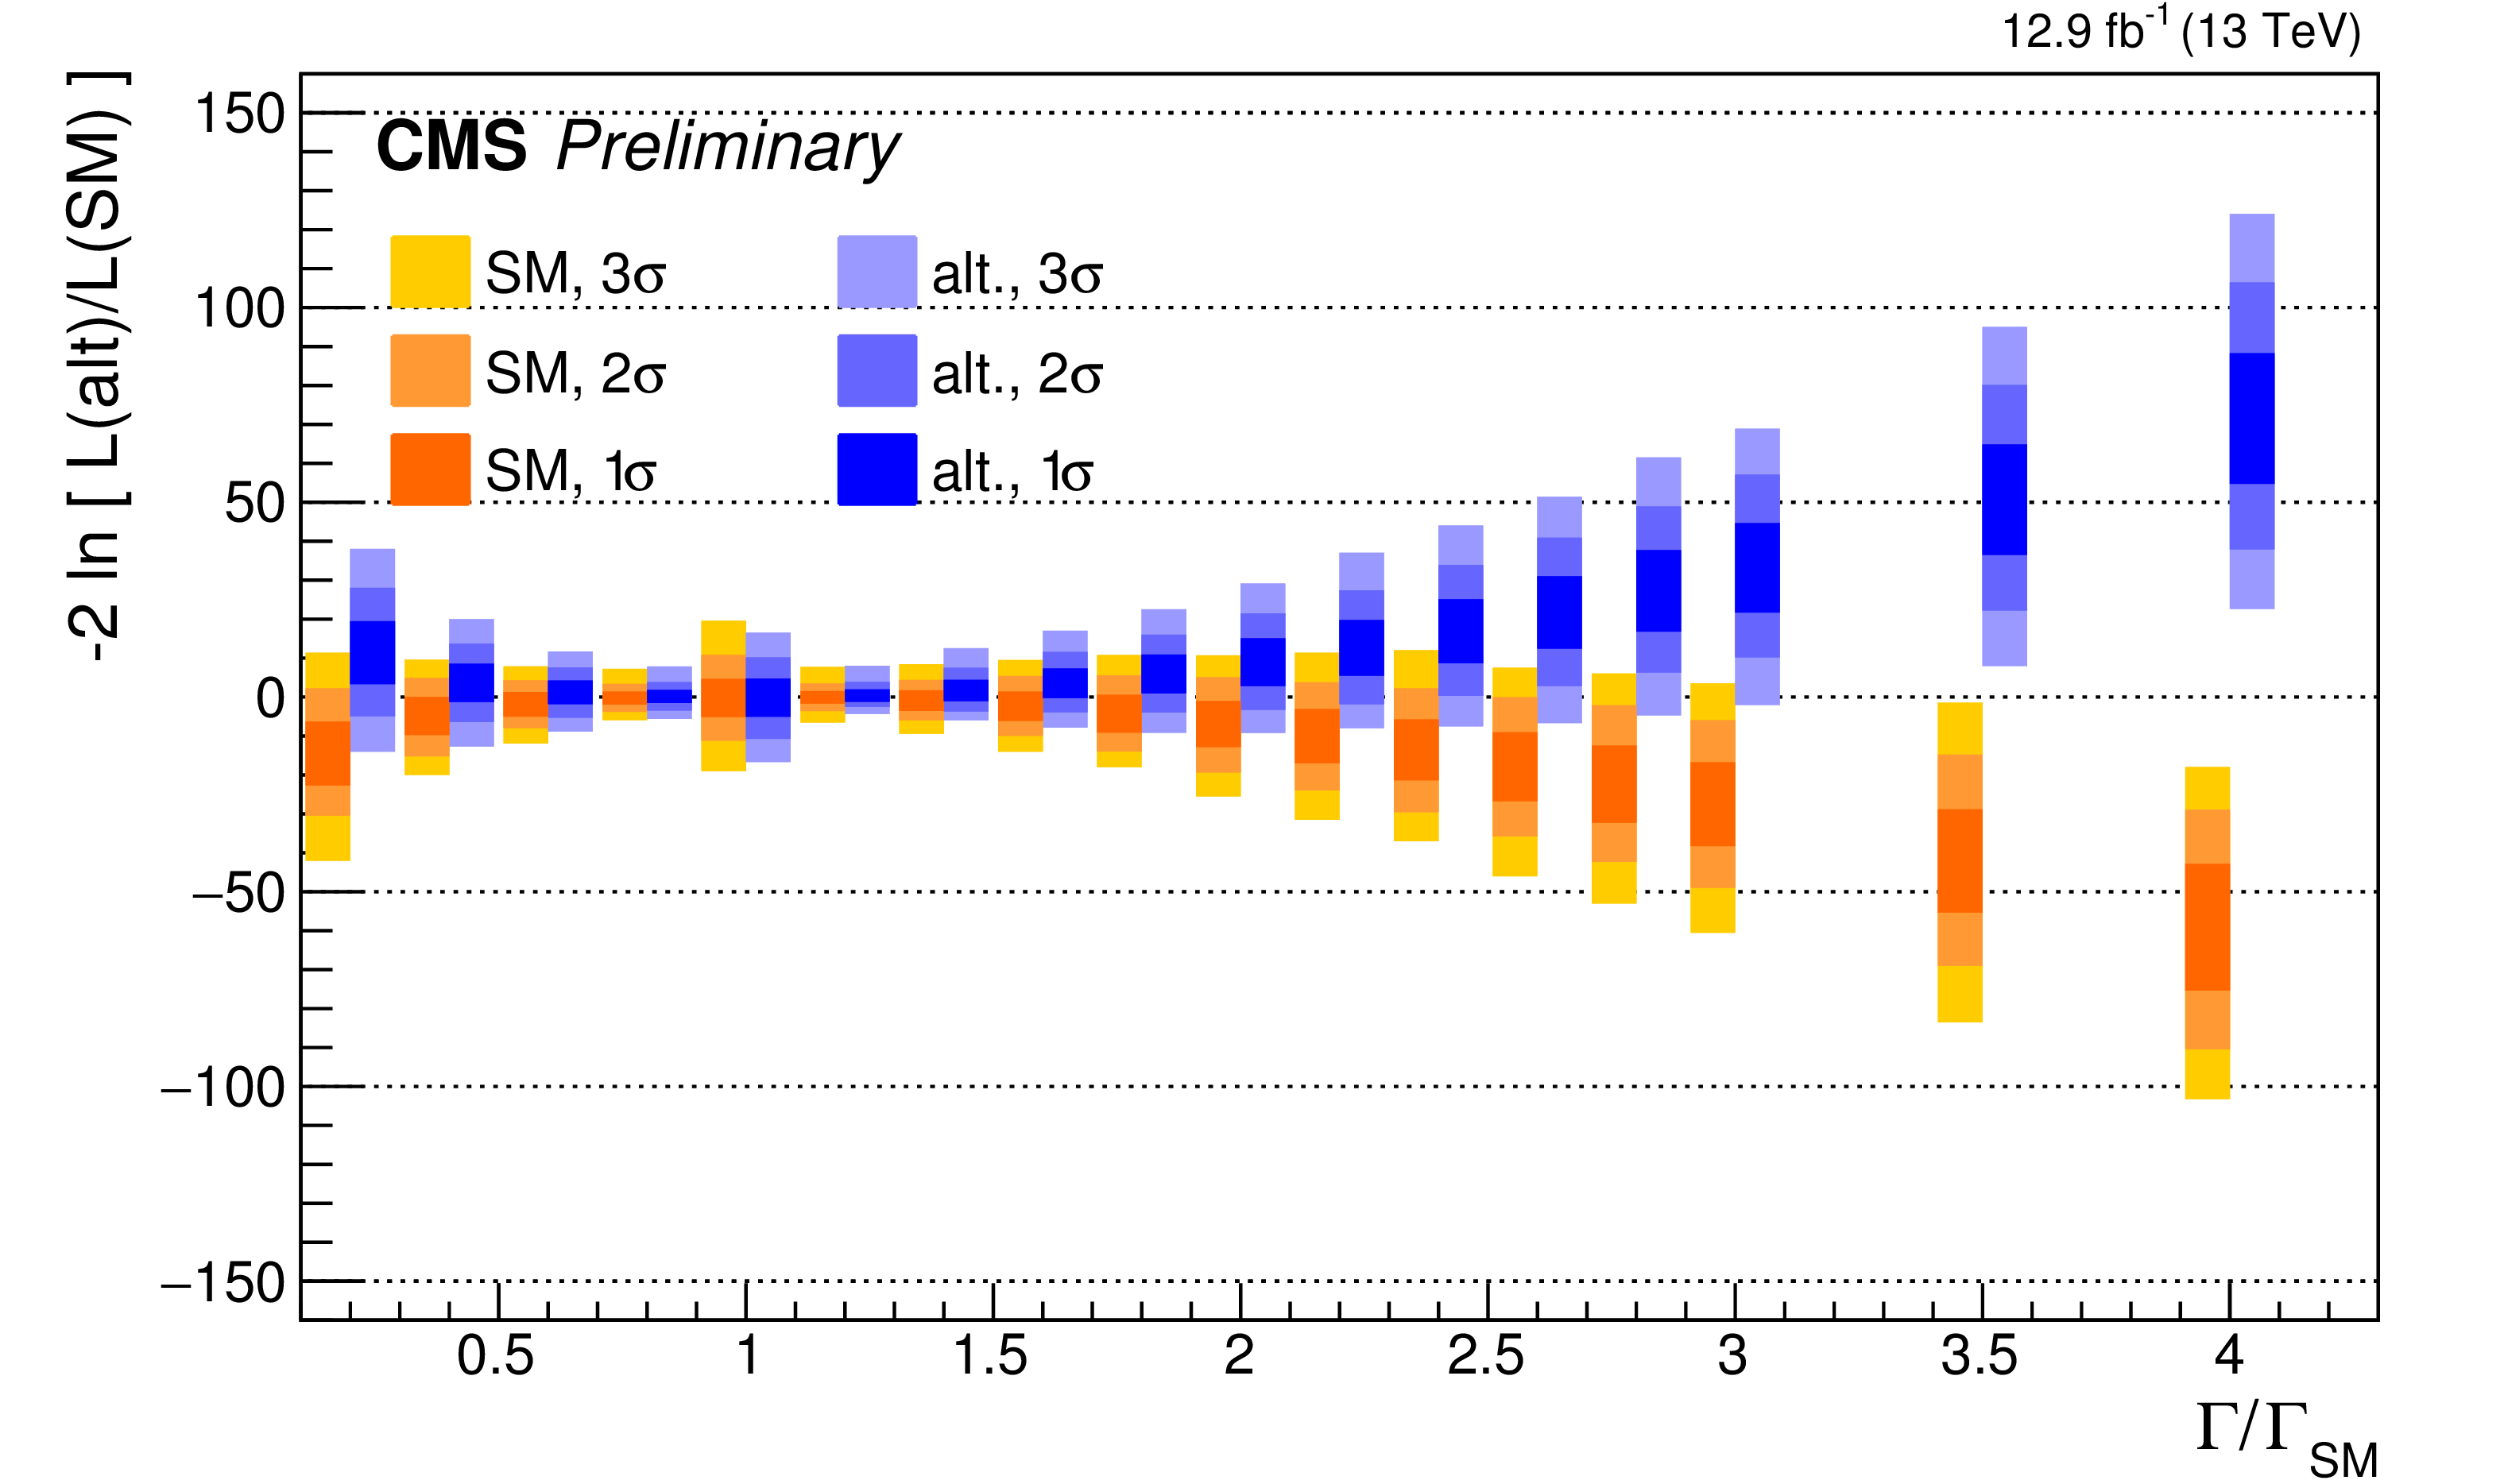
Figure 6:
Evolution of the quantiles of the distributions of the test statistics, as a function of the top quark width. The 68%, 95% and 99% CL quantiles are represented by different shades of orange (blue) for the SM (alternative) hypothesis. The plot on the top (bottom) shows the quantiles obtained with the pre-fit (post-fit) model. The values of the test statistics observed in data are represented by the black points in the bottom plot. |
png pdf |
Figure 6-a:
Evolution of the quantiles of the distributions of the test statistics, as a function of the top quark width. The 68%, 95% and 99% CL quantiles are represented by different shades of orange (blue) for the SM (alternative) hypothesis. The plot shows the quantiles obtained with the pre-fit model. |

png pdf |
Figure 6-b:
Evolution of the quantiles of the distributions of the test statistics, as a function of the top quark width. The 68%, 95% and 99% CL quantiles are represented by different shades of orange (blue) for the SM (alternative) hypothesis. The plot shows the quantiles obtained with the post-fit model. The values of the test statistics observed in data are represented by the black points in the bottom plot. |

png pdf |
Figure 7:
Evolution of the CL$_{\rm S}$ as a function of the top quark width. The derived limits at the 95% (99%) confidence level are represented as the intersection of the fits to the line at CL$_{\rm S}= $ 0.05 (0.01). The expectations from both the pre-fit and post-fit models are represented by means of a best-fit spline curve. |
| Summary |
| We have presented limits on the top quark width using 12.9 fb$^{-1}$ of proton-proton collision data at $\sqrt{s} = $ 13 TeV collected by the CMS experiment. Using $\mathrm{ t \bar{t} }$ and $\mathrm{t }\mathrm{ W }$ decay events with two charged leptons in the final state, we reconstruct the $M_{\ell\mathrm{b }}$ observable inclusively using up to two jets identified as stemming from the fragmentation and hadronization of a $\mathrm{b }$ quark. The observable is fit for deviations of the width with respect to the SM prediction. Different event categories are included in the fit to improve the sensitivity of the measurement and partially constraint some of the uncertainties. Binary hypothesis tests are then used to bound an SM-like top quark width to 0.6 $ \leq \Gamma_\mathrm{t } \leq $ 2.5 GeV at the 95% CL, with corresponding expected bounds of 0.6 $ \leq \Gamma_\mathrm{t } \leq $ 2.4 GeV for $m_\mathrm{t }= $ 172.5 GeV. This constitutes the first such direct measurement at the LHC and the most precise direct bound of the top quark width performed to date. |
| References | ||||
| 1 | CMS Collaboration | Measurement of the top quark mass using proton-proton data at $ \sqrt{s}= $ 7 and 8 TeV | PRD 93 (Apr, 2016) 072004 | |
| 2 | C. P. Yuan | A new method to detect a heavy top quark at the Tevatron | PRD 41 (1990) 42 | |
| 3 | D0 Collaboration | An improved determination of the width of the top quark | PRD85 (2012) 091104 | 1201.4156 |
| 4 | CMS Collaboration | Measurement of the ratio $ \mathcal B(\mathrm{t } \to \mathrm{ W }\mathrm{b })/\mathcal B(\mathrm{t } \to \mathrm{ W }\mathrm{c}) $ in $ \mathrm{ p }\mathrm{ p } $ collisions at $ \sqrt{s} $ = 8 TeV | Phys. Lett.B 736 (2014) 33 | CMS-TOP-12-035 1404.2292 |
| 5 | CDF Collaboration | Direct measurement of the total decay width of the top quark | PRL 111 (2013), no. 20, 202001 | 1308.4050 |
| 6 | CMS Collaboration | CMS luminosity measurement for the 2015 data taking period | CMS-PAS-LUM-15-001 | CMS-PAS-LUM-15-001 |
| 7 | CMS Collaboration | The CMS experiment at the CERN LHC | JINST 3 (2008) S08004 | CMS-00-001 |
| 8 | M. Czakon and A. Mitov | Top++: a program for the calculation of the top-pair cross-section at hadron colliders | CPC 185 (2014) 2930 | 1112.5675 |
| 9 | N. Kidonakis | Top quark production | in Proceedings, Helmholtz International Summer School on Physics of Heavy Quarks and Hadrons (HQ 2013): JINR, Dubna, Russia, 2013 | 1311.0283 |
| 10 | S. Frixione, P. Nason, and C. Oleari | Matching NLO QCD computations with parton shower simulations: the POWHEG method | JHEP 11 (2007) 070 | 0709.2092 |
| 11 | S. Alioli, P. Nason, C. Oleari, and E. Re | A general framework for implementing NLO calculations in shower Monte Carlo programs: the POWHEG BOX | JHEP 06 (2010) 043 | 1002.2581 |
| 12 | E. Re | Single-top Wt-channel production matched with parton showers using the POWHEG method | EPJC 71 (2011) 1547 | 1009.2450 |
| 13 | T. Sj\"ostrand, S. Mrenna, and P. Skands | PYTHIA 6.4 physics and manual | JHEP 05 (2006) 026 | hep-ph/0603175 |
| 14 | T. Sj\"ostrand et al. | An introduction to PYTHIA 8.2 | CPC 191 (2015) 159 | 1410.3012 |
| 15 | F. Demartin et al. | The impact of PDF and alphas uncertainties on Higgs Production in gluon fusion at hadron colliders | PRD 82 (2010) | 1004.0962 |
| 16 | CMS Collaboration | Underlying event tunes and double parton scattering | CDS | |
| 17 | P. Skands, S. Carrazza, and J. Rojo | Tuning PYTHIA 8.1: the Monash 2013 Tune | EPJC 74 (2014), no. 8 | 1404.5630 |
| 18 | CMS Collaboration | Measurement of the top quark pair production cross section in proton-proton collisions at $ \sqrt{s} = $ 13 TeV | PRL 116 (2016) | CMS-TOP-15-003 1510.05302 |
| 19 | J. Allison et al. | Geant4 developments and applications | IEEE Trans. Nucl. Sci. 53 (2006) 270 | |
| 20 | CMS Collaboration | Identification of $ \mathrm{b } $ quark jets at the CMS Experiment in the LHC Run 2 | CMS-PAS-BTV-15-001 | CMS-PAS-BTV-15-001 |
| 21 | CMS Collaboration | Measurement of particle level differential ttbar cross sections in the dilepton channel at $ \sqrt{s} $ = 13 TeV | CMS-PAS-TOP-16-007 | CMS-PAS-TOP-16-007 |
| 22 | CMS Collaboration | Measurement of the inclusive and differential $ \mathrm{ t \bar{t} } $ production cross sections in lepton + jets final states at 13 TeV | CMS-PAS-TOP-16-008 | CMS-PAS-TOP-16-008 |
| 23 | CMS Collaboration | Measurement of the differential cross section for $ \mathrm{t \bar t} $ production in the dilepton final state at $ \sqrt{s}= $ 13 TeV | CMS-PAS-TOP-16-011 | CMS-PAS-TOP-16-011 |
| 24 | CMS Collaboration | Measurement of the top-quark mass in the $ \mathrm{ t \bar{t} } $ dileptonic channel using the $ M_{\mathrm{b },\ell} $, $ M_{T2} $, and $ M_{\mathrm{b }\ell\nu} $ observables | CMS-PAS-TOP-15-008 | CMS-PAS-TOP-15-008 |
| 25 | A. Denner, S. Dittmaier, S. Kallweit, and S. Pozzorini | NLO QCD corrections to $ \mathrm{ W }\mathrm{ W }\mathrm{b }\mathrm{b } $ production at hadron colliders | PRL 106 (2011) 052001 | 1012.3975 |
| 26 | G. Bevilacqua et al. | Complete off-shell effects in top quark pair hadroproduction with leptonic decay at next-to-leading order | JHEP 02 (2011) 083 | 1012.4230 |
| 27 | A. Denner, S. Dittmaier, S. Kallweit, and S. Pozzorini | NLO QCD corrections to off-shell top-antitop production with leptonic decays at hadron colliders | JHEP 10 (2012) 110 | 1207.5018 |
| 28 | F. Cascioli, S. Kallweit, P. Maierhöfer, and S. Pozzorini | A unified NLO description of top-pair and associated $ \mathrm{ W }\mathrm{t } $ production | EPJC 74 (2014), no. 3 | 1312.0546 |
| 29 | R. Frederix | Top Quark Induced Backgrounds to Higgs Production in the $ \mathrm{ W }\mathrm{ W }^{(*)}\to \ell\ell\nu\nu $ Decay Channel at Next-to-Leading-Order in QCD | PRL 112 (2014), no. 8, 082002 | 1311.4893 |
| 30 | G. Heinrich et al. | NLO QCD corrections to $ \mathrm{ W }^{+}\mathrm{ W }^{-}b\bar{b} $ production with leptonic decays in the light of top quark mass and asymmetry measurements | JHEP 06 (2014) 158 | 1312.6659 |
| 31 | M. V. Garzelli, A. Kardos, and Z. Trócsanyi | Hadroproduction of $ \mathrm{ W }^{+} \mathrm{ W }^{-} \mathrm{b } \bar{\mathrm{b }} $ at NLO accuracy matched with shower Monte Carlo programs | JHEP 08 (2014) 069 | 1405.5859 |
| 32 | J. M. Campbell, R. K. Ellis, P. Nason, and E. Re | Top-pair production and decay at NLO matched with parton showers | JHEP 04 (2015) 114 | 1412.1828 |
| 33 | CMS Collaboration | Performance of photon reconstruction and identification with the CMS d | JINST 10 (2015) P08010 | CMS-EGM-14-001 1502.02702 |
| 34 | CMS Collaboration | Performance of muon identification in $ \mathrm{ p }\mathrm{ p } $ collisions at $ \sqrt{s}= $ 7 TeV | CDS | |
| 35 | CMS Collaboration | Performance of CMS muon reconstruction in $ \mathrm{ p }\mathrm{ p } $ collisions at $ \sqrt{s}= $ 7 TeV | CDS | |
| 36 | CMS Collaboration | Measurement of the $ \mathrm{ \mathrm{ t \bar{t} } } $ production cross section in the $ \mathrm{ e }\mu $ channel in proton-proton collisions at $ \sqrt{s} = $ 7 and 8 TeV | JHEP 08 (2016) 029 | CMS-TOP-13-004 1603.02303 |
| 37 | CMS Collaboration | Jet energy scale and resolution in the CMS experiment in pp collisions at 8 TeV | Submitted to: JINST (2016) | CMS-JME-13-004 1607.03663 |
| 38 | CMS Collaboration | Measurement of the differential cross section for top quark pair production in $ \mathrm{ p }\mathrm{ p } $ collisions at $ \sqrt{s} = 8 $ TeV | EPJC 75 (2015), no. 11, 542 | CMS-TOP-12-028 1505.04480 |
| 39 | S. Frixione et al. | Single-top hadroproduction in association with a $ \mathrm{ W } $ boson | JHEP 07 (2008) 029 | 0805.3067 |
| 40 | A. S. Belyaev, E. E. Boos, and L. V. Dudko | Single top quark at future hadron colliders: complete signal and background study | PRD 59 (1999) 075001 | hep-ph/9806332 |
| 41 | C. D. White, S. Frixione, E. Laenen, and F. Maltoni | Isolating $ \mathrm{ W }\mathrm{t } $ production at the LHC | JHEP 11 (2009) 074 | 0908.0631 |
| 42 | T. M. P. Tait | The $ \mathrm{t }\mathrm{ W } $$ ^{-} $ mode of single top production | PRD 61 (1999) 034001 | hep-ph/9909352 |
| 43 | CMS Collaboration | Combination of standard model Higgs boson searches and measurements of the properties of the new boson with a mass near 125 GeV | CMS-PAS-HIG-13-005 | CMS-PAS-HIG-13-005 |
|
|
Compact Muon Solenoid LHC, CERN |
|

|

|

|

|

|