

Compact Muon Solenoid
LHC, CERN
| CMS-PAS-TOP-18-012 | ||
| Measurement of the shape of the b quark fragmentation function using charmed mesons produced inside b jets from $\mathrm{t}\bar{\mathrm{t}}$ pair decays | ||
| CMS Collaboration | ||
| June 2021 | ||
| Abstract: A determination of the shape parameter of the Lund-Bowler fragmentation function for b quarks is presented. The analysis uses charm mesons produced inside b jets from $\mathrm{t}\bar{\mathrm{t}}$ pair decays in a data sample collected by the CMS experiment at the LHC at $\sqrt{s}= $ 13 TeV, corresponding to an integrated luminosity of 35.9 fb$^{-1}$. Samples of D$^{0}$ and J/$\psi$ mesons are reconstructed from the decays D$^{0} \to$ K$^{\pm} \pi^{\mp}$ and J/$\psi \to \mu^{+}\mu^{-}$ using charged particle track information. The reconstructed mesons are used as proxies for their parent B hadrons. The corresponding $x_{b}$ distributions, where $x_{b}$ is the fraction of the total transverse momentum of the charged constituents of the jet carried by the charm meson, are fitted to extract the value of the fragmentation function shape parameter, $r_{b}$. A value of $r_{b}= $ 0.858 $\pm$ 0.037 (stat) $\pm$ 0.031 (syst) is obtained. This is the first measurement of the b quark fragmentation function in $\mathrm{t}\bar{\mathrm{t}}$ events at the LHC, and significantly improves the experimental constraints on the shape of the function. From a comparison with results at the Z pole in e$^{+}$e$^{-}$ data, no evidence for an environmental dependence of the fragmentation function is observed. | ||
| Links: CDS record (PDF) ; inSPIRE record ; CADI line (restricted) ; | ||
| Figures | |
png pdf |
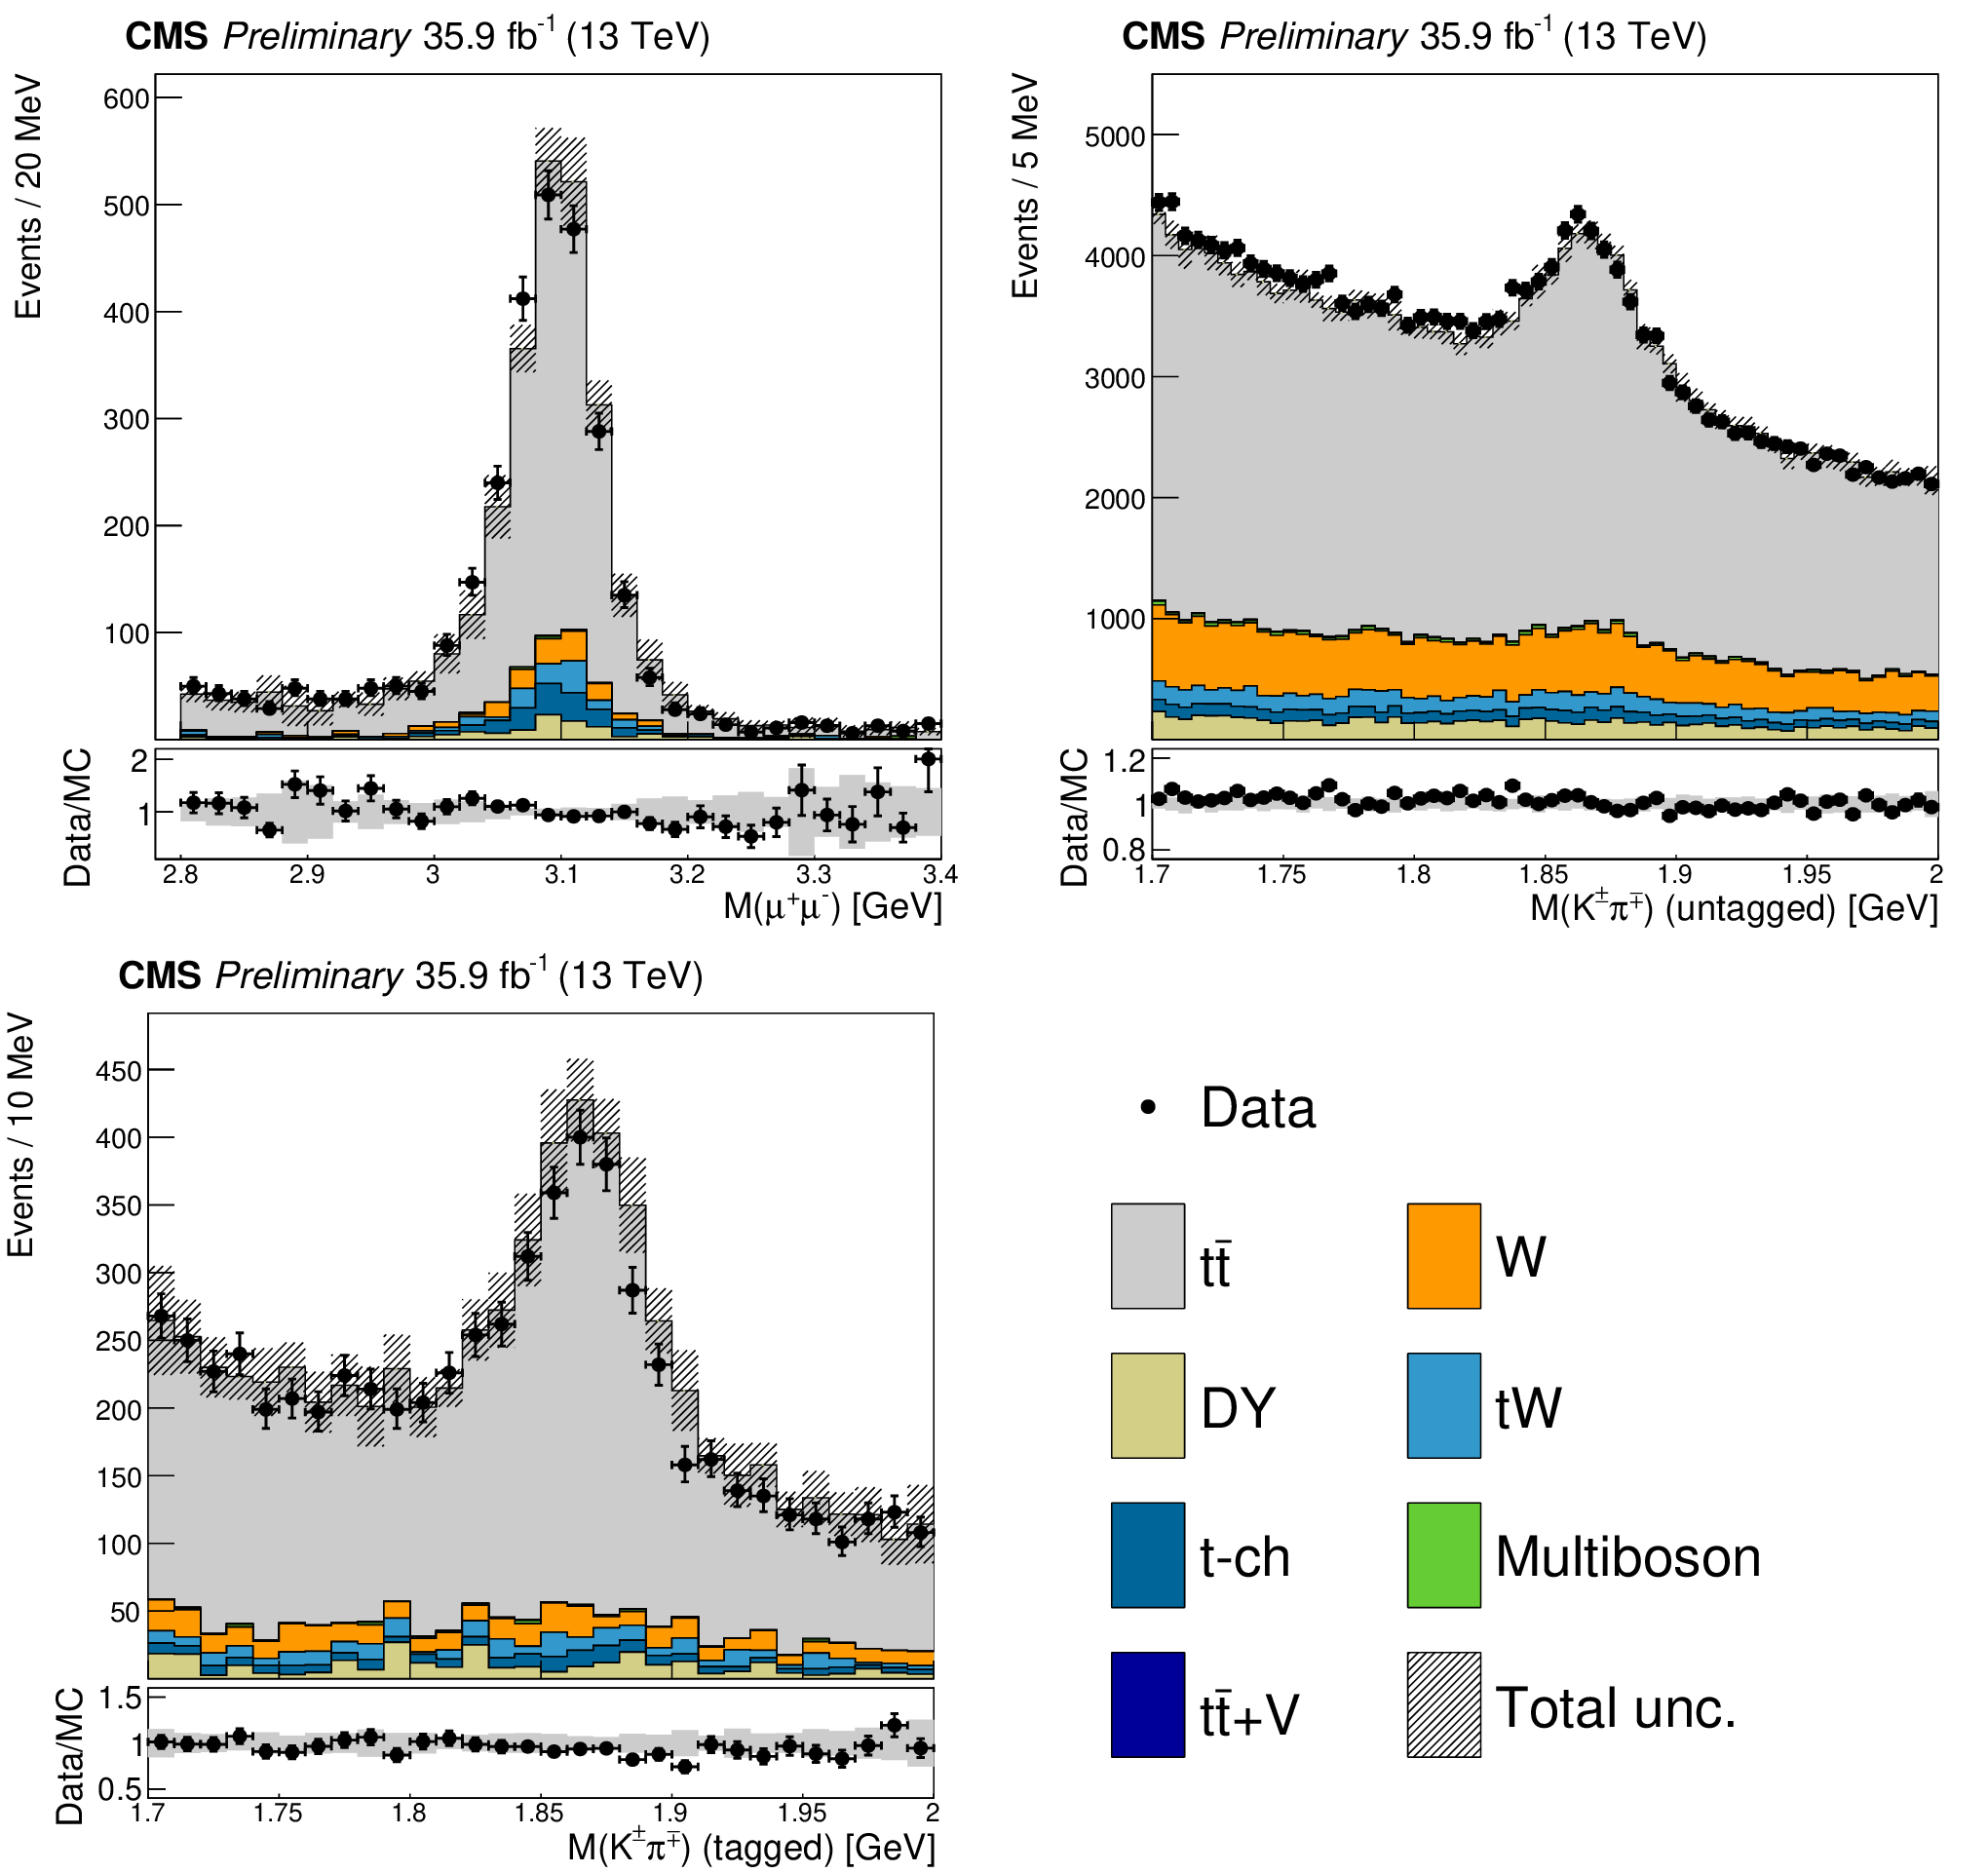
Figure 1:
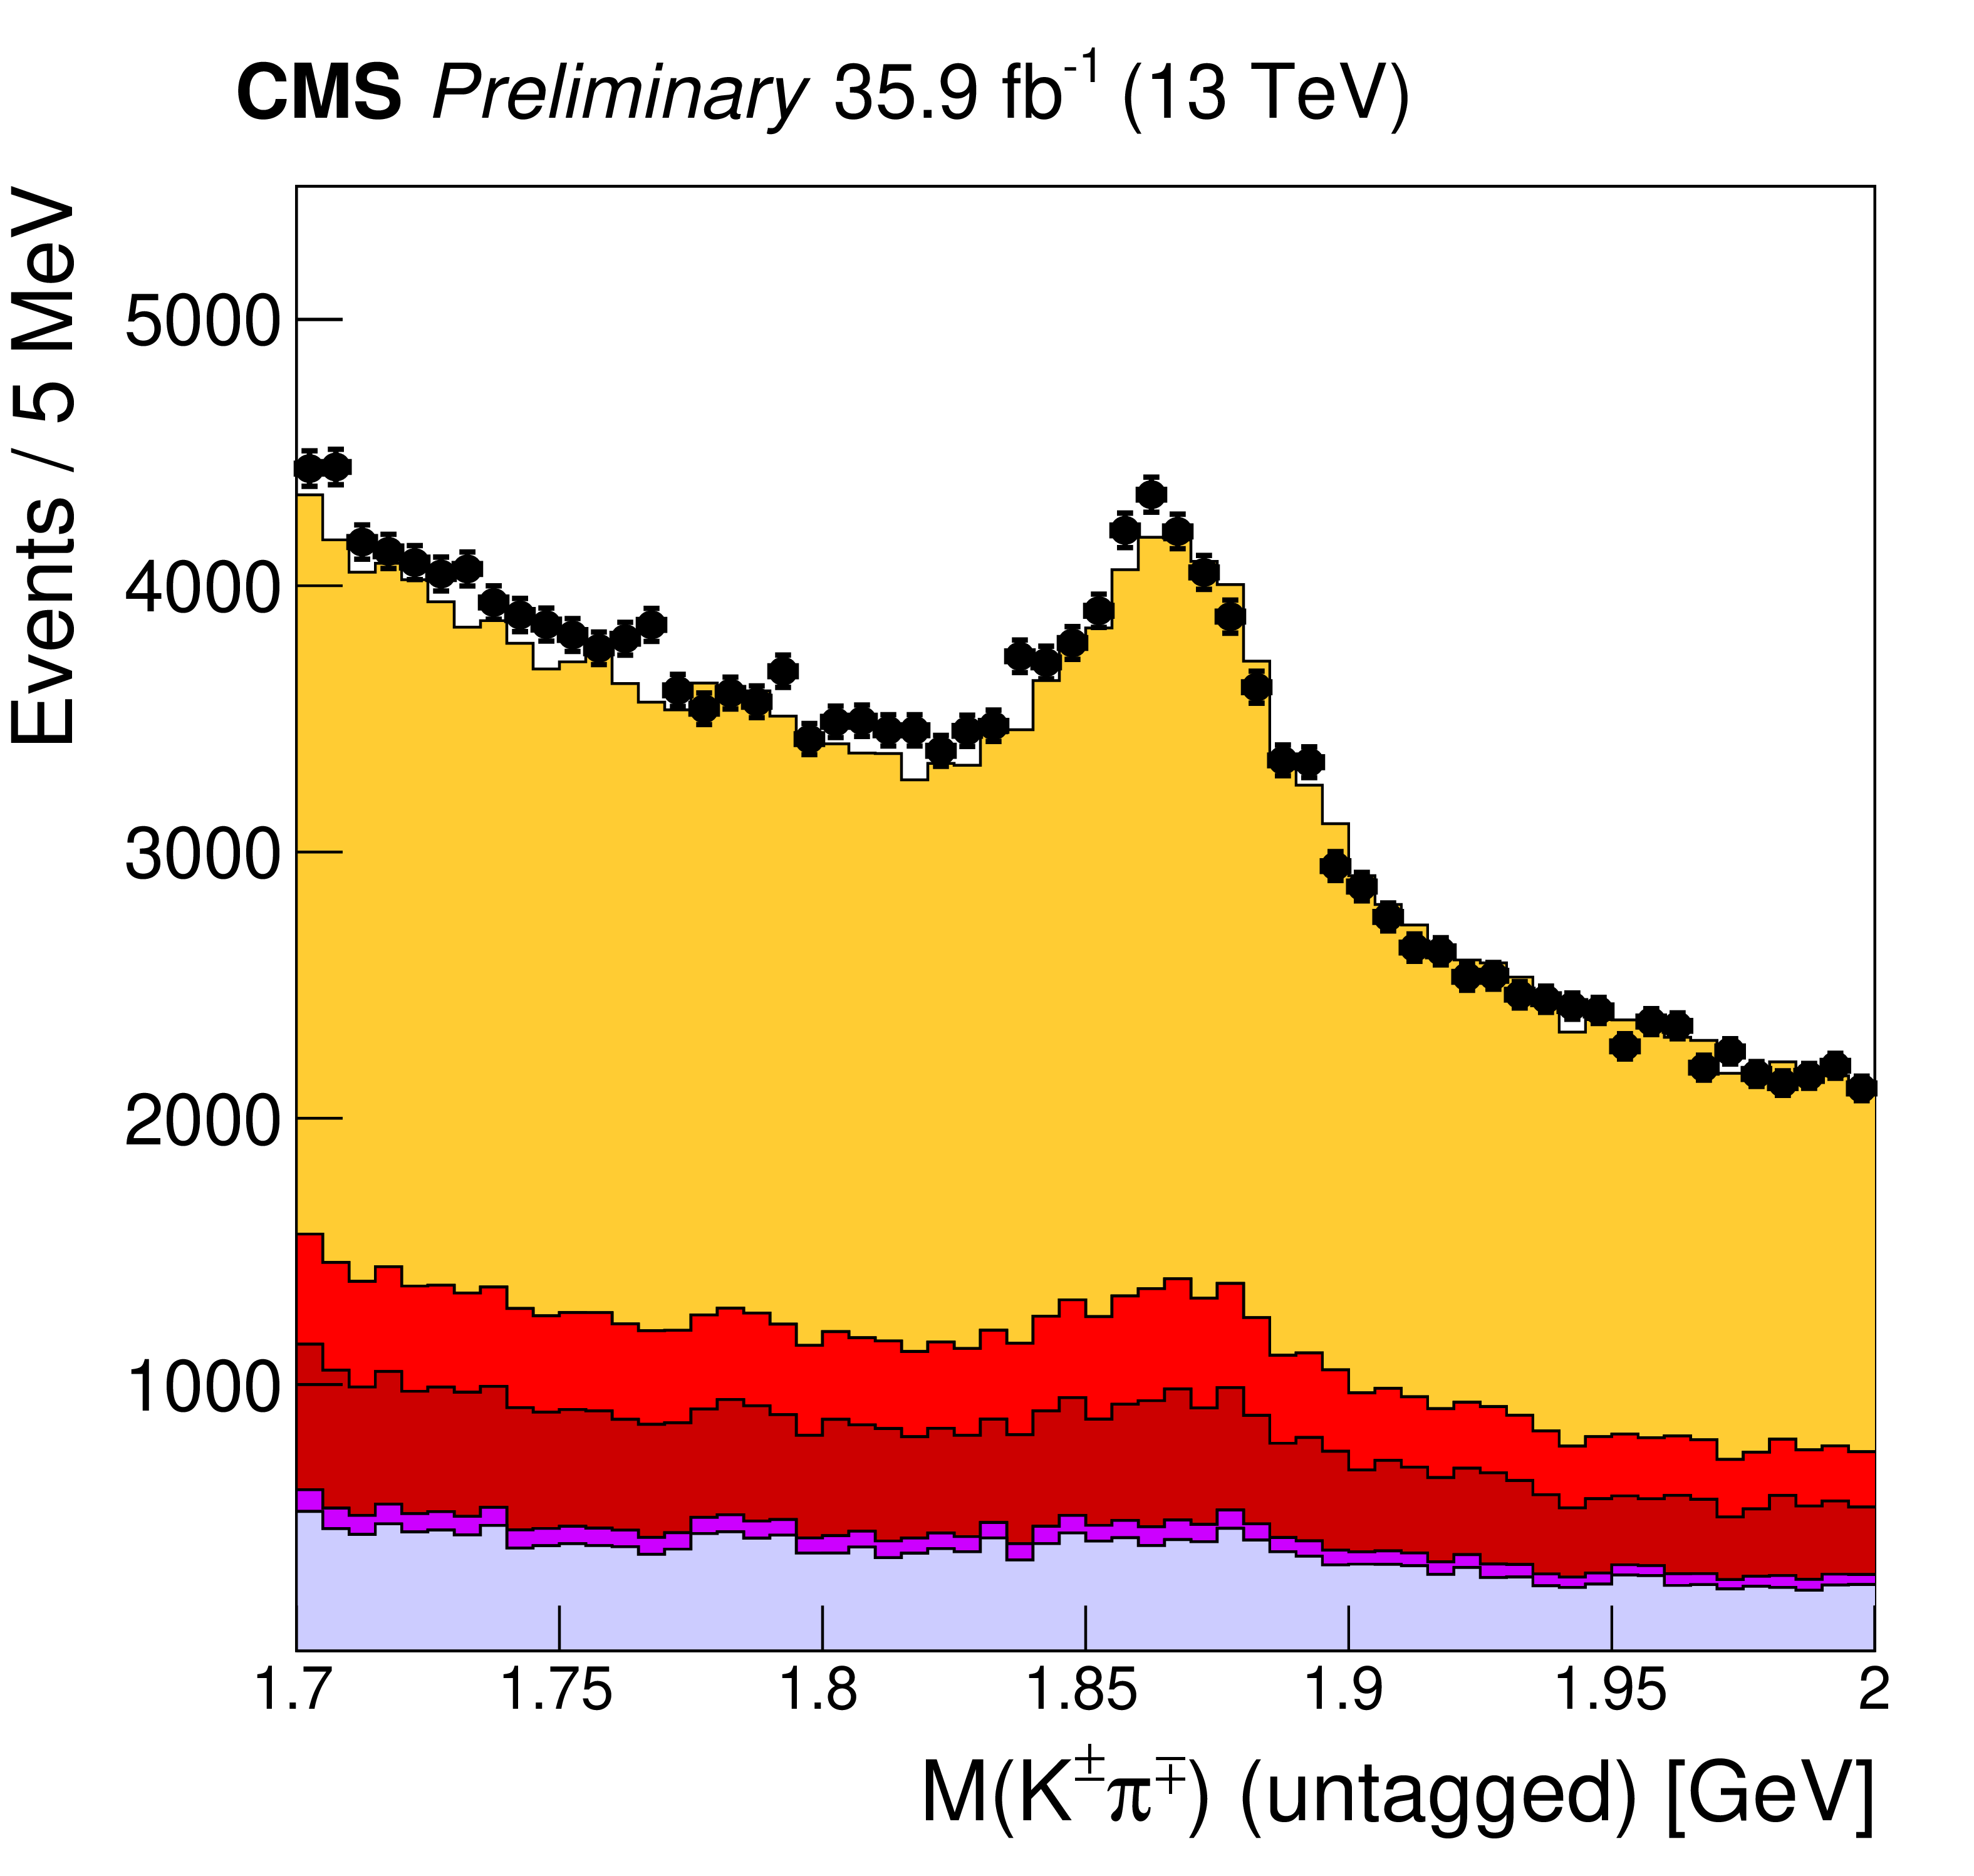
Invariant mass distributions for the initial samples of $\mathrm{J}/\psi$ (upper left), untagged ${\mathrm{D^0}}$ (upper right), and flavor-tagged ${{\mathrm{D^0}} _{\mu}}$ (lower left) meson candidates. The data are compared to the combined background predictions from simulations of ${\mathrm{t} {}\mathrm{\bar{t}}}$ pair production, ${\mathrm{t} {}\mathrm{\bar{t}}}$ pair + vector boson production ( ${\mathrm{t} {}\mathrm{\bar{t}}}$+V, where V is a W or Z boson), single top production in the $t$ channel (t-ch) and $\mathrm{t} \mathrm{W} $ channel ($\mathrm{t} \mathrm{W} $), W boson production (W), Drell-Yan pair production (DY), and $\mathrm{W} \mathrm{W} $, $\mathrm{W} \mathrm{Z} $, and $\mathrm{Z} \mathrm{Z} $ production (multiboson). The lower panels show the ratio of the data to the simulation. The shaded bands correspond to the total uncertainty in the simulation (statistical and systematic). |

png pdf |
Figure 1-a:
Invariant mass distributions for the initial samples of $\mathrm{J}/\psi$ (upper left), untagged ${\mathrm{D^0}}$ (upper right), and flavor-tagged ${{\mathrm{D^0}} _{\mu}}$ (lower left) meson candidates. The data are compared to the combined background predictions from simulations of ${\mathrm{t} {}\mathrm{\bar{t}}}$ pair production, ${\mathrm{t} {}\mathrm{\bar{t}}}$ pair + vector boson production ( ${\mathrm{t} {}\mathrm{\bar{t}}}$+V, where V is a W or Z boson), single top production in the $t$ channel (t-ch) and $\mathrm{t} \mathrm{W} $ channel ($\mathrm{t} \mathrm{W} $), W boson production (W), Drell-Yan pair production (DY), and $\mathrm{W} \mathrm{W} $, $\mathrm{W} \mathrm{Z} $, and $\mathrm{Z} \mathrm{Z} $ production (multiboson). The lower panels show the ratio of the data to the simulation. The shaded bands correspond to the total uncertainty in the simulation (statistical and systematic). |
png pdf |
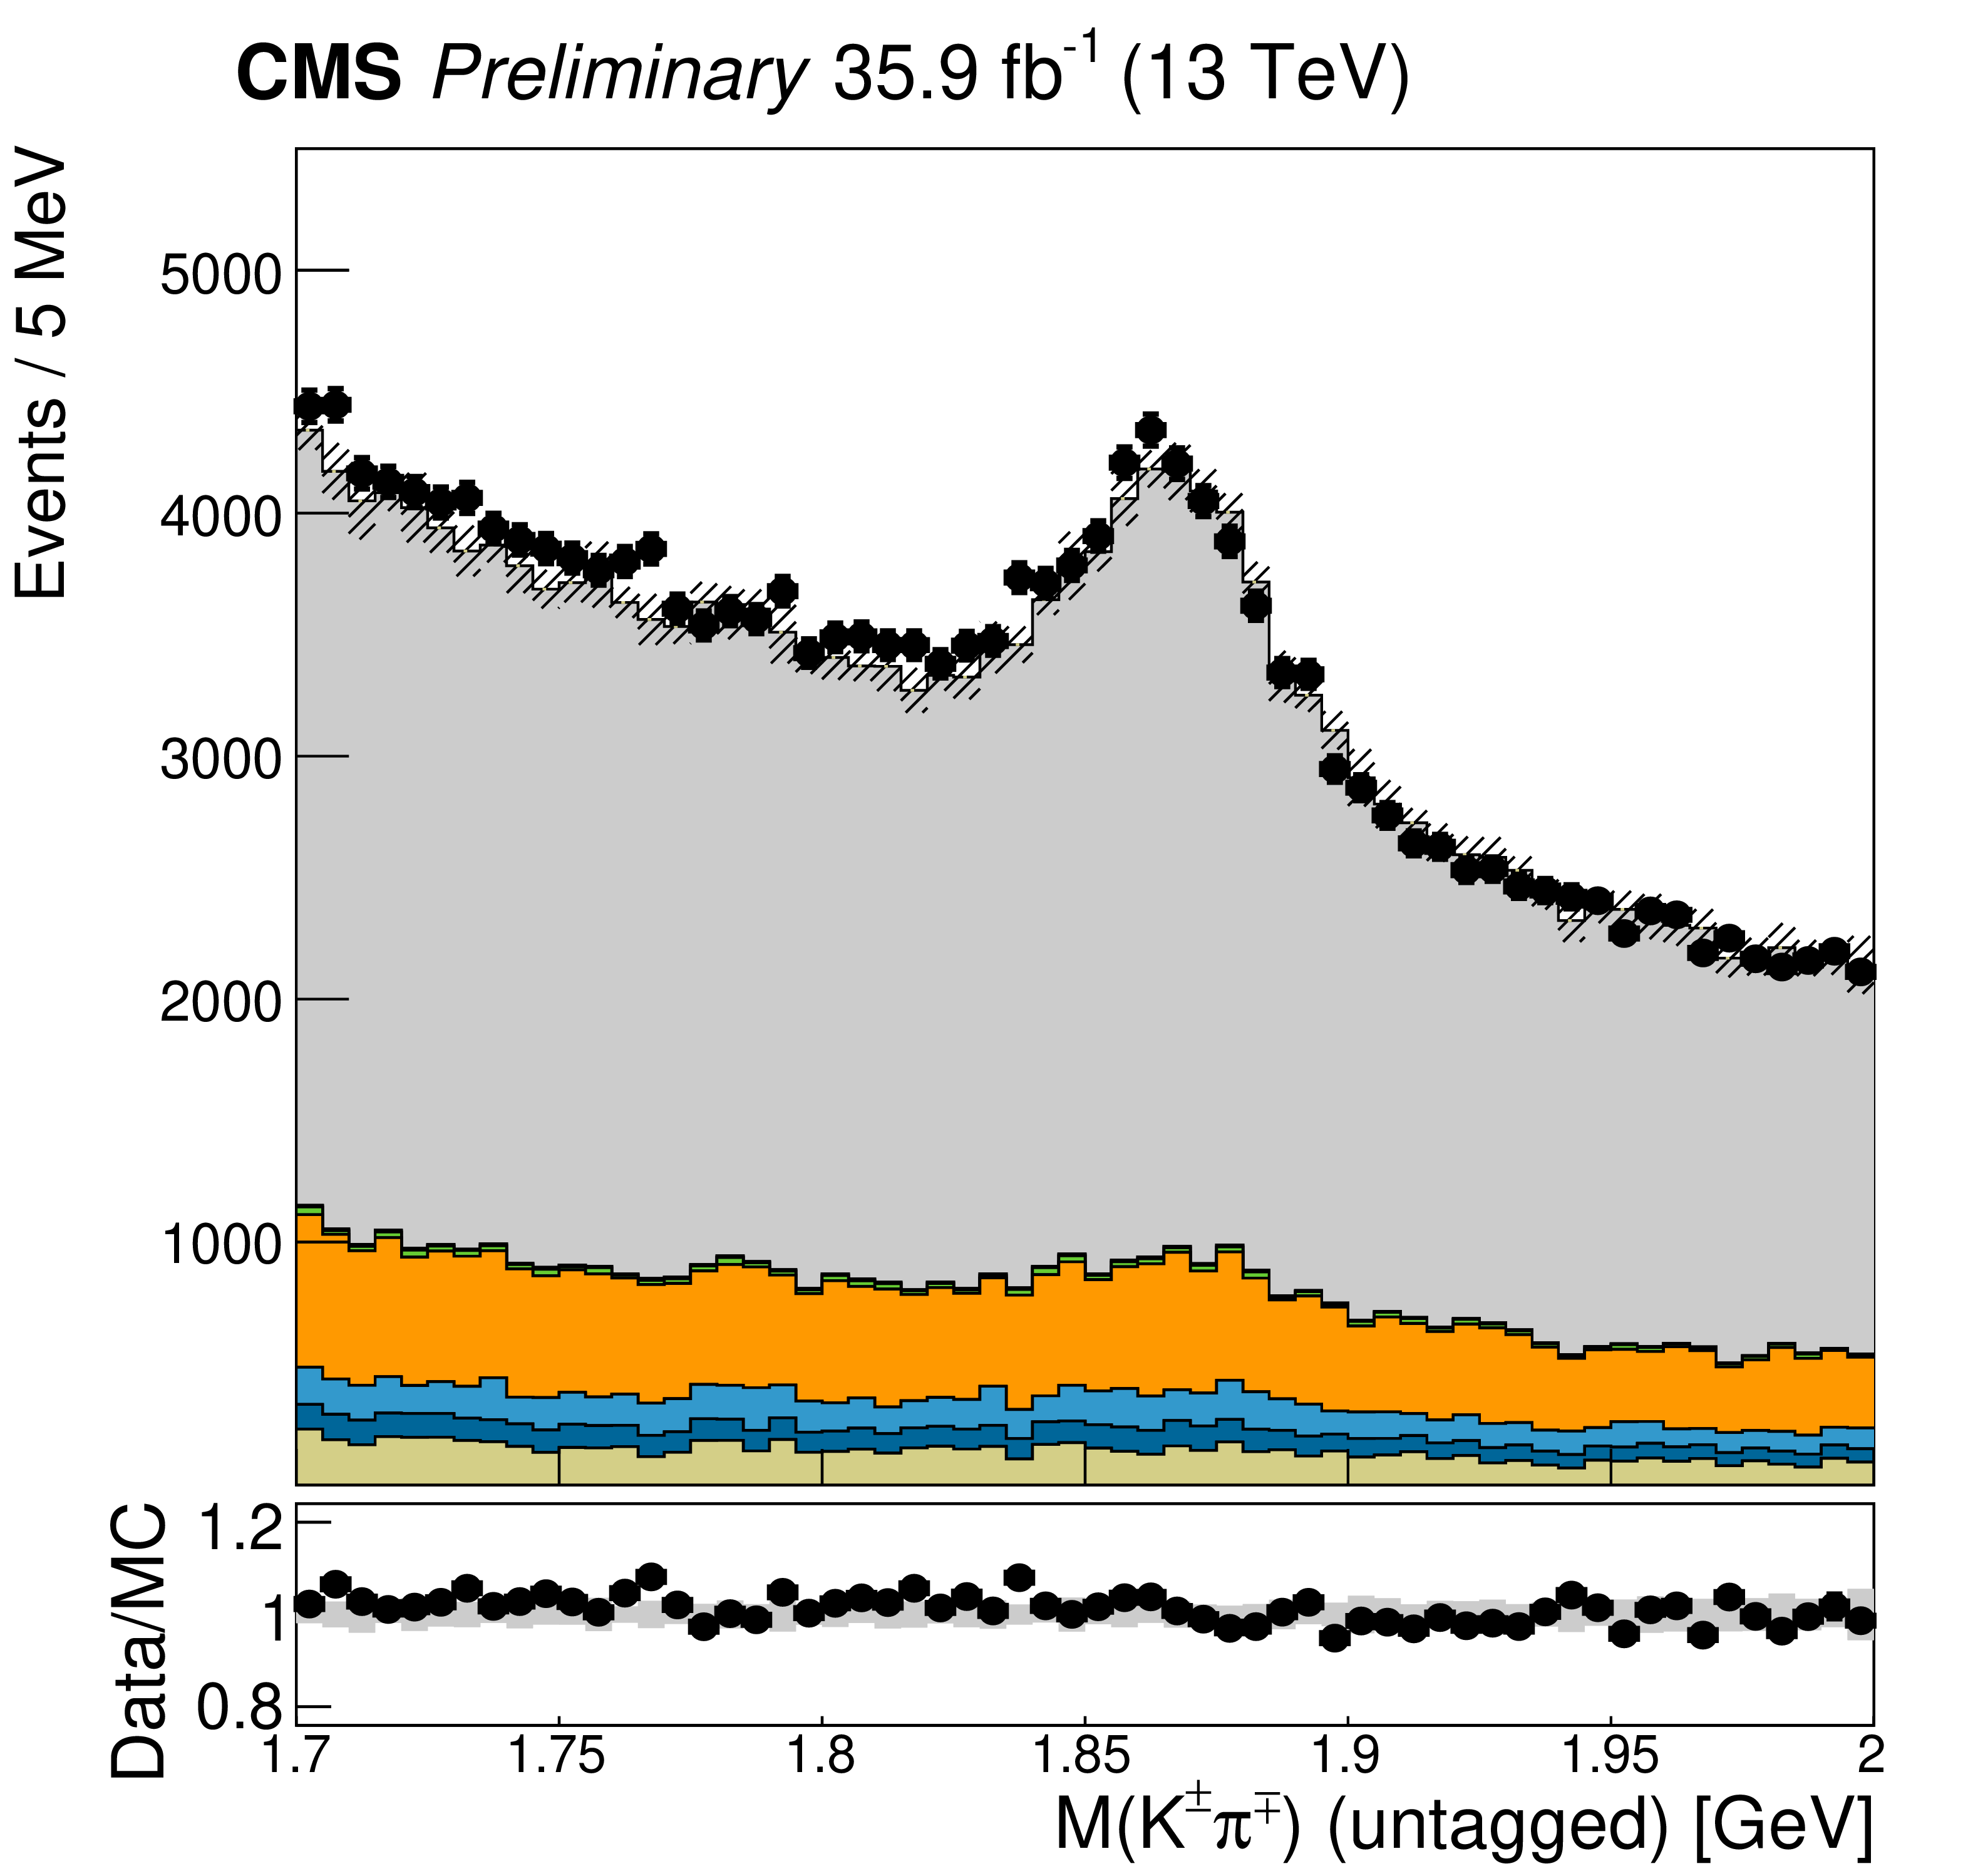
Figure 1-b:
Invariant mass distributions for the initial samples of $\mathrm{J}/\psi$ (upper left), untagged ${\mathrm{D^0}}$ (upper right), and flavor-tagged ${{\mathrm{D^0}} _{\mu}}$ (lower left) meson candidates. The data are compared to the combined background predictions from simulations of ${\mathrm{t} {}\mathrm{\bar{t}}}$ pair production, ${\mathrm{t} {}\mathrm{\bar{t}}}$ pair + vector boson production ( ${\mathrm{t} {}\mathrm{\bar{t}}}$+V, where V is a W or Z boson), single top production in the $t$ channel (t-ch) and $\mathrm{t} \mathrm{W} $ channel ($\mathrm{t} \mathrm{W} $), W boson production (W), Drell-Yan pair production (DY), and $\mathrm{W} \mathrm{W} $, $\mathrm{W} \mathrm{Z} $, and $\mathrm{Z} \mathrm{Z} $ production (multiboson). The lower panels show the ratio of the data to the simulation. The shaded bands correspond to the total uncertainty in the simulation (statistical and systematic). |
png pdf |
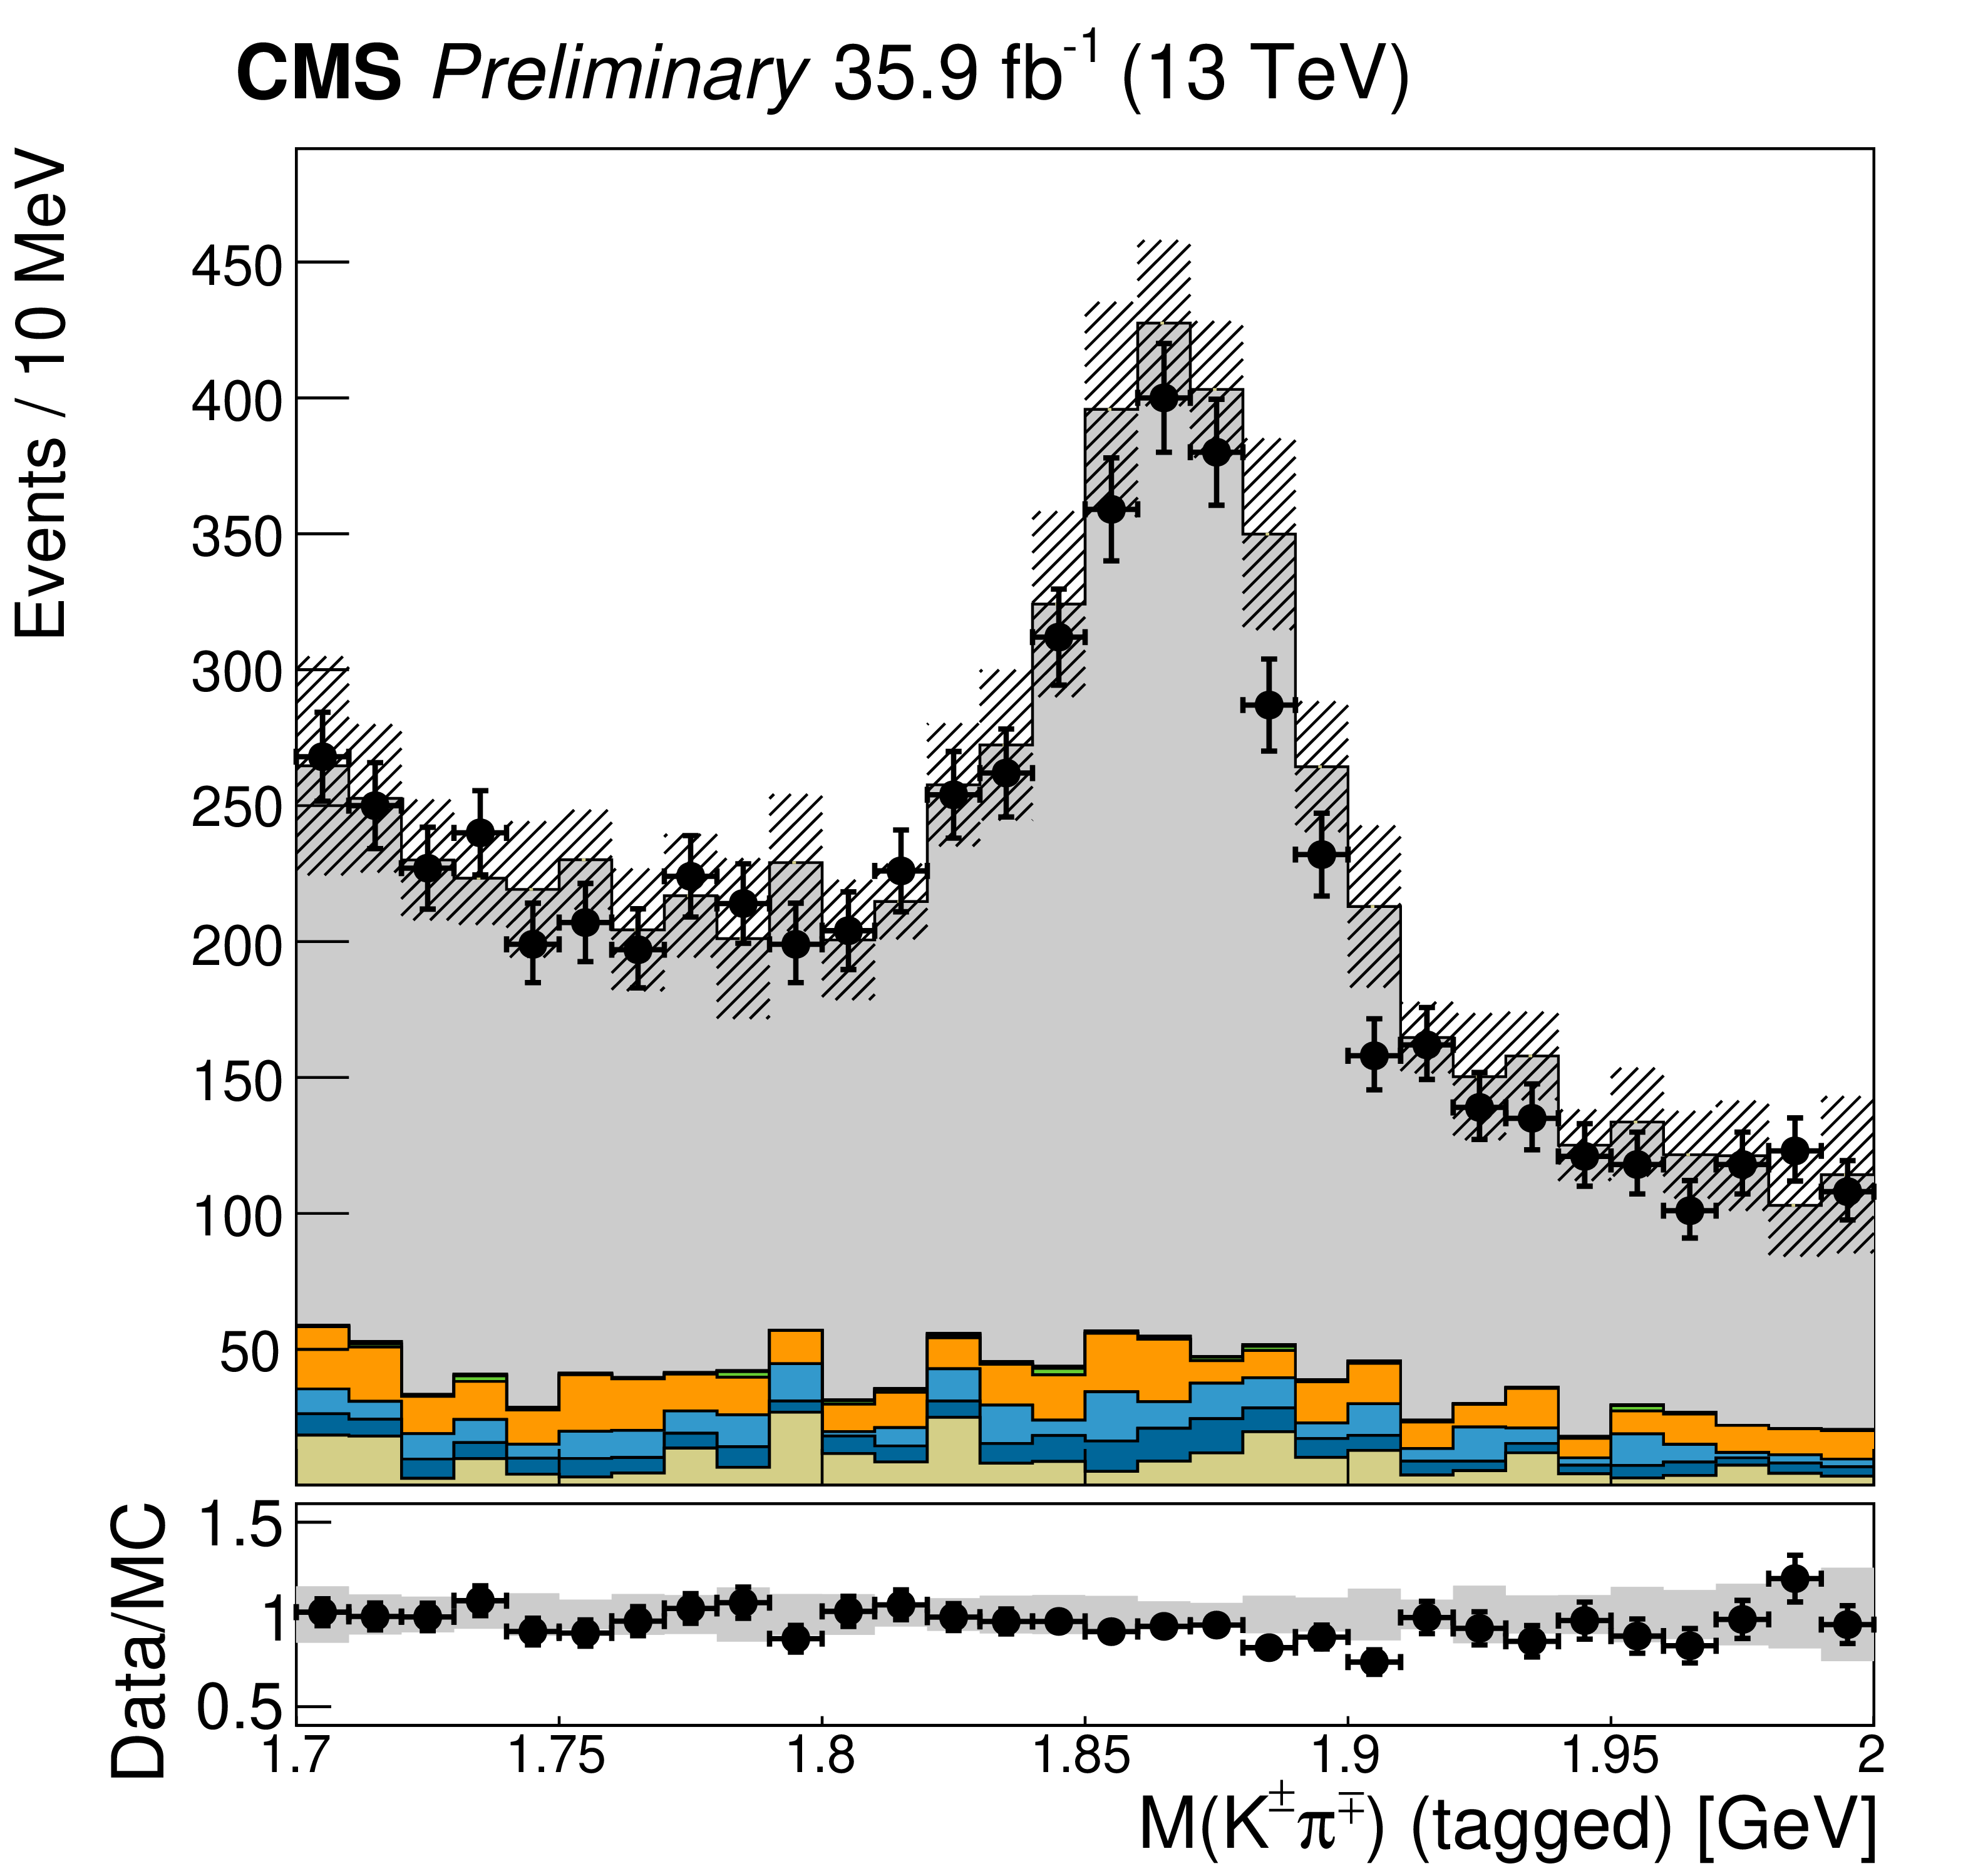
Figure 1-c:
Invariant mass distributions for the initial samples of $\mathrm{J}/\psi$ (upper left), untagged ${\mathrm{D^0}}$ (upper right), and flavor-tagged ${{\mathrm{D^0}} _{\mu}}$ (lower left) meson candidates. The data are compared to the combined background predictions from simulations of ${\mathrm{t} {}\mathrm{\bar{t}}}$ pair production, ${\mathrm{t} {}\mathrm{\bar{t}}}$ pair + vector boson production ( ${\mathrm{t} {}\mathrm{\bar{t}}}$+V, where V is a W or Z boson), single top production in the $t$ channel (t-ch) and $\mathrm{t} \mathrm{W} $ channel ($\mathrm{t} \mathrm{W} $), W boson production (W), Drell-Yan pair production (DY), and $\mathrm{W} \mathrm{W} $, $\mathrm{W} \mathrm{Z} $, and $\mathrm{Z} \mathrm{Z} $ production (multiboson). The lower panels show the ratio of the data to the simulation. The shaded bands correspond to the total uncertainty in the simulation (statistical and systematic). |

png pdf |
Figure 1-d:
Invariant mass distributions for the initial samples of $\mathrm{J}/\psi$ (upper left), untagged ${\mathrm{D^0}}$ (upper right), and flavor-tagged ${{\mathrm{D^0}} _{\mu}}$ (lower left) meson candidates. The data are compared to the combined background predictions from simulations of ${\mathrm{t} {}\mathrm{\bar{t}}}$ pair production, ${\mathrm{t} {}\mathrm{\bar{t}}}$ pair + vector boson production ( ${\mathrm{t} {}\mathrm{\bar{t}}}$+V, where V is a W or Z boson), single top production in the $t$ channel (t-ch) and $\mathrm{t} \mathrm{W} $ channel ($\mathrm{t} \mathrm{W} $), W boson production (W), Drell-Yan pair production (DY), and $\mathrm{W} \mathrm{W} $, $\mathrm{W} \mathrm{Z} $, and $\mathrm{Z} \mathrm{Z} $ production (multiboson). The lower panels show the ratio of the data to the simulation. The shaded bands correspond to the total uncertainty in the simulation (statistical and systematic). |

png pdf |
Figure 2:
Invariant mass distributions for the initial samples of $\mathrm{J}/\psi$ (upper left), untagged ${\mathrm{D^0}}$ (upper right), and flavor-tagged ${{\mathrm{D^0}} _{\mu}}$ (lower left) meson candidates. The data are compared to the background predictions for charm and bottom jets from ${\mathrm{t} {}\mathrm{\bar{t}}}$ pair production, single top production in the $t$ and $\mathrm{t} \mathrm{W} $ channels (t), W boson production (W), and Drell-Yan pair production (DY). |
png pdf |
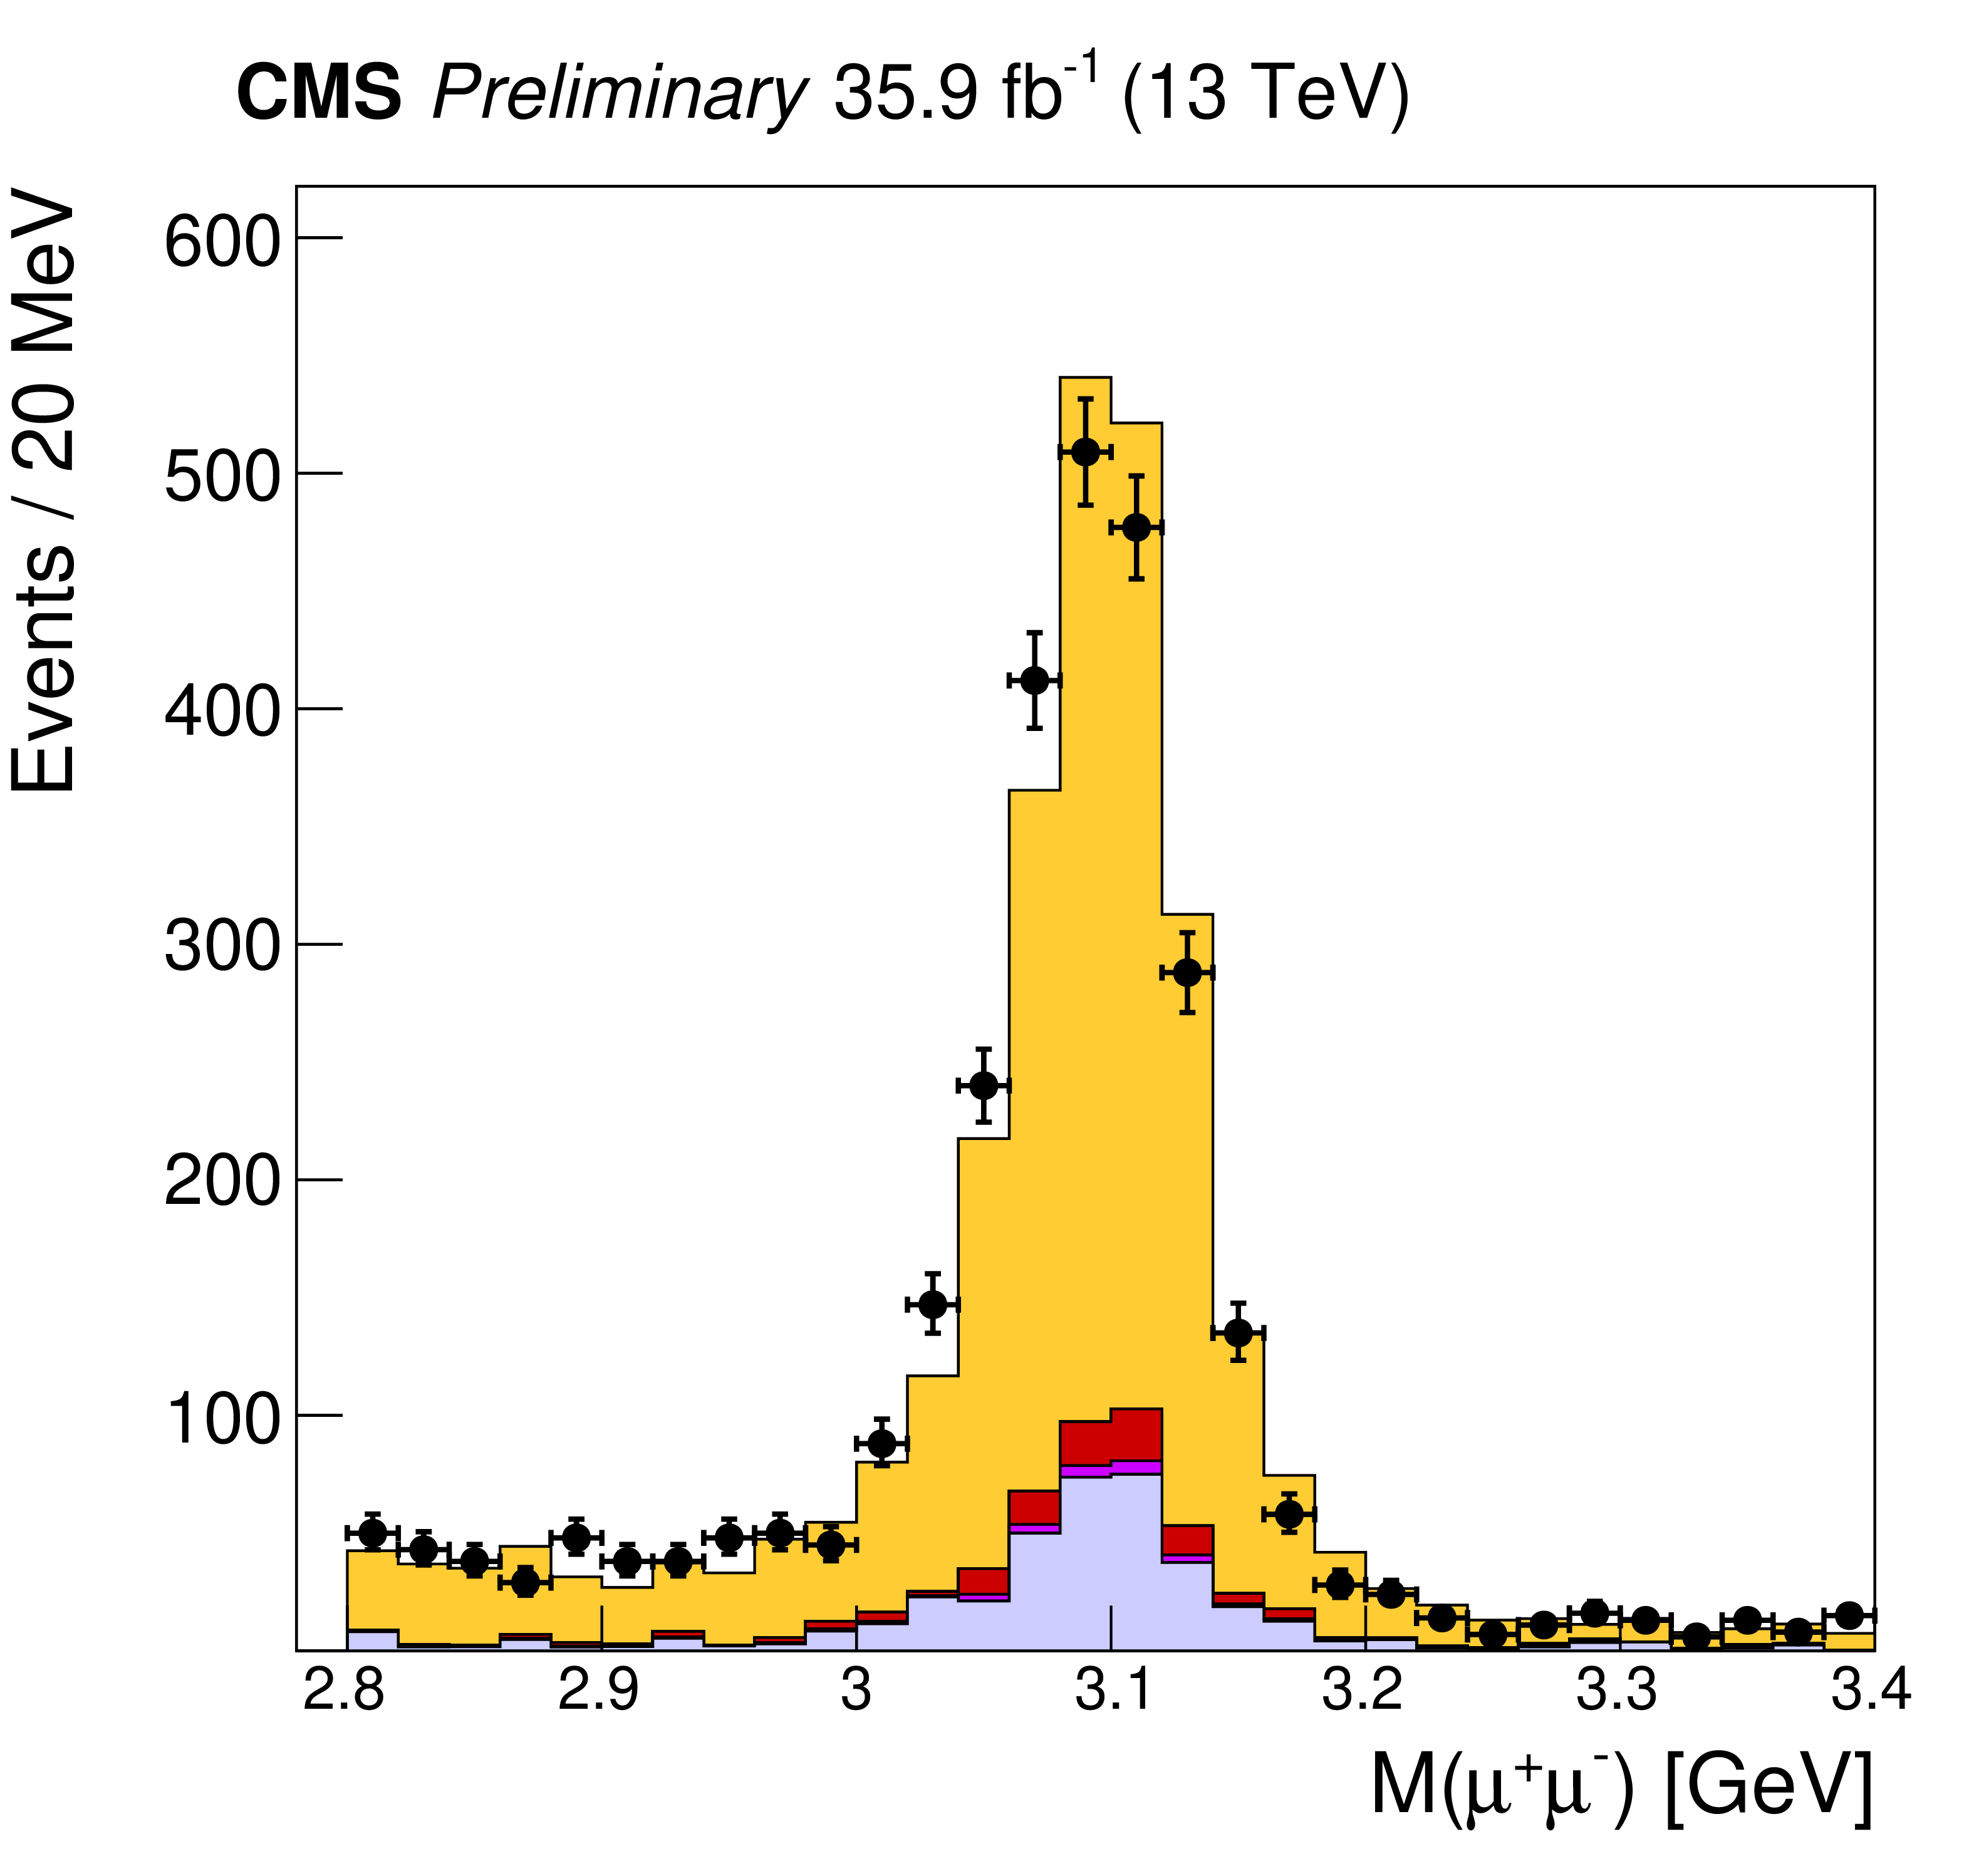
Figure 2-a:
Invariant mass distributions for the initial samples of $\mathrm{J}/\psi$ (upper left), untagged ${\mathrm{D^0}}$ (upper right), and flavor-tagged ${{\mathrm{D^0}} _{\mu}}$ (lower left) meson candidates. The data are compared to the background predictions for charm and bottom jets from ${\mathrm{t} {}\mathrm{\bar{t}}}$ pair production, single top production in the $t$ and $\mathrm{t} \mathrm{W} $ channels (t), W boson production (W), and Drell-Yan pair production (DY). |
png pdf |
Figure 2-b:
Invariant mass distributions for the initial samples of $\mathrm{J}/\psi$ (upper left), untagged ${\mathrm{D^0}}$ (upper right), and flavor-tagged ${{\mathrm{D^0}} _{\mu}}$ (lower left) meson candidates. The data are compared to the background predictions for charm and bottom jets from ${\mathrm{t} {}\mathrm{\bar{t}}}$ pair production, single top production in the $t$ and $\mathrm{t} \mathrm{W} $ channels (t), W boson production (W), and Drell-Yan pair production (DY). |

png pdf |
Figure 2-c:
Invariant mass distributions for the initial samples of $\mathrm{J}/\psi$ (upper left), untagged ${\mathrm{D^0}}$ (upper right), and flavor-tagged ${{\mathrm{D^0}} _{\mu}}$ (lower left) meson candidates. The data are compared to the background predictions for charm and bottom jets from ${\mathrm{t} {}\mathrm{\bar{t}}}$ pair production, single top production in the $t$ and $\mathrm{t} \mathrm{W} $ channels (t), W boson production (W), and Drell-Yan pair production (DY). |

png pdf |
Figure 2-d:
Invariant mass distributions for the initial samples of $\mathrm{J}/\psi$ (upper left), untagged ${\mathrm{D^0}}$ (upper right), and flavor-tagged ${{\mathrm{D^0}} _{\mu}}$ (lower left) meson candidates. The data are compared to the background predictions for charm and bottom jets from ${\mathrm{t} {}\mathrm{\bar{t}}}$ pair production, single top production in the $t$ and $\mathrm{t} \mathrm{W} $ channels (t), W boson production (W), and Drell-Yan pair production (DY). |

png pdf |
Figure 3:
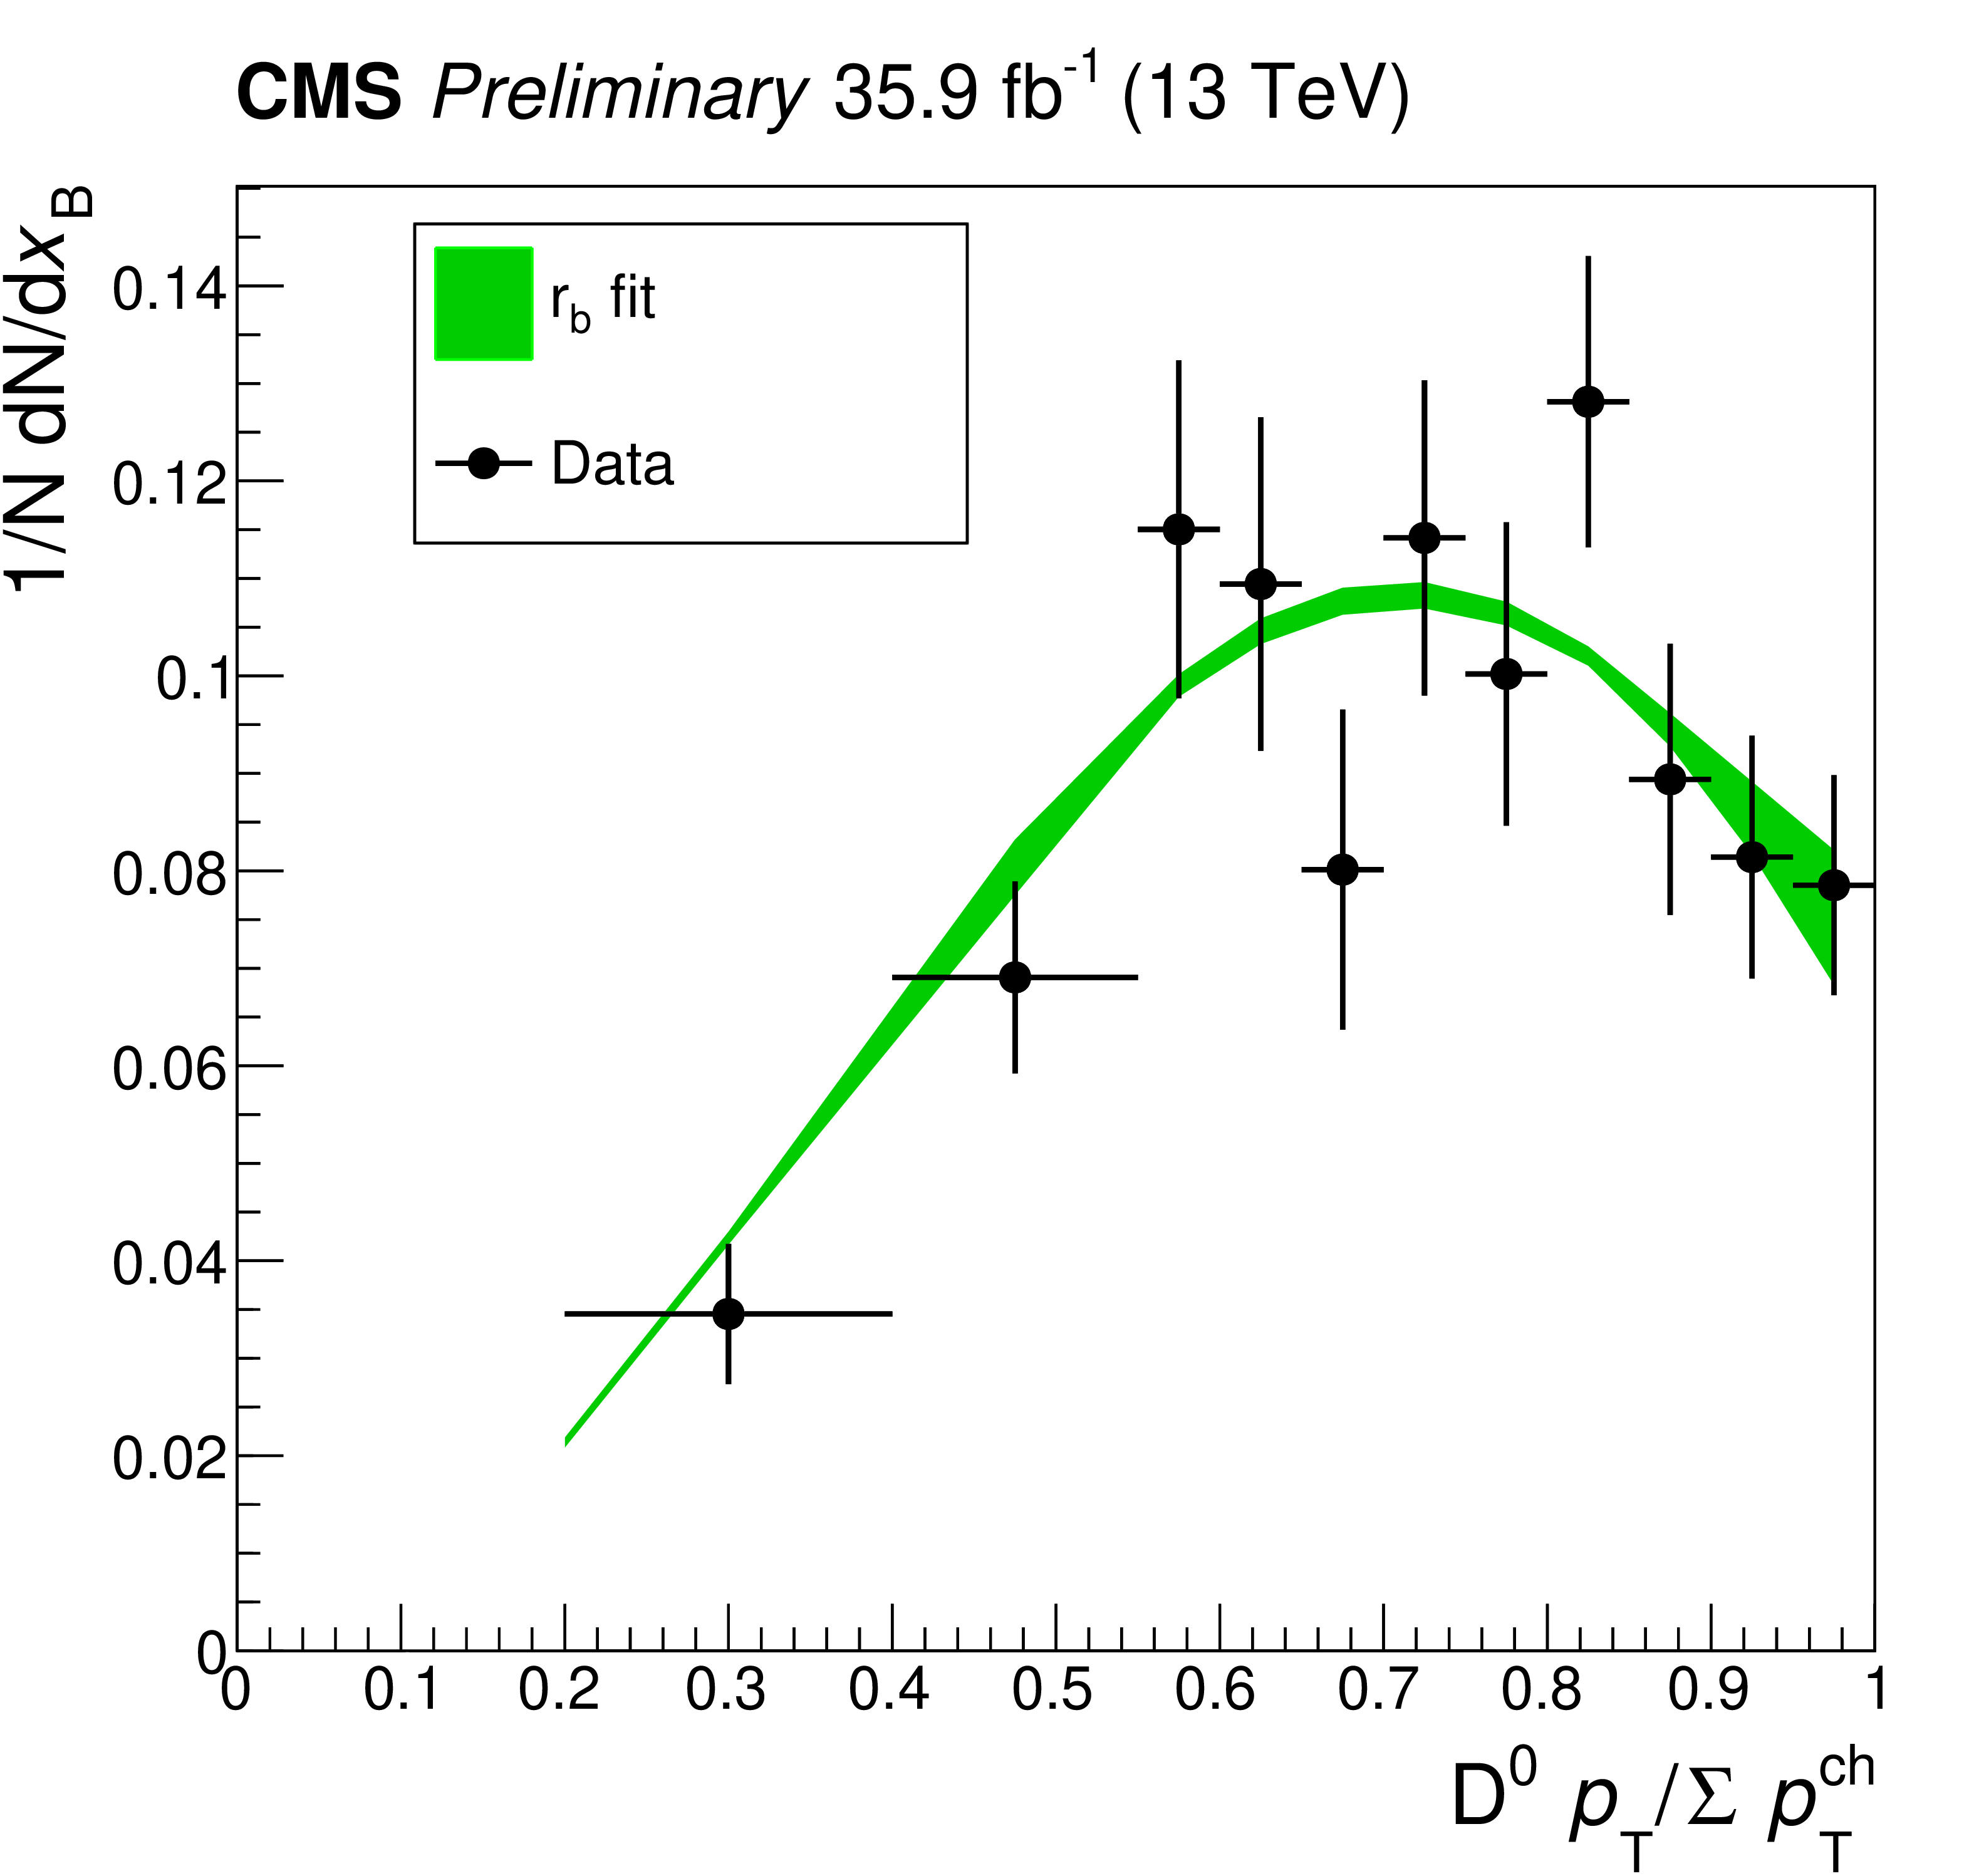
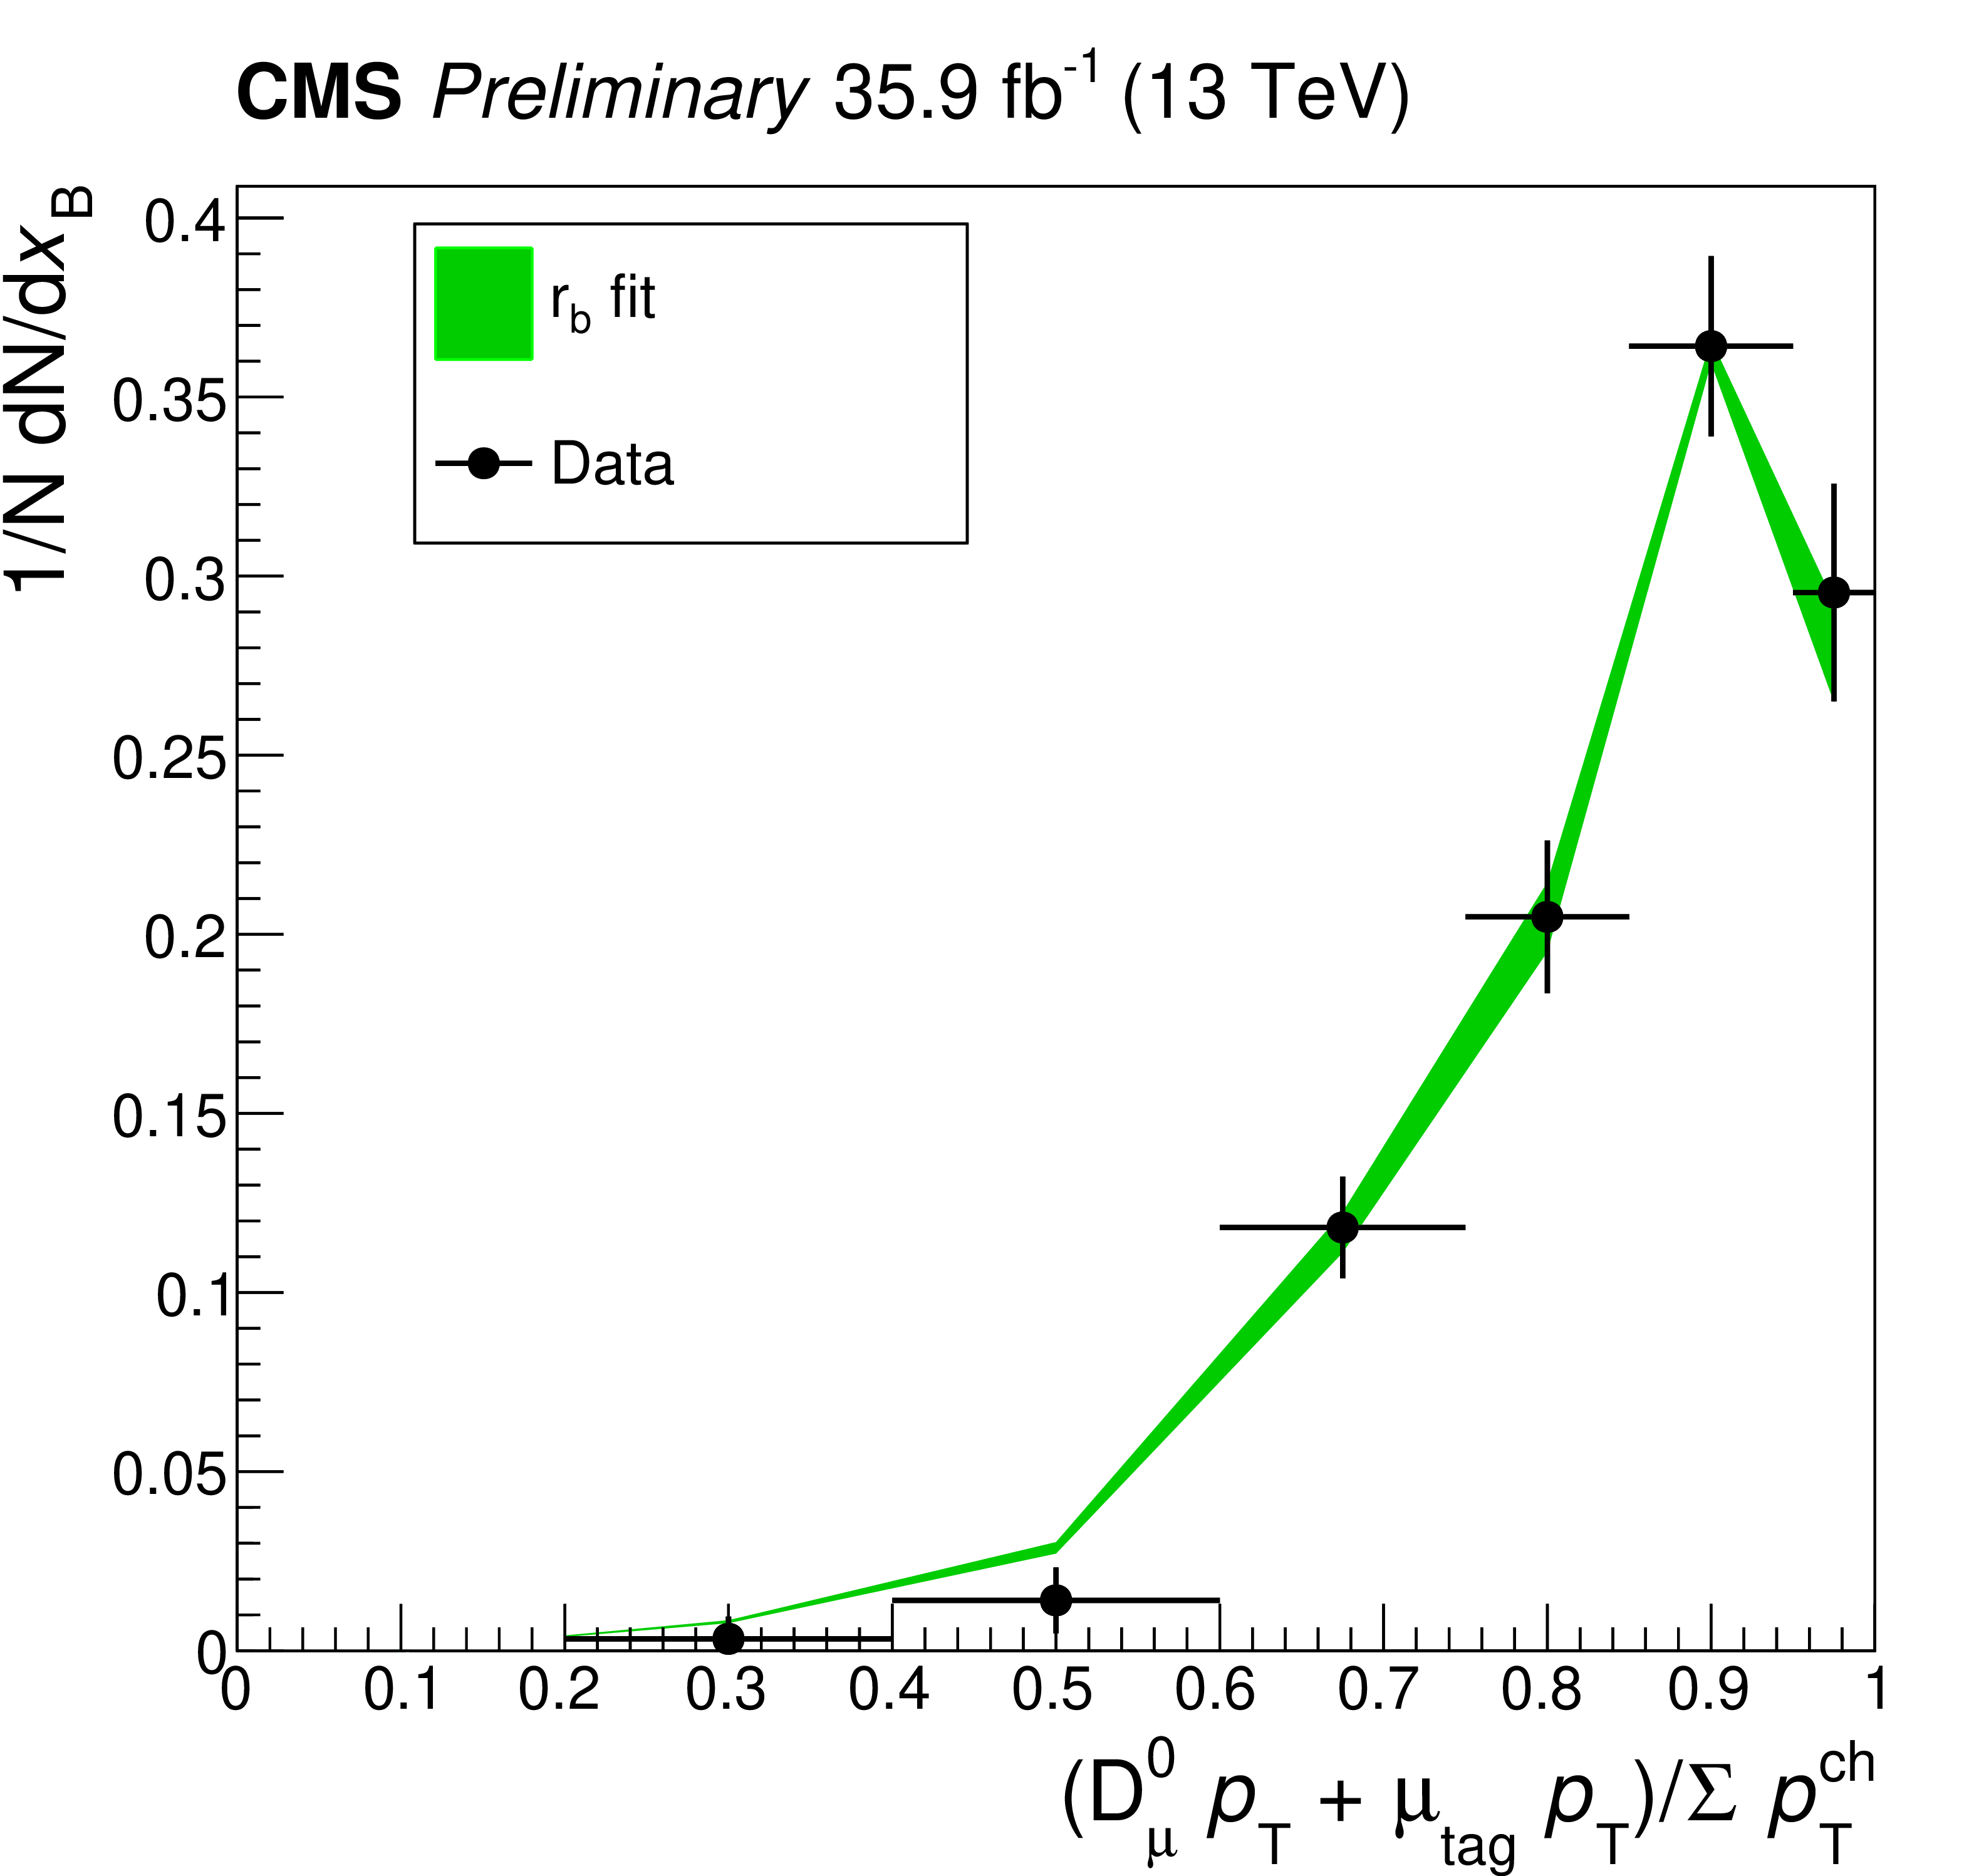
Fragmentation proxy distributions for the background-subtracted samples for $\mathrm{J}/\psi$ (upper left), untagged ${\mathrm{D^0}}$ (upper right), and flavor-tagged ${{\mathrm{D^0}} _{\mu}}$ (lower) meson candidates. The proxy for the $\mathrm{J}/\psi$ and ${\mathrm{D^0}}$ events is defined as the ratio of the meson ${p_{\mathrm {T}}}$ over the ${p_{\mathrm {T}}}$ of all of the charged particles in the jet, ${\Sigma {{p_{\mathrm {T}}} ^{\text {ch}}}}$. For the ${{\mathrm{D^0}} _{\mu}}$ sample this is changed to the (${p_{\mathrm {T}}}$ of the combined meson and tag $\mu$ system) / ${\Sigma {{p_{\mathrm {T}}} ^{\text {ch}}}}$. The shaded bands show the result of the combined fit to the data, where the width of the band is the combined statistical and systematic uncertainty. |

png pdf |
Figure 3-a:
Fragmentation proxy distributions for the background-subtracted samples for $\mathrm{J}/\psi$ (upper left), untagged ${\mathrm{D^0}}$ (upper right), and flavor-tagged ${{\mathrm{D^0}} _{\mu}}$ (lower) meson candidates. The proxy for the $\mathrm{J}/\psi$ and ${\mathrm{D^0}}$ events is defined as the ratio of the meson ${p_{\mathrm {T}}}$ over the ${p_{\mathrm {T}}}$ of all of the charged particles in the jet, ${\Sigma {{p_{\mathrm {T}}} ^{\text {ch}}}}$. For the ${{\mathrm{D^0}} _{\mu}}$ sample this is changed to the (${p_{\mathrm {T}}}$ of the combined meson and tag $\mu$ system) / ${\Sigma {{p_{\mathrm {T}}} ^{\text {ch}}}}$. The shaded bands show the result of the combined fit to the data, where the width of the band is the combined statistical and systematic uncertainty. |
png pdf |
Figure 3-b:
Fragmentation proxy distributions for the background-subtracted samples for $\mathrm{J}/\psi$ (upper left), untagged ${\mathrm{D^0}}$ (upper right), and flavor-tagged ${{\mathrm{D^0}} _{\mu}}$ (lower) meson candidates. The proxy for the $\mathrm{J}/\psi$ and ${\mathrm{D^0}}$ events is defined as the ratio of the meson ${p_{\mathrm {T}}}$ over the ${p_{\mathrm {T}}}$ of all of the charged particles in the jet, ${\Sigma {{p_{\mathrm {T}}} ^{\text {ch}}}}$. For the ${{\mathrm{D^0}} _{\mu}}$ sample this is changed to the (${p_{\mathrm {T}}}$ of the combined meson and tag $\mu$ system) / ${\Sigma {{p_{\mathrm {T}}} ^{\text {ch}}}}$. The shaded bands show the result of the combined fit to the data, where the width of the band is the combined statistical and systematic uncertainty. |
png pdf |
Figure 3-c:
Fragmentation proxy distributions for the background-subtracted samples for $\mathrm{J}/\psi$ (upper left), untagged ${\mathrm{D^0}}$ (upper right), and flavor-tagged ${{\mathrm{D^0}} _{\mu}}$ (lower) meson candidates. The proxy for the $\mathrm{J}/\psi$ and ${\mathrm{D^0}}$ events is defined as the ratio of the meson ${p_{\mathrm {T}}}$ over the ${p_{\mathrm {T}}}$ of all of the charged particles in the jet, ${\Sigma {{p_{\mathrm {T}}} ^{\text {ch}}}}$. For the ${{\mathrm{D^0}} _{\mu}}$ sample this is changed to the (${p_{\mathrm {T}}}$ of the combined meson and tag $\mu$ system) / ${\Sigma {{p_{\mathrm {T}}} ^{\text {ch}}}}$. The shaded bands show the result of the combined fit to the data, where the width of the band is the combined statistical and systematic uncertainty. |

png pdf |
Figure 4:
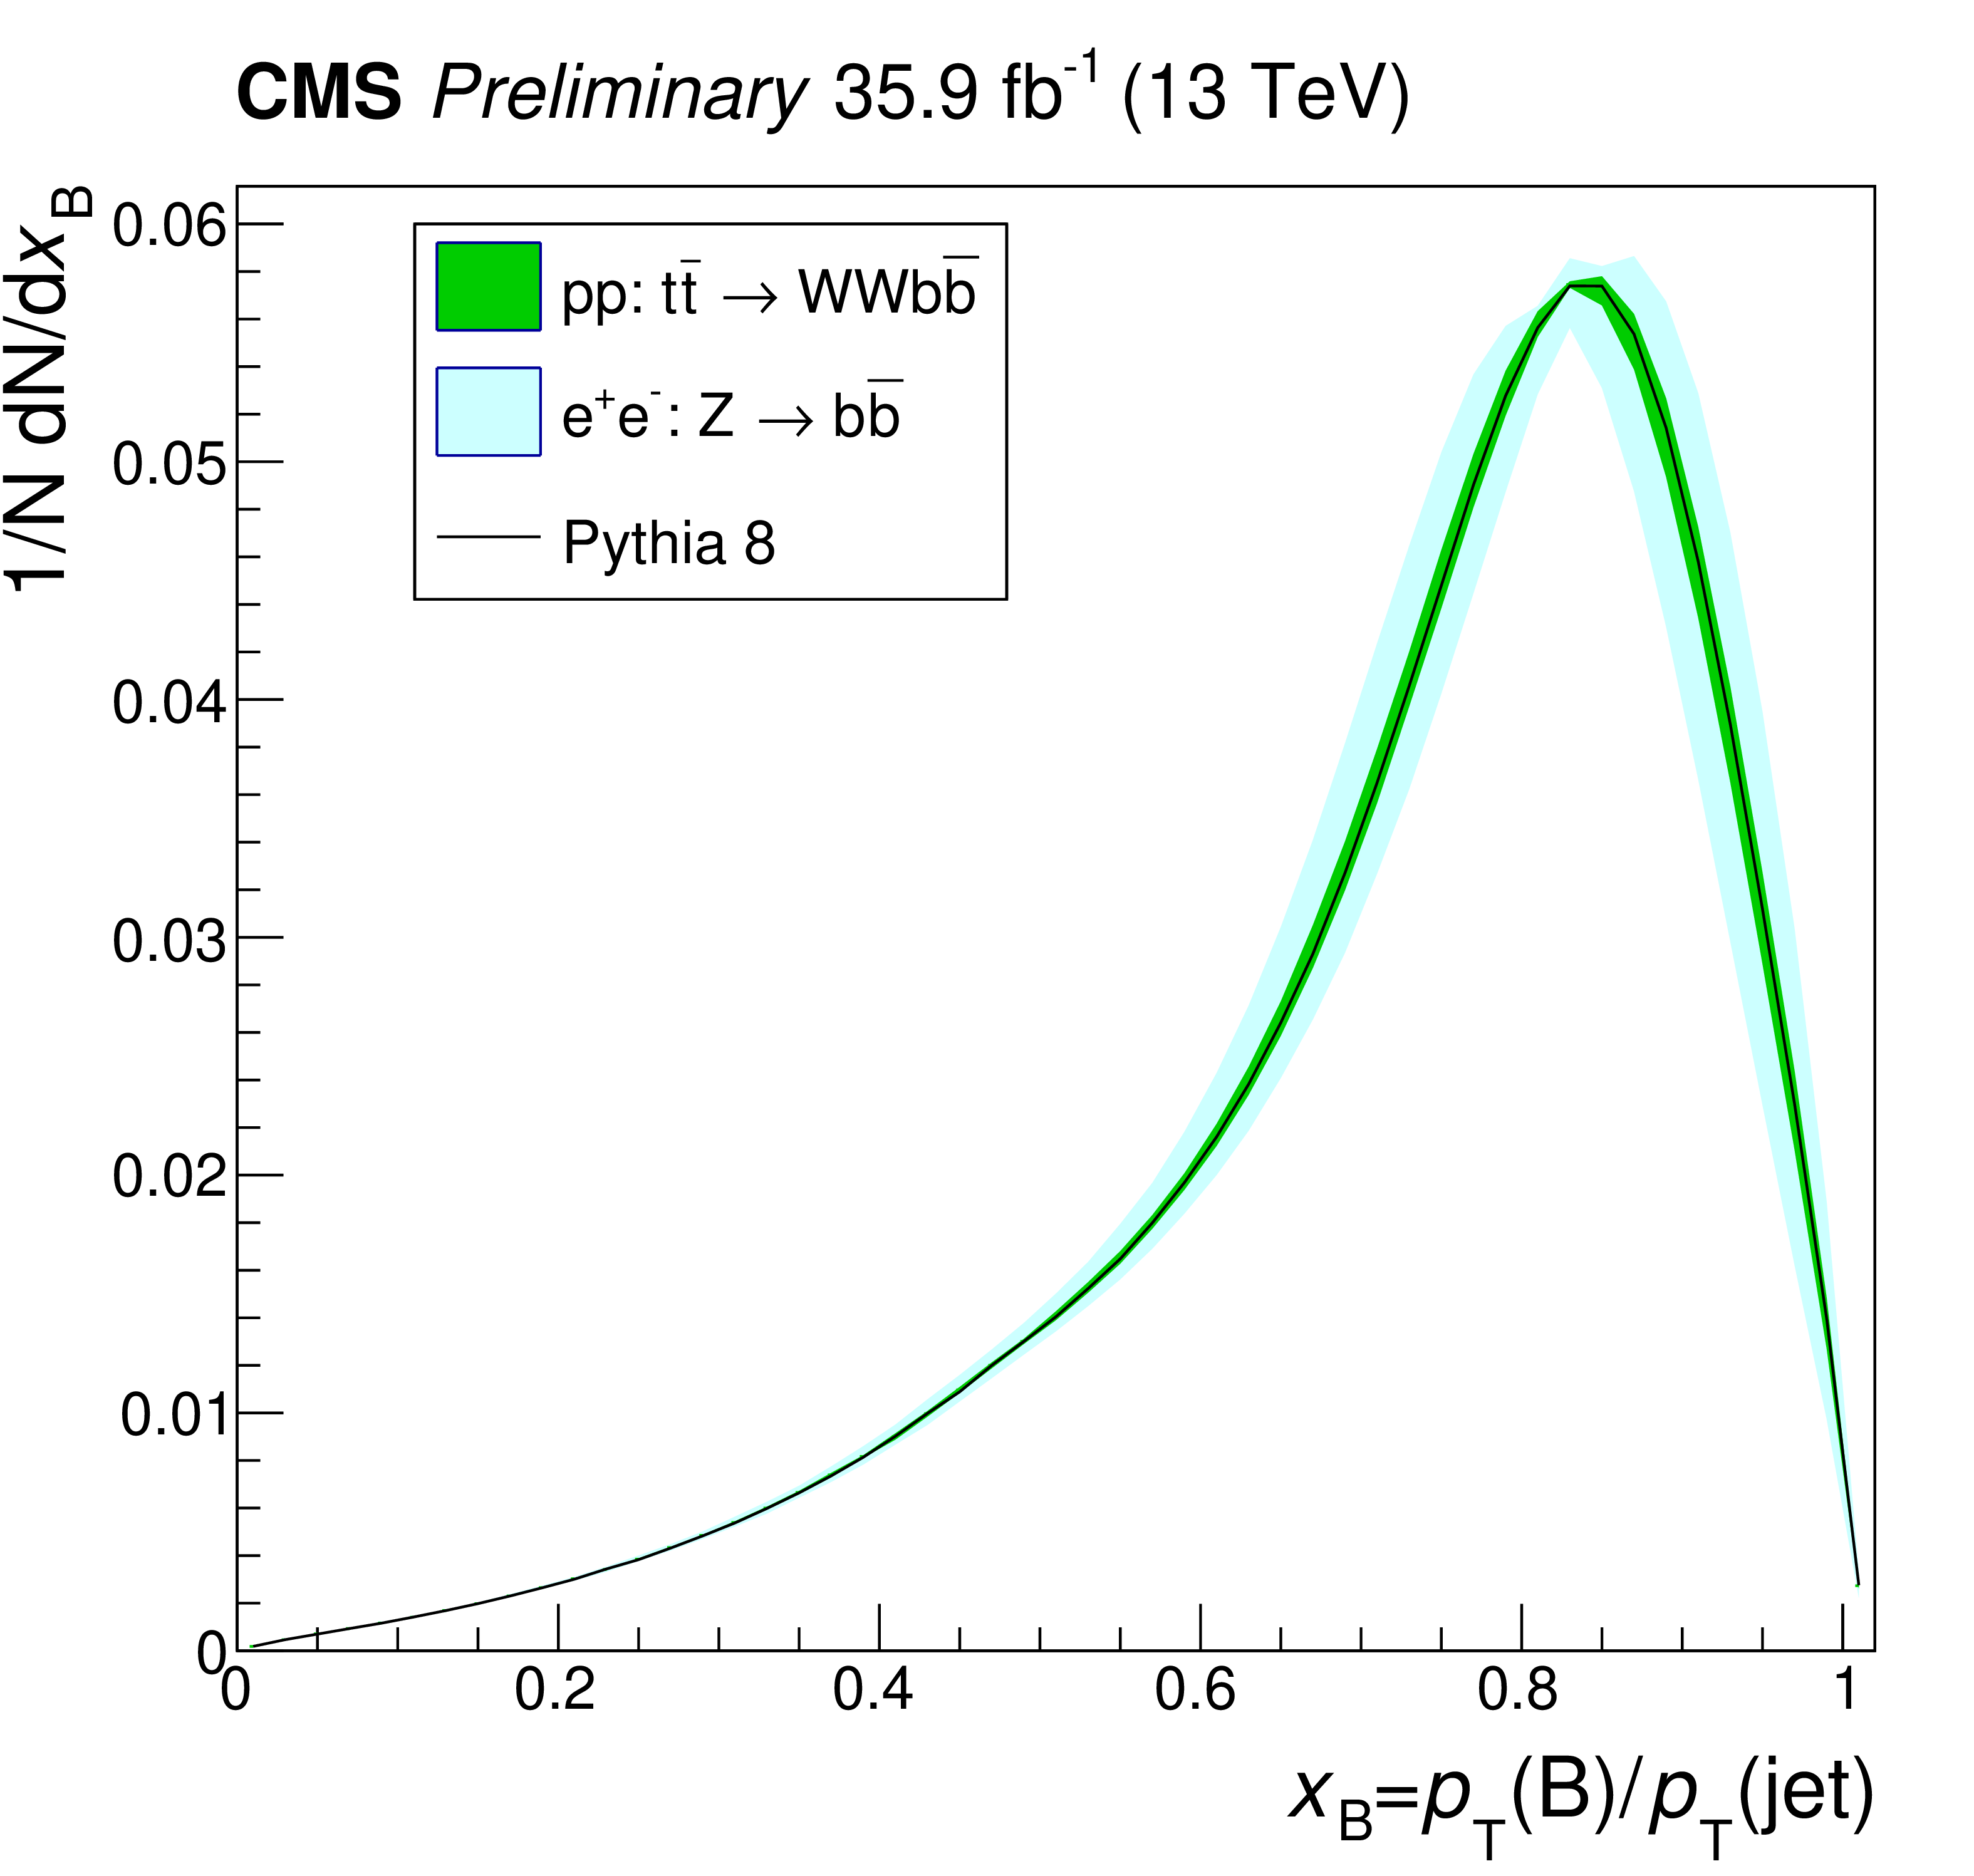
The Lund-Bowler fragmentation function for b quarks plotted as a function of ${x_{\mathrm{b}}}$. The left panel shows the comparison of the result from this analysis (green), the result obtained from the data at the Z pole (light blue), and the current default function from PYTHIA 8 (black line). The right panel shows the value of the the fitted functions divided by the PYTHIA 8 calculation. |
png pdf |
Figure 4-a:
The Lund-Bowler fragmentation function for b quarks plotted as a function of ${x_{\mathrm{b}}}$. The left panel shows the comparison of the result from this analysis (green), the result obtained from the data at the Z pole (light blue), and the current default function from PYTHIA 8 (black line). The right panel shows the value of the the fitted functions divided by the PYTHIA 8 calculation. |

png pdf |
Figure 4-b:
The Lund-Bowler fragmentation function for b quarks plotted as a function of ${x_{\mathrm{b}}}$. The left panel shows the comparison of the result from this analysis (green), the result obtained from the data at the Z pole (light blue), and the current default function from PYTHIA 8 (black line). The right panel shows the value of the the fitted functions divided by the PYTHIA 8 calculation. |
| Tables | |

png pdf |
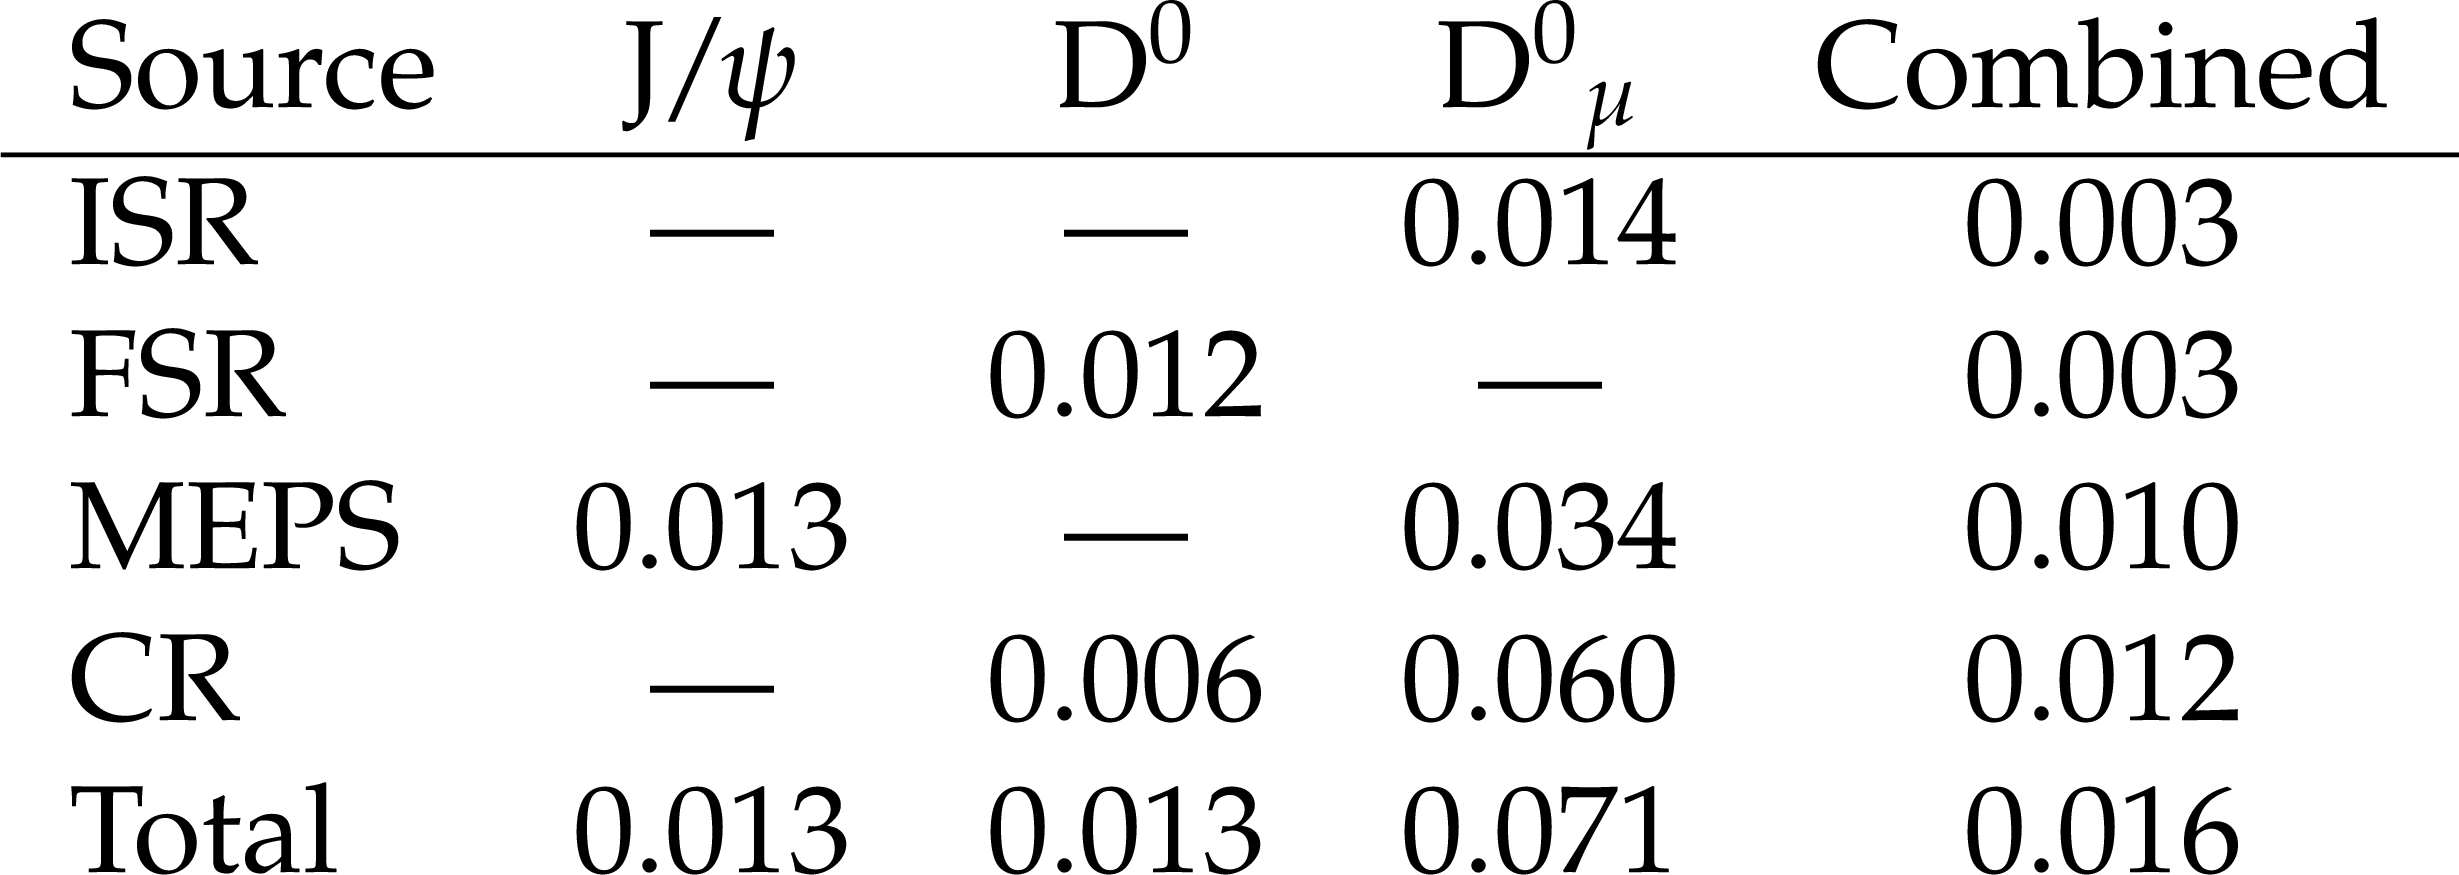
Table 1:
Systematic uncertainties in ${r_{\mathrm{b}}}$ from the background subtraction procedure for the different processes producing c and b jets. Entries for which the uncertainty is less than 0.001 are denoted by "---''. |
png pdf |
Table 2:
Systematic uncertainties in ${r_{\mathrm{b}}}$ from the modeling of the ${x_{\mathrm{b}}}$ shape in PYTHIA 8. |
png pdf |
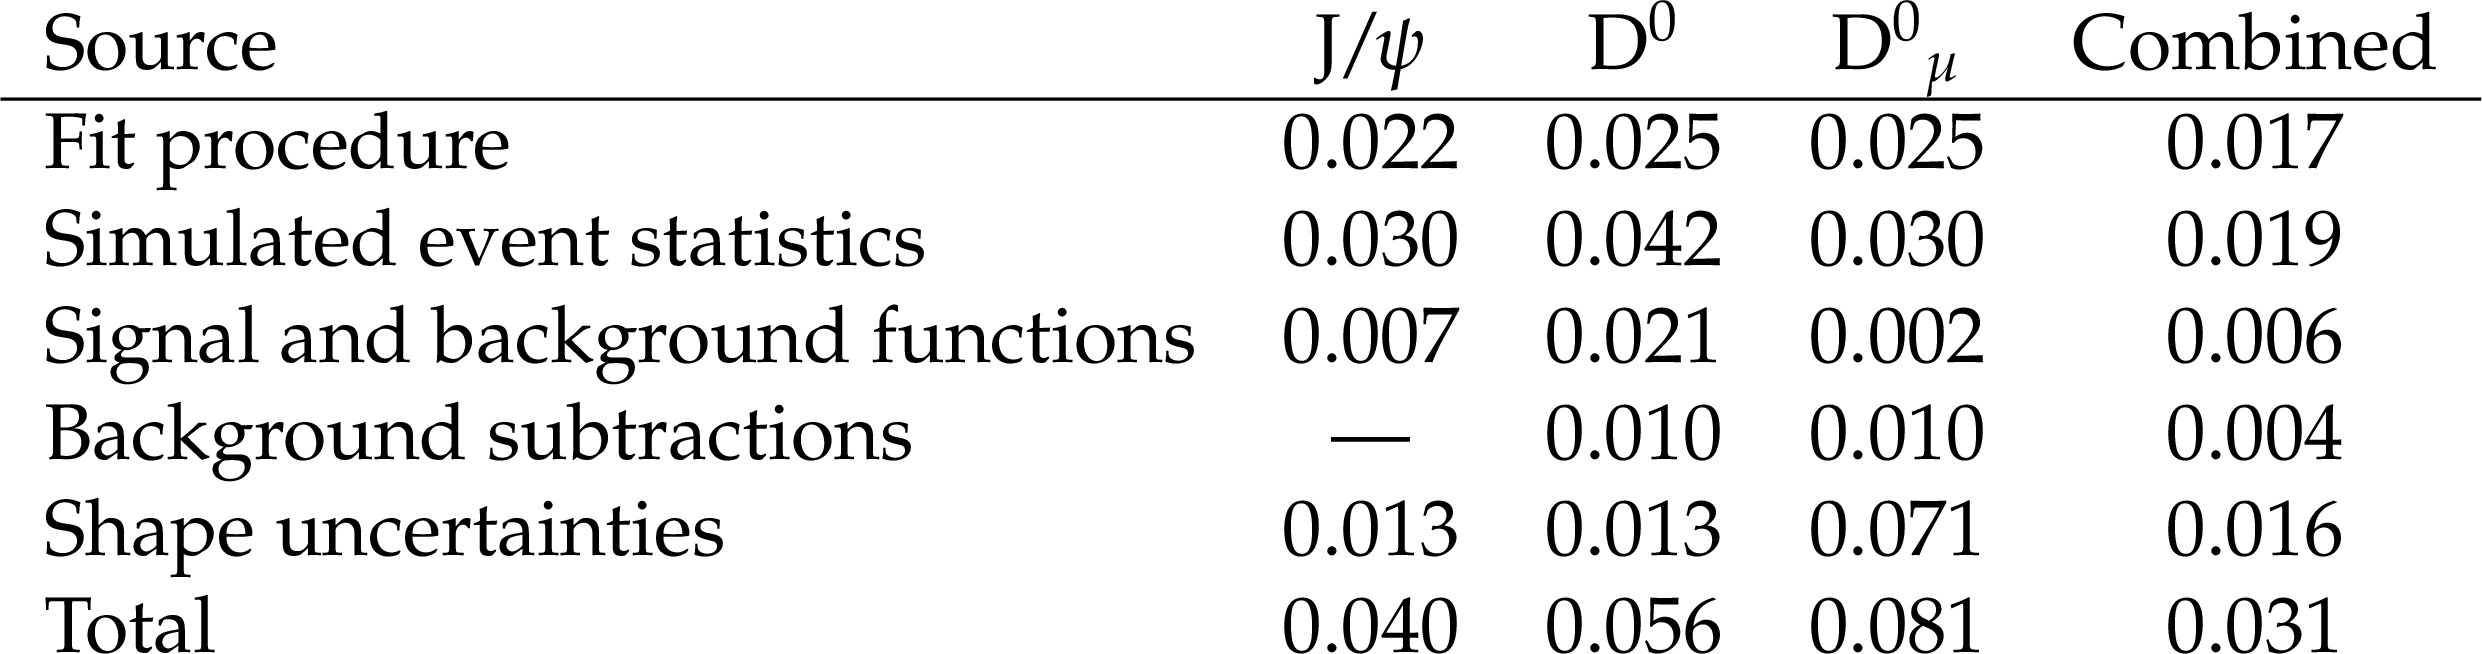
Table 3:
Sources of systematic uncertainty in ${r_{\mathrm{b}}}$ and their estimated values. |
| Summary |
| A determination of the shape parameter of the Lund-Bowler fragmentation function for b quarks has been presented. The analysis uses charm mesons produced inside b jets from $\mathrm{t\bar{t}}$ production and is based on 35.9 fb$^{-1}$ of data recorded by the CMS experiment at $\sqrt{s} = $ 13 TeV during 2016. Samples of ${\mathrm{D^0}}$ and $\mathrm{J}/\psi$ meson candidates are reconstructed from the decays ${\mathrm{D^0}} \to \mathrm{K^{\pm}} \pi^{\mp}$ and $\mathrm{J}/\psi \to \mu^{+}\mu^{-}$ using charged particle track information. The mesons are used as proxies for their parent b quarks and the corresponding ${x_{\mathrm{b}}} $ distributions, where ${x_{\mathrm{b}}} $ is the fraction of the combined transverse momentum of the charged constituents of the jet carried by the charm meson, are fitted to extract the value of the shape parameter ${r_{\mathrm{b}}} $. A value of ${{{r_{\mathrm{b}}}}} = $ 0.858 $\pm$ 0.037 (stat) $\pm$ 0.031 (syst) is obtained. This is the first measurement of the b quark fragmentation function in the $\mathrm{t\bar{t}}$ environment, and it significantly improves the experimental precision on the shape of the fragmentation function. From a comparison with results obtained from $\mathrm{e^{+}}\mathrm{e^{-}}$ data at the Z pole, no evidence is observed for an environmental dependence of the shape of the fragmentation function. |
| References | ||||
| 1 | C. Peterson, D. Schlatter, I. Schmitt, and P. M. Zerwas | Scaling violations in inclusive $ e^{+}e^{-} $ annihilation spectra | PRD 27 (1983) 105 | |
| 2 | B. Andersson, G. Gustafsson, and B. Soderberg | A general model for jet fragmentation | Z. Phys. C 20 (1983) 317 | |
| 3 | M. G. Bowler | $ e^{+}e^{-} $ production of heavy quarks in the string model | Z. Phys. C 11 (1981) 169 | |
| 4 | ALEPH Collaboration | Study of the fragmentation of b quarks into B mesons at the Z peak | PLB 512 (2001) 30 | hep-ex/0106051 |
| 5 | OPAL Collaboration | Inclusive analysis of the b quark fragmentation function in Z decays at LEP | EPJC 29 (2003) 463 | hep-ex/0210031 |
| 6 | DELPHI Collaboration | A study of the b-quark fragmentation function with the DELPHI detector at LEP I and an averaged distribution obtained at the Z pole | EPJC 71 (2011) 1857 | |
| 7 | SLD Collaboration | Measurement of the b quark fragmentation function in Z$ ^{0} $ decays | PRD 65 (2002) 092006 | |
| 8 | CMS Collaboration | Measurement of the top quark mass using proton-proton data at $ \sqrt{s} = $ 7 and 8 TeV | PRD 93 (2016) 072004 | |
| 9 | CMS Collaboration | Measurement of the cross section ratio $ \sigma_{ttbb} $/$ \sigma_{ttqq} $ in pp collisions at $ \sqrt{s} = $ 8 TeV | PLB 746 (2015) 132 | |
| 10 | CMS Collaboration | Search for standard model production of four top quarks in proton-proton collisions at $ \sqrt{s} = $ 13 TeV | PLB 772 (2017) 336 | |
| 11 | CMS Collaboration | Event generator tunes obtained from underlying event and multiparton scattering measurements | EPJC 76 (2016) 155 | CMS-GEN-14-001 1512.00815 |
| 12 | CMS Collaboration | Investigations of the impact of the parton shower tuning in Pythia 8 in the modeling of $ \mathrm{t\overline{t}} $ at $ \sqrt{s}= $ 8 and 13 TeV | CMS-PAS-TOP-16-021 | CMS-PAS-TOP-16-021 |
| 13 | P. Skands, S. Carrazza, and J. Rojo | Tuning PYTHIA 8.1: the Monash 2013 tune | EPJC 74 (2014) 3024 | 1404.5630 |
| 14 | P. Nason | A new method for combining NLO QCD with shower Monte Carlo algorithms | JHEP 11 (2004) 040 | hep-ph/0409146 |
| 15 | S. Frixione, P. Nason, and C. Oleari | Matching NLO QCD computations with parton shower simulations: the POWHEG method | JHEP 11 (2007) 070 | 0709.2092 |
| 16 | S. Alioli, P. Nason, C. Oleari, and E. Re | A general framework for implementing NLO calculations in shower Monte Carlo programs: the POWHEG BOX | JHEP 06 (2010) 043 | 1002.2581 |
| 17 | S. Alioli, S.-O. Moch, and P. Uwer | Hadronic top-quark pair production with one jet and parton showering | JHEP 01 (2012) 137 | 1110.5251 |
| 18 | M. Czakon and A. Mitov | Top++: A program for the calculation of the top-pair cross-section at hadron colliders | CPC 185 (2014) 2930 | 1112.5675 |
| 19 | M. Czakon, P. Fiedler, and A. Mitov | Total top quark production cross section at hadron colliders through O($ \alpha_{s}^{4} $) | PRL 110 (2013) 252004 | 1303.6254 |
| 20 | T. Sjostrand, S. Mrenna, and P. Skands | PYTHIA 6.4 physics and manual | JHEP 05 (2006) 026 | hep-ph/0603175 |
| 21 | T. Sjostrand, S. Mrenna, and P. Skands | A brief introduction to PYTHIA 8.1 | Comp. Phys. Comm. 178 (2008) 852 | 0710.3820 |
| 22 | NNPDF Collaboration | Parton distributions for the LHC Run II | JHEP 04 (2015) 040 | 1410.8849 |
| 23 | Particle Data Group, M. Tanabashi et al. | Review of particle physics | PRD 98 (2018) 030001 | |
| 24 | J. Alwall et al. | The automated computation of tree-level and next-to-leading order differential cross sections, and their matching to parton shower simulations | JHEP 07 (2014) 079 | 1405.0301 |
| 25 | J. Alwall et al. | Comparative study of various algorithms for the merging of parton showers and matrix elements in hadronic collisions | EPJC 53 (2008) 473 | |
| 26 | P. Kant et al. | Hathor for single top quark production: updated predictions and uncertainty estimates for single top quark production in hadron collisions | Comp. Phys. Comm. 191 (2015) 74 | |
| 27 | R. Artoisenet, R. Frederix, O. Mattelaser, and R. Rietkerk | Automatic spin-entangled decays of heavy resonances in Monte Carlo simulations | JHEP 03 (2013) 015 | |
| 28 | E. Re | Single-top Wt-channel production matched with parton showers using the POWHEG method | EPJC 71 (2011) 1547 | 1009.2450 |
| 29 | T. Melia, P. Nason, R. Rontsch, and G. Zanderighi | W$ ^+ $W$ ^- $, WZ and ZZ production in the POWHEG BOX | JHEP 11 (2011) 078 | 1107.5051 |
| 30 | P. Nason and G. Zanderighi | $ W^+ W^- $ , $ W Z $ and $ Z Z $ production in the POWHEG-BOX-V2 | EPJC 74 (2014) 2702 | 1311.1365 |
| 31 | GEANT4 Collaboration | GEANT4--a simulation toolkit | NIMA 506 (2003) 250 | |
| 32 | CMS Collaboration | Particle-flow reconstruction and global event description with the CMS detector | JINST 12 (2017) P10003 | CMS-PRF-14-001 1706.04965 |
| 33 | M. Cacciari, G. P. Salam, and G. Soyez | The anti-$ {k_{\mathrm{T}}} $ jet clustering algorithm | JHEP 04 (2008) 063 | 0802.1189 |
| 34 | M. Cacciari, G. P. Salam, and G. Soyez | FastJet user manual | EPJC 72 (2012) 1896 | 1111.6097 |
| 35 | CMS Collaboration | Jet energy scale and resolution in the CMS experiment in pp collisions at 8 TeV | JINST 12 (2017) P02014 | CMS-JME-13-004 1607.03663 |
| 36 | E. Butz and on behalf of the CMS Collaboration | Operation and performance of the CMS outer tracker | PoS Vertex 2017 (2018) 013 | |
| 37 | R. Fruhwirth | Application of Kalman filtering to track and vertex fitting | NIMA 262 (1987) 444 | |
| 38 | R. Fruhwirth, P. Kubinec, W. Mitaroff, and M. Regler | Vertex reconstruction and track bundling at the LEP collider using robust algorithms | CPC 96 (1996) 189 | |
| 39 | CMS Collaboration | Measurement of the mass of the top quark in decays with a $ J/\psi $ meson in pp collisions at 8 TeV | JHEP 12 (2016) 123 | CMS-TOP-15-014 1608.03560 |
| 40 | M. J. Oreglia | PhD thesis, Stanford University, 1980 SLAC Report SLAC-R-236 | ||
| 41 | M. Pivk and F. R. Le Diberder | sPlot: A statistical tool to unfold data distributions | NIMA 555 (2005) 356 | physics/0402083 |
| 42 | CMS Collaboration | Measurement of jet substructure observables in $ \mathrm{t\bar{t}} $ events from proton-proton collisions at $ \sqrt{s} = $ 13 TeV | PRD 98 (2018) 092014 | |
|
|
Compact Muon Solenoid LHC, CERN |
|

|

|

|

|

|