

Compact Muon Solenoid
LHC, CERN
| CMS-PAS-TOP-23-001 | ||
| Probing entanglement in top quark production with the CMS detector | ||
| CMS Collaboration | ||
| 27 March 2024 | ||
| Abstract: Entanglement is an intrinsic property of quantum mechanics and its measurement probes the current understanding of the underlying quantum nature of elementary particles at a fundamental level. A measurement of the extent of entanglement in top quark-antiquark ($ \mathrm{t\bar{t}} $) events produced in proton-proton collisions at a center-of-mass energy of 13 TeV is performed on the data recorded by the CMS experiment at the CERN LHC in 2016, corresponding to an integrated luminosity of 35.9 fb$^{-1}$. The events are selected based on the presence of two oppositely charged high transverse momentum leptons. An entanglement-sensitive observable $ D $ is derived from the top quark spin-dependent parts of the $ \mathrm{t\bar{t}} $ production density matrix. Values of $ D $ smaller than $ -$1/3 are evidence of entanglement and, within a particular phase space, $ D $ is measured to be $-$0.478 $ ^{+0.025}_{-0.027} $. With an expected (observed) significance of 5.1 (5.7) standard deviations, this provides observation for quantum mechanical entanglement within $ \mathrm{t\bar{t}} $ pairs in this phase space. This measurement provides a new quantum probe of the inner workings of the standard model at the highest energy ever tested. | ||
| Links: CDS record (PDF) ; Physics Briefing ; CADI line (restricted) ; | ||
| Figures | |
png pdf |
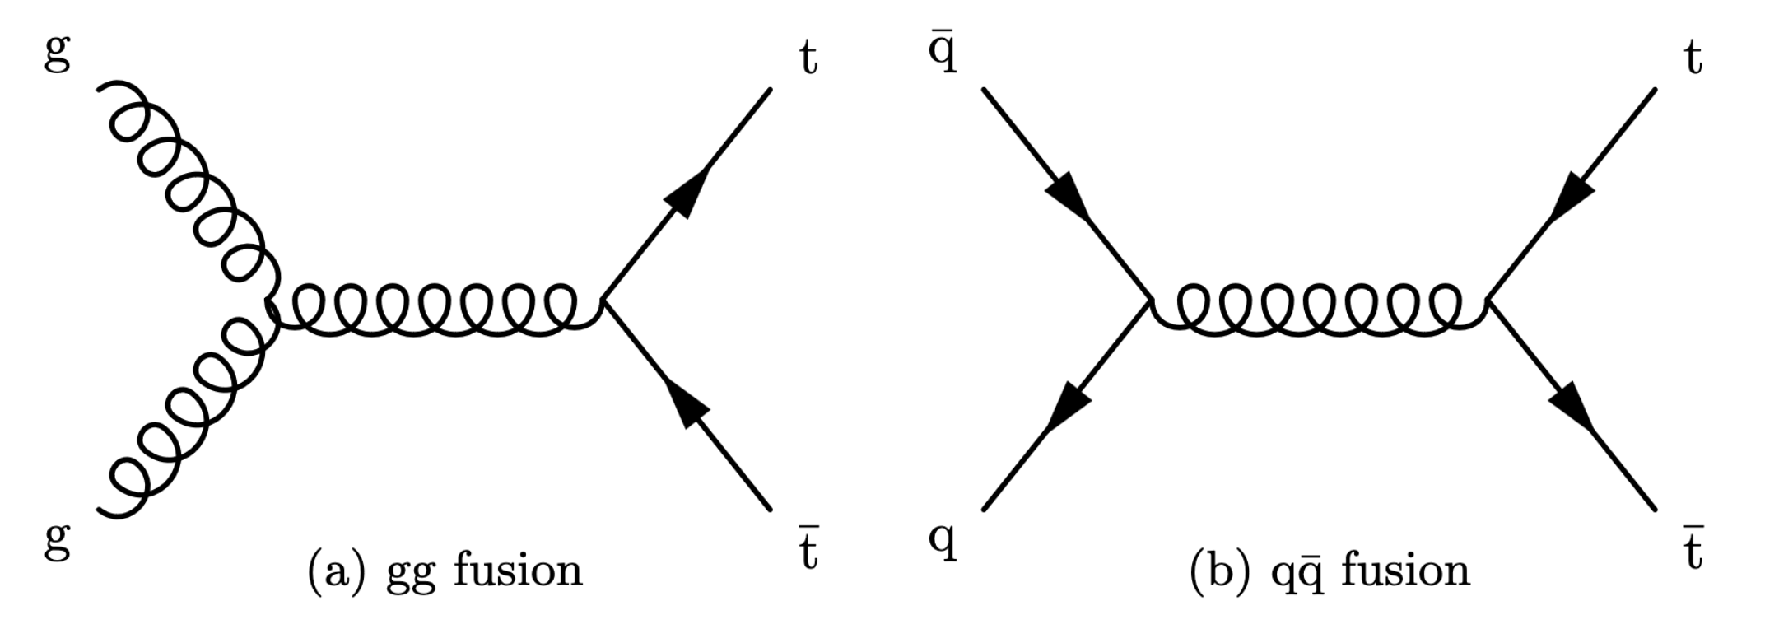
Figure 1:
Subfigure (a) shows the Feynman diagram for the leading order QCD gluon-gluon fusion process and (b) shows the quark-antiquark fusion process for top quark pair production. |

png pdf |
Figure 2:
Predicted values of $ -(1 + \Delta)/ 3 $ (see Eq. (4)) obtained from calculations of the $ \mathrm{t} \overline{\mathrm{t}} $ production cross section [7], without accounting for detector effects, are shown as a function of $ m({\mathrm{t}\overline{\mathrm{t}}} ) $ and the top quark scattering angle $ \Theta $ for the gluon-gluon fusion production. The black solid lines represent the $ D= -1/ 3$ boundary for entanglement while the black dashed line corresponds to $ m({\mathrm{t}\overline{\mathrm{t}}} )= $ 400 GeV. The minimum value on the z axis corresponds to the boundary below which $ \Delta = tr[\mathbf{C}] - 1$. Top quarks with no spin correlations correspond to a value of 0. |

png pdf |
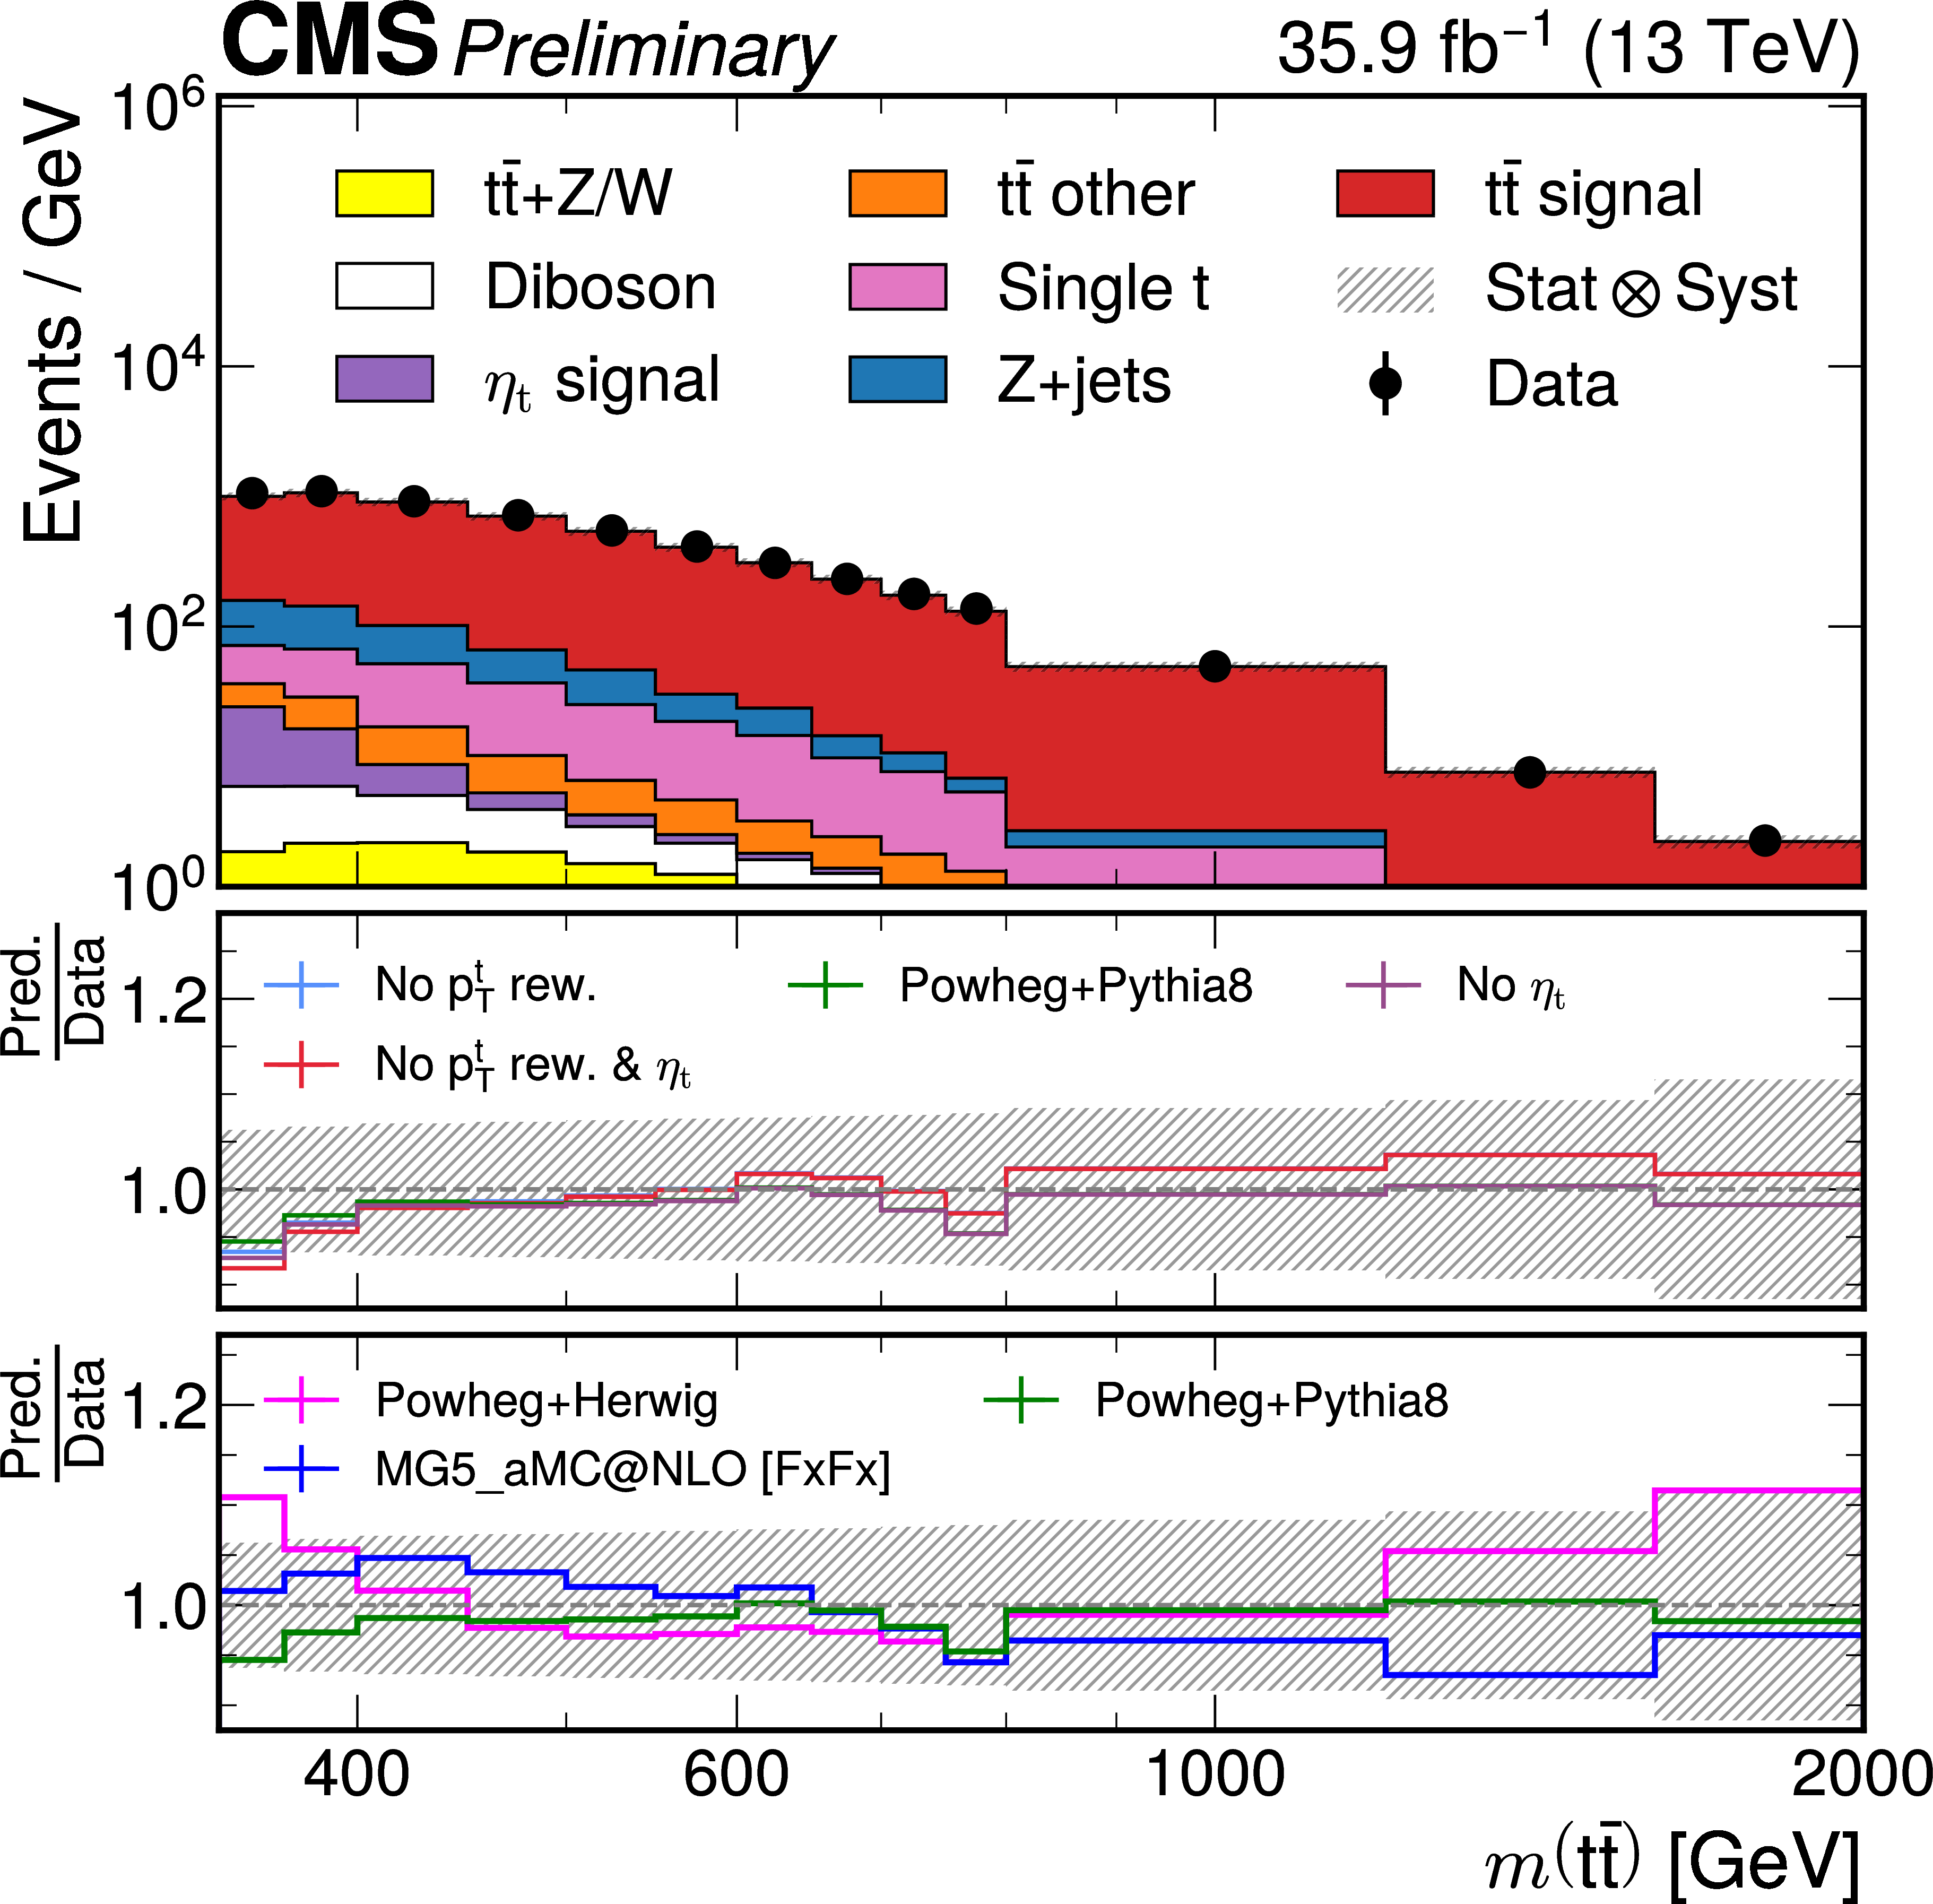
Figure 3:
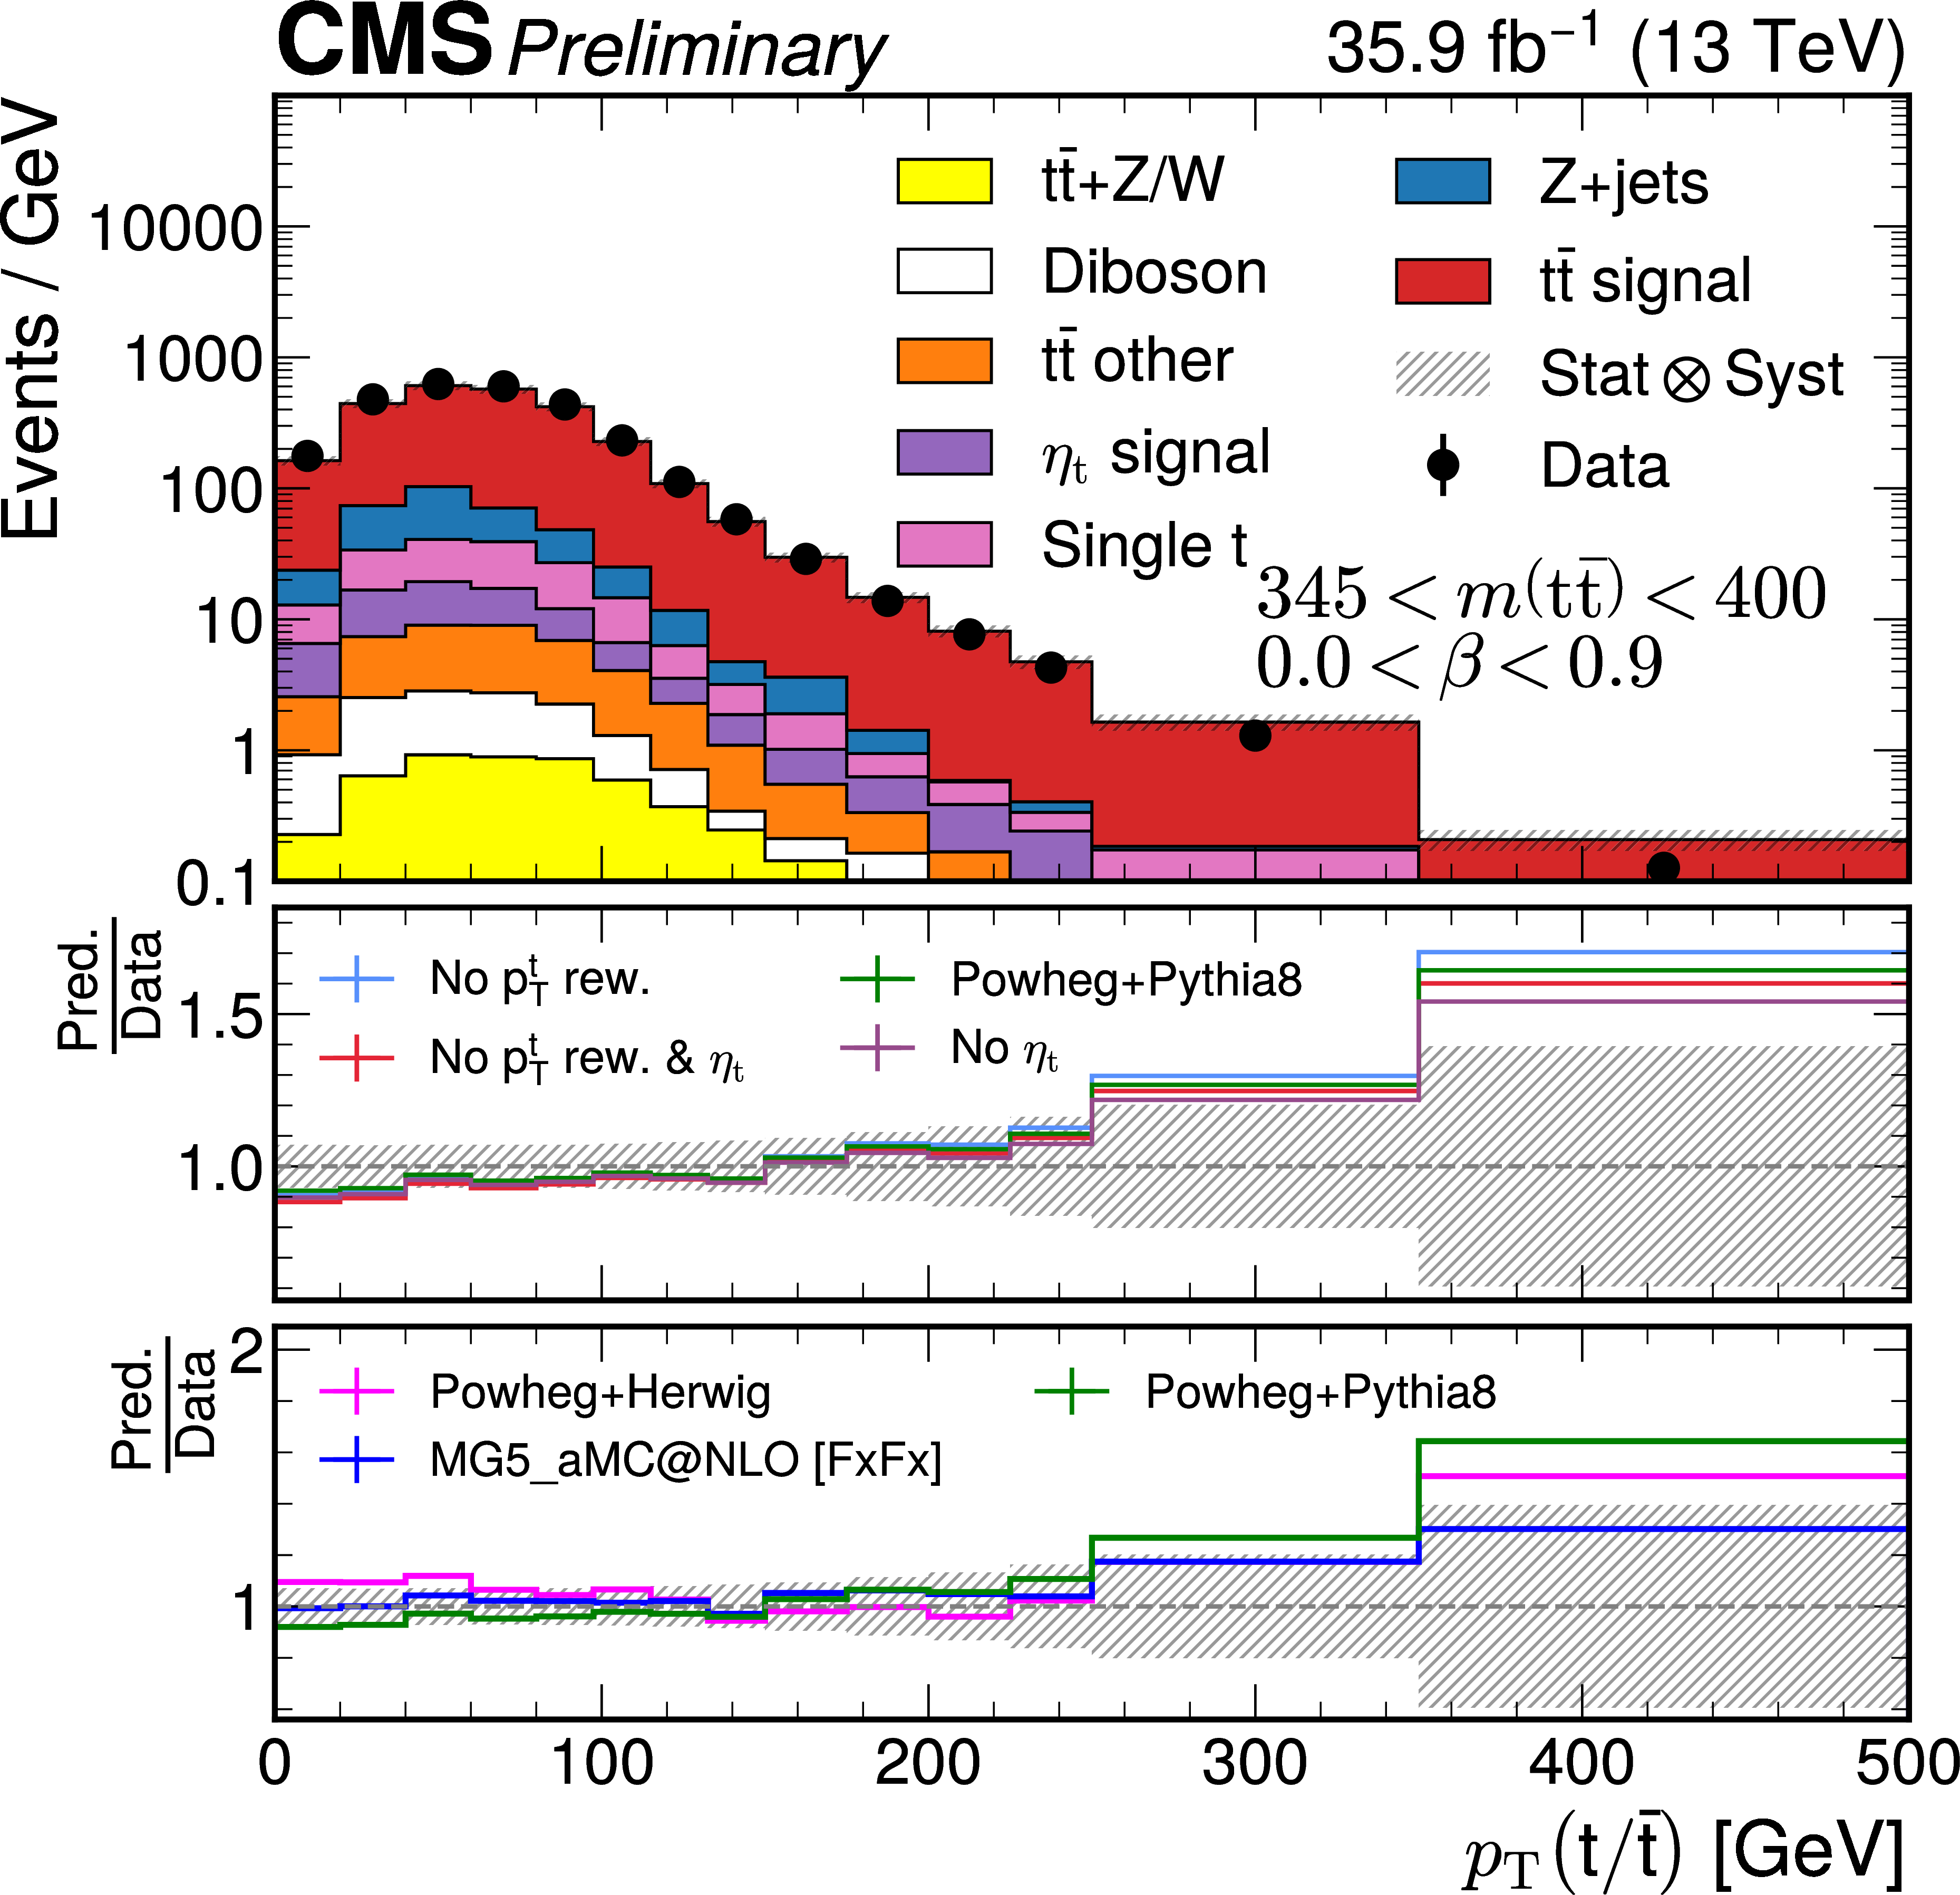
Reconstruction-level $ m({\mathrm{t}\overline{\mathrm{t}}} ) $ (left) and $ p_{\mathrm{T}}(\mathrm{t}/\overline{\mathrm{t}}) $ (right) distributions of the combined signal model in the full phase space comparing the modeling of the data by MC when not including $ \eta_{\mathrm{t}} $ (red line in upper ratio pad), no $ p_{\mathrm{T}}(\mathrm{t}/\overline{\mathrm{t}}) $ reweighting is applied (blue line in upper ratio pad), or neither of those (pink line in upper ratio pad). The lower ratio pad compares the data to POWHEGV2+HERWIG (pink line in lower ratio pad), to MG5_AMC@NLO (FXFX)+PYTHIA8 (blue line in lower ratio pad), and finally to the nominal MC including $ \eta_{\mathrm{t}} $ and $ p_{\mathrm{T}}(\mathrm{t}/\overline{\mathrm{t}}) $ reweighting (green line in lower ratio pad). |
png pdf |
Figure 3-a:
Reconstruction-level $ m({\mathrm{t}\overline{\mathrm{t}}} ) $ (left) and $ p_{\mathrm{T}}(\mathrm{t}/\overline{\mathrm{t}}) $ (right) distributions of the combined signal model in the full phase space comparing the modeling of the data by MC when not including $ \eta_{\mathrm{t}} $ (red line in upper ratio pad), no $ p_{\mathrm{T}}(\mathrm{t}/\overline{\mathrm{t}}) $ reweighting is applied (blue line in upper ratio pad), or neither of those (pink line in upper ratio pad). The lower ratio pad compares the data to POWHEGV2+HERWIG (pink line in lower ratio pad), to MG5_AMC@NLO (FXFX)+PYTHIA8 (blue line in lower ratio pad), and finally to the nominal MC including $ \eta_{\mathrm{t}} $ and $ p_{\mathrm{T}}(\mathrm{t}/\overline{\mathrm{t}}) $ reweighting (green line in lower ratio pad). |

png pdf |
Figure 3-b:
Reconstruction-level $ m({\mathrm{t}\overline{\mathrm{t}}} ) $ (left) and $ p_{\mathrm{T}}(\mathrm{t}/\overline{\mathrm{t}}) $ (right) distributions of the combined signal model in the full phase space comparing the modeling of the data by MC when not including $ \eta_{\mathrm{t}} $ (red line in upper ratio pad), no $ p_{\mathrm{T}}(\mathrm{t}/\overline{\mathrm{t}}) $ reweighting is applied (blue line in upper ratio pad), or neither of those (pink line in upper ratio pad). The lower ratio pad compares the data to POWHEGV2+HERWIG (pink line in lower ratio pad), to MG5_AMC@NLO (FXFX)+PYTHIA8 (blue line in lower ratio pad), and finally to the nominal MC including $ \eta_{\mathrm{t}} $ and $ p_{\mathrm{T}}(\mathrm{t}/\overline{\mathrm{t}}) $ reweighting (green line in lower ratio pad). |
png pdf |
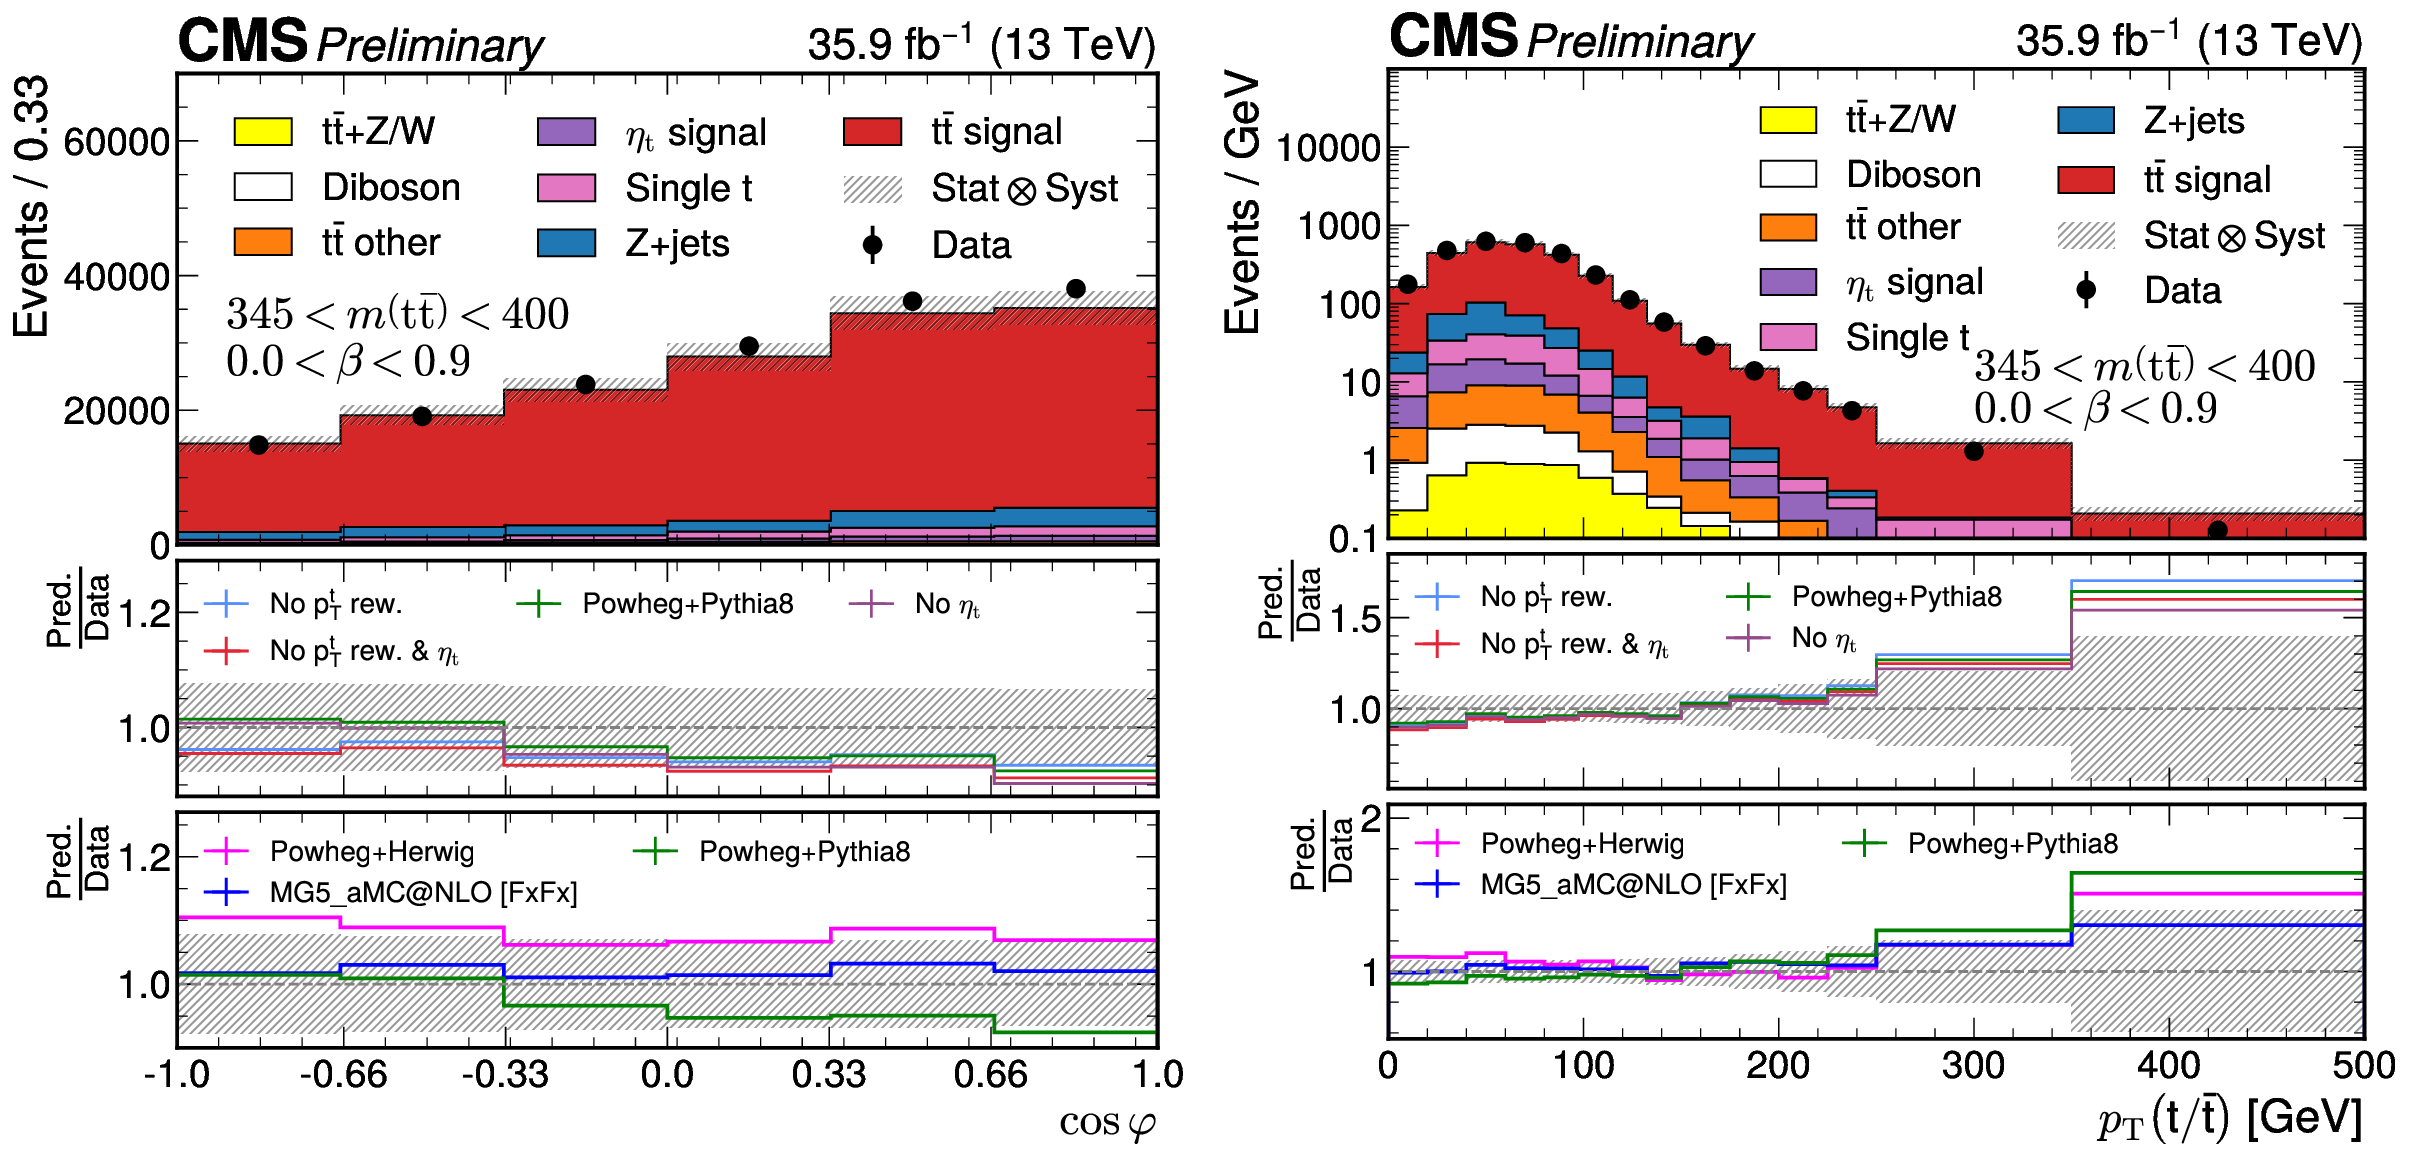
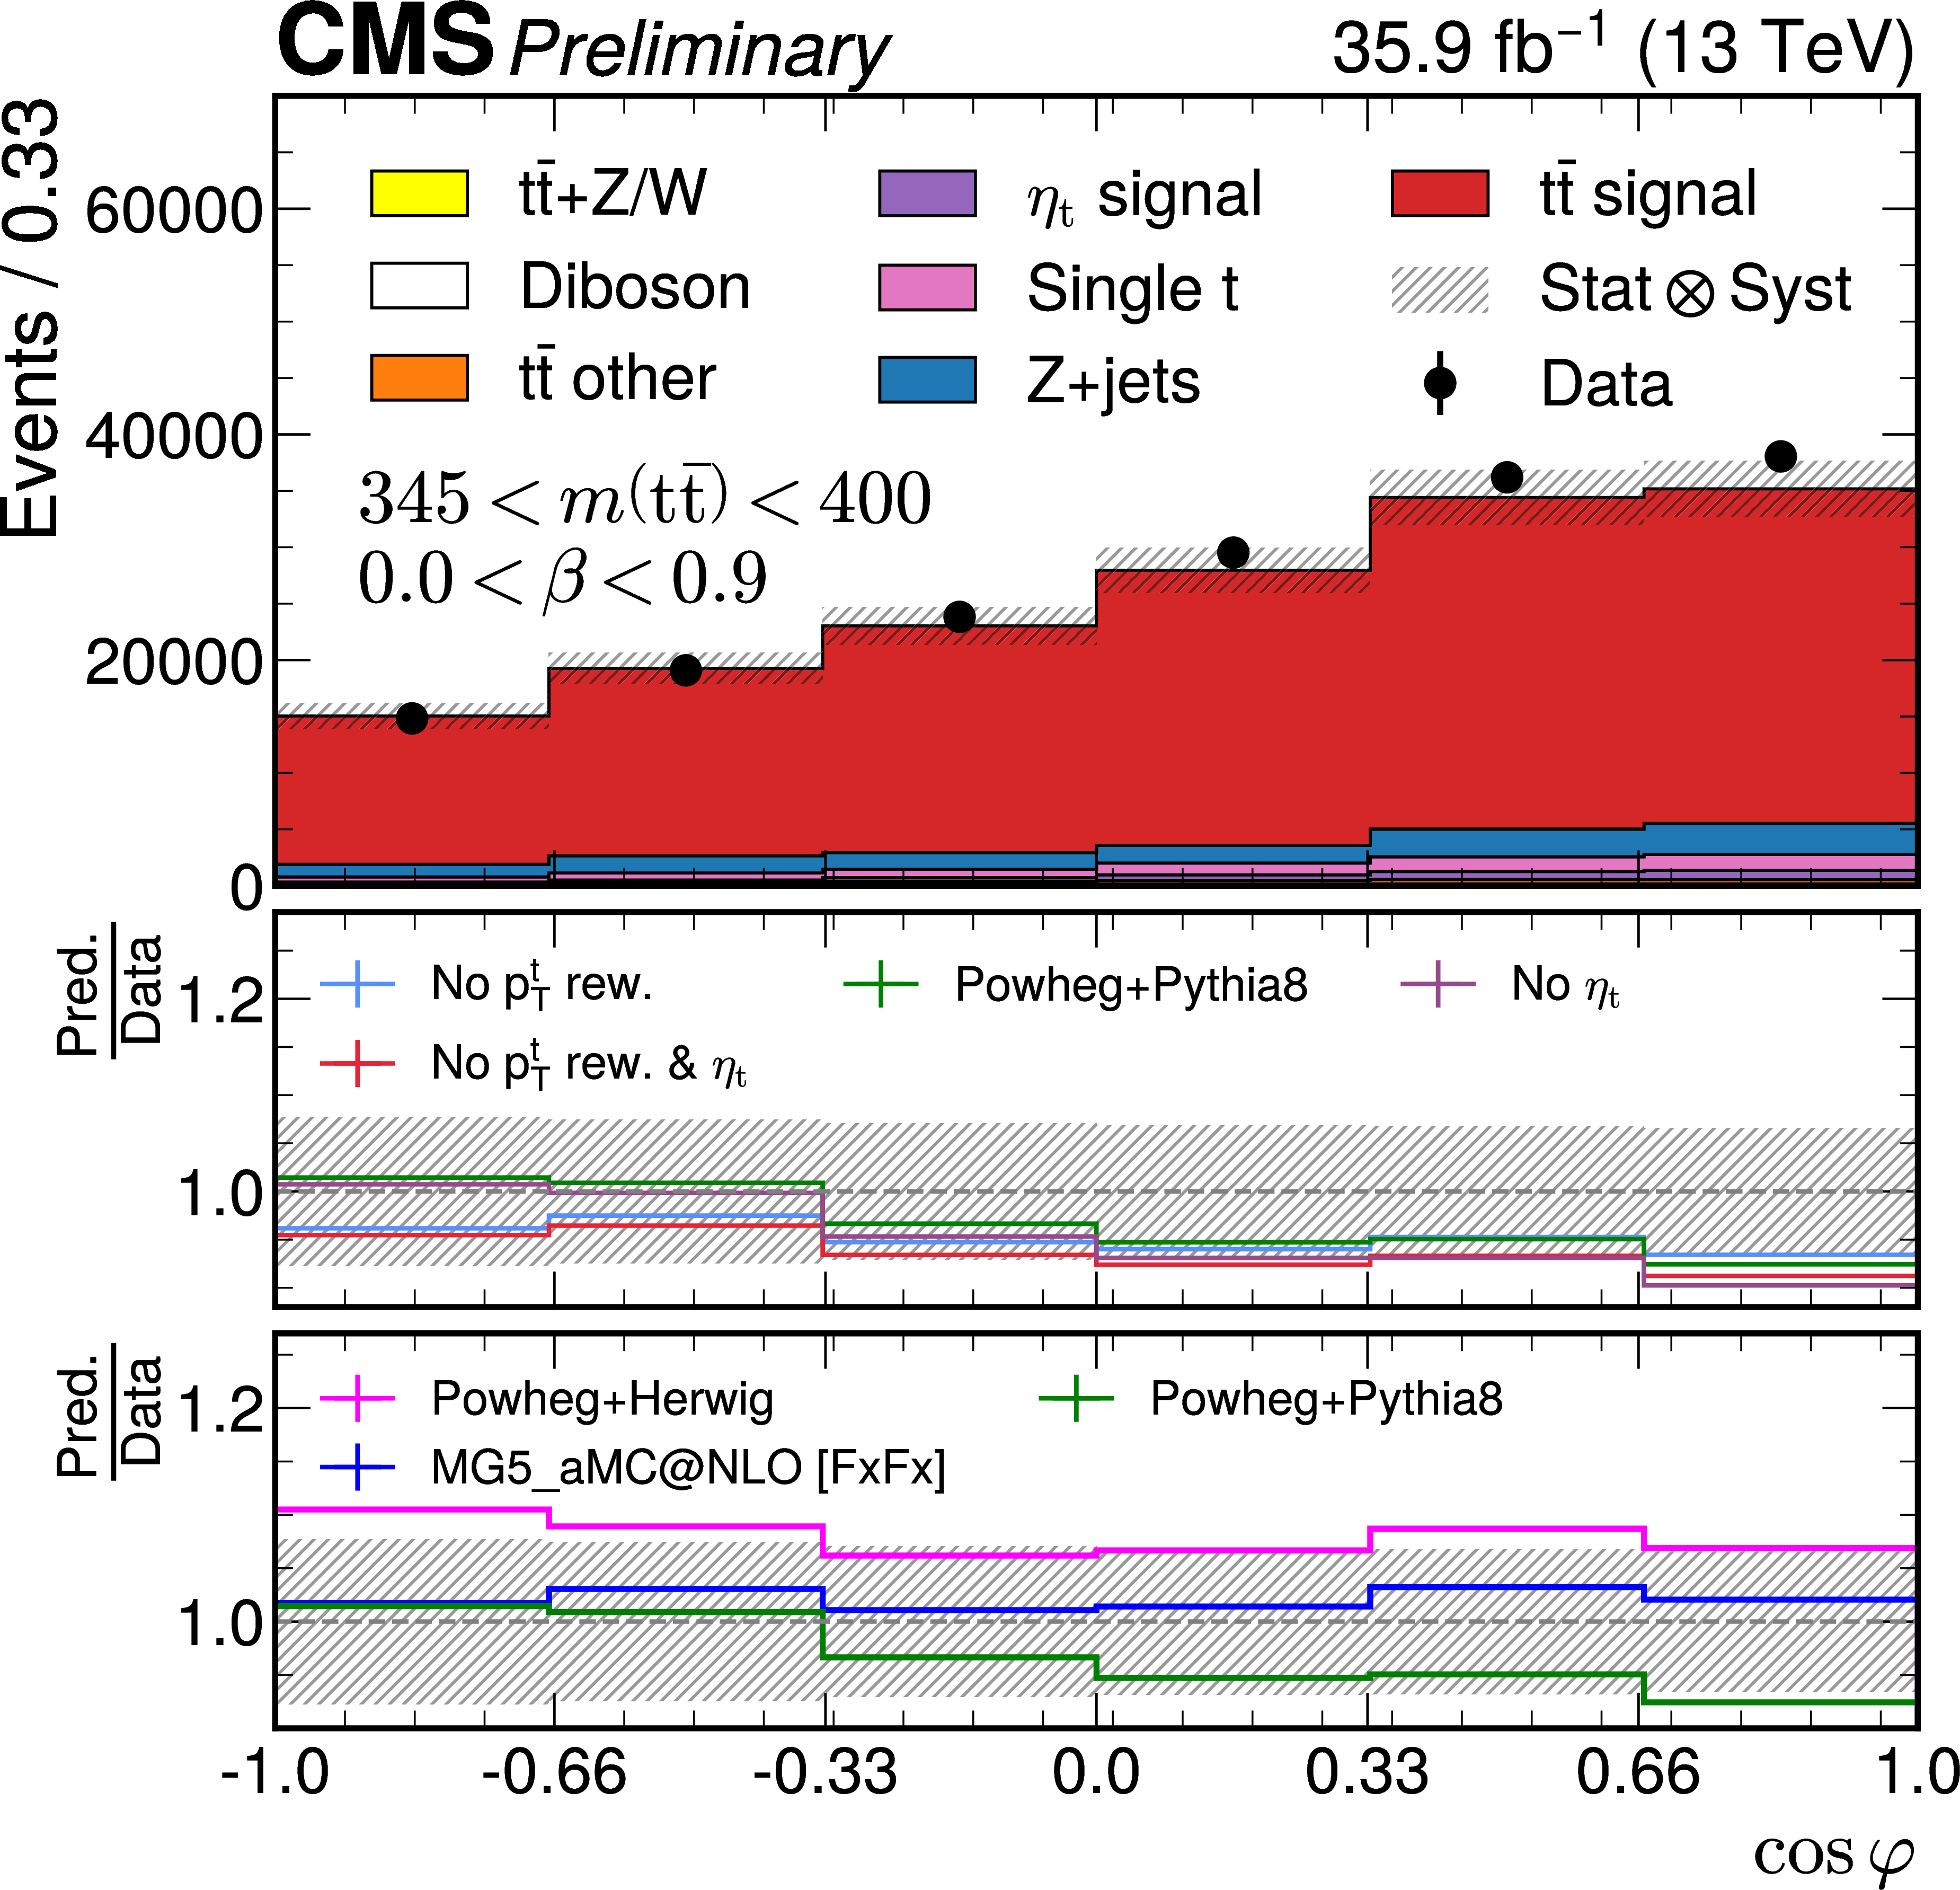
Figure 4:
Reconstruction-level distribution (left) of $ \cos \varphi $ with 345 $ < m({\mathrm{t}\overline{\mathrm{t}}} ) < $ 400 GeV and 0.0 $ < \beta < $ 0.9. On the right, the $ p_{\mathrm{T}}(\mathrm{t}/\overline{\mathrm{t}}) $ distributions is shown with the same model comparison as was done in Fig. 3. |
png pdf |
Figure 4-a:
Reconstruction-level distribution (left) of $ \cos \varphi $ with 345 $ < m({\mathrm{t}\overline{\mathrm{t}}} ) < $ 400 GeV and 0.0 $ < \beta < $ 0.9. On the right, the $ p_{\mathrm{T}}(\mathrm{t}/\overline{\mathrm{t}}) $ distributions is shown with the same model comparison as was done in Fig. 3. |
png pdf |
Figure 4-b:
Reconstruction-level distribution (left) of $ \cos \varphi $ with 345 $ < m({\mathrm{t}\overline{\mathrm{t}}} ) < $ 400 GeV and 0.0 $ < \beta < $ 0.9. On the right, the $ p_{\mathrm{T}}(\mathrm{t}/\overline{\mathrm{t}}) $ distributions is shown with the same model comparison as was done in Fig. 3. |
png pdf |
Figure 5:
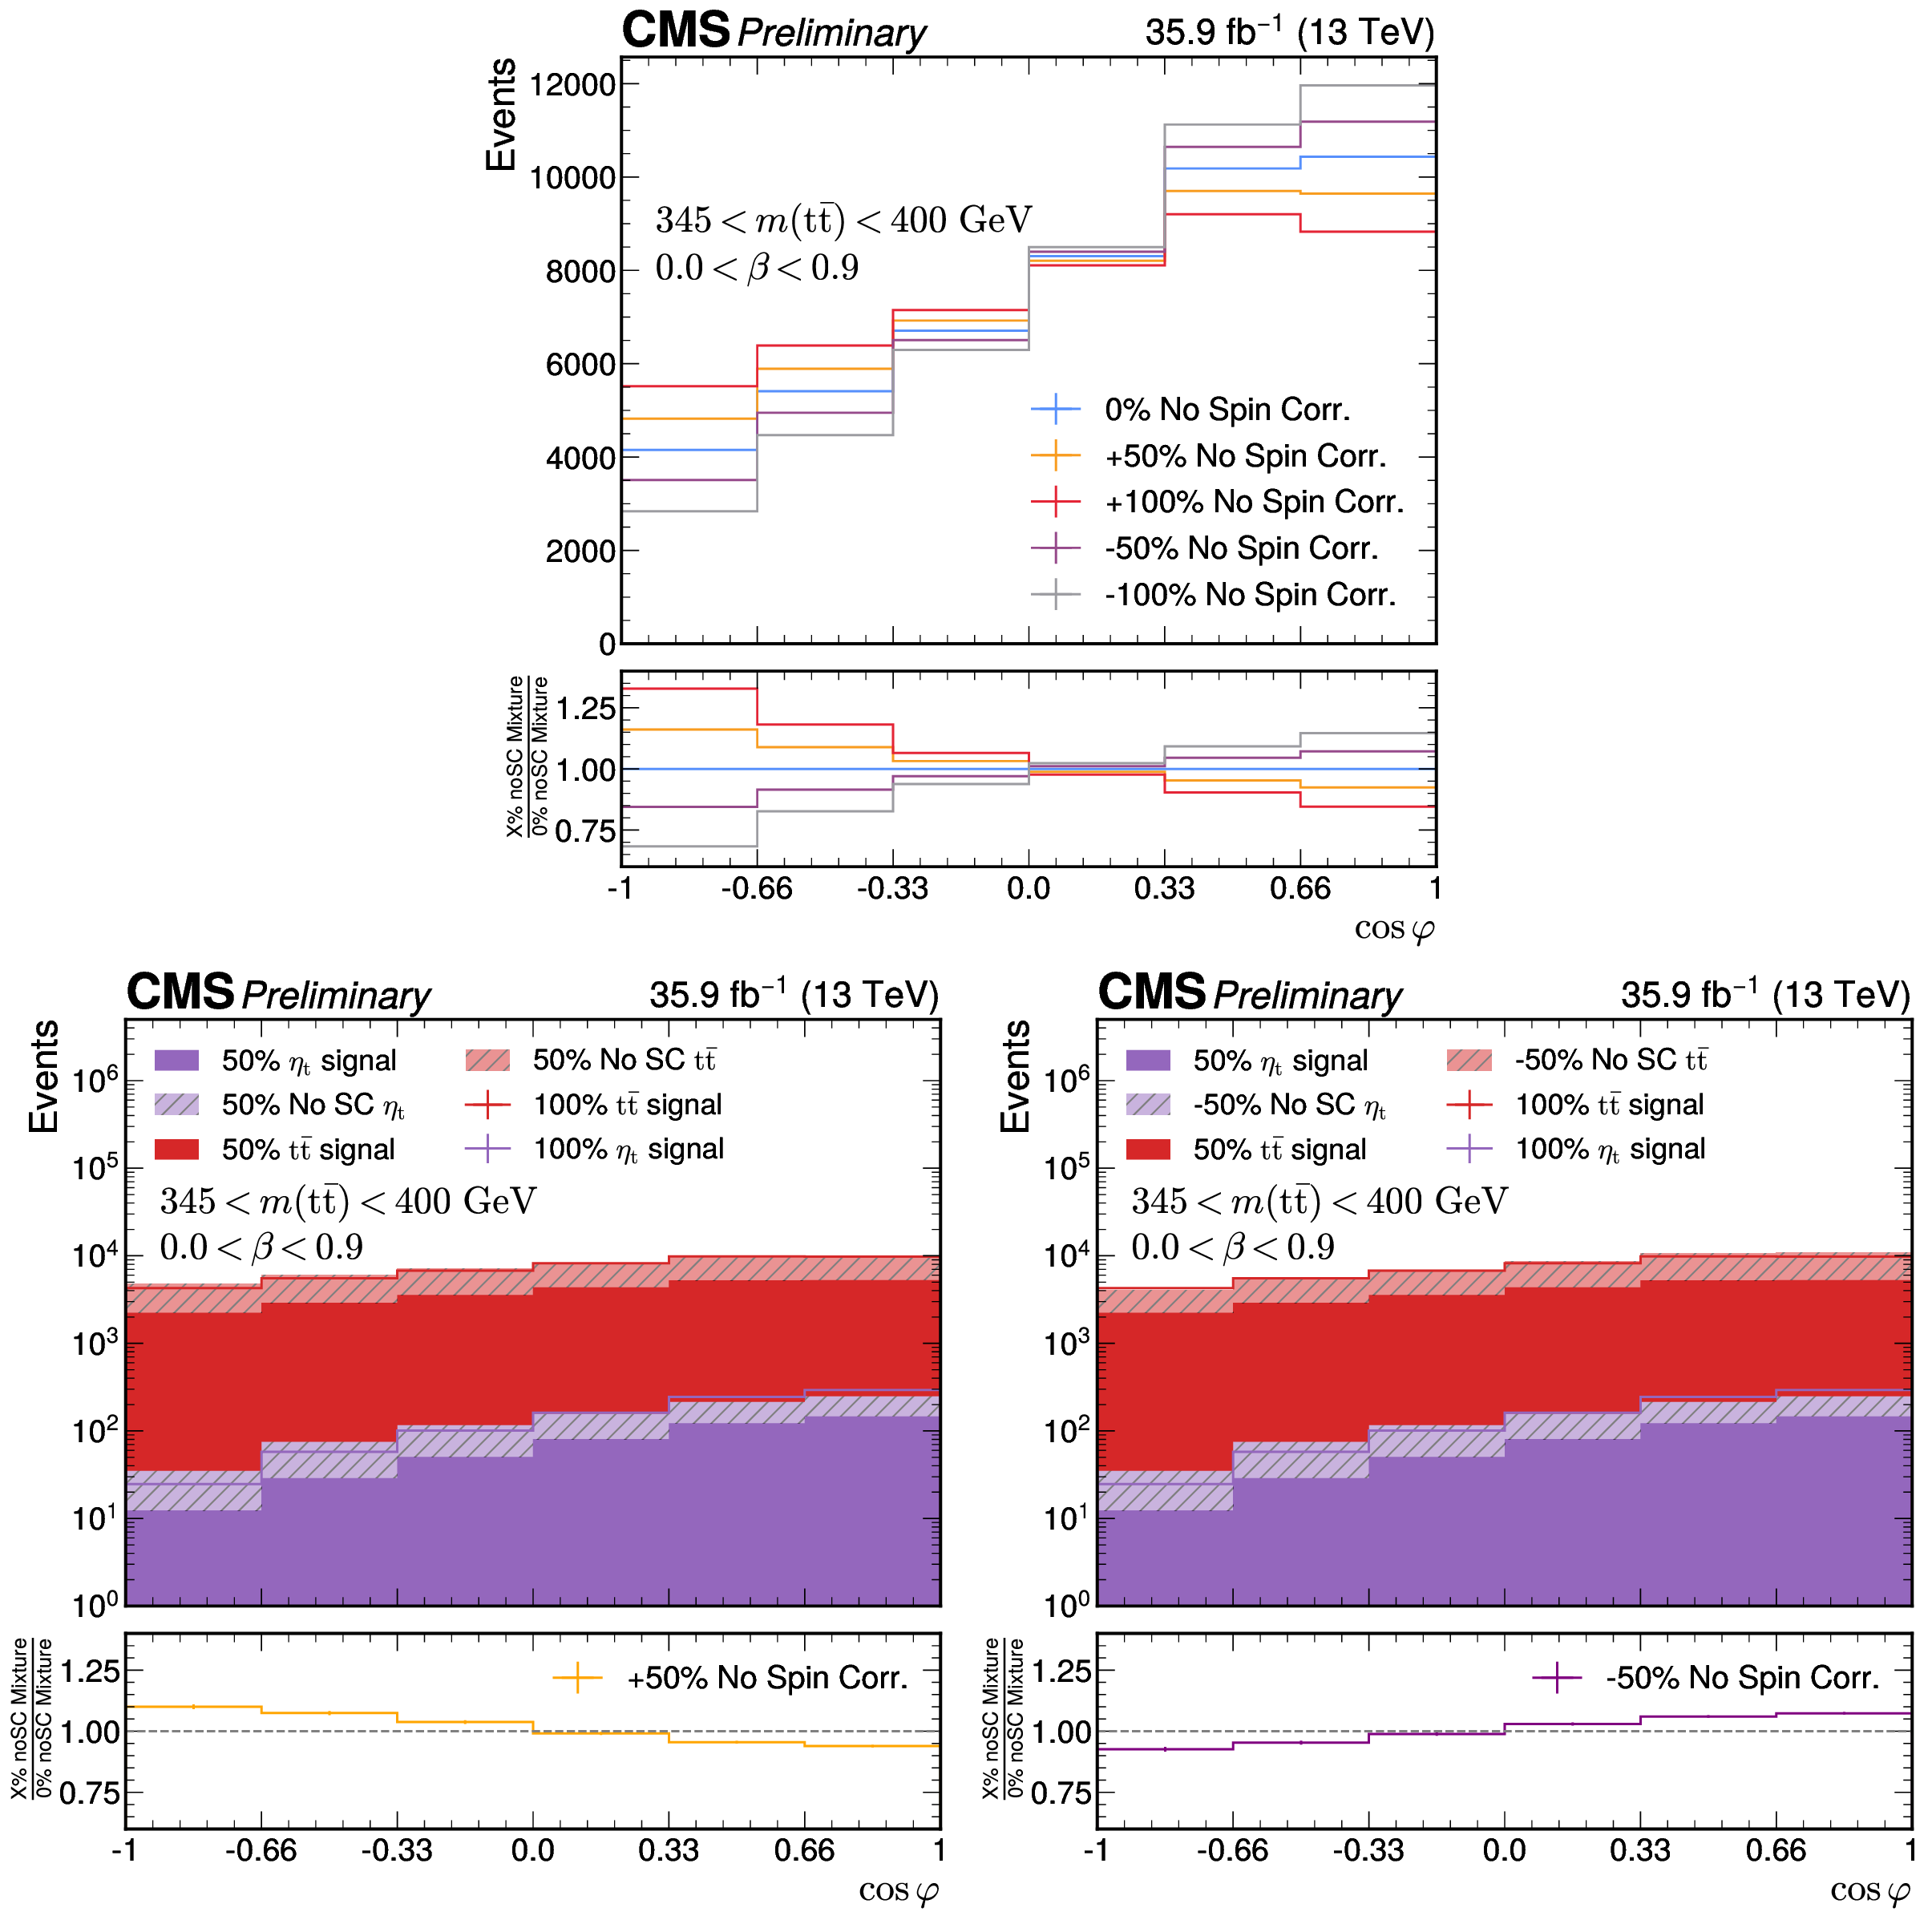
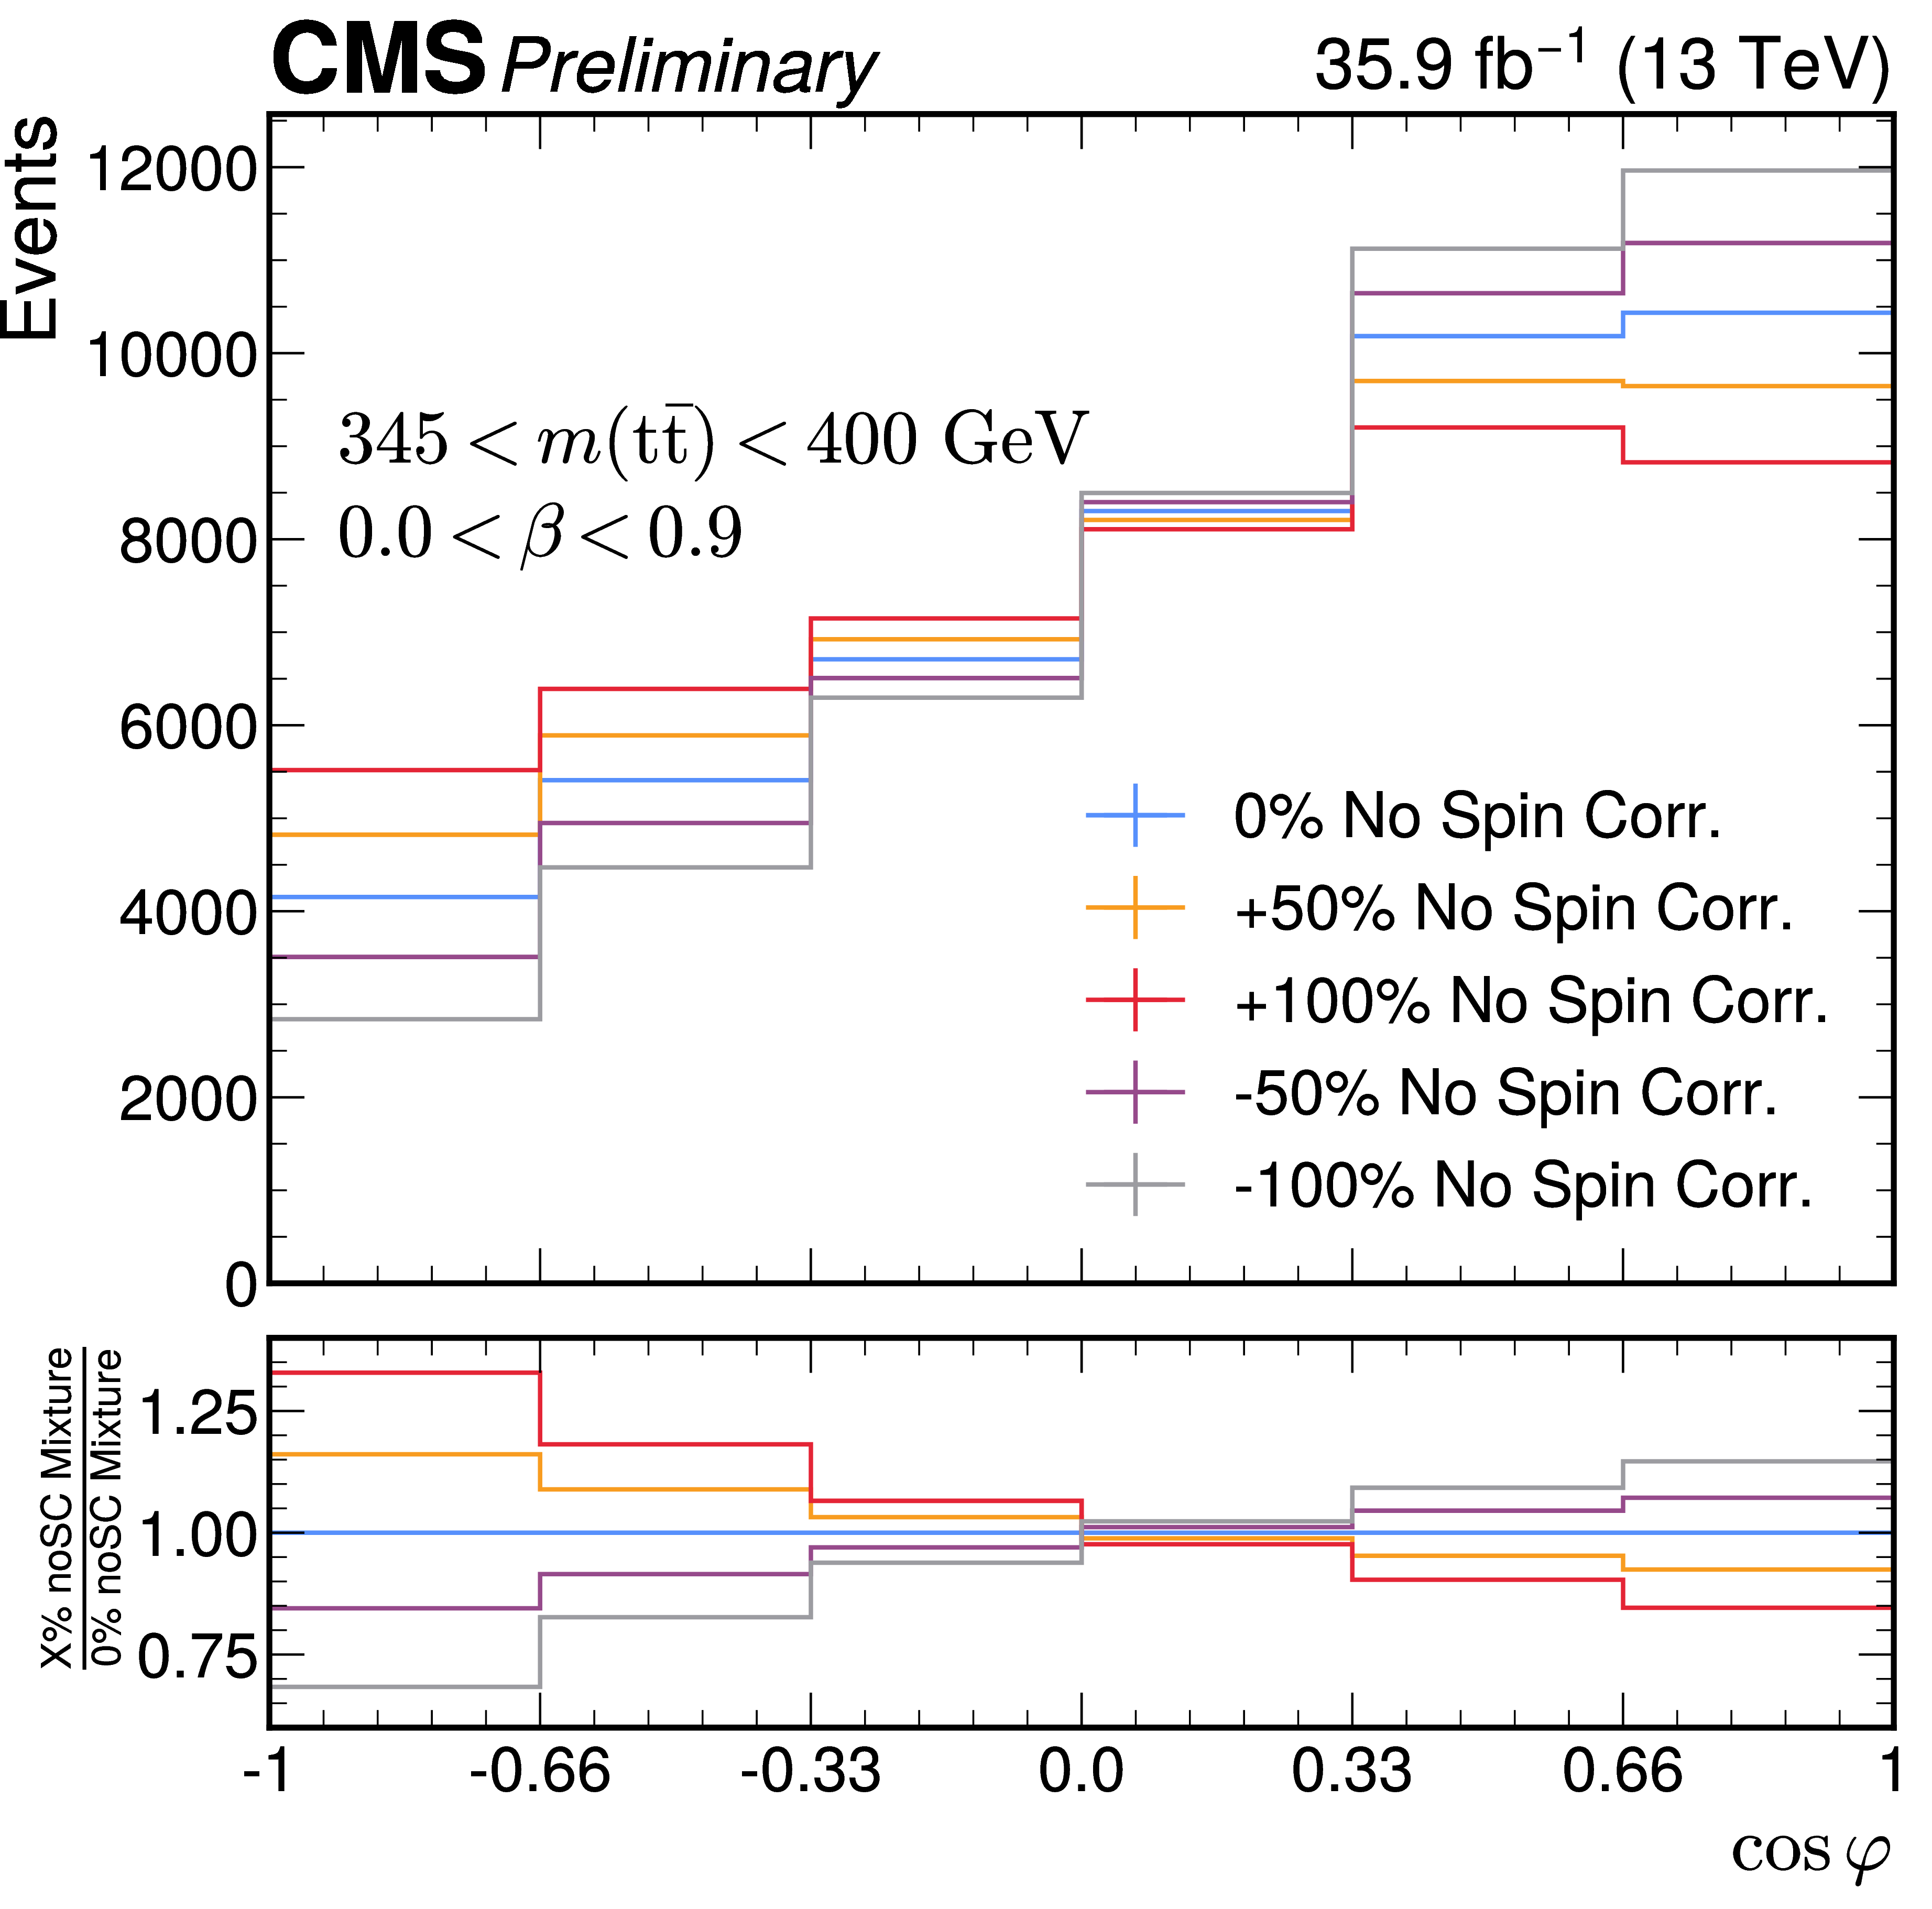
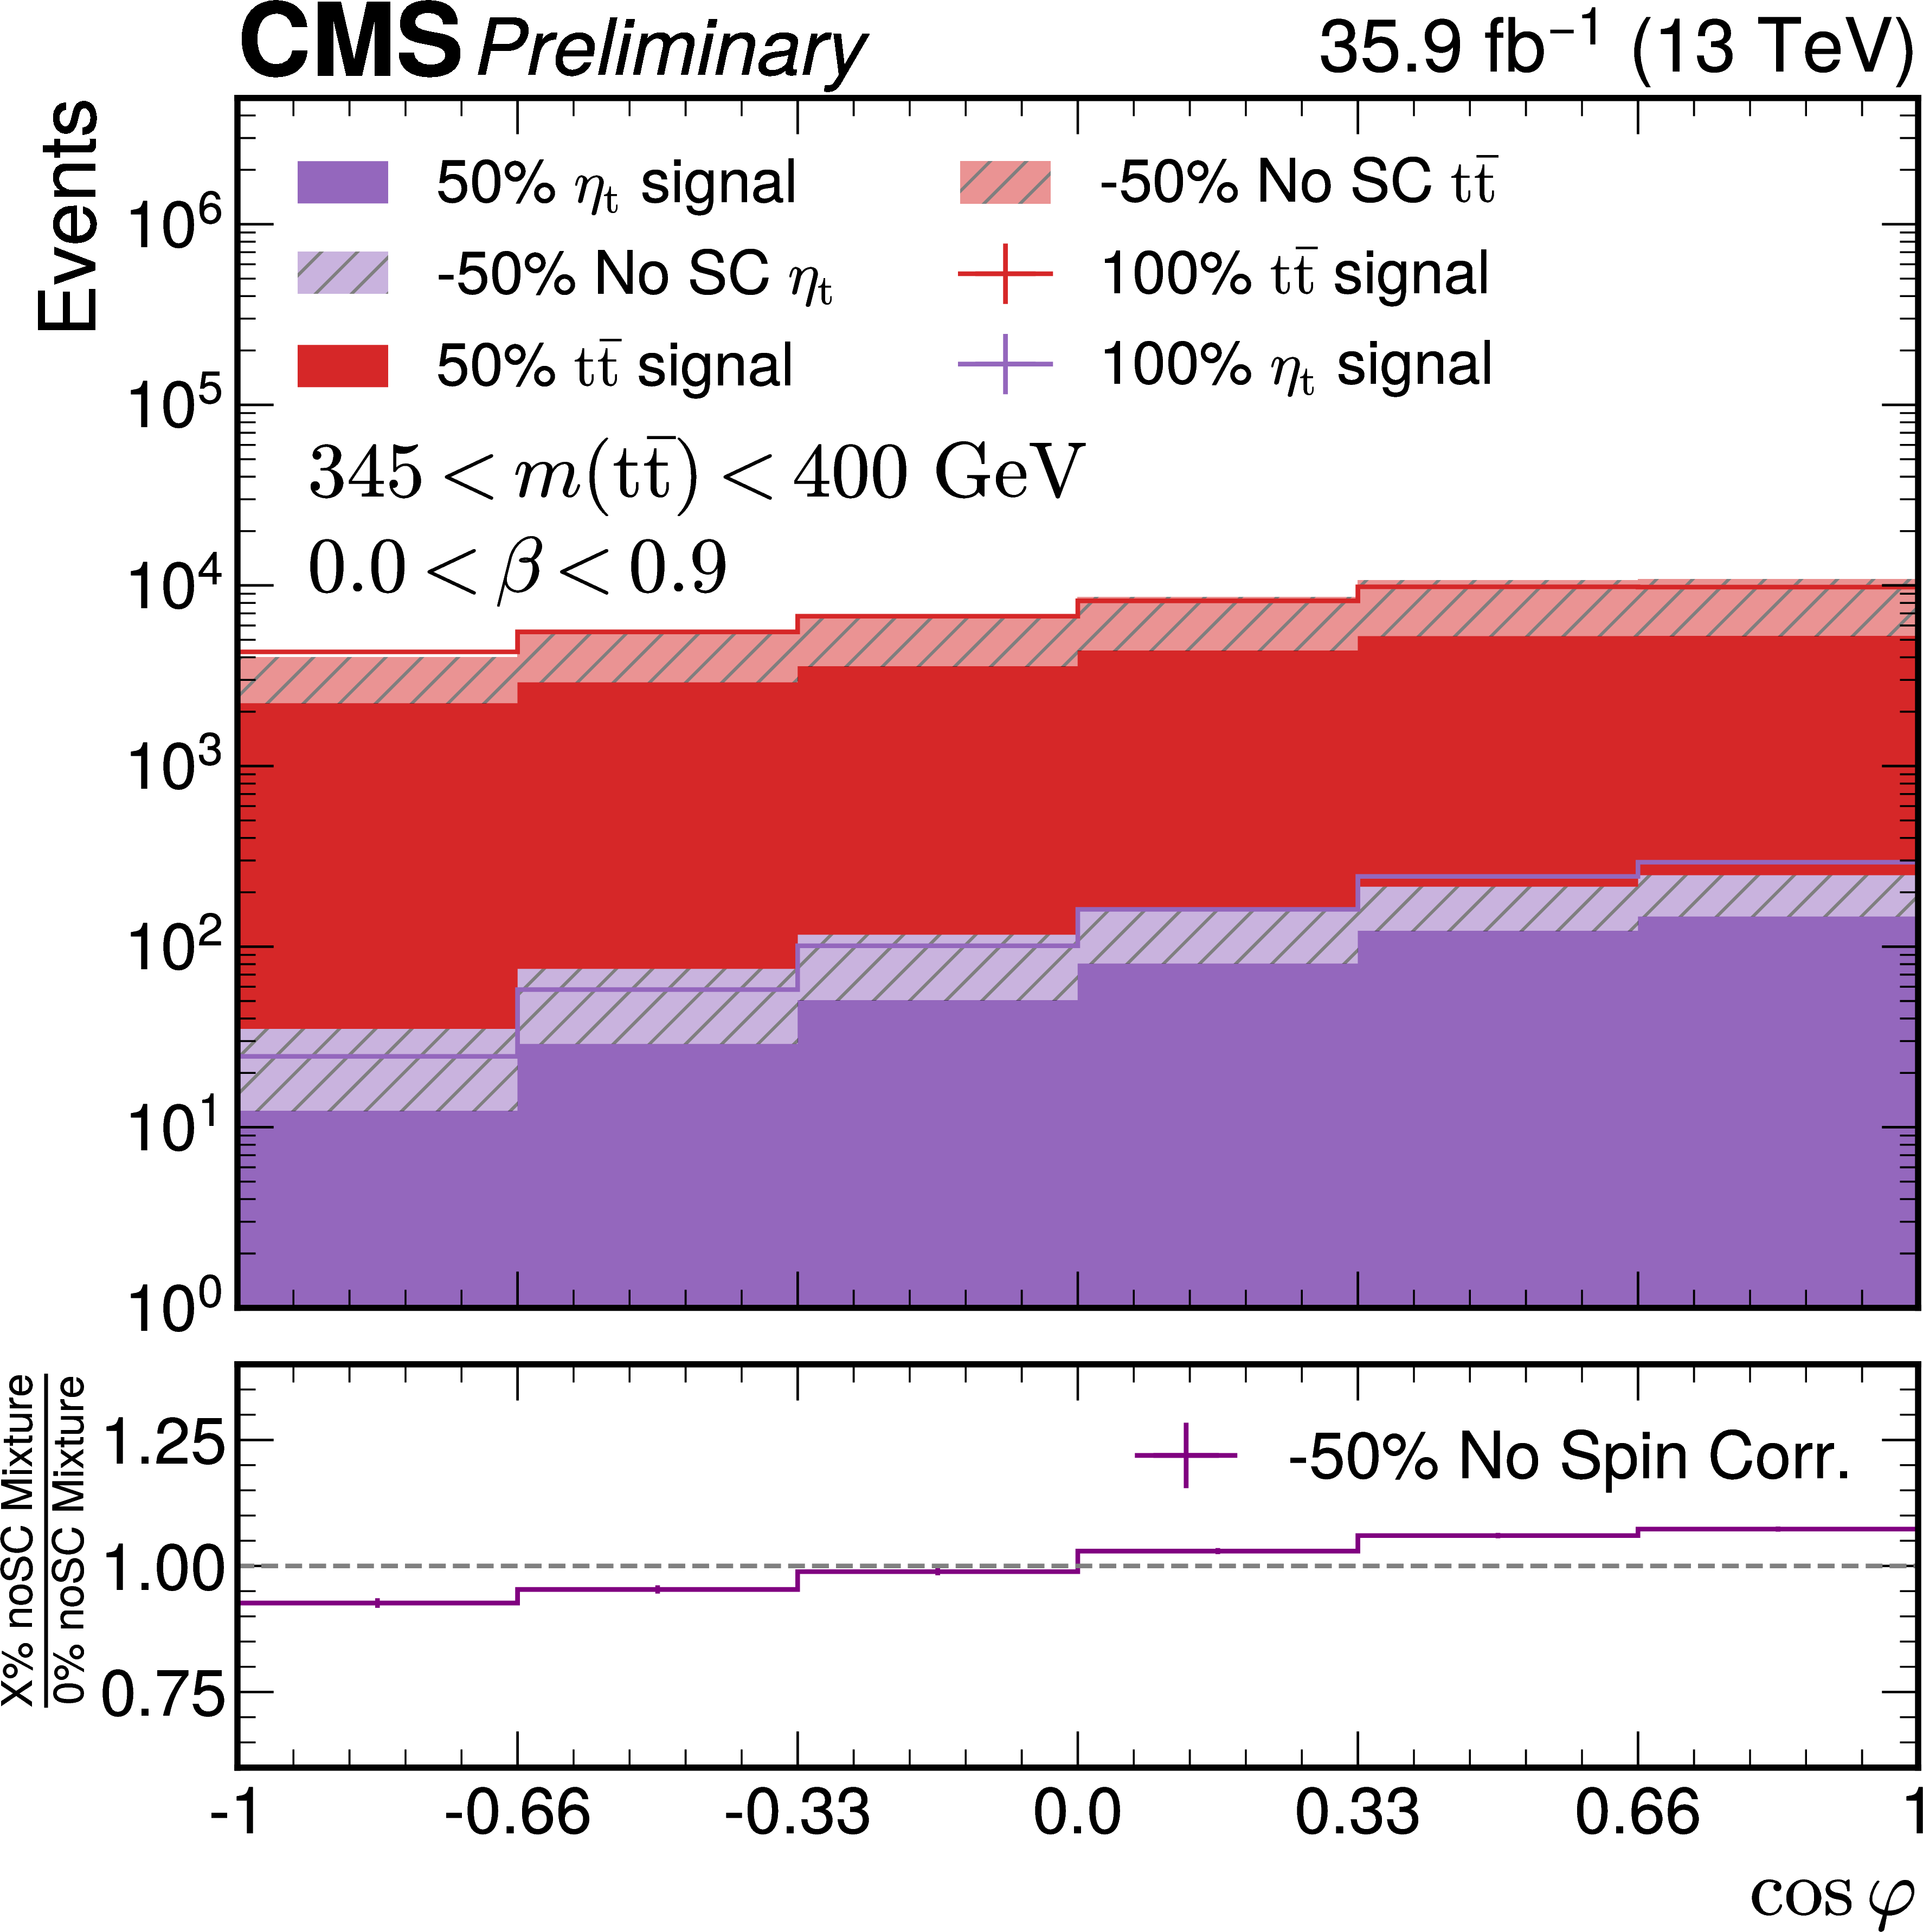
Reconstruction-level distribution (top) of the combined $ \mathrm{t} \overline{\mathrm{t}} $ + $ \eta_{\mathrm{t}} $ signal model in mixtures of the noSC combined signal sample, more details in the text. Template variations are shown as a function of $ \cos \varphi $ in the phase space of 345 $ < m({\mathrm{t}\overline{\mathrm{t}}} ) < $ 400 GeV and 0.0 $ < \beta < $ 0.9 for a $+$50% mixture of SC and noSC (bottom left) and a $-$50% mixture (bottom right). |
png pdf |
Figure 5-a:
Reconstruction-level distribution (top) of the combined $ \mathrm{t} \overline{\mathrm{t}} $ + $ \eta_{\mathrm{t}} $ signal model in mixtures of the noSC combined signal sample, more details in the text. Template variations are shown as a function of $ \cos \varphi $ in the phase space of 345 $ < m({\mathrm{t}\overline{\mathrm{t}}} ) < $ 400 GeV and 0.0 $ < \beta < $ 0.9 for a $+$50% mixture of SC and noSC (bottom left) and a $-$50% mixture (bottom right). |

png pdf |
Figure 5-b:
Reconstruction-level distribution (top) of the combined $ \mathrm{t} \overline{\mathrm{t}} $ + $ \eta_{\mathrm{t}} $ signal model in mixtures of the noSC combined signal sample, more details in the text. Template variations are shown as a function of $ \cos \varphi $ in the phase space of 345 $ < m({\mathrm{t}\overline{\mathrm{t}}} ) < $ 400 GeV and 0.0 $ < \beta < $ 0.9 for a $+$50% mixture of SC and noSC (bottom left) and a $-$50% mixture (bottom right). |
png pdf |
Figure 5-c:
Reconstruction-level distribution (top) of the combined $ \mathrm{t} \overline{\mathrm{t}} $ + $ \eta_{\mathrm{t}} $ signal model in mixtures of the noSC combined signal sample, more details in the text. Template variations are shown as a function of $ \cos \varphi $ in the phase space of 345 $ < m({\mathrm{t}\overline{\mathrm{t}}} ) < $ 400 GeV and 0.0 $ < \beta < $ 0.9 for a $+$50% mixture of SC and noSC (bottom left) and a $-$50% mixture (bottom right). |

png pdf |
Figure 6:
Postfit detector level distribution of $ \cos \varphi \otimes m({\mathrm{t}\overline{\mathrm{t}}} ) $ for 345 $ < m({\mathrm{t}\overline{\mathrm{t}}} ) < $ 400 GeV and 0.0 $ < \beta < $ 0.9. |
png pdf |
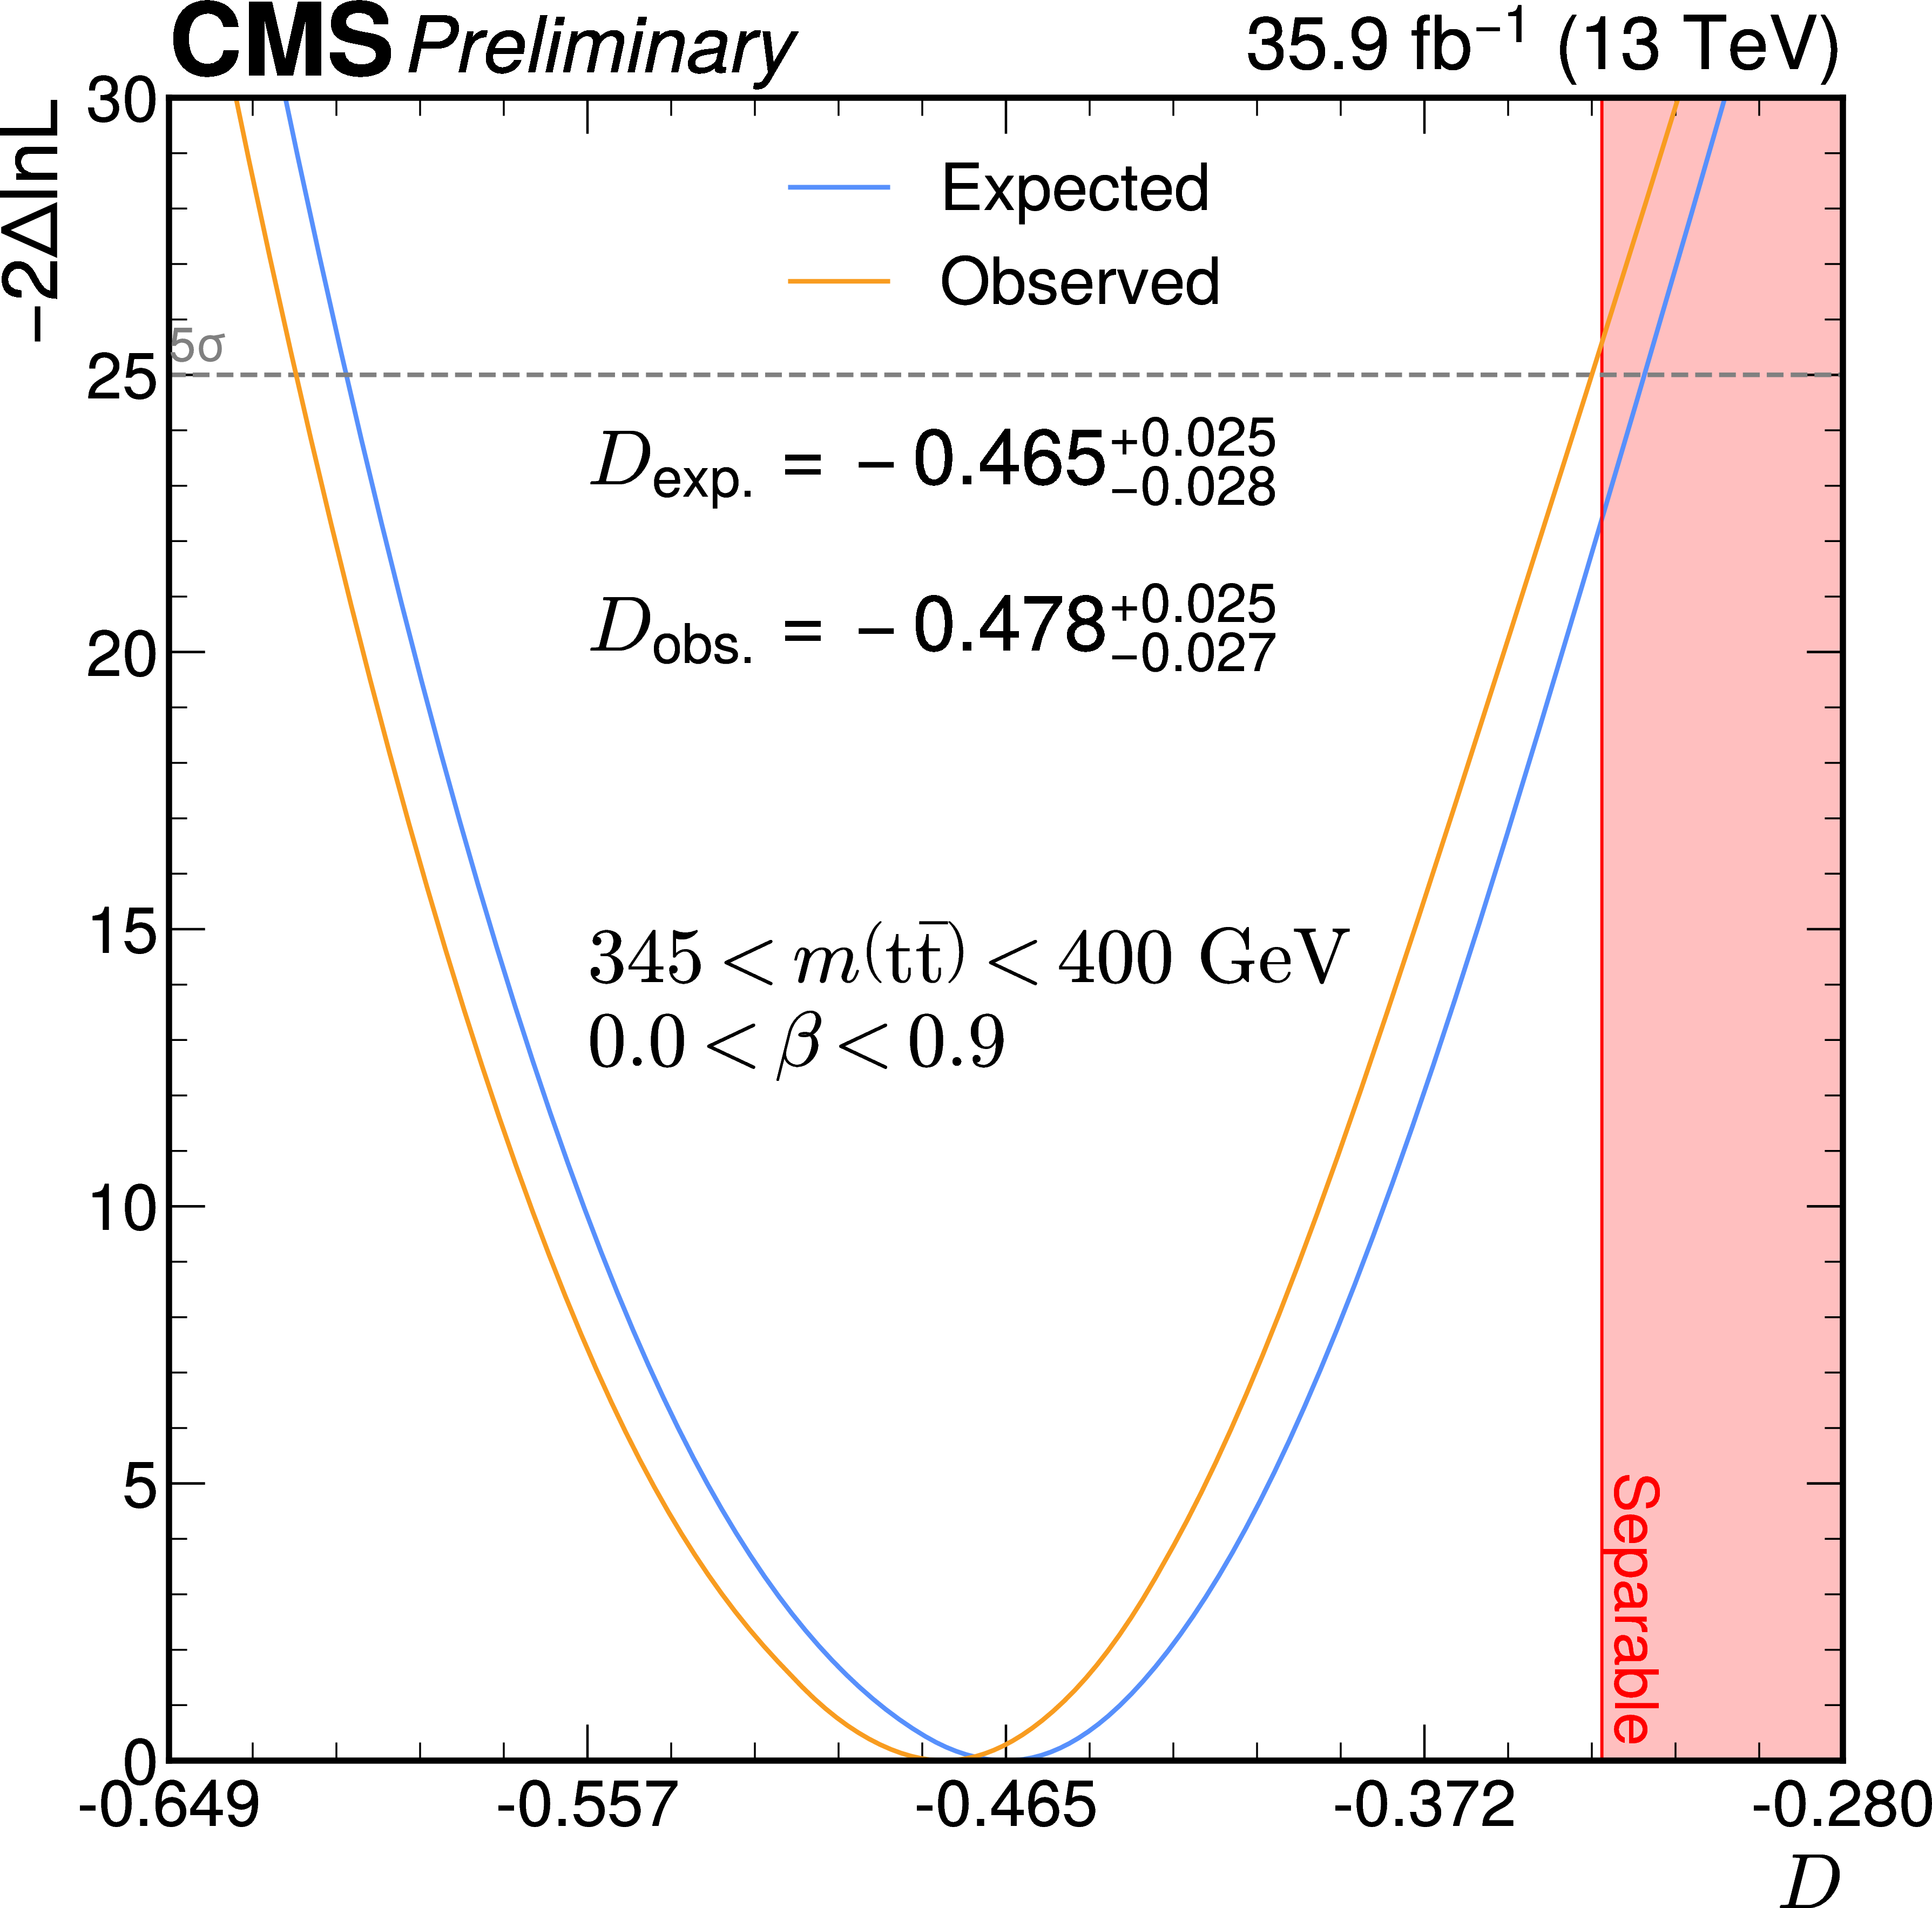
Figure 7:
Result of the scan of the quantity $ -2\ln L $ resulting from a maximum likelihood fit as a function of the parameter of interest, $ D $. The region where entanglement is not implied ($ D > -1/ $ 3) is indicated by the pink shading. |
png pdf |
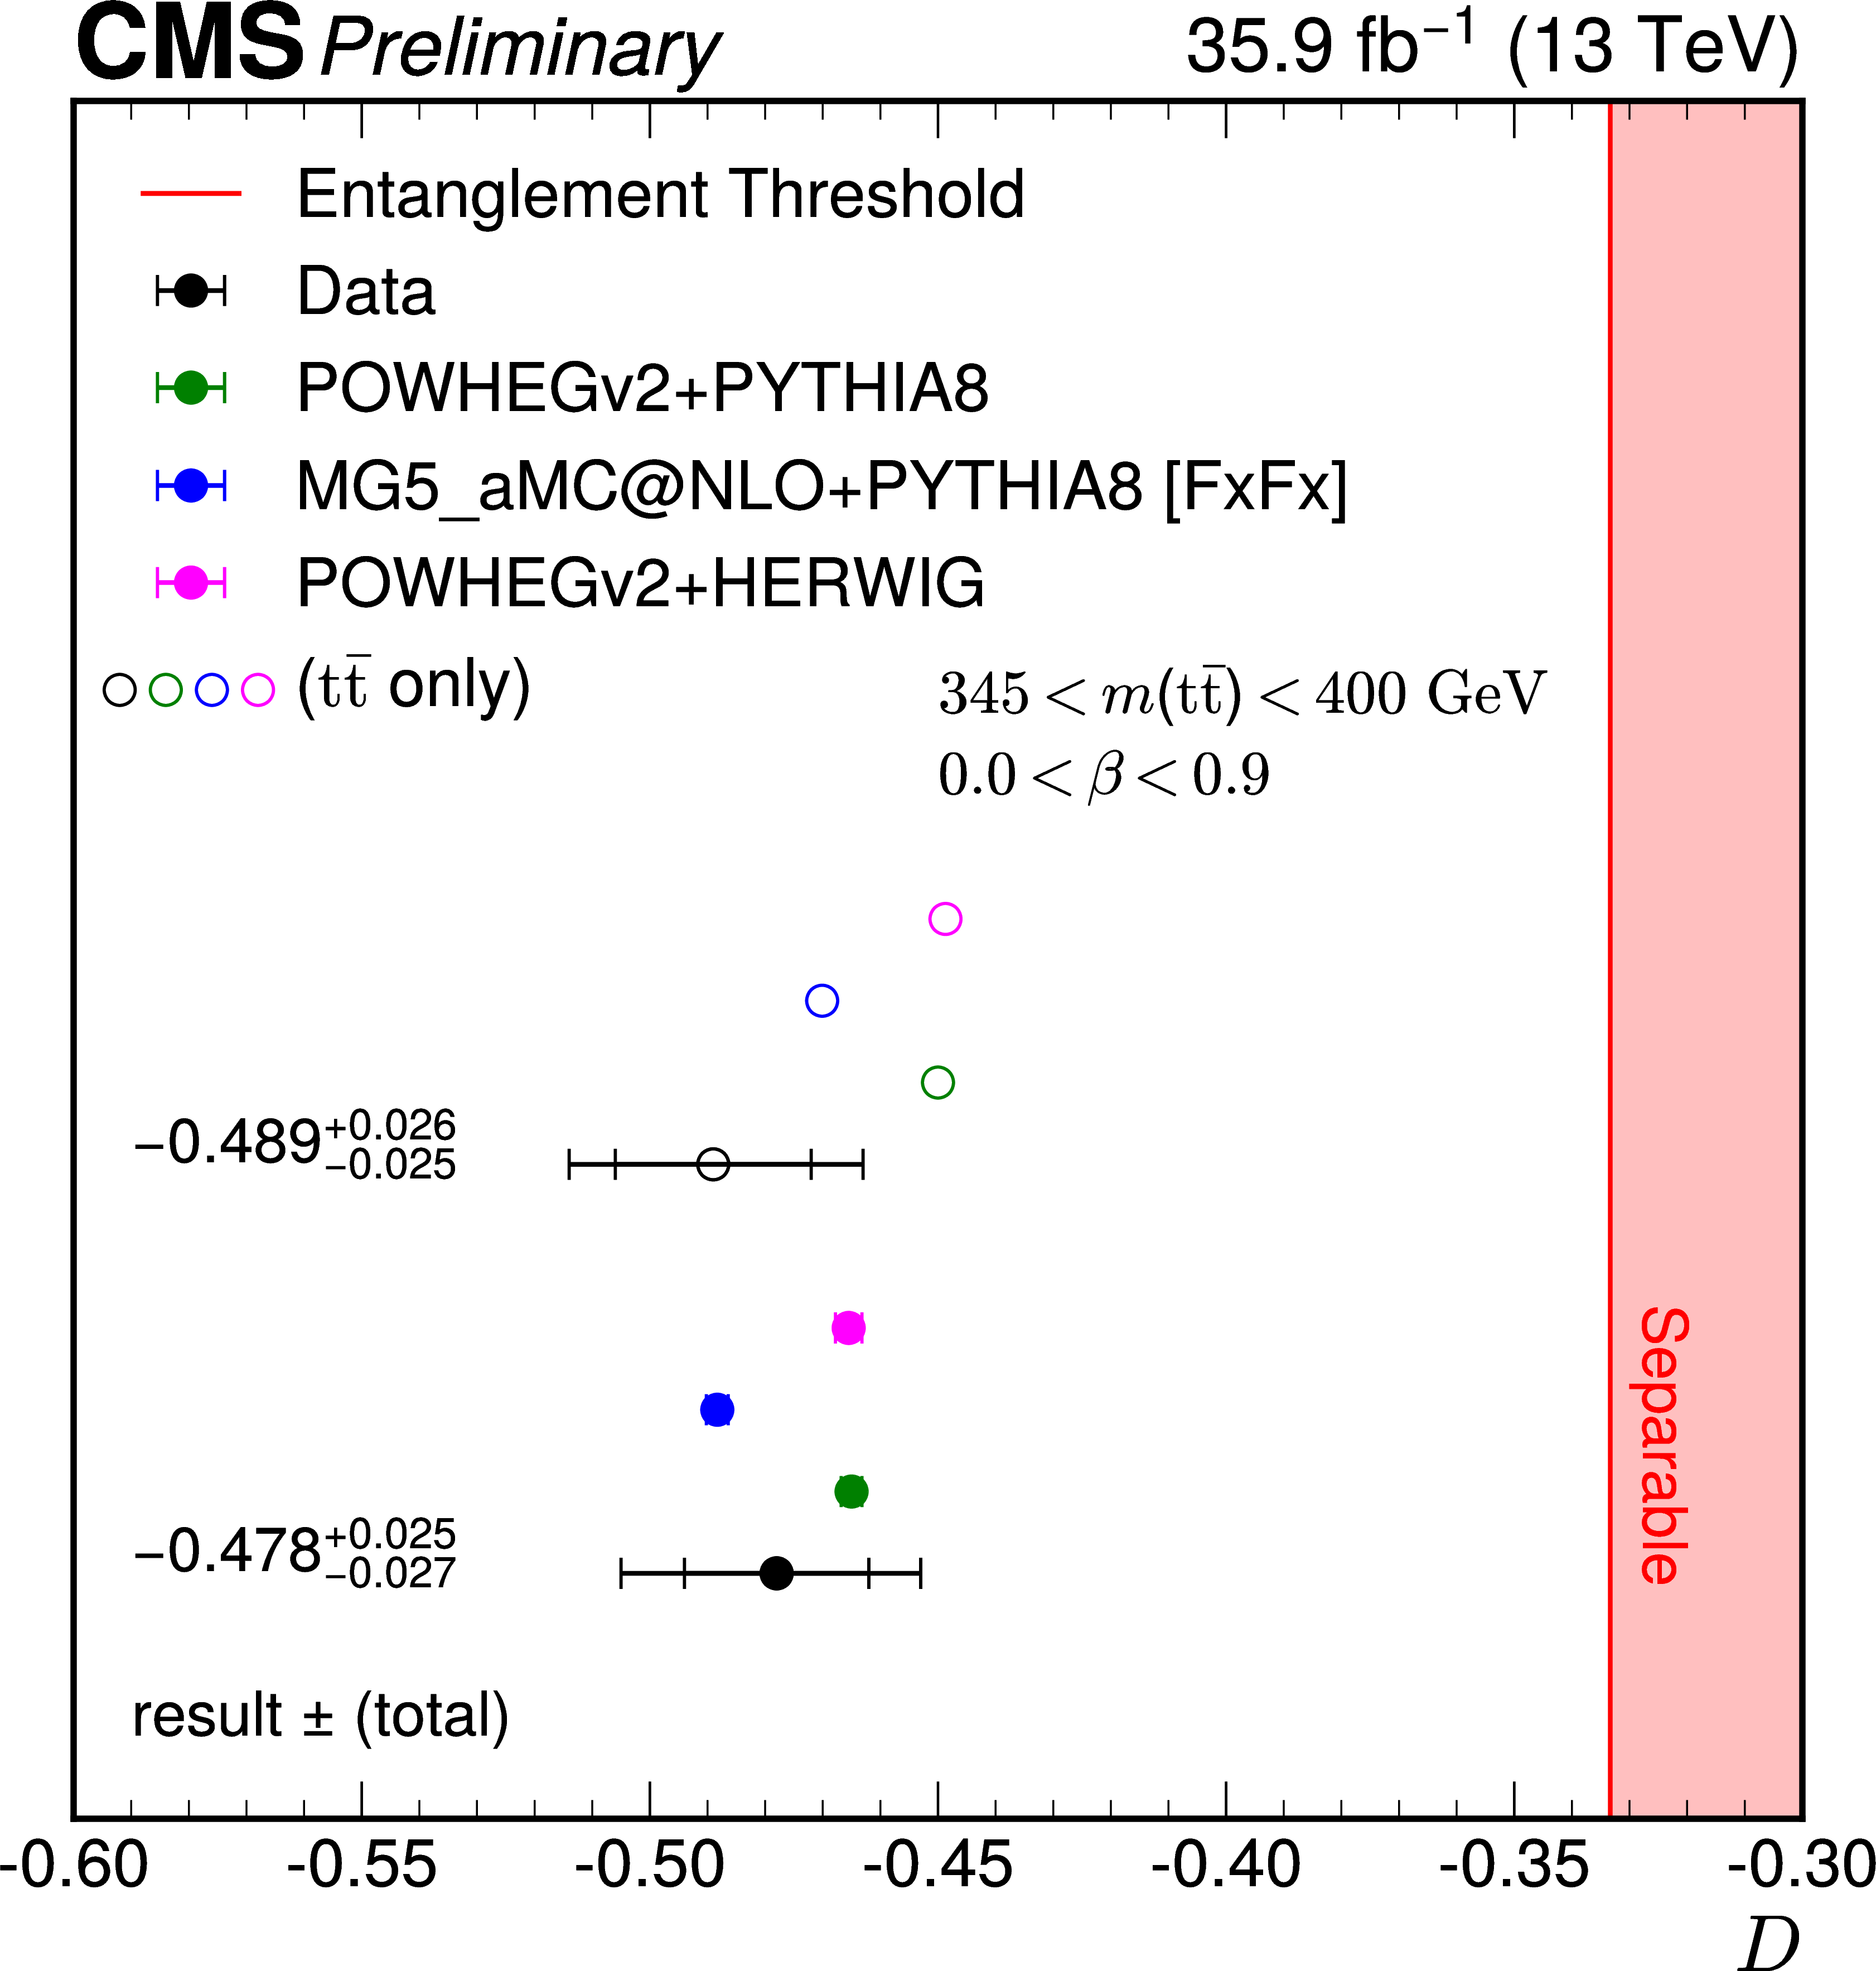
Figure 8:
Summary of the measurement of the entanglement proxy $ D $ compared with the SM expectations including (filled) or not including (open) contributions from the hypothetical toponium state. |
| Tables | |

png pdf |
Table 1:
The number of observed and predicted events categorized into signal and background contributions. All selection requirements are applied, i.e., the final event yield includes all requirements. Finally, we also apply an electroweak correction to the MC signal samples of $ \mathrm{t} \overline{\mathrm{t}} $ and $ \eta_{\mathrm{t}} $. The uncertainties reflect those originating from the limited MC sample size. The ``Only $ \eta_{\mathrm{t}} $" contribution is not added to the total MC prediction since it is included in the combined signal contribution. |
png pdf |
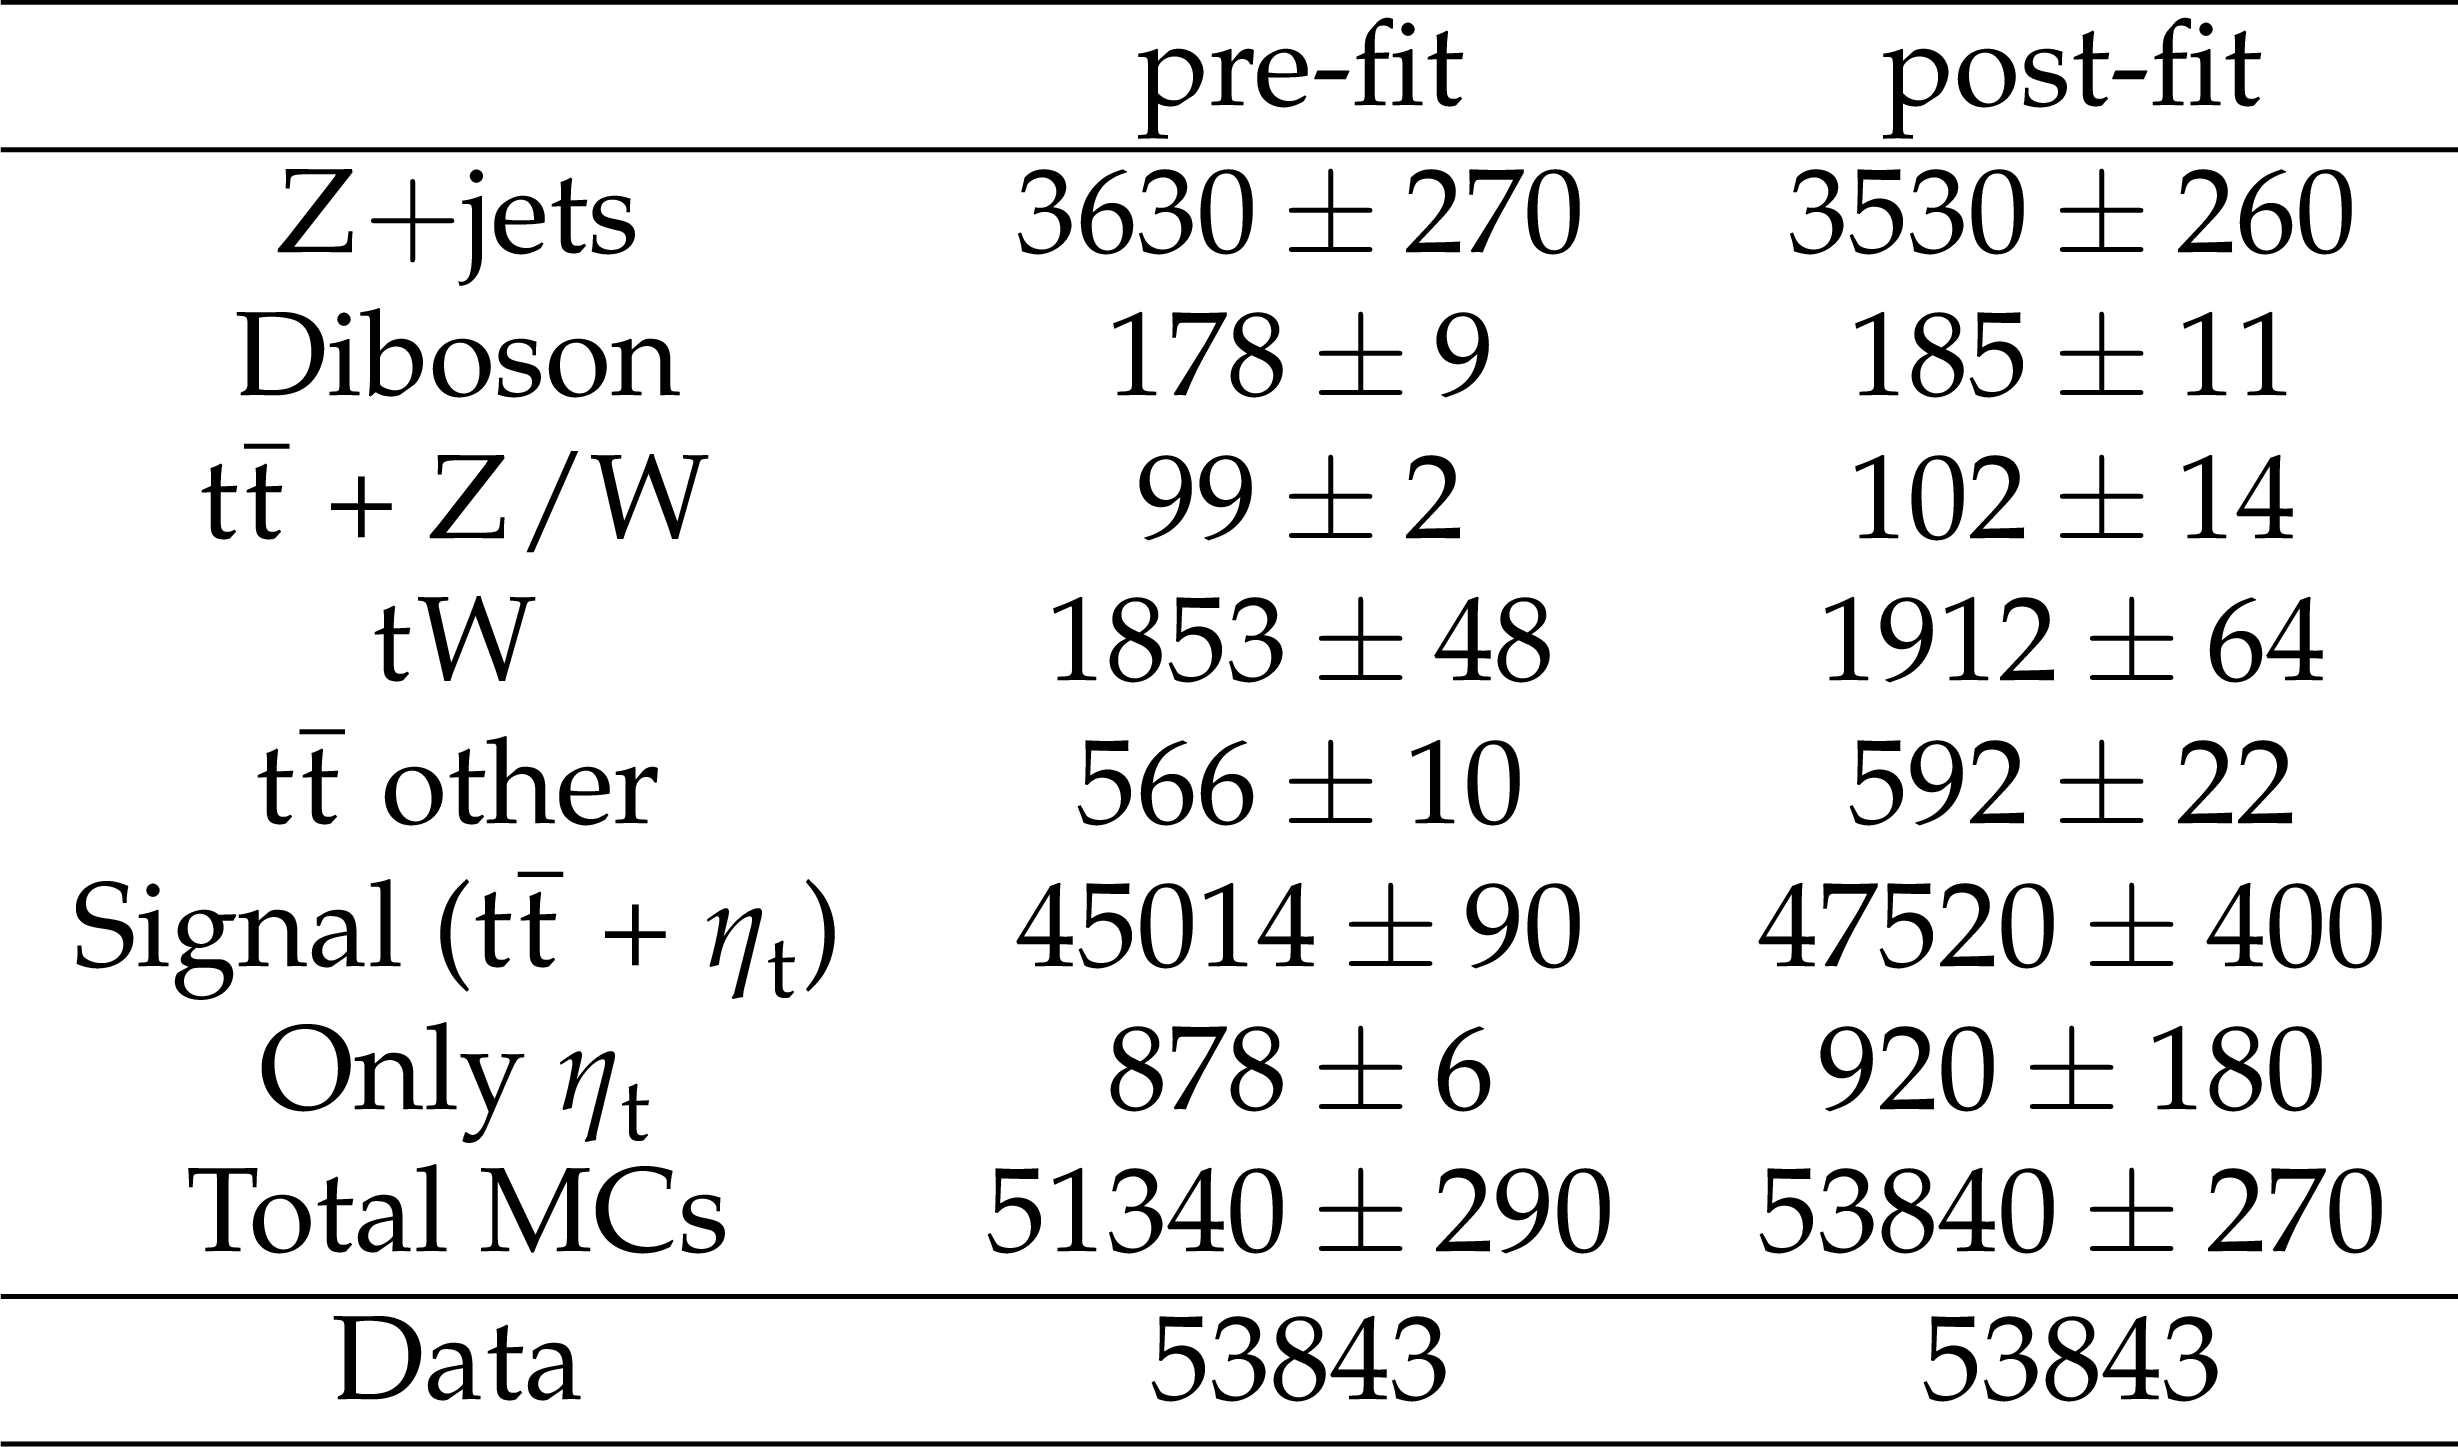
Table 2:
The number of predicted and observed events in the finally selected phase space, before the fit to the data (pre-fit) and with their best fit normalizations (post-fit). The uncertainties in the pre-fit yields originate from limited MC statistics, while for the uncertainties of post-fit yields total uncertainties including systematic ones are provided (but without correlations). Please note that the ``Only $ \eta_{\mathrm{t}} $" contribution is not added to the total MC prediction since it is included in the combined signal contribution. |
png pdf |
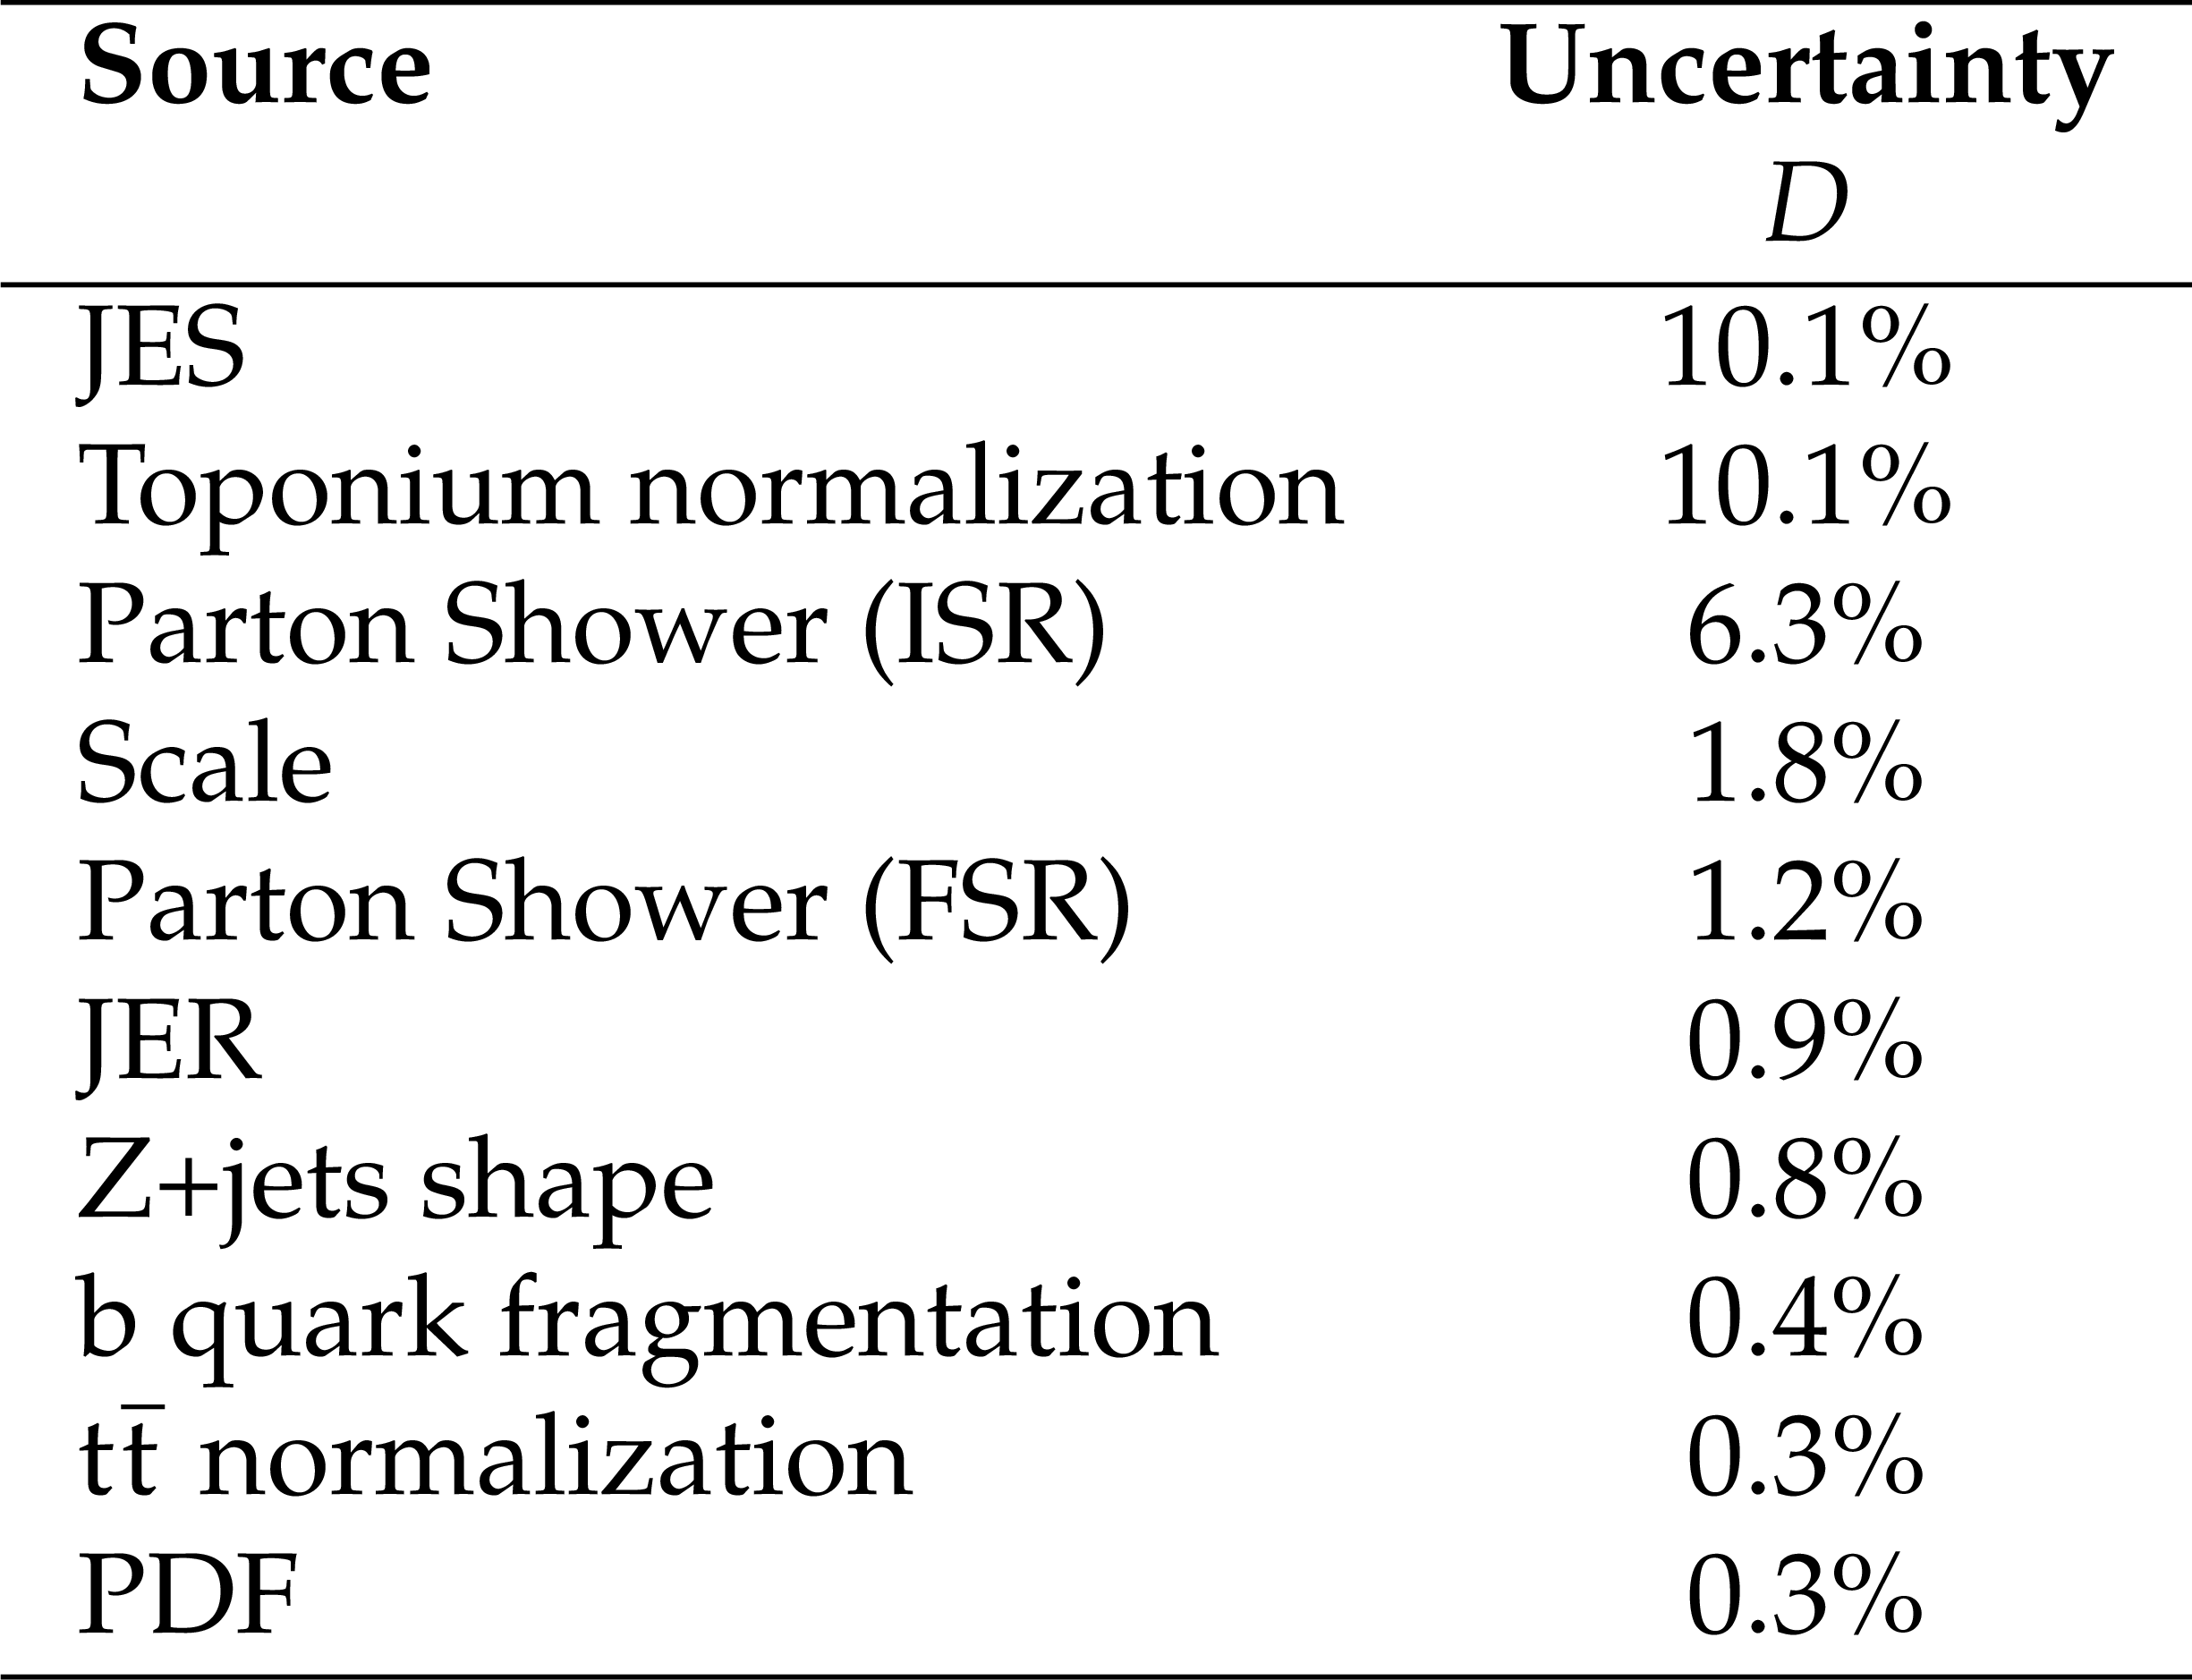
Table 3:
Breakdown into leading ten systematic uncertainties in the entanglement proxy $ D $ at the postfit level. |
| Summary |
| A measurement of the entanglement of top quark pairs $ \mathrm{t} \overline{\mathrm{t}} $ utilizing the spin correlation variable $ D $ is presented. This entanglement proxy is measured using events containing two oppositely charged leptons (including semileptonic decays of $ \tau $ leptons) produced in proton-proton collisions at a center-of-mass energy of 13 TeV. The extent to which top quarks are entangled is measured by means of a binned profile likelihood fit of the parameter of interest $ D $ from the distribution of $ \cos\varphi $ in the most sensitive kinematic phase space of 345 $ < m({\mathrm{t}\overline{\mathrm{t}}} ) < $ 400 GeV and 0.0 $ < \beta < $ 0.9. The value of the entanglement proxy $ D $ itself is measured by a negative log-likelihood scan of the parameter of interest $ D $ and yields an expected value of $ D = -$0.465 $ ^{+0.025}_{-0.028} $ and an observed value of $ D = -$0.478 $ ^{+0.025}_{-0.027} $. This result has an expected (observed) significance of 5.1 (5.7) standard deviations, corresponding to the observation of top quark entanglement. This measurement with CMS data of the quantum mechanics phenomena of entanglement present in top quark events provides a new and fundamental probe to beyond the standard model contributions and represents a first step towards quantum tomography and coherence in top quark events. |
| References | ||||
| 1 | J. S. Bell | On the Einstein Podolsky Rosen paradox | Physics Physique Fizika 1 (1964) 195 | |
| 2 | F. M. Rafael Aoude, Eric Madge and L. Mantani | Quantum SMEFT tomography: Top quark pair production at the LHC | PRD 106 (2022) | |
| 3 | Y. Afik and J. R. M. n. de Nova | Entanglement and quantum tomography with top quarks at the LHC | Eur. Phys. J. Plus 136 (2021) 907 | 2003.02280 |
| 4 | B. Fuks, K. Hagiwara, K. Ma, and Y.-J. Zheng | Signatures of toponium formation in LHC run 2 data | PRD 104 (2021) 034023 | 2102.11281 |
| 5 | W.-L. Ju et al. | Top quark pair production near threshold: single/double distributions and mass determination | JHEP 06 (2020) 158 | 2004.03088 |
| 6 | CMS Collaboration | Measurement of the top quark polarization and $ \mathrm{t\bar{t}} $ spin correlations using dilepton final states in proton-proton collisions at $ \sqrt{s} = $ 13 TeV | PRD 100 (2019) 072002 | CMS-TOP-18-006 1907.03729 |
| 7 | W. Bernreuther, D. Heisler, and Z.-G. Si | A set of top quark spin correlation and polarization observables for the LHC: Standard Model predictions and new physics contributions | JHEP 12 (2015) 026 | 1508.05271 |
| 8 | A. Peres | Separability criterion for density matrices | PRL 77 (1996) 1413 | |
| 9 | M. Horodecki, P. Horodecki, and R. Horodecki | Separability of mixed states: necessary and sufficient conditions | Physics Letters A 223 (1996) 1 | |
| 10 | CMS Collaboration | Projection of the top quark spin correlation measurement and search for top squark pair production at the HL-LHC | CMS Physics Analysis Summary, 2022 CMS-PAS-FTR-18-034 |
CMS-PAS-FTR-18-034 |
| 11 | CMS Collaboration | Measurement of the differential cross section for top quark pair production in pp collisions at $ \sqrt{s} = 8\,\text {TeV} $ | EPJC 75 (2015) 542 | CMS-TOP-12-028 1505.04480 |
| 12 | D0 Collaboration | Measurement of the top quark mass using dilepton events. | PRL 80 (1998) 2063 | hep-ex/9706014 |
| 13 | CMS Collaboration | The CMS experiment at the CERN LHC | JINST 3 (2008) S08004 | |
| 14 | CMS Collaboration | Development of the CMS detector for the CERN LHC Run 3 | Accepted by JINST, 2023 | CMS-PRF-21-001 2309.05466 |
| 15 | CMS Collaboration | Particle-flow reconstruction and global event description with the CMS detector | JINST 12 (2017) P10003 | CMS-PRF-14-001 1706.04965 |
| 16 | CMS Collaboration | Pileup mitigation at CMS in 13 TeV data | JINST 15 (2020) P09018 | CMS-JME-18-001 2003.00503 |
| 17 | CMS Collaboration | Jet energy scale and resolution in the CMS experiment in pp collisions at 8 TeV | JINST 12 (2017) P02014 | CMS-JME-13-004 1607.03663 |
| 18 | CMS Collaboration | Performance of missing transverse momentum reconstruction in proton-proton collisions at $ \sqrt{s} = $ 13 TeV using the CMS detector | JINST 14 (2019) P07004 | CMS-JME-17-001 1903.06078 |
| 19 | CMS Collaboration | Electron and photon reconstruction and identification with the CMS experiment at the CERN LHC | JINST 16 (2021) P05014 | CMS-EGM-17-001 2012.06888 |
| 20 | CMS Collaboration | ECAL 2016 refined calibration and Run2 summary plots | CMS Detector Performance Summary CMS-DP-2020-021, 2020 CDS |
|
| 21 | CMS Collaboration | Performance of the CMS muon detector and muon reconstruction with proton-proton collisions at $ \sqrt{s}= $ 13 TeV | JINST 13 (2018) P06015 | CMS-MUO-16-001 1804.04528 |
| 22 | S. Frixione, P. Nason, and G. Ridolfi | A Positive-weight next-to-leading-order Monte Carlo for heavy flavour hadroproduction | JHEP 09 (2007) 126 | 0707.3088 |
| 23 | P. Nason | A New method for combining NLO QCD with shower Monte Carlo algorithms | JHEP 11 (2004) 040 | hep-ph/0409146 |
| 24 | S. Frixione, P. Nason, and C. Oleari | Matching NLO QCD computations with Parton Shower simulations: the POWHEG method | JHEP 11 (2007) 070 | 0709.2092 |
| 25 | S. Alioli, P. Nason, C. Oleari, and E. Re | A general framework for implementing NLO calculations in shower Monte Carlo programs: the POWHEG BOX | JHEP 06 (2010) 043 | 1002.2581 |
| 26 | M. Czakon and A. Mitov | Top++: A Program for the Calculation of the Top-Pair Cross-Section at Hadron Colliders | Comput. Phys. Commun. 185 (2014) 2930 | 1112.5675 |
| 27 | J. Alwall et al. | The automated computation of tree-level and next-to-leading order differential cross sections, and their matching to parton shower simulations | JHEP 07 (2014) 079 | 1405.0301 |
| 28 | P. Artoisenet, R. Frederix, O. Mattelaer, and R. Rietkerk | Automatic spin-entangled decays of heavy resonances in Monte Carlo simulations | JHEP 03 (2013) 015 | 1212.3460 |
| 29 | R. Frederix and S. Frixione | Merging meets matching in MC@NLO | JHEP 12 (2012) 061 | 1209.6215 |
| 30 | NNPDF Collaboration | Parton distributions for the LHC Run II | JHEP 04 (2015) 040 | 1410.8849 |
| 31 | J. Alwall et al. | Comparative study of various algorithms for the merging of parton showers and matrix elements in hadronic collisions | EPJC 53 (2008) 473 | 0706.2569 |
| 32 | T. Sj\"ostrand et al. | An introduction to PYTHIA 8.2 | Comput. Phys. Commun. 191 (2015) 159 | 1410.3012 |
| 33 | CMS Collaboration | Investigations of the impact of the parton shower tuning in Pythia 8 in the modelling of $ \mathrm{t\overline{t}} $ at $ \sqrt{s}= $ 8 and 13 TeV | CMS Physics Analysis Summary, 2016 CMS-PAS-TOP-16-021 |
CMS-PAS-TOP-16-021 |
| 34 | CMS Collaboration | Event generator tunes obtained from underlying event and multiparton scattering measurements | EPJC 76 (2016) 155 | CMS-GEN-14-001 1512.00815 |
| 35 | M. Bahr et al. | Herwig++ Physics and Manual | EPJC 58 (2008) 639 | 0803.0883 |
| 36 | S. Gieseke, C. Rohr, and A. Siodmok | Colour reconnections in Herwig++ | EPJC 72 (2012) 2225 | 1206.0041 |
| 37 | GEANT4 Collaboration | Geant4-a simulation toolkit | Nuclear Instruments and Methods in Physics Research Section A 506 (2003) 250 | |
| 38 | CMS Collaboration | Measurements of $ \mathrm{t\overline{t}} $ differential cross sections in proton-proton collisions at $ \sqrt{s}= $ 13 TeV using events containing two leptons | JHEP 02 (2019) 149 | CMS-TOP-17-014 1811.06625 |
| 39 | J. A. Aguilar-Saavedra and J. A. Casas | Improved tests of entanglement and Bell inequalities with LHC tops | EPJC 82 (2022) 666 | 2205.00542 |
| 40 | CMS Collaboration | Measurement of the $ t\bar t $ production cross section in the dilepton channel in pp collisions at $ \sqrt{s} = $ 7 TeV | JHEP 11 (2012) 067 | CMS-TOP-11-005 1208.2671 |
| 41 | CMS Collaboration | Precision luminosity measurement in proton-proton collisions at $ \sqrt{s} = $ 13 TeV in 2015 and 2016 at CMS | EPJC 81 (2021) 800 | CMS-LUM-17-003 2104.01927 |
| 42 | CMS Collaboration | Combination of measurements of the top quark mass from data collected by the ATLAS and CMS experiments at $ \sqrt{s}= $ 7 and 8 TeV | CMS-TOP-22-001 2402.08713 |
|
| 43 | CMS Collaboration | Measurement of the shape of the b quark fragmentation function using charmed mesons produced inside b jets from $ \mathrm{t}\bar{\mathrm{t}} $ pair decays | CMS Physics Analysis Summary, 2021 CMS-PAS-TOP-18-012 |
CMS-PAS-TOP-18-012 |
| 44 | Particle Data Group Collaboration | Review of Particle Physics (2017 update) | Chin. Phys. C 40 (2016) 100001 | |
| 45 | CMS Collaboration | Measurement of the top quark Yukawa coupling from $ \mathrm{t\bar{t}} $ kinematic distributions in the dilepton final state in proton-proton collisions at $ \sqrt{s}= $ 13 TeV | PRD 102 (2020) 092013 | CMS-TOP-19-008 2009.07123 |
|
|
Compact Muon Solenoid LHC, CERN |
|

|

|

|

|

|