

Compact Muon Solenoid
LHC, CERN
| CMS-EXO-16-018 ; CERN-EP/2016-154 | ||
| Search for resonant production of high-mass photon pairs in proton-proton collisions at $\sqrt{s} = $ 8 and 13 TeV | ||
| CMS Collaboration | ||
| 13 June 2016 | ||
| Phys. Rev. Lett. 117 (2016) 051802 | ||
| Abstract: A search for the resonant production of high-mass photon pairs is presented. The analysis is based on samples of proton-proton collision data collected by the CMS experiment at center-of-mass energies of 8 and 13 TeV, corresponding to integrated luminosities of 19.7 and 3.3 fb$^{-1}$, respectively. The search focuses on spin-0 and spin-2 resonances with masses between 0.5 and 4 TeV and with widths, relative to the mass, between $ 1.4 \times 10^{-4}$ and $ 5.6 \times 10^{-2}$. Limits are set on scalar resonances produced through gluon-gluon fusion, and on Randall-Sundrum gravitons. A modest excess of events compatible with a narrow resonance with a mass of about 750 GeV is observed. The local significance of the excess is approximately 3.4 standard deviations. The significance is reduced to 1.6 standard deviations once the effect of searching under multiple signal hypotheses is considered. More data are required to determine the origin of this excess. | ||
| Links: e-print arXiv:1606.04093 [hep-ex] (PDF) ; CDS record ; inSPIRE record ; CADI line (restricted) ; | ||
| Figures | Summary | Additional Figures | References | CMS Publications |
|---|
| PRL Editor's Suggestion | |

png |
Data from the CMS collaboration contain a modest excess of photon pairs at 750 GeV. If this bump were confirmed it would require the existence of new elementary particles. More data should resolve the issue. |
| Figures | |
png pdf |
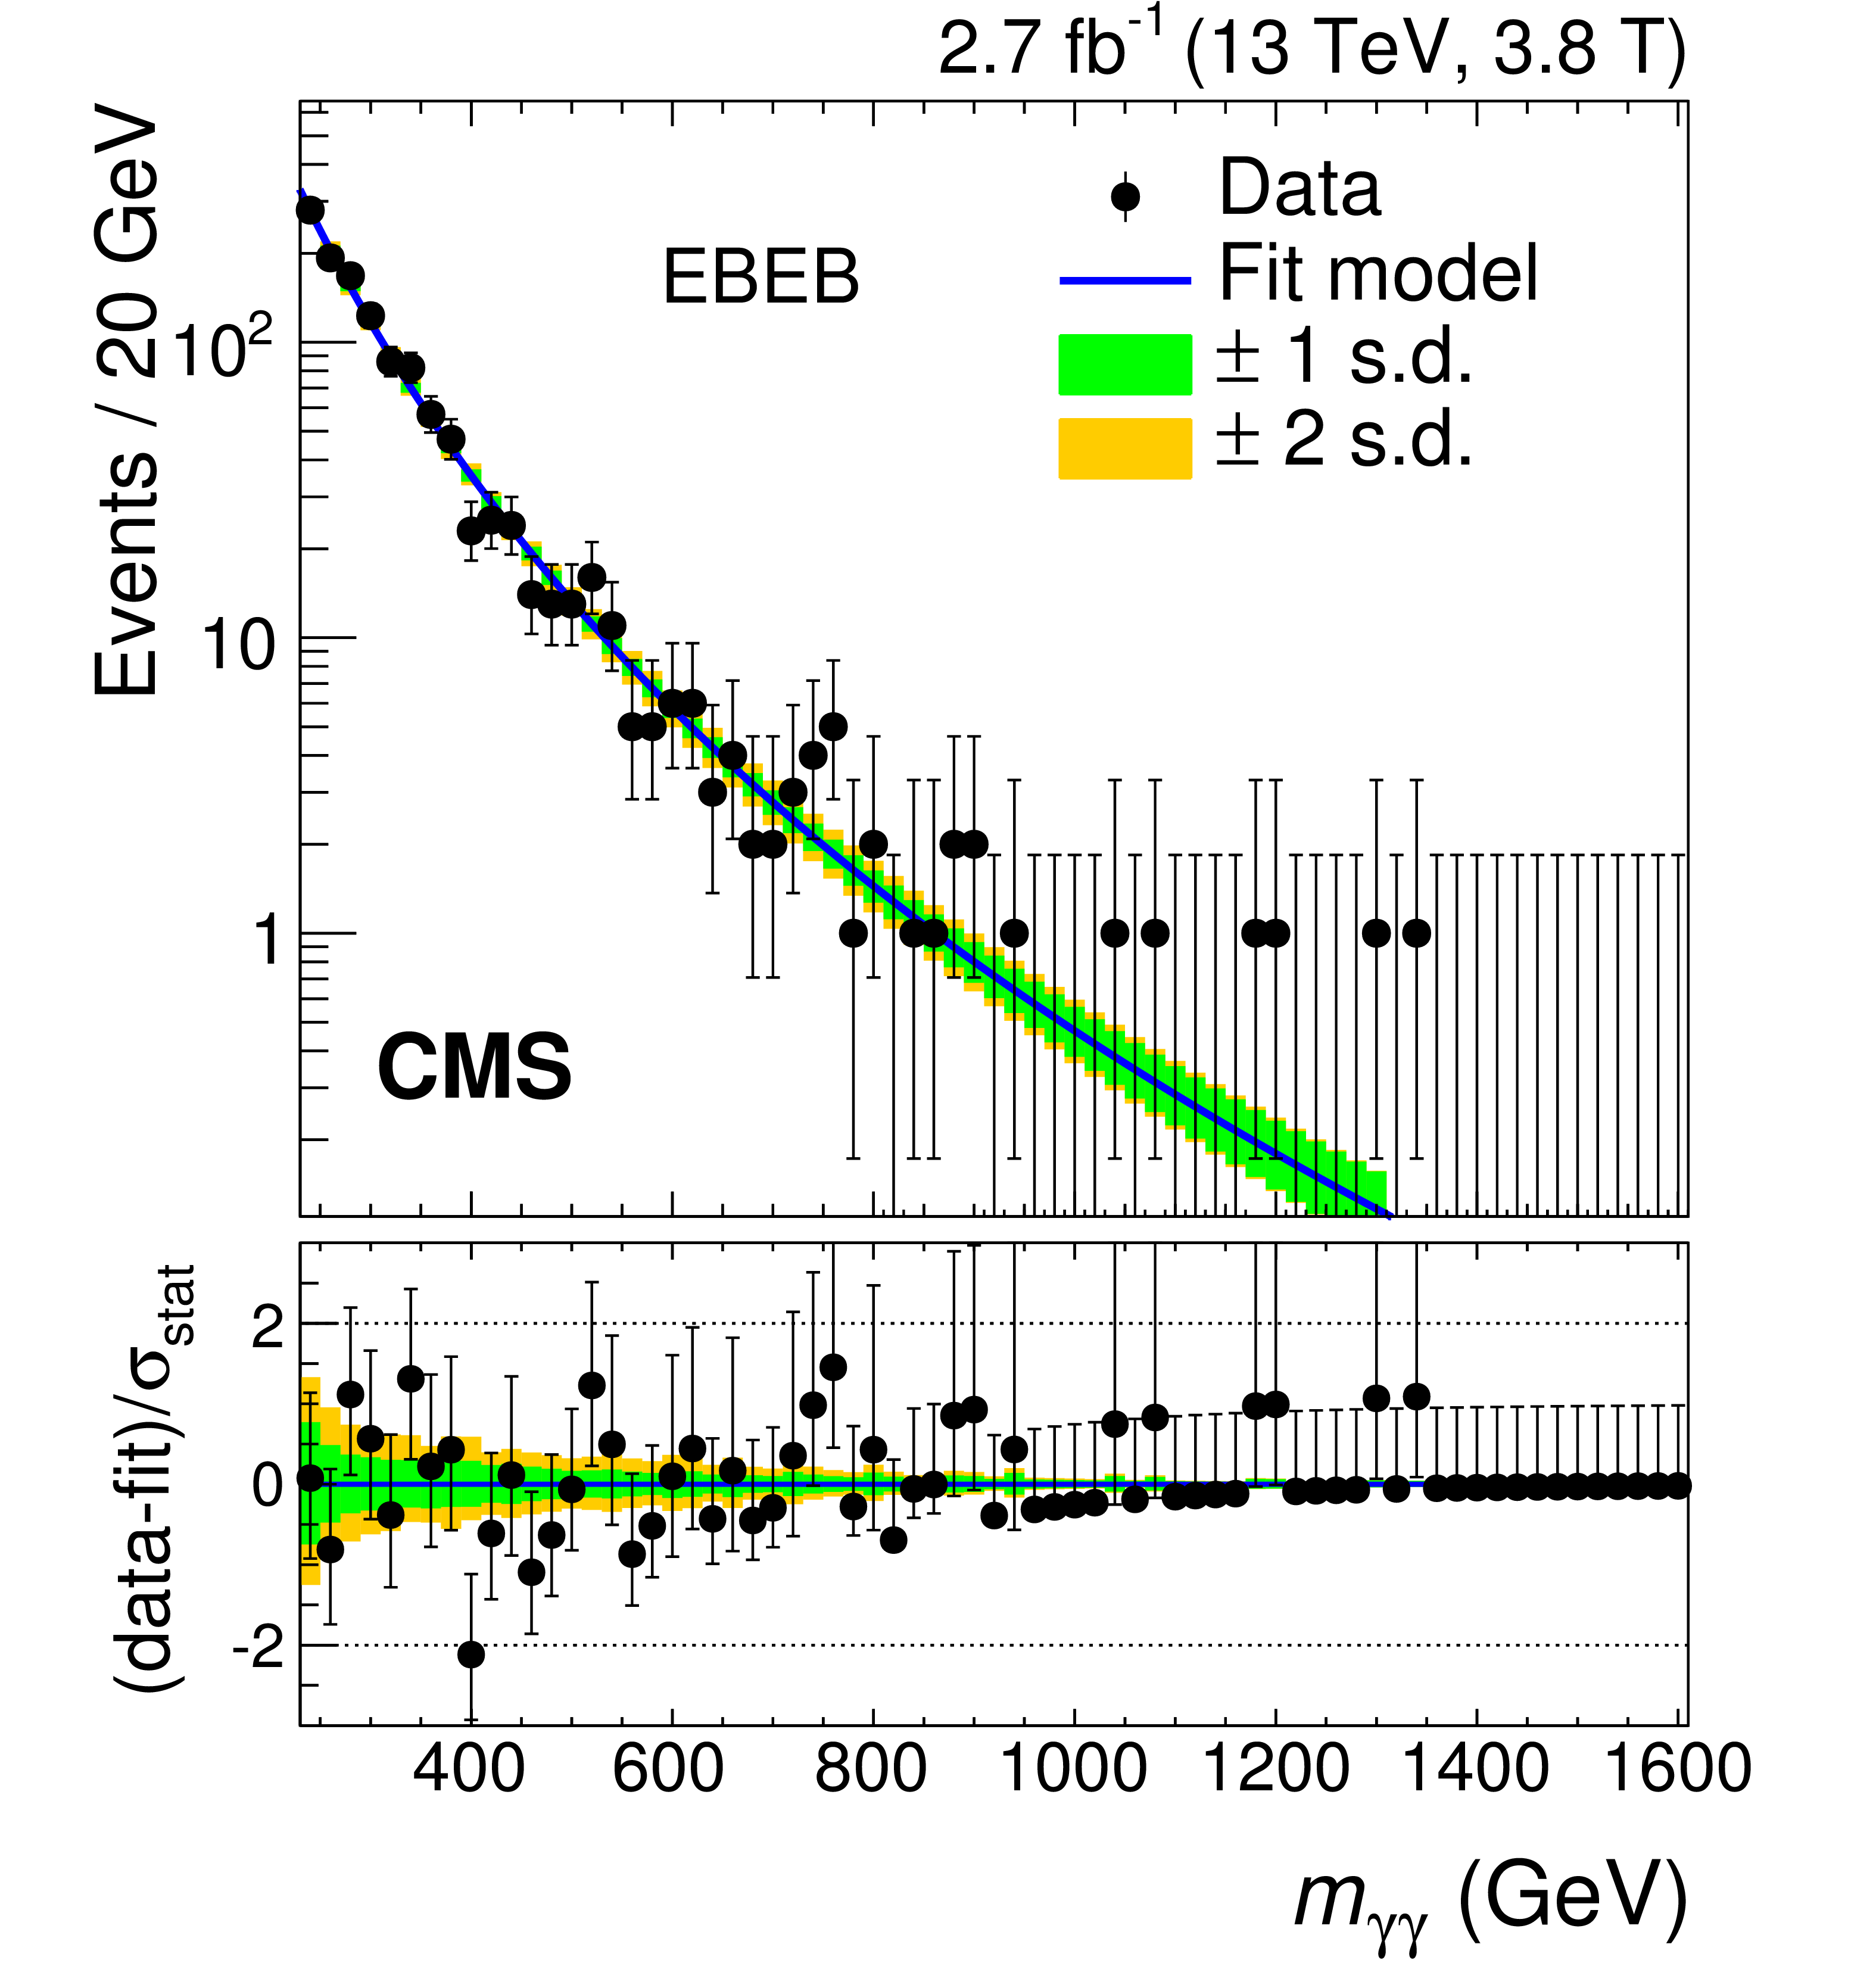
Figure 1-a:
Observed diphoton invariant mass ${m_{\gamma \gamma }}$ spectra for the event categories used in the analysis of the 13 TeV data: (a,b) magnetic field strength $\mathrm {B}=$ 3.8 T; (c,d) $\mathrm {B}=$ 0 T; (a,c) both photons in the ECAL barrel detector, (b,d) one photon in the ECAL barrel detector and the other in an ECAL endcap detector. The results of a likelihood fit to the background-only hypothesis are also shown. The shaded regions show the 1 and 2 standard deviation uncertainty bands. The lower panels show the difference between the data and fit, divided by the statistical uncertainty in the data points. |

png pdf |
Figure 1-b:
Observed diphoton invariant mass ${m_{\gamma \gamma }}$ spectra for the event categories used in the analysis of the 13 TeV data: (a,b) magnetic field strength $\mathrm {B}=$ 3.8 T; (c,d) $\mathrm {B}=$ 0 T; (a,c) both photons in the ECAL barrel detector, (b,d) one photon in the ECAL barrel detector and the other in an ECAL endcap detector. The results of a likelihood fit to the background-only hypothesis are also shown. The shaded regions show the 1 and 2 standard deviation uncertainty bands. The lower panels show the difference between the data and fit, divided by the statistical uncertainty in the data points. |
png pdf |
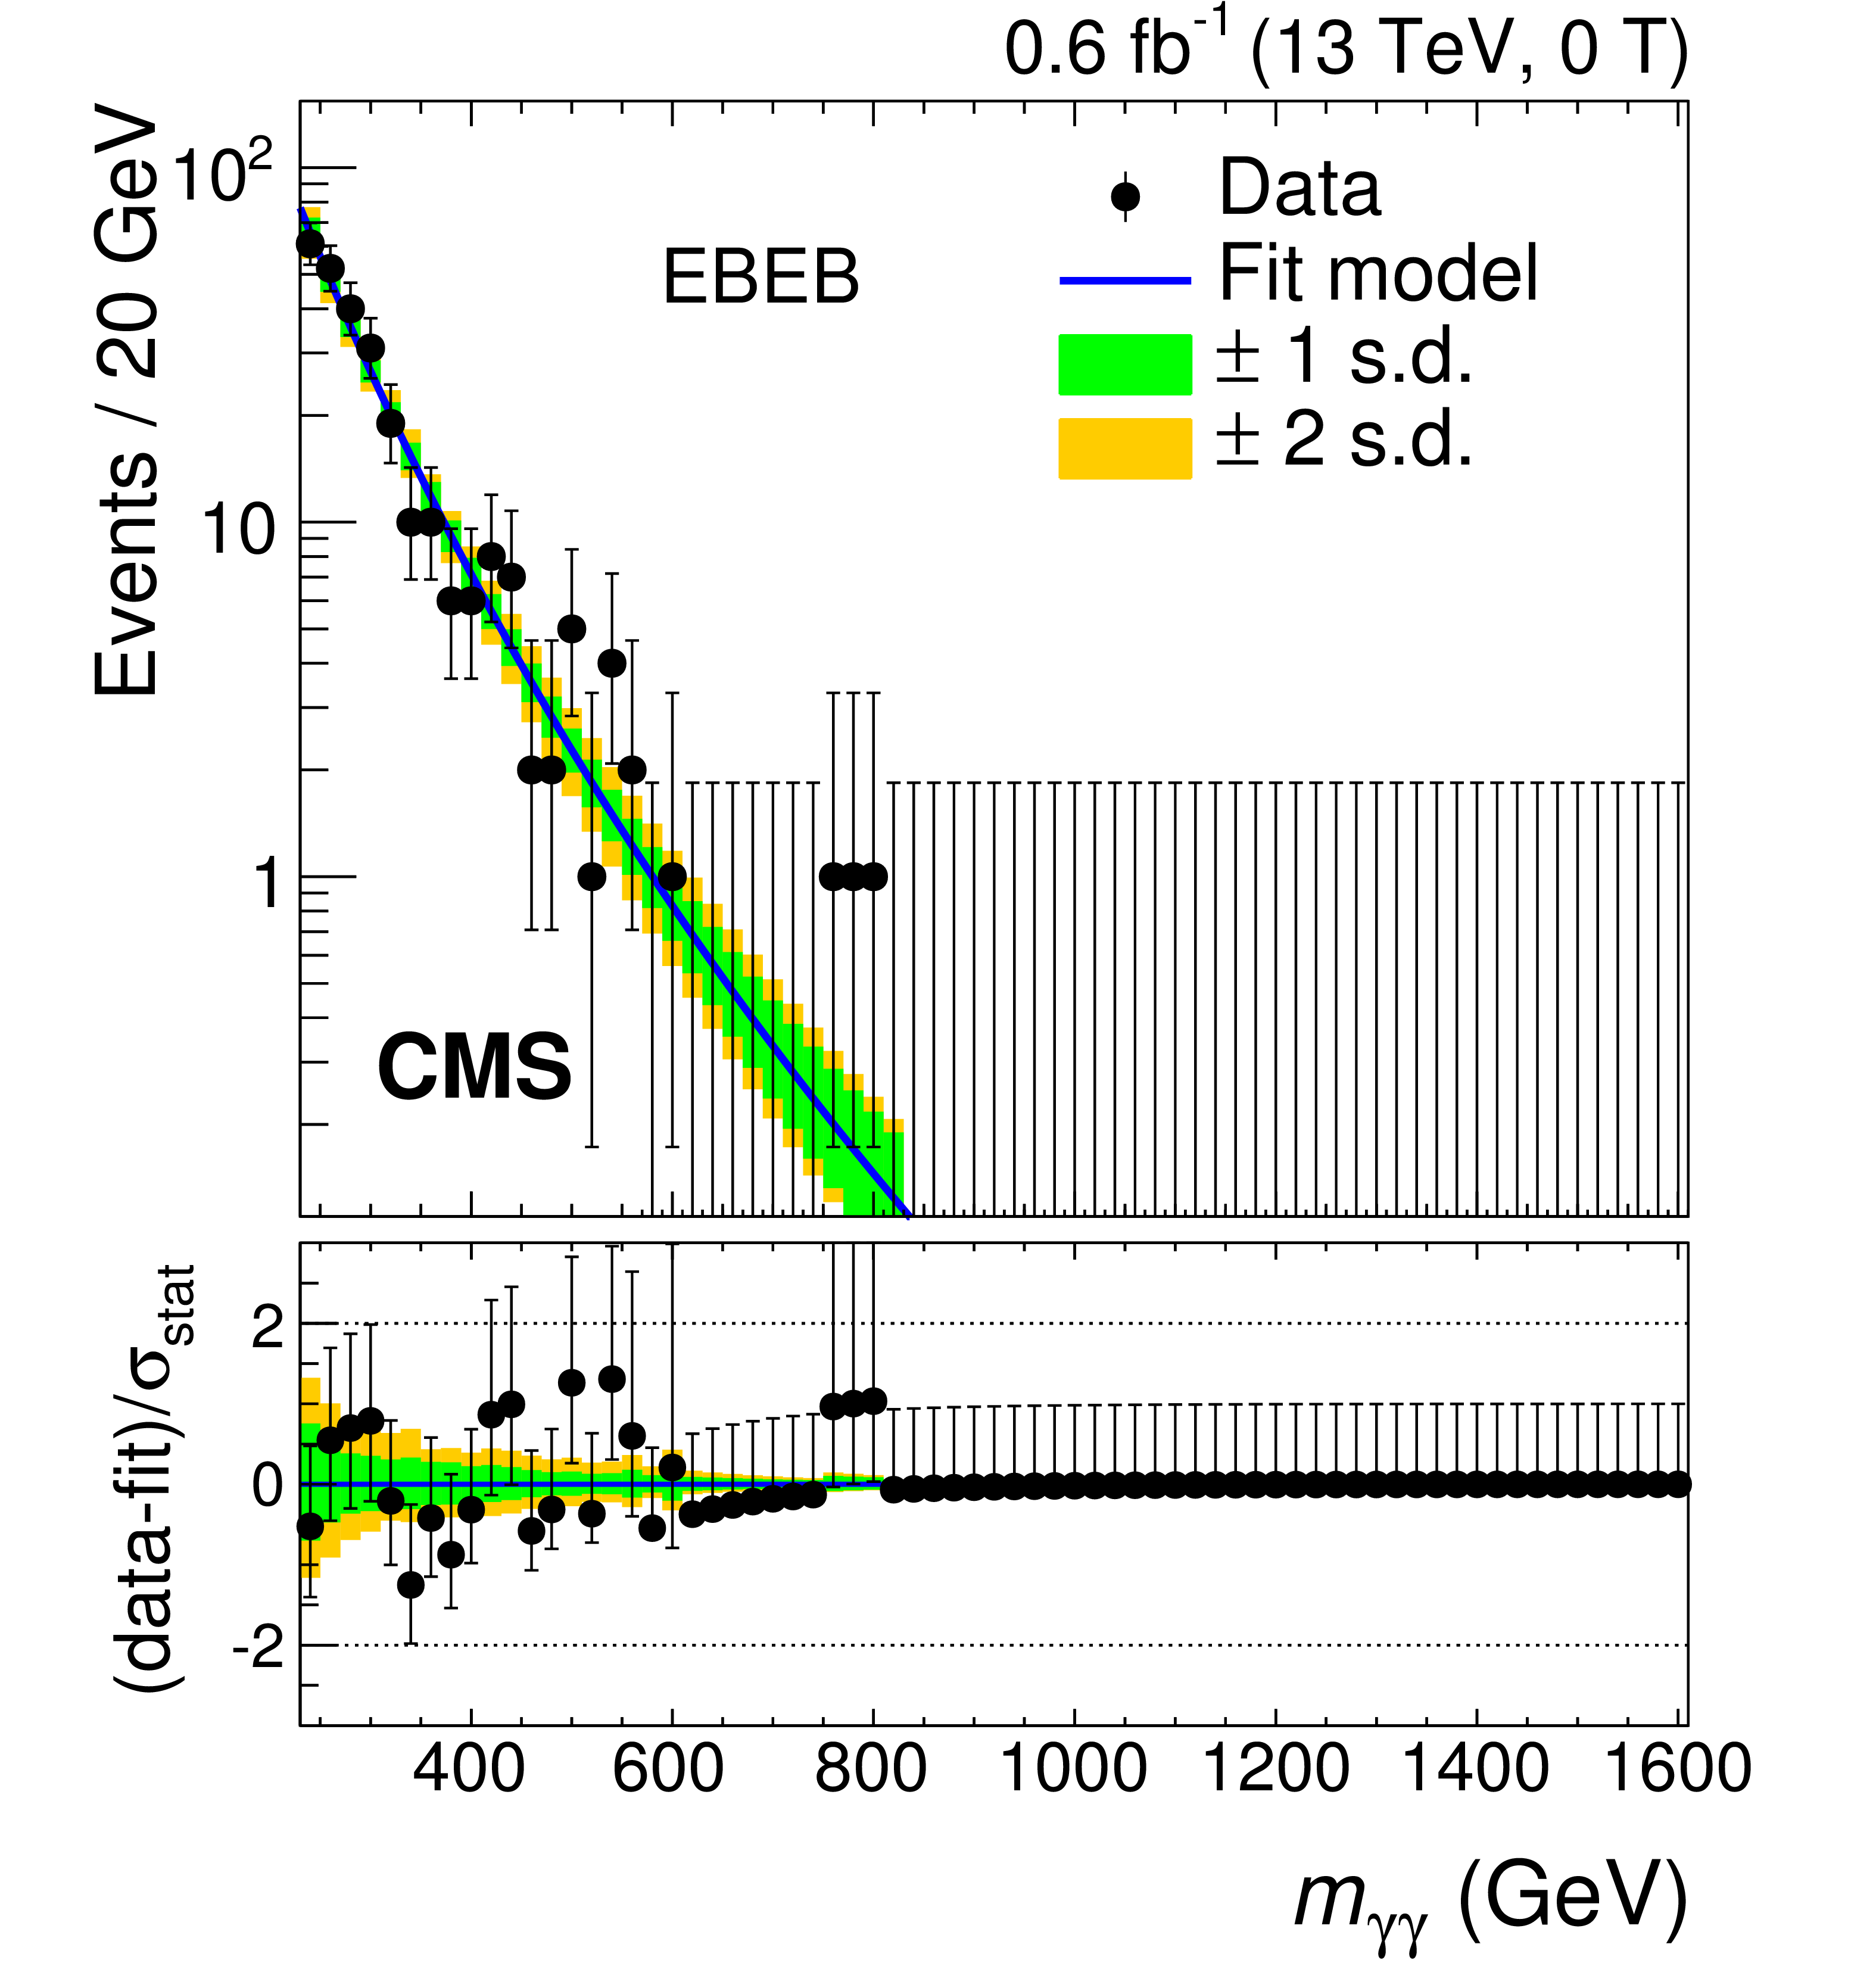
Figure 1-c:
Observed diphoton invariant mass ${m_{\gamma \gamma }}$ spectra for the event categories used in the analysis of the 13 TeV data: (a,b) magnetic field strength $\mathrm {B}=$ 3.8 T; (c,d) $\mathrm {B}=$ 0 T; (a,c) both photons in the ECAL barrel detector, (b,d) one photon in the ECAL barrel detector and the other in an ECAL endcap detector. The results of a likelihood fit to the background-only hypothesis are also shown. The shaded regions show the 1 and 2 standard deviation uncertainty bands. The lower panels show the difference between the data and fit, divided by the statistical uncertainty in the data points. |
png pdf |
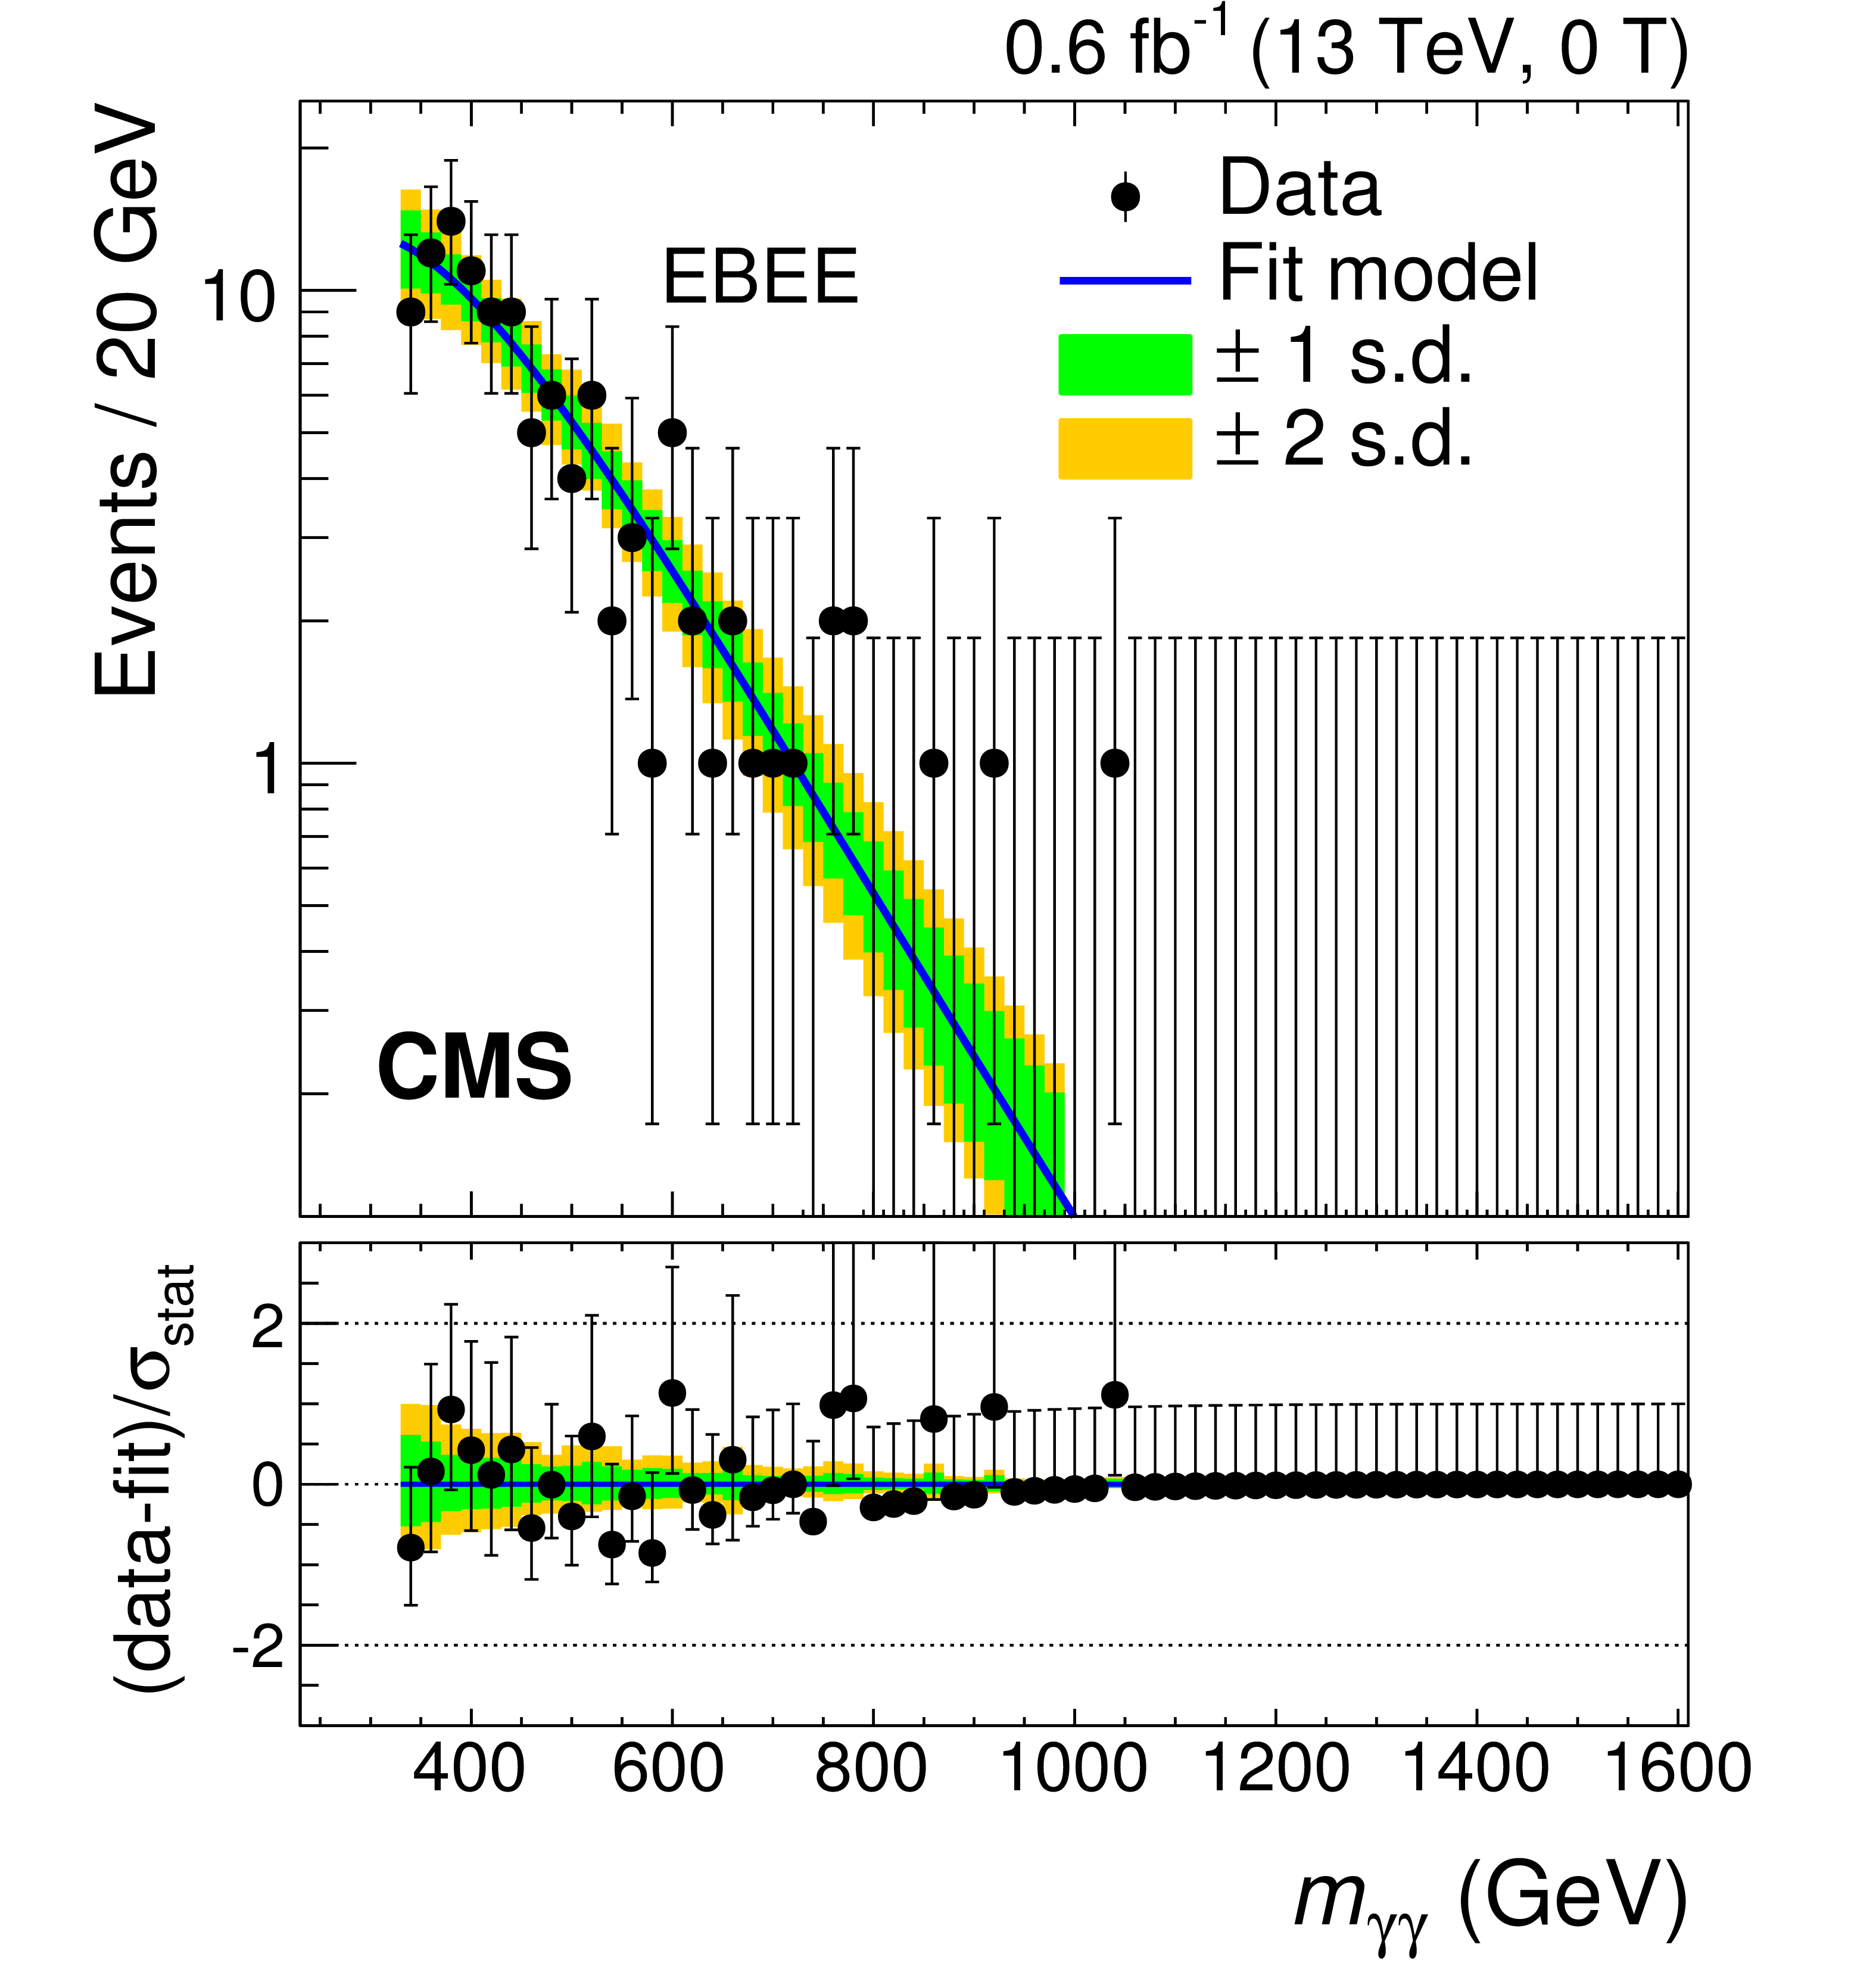
Figure 1-d:
Observed diphoton invariant mass ${m_{\gamma \gamma }}$ spectra for the event categories used in the analysis of the 13 TeV data: (a,b) magnetic field strength $\mathrm {B}=$ 3.8 T; (c,d) $\mathrm {B}=$ 0 T; (a,c) both photons in the ECAL barrel detector, (b,d) one photon in the ECAL barrel detector and the other in an ECAL endcap detector. The results of a likelihood fit to the background-only hypothesis are also shown. The shaded regions show the 1 and 2 standard deviation uncertainty bands. The lower panels show the difference between the data and fit, divided by the statistical uncertainty in the data points. |
png pdf |
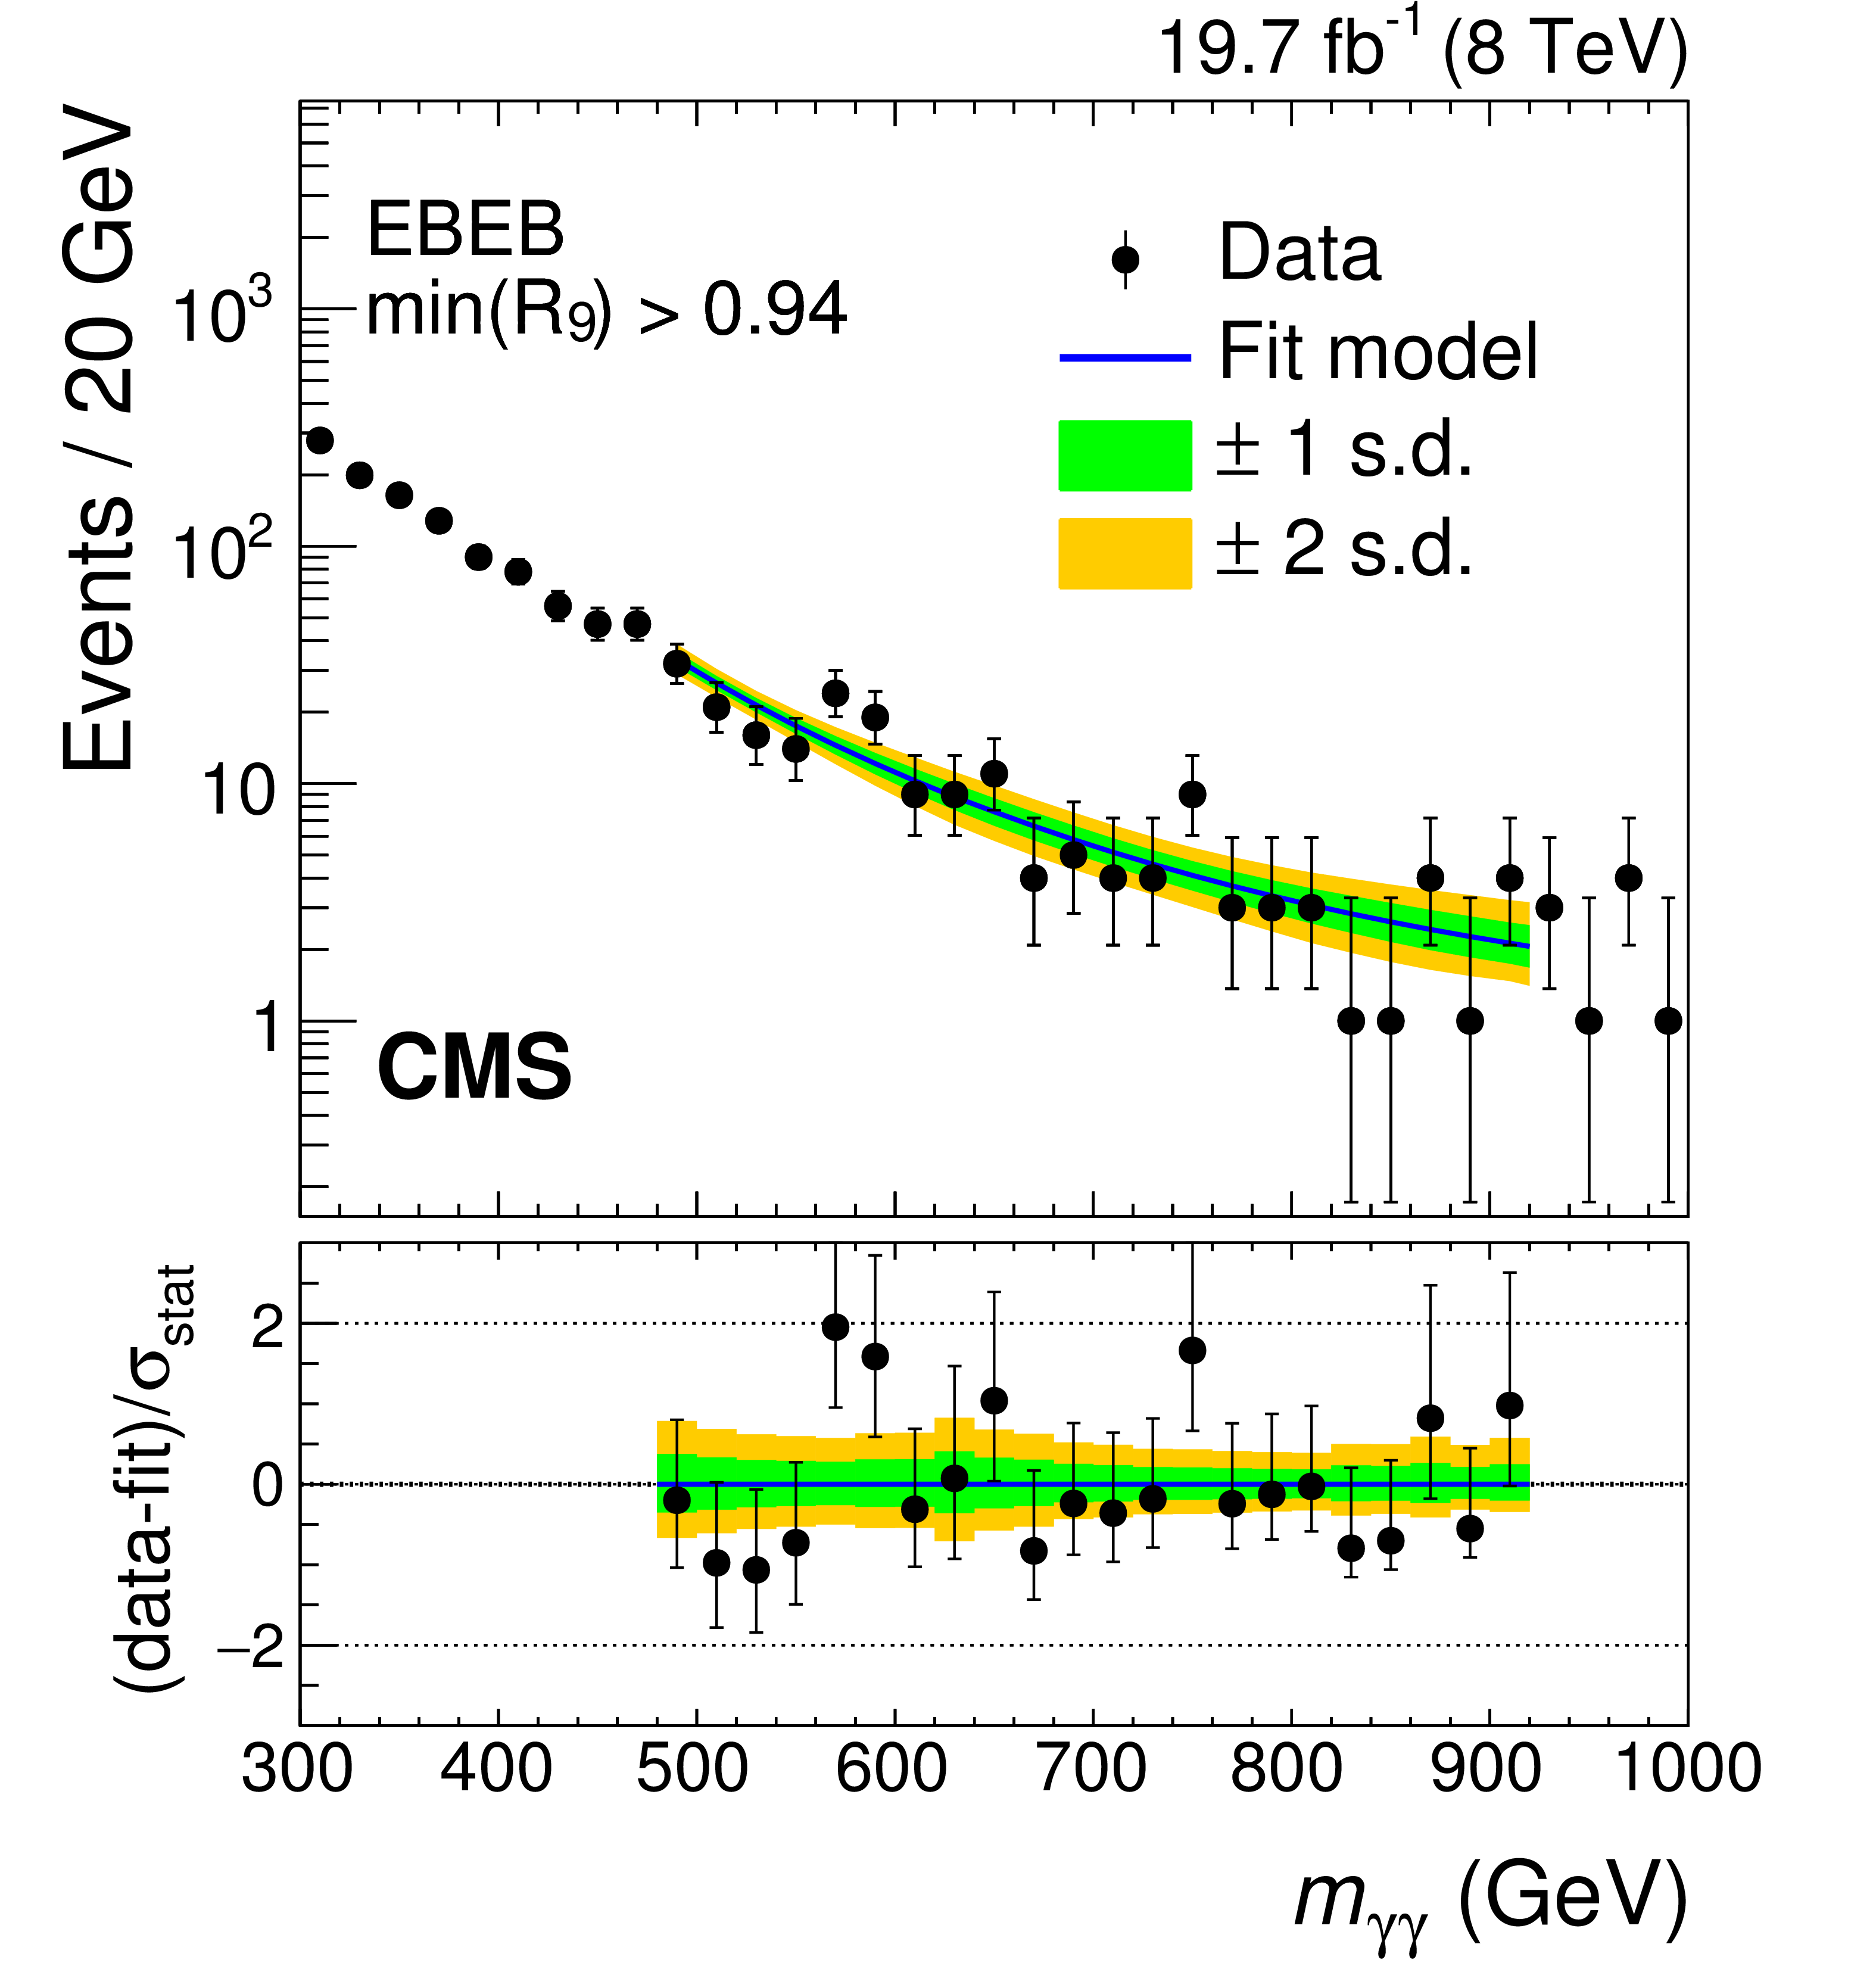
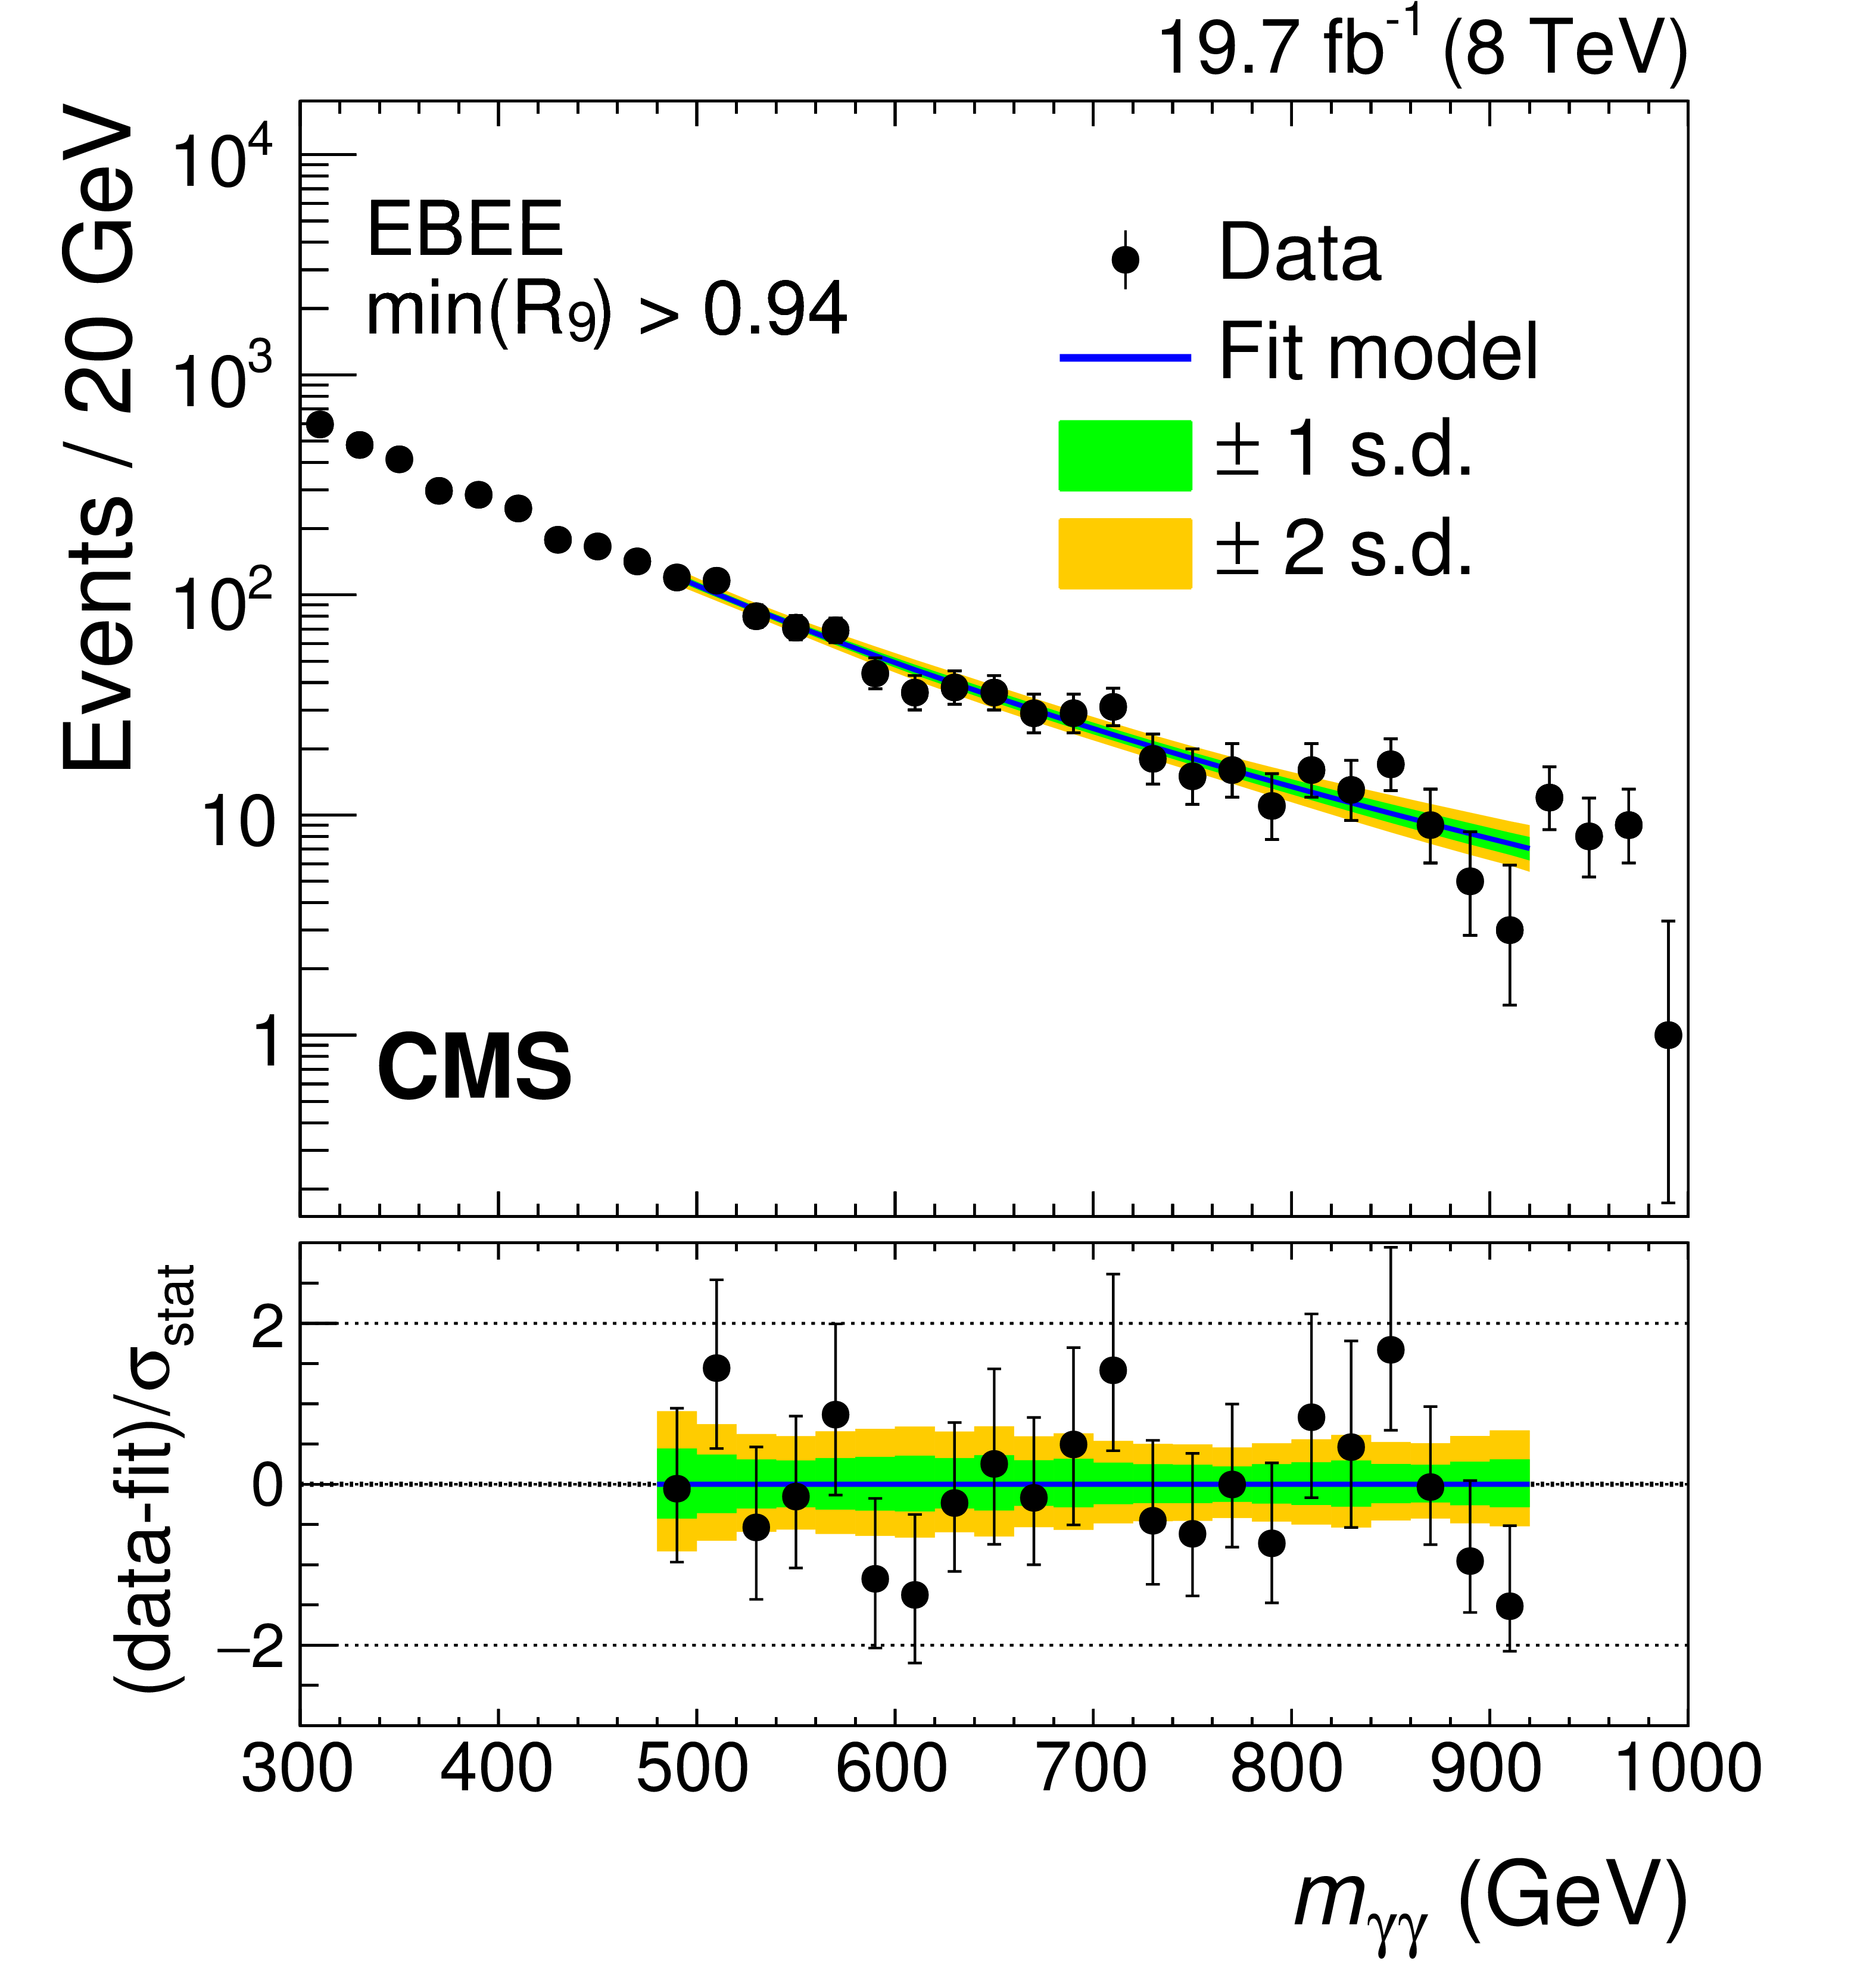
Figure 2-a:
Observed diphoton invariant mass ${m_{\gamma \gamma }}$ spectra for the event categories used in the analysis of the 8 TeV data for resonance mass $ {m_{\mathrm{X} }} \leq $ 850 GeV: (upper row) $\mathrm{min}( {R_{9}} )> $ 0.94 , (lower row) $\mathrm{min}( {R_{9}} )\leq $ 0.94 ; (left column) both photons in the ECAL barrel detector; (right column) one photon in the ECAL barrel detector and the other in the ECAL endcap detector. The results of background-only parametric fits to the data corresponding to the fit range used for the $ {m_{\mathrm{X} }} = $ 750 GeV hypothesis test are also shown [8]. The shaded regions show the 1 and 2 standard deviation uncertainty bands. The lower panels show the difference between the data and fit, divided by the statistical uncertainty in the data points. |
png pdf |
Figure 2-b:
Observed diphoton invariant mass ${m_{\gamma \gamma }}$ spectra for the event categories used in the analysis of the 8 TeV data for resonance mass $ {m_{\mathrm{X} }} \leq $ 850 GeV: (upper row) $\mathrm{min}( {R_{9}} )> $ 0.94 , (lower row) $\mathrm{min}( {R_{9}} )\leq $ 0.94 ; (left column) both photons in the ECAL barrel detector; (right column) one photon in the ECAL barrel detector and the other in the ECAL endcap detector. The results of background-only parametric fits to the data corresponding to the fit range used for the $ {m_{\mathrm{X} }} = $ 750 GeV hypothesis test are also shown [8]. The shaded regions show the 1 and 2 standard deviation uncertainty bands. The lower panels show the difference between the data and fit, divided by the statistical uncertainty in the data points. |
png pdf |
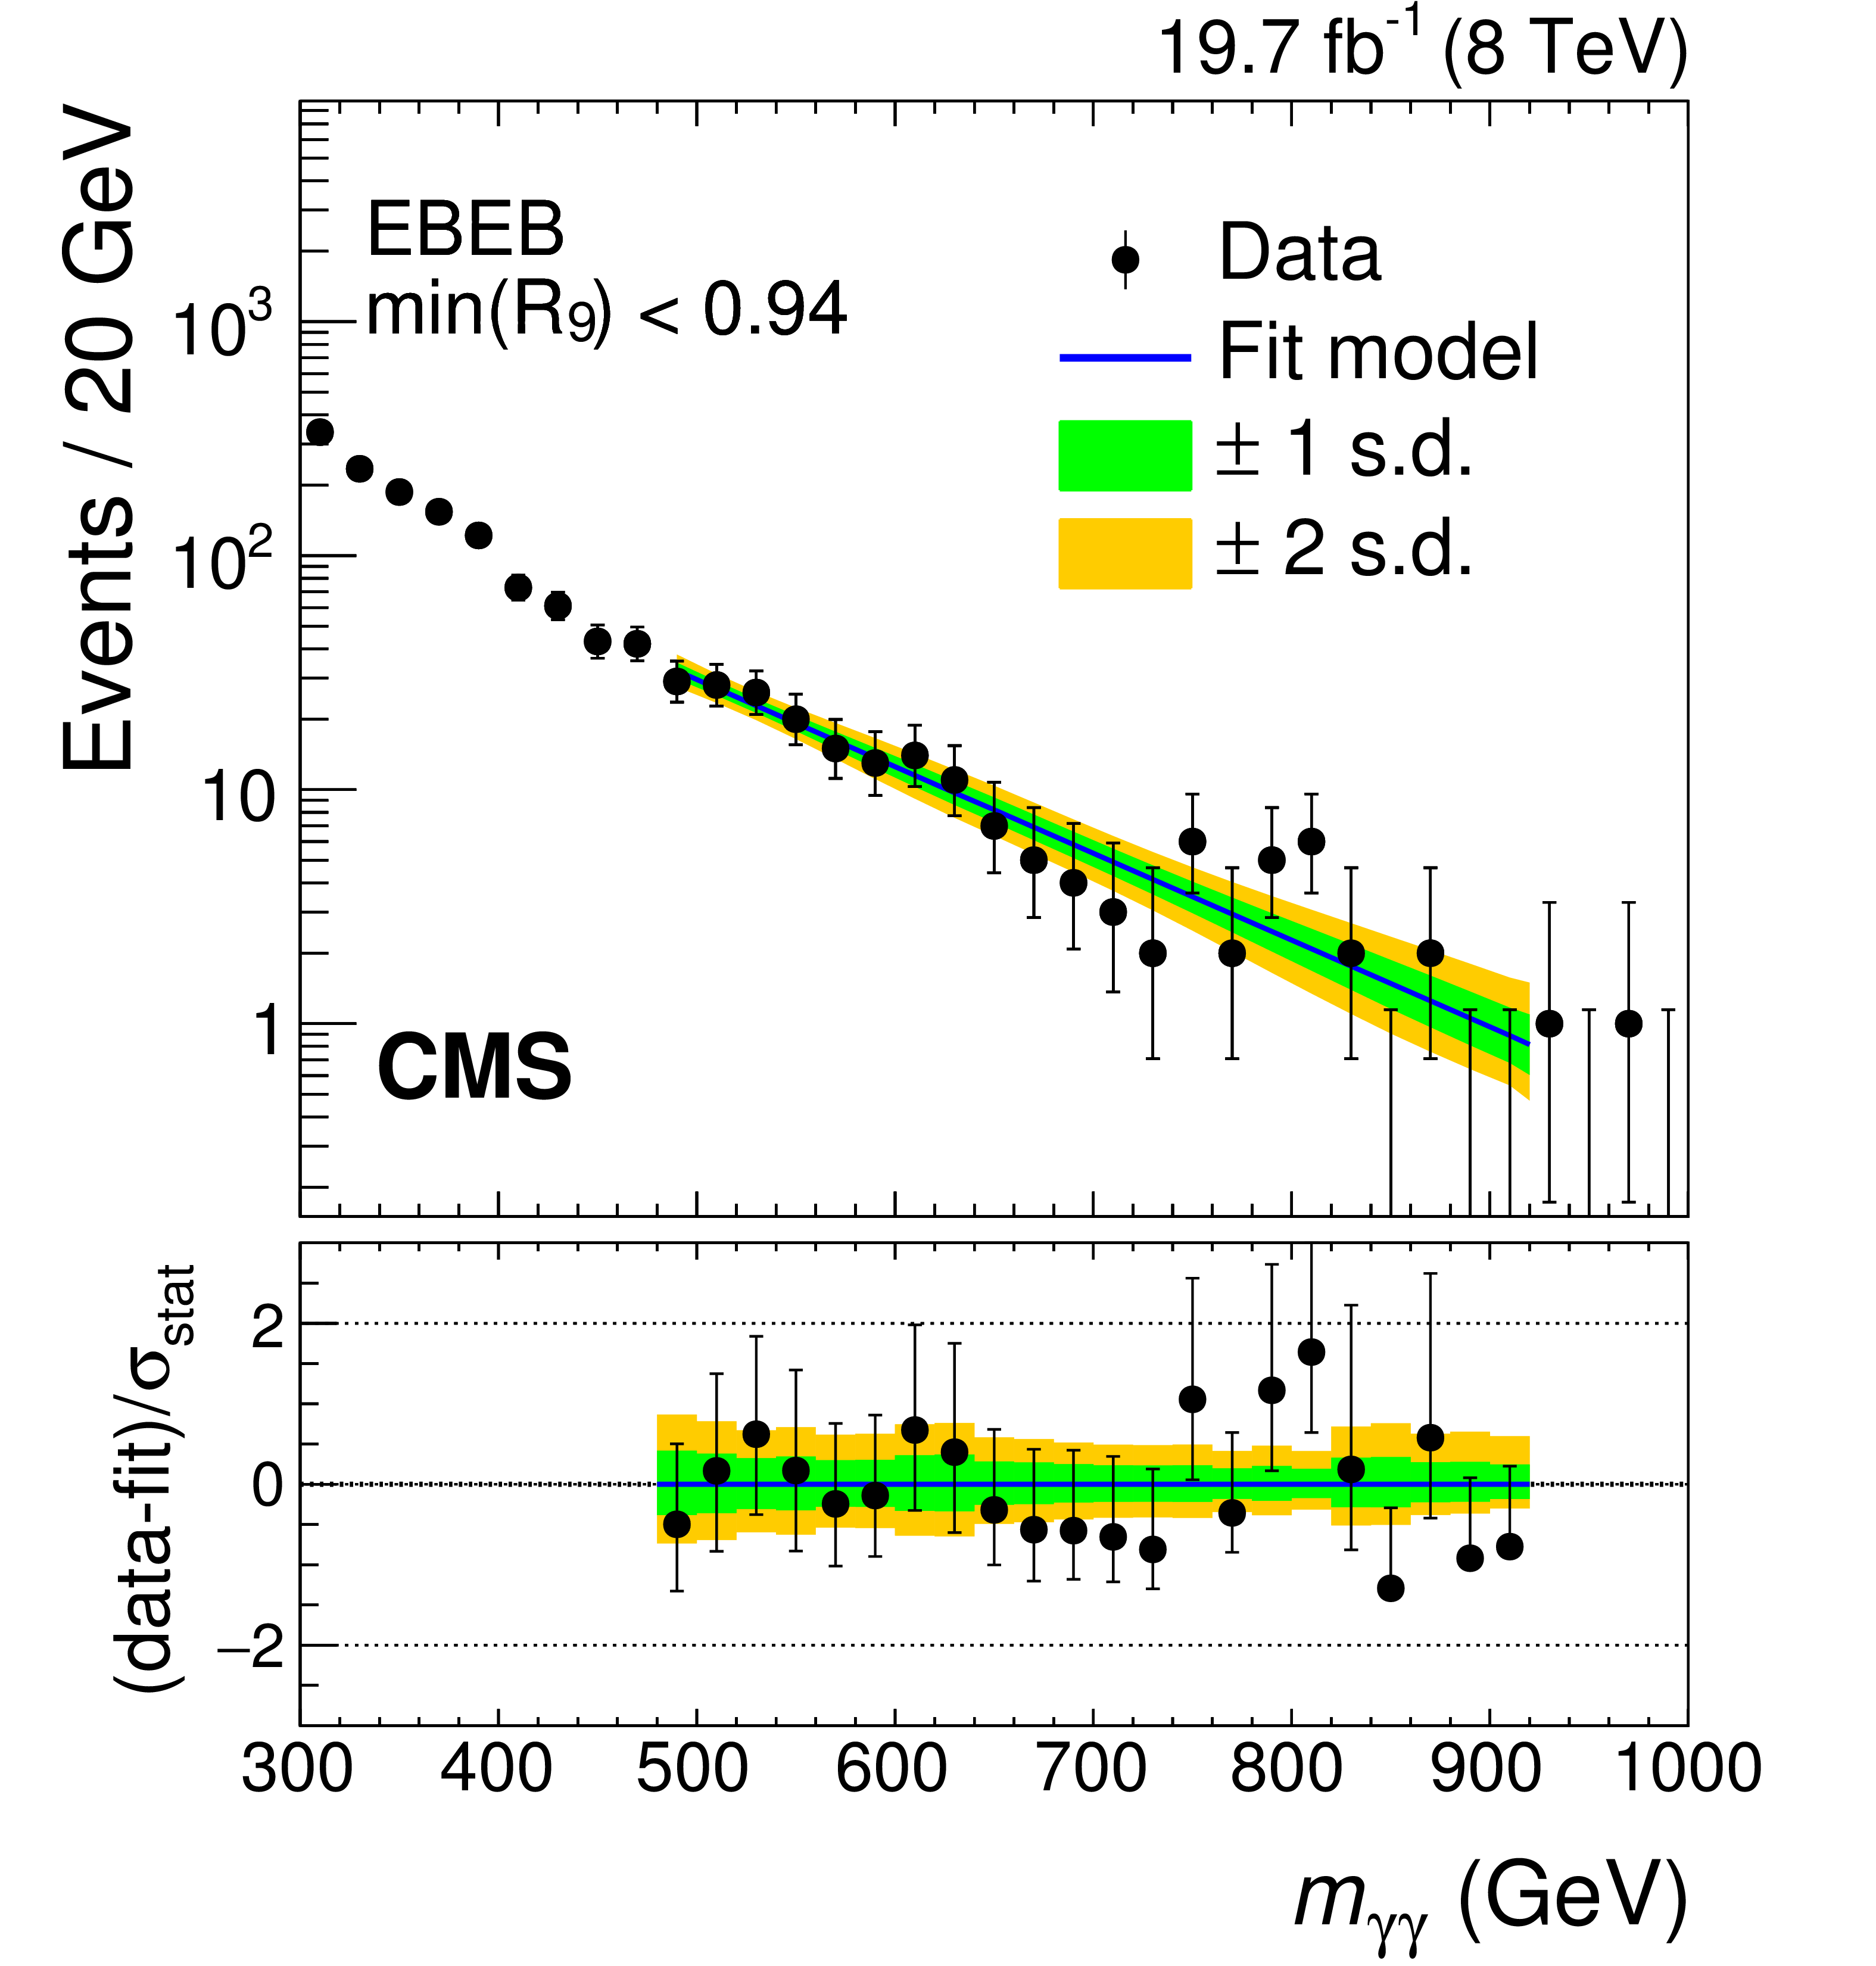
Figure 2-c:
Observed diphoton invariant mass ${m_{\gamma \gamma }}$ spectra for the event categories used in the analysis of the 8 TeV data for resonance mass $ {m_{\mathrm{X} }} \leq $ 850 GeV: (upper row) $\mathrm{min}( {R_{9}} )> $ 0.94 , (lower row) $\mathrm{min}( {R_{9}} )\leq $ 0.94 ; (left column) both photons in the ECAL barrel detector; (right column) one photon in the ECAL barrel detector and the other in the ECAL endcap detector. The results of background-only parametric fits to the data corresponding to the fit range used for the $ {m_{\mathrm{X} }} = $ 750 GeV hypothesis test are also shown [8]. The shaded regions show the 1 and 2 standard deviation uncertainty bands. The lower panels show the difference between the data and fit, divided by the statistical uncertainty in the data points. |

png pdf |
Figure 2-d:
Observed diphoton invariant mass ${m_{\gamma \gamma }}$ spectra for the event categories used in the analysis of the 8 TeV data for resonance mass $ {m_{\mathrm{X} }} \leq $ 850 GeV: (upper row) $\mathrm{min}( {R_{9}} )> $ 0.94 , (lower row) $\mathrm{min}( {R_{9}} )\leq $ 0.94 ; (left column) both photons in the ECAL barrel detector; (right column) one photon in the ECAL barrel detector and the other in the ECAL endcap detector. The results of background-only parametric fits to the data corresponding to the fit range used for the $ {m_{\mathrm{X} }} = $ 750 GeV hypothesis test are also shown [8]. The shaded regions show the 1 and 2 standard deviation uncertainty bands. The lower panels show the difference between the data and fit, divided by the statistical uncertainty in the data points. |
png pdf |
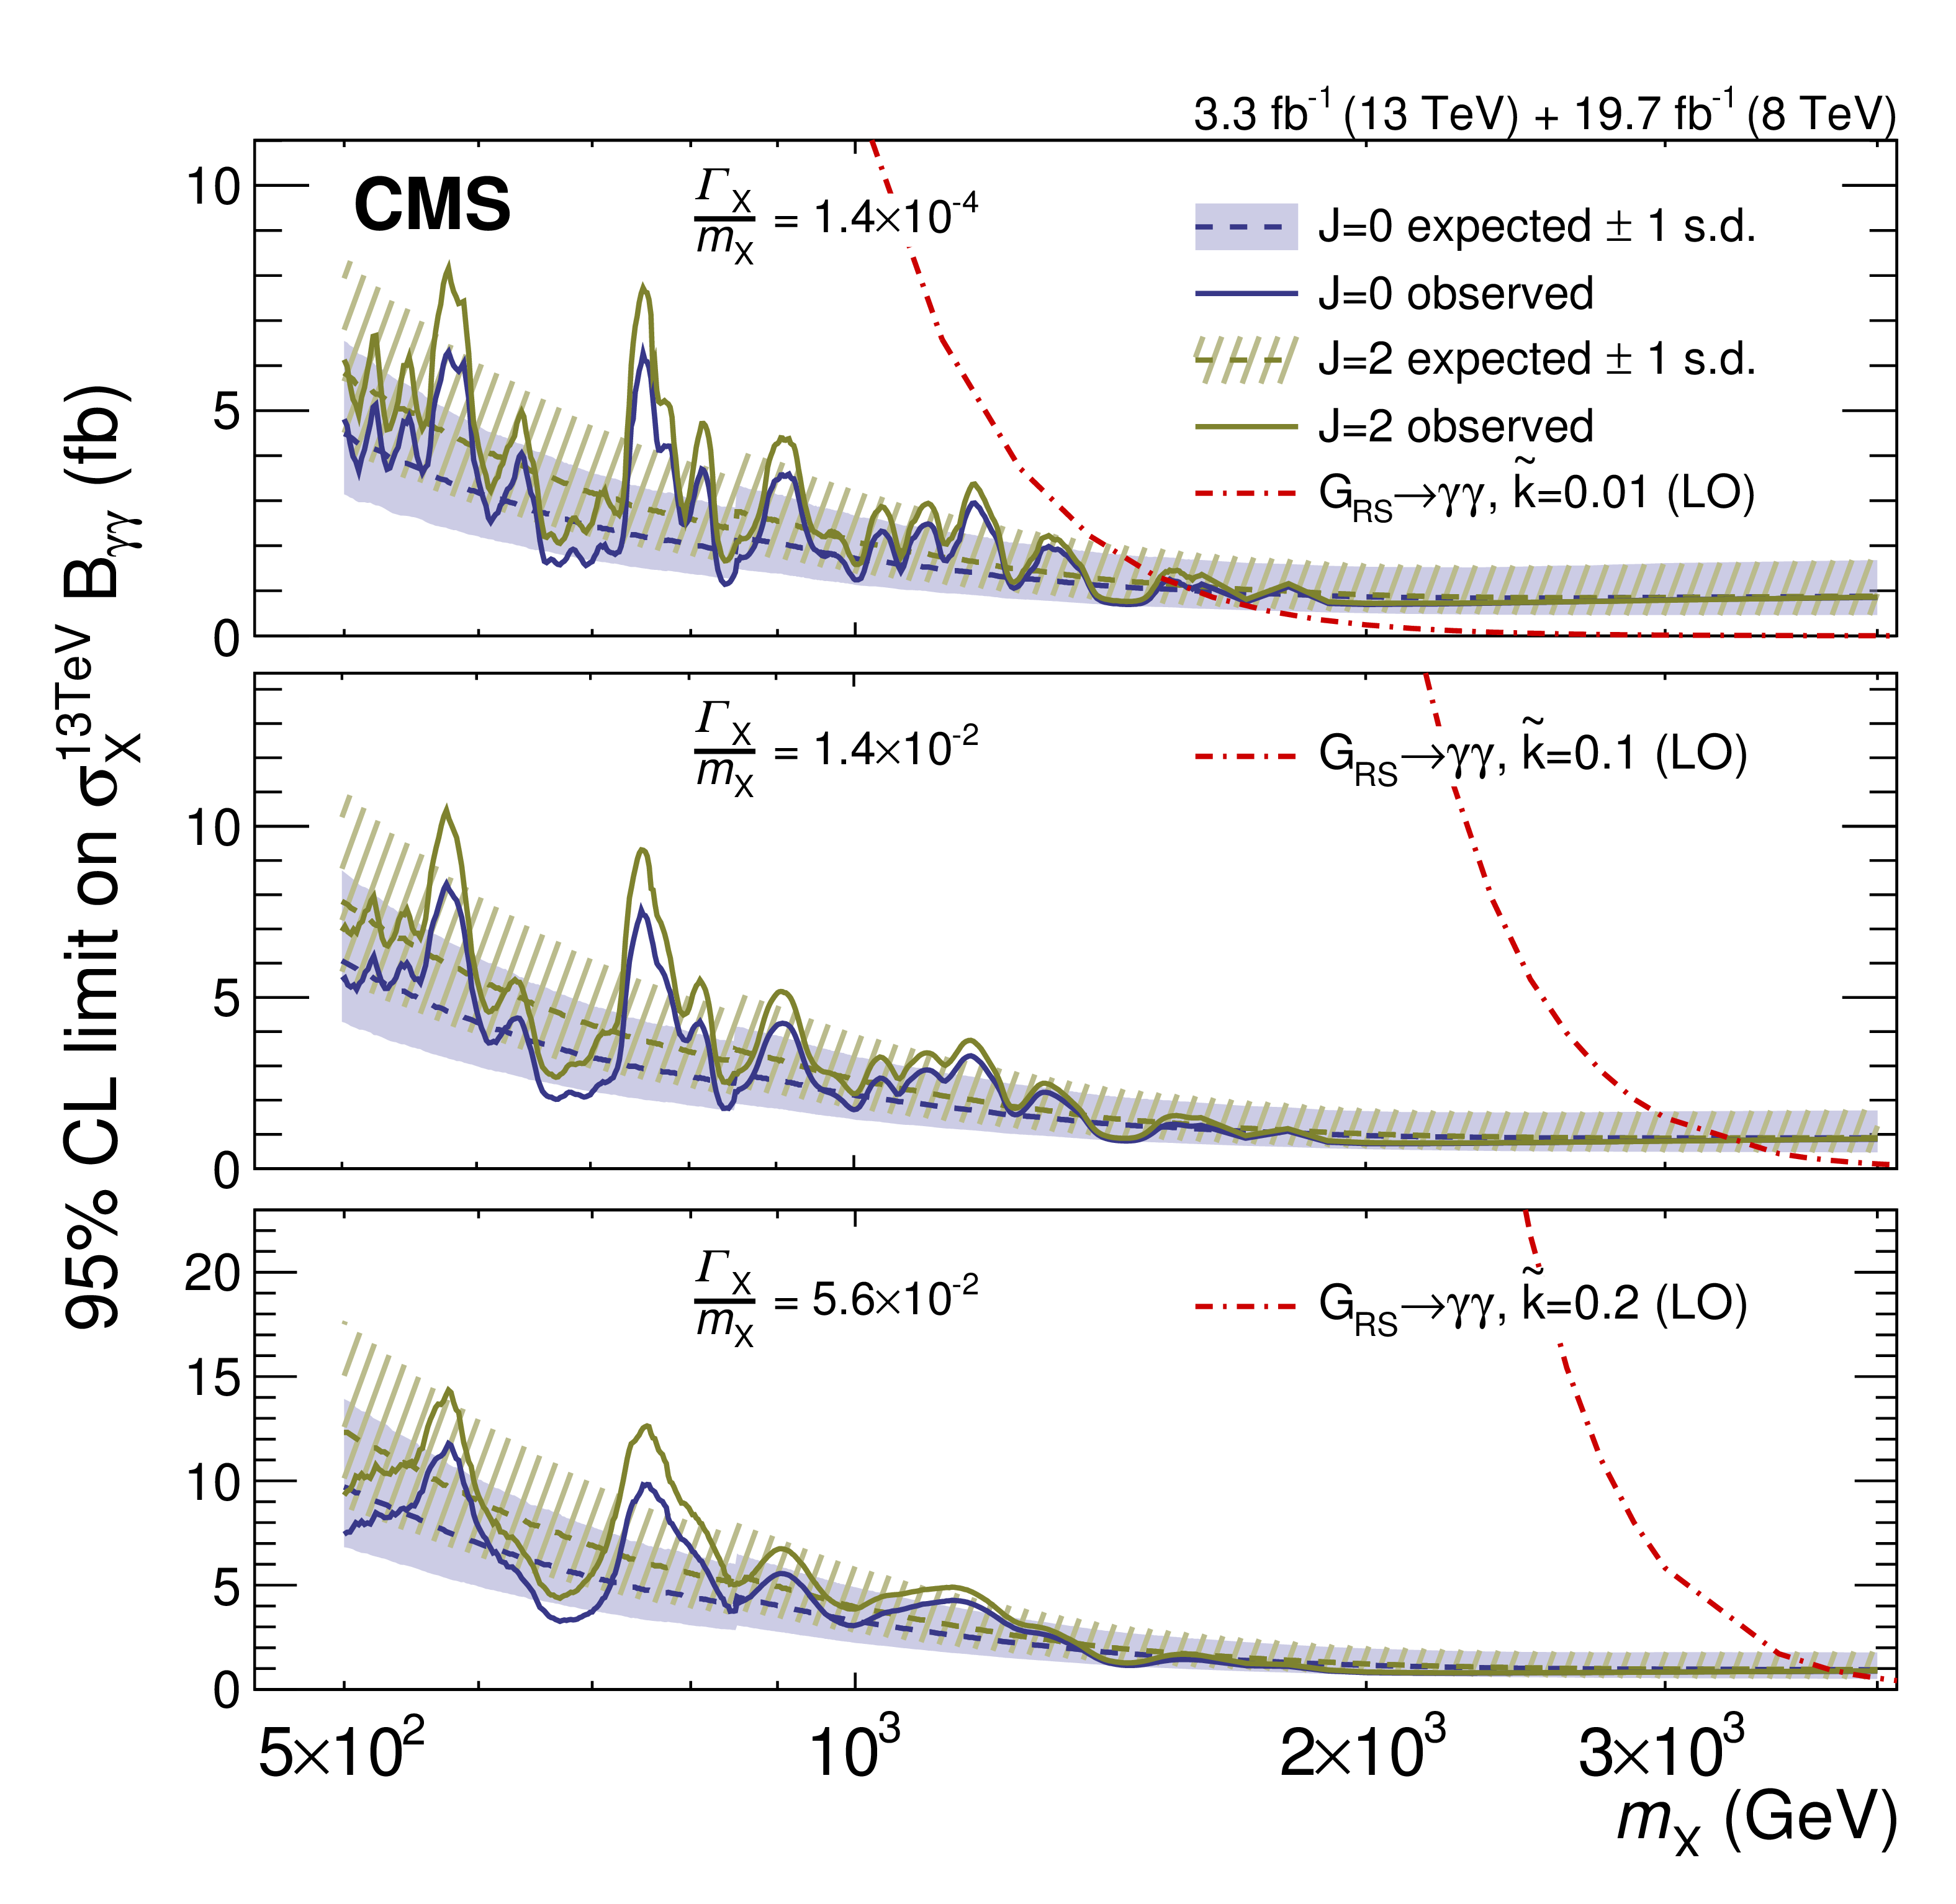
Figure 3:
The 95% CL upper limits on the production of diphoton resonances as a function of the resonance mass ${m_{\mathrm{X} }} $, from the combined analysis of the 8 and 13 TeV data. The 8 TeV results are scaled by the ratio of the 8 to 13 TeV cross sections. The blue-grey (darker) curves and the green (lighter) ones correspond to the scalar and RS graviton signals, respectively. Solid (dashed) curves represent the observed (median expected) exclusion limit. The expected results are shown with their 1 standard deviation dispersion bands. The leading-order RS graviton production cross section is shown by the red dot-dashed curves. The results are shown for (upper) a narrow, (middle) an intermediate-width, and (lower) a broad resonance, with the value of the width ${\Gamma _{\mathrm{X} } / m_{\mathrm{X} }} $, relative to the mass, indicated in the legend of each plot. |

png pdf |
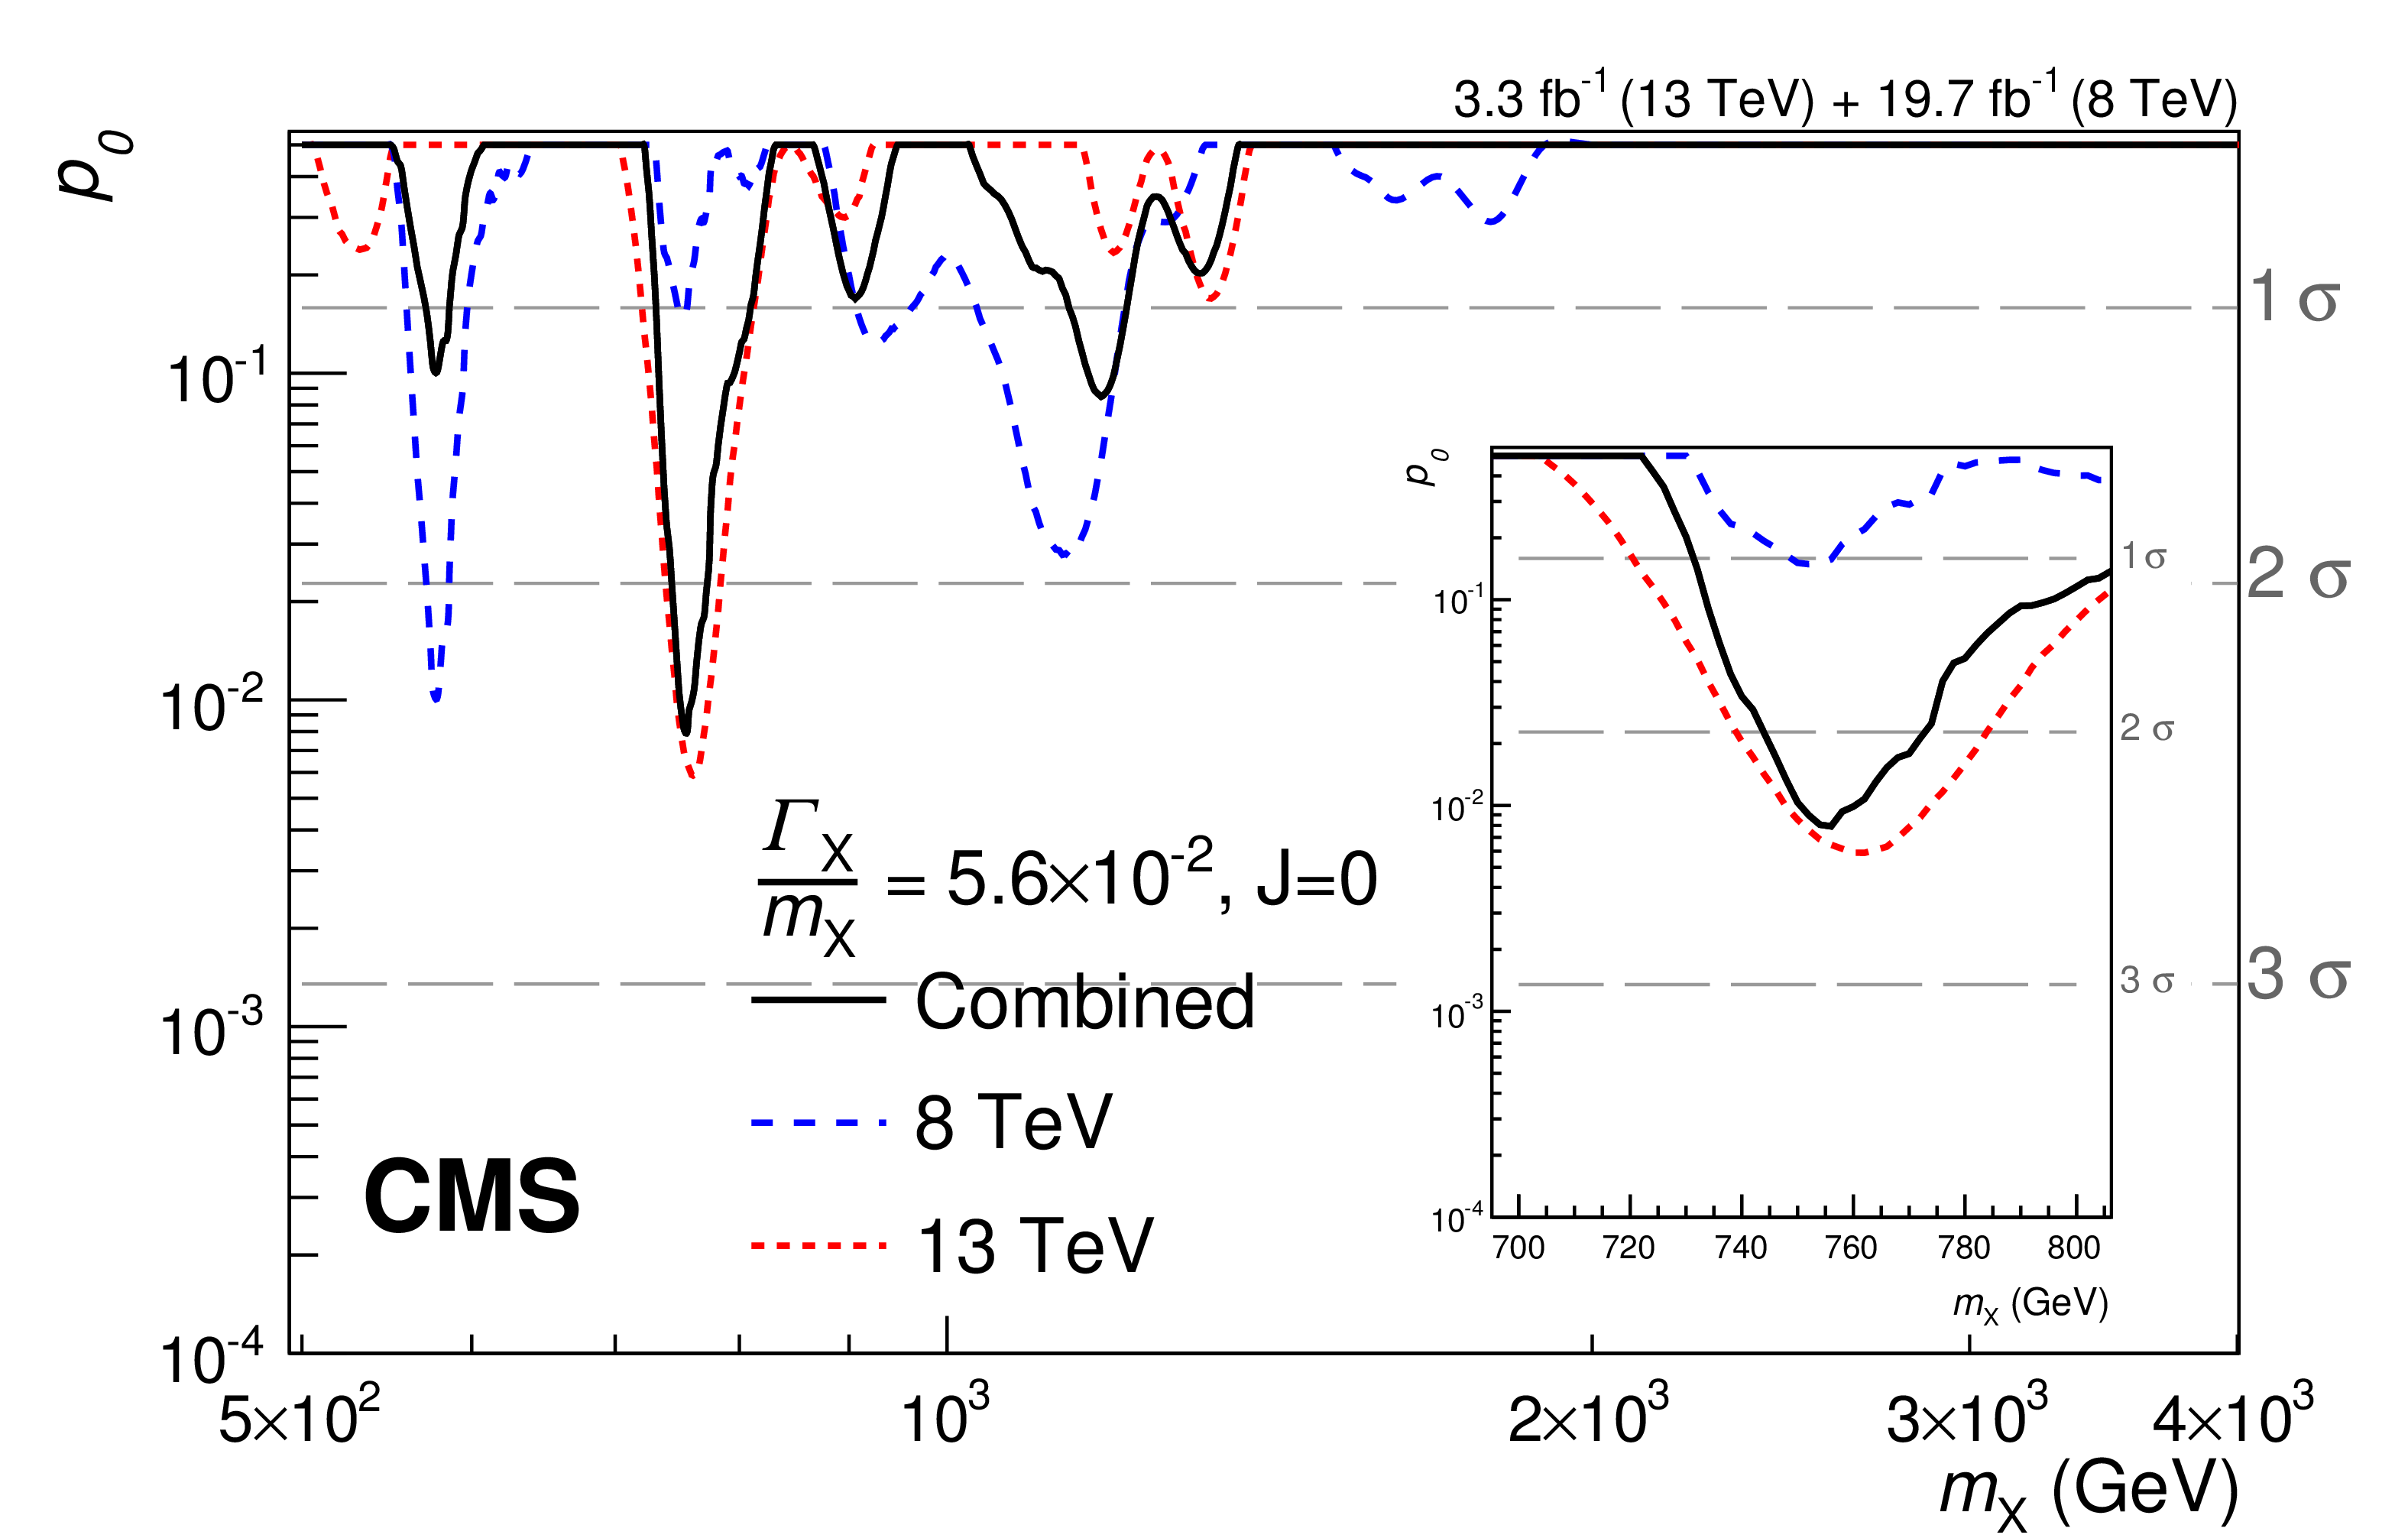
Figure 4:
Observed background-only $p$-values for narrow-width scalar resonances as a function of the resonance mass ${m_{\mathrm{X} }} $, from the combined analysis of the 8 and 13 TeV data. The results for the separate 8 and 13 TeV data sets are also shown. The inset shows an expanded region around $ {m_{\mathrm{X} }} = $ 750 GeV. |
| Summary |
|
In summary, a search for the resonant production of high-mass photon pairs is presented. The analysis is based on 19.7 and 3.3 of proton-proton collisions collected at $\sqrt{s} =$ 8 and 13 TeV, respectively, by the CMS experiment. Limits on the production cross section of scalar resonances and Randall-Sundrum gravitons for resonance masses 0.5 $ < m_{\mathrm{X}} < $ 4 TeV and relative widths $1.4\times 10^{-4} < {\Gamma _{\mathrm{X} } / m_{\mathrm{X} }} < 5.6\times10^{-2}$ are determined. Using leading-order cross sections for RS graviton production, RS gravitons with masses below about 1.6, 3.3, and 3.8 TeV are excluded at 95% confidence level for $\tilde{k} =$ 0.01, 0.1, and 0.2, respectively, corresponding to $ {\Gamma _{\mathrm{X} } / m_{\mathrm{X} }} =1.4\times10^{-4}$, $1.4\times10^{-2}$, and $5.6\times10^{-2}$. A modest excess of events over the background-only hypothesis is observed for $m_{\mathrm{X}} \approx $ 750 GeV. The local $p$-value under the narrow-width hypothesis of $ {\Gamma _{\mathrm{X} } / m_{\mathrm{X} }} = 1.4 \times 10^{-4} $ is 3.4 standard deviations. At $m_{\mathrm{X}}=$ 750 GeV, the 8 and 13 TeV data contribute with similar weights to the combined result. The significance of the excess is reduced to about 1.6 standard deviations once the effect of searching under multiple signal hypotheses is taken into account. More data are required to determine the origin of this excess. A similar analysis is presented by the ATLAS Collaboration [43]. |
| Additional Figures | |
png pdf |
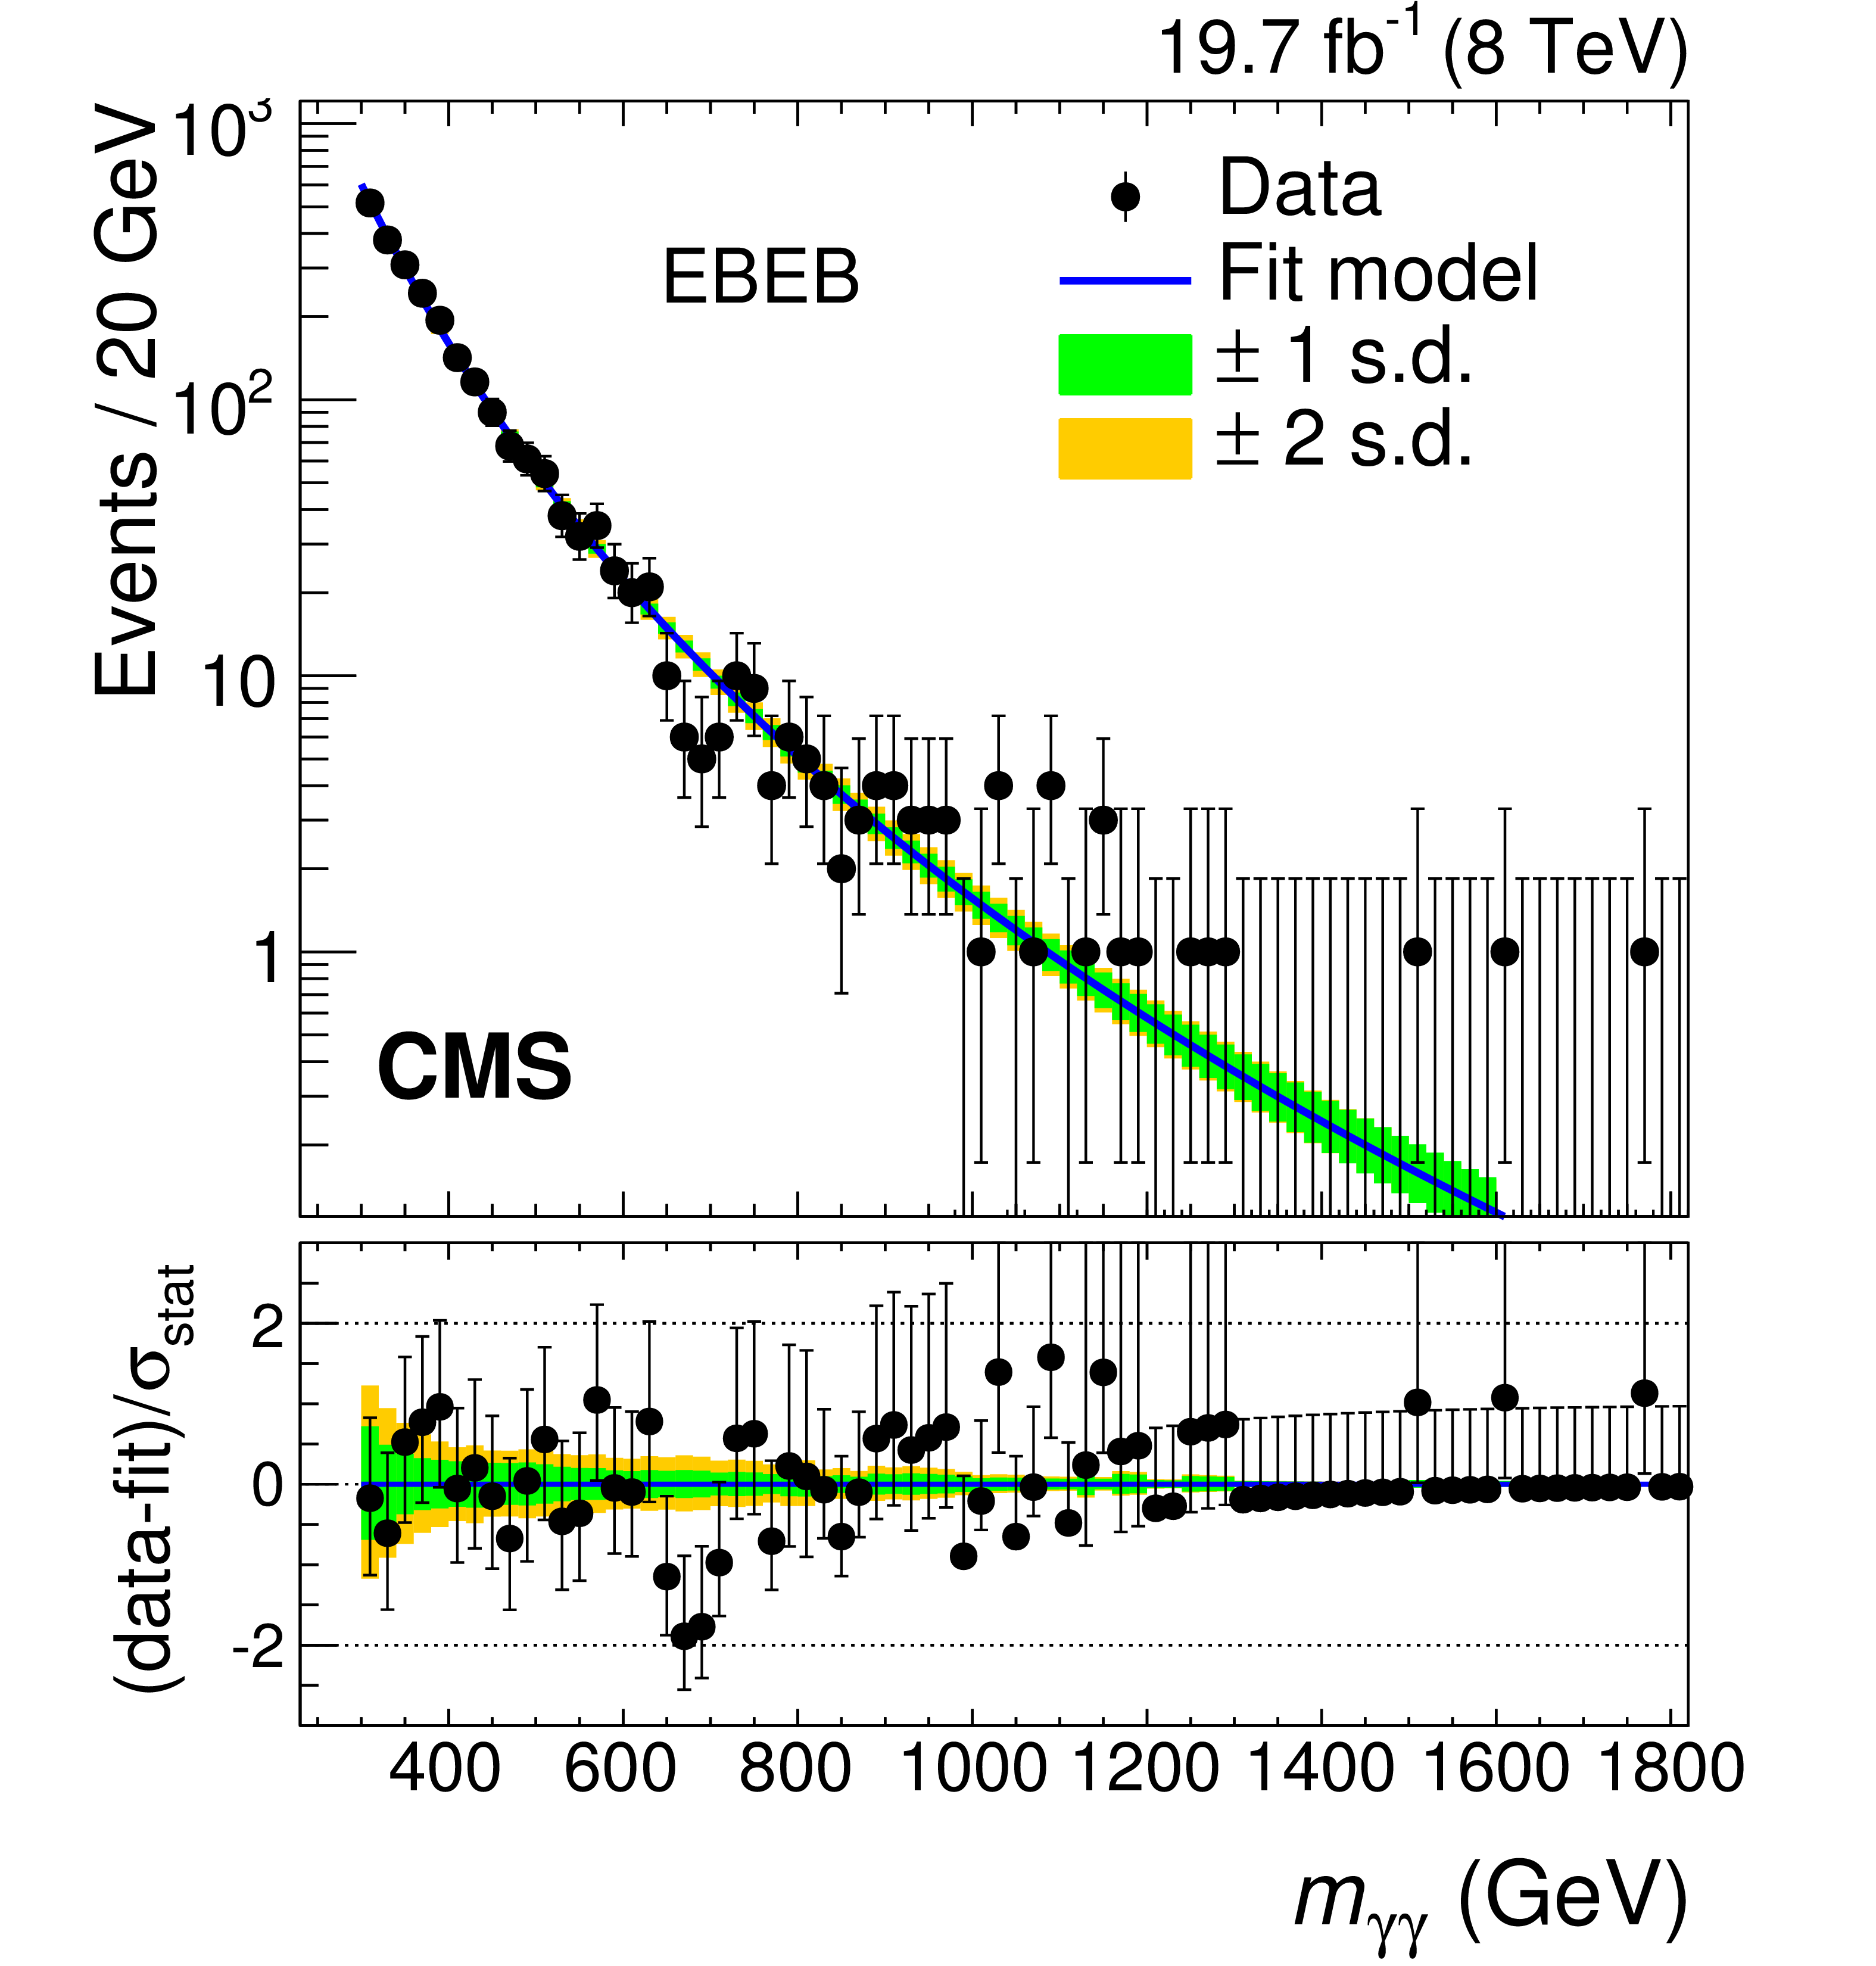
Additional Figure 1:
Observed diphoton invariant mass ${m_{\gamma \gamma }}$ spectra for the event categories used in the analysis of the 8 TeV data for the $ {m_{\mathrm{X} }} >$ 850 GeV search. No event with $ {m_{\gamma \gamma }} >$ 1800 GeV is selected in the analysis. The results of a likelihood fit to the background-only hypothesis are also shown. The lower panel shows the difference between the data and fit, divided by the statistical uncertainty in the data points. |

png pdf |
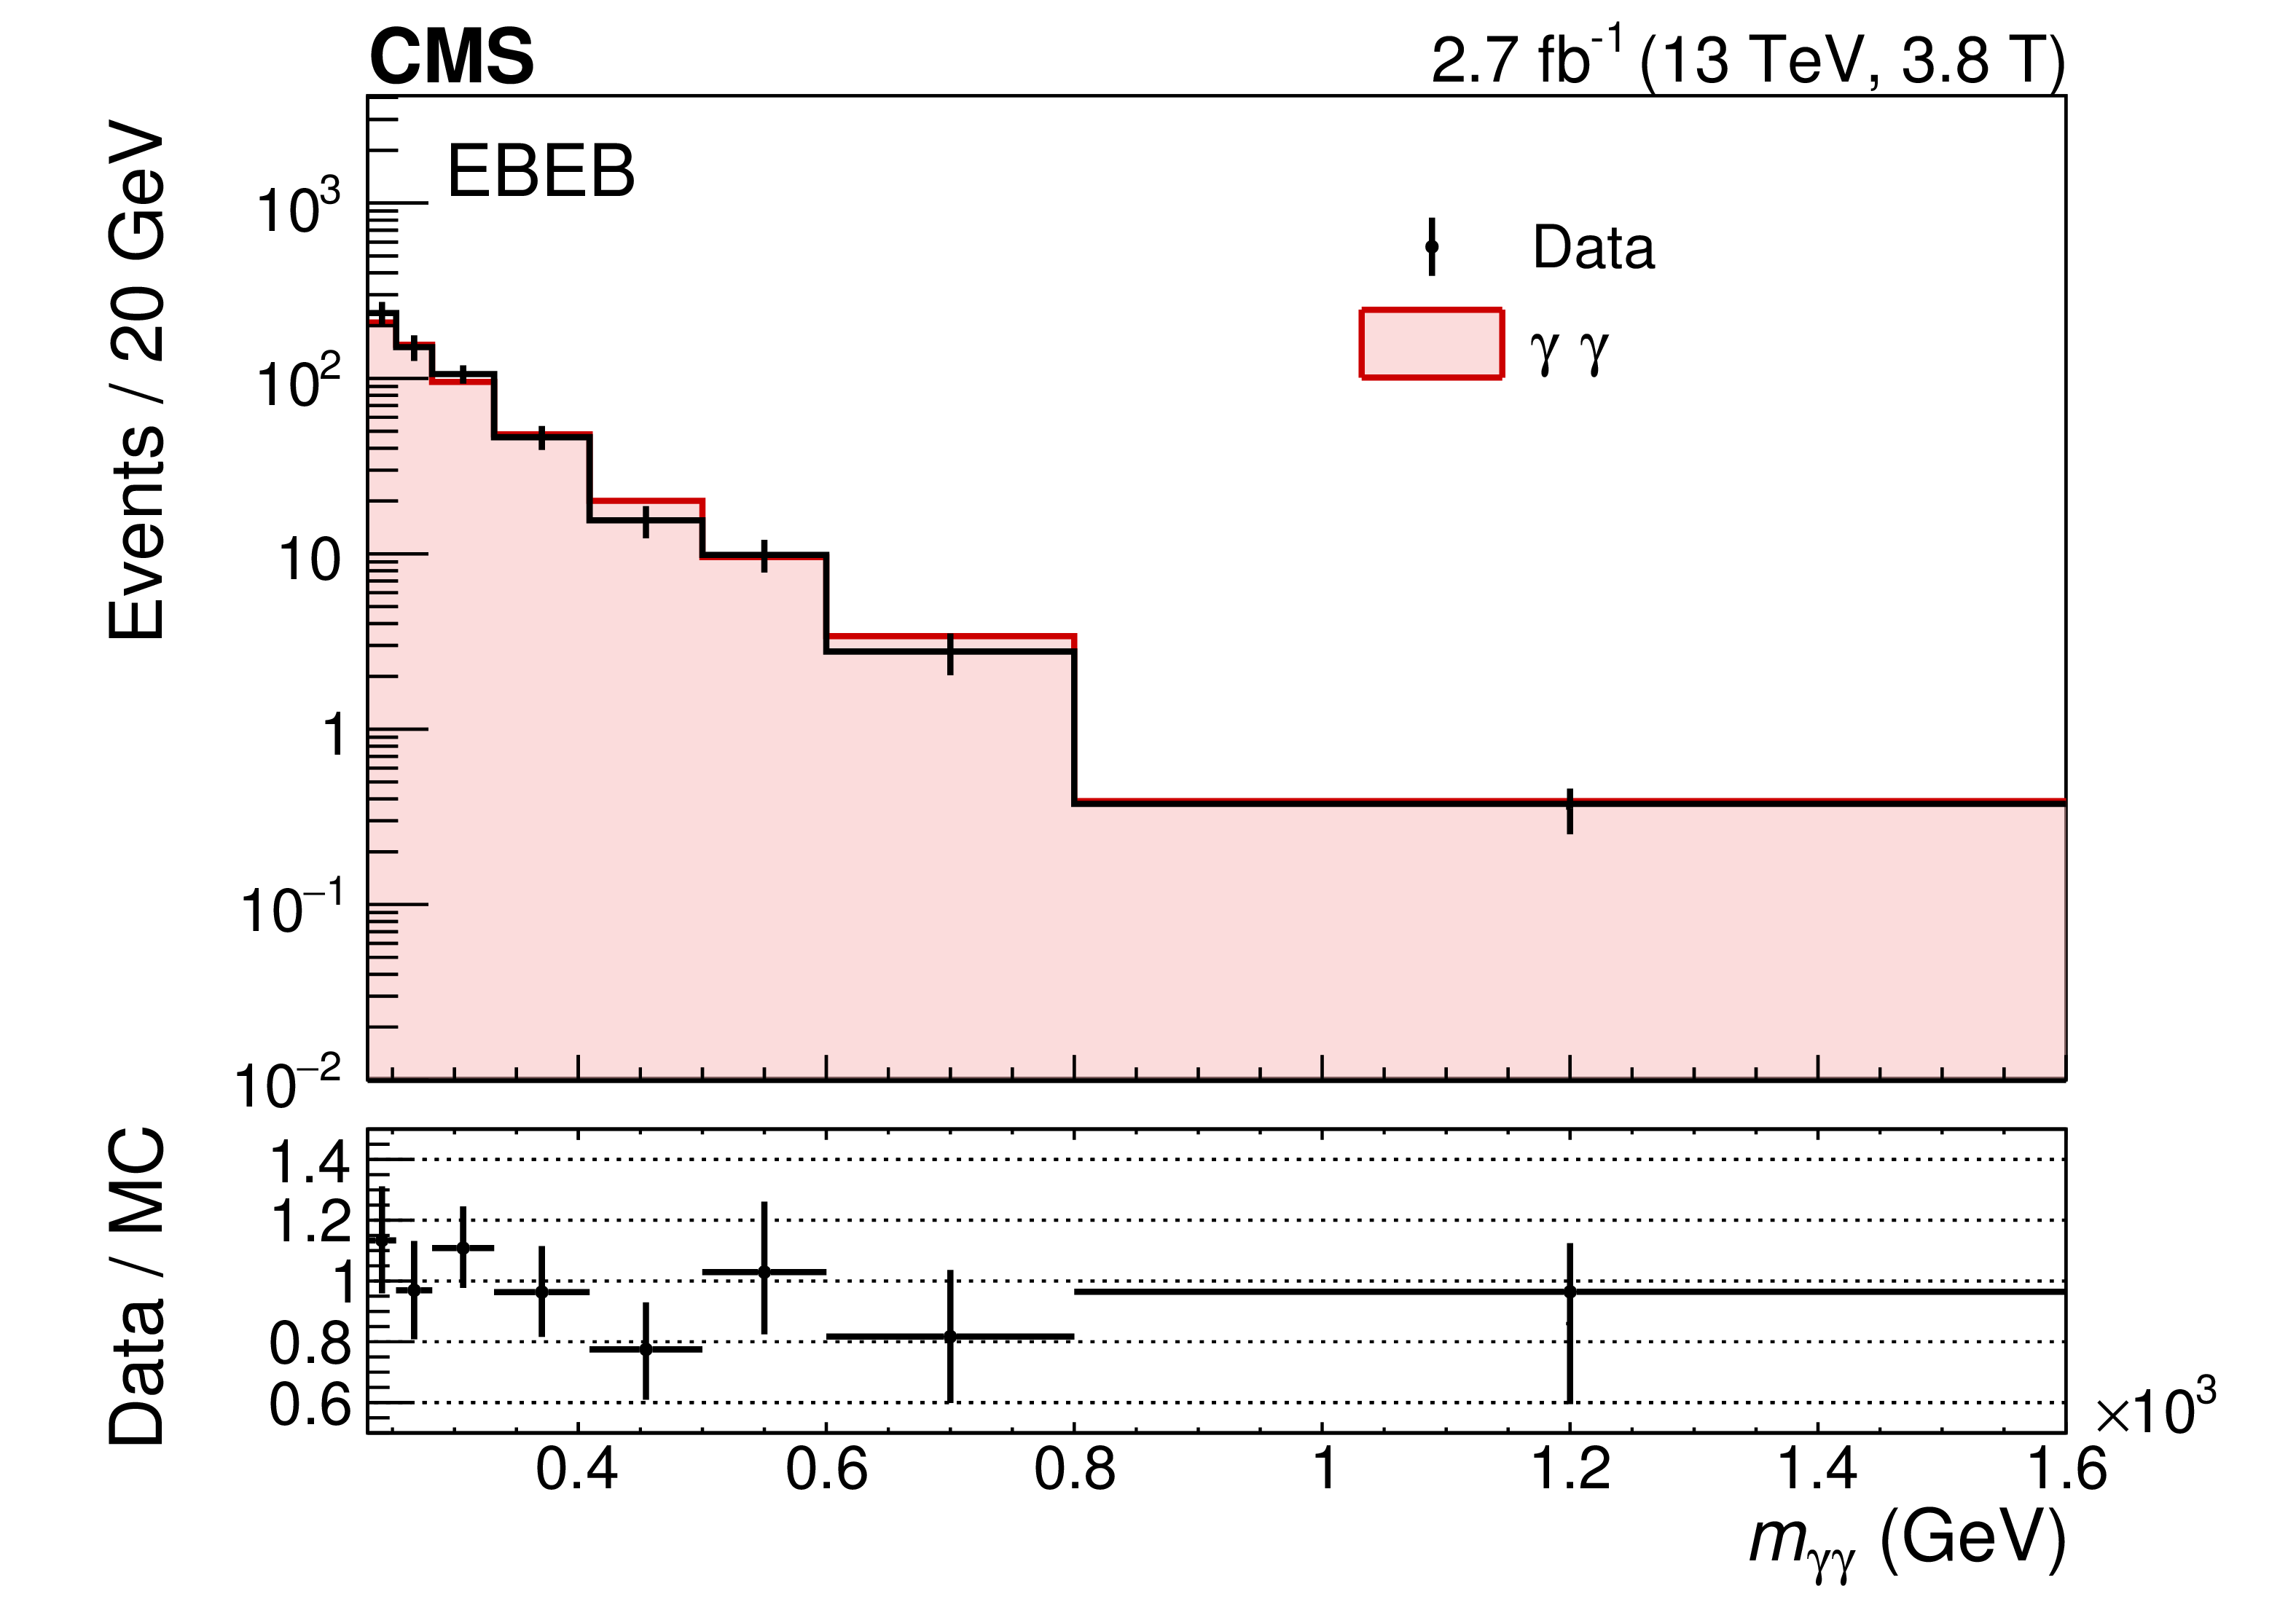
Additional Figure 2-a:
Measured composition of the background for the 13 TeV analysis at 3.8 T for the (a) EBEB and (b) EBEE categories. The method described in Ref. [1] was used to obtain these results. The background corresponds to the direct production of two photons ($\gamma \gamma $), the production of $\gamma $+jets events ($\gamma \mathrm{j}$), and the production of multijet events ($\mathrm{jj}$). The shaded error boxes represent the systematic uncertainties associated with the measurement, while the error bars represent the total uncertainties, obtained adding in quadrature statistical and systematic uncertainties. |

png pdf |
Additional Figure 2-b:
Measured composition of the background for the 13 TeV analysis at 3.8 T for the (a) EBEB and (b) EBEE categories. The method described in Ref. [1] was used to obtain these results. The background corresponds to the direct production of two photons ($\gamma \gamma $), the production of $\gamma $+jets events ($\gamma \mathrm{j}$), and the production of multijet events ($\mathrm{jj}$). The shaded error boxes represent the systematic uncertainties associated with the measurement, while the error bars represent the total uncertainties, obtained adding in quadrature statistical and systematic uncertainties. |
png pdf |
Additional Figure 3-a:
Comparison between the measured and the predicted invariant mass spectrum of the nonresonant SM $\gamma \gamma $ background for the 13 TeV analysis at 3.8 T for the (a) EBEB and (b) EBEE categories. The $\gamma$+jets and multijet background components are subtracted in data, using the method described in Ref. [1]. The predicted background is obtained correcting the distribution of the events generated with the SHERPA 2.1 [2] generator (where the CMS detector response was simulated using the GEANT4 package [3]) to match the predictions obtained with the 2$\gamma $ NNLO program [4]. |

png pdf |
Additional Figure 3-b:
Comparison between the measured and the predicted invariant mass spectrum of the nonresonant SM $\gamma \gamma $ background for the 13 TeV analysis at 3.8 T for the (a) EBEB and (b) EBEE categories. The $\gamma$+jets and multijet background components are subtracted in data, using the method described in Ref. [1]. The predicted background is obtained correcting the distribution of the events generated with the SHERPA 2.1 [2] generator (where the CMS detector response was simulated using the GEANT4 package [3]) to match the predictions obtained with the 2$\gamma $ NNLO program [4]. |
png pdf |
Additional Figure 4:
Observed background-only $p$-values for spin-0 resonances with $ {\Gamma _{\mathrm{X} } / m_{\mathrm{X} }} =5.6\times 10^{-2}$ as a function of the resonance mass ${m_{\mathrm{X} }}$ from the combined analysis of the 8 and 13 TeV data. The results for the 8 and 13 TeV data sets are also shown separately. |

png pdf |
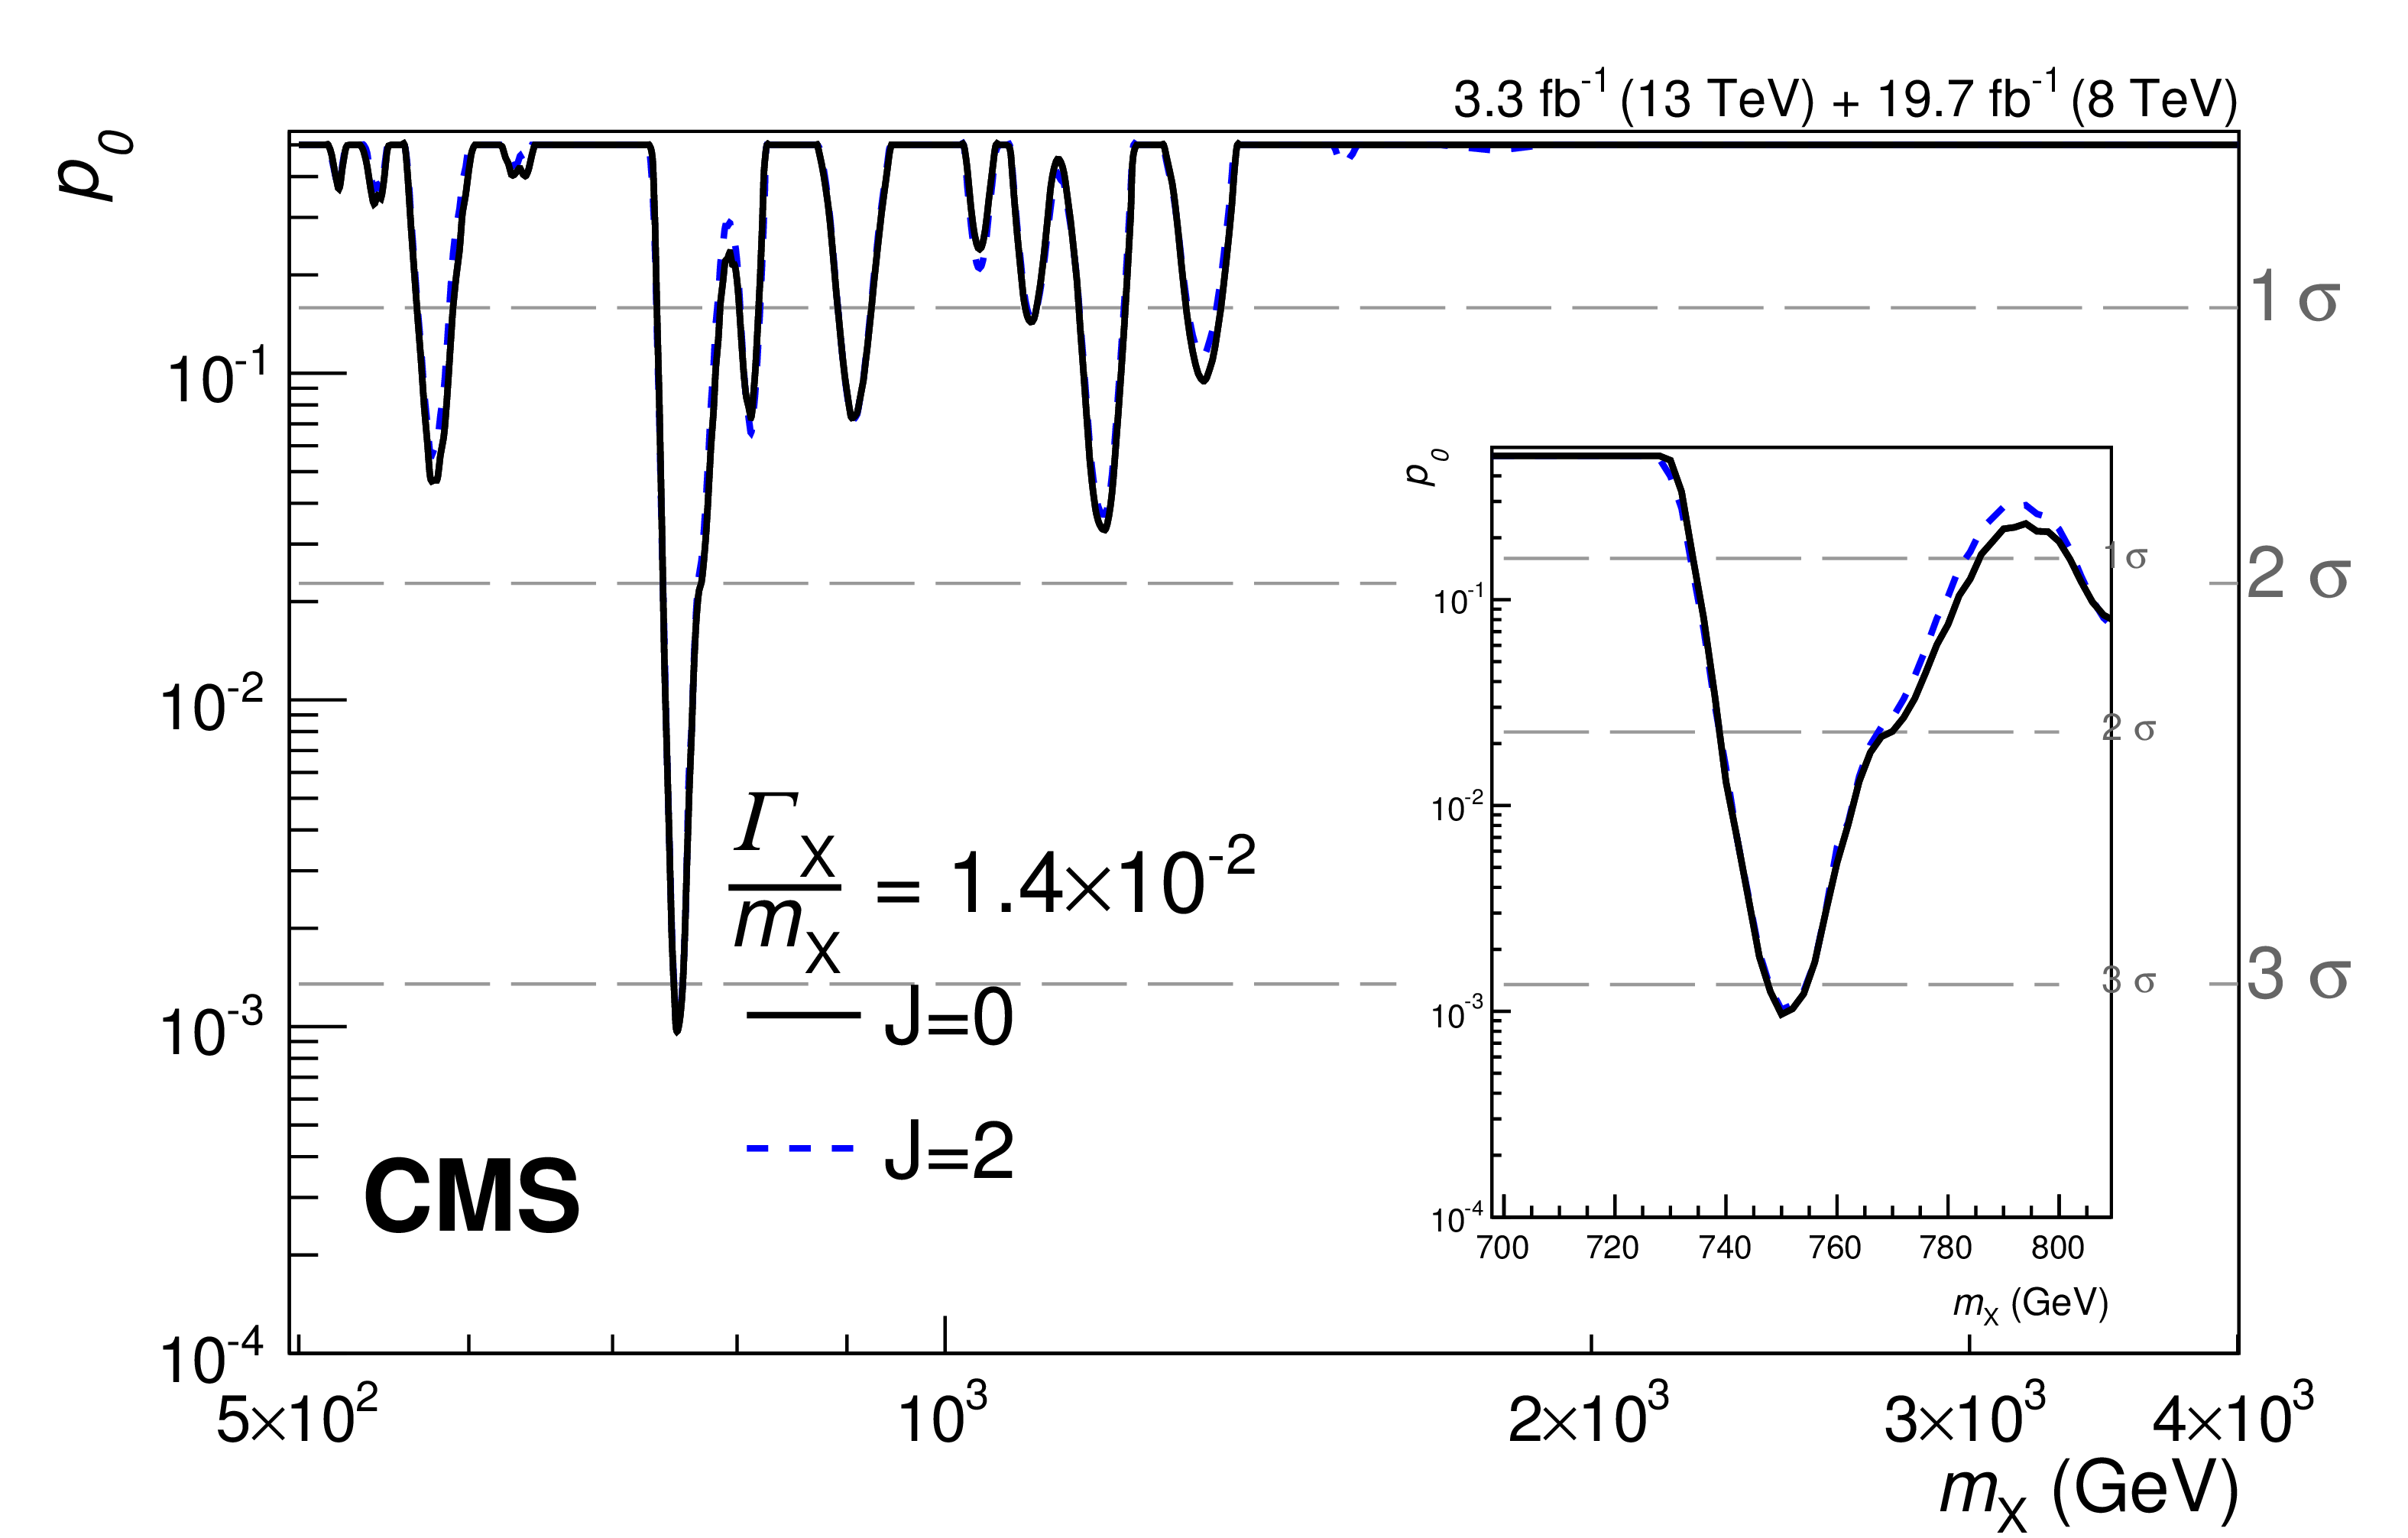
Additional Figure 5-a:
Observed background-only $p$-values as a function of the resonance mass ${m_{\mathrm{X} }}$ from the combined analysis of the 8 and 13 TeV data. Three width hypotheses are shown: (a) $ {\Gamma _{\mathrm{X} } / m_{\mathrm{X} }} = 1.4 \times 10^{-4}$; (b) $ {\Gamma _{\mathrm{X} } / m_{\mathrm{X} }} = 1.4 \times 10^{-2}$; (c) $ {\Gamma _{\mathrm{X} } / m_{\mathrm{X} }} = 5.6 \times 10^{-2}$. In each plot, the results obtained under the RS graviton and scalar hypotheses are shown. |
png pdf |
Additional Figure 5-b:
Observed background-only $p$-values as a function of the resonance mass ${m_{\mathrm{X} }}$ from the combined analysis of the 8 and 13 TeV data. Three width hypotheses are shown: (a) $ {\Gamma _{\mathrm{X} } / m_{\mathrm{X} }} = 1.4 \times 10^{-4}$; (b) $ {\Gamma _{\mathrm{X} } / m_{\mathrm{X} }} = 1.4 \times 10^{-2}$; (c) $ {\Gamma _{\mathrm{X} } / m_{\mathrm{X} }} = 5.6 \times 10^{-2}$. In each plot, the results obtained under the RS graviton and scalar hypotheses are shown. |
png pdf |
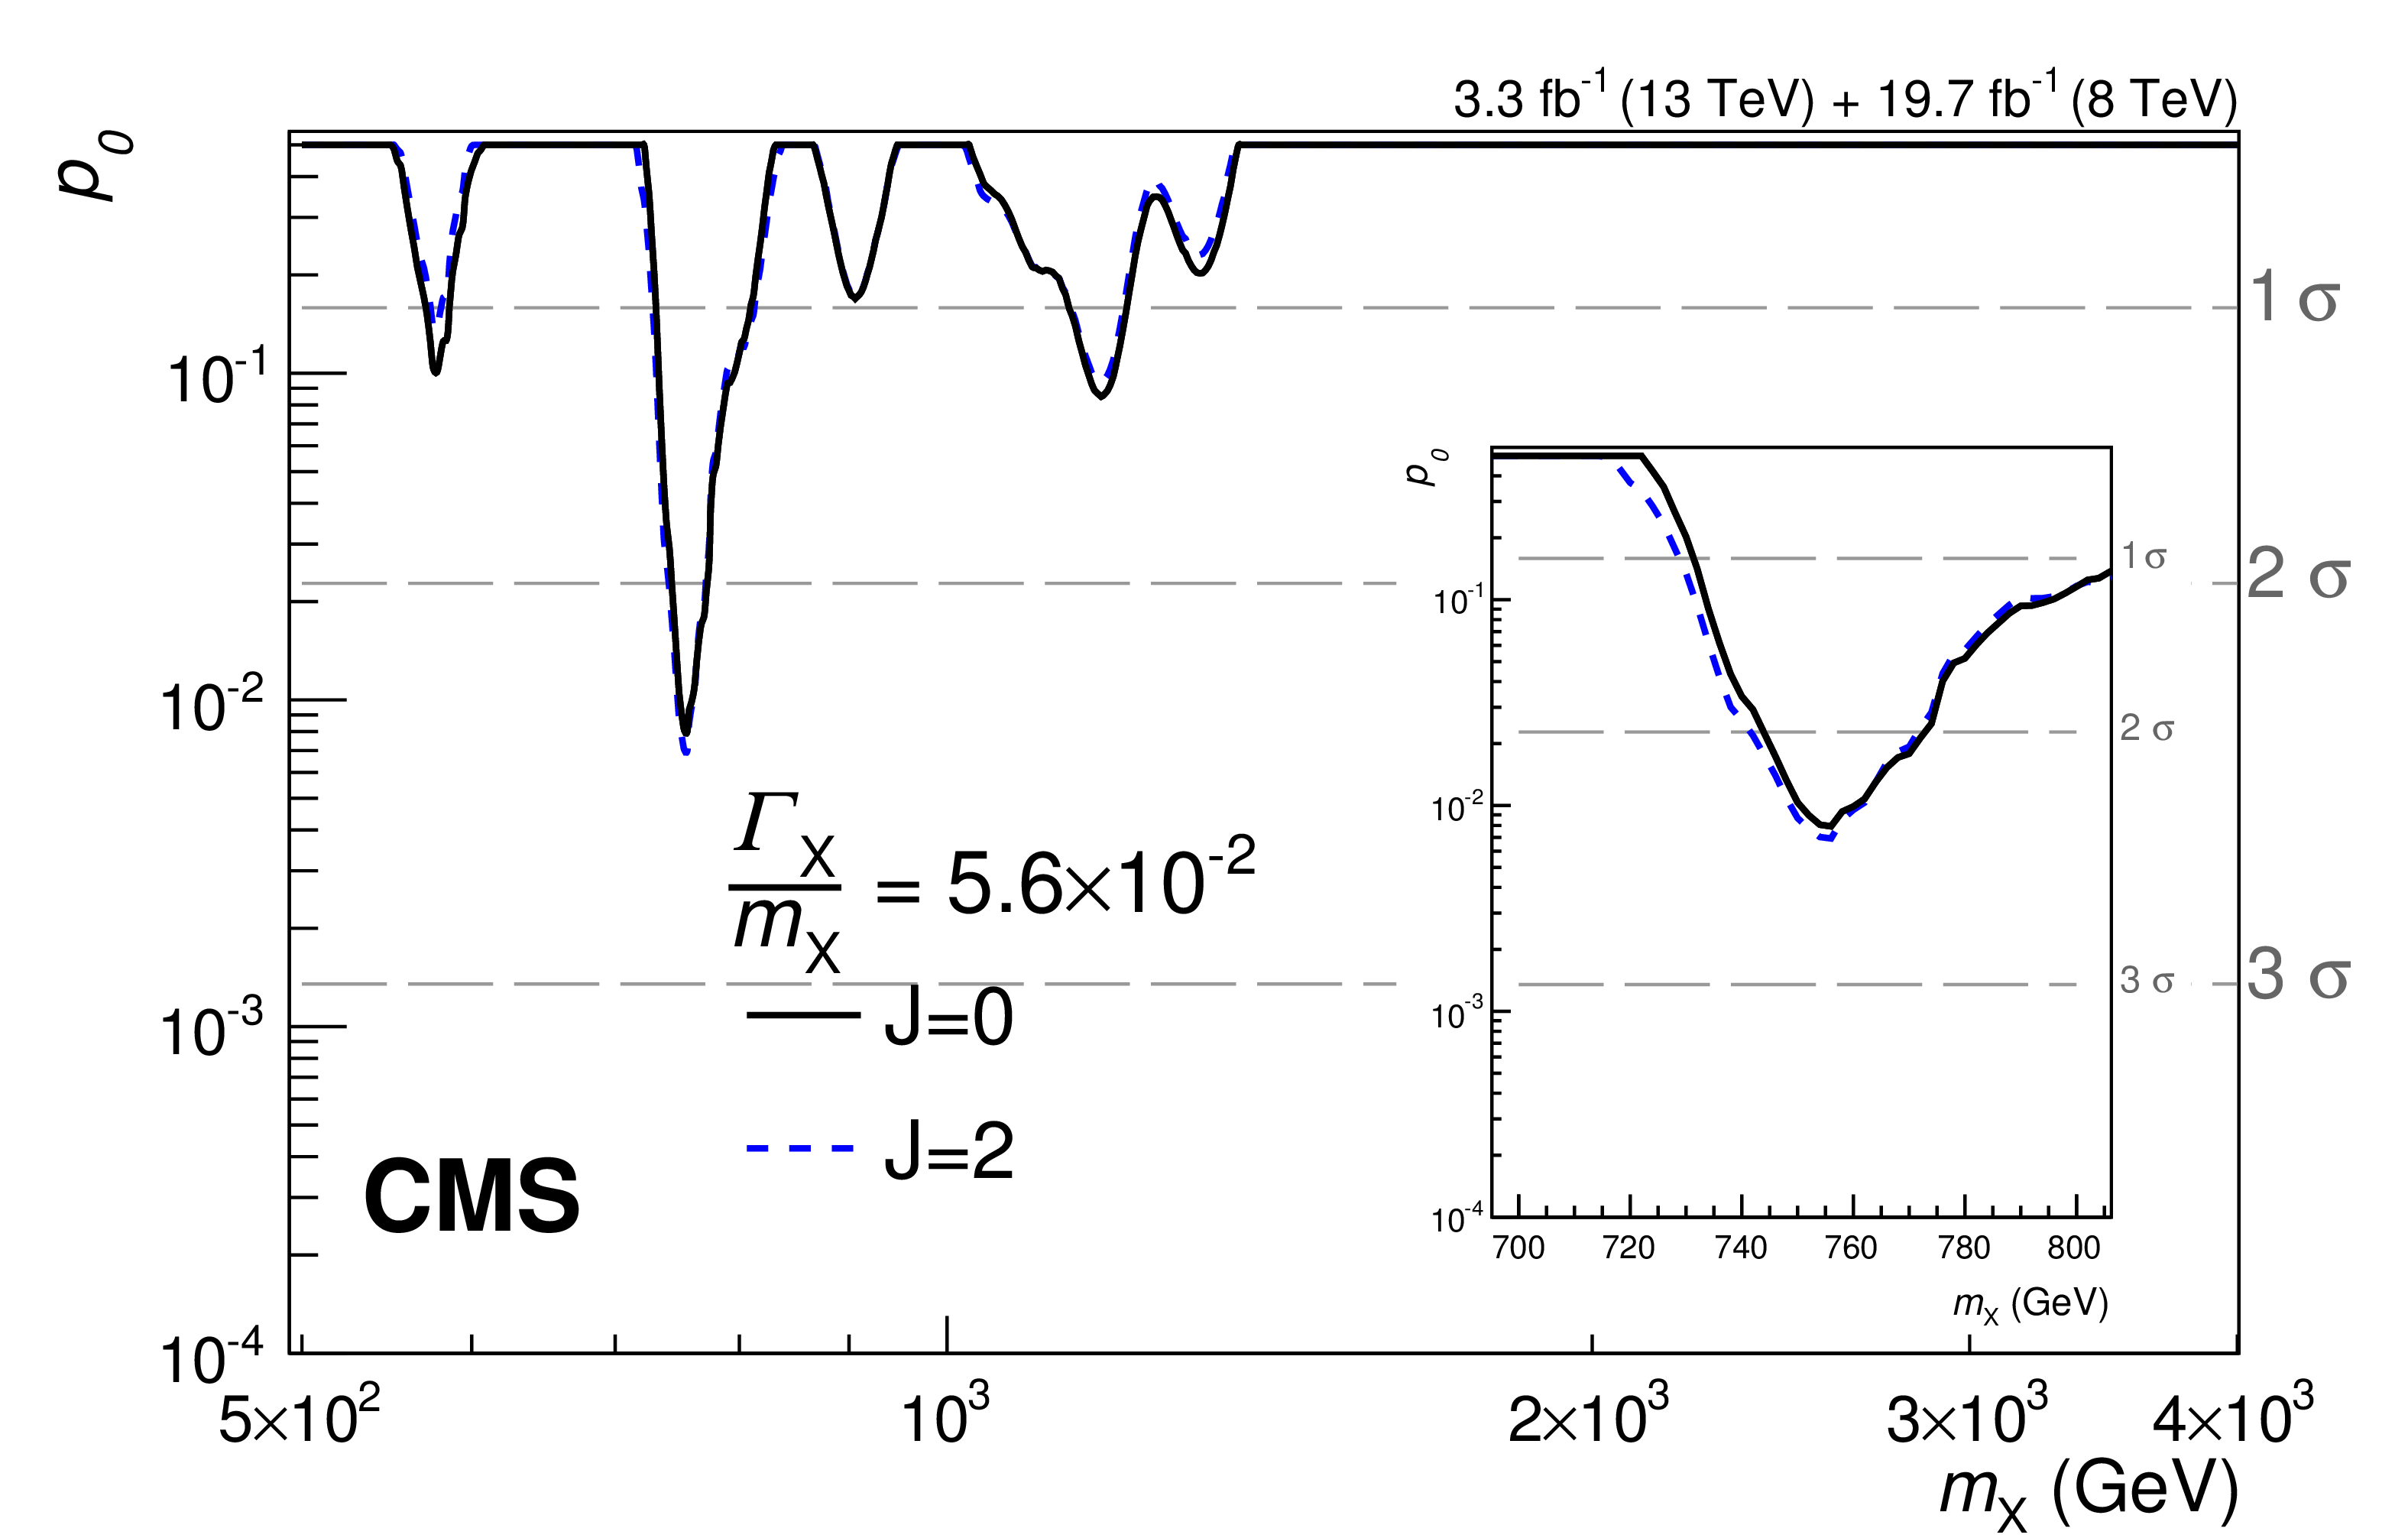
Additional Figure 5-c:
Observed background-only $p$-values as a function of the resonance mass ${m_{\mathrm{X} }}$ from the combined analysis of the 8 and 13 TeV data. Three width hypotheses are shown: (a) $ {\Gamma _{\mathrm{X} } / m_{\mathrm{X} }} = 1.4 \times 10^{-4}$; (b) $ {\Gamma _{\mathrm{X} } / m_{\mathrm{X} }} = 1.4 \times 10^{-2}$; (c) $ {\Gamma _{\mathrm{X} } / m_{\mathrm{X} }} = 5.6 \times 10^{-2}$. In each plot, the results obtained under the RS graviton and scalar hypotheses are shown. |
png pdf |
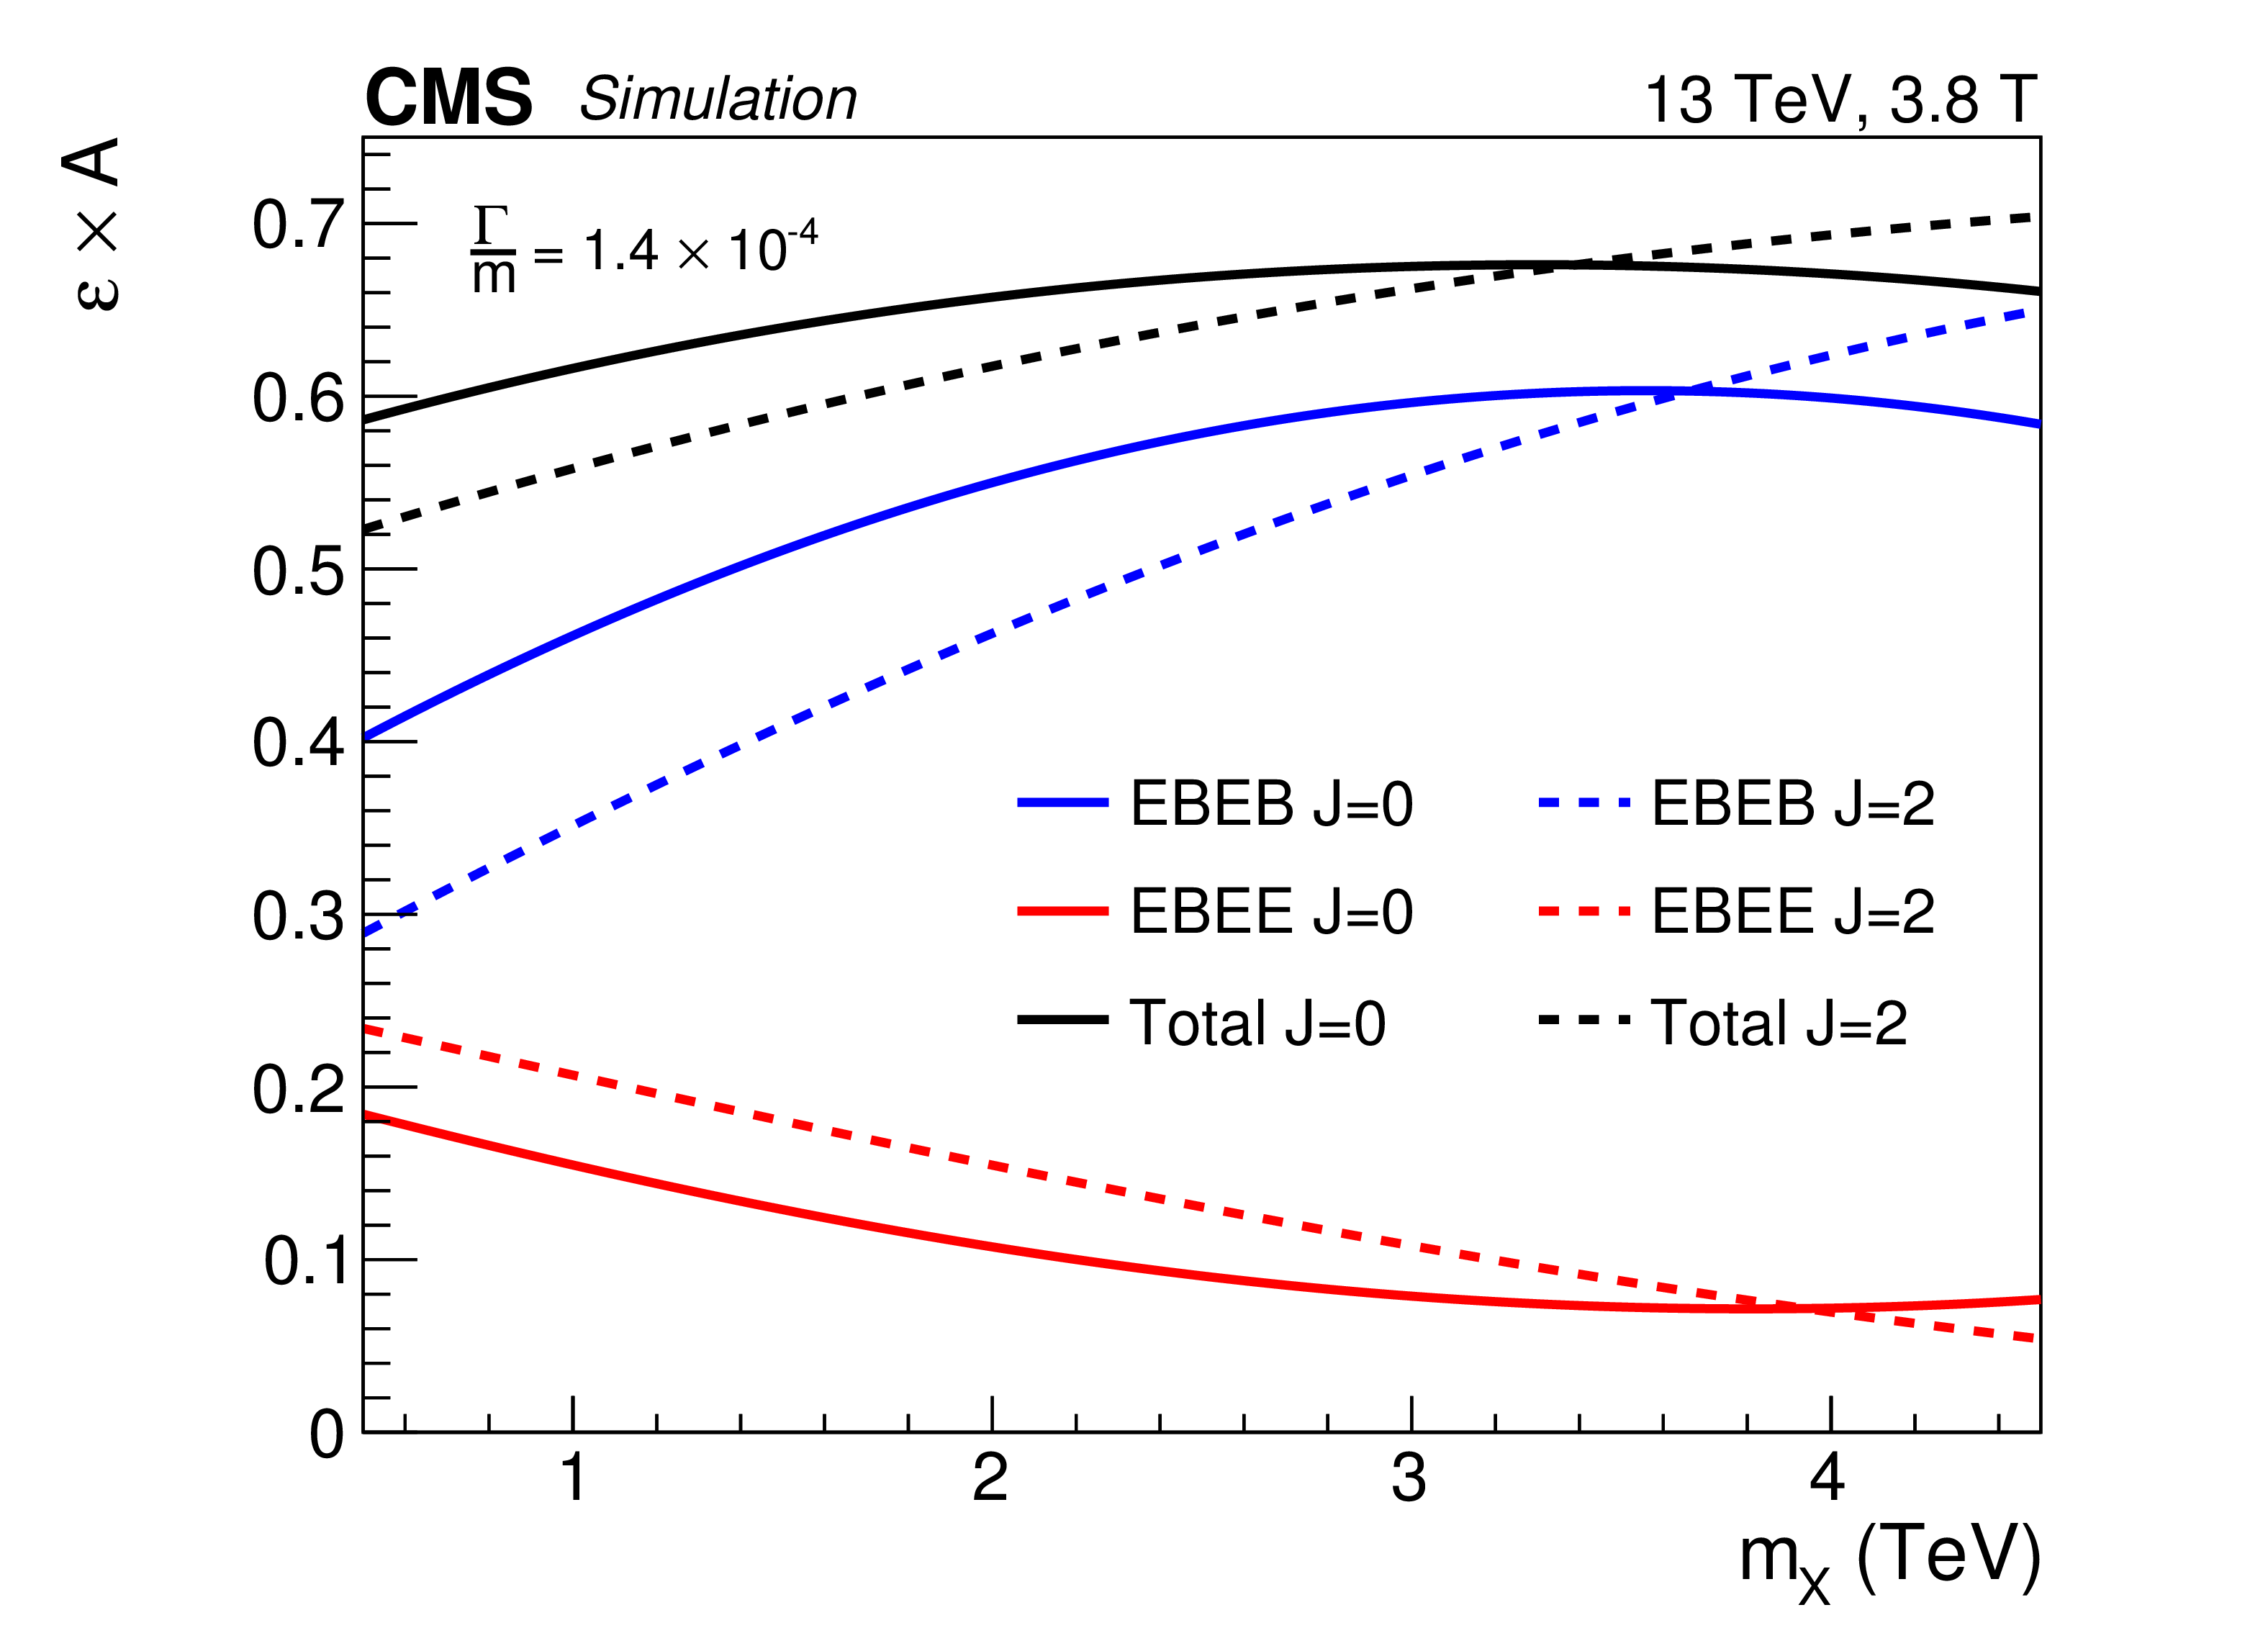
Additional Figure 6-a:
Fraction of events selected by the analysis categories for 0.5 $< {m_{\mathrm{X} }} <$ 4.5 TeV and $ {\Gamma _{\mathrm{X} } / m_{\mathrm{X} }} = 1.4\times 10^{-4}$. Curves for both spin-0 and RS graviton resonances are shown, in the left plot for the 3.8 T sample and in the right one for the 0 T sample. |
png pdf |
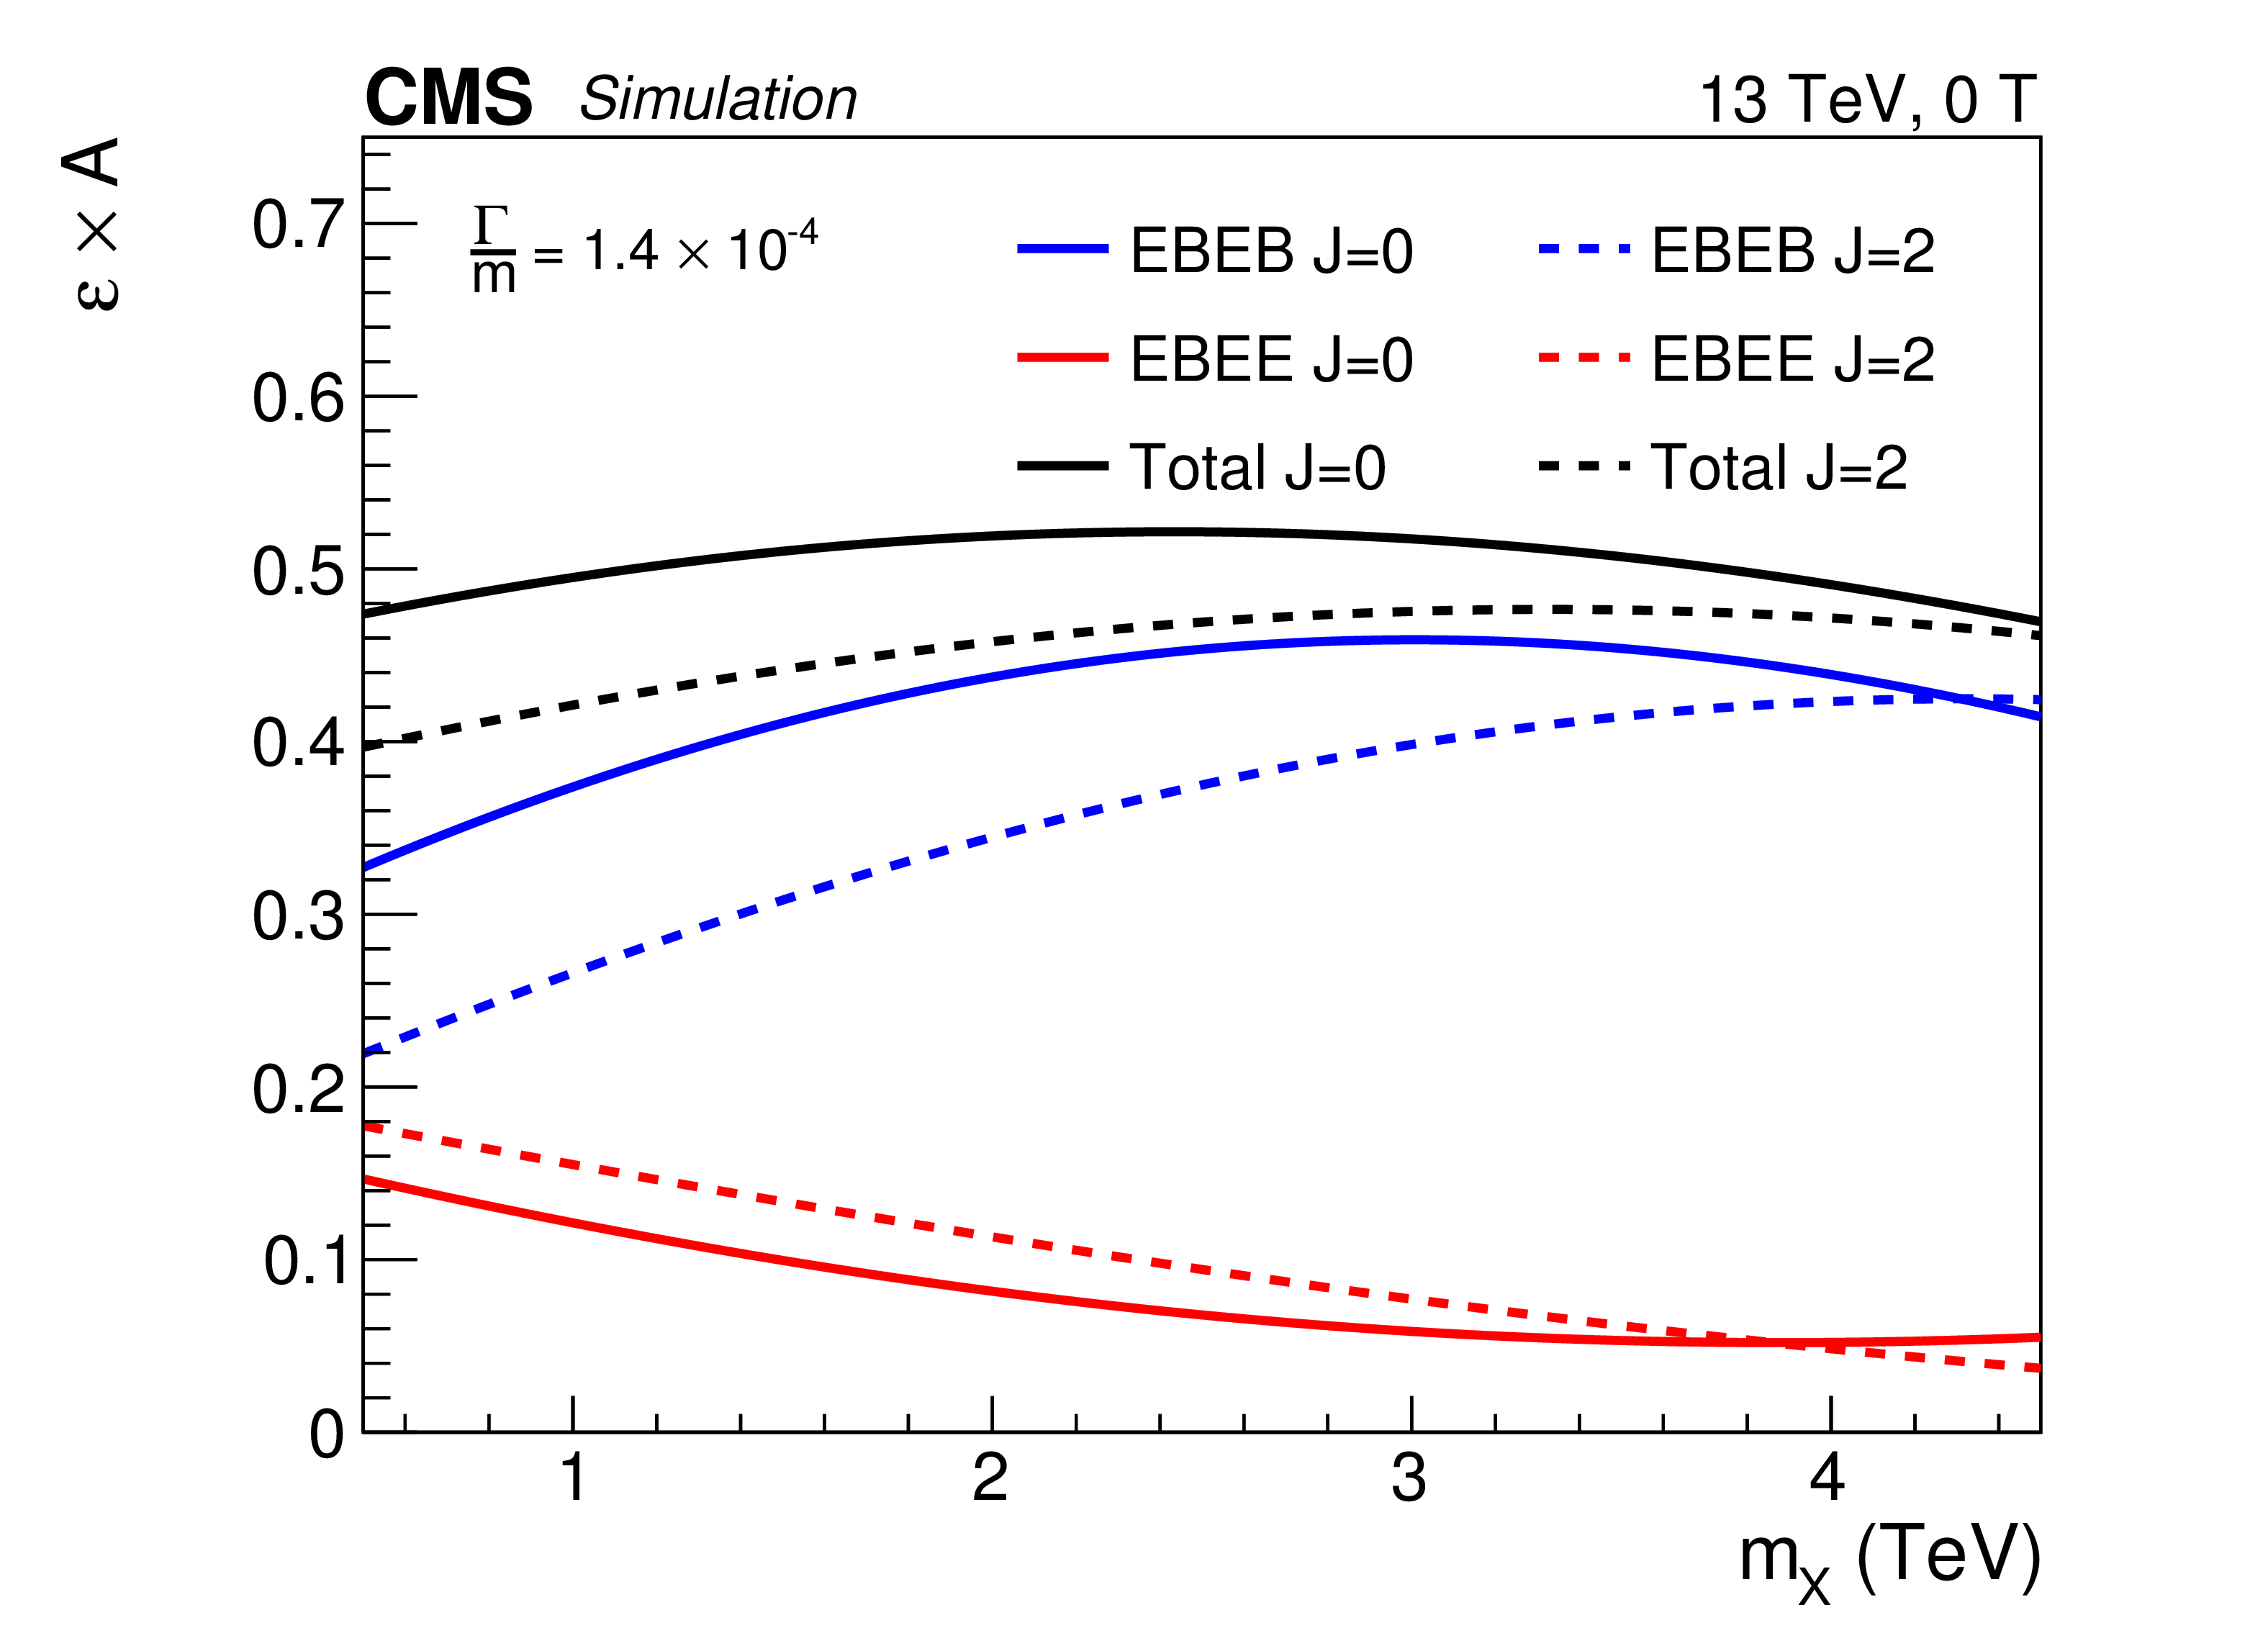
Additional Figure 6-b:
Fraction of events selected by the analysis categories for 0.5 $< {m_{\mathrm{X} }} <$ 4.5 TeV and $ {\Gamma _{\mathrm{X} } / m_{\mathrm{X} }} = 1.4\times 10^{-4}$. Curves for both spin-0 and RS graviton resonances are shown, in the left plot for the 3.8 T sample and in the right one for the 0 T sample. |

png pdf |
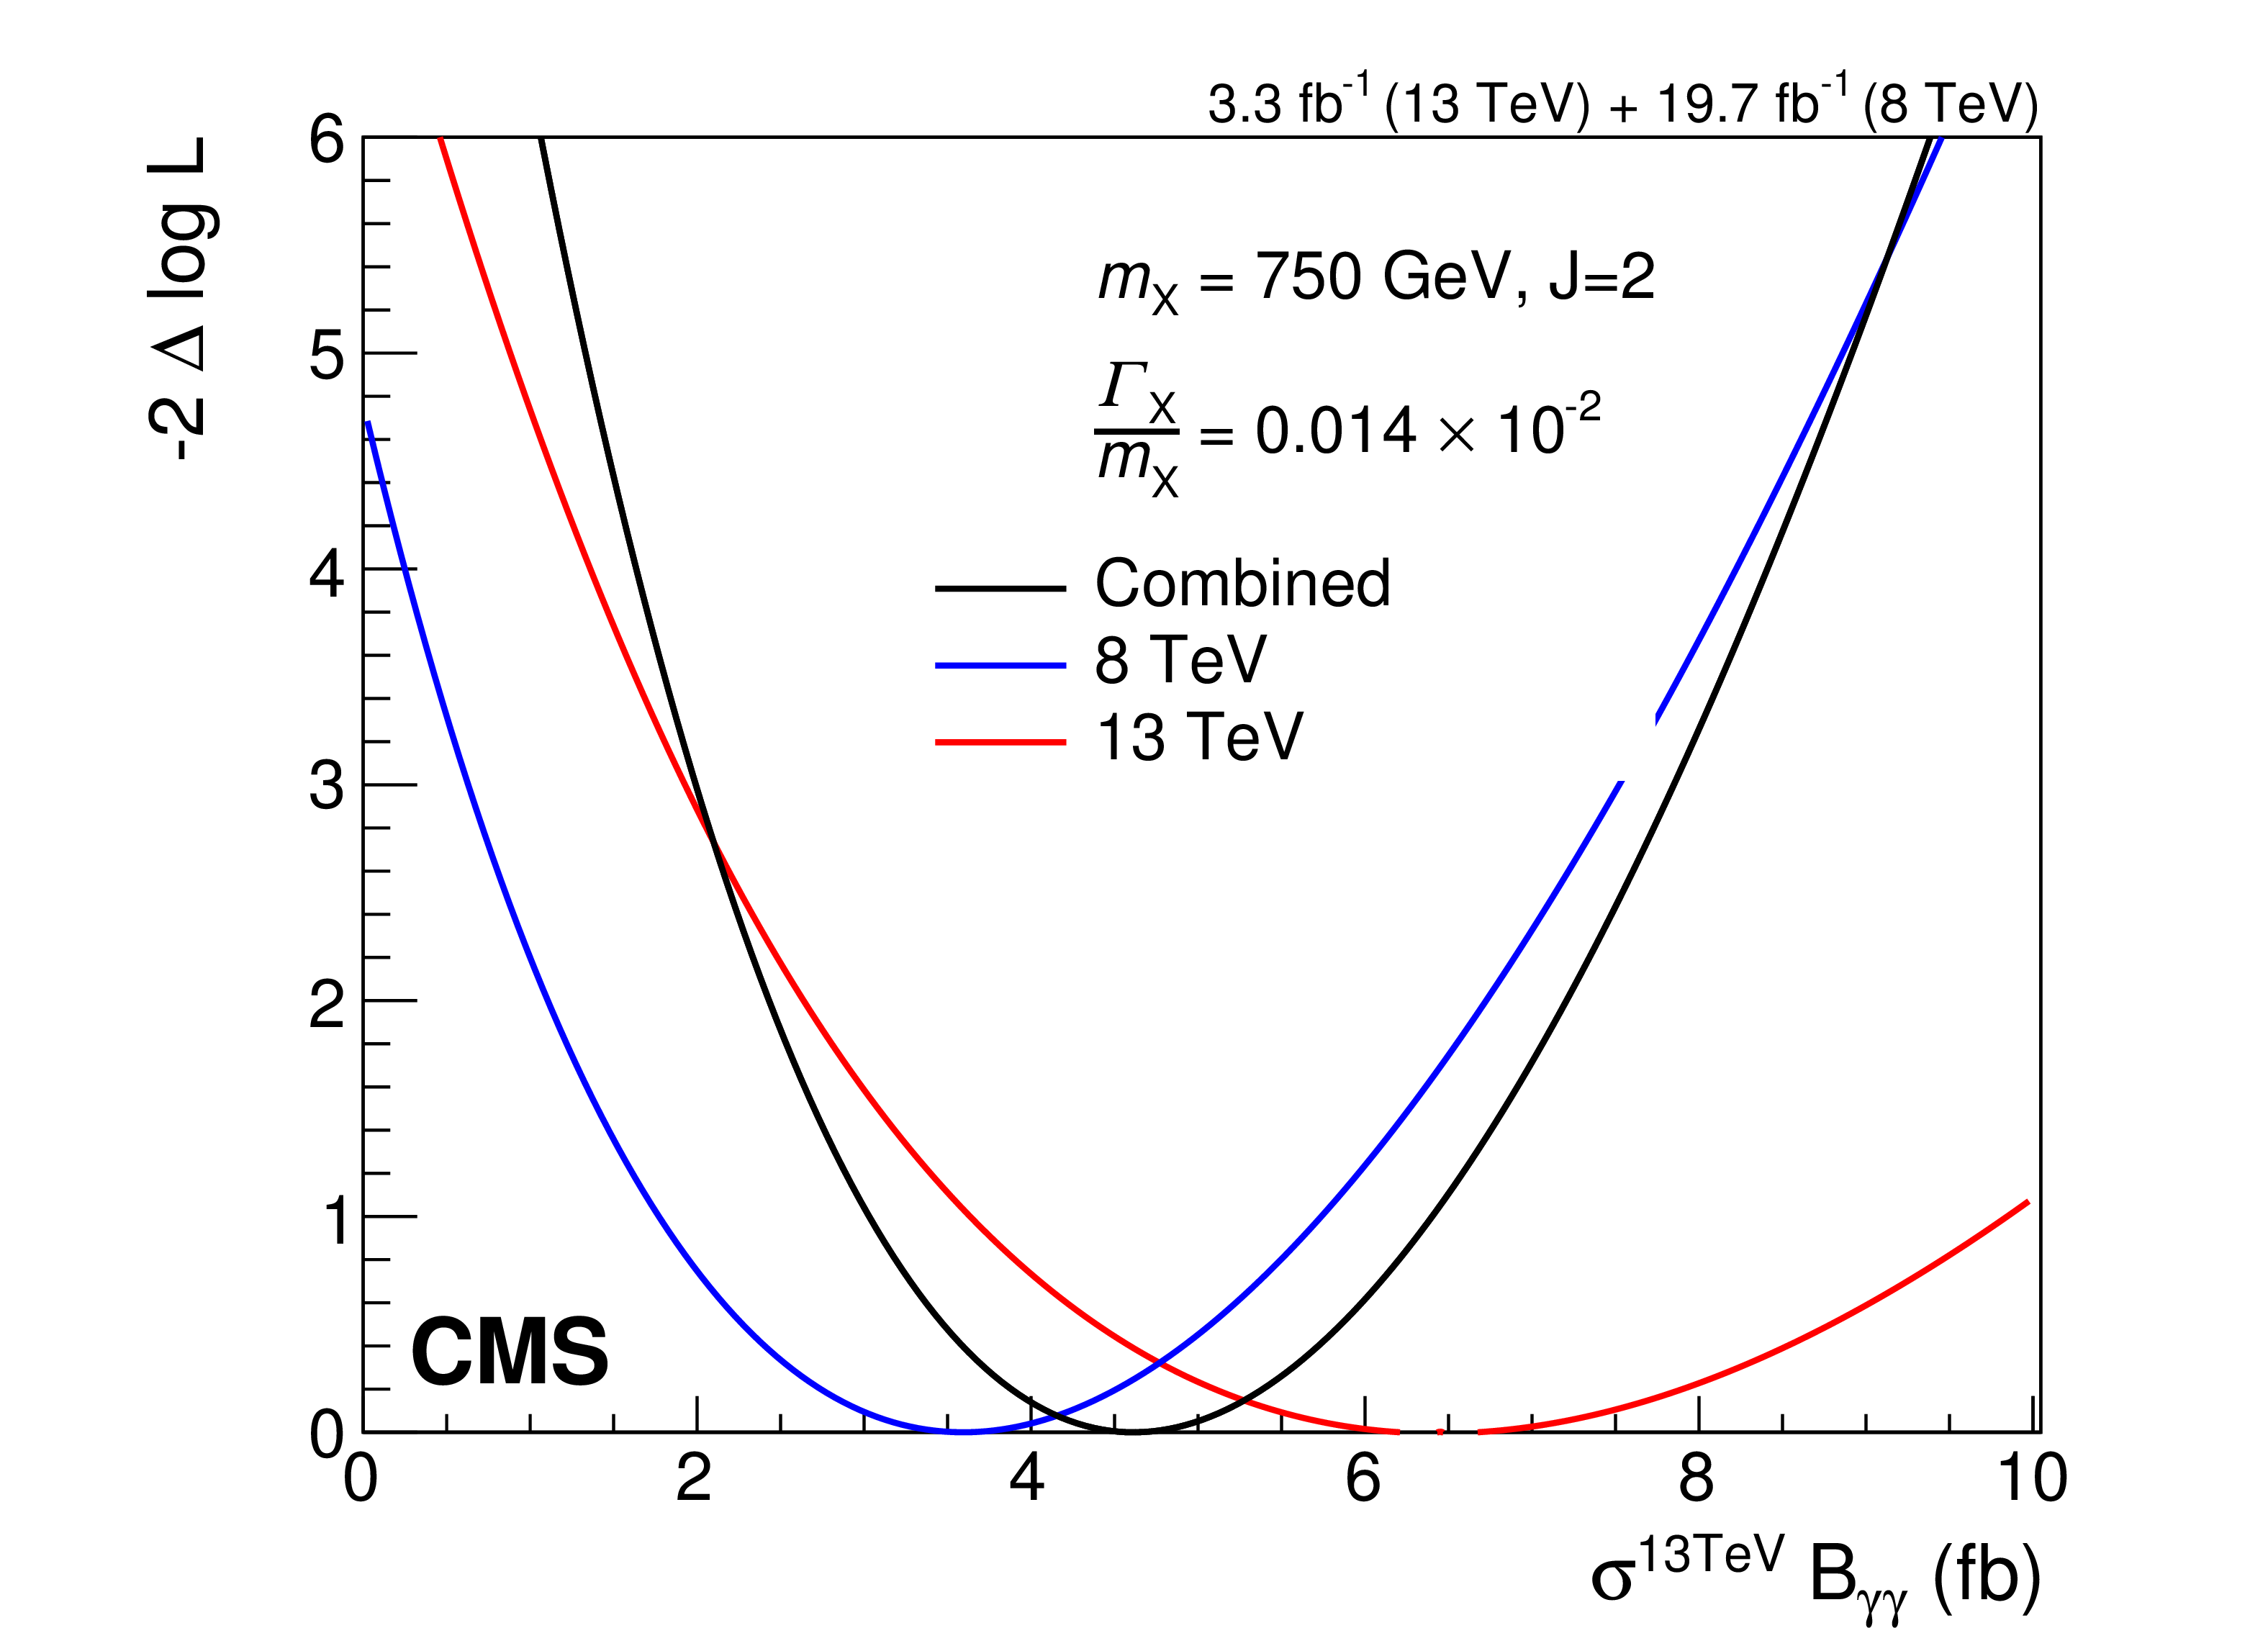
Additional Figure 7-a:
Likelihood scan for the cross section corresponding to the largest excess in the combined analysis of the 8 and 13 TeV data sets. The (a) (resp. b) plot corresponds to the scalar (resp. RS graviton) signals. The 8 TeV results are scaled by the expected ratio of cross sections in each scenario. |
png pdf |
Additional Figure 7-b:
Likelihood scan for the cross section corresponding to the largest excess in the combined analysis of the 8 and 13 TeV data sets. The (a) (resp. b) plot corresponds to the scalar (resp. RS graviton) signals. The 8 TeV results are scaled by the expected ratio of cross sections in each scenario. |
| References | ||||
| 1 | L. D. Landau | On the angular momentum of a system of two photons | Dokl. Akad. Nauk SSSR 60 (1948) 207 | |
| 2 | C. N. Yang | Selection Rules for the Dematerialization of a Particle into Two Photons | PR77 (1950) 242 | |
| 3 | G. C. Branco et al. | Theory and phenomenology of two-Higgs-doublet models | PR 516 (2012) 1 | 1106.0034 |
| 4 | T. D. Lee | A Theory of Spontaneous T Violation | PRD 8 (1973) 1226 | |
| 5 | L. Randall and R. Sundrum | A large mass hierarchy from a small extra dimension | PRL 83 (1999) 3370 | hep-ph/9905221 |
| 6 | H. Davoudiasl, J. L. Hewett, and T. G. Rizzo | Phenomenology of the Randall-Sundrum Gauge Hierarchy Model | PRL 84 (2000) 2080 | hep-ph/9909255 |
| 7 | ATLAS Collaboration | Search for Scalar Diphoton Resonances in the Mass Range 65--600$ GeV $ with the ATLAS Detector in $ \mathrm{ p }\mathrm{ p } $ Collision Data at $ \sqrt{s} = $ 8 TeV | PRL 113 (2014) 171801 | 1407.6583 |
| 8 | CMS Collaboration | Search for diphoton resonances in the mass range from 150 to 850$ GeV $ in $ \mathrm{ p }\mathrm{ p } $ collisions at $ \sqrt{s} = $ 8 TeV | PLB 750 (2015) 494 | CMS-HIG-14-006 1506.02301 |
| 9 | ATLAS Collaboration | Search for high-mass diphoton resonances in $ \mathrm{ p }\mathrm{ p } $ collisions at $ \sqrt{s} = $ 8 TeV with the ATLAS detector | PRD 92 (2015) 032004 | 1504.05511 |
| 10 | ATLAS Collaboration | Search for extra dimensions in diphoton events using proton-proton collisions recorded at $ \sqrt{s} = $ 7 TeV with the ATLAS detector at the LHC | New J. Phys. 15 (2013) 043007 | 1210.8389 |
| 11 | ATLAS Collaboration | Search for high-mass dilepton resonances in $ \mathrm{ p }\mathrm{ p } $ collisions at $ \sqrt{s} = $ 8 TeV with the ATLAS detector | PRD 90 (2014) 052005 | 1405.4123 |
| 12 | ATLAS Collaboration | Search for dilepton resonances in $ \mathrm{ p }\mathrm{ p } $ collisions at $ \sqrt{s} = $ 7 TeV with the ATLAS detector | PRL 107 (2011) 272002 | 1108.1582 |
| 13 | ATLAS Collaboration | Search for new phenomena in the $ W W $ to $ \ell \nu \ell{\rm'} \nu{\rm'} $ final state in $ \mathrm{ p }\mathrm{ p } $ collisions at $ \sqrt{s} = $ 7 TeV with the ATLAS detector | PLB 718 (2013) 860 | 1208.2880 |
| 14 | ATLAS Collaboration | Search for resonant diboson production in the $ WW/WZ \to \ell \nu j j $ decay channels with the ATLAS detector at $ \sqrt{s} = $ 7 TeV | PRD 87 (2013) 112006 | 1305.0125 |
| 15 | CMS Collaboration | Search for signatures of extra dimensions in the diphoton mass spectrum at the Large Hadron Collider | PRL 108 (2012) 111801 | CMS-EXO-11-038 1112.0688 |
| 16 | CMS Collaboration | Search for physics beyond the standard model in dilepton mass spectra in proton-proton collisions at $ \sqrt{s} = $ 8 TeV | JHEP 04 (2015) 025 | CMS-EXO-12-061 1412.6302 |
| 17 | CMS Collaboration | Search for heavy narrow dilepton resonances in $ \mathrm{ p }\mathrm{ p } $ collisions at $ \sqrt{s} = $ 7 TeV and $ \sqrt{s} = $ 8 TeV | PLB 720 (2013) 63 | CMS-EXO-12-015 1212.6175 |
| 18 | CMS Collaboration | Search for narrow resonances decaying to dijets in proton-proton collisions at $ \sqrt{s} = $ 13 TeV | PRL 116 (2016) 071801 | CMS-EXO-15-001 1512.01224 |
| 19 | CMS Collaboration | Search for narrow resonances using the dijet mass spectrum in $ \mathrm{ p }\mathrm{ p } $ collisions at $ \sqrt{s} = $ 8 TeV | PRD 87 (2013) 114015 | CMS-EXO-12-016 1302.4794 |
| 20 | CMS Collaboration | Search for narrow resonances in dijet final states at $ \sqrt{s} = $ 8 TeV with the novel CMS technique of data scouting | Submitted to \it PRLett | CMS-EXO-14-005 1604.08907 |
| 21 | CMS Collaboration | Search for resonances and quantum black holes using dijet mass spectra in proton-proton collisions at $ \sqrt{s} = $ 8 TeV | PRD 91 (2015) 052009 | CMS-EXO-12-059 1501.04198 |
| 22 | CMS Collaboration | Search for massive resonances in dijet systems containing jets tagged as $ \mathrm{ W } $ or $ \mathrm{ Z } $ boson decays in $ \mathrm{ p }\mathrm{ p } $ collisions at $ \sqrt{s} = $ 8 TeV | JHEP 08 (2014) 173 | CMS-EXO-12-024 1405.1994 |
| 23 | CMS Collaboration | Search for exotic resonances decaying into $ \mathrm{ W }\mathrm{ Z }/\mathrm{ Z }\mathrm{ Z } $ in $ \mathrm{ p }\mathrm{ p } $ collisions at $ \sqrt{s} = $ 7 TeV | JHEP 02 (2013) 036 | CMS-EXO-12-014 1211.5779 |
| 24 | CMS Collaboration | Search for a narrow spin-2 resonance decaying to a pair of $ \mathrm{ Z } $ vector bosons in the semileptonic final state | PLB 718 (2013) 1208 | CMS-EXO-11-102 1209.3807 |
| 25 | CMS Collaboration | The CMS experiment at the CERN LHC | JINST 3 (2008) S08004 | CMS-00-001 |
| 26 | CMS Collaboration | Particle-flow event reconstruction in CMS and performance for jets, taus, and $ E_{\mathrm{T}}^{\text{miss}} $ | CDS | |
| 27 | CMS Collaboration | Commissioning of the particle-flow event with the first LHC collisions recorded in the CMS detector | CDS | |
| 28 | T. Sj\"ostrand et al. | An Introduction to PYTHIA 8.2 | CPC 191 (2015) 159 | 1410.3012 |
| 29 | NNPDF Collaboration | Parton distributions with LHC data | Nucl. Phys. B 867 (2013) 244 | 1207.1303 |
| 30 | T. Gleisberg et al. | Event generation with SHERPA 1.1 | JHEP 02 (2009) 007 | 0811.4622 |
| 31 | J. Alwall et al. | The automated computation of tree-level and next-to-leading order differential cross sections, and their matching to parton shower simulations | JHEP 07 (2014) 079 | 1405.0301 |
| 32 | GEANT4 Collaboration | GEANT4 --- a simulation toolkit | NIMA 506 (2003) 250 | |
| 33 | CMS Collaboration | Performance of photon reconstruction and identification with the CMS detector in proton-proton collisions at $ \sqrt{s} = $ 8 TeV | JINST 10 (2015) P08010 | CMS-EGM-14-001 1502.02702 |
| 34 | CMS Collaboration | Observation of the diphoton decay of the Higgs boson and measurement of its properties | EPJC 74 (2014) 3076 | CMS-HIG-13-001 1407.0558 |
| 35 | CMS Collaboration | Measurement of differential cross sections for the production of a pair of isolated photons in $ \mathrm{ p }\mathrm{ p } $ collisions at $ \sqrt{s} = $ 7 TeV | EPJC 74 (2014) 3129 | CMS-SMP-13-001 1405.7225 |
| 36 | T. Junk | Confidence level computation for combining searches with small statistics | Nucl. Instr. and Meth. A 434 (1999) 435 | hep-ex/9902006 |
| 37 | A. L. Read | Presentation of search results: the $ \rm CL_s $ technique | JPG 28 (2002) 2693 | |
| 38 | LHC Higgs Combination Group | Procedure for the LHC Higgs boson search combination in Summer 2011 | CMS-NOTE-2011-005 | |
| 39 | G. Cowan, K. Cranmer, E. Gross, and O. Vitells | Asymptotic formulae for likelihood-based tests of new physics | EPJC 71 (2011) 1554 | 1007.1727 |
| 40 | M. Baak, S. Gadatsch, R. Harrington, and W. Verkerke | Interpolation between multi-dimensional histograms using a new non-linear moment morphing method | NIMA 771 (2015) 39 | 1410.7388 |
| 41 | CMS Collaboration | CMS Luminosity Measurement for the 2015 Data Taking Period | CMS-PAS-LUM-15-001 | CMS-PAS-LUM-15-001 |
| 42 | E. Gross and O. Vitells | Trial factors or the look elsewhere effect in high energy physics | EPJC 70 (2010) 525 | 1005.1891 |
| 43 | ATLAS Collaboration | Search for resonances in diphoton events at $ \sqrt{s} = $ 13 TeV with the ATLAS detector | Submitted to JHEP | 1606.03833 |
|
|
Compact Muon Solenoid LHC, CERN |
|

|

|

|

|

|