

Compact Muon Solenoid
LHC, CERN
| CMS-SUS-15-008 ; CERN-EP-2016-119 | ||
| Search for new physics in same-sign dilepton events in proton-proton collisions at $ \sqrt{s} = $ 13 TeV | ||
| CMS Collaboration | ||
| 10 May 2016 | ||
| Eur. Phys. J. C 76 (2016) 439 | ||
| Abstract: A search for new physics is performed using events with two isolated same-sign leptons, two or more jets, and missing transverse momentum. The results are based on a sample of proton-proton collisions at a center-of-mass energy of 13 TeV recorded with the CMS detector at the LHC, corresponding to an integrated luminosity of 2.3 fb$^{-1}$. Multiple search regions are defined by classifying events in terms of missing transverse momentum, the scalar sum of jet transverse momenta, the transverse mass associated with a W boson candidate, the number of jets, the number of b quark jets, and the transverse momenta of the leptons in the event. The analysis is sensitive to a wide variety of possible signals beyond the standard model. No excess above the standard model background expectation is observed. Constraints are set on various supersymmetric models, with gluinos and bottom squarks excluded for masses up to 1300 and 680 GeV, respectively, at the 95% confidence level. Upper limits on the cross sections for the production of two top quark-antiquark pairs (119 fb) and two same-sign top quarks (1.7 pb) are also obtained. Selection efficiencies and model independent limits are provided to allow further interpretations of the results. | ||
| Links: e-print arXiv:1605.03171 [hep-ex] (PDF) ; CDS record ; inSPIRE record ; CADI line (restricted) ; | ||
| Figures & Tables | Summary | Additional Figures & Tables | References | CMS Publications |
|---|
| Figures | |
png pdf |
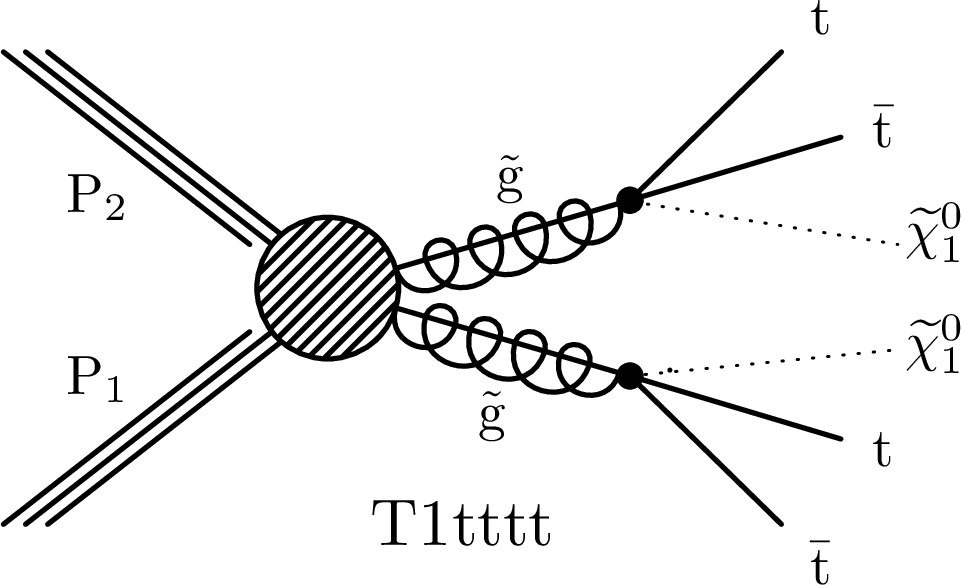
Figure 1-a:
Diagram illustrating the T1tttt simplified SUSY model used in this analysis. |
png pdf |
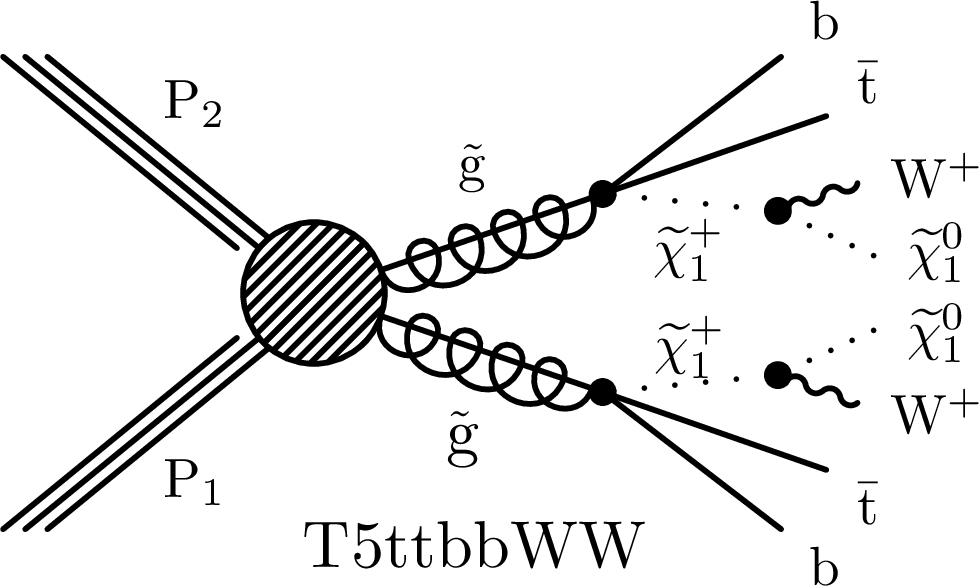
Figure 1-b:
Diagram illustrating the T5ttbbWW simplified SUSY model used in this analysis. |
png pdf |
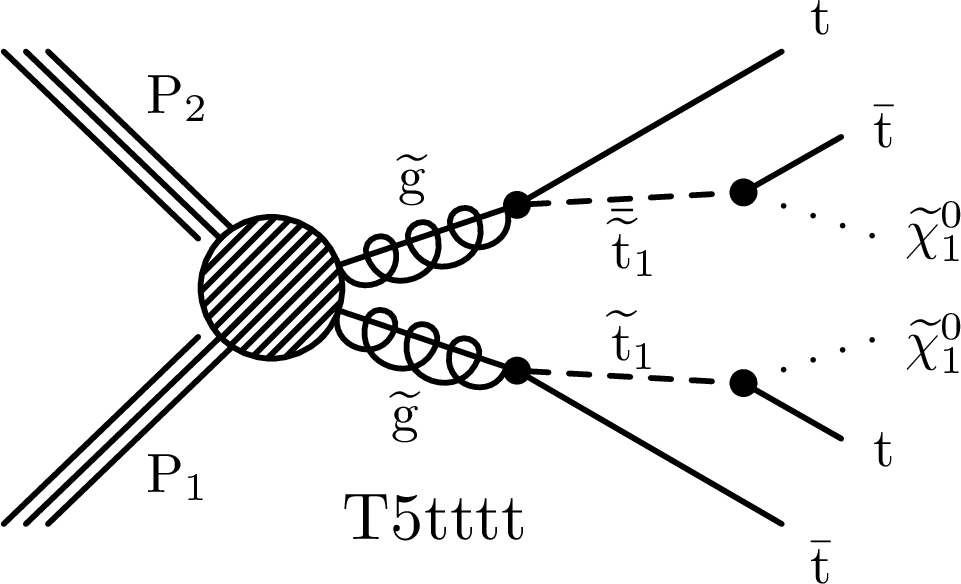
Figure 1-c:
Diagram illustrating the T5tttt simplified SUSY model used in this analysis. |
png pdf |
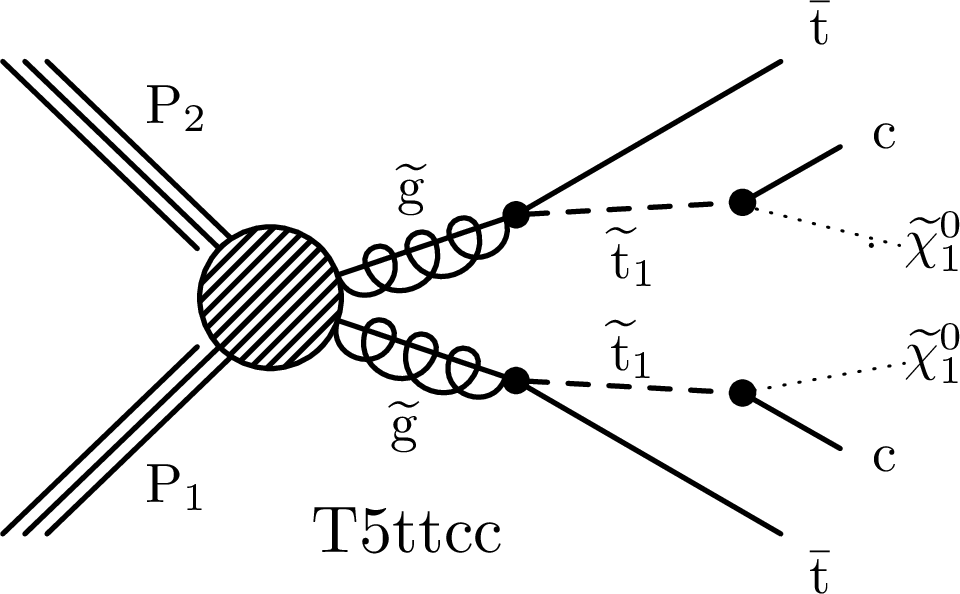
Figure 1-d:
Diagram illustrating the T5ttcc simplified SUSY model used in this analysis. |
png pdf |
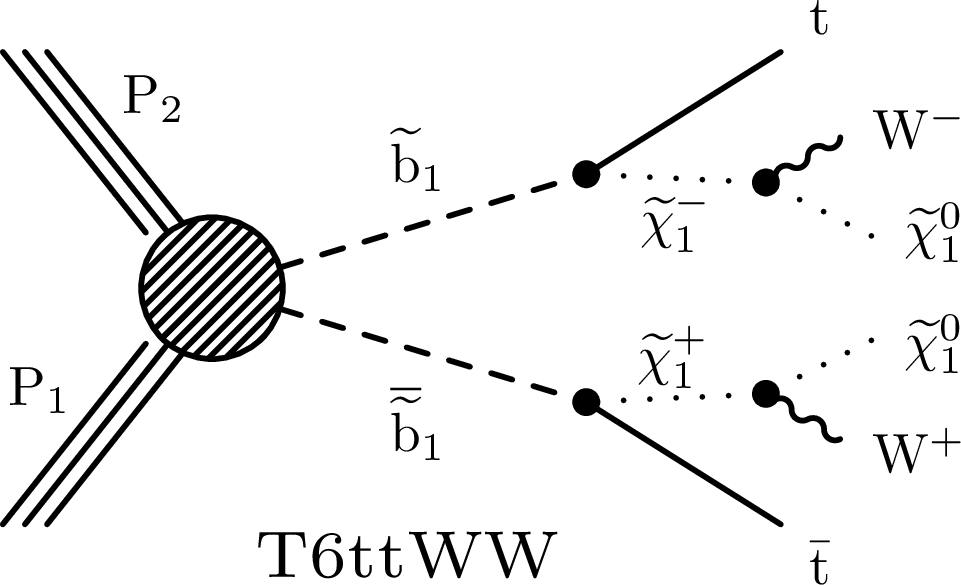
Figure 1-e:
Diagram illustrating the T6ttWW simplified SUSY model used in this analysis. |
png pdf |
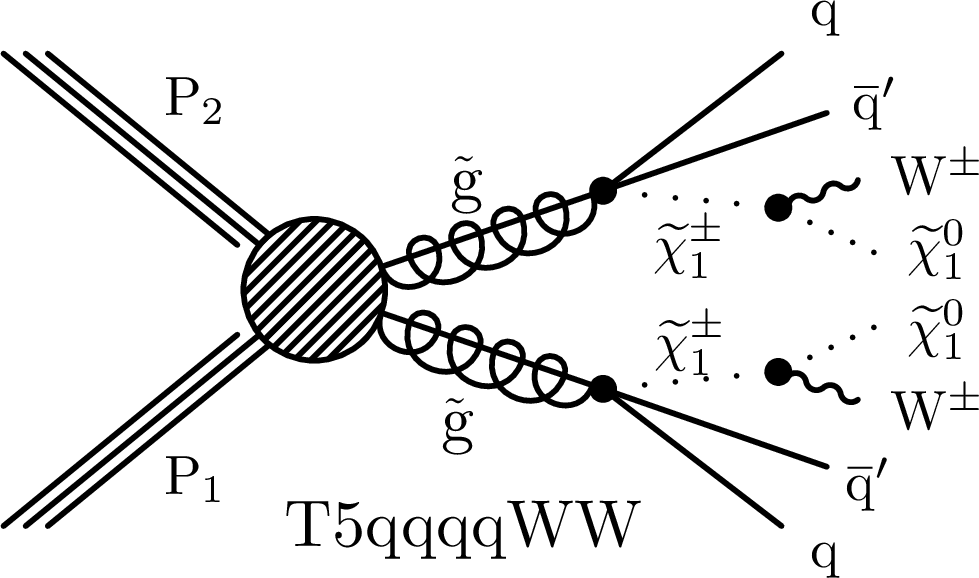
Figure 1-f:
Diagram illustrating the T5qqqqWW simplified SUSY model used in this analysis. |
png pdf |
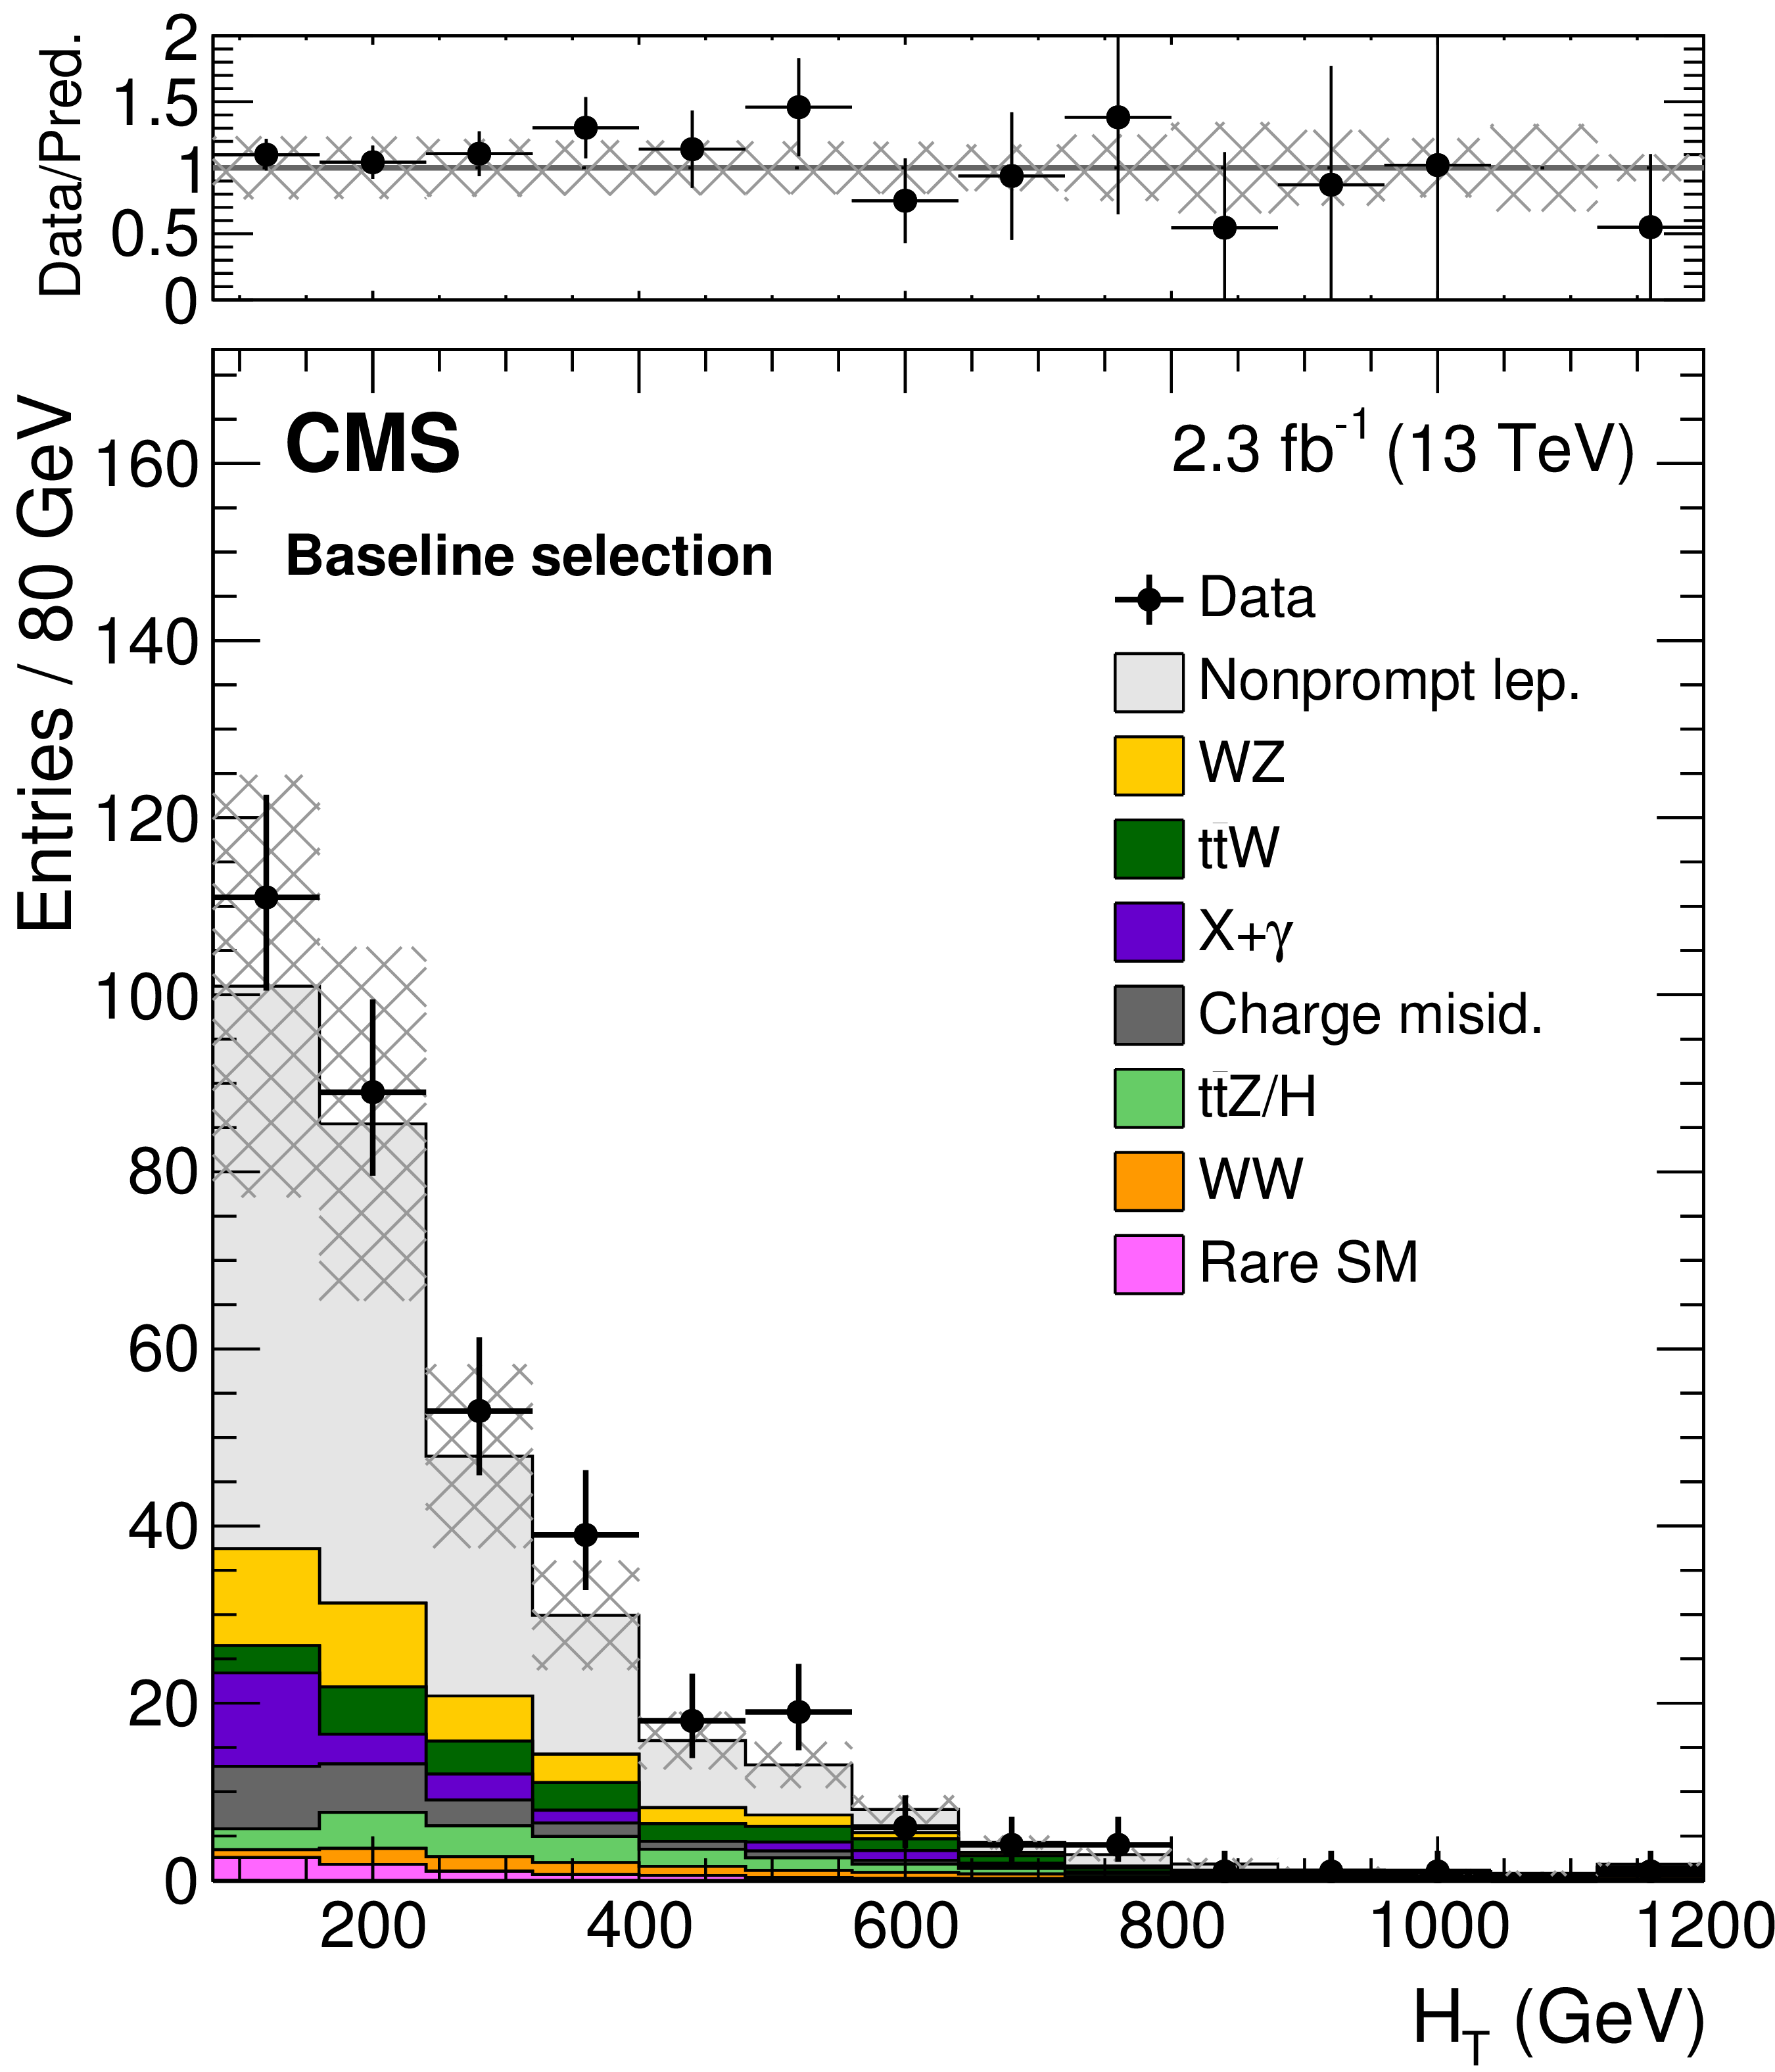
Figure 2-a:
Distributions of the main analysis variables: $ {H_{\mathrm {T}}}$ (a), ${E_{\mathrm {T}}^{\text {miss}}}$ (b), ${M_\text {T}^{\text {min}}}$ (c), ${N_\text {jet}}$ (d), and ${N_\text {b}}$ (e), after a baseline selection requiring a pair of SS leptons, two jets, and either $ {E_{\mathrm {T}}^{\text {miss}}} > $ 30 GeV or $ {H_{\mathrm {T}}} > $ 500 GeV. The last bin includes the overflow. The hatched area represents the total uncertainty in the background prediction. The upper panels show the ratio of the observed event yield to the background prediction. |

png pdf |
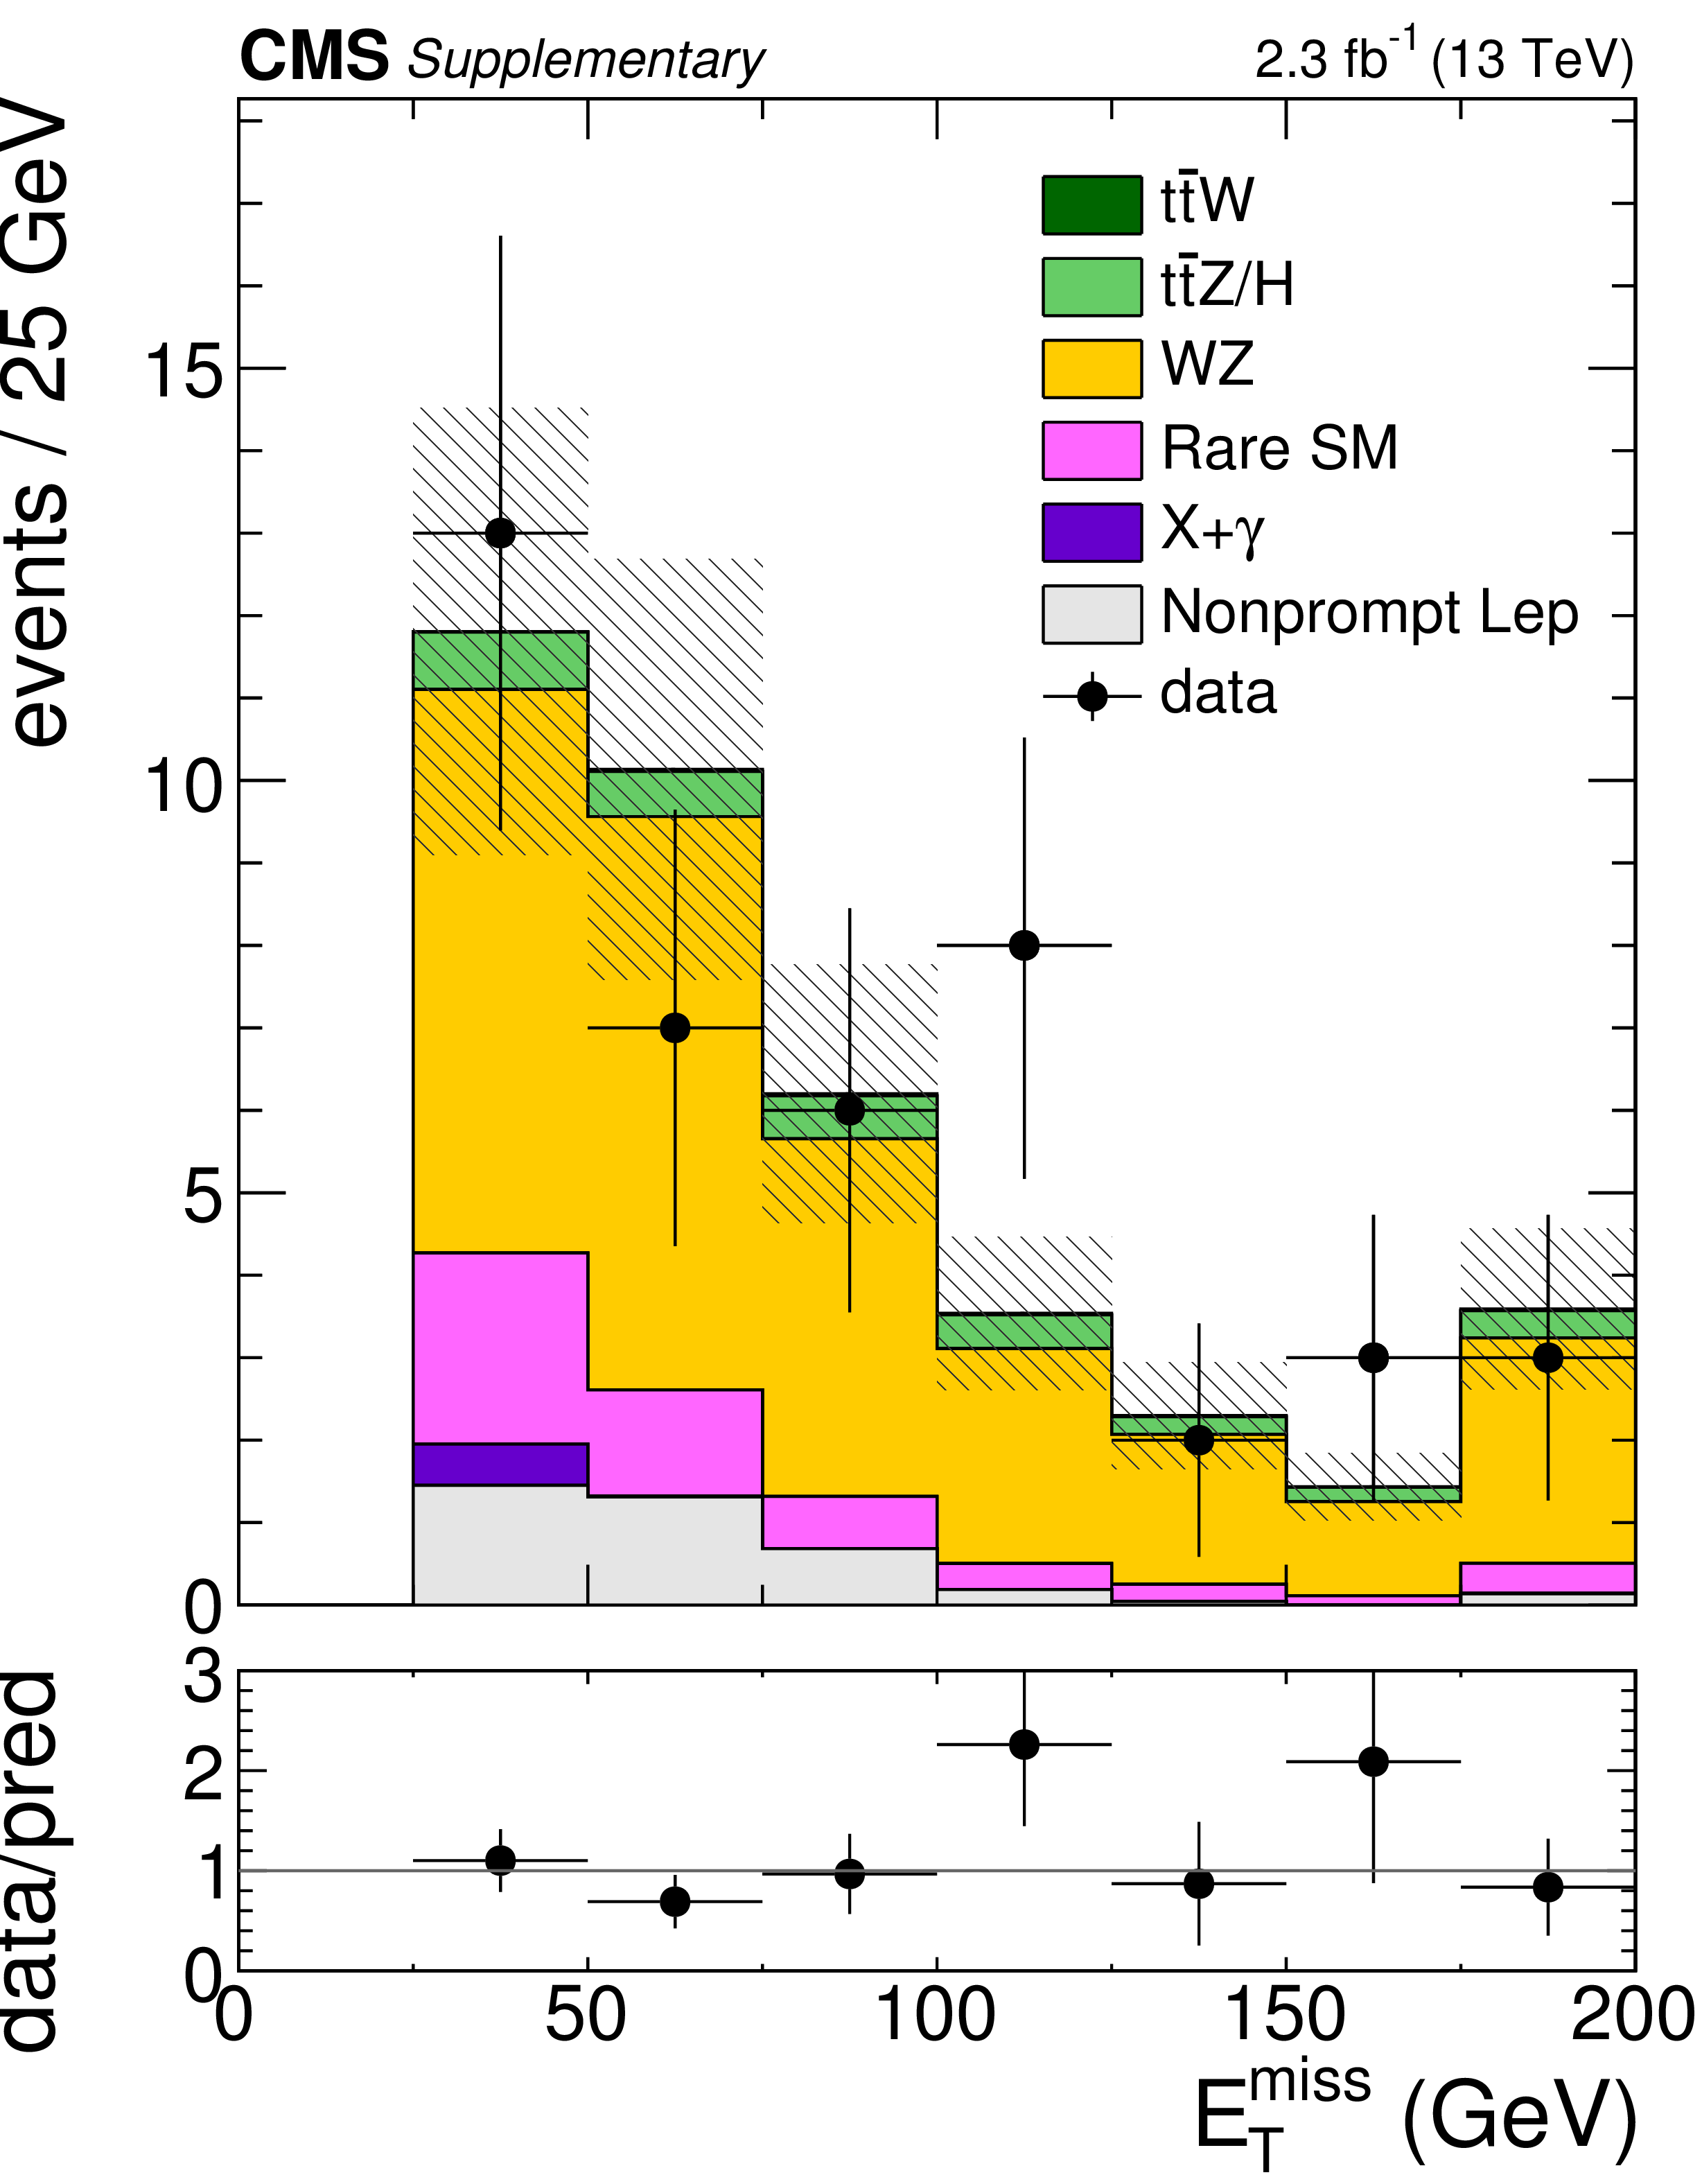
Figure 2-b:
Distributions of the main analysis variables: $ {H_{\mathrm {T}}}$ (a), ${E_{\mathrm {T}}^{\text {miss}}}$ (b), ${M_\text {T}^{\text {min}}}$ (c), ${N_\text {jet}}$ (d), and ${N_\text {b}}$ (e), after a baseline selection requiring a pair of SS leptons, two jets, and either $ {E_{\mathrm {T}}^{\text {miss}}} > $ 30 GeV or $ {H_{\mathrm {T}}} > $ 500 GeV. The last bin includes the overflow. The hatched area represents the total uncertainty in the background prediction. The upper panels show the ratio of the observed event yield to the background prediction. |

png pdf |
Figure 2-c:
Distributions of the main analysis variables: $ {H_{\mathrm {T}}}$ (a), ${E_{\mathrm {T}}^{\text {miss}}}$ (b), ${M_\text {T}^{\text {min}}}$ (c), ${N_\text {jet}}$ (d), and ${N_\text {b}}$ (e), after a baseline selection requiring a pair of SS leptons, two jets, and either $ {E_{\mathrm {T}}^{\text {miss}}} > $ 30 GeV or $ {H_{\mathrm {T}}} > $ 500 GeV. The last bin includes the overflow. The hatched area represents the total uncertainty in the background prediction. The upper panels show the ratio of the observed event yield to the background prediction. |
png pdf |
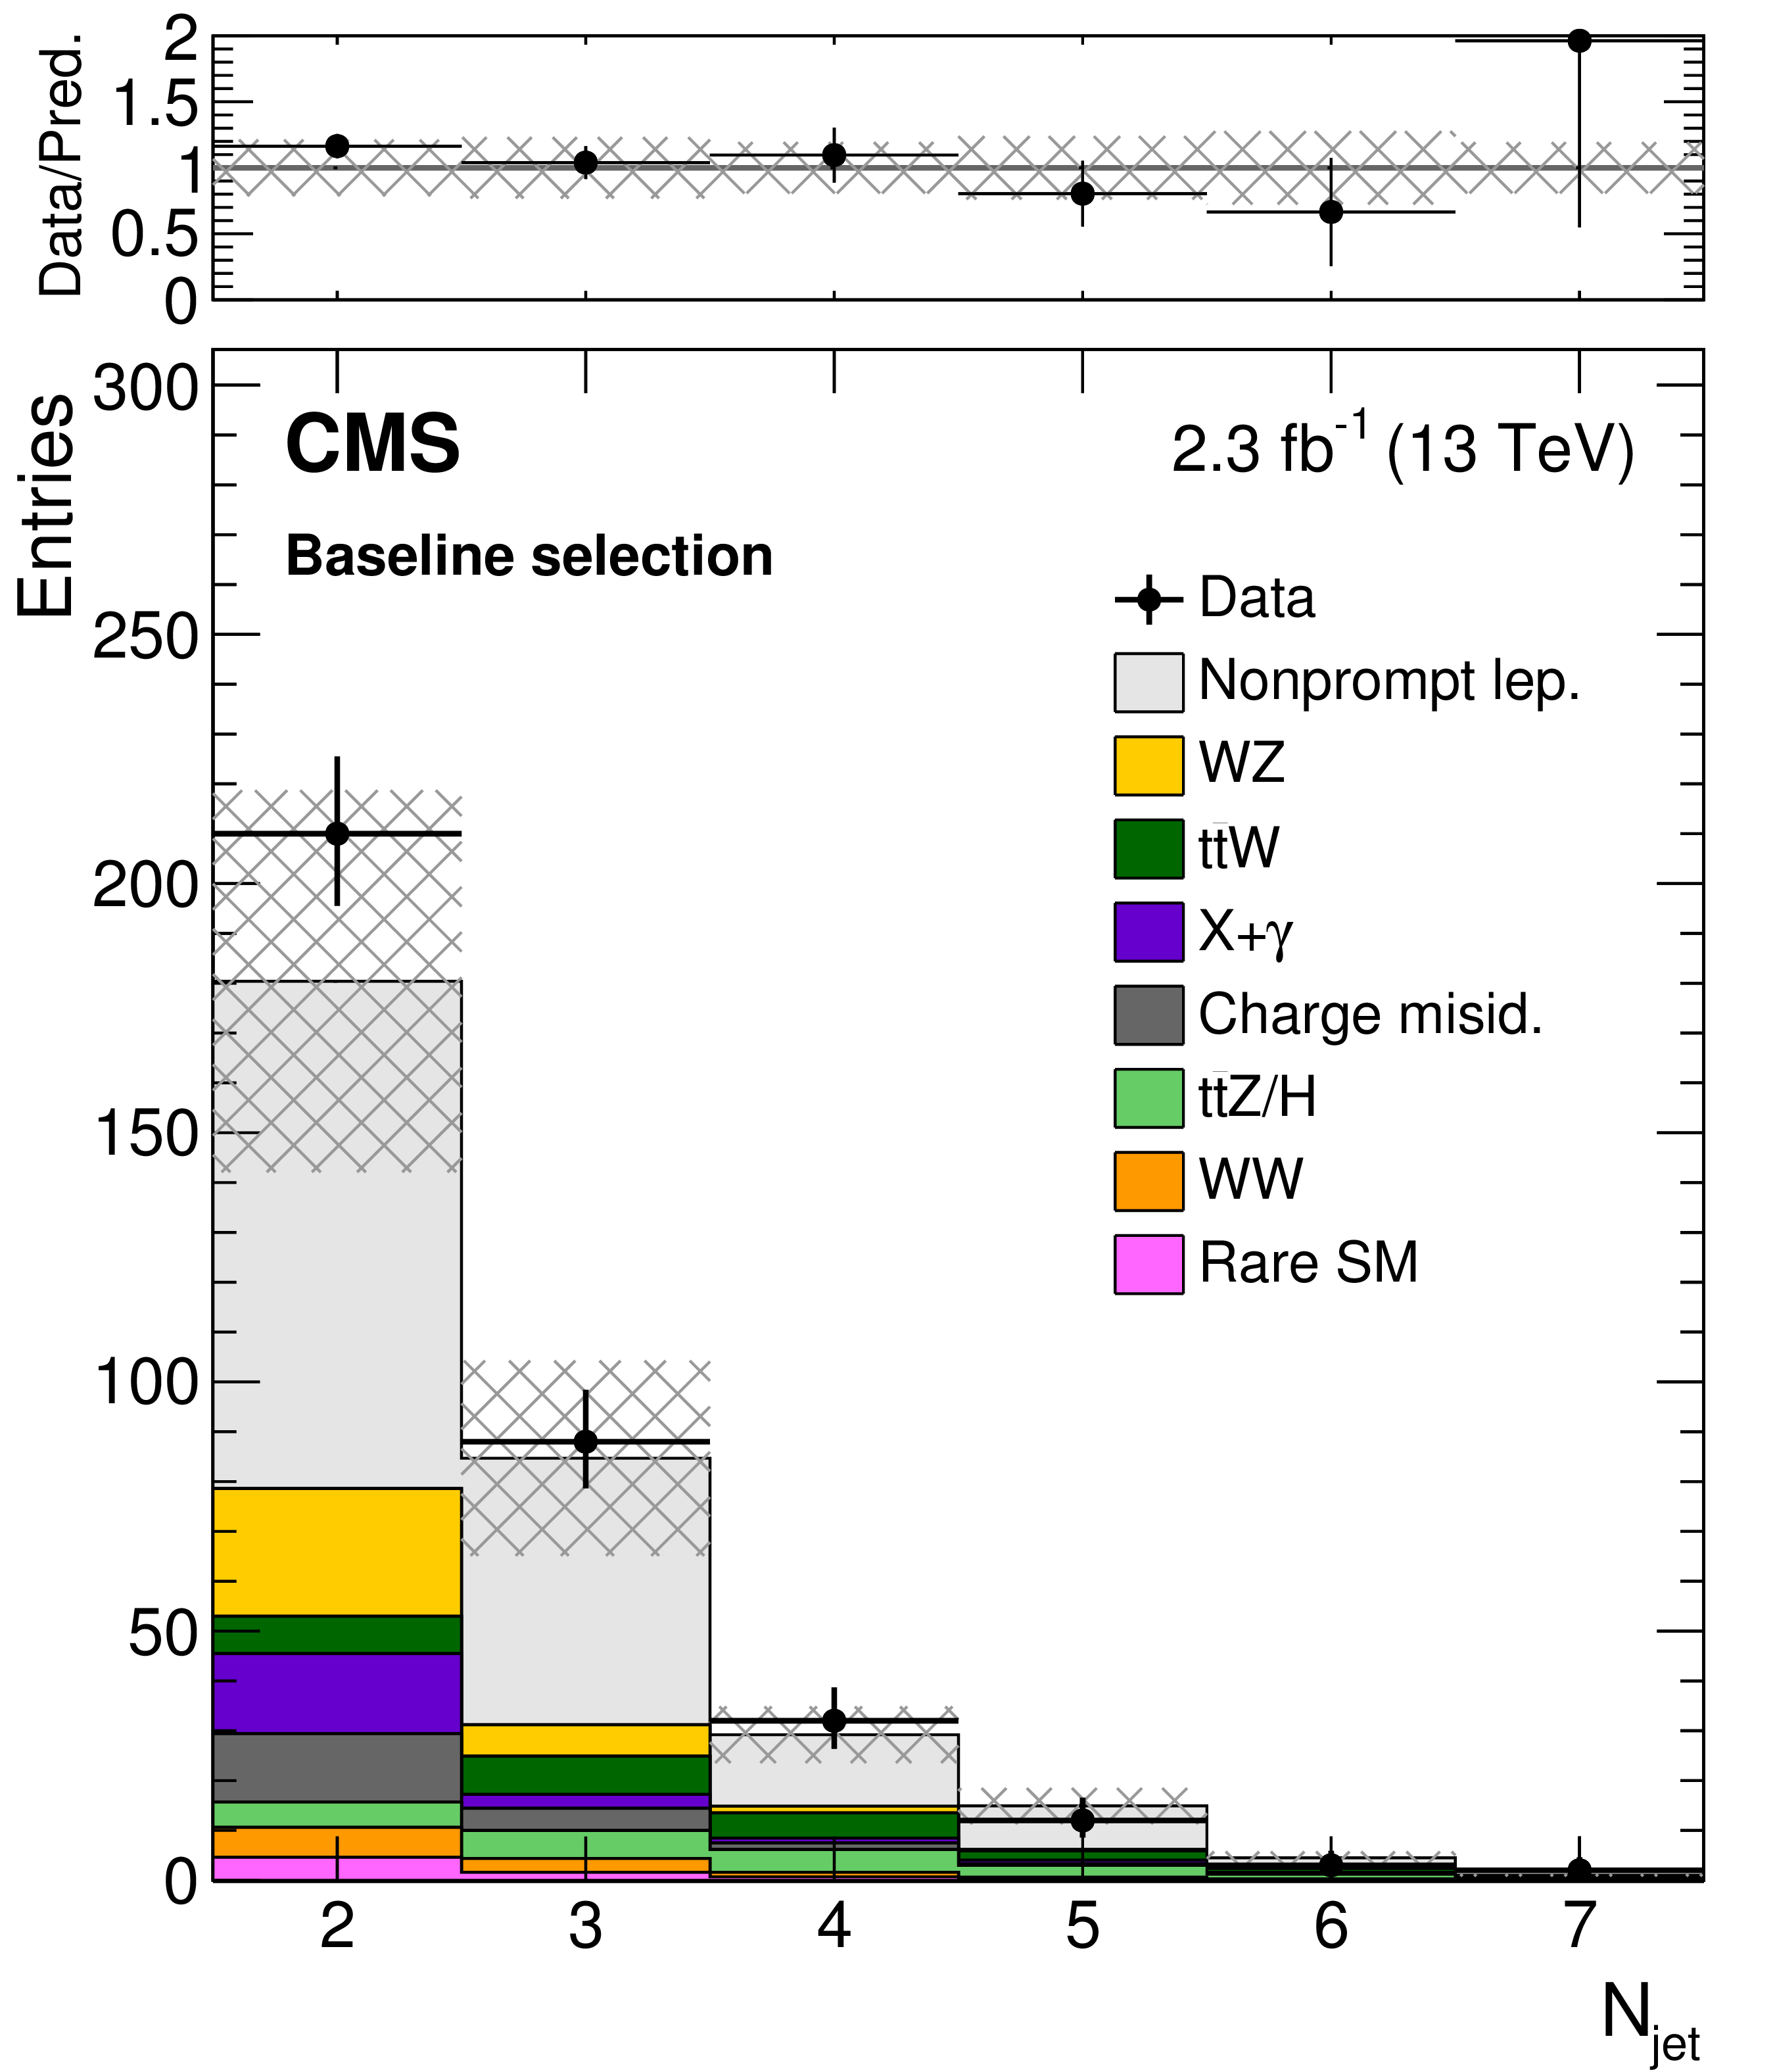
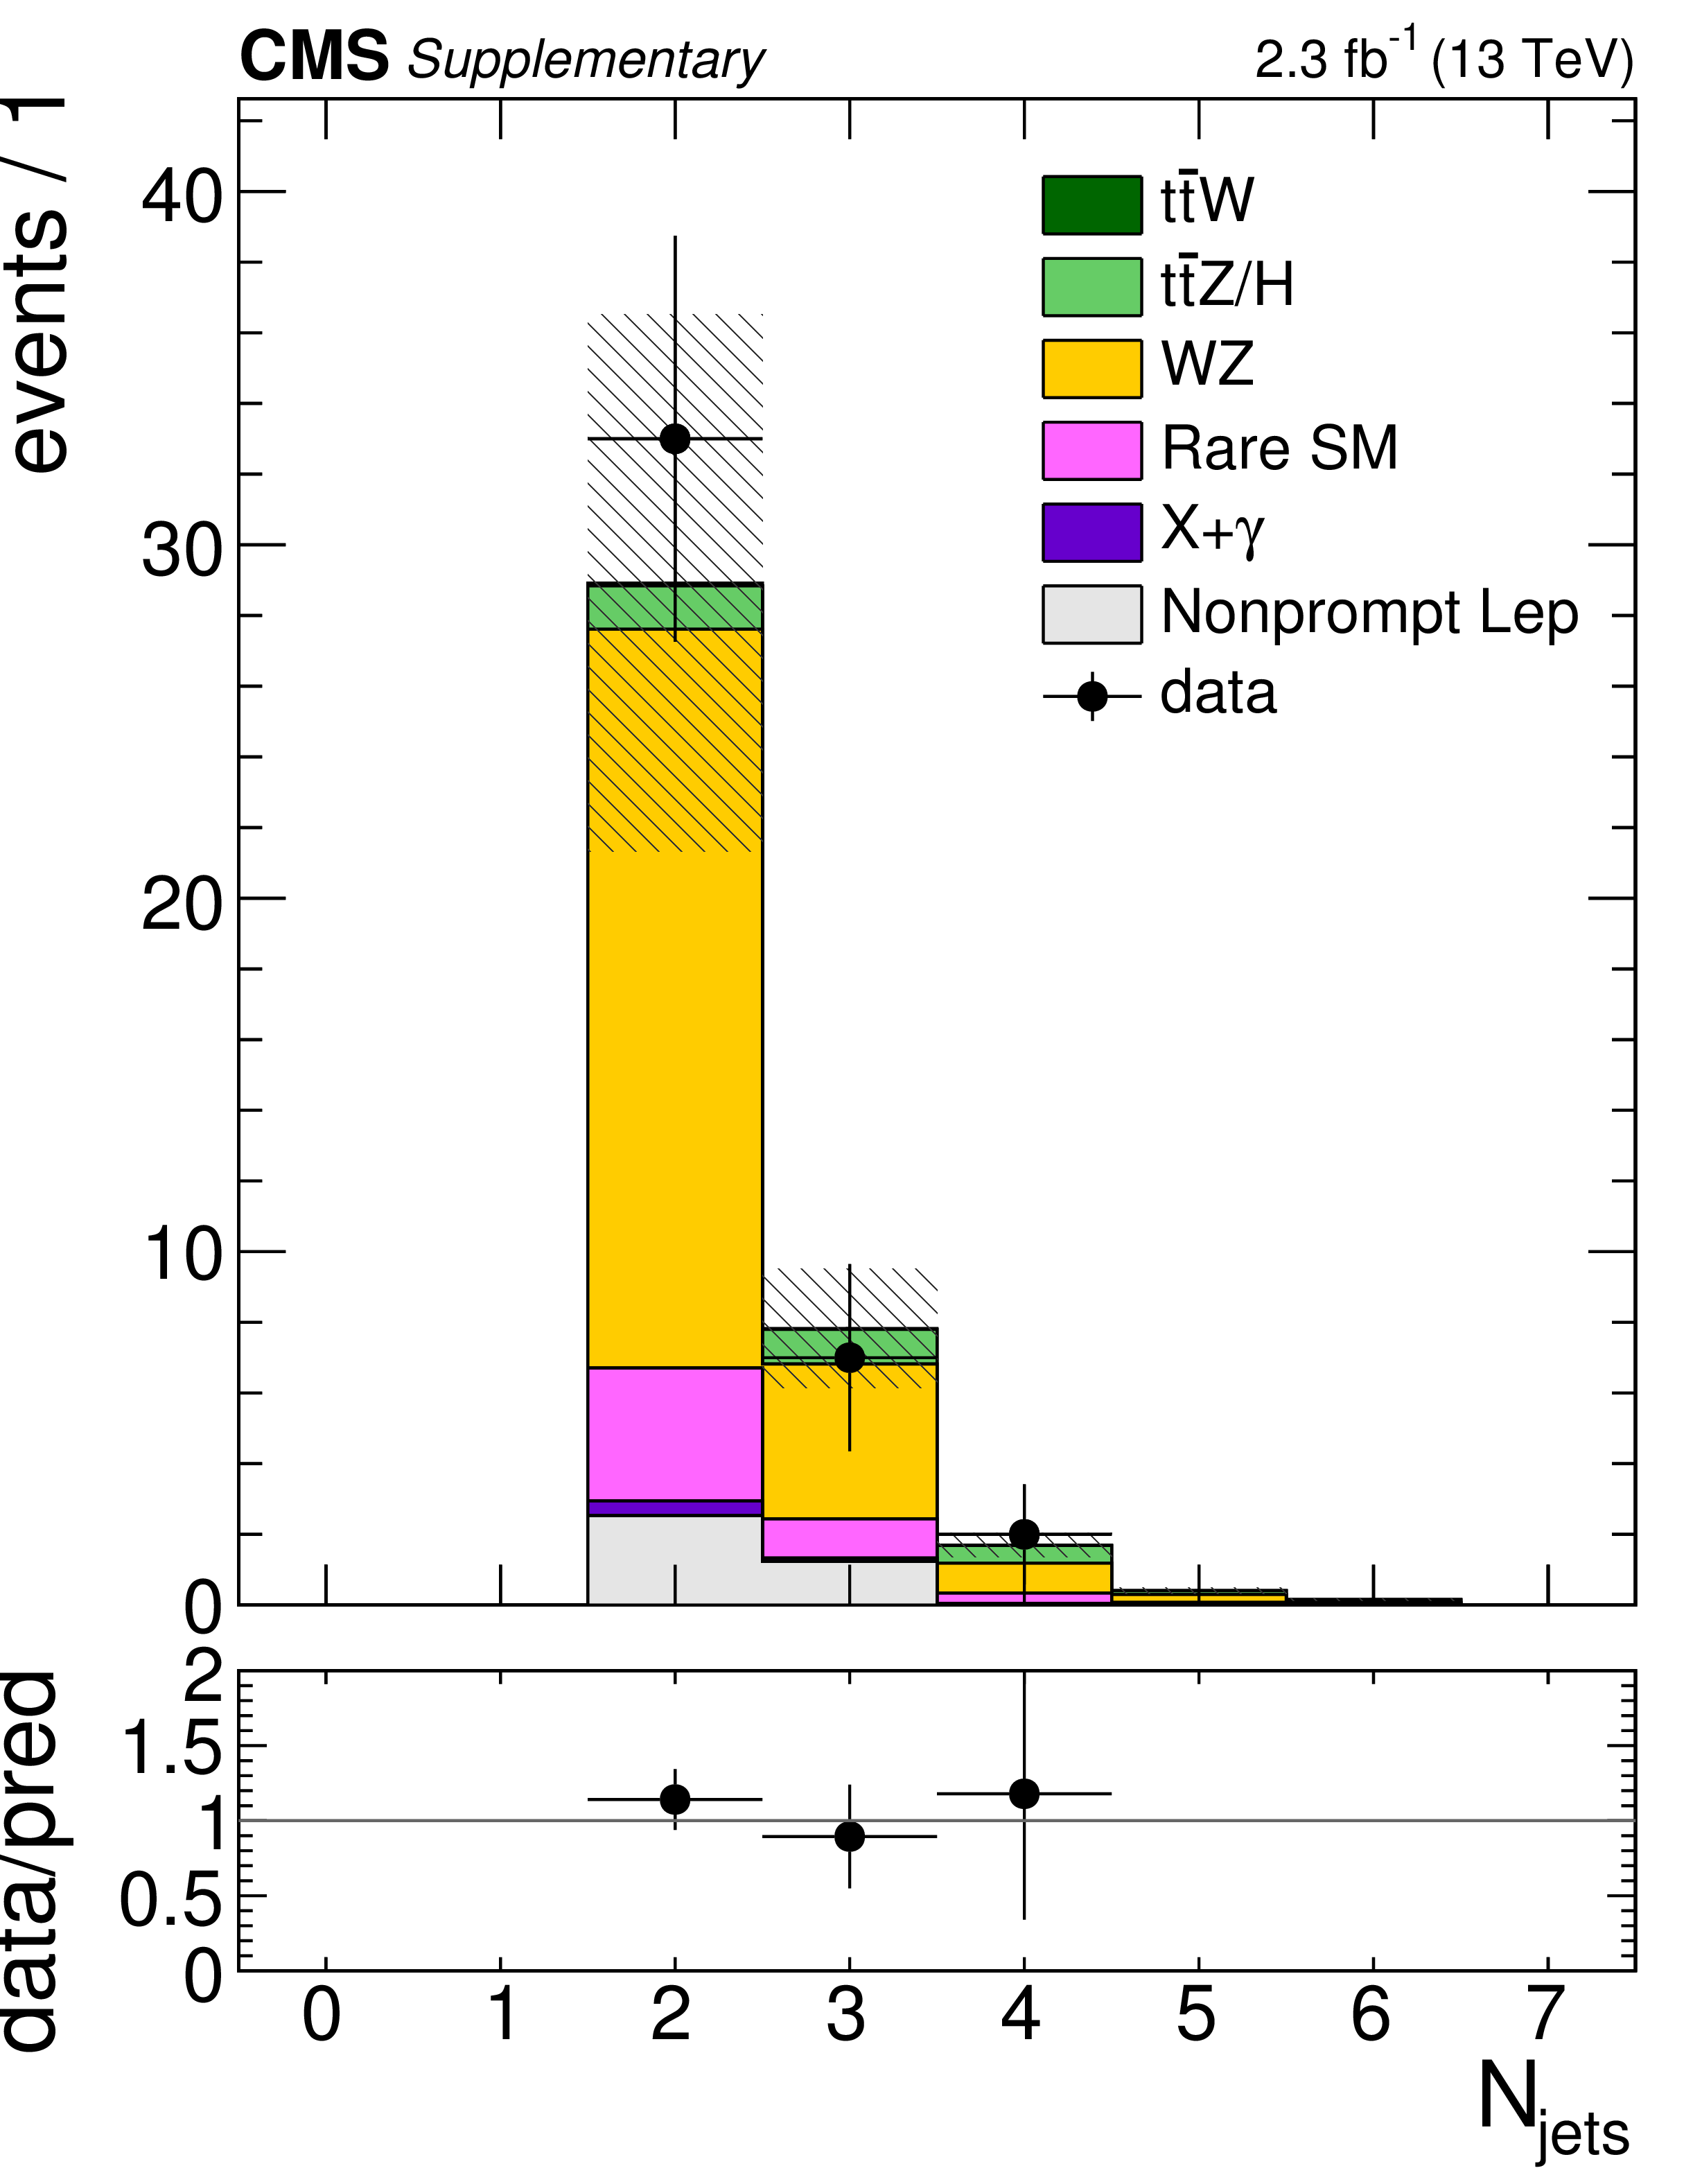
Figure 2-d:
Distributions of the main analysis variables: $ {H_{\mathrm {T}}}$ (a), ${E_{\mathrm {T}}^{\text {miss}}}$ (b), ${M_\text {T}^{\text {min}}}$ (c), ${N_\text {jet}}$ (d), and ${N_\text {b}}$ (e), after a baseline selection requiring a pair of SS leptons, two jets, and either $ {E_{\mathrm {T}}^{\text {miss}}} > $ 30 GeV or $ {H_{\mathrm {T}}} > $ 500 GeV. The last bin includes the overflow. The hatched area represents the total uncertainty in the background prediction. The upper panels show the ratio of the observed event yield to the background prediction. |
png pdf |
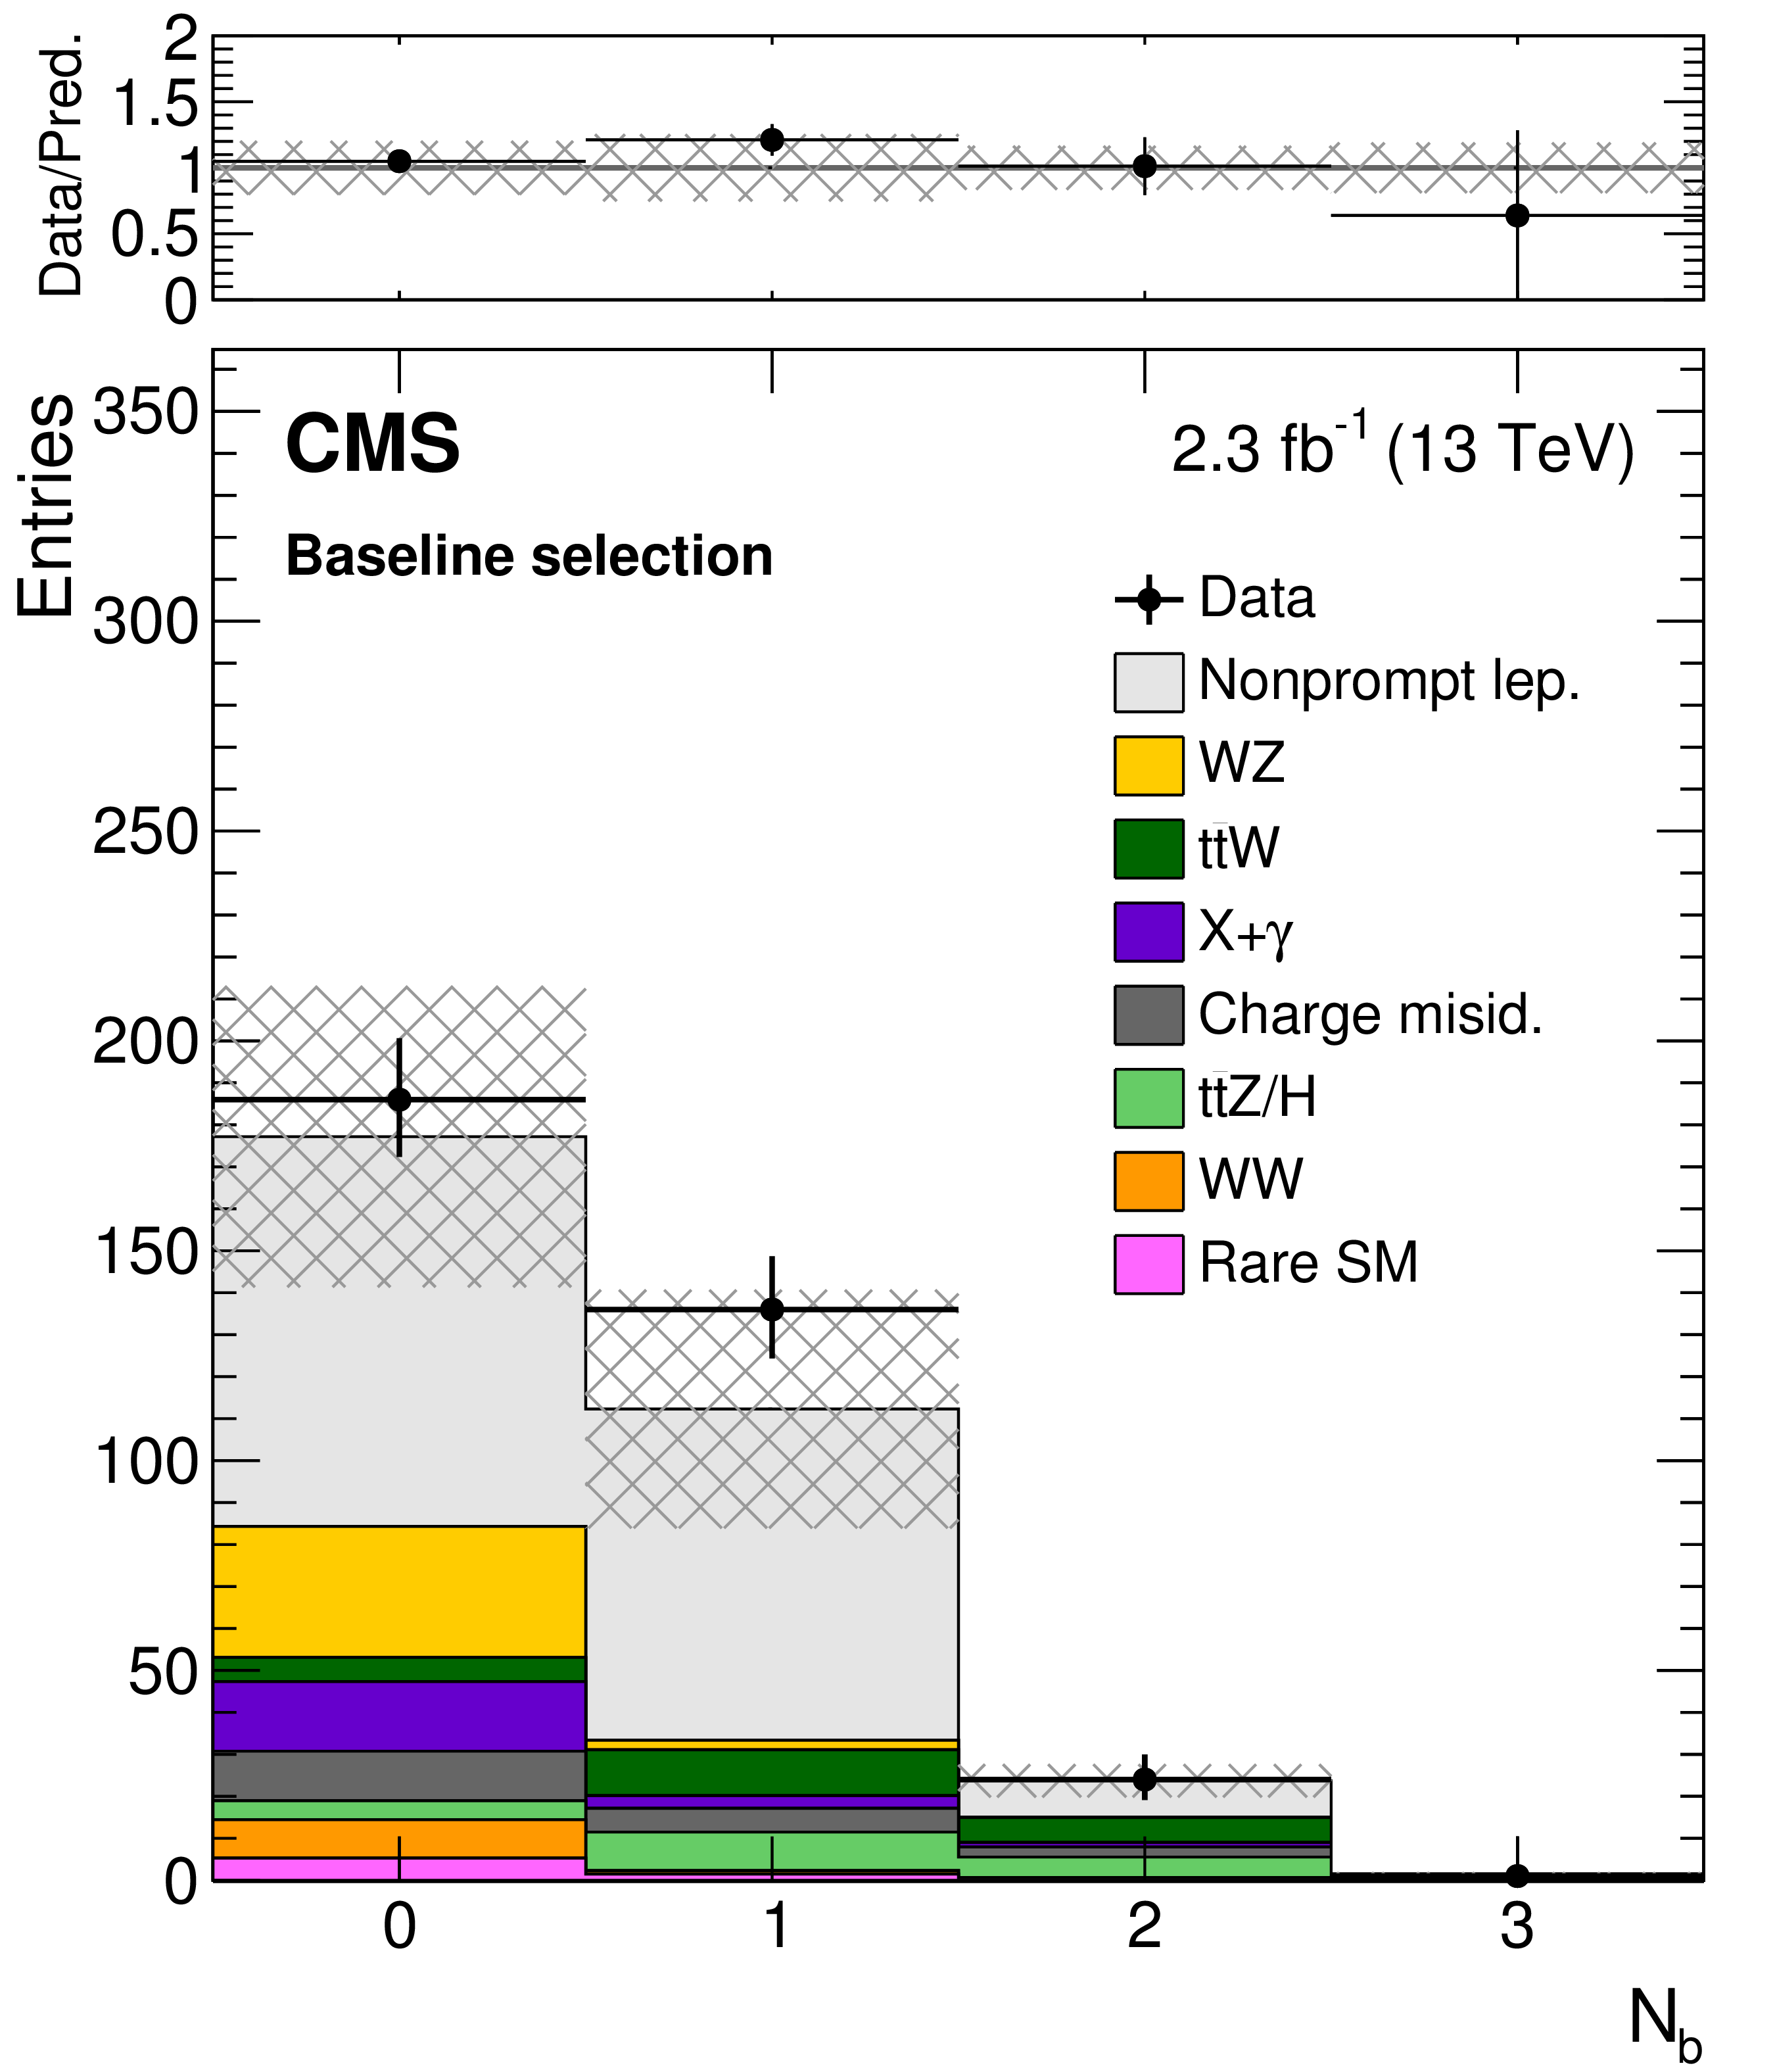
Figure 2-e:
Distributions of the main analysis variables: $ {H_{\mathrm {T}}}$ (a), ${E_{\mathrm {T}}^{\text {miss}}}$ (b), ${M_\text {T}^{\text {min}}}$ (c), ${N_\text {jet}}$ (d), and ${N_\text {b}}$ (e), after a baseline selection requiring a pair of SS leptons, two jets, and either $ {E_{\mathrm {T}}^{\text {miss}}} > $ 30 GeV or $ {H_{\mathrm {T}}} > $ 500 GeV. The last bin includes the overflow. The hatched area represents the total uncertainty in the background prediction. The upper panels show the ratio of the observed event yield to the background prediction. |
png pdf |
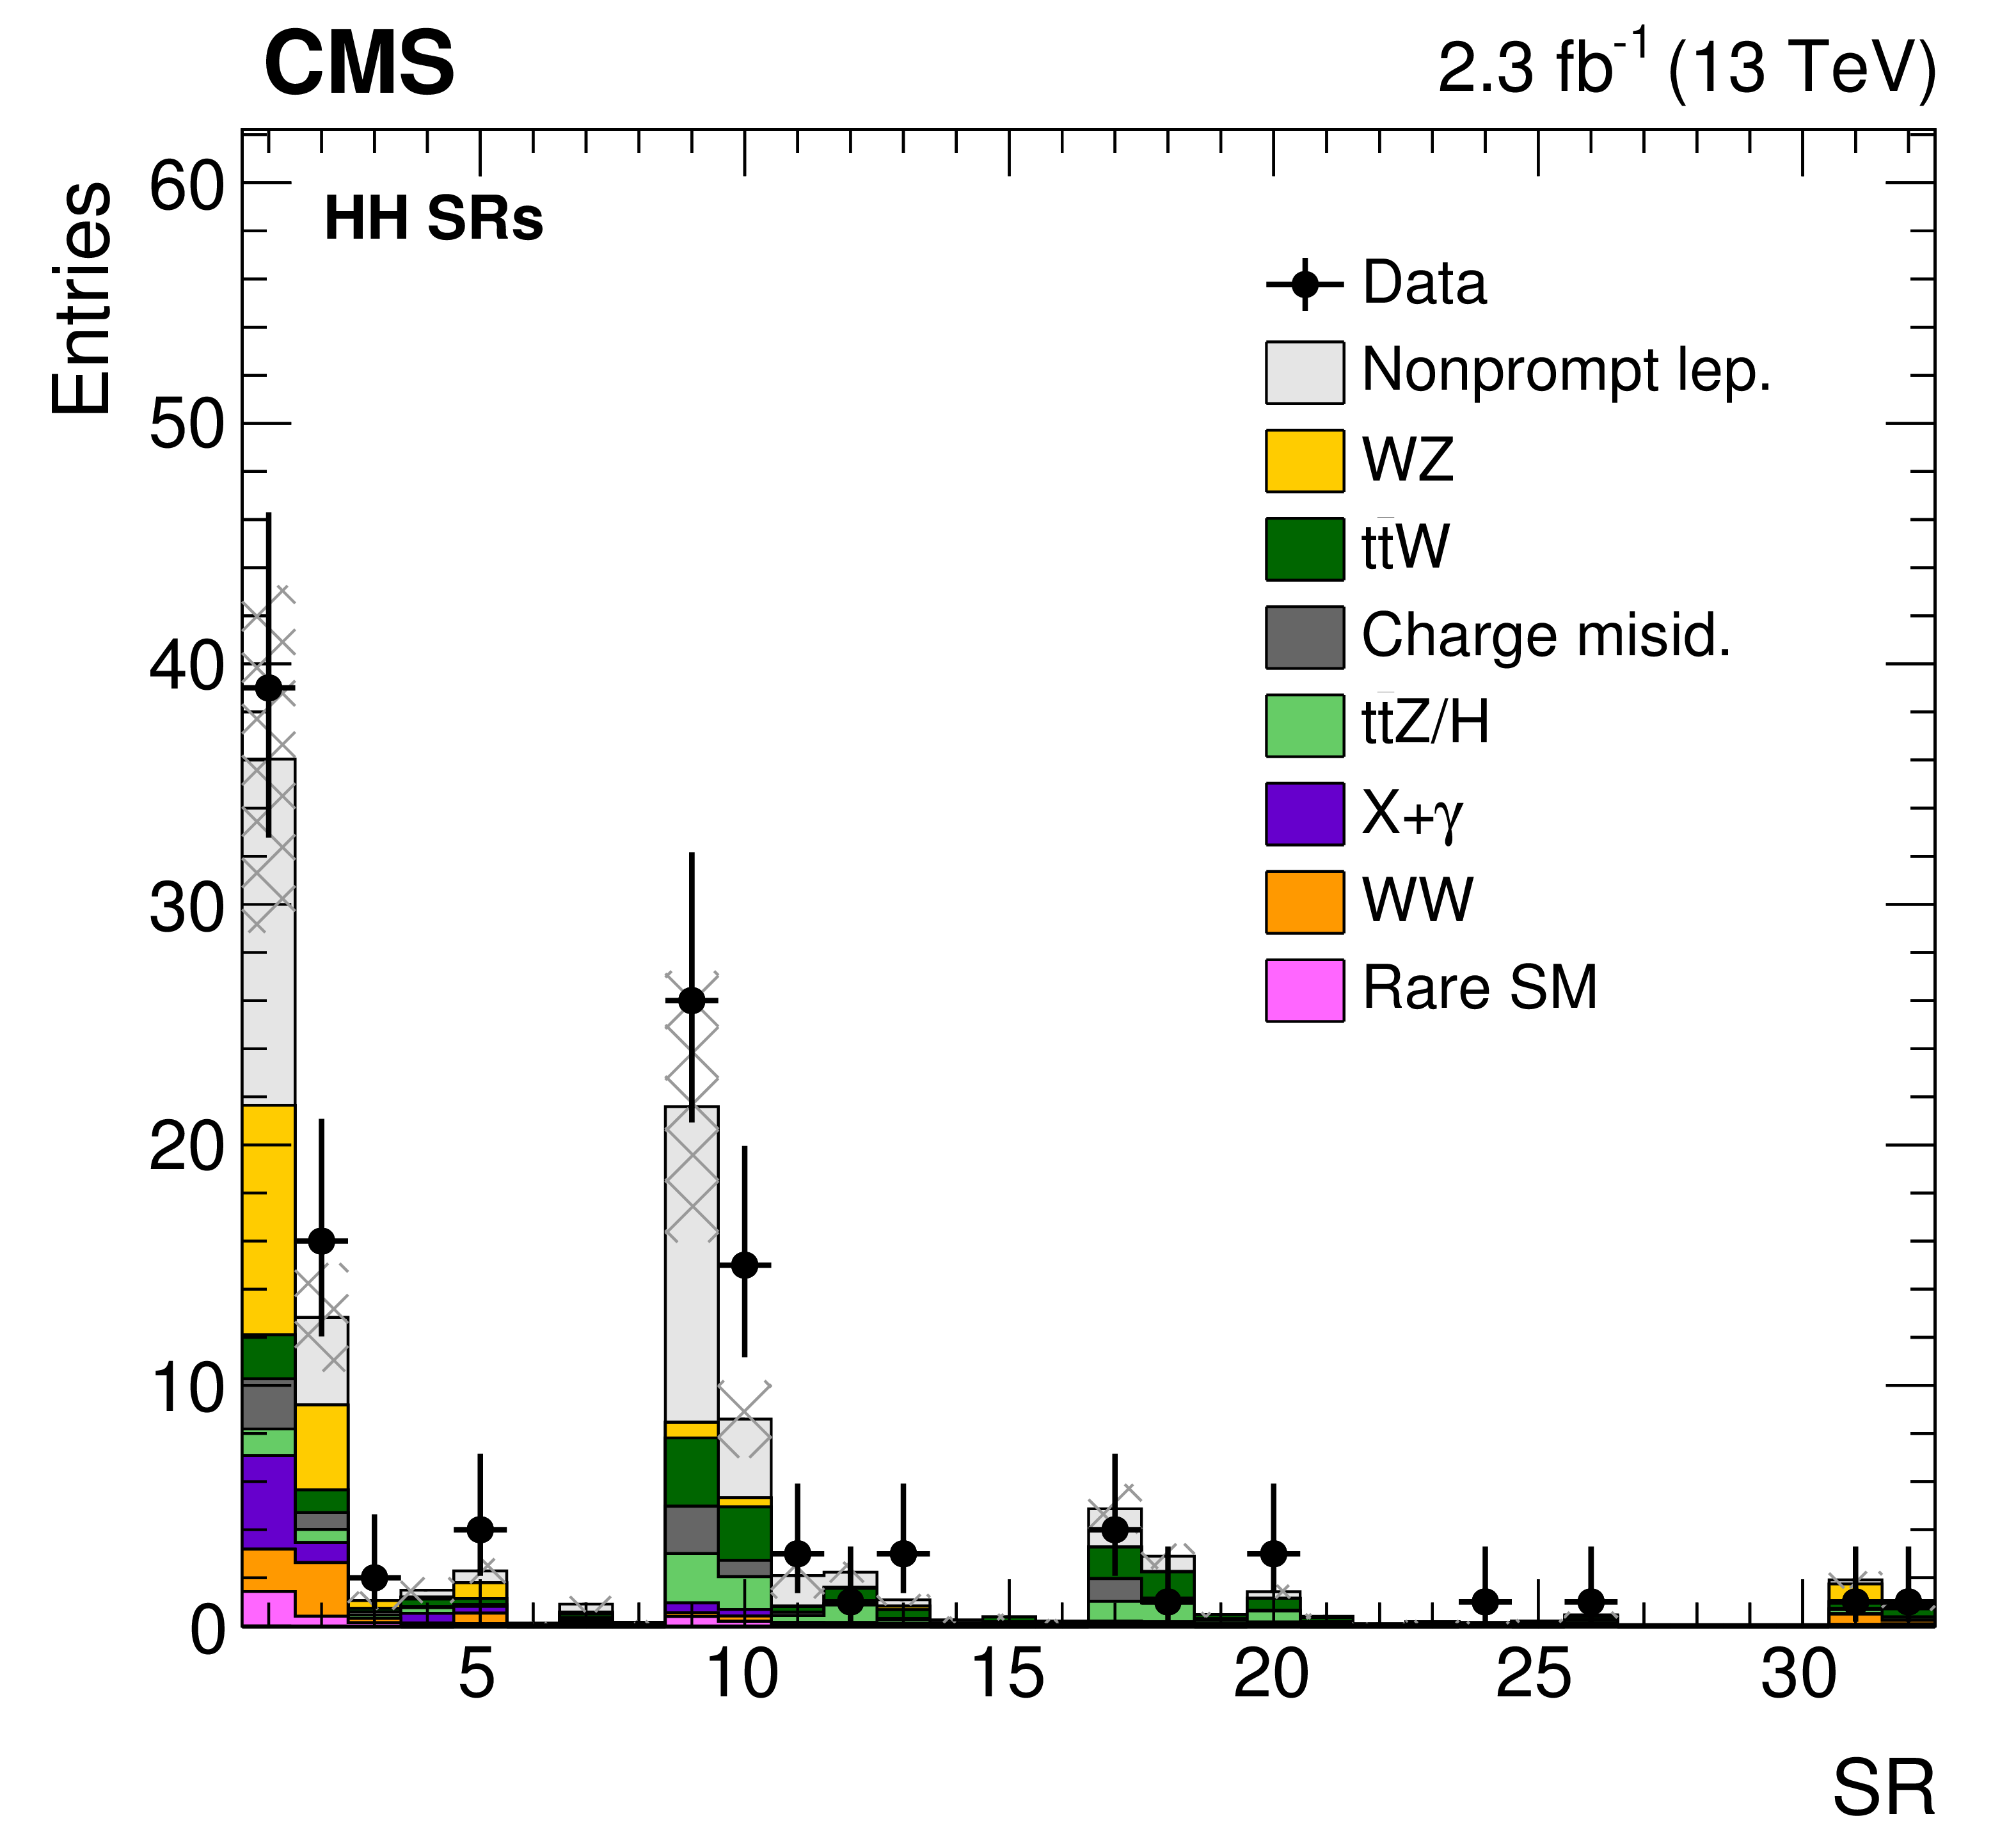
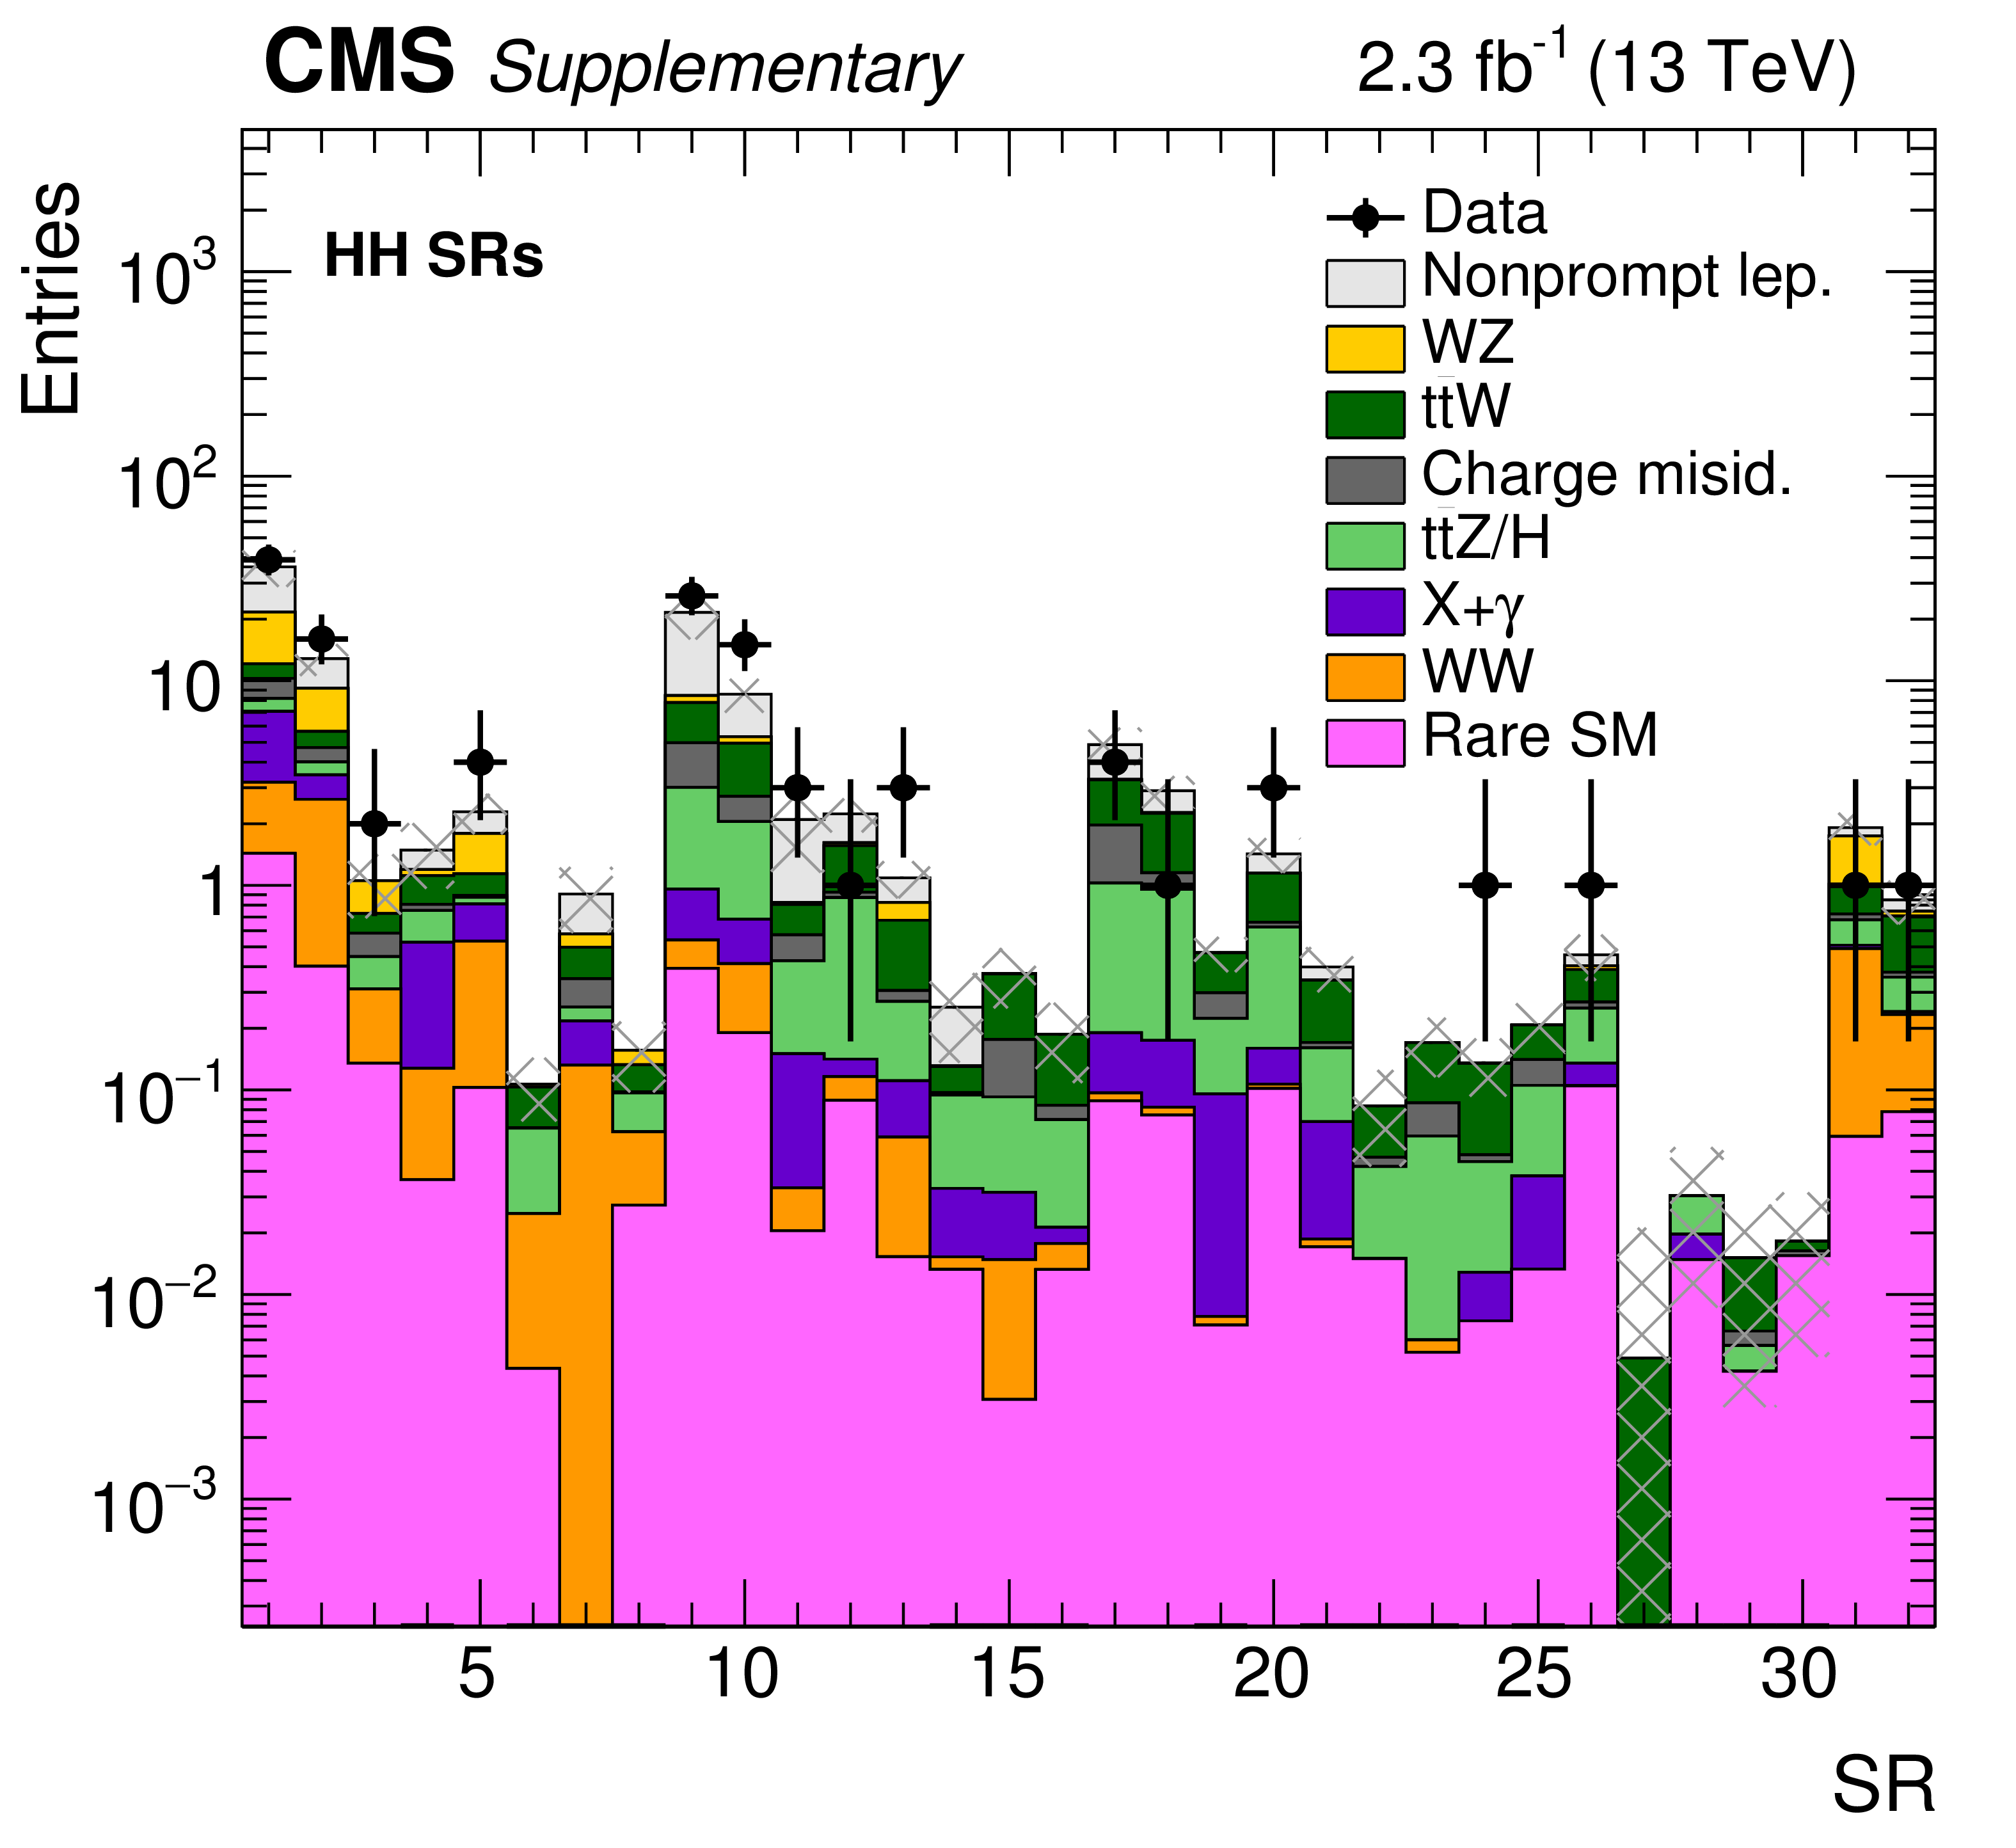
Figure 3-a:
Event yields in the HH (a), HL (b), and LL (c) SRs. The hatched area represents the total uncertainty in the background prediction. |

png pdf |
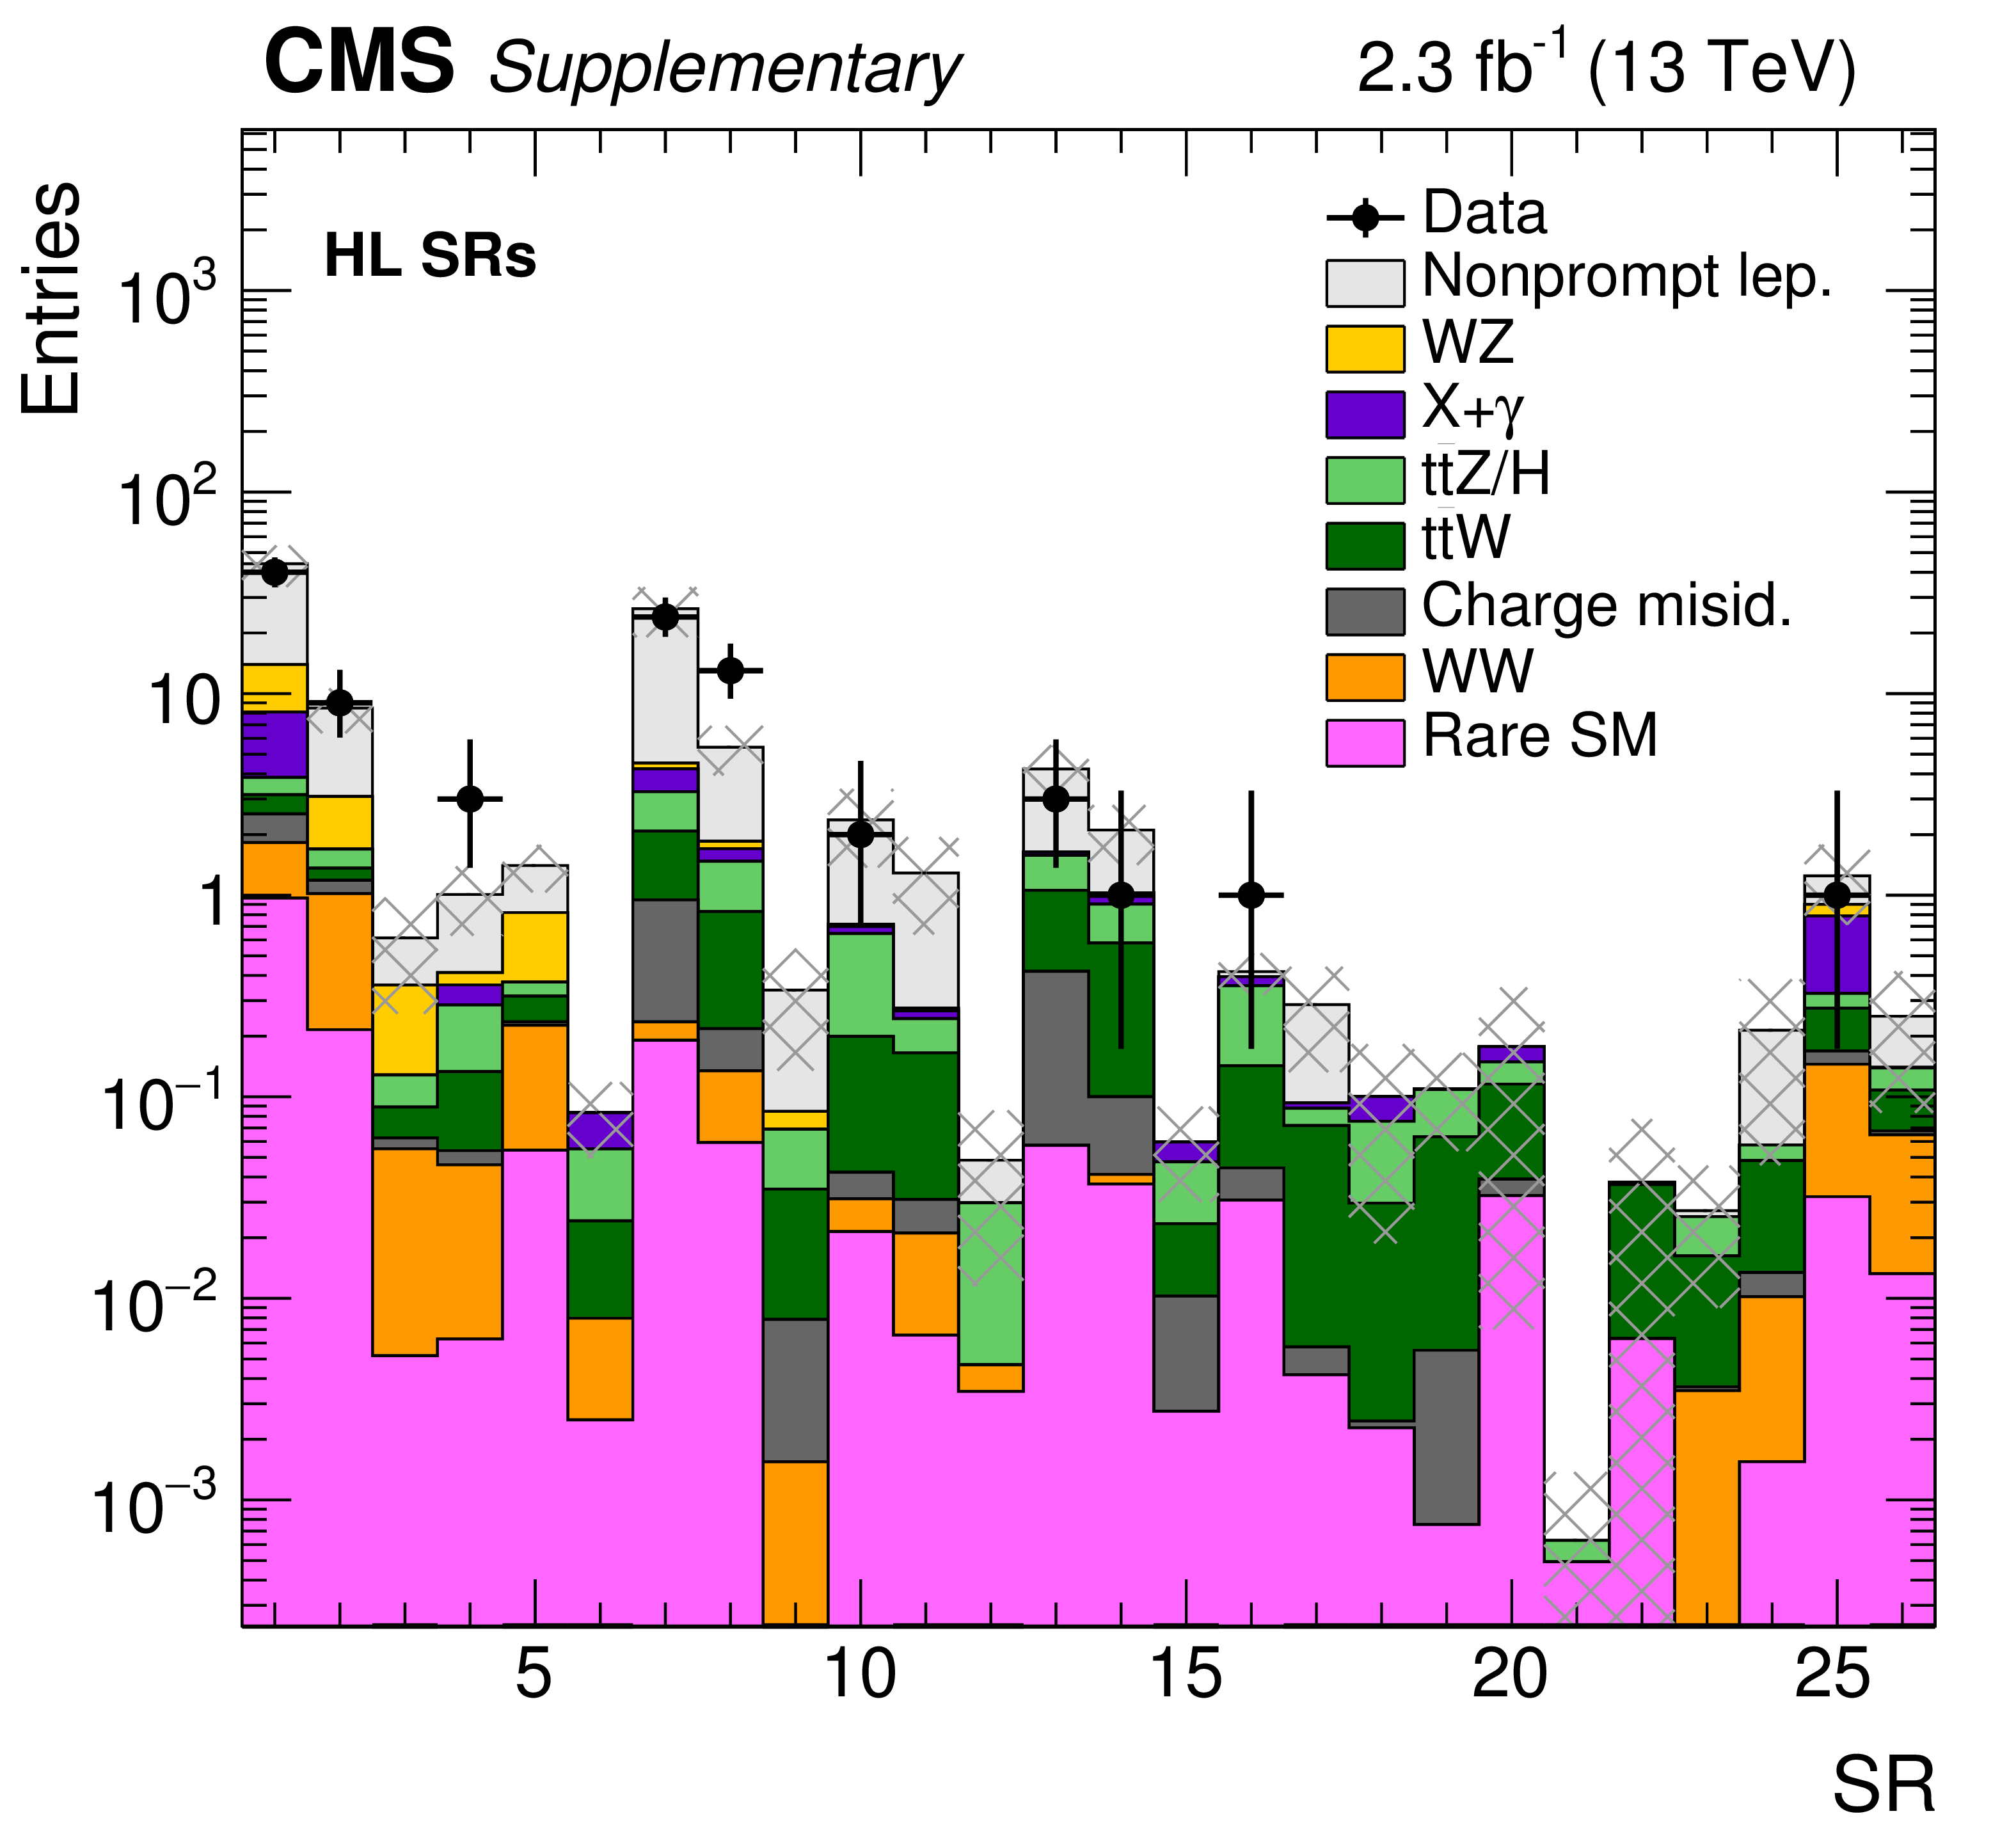
Figure 3-b:
Event yields in the HH (a), HL (b), and LL (c) SRs. The hatched area represents the total uncertainty in the background prediction. |

png pdf |
Figure 3-c:
Event yields in the HH (a), HL (b), and LL (c) SRs. The hatched area represents the total uncertainty in the background prediction. |
png pdf root |
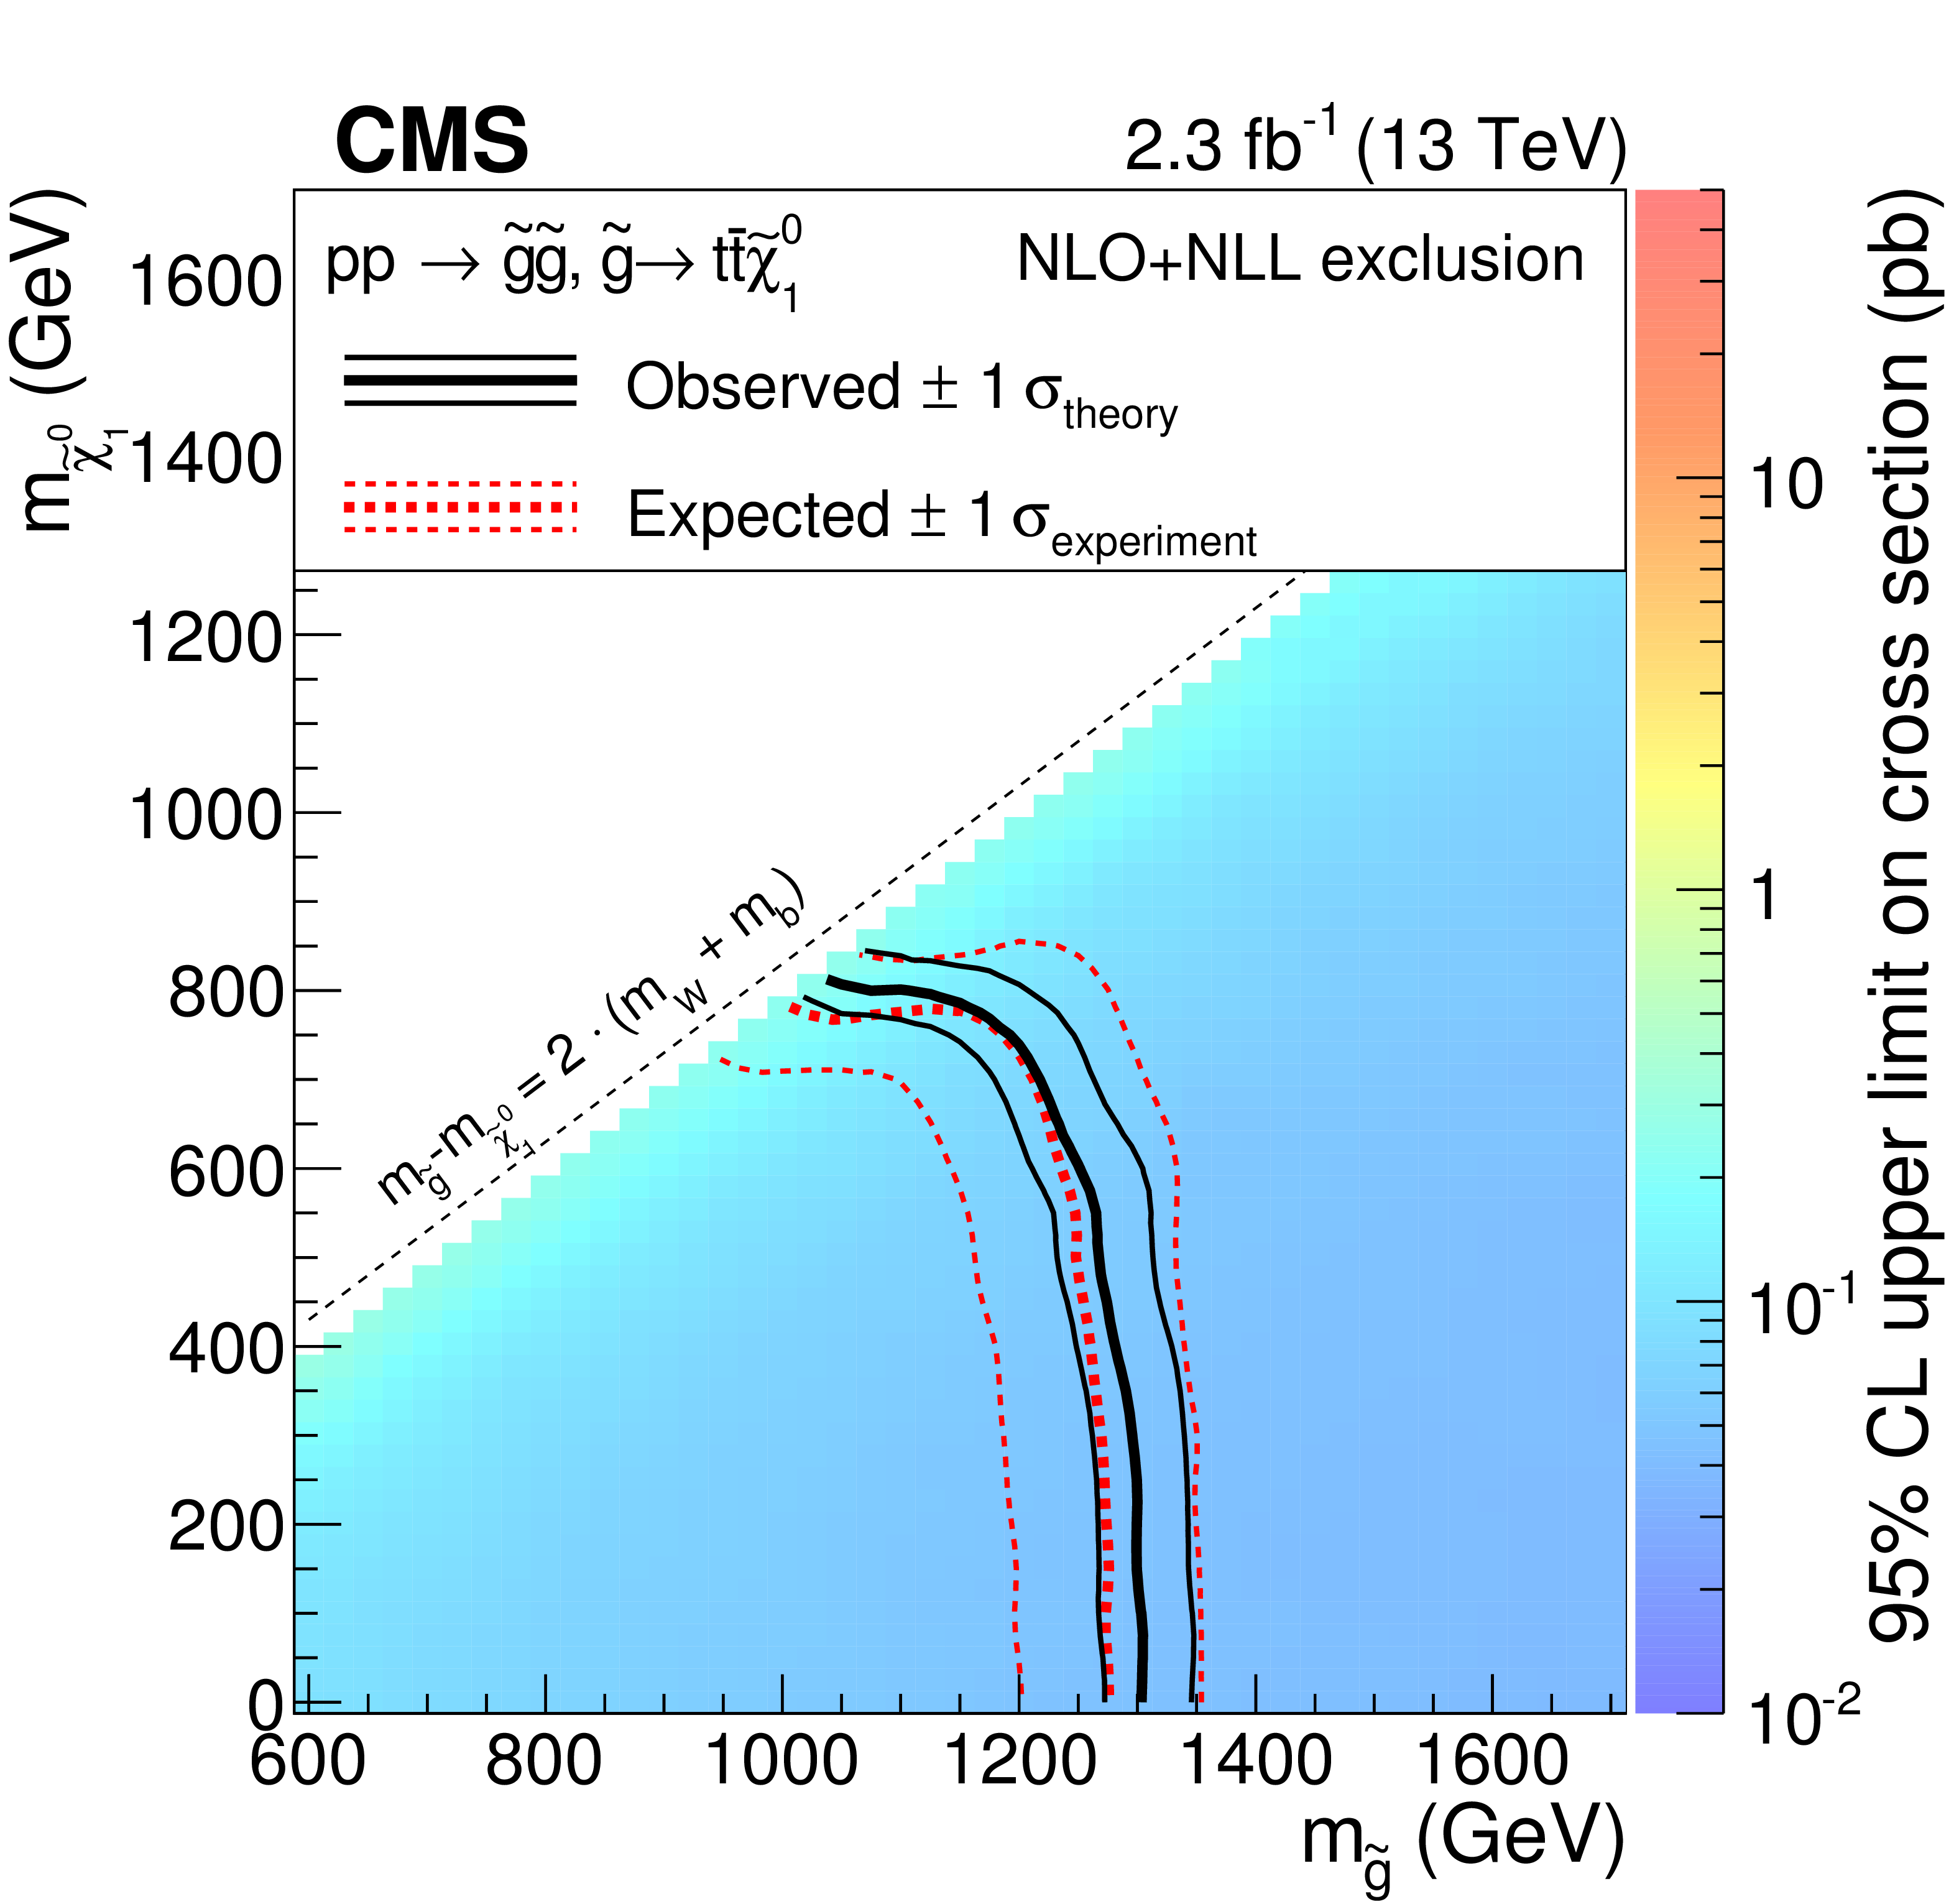
Figure 4-a:
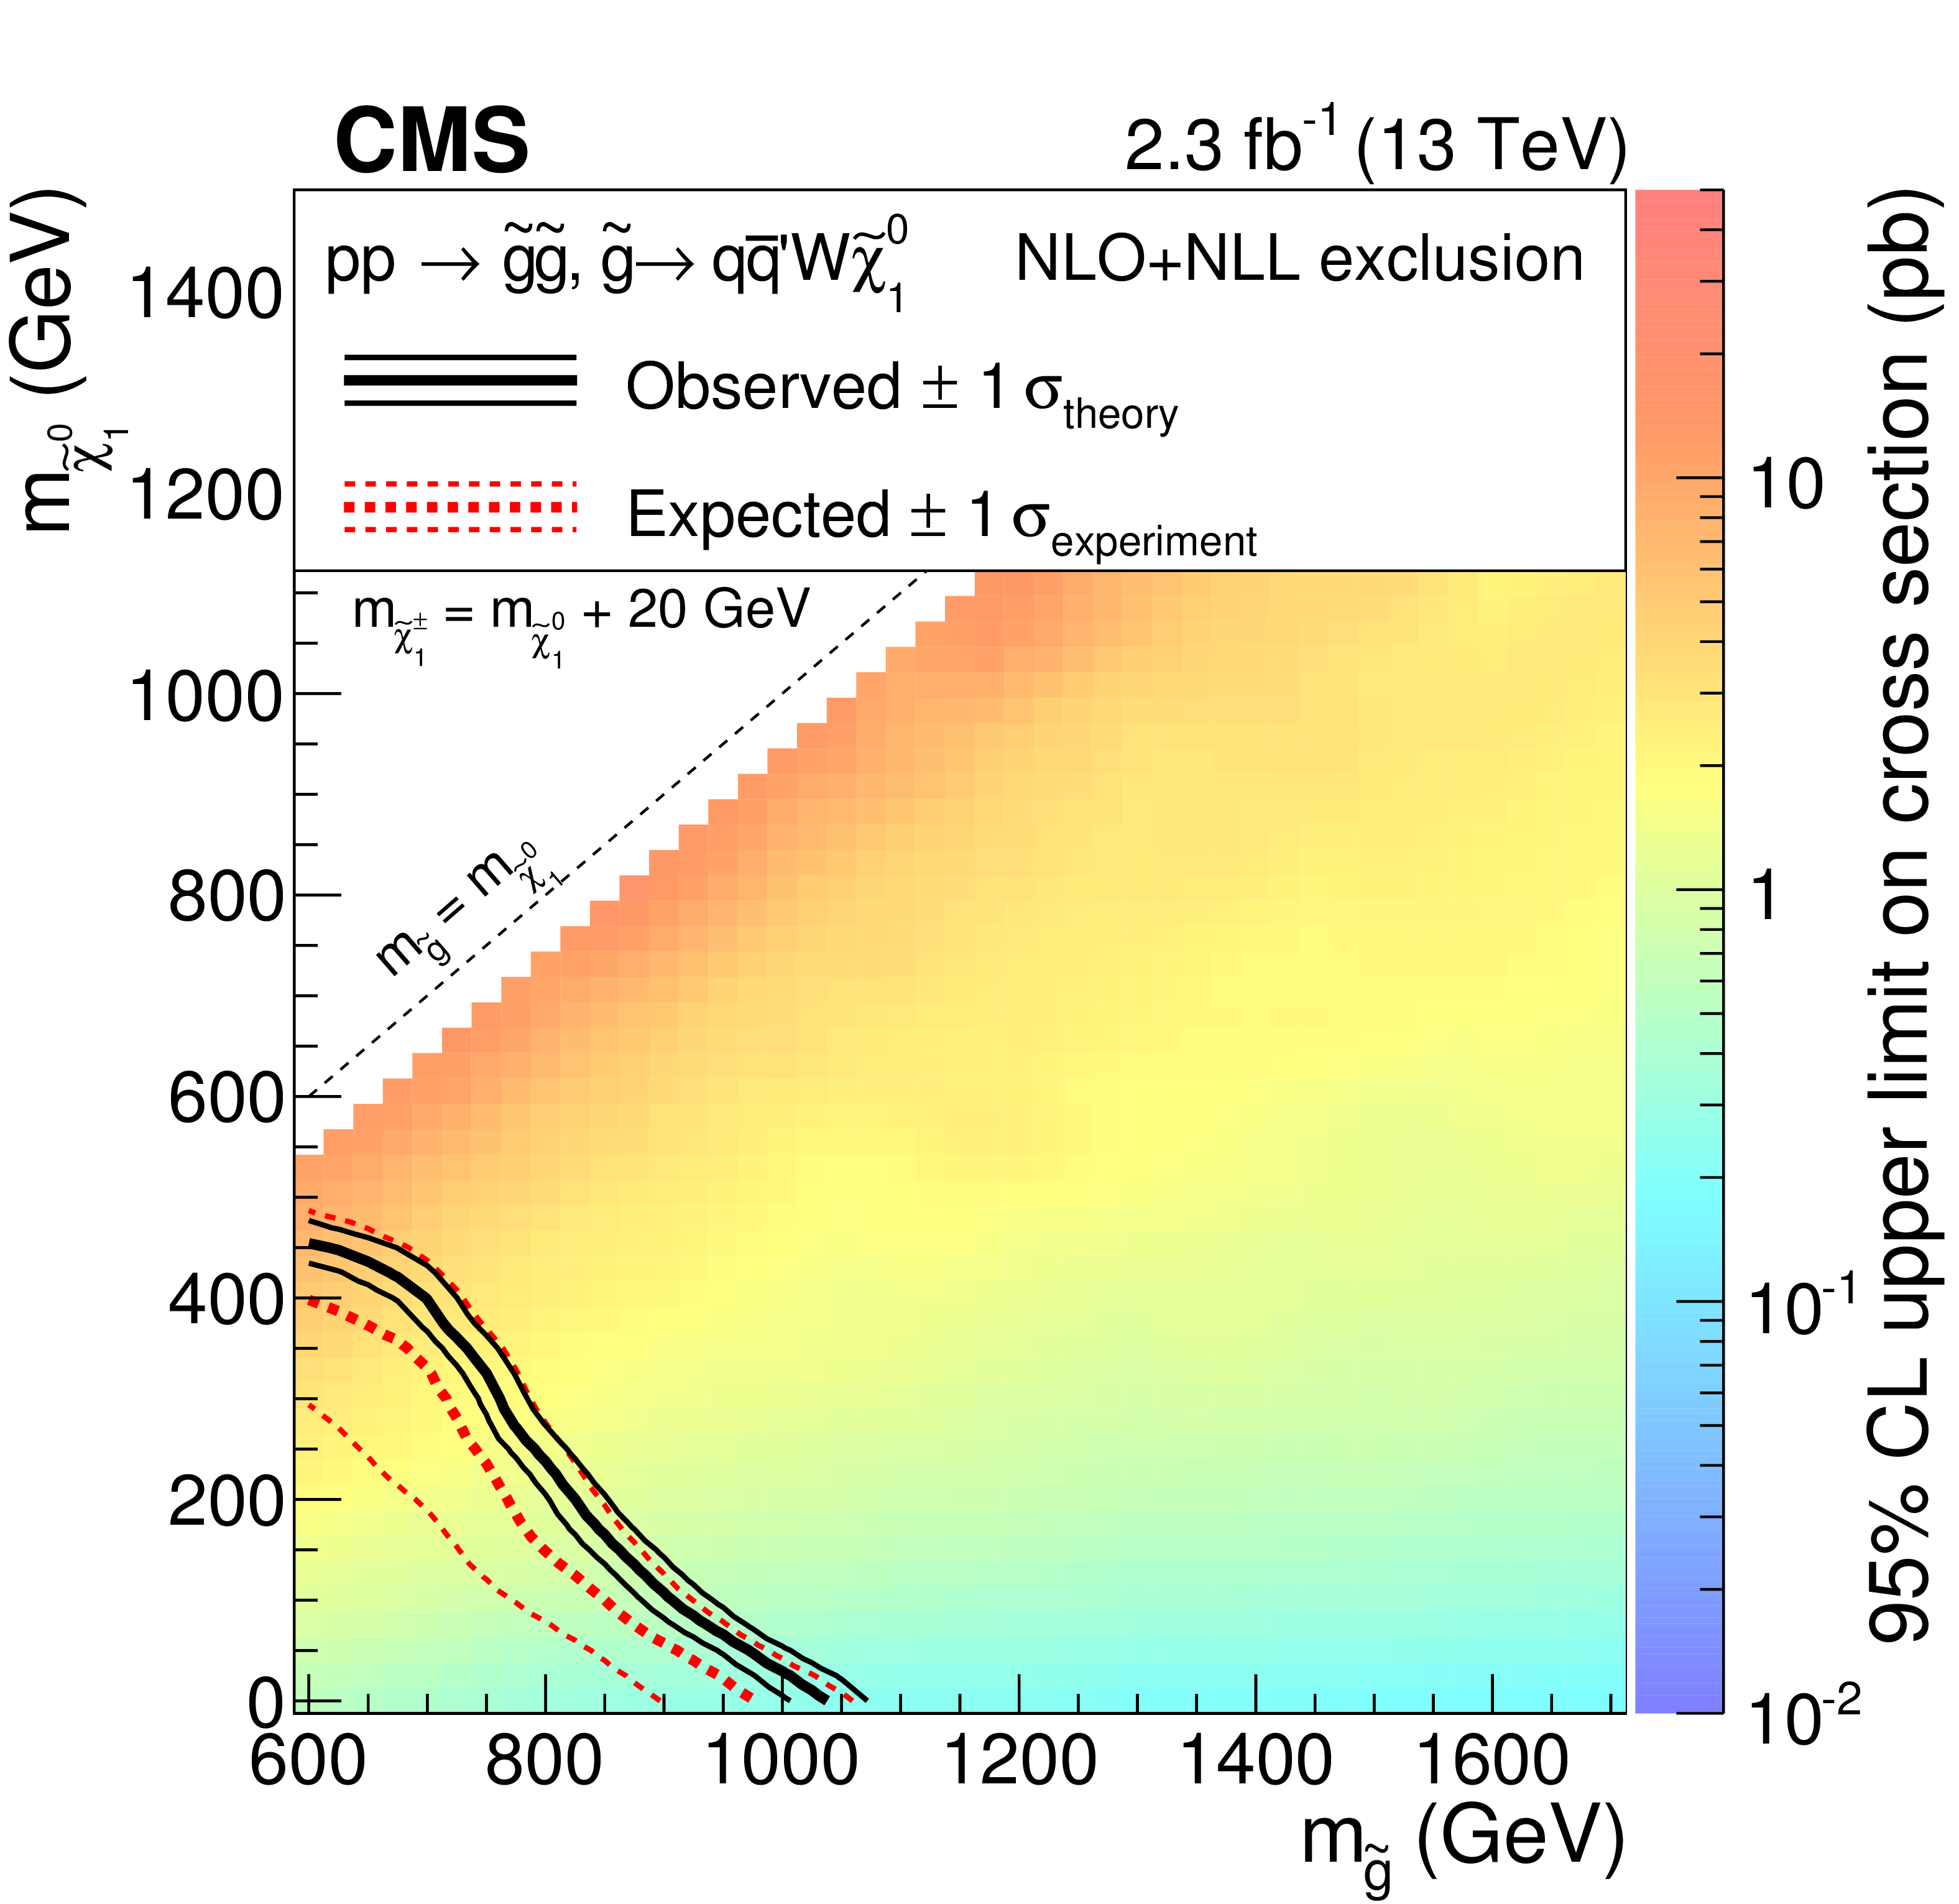
Exclusion regions at the 95% CL in the $m_{ {\tilde{\chi}^0_1} }$ versus $m_{ \mathrm{ \tilde{g} } }$ plane for the T1tttt (left) and T5ttbbWW (right) models, where for the T5ttbbWW model $m_{ {\tilde{\chi}^\pm _1} } = m_{ {\tilde{\chi}^0_1} }$ + 5 GeV. The right-hand side color scale indicates the excluded cross section values for a given point in the SUSY particle mass plane. The solid, black curves represent the observed exclusion limits assuming the NLO+NLL cross sections (thick line), or their variations of $\pm$1 standard deviation (thin lines). The dashed, red curves show the expected limits with the corresponding $\pm$1 standard deviation experimental uncertainties. Excluded regions are to the left and below the limit curves. |
png pdf root |
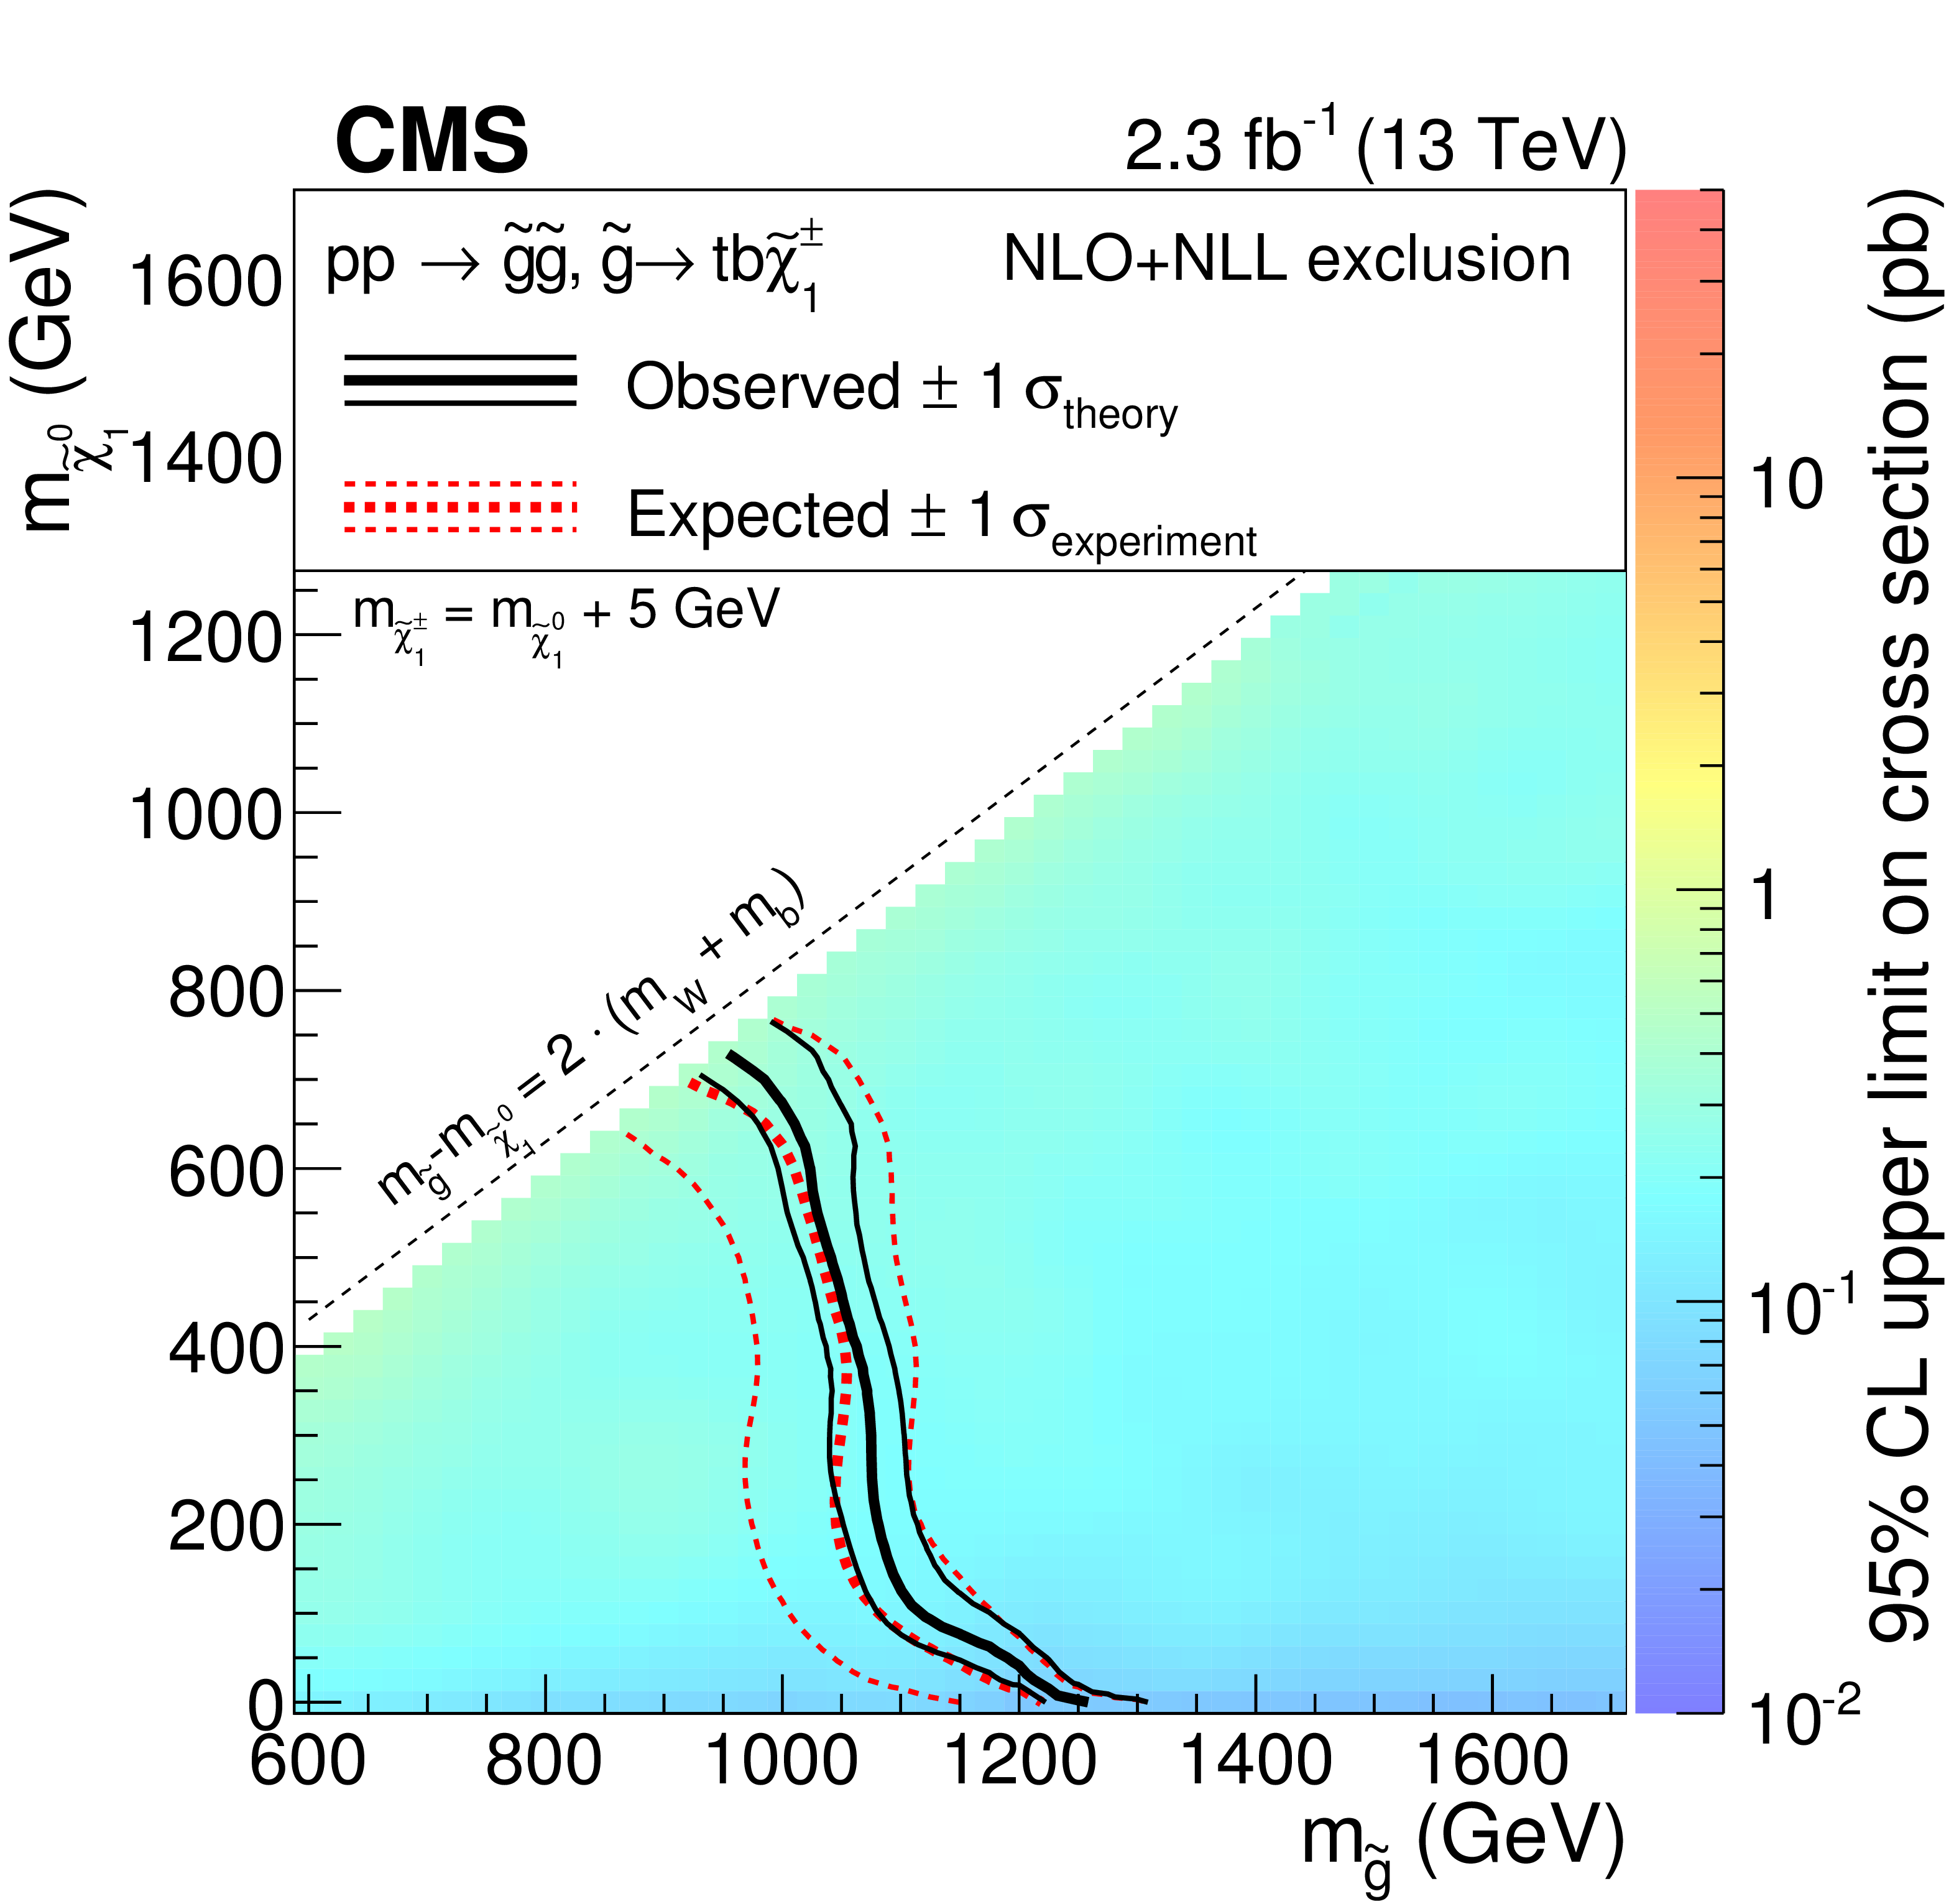
Figure 4-b:
Exclusion regions at the 95% CL in the $m_{ {\tilde{\chi}^0_1} }$ versus $m_{ \mathrm{ \tilde{g} } }$ plane for the T1tttt (left) and T5ttbbWW (right) models, where for the T5ttbbWW model $m_{ {\tilde{\chi}^\pm _1} } = m_{ {\tilde{\chi}^0_1} }$ + 5 GeV. The right-hand side color scale indicates the excluded cross section values for a given point in the SUSY particle mass plane. The solid, black curves represent the observed exclusion limits assuming the NLO+NLL cross sections (thick line), or their variations of $\pm$1 standard deviation (thin lines). The dashed, red curves show the expected limits with the corresponding $\pm$1 standard deviation experimental uncertainties. Excluded regions are to the left and below the limit curves. |
png pdf root |
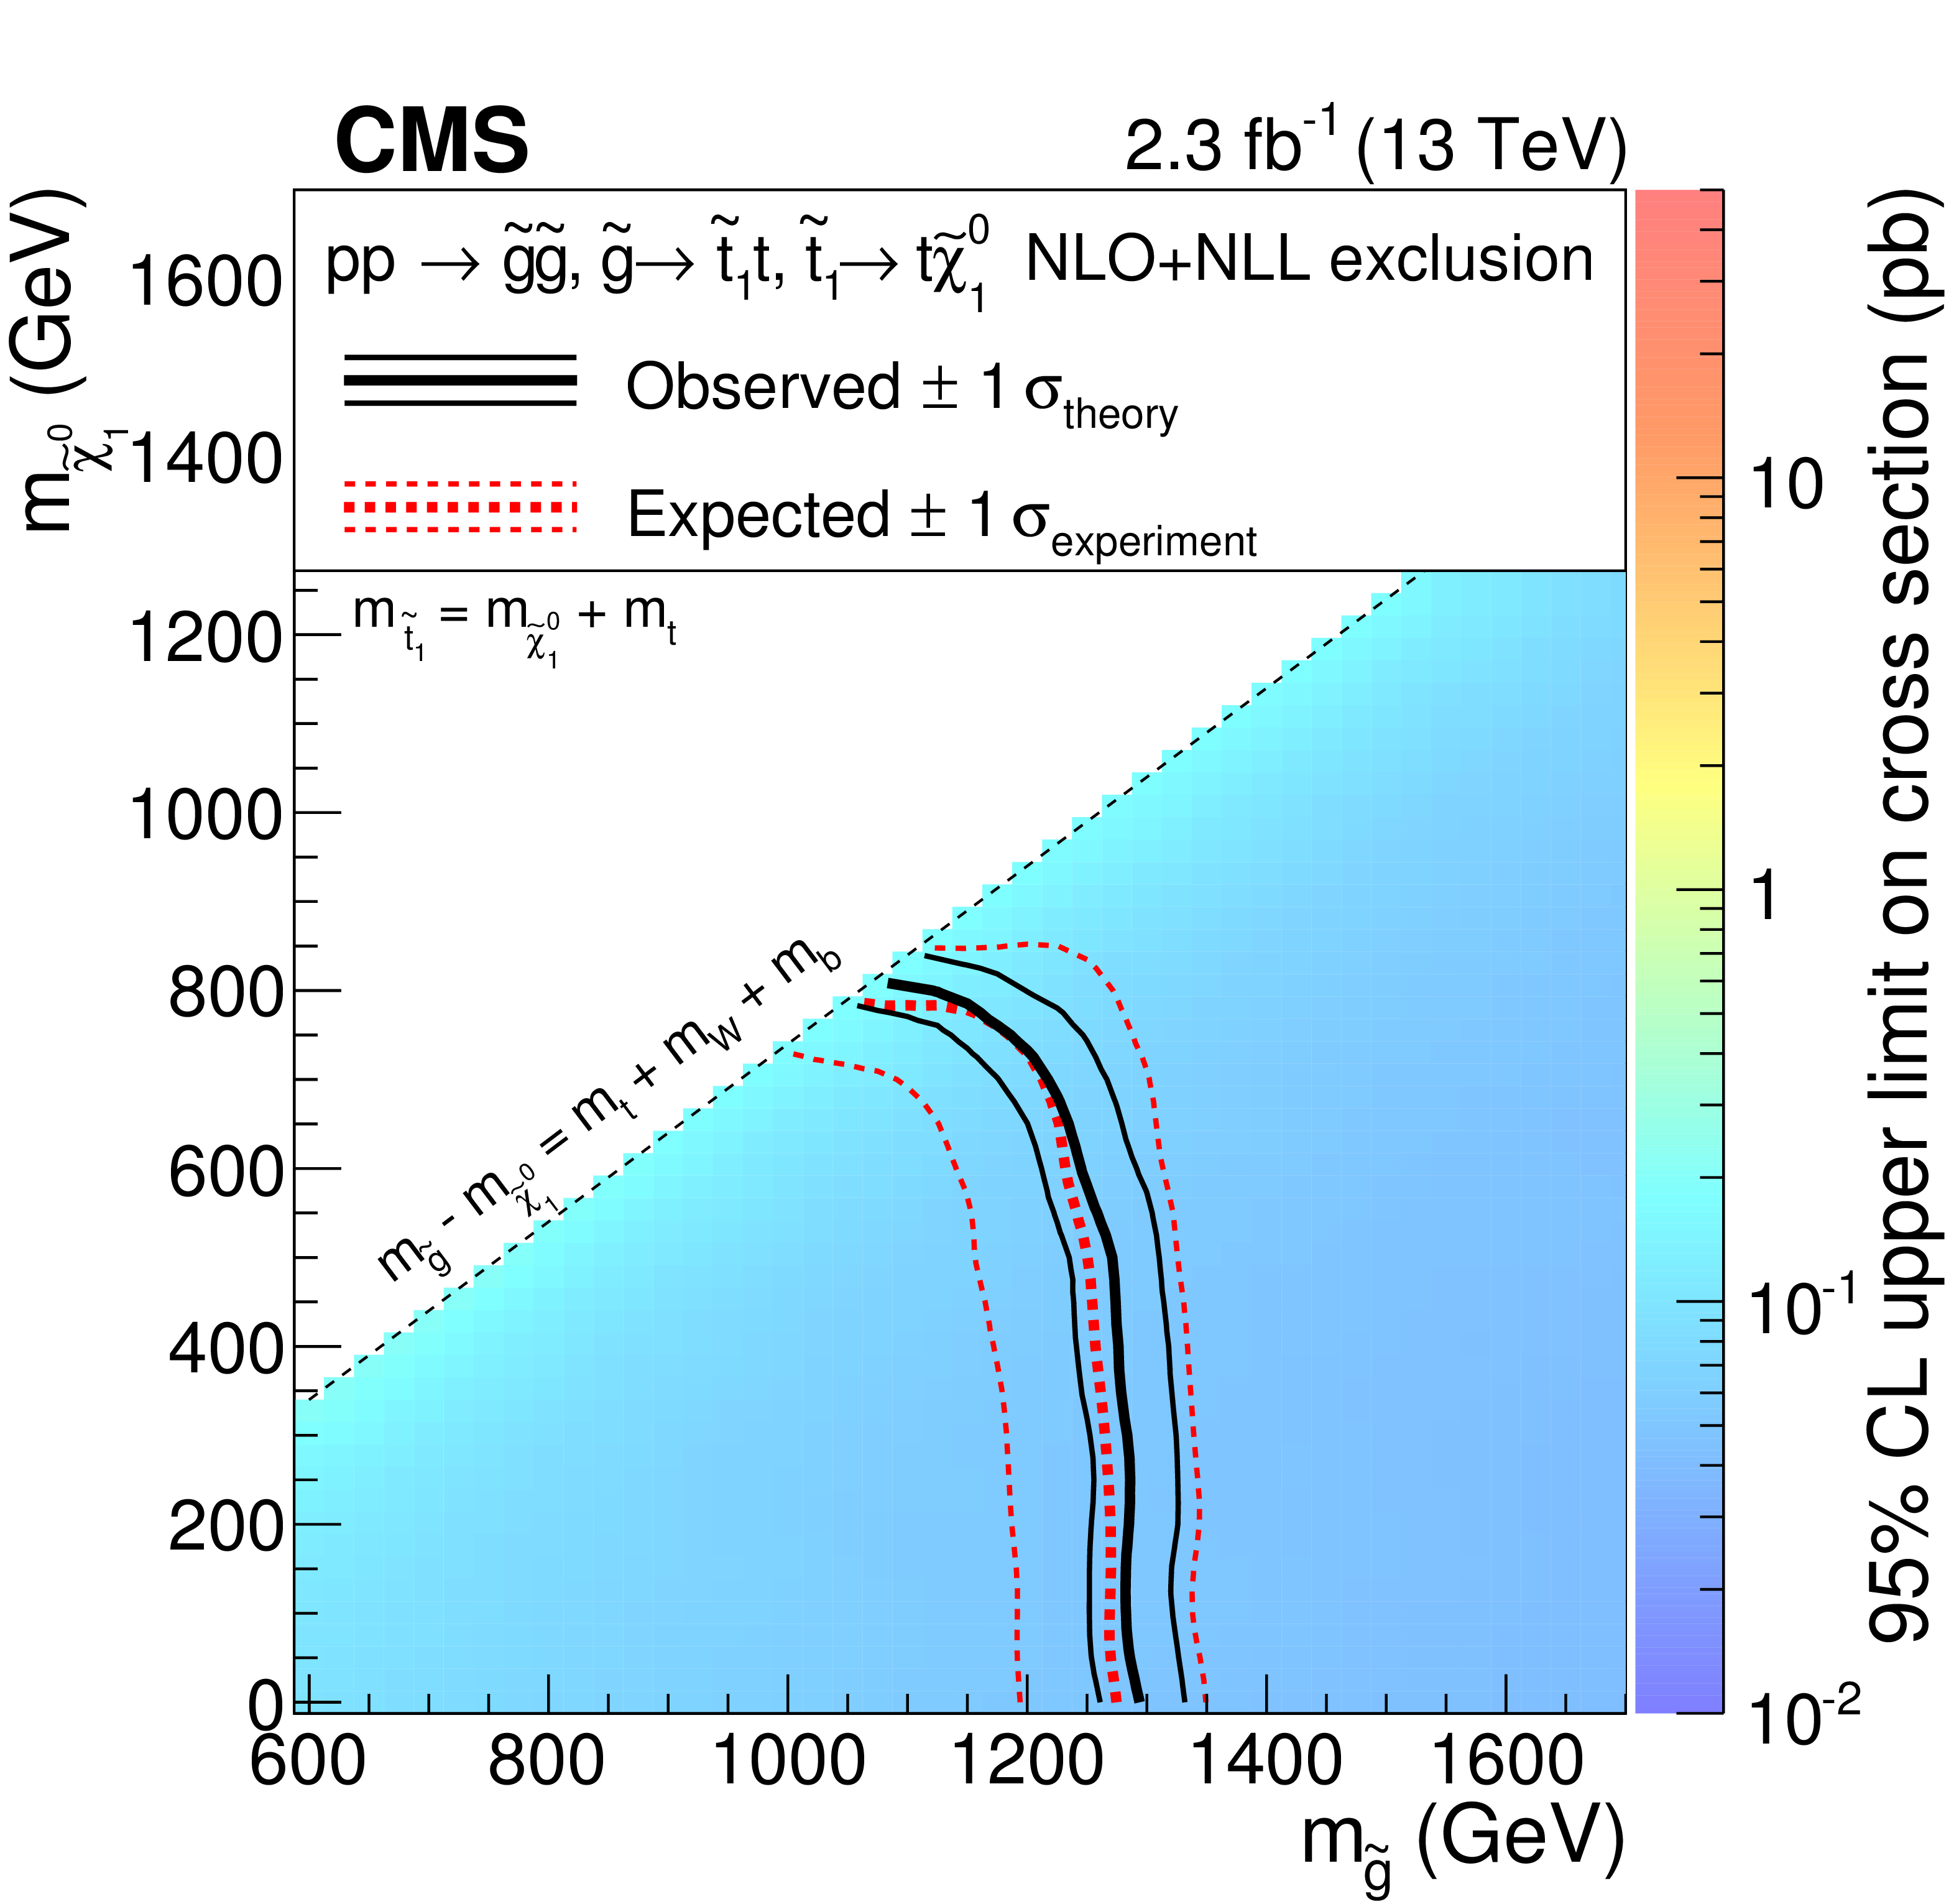
Figure 5-a:
Exclusion regions at the 95% CL in the plane of $m_{ {\tilde{\chi}^0_1} }$ versus $m_{ \mathrm{ \tilde{g} } }$ for models with the gluino decaying to an on-shell top squark: T5tttt with $m_{ \mathrm{ \tilde{t}_1 } } = m_{ {\tilde{\chi}^0_1} } + m_{\rm t}$(top), T5tttt with $m_{ \mathrm{ \tilde{t}_1 } } = m_{ {\tilde{\chi}^0_1} }$ + 20 GeV (bottom left), and T5ttcc with $m_{ \mathrm{ \tilde{t}_1 } } = m_{ {\tilde{\chi}^0_1} }$ + 20 GeV (bottom right). For a description of the notation, see Fig. 4. |
png pdf root |
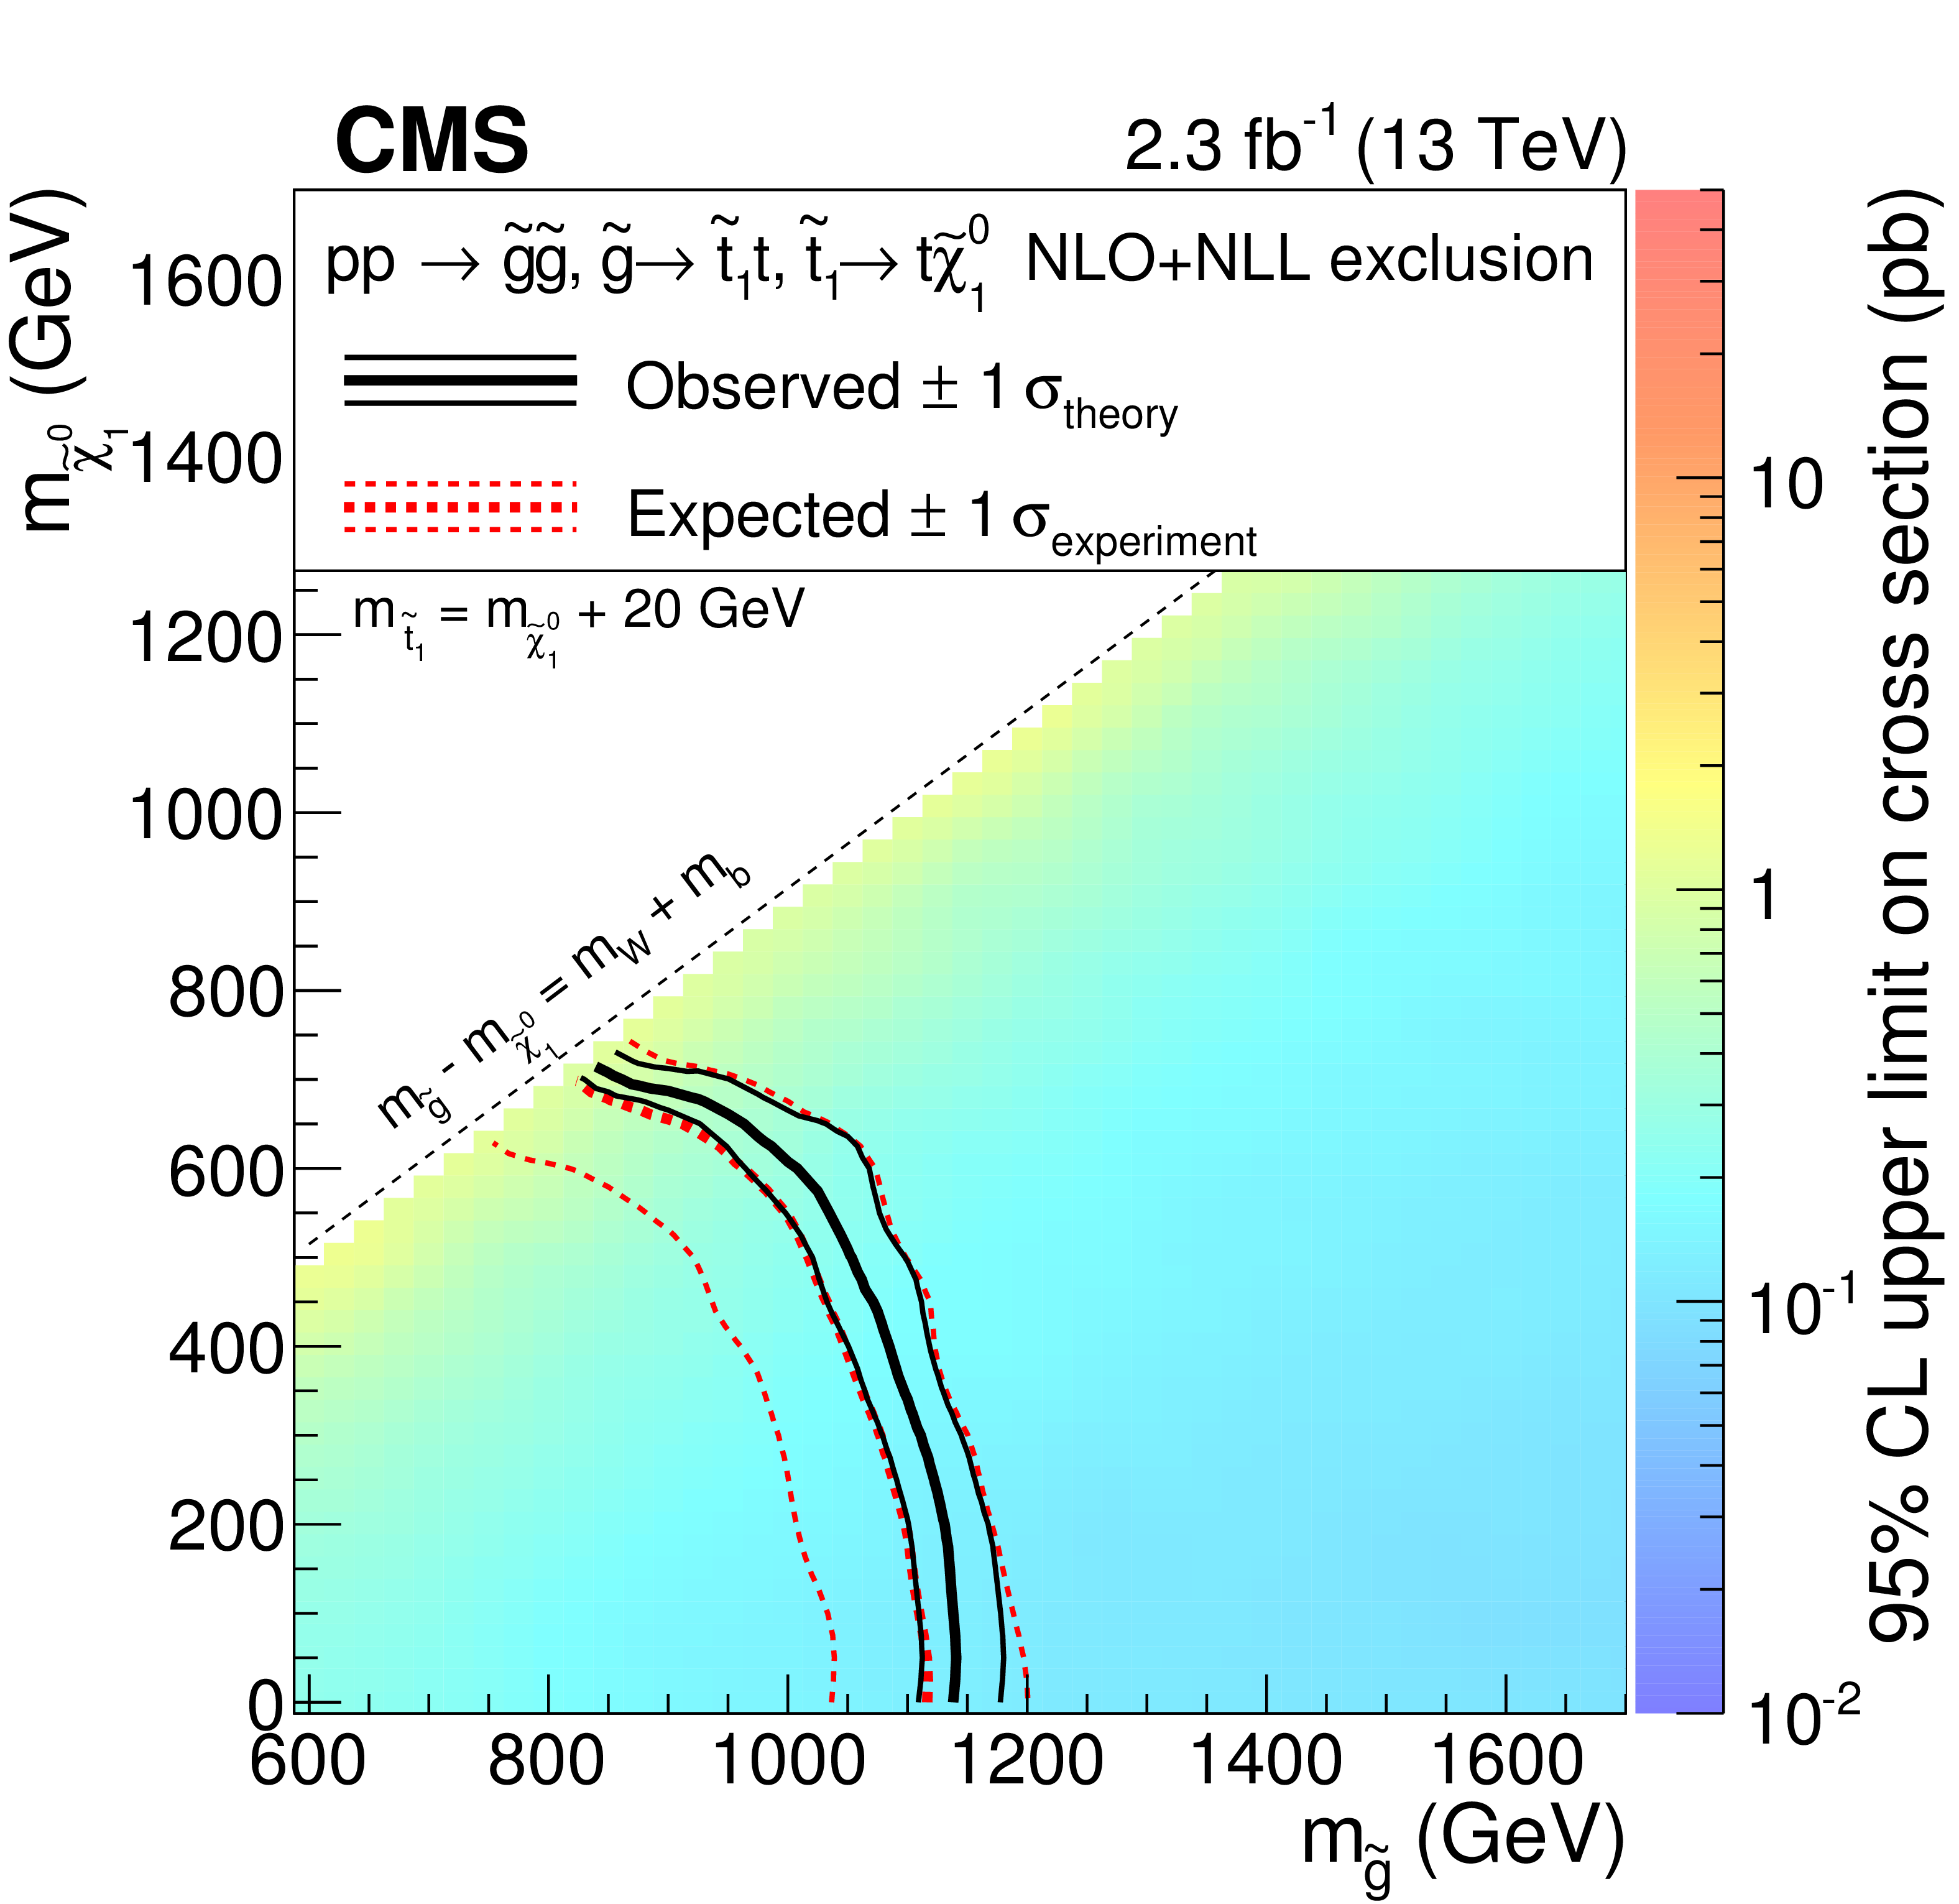
Figure 5-b:
Exclusion regions at the 95% CL in the plane of $m_{ {\tilde{\chi}^0_1} }$ versus $m_{ \mathrm{ \tilde{g} } }$ for models with the gluino decaying to an on-shell top squark: T5tttt with $m_{ \mathrm{ \tilde{t}_1 } } = m_{ {\tilde{\chi}^0_1} } + m_{\rm t}$(top), T5tttt with $m_{ \mathrm{ \tilde{t}_1 } } = m_{ {\tilde{\chi}^0_1} }$ + 20 GeV (bottom left), and T5ttcc with $m_{ \mathrm{ \tilde{t}_1 } } = m_{ {\tilde{\chi}^0_1} }$ + 20 GeV (bottom right). For a description of the notation, see Fig. 4. |
png pdf root |
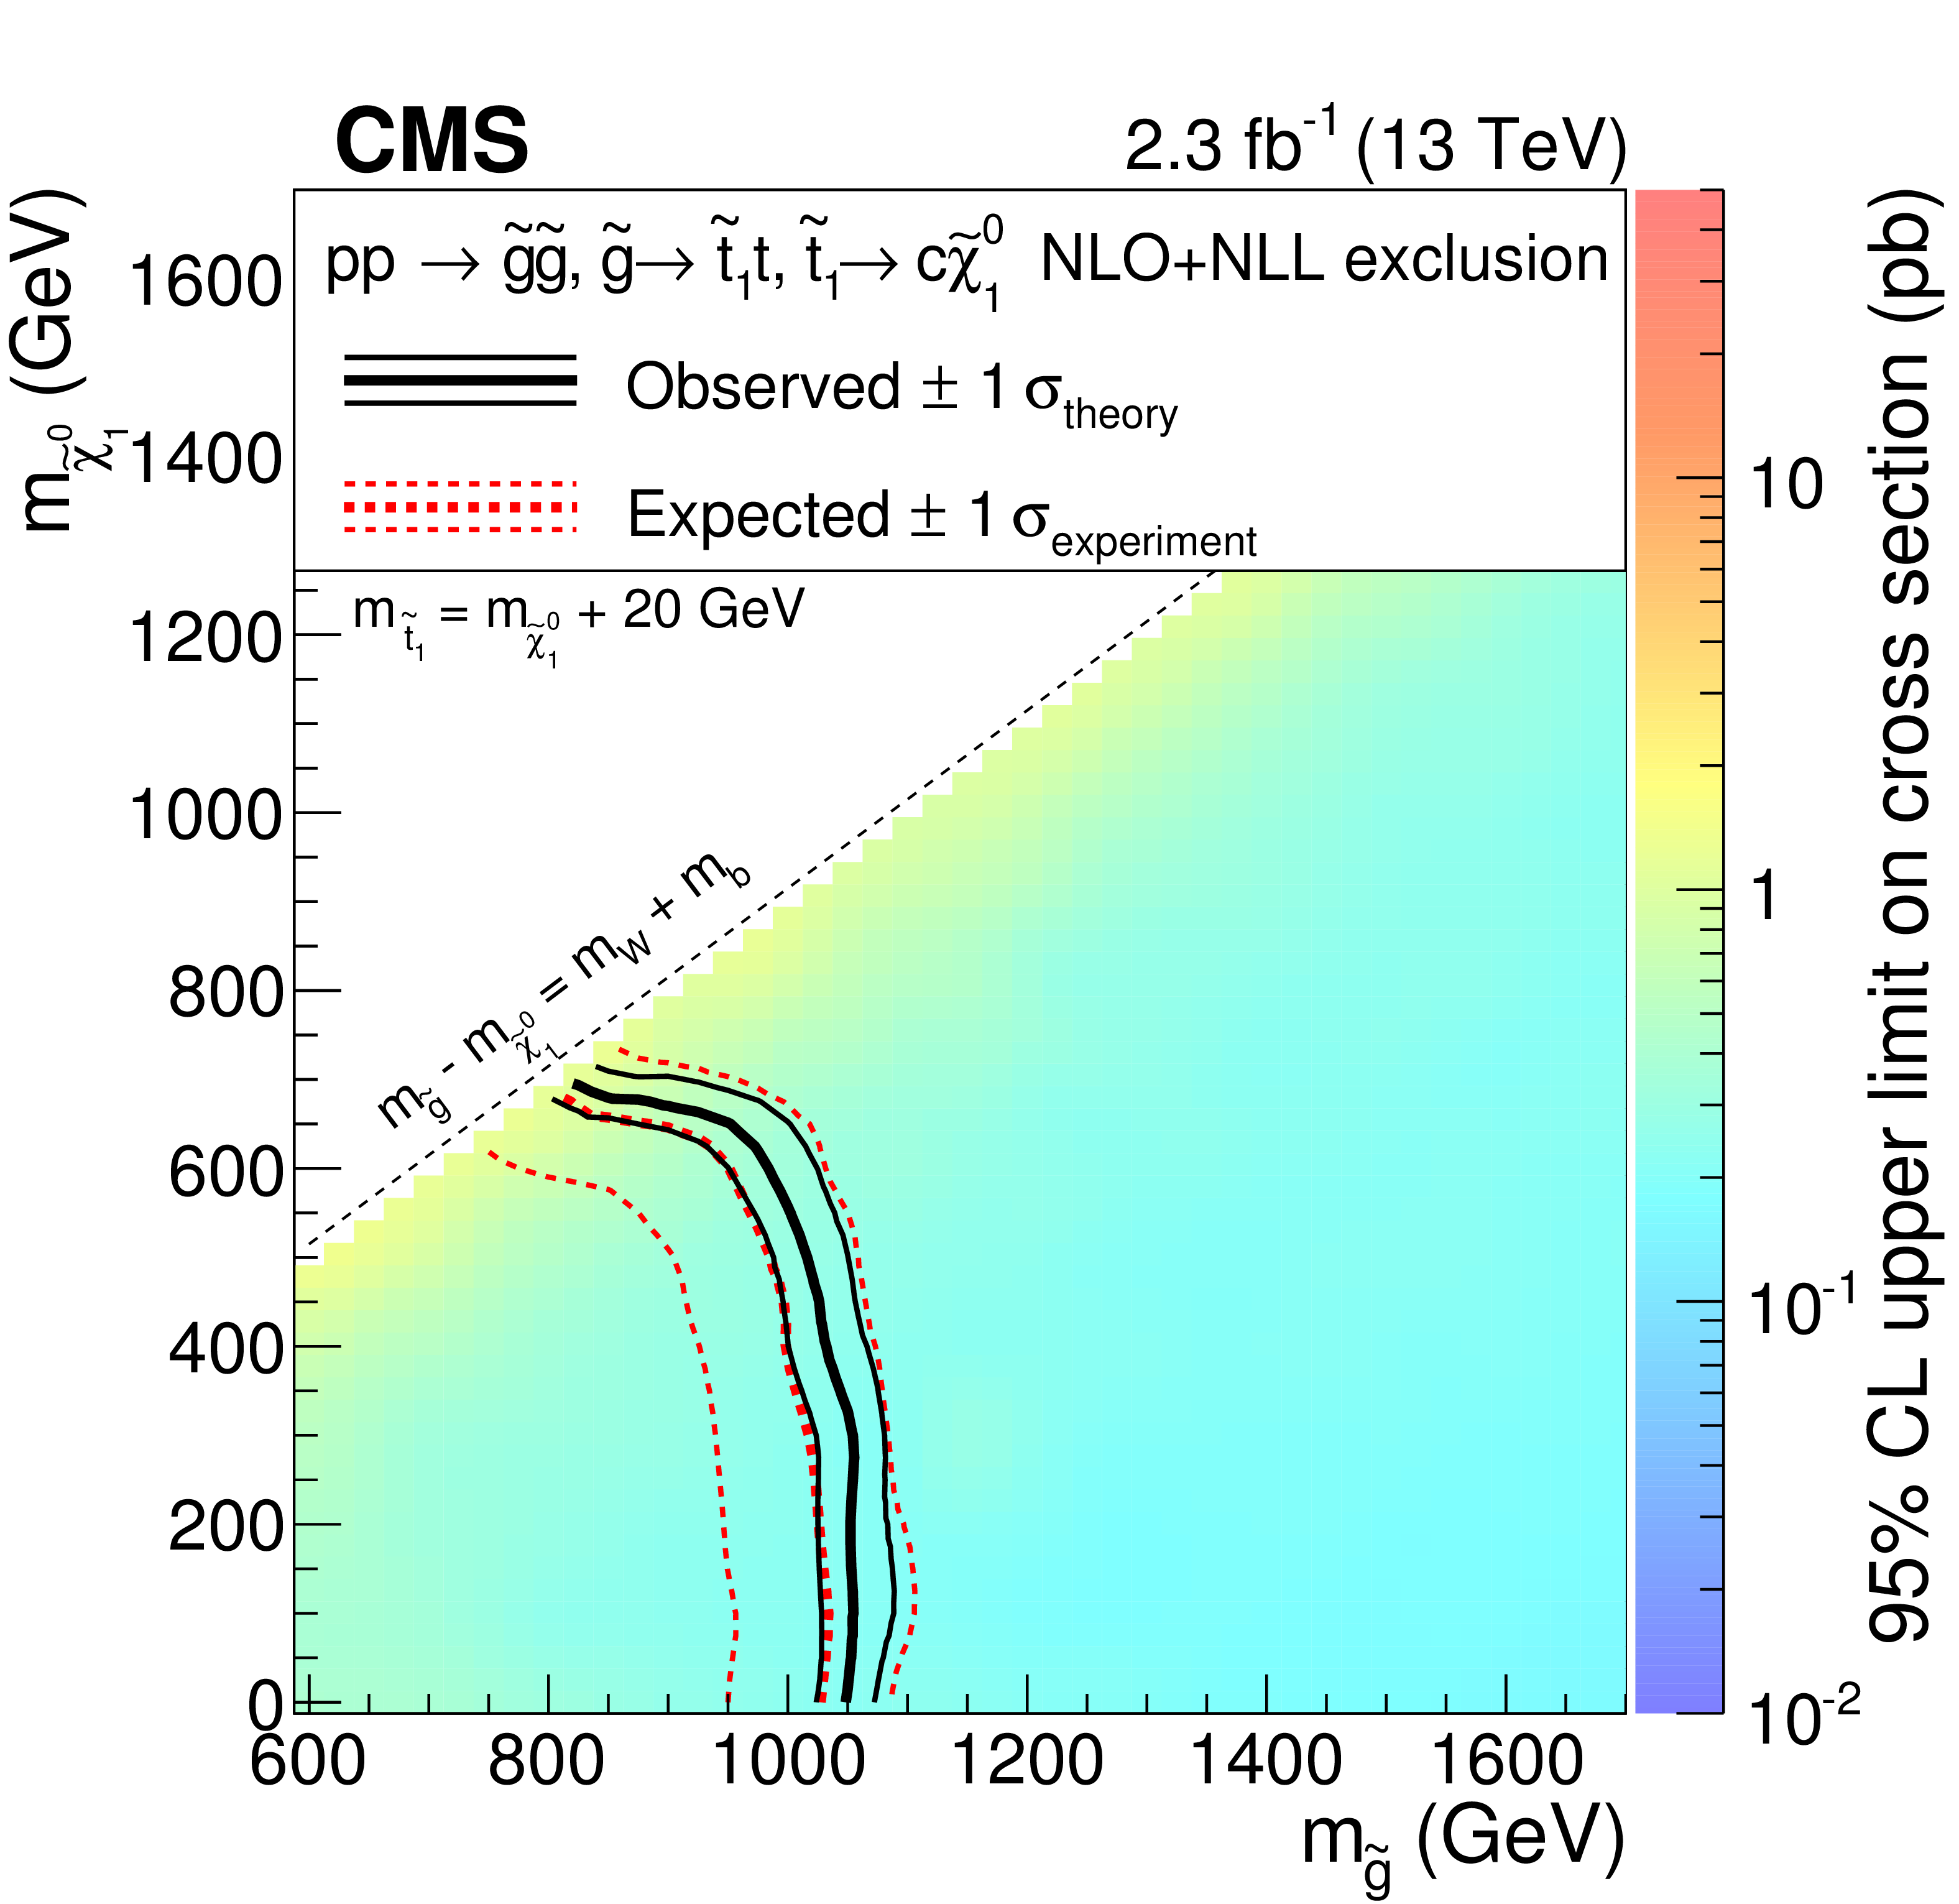
Figure 5-c:
Exclusion regions at the 95% CL in the plane of $m_{ {\tilde{\chi}^0_1} }$ versus $m_{ \mathrm{ \tilde{g} } }$ for models with the gluino decaying to an on-shell top squark: T5tttt with $m_{ \mathrm{ \tilde{t}_1 } } = m_{ {\tilde{\chi}^0_1} } + m_{\rm t}$(top), T5tttt with $m_{ \mathrm{ \tilde{t}_1 } } = m_{ {\tilde{\chi}^0_1} }$ + 20 GeV (bottom left), and T5ttcc with $m_{ \mathrm{ \tilde{t}_1 } } = m_{ {\tilde{\chi}^0_1} }$ + 20 GeV (bottom right). For a description of the notation, see Fig. 4. |
png pdf root |
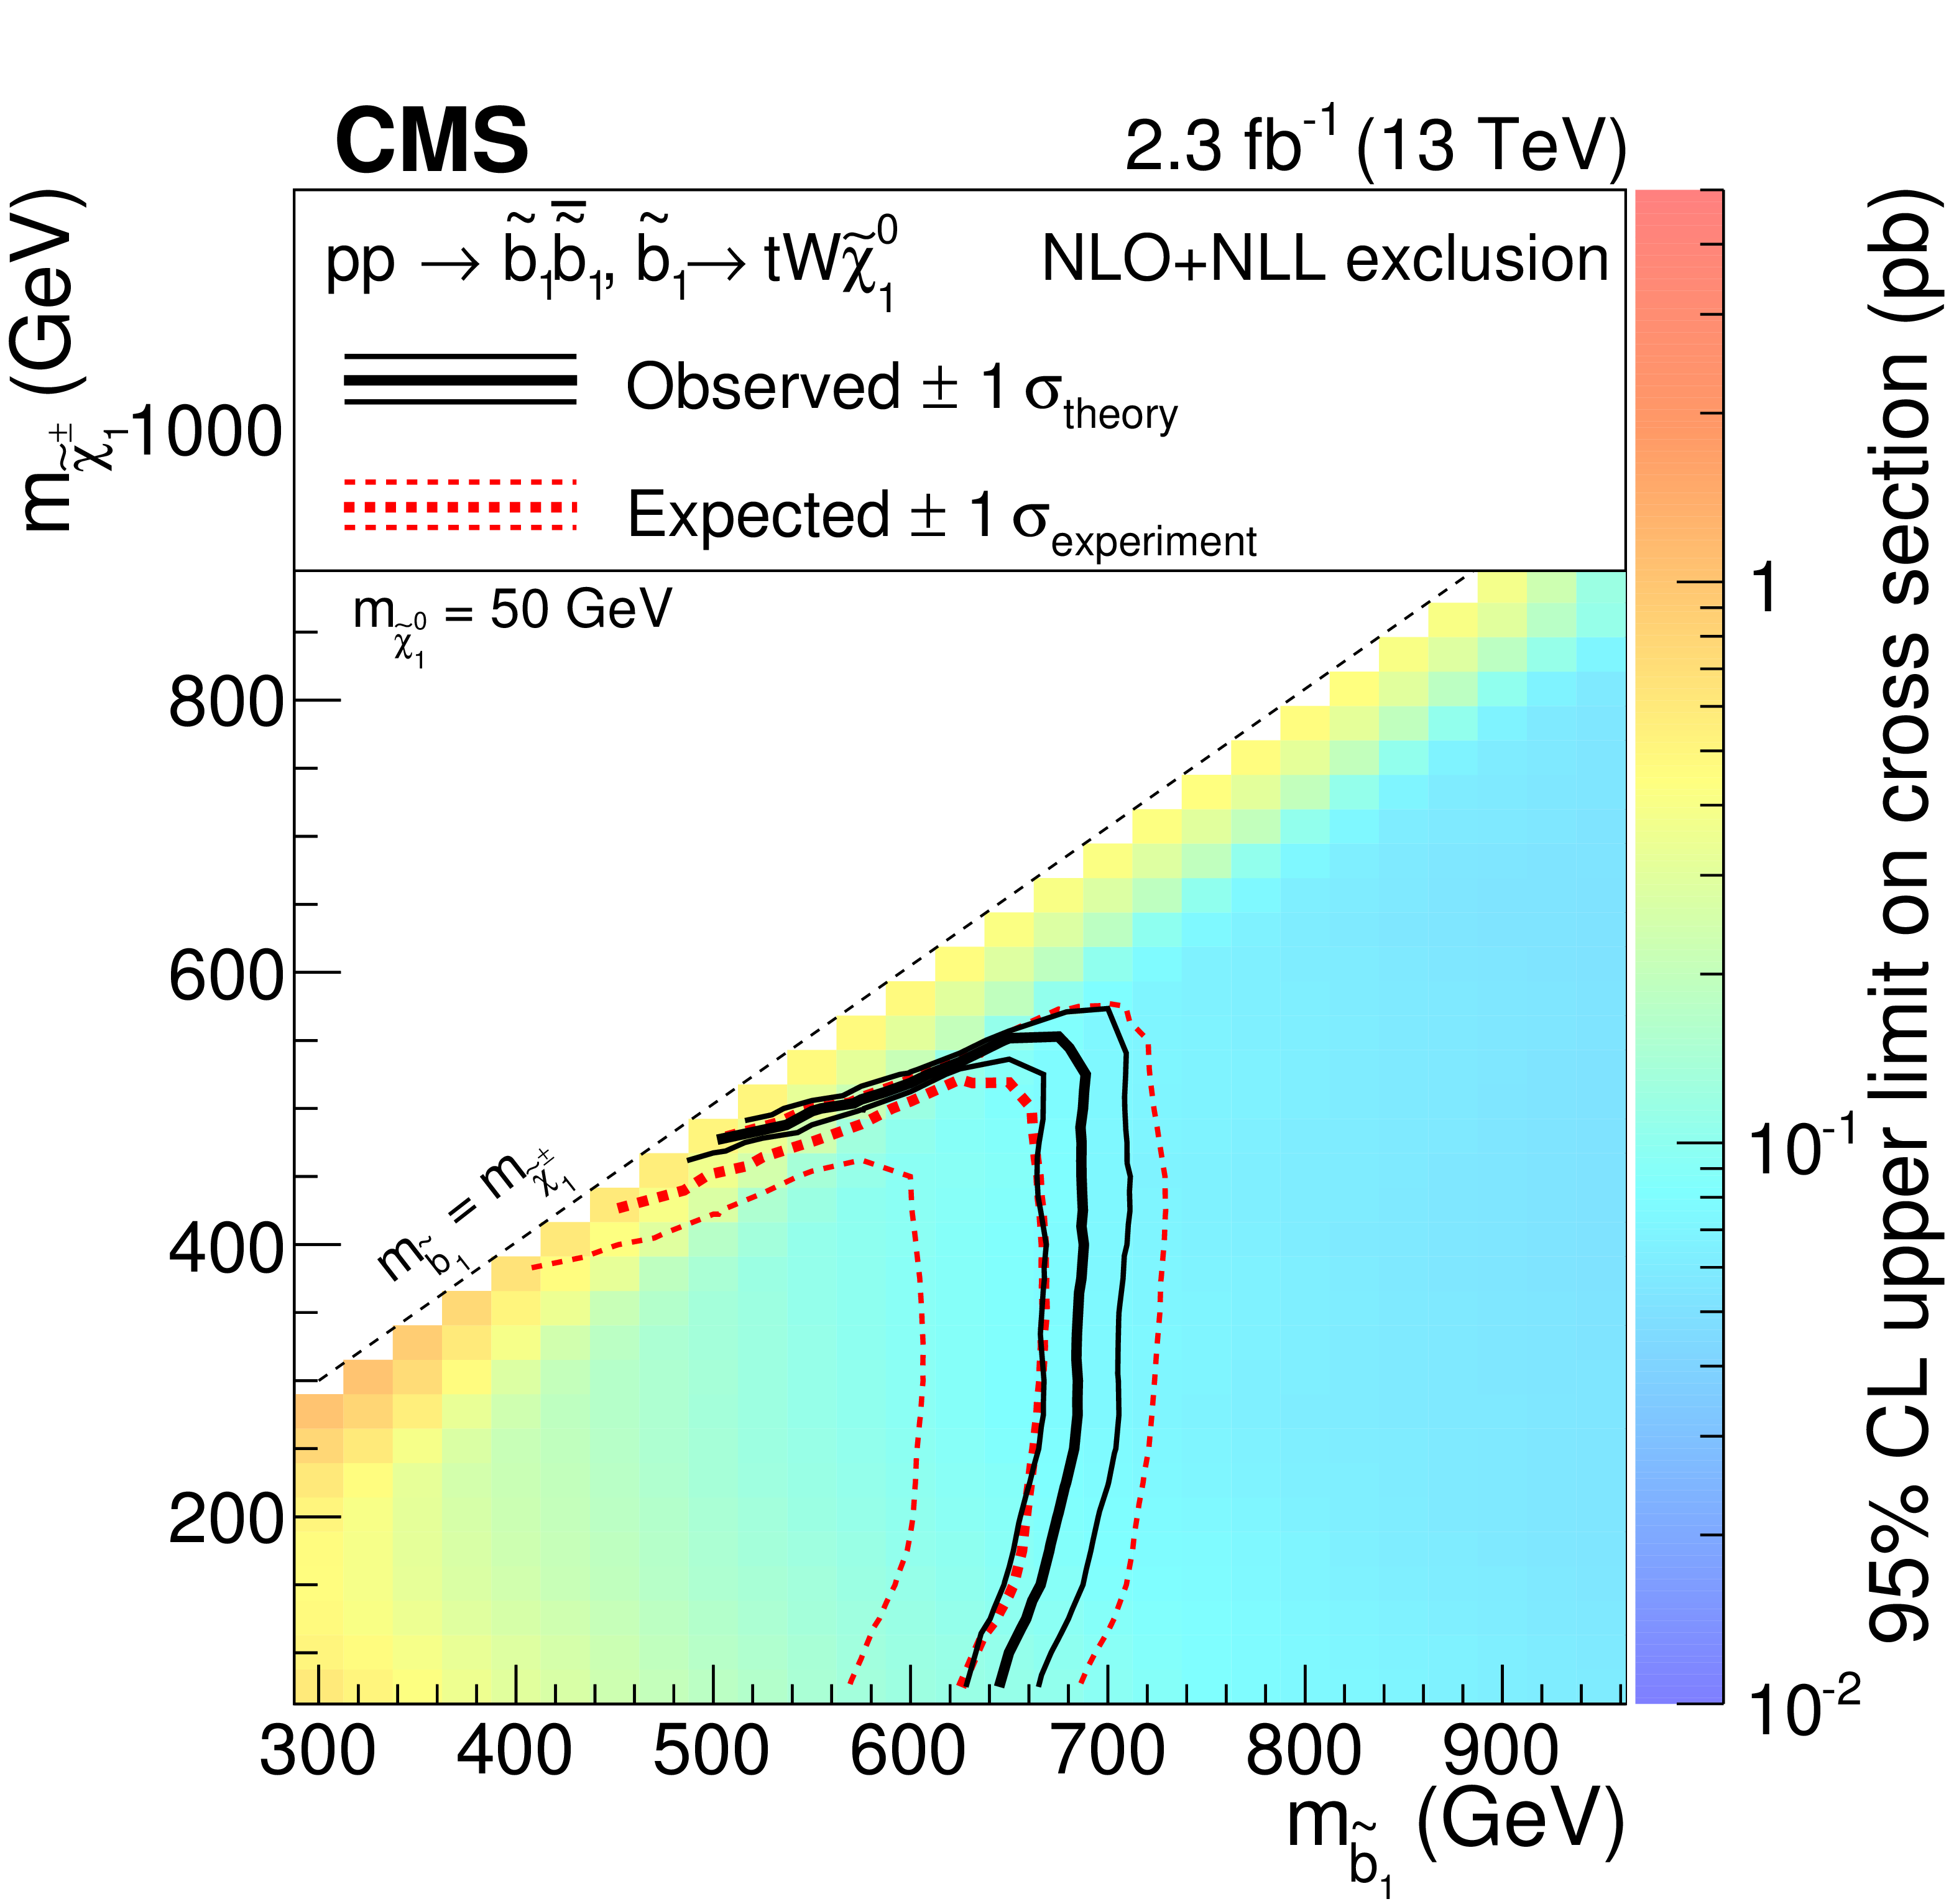
Figure 6:
Exclusion regions at the 95% CL in the plane of $m_{ {\tilde{\chi}^\pm _1} }$ versus $m_{ \mathrm{ \tilde{b}_1 } }$ for the T6ttWW model with $m_{ {\tilde{\chi}^0_1} }= $ 50 GeV. For a description of the notation, see Fig. 4. |

png pdf root |
Figure 7-a:
Exclusion regions at the 95% CL in the plane of $m_{ {\tilde{\chi}^0_1} }$ versus $m_{ \mathrm{ \tilde{g} } }$ for the T5qqqqWW model with $m_{ {\tilde{\chi}^\pm _1} }= 0.5 (m_{ \mathrm{ \tilde{g} } } + m_{ {\tilde{\chi}^0_1} })$ (a) and with $m_{ {\tilde{\chi}^\pm _1} } = m_{ {\tilde{\chi}^0_1} }$ + 20 GeV (b). For a description of the notation, see Fig. 4. |
png pdf root |
Figure 7-b:
Exclusion regions at the 95% CL in the plane of $m_{ {\tilde{\chi}^0_1} }$ versus $m_{ \mathrm{ \tilde{g} } }$ for the T5qqqqWW model with $m_{ {\tilde{\chi}^\pm _1} }= 0.5 (m_{ \mathrm{ \tilde{g} } } + m_{ {\tilde{\chi}^0_1} })$ (a) and with $m_{ {\tilde{\chi}^\pm _1} } = m_{ {\tilde{\chi}^0_1} }$ + 20 GeV (b). For a description of the notation, see Fig. 4. |
png pdf |
Figure 8-a:
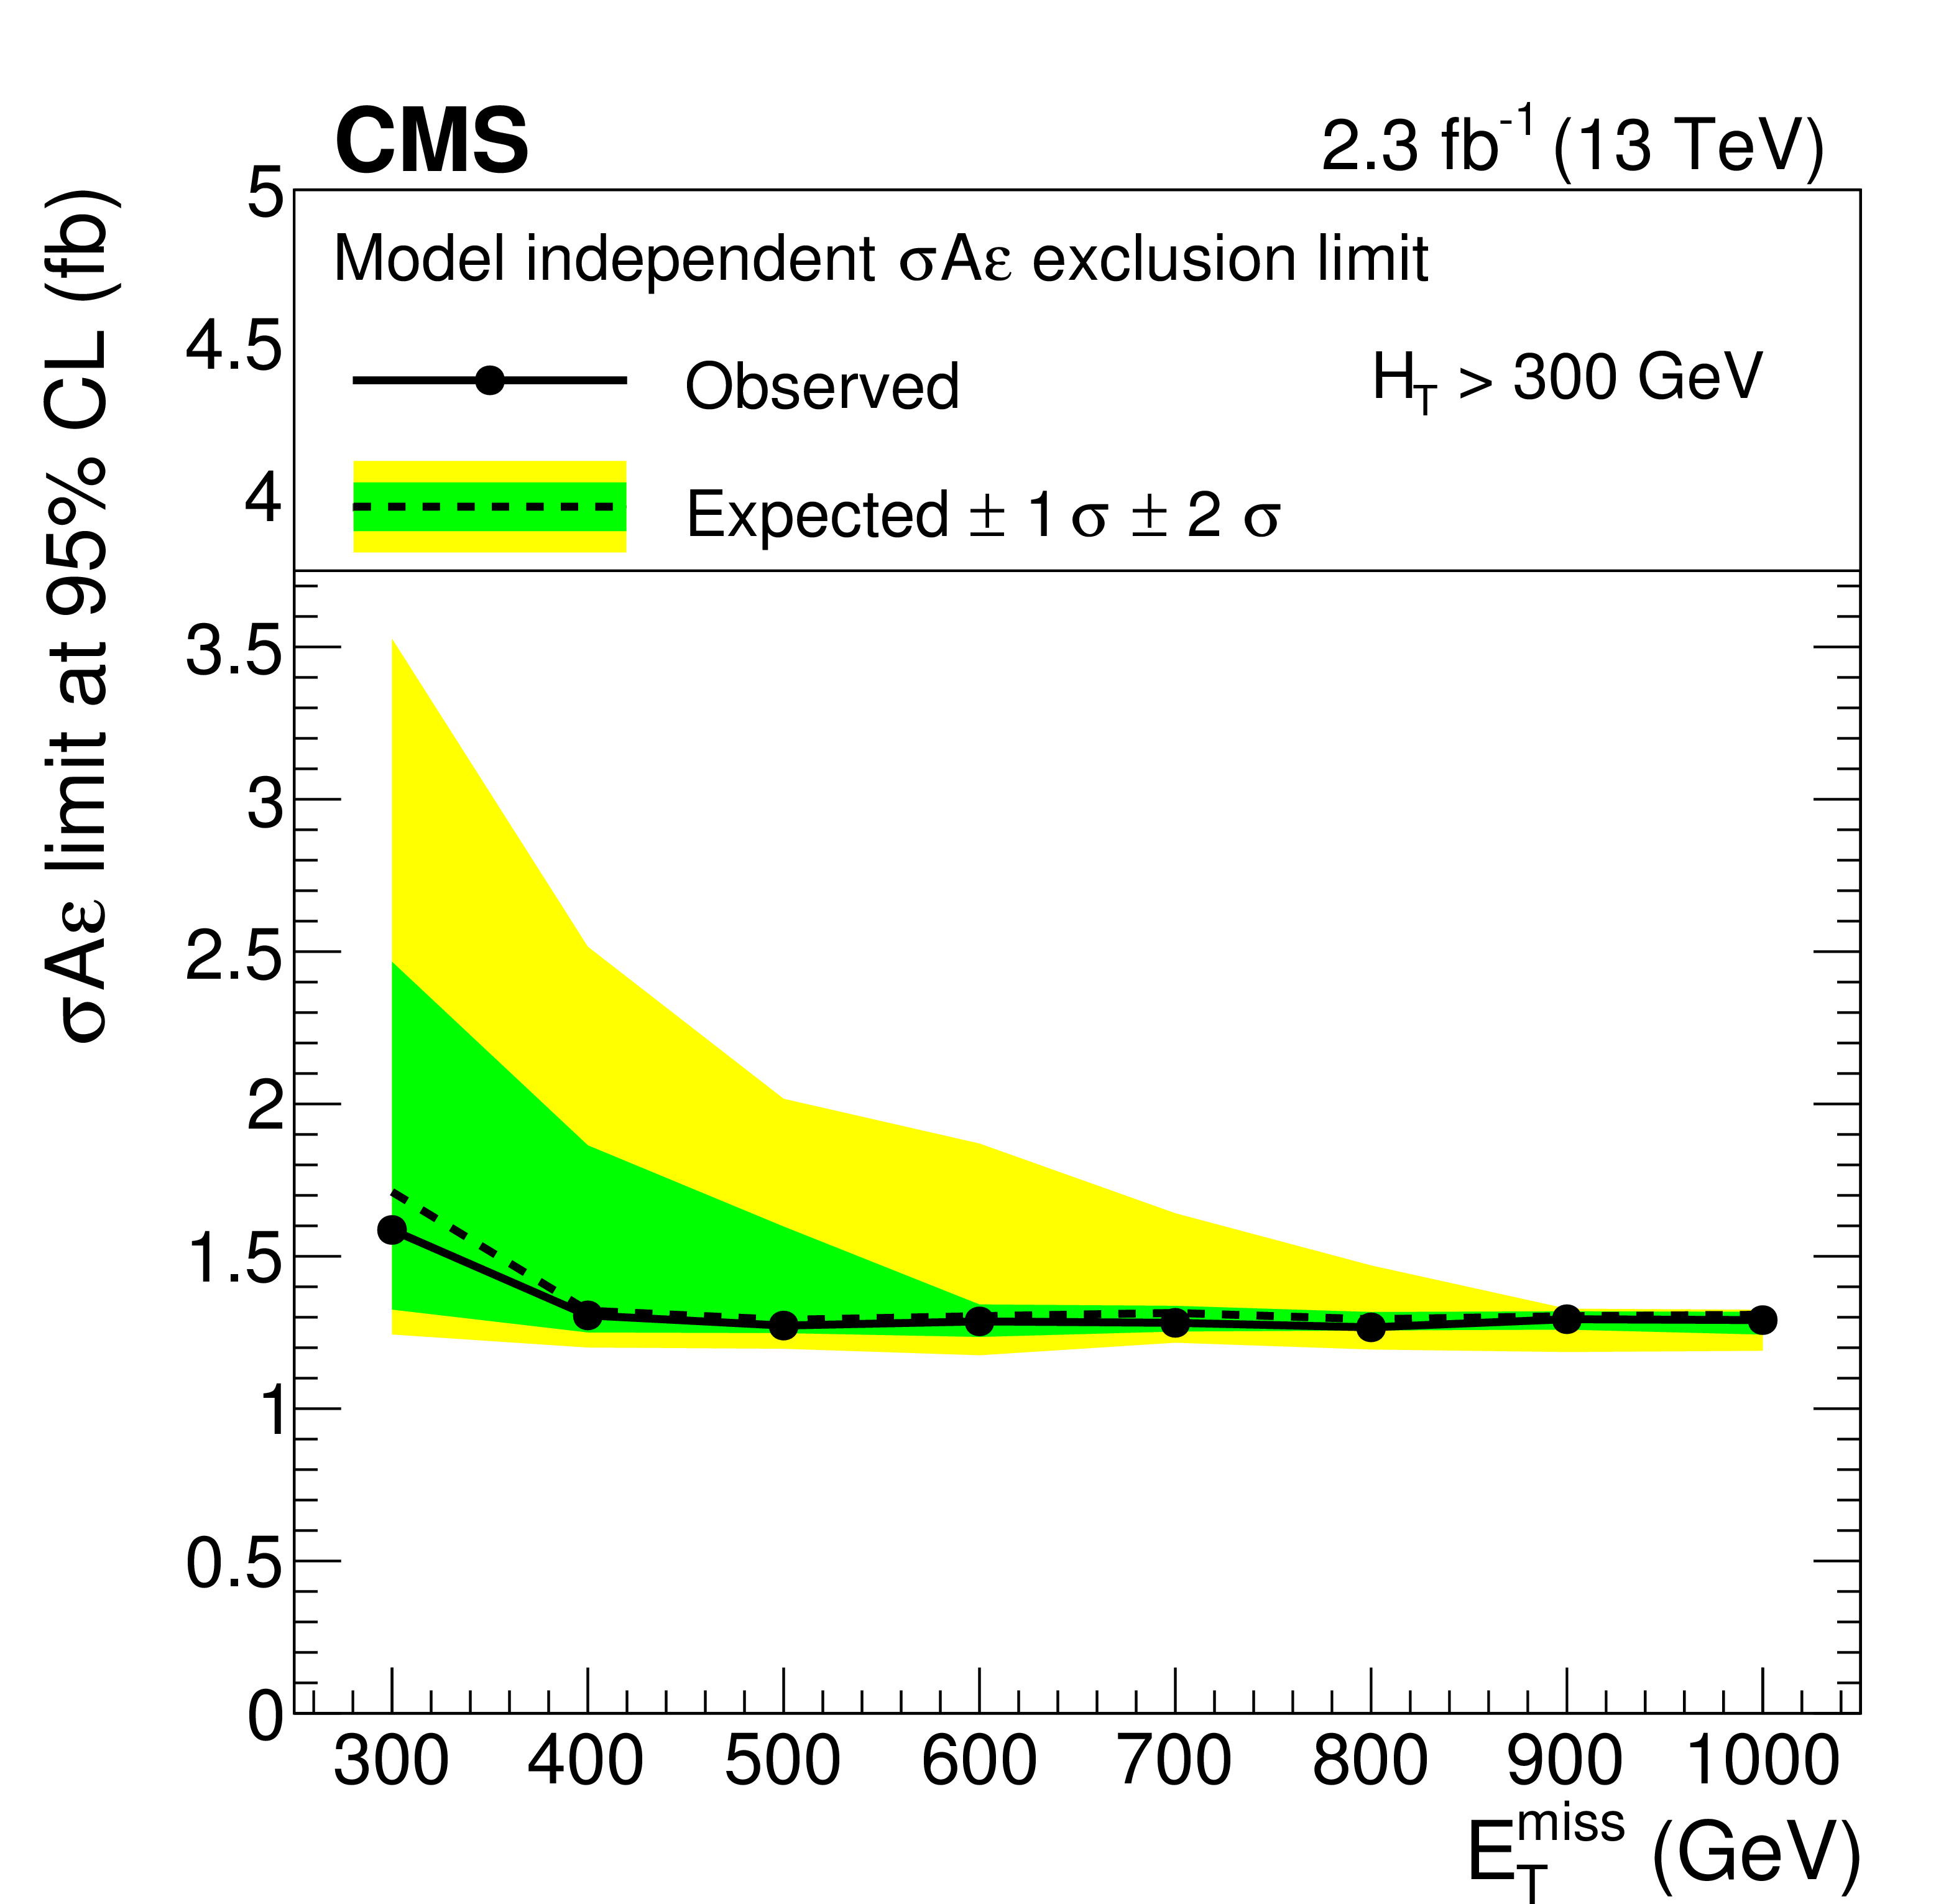
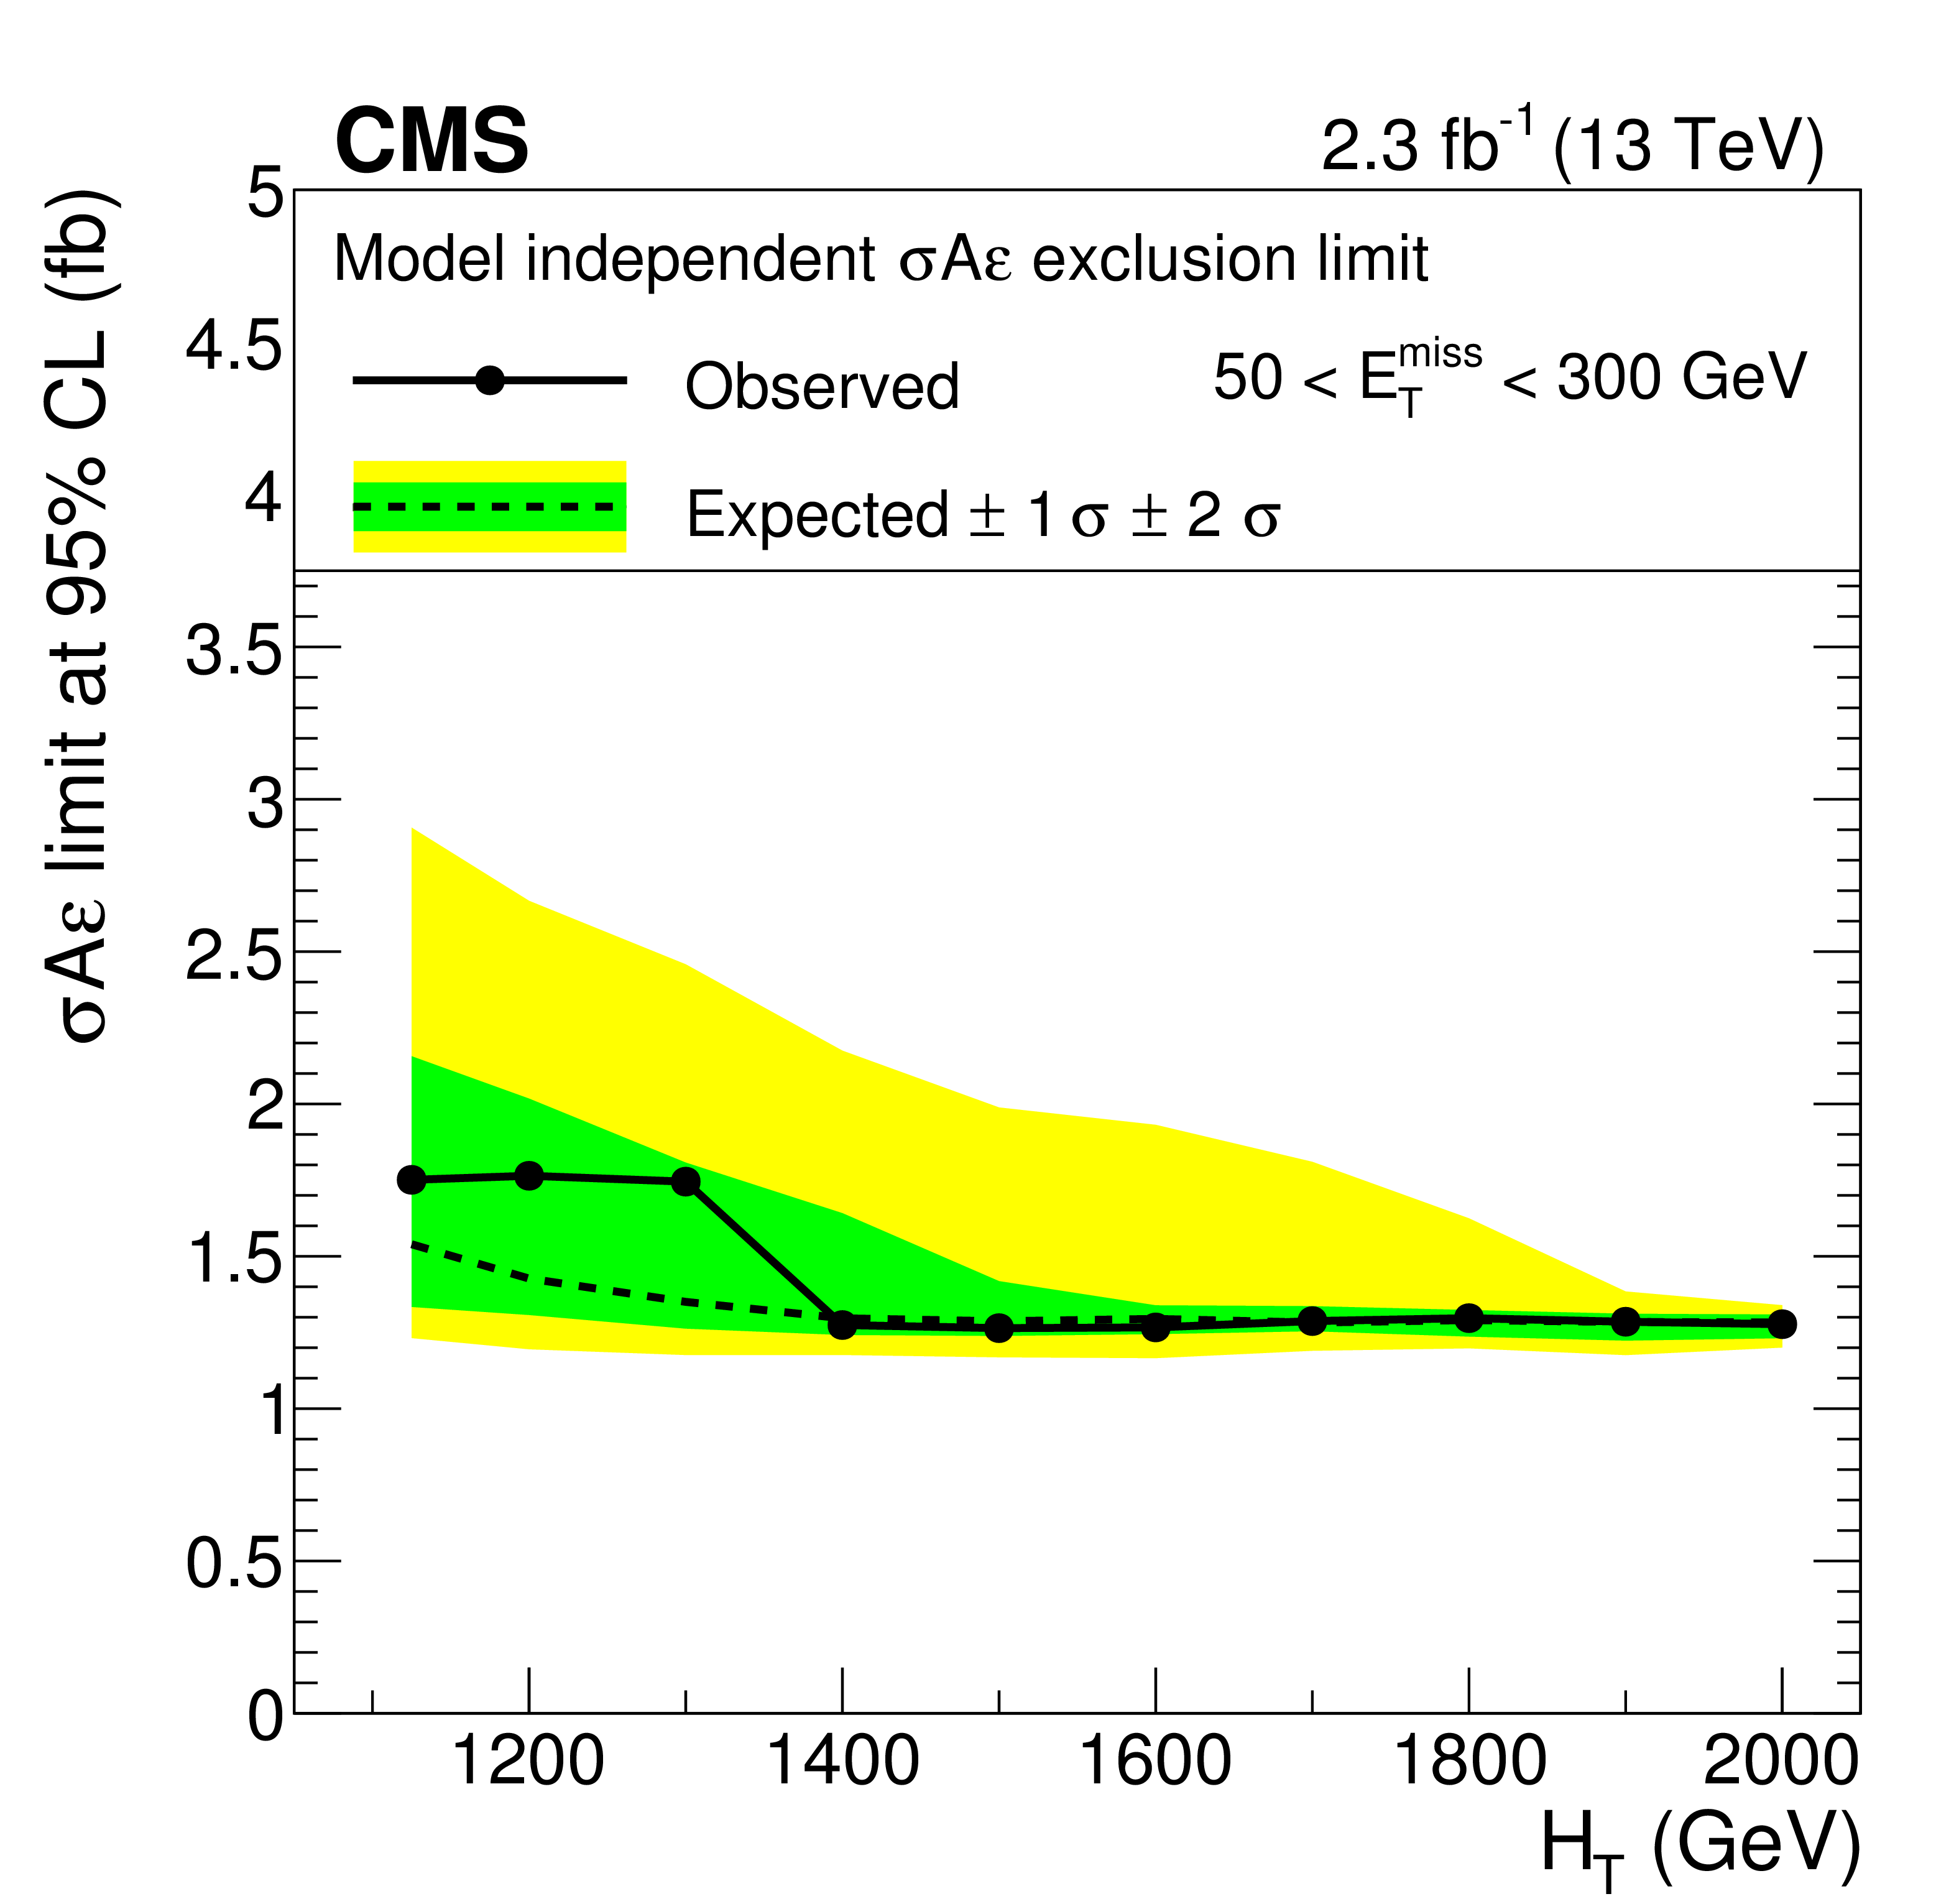
Limits on the product of cross section, detector acceptance, and selection efficiency, $\sigma \mathcal {A} \epsilon $, for the production of an SS dilepton pair as a function of ${E_{\mathrm {T}}^{\text {miss}}}$ in HH SR31(a) and of ${H_{\mathrm {T}}}$ in HH SR32 (b). |
png pdf |
Figure 8-b:
Limits on the product of cross section, detector acceptance, and selection efficiency, $\sigma \mathcal {A} \epsilon $, for the production of an SS dilepton pair as a function of ${E_{\mathrm {T}}^{\text {miss}}}$ in HH SR31(a) and of ${H_{\mathrm {T}}}$ in HH SR32 (b). |
| Tables | |
png pdf |
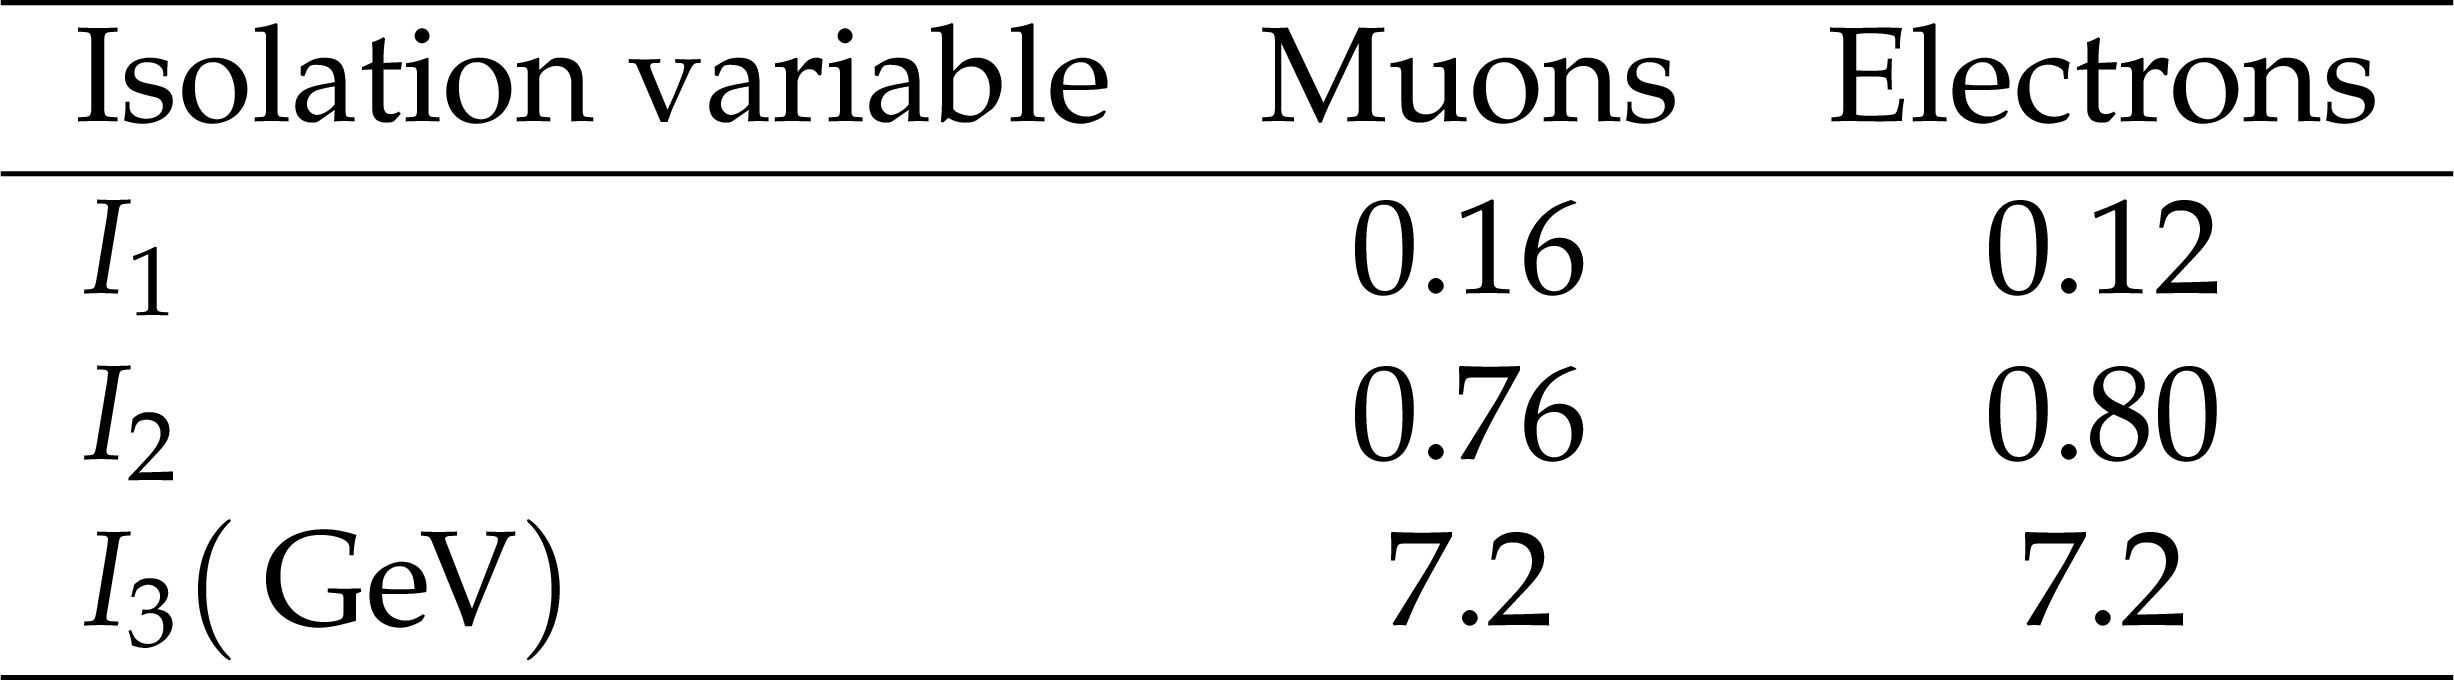
Table 1:
Values of the isolation parameters used in Eq.(4). |
png pdf |
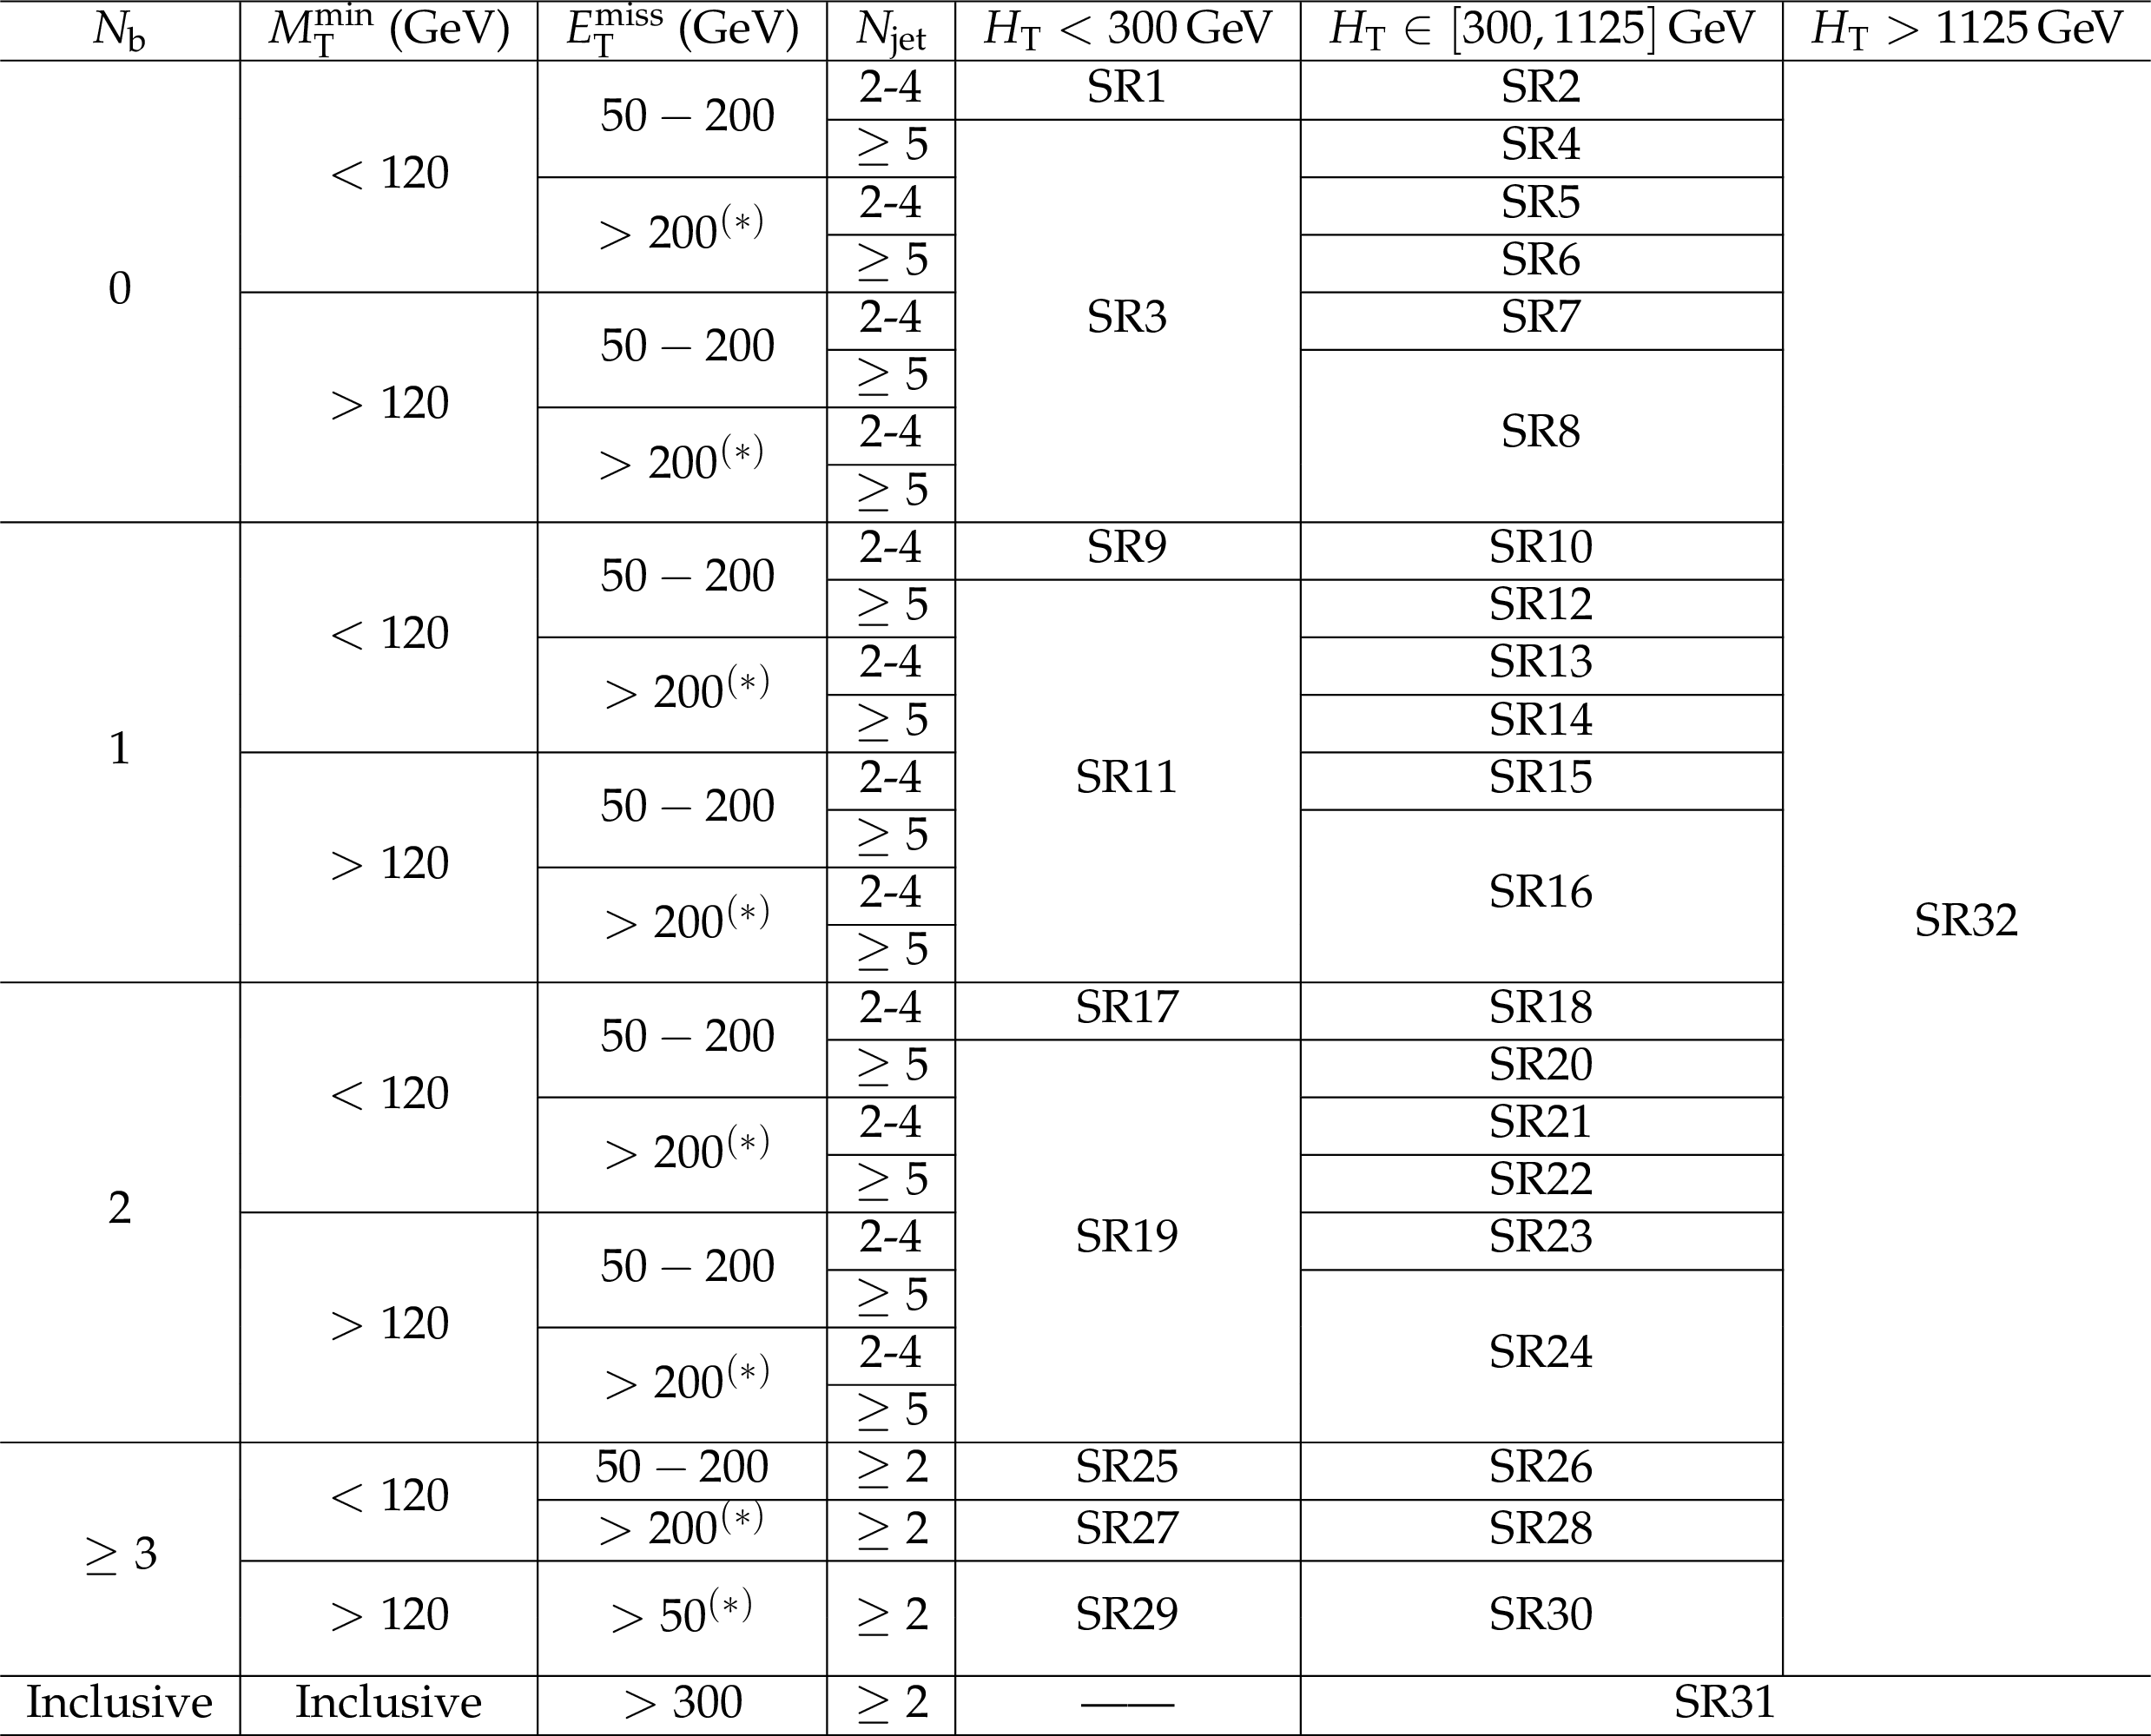
Table 2:
SR definitions for the HH selection. The notation $^{\rm (*)}$ indicates that, in order to avoid overlaps with SR31, an upper bound $ {E_{\mathrm {T}}^{\text {miss}}} < $ 300 GeV is used for regions with $ {H_{\mathrm {T}}} > $ 300 GeV. |

png pdf |
Table 3:
SR definitions for the HL selection. The notation $^{\rm (*)}$ indicates that, in order to avoid overlaps with SR25, an upper bound $ {E_{\mathrm {T}}^{\text {miss}}} < $ 300 GeV is used for regions with $ {H_{\mathrm {T}}} > $ 300 GeV. |

png pdf |
Table 4:
SR definitions for the LL selection. All SRs in this category require $ {N_\text {jet}} \geq$ 2. |

png pdf |
Table 5:
Summary of systematic uncertainties in the event yields in the SRs. The upper group lists uncertainties related to experimental factors for all processes whose yield is estimated from simulation; the middle group lists uncertainties in these yields related to the event simulation process itself. The lower group lists uncertainties for background processes whose yield is estimated from data. |
png pdf |
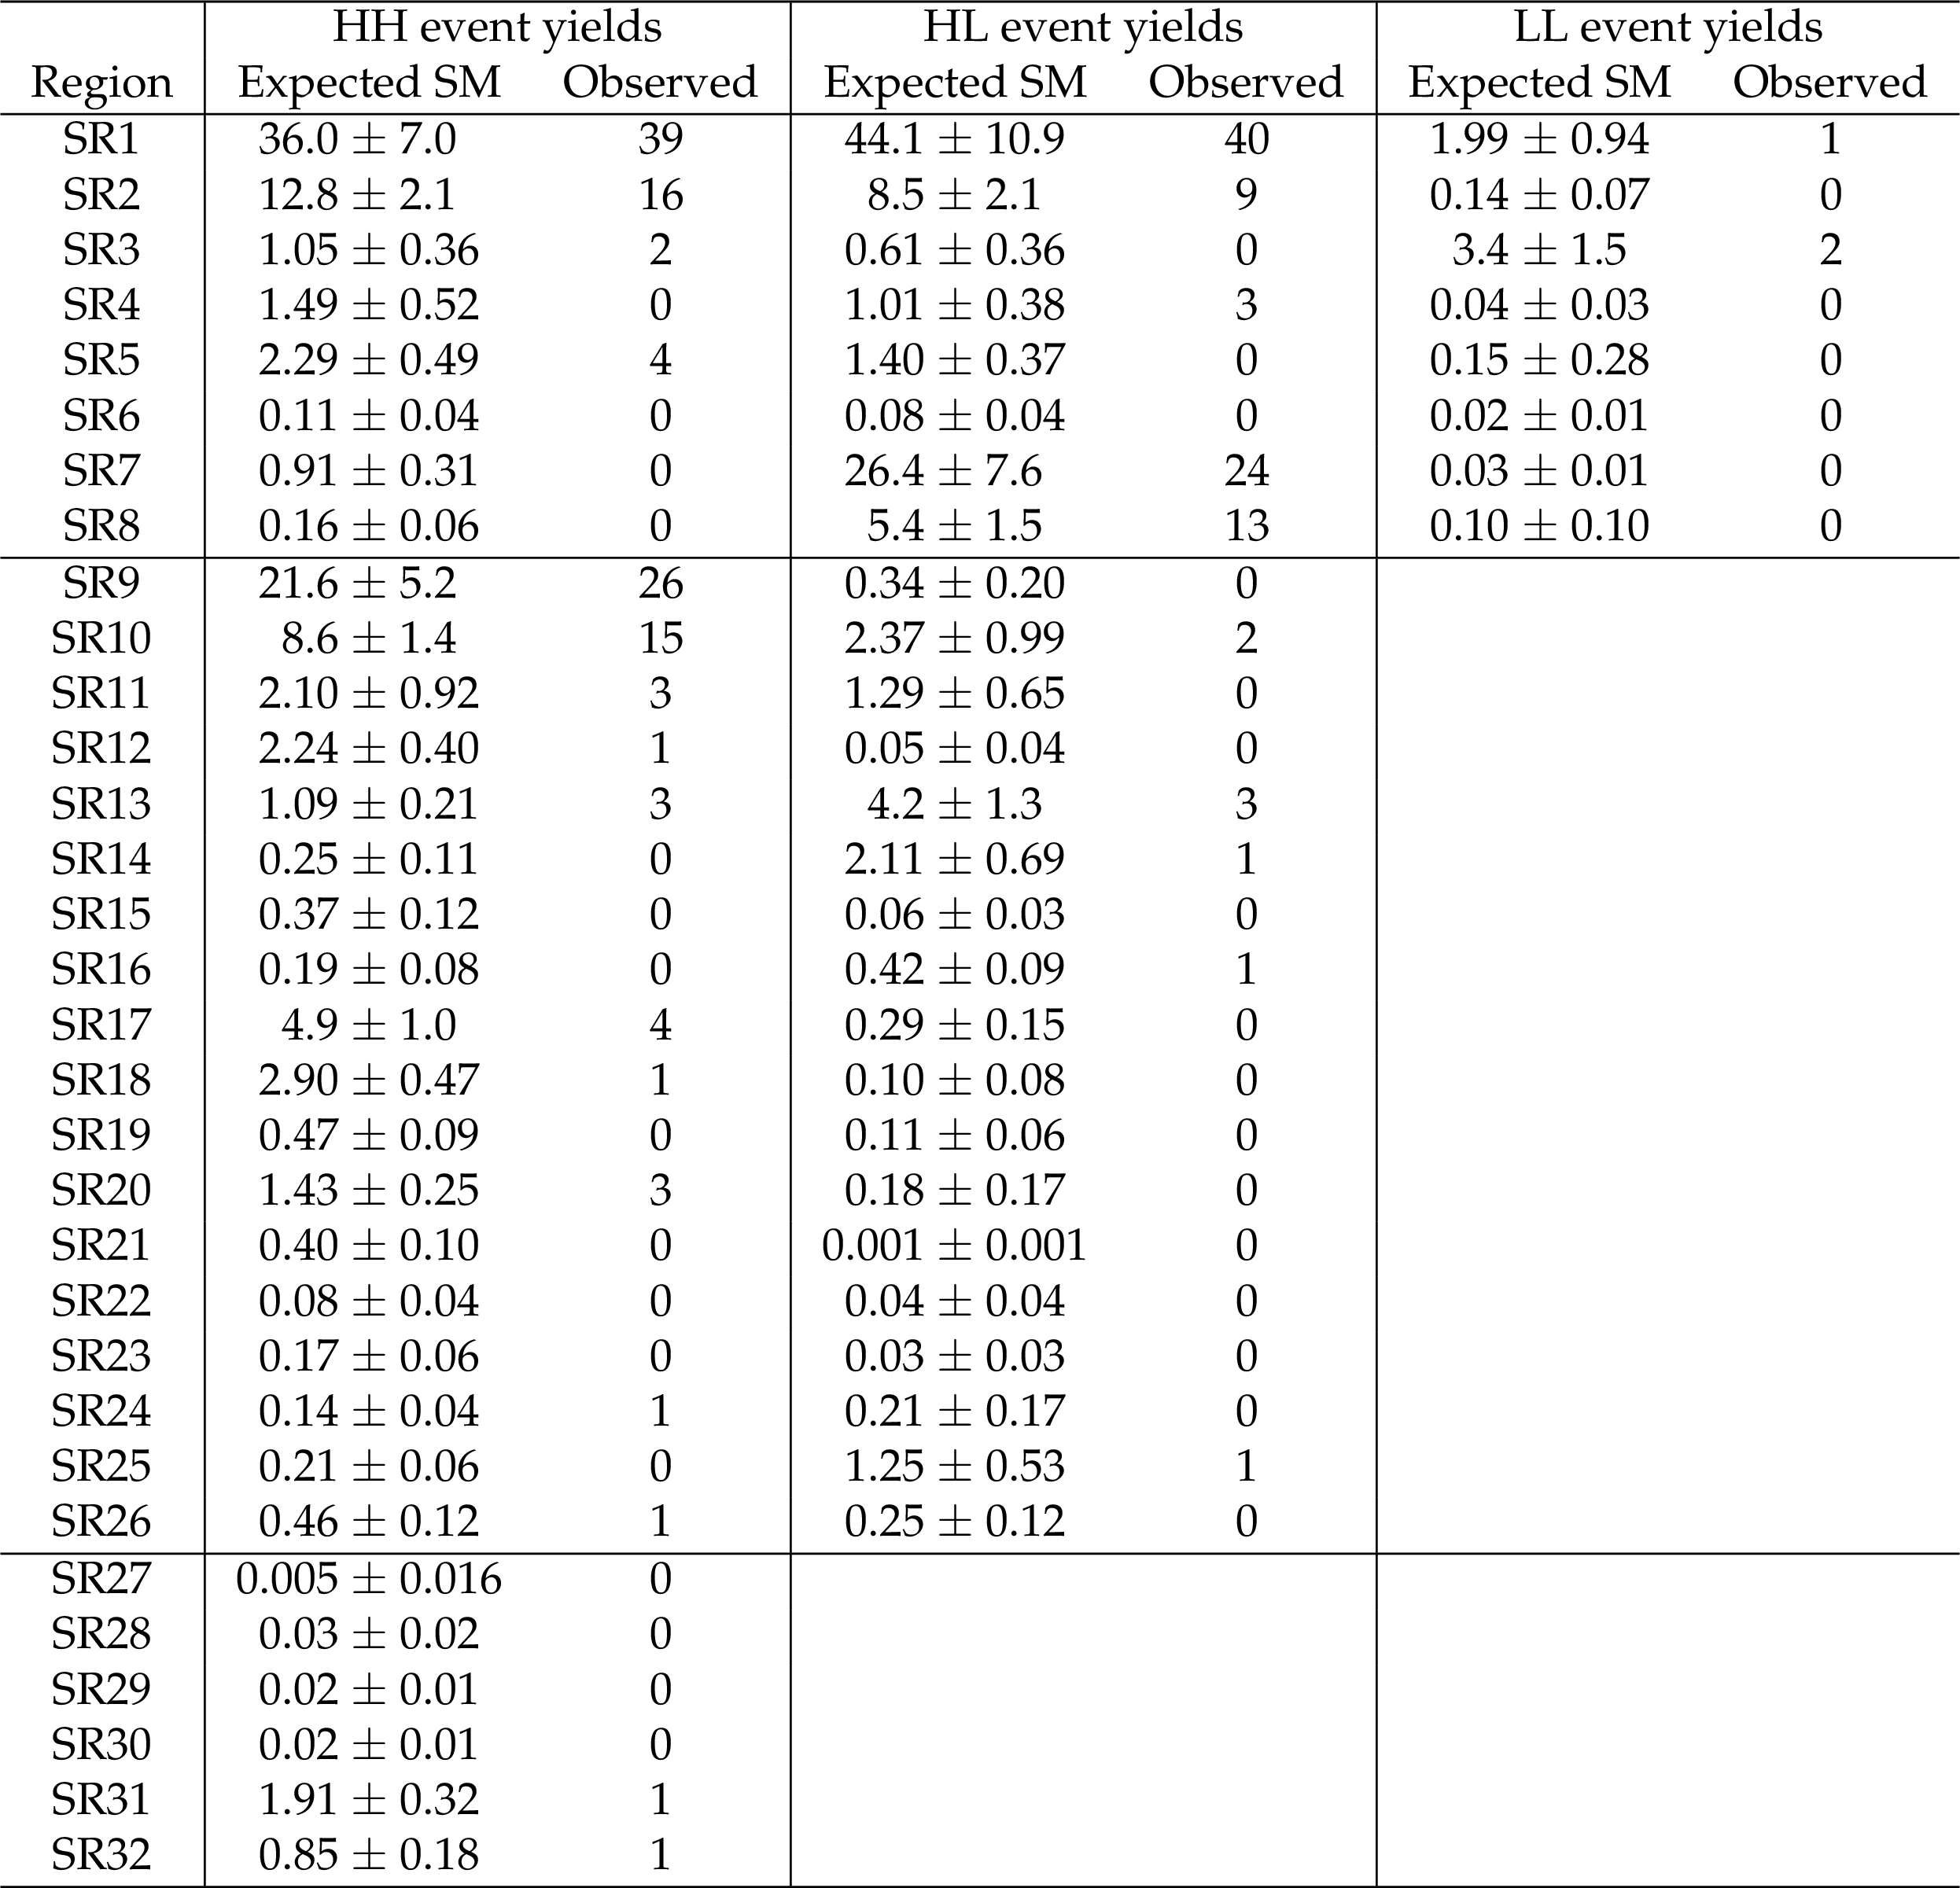
Table 6:
Expected number of background and observed events for the different SRs considered in this analysis. |
| Summary |
|
The results of a search for new physics in same-sign dilepton events using the CMS detector at the LHC and based on a data sample of pp collisions at $ \sqrt{s} = $ 13 TeV, corresponding to an integrated luminosity of 2.3 fb$^{-1}$, are presented. The data are analyzed in nonoverlapping signal regions defined with different selections on lepton and event kinematic variables, as well as jet and b quark jet multiplicities. No significant deviation from the standard model expectations is observed. The results are used to set limits on the production of supersymmetric particles in various simplified models. Gluino and bottom squark masses are excluded at the 95% confidence level up to 1300 and 680 GeV, respectively. These results extend the limits obtained in the previous version of the analysis [23] by about 250 GeV on the gluino mass, and 150 GeV on the bottom squark mass. In addition, 95% confidence level upper limits of 119 fb and 1.7 pb are set on the cross sections for the production of two top quark-antiquark pairs and for the production of two SS top quarks, respectively. Model independent limits and selection efficiencies are provided to allow further interpretations of the results, using alternative models to those examined here. |
| Additional Figures | |
png pdf |
Additional Figure 1:
Event yields in HH search regions. The hatched bars represent the total uncertainty in the background prediction. |
png pdf |
Additional Figure 2:
Event yields in HL search regions. The hatched bars represent the total uncertainty in the background prediction. |
png pdf |
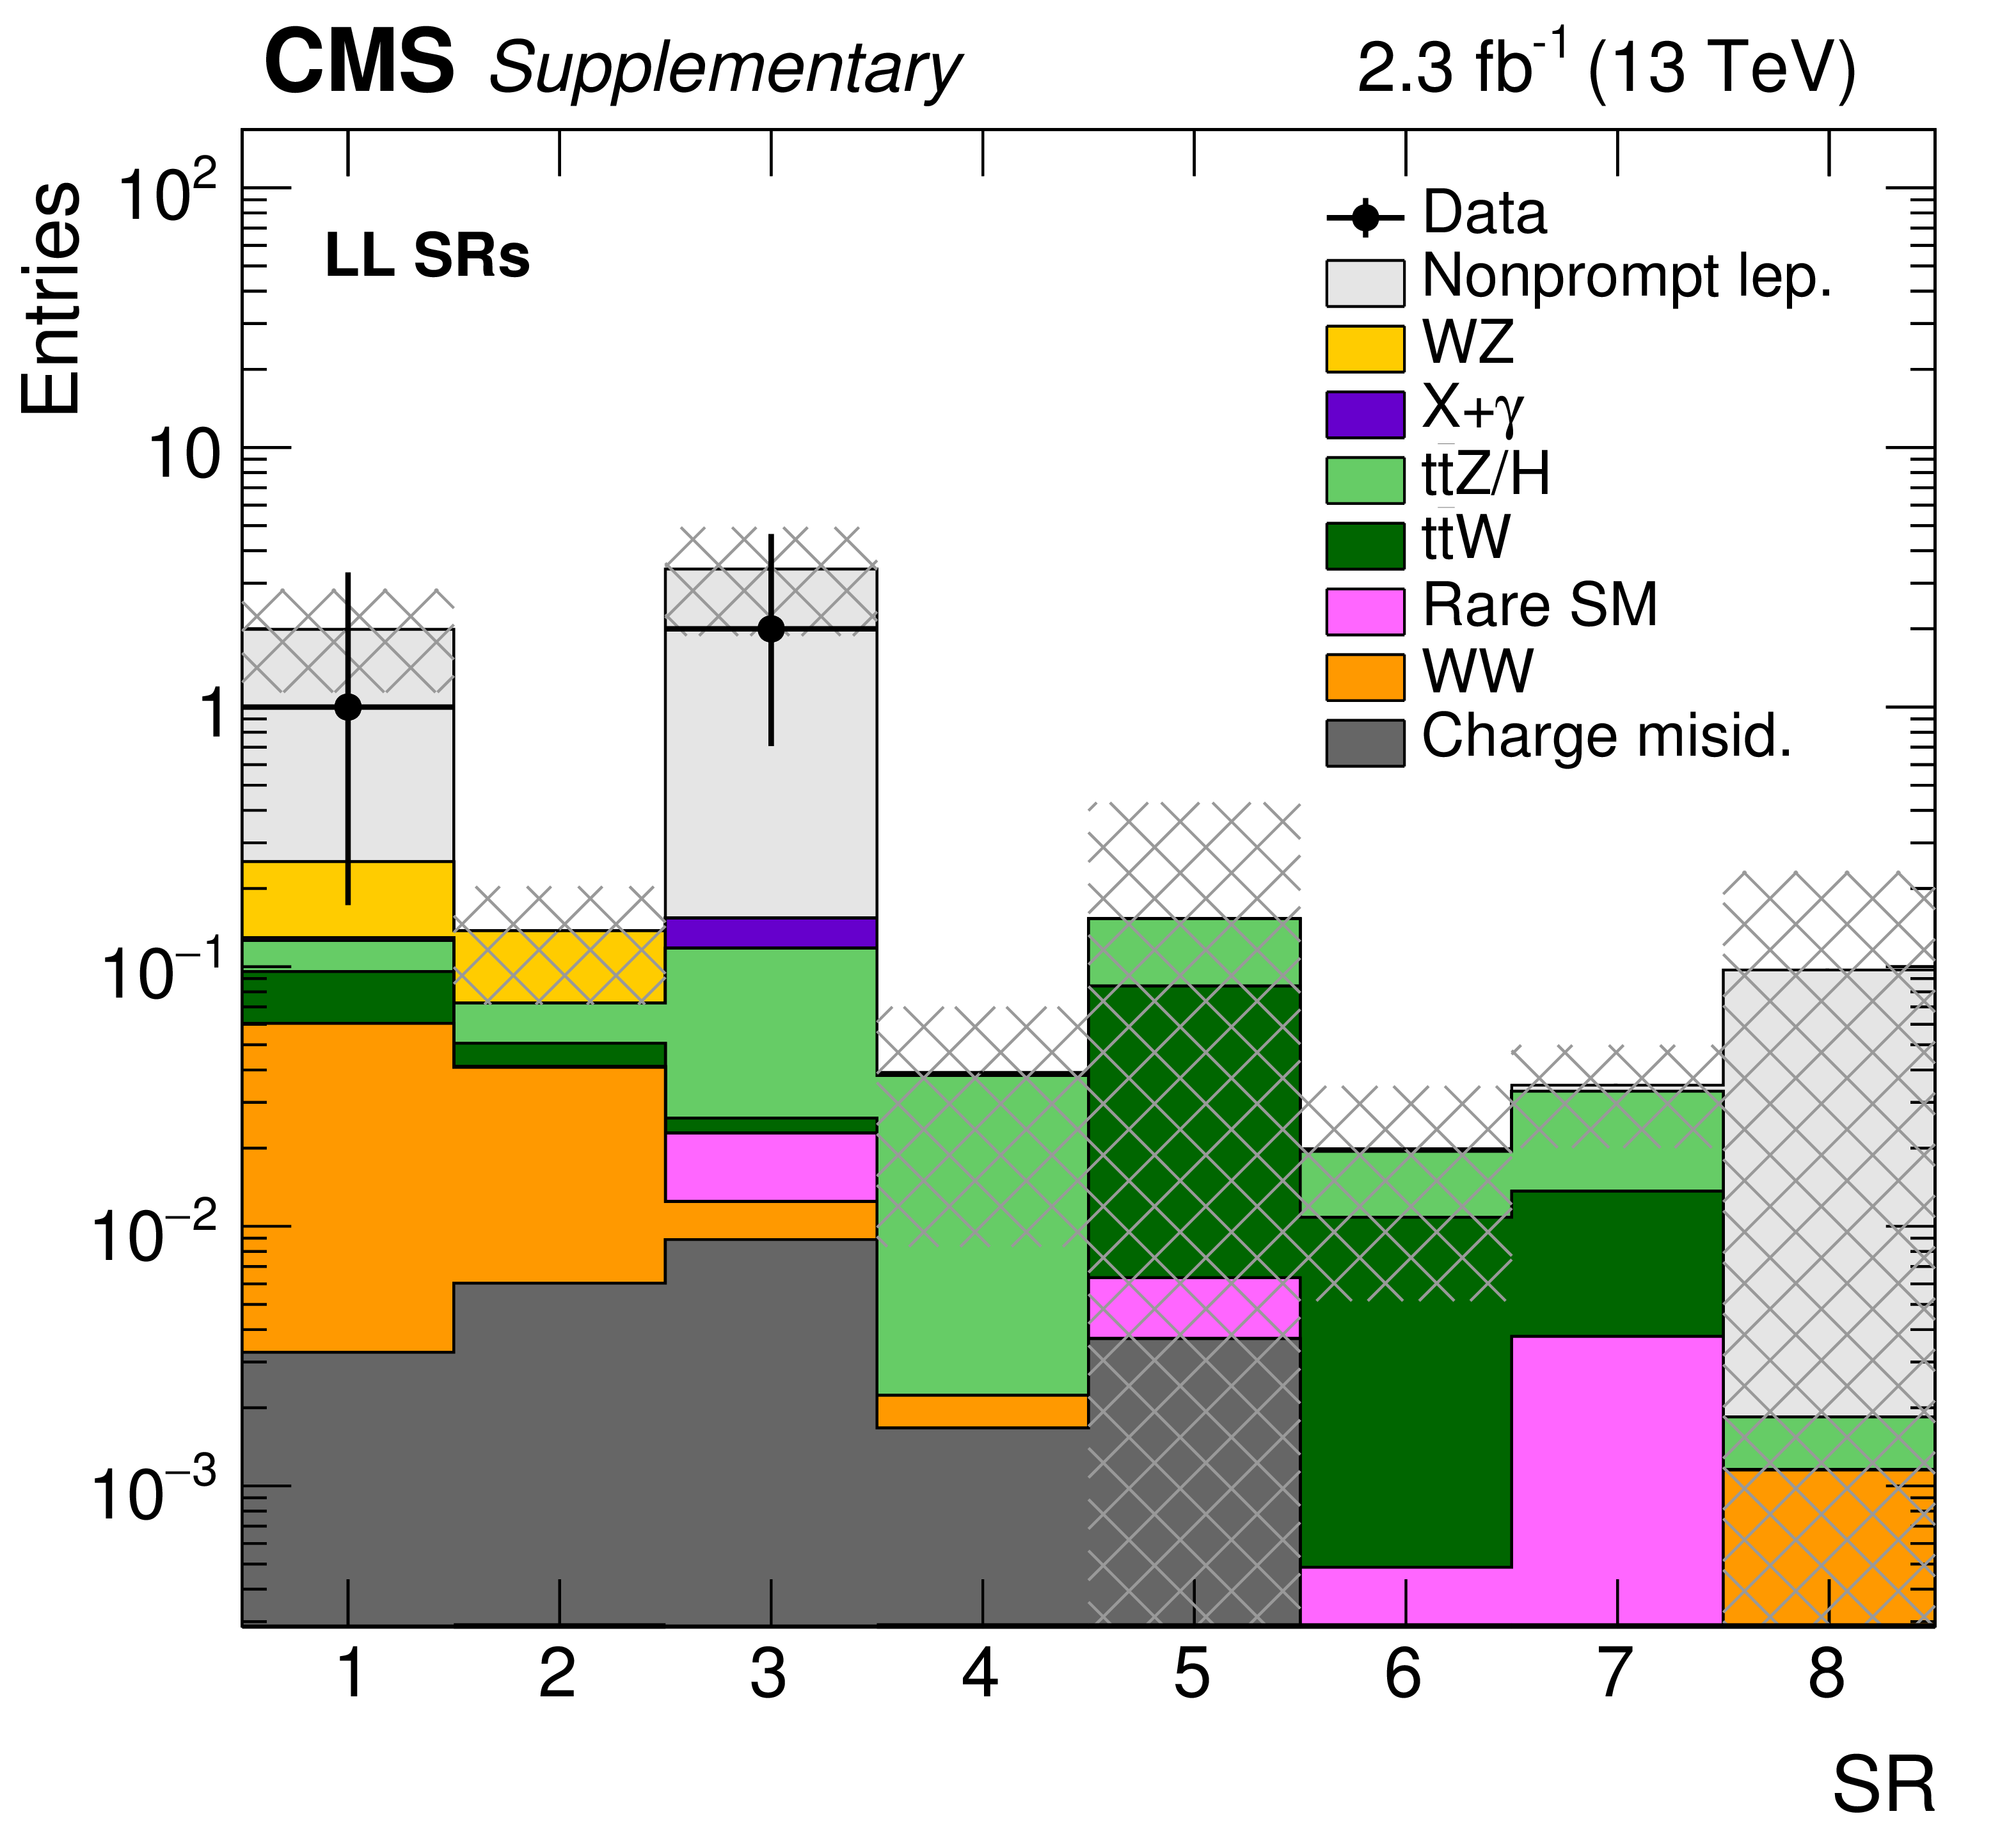
Additional Figure 3:
Event yields in LL search regions. The hatched bars represent the total uncertainty in the background prediction. |
png pdf |
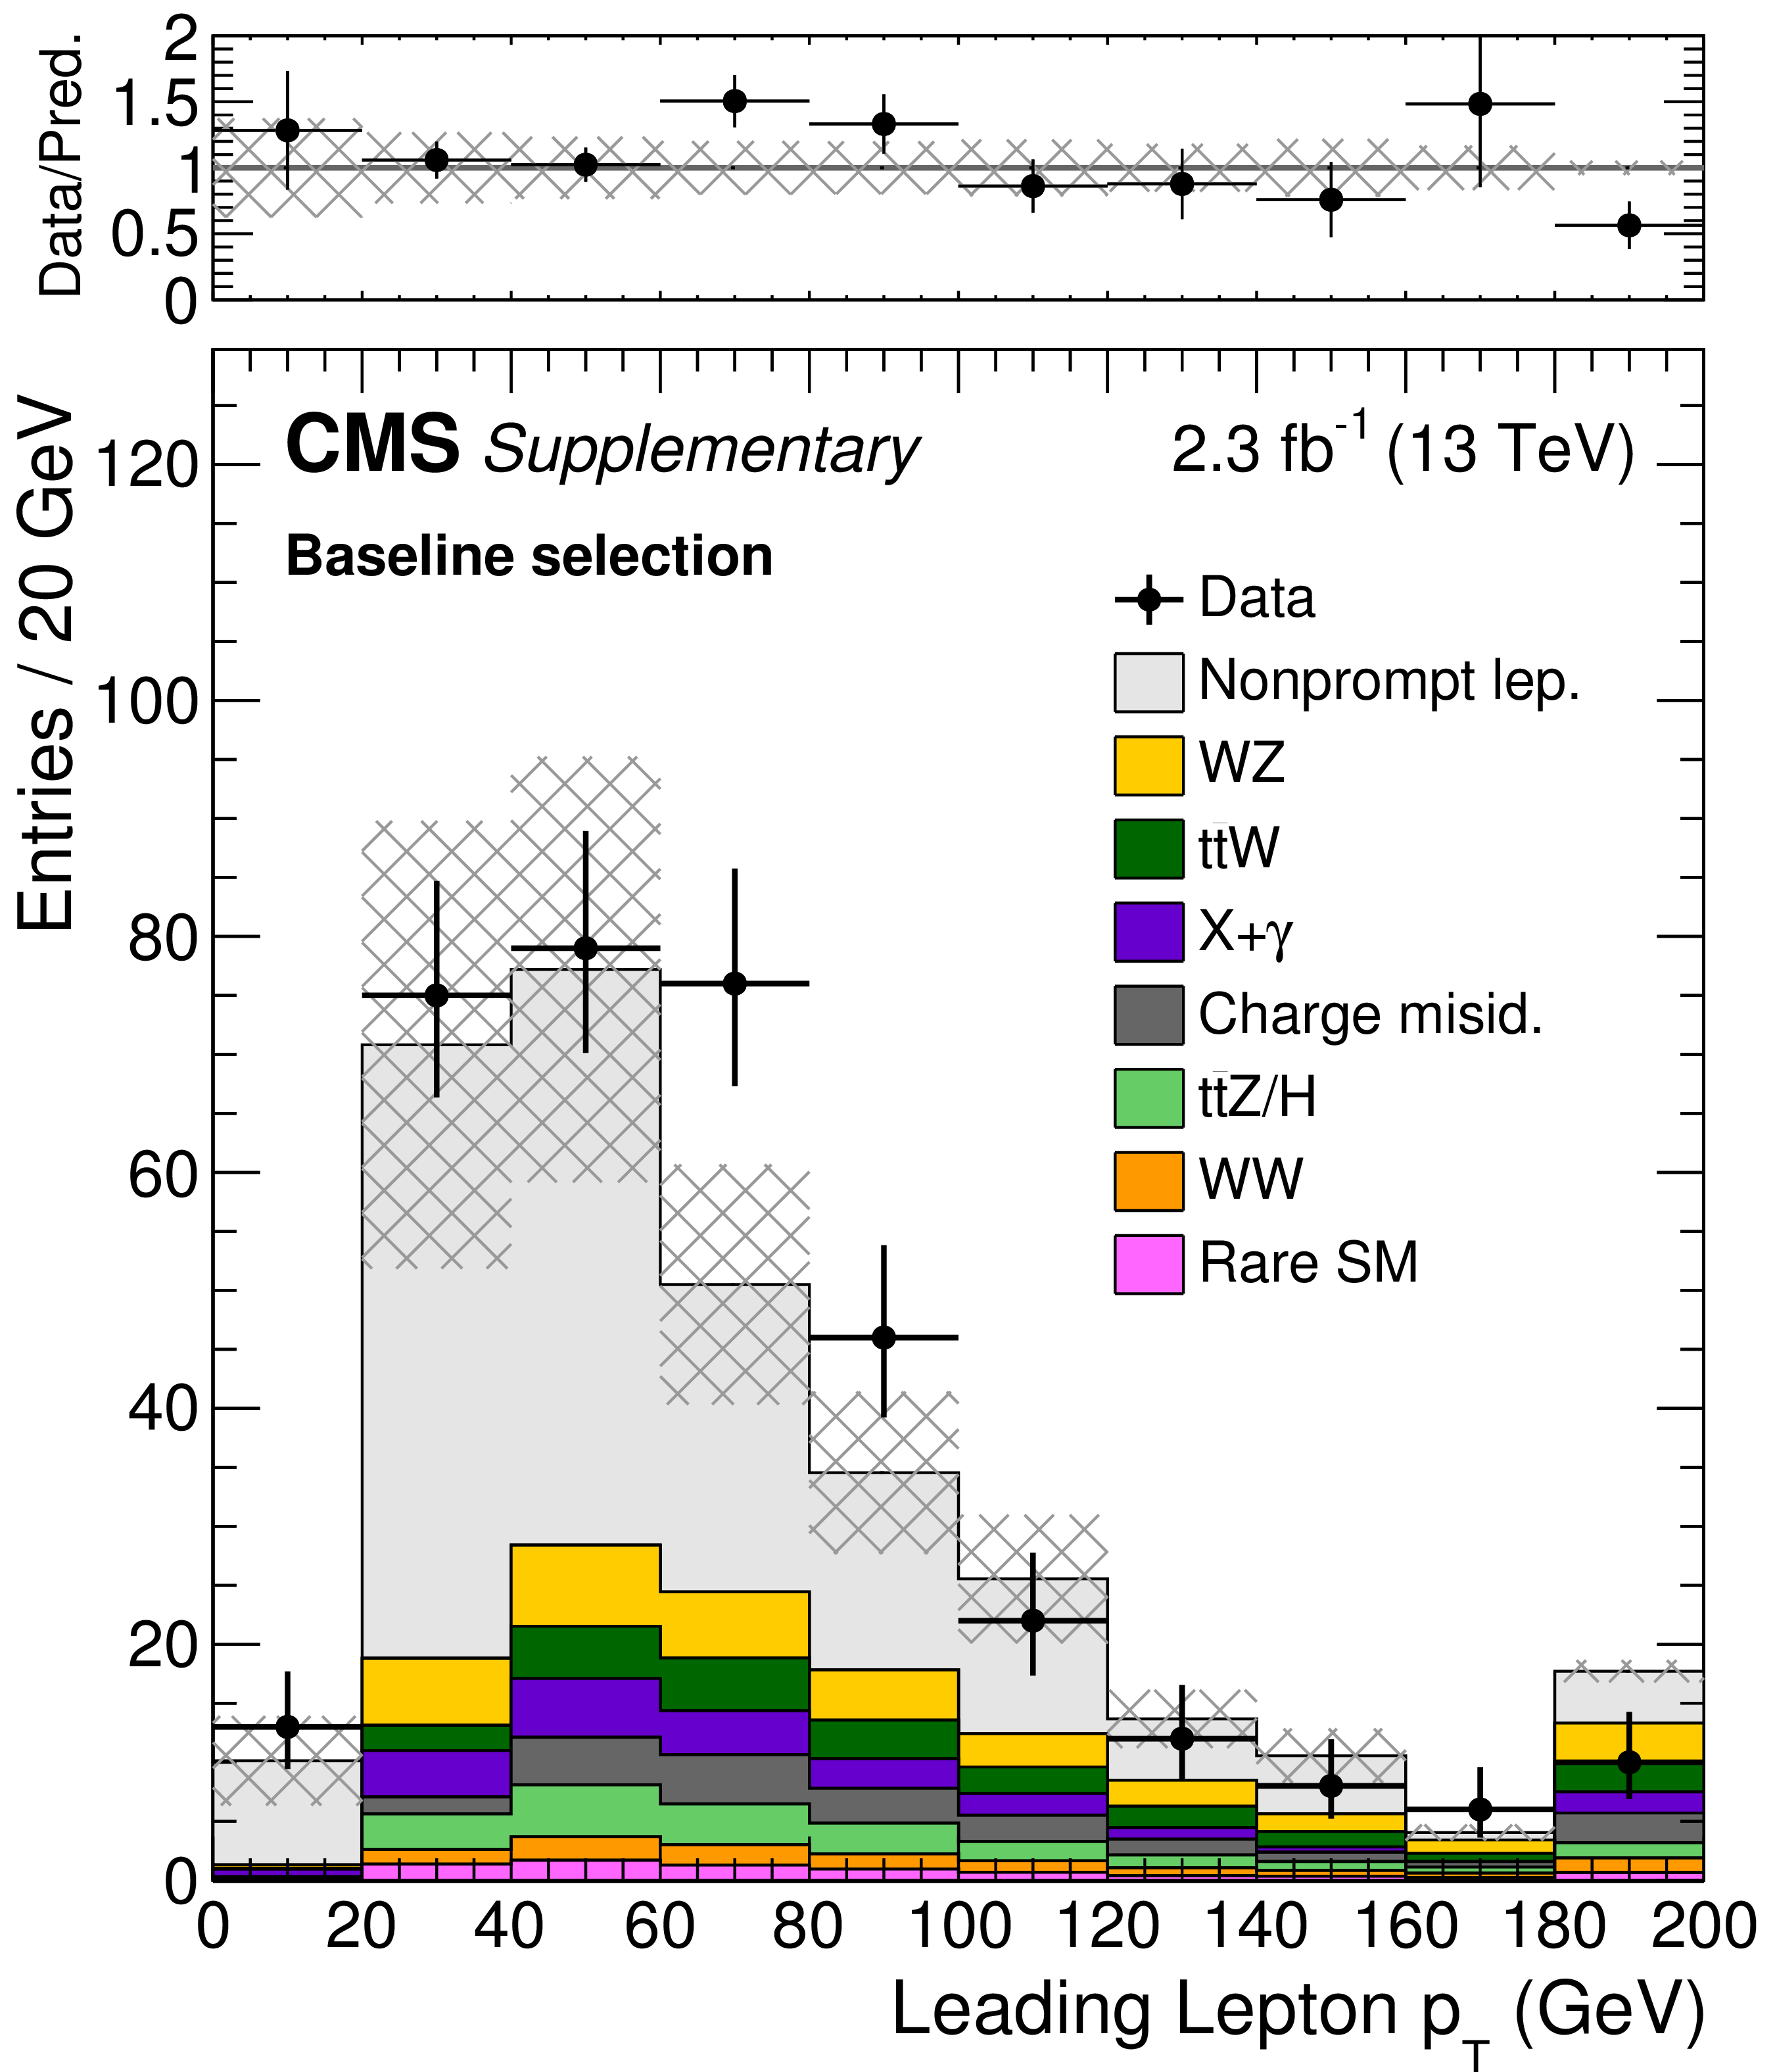
Additional Figure 4:
Distribution of the leading lepton ${p_{\mathrm {T}}}$ after the baseline selection, where the last bin includes the overflow. The hatched area represents the total uncertainty in the background prediction. The upper panels show the ratio of the observed event yield and the background prediction. |

png pdf |
Additional Figure 5:
Distribution of the subleading lepton ${p_{\mathrm {T}}}$ after the baseline selection, where the last bin includes the overflow. The hatched area represents the total uncertainty in the background prediction. The upper panels show the ratio of the observed event yield and the background prediction. |
png pdf |
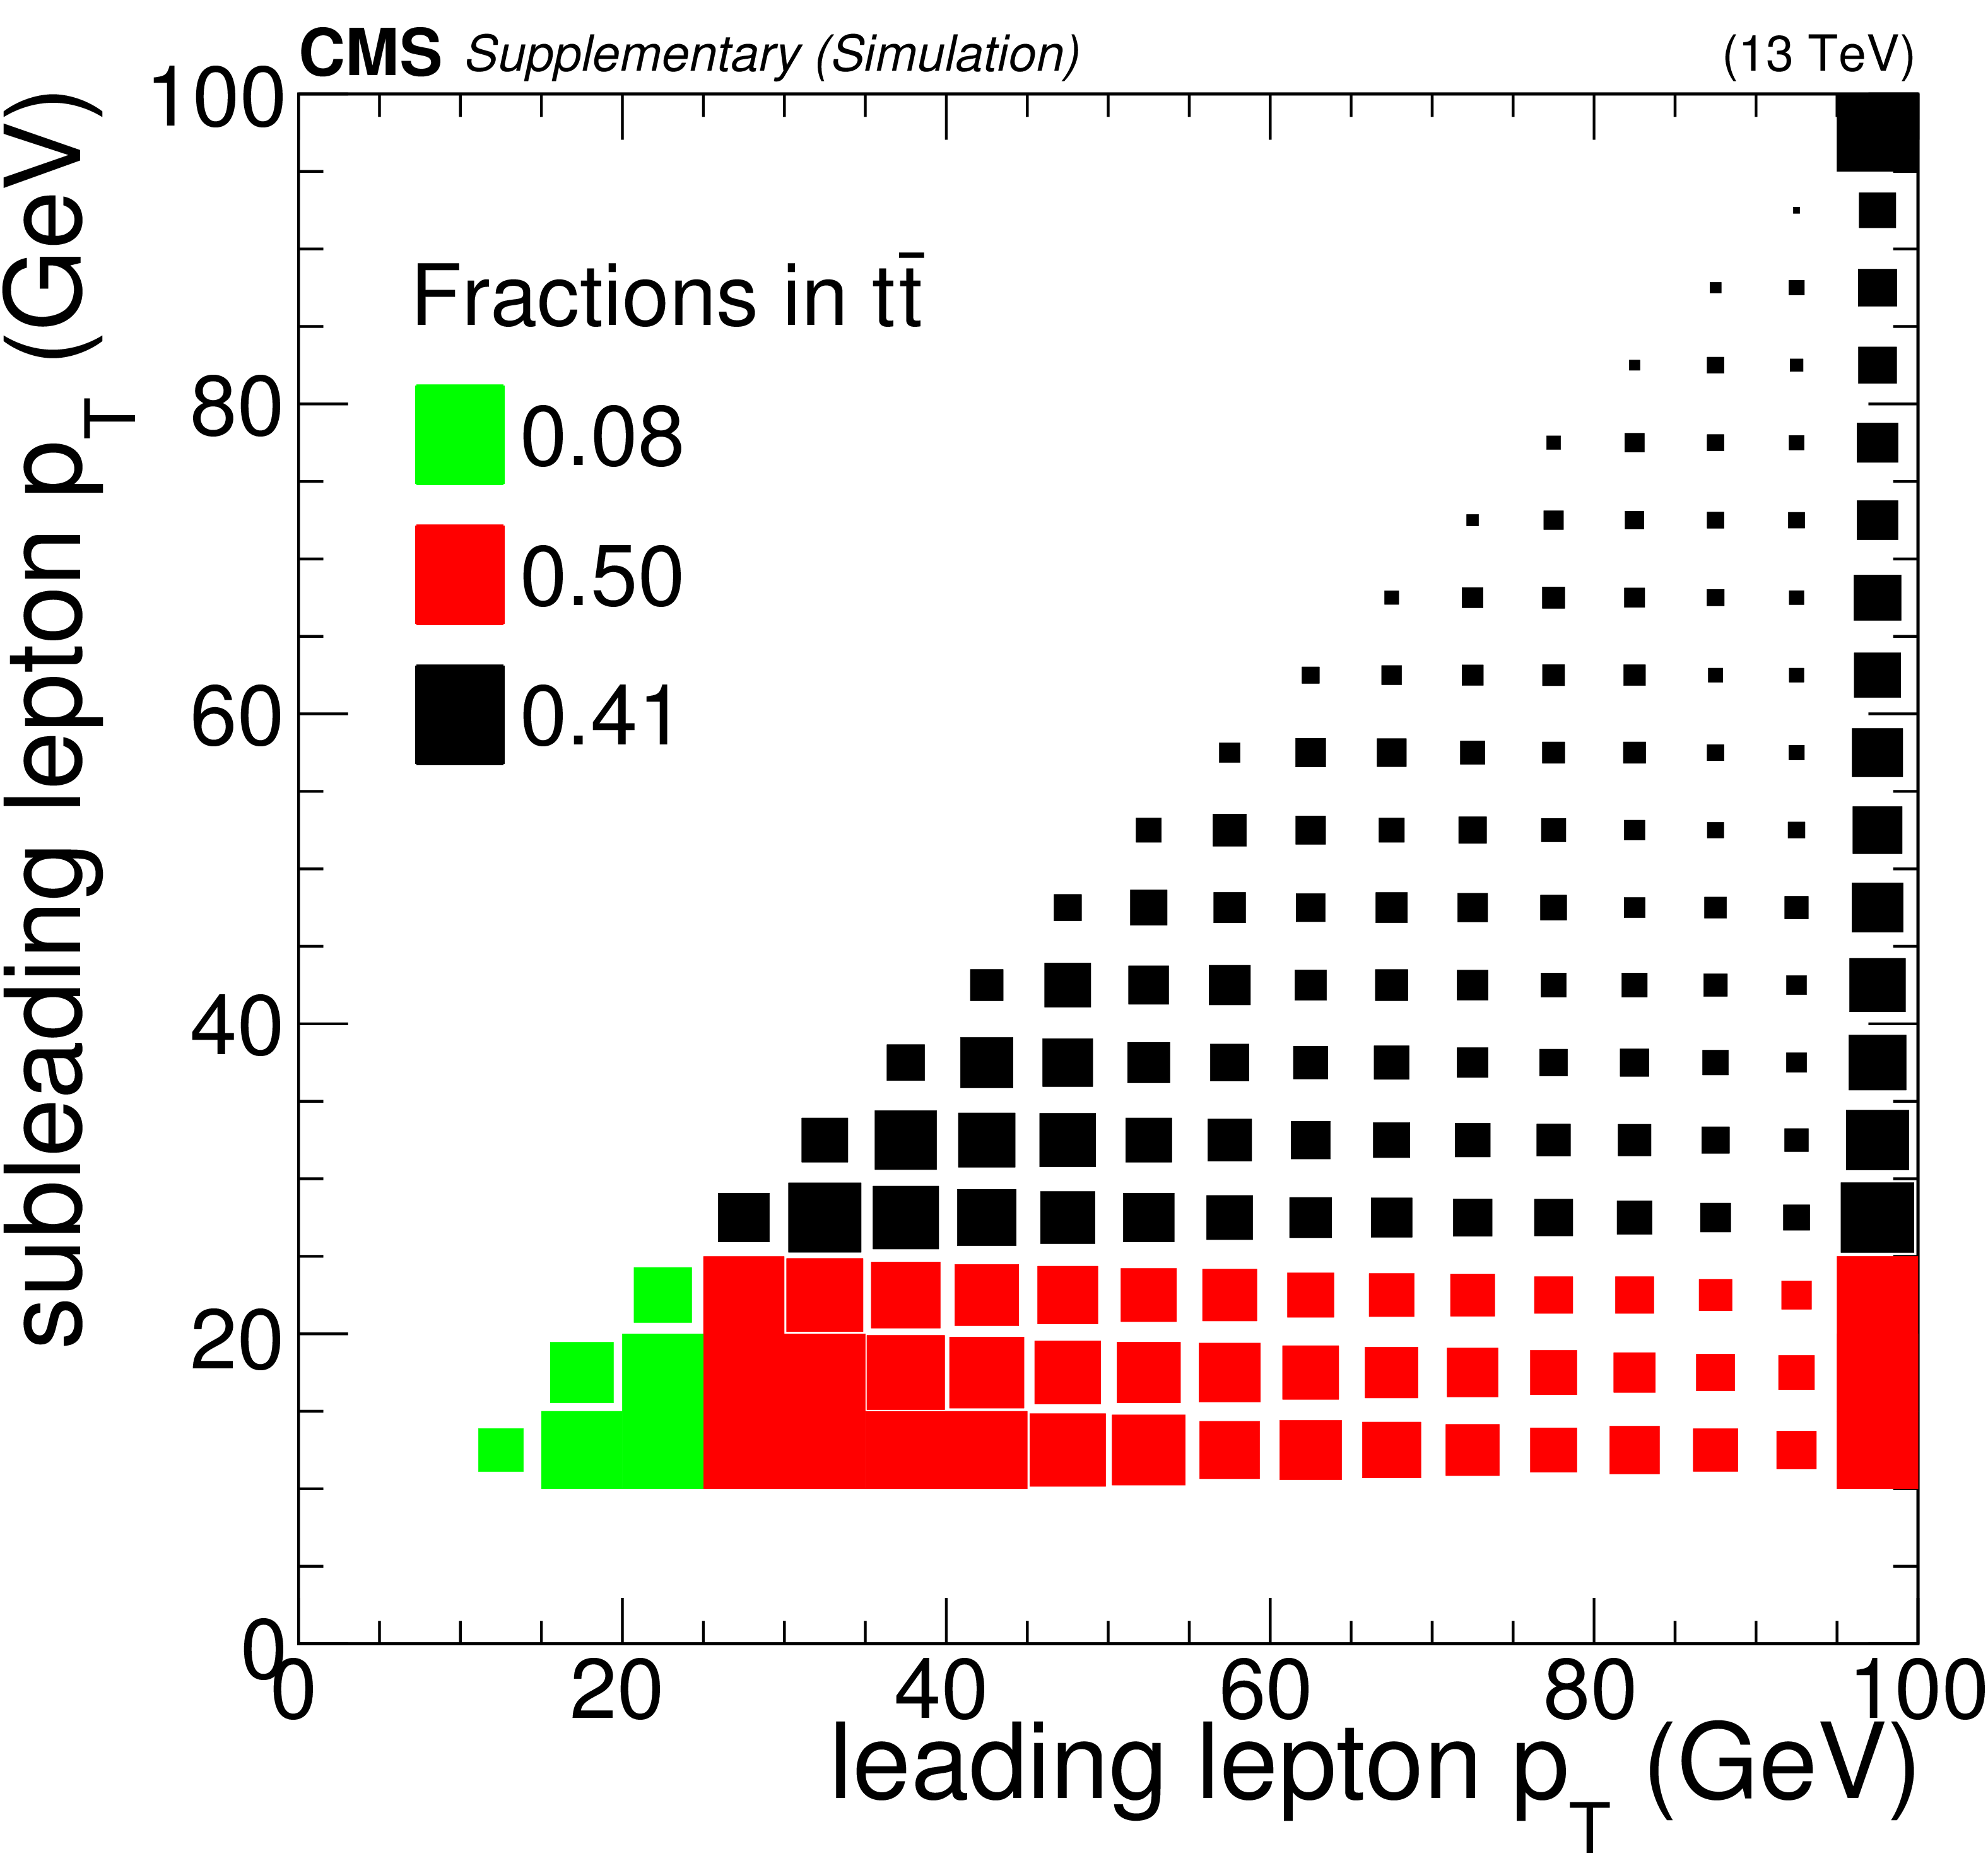
Additional Figure 6:
Relative population in the three lepton kinematic regions (HH in black, HL in red, and LL in green) for the ${\mathrm{ t \bar{t} } }$ process. The fraction of events in each region is reported in the legend. |
png pdf |
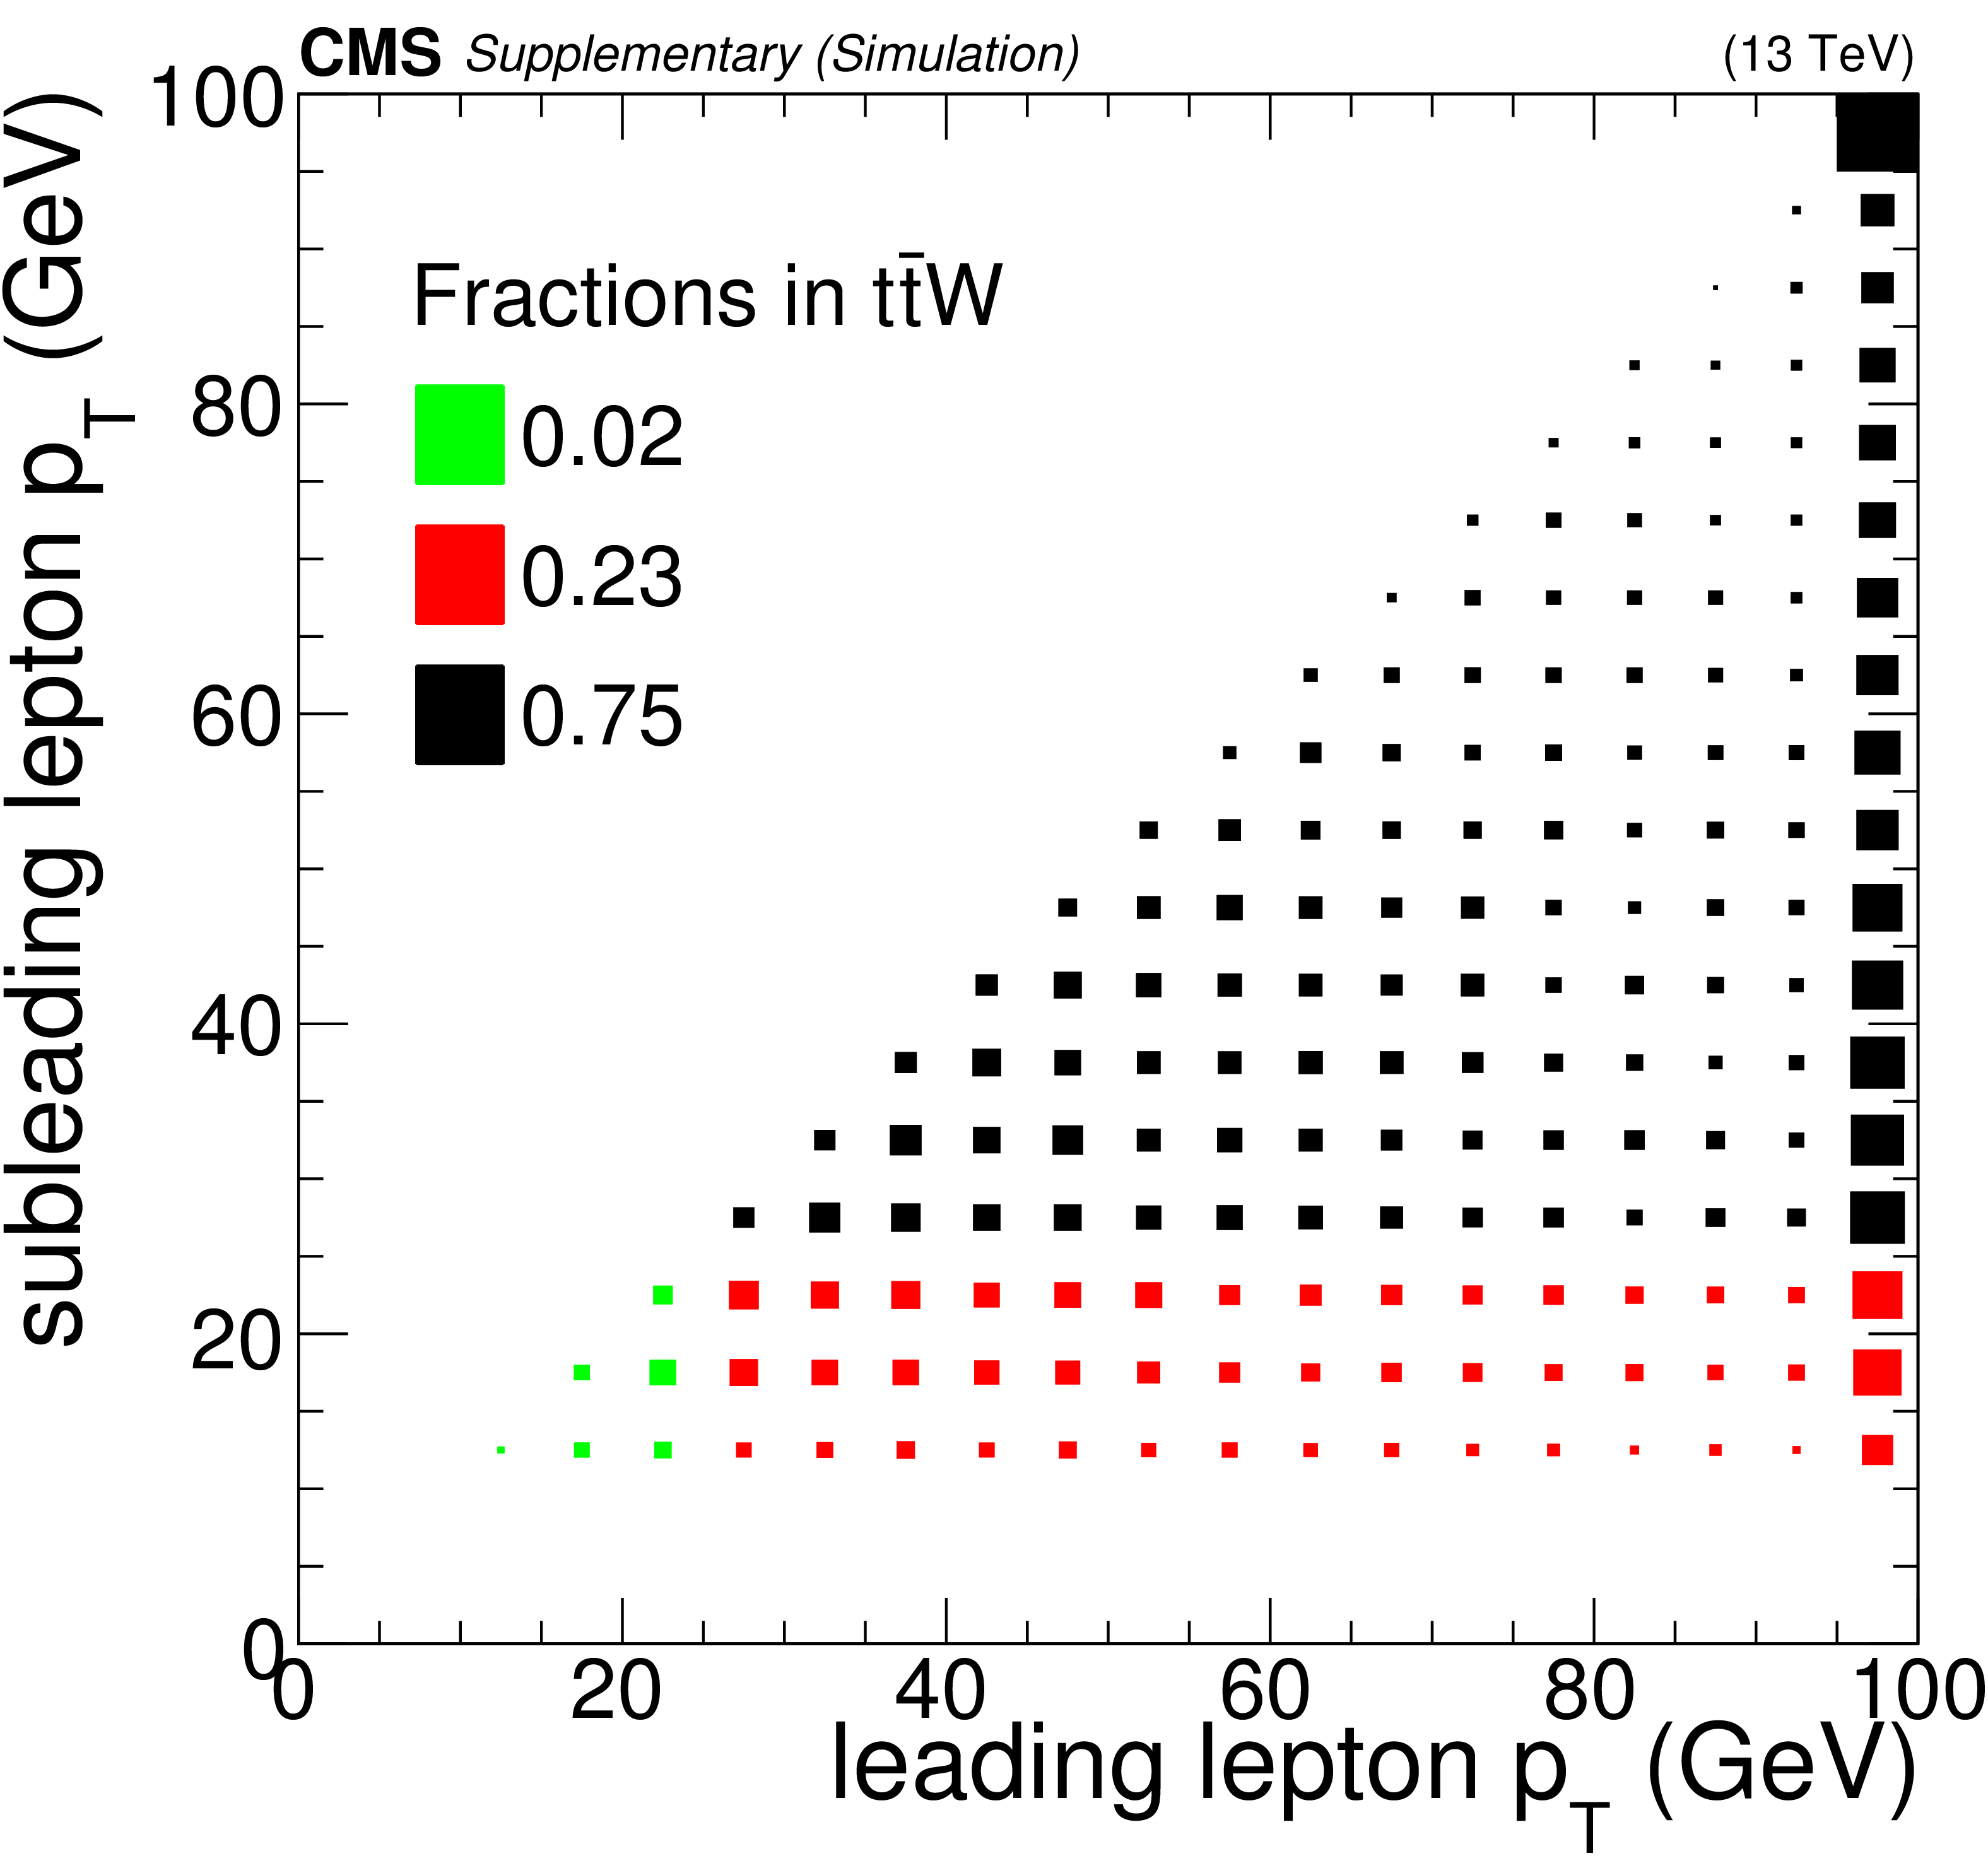
Additional Figure 7:
Relative population in the three lepton kinematic regions (HH in black, HL in red, and LL in green) for the ${ {\mathrm{ t \bar{t} } } \mathrm{ W } }$ process. The fraction of events in each region is reported in the legend. |

png pdf |
Additional Figure 8:
Event yields in the HH search regions for SM backgrounds. |
png pdf |
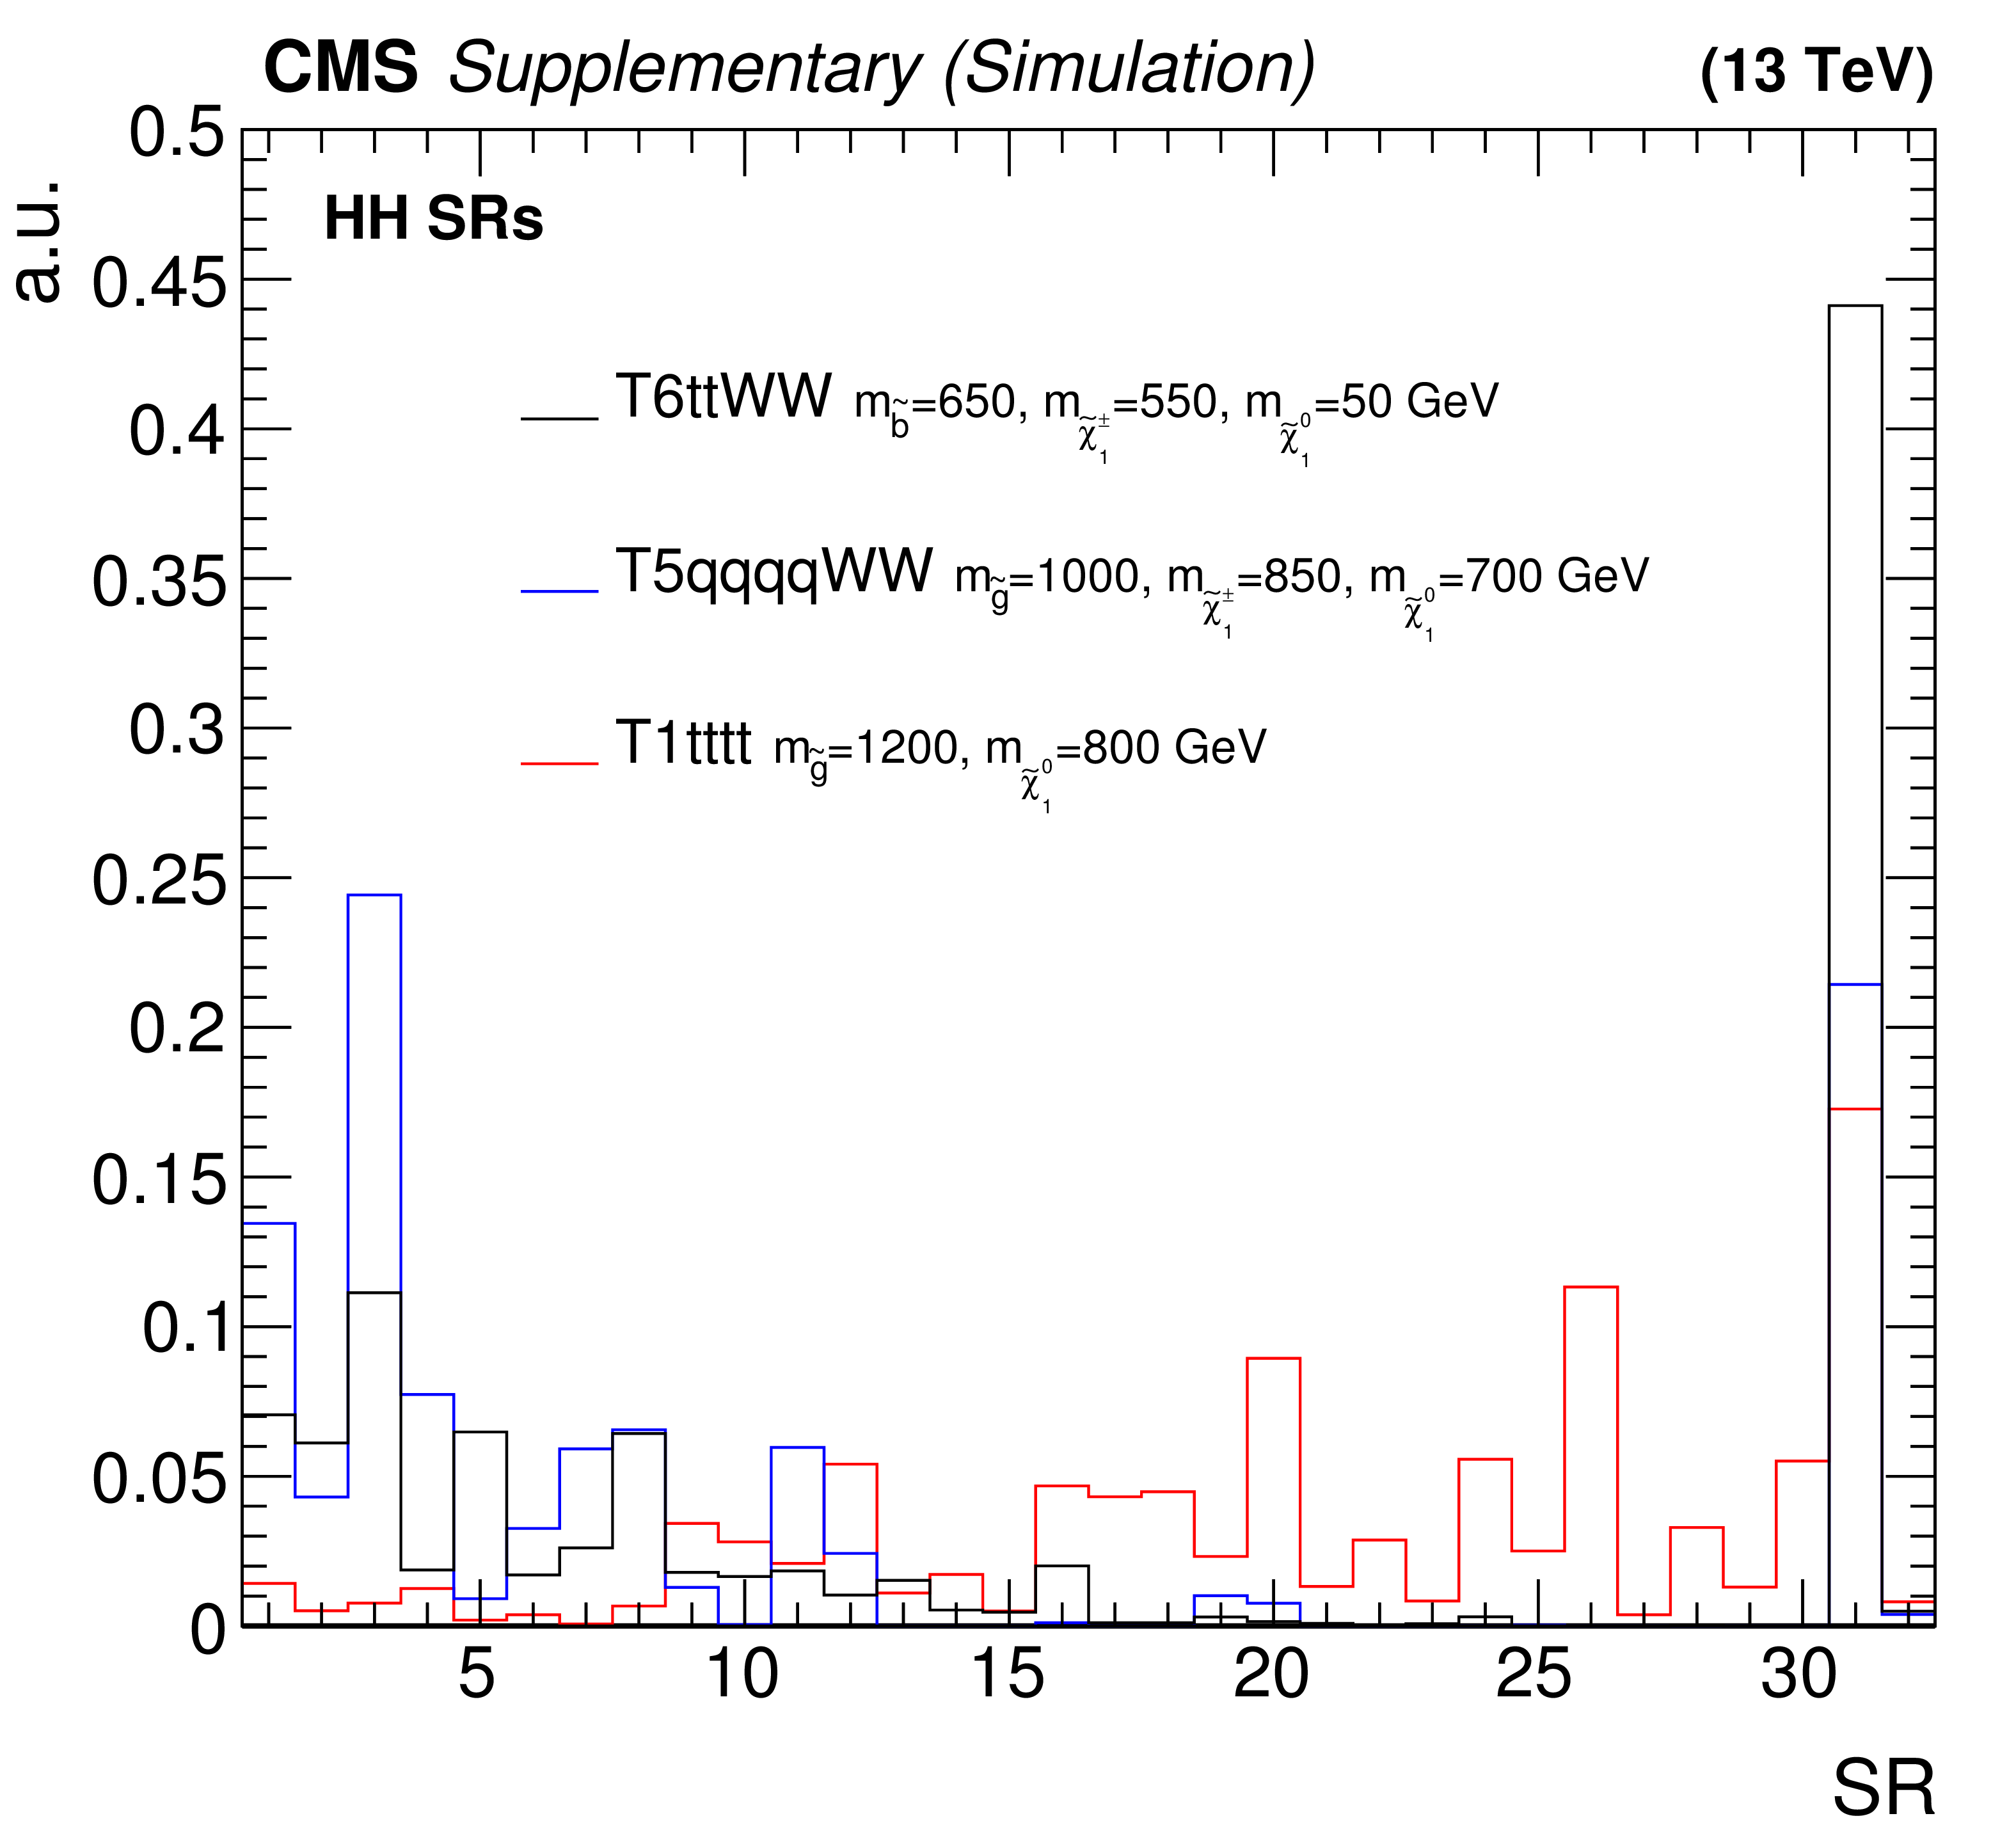
Additional Figure 9:
Event yields in the HH search regions for a few SUSY signal models. |
png pdf |
Additional Figure 10:
Number of jets distribution in the ${\mathrm{ W } \mathrm{ Z } }$ control region, defined requiring at least two jets, no b jets, ${E_{\mathrm {T}}^{\text {miss}}} >$ 30 GeV, and three leptons, where two of the leptons form a same-flavor, opposite-sign pair with an invariant mass within 15 GeV of the Z boson mass. |
png pdf |
Additional Figure 11:
${E_{\mathrm {T}}^{\text {miss}}}$ distribution in the ${\mathrm{ W } \mathrm{ Z } }$ control region, defined requiring at least two jets, no b jets, ${E_{\mathrm {T}}^{\text {miss}}} > $ 30 GeV, and three leptons, where two of the leptons form a same-flavor, opposite-sign pair with an invariant mass within 15 GeV of the Z boson mass. |
png pdf |
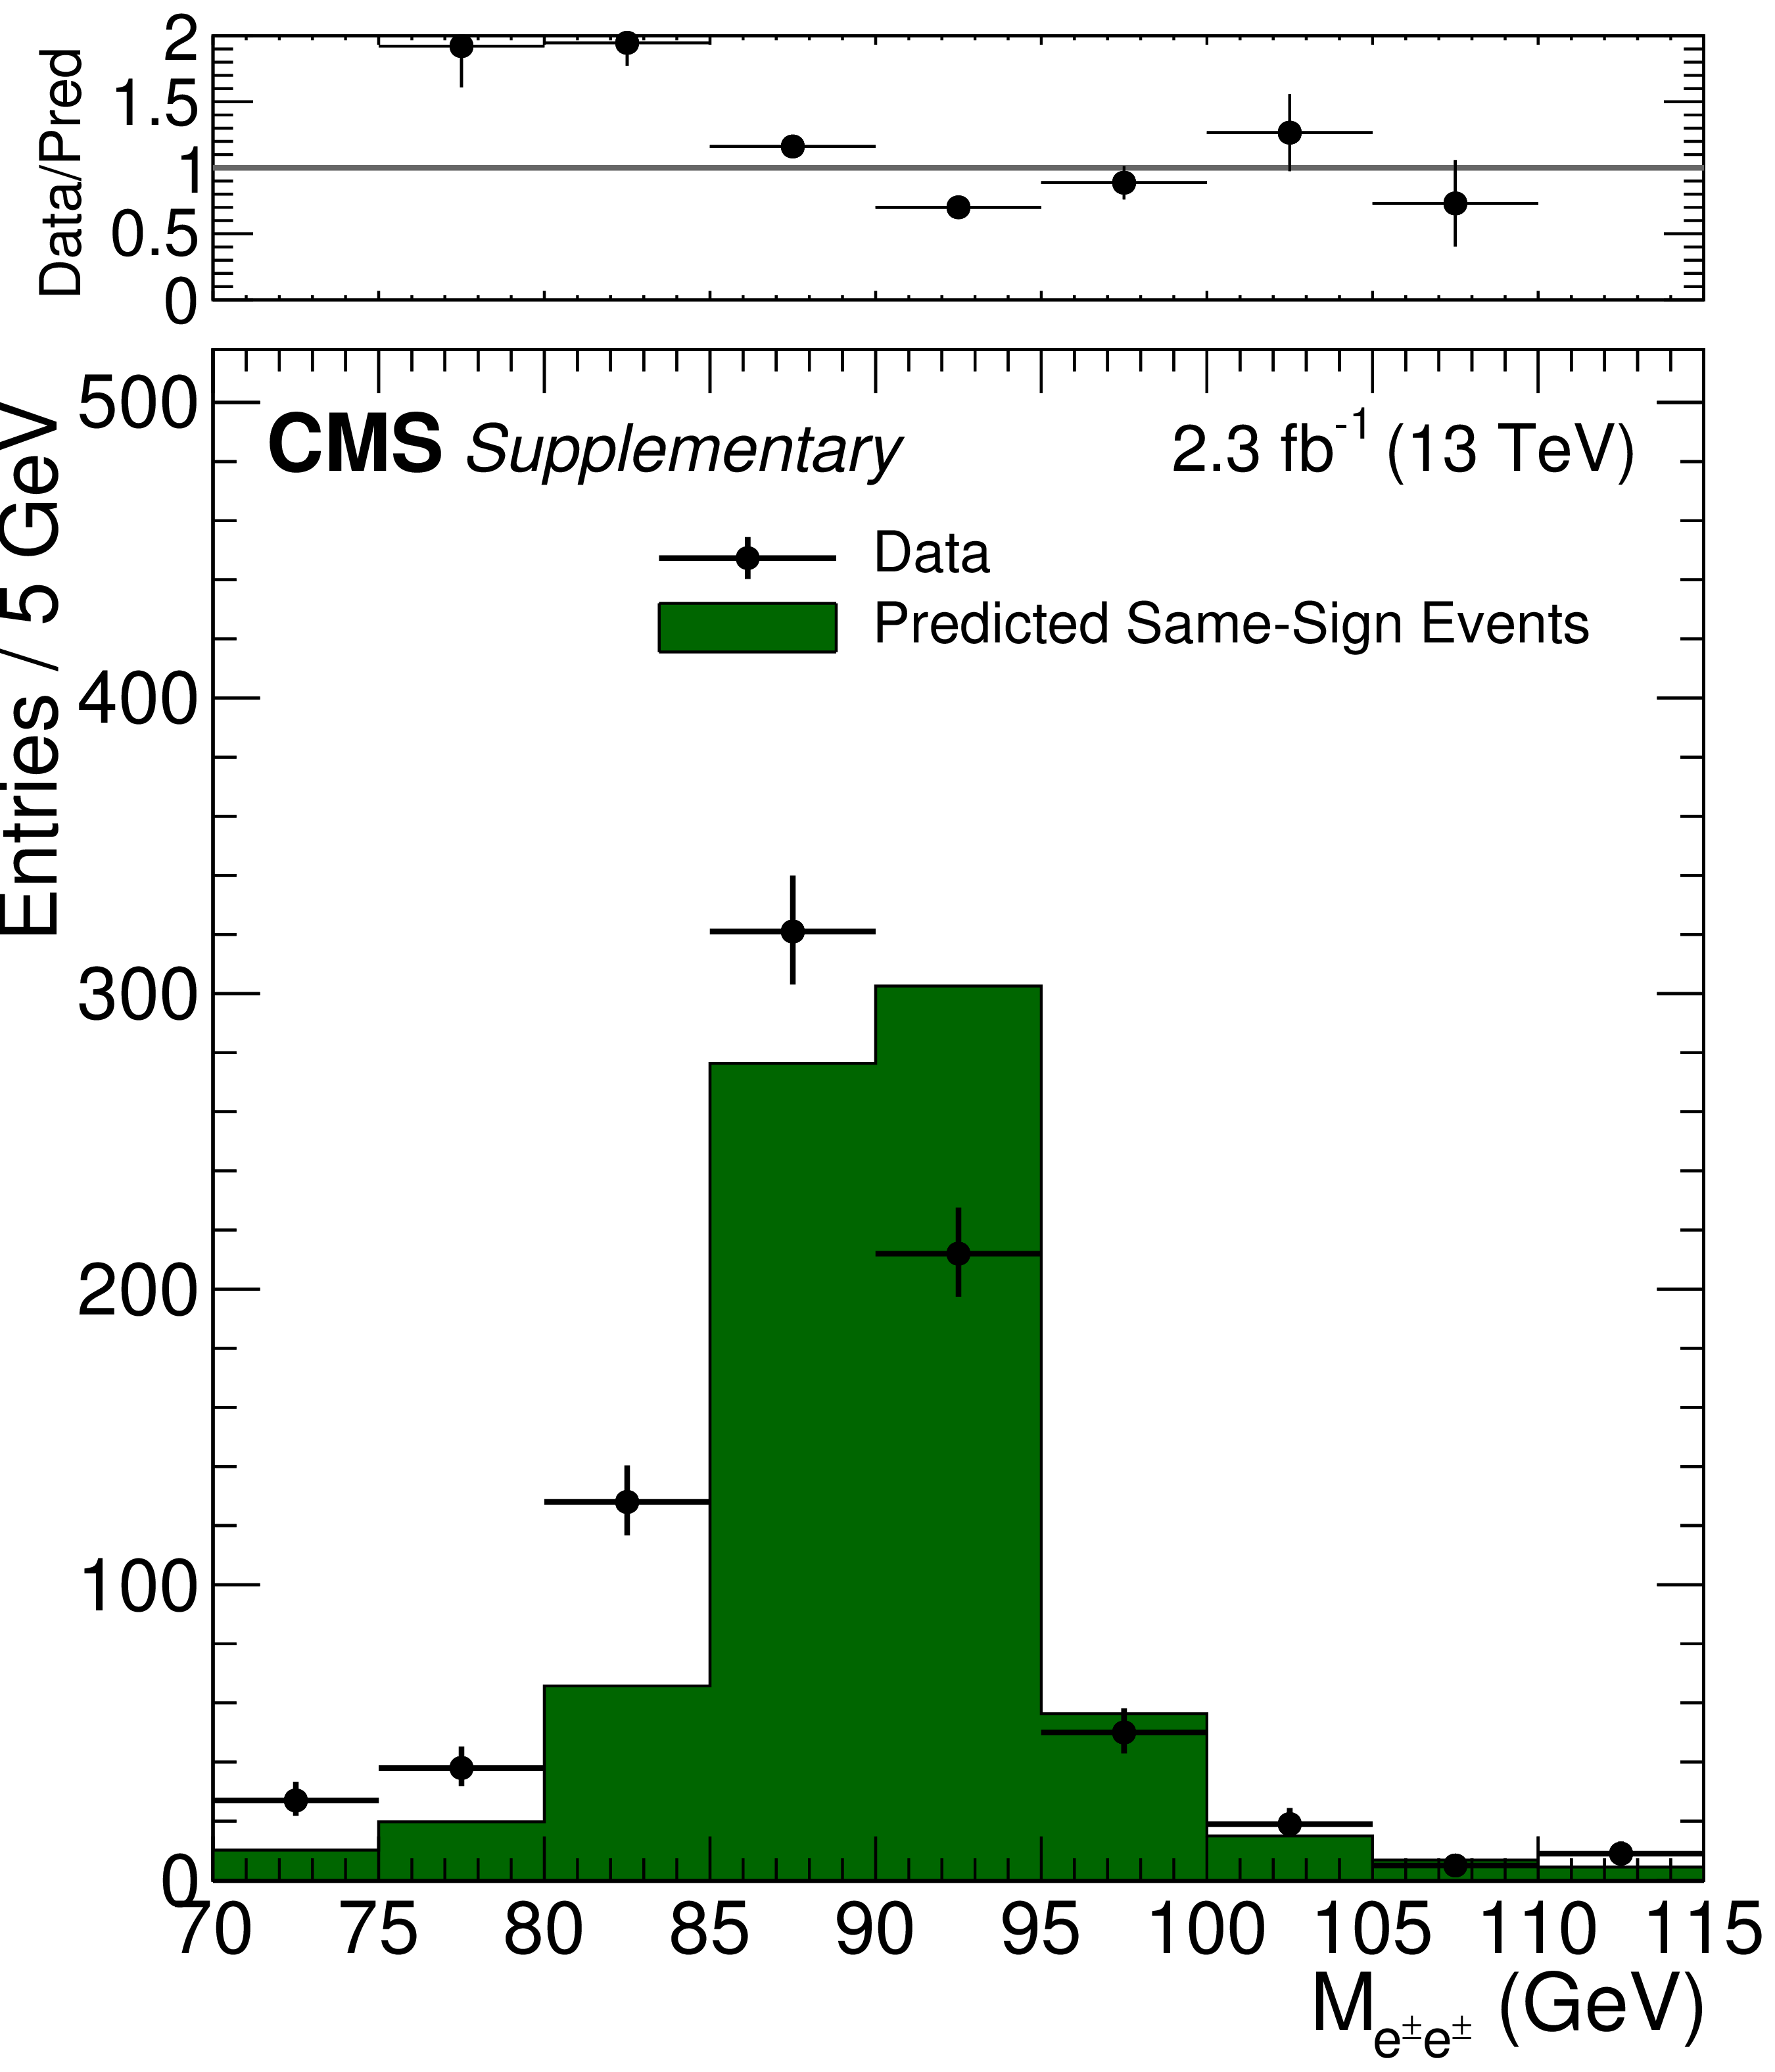
Additional Figure 12:
Comparison of observed and predicted events in the ${\mathrm{ Z } } \to {\rm e^{\pm }e^{\pm }}$ control region as a function of the di-electron mass. The prediction is obtained from ${\mathrm{ Z } } \to {\rm e^{+}e^{-}}$ events reweighted by the charge misidentification probability. |
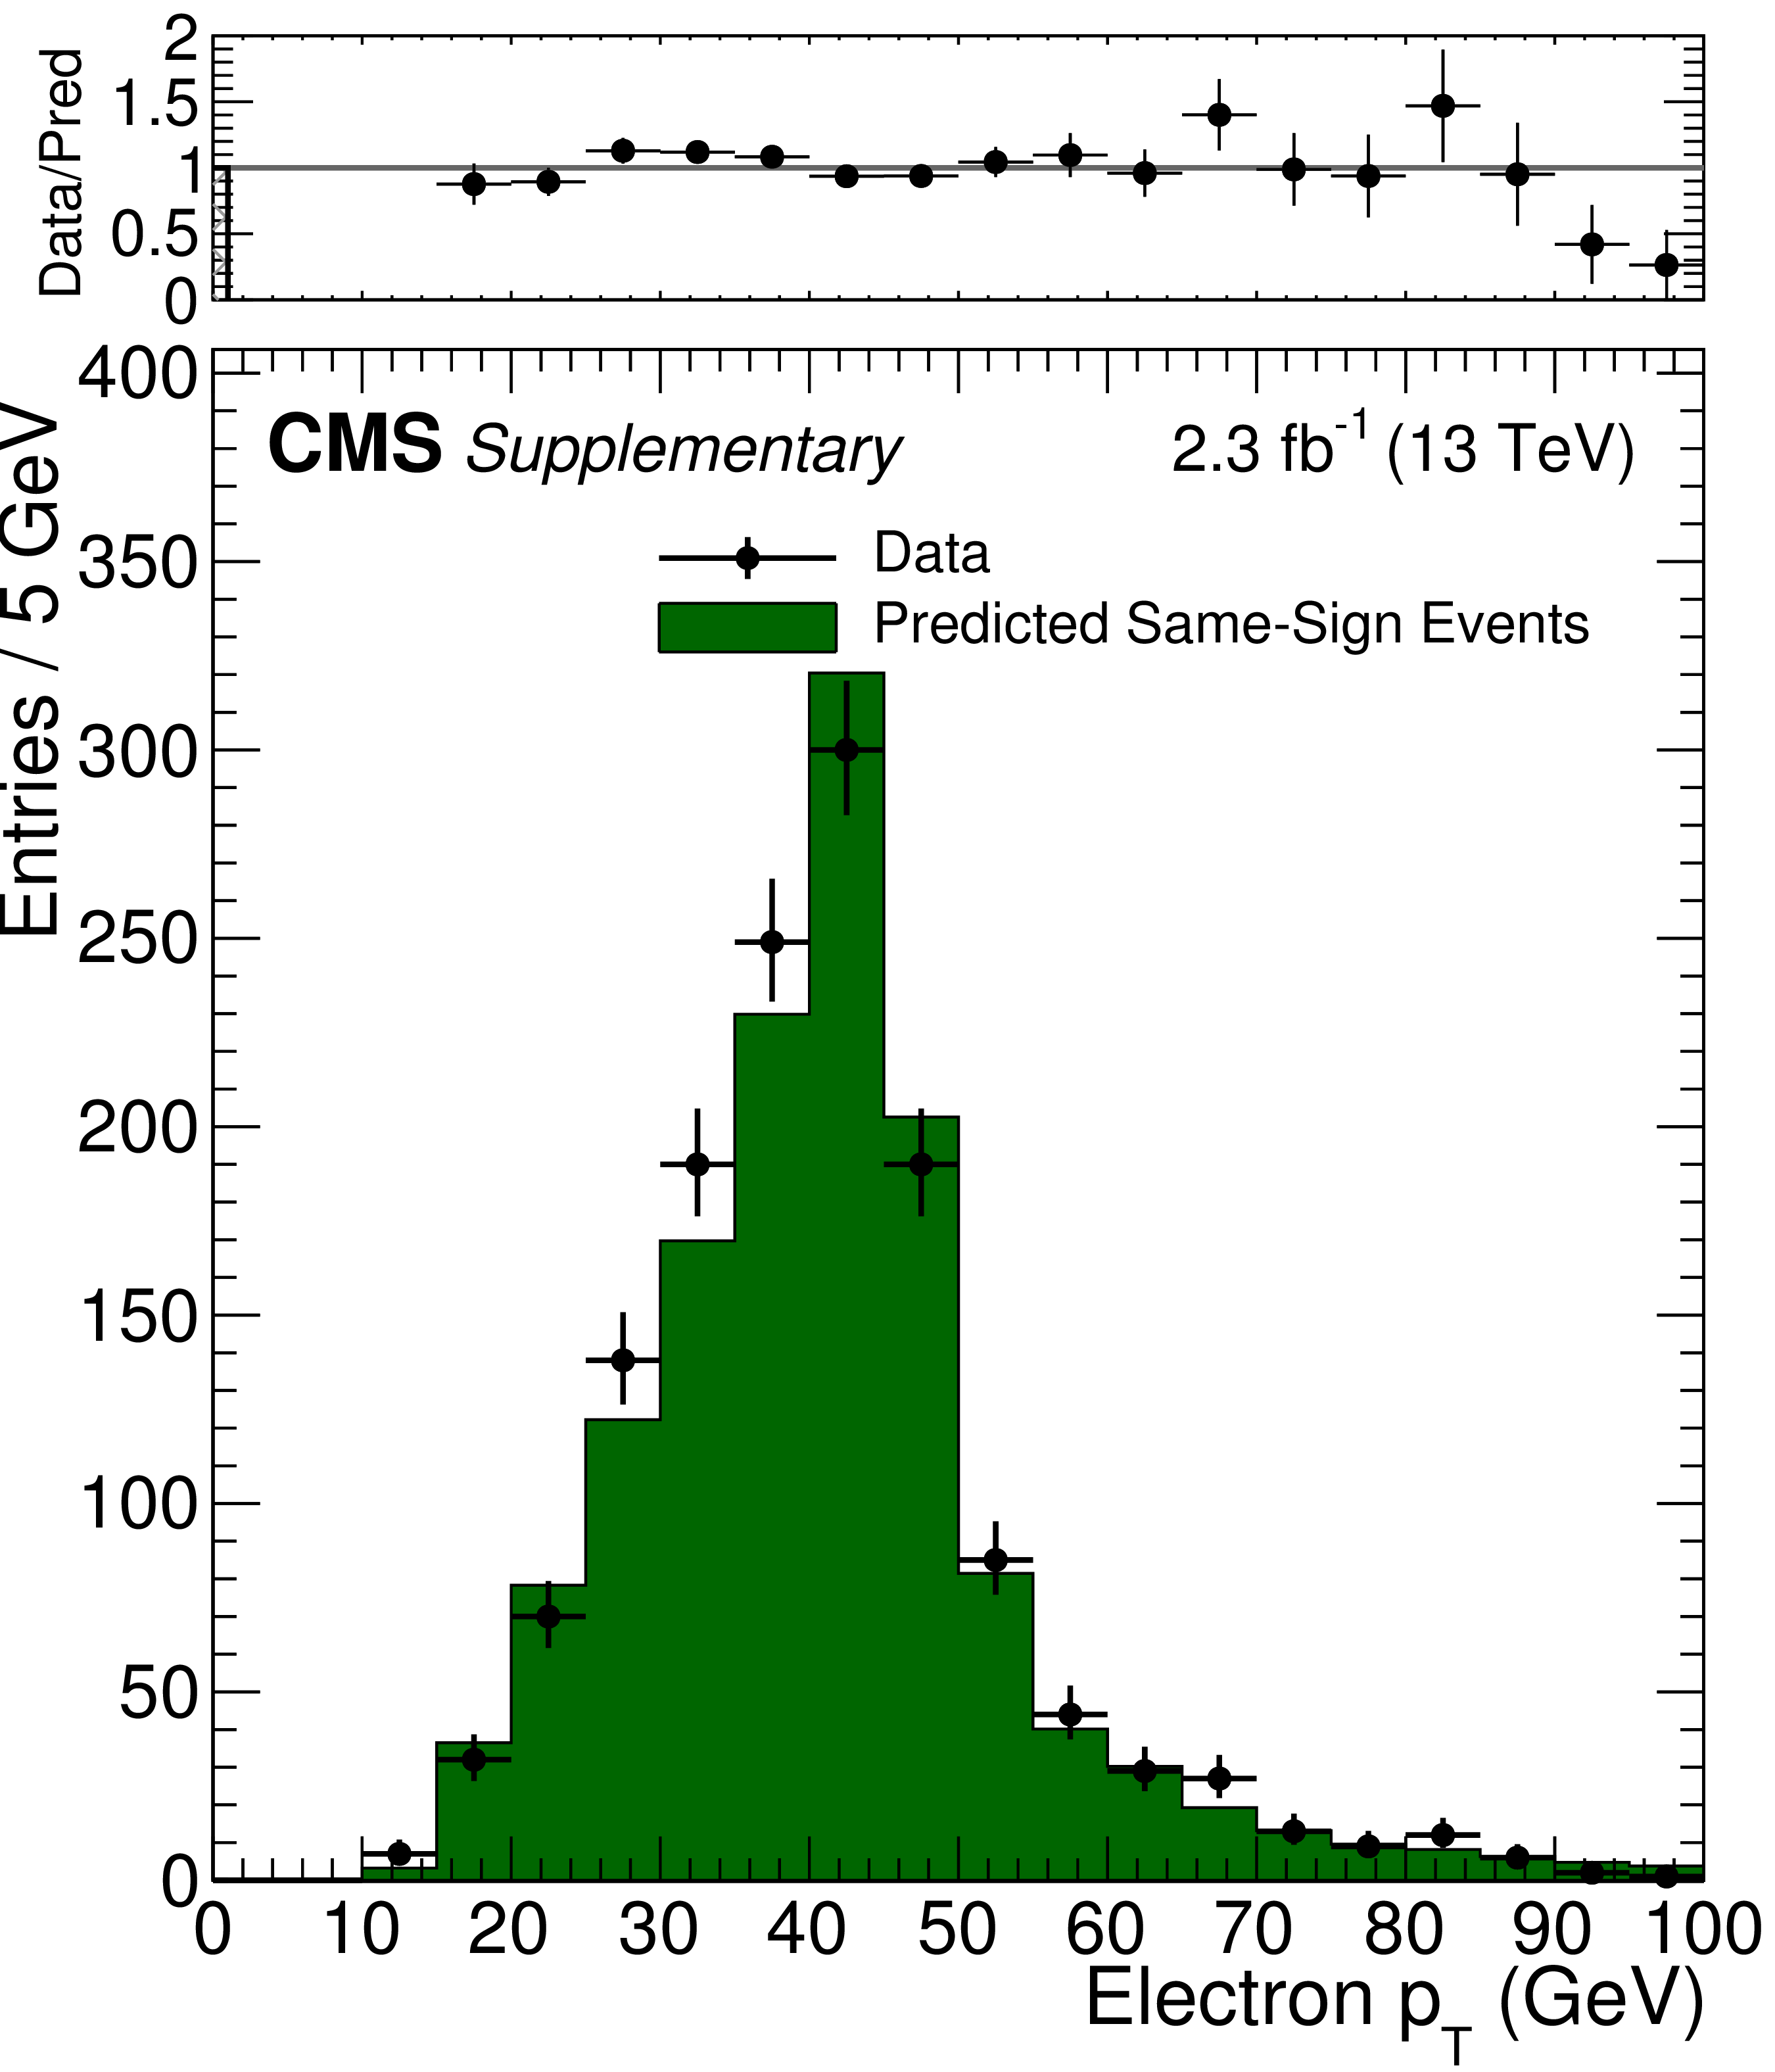
png pdf |
Additional Figure 13:
Comparison of observed and predicted events in the ${\mathrm{ Z } } \to {\rm e^{\pm }e^{\pm }}$ control region as a function of the electron ${p_{\mathrm {T}}}$ . The prediction is obtained from ${\mathrm{ Z } } \to {\rm e^{+}e^{-}}$ events reweighted by the charge misidentification probability. |
png pdf |
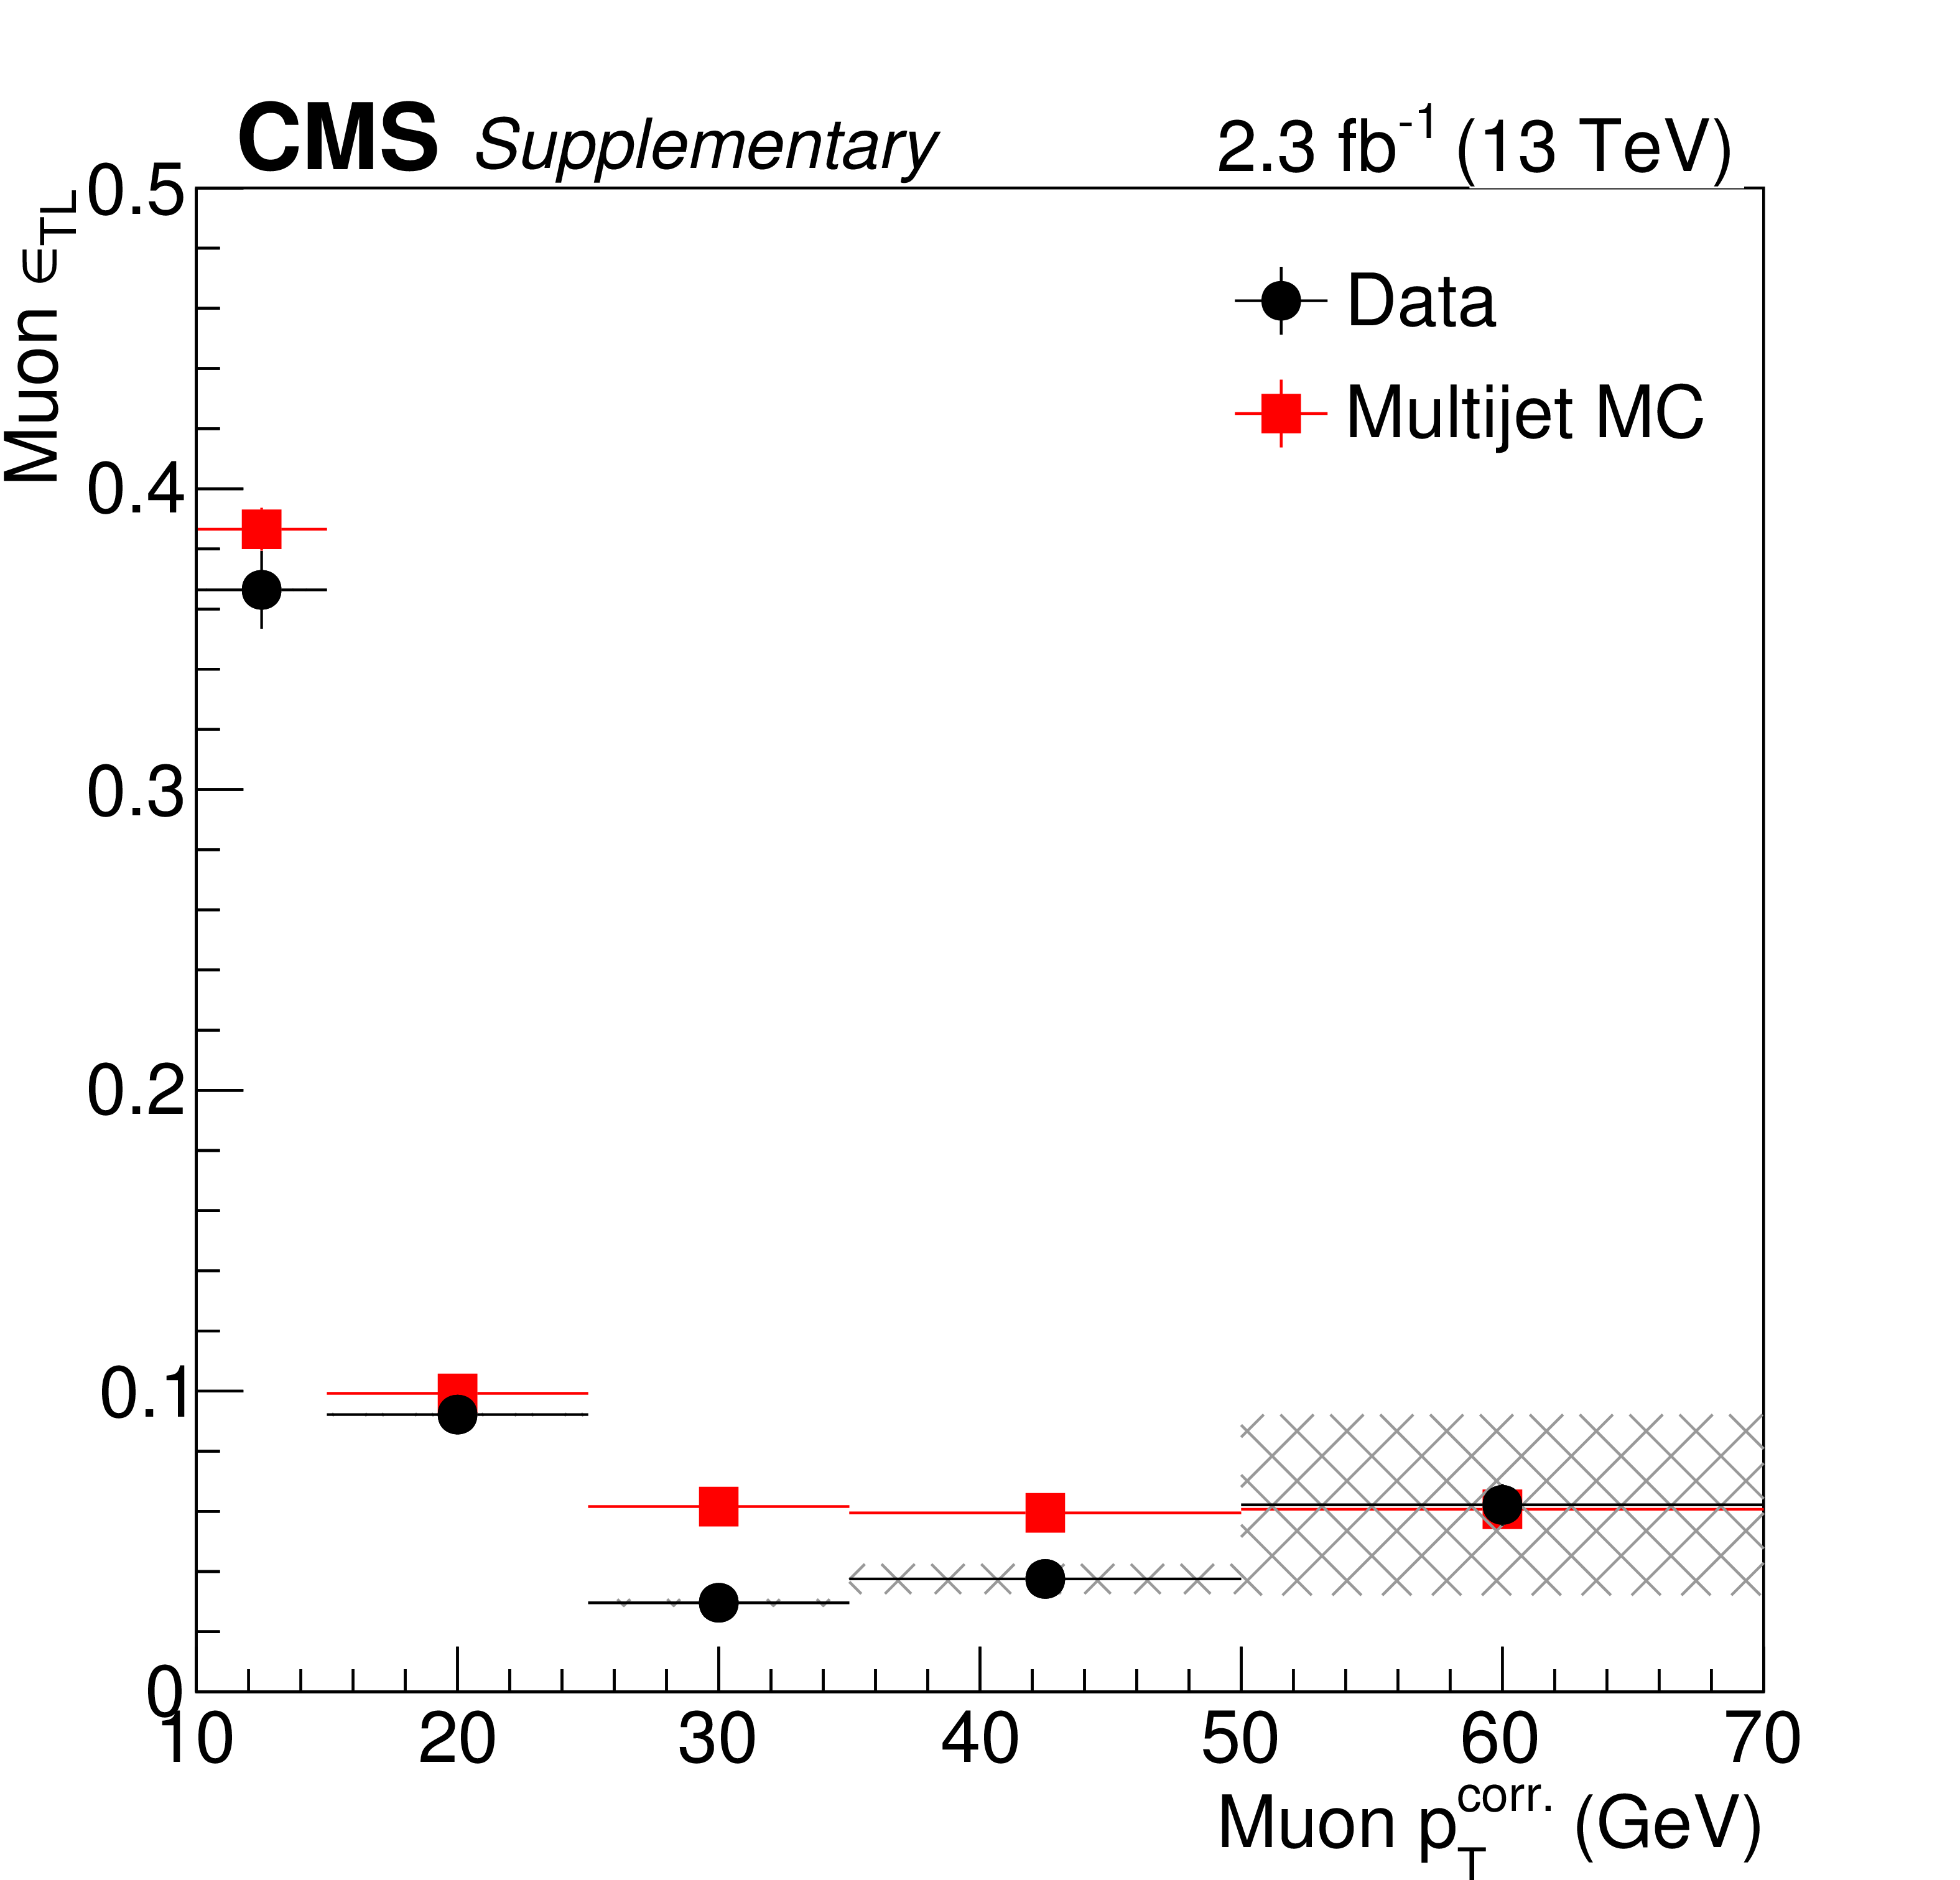
Additional Figure 14:
Probability for a nonprompt muon that satisfies the loose selection to also satisfy the tight selection ($\epsilon _{\rm TL}$). The measurement is performed in a multijet-enriched data set from single-lepton triggered events with no isolation requirement at the HLT. The hatched area represents the systematic uncertainty due to the subtraction of the contribution from prompt leptons. |
png pdf |
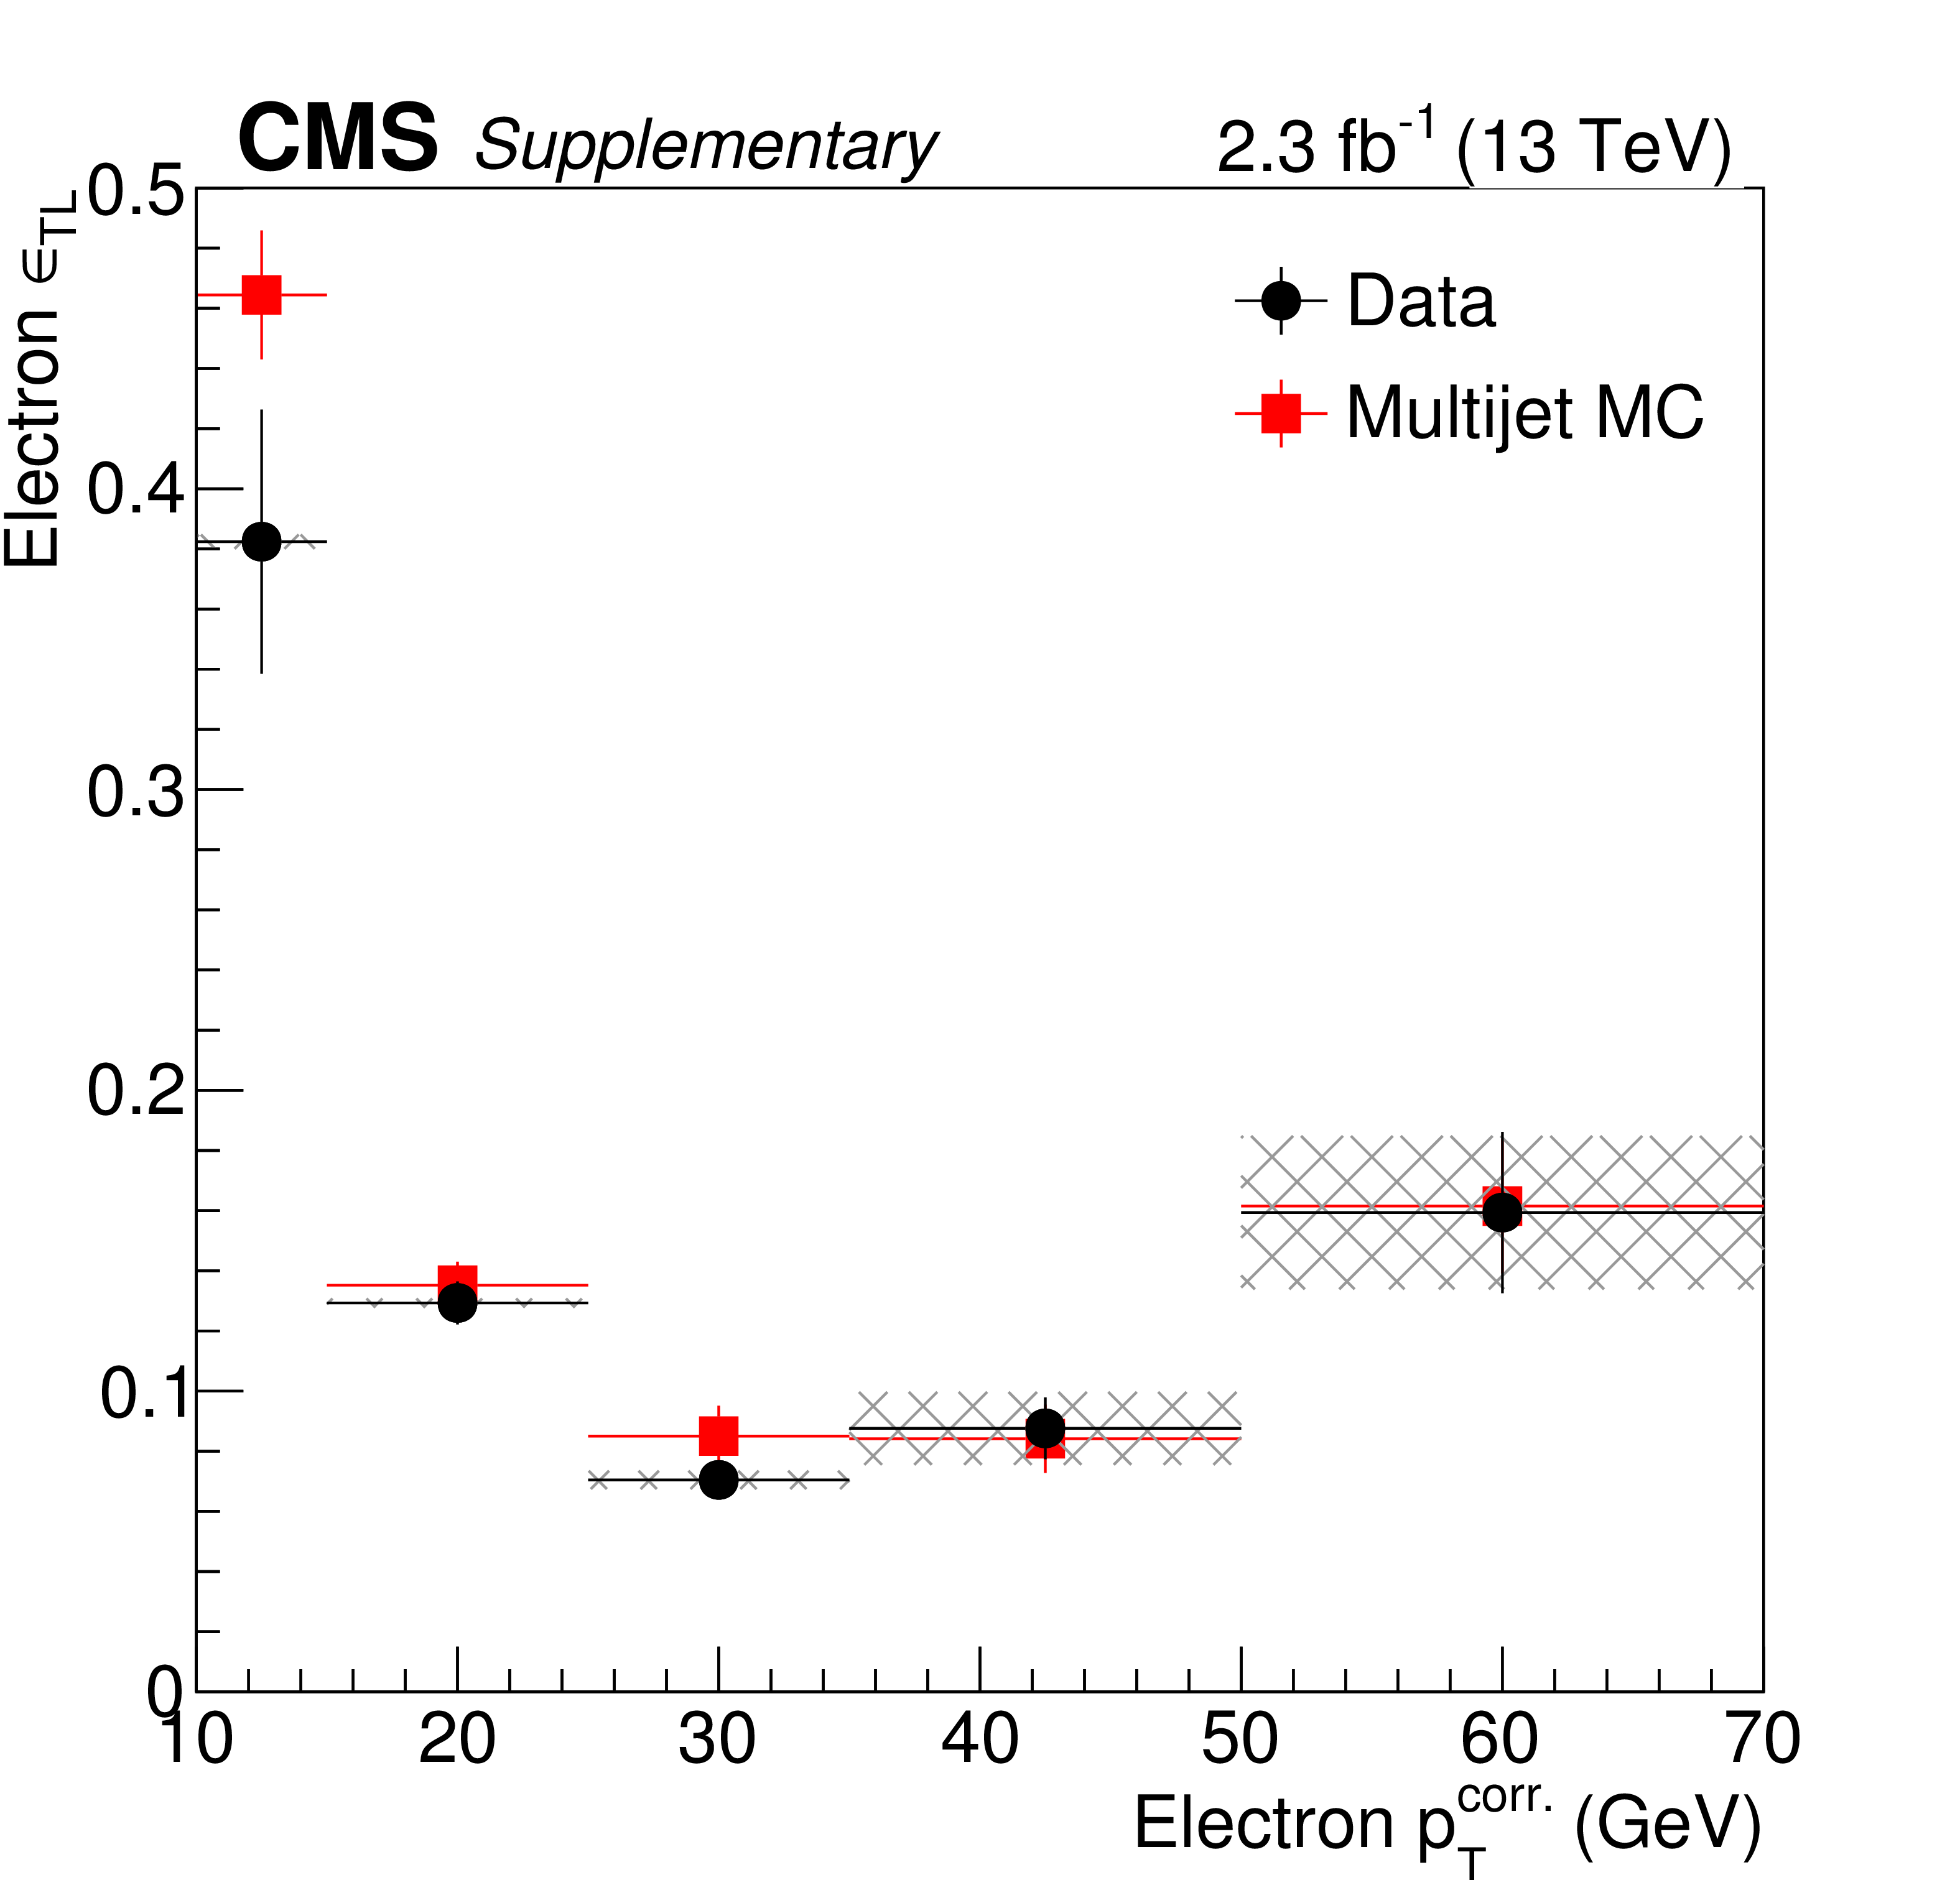
Additional Figure 15:
Probability for a nonprompt electron that satisfies the loose selection to also satisfy the tight selection ($\epsilon _{\rm TL}$). The measurement is performed in a multijet-enriched data set from single-lepton triggered events with no isolation requirement at the HLT. The hatched area represents the systematic uncertainty due to the subtraction of the contribution from prompt leptons. |
png pdf |
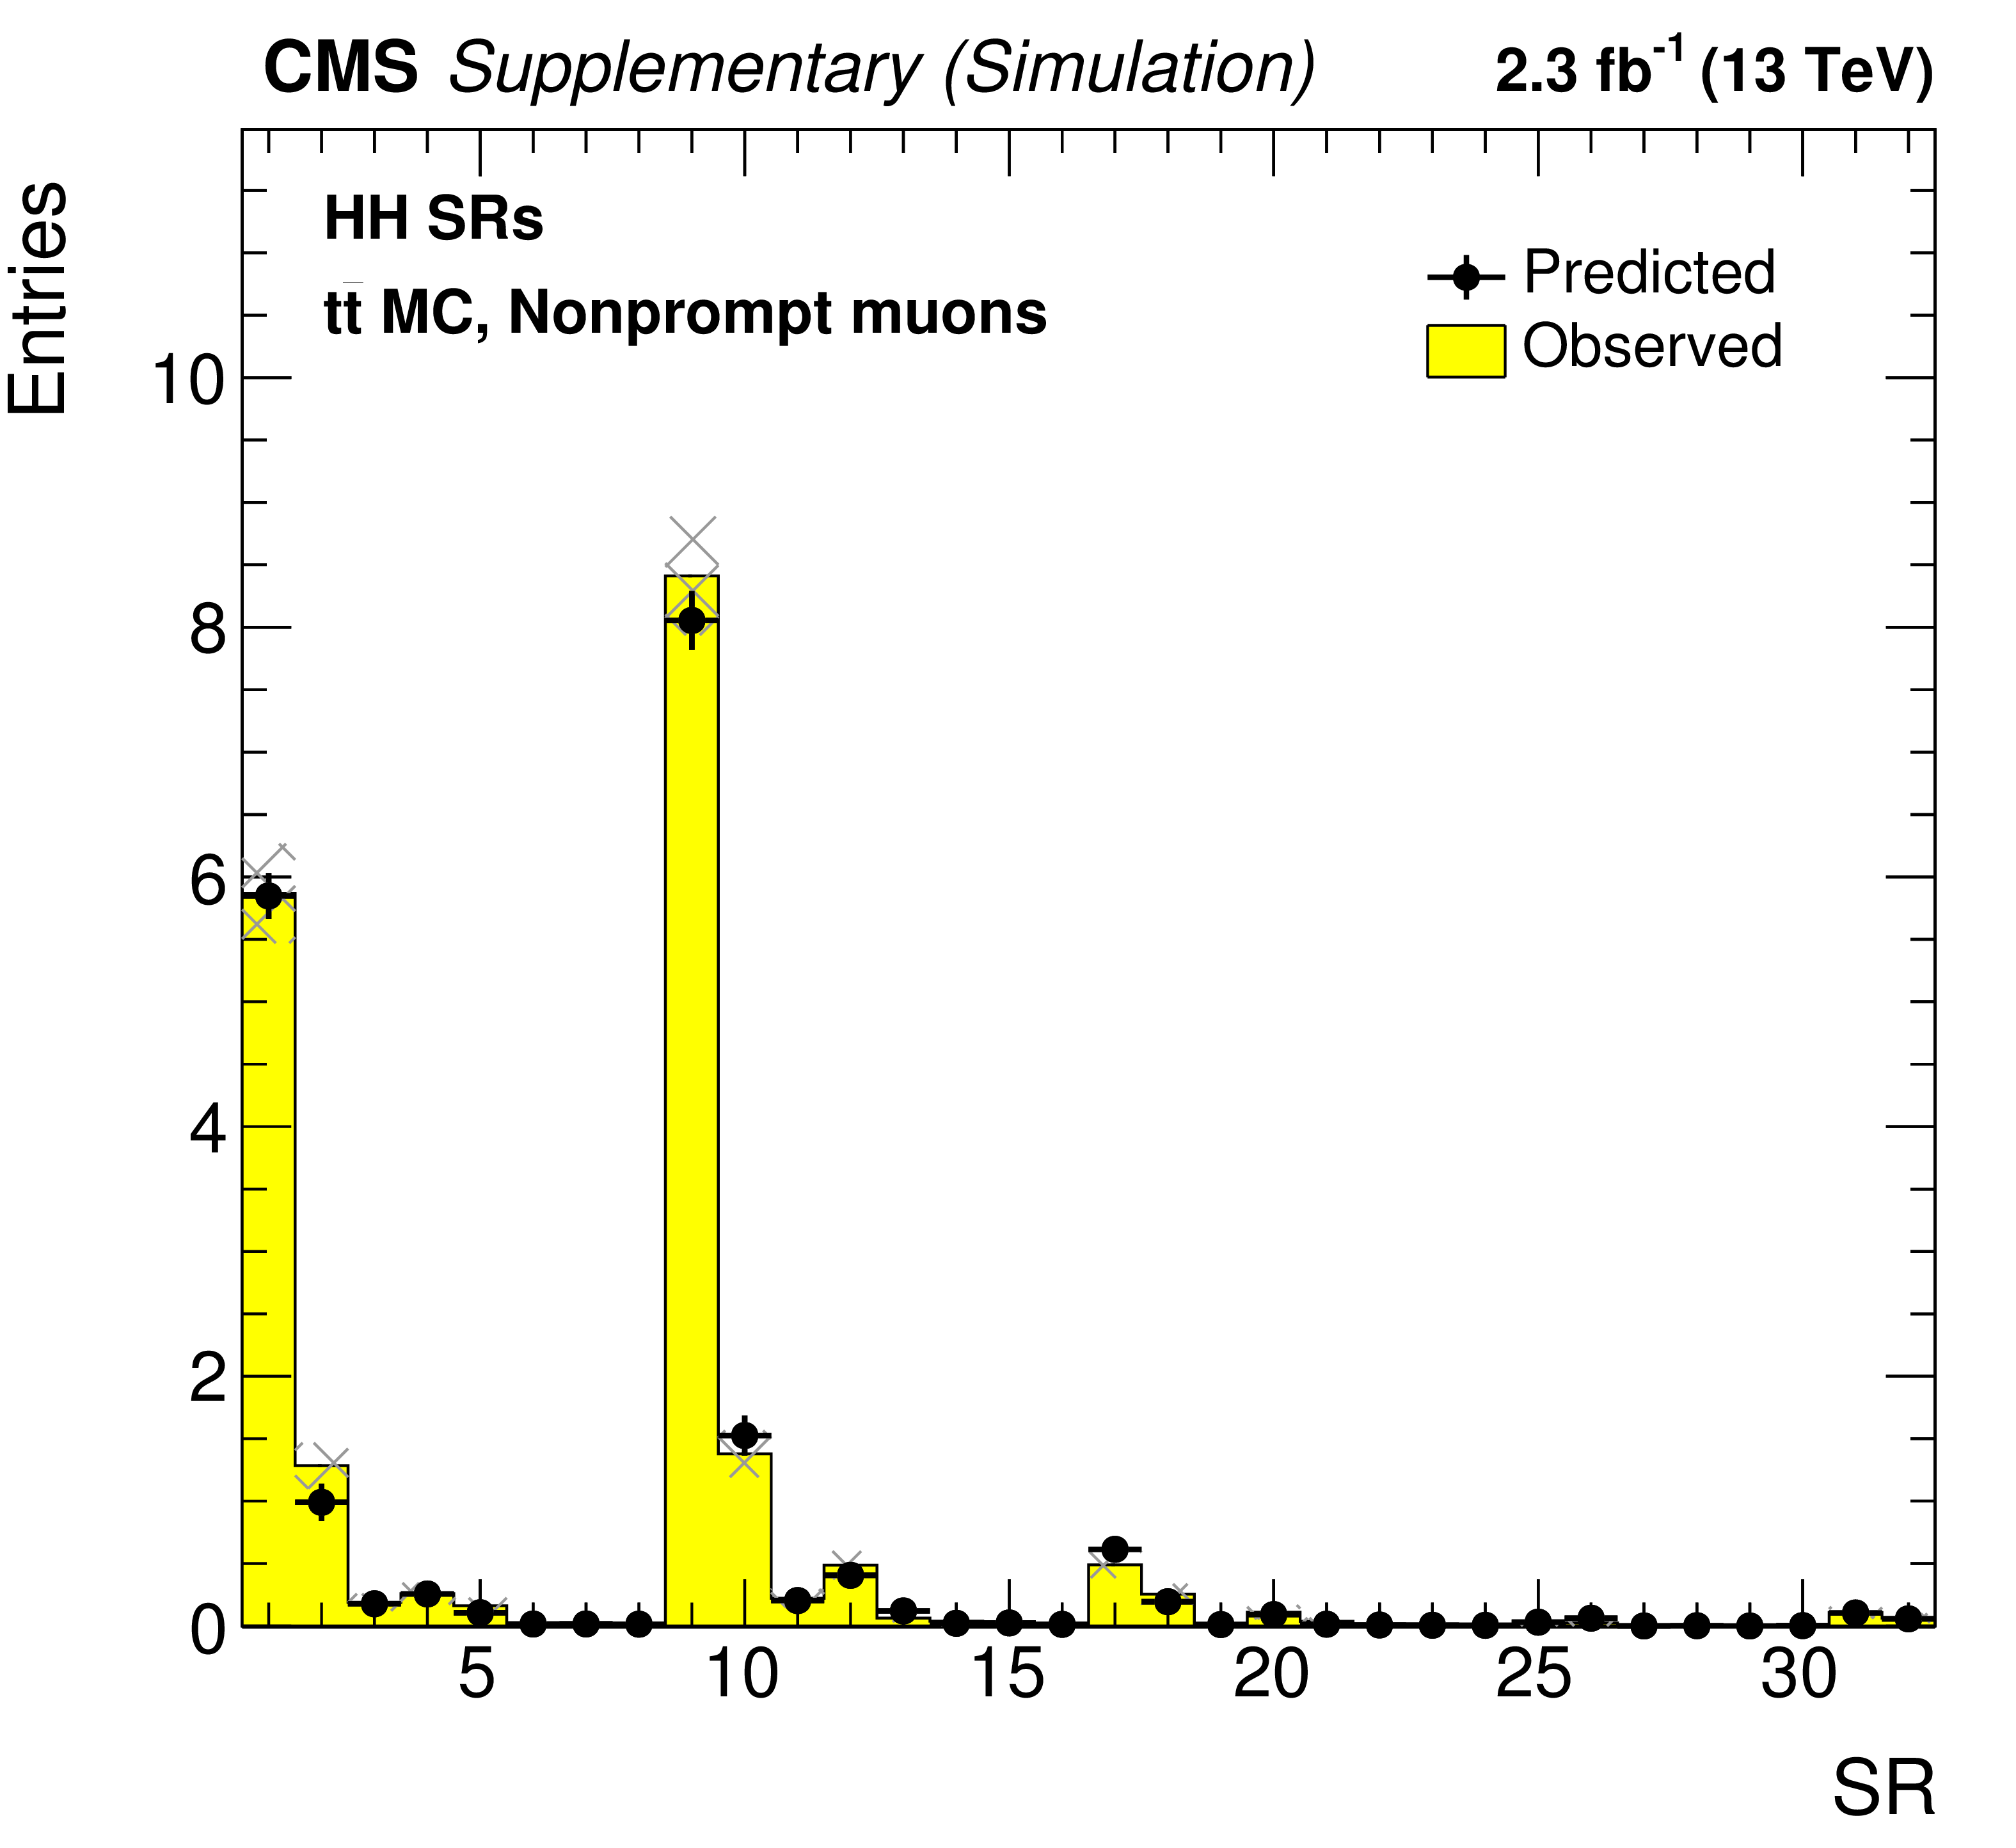
Additional Figure 16:
Closure test of the nonprompt muon background prediction in simulation in HH search regions. The yellow histogram corresponds to the yield of simulated $ {\mathrm{ t \bar{t} } } $ events in the search regions, while the dots represent the prediction from the ``tight-to-loose'' ratio method applied to simulated $ {\mathrm{ t \bar{t} } } $ events, using $\epsilon _{\rm TL}$ values estimated on simulated multijet events. The hatched area represents the statistical uncertainty in the number of observed simulated events. |
png pdf |
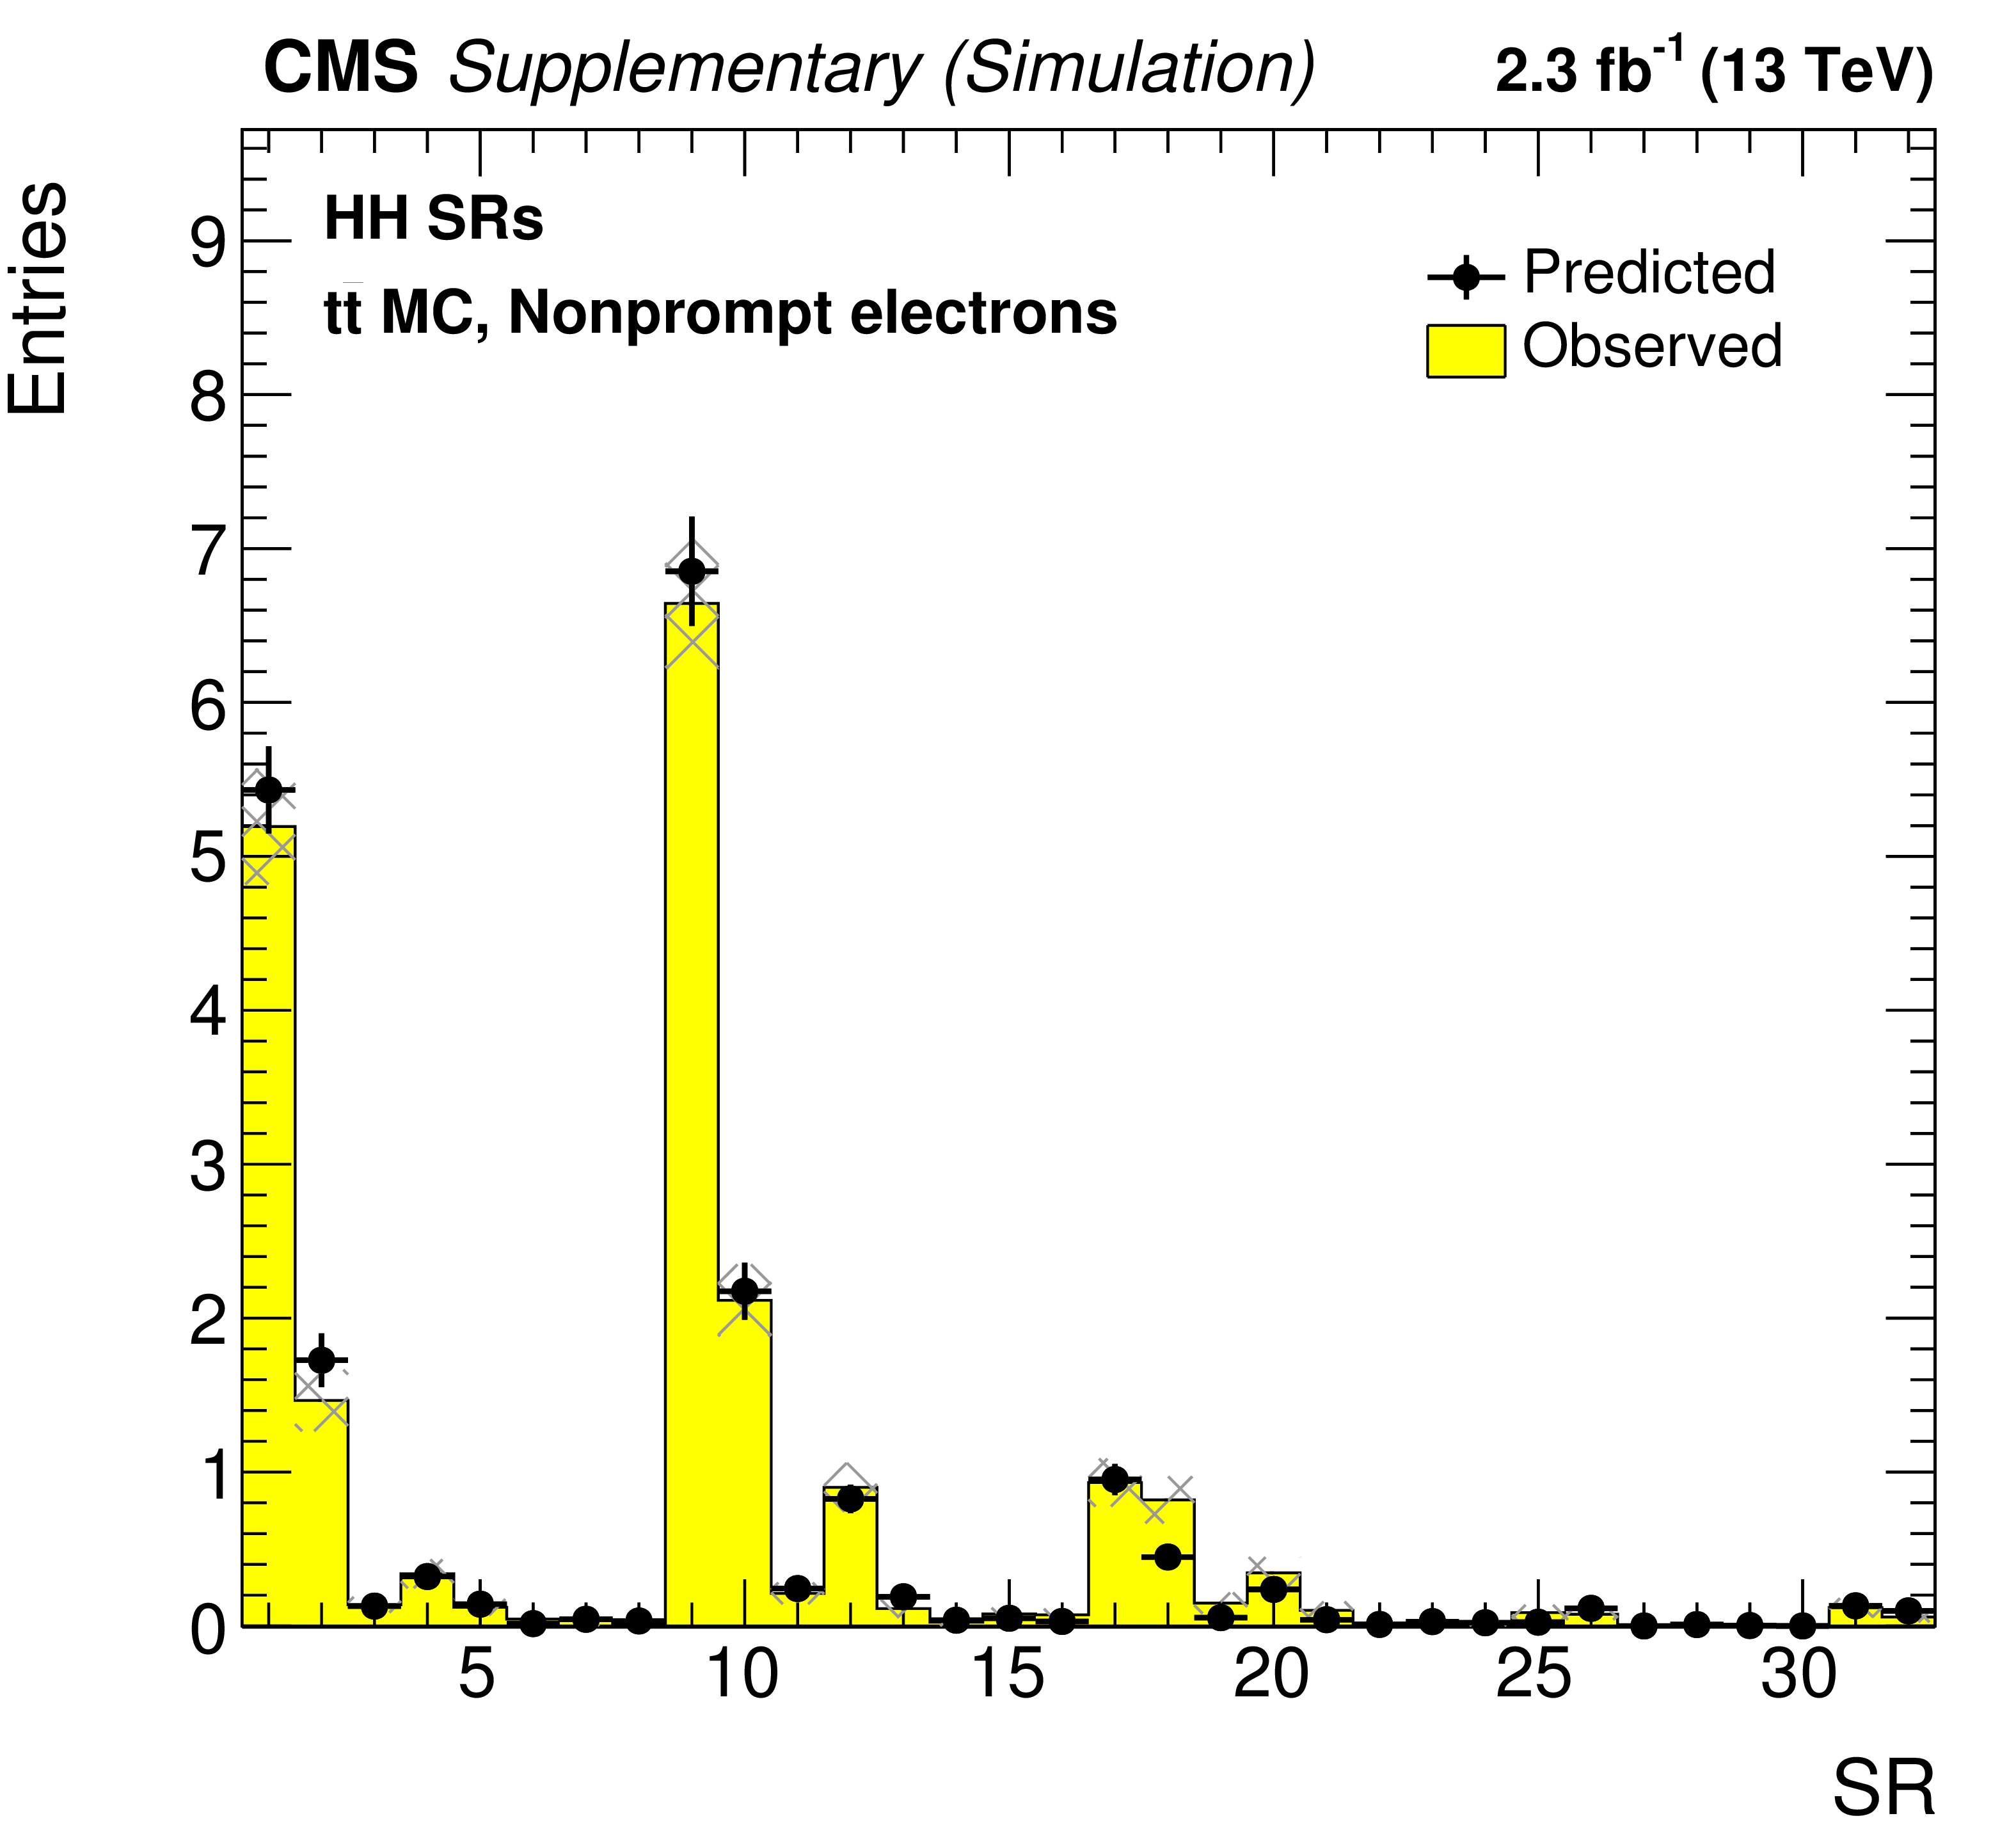
Additional Figure 17:
Closure test of the nonprompt electron background prediction in simulation in HH search regions. The yellow histogram corresponds to the yield of simulated $ {\mathrm{ t \bar{t} } } $ events in the search regions, while the dots represent the prediction from the ``tight-to-loose'' ratio method applied to simulated $ {\mathrm{ t \bar{t} } } $ events, using $\epsilon _{\rm TL}$ values estimated on simulated multijet events. The hatched area represents the statistical uncertainty in the number of observed simulated events. |

png pdf |
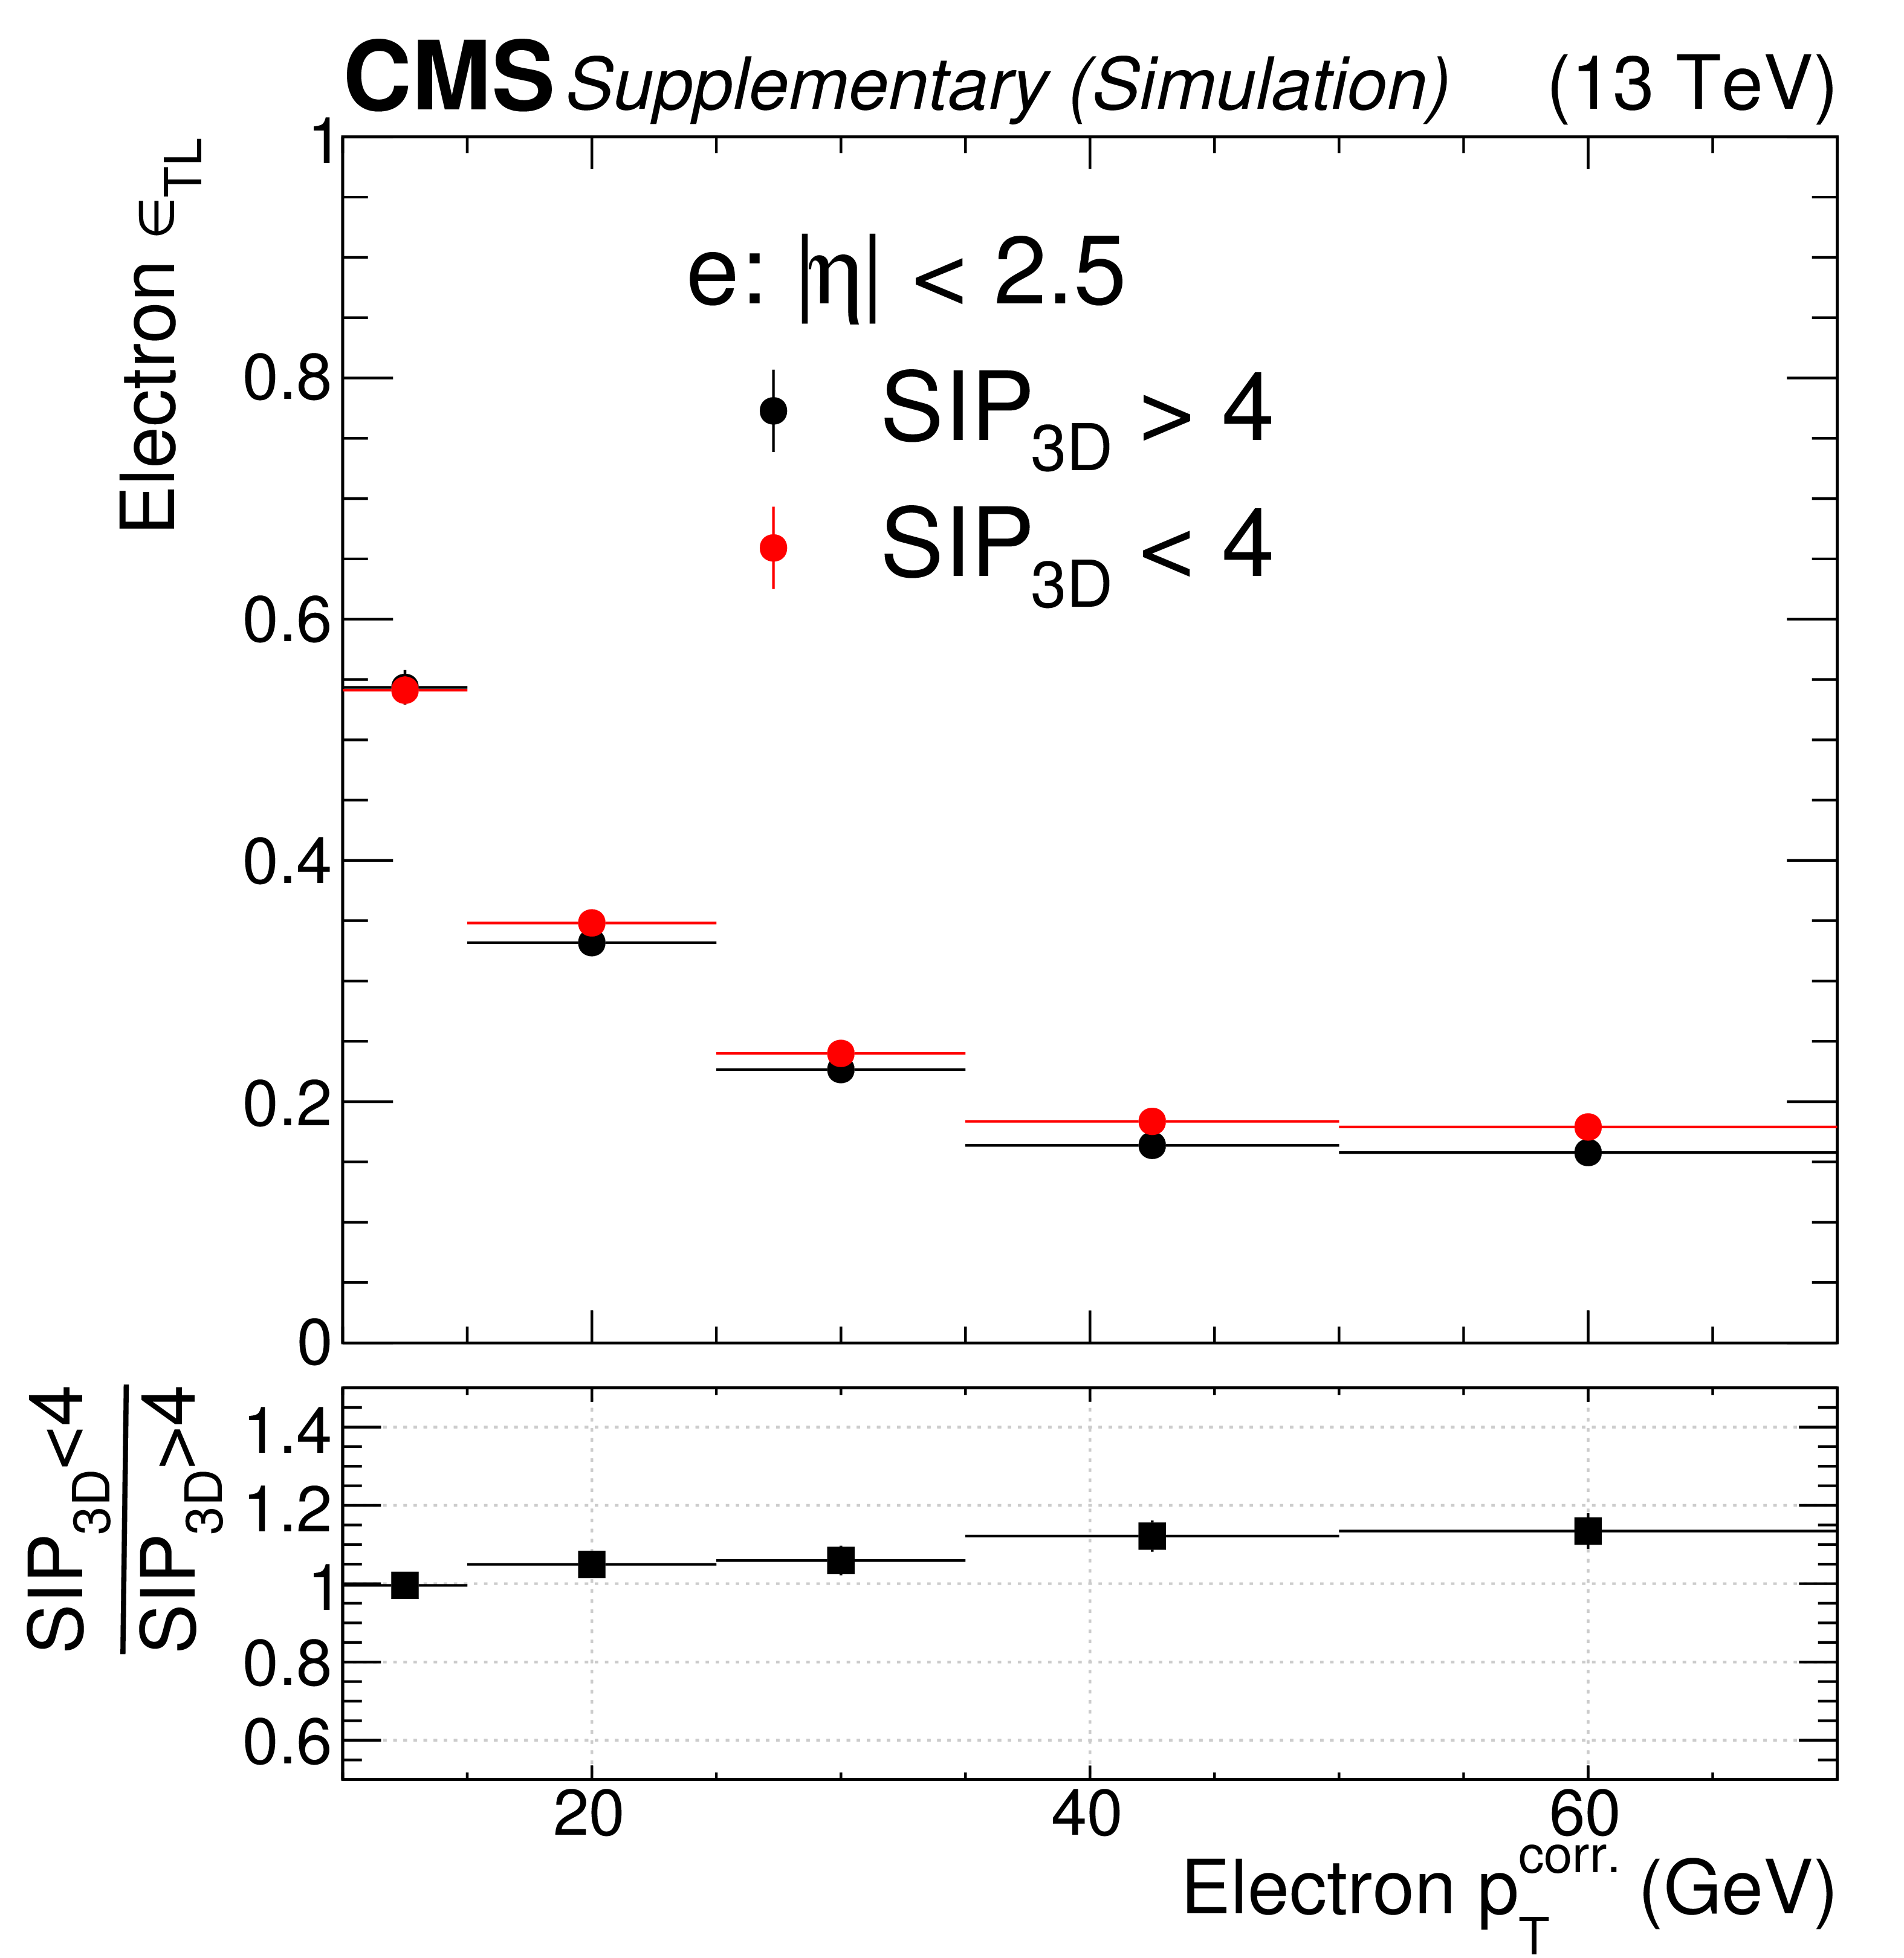
Additional Figure 18:
Measurement of $\epsilon _{\rm TL}$ for the alternative nonprompt lepton background prediction method in $ {\mathrm{ t \bar{t} } } $ simulated events after the baseline selection. Plots compare $\epsilon _{\rm TL}$ for muons passing and failing the impact parameter requirement. |
png pdf |
Additional Figure 19:
Measurement of $\epsilon _{\rm TL}$ for the alternative nonprompt lepton background prediction method in $ {\mathrm{ t \bar{t} } } $ simulated events after the baseline selection. Plots compare $\epsilon _{\rm TL}$ for electrons passing and failing the impact parameter requirement. |

png pdf |
Additional Figure 20:
Distributions of the b quark ${p_{\mathrm {T}}}$ for nonprompt muons from b hadron decays. Comparison for muons passing the loose vs muons passing the tight selection in multijet events. |

png pdf |
Additional Figure 21:
Distributions of the b quark ${p_{\mathrm {T}}}$ for nonprompt muons from b hadron decays. Comparison for muons passing the loose selection in multijet vs ${\mathrm{ t \bar{t} } }$ events. |
| Additional Tables | |

png pdf |
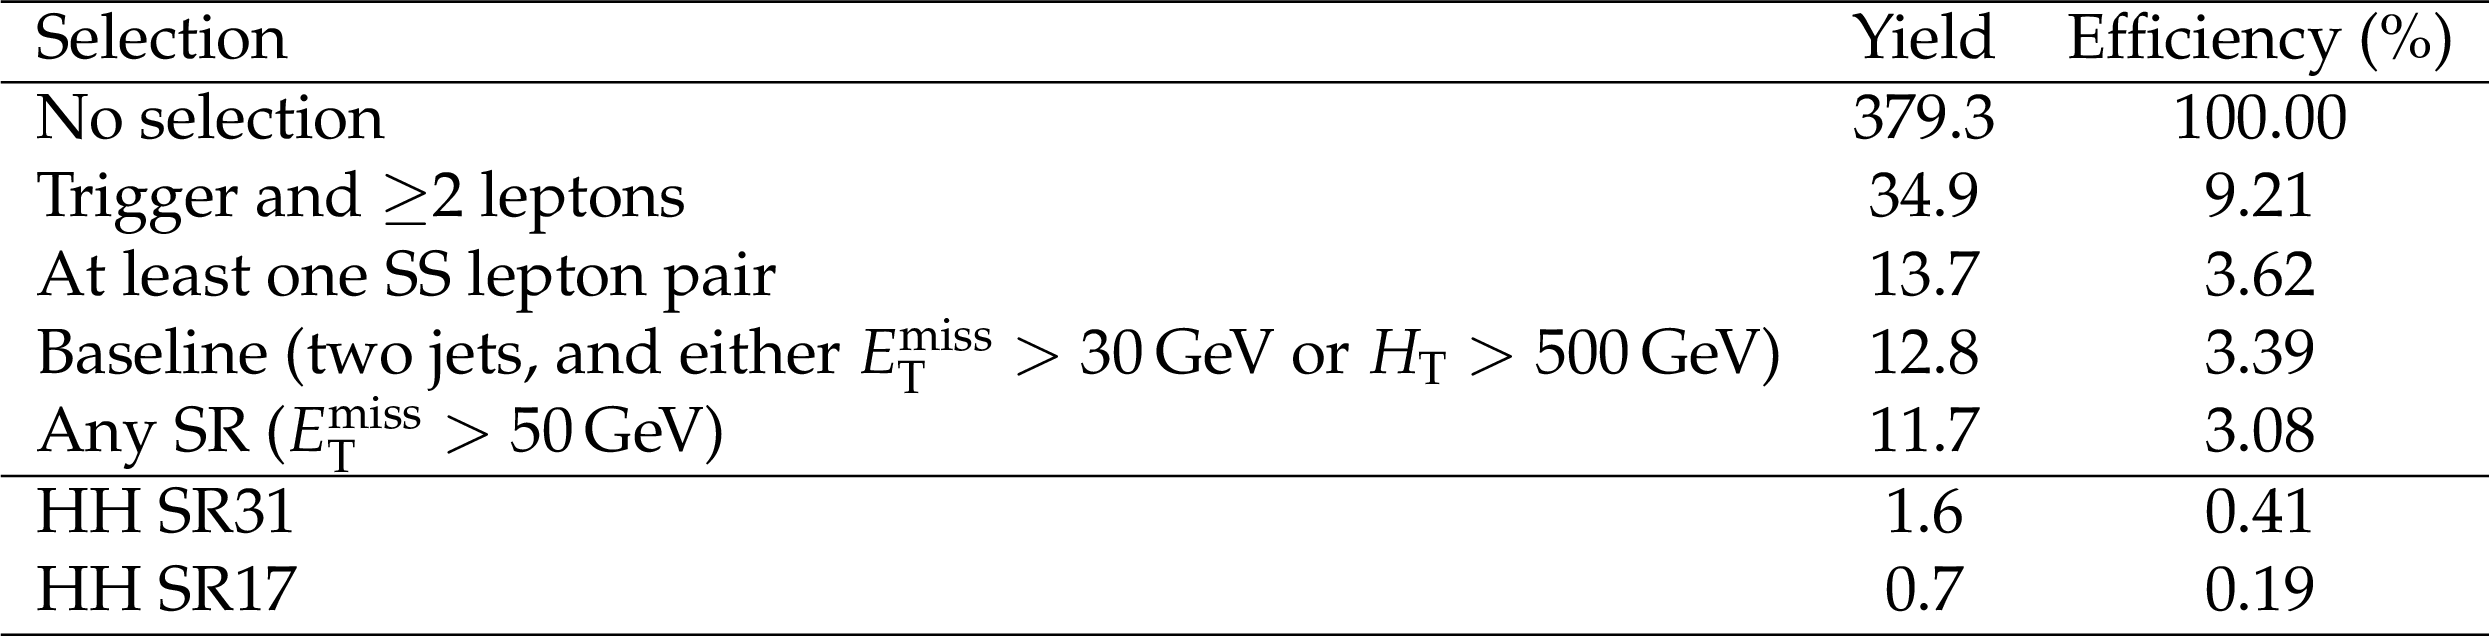
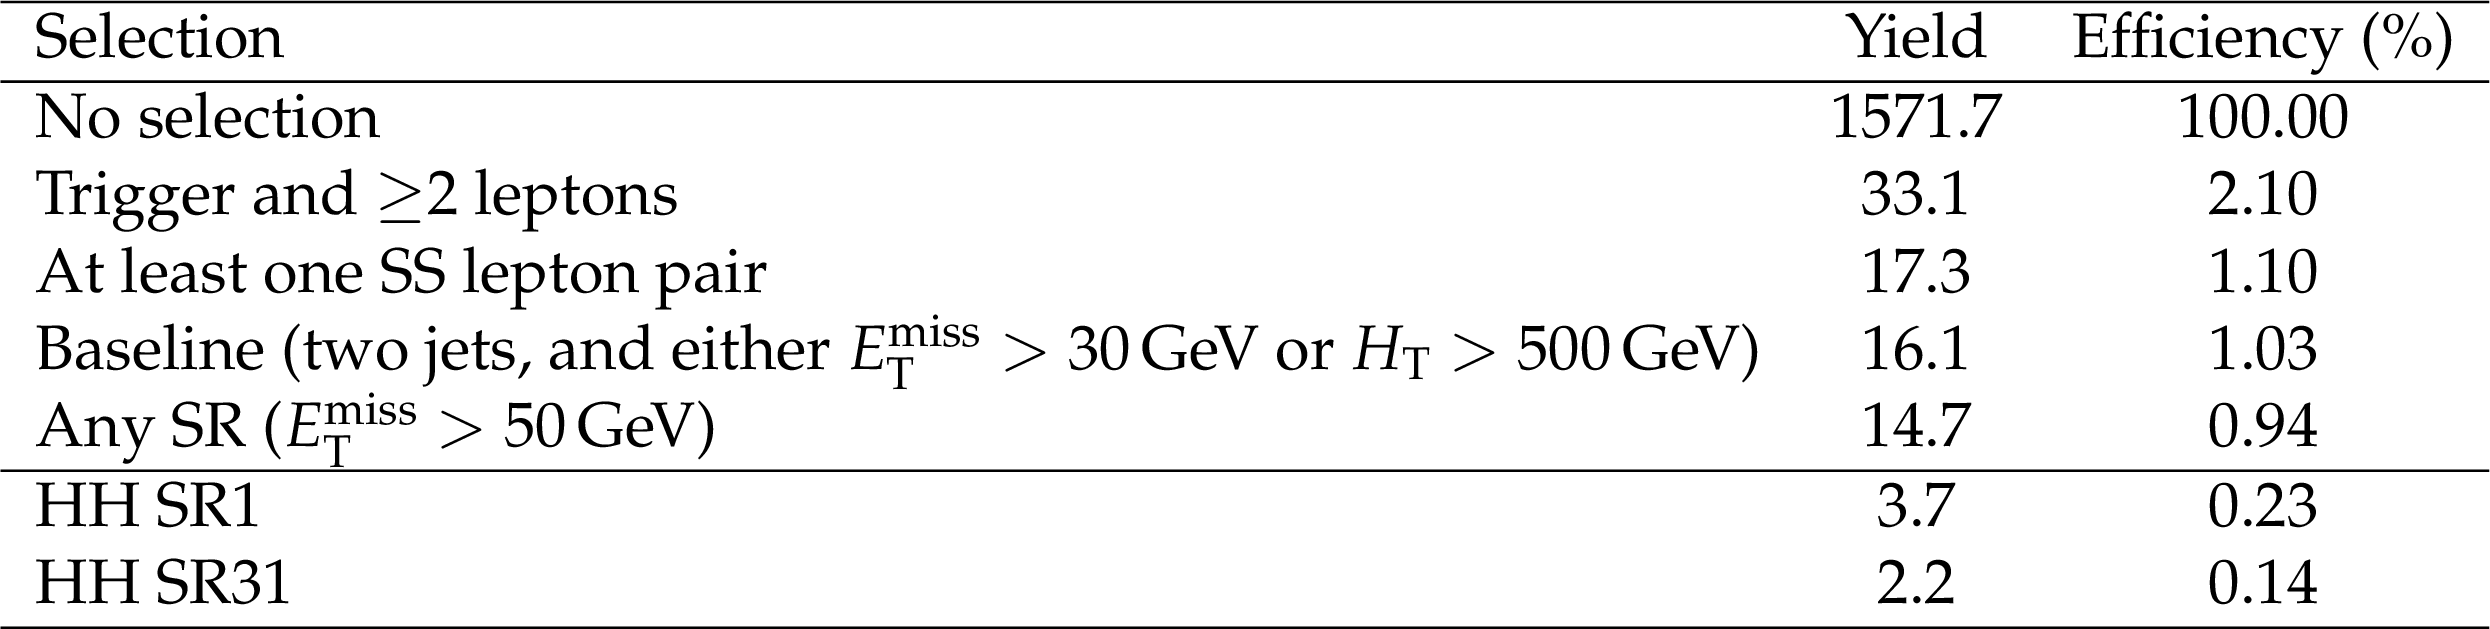
Additional Table 1:
Cut flow table for the T1tttt model assuming gluino and LSP masses equal to 1300 and 100 GeV, respectively. The last two lines correspond to the most populated search regions. The predicted cross section for this model is 0.046 pb. |

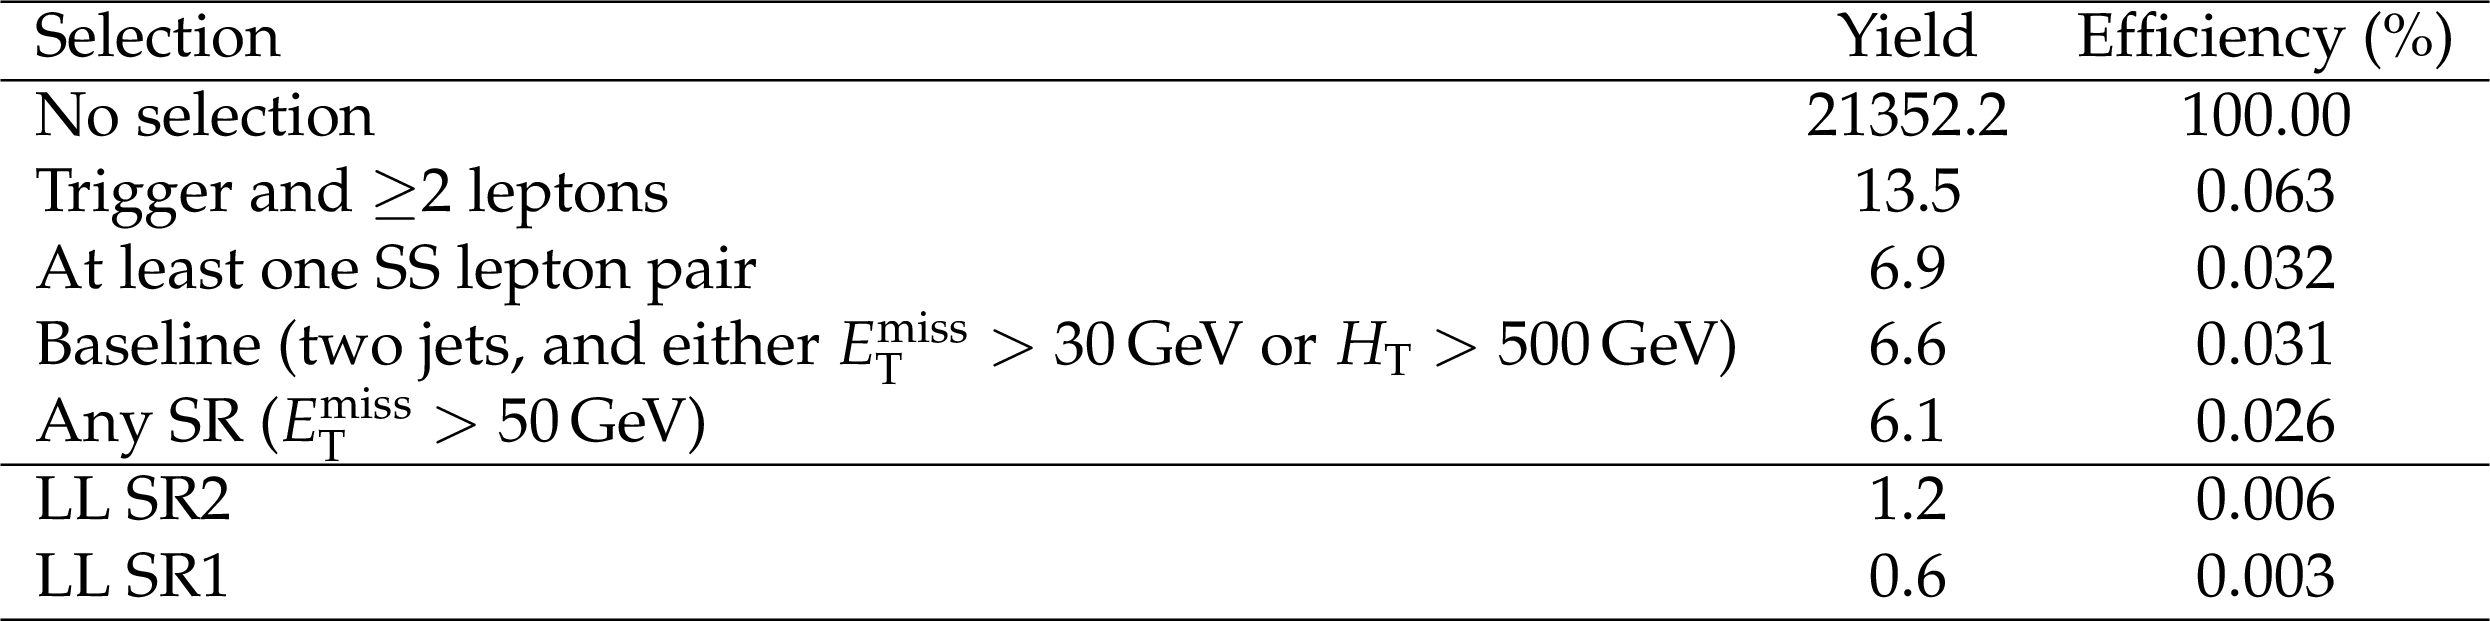
png pdf |
Additional Table 2:
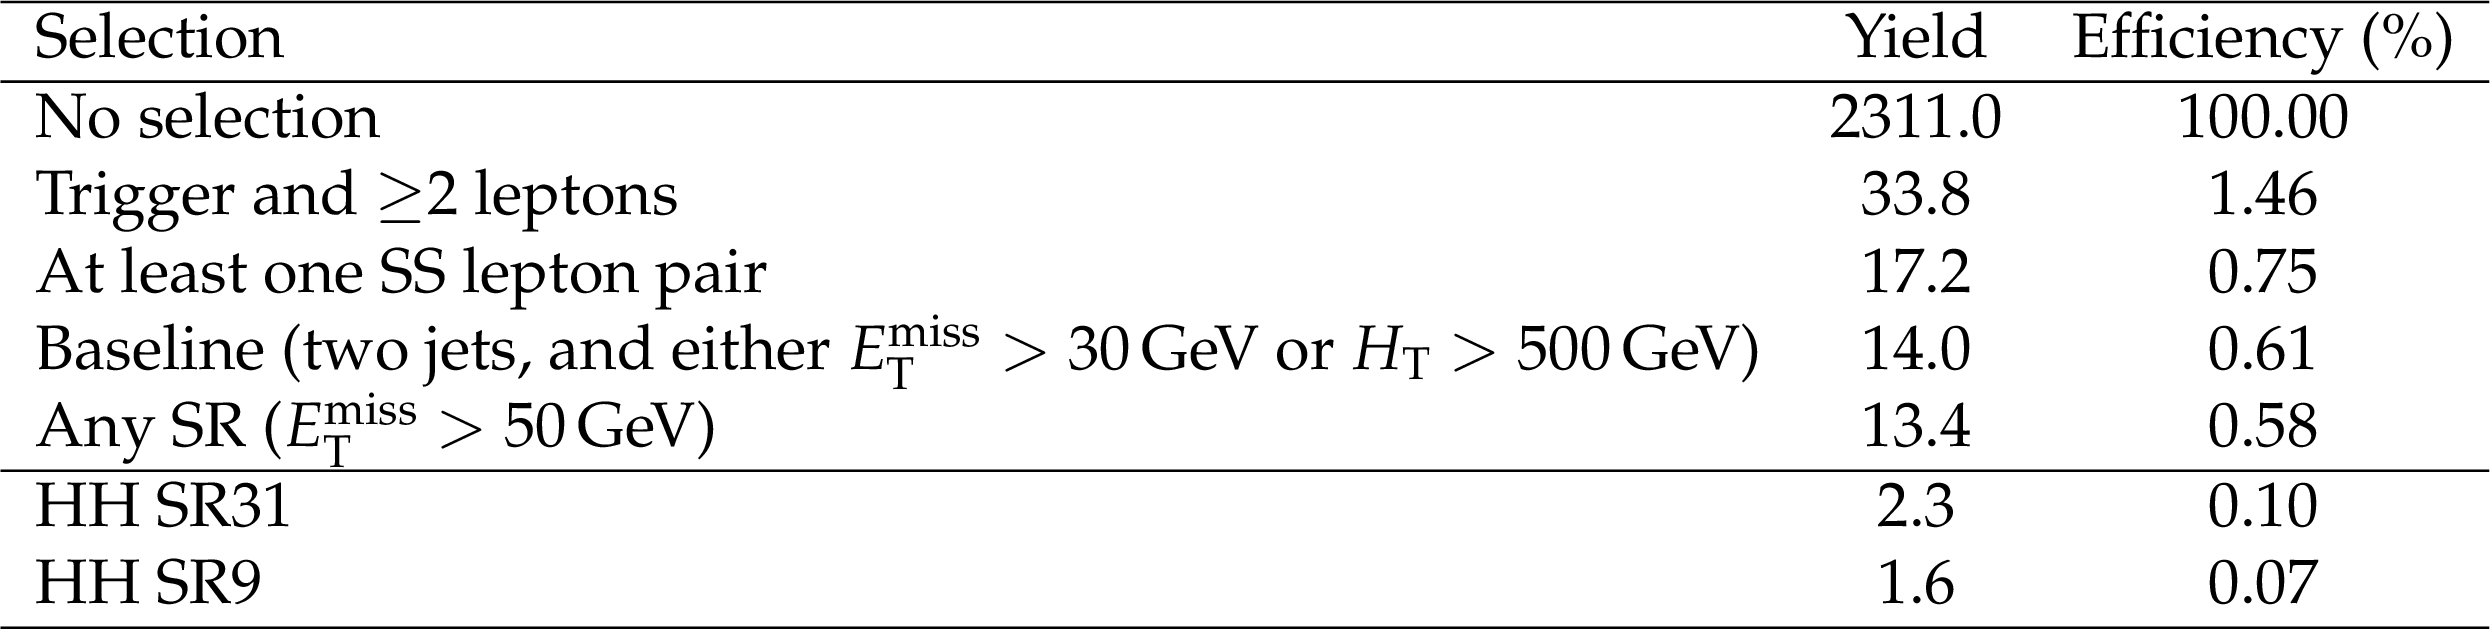
Cut flow table for the T1tttt model assuming gluino and LSP masses equal to 1100 and 800 GeV, respectively. The last two lines correspond to the most populated search regions. The predicted cross section for this model is 0.16 pb. |

png pdf |
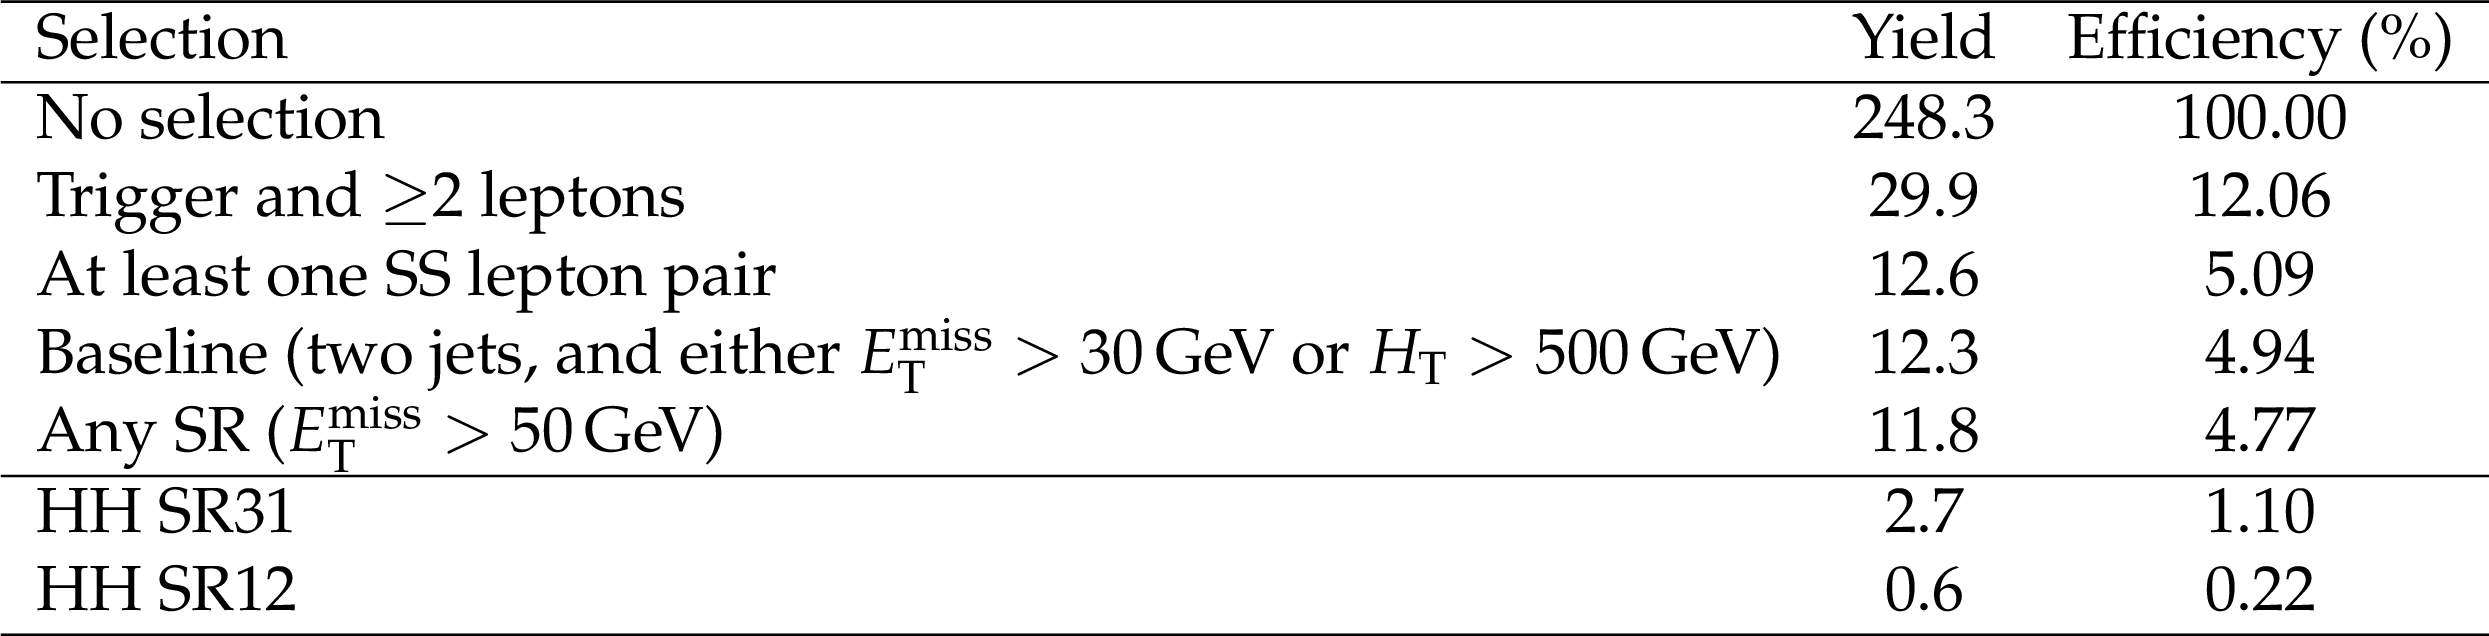
Additional Table 3:
Cut flow table for the T5ttbbWW model assuming gluino and LSP masses equal to 1300 and 100 GeV, respectively. The last two lines correspond to the most populated search regions. The predicted cross section for this model is 0.046 pb. |
png pdf |
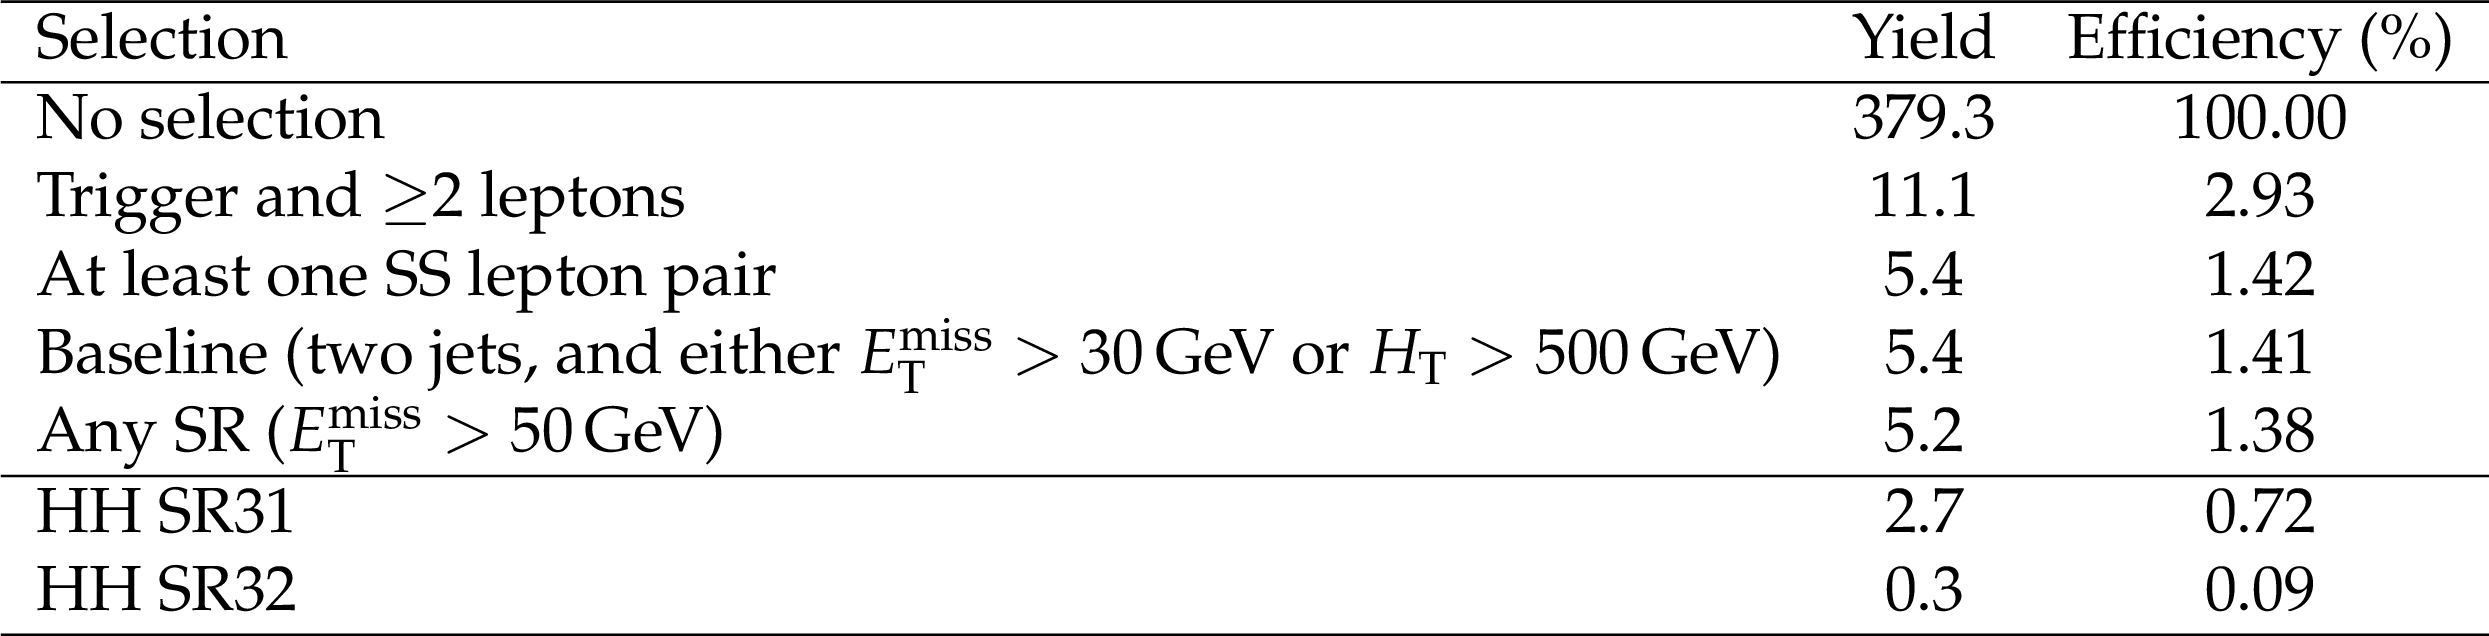
Additional Table 4:
Cut flow table for the T5ttbbWW model assuming gluino and LSP masses equal to 1000 and 700 GeV, respectively. The last two lines correspond to the most populated search regions. The predicted cross section for this model is 0.33 pb. |
png pdf |
Additional Table 5:
Cut flow table for the T5tttt model with $m_{ \mathrm{ \tilde{t}_1 } } = m_{ {\tilde{\chi}^0_1} } + m_{\rm t}$, assuming gluino and LSP masses equal to 1300 and 100 GeV, respectively. The last two lines correspond to the most populated search regions. The predicted cross section for this model is 0.046 pb. |
png pdf |
Additional Table 6:
Cut flow table for the T5tttt model with $m_{ \mathrm{ \tilde{t}_1 } } = m_{ {\tilde{\chi}^0_1} } + m_{\rm t}$, assuming gluino and LSP masses equal to 1100 and 800 GeV, respectively. The last two lines correspond to the most populated search regions. The predicted cross section for this model is 0.16 pb. |

png pdf |
Additional Table 7:
Cut flow table for the T5tttt model with $m_{ \mathrm{ \tilde{t}_1 } } = m_{ {\tilde{\chi}^0_1} }$ + 20 GeV , assuming gluino and LSP masses equal to 1100 and 100 GeV, respectively. The last two lines correspond to the most populated search regions. The predicted cross section for this model is 0.16 pb. |

png pdf |
Additional Table 8:
Cut flow table for the T5tttt model with $m_{ \mathrm{ \tilde{t}_1 } } = m_{ {\tilde{\chi}^0_1} }$ + 20 GeV , assuming gluino and LSP masses equal to 850 and 700 GeV, respectively. The last two lines correspond to the most populated search regions. The predicted cross section for this model is 1.0 pb. |

png pdf |
Additional Table 9:
Cut flow table for the T5ttcc model assuming gluino and LSP masses equal to 1100 and 100 GeV, respectively. The last two lines correspond to the most populated search regions. The predicted cross section for this model is 0.16 pb. |
png pdf |
Additional Table 10:
Cut flow table for the T5ttcc model assuming gluino and LSP masses equal to 850 and 700 GeV, respectively. The last two lines correspond to the most populated search regions. The predicted cross section for this model is 1.0 pb. |
png pdf |
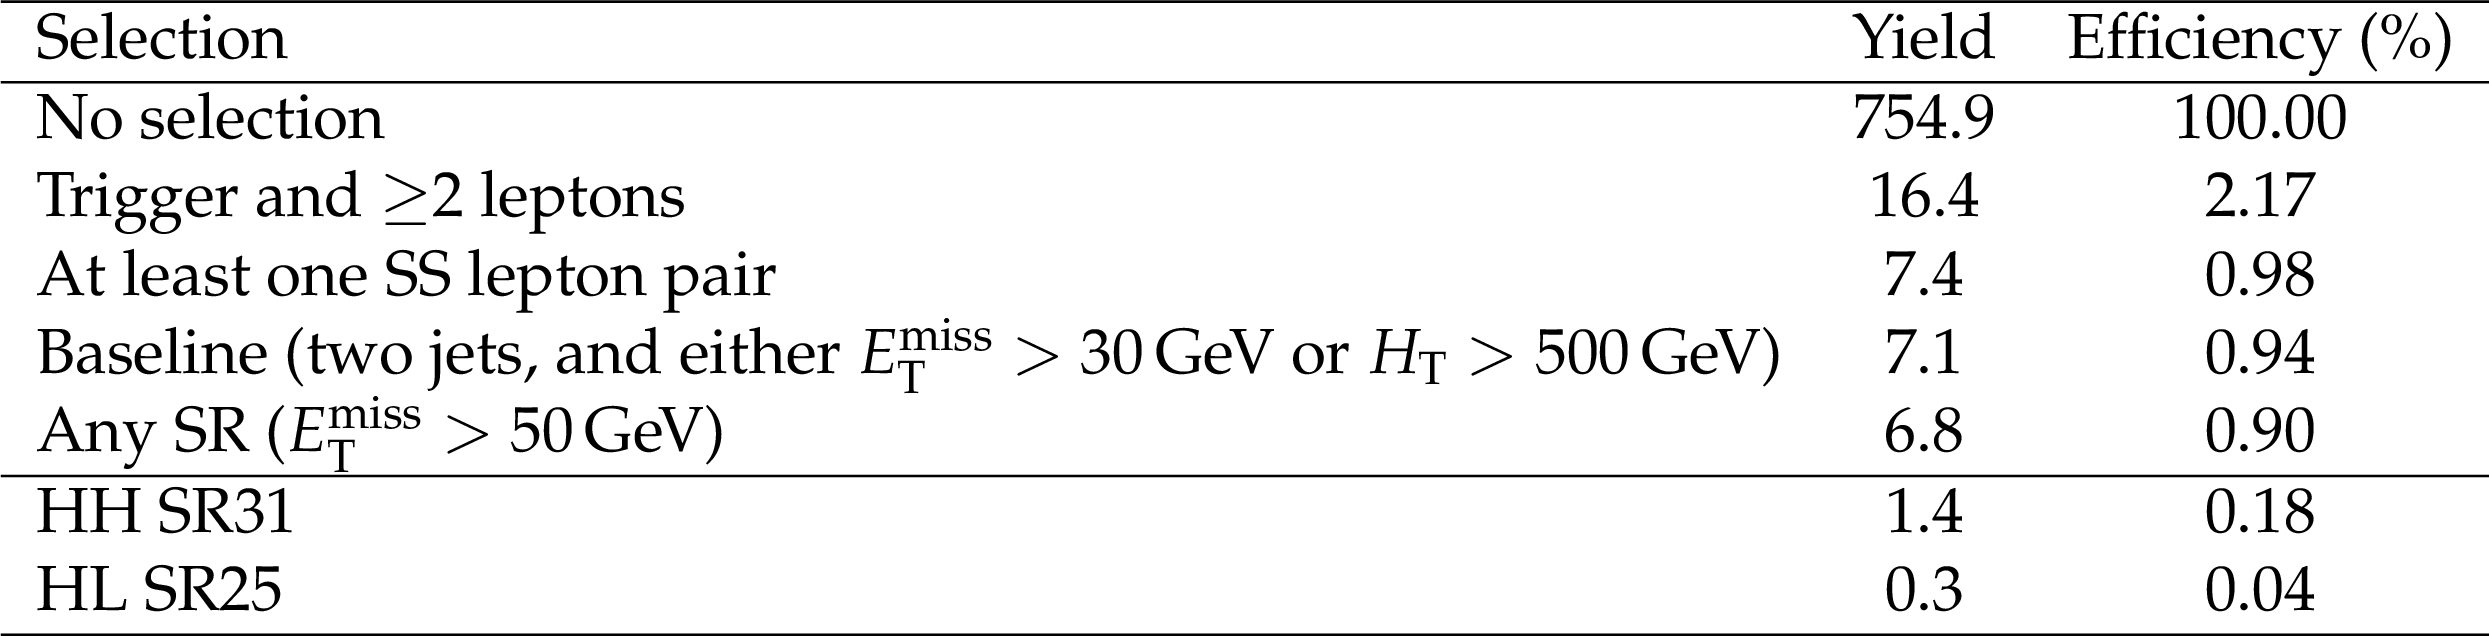
Additional Table 11:
Cut flow table for the T6ttWW model assuming bottom squark and chargino masses equal to 650 and 300 GeV, respectively. The last two lines correspond to the most populated search regions. The predicted cross section for this model is 0.11 pb. |

png pdf |
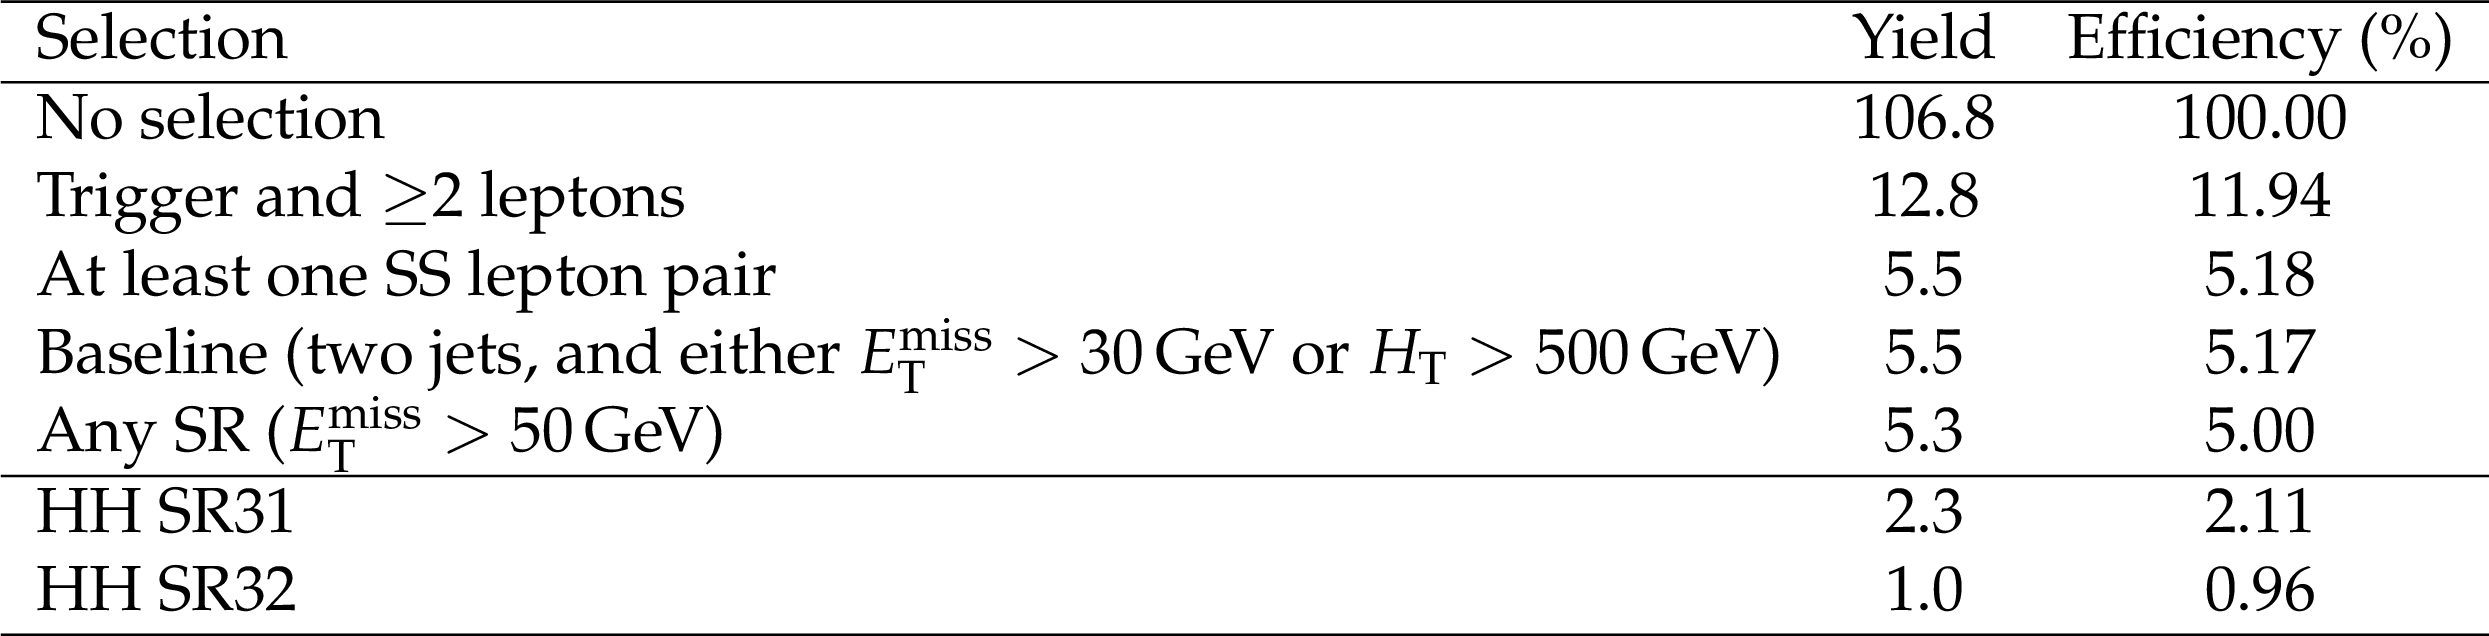
Additional Table 12:
Cut flow table for the T6ttWW model assuming bottom squark and chargino masses equal to 550 and 500 GeV, respectively. The last two lines correspond to the most populated search regions. The predicted cross section for this model is 0.30 pb. |
png pdf |
Additional Table 13:
Cut flow table for the T5qqqqWW model with $m_{ {\tilde{\chi}^\pm _1} }=0.5(m_{ \mathrm{ \tilde{g} } } + m_{ {\tilde{\chi}^0_1} })$, assuming gluino and LSP masses equal to 1100 and 100 GeV, respectively. The last two lines correspond to the most populated search regions. The predicted cross section for this model is 0.16 pb. |
png pdf |
Additional Table 14:
Cut flow table for the T5qqqqWW model with $m_{ {\tilde{\chi}^\pm _1} }=0.5(m_{ \mathrm{ \tilde{g} } } + m_{ {\tilde{\chi}^0_1} })$, assuming gluino and LSP masses equal to 900 and 700 GeV, respectively. The last two lines correspond to the most populated search regions. The predicted cross section for this model is 0.68 pb. |

png pdf |
Additional Table 15:
Cut flow table for the T5qqqqWW model with $m_{ {\tilde{\chi}^\pm _1} } = m_{ {\tilde{\chi}^0_1} }$ + 20 GeV , assuming gluino and LSP masses equal to 1000 and 50 GeV, respectively. The last two lines correspond to the most populated search regions. The predicted cross section for this model is 0.33 pb. |
png pdf |
Additional Table 16:
Cut flow table for the T5qqqqWW model with $m_{ {\tilde{\chi}^\pm _1} } = m_{ {\tilde{\chi}^0_1} }$ + 20 GeV , assuming gluino and LSP masses equal to 600 and 450 GeV, respectively. The last two lines correspond to the most populated search regions. The predicted cross section for this model is 9.2 pb. |
| References | ||||
| 1 | R. M. Barnett, J. F. Gunion, and H. E. Haber | Discovering supersymmetry with like-sign dileptons | PLB 315 (1993) 349 | hep-ph/9306204 |
| 2 | M. Guchait and D. P. Roy | Like-sign dilepton signature for gluino production at CERN LHC including top quark and Higgs boson effects | PRD 52 (1995) 133 | hep-ph/9412329 |
| 3 | F. M. L. Almeida, Jr. et al. | Same-sign dileptons as a signature for heavy Majorana neutrinos in hadron-hadron collisions | PLB 400 (1997) 331 | hep-ph/9703441 |
| 4 | R. Contino and G. Servant | Discovering the top partners at the LHC using same-sign dilepton final states | JHEP 06 (2008) 026 | 0801.1679 |
| 5 | Y. Bai and Z. Han | Top-antitop and top-top resonances in the dilepton channel at the CERN LHC | JHEP 04 (2009) 056 | 0809.4487 |
| 6 | E. L. Berger et al. | Top quark forward-backward asymmetry and same-sign top quark pairs | PRL 106 (2011) 201801 | 1101.5625 |
| 7 | P. Ramond | Dual theory for free fermions | PRD 3 (1971) 2415 | |
| 8 | Yu. A. Golfand and E. P. Likhtman | Extension of the algebra of Poincare group generators and violation of P invariance | JEPTL 13 (1971) 323.[Pisma Zh. Eksp. Teor. Fiz. 13 (1971) 452] | |
| 9 | A. Neveu and J. H. Schwarz | Factorizable dual model of pions | Nucl. Phys. B 31 (1971) 86 | |
| 10 | D. V. Volkov and V. P. Akulov | Possible universal neutrino interaction | JEPTL 16 (1972) 438.[Pisma Zh. Eksp. Teor. Fiz. 16 (1972) 621] | |
| 11 | J. Wess and B. Zumino | A lagrangian model invariant under supergauge transformations | PLB 49 (1974) 52 | |
| 12 | J. Wess and B. Zumino | Supergauge transformations in four-dimensions | Nucl. Phys. B 70 (1974) 39 | |
| 13 | P. Fayet | Supergauge invariant extension of the Higgs mechanism and a model for the electron and its neutrino | Nucl. Phys. B 90 (1975) 104 | |
| 14 | H. P. Nilles | Supersymmetry, supergravity and particle physics | PR 110 (1984) 1 | |
| 15 | S. P. Martin | A supersymmetry primer | volume 21 1 2010 | hep-ph/9709356 |
| 16 | ATLAS Collaboration | Search for gluinos in events with two same-sign leptons, jets and missing transverse momentum with the ATLAS detector in pp collisions at $ \sqrt{s} = $ 7 TeV | PRL 108 (2012) 241802 | 1203.5763 |
| 17 | ATLAS Collaboration | Search for supersymmetry at $ \sqrt{s} = $ 8 TeV in final states with jets and two same-sign leptons or three leptons with the ATLAS detector | JHEP 06 (2014) 035 | 1404.2500 |
| 18 | ATLAS Collaboration | Search for supersymmetry at $ \sqrt{s} = $ 13 TeV in final states with jets and two same-sign leptons or three leptons with the ATLAS detector | \it Submitted to EPJC | 1602.09058 |
| 19 | CMS Collaboration | Search for new physics with same-sign isolated dilepton events with jets and missing transverse energy at the LHC | JHEP 06 (2011) 077 | CMS-SUS-10-004 1104.3168 |
| 20 | CMS Collaboration | Search for new physics in events with same-sign dileptons and b-tagged jets in pp collisions at $ \sqrt{s} = $ 7 TeV | JHEP 08 (2012) 110 | CMS-SUS-11-020 1205.3933 |
| 21 | CMS Collaboration | Search for new physics with same-sign isolated dilepton events with jets and missing transverse energy | PRL 109 (2012) 071803 | CMS-SUS-11-010 1205.6615 |
| 22 | CMS Collaboration | Search for new physics in events with same-sign dileptons and b jets in pp collisions at $ \sqrt{s} = $ 8 TeV | JHEP 03 (2013) 037 [Erratum: JHEP 07 (2013) 041] | CMS-SUS-12-017 1212.6194 |
| 23 | CMS Collaboration | Search for new physics in events with same-sign dileptons and jets in pp collisions at 8 TeV | JHEP 01 (2014) 163 | CMS-SUS-13-013 1311.6736 |
| 24 | G. R. Farrar and P. Fayet | Phenomenology of the production, decay, and detection of new hadronic states associated with supersymmetry | PLB 76 (1978) 575 | |
| 25 | CMS Collaboration | The CMS experiment at the CERN LHC | JINST 3 (2008) S08004 | CMS-00-001 |
| 26 | CMS Collaboration | Performance of CMS muon reconstruction in pp collision events at $ \sqrt{s} = $ 7 TeV | JINST 7 (2012) P10002 | CMS-MUO-10-004 1206.4071 |
| 27 | CMS Collaboration | Performance of electron reconstruction and selection with the CMS detector in proton-proton collisions at $ \sqrt{s} = $ 8 TeV | JINST 10 (2015) P06005 | CMS-EGM-13-001 1502.02701 |
| 28 | K. Rehermann and B. Tweedie | Efficient identification of boosted semileptonic top quarks at the LHC | JHEP 03 (2011) 059 | 1007.2221 |
| 29 | UA1 Collaboration | Beauty production at the CERN proton-antiproton collider | PLB 186 (1987) 237 | |
| 30 | CMS Collaboration | Particle-flow event reconstruction in CMS and performance for jets, taus, and $ E_{\mathrm{T}}^{\text{miss}} $ | CDS | |
| 31 | CMS Collaboration | Commissioning of the particle-flow event reconstruction with the first LHC collisions recorded in the CMS detector | CDS | |
| 32 | CMS Collaboration | Performance of the CMS missing transverse momentum reconstruction in pp data at $ \sqrt{s} = $ 8 TeV | JINST 10 (2015) P02006 | CMS-JME-13-003 1411.0511 |
| 33 | M. Cacciari, G. P. Salam, and G. Soyez | The anti-$ k_t $ jet clustering algorithm | JHEP 04 (2008) 063 | 0802.1189 |
| 34 | CMS Collaboration | Determination of jet energy calibration and transverse momentum resolution in CMS | JINST 6 (2011) P11002 | CMS-JME-10-011 1107.4277 |
| 35 | CMS Collaboration | Identification of b quark jets at the CMS Experiment in the LHC Run 2 | CMS-PAS-BTV-15-001 | CMS-PAS-BTV-15-001 |
| 36 | J. Alwall et al. | The automated computation of tree-level and next-to-leading order differential cross sections, and their matching to parton shower simulations | JHEP 07 (2014) 079 | 1405.0301 |
| 37 | T. Melia, P. Nason, R. Rontsch, and G. Zanderighi | $ \mathrm{ W }^+ \mathrm{ W }^- $, $ \mathrm{ W } \mathrm{ Z } $ and $ \mathrm{ Z } \mathrm{ Z } $ production in the POWHEG BOX | JHEP 11 (2011) 078 | 1107.5051 |
| 38 | P. Nason and G. Zanderighi | $ \mathrm{ W }^+ \mathrm{ W }^- $ , $ \mathrm{ W } \mathrm{ Z } $ and $ \mathrm{ Z } \mathrm{ Z } $ production in the POWHEG-BOX-V2 | EPJC 74 (2014) 2702 | 1311.1365 |
| 39 | NNPDF Collaboration | Parton distributions for the LHC Run II | JHEP 04 (2015) 040 | 1410.8849 |
| 40 | T. Sjostrand, S. Mrenna, and P. Z. Skands | A brief introduction to PYTHIA 8.1 | CPC 178 (2008) 852 | 0710.3820 |
| 41 | P. Skands, S. Carrazza, and J. Rojo | Tuning PYTHIA 8.1: the Monash 2013 tune | EPJC 74 (2014) 3024 | 1404.5630 |
| 42 | CMS Collaboration | Event generator tunes obtained from underlying event and multiparton scattering measurements | EPJC 76 (2016) 155 | CMS-GEN-14-001 1512.00815 |
| 43 | GEANT4 Collaboration | GEANT4---a simulation toolkit | NIMA 506 (2003) 250 | |
| 44 | S. Abdullin et al. | The fast simulation of the CMS detector at LHC | J. Phys. Conf. Ser. 331 (2011) 032049 | |
| 45 | D. Alves et al. | Simplified models for LHC new physics searches | JPG 39 (2012) 105005 | 1105.2838 |
| 46 | CMS Collaboration | Interpretation of searches for supersymmetry with simplified models | PRD 88 (2013) 052017 | CMS-SUS-11-016 1301.2175 |
| 47 | UA1 Collaboration | Experimental observation of isolated large transverse energy electrons with associated missing energy at $ \sqrt{s} =$ 540 GeV | PLB 122 (1983) 103 | |
| 48 | ATLAS Collaboration | Search for anomalous production of prompt same-sign lepton pairs and pair-produced doubly charged Higgs bosons with $ \sqrt{s} = $ 8 TeV pp collisions using the ATLAS detector | JHEP 03 (2015) 041 | 1412.0237 |
| 49 | CMS Collaboration | CMS luminosity measurement for the 2015 data taking period | CMS-PAS-LUM-15-001 | CMS-PAS-LUM-15-001 |
| 50 | A. L. Read | Presentation of search results: the $ \rm CL_s $ technique | JPG 28 (2002) 2693 | |
| 51 | T. Junk | Confidence level computation for combining searches with small statistics | NIMA 434 (1999) 435 | hep-ex/9902006 |
| 52 | ATLAS and CMS Collaborations | Procedure for the LHC Higgs boson search combination in summer 2011 | Technical Report CMS NOTE-2011/005, CERN | |
| 53 | G. Cowan, K. Cranmer, E. Gross, and O. Vitells | Asymptotic formulae for likelihood-based tests of new physics | EPJC 71 (2011) 1554 [Erratum: 10.1140/epjc/s10052-013-2501-z] | 1007.1727 |
| 54 | W. Beenakker, R. Hopker, M. Spira, and P. M. Zerwas | Squark and gluino production at hadron colliders | Nucl. Phys. B 492 (1997) 51 | hep-ph/9610490 |
| 55 | A. Kulesza and L. Motyka | Threshold resummation for squark-antisquark and gluino-pair production at the LHC | PRL 102 (2009) 111802 | 0807.2405 |
| 56 | A. Kulesza and L. Motyka | Soft gluon resummation for the production of gluino-gluino and squark-antisquark pairs at the LHC | PRD 80 (2009) 095004 | 0905.4749 |
| 57 | W. Beenakker et al. | Soft-gluon resummation for squark and gluino hadroproduction | JHEP 12 (2009) 041 | 0909.4418 |
| 58 | W. Beenakker et al. | Squark and gluino hadroproduction | Int. J. Mod. Phys. A 26 (2011) 2637 | 1105.1110 |
| 59 | C. Borschensky et al. | Squark and gluino production cross sections in pp collisions at $ \sqrt{s} = $ 13, 14, 33 and 100 TeV | EPJC 74 (2014) 3174 | 1407.5066 |
|
|
Compact Muon Solenoid LHC, CERN |
|

|

|

|

|

|