

Compact Muon Solenoid
LHC, CERN
| CMS-B2G-16-013 ; CERN-EP-2017-035 | ||
| Search for a heavy resonance decaying to a top quark and a vector-like top quark at $ \sqrt{s} = $ 13 TeV | ||
| CMS Collaboration | ||
| 18 March 2017 | ||
| JHEP 09 (2017) 053 | ||
| Abstract: A search is presented for massive spin-1 Z' resonances decaying to a top quark and a heavy vector-like top quark partner T. The search is based on a 2.6 fb$^{-1}$ sample of proton-proton collisions at 13 TeV collected with the CMS detector at the LHC. The analysis is optimized for final states in which the T quark decays to a W boson and a bottom quark. The focus is on all-jet final states in which both the W boson and the top quark decay into quarks that evolve into jets. The decay products of the top quark and of the W boson are assumed to be highly Lorentz-boosted and cannot be reconstructed as separate jets, but are instead reconstructed as merged, wide jets. Techniques for the identification of jet substructure and jet flavour are used to distinguish signal from background events. Several models for Z' bosons decaying to T quarks are excluded at 95% confidence level, with upper limits on the cross section ranging from 0.13 to 10 pb, depending on the chosen hypotheses. This is the first search for a neutral spin-1 heavy resonance decaying to a top quark and a vector-like T quark in the all-hadronic final state. | ||
| Links: e-print arXiv:1703.06352 [hep-ex] (PDF) ; CDS record ; inSPIRE record ; CADI line (restricted) ; | ||
| Figures | |

png pdf |
Figure 1:
The leading order Feynman diagram showing the production mode of the Z' boson and its decay chain. |

png pdf |
Figure 2:
Ratio of the number of events in the signal region to the number in the sideband region, as a function of the Z' mass, for simulated background QCD multijet events. The left (right) plot involves events with no (at least one) b-tagged subjet. The solid line shows a fit of a second-order polynomial function to the ratio. |

png pdf |
Figure 2-a:
Ratio of the number of events in the signal region to the number in the sideband region, as a function of the Z' mass, for simulated background QCD multijet events. The plot involves events with no b-tagged subjet. The solid line shows a fit of a second-order polynomial function to the ratio. |

png pdf |
Figure 2-b:
Ratio of the number of events in the signal region to the number in the sideband region, as a function of the Z' mass, for simulated background QCD multijet events. The plot involves events with at least one b-tagged subjet. The solid line shows a fit of a second-order polynomial function to the ratio. |
png pdf |
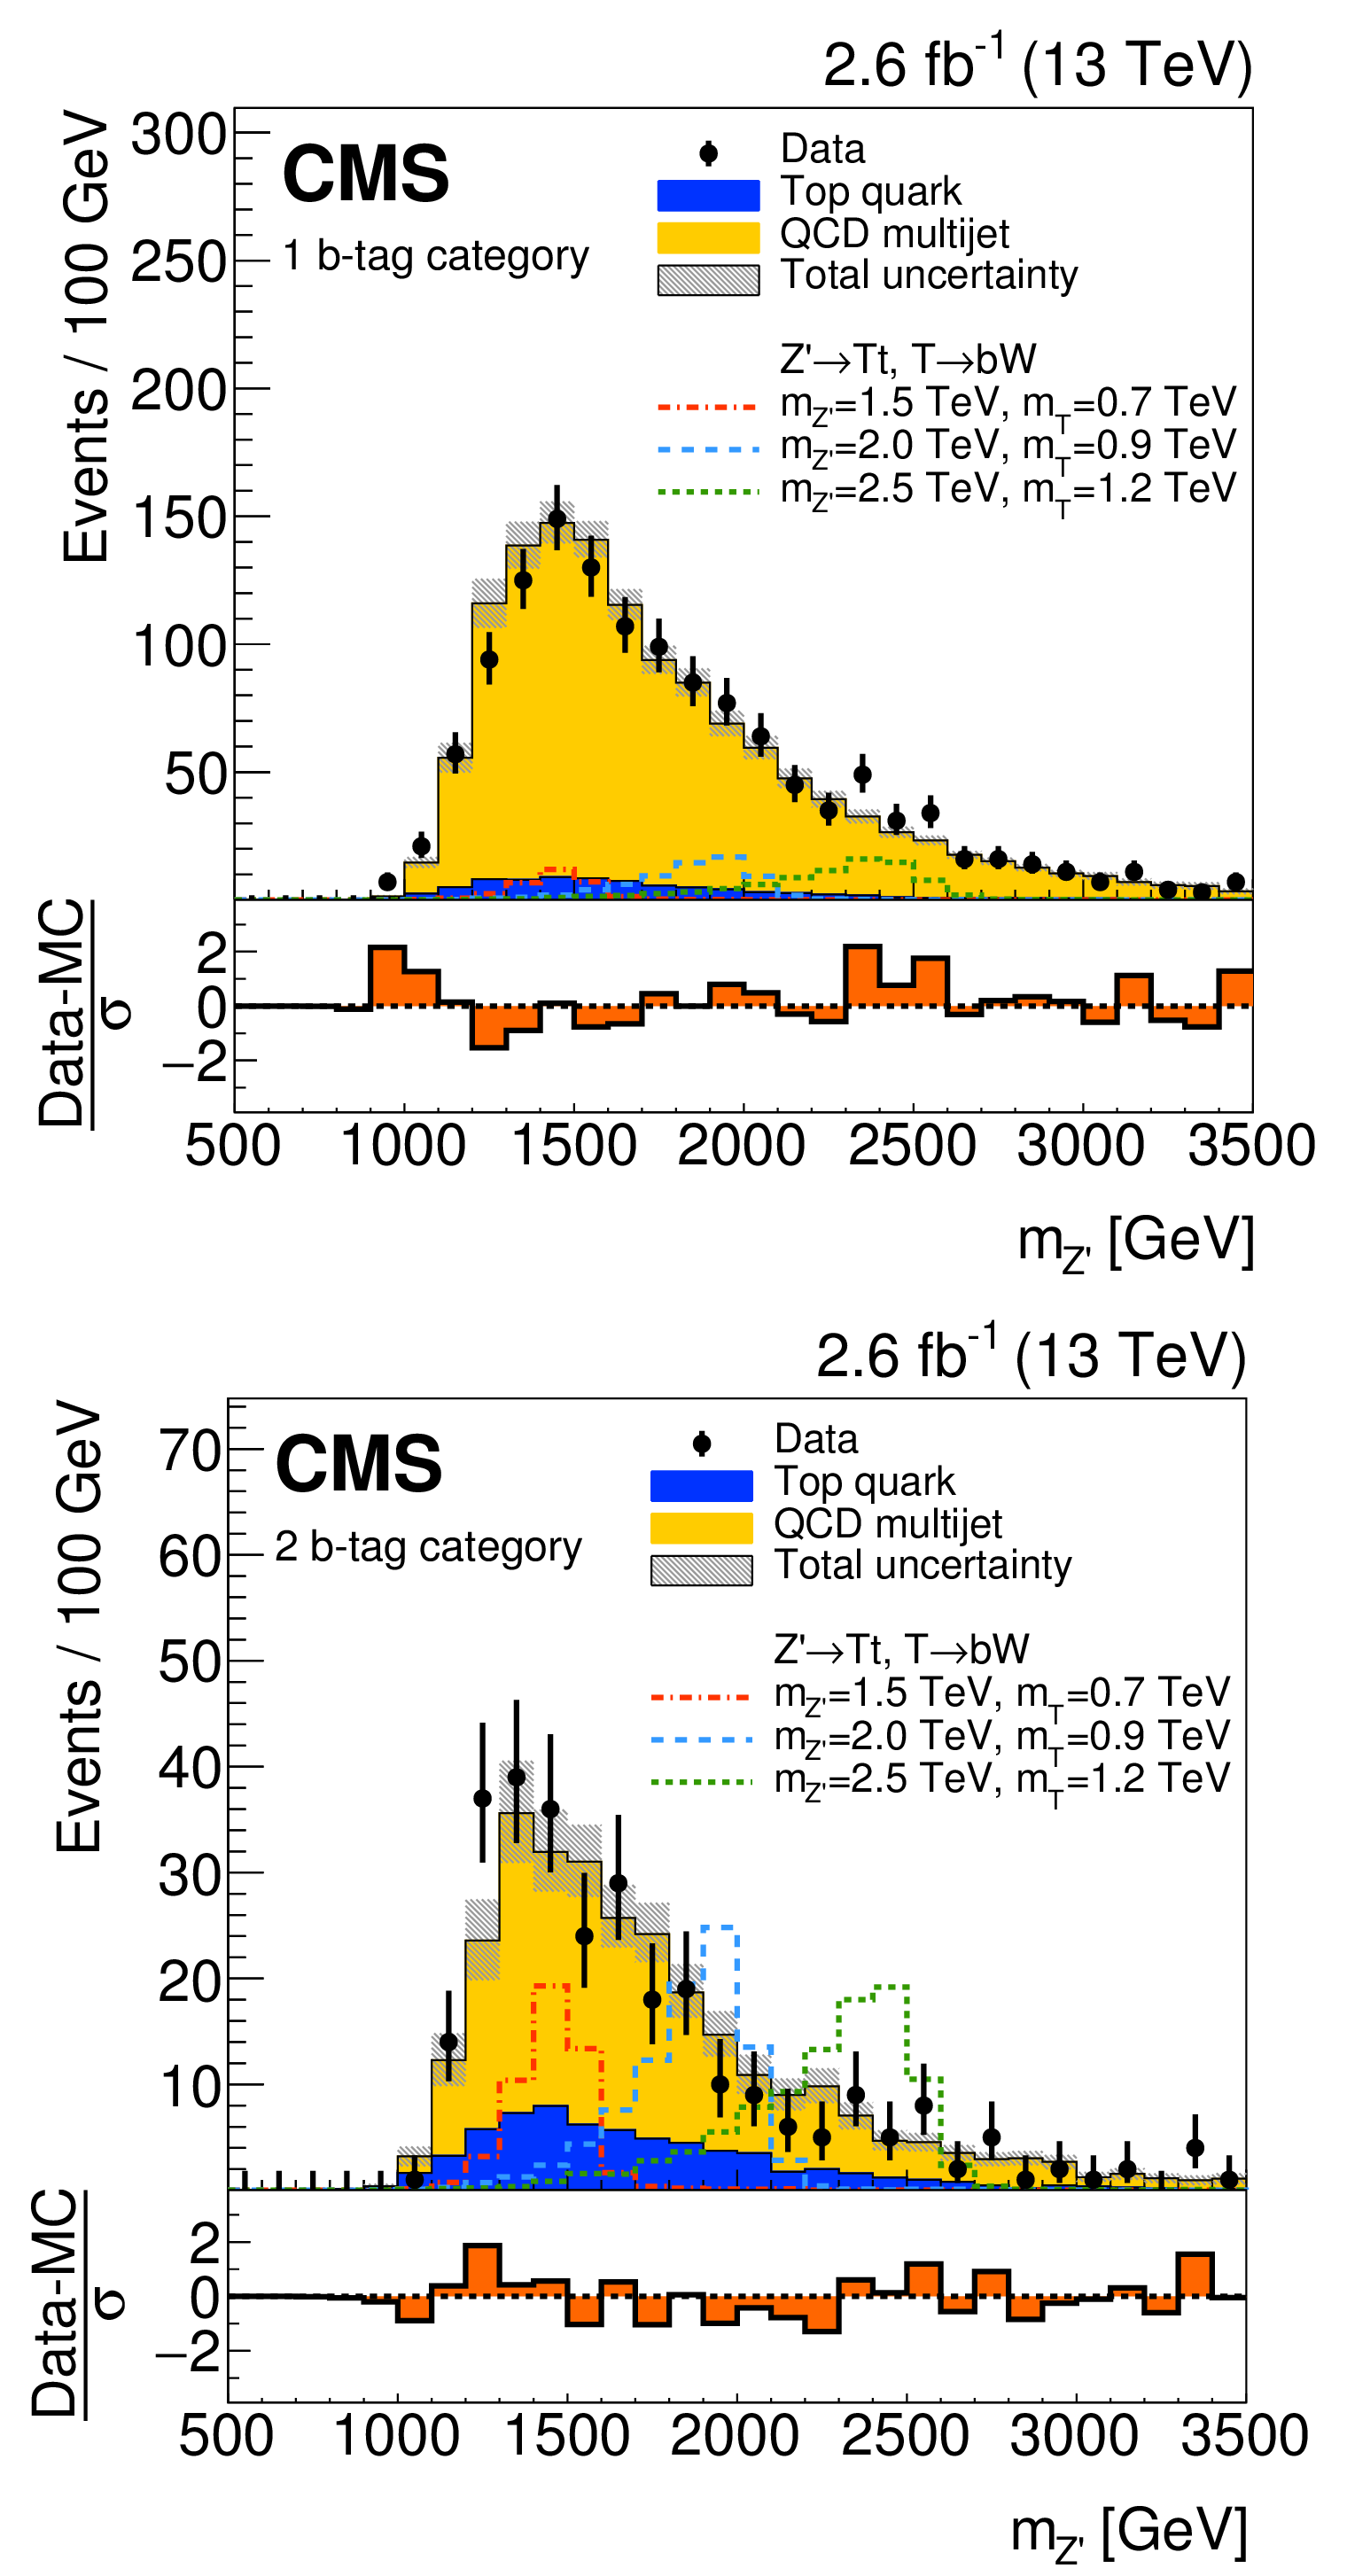
Figure 3:
Distribution of the $m_{\mathrm{ Z }' }$ variable for the signal region with 1 b tag (upper plot) and 2 b tags (lower plot) prior to the fit. The yellow (lighter) distribution represents the multijet background estimated from data, the blue (darker) distribution is the estimated top quark background, and the black markers are the data. The gray bands represent the statistical and systematic uncertainties in the background estimates. The uncertainty $\sigma $ includes the statistical uncertainties in data and backgrounds, and the systematic uncertainties in the estimated backgrounds. The dashed lines represent the distributions for signal hypotheses as indicated in the legend. The signal distributions are each normalized to a cross section of 1 pb. Events lying outside the x-axis range are not considered. |

png pdf |
Figure 3-a:
Distribution of the $m_{\mathrm{ Z }' }$ variable for the signal region with 1 b tag prior to the fit. The yellow (lighter) distribution represents the multijet background estimated from data, the blue (darker) distribution is the estimated top quark background, and the black markers are the data. The gray bands represent the statistical and systematic uncertainties in the background estimates. The uncertainty $\sigma $ includes the statistical uncertainties in data and backgrounds, and the systematic uncertainties in the estimated backgrounds. The dashed lines represent the distributions for signal hypotheses as indicated in the legend. The signal distributions are each normalized to a cross section of 1 pb. Events lying outside the x-axis range are not considered. |

png pdf |
Figure 3-b:
Distribution of the $m_{\mathrm{ Z }' }$ variable for the signal region with 2 b tags prior to the fit. The yellow (lighter) distribution represents the multijet background estimated from data, the blue (darker) distribution is the estimated top quark background, and the black markers are the data. The gray bands represent the statistical and systematic uncertainties in the background estimates. The uncertainty $\sigma $ includes the statistical uncertainties in data and backgrounds, and the systematic uncertainties in the estimated backgrounds. The dashed lines represent the distributions for signal hypotheses as indicated in the legend. The signal distributions are each normalized to a cross section of 1 pb. Events lying outside the x-axis range are not considered. |

png pdf |
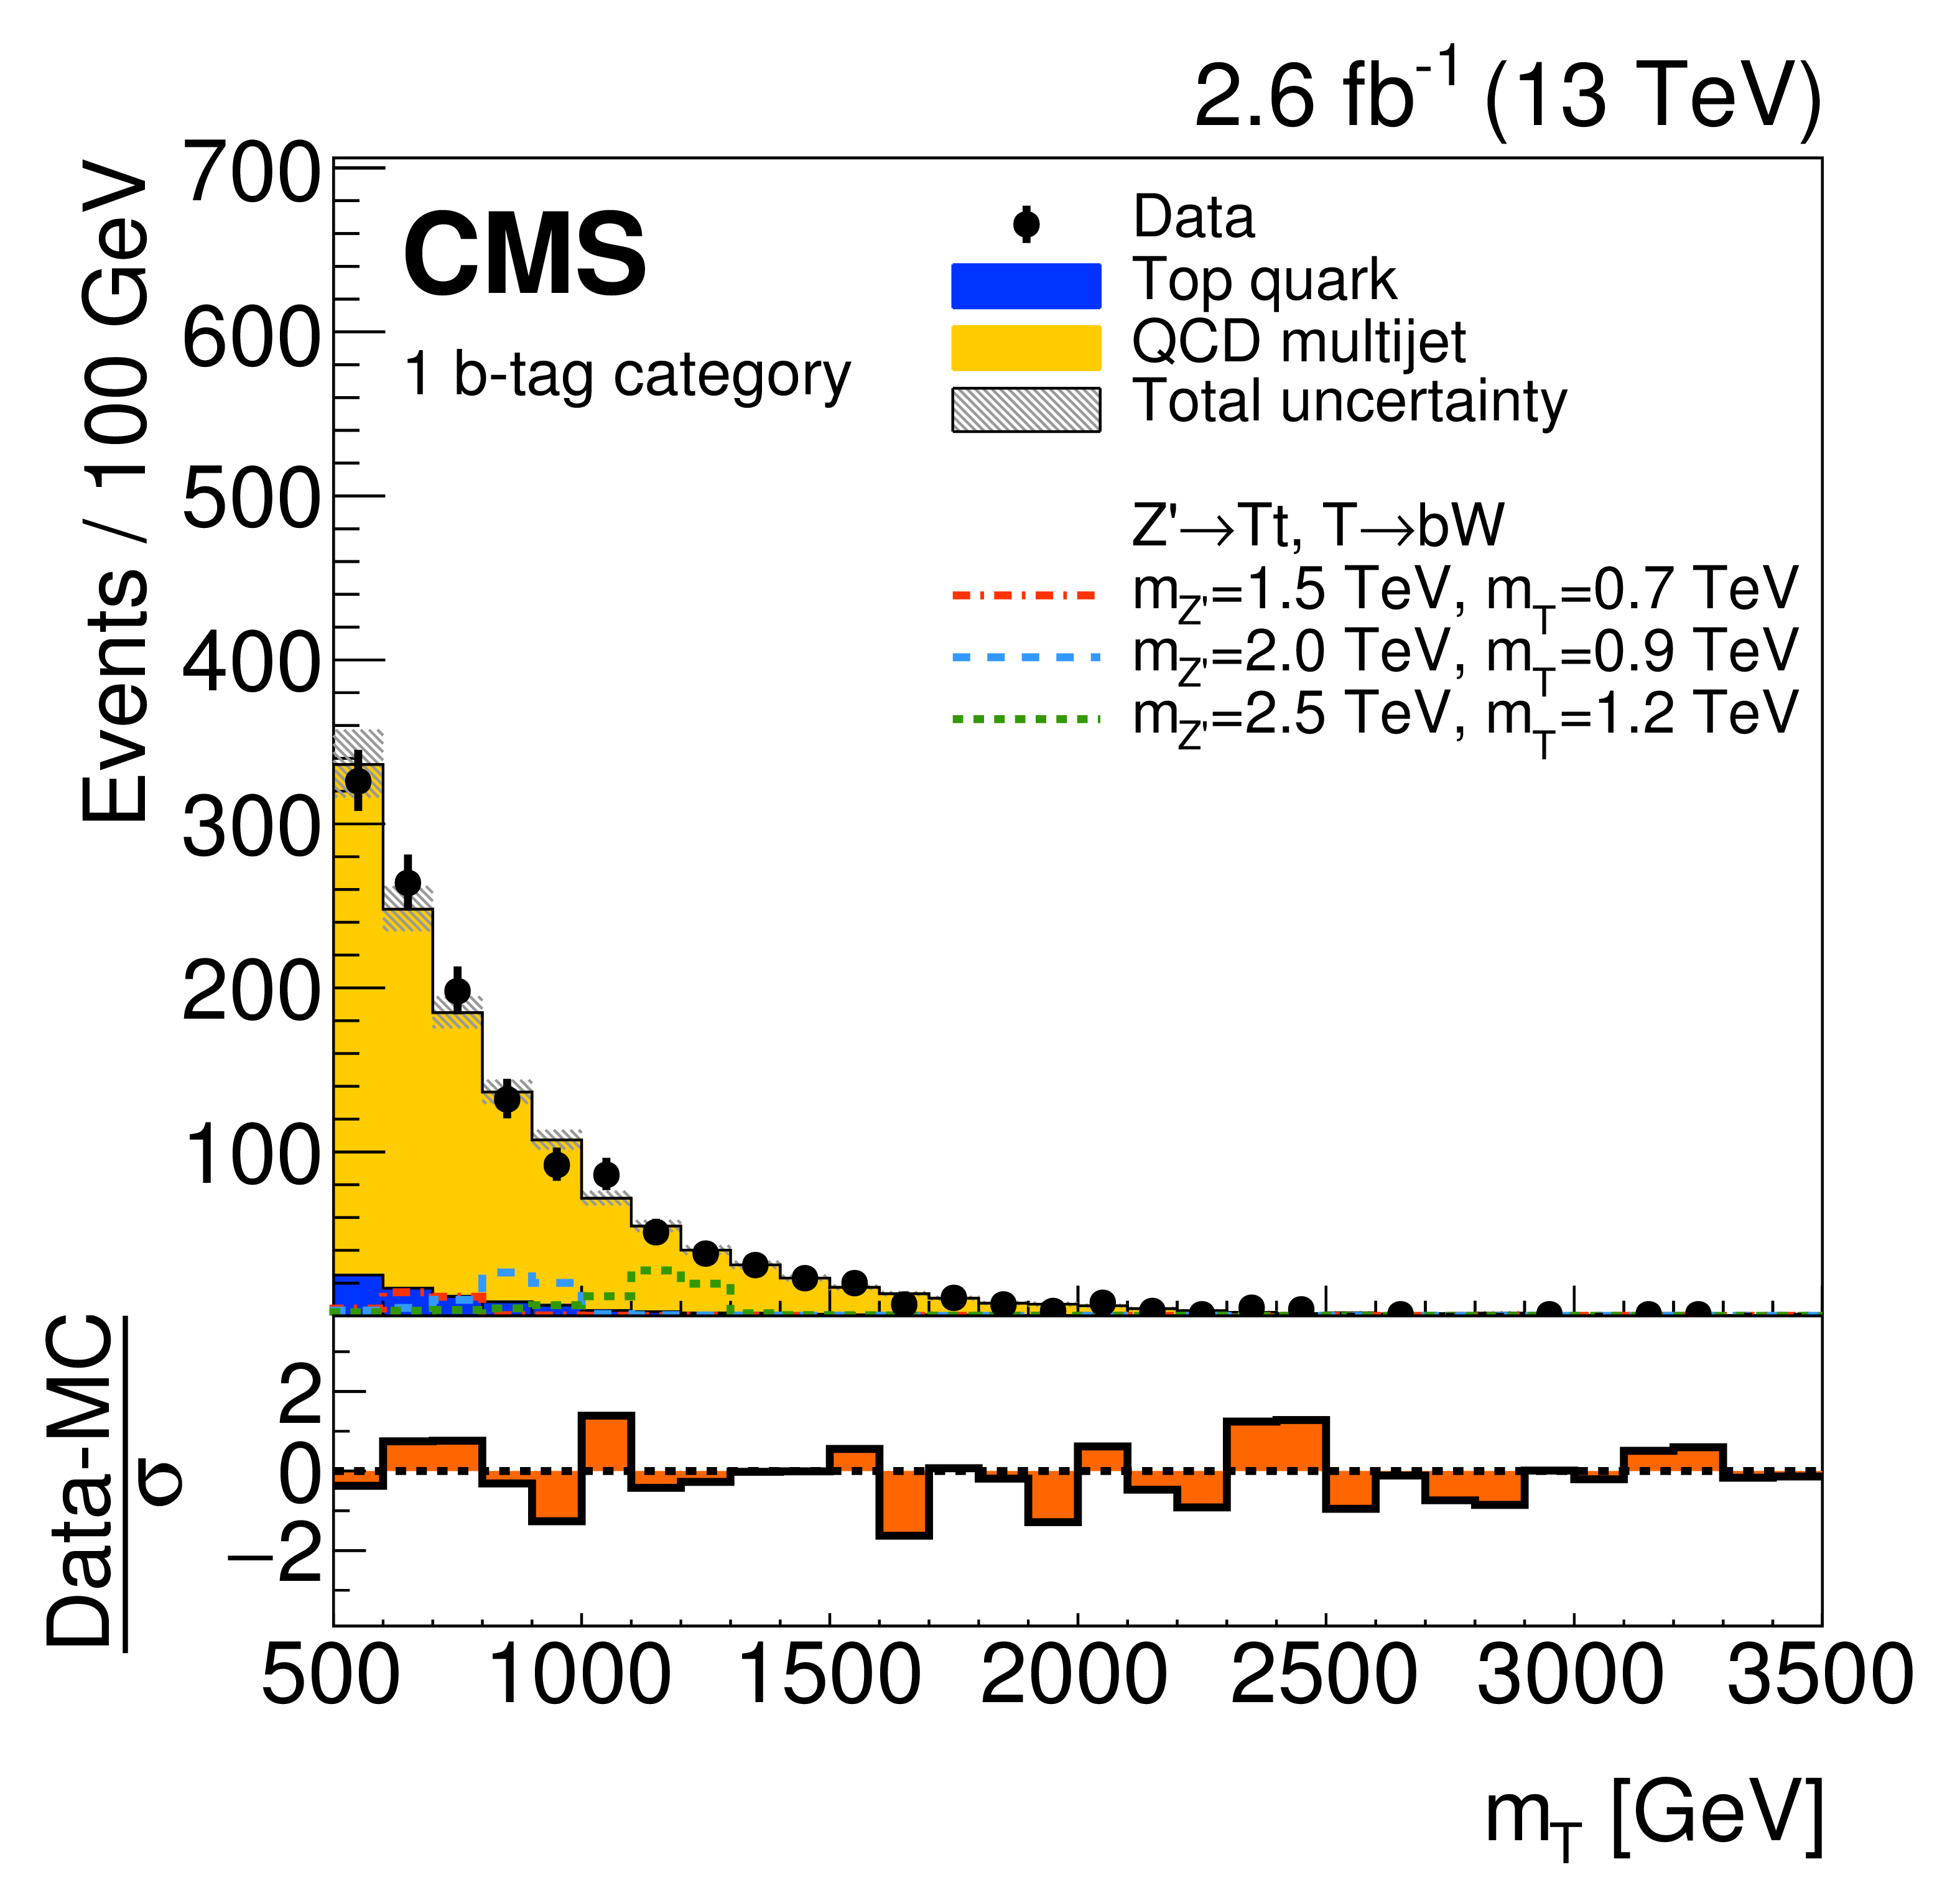
Figure 4:
Distributions of the $m_{ {\mathrm {T}} }$ (upper plots) and $H_{ {\mathrm {T}} }$ (lower plots) variables for the 1 b tag (left) and 2 b tag (right) event categories prior to the fit. The gray bands represent the statistical and systematic uncertainties in the background estimates. The uncertainty $\sigma $ includes the statistical uncertainties in data and backgrounds, and the systematic uncertainties in the estimated backgrounds. The dashed lines represent the distributions for signal hypotheses as indicated in the legend. The signal distributions are each normalized to a cross section of 1 pb. Events lying outside the x-axis range are not considered. |
png pdf |
Figure 4-a:
Distribution of the $m_{ {\mathrm {T}} }$ variable for the 1 b tag event category prior to the fit. The gray bands represent the statistical and systematic uncertainties in the background estimates. The uncertainty $\sigma $ includes the statistical uncertainties in data and backgrounds, and the systematic uncertainties in the estimated backgrounds. The dashed lines represent the distributions for signal hypotheses as indicated in the legend. The signal distribution is normalized to a cross section of 1 pb. Events lying outside the x-axis range are not considered. |

png pdf |
Figure 4-b:
Distribution of the $m_{ {\mathrm {T}} }$ variable for the 2 b tag event category prior to the fit. The gray bands represent the statistical and systematic uncertainties in the background estimates. The uncertainty $\sigma $ includes the statistical uncertainties in data and backgrounds, and the systematic uncertainties in the estimated backgrounds. The dashed lines represent the distributions for signal hypotheses as indicated in the legend. The signal distribution is normalized to a cross section of 1 pb. Events lying outside the x-axis range are not considered. |

png pdf |
Figure 4-c:
Distribution of the $H_{ {\mathrm {T}} }$ variable for the 1 b tag event category prior to the fit. The gray bands represent the statistical and systematic uncertainties in the background estimates. The uncertainty $\sigma $ includes the statistical uncertainties in data and backgrounds, and the systematic uncertainties in the estimated backgrounds. The dashed lines represent the distributions for signal hypotheses as indicated in the legend. The signal distribution is normalized to a cross section of 1 pb. Events lying outside the x-axis range are not considered. |

png pdf |
Figure 4-d:
Distribution of the $H_{ {\mathrm {T}} }$ variable for the 2 b tag event category prior to the fit. The gray bands represent the statistical and systematic uncertainties in the background estimates. The uncertainty $\sigma $ includes the statistical uncertainties in data and backgrounds, and the systematic uncertainties in the estimated backgrounds. The dashed lines represent the distributions for signal hypotheses as indicated in the legend. The signal distribution is normalized to a cross section of 1 pb. Events lying outside the x-axis range are not considered. |

png pdf |
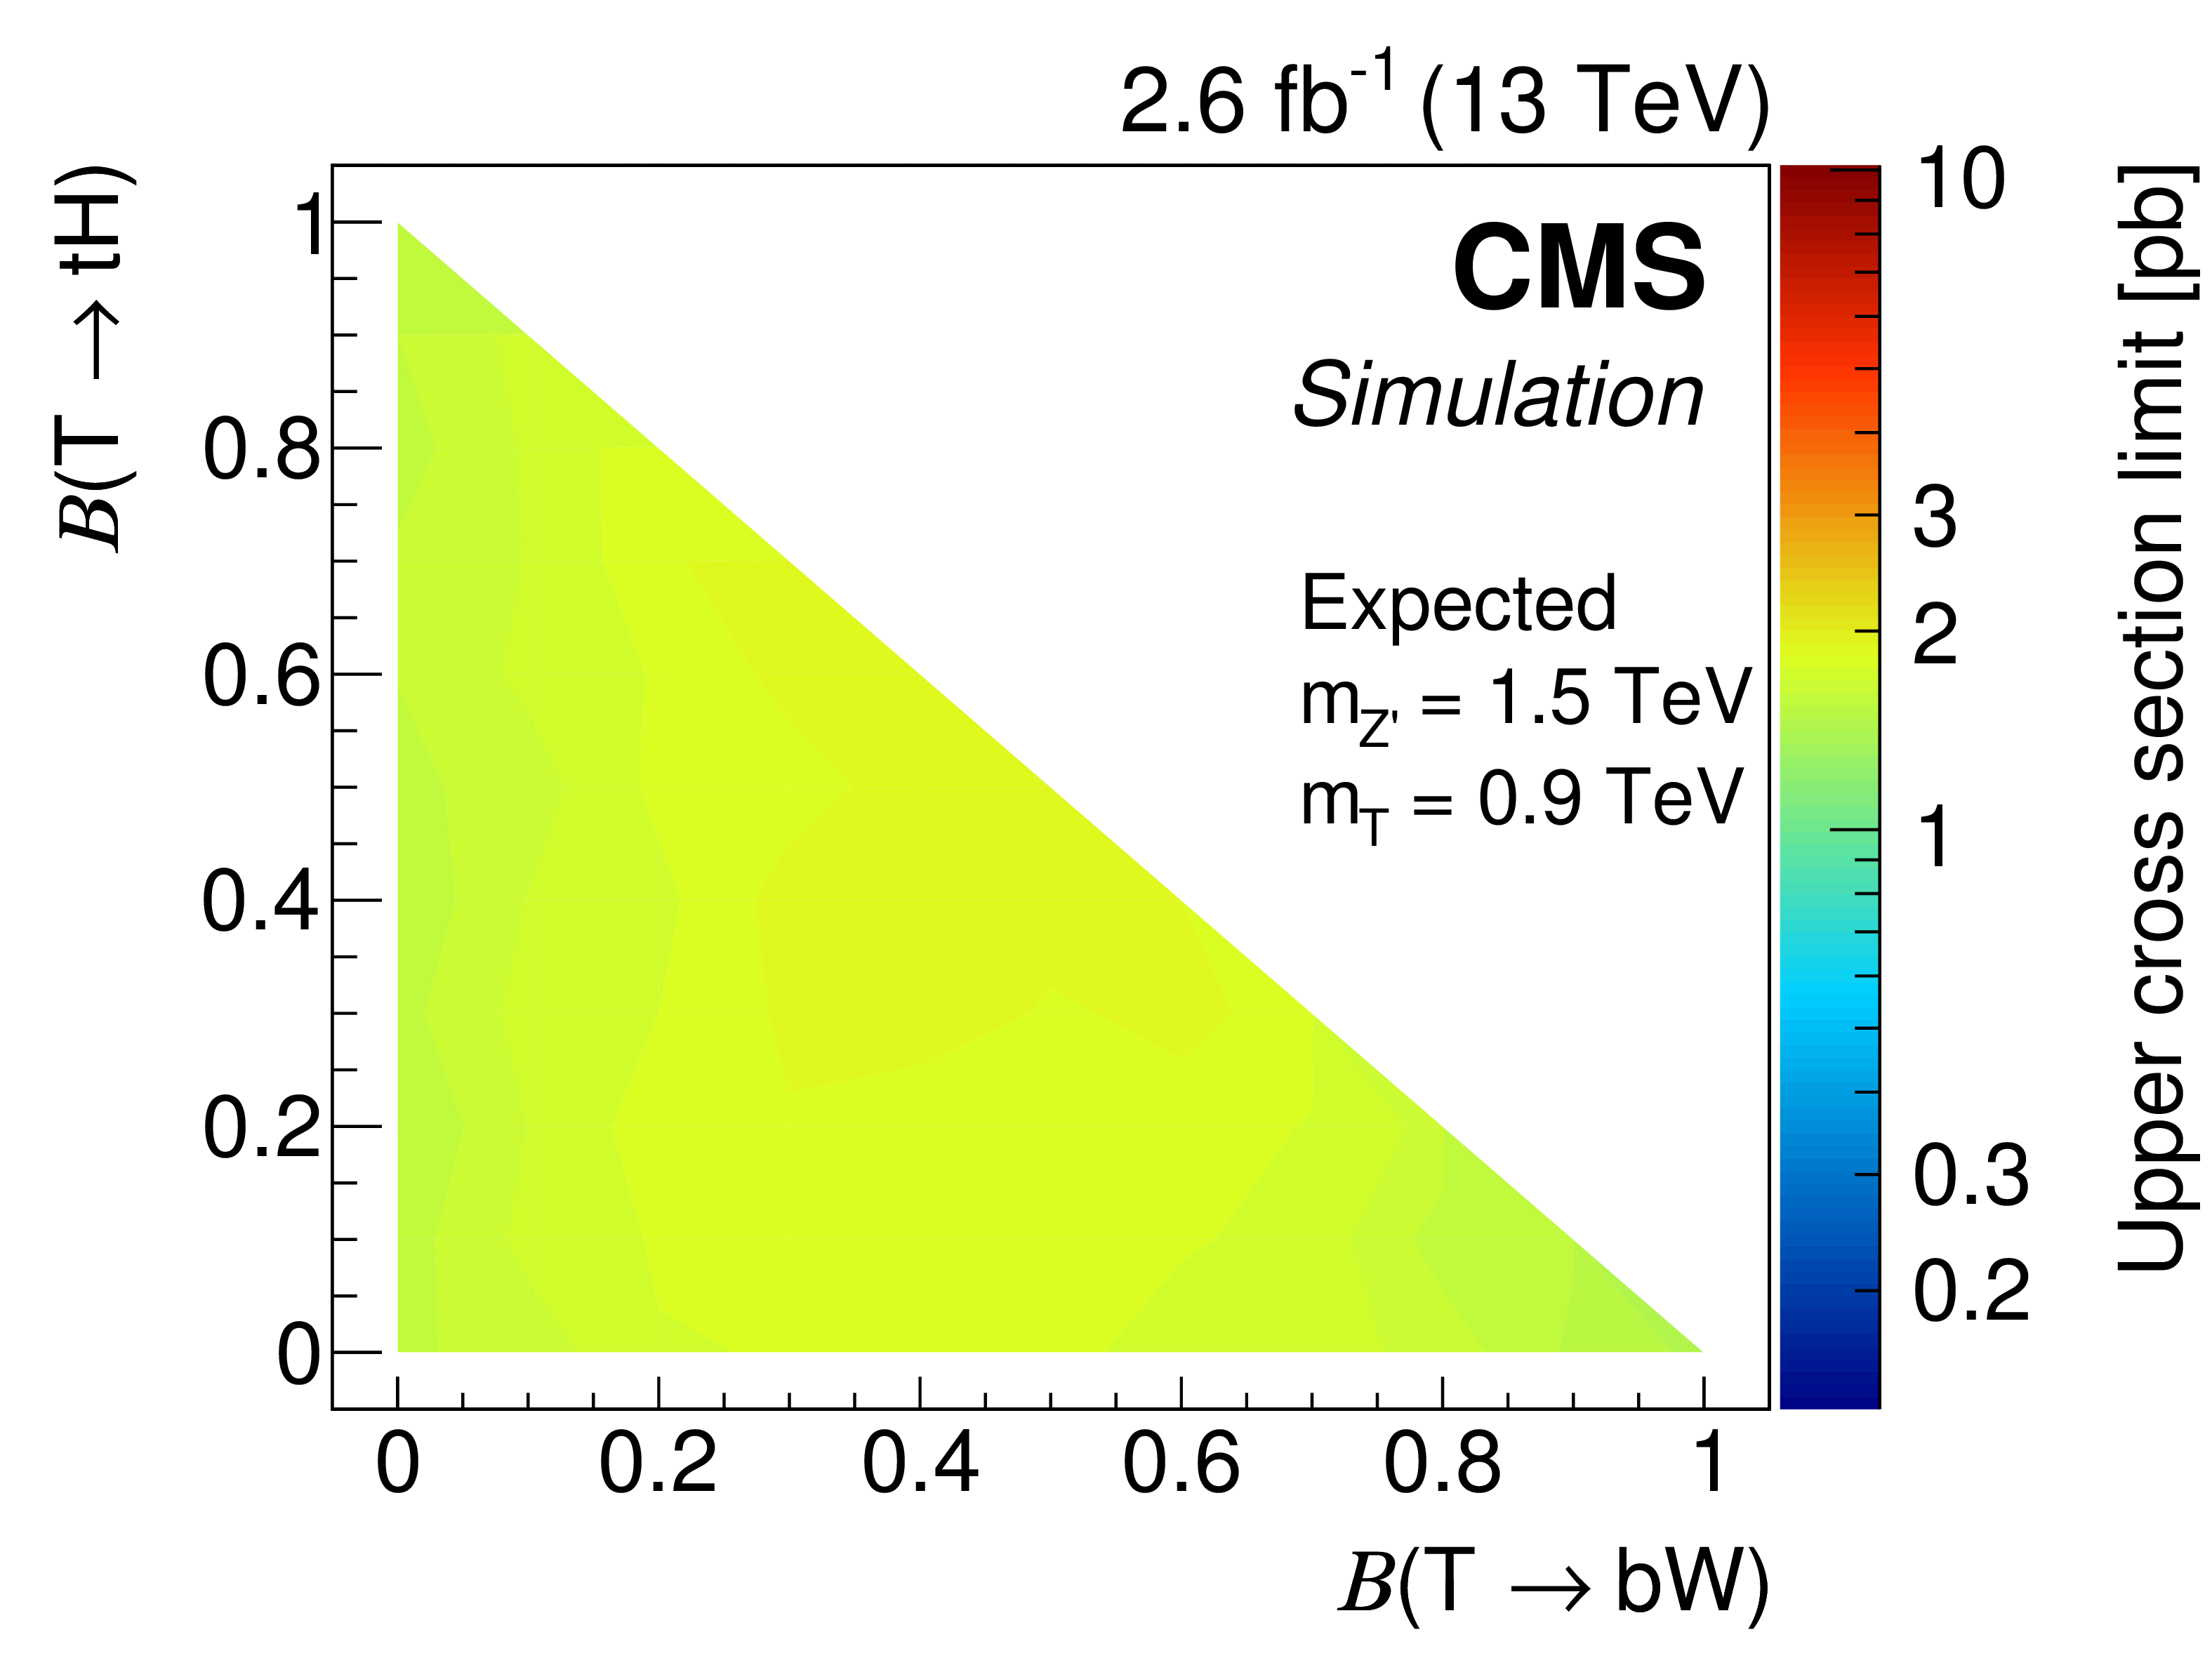
Figure 5:
Expected cross section limits for $\mathrm{ Z }' \to {\mathrm {T}} \mathrm{ t } $ for different hypotheses for the Z' boson and T quark masses, and the branching fraction of the T quark decay into bW and tH channels, with $\mathcal {B}( {\mathrm {T}} \to \mathrm{ t } {\mathrm{ Z } } )=(1-\mathcal {B}( {\mathrm {T}} \to \mathrm{ b } \mathrm{ W }, \mathrm{ t } \mathrm{ H } ))$. |

png pdf |
Figure 5-a:
Expected cross section limit for $\mathrm{ Z }' \to {\mathrm {T}} \mathrm{ t } $ for $m_{\mathrm{ Z }' } = $ 1.5 TeV and $m_{\mathrm{ T } } = $ 0.7 TeV, and the branching fraction of the T quark decay into bW and tH channels, with $\mathcal {B}( {\mathrm {T}} \to \mathrm{ t } {\mathrm{ Z } } )=(1-\mathcal {B}( {\mathrm {T}} \to \mathrm{ b } \mathrm{ W }, \mathrm{ t } \mathrm{ H } ))$. |
png pdf |
Figure 5-b:
Expected cross section limit for $\mathrm{ Z }' \to {\mathrm {T}} \mathrm{ t } $ for $m_{\mathrm{ Z }' } = $ 1.5 TeV and $m_{\mathrm{ T } } = $ 0.9 TeV, and the branching fraction of the T quark decay into bW and tH channels, with $\mathcal {B}( {\mathrm {T}} \to \mathrm{ t } {\mathrm{ Z } } )=(1-\mathcal {B}( {\mathrm {T}} \to \mathrm{ b } \mathrm{ W }, \mathrm{ t } \mathrm{ H } ))$. |

png pdf |
Figure 5-c:
Expected cross section limit for $\mathrm{ Z }' \to {\mathrm {T}} \mathrm{ t } $ for $m_{\mathrm{ Z }' } = $ 1.5 TeV and $m_{\mathrm{ T } } = $ 1.2 TeV, and the branching fraction of the T quark decay into bW and tH channels, with $\mathcal {B}( {\mathrm {T}} \to \mathrm{ t } {\mathrm{ Z } } )=(1-\mathcal {B}( {\mathrm {T}} \to \mathrm{ b } \mathrm{ W }, \mathrm{ t } \mathrm{ H } ))$. |

png pdf |
Figure 5-d:
Expected cross section limit for $\mathrm{ Z }' \to {\mathrm {T}} \mathrm{ t } $ for $m_{\mathrm{ Z }' } = $ 2.0 TeV and $m_{\mathrm{ T } } = $ 0.9 TeV, and the branching fraction of the T quark decay into bW and tH channels, with $\mathcal {B}( {\mathrm {T}} \to \mathrm{ t } {\mathrm{ Z } } )=(1-\mathcal {B}( {\mathrm {T}} \to \mathrm{ b } \mathrm{ W }, \mathrm{ t } \mathrm{ H } ))$. |
png pdf |
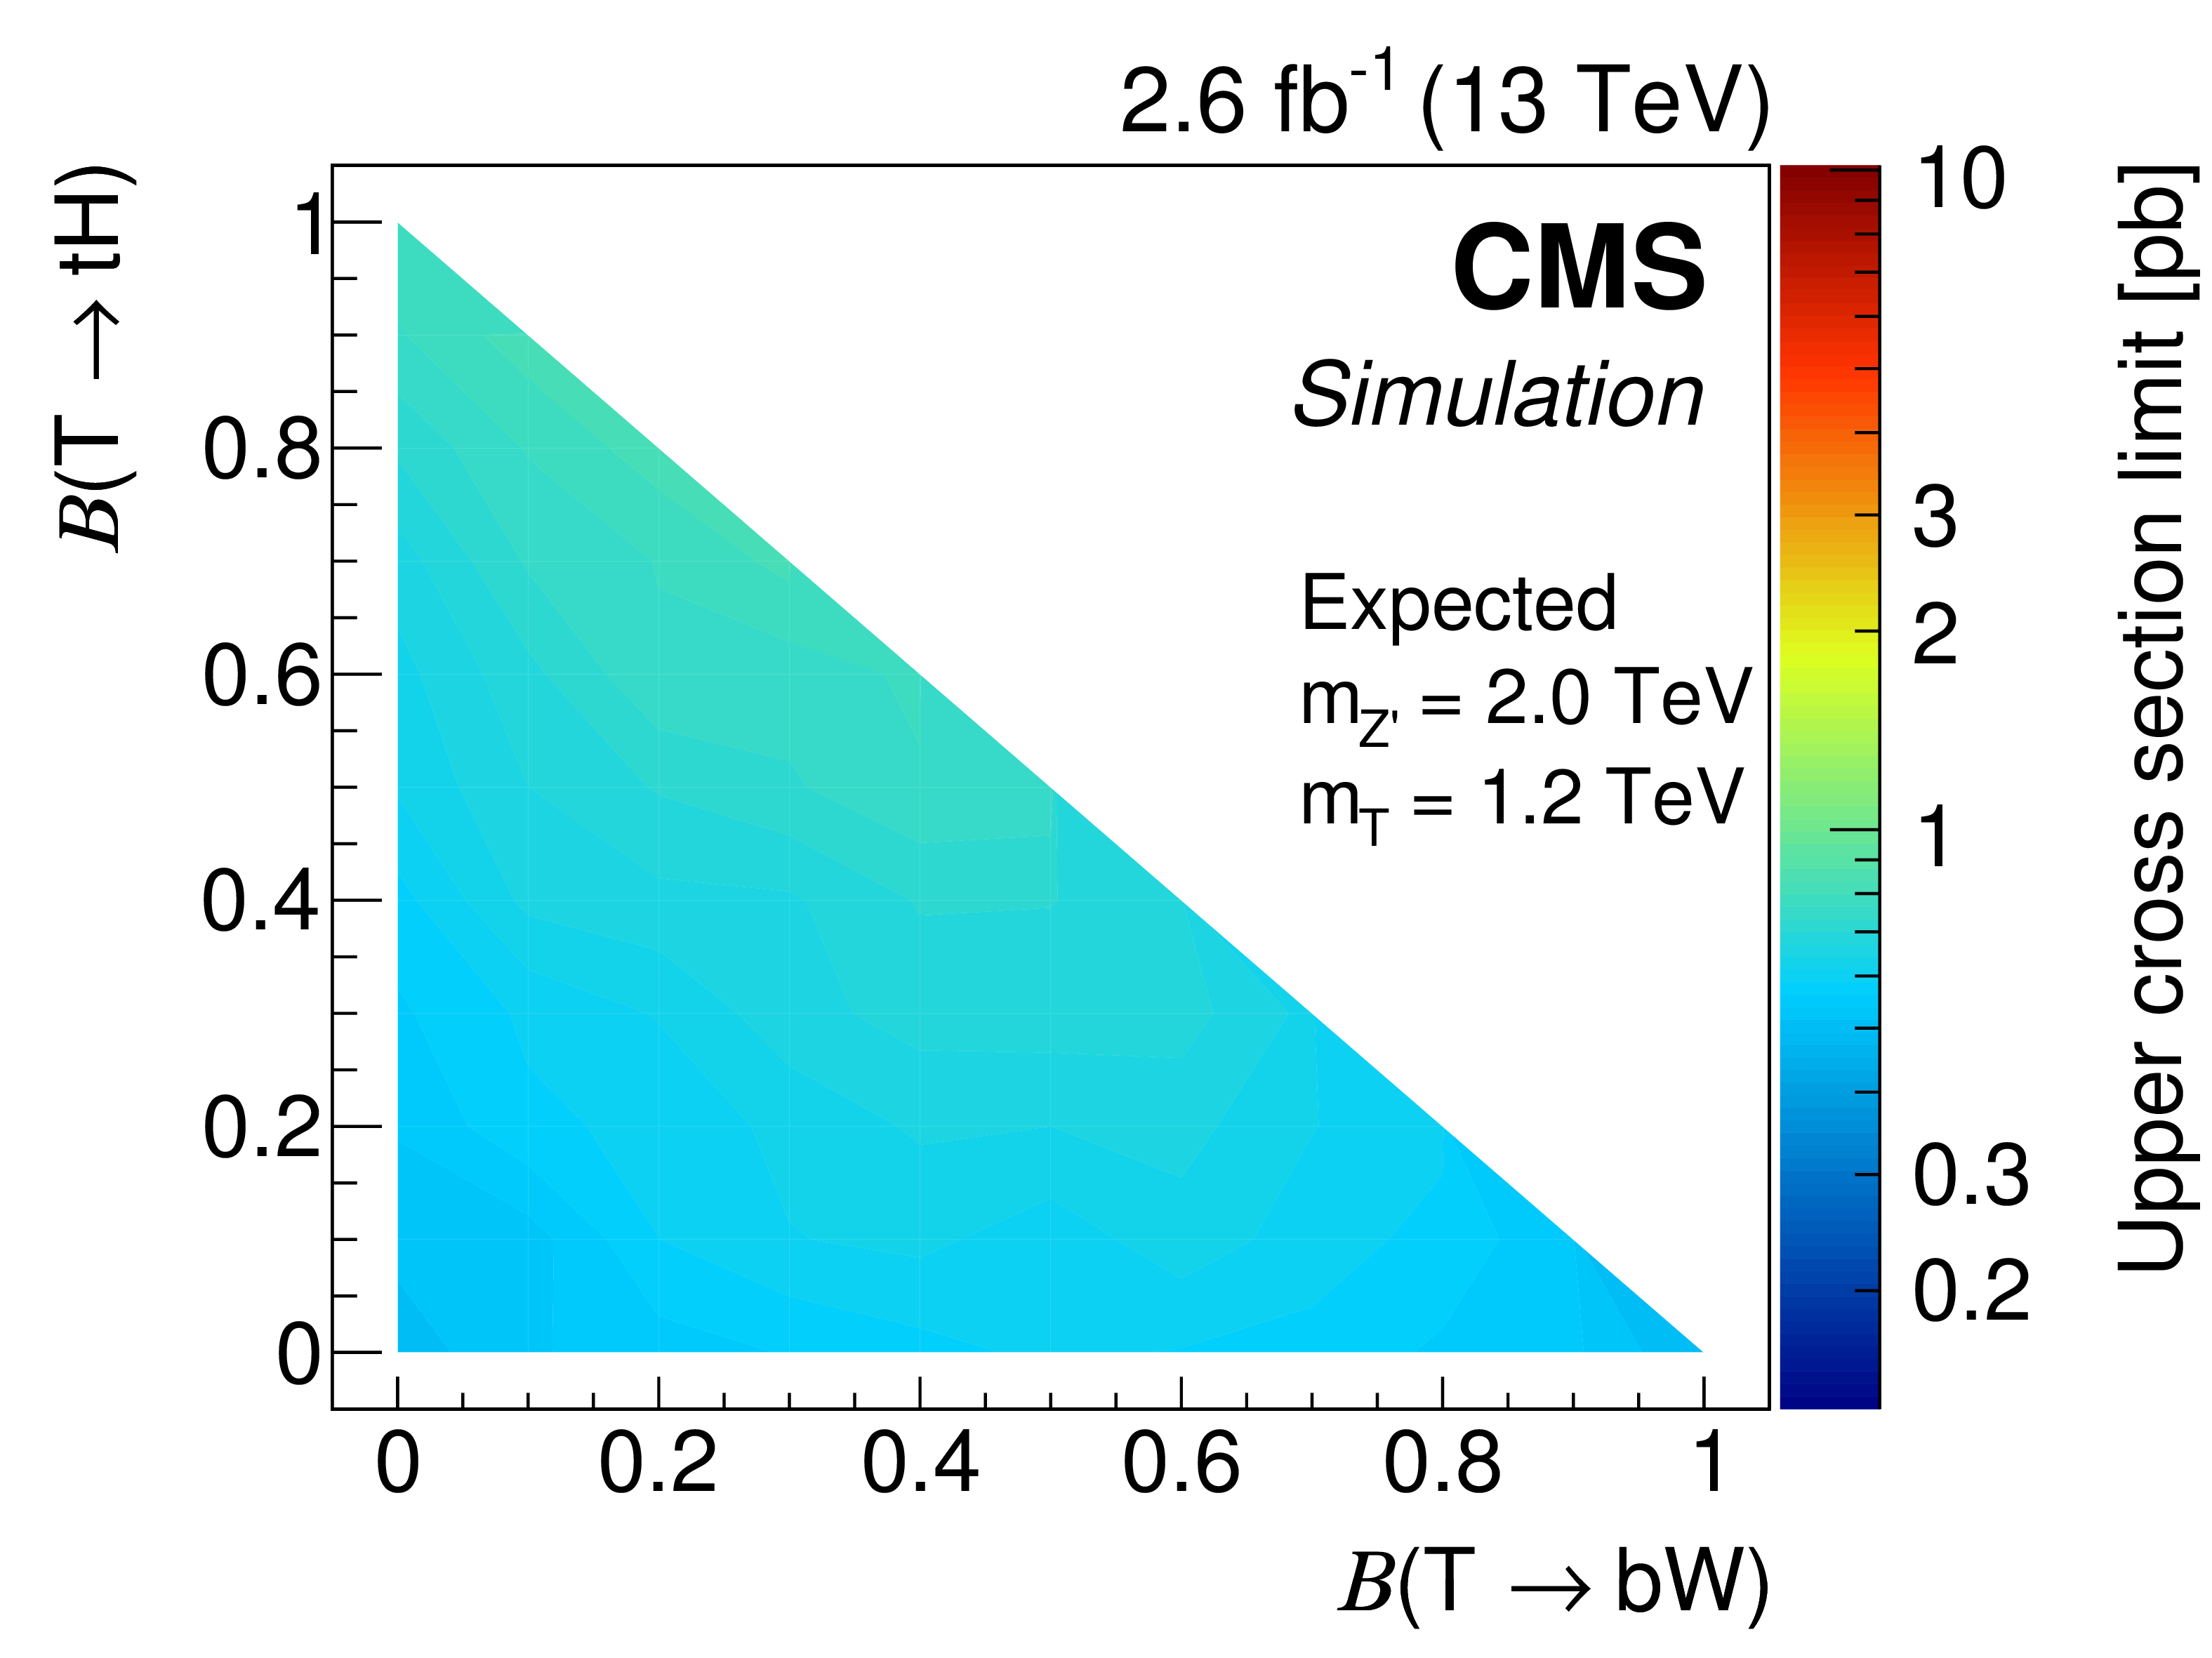
Figure 5-e:
Expected cross section limit for $\mathrm{ Z }' \to {\mathrm {T}} \mathrm{ t } $ for $m_{\mathrm{ Z }' } = $ 2.0 TeV and $m_{\mathrm{ T } } = $ 1.2 TeV, and the branching fraction of the T quark decay into bW and tH channels, with $\mathcal {B}( {\mathrm {T}} \to \mathrm{ t } {\mathrm{ Z } } )=(1-\mathcal {B}( {\mathrm {T}} \to \mathrm{ b } \mathrm{ W }, \mathrm{ t } \mathrm{ H } ))$. |

png pdf |
Figure 5-f:
Expected cross section limit for $\mathrm{ Z }' \to {\mathrm {T}} \mathrm{ t } $ for $m_{\mathrm{ Z }' } = $ 2.0 TeV and $m_{\mathrm{ T } } = $ 1.5 TeV, and the branching fraction of the T quark decay into bW and tH channels, with $\mathcal {B}( {\mathrm {T}} \to \mathrm{ t } {\mathrm{ Z } } )=(1-\mathcal {B}( {\mathrm {T}} \to \mathrm{ b } \mathrm{ W }, \mathrm{ t } \mathrm{ H } ))$. |

png pdf |
Figure 5-g:
Expected cross section limit for $\mathrm{ Z }' \to {\mathrm {T}} \mathrm{ t } $ for $m_{\mathrm{ Z }' } = $ 2.5 TeV and $m_{\mathrm{ T } } = $ 1.2 TeV, and the branching fraction of the T quark decay into bW and tH channels, with $\mathcal {B}( {\mathrm {T}} \to \mathrm{ t } {\mathrm{ Z } } )=(1-\mathcal {B}( {\mathrm {T}} \to \mathrm{ b } \mathrm{ W }, \mathrm{ t } \mathrm{ H } ))$. |

png pdf |
Figure 5-h:
Expected cross section limit for $\mathrm{ Z }' \to {\mathrm {T}} \mathrm{ t } $ for $m_{\mathrm{ Z }' } = $ 2.5 TeV and $m_{\mathrm{ T } } = $ 1.5 TeV, and the branching fraction of the T quark decay into bW and tH channels, with $\mathcal {B}( {\mathrm {T}} \to \mathrm{ t } {\mathrm{ Z } } )=(1-\mathcal {B}( {\mathrm {T}} \to \mathrm{ b } \mathrm{ W }, \mathrm{ t } \mathrm{ H } ))$. |

png pdf |
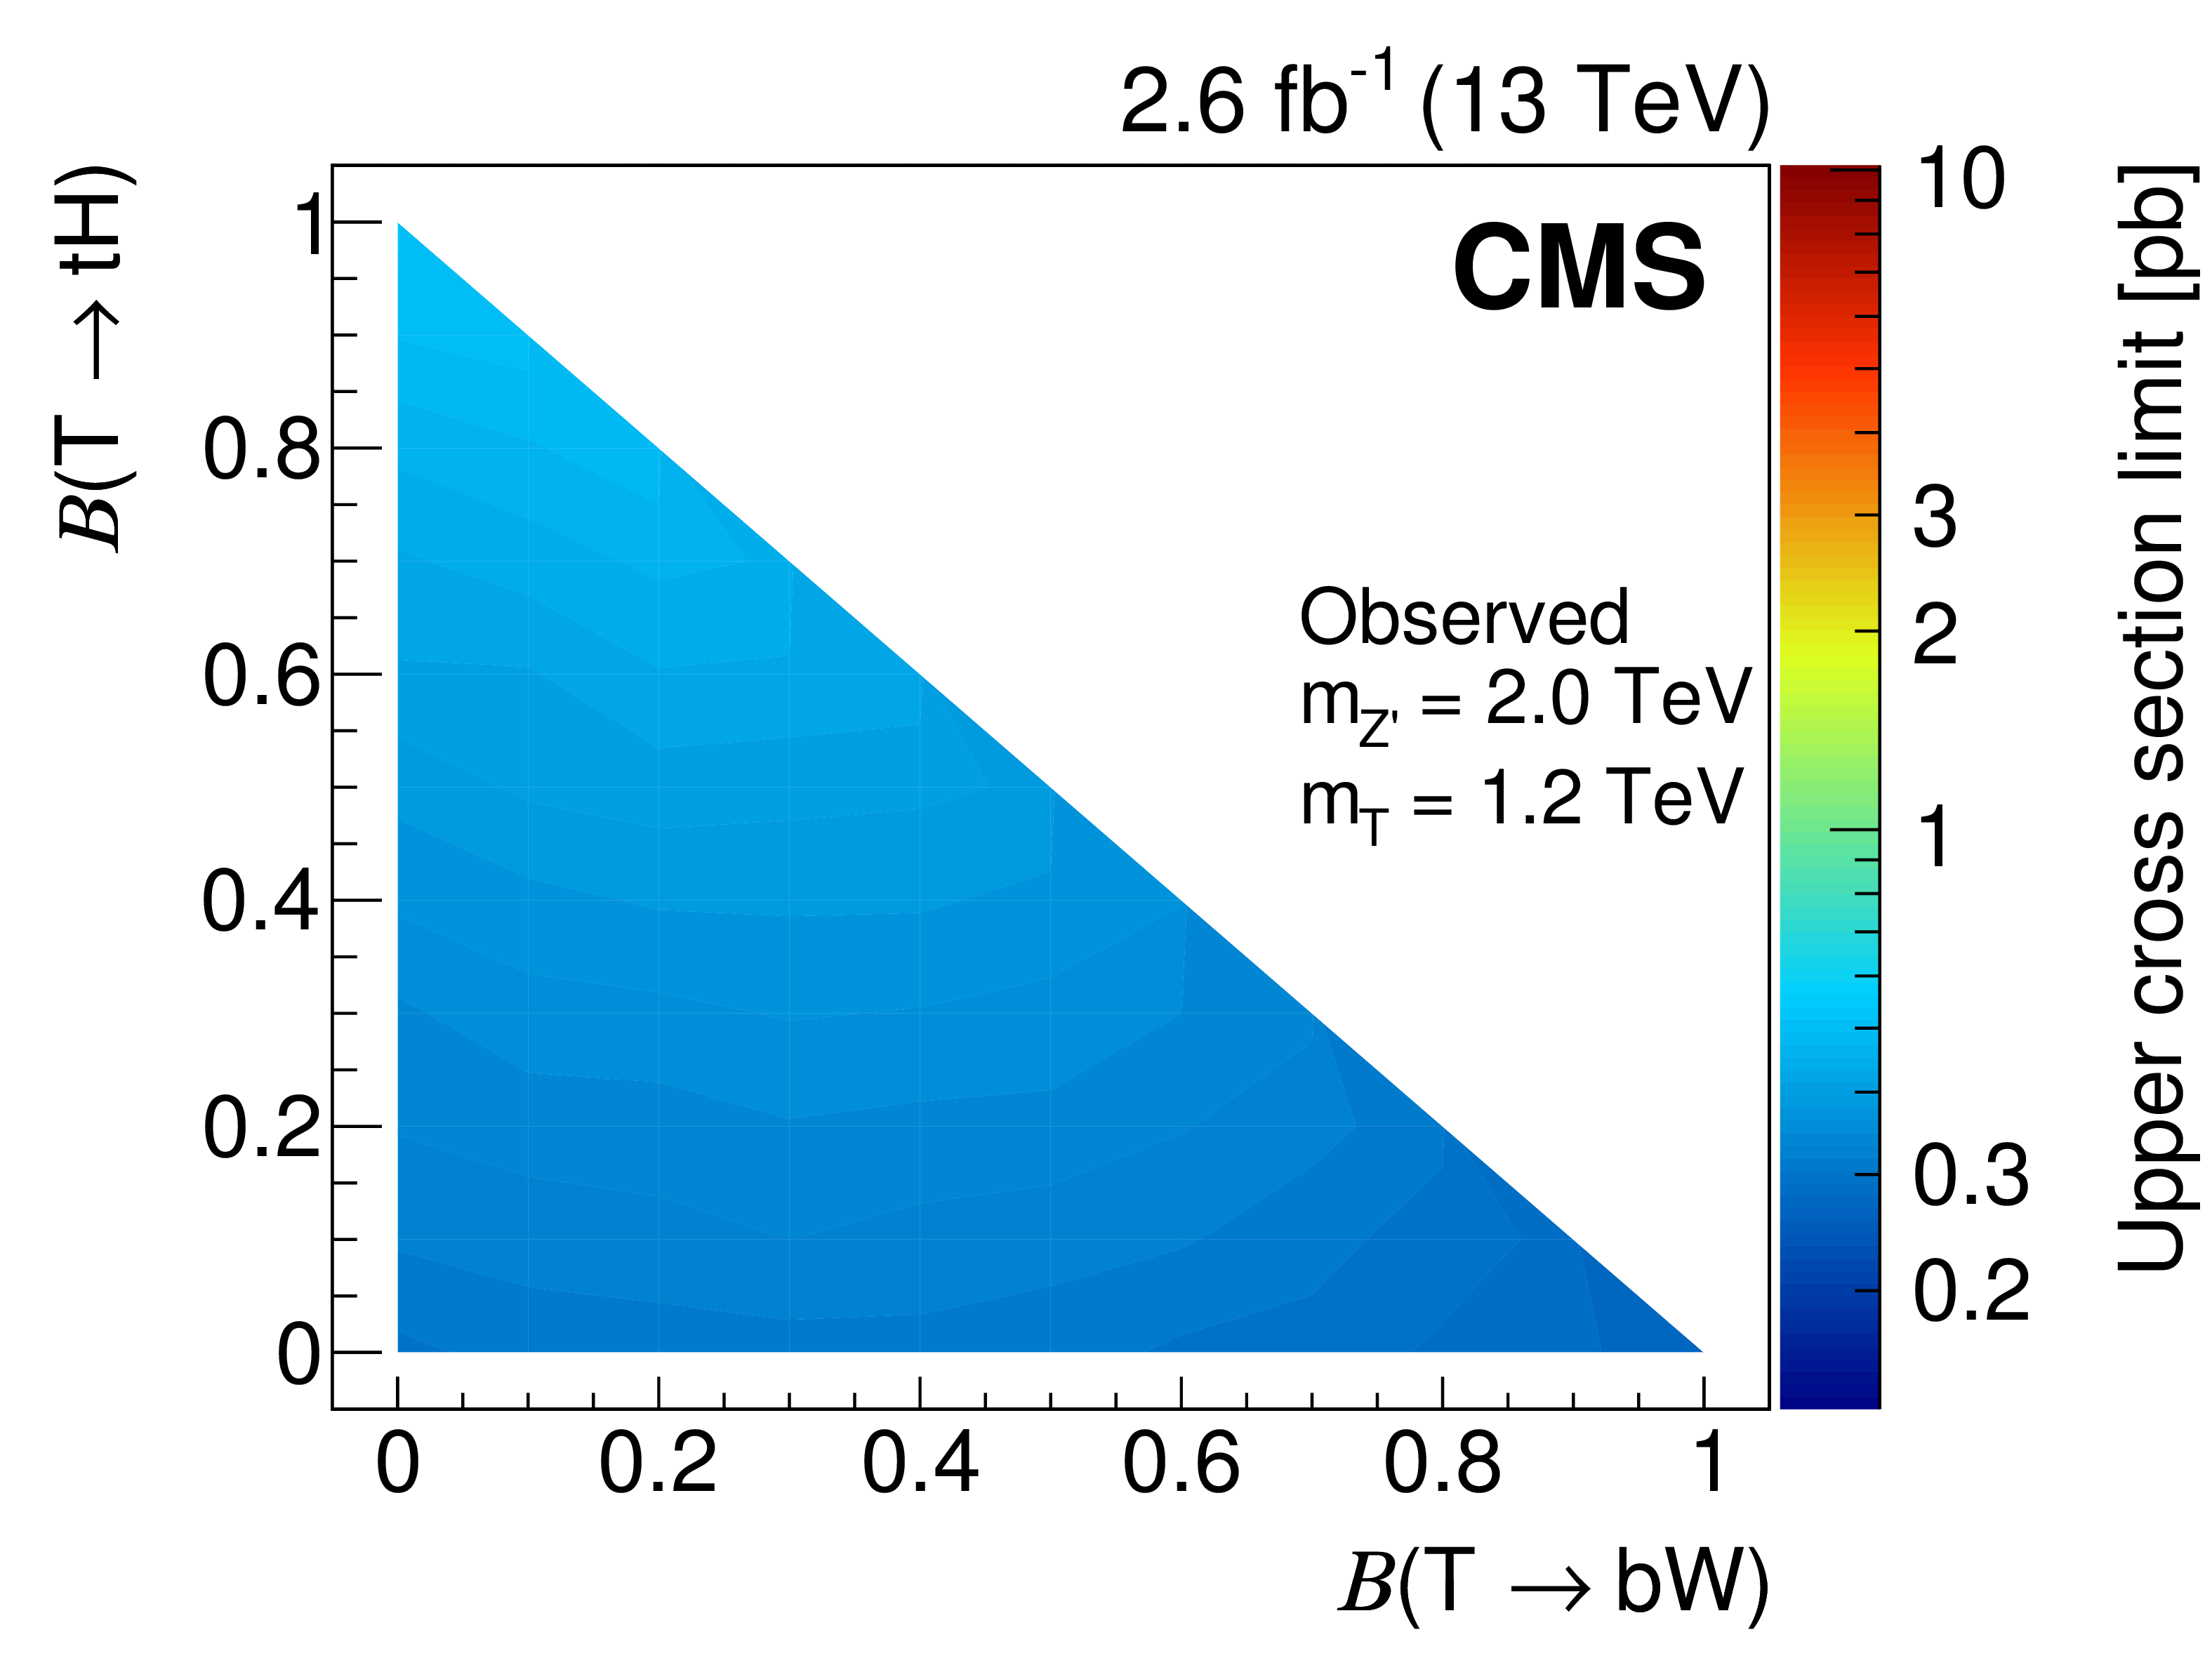
Figure 6:
Observed cross section limits for $\mathrm{ Z }' \to {\mathrm {T}} \mathrm{ t } $ for different hypotheses for the Z' boson and T quark masses, and the branching fraction of the T quark decay into bW and tH channels, with $\mathcal {B}( {\mathrm {T}} \to \mathrm{ t } {\mathrm{ Z } } )=(1-\mathcal {B}( {\mathrm {T}} \to \mathrm{ b } \mathrm{ W }, \mathrm{ t } \mathrm{ H } ))$. |

png pdf |
Figure 6-a:
Observed cross section limits for $\mathrm{ Z }' \to {\mathrm {T}} \mathrm{ t } $ for $m_{\mathrm{ Z }' } = $ 1.5 TeV and $m_{\mathrm{ T } } = $ 0.7 TeV, and the branching fraction of the T quark decay into bW and tH channels, with $\mathcal {B}( {\mathrm {T}} \to \mathrm{ t } {\mathrm{ Z } } )=(1-\mathcal {B}( {\mathrm {T}} \to \mathrm{ b } \mathrm{ W }, \mathrm{ t } \mathrm{ H } ))$. |

png pdf |
Figure 6-b:
Observed cross section limits for $\mathrm{ Z }' \to {\mathrm {T}} \mathrm{ t } $ for $m_{\mathrm{ Z }' } = $ 1.5 TeV and $m_{\mathrm{ T } } = $ 0.9 TeV, and the branching fraction of the T quark decay into bW and tH channels, with $\mathcal {B}( {\mathrm {T}} \to \mathrm{ t } {\mathrm{ Z } } )=(1-\mathcal {B}( {\mathrm {T}} \to \mathrm{ b } \mathrm{ W }, \mathrm{ t } \mathrm{ H } ))$. |

png pdf |
Figure 6-c:
Observed cross section limits for $\mathrm{ Z }' \to {\mathrm {T}} \mathrm{ t } $ for $m_{\mathrm{ Z }' } = $ 1.5 TeV and $m_{\mathrm{ T } } = $ 1.2 TeV, and the branching fraction of the T quark decay into bW and tH channels, with $\mathcal {B}( {\mathrm {T}} \to \mathrm{ t } {\mathrm{ Z } } )=(1-\mathcal {B}( {\mathrm {T}} \to \mathrm{ b } \mathrm{ W }, \mathrm{ t } \mathrm{ H } ))$. |

png pdf |
Figure 6-d:
Observed cross section limits for $\mathrm{ Z }' \to {\mathrm {T}} \mathrm{ t } $ for $m_{\mathrm{ Z }' } = $ 2.0 TeV and $m_{\mathrm{ T } } = $ 0.9 TeV, and the branching fraction of the T quark decay into bW and tH channels, with $\mathcal {B}( {\mathrm {T}} \to \mathrm{ t } {\mathrm{ Z } } )=(1-\mathcal {B}( {\mathrm {T}} \to \mathrm{ b } \mathrm{ W }, \mathrm{ t } \mathrm{ H } ))$. |
png pdf |
Figure 6-e:
Observed cross section limits for $\mathrm{ Z }' \to {\mathrm {T}} \mathrm{ t } $ for $m_{\mathrm{ Z }' } = $ 2.0 TeV and $m_{\mathrm{ T } } = $ 1.2 TeV, and the branching fraction of the T quark decay into bW and tH channels, with $\mathcal {B}( {\mathrm {T}} \to \mathrm{ t } {\mathrm{ Z } } )=(1-\mathcal {B}( {\mathrm {T}} \to \mathrm{ b } \mathrm{ W }, \mathrm{ t } \mathrm{ H } ))$. |

png pdf |
Figure 6-f:
Observed cross section limits for $\mathrm{ Z }' \to {\mathrm {T}} \mathrm{ t } $ for $m_{\mathrm{ Z }' } = $ 2.0 TeV and $m_{\mathrm{ T } } = $ 1.5 TeV, and the branching fraction of the T quark decay into bW and tH channels, with $\mathcal {B}( {\mathrm {T}} \to \mathrm{ t } {\mathrm{ Z } } )=(1-\mathcal {B}( {\mathrm {T}} \to \mathrm{ b } \mathrm{ W }, \mathrm{ t } \mathrm{ H } ))$. |

png pdf |
Figure 6-g:
Observed cross section limits for $\mathrm{ Z }' \to {\mathrm {T}} \mathrm{ t } $ for $m_{\mathrm{ Z }' } = $ 2.5 TeV and $m_{\mathrm{ T } } = $ 1.2 TeV, and the branching fraction of the T quark decay into bW and tH channels, with $\mathcal {B}( {\mathrm {T}} \to \mathrm{ t } {\mathrm{ Z } } )=(1-\mathcal {B}( {\mathrm {T}} \to \mathrm{ b } \mathrm{ W }, \mathrm{ t } \mathrm{ H } ))$. |

png pdf |
Figure 6-h:
Observed cross section limits for $\mathrm{ Z }' \to {\mathrm {T}} \mathrm{ t } $ for $m_{\mathrm{ Z }' } = $ 2.5 TeV and $m_{\mathrm{ T } } = $ 1.5 TeV, and the branching fraction of the T quark decay into bW and tH channels, with $\mathcal {B}( {\mathrm {T}} \to \mathrm{ t } {\mathrm{ Z } } )=(1-\mathcal {B}( {\mathrm {T}} \to \mathrm{ b } \mathrm{ W }, \mathrm{ t } \mathrm{ H } ))$. |
png pdf |
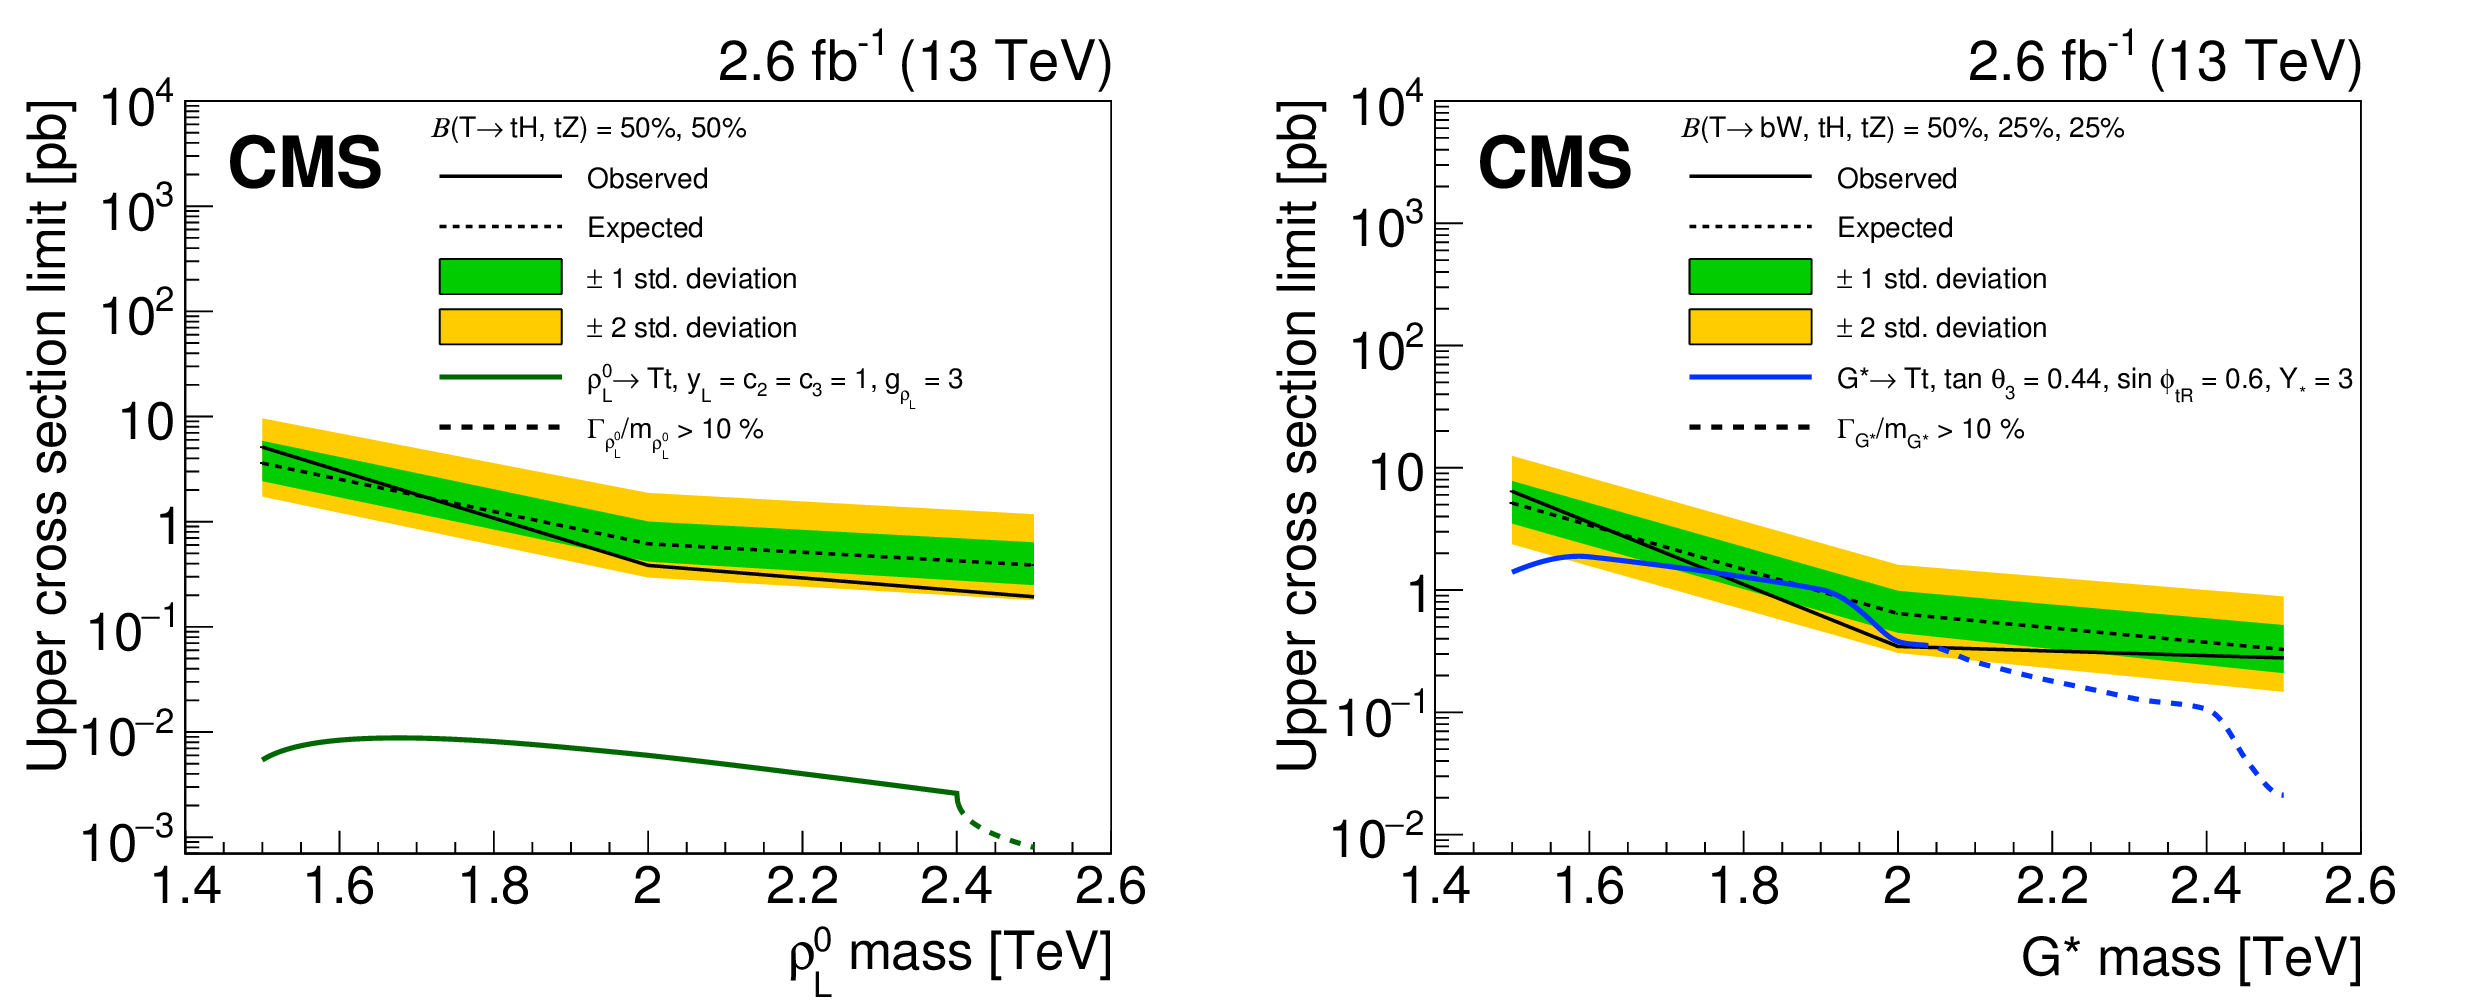
Figure 7:
One-dimensional cross section limits at 95% CL as a function of the heavy vector resonance mass for $m_{ {\mathrm {T}} }= $ 1.2 TeV, assuming branching fractions of the T quark decay to the tH/tZ channels of 50/50% (left) or to the bW/tH/tZ channels of 50/25/25% (right). The solid line is the observed limit, the dotted line is the expected limit, shown with 68% (inner) and 95% (outer) uncertainty bands. In the left plot, the green thick line is the product of the cross section and branching fraction for a heavy spin-1 resonance $\rho ^0_L\to {\mathrm {T}} \mathrm{ t } $ in a composite Higgs boson model [24]. In the right plot, the blue thick line is the product of the cross section and branching fraction for a heavy gluon $\mathrm {G}^*\to {\mathrm {T}} \mathrm{ t } $ in a warped extra-dimension model [22]. The theoretical predictions are shown as dashed lines where the width of the resonance is larger than 10% of its mass. |

png pdf |
Figure 7-a:
One-dimensional cross section limits at 95% CL as a function of the heavy vector resonance mass for $m_{ {\mathrm {T}} }=1.2 TeV $, assuming branching fractions of the T quark decay to the tH/tZ channels of 50/50%. The solid line is the observed limit, the dotted line is the expected limit, shown with 68% (inner) and 95% (outer) uncertainty bands. In the left plot, the green thick line is the product of the cross section and branching fraction for a heavy spin-1 resonance $\rho ^0_L\to {\mathrm {T}} \mathrm{ t } $ in a composite Higgs boson model [24]. In the right plot, the blue thick line is the product of the cross section and branching fraction for a heavy gluon $\mathrm {G}^*\to {\mathrm {T}} \mathrm{ t } $ in a warped extra-dimension model [22]. The theoretical predictions are shown as dashed lines where the width of the resonance is larger than 10% of its mass. |

png pdf |
Figure 7-b:
One-dimensional cross section limits at 95% CL as a function of the heavy vector resonance mass for $m_{ {\mathrm {T}} }=1.2 TeV $, assuming branching fractions of the T quark decay to the bW/tH/tZ channels of 50/25/25%. The solid line is the observed limit, the dotted line is the expected limit, shown with 68% (inner) and 95% (outer) uncertainty bands. In the left plot, the green thick line is the product of the cross section and branching fraction for a heavy spin-1 resonance $\rho ^0_L\to {\mathrm {T}} \mathrm{ t } $ in a composite Higgs boson model [24]. In the right plot, the blue thick line is the product of the cross section and branching fraction for a heavy gluon $\mathrm {G}^*\to {\mathrm {T}} \mathrm{ t } $ in a warped extra-dimension model [22]. The theoretical predictions are shown as dashed lines where the width of the resonance is larger than 10% of its mass. |
| Tables | |

png pdf |
Table 1:
Selection efficiencies for the signal in the categories used in the analysis. The quoted uncertainties are statistical. |

png pdf |
Table 2:
Summary of the selection criteria for the event categories in the signal region (SR) and the sideband region (SB). |

png pdf |
Table 3:
Number of events in the two signal categories of the analysis. The uncertainties include both statistical and systematic components. |

png pdf |
Table 4:
Sources of systematic uncertainty, their impact on event rates, their type, and the processes for which they are relevant. |

png pdf |
Table 5:
Expected and observed limits on the cross section to produce a Z' boson that decays to Tt at 95% CL for the $\mathrm {T}\to \mathrm {bW}$ (upper), $\mathrm {T}\to \mathrm {tH}$ (middle), and $\mathrm {T}\to \mathrm {tZ}$ (lower) signal hypotheses. |
| Summary |
|
A search for a massive spin-1 resonance decaying to a top quark and a vector-like T quark has been performed in the all-jets channel using $\sqrt{s} = $ 13 TeV proton-proton collision data collected by CMS at the LHC. The search uses jet-substructure techniques, involving top quark and W boson tagging algorithms, along with subjet b tagging. The top quark and W boson algorithms are based on the N-subjettiness variables and use the modified mass-drop algorithm to compute the jet mass. The multijet background is estimated in data through a sideband region that is adjusted through simulation-based correction factors. The top quark background is estimated using simulated events. No excess is observed in data beyond the standard model expectations, and upper limits are set on the production cross sections of hypothetical signals. The cross section limits are compared to the cross sections of a spin-1 resonance in a composite Higgs boson model and a Kaluza-Klein gluon in a warped extra-dimension model, for benchmark values of the model parameters, assuming a T quark mass of 1.2 TeV. Branching fractions of the T quark decay to the tH/tZ channels of 50/50% and to the bW/tH/tZ channels of 50/25/25% are assumed for models with a composite Higgs boson and with a warped extra-dimension, respectively. This search is not sensitive to the composite Higgs model [24] with the analyzed data. In the case of the model with a warped extra-dimension [22], the upper limit obtained on the cross section is just at the predicted level for $\mathrm{G}^*$ masses in the region of 1.8 TeV. Although limits are not placed on these particular models, more generally a Z' boson decaying to a top and a T quark is excluded at 95% confidence level, with upper limits on production cross sections ranging from 0.13 to 10 pb, depending on the hypotheses. This is the first search for a heavy spin-1 resonance decaying to a vector-like T quark and a top quark. |
| References | ||||
| 1 | S. Dimopoulos and H. Georgi | Softly broken supersymmetry and SU(5) | Nucl. Phys. B 193 (1981) 150 | |
| 2 | S. Weinberg | Implications of dynamical symmetry breaking | PRD 13 (1976) 974 | |
| 3 | L. Susskind | Dynamics of spontaneous symmetry breaking in the Weinberg-Salam theory | PRD 20 (1979) 2619 | |
| 4 | C. T. Hill and S. J. Parke | Top production: Sensitivity to new physics | PRD 49 (1994) 4454 | hep-ph/9312324 |
| 5 | R. S. Chivukula, B. A. Dobrescu, H. Georgi, and C. T. Hill | Top quark seesaw theory of electroweak symmetry breaking | PRD 59 (1999) 075003 | hep-ph/9809470 |
| 6 | N. Arkani-Hamed, A. G. Cohen, and H. Georgi | Electroweak symmetry breaking from dimensional deconstruction | PLB 513 (2001) 232 | hep-ph/0105239 |
| 7 | N. Arkani-Hamed, S. Dimopoulos, and G. R. Dvali | The hierarchy problem and new dimensions at a millimeter | PLB 429 (1998) 263 | hep-ph/9803315 |
| 8 | L. Randall and R. Sundrum | A Large Mass Hierarchy from a Small Extra Dimension | PRL 83 (1999) 3370 | hep-ph/9905221 |
| 9 | L. Randall and R. Sundrum | An Alternative to Compactification | PRL 83 (1999) 4690 | hep-th/9906064 |
| 10 | J. L. Rosner | Prominent decay modes of a leptophobic Z' | PRB 387 (1996) 113 | hep-ph/9607207v3 |
| 11 | C. T. Hill | Topcolor assisted technicolor | PLB 345 (1995) 483 | hep-ph/9911288 |
| 12 | K. R. Lynch, M. Narain, E. H. Simmons, and S. Mrenna | Finding Z' bosons coupled preferentially to the third family at CERN LEP and the Fermilab Tevatron | PRD 63 (2001) 035006 | hep-ph/0007286 |
| 13 | K. Agashe et al. | LHC signals for warped electroweak neutral gauge bosons | PRD 76 (2007) 115015 | 0810.1497 |
| 14 | K. Agashe et al. | LHC signals from warped extra dimensions | PRD 77 (2008) 015003 | hep-ph/0612015 |
| 15 | CMS Collaboration | Search for anomalous $ \mathrm{ t \bar{t} } $ production in the highly-boosed all-hadronic final state | JHEP 09 (2012) 29 | CMS-EXO-11-006 1204.2488 |
| 16 | CMS Collaboration | Search for resonant $ \mathrm{ t \bar{t} } $ production in lepton+jets events in pp collisions at $ \sqrt{s} = $ 7 TeV | JHEP 12 (2012) 15 | CMS-TOP-12-017 1209.4397 |
| 17 | ATLAS Collaboration | Search for resonances decaying into top-quark pairs using fully hadronic decays in $ pp $ collisions with ATLAS at $ \sqrt{s} = $ 7 TeV | JHEP 01 (2013) 116 | 1211.2202 |
| 18 | ATLAS Collaboration | A search for $ \mathrm{ t \bar{t} } $ resonances in lepton+jets events with highly-boosed top quarks collected in pp collisions with ATLAS at $ \sqrt{s} = $ 7 TeV | JHEP 09 (2012) 41 | 1207.2409 |
| 19 | CMS Collaboration | Searches for New Physics Using the $ t \bar{t} $ Invariant Mass Distribution in $ pp $ Collisions at $ \sqrt{s} = $ 8 TeV | PRL 111 (2013) 211804 | CMS-B2G-13-001 1309.2030 |
| 20 | CMS Collaboration | Search for resonant $ \mathrm{ t \bar{t} } $ production in proton-proton collisions at $ \sqrt{s} = $ 8 TeV | PRD 93 (2016) 012001 | CMS-B2G-13-008 1506.03062 |
| 21 | ATLAS Collaboration | A search for $ \mathrm{ t \bar{t} } $ resonances using lepton-plus-jets events in proton-proton collisions at $ \sqrt{s} = $ 8 TeV with the ATLAS detector | JHEP 08 (2015) 148 | 1505.07018 |
| 22 | C. Bini, R. Contino, and N. Vignaroli | Heavy-light decay topologies as a new strategy to discover a heavy gluon | JHEP 01 (2012) 157 | 1110.6058 |
| 23 | B. A. Dobrescu, K. Kong, and R. Mahbubani | Prospects for top-prime quark discovery at the Tevatron | JHEP 06 (2009) 001 | 0902.0792 |
| 24 | D. Greco and D. Liu | Hunting composite vector resonances at the LHC: naturalness facing data | JHEP 12 (2014) 126 | 1410.2883 |
| 25 | N. Vignaroli | New W' signals at the LHC | PRD 89 (2014) 095027 | 1404.5558 |
| 26 | ATLAS, CMS Collaboration | Measurements of the Higgs boson production and decay rates and constraints on its couplings from a combined ATLAS and CMS analysis of the LHC pp collision data at $ \sqrt{s}= $ 7 and 8 TeV | JHEP 08 (2016) 045 | 1606.02266 |
| 27 | Particle Data Group Collaboration | Review of Particle Physics | CPC 40 (2016), no. 10, 100001 | |
| 28 | CMS Collaboration | Particle-flow event reconstruction in CMS and performance for jets, taus, and $ E_{\mathrm{T}}^{\text{miss}} $ | CDS | |
| 29 | CMS Collaboration | Commissioning of the particle-flow event reconstruction with the first LHC collisions recorded in the CMS detector | CDS | |
| 30 | CMS Collaboration | Description and performance of track and primary-vertex reconstruction with the CMS tracker | JINST 9 (2014) P10009 | CMS-TRK-11-001 1405.6569 |
| 31 | CMS Collaboration | The CMS experiment at the CERN LHC | JINST 3 (2008) S08004 | CMS-00-001 |
| 32 | J. Alwall et al. | The automated computation of tree-level and next-to-leading order differential cross sections, and their matching to parton shower simulations | JHEP 07 (2014) 079 | 1405.0301 |
| 33 | P. Artoisenet, R. Frederix, O. Mattelaer, and R. Rietkerk | Automatic spin-entangled decays of heavy resonances in Monte Carlo simulations | JHEP 03 (2013) 015 | 1212.3460 |
| 34 | T. Sjostrand et al. | An introduction to PYTHIA 8.2 | CPC 191 (2015) 159 | 1410.3012 |
| 35 | CMS Collaboration | Event generator tunes obtained from underlying event and multiparton scattering measurements | EPJC 76 (2016) 155 | CMS-GEN-14-001 1512.00815 |
| 36 | M. L. Mangano, M. Moretti, F. Piccinini, and M. Treccani | Matching matrix elements and shower evolution for top-quark production in hadronic collisions | JHEP 01 (2007) 013 | hep-ph/0611129 |
| 37 | P. Nason | A new method for combining NLO QCD with shower Monte Carlo algorithms | JHEP 11 (2004) 040 | hep-ph/0409146 |
| 38 | S. Frixione, P. Nason, and C. Oleari | Matching NLO QCD computations with parton shower simulations: the POWHEG method | JHEP 11 (2007) 070 | 0709.2092 |
| 39 | S. Alioli, P. Nason, C. Oleari, and E. Re | A general framework for implementing NLO calculations in shower Monte Carlo programs: the POWHEG BOX | JHEP 06 (2010) 043 | 1002.2581 |
| 40 | S. Frixione, P. Nason, and G. Ridolfi | A positive-weight next-to-leading-order Monte Carlo for heavy flavour hadroproduction | JHEP 09 (2007) 126 | 0707.3088 |
| 41 | E. Re | Single-top $ Wt $-channel production matched with parton showers using the POWHEG method | EPJC 71 (2011) 1547 | 1009.2450 |
| 42 | M. Czakon and A. Mitov | Top++: a program for the calculation of the top-pair cross-section at hadron colliders | CPC 185 (2014) 2930 | 1112.5675 |
| 43 | N. Kidonakis | Two-loop soft anomalous dimensions for single top quark associated production with a $ W^- $ or $ H^- $ | PRD 82 (2010) 054018 | 1311.0283 |
| 44 | M. Aliev et al. | HATHOR: HAdronic Top and Heavy quarks crOss section calculatoR | CPC 182 (2011) 1034 | 1007.1327 |
| 45 | P. Kant et al. | HatHor for single top-quark production: Updated predictions and uncertainty estimates for single top-quark production in hadronic collisions | CPC 191 (2015) 74 | 1406.4403 |
| 46 | NNPDF Collaboration | Parton distributions for the LHC Run II | JHEP 04 (2015) 040 | 1410.8849 |
| 47 | GEANT4 Collaboration | GEANT4---a simulation toolkit | NIMA 506 (2003) 250 | |
| 48 | J. Allison et al. | Geant4 developments and applications | IEEE Trans. Nucl. Sci. 53 (2006) 270 | |
| 49 | M. Cacciari, G. P. Salam, and G. Soyez | The anti-$ k_t $ jet clustering algorithm | JHEP 04 (2008) 063 | 0802.1189 |
| 50 | M. Cacciari and G. P. Salam | Dispelling the $ N^3 $ myth for the $ k_t $ jet-finder | PLB 641 (2006) 57 | hep-ph/0512210 |
| 51 | M. Cacciari, G. P. Salam, and G. Soyez | FastJet User Manual | EPJC 72 (2012) 1896 | 1111.6097 |
| 52 | M. Cacciari and G. P. Salam | Pileup subtraction using jet areas | PLB 659 (2008) 119 | 0707.1378 |
| 53 | CMS Collaboration | Determination of Jet Energy Calibration and Transverse Momentum Resolution in CMS | JINST 6 (2011) P11002 | CMS-JME-10-011 1107.4277 |
| 54 | CMS Collaboration | Top Tagging with New Approaches | ||
| 55 | Y. L. Dokshitzer, G. D. Leder, S. Moretti, and B. R. Webber | Better jet clustering algorithms | JHEP 08 (1997) 001 | hep-ph/9707323 |
| 56 | M. Wobisch and T. Wengler | Hadronization corrections to jet cross-sections in deep-inelastic scattering | hep-ph/9907280 | |
| 57 | M. Dasgupta, A. Fregoso, S. Marzani, and G. P. Salam | Towards an understanding of jet substructure | JHEP 09 (2013) 029 | 1307.0007 |
| 58 | A. J. Larkoski, S. Marzani, G. Soyez, and J. Thaler | Soft drop | JHEP 05 (2014) 146 | 1402.2657 |
| 59 | J. Thaler and K. Van Tilburg | Identifying boosted objects with N-subjettiness | JHEP 03 (2011) 015 | 1011.2268 |
| 60 | J. Thaler and K. Van Tilburg | Maximizing boosted top identification by minimizing N-subjettiness | JHEP 02 (2012) 093 | 1108.2701 |
| 61 | CMS Collaboration | Identification of b quark jets at the CMS Experiment in the LHC Run 2 | CMS-PAS-BTV-15-001 | CMS-PAS-BTV-15-001 |
| 62 | CMS Collaboration | Identification of b-quark jets with the CMS experiment | JINST 8 (2013) P04013 | CMS-BTV-12-001 1211.4462 |
| 63 | CMS Collaboration | Boosted Top Jet Tagging at CMS | CMS-PAS-JME-13-007 | CMS-PAS-JME-13-007 |
| 64 | CMS Collaboration | Measurements of inclusive W and Z cross sections in pp collisions at $ \sqrt{s}= $ 7 TeV | JHEP 01 (2011) 080 | CMS-EWK-10-002 1012.2466 |
| 65 | CMS Collaboration | CMS Luminosity Measurement for the 2015 Data Taking Period | CMS-PAS-LUM-15-001 | CMS-PAS-LUM-15-001 |
| 66 | T. Muller, J. Ott, and J. Wagner-Kuhr | Theta---a framework for template-based modeling and inference | 2010 | |
|
|
Compact Muon Solenoid LHC, CERN |
|

|

|

|

|

|