

Compact Muon Solenoid
LHC, CERN
| CMS-B2G-16-015 ; CERN-EP-2017-049 | ||
| Search for $\mathrm{ t \bar{t} }$ resonances in highly-boosted lepton+jets and fully hadronic final states in proton-proton collisions at $ \sqrt{s} = $ 13 TeV | ||
| CMS Collaboration | ||
| 11 April 2017 | ||
| JHEP 07 (2017) 001 | ||
| Abstract: A search for the production of heavy resonances decaying into top quark-antiquark pairs is presented. The analysis is performed in the lepton+jets and fully hadronic channels using data collected in proton-proton collisions at $ \sqrt{s} = $ 13 TeV using the CMS detector at the LHC, corresponding to an integrated luminosity of 2.6 fb$^{-1}$. The selection is optimized for massive resonances, where the top quarks have large Lorentz boosts. No evidence for resonant $\mathrm{ t \bar{t} }$ production is found in the data, and upper limits on the production cross section of heavy resonances are set. The exclusion limits for resonances with masses above 2 TeV are significantly improved compared to those of previous analyses at $ \sqrt{s} = $ 8 TeV. | ||
| Links: e-print arXiv:1704.03366 [hep-ex] (PDF) ; CDS record ; inSPIRE record ; CADI line (restricted) ; | ||
| Figures | |

png pdf |
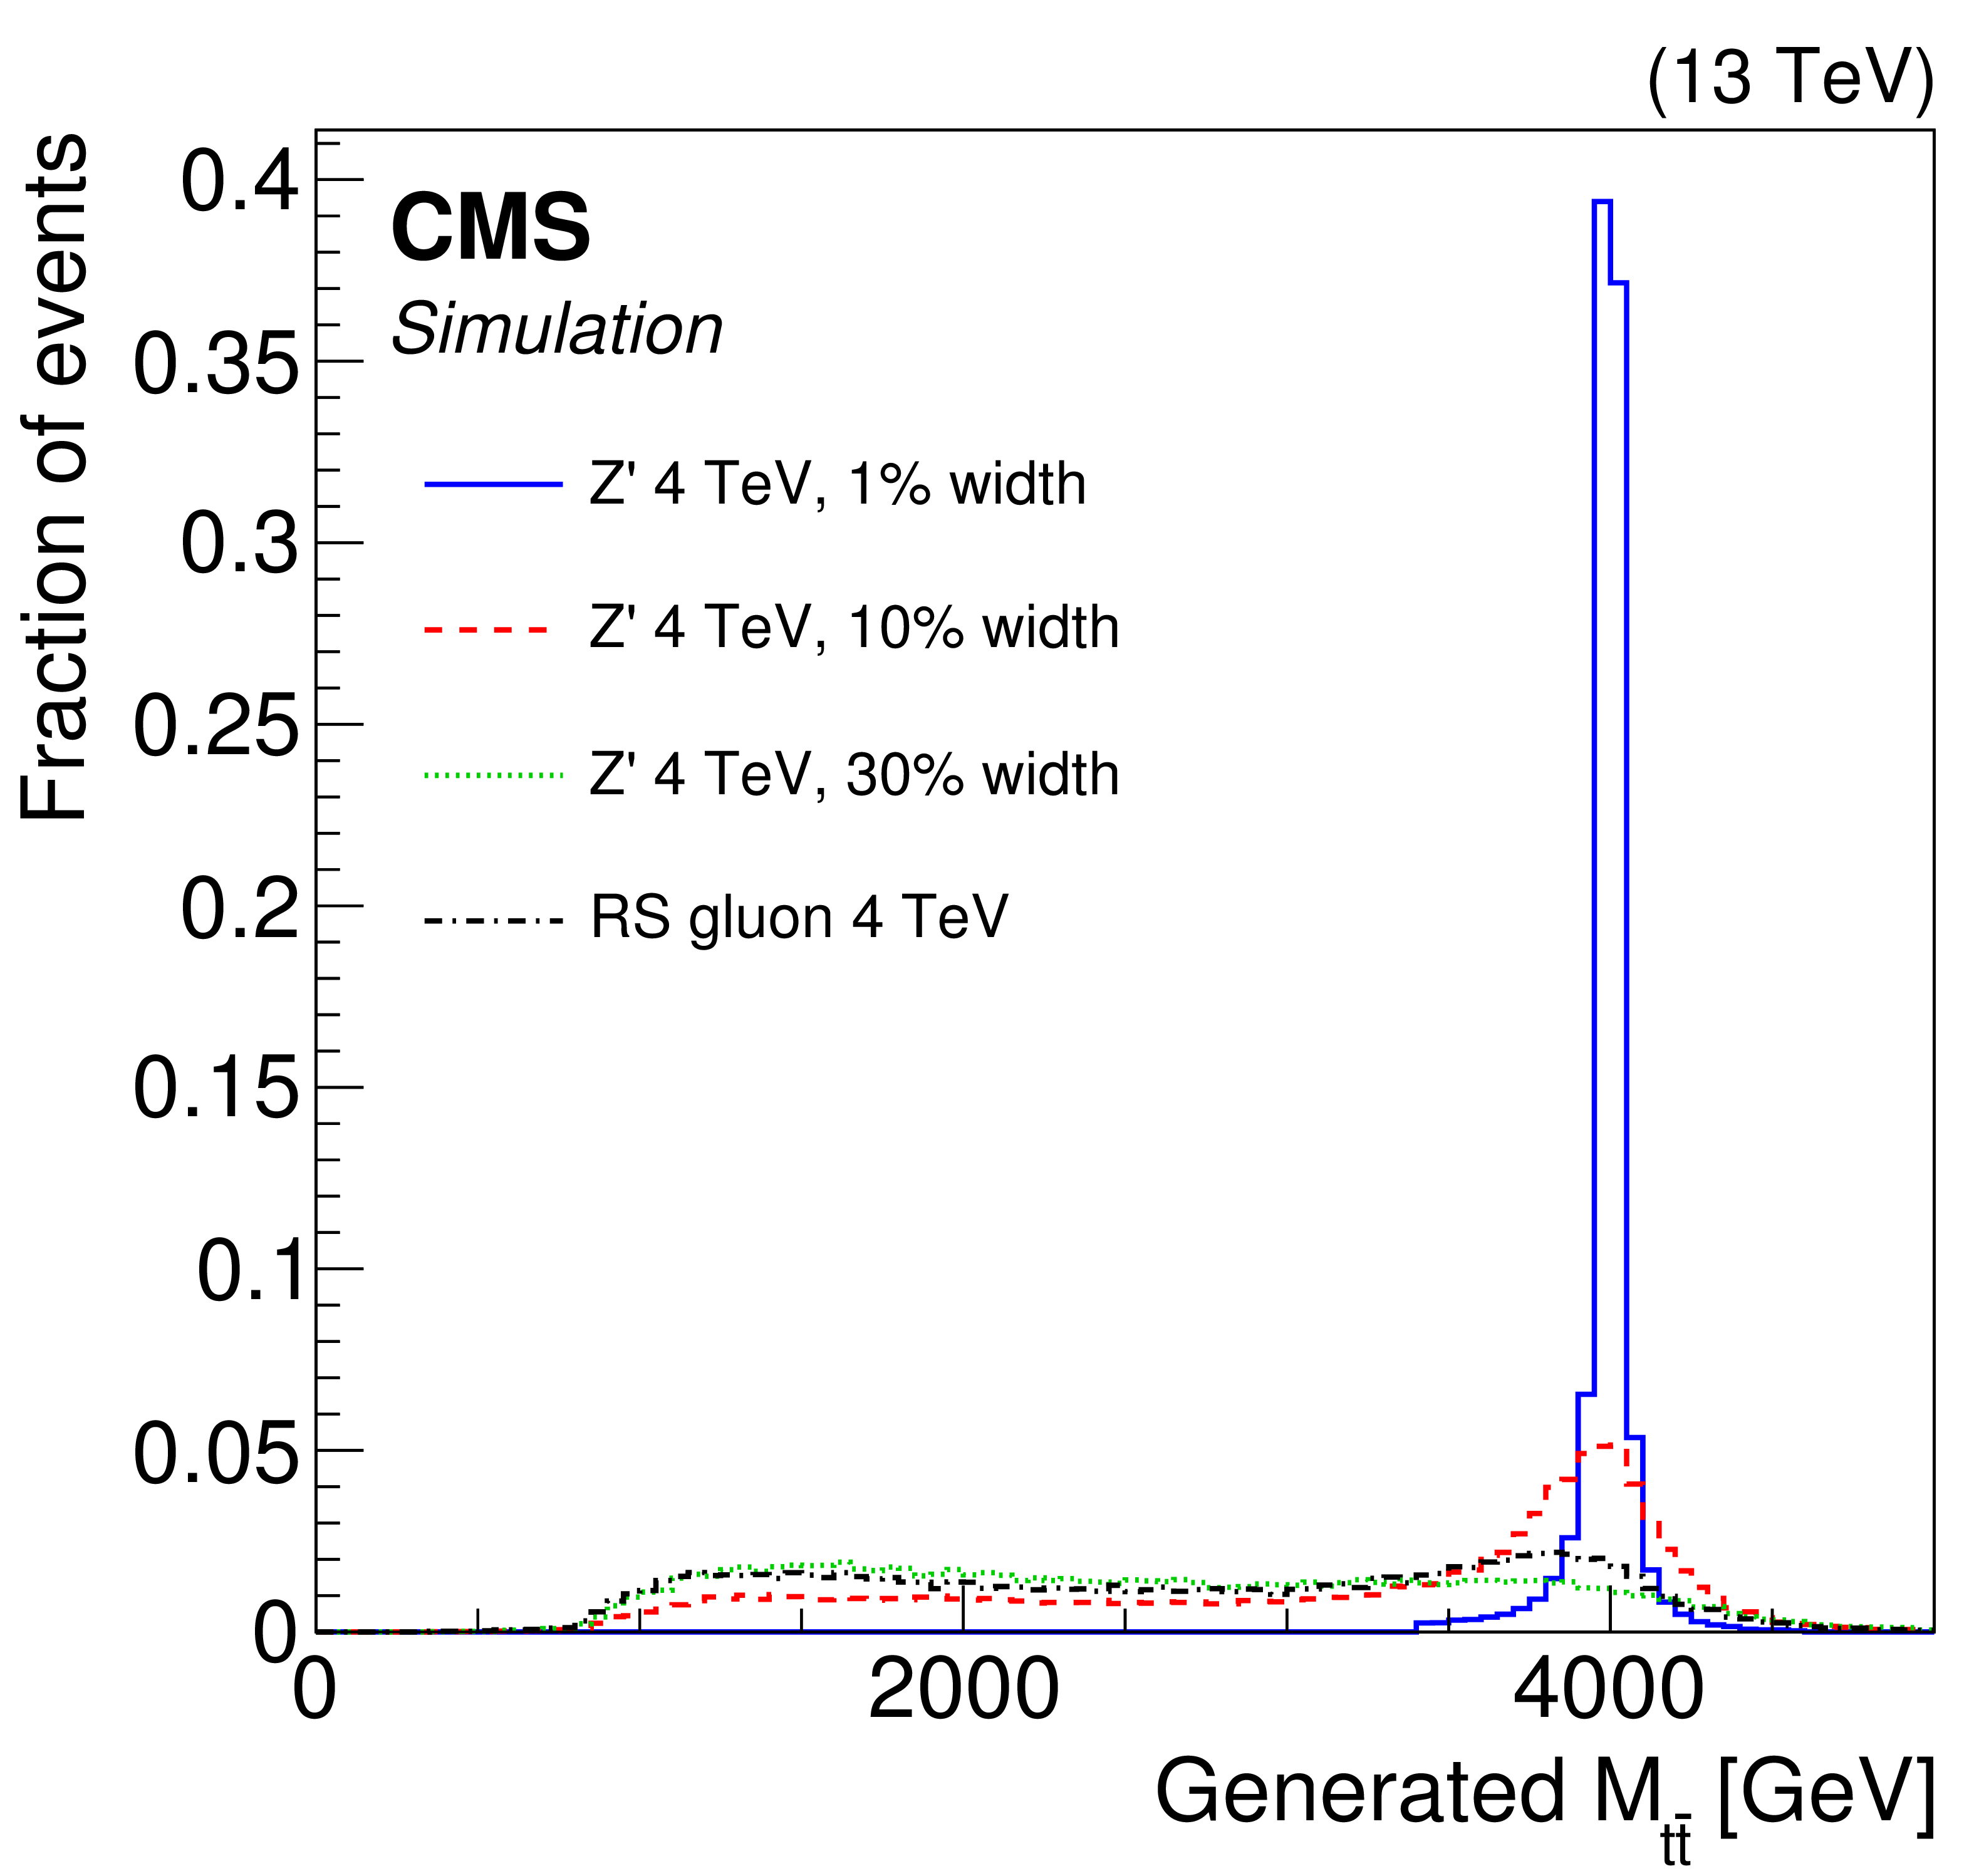
Figure 1:
Distributions of generator-level $M_{{\mathrm{ t } {}\mathrm{ \bar{t} } } }$ for the production of new particles with masses of 2 TeV (left) and 4 TeV (right), for the four signal hypotheses considered in this analysis. |

png pdf |
Figure 1-a:
Distribution of generator-level $M_{{\mathrm{ t } {}\mathrm{ \bar{t} } } }$ for the production of a new particle with mass 2 TeV, for the four signal hypotheses considered in this analysis. |
png pdf |
Figure 1-b:
Distribution of generator-level $M_{{\mathrm{ t } {}\mathrm{ \bar{t} } } }$ for the production of a new particle with mass 4 TeV, for the four signal hypotheses considered in this analysis. |

png pdf |
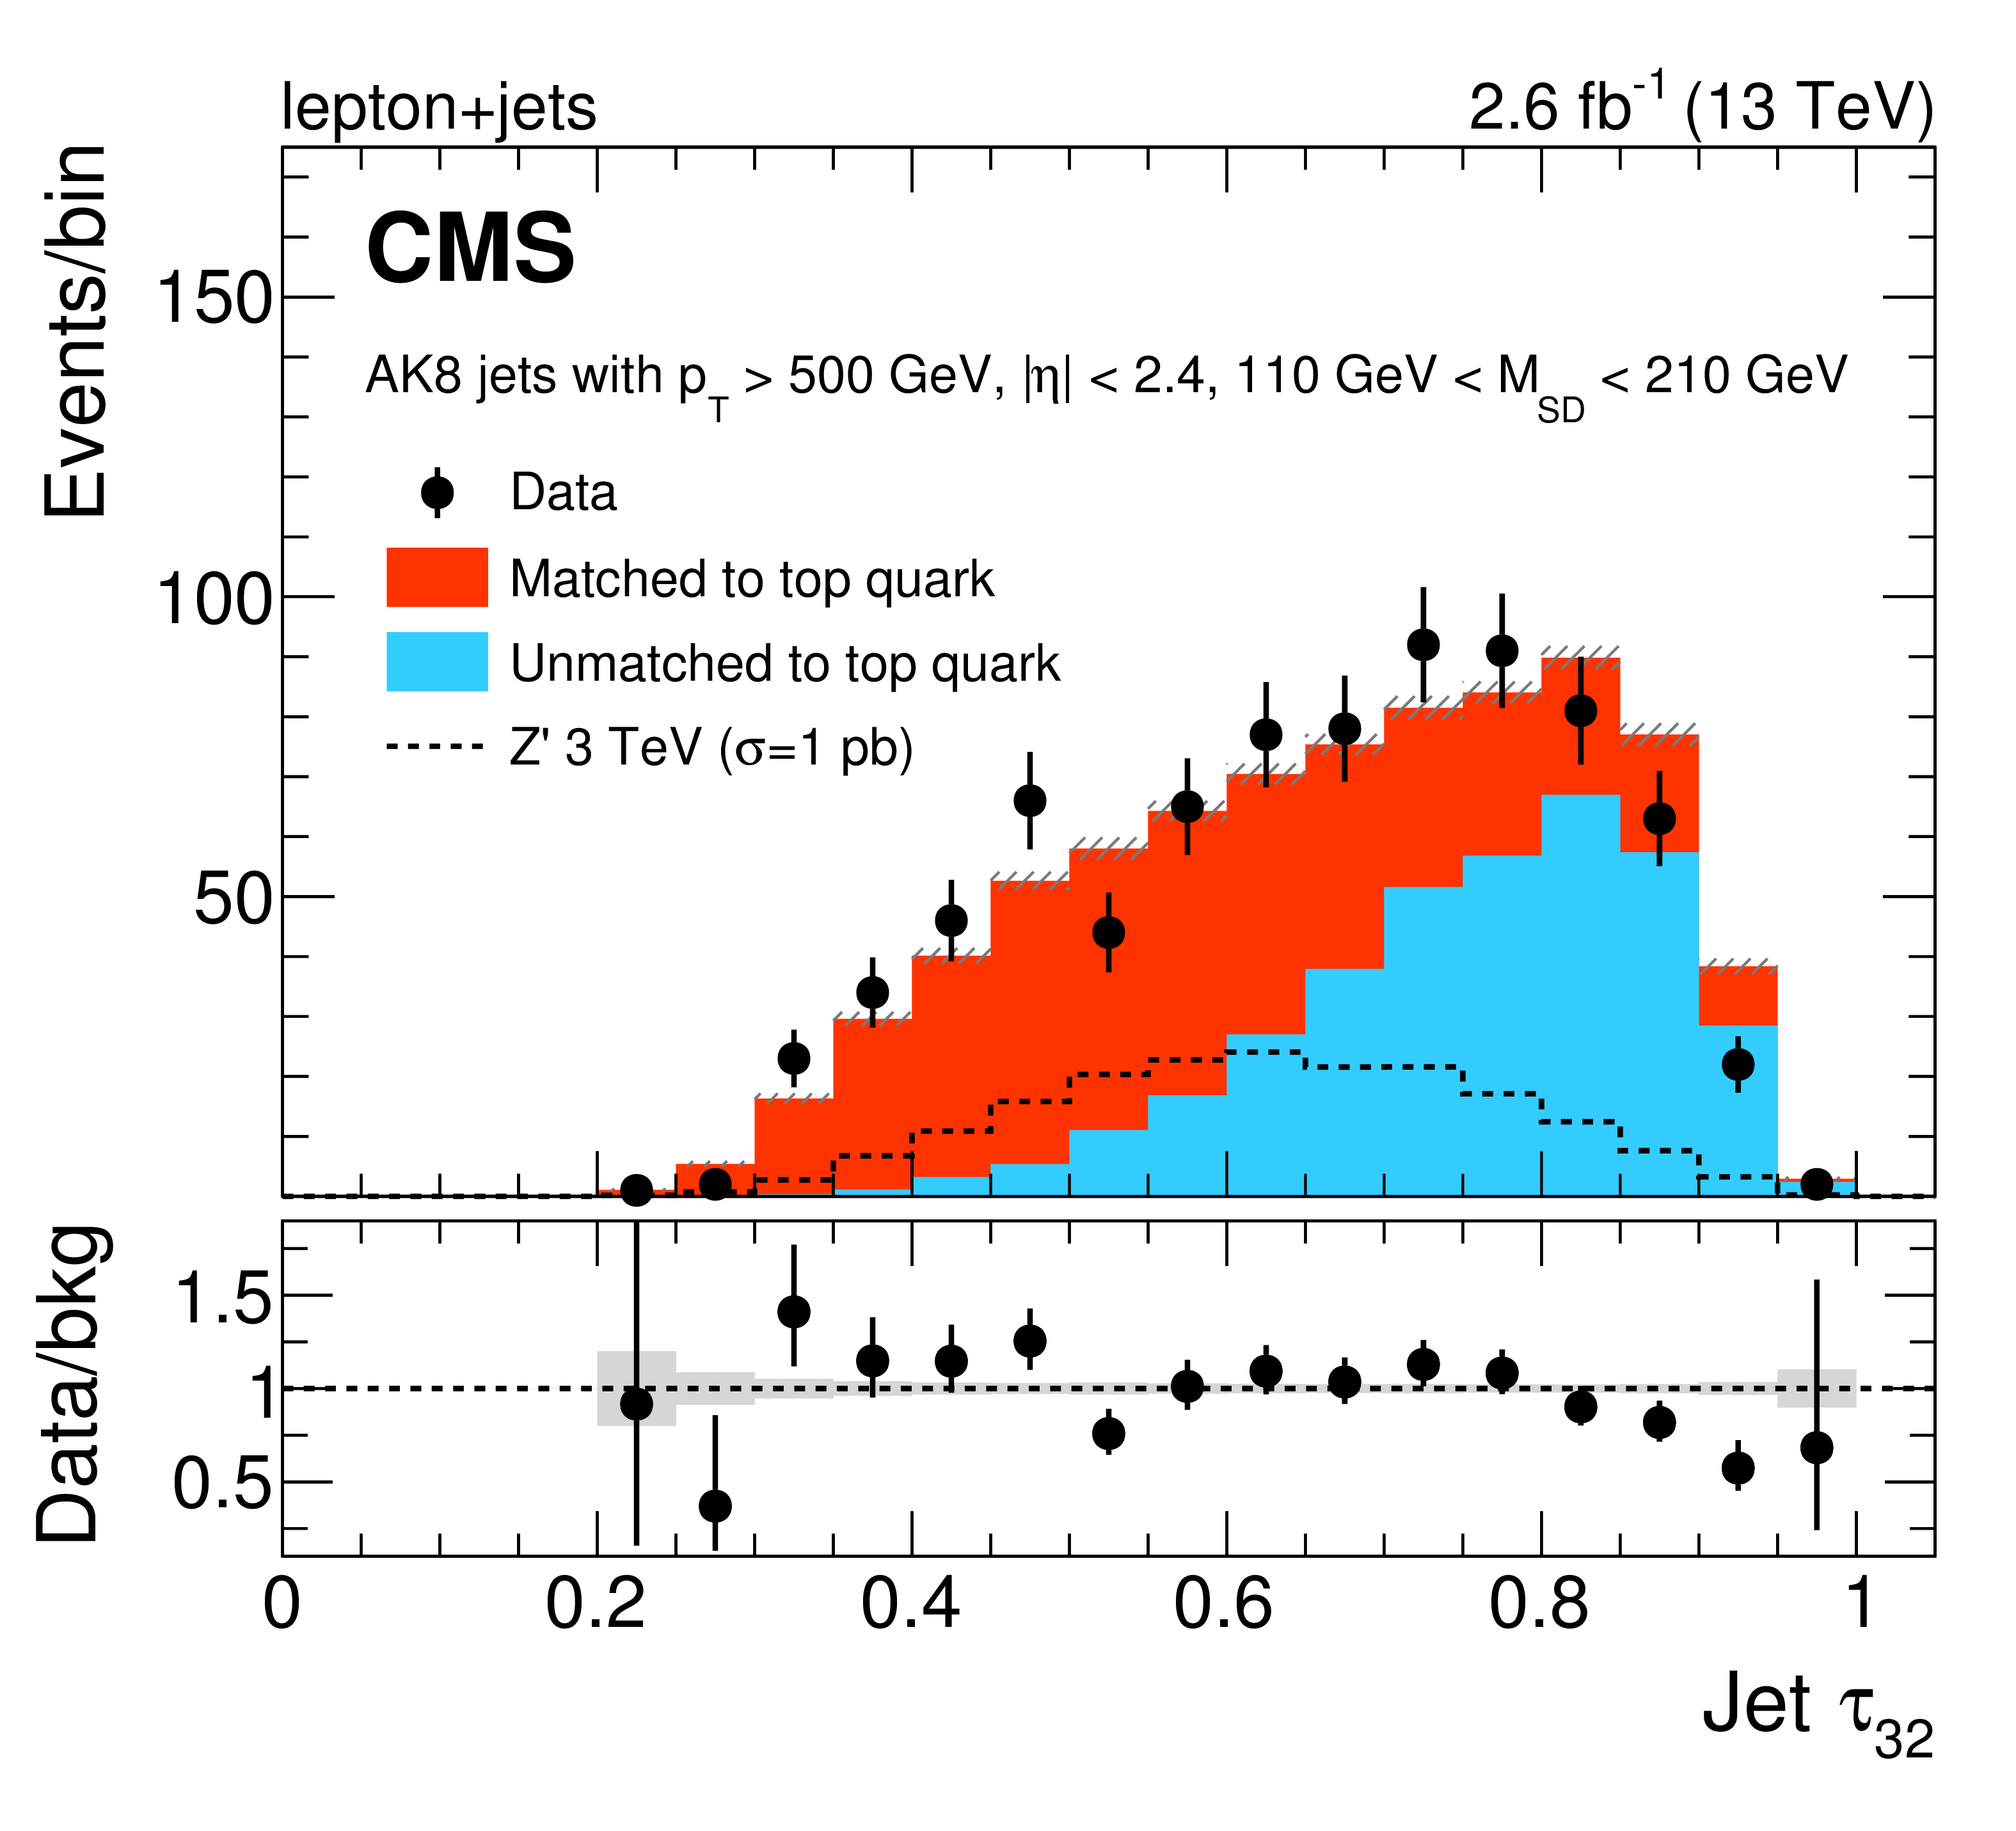
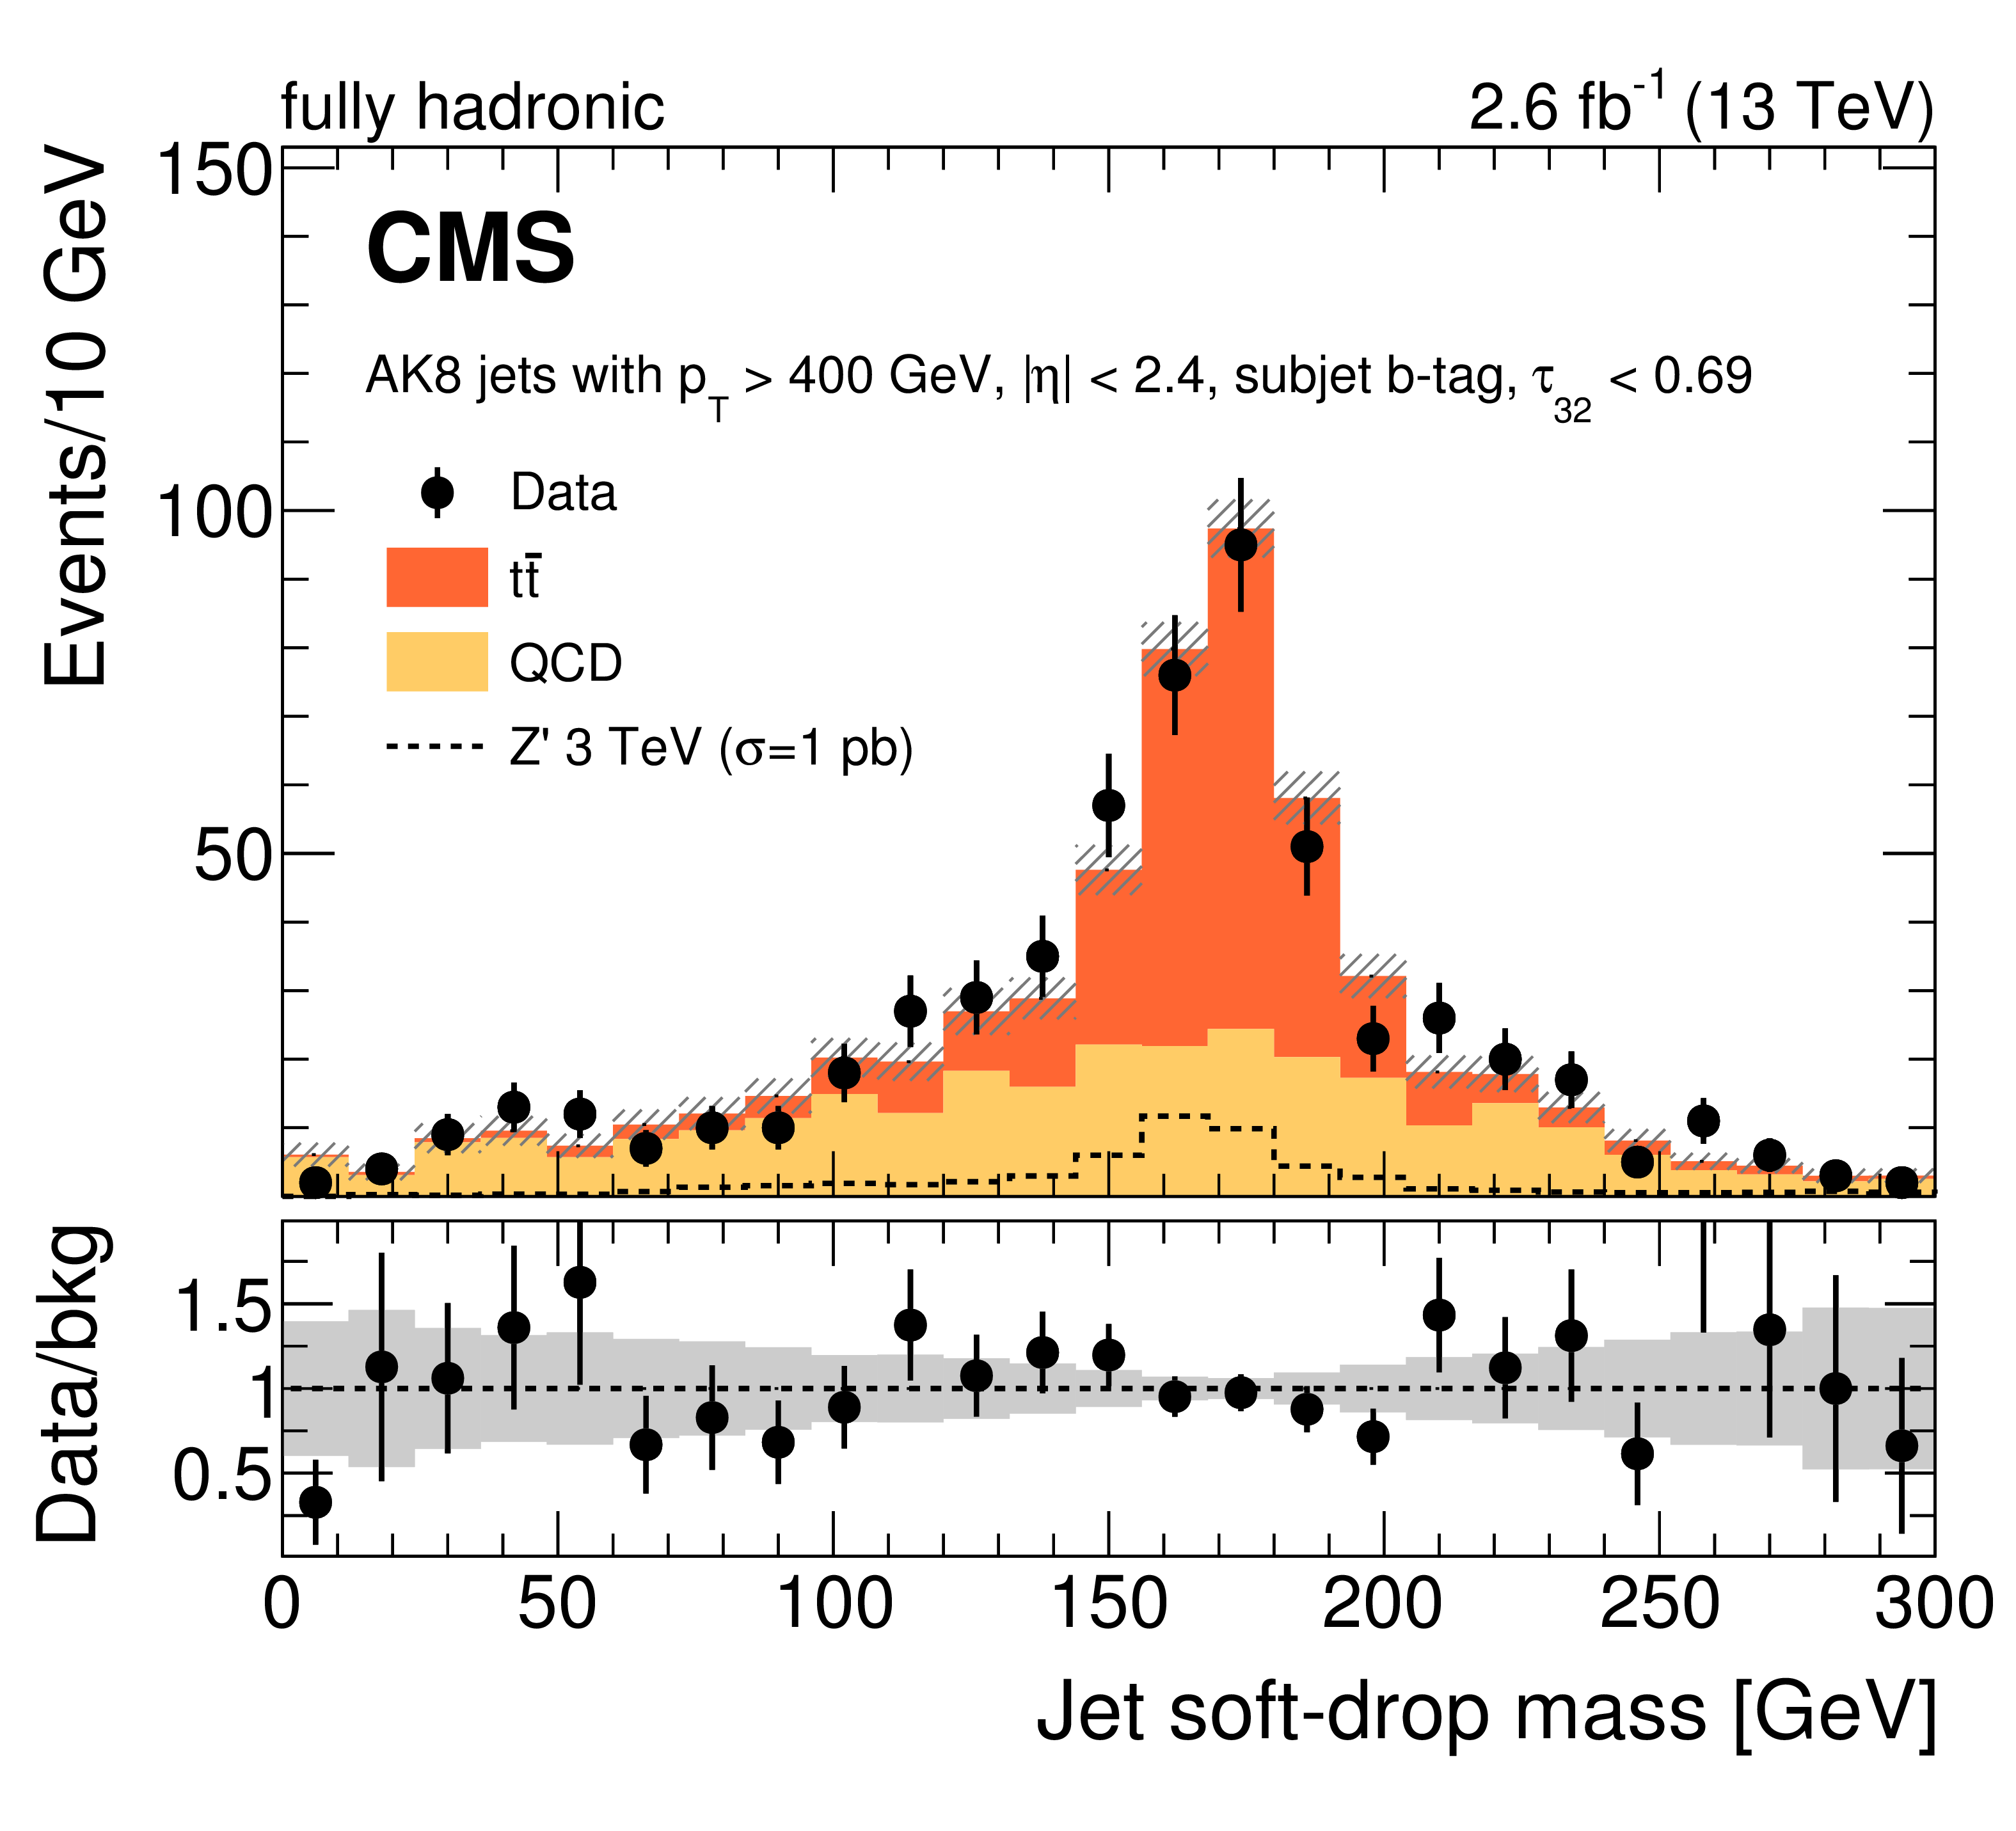
Figure 2:
Distributions of the N-subjettiness ratio, $\tau _{32}$, and the soft dropped mass, $M_{\mathrm {SD}}$, for AK8 jets in data and simulation, after the signal selection. For lepton+jets, with $ {p_{\mathrm {T}}} >$ 500 GeV (upper row). For the fully hadronic final state, with $ {p_{\mathrm {T}}} >$ 400 GeV and subjet b tag (lower row). The distribution of $\tau _{32}$ (left) is shown after the selection 110 $ < M_{\mathrm {SD}} < $ 210 GeV, and the distribution of $M_{\mathrm {SD}}$ (right) is shown after the selection $\tau _{32}< $ 0.69. The lepton+jets channel plots compare data to background simulation, where the latter is divided into contributions from jets matched at the generator level to top quarks and other jets in top pair or W+jets events. The fully hadronic channel plots compare data to ${\mathrm{ t } {}\mathrm{ \bar{t} } }$ and QCD multijet simulation. Contributions from a benchmark narrow Z' signal model are shown with the black dashed lines. In obtaining the final results, NTMJ production is estimated from data, and simulated QCD multijet events are not used. In all plots, the error bars include only statistical contributions. |
png pdf |
Figure 2-a:
Distribution of the N-subjettiness ratio, $\tau _{32}$, for AK8 jets in data and simulation, after the signal selection for lepton+jets, with $ {p_{\mathrm {T}}} >$ 500 GeV. The distribution is shown after the selection 110 $ < M_{\mathrm {SD}} < $ 210 GeV. The plot compares data to background simulation, where the latter is divided into contributions from jets matched at the generator level to top quarks and other jets in top pair or W+jets events. The contribution from a benchmark narrow Z' signal model is shown with the black dashed line. In obtaining the final results, NTMJ production is estimated from data, and simulated QCD multijet events are not used. The error bars include only statistical contributions. |

png pdf |
Figure 2-b:
Distribution of the soft dropped mass, $M_{\mathrm {SD}}$, for AK8 jets in data and simulation, after the signal selection for lepton+jets, with $ {p_{\mathrm {T}}} >$ 500 GeV. The distribution is shown after the selection $\tau _{32}< $ 0.69. The plot compares data to background simulation, where the latter is divided into contributions from jets matched at the generator level to top quarks and other jets in top pair or W+jets events. The contribution from a benchmark narrow Z' signal model is shown with the black dashed line. In obtaining the final results, NTMJ production is estimated from data, and simulated QCD multijet events are not used. The error bars include only statistical contributions. |

png pdf |
Figure 2-c:
Distribution of the N-subjettiness ratio, $\tau _{32}$, for AK8 jets in data and simulation, after the signal selection for the fully hadronic final state, with $ {p_{\mathrm {T}}} >$ 400 GeV and subjet b tag. The distribution is shown after the selection 110 $ < M_{\mathrm {SD}} < $ 210 GeV. The plot compares data to ${\mathrm{ t } {}\mathrm{ \bar{t} } }$ and QCD multijet simulation. The contribution from a benchmark narrow Z' signal model is shown with the black dashed line. In obtaining the final results, NTMJ production is estimated from data, and simulated QCD multijet events are not used. The error bars include only statistical contributions. |
png pdf |
Figure 2-d:
Distribution of the soft dropped mass, $M_{\mathrm {SD}}$, for AK8 jets in data and simulation, after the signal selection for the fully hadronic final state, with $ {p_{\mathrm {T}}} >$ 400 GeV and subjet b tag. The distribution is shown after the selection $\tau _{32}< $ 0.69. The plot compares data to ${\mathrm{ t } {}\mathrm{ \bar{t} } }$ and QCD multijet simulation. The contribution from a benchmark narrow Z' signal model is shown with the black dashed line. In obtaining the final results, NTMJ production is estimated from data, and simulated QCD multijet events are not used. The error bars include only statistical contributions. |
png pdf |
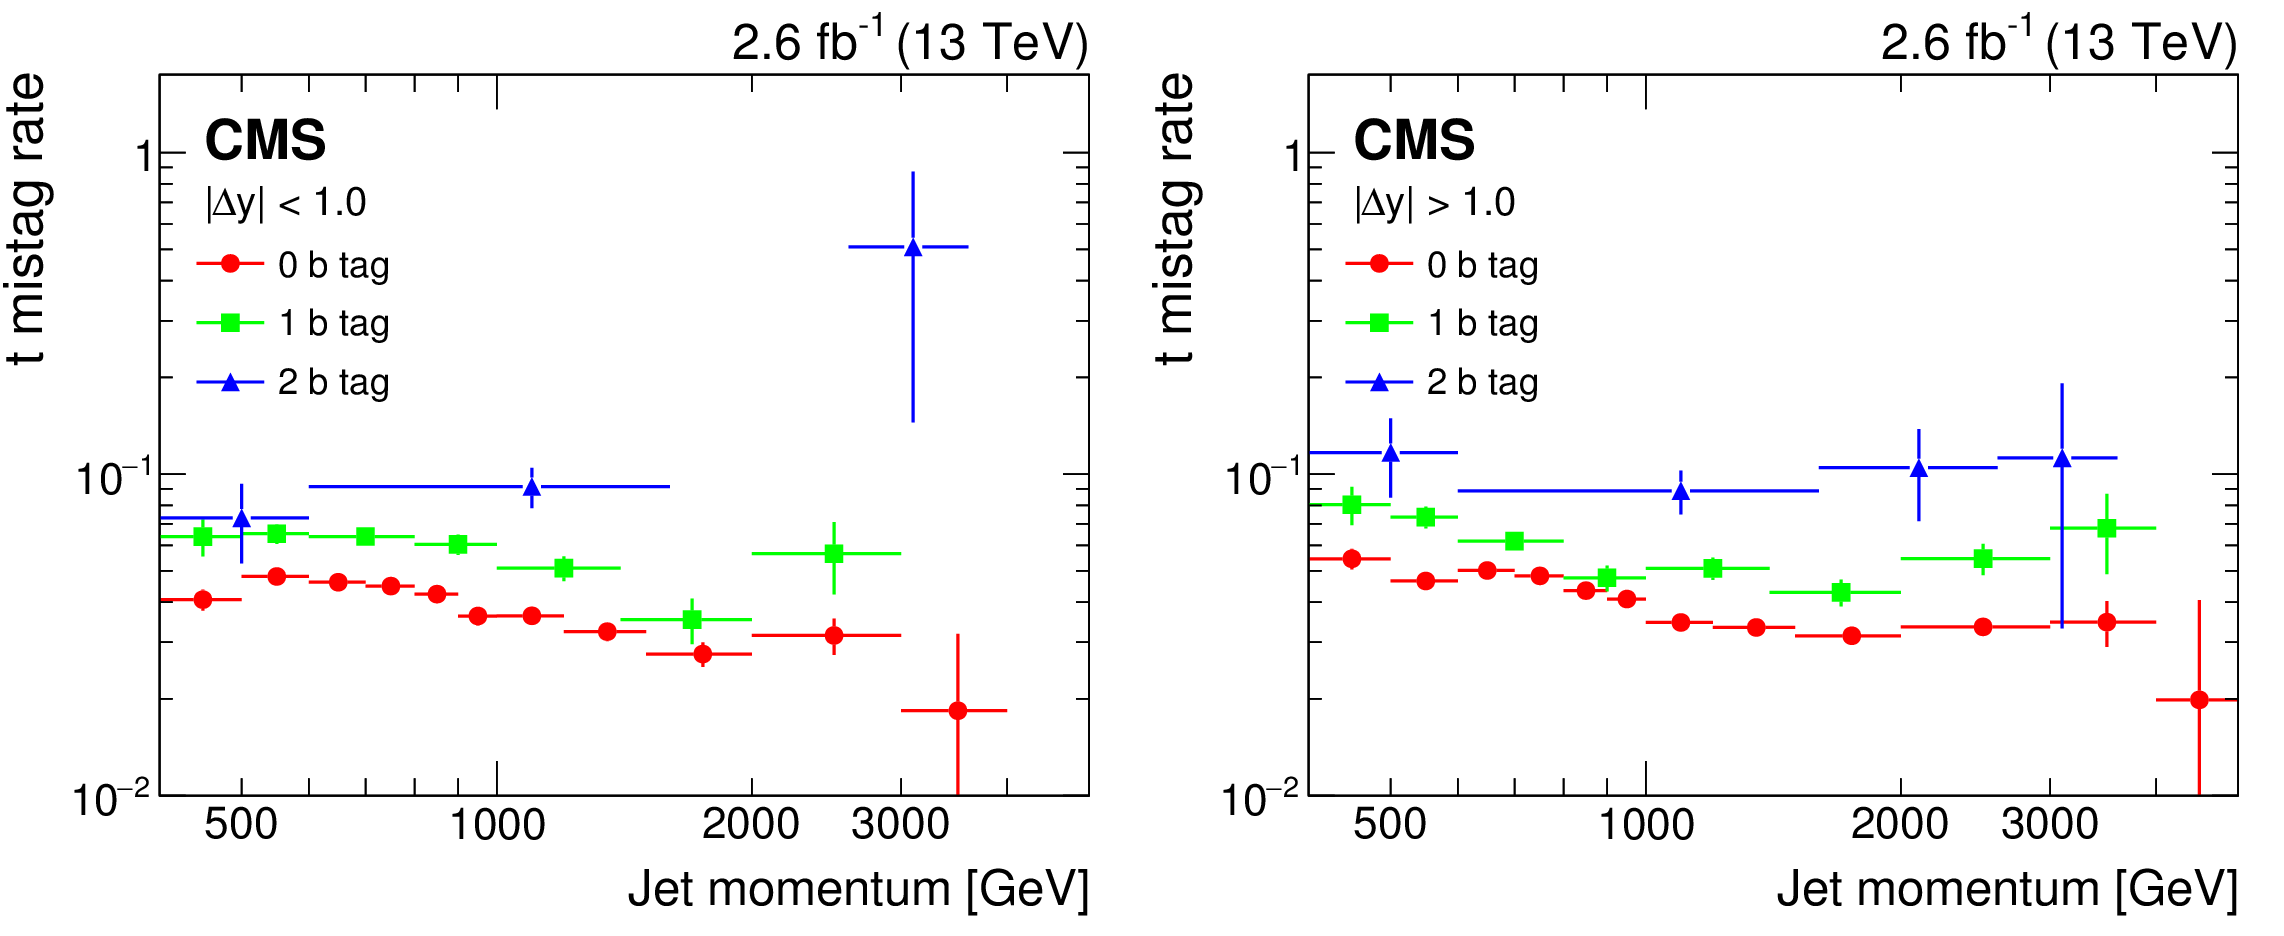
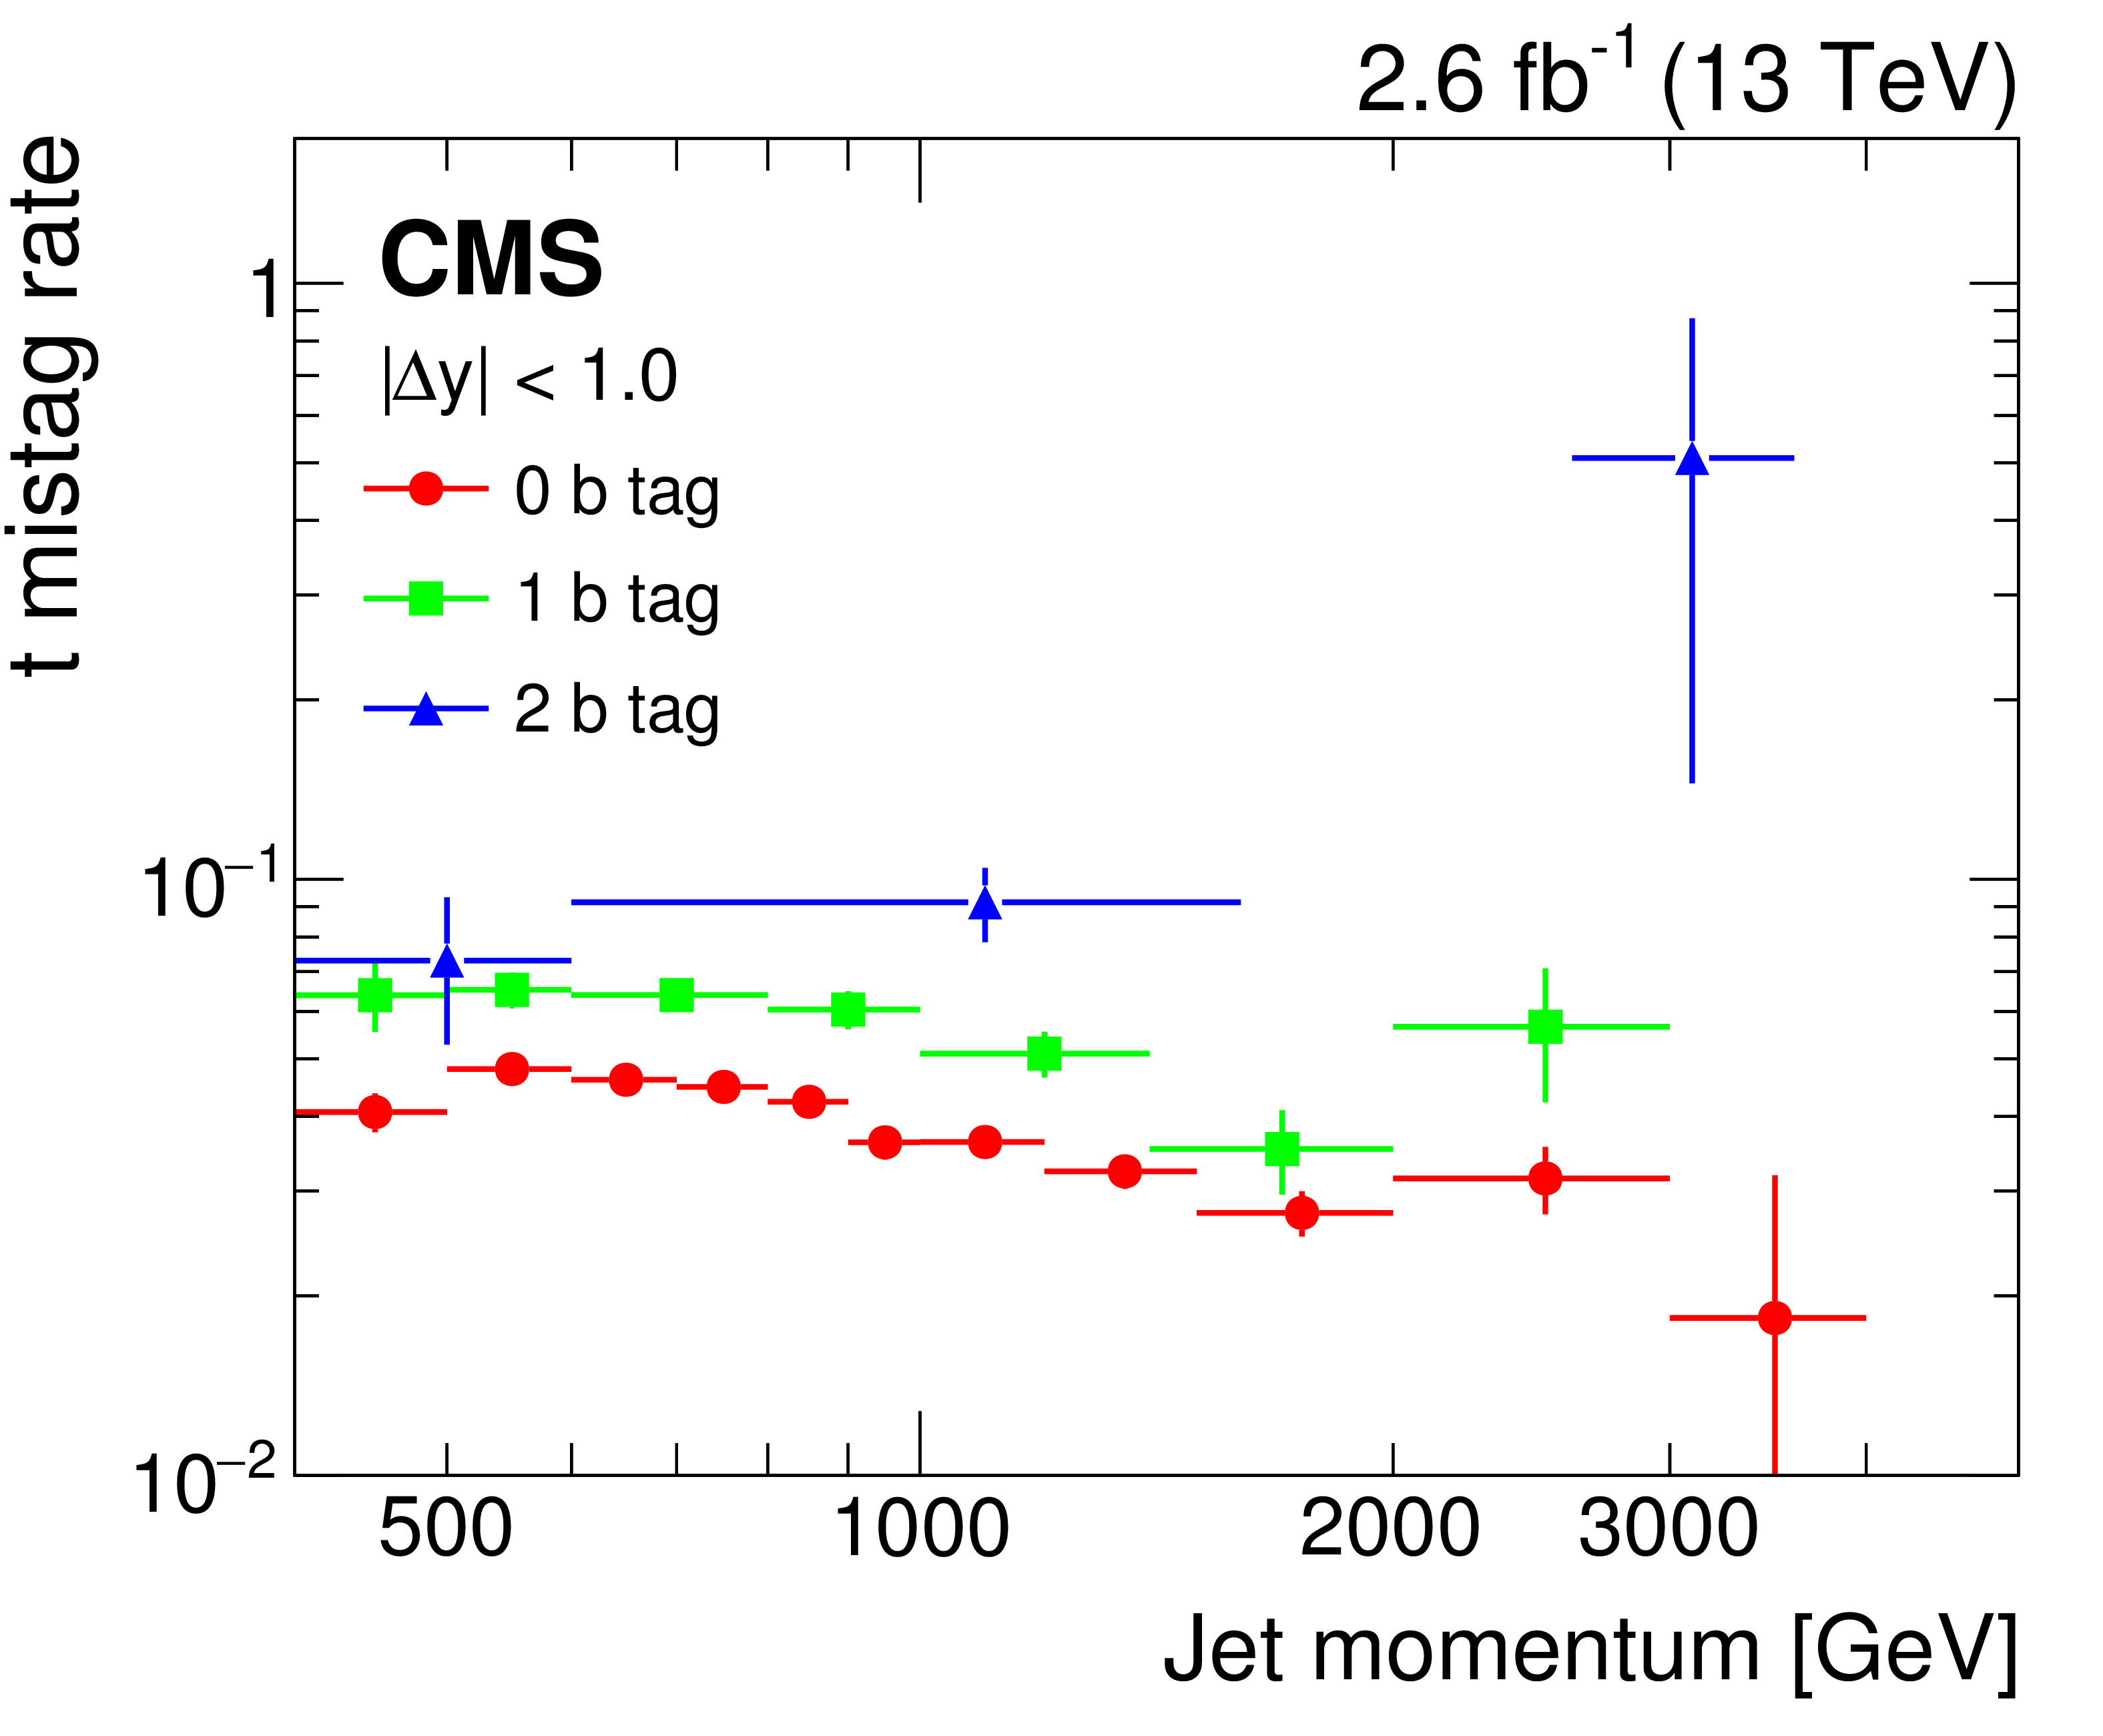
Figure 3:
The mistag rate for the t tagging algorithm in the fully hadronic channel, measured with data for the six event categories by an anti-tag and probe procedure. The round, square, and triangular points indicate the t mistag rate for events in the 0, 1, and 2 b tag categories, respectively. The left (right) plot contains events with $ {| \Delta y | } < $ 1.0 ($ > $ 1.0). The contamination from ${\mathrm{ t } {}\mathrm{ \bar{t} } }$ production is removed by subtracting the distribution of ${\mathrm{ t } {}\mathrm{ \bar{t} } }$ events in simulation, normalized to SM expectation. |
png pdf |
Figure 3-a:
The mistag rate for the t tagging algorithm in the fully hadronic channel, measured with data for the six event categories by an anti-tag and probe procedure. The round, square, and triangular points indicate the t mistag rate for events in the 0, 1, and 2 b tag categories, respectively. The plot contains events with $ {| \Delta y | } < $ 1.0. The contamination from ${\mathrm{ t } {}\mathrm{ \bar{t} } }$ production is removed by subtracting the distribution of ${\mathrm{ t } {}\mathrm{ \bar{t} } }$ events in simulation, normalized to SM expectation. |

png pdf |
Figure 3-b:
The mistag rate for the t tagging algorithm in the fully hadronic channel, measured with data for the six event categories by an anti-tag and probe procedure. The round, square, and triangular points indicate the t mistag rate for events in the 0, 1, and 2 b tag categories, respectively. The plot contains events with $ {| \Delta y | } > $ 1.0. The contamination from ${\mathrm{ t } {}\mathrm{ \bar{t} } }$ production is removed by subtracting the distribution of ${\mathrm{ t } {}\mathrm{ \bar{t} } }$ events in simulation, normalized to SM expectation. |
png pdf |
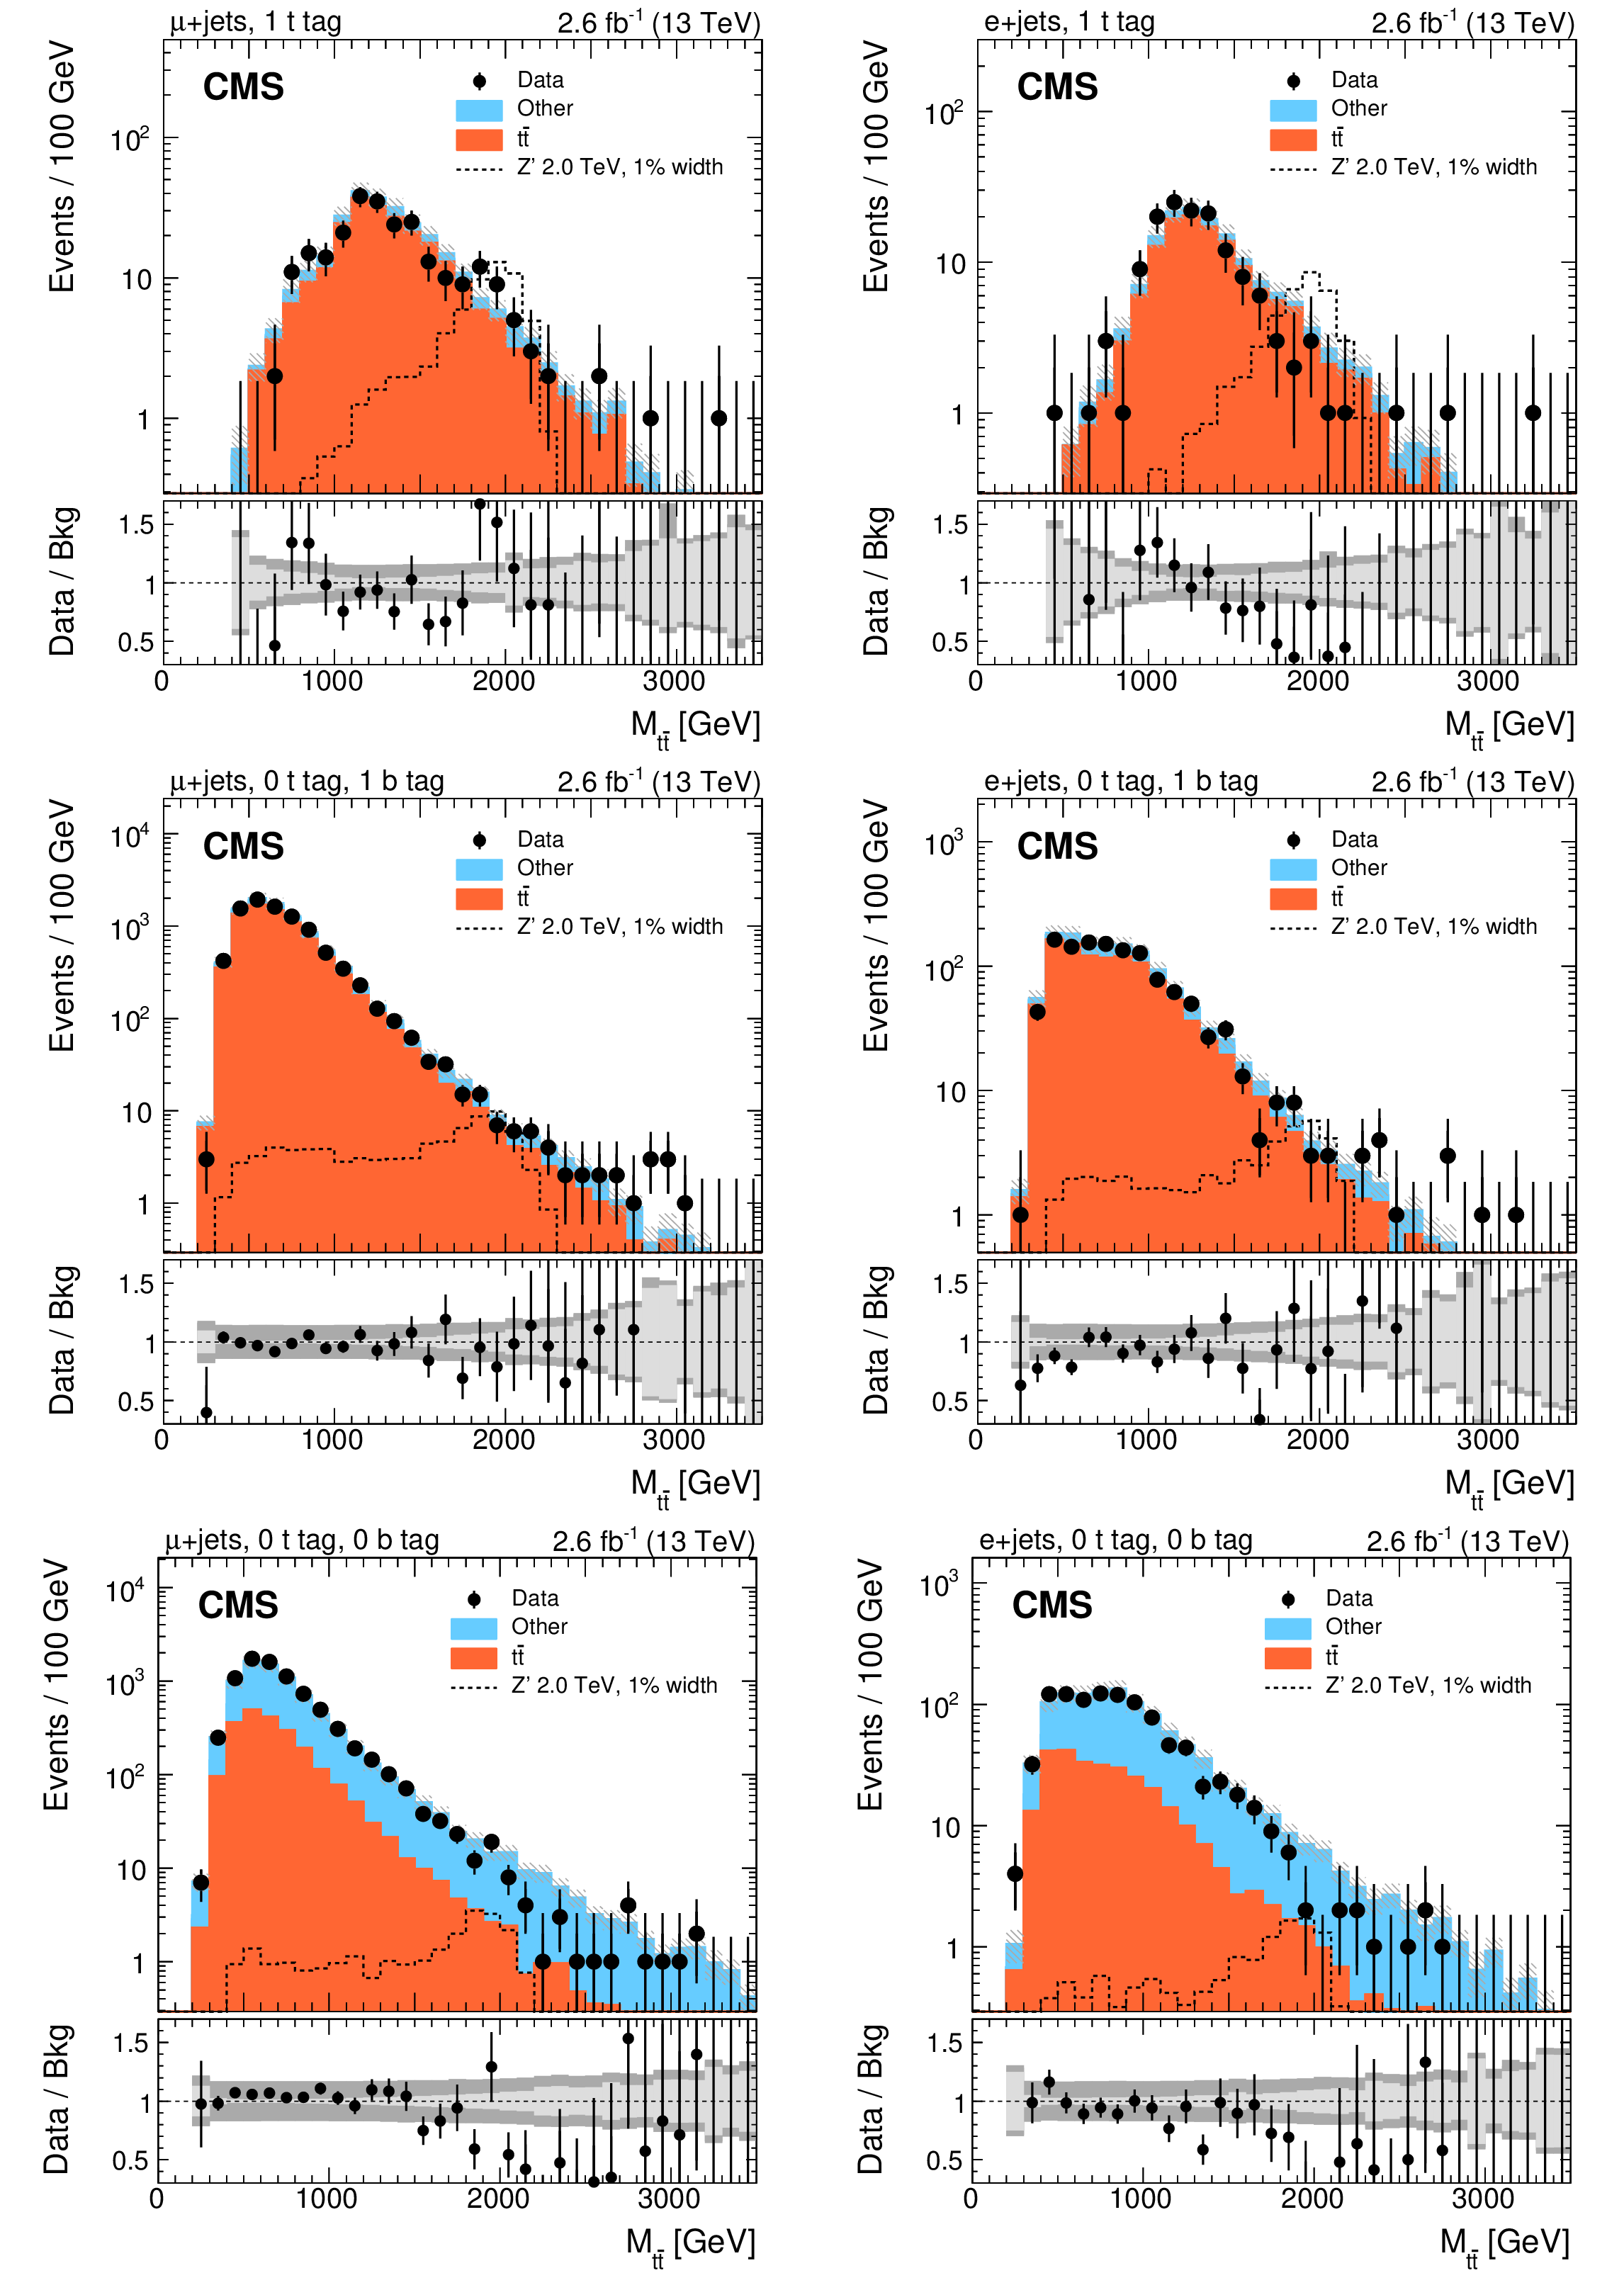
Figure 4:
Distributions in $ {M_{{\mathrm{ t } {}\mathrm{ \bar{t} } } }} $ for data and expected background, for events passing the signal selection of the lepton+jets analysis ($\chi ^{2} < $ 30) after the maximum likelihood fit. Distributions are shown for the muon (left) and electron (right) channel. For each lepton flavor, events are split into three exclusive categories (from uppermost to lowest): (1 t tag), (0 t tag, 1 b tag), and (0 t tag, 0 b tag). The signal templates are normalized to a cross section of 1 pb. The uncertainties associated with the background expectation include the statistical and all post-fit systematic uncertainties. The lower panel in each figure shows the ratio of data to predicted SM background, with the statistical (light gray) and total (dark gray) uncertainties shown separately. |

png pdf |
Figure 4-a:
Distributions in $ {M_{{\mathrm{ t } {}\mathrm{ \bar{t} } } }} $ for data and expected background, for events passing the signal selection of the lepton+jets analysis ($\chi ^{2} < $ 30) after the maximum likelihood fit. Distributions are shown for the muon channel, for events in the (1 t tag) category. The signal template is normalized to a cross section of 1 pb. The uncertainties associated with the background expectation include the statistical and all post-fit systematic uncertainties. The lower panel shows the ratio of data to predicted SM background, with the statistical (light gray) and total (dark gray) uncertainties shown separately. |
png pdf |
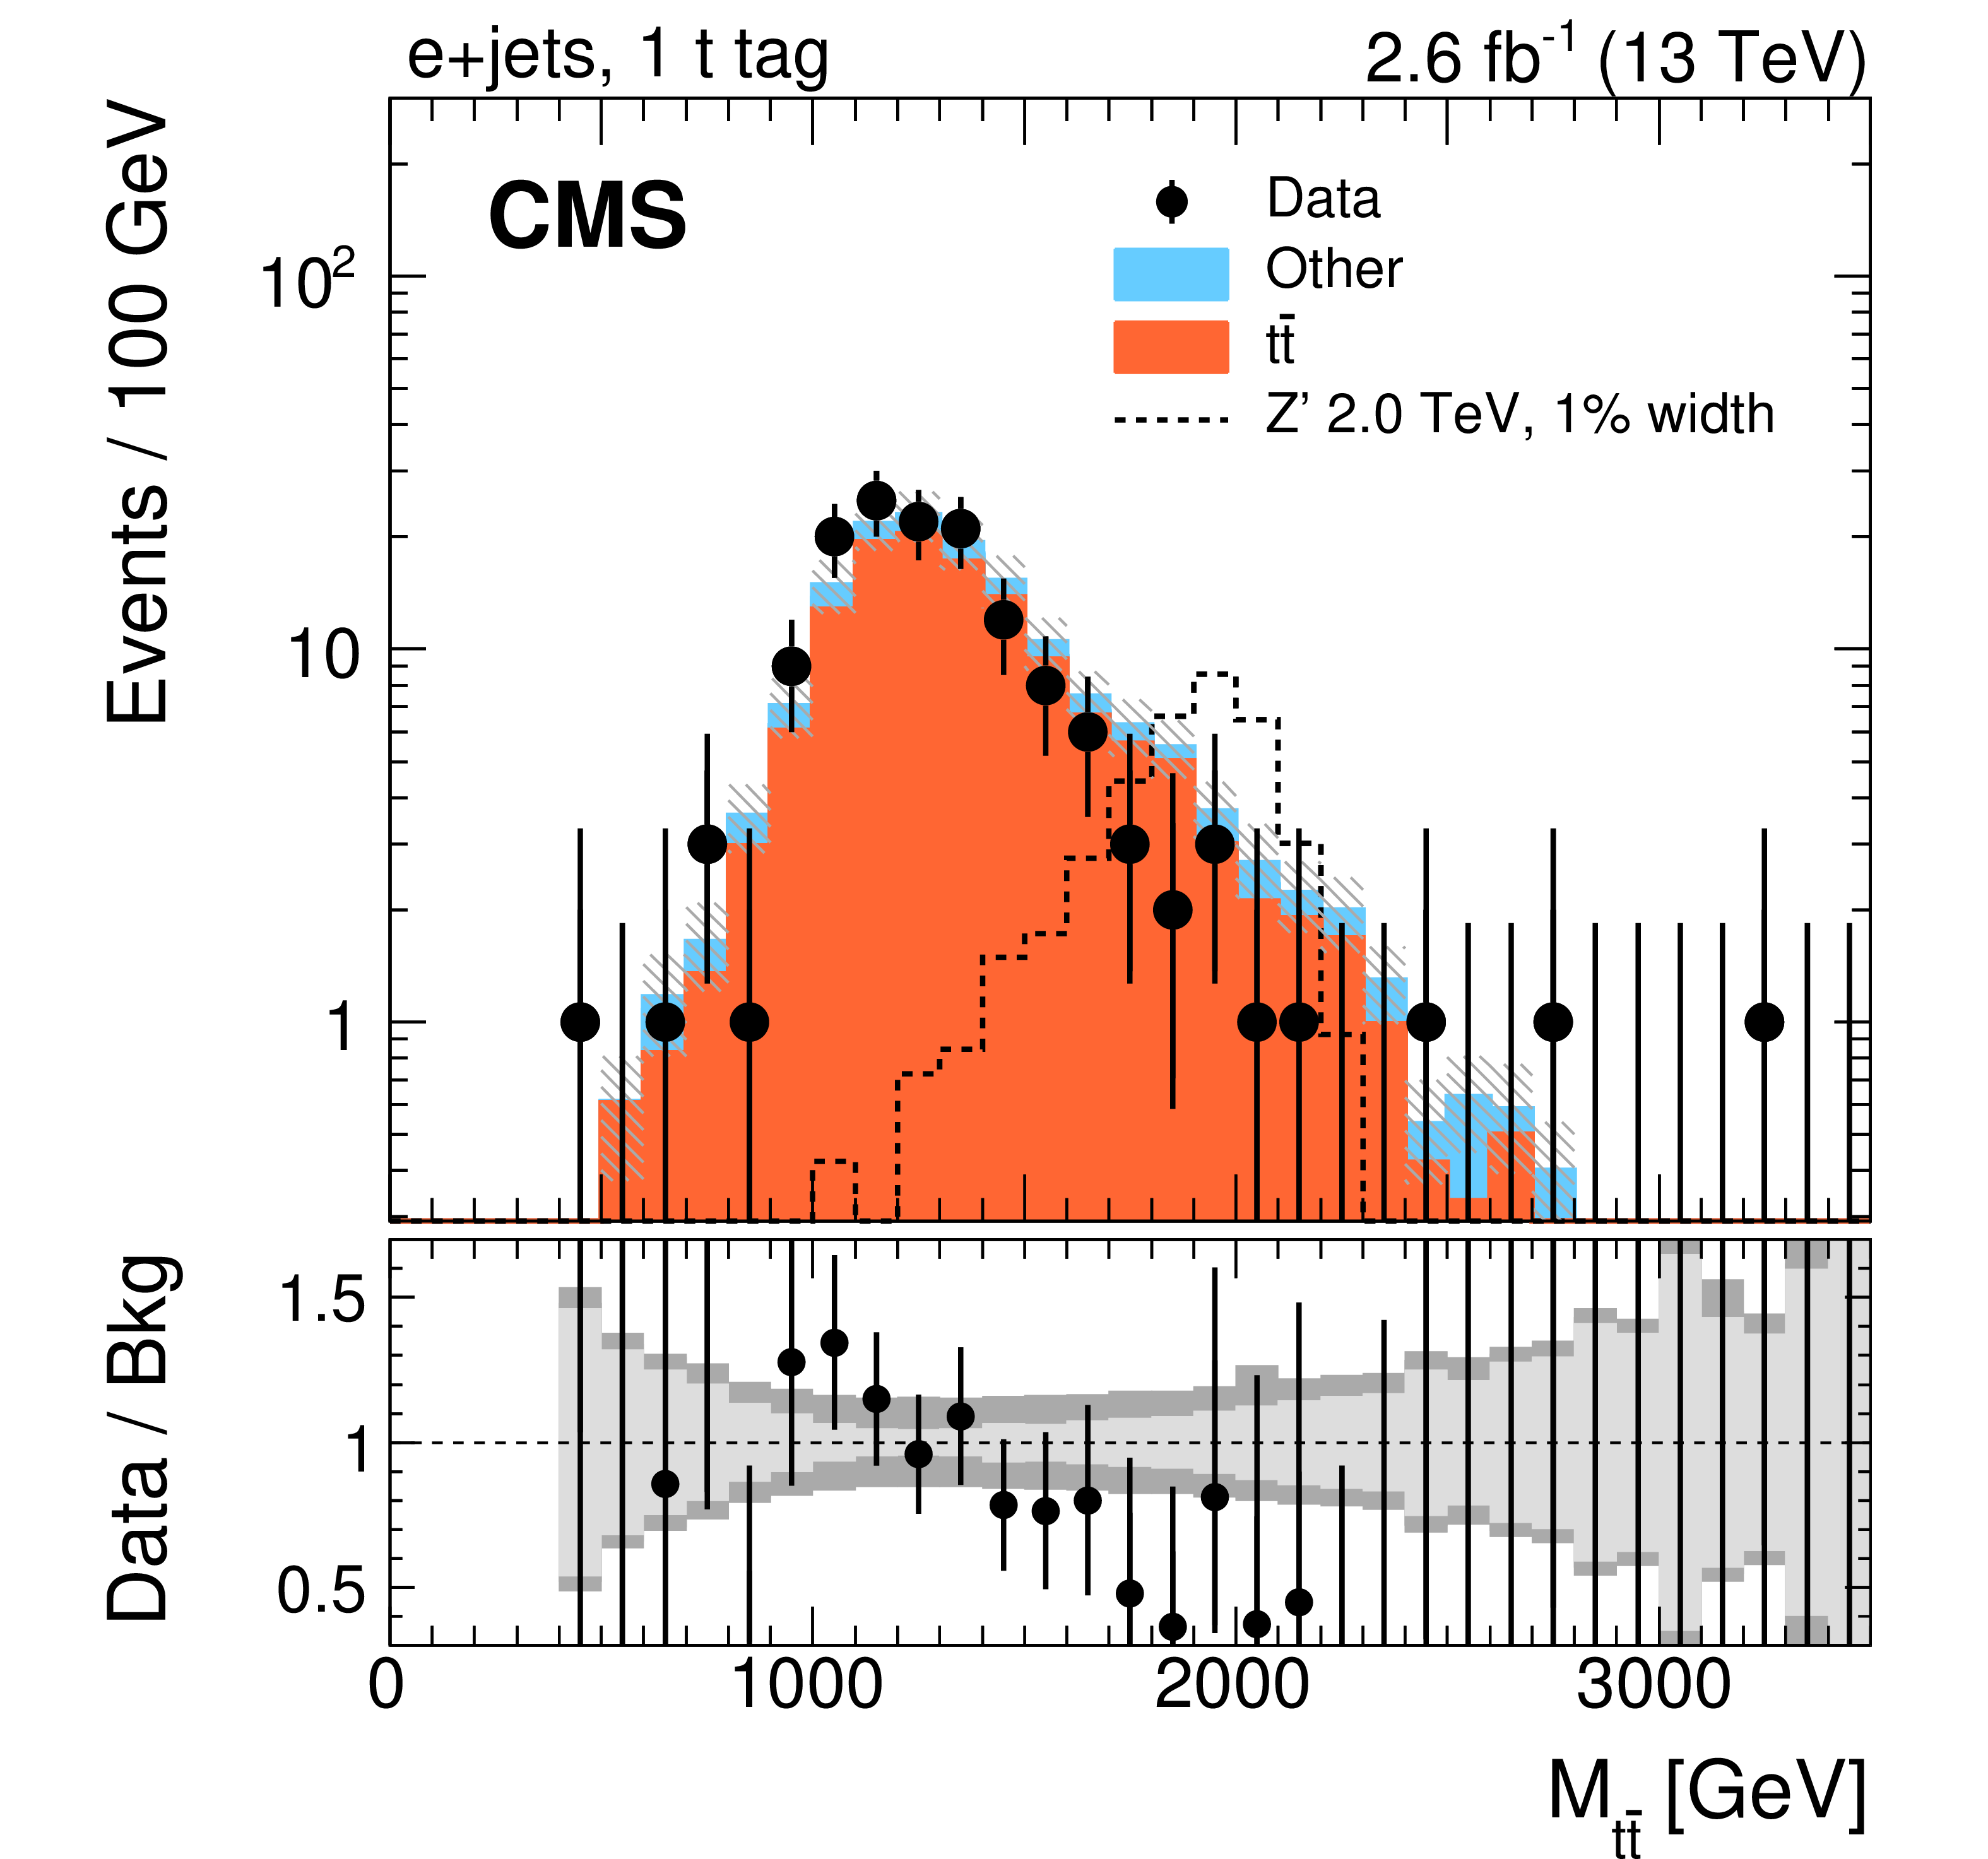
Figure 4-b:
Distributions in $ {M_{{\mathrm{ t } {}\mathrm{ \bar{t} } } }} $ for data and expected background, for events passing the signal selection of the lepton+jets analysis ($\chi ^{2} < $ 30) after the maximum likelihood fit. Distributions are shown for the electron channel, for events in the (1 t tag) category. The signal template is normalized to a cross section of 1 pb. The uncertainties associated with the background expectation include the statistical and all post-fit systematic uncertainties. The lower panel shows the ratio of data to predicted SM background, with the statistical (light gray) and total (dark gray) uncertainties shown separately. |
png pdf |
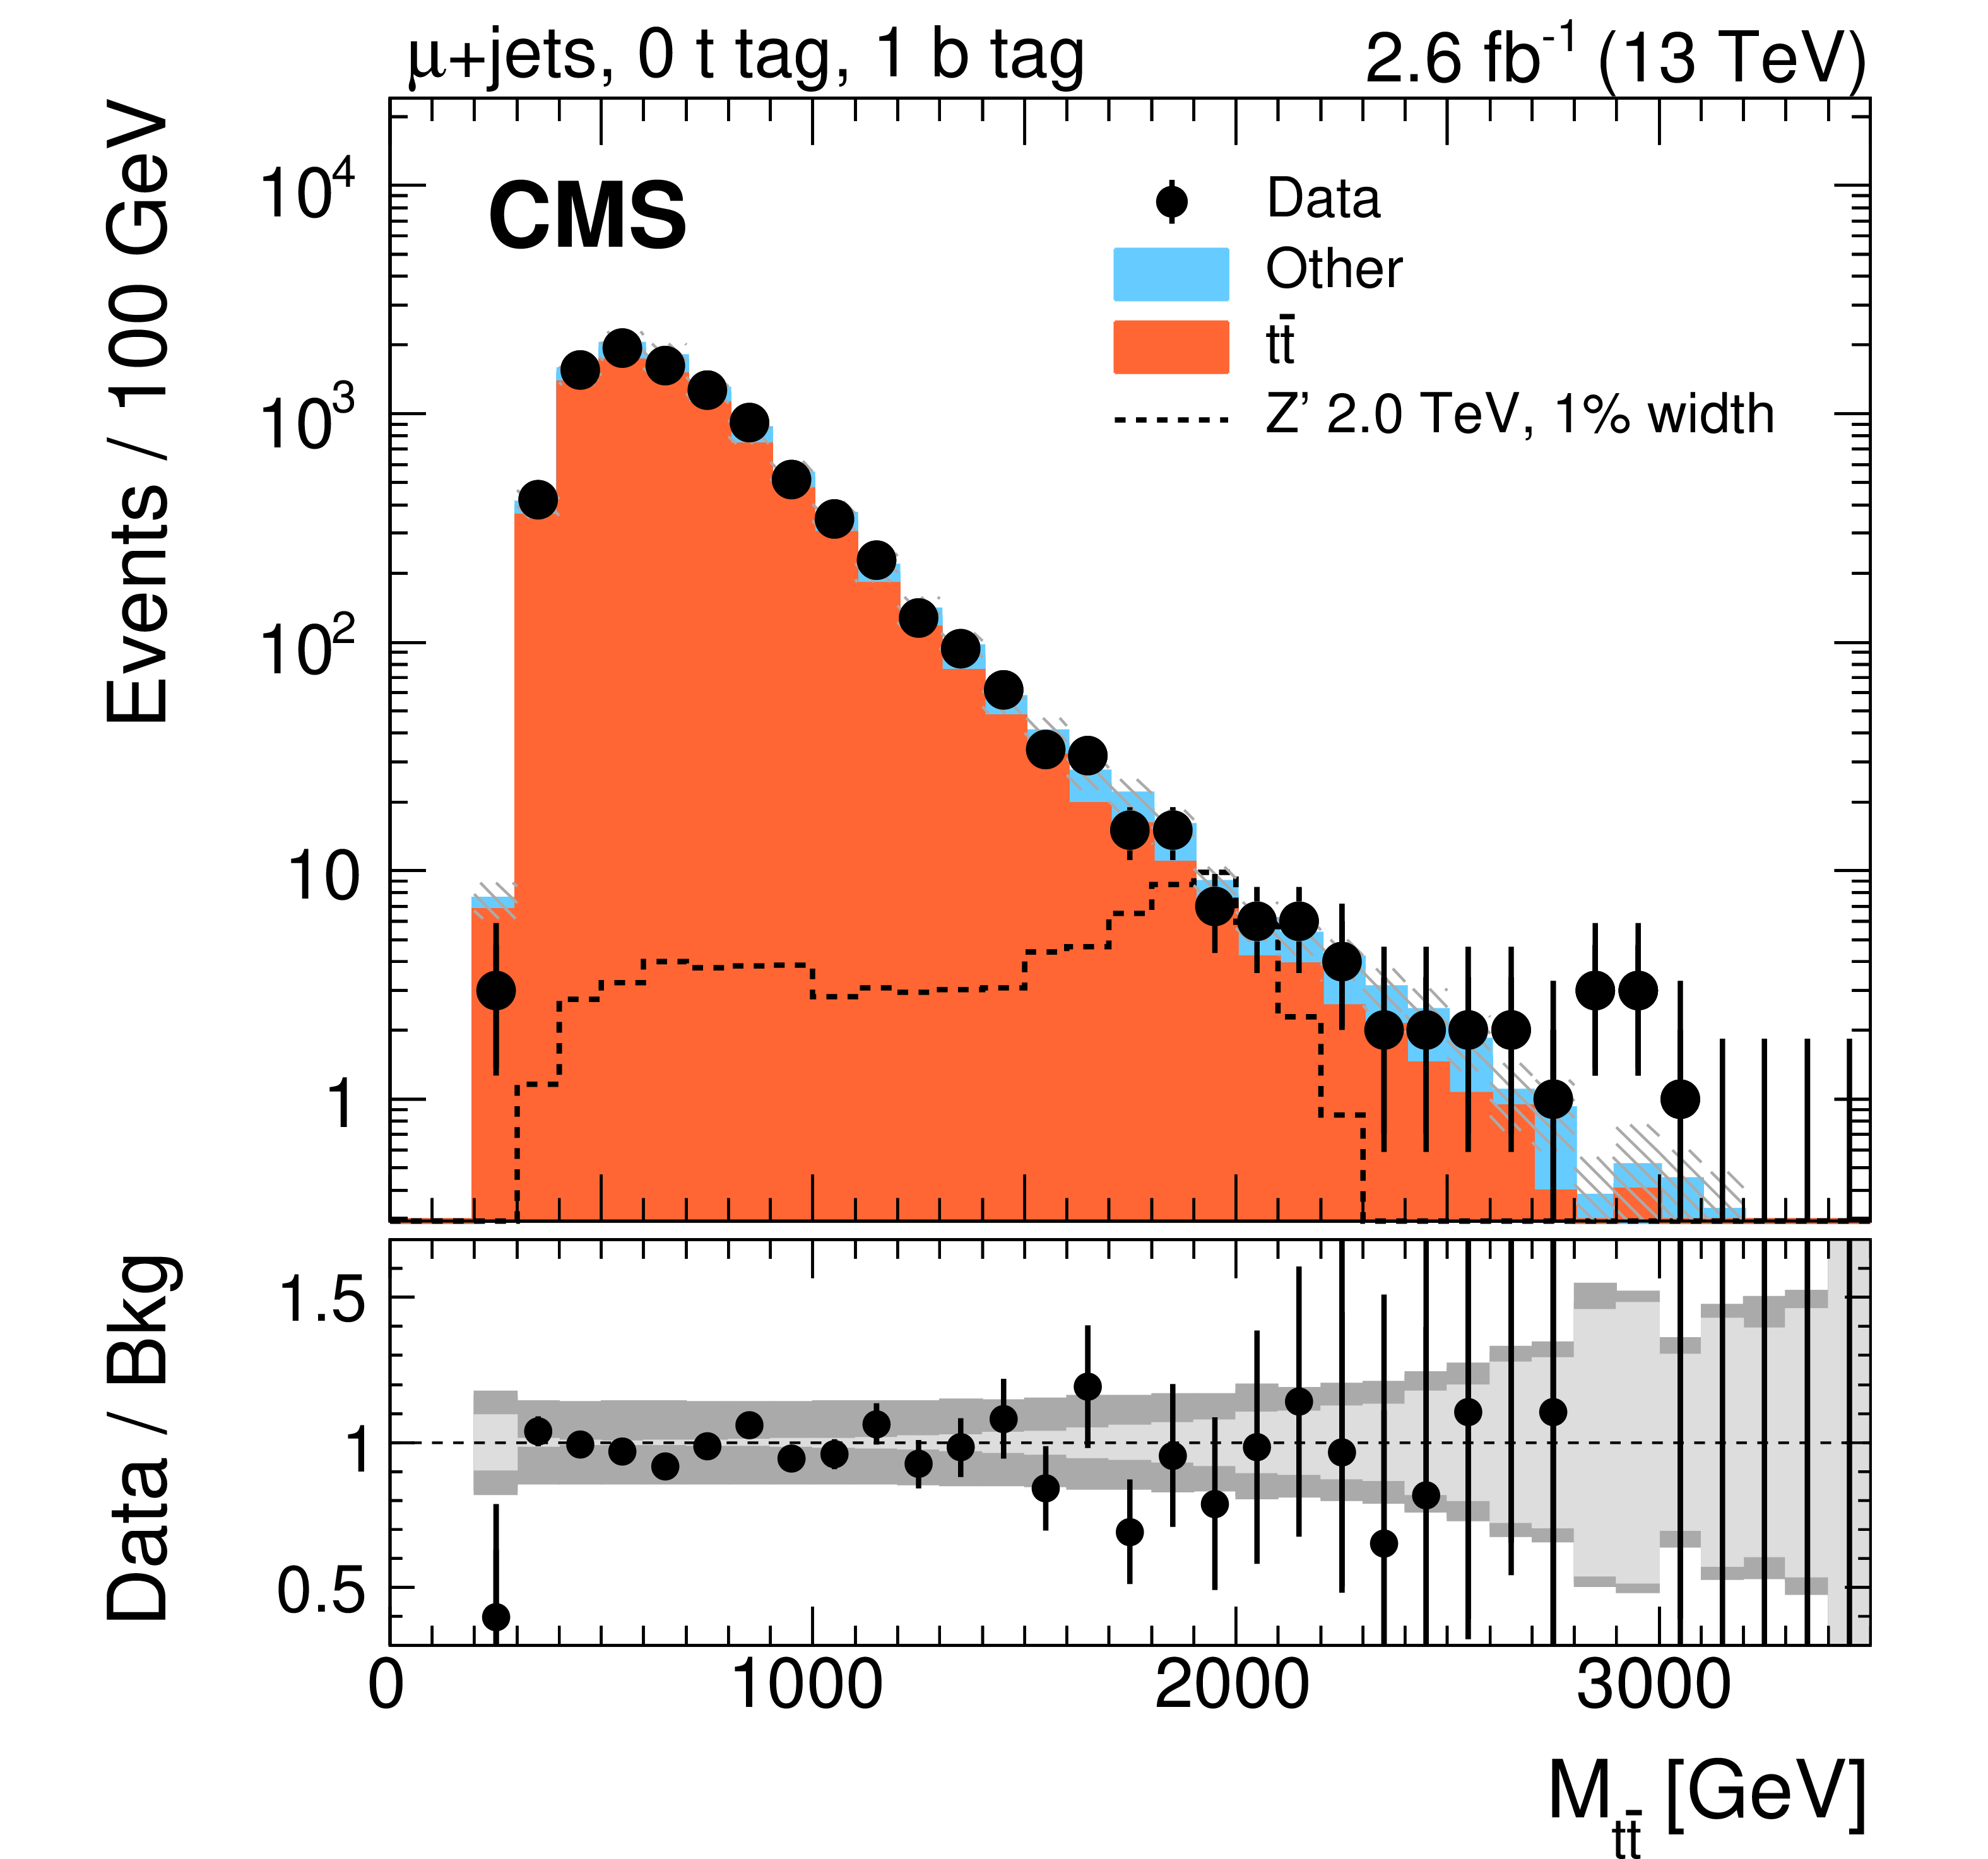
Figure 4-c:
Distributions in $ {M_{{\mathrm{ t } {}\mathrm{ \bar{t} } } }} $ for data and expected background, for events passing the signal selection of the lepton+jets analysis ($\chi ^{2} < $ 30) after the maximum likelihood fit. Distributions are shown for the muon channel, for events in the (0 t tag, 1 b tag) category. The signal template is normalized to a cross section of 1 pb. The uncertainties associated with the background expectation include the statistical and all post-fit systematic uncertainties. The lower panel shows the ratio of data to predicted SM background, with the statistical (light gray) and total (dark gray) uncertainties shown separately. |

png pdf |
Figure 4-d:
Distributions in $ {M_{{\mathrm{ t } {}\mathrm{ \bar{t} } } }} $ for data and expected background, for events passing the signal selection of the lepton+jets analysis ($\chi ^{2} < $ 30) after the maximum likelihood fit. Distributions are shown for the electron channel, for events in the (0 t tag, 1 b tag) category. The signal template is normalized to a cross section of 1 pb. The uncertainties associated with the background expectation include the statistical and all post-fit systematic uncertainties. The lower panel shows the ratio of data to predicted SM background, with the statistical (light gray) and total (dark gray) uncertainties shown separately. |

png pdf |
Figure 4-e:
Distributions in $ {M_{{\mathrm{ t } {}\mathrm{ \bar{t} } } }} $ for data and expected background, for events passing the signal selection of the lepton+jets analysis ($\chi ^{2} < $ 30) after the maximum likelihood fit. Distributions are shown for the muon channel, for events in the (0 t tag, 0 b tag) category. The signal template is normalized to a cross section of 1 pb. The uncertainties associated with the background expectation include the statistical and all post-fit systematic uncertainties. The lower panel shows the ratio of data to predicted SM background, with the statistical (light gray) and total (dark gray) uncertainties shown separately. |

png pdf |
Figure 4-f:
Distributions in $ {M_{{\mathrm{ t } {}\mathrm{ \bar{t} } } }} $ for data and expected background, for events passing the signal selection of the lepton+jets analysis ($\chi ^{2} < $ 30) after the maximum likelihood fit. Distributions are shown for the electron channel, for events in the (0 t tag, 0 b tag) category. The signal template is normalized to a cross section of 1 pb. The uncertainties associated with the background expectation include the statistical and all post-fit systematic uncertainties. The lower panel shows the ratio of data to predicted SM background, with the statistical (light gray) and total (dark gray) uncertainties shown separately. |
png pdf |
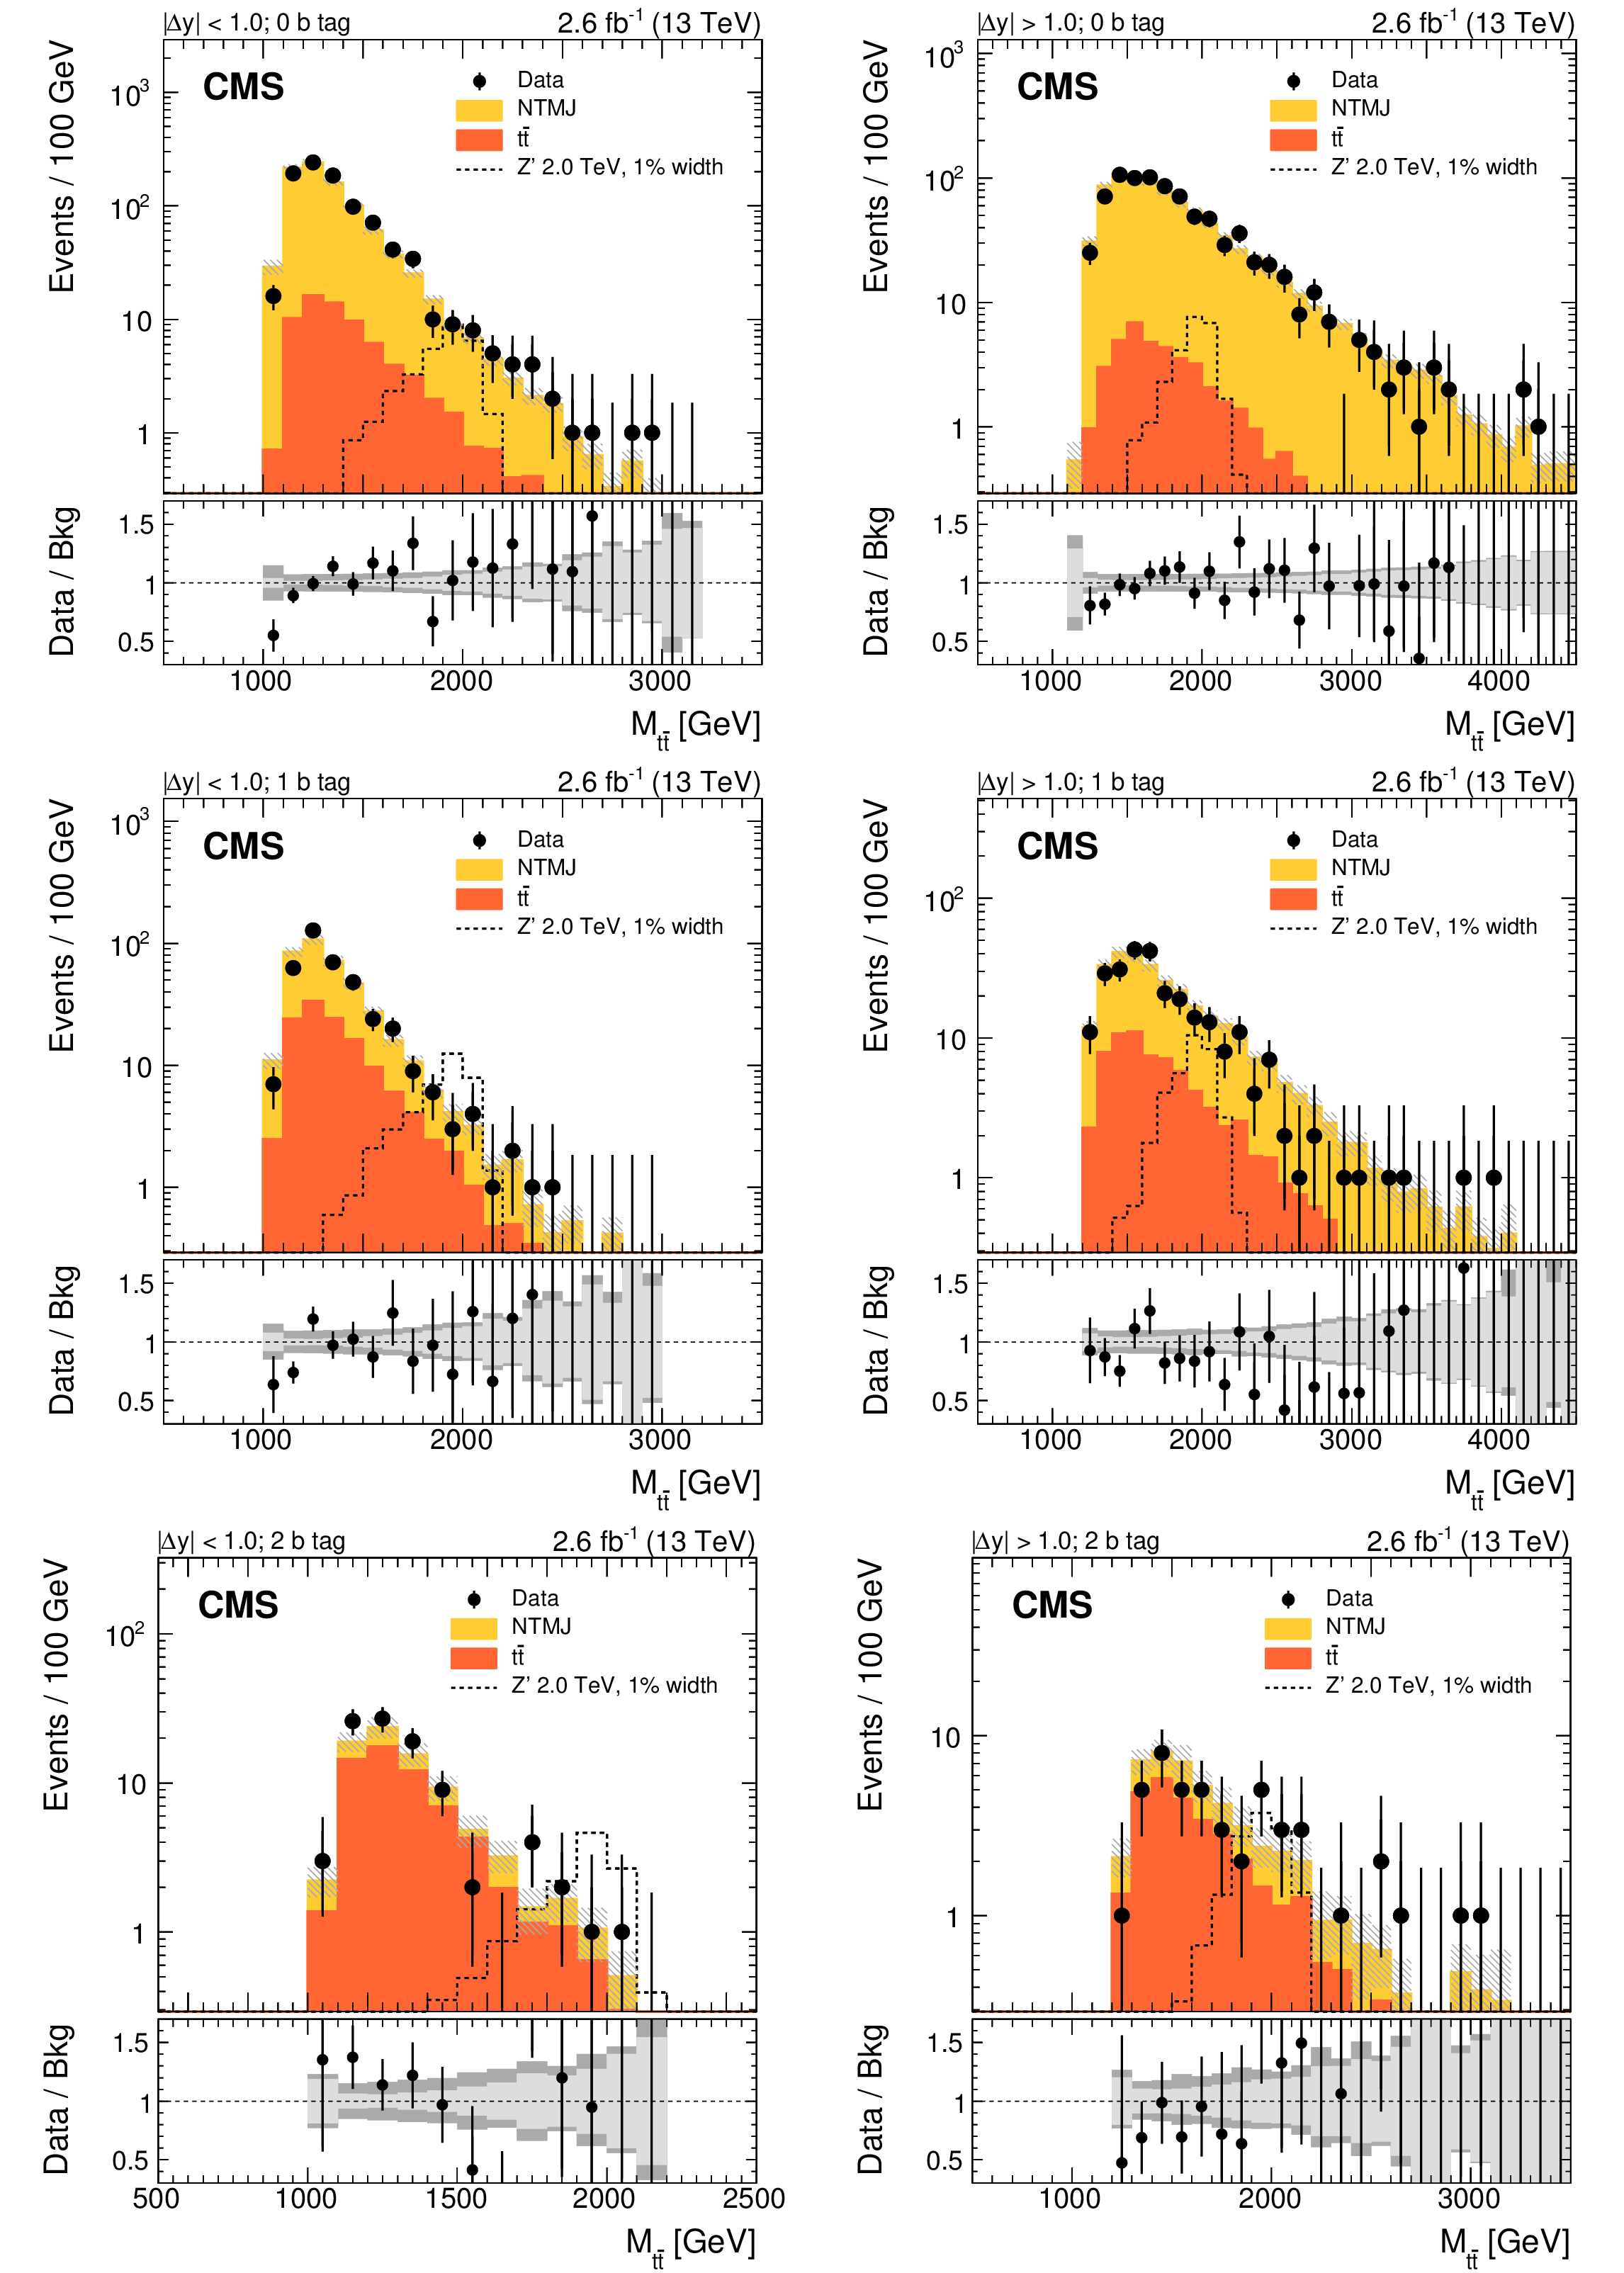
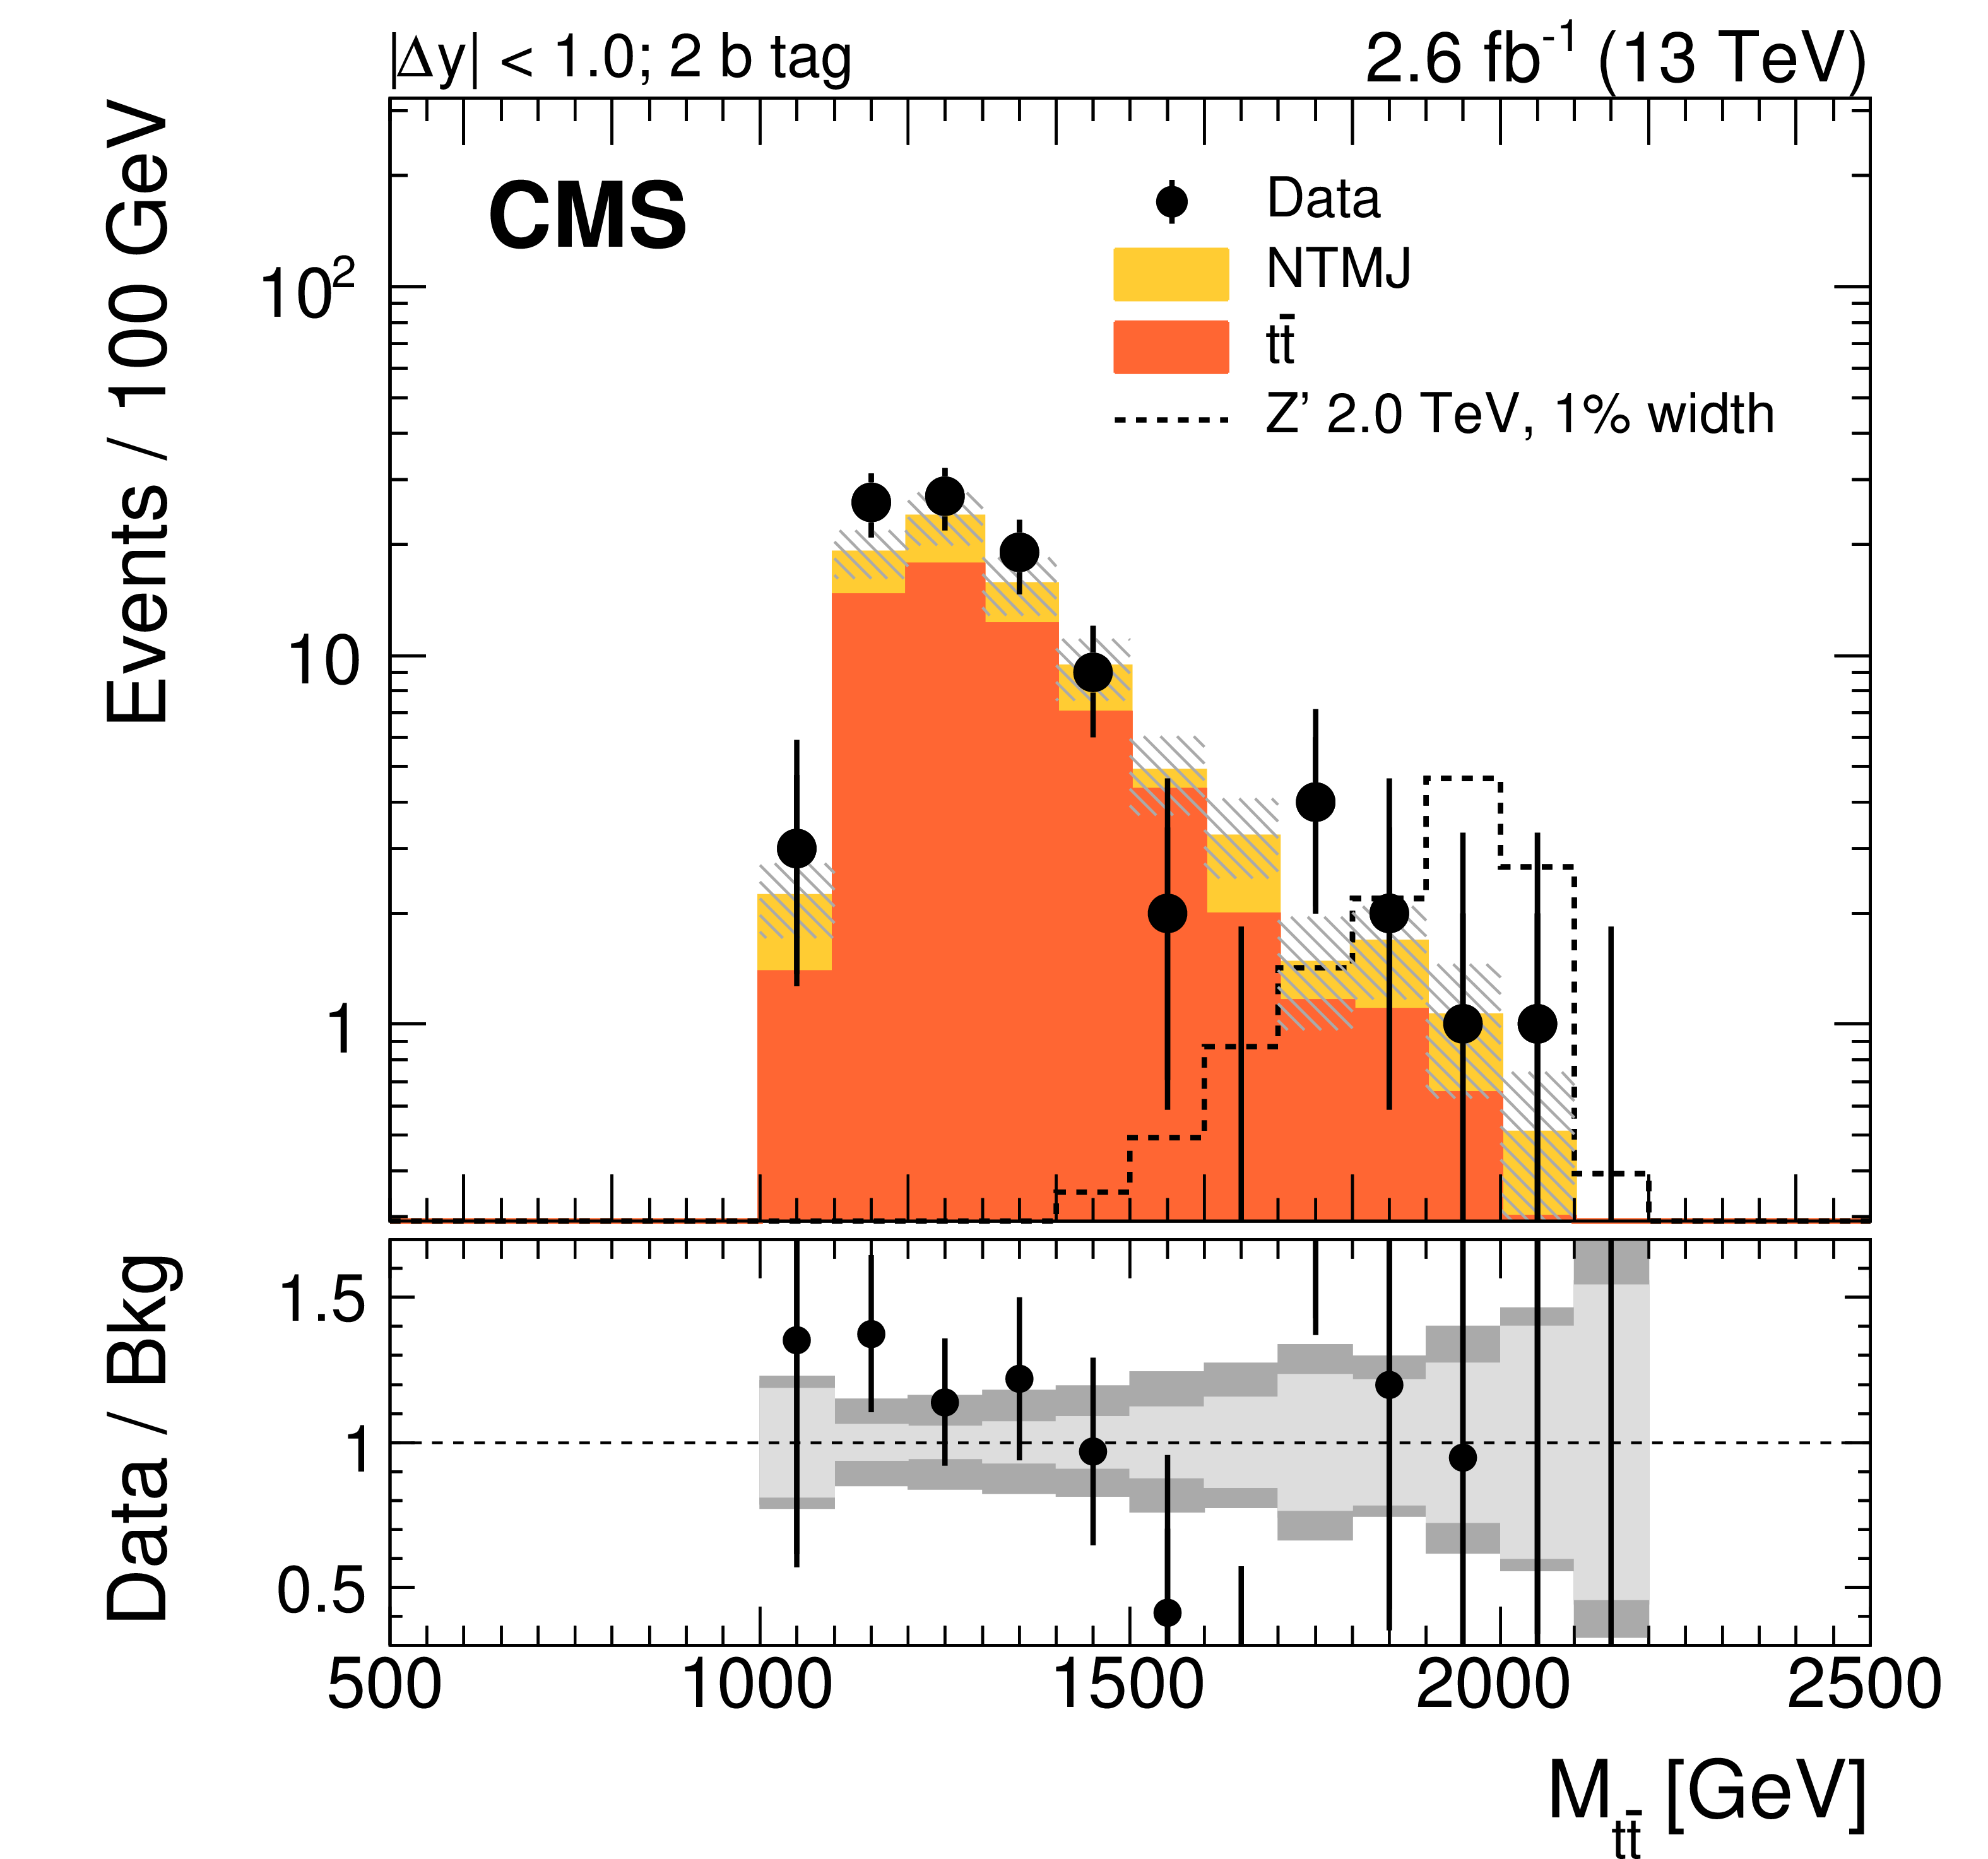
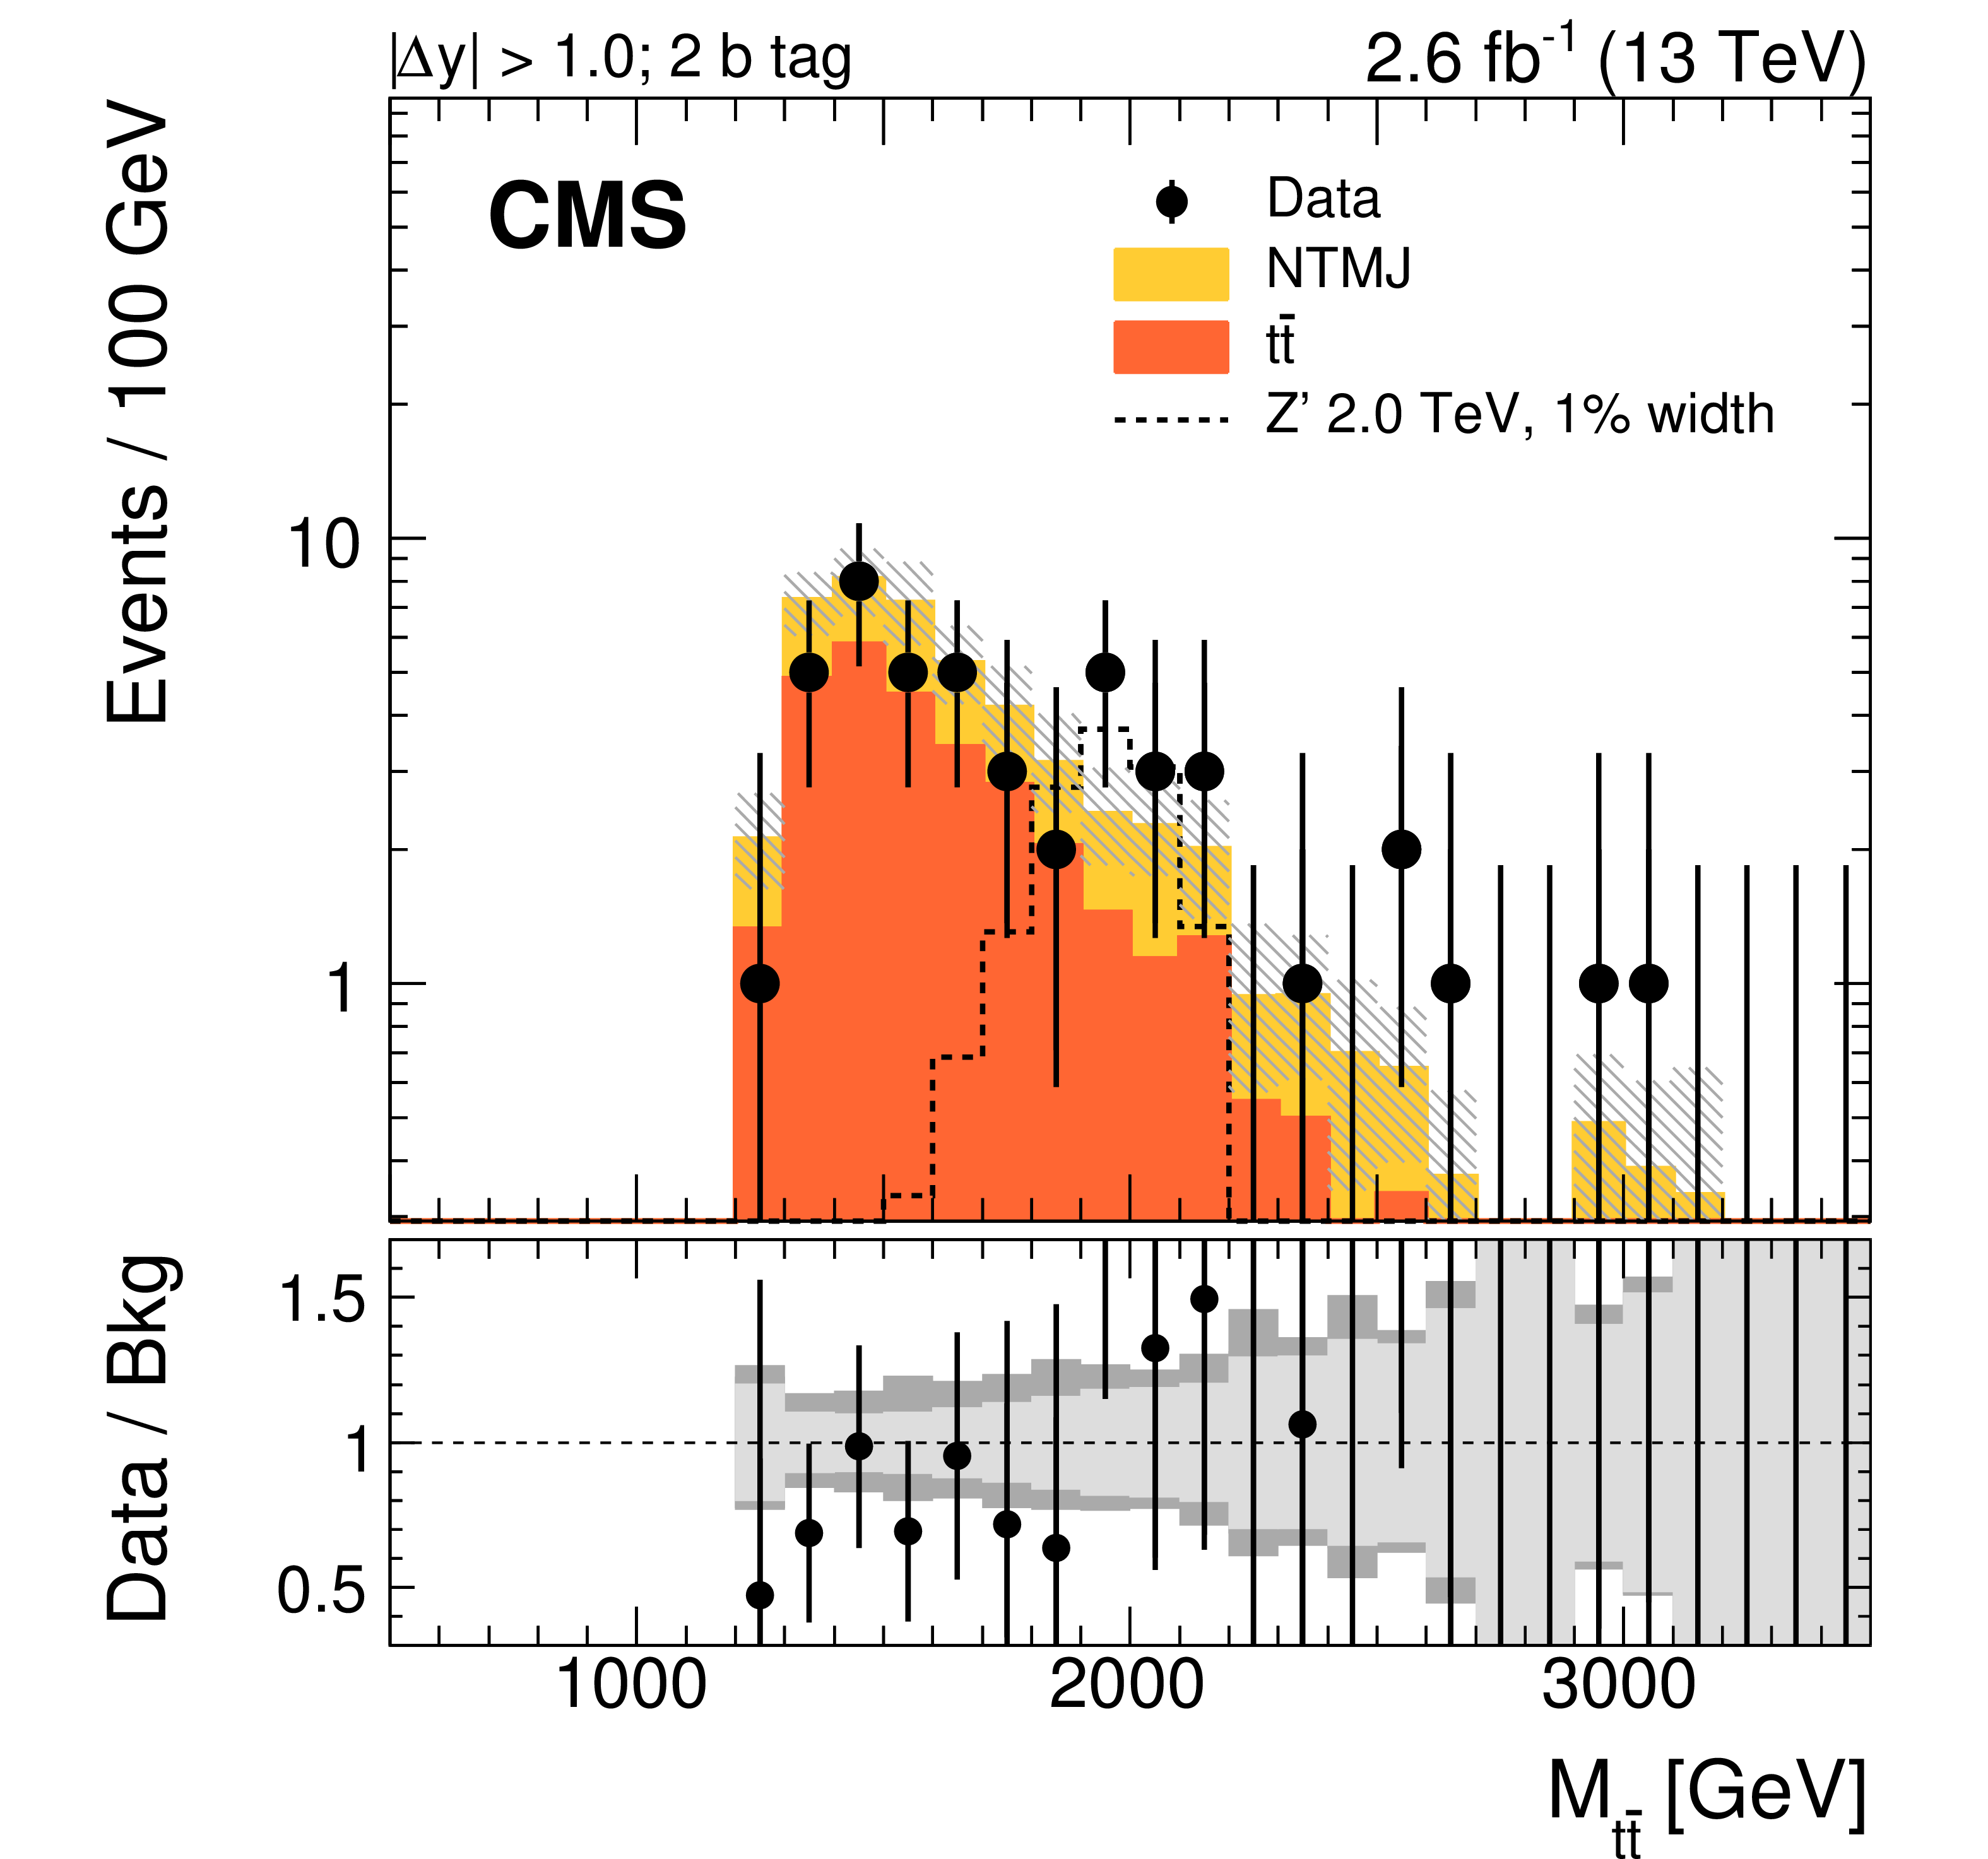
Figure 5:
Distributions in $ {M_{{\mathrm{ t } {}\mathrm{ \bar{t} } } }} $ for data and expected background, for events passing the signal selection of the fully hadronic analysis after the maximum likelihood fit. Distributions are shown for the regions with $ {| \Delta y | } < $ 1.0 (left) and $ {| \Delta y | } > $ 1.0 (right), for 0, 1, or 2 subjet b tags (from uppermost to lowest). The signal templates are normalized to a cross section of 1 pb. The uncertainties associated with the background expectation include the statistical and all post-fit systematic uncertainties. The lower panel in each figure shows the ratio of data to predicted SM background, with the statistical (light gray) and total (dark gray) uncertainties shown separately. |

png pdf |
Figure 5-a:
Distributions in $ {M_{{\mathrm{ t } {}\mathrm{ \bar{t} } } }} $ for data and expected background, for events passing the signal selection of the fully hadronic analysis after the maximum likelihood fit. Distributions are shown for the regions with $ {| \Delta y | } < $ 1.0, for 0 subjet b tag. The signal template is normalized to a cross section of 1 pb. The uncertainties associated with the background expectation include the statistical and all post-fit systematic uncertainties. The lower panel shows the ratio of data to predicted SM background, with the statistical (light gray) and total (dark gray) uncertainties shown separately. |
png pdf |
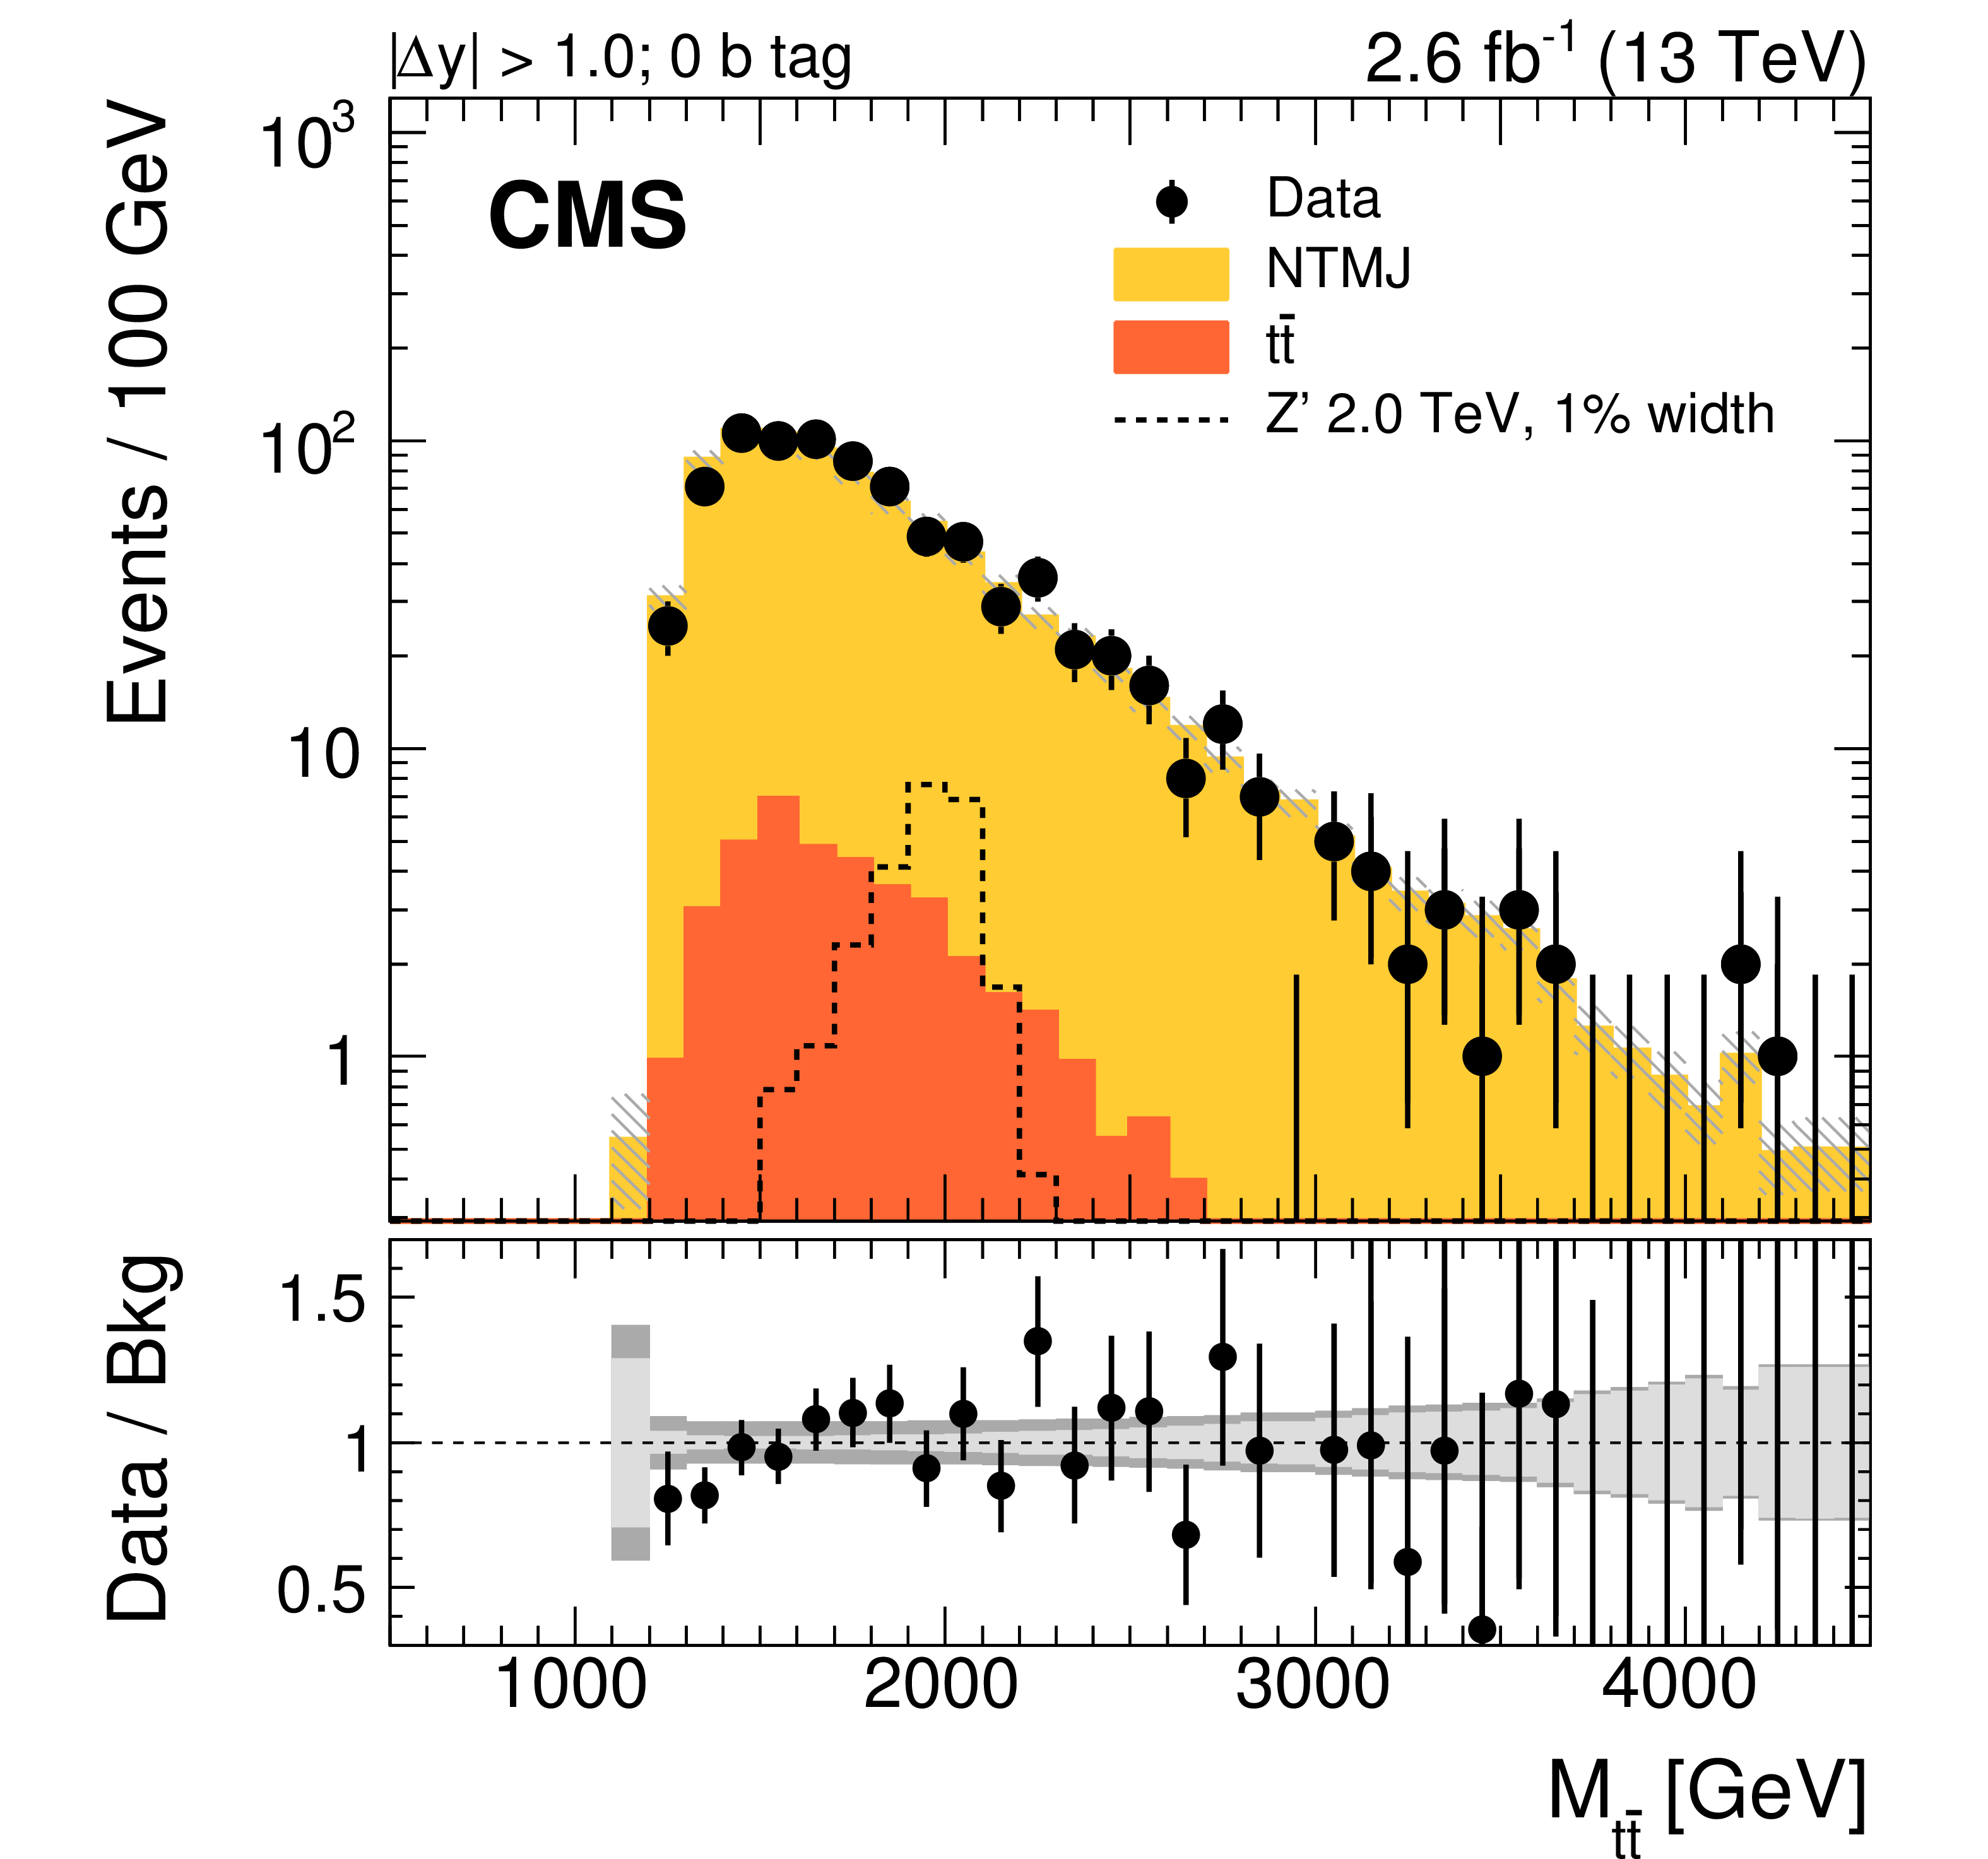
Figure 5-b:
Distributions in $ {M_{{\mathrm{ t } {}\mathrm{ \bar{t} } } }} $ for data and expected background, for events passing the signal selection of the fully hadronic analysis after the maximum likelihood fit. Distributions are shown for the regions with $ {| \Delta y | } > $ 1.0, for 0 subjet b tag. The signal template is normalized to a cross section of 1 pb. The uncertainties associated with the background expectation include the statistical and all post-fit systematic uncertainties. The lower panel shows the ratio of data to predicted SM background, with the statistical (light gray) and total (dark gray) uncertainties shown separately. |
png pdf |
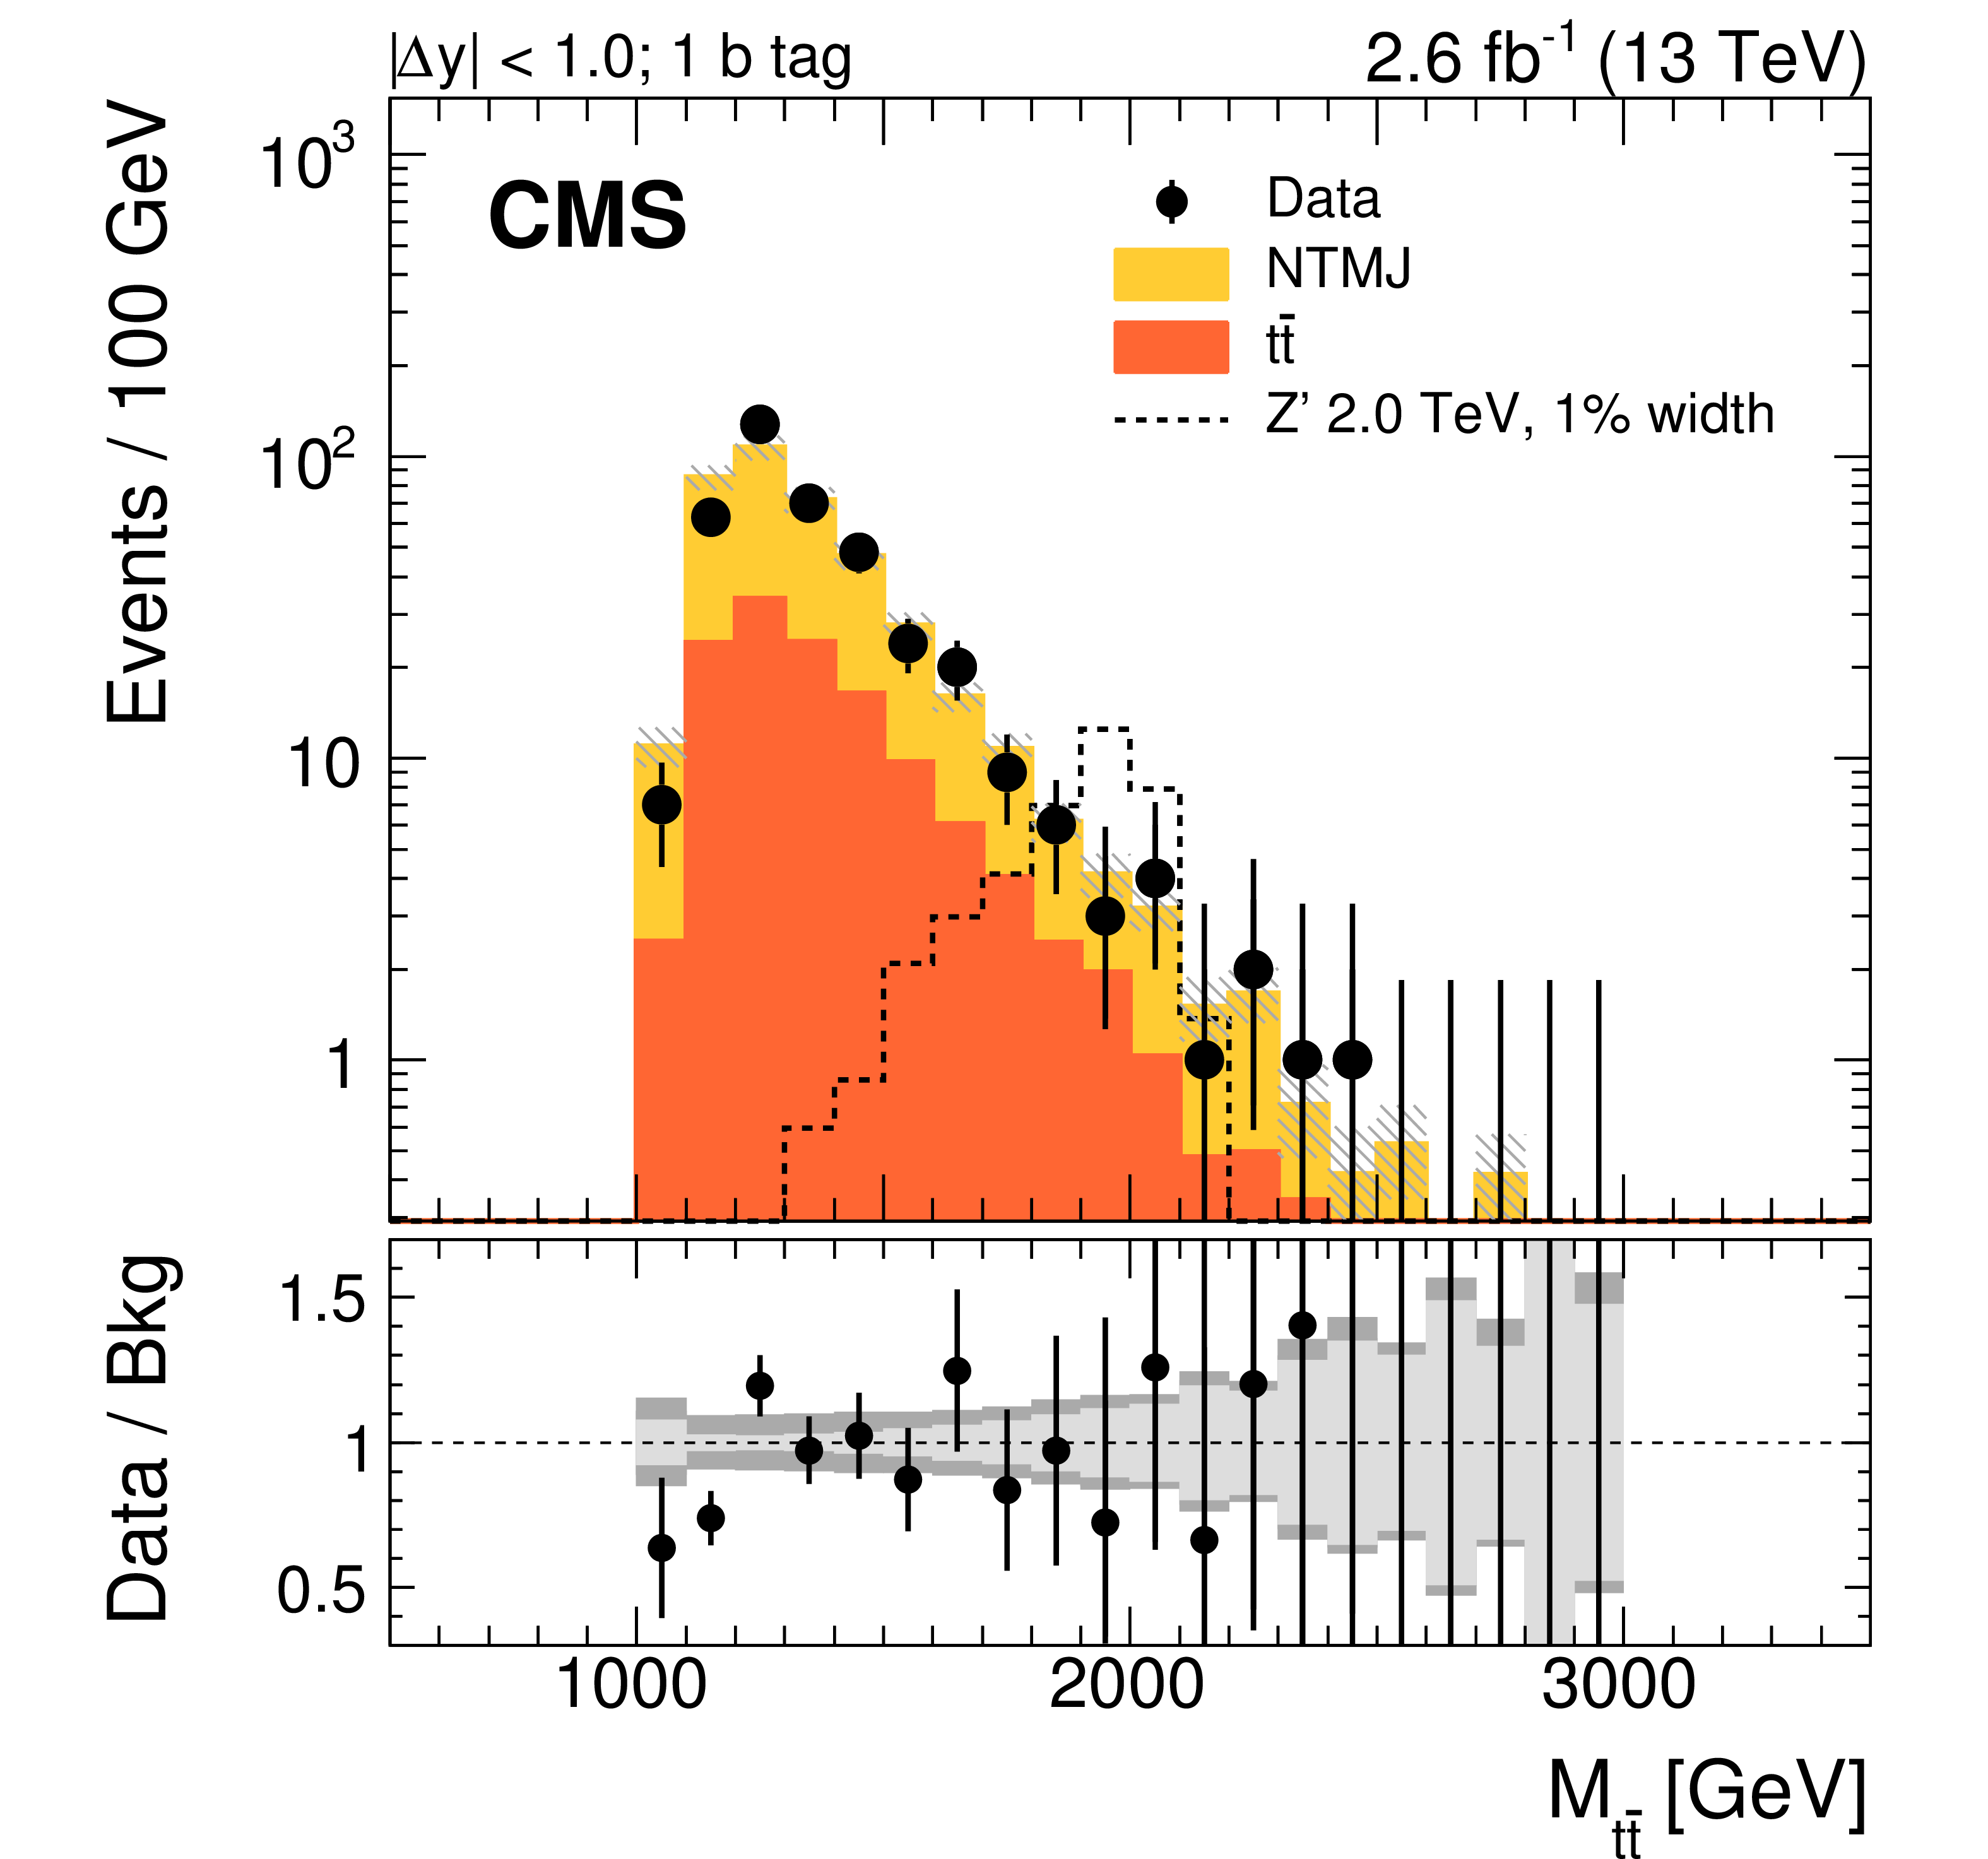
Figure 5-c:
Distributions in $ {M_{{\mathrm{ t } {}\mathrm{ \bar{t} } } }} $ for data and expected background, for events passing the signal selection of the fully hadronic analysis after the maximum likelihood fit. Distributions are shown for the regions with $ {| \Delta y | } < $ 1.0, for 1 subjet b tag. The signal template is normalized to a cross section of 1 pb. The uncertainties associated with the background expectation include the statistical and all post-fit systematic uncertainties. The lower panel shows the ratio of data to predicted SM background, with the statistical (light gray) and total (dark gray) uncertainties shown separately. |
png pdf |
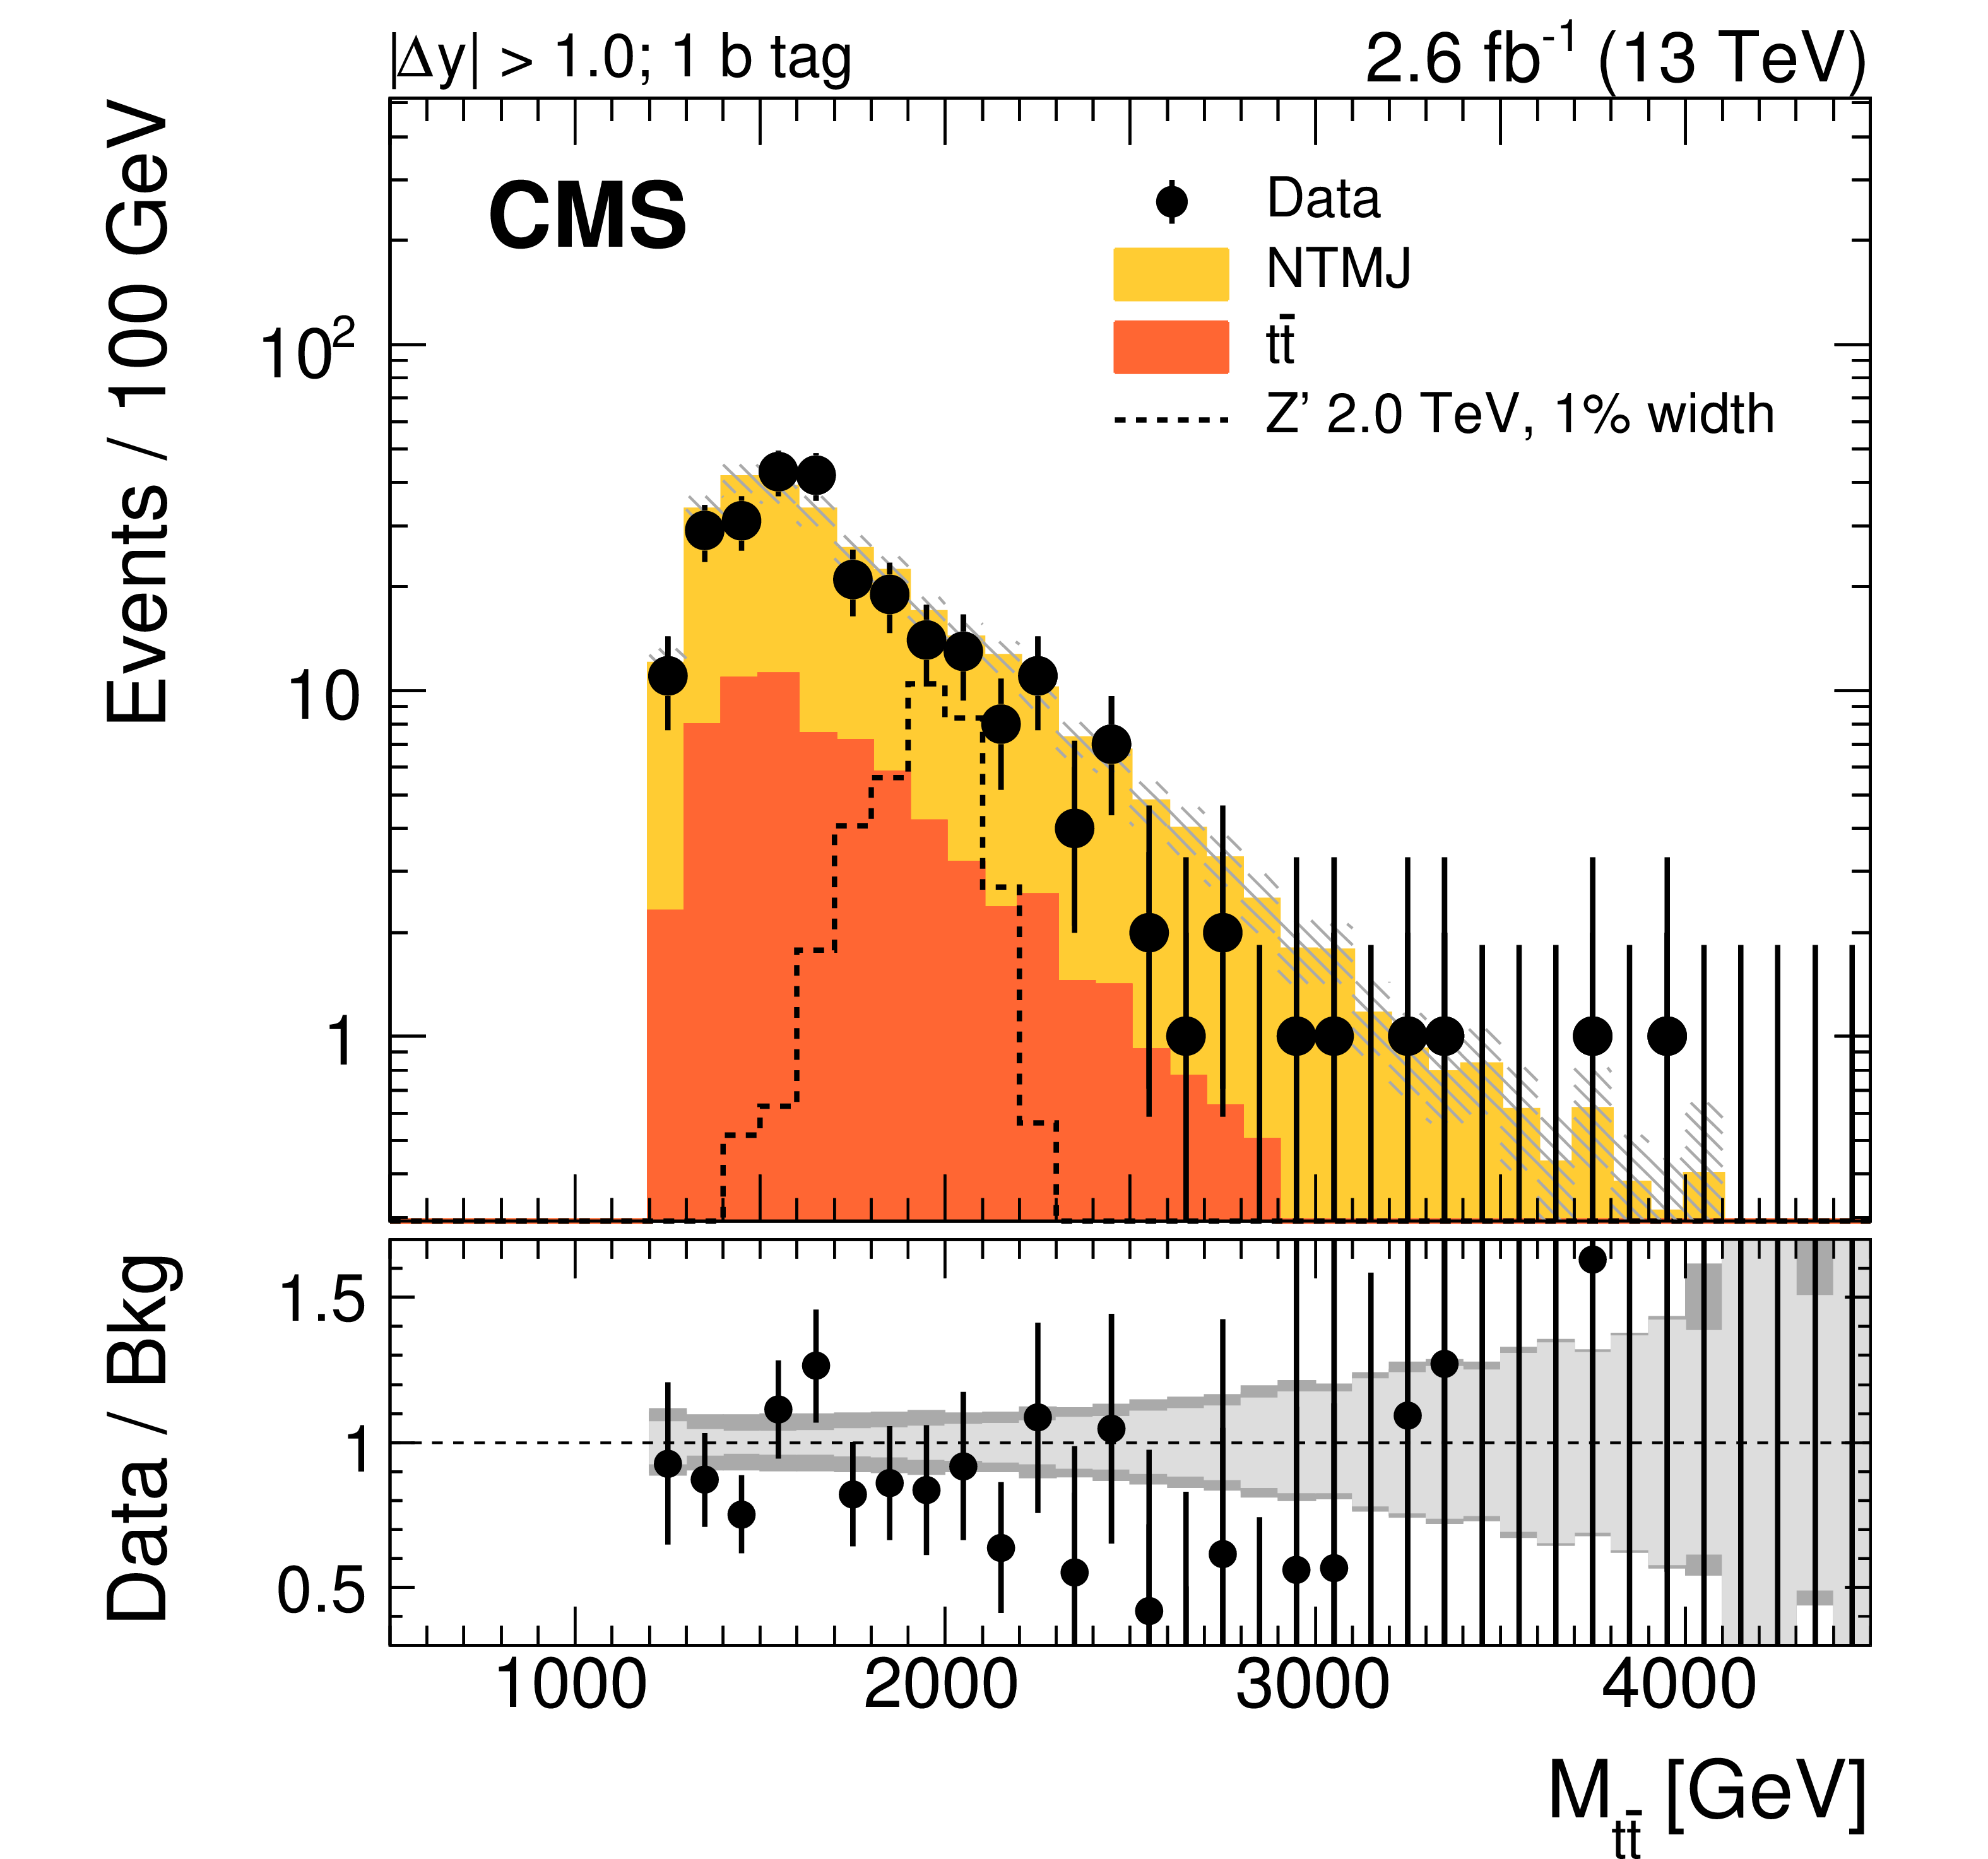
Figure 5-d:
Distributions in $ {M_{{\mathrm{ t } {}\mathrm{ \bar{t} } } }} $ for data and expected background, for events passing the signal selection of the fully hadronic analysis after the maximum likelihood fit. Distributions are shown for the regions with $ {| \Delta y | } > $ 1.0, for 1 subjet b tag. The signal template is normalized to a cross section of 1 pb. The uncertainties associated with the background expectation include the statistical and all post-fit systematic uncertainties. The lower panel shows the ratio of data to predicted SM background, with the statistical (light gray) and total (dark gray) uncertainties shown separately. |
png pdf |
Figure 5-e:
Distributions in $ {M_{{\mathrm{ t } {}\mathrm{ \bar{t} } } }} $ for data and expected background, for events passing the signal selection of the fully hadronic analysis after the maximum likelihood fit. Distributions are shown for the regions with $ {| \Delta y | } < $ 1.0, for 2 subjet b tags. The signal template is normalized to a cross section of 1 pb. The uncertainties associated with the background expectation include the statistical and all post-fit systematic uncertainties. The lower panel shows the ratio of data to predicted SM background, with the statistical (light gray) and total (dark gray) uncertainties shown separately. |
png pdf |
Figure 5-f:
Distributions in $ {M_{{\mathrm{ t } {}\mathrm{ \bar{t} } } }} $ for data and expected background, for events passing the signal selection of the fully hadronic analysis after the maximum likelihood fit. Distributions are shown for the regions with $ {| \Delta y | } > $ 1.0, for 2 subjet b tags. The signal template is normalized to a cross section of 1 pb. The uncertainties associated with the background expectation include the statistical and all post-fit systematic uncertainties. The lower panel shows the ratio of data to predicted SM background, with the statistical (light gray) and total (dark gray) uncertainties shown separately. |

png pdf |
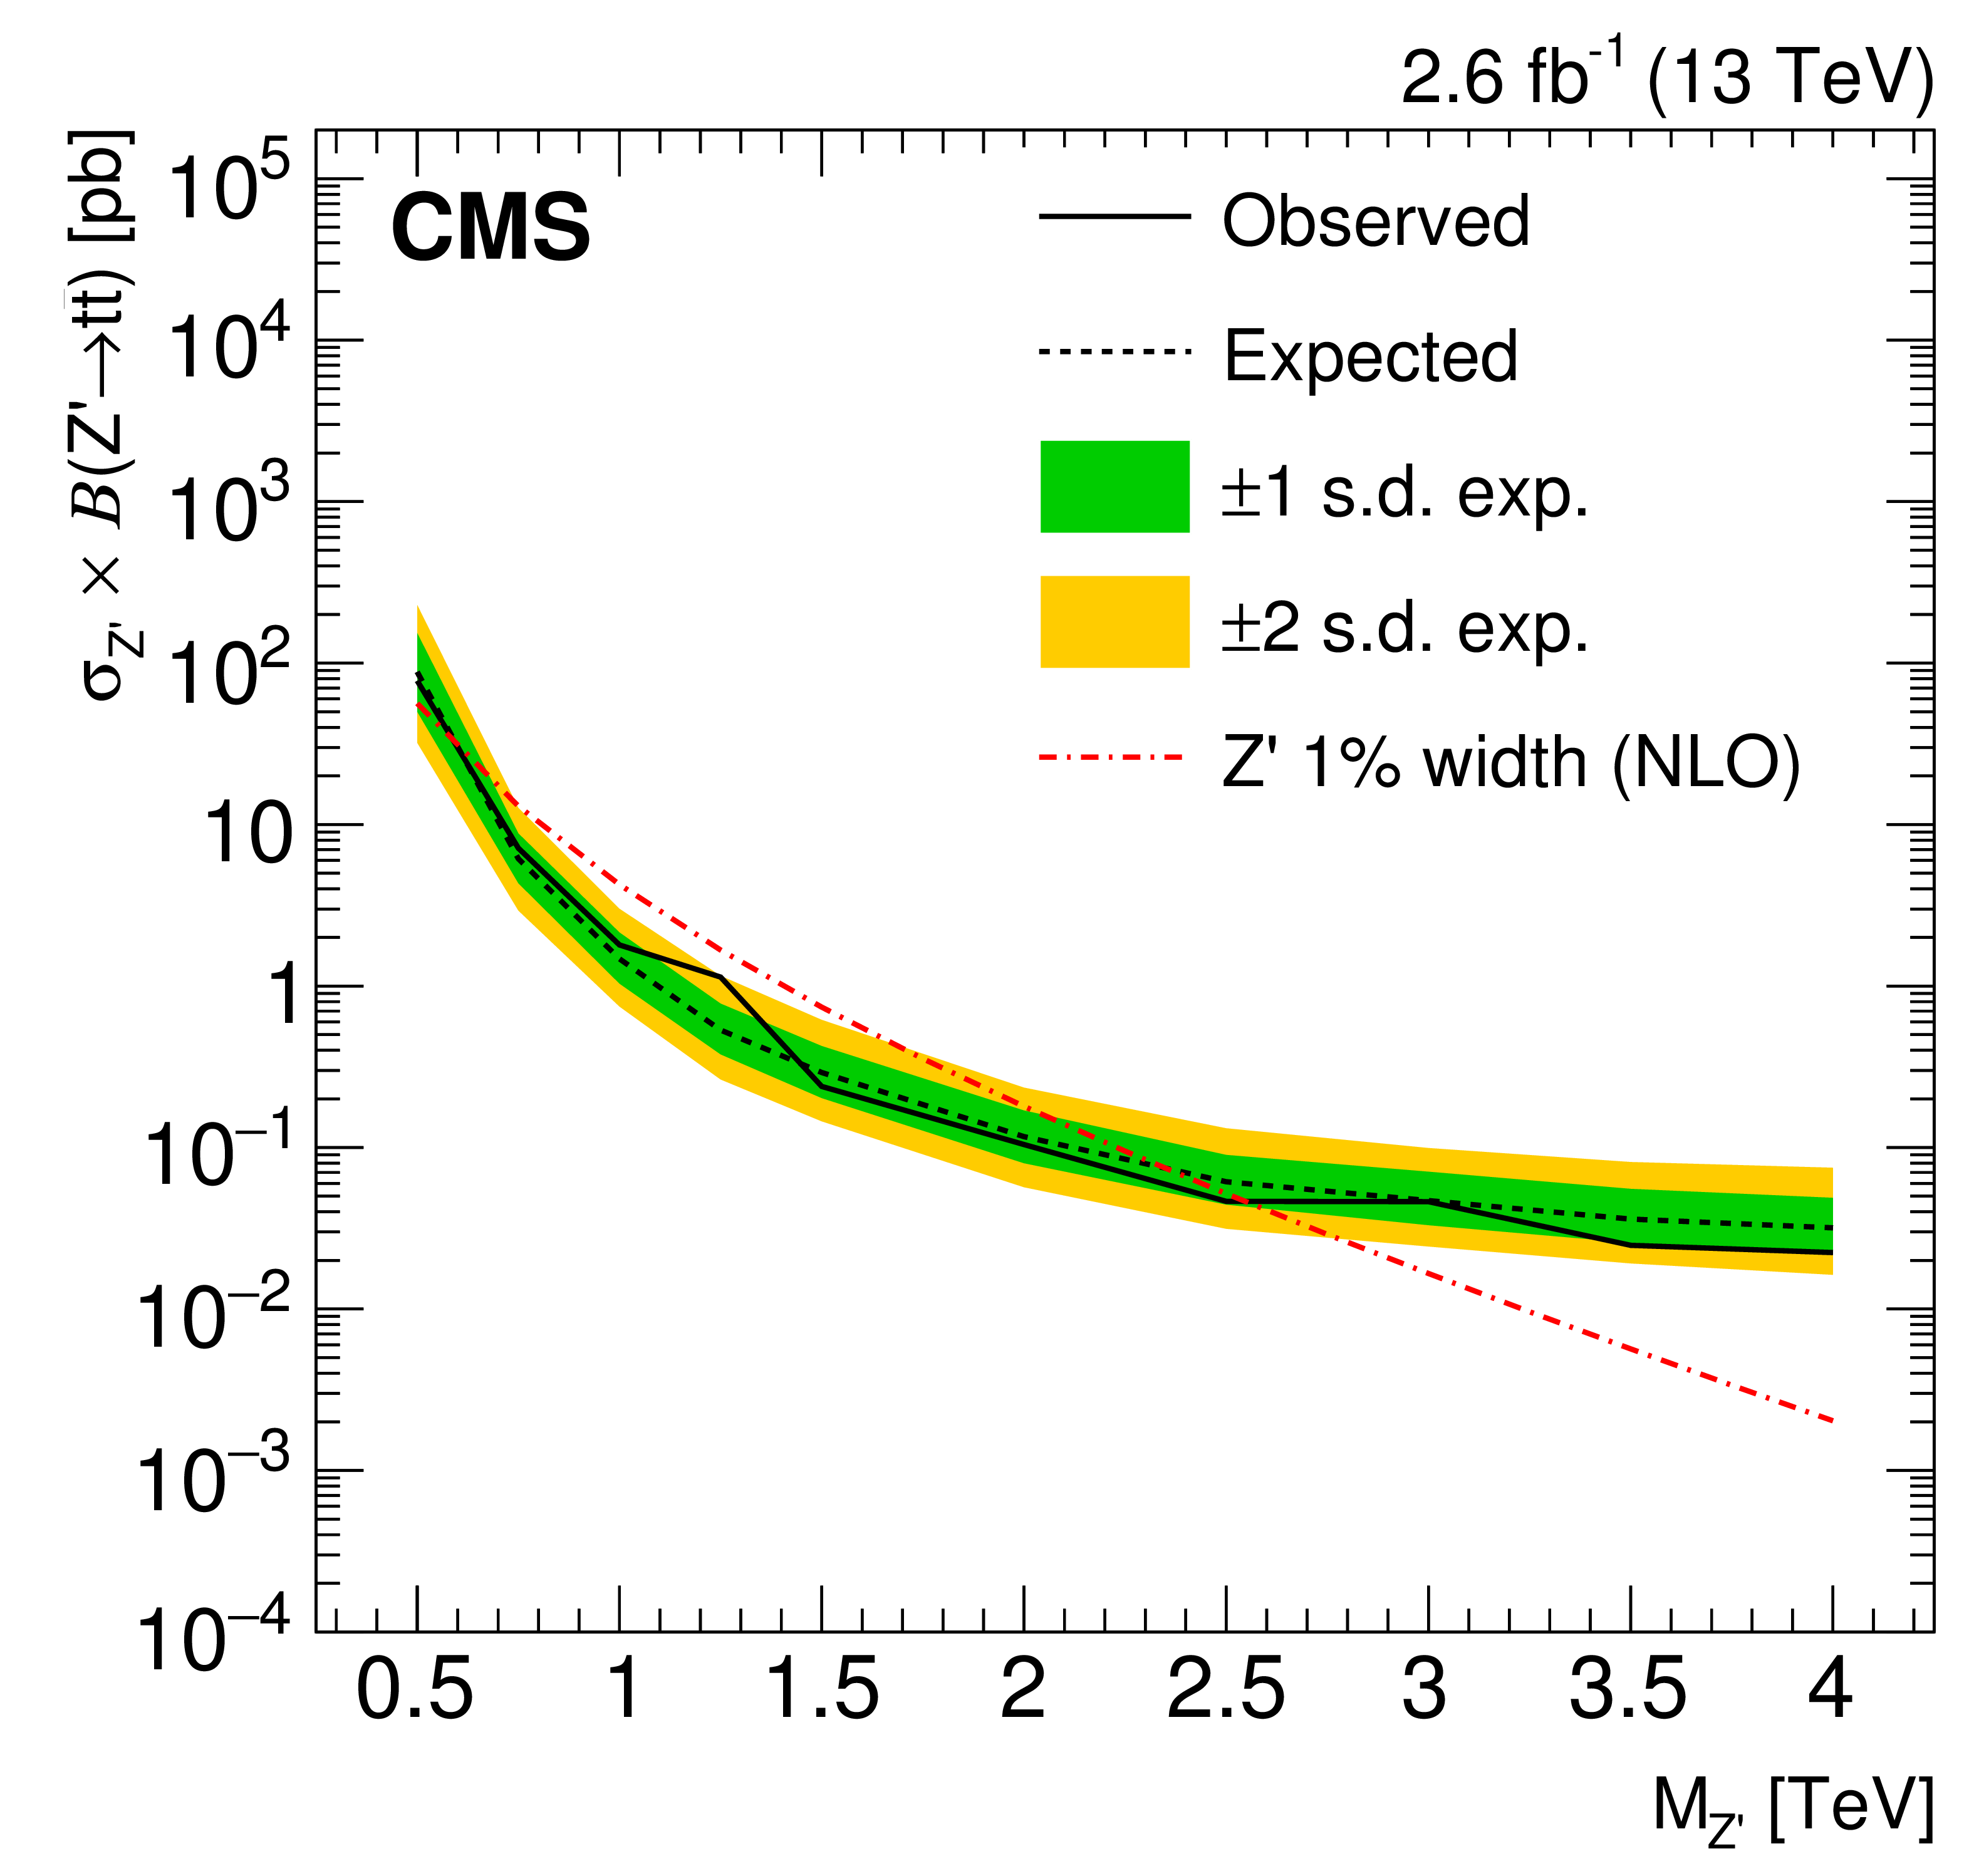
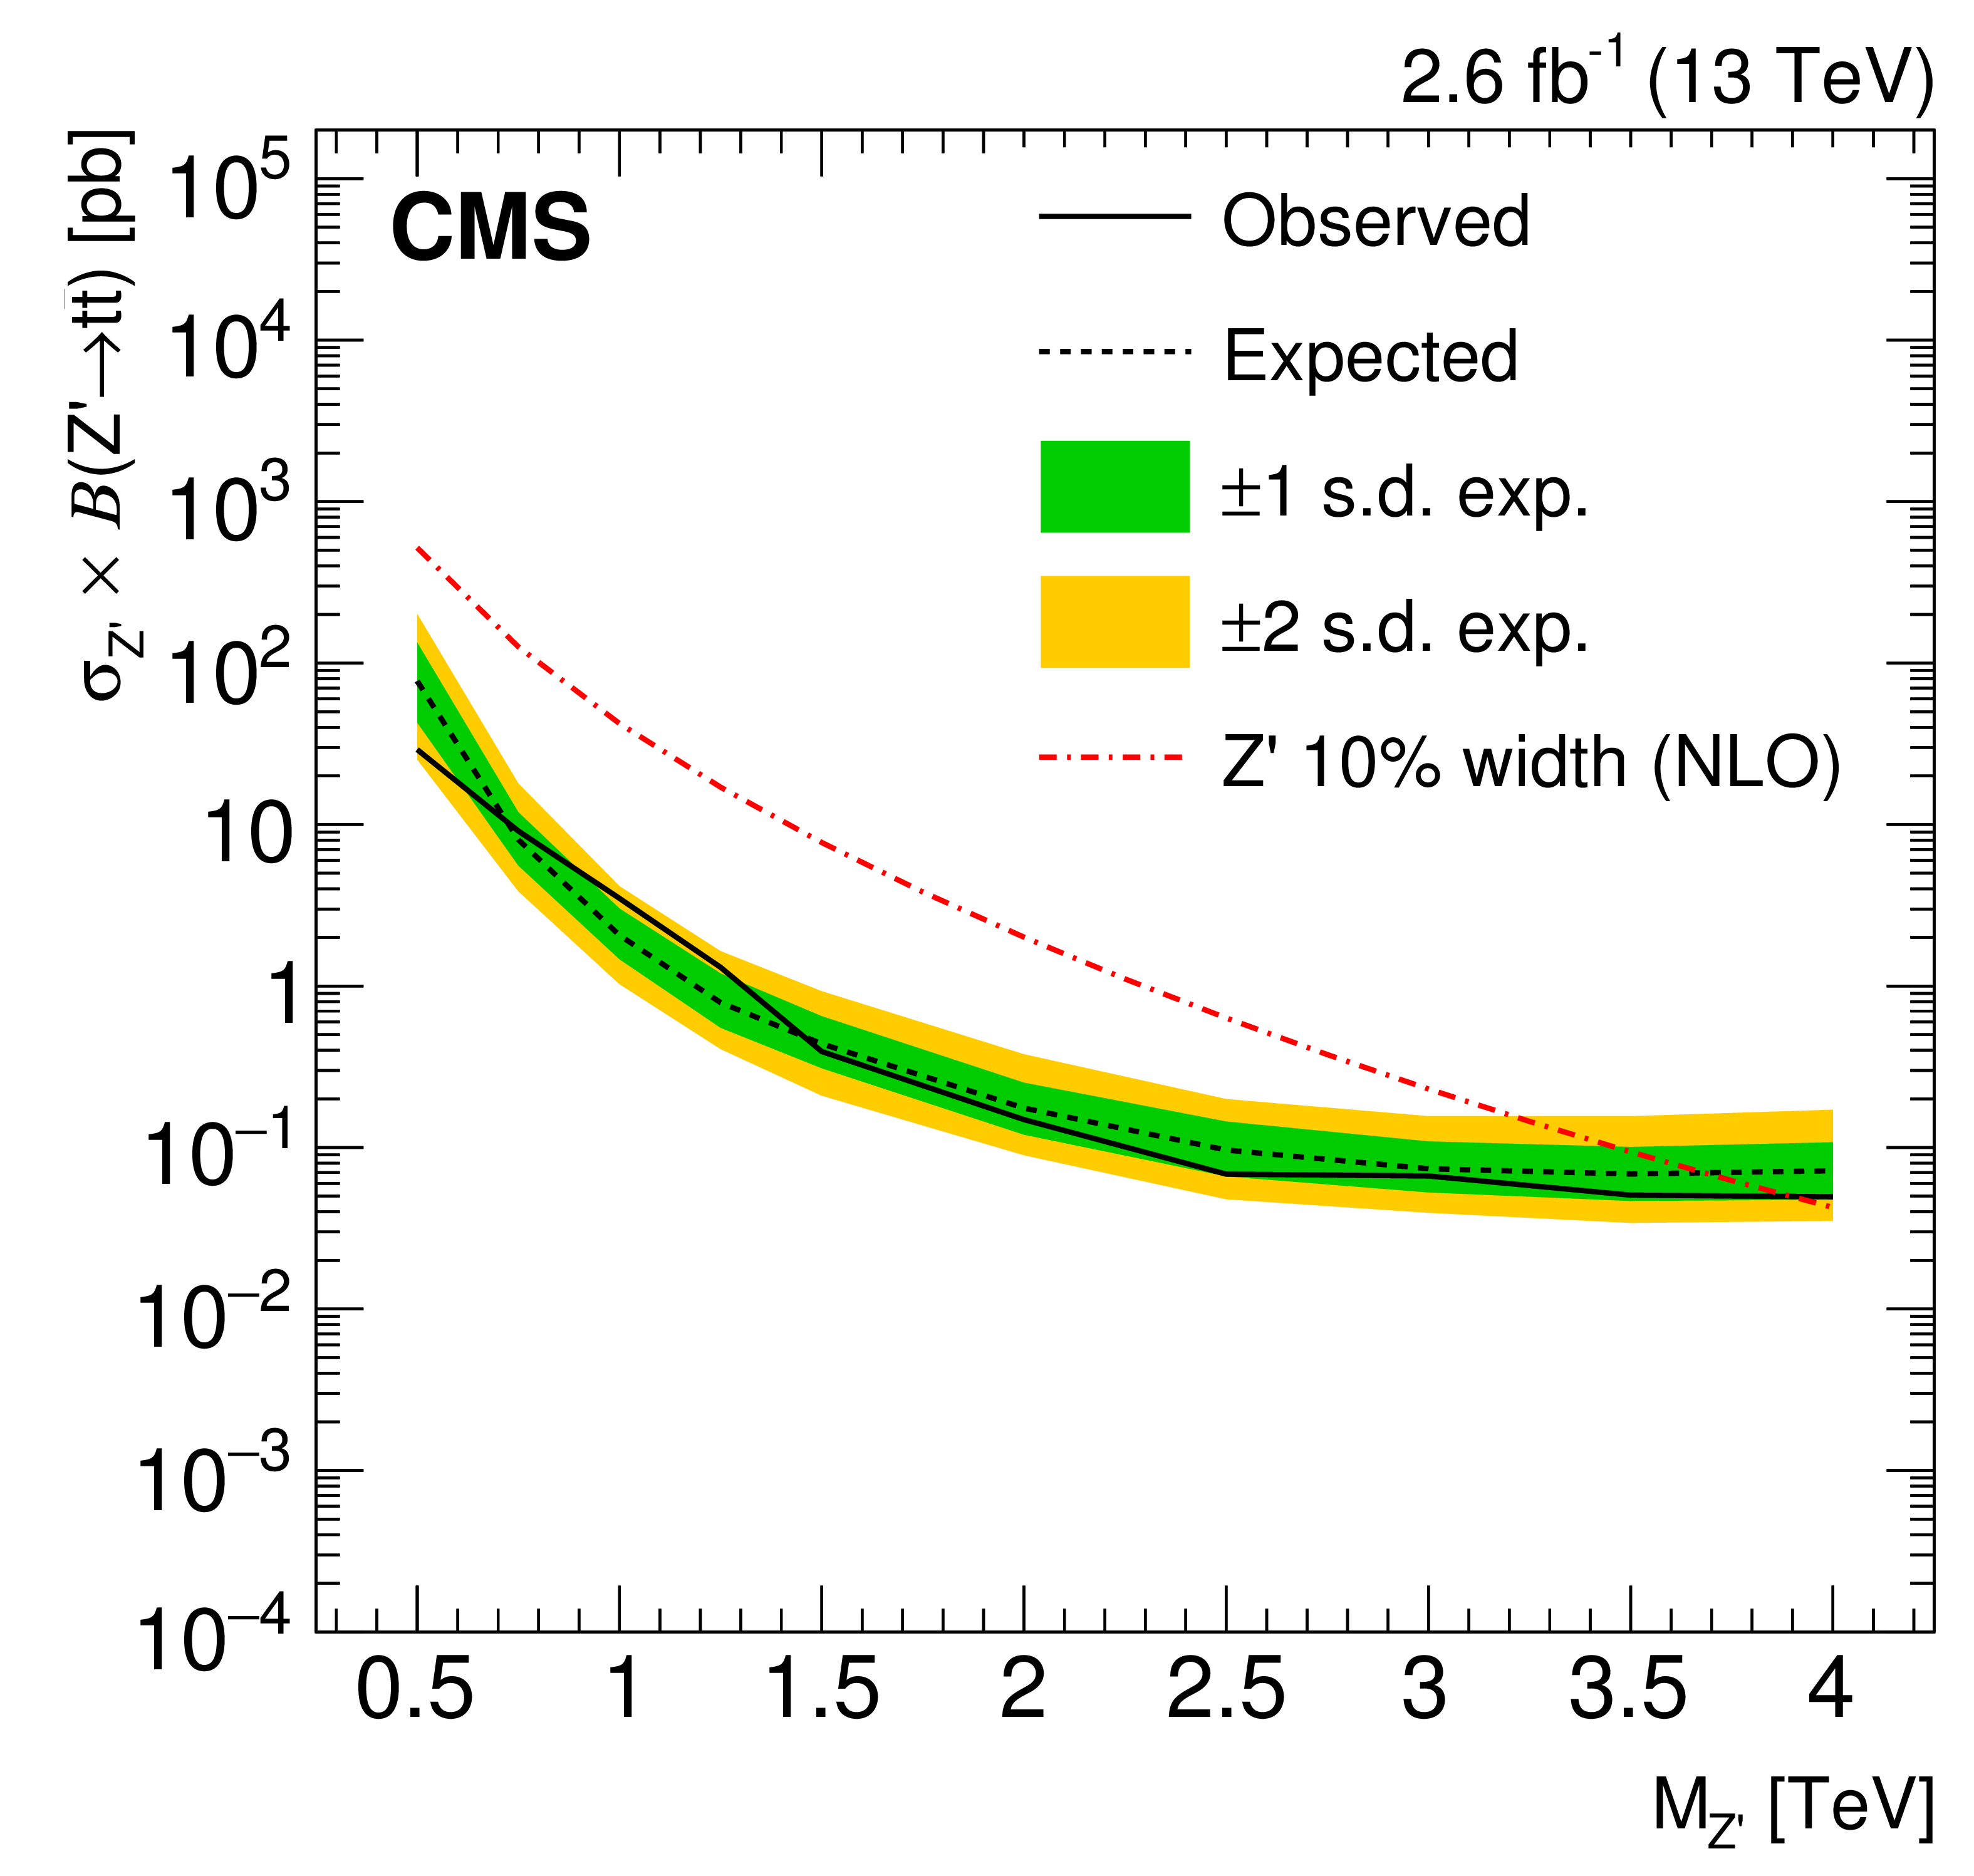
Figure 6:
Observed and expected upper limits at 95% CL on the product of the production cross section and branching fractions for the full combination of the analysis results, shown as function of the resonance mass. Limits are set using four extensions to the SM : (upper left) a Z' boson with $\Gamma /M$ of 1%, (upper right) a Z' boson with $\Gamma /M$ of 10%, (lower left) a Z' boson with $ \Gamma / M $ of 30% and (lower right) a KK excitation of a gluon in the RS model. The corresponding theoretical prediction as a function of the resonance mass is shown as a dot-dashed curve. |
png pdf |
Figure 6-a:
Observed and expected upper limits at 95% CL on the product of the production cross section and branching fractions for the full combination of the analysis results, shown as function of the resonance mass. Limits are set for a Z' boson with $\Gamma /M$ of 1%. The corresponding theoretical prediction as a function of the resonance mass is shown as a dot-dashed curve. |
png pdf |
Figure 6-b:
Observed and expected upper limits at 95% CL on the product of the production cross section and branching fractions for the full combination of the analysis results, shown as function of the resonance mass. Limits are set for a Z' boson with $\Gamma /M$ of 10%. The corresponding theoretical prediction as a function of the resonance mass is shown as a dot-dashed curve. |
png pdf |
Figure 6-c:
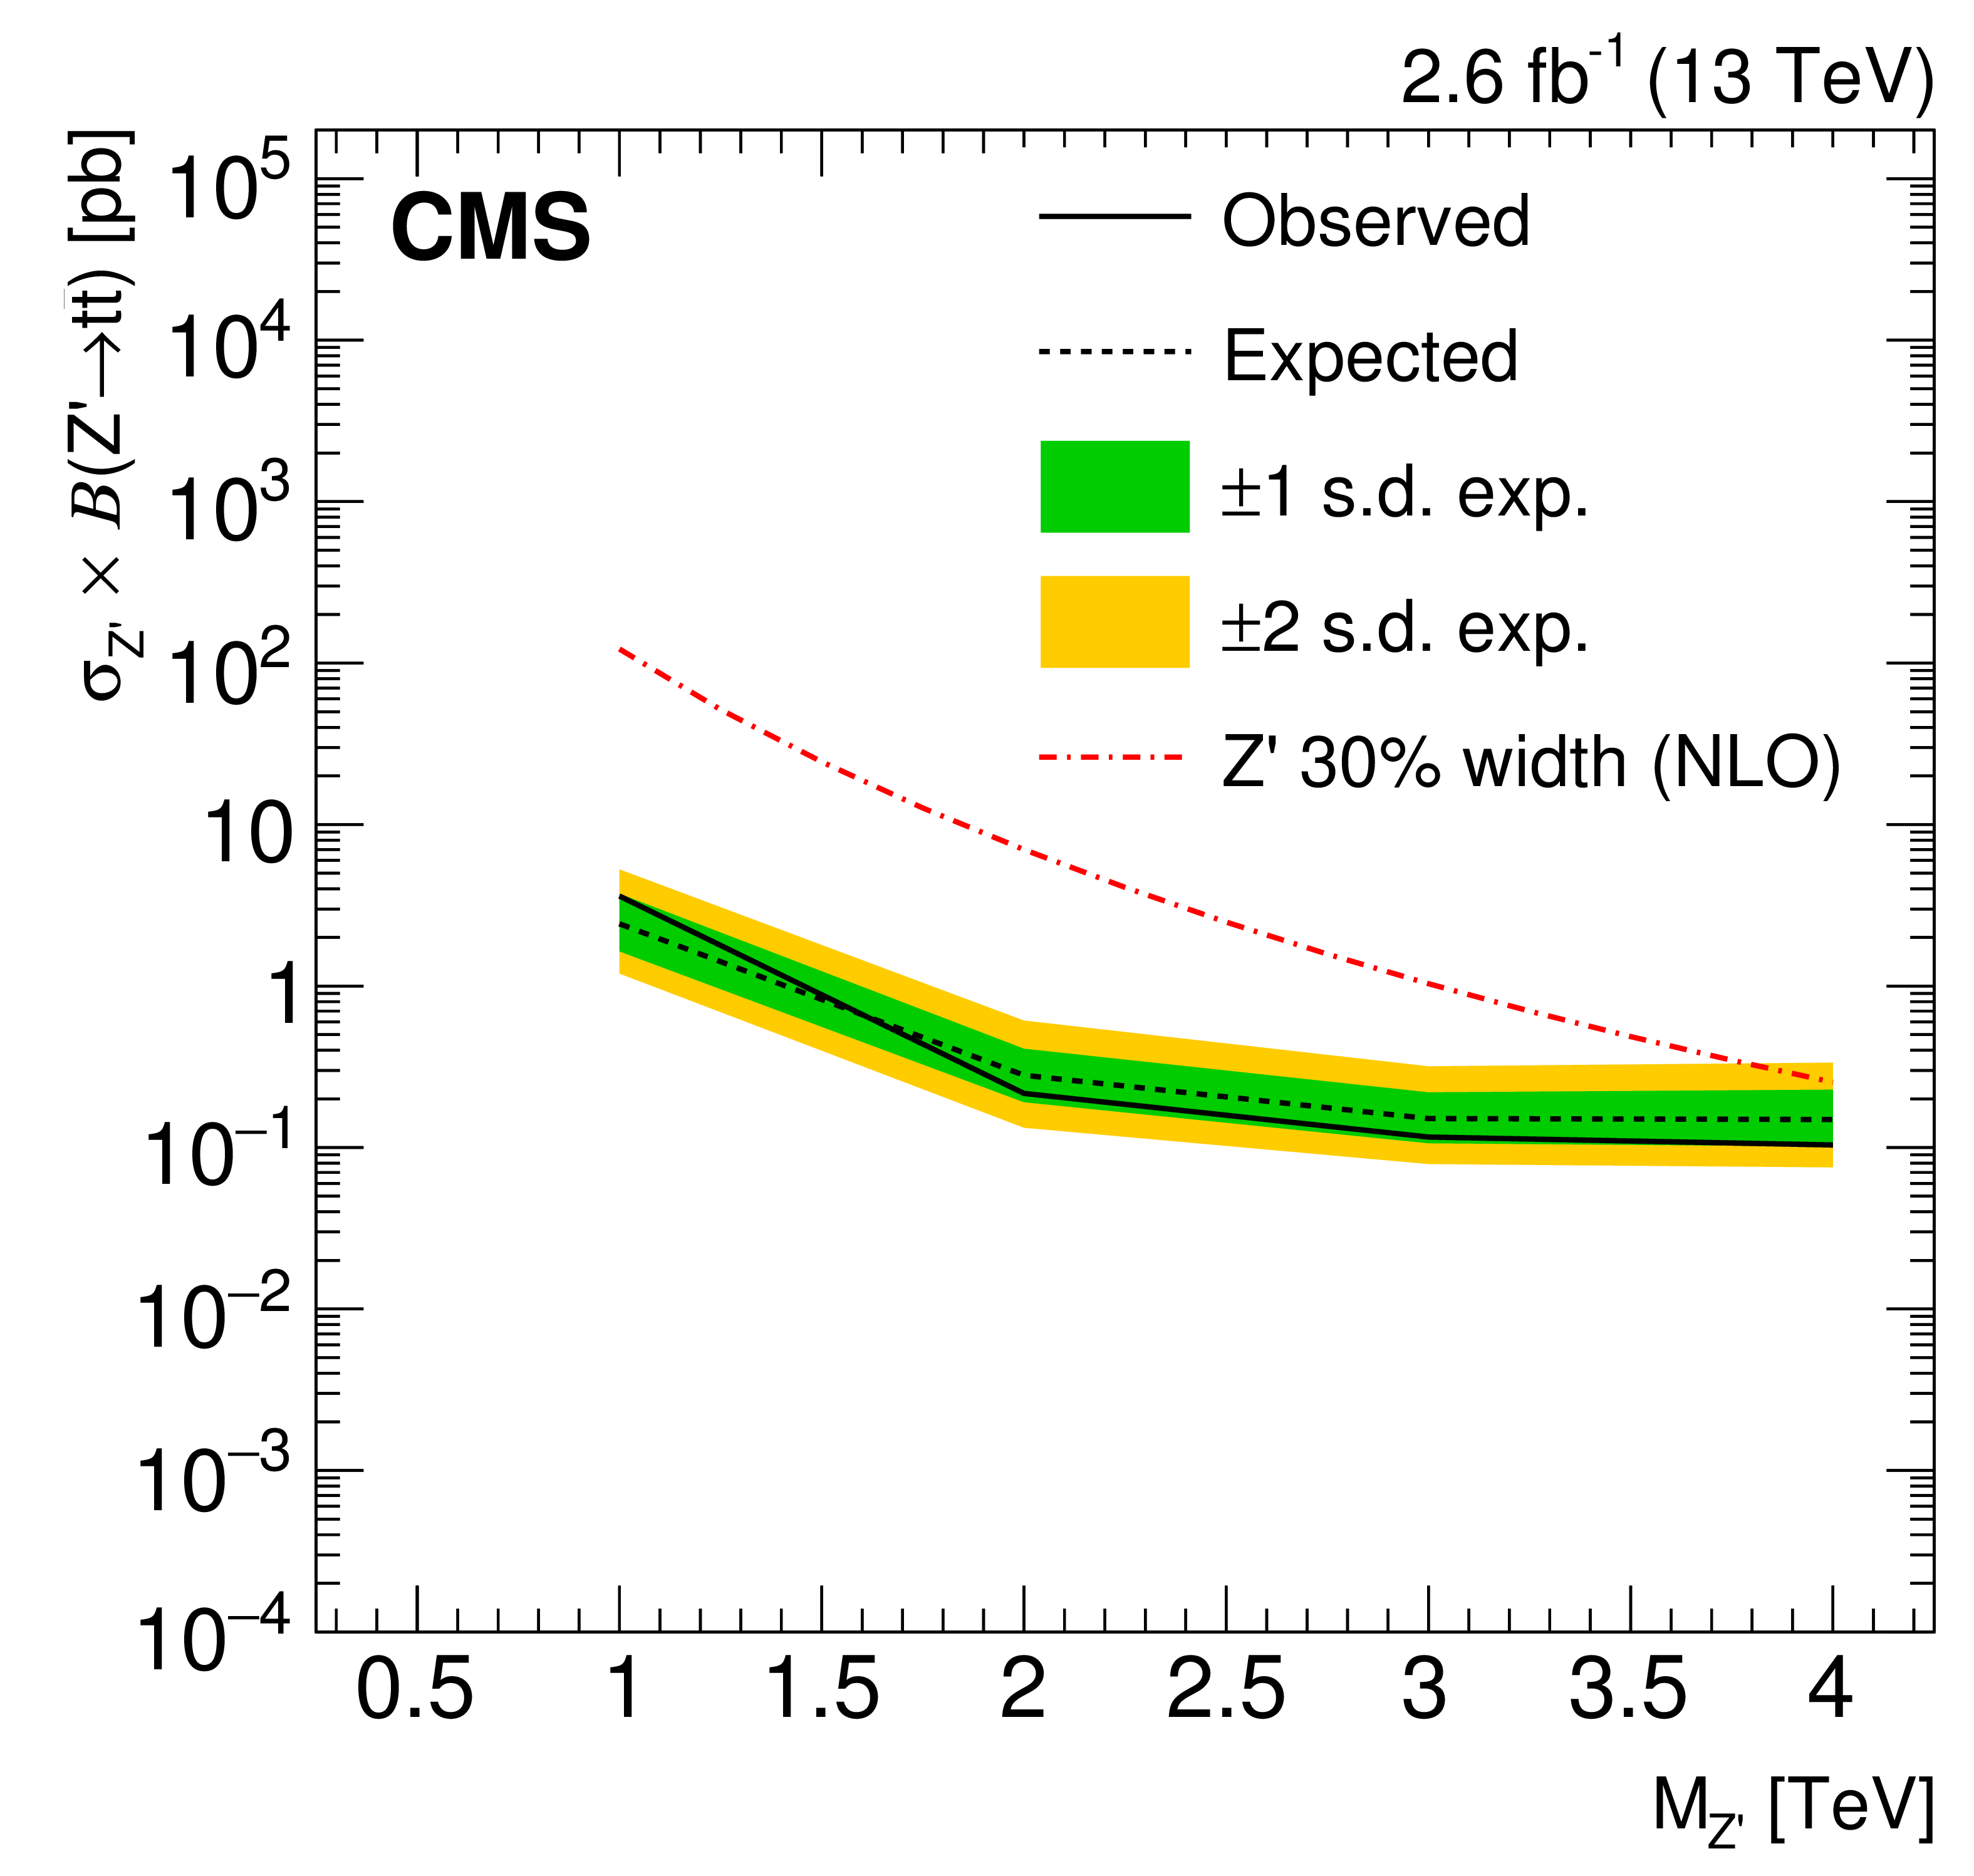
Observed and expected upper limits at 95% CL on the product of the production cross section and branching fractions for the full combination of the analysis results, shown as function of the resonance mass. Limits are set for a Z' boson with $ \Gamma / M $ of 30%. The corresponding theoretical prediction as a function of the resonance mass is shown as a dot-dashed curve. |

png pdf |
Figure 6-d:
Observed and expected upper limits at 95% CL on the product of the production cross section and branching fractions for the full combination of the analysis results, shown as function of the resonance mass. Limits are set for a KK excitation of a gluon in the RS model. The corresponding theoretical prediction as a function of the resonance mass is shown as a dot-dashed curve. |

png pdf |
Figure 7:
Expected and observed limits presented as a function of width, for $M_{\mathrm{ Z }' } = $ 1, 2, 3, 4 TeV . The corresponding theoretical prediction as a function of width is shown as a dot-dashed curve in each case. |
| Tables | |

png pdf |
Table 1:
The mistag rates in data and simulation, and their ratio (data/simulation SF), for AK8 jets in the $ \ell $+jets analysis. |
png pdf |
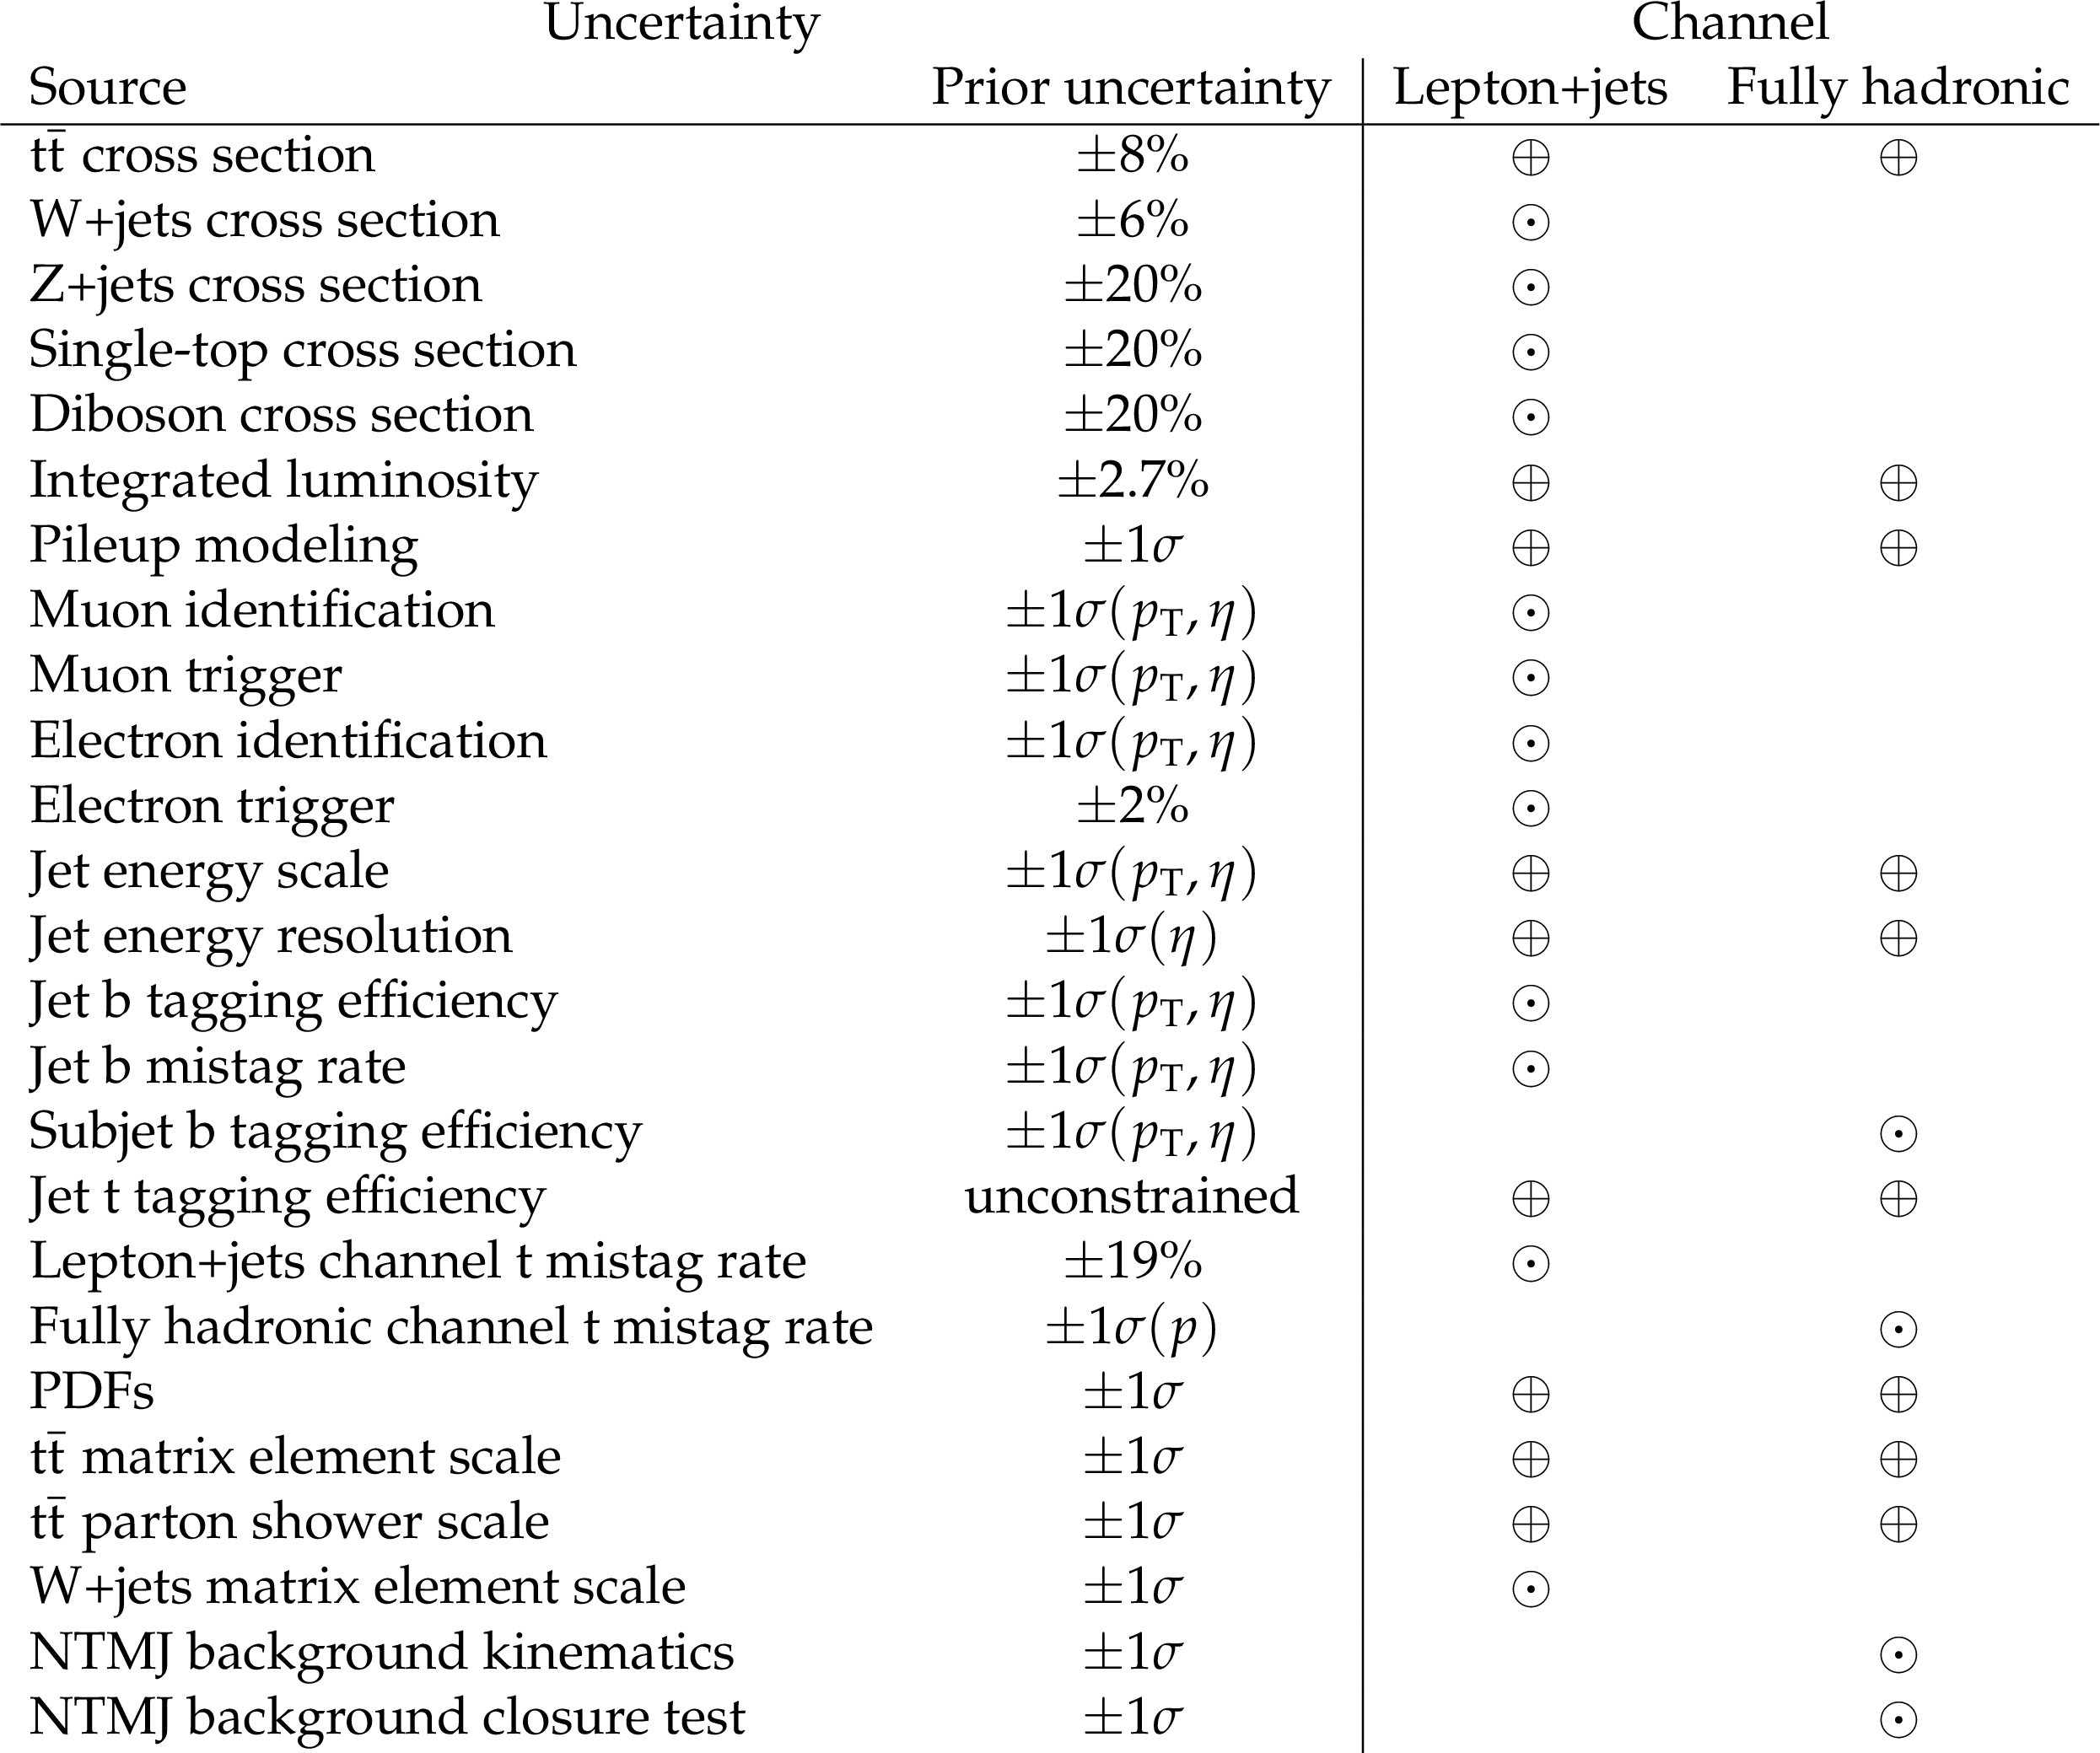
Table 2:
Sources of uncertainty and the channels they affect. Uncorrelated uncertainties applied to a given channel are labeled with a $\odot $. Uncertainties that are correlated between channels are labeled with a $\oplus $. In this table, $\sigma $ denotes the uncertainty in the given prior value in the likelihood fit. |
png pdf |
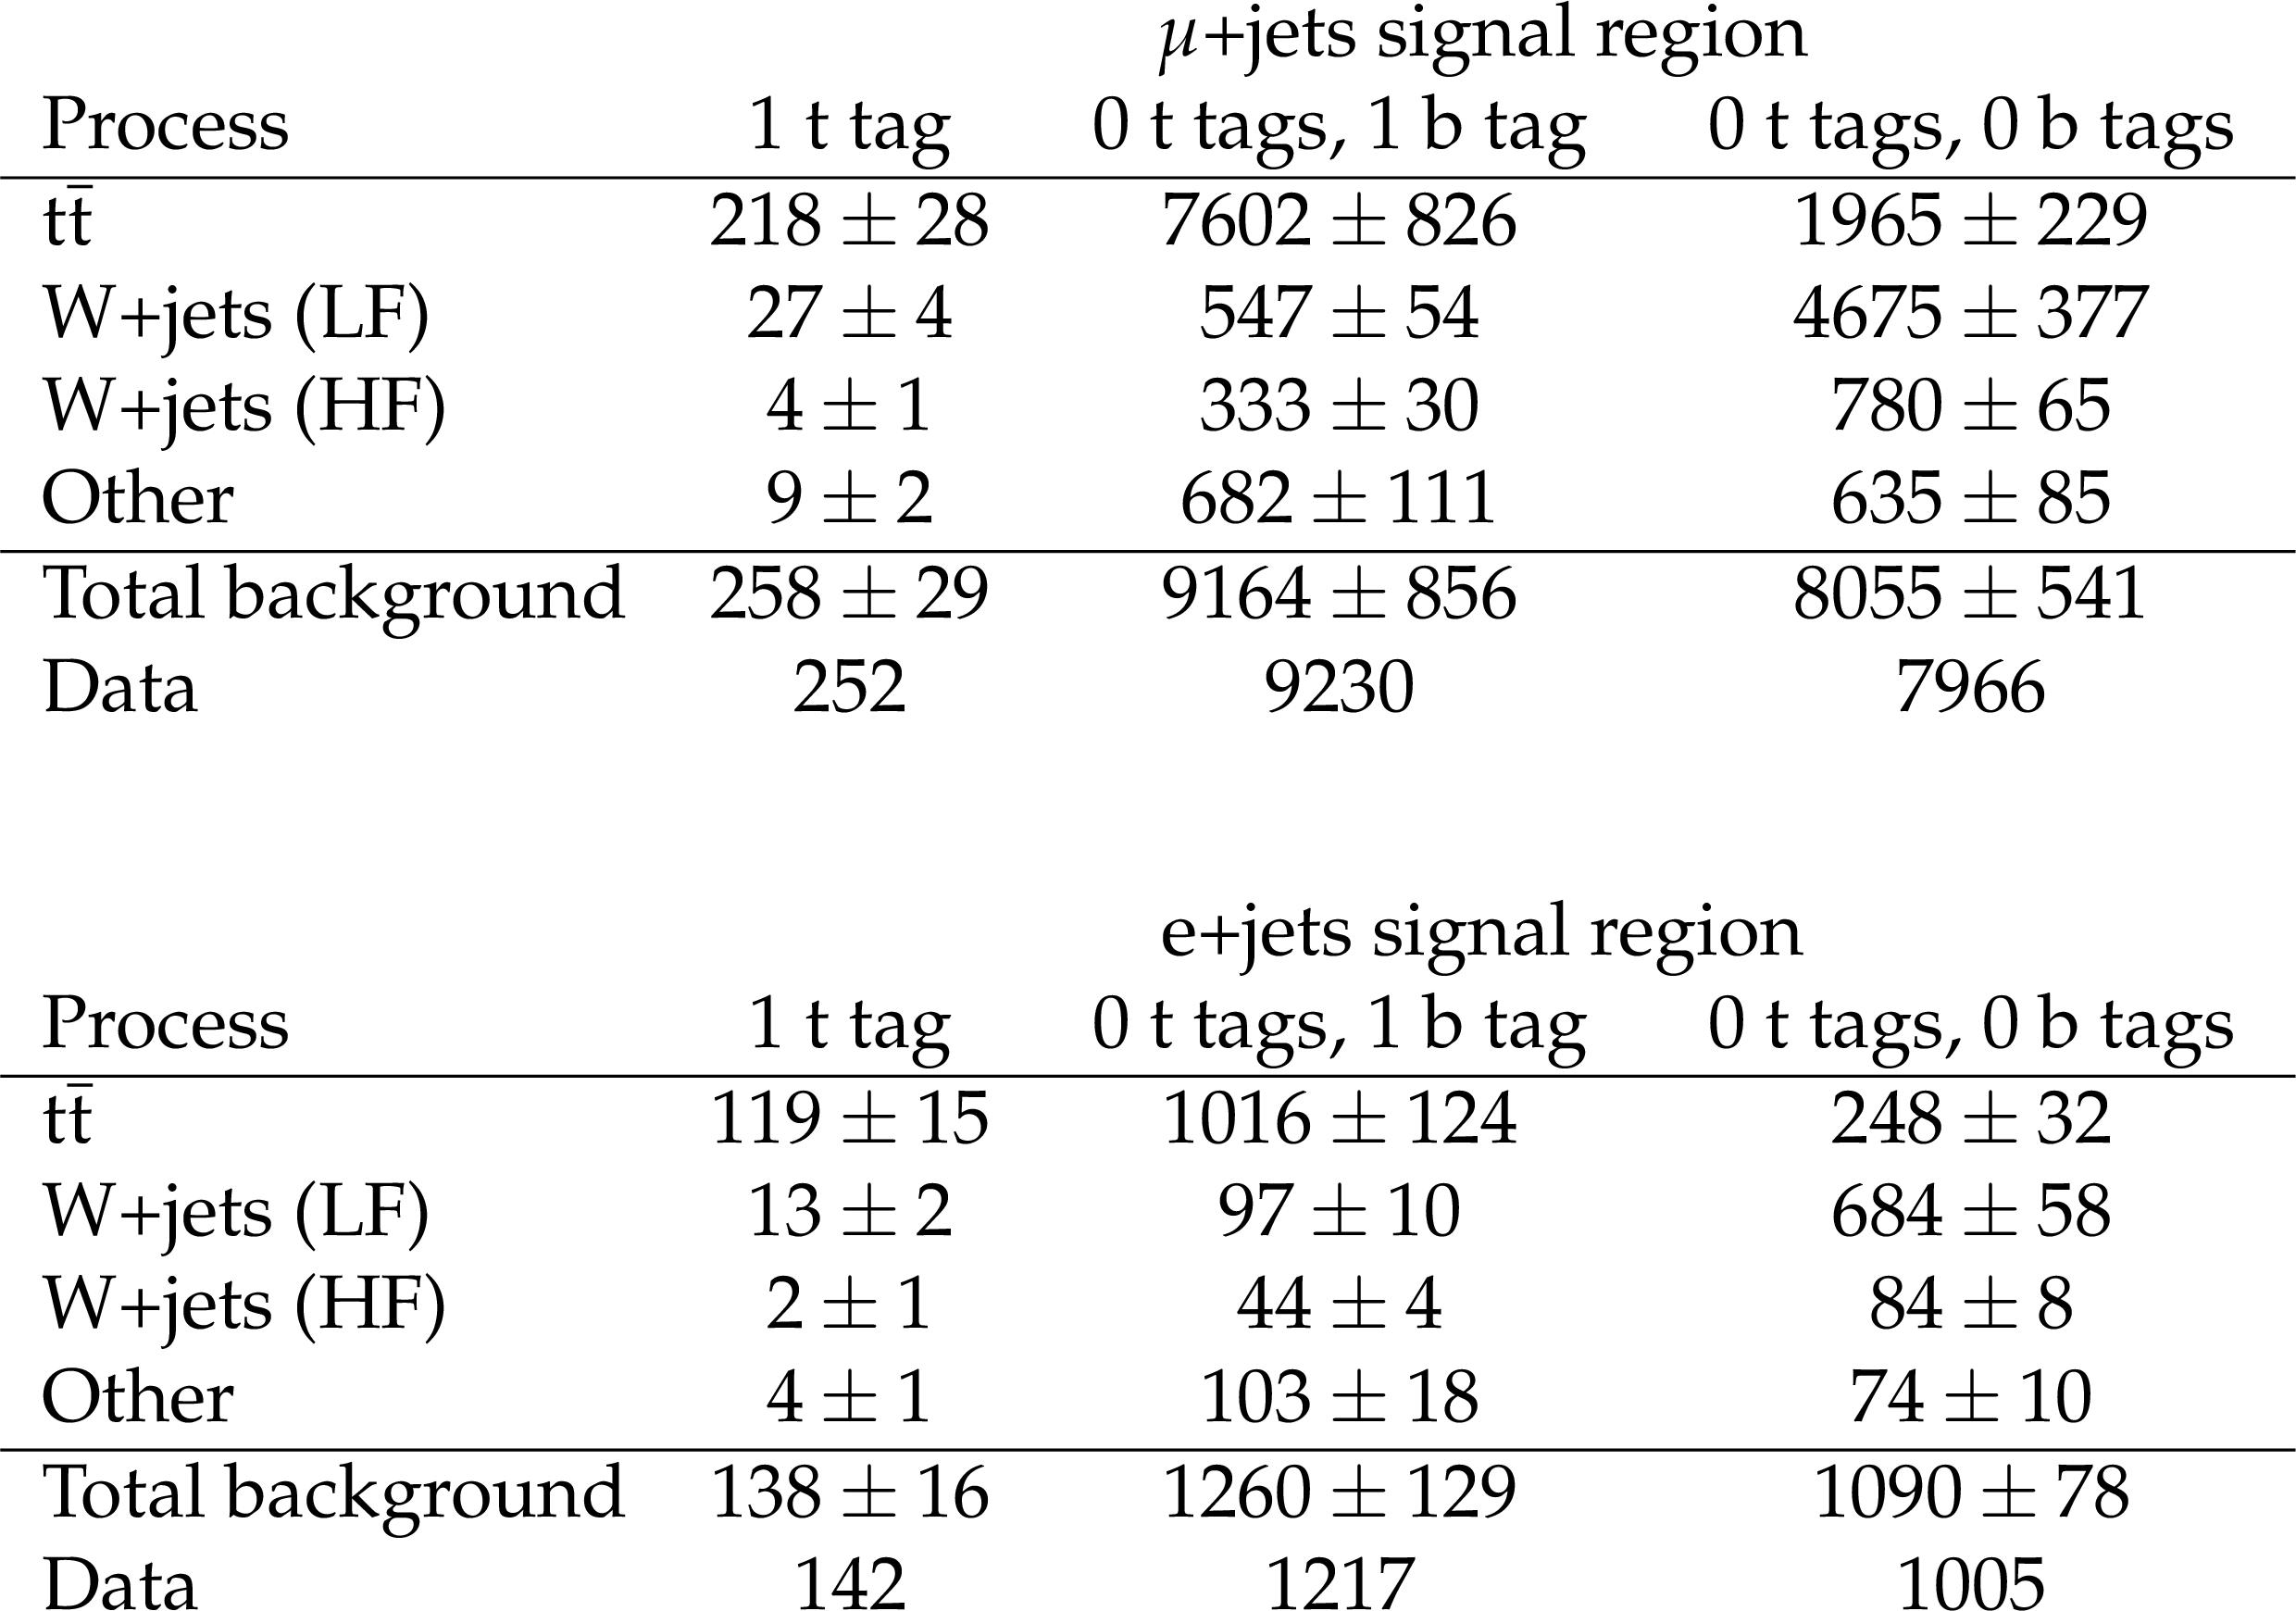
Table 3:
Numbers of events in the signal region for the lepton+jets analysis. The expected yields for SM backgrounds are obtained from the maximum likelihood fit to the data described in Section 6.4. The uncertainties reported in the total expected background include the statistical uncertainties in the simulation and all the posterior systematic uncertainties. For the W+jets background, LF (HF) indicates contributions from W bosons produced in association with light-flavor (heavy-flavor) jets. |
png pdf |
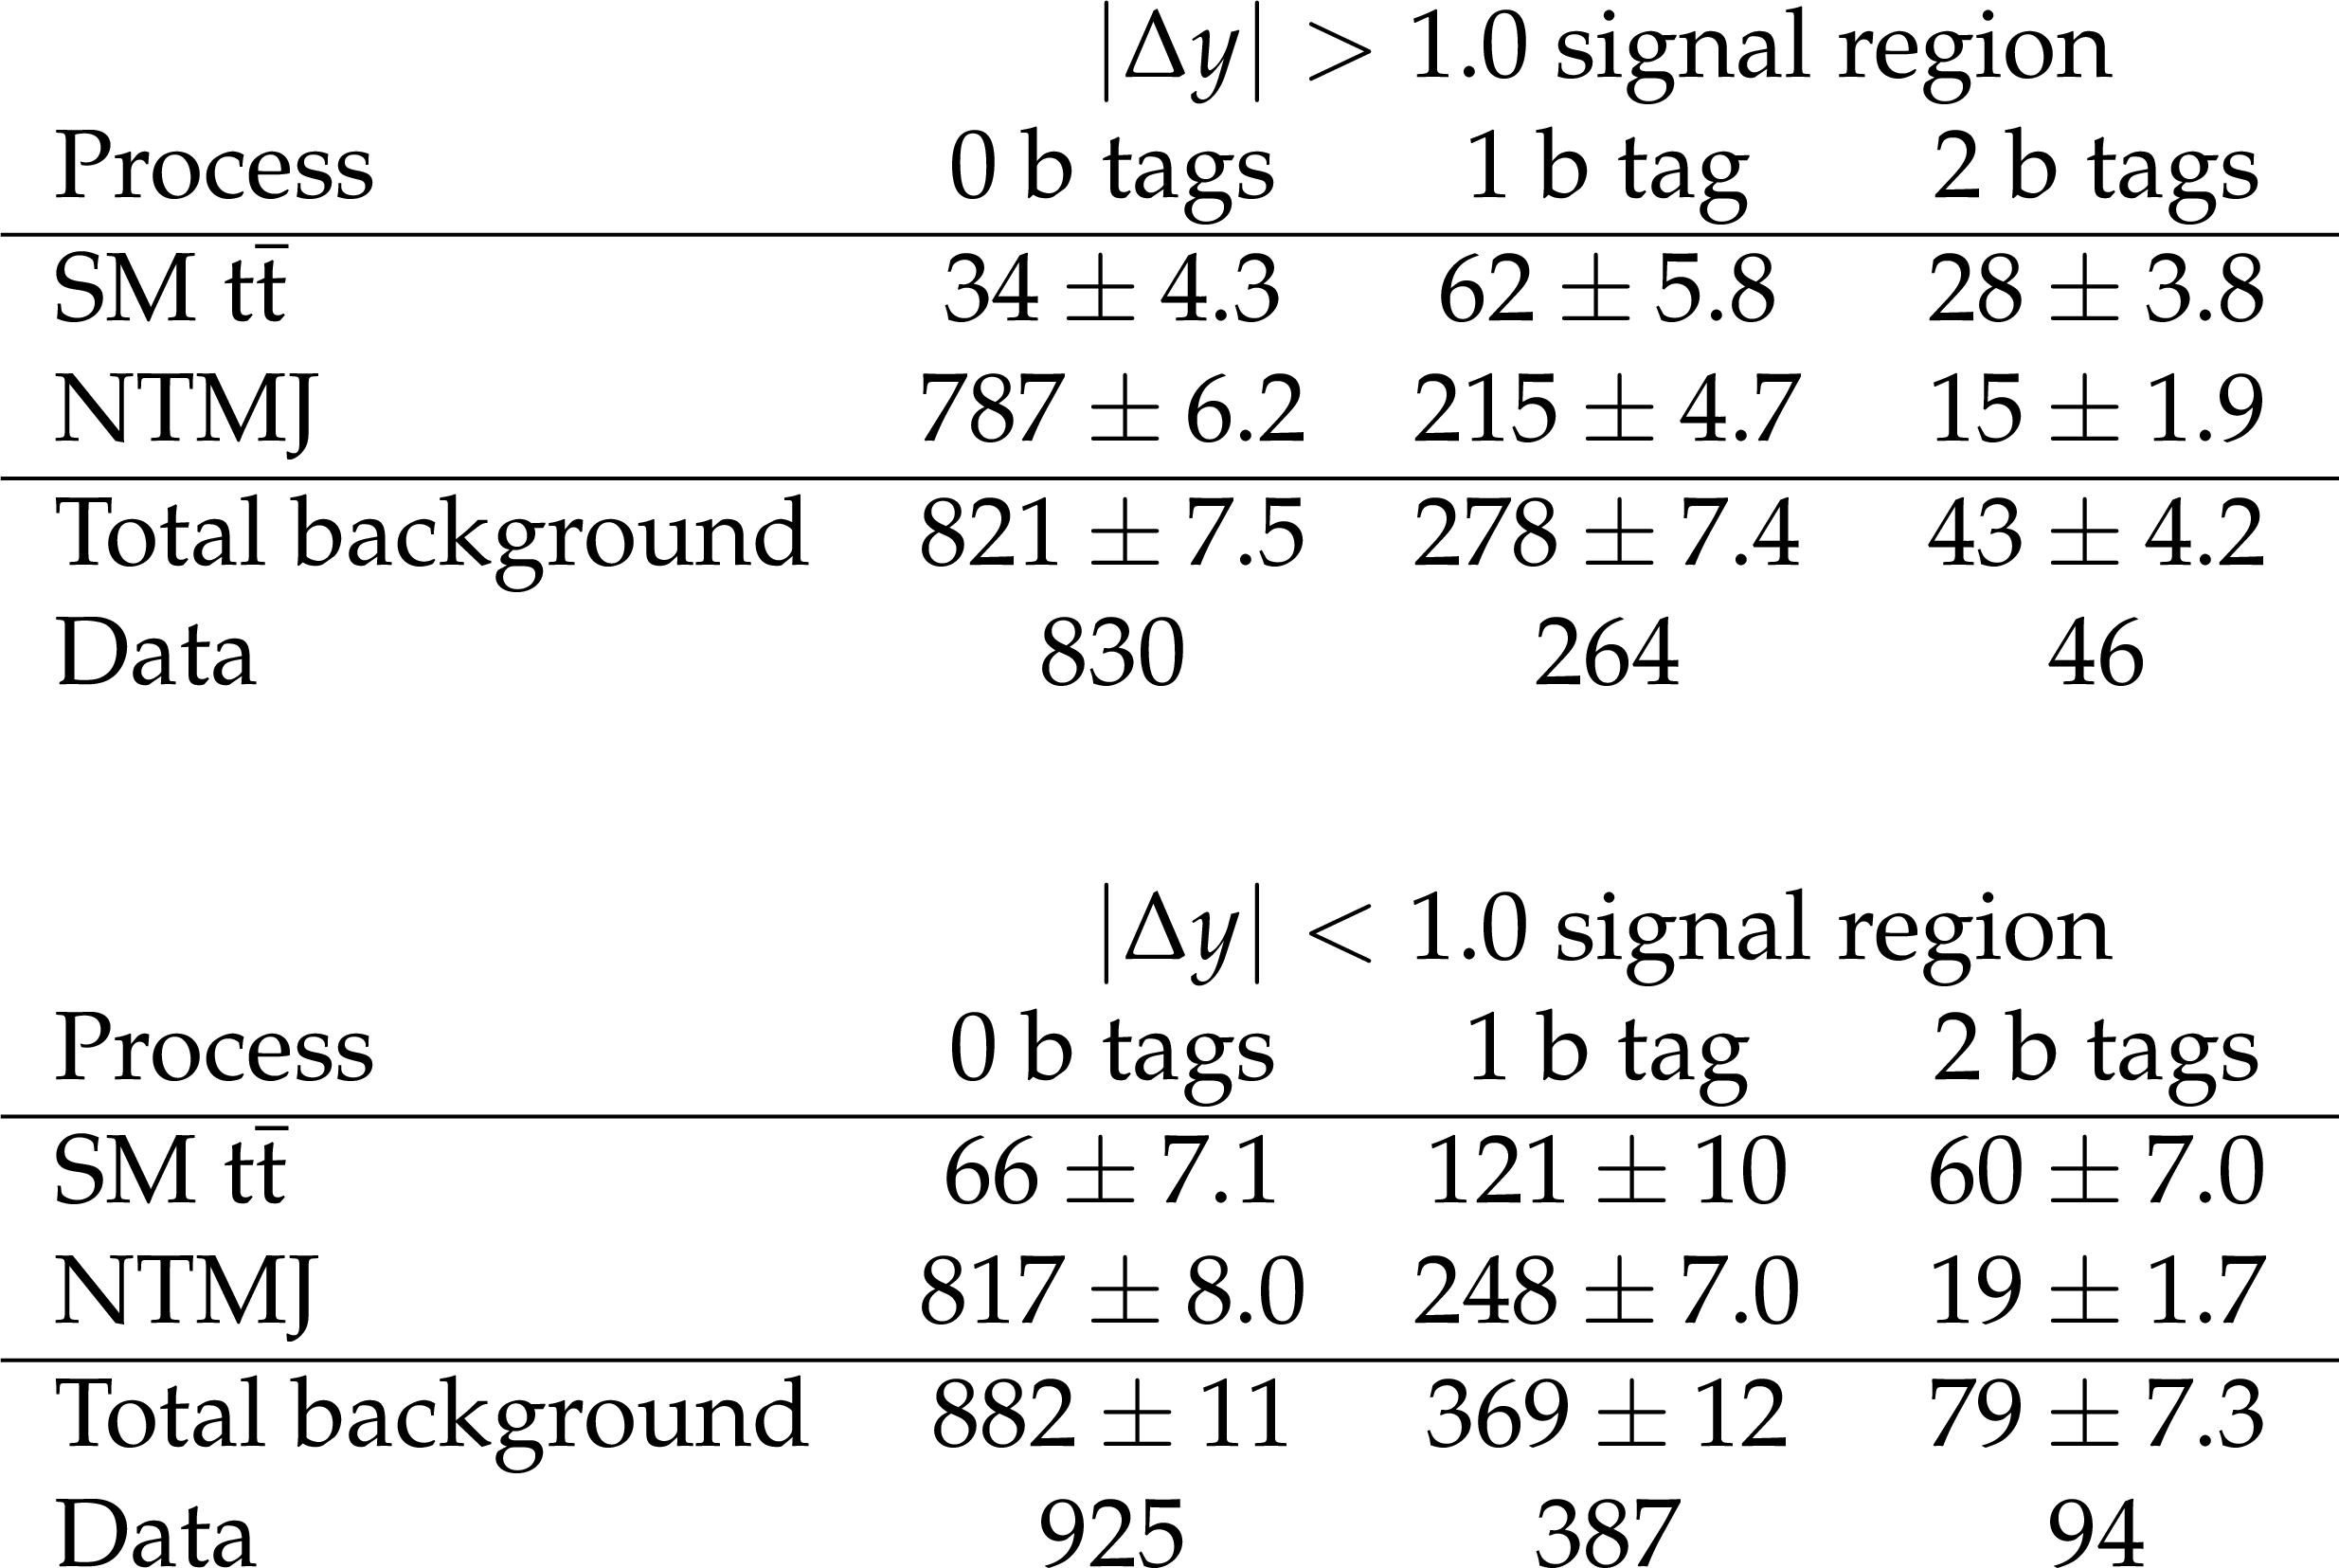
Table 4:
Number of events in the signal region for the fully hadronic analysis. The expected yields for SM backgrounds are obtained from the maximum likelihood fit to data described in the text. The uncertainties reported for the total expected background include the statistical uncertainties on the simulation and all the posterior systematic uncertainties. |
png pdf |
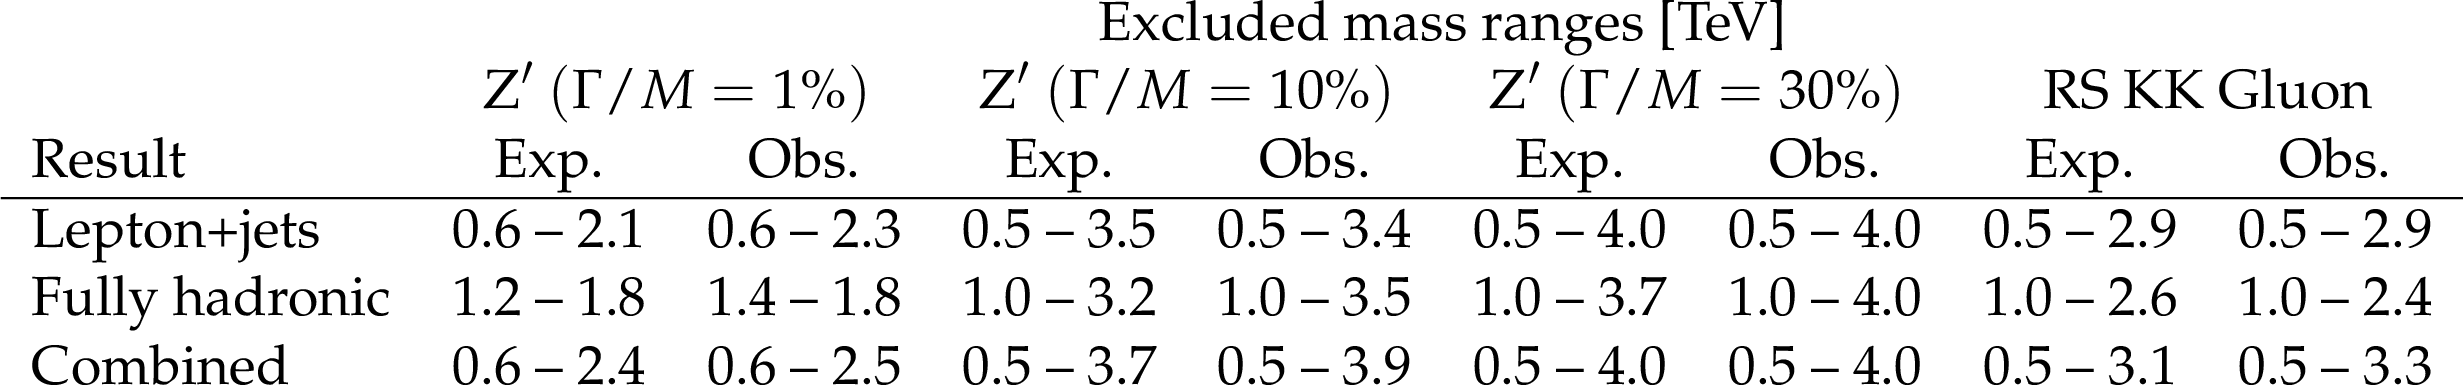
Table 5:
Comparison of mass exclusion results (in TeV) for the individual channels and for their combination. |
png pdf |
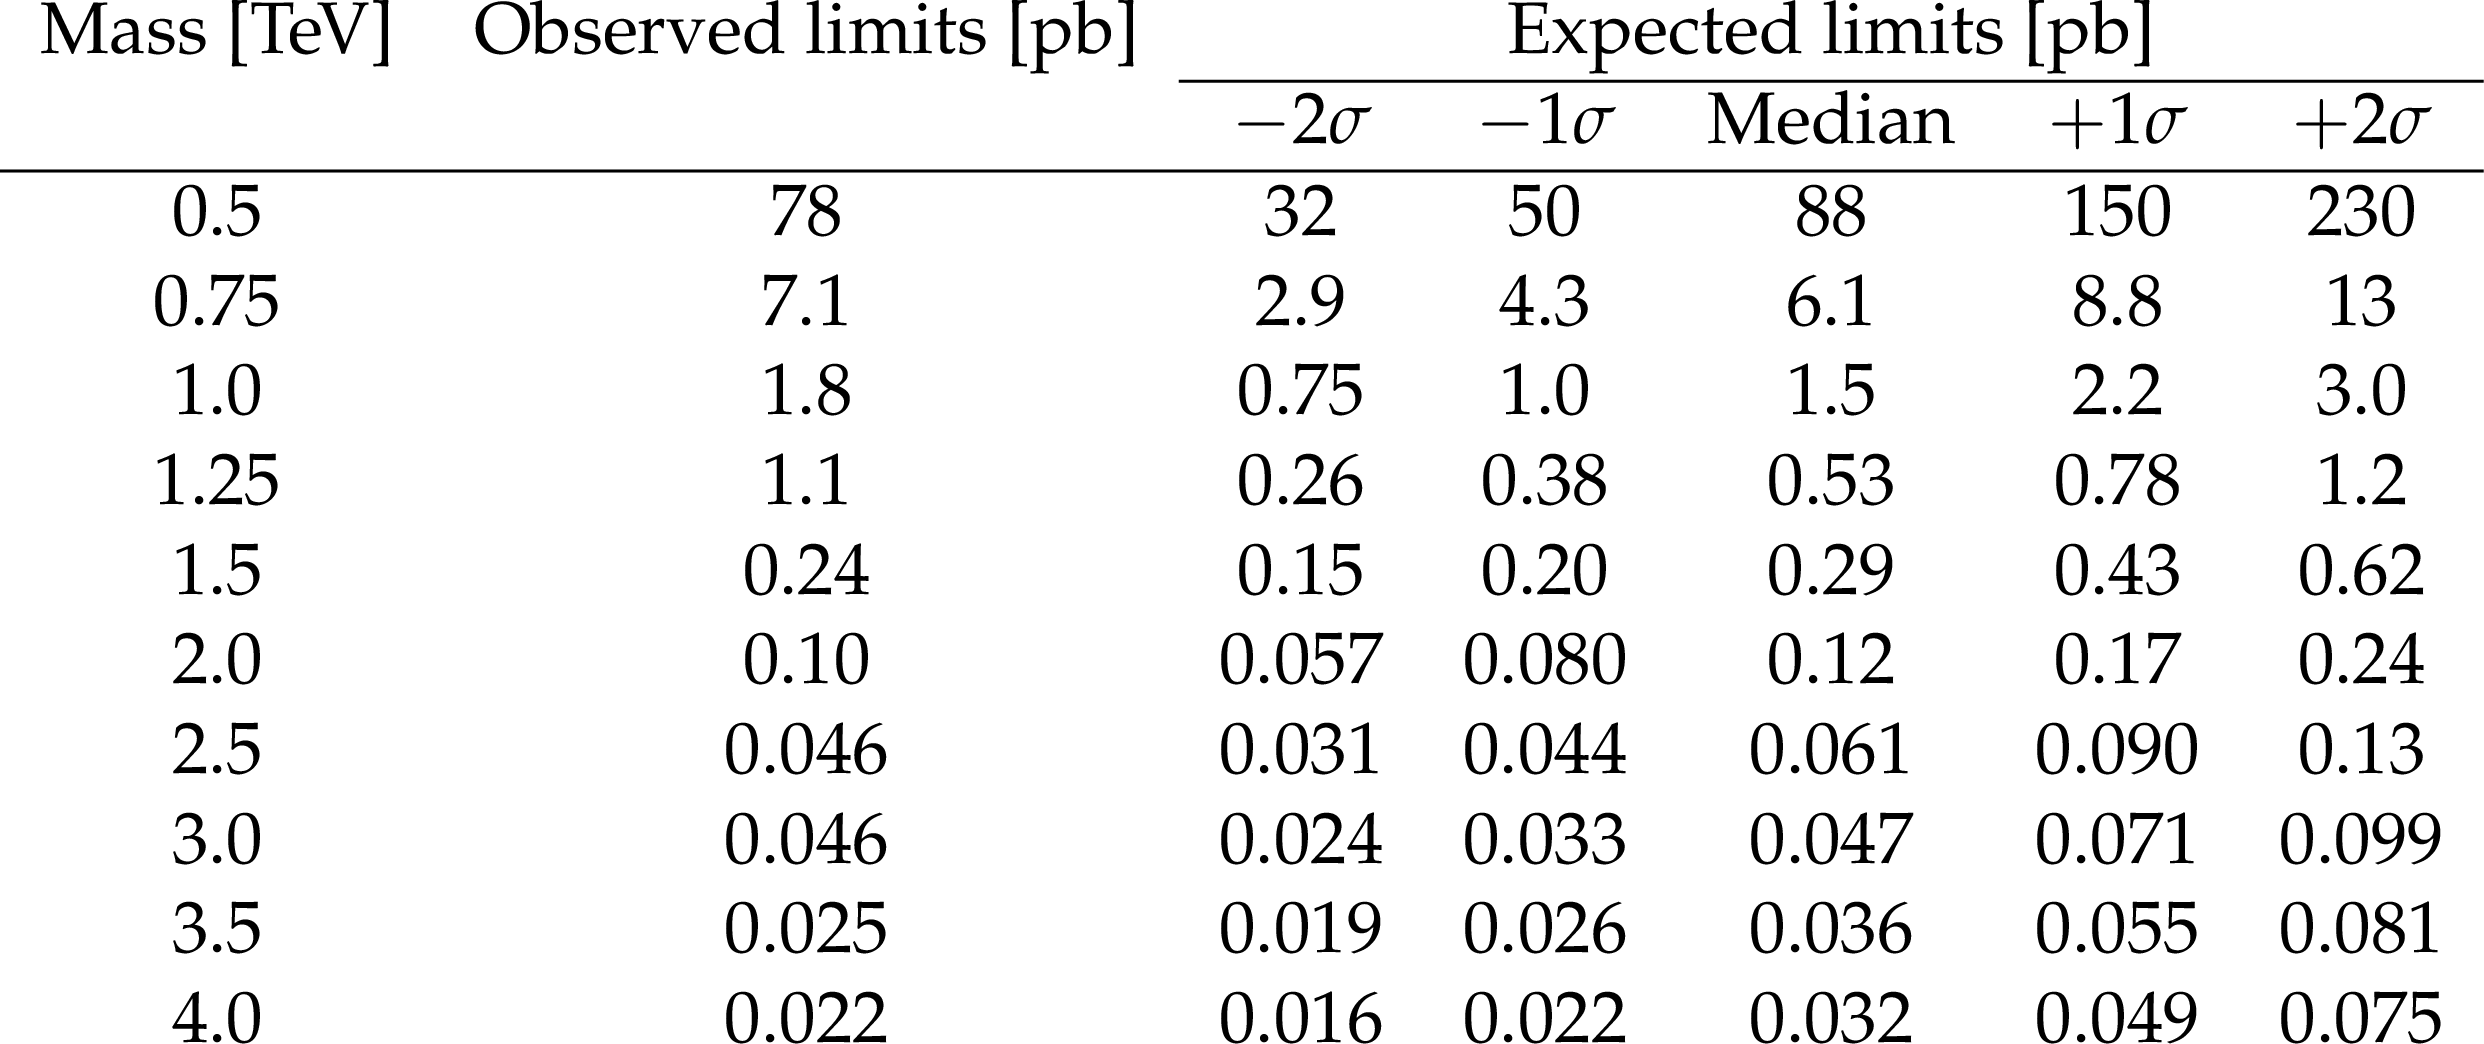
Table 6:
Expected and observed cross section limits at 95% CL, for the 1% width Z' resonance hypothesis. |
png pdf |
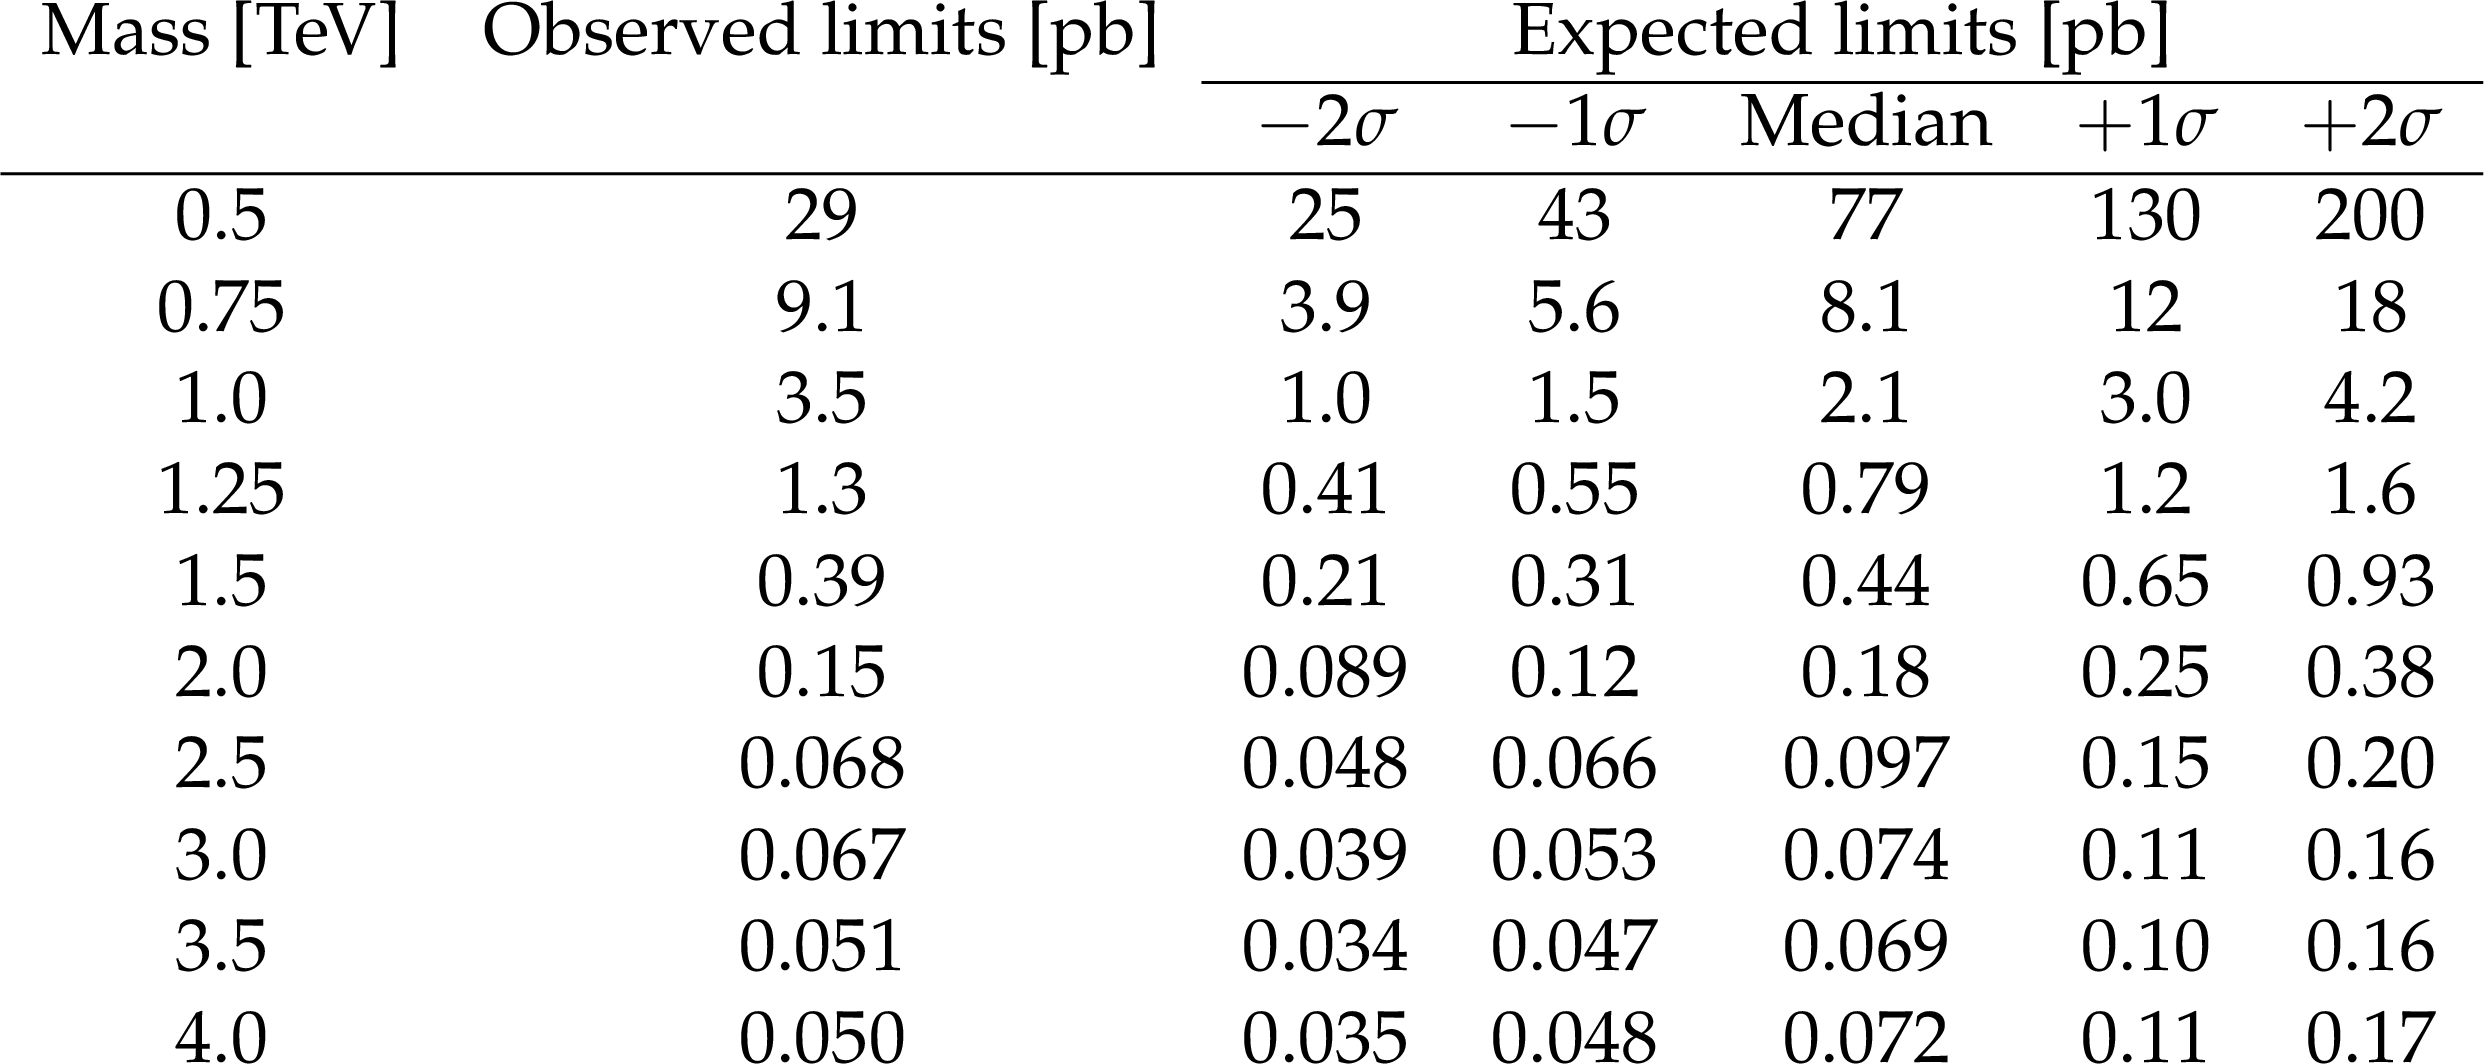
Table 7:
Expected and observed cross section limits at 95% CL, for the 10% width Z' resonance hypothesis. |

png pdf |
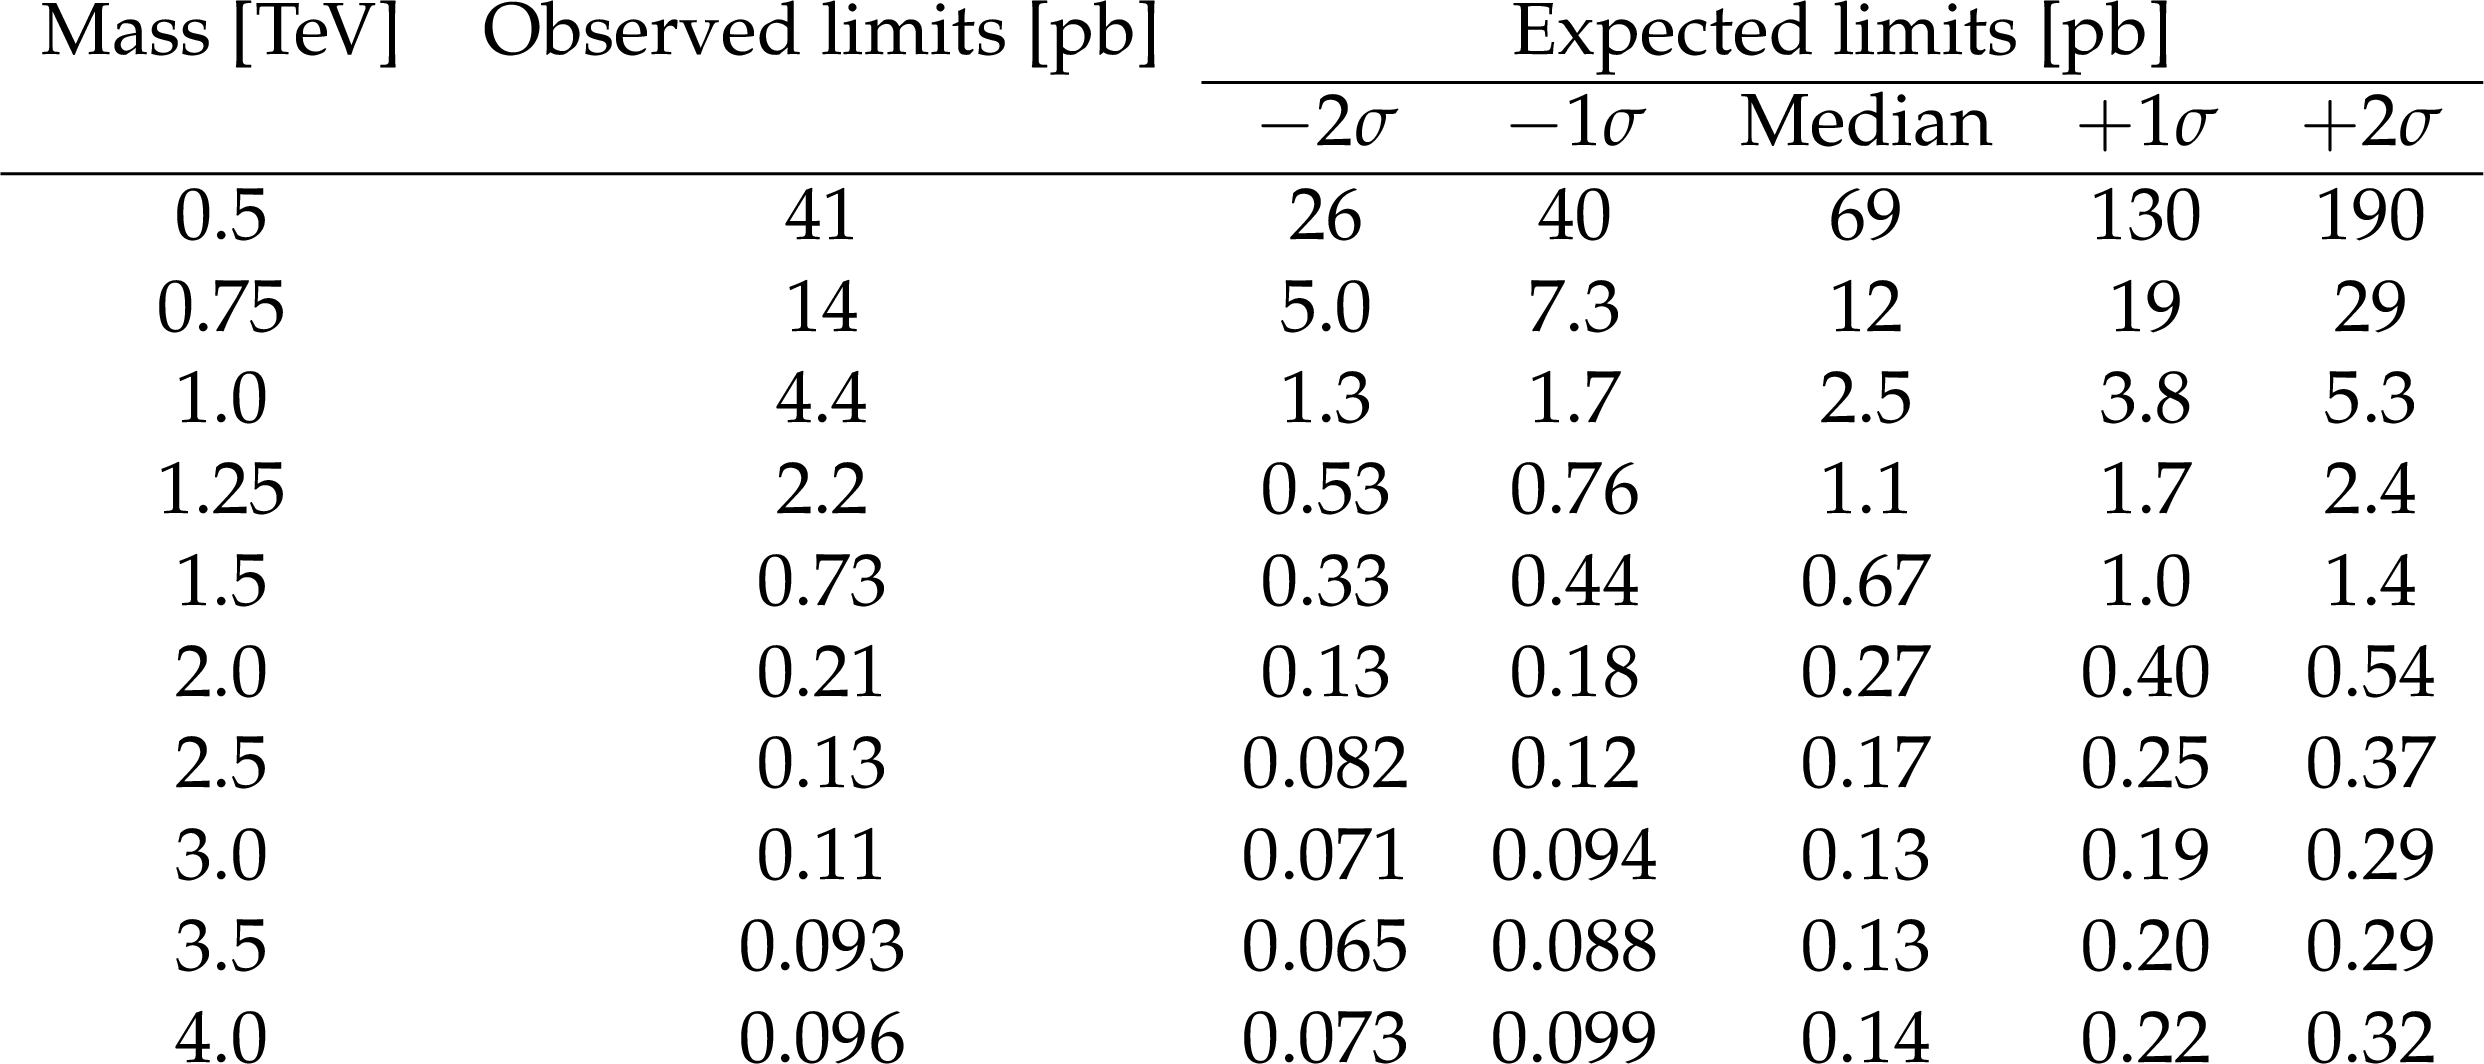
Table 8:
Expected and observed cross section limits at 95% CL, for the 30% width Z' resonance hypothesis. |
png pdf |
Table 9:
Expected and observed cross section limits at 95% CL, for the RS KK gluon hypothesis. |
| Summary |
| The first search for top quark pair resonances in the fully hadronic channel using $\sqrt{s} = $ 13 TeV data was performed using the CMS experiment at the CERN LHC. The search uses a new top-tagging algorithm, optimized for Run 2 analyses, using the jet mass from the modified mass-drop tagger and N-subjettiness jet substructure variables along with subjet b-tagging. The non-top multijet background was estimated using a mistag rate measured in a control region depleted of $\mathrm{ t \bar{t} }$ events. No excess above the standard model expectation is observed, and limits were set on the production cross sections of Z' bosons and RS gluons, for signal models with varying widths. For some signal models, previous limits are eclipsed, excluding Z' bosons with masses up to 3.3 (3.8) TeV, for Z' relative widths of 10% (30%) of their masses. |
| References | ||||
| 1 | J. L. Rosner | Prominent decay modes of a leptophobic Z' | PLB 387 (1996) 113 | hep-ph/9607207 |
| 2 | K. R. Lynch, S. Mrenna, M. Narain, and E. H. Simmons | Finding Z' bosons coupled preferentially to the third family at CERN LEP and the Fermilab Tevatron | PRD 63 (2001) 035006 | hep-ph/0007286 |
| 3 | M. Carena, A. Daleo, B. A. Dobrescu, and T. M. P. Tait | Z' gauge bosons at the Fermilab Tevatron | PRD 70 (2004) 093009 | hep-ph/0408098 |
| 4 | C. T. Hill | Topcolor top quark condensation in a gauge extension of the standard model | PLB 266 (1991) 419 | |
| 5 | R. M. Harris and S. Jain | Cross sections for leptophobic topcolor Z' decaying to top-antitop | EPJC 72 (2012) 2072 | 1112.4928 |
| 6 | C. T. Hill and S. J. Parke | Top production: Sensitivity to new physics | PRD 49 (1994) 4454 | hep-ph/9312324 |
| 7 | C. T. Hill | Topcolor assisted technicolor | PLB 345 (1995) 483 | hep-ph/9411426 |
| 8 | P. H. Frampton and S. L. Glashow | Chiral color: An alternative to the standard model | PLB 190 (1987) 157 | |
| 9 | D. Choudhury, R. M. Godbole, R. K. Singh, and K. Wagh | Top production at the Tevatron/LHC and nonstandard, strongly interacting spin one particles | PLB 657 (2007) 69 | 0705.1499 |
| 10 | R. M. Godbole and D. Choudhury | Nonstandard, strongly interacting spin one $ t \bar{t} $ resonances | in Proceedings, 34th International Conference on High Energy Physics (ICHEP 2008) Philadelphia, 2008 | 0810.3635 |
| 11 | D. Dicus, A. Stange, and S. Willenbrock | Higgs decay to top quarks at hadron colliders | PLB 333 (1994) 126 | hep-ph/9404359 |
| 12 | K. Agashe et al. | CERN LHC signals from warped extra dimensions | PRD 77 (2008) 015003 | hep-ph/0612015 |
| 13 | K. Agashe et al. | CERN LHC signals for warped electroweak neutral gauge bosons | PRD 76 (2007) 115015 | 0709.0007 |
| 14 | H. Davoudiasl, J. L. Hewett, and T. G. Rizzo | Phenomenology of the Randall-Sundrum Gauge Hierarchy Model | PRL 84 (2000) 2080 | hep-ph/9909255 |
| 15 | L. Randall and R. Sundrum | Large Mass Hierarchy from a Small Extra Dimension | PRL 83 (1999) 3370 | hep-ph/9905221 |
| 16 | L. Randall and R. Sundrum | An Alternative to Compactification | PRL 83 (1999) 4690 | hep-th/9906064 |
| 17 | CDF Collaboration | A search for resonant production of $ t \bar{t} $ pairs in 4.8 fb$^{-1}$ of integrated luminosity of $ p\bar{p} $ collisions at $ \sqrt{s}= $ 1.96 TeV | PRD 84 (2011) 072004 | 1107.5063 |
| 18 | D0 Collaboration | Search for a narrow $ t \bar{t} $ resonance in $ {p\bar{p}} $ collisions at $ \sqrt{s}= $ 1.96 TeV | PRD 85 (2012) 051101 | 1111.1271 |
| 19 | CMS Collaboration | Search for anomalous $ \mathrm{ t \bar{t} } $ production in the highly-boosted all-hadronic final state | JHEP 09 (2012) 029 | CMS-EXO-11-006 1204.2488 |
| 20 | ATLAS Collaboration | Search for resonances decaying into top-quark pairs using fully hadronic decays in $ pp $ collisions with ATLAS at $ \sqrt{s}= $ 7 TeV | JHEP 01 (2013) 116 | 1211.2202 |
| 21 | ATLAS Collaboration | A search for $ t \bar{t} $ resonances in the lepton plus jets final state with ATLAS using 4.7 fb$ ^{-1} $ of $ pp $ collisions at $ \sqrt{s}= $ 7 TeV | PRD 88 (2013) 012004 | 1305.2756 |
| 22 | ATLAS Collaboration | A search for $ t \bar{t} $ resonances in lepton+jets events with highly boosted top quarks collected in $ pp $ collisions at $ \sqrt{s}= $ 7 TeV with the ATLAS detector | JHEP 09 (2012) 041 | 1207.2409 |
| 23 | CMS Collaboration | Search for resonant $ \mathrm{ t \bar{t} } $ production in lepton+jets events in pp collisions at $ \sqrt{s}= $ 7 TeV | JHEP 12 (2012) 015 | CMS-TOP-12-017 1209.4397 |
| 24 | CMS Collaboration | Search for Z' resonances decaying to $ t\bar{t} $ in dilepton+jets final states in pp collisions at $ \sqrt{s}= $ 7 TeV | PRD 87 (2013) 072002 | CMS-TOP-11-010 1211.3338 |
| 25 | CMS Collaboration | Searches for new physics using the $ t \bar{t} $ invariant mass distribution in $ pp $ collisions at $ \sqrt{s}= $ 8 TeV | PRL 111 (2013) 211804 | CMS-B2G-13-001 1309.2030 |
| 26 | ATLAS Collaboration | A search for $ \mathrm{ t \bar{t} } $ resonances using lepton-plus-jets events in proton-proton collisions at $ \sqrt{s}= $ 8 TeV with the ATLAS detector | JHEP 08 (2015) 148 | 1505.07018 |
| 27 | CMS Collaboration | Search for resonant $ \mathrm{ t \bar{t} } $ production in proton-proton collisions at $ \sqrt{s}= $ 8 TeV | PRD 93 (2016) 012001 | CMS-B2G-13-008 1506.03062 |
| 28 | G. Altarelli, B. Mele, and M. Ruiz-Altaba | Searching for new heavy vector bosons in $ {p\bar{p}} $ colliders | Z. Phys. C 45 (1989) 109 | |
| 29 | CMS Collaboration | The CMS experiment at the CERN LHC | JINST 3 (2008) S08004 | CMS-00-001 |
| 30 | CMS Collaboration | Particle--Flow Event Reconstruction in CMS and Performance for Jets, Taus, and $ E_{\mathrm{T}}^{\text{miss}} $ | CDS | |
| 31 | CMS Collaboration | Commissioning of the Particle-flow Event Reconstruction with the first LHC collisions recorded in the CMS detector | CDS | |
| 32 | CMS Collaboration | Description and performance of track and primary-vertex reconstruction with the CMS tracker | JINST 9 (2014) P10009 | CMS-TRK-11-001 1405.6569 |
| 33 | CMS Collaboration | Performance of CMS muon reconstruction in pp collision events at $ \sqrt{s}= $ 7 TeV | JINST 7 (2012) P10002 | CMS-MUO-10-004 1206.4071 |
| 34 | CMS Collaboration | Performance of electron reconstruction and selection with the CMS Detector in proton-proton collisions at $ \sqrt{s}= $ 8 TeV | JINST 10 (2015) P06005 | CMS-EGM-13-001 1502.02701 |
| 35 | M. Cacciari, G. P. Salam, and G. Soyez | The anti-$ k_t $ jet clustering algorithm | JHEP 04 (2008) 063 | 0802.1189 |
| 36 | M. Cacciari, G. P. Salam, and G. Soyez | FastJet user manual | EPJC 72 (2012) 1896 | 1111.6097 |
| 37 | M. Cacciari, G. P. Salam, and G. Soyez | The catchment area of jets | JHEP 04 (2008) 005 | 0802.1188 |
| 38 | CMS Collaboration | Determination of jet energy calibration and transverse momentum resolution in CMS | JINST 6 (2011) P11002 | CMS-JME-10-011 1107.4277 |
| 39 | CMS Collaboration | Identification of b-quark jets with the CMS experiment | JINST 8 (2013) P04013 | CMS-BTV-12-001 1211.4462 |
| 40 | CMS Collaboration | Identification of b quark jets at the CMS experiment in the LHC Run 2 | CMS-PAS-BTV-15-001 | CMS-PAS-BTV-15-001 |
| 41 | CMS Collaboration | Top Tagging with New Approaches | CDS | |
| 42 | Y. L. Dokshitzer, G. D. Leder, S. Moretti, and B. R. Webber | Better jet clustering algorithms | JHEP 08 (1997) 001 | hep-ph/9707323 |
| 43 | M. Wobisch and T. Wengler | Hadronization corrections to jet cross sections in deep- inelastic scattering | hep-ph/9907280 | |
| 44 | M. Dasgupta, A. Fregoso, S. Marzani, and G. P. Salam | Towards an understanding of jet substructure | JHEP 09 (2013) 029 | 1307.0007 |
| 45 | A. J. Larkoski, S. Marzani, G. Soyez, and J. Thaler | Soft drop | JHEP 05 (2014) 146 | 1402.2657 |
| 46 | J. Thaler and K. Van Tilburg | Identifying boosted objects with N-subjettiness | JHEP 03 (2011) 015 | 1011.2268 |
| 47 | J. Thaler and K. Van Tilburg | Maximizing boosted top identification by minimizing $ N $-subjettiness | JHEP 02 (2012) 093 | 1108.2701 |
| 48 | J. Alwall et al. | The automated computation of tree-level and next-to-leading order differential cross sections, and their matching to parton shower simulations | JHEP 07 (2014) 079 | 1405.0301 |
| 49 | T. Sjostrand, S. Mrenna, and P. Z. Skands | PYTHIA 6.4 physics and manual | JHEP 05 (2006) 026 | hep-ph/0603175 |
| 50 | T. Sjostrand et al. | An introduction to PYTHIA 8.2 | CPC 191 (2015) 159 | 1410.3012 |
| 51 | M. L. Mangano, M. Moretti, F. Piccinini, and M. Treccani | Matching matrix elements and shower evolution for top-quark production in hadronic collisions | JHEP 01 (2007) 013 | hep-ph/0611129 |
| 52 | P. Nason | A new method for combining NLO QCD with shower Monte Carlo algorithms | JHEP 11 (2004) 040 | hep-ph/0409146 |
| 53 | S. Frixione, P. Nason, and C. Oleari | Matching NLO QCD computations with Parton Shower simulations: the POWHEG method | JHEP 11 (2007) 070 | 0709.2092 |
| 54 | S. Alioli, P. Nason, C. Oleari, and E. Re | A general framework for implementing NLO calculations in shower Monte Carlo programs: the POWHEG BOX | JHEP 06 (2010) 043 | 1002.2581 |
| 55 | S. Frixione, P. Nason, and G. Ridolfi | A positive-weight next-to-leading-order Monte Carlo for heavy flavour hadroproduction | JHEP 09 (2007) 126 | 0707.3088 |
| 56 | E. Re | Single-top Wt-channel production matched with parton showers using the POWHEG method | EPJC 71 (2011) 1547 | 1009.2450 |
| 57 | M. Czakon and A. Mitov | Top++: A program for the calculation of the top-pair cross-section at hadron colliders | CPC 185 (2014) 2930 | 1112.5675 |
| 58 | Y. Li and F. Petriello | Combining QCD and electroweak corrections to dilepton production in FEWZ | PRD 86 (2012) 094034 | 1208.5967 |
| 59 | P. Kant et al. | HatHor for single top-quark production: Updated predictions and uncertainty estimates for single top-quark production in hadronic collisions | CPC 191 (2015) 74 | 1406.4403 |
| 60 | N. Kidonakis | NNLL threshold resummation for top-pair and single-top production | Phys. Part. Nucl. 45 (2014) 714 | 1210.7813 |
| 61 | J. M. Campbell and R. K. Ellis | MCFM for the Tevatron and the LHC | NPPS 205 (2010) 10 | 1007.3492 |
| 62 | NNPDF Collaboration | Parton distributions for the LHC Run II | JHEP 04 (2015) 040 | 1410.8849 |
| 63 | CMS Collaboration | Event generator tunes obtained from underlying event and multiparton scattering measurements | EPJC 76 (2016) 155 | CMS-GEN-14-001 1512.00815 |
| 64 | P. Skands, S. Carrazza, and J. Rojo | Tuning PYTHIA 8.1: the Monash 2013 Tune | EPJC 74 (2014) 3024 | 1404.5630 |
| 65 | T. Muller, J. Ott, and J. Wagner-Kuhr | theta - a framework for template-based modeling and inference | 2010 | |
| 66 | J. M. Campbell, R. K. Ellis, and C. Williams | Vector boson pair production at the LHC | JHEP 07 (2011) 018 | 1105.0020 |
| 67 | T. Gehrmann et al. | $ W^+W^- $ Production at Hadron Colliders in Next-to-Next-to-Leading-Order QCD | PRL 113 (2014) 212001 | 1408.5243 |
| 68 | N. Kidonakis | Top Quark Production | Proceedings, Helmholtz International Summer School on Physics of Heavy Quarks and Hadrons (HQ 2013) 2014 | 1311.0283 |
| 69 | M. Aliev et al. | HATHOR: HAdronic Top and Heavy quarks crOss section calculatoR | CPC 182 (2011) 1034 | 1007.1327 |
| 70 | M. Botje et al. | The PDF4LHC Working Group Interim Recommendations | 1101.0538 | |
| 71 | CMS Collaboration | CMS Luminosity Measurement for the 2015 Data Taking Period | CMS-PAS-LUM-15-001 | CMS-PAS-LUM-15-001 |
| 72 | CMS Collaboration | Measurement of the inelastic proton-proton cross section at $ \sqrt{s}= $ 13 TeV | CMS-PAS-FSQ-15-005 | CMS-PAS-FSQ-15-005 |
| 73 | A. O'Hagan and J. J. Forster | Bayesian Inference | Kendall's Advanced Theory of Statistics, volume 2B, Arnold, London | |
| 74 | R. J. Barlow and C. Beeston | Fitting using finite Monte Carlo samples | CPC 77 (1993) 219 | |
| 75 | R. Bonciani et al. | Electroweak top-quark pair production at the LHC with Z' bosons to NLO QCD in POWHEG | JHEP 02 (2016) 141 | 1511.08185 |
| 76 | J. Gao et al. | Next-to-leading order QCD corrections to the heavy resonance production and decay into top quark pair at the LHC | PRD 82 (2010) 014020 | 1004.0876 |
|
|
Compact Muon Solenoid LHC, CERN |
|

|

|

|

|

|