

Compact Muon Solenoid
LHC, CERN
| CMS-BPH-15-004 ; CERN-EP-2016-198 | ||
| Measurement of the differential inclusive $\mathrm{B^{+}}$ hadron cross sections in pp collisions at $\sqrt{s} = $ 13 TeV | ||
| CMS Collaboration | ||
| 4 September 2016 | ||
| Phys. Lett. B 771 (2017) 435 | ||
| Abstract: The differential cross sections for inclusive production of $\mathrm{B^{+}}$ hadrons are measured as a function of the $\mathrm{B^{+}}$ transverse momentum ${p_{\mathrm{T}}}^{\mathrm{B}}$ and rapidity $y^{\mathrm{B}}$ in pp collisions at a centre-of-mass energy of 13 TeV, using data collected by the CMS experiment that correspond to an integrated luminosity of 48.1 pb$^{-1}$. The measurement uses the exclusive decay channel $\mathrm{B^{+}} \to \mathrm{J}/\psi \mathrm{K^{+}}$, with $\mathrm{J}/\psi$ mesons that decay to a pair of muons. The results show a reasonable agreement with theoretical calculations within the uncertainties. | ||
| Links: e-print arXiv:1609.00873 [hep-ex] (PDF) ; CDS record ; inSPIRE record ; HepData record ; CADI line (restricted) ; | ||
| Figures | |

png pdf |
Figure 1:
Invariant mass distribution of $\mathrm{B^{+}} \to \mathrm{J}/\psi \mathrm{K^{+}} $ candidates, integrated over the phase-space region of 10 $ \le {p_{\mathrm {T}}} ^{{\mathrm{B}}} < $ 17 GeV and $ { | y^{{\mathrm{B}}} | } < 1.45$, and of $17 \le {p_{\mathrm {T}}} ^{{\mathrm{B}}} < $ 100 GeV and $ { | y^{{\mathrm{B}}} | } < 2.1$. The solid curve shows the result of the fit. The shaded and hatched areas represent, respectively, the $\mathrm{J}/\psi \mathrm{K^{+}} $ signal and the $\mathrm{J}/\psi \pi^{+} $ component, while the dashed and dotted curves represent the combinatorial and misreconstructed ${\mathrm{B}} \to \mathrm{J}/\psi $ + hadrons backgrounds, respectively. |
png pdf |
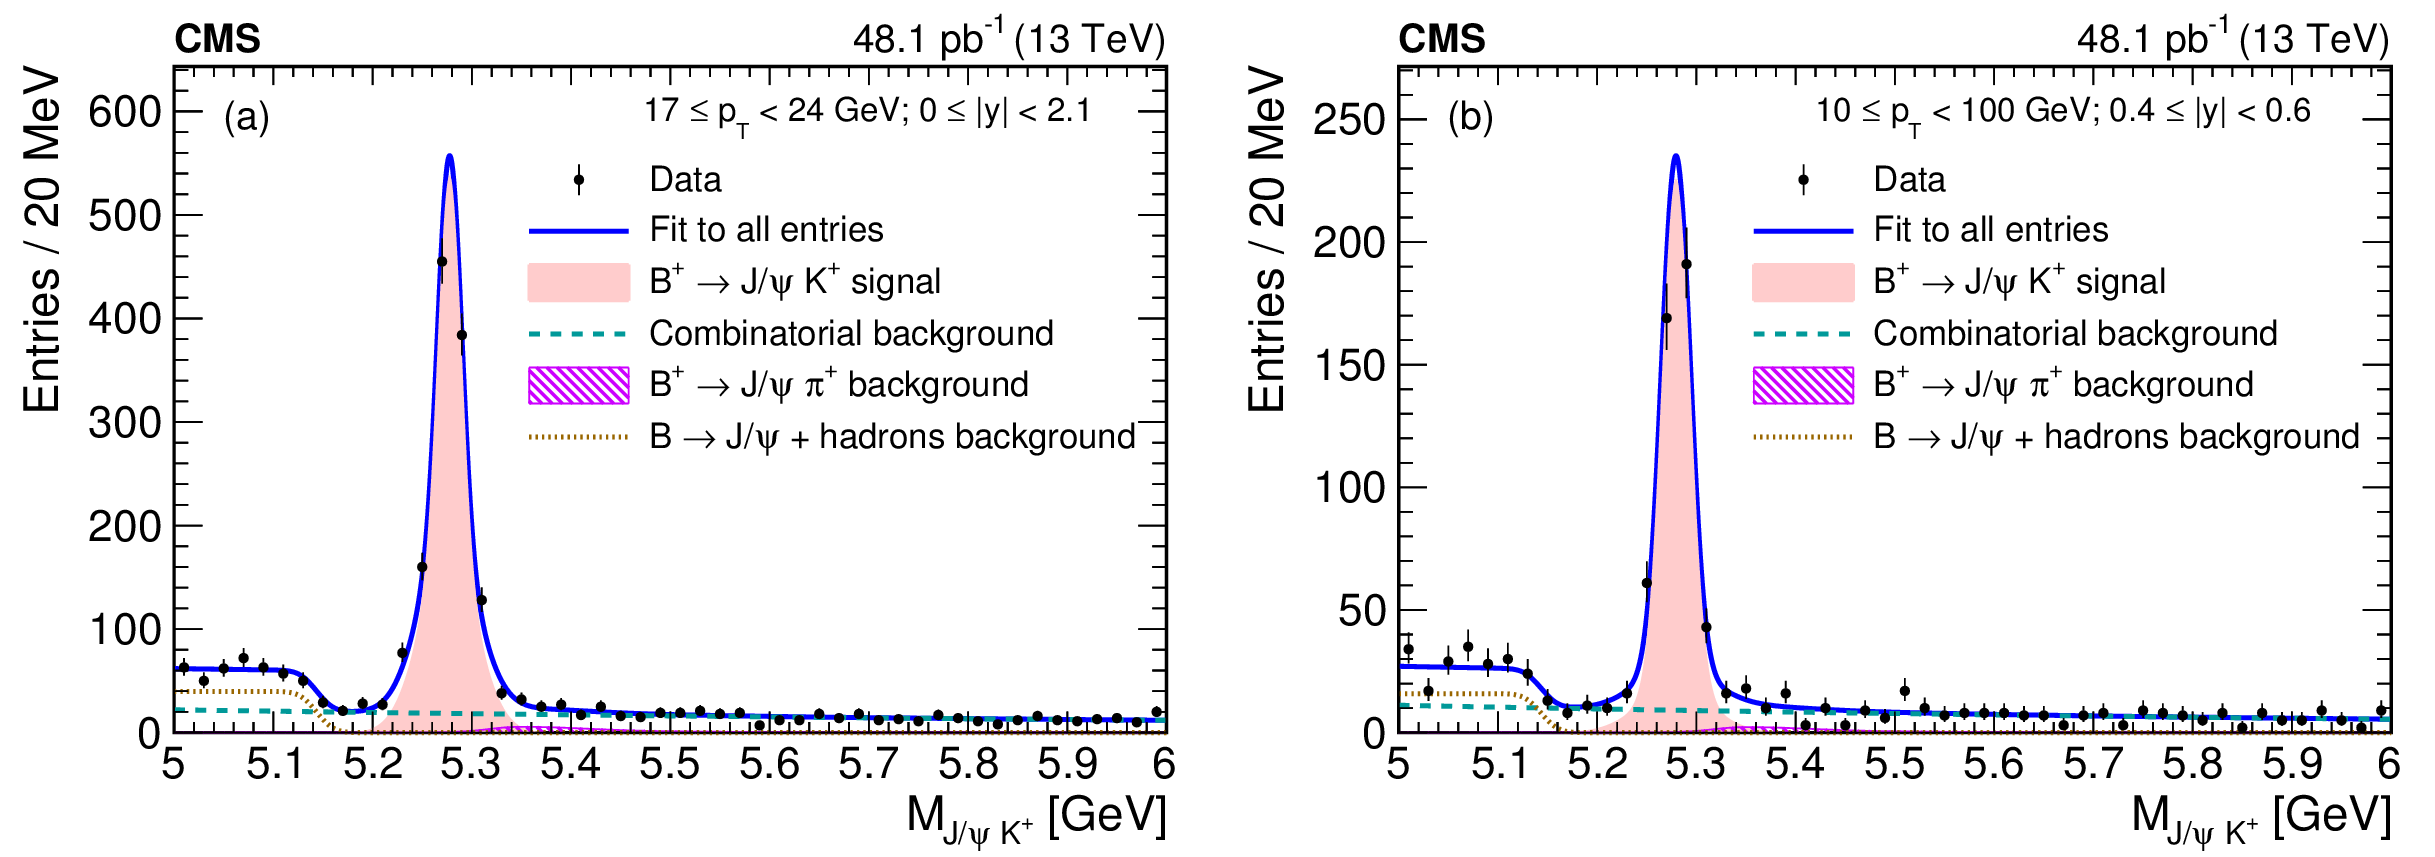
Figure 2:
Invariant mass distributions of the $\mathrm{B^{+}} \to \mathrm{J}/\psi \mathrm{K^{+}} $ candidates in the regions of (a) 17 $ \le {p_{\mathrm {T}}} ^{{\mathrm{B}}} < $ 24 GeV, $ { | y^{{\mathrm{B}}} | } < $ 2.1, and (b) 10 $ \le {p_{\mathrm {T}}} ^{{\mathrm{B}}} < $ 100 GeV, 0.4 $ \le { | y^{{\mathrm{B}}} | } < $ 0.6. The solid curve shows the result of the fit. The shaded (hatched) area represents the signal ($\mathrm{B^{+}} \to \mathrm{J}/\psi \pi^{+} $) component, while the dashed and dotted curves represent the combinatorial and misreconstructed $ {\mathrm{B}} \to \mathrm{J}/\psi $ + hadrons background components, respectively. |
png pdf |
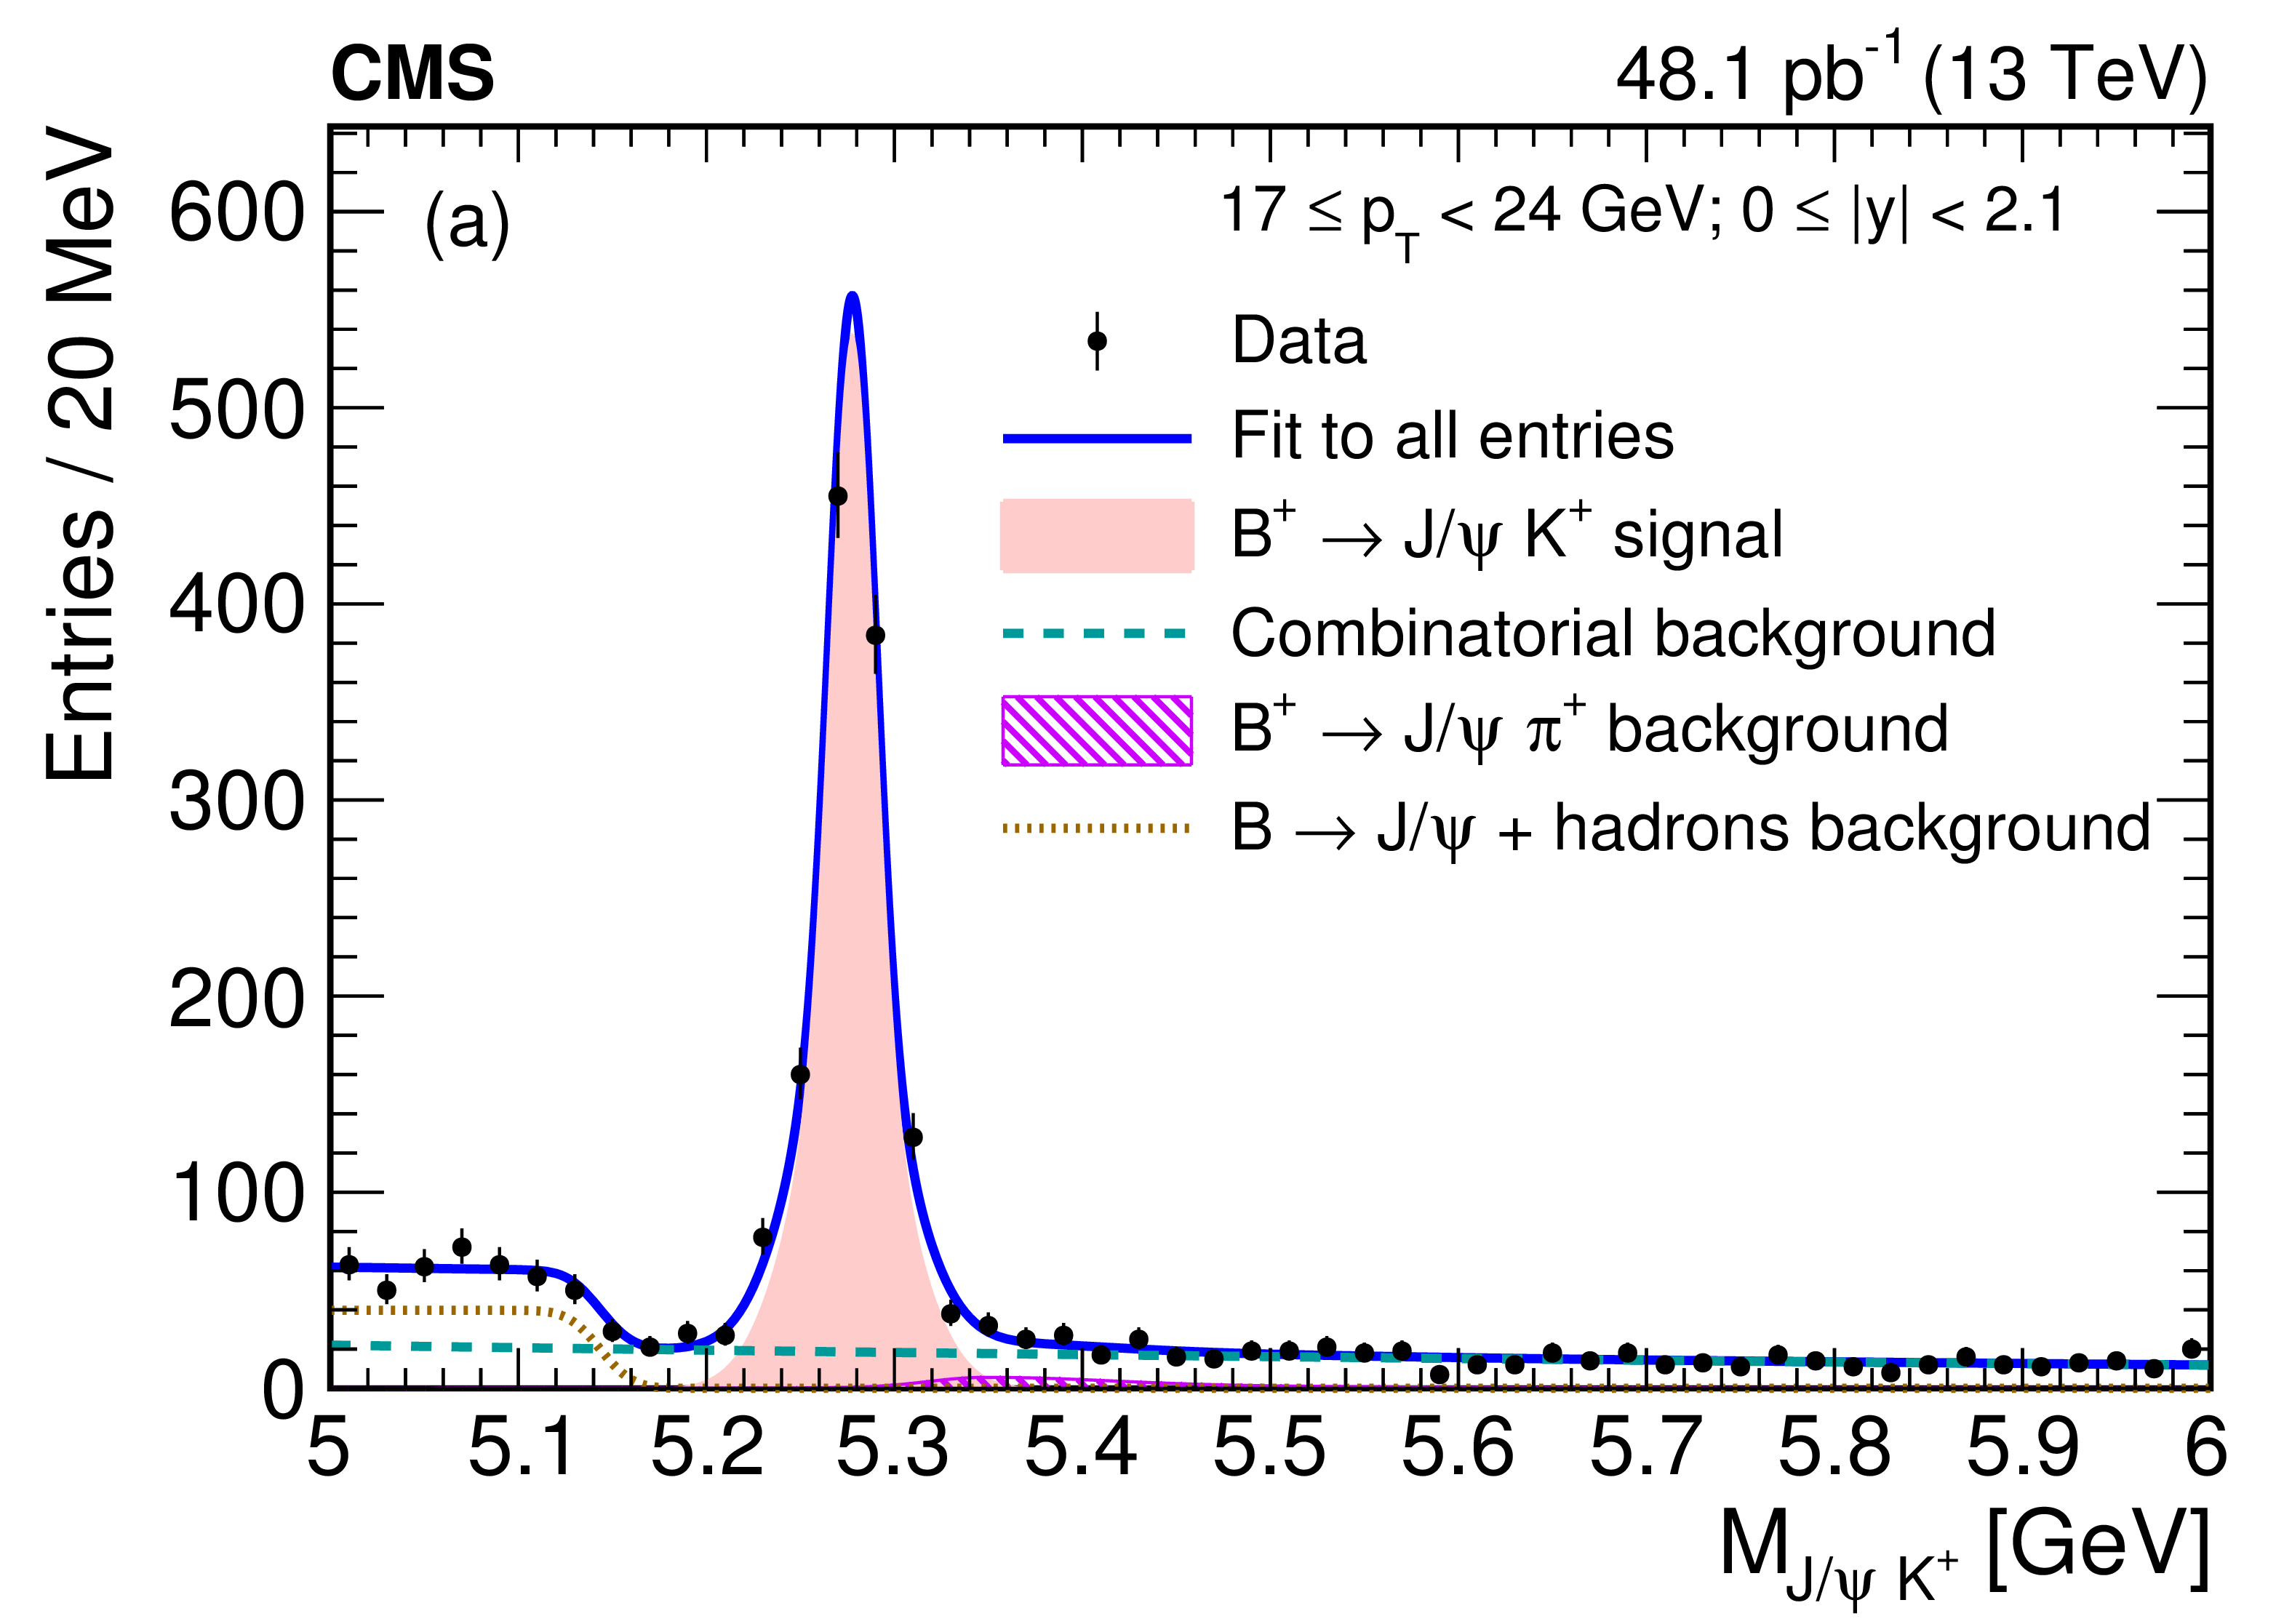
Figure 2-a:
Invariant mass distributions of the $\mathrm{B^{+}} \to \mathrm{J}/\psi \mathrm{K^{+}} $ candidates in the regions of 17 $ \le {p_{\mathrm {T}}} ^{{\mathrm{B}}} < $ 24 GeV, $ { | y^{{\mathrm{B}}} | } < $ 2.1. The solid curve shows the result of the fit. The shaded (hatched) area represents the signal ($\mathrm{B^{+}} \to \mathrm{J}/\psi \pi^{+} $) component, while the dashed and dotted curves represent the combinatorial and misreconstructed $ {\mathrm{B}} \to \mathrm{J}/\psi $ + hadrons background components, respectively. |

png pdf |
Figure 2-b:
Invariant mass distributions of the $\mathrm{B^{+}} \to \mathrm{J}/\psi \mathrm{K^{+}} $ candidates in the regions of 10 $ \le {p_{\mathrm {T}}} ^{{\mathrm{B}}} < $ 100 GeV, 0.4 $ \le { | y^{{\mathrm{B}}} | } < $ 0.6. The solid curve shows the result of the fit. The shaded (hatched) area represents the signal ($\mathrm{B^{+}} \to \mathrm{J}/\psi \pi^{+} $) component, while the dashed and dotted curves represent the combinatorial and misreconstructed $ {\mathrm{B}} \to \mathrm{J}/\psi $ + hadrons background components, respectively. |

png pdf |
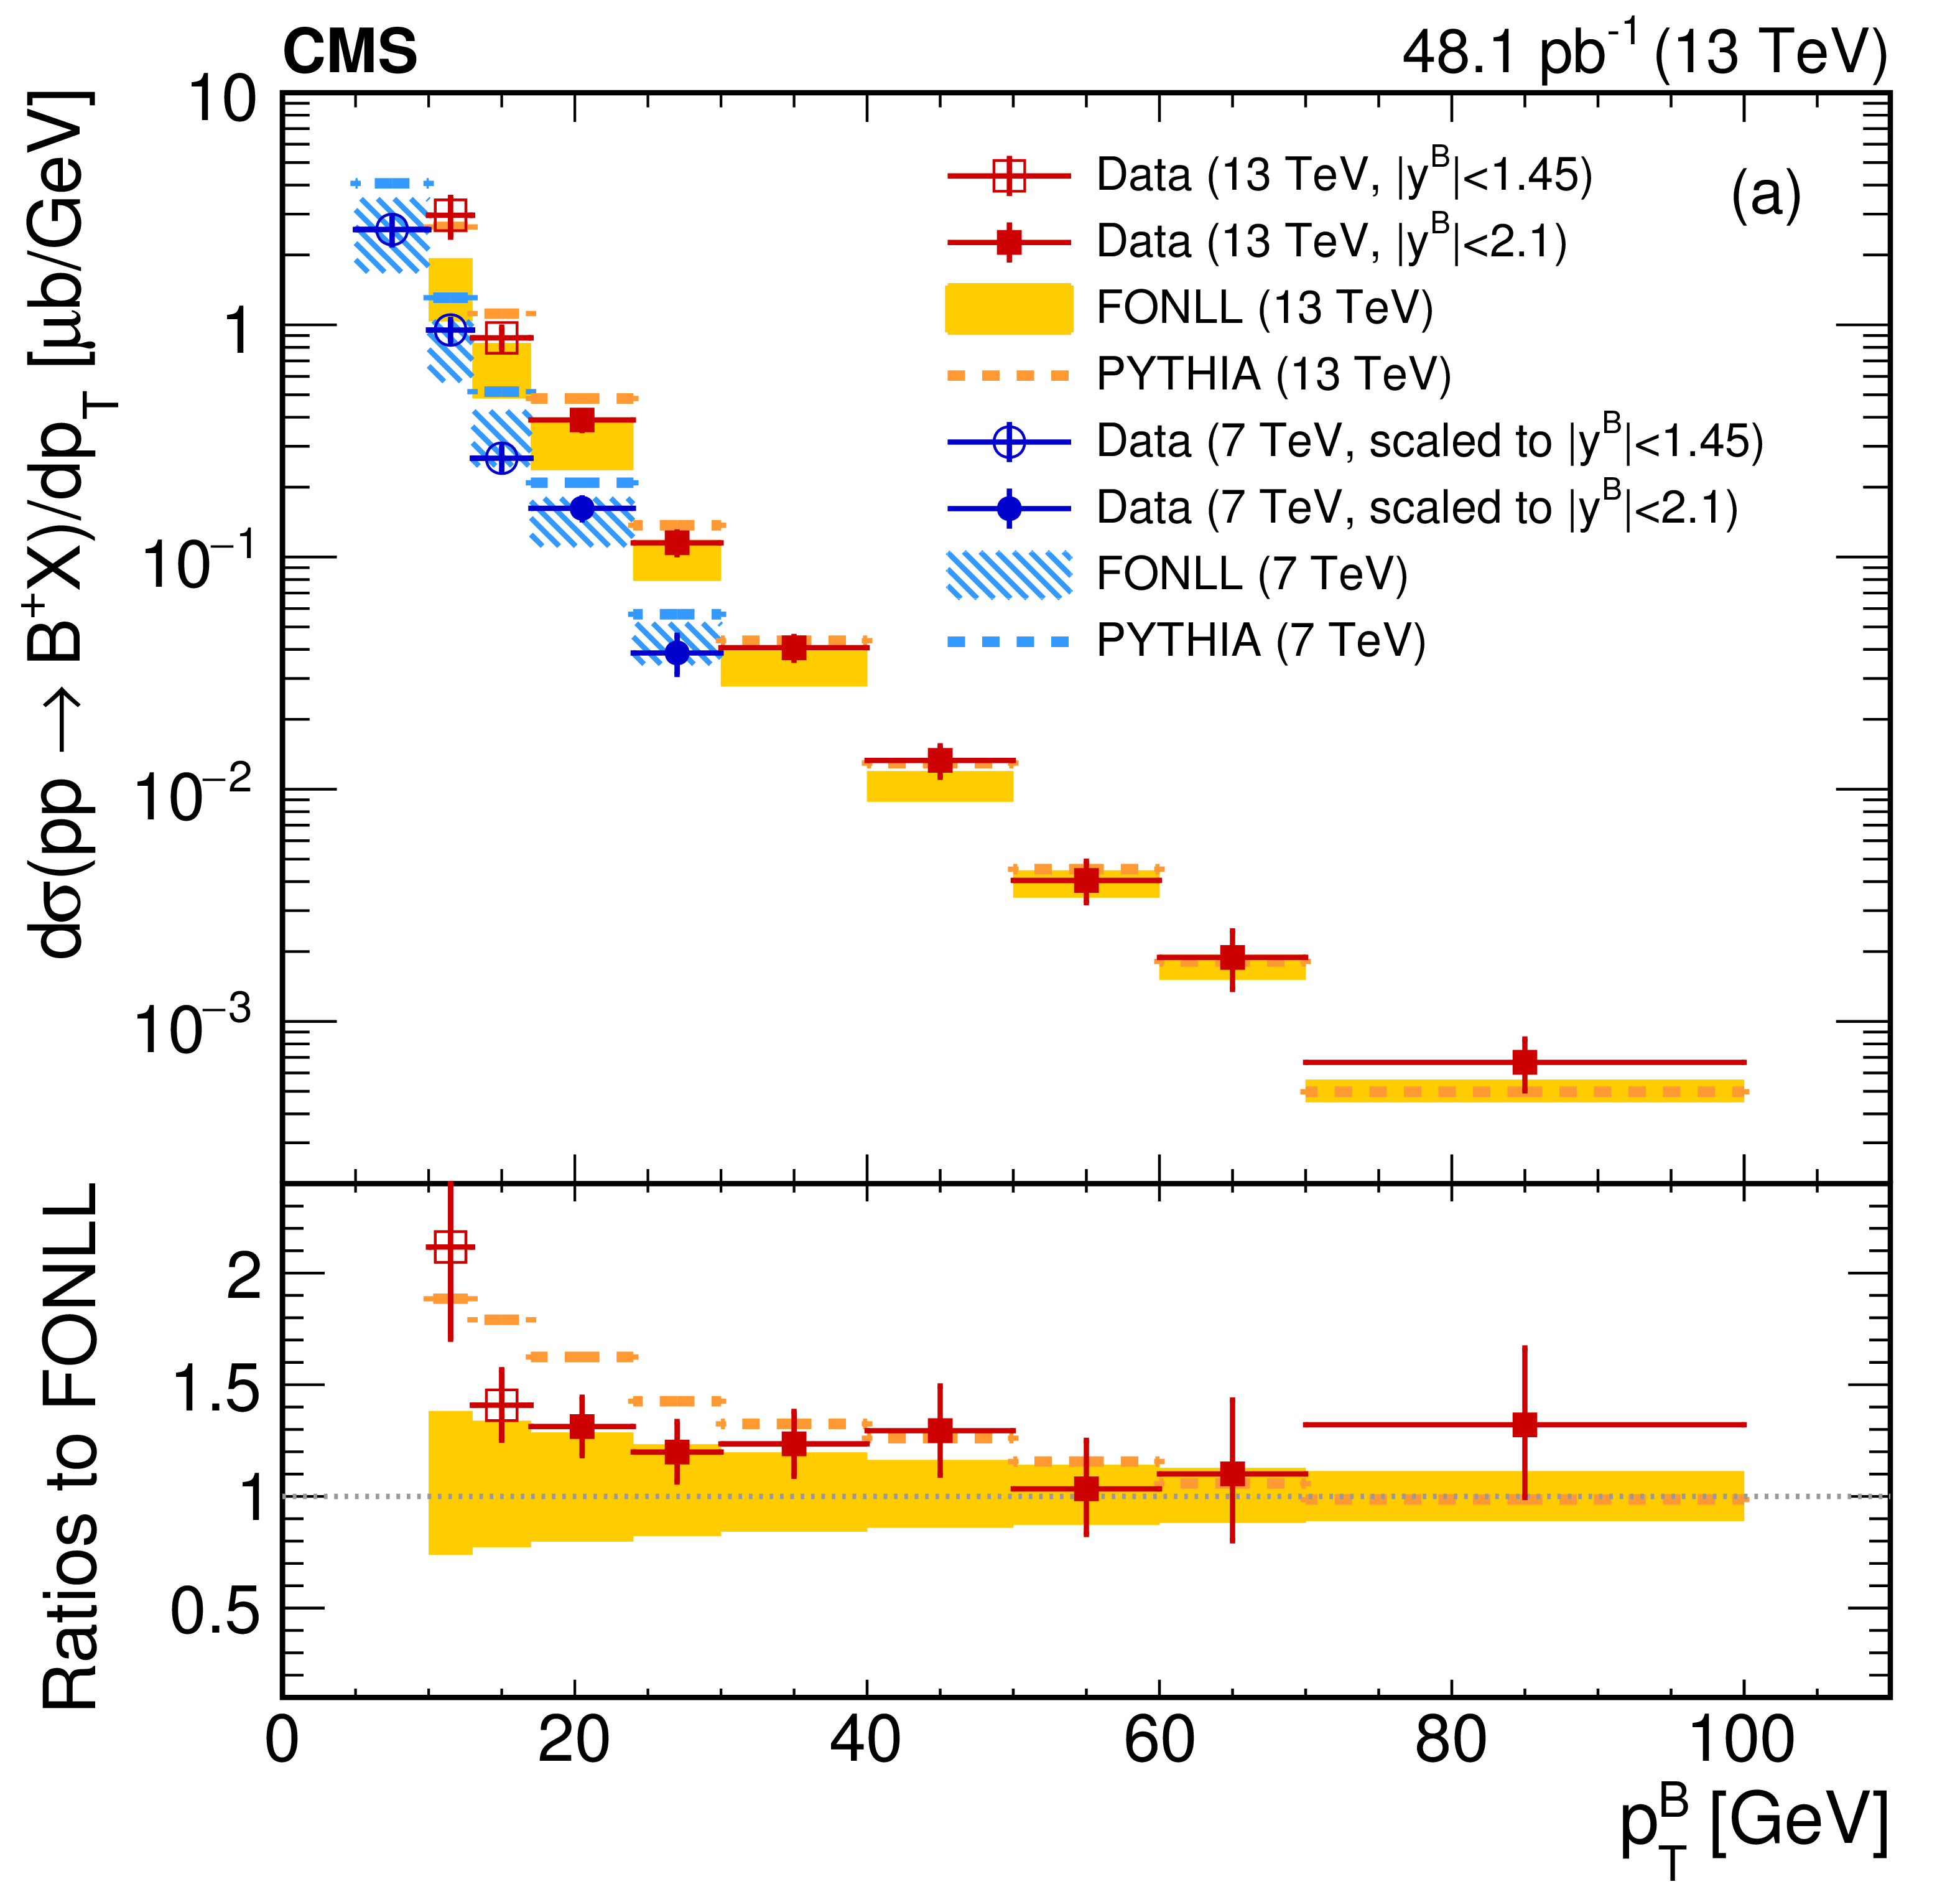
Figure 3:
$\mathrm{B^{+}} $ differential production cross sections (a) $ {\mathrm {d}}\sigma / {\mathrm {d}} {p_{\mathrm {T}}} ^{{\mathrm{B}}}$ for $ { | y^{{\mathrm{B}}} | } < $ 1.45 or $ { | y^{{\mathrm{B}}} | } < $ 2.1, and (b) $ {\mathrm {d}}\sigma / {\mathrm {d}}y^{{\mathrm{B}}}$ for 10 $ < {p_{\mathrm {T}}} ^{{\mathrm{B}}} < $ 100 GeV or 17 $ < {p_{\mathrm {T}}} ^{{\mathrm{B}}} < $ 100 GeV, at $\sqrt {s} = $ 13 TeV (squares, this measurement). The previous CMS measurements from $\sqrt {s} = $ 7 TeV data [11] (circles) are also presented as a function of $ {p_{\mathrm {T}}} ^{{\mathrm{B}}}$ ($y^{{\mathrm{B}}}$), scaled to the phase-space region of $ { | y^{{\mathrm{B}}} | } < $ 2.1 or $ { | y^{{\mathrm{B}}} | } < $ 1.45 (10 $ < {p_{\mathrm {T}}} ^{{\mathrm{B}}} < $ 100 GeV or 17 $ < {p_{\mathrm {T}}} ^{{\mathrm{B}}} < $ 100 GeV). The vertical bars show the total uncertainty in the measured cross sections, and the horizontal bars represent the bin width. The calculations from FONLL and PYTHIA are shown as shaded boxes and dashed lines, respectively. The bottom panels display the ratio of the data at 13 TeV to the FONLL predictions (points) and the ratios of the PYTHIA to the FONLL calculations (dashed lines), with the shaded region displaying the uncertainties in the FONLL predictions. |
png pdf |
Figure 3-a:
$\mathrm{B^{+}} $ differential production cross sections $ {\mathrm {d}}\sigma / {\mathrm {d}} {p_{\mathrm {T}}} ^{{\mathrm{B}}}$ for $ { | y^{{\mathrm{B}}} | } < $ 1.45 or $ { | y^{{\mathrm{B}}} | } < $ 2.1, at $\sqrt {s} = $ 13 TeV (squares, this measurement). The previous CMS measurements from $\sqrt {s} = $ 7 TeV data [11] (circles) are also presented as a function of $ {p_{\mathrm {T}}} ^{{\mathrm{B}}}$ ($y^{{\mathrm{B}}}$), scaled to the phase-space region of $ { | y^{{\mathrm{B}}} | } < $ 2.1 or $ { | y^{{\mathrm{B}}} | } < $ 1.45 (10 $ < {p_{\mathrm {T}}} ^{{\mathrm{B}}} < $ 100 GeV or 17 $ < {p_{\mathrm {T}}} ^{{\mathrm{B}}} < $ 100 GeV). The vertical bars show the total uncertainty in the measured cross sections, and the horizontal bars represent the bin width. The calculations from FONLL and PYTHIA are shown as shaded boxes and dashed lines, respectively. The bottom panels display the ratio of the data at 13 TeV to the FONLL predictions (points) and the ratios of the PYTHIA to the FONLL calculations (dashed lines), with the shaded region displaying the uncertainties in the FONLL predictions. |

png pdf |
Figure 3-b:
$\mathrm{B^{+}} $ differential production cross sections $ {\mathrm {d}}\sigma / {\mathrm {d}}y^{{\mathrm{B}}}$ for 10 $ < {p_{\mathrm {T}}} ^{{\mathrm{B}}} < $ 100 GeV or 17 $ < {p_{\mathrm {T}}} ^{{\mathrm{B}}} < $ 100 GeV, at $\sqrt {s} = $ 13 TeV (squares, this measurement). The previous CMS measurements from $\sqrt {s} = $ 7 TeV data [11] (circles) are also presented as a function of $ {p_{\mathrm {T}}} ^{{\mathrm{B}}}$ ($y^{{\mathrm{B}}}$), scaled to the phase-space region of $ { | y^{{\mathrm{B}}} | } < $ 2.1 or $ { | y^{{\mathrm{B}}} | } < $ 1.45 (10 $ < {p_{\mathrm {T}}} ^{{\mathrm{B}}} < $ 100 GeV or 17 $ < {p_{\mathrm {T}}} ^{{\mathrm{B}}} < $ 100 GeV). The vertical bars show the total uncertainty in the measured cross sections, and the horizontal bars represent the bin width. The calculations from FONLL and PYTHIA are shown as shaded boxes and dashed lines, respectively. The bottom panels display the ratio of the data at 13 TeV to the FONLL predictions (points) and the ratios of the PYTHIA to the FONLL calculations (dashed lines), with the shaded region displaying the uncertainties in the FONLL predictions. |

png pdf |
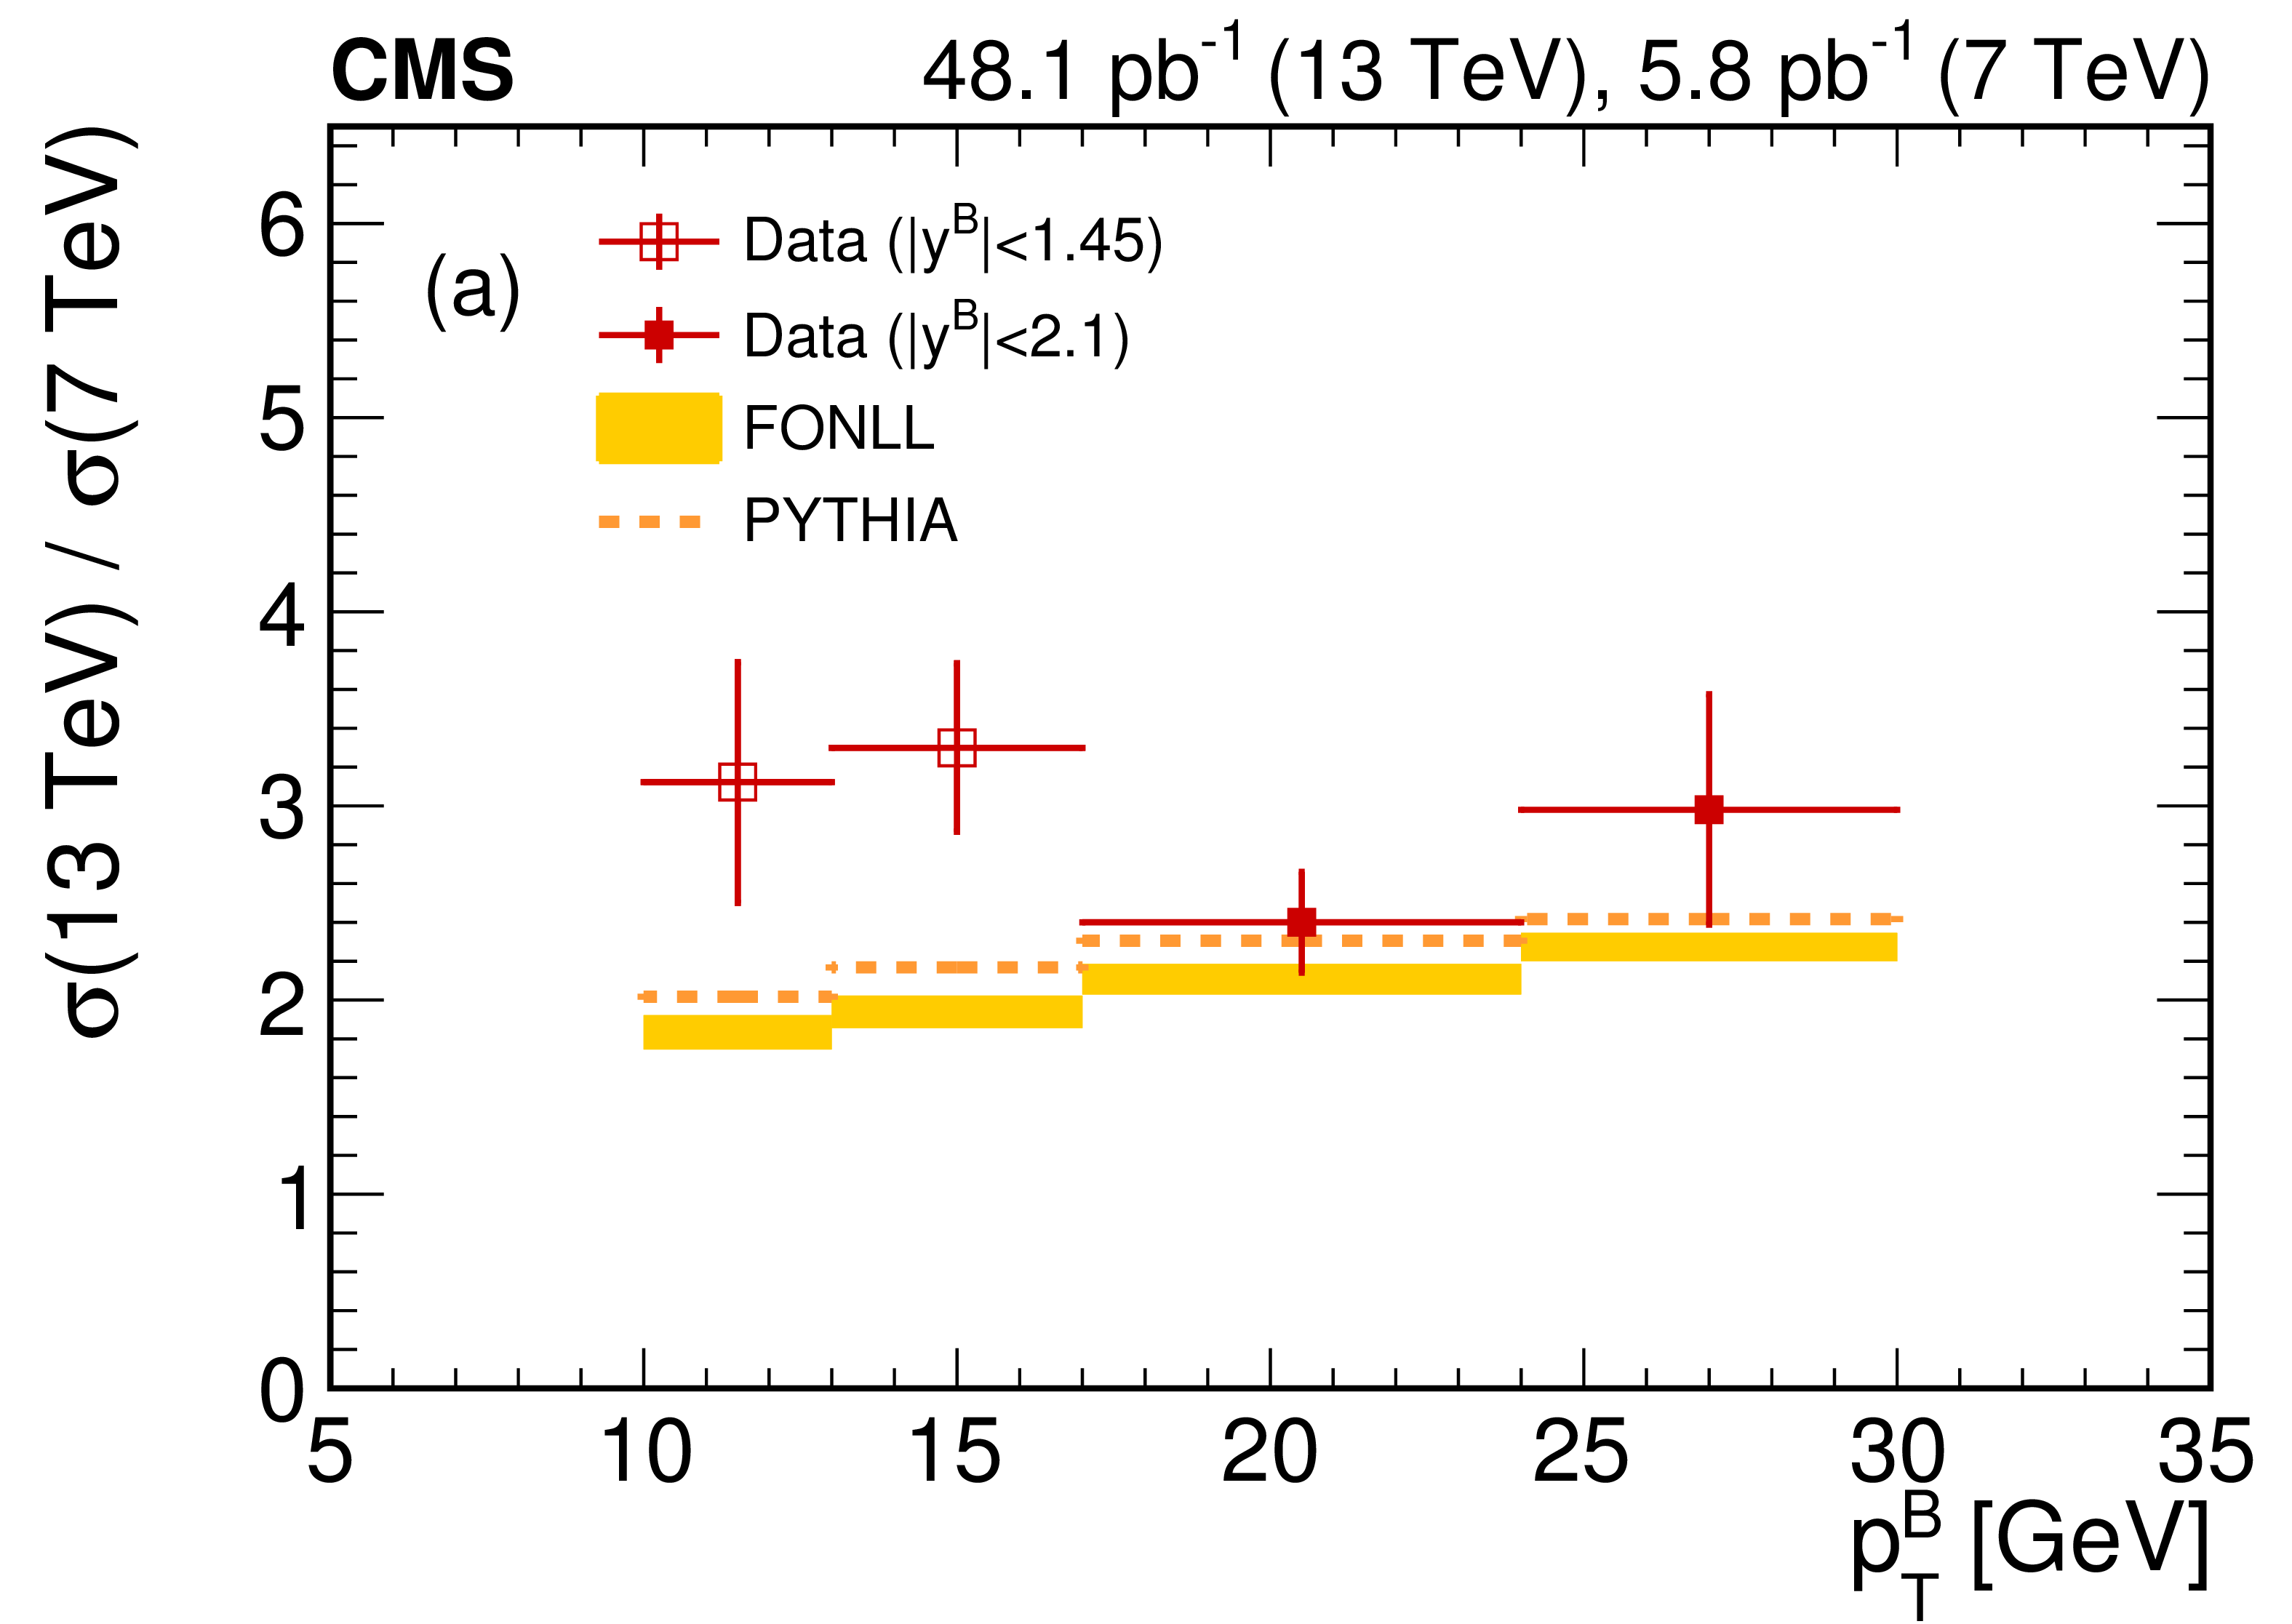
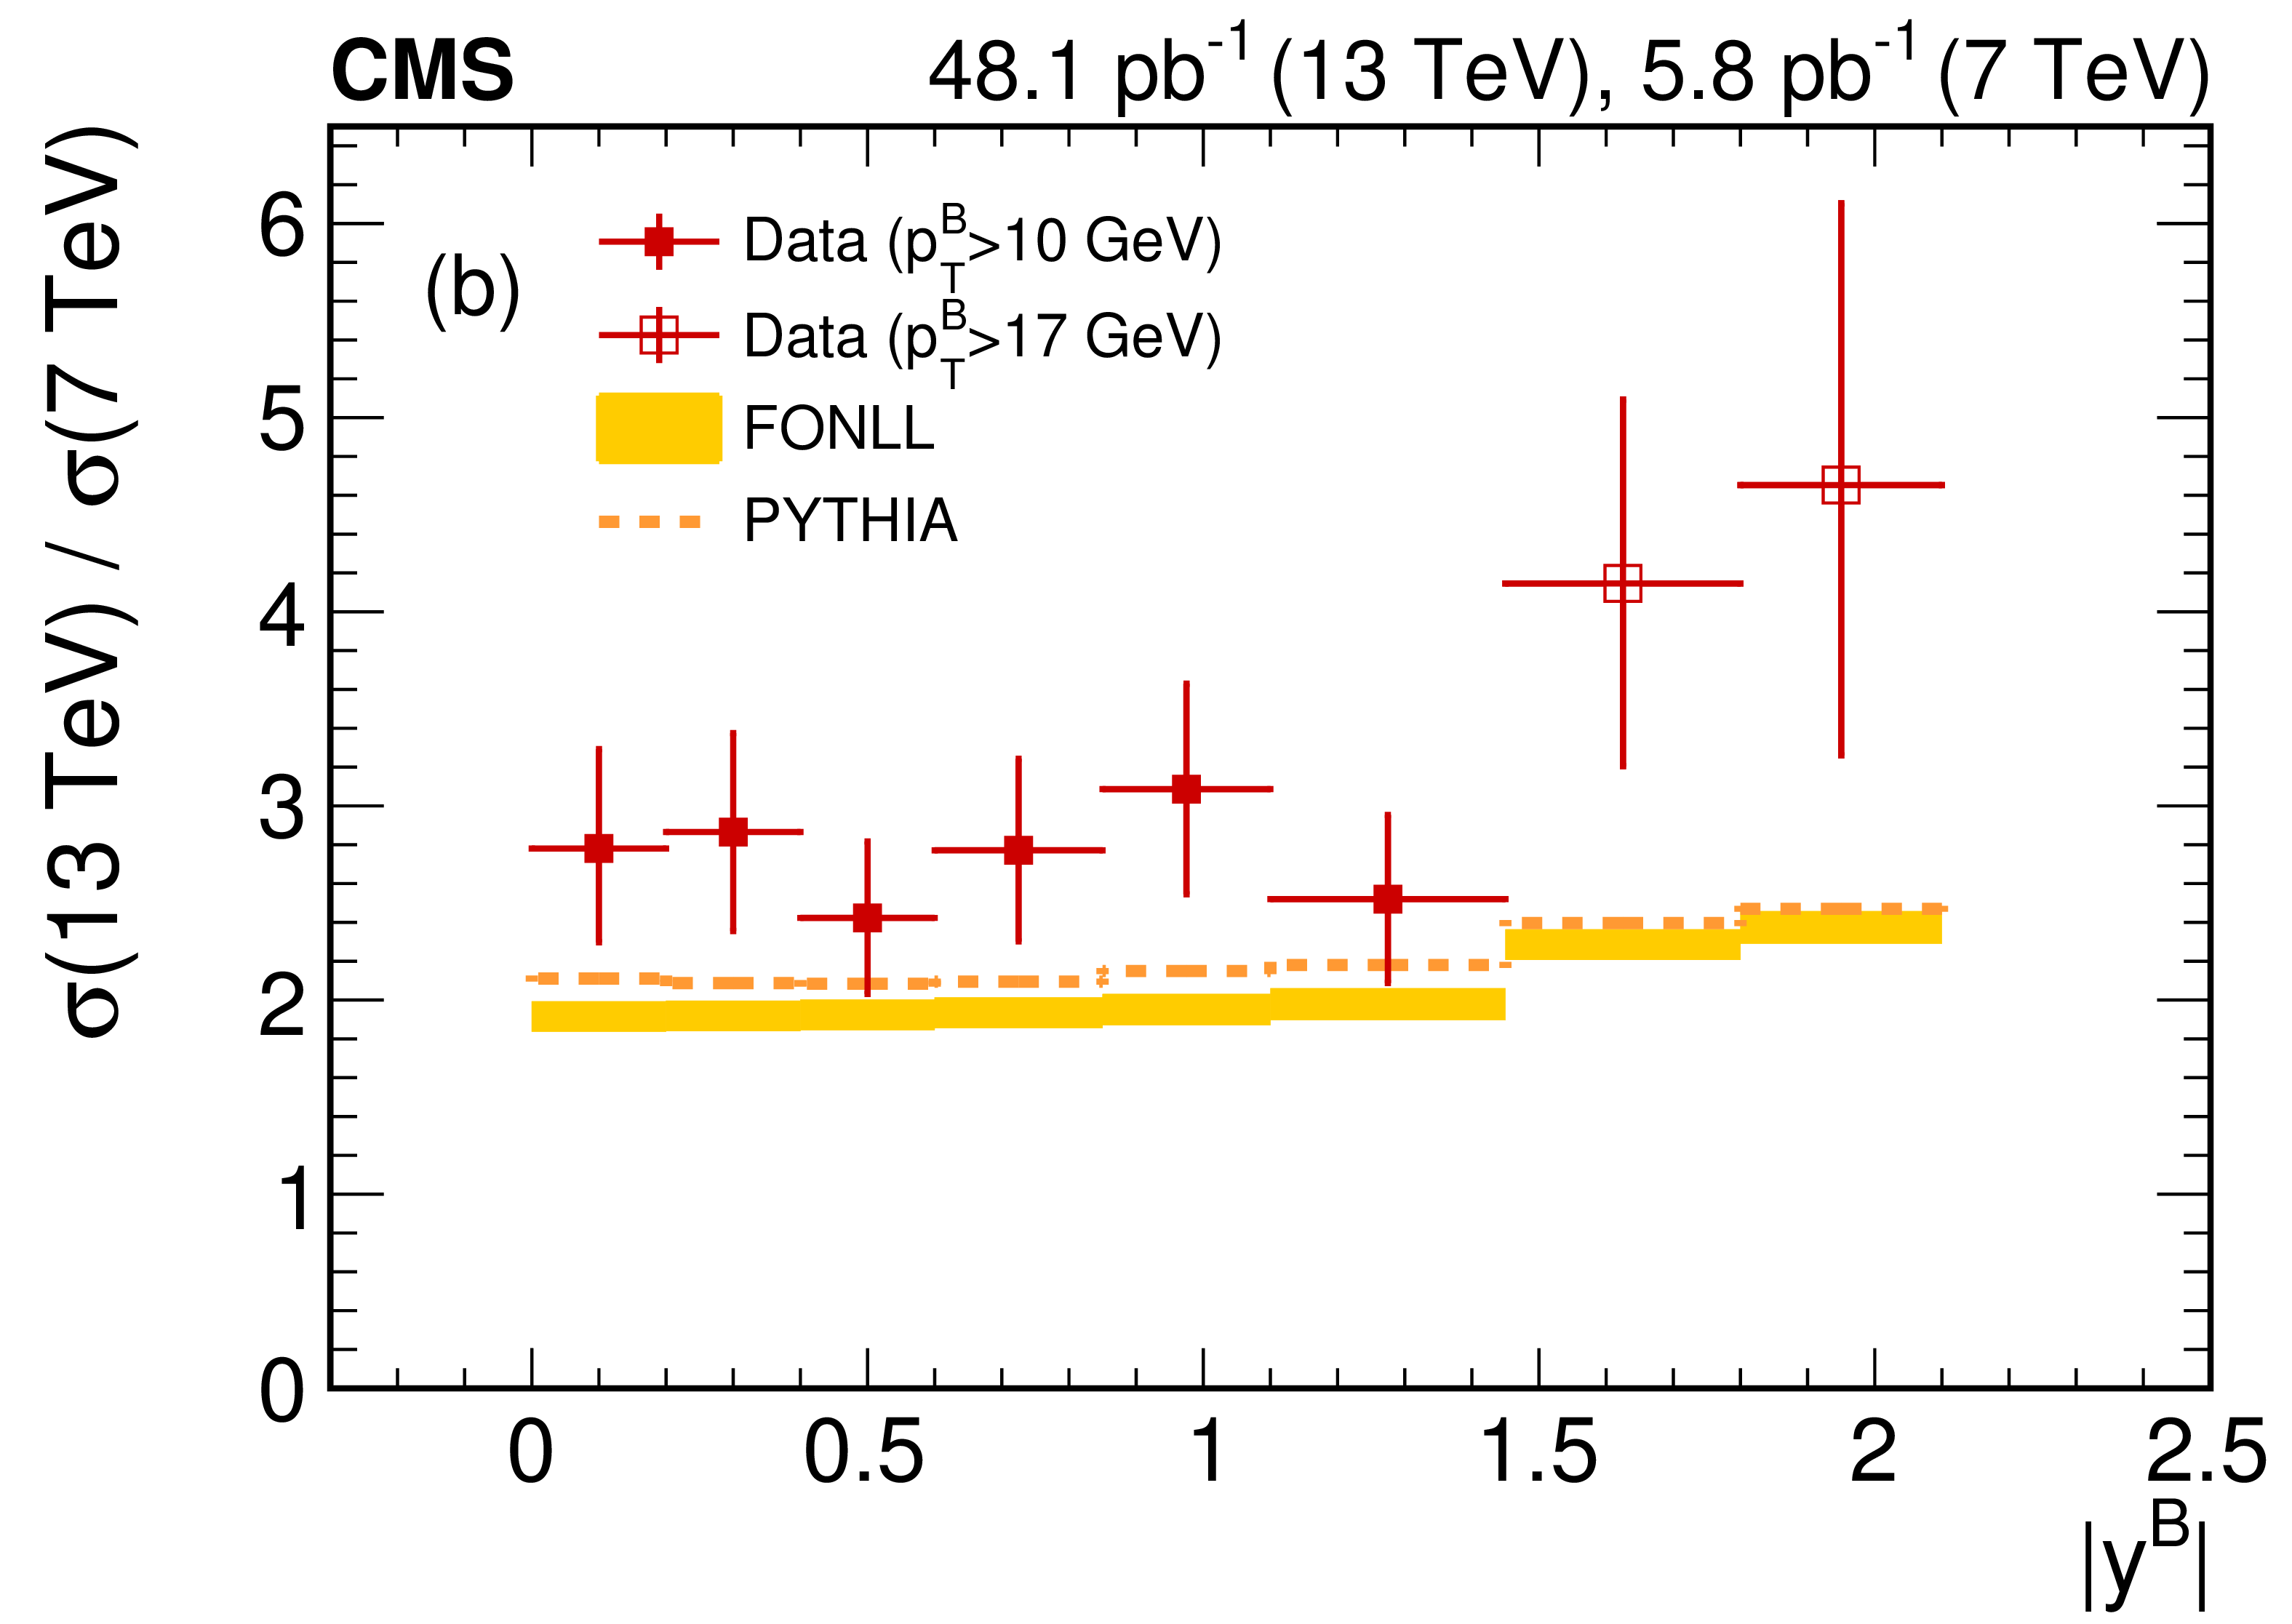
Figure 4:
Ratios of $\mathrm{B^{+}} $ differential production cross sections at $\sqrt {s} = $ 13 TeV and at $\sqrt {s} = $ 7 TeV as (a) a function of $ {p_{\mathrm {T}}} ^{{\mathrm{B}}}$ for $ { | y^{{\mathrm{B}}} | } < $ 1.45 or $ { | y^{{\mathrm{B}}} | } < $ 2.1 and (b) as a function of $ { | y^{{\mathrm{B}}} | }$ for 10 $ < {p_{\mathrm {T}}} ^{{\mathrm{B}}} < $ 100 GeV or 17 $ < {p_{\mathrm {T}}} ^{{\mathrm{B}}} < $ 100 GeV. The vertical bars show the total uncertainty in the measured ratios of the cross sections, and the horizontal bars represent the bin width. The calculations from FONLL and PYTHIA are shown as shaded boxes and dashed lines, respectively. |
png pdf |
Figure 4-a:
Ratios of $\mathrm{B^{+}} $ differential production cross sections at $\sqrt {s} = $ 13 TeV and at $\sqrt {s} = $ 7 TeV as a function of $ {p_{\mathrm {T}}} ^{{\mathrm{B}}}$ for $ { | y^{{\mathrm{B}}} | } < $ 1.45 or $ { | y^{{\mathrm{B}}} | } < $ 2.1. The vertical bars show the total uncertainty in the measured ratios of the cross sections, and the horizontal bars represent the bin width. The calculations from FONLL and PYTHIA are shown as shaded boxes and dashed lines, respectively. |
png pdf |
Figure 4-b:
Ratios of $\mathrm{B^{+}} $ differential production cross sections at $\sqrt {s} = $ 13 TeV and at $\sqrt {s} = $ 7 TeV as a function of $ { | y^{{\mathrm{B}}} | }$ for 10 $ < {p_{\mathrm {T}}} ^{{\mathrm{B}}} < $ 100 GeV or 17 $ < {p_{\mathrm {T}}} ^{{\mathrm{B}}} < $ 100 GeV. The vertical bars show the total uncertainty in the measured ratios of the cross sections, and the horizontal bars represent the bin width. The calculations from FONLL and PYTHIA are shown as shaded boxes and dashed lines, respectively. |
| Tables | |
png pdf |
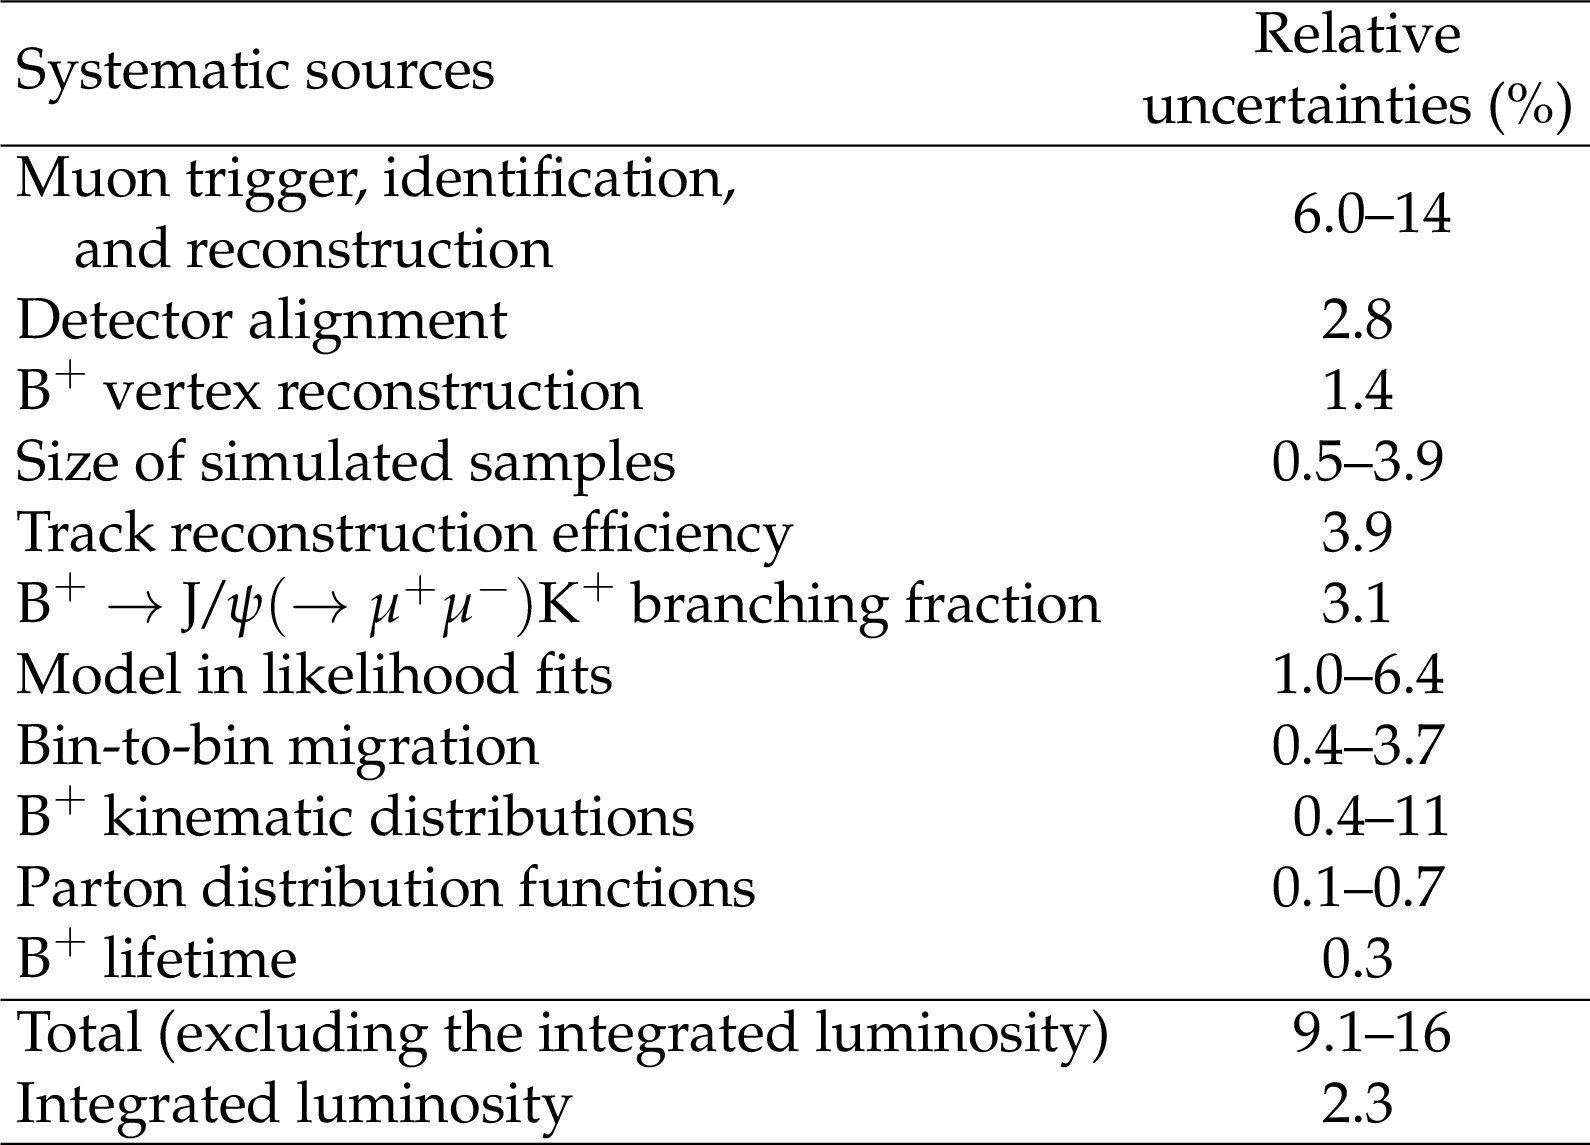
Table 1:
Summary of the relative systematic uncertainties in the measured $\mathrm{B^{+}} $ production cross sections. The ranges given reflect the uncertainties over the $ {p_{\mathrm {T}}} ^{{\mathrm{B}}}$ and $y^{{\mathrm{B}}}$ bins. |
png pdf |
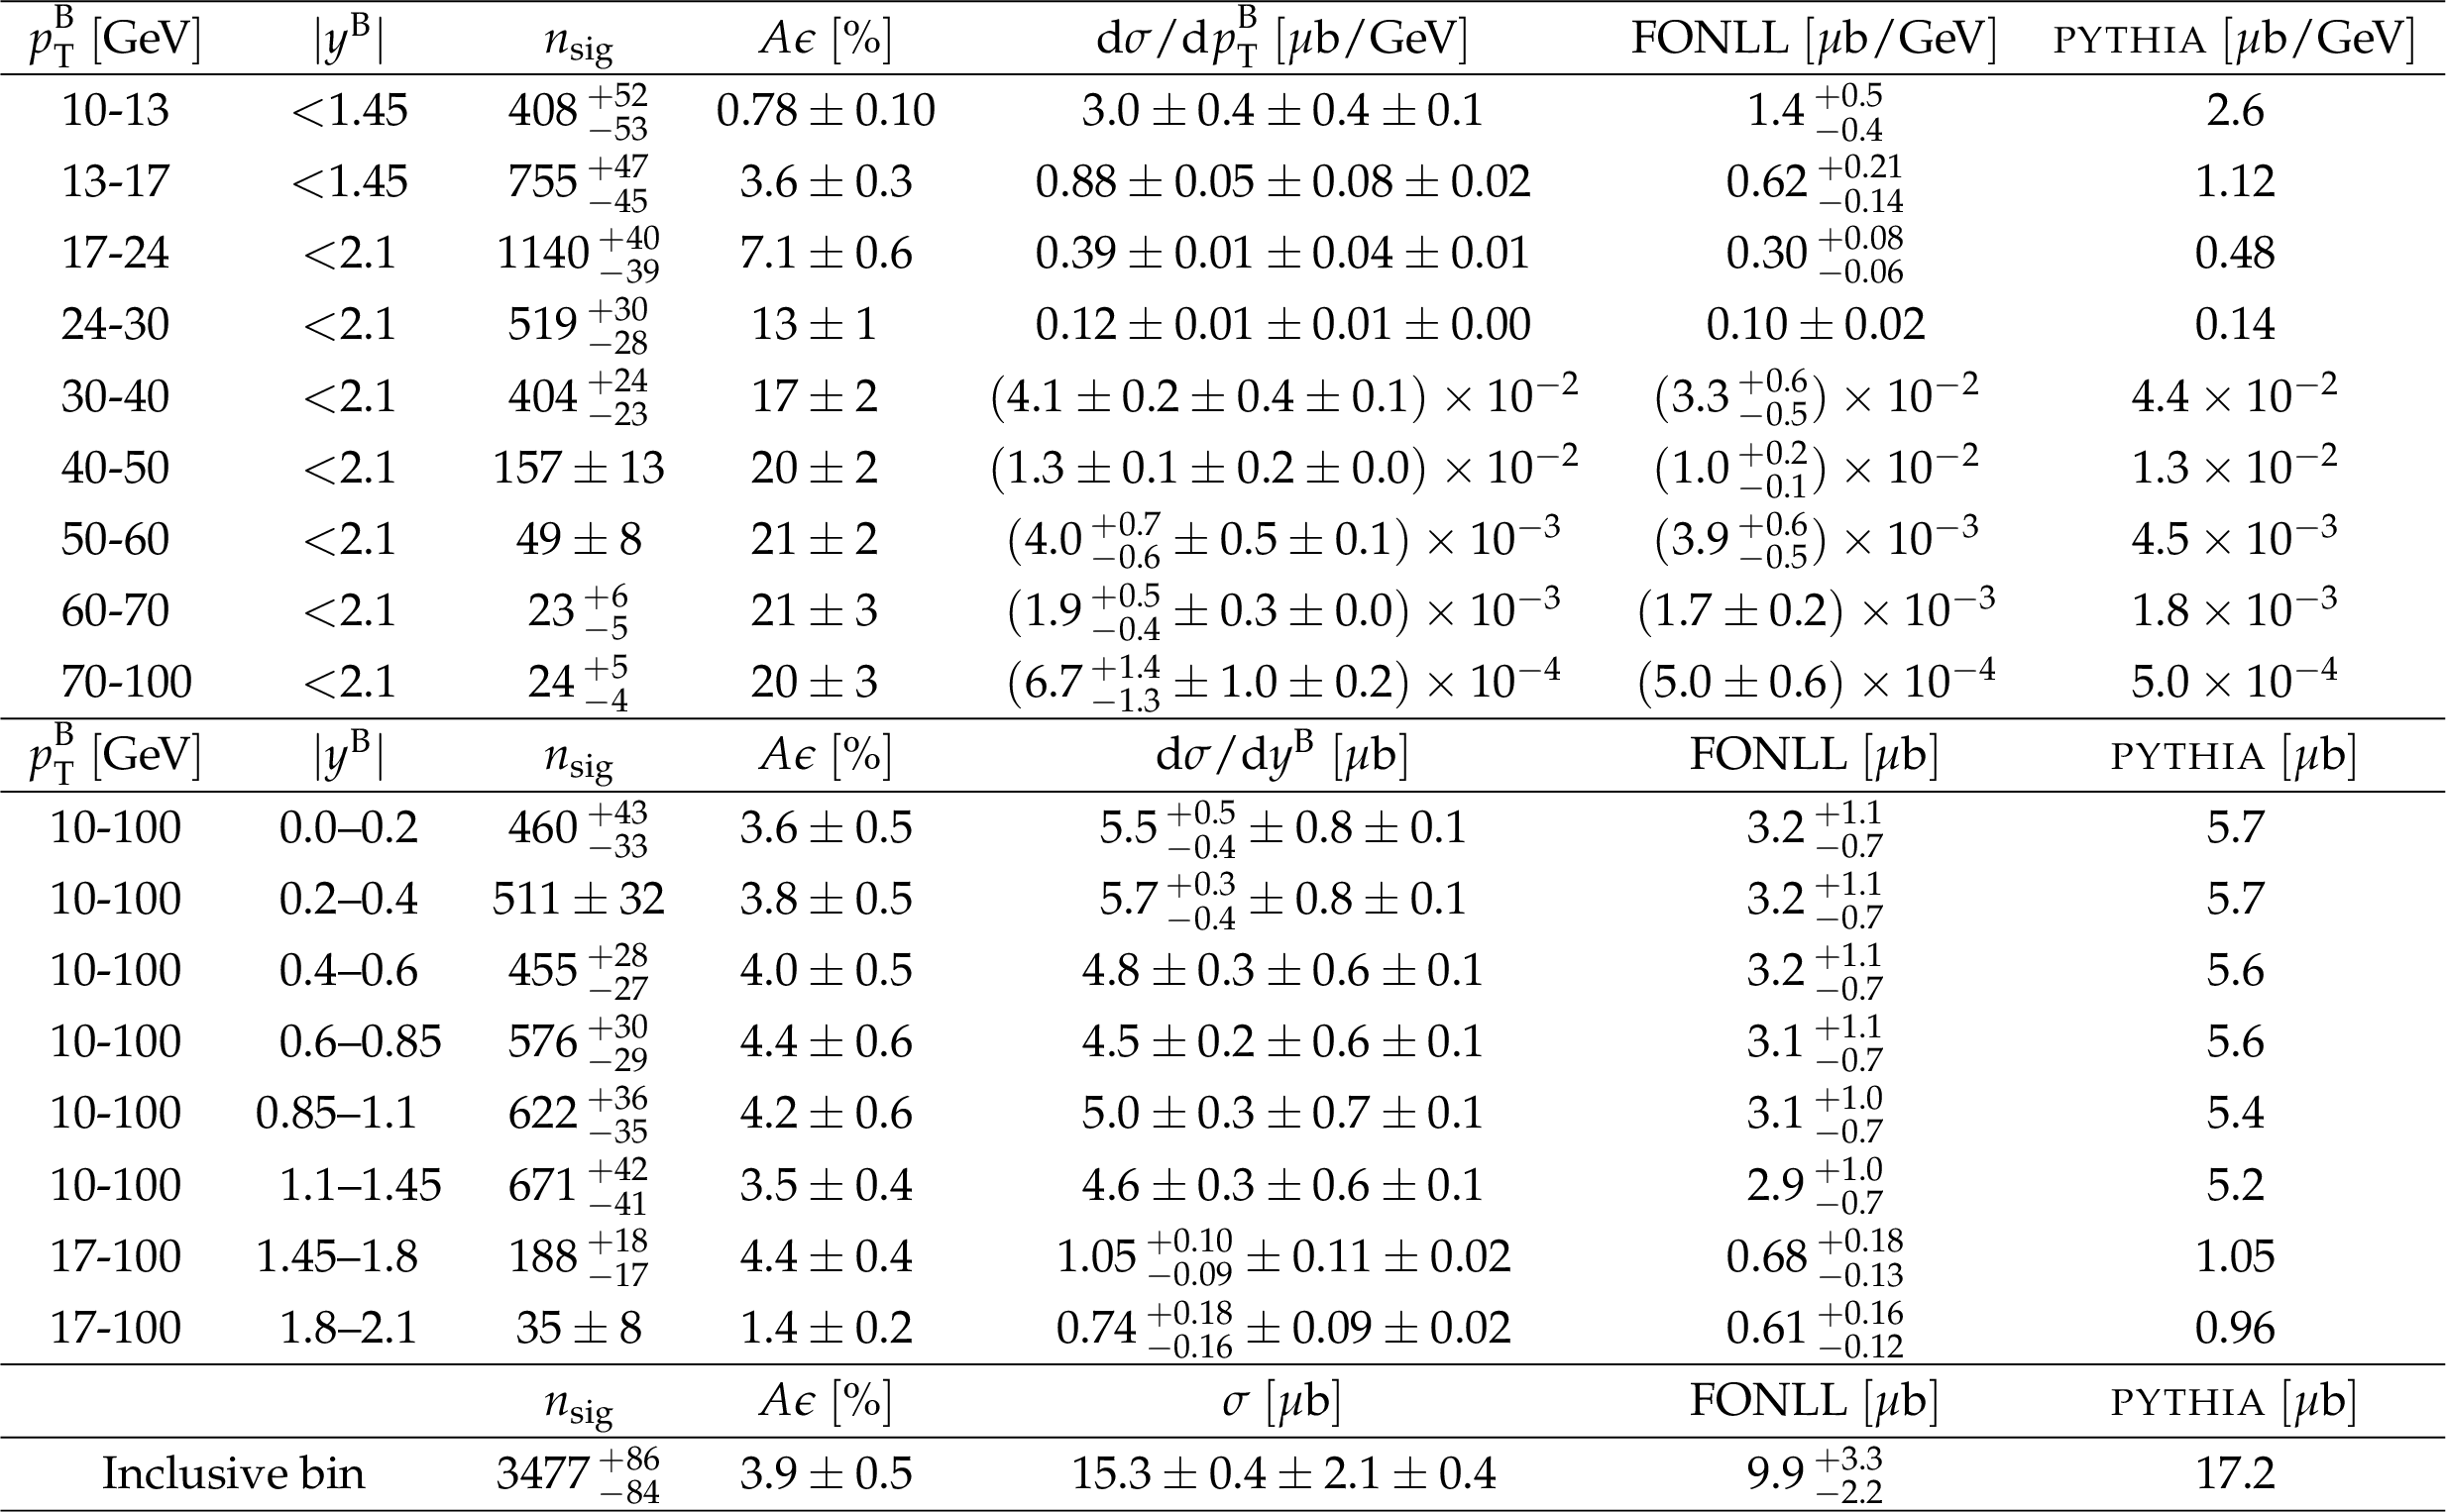
Table 2:
The ranges in $ {p_{\mathrm {T}}} ^{{\mathrm{B}}}$ and $ { | y^{{\mathrm{B}}} | }$, signal yields $n_\text {sig}$, acceptance times efficiency $A\epsilon $, and measured differential cross sections ${{{\mathrm {d}}}\sigma}/{{{\mathrm {d}}} {p_{\mathrm {T}}} ^{{\mathrm{B}}}}$ and ${{{\mathrm {d}}}\sigma}/{{{\mathrm {d}}}y^{{\mathrm{B}}}}$, compared to the FONLL and PYTHIA predictions. The three uncertainties in the measured cross sections refer to the statistical, systematic, and integrated luminosity uncertainties, respectively. The uncertainties in $A\epsilon $ and in the FONLL predictions are the total uncertainties. The last row ("Inclusive bin") presents the measured total cross section and the FONLL and PYTHIA predictions for the phase-space region of $10 \le {p_{\mathrm {T}}} ^{{\mathrm{B}}} < $ 17 GeV and $ { | y^{{\mathrm{B}}} | } < $ 1.45, and 17 $ \le {p_{\mathrm {T}}} ^{{\mathrm{B}}} < $ 100 GeV and $ { | y^{{\mathrm{B}}} | } < $ 2.1. |
| Summary |
| The differential cross sections for $\mathrm{B^{+}}$ meson production in ${\mathrm{p}}{\mathrm{p}}$ collisions at $\sqrt{s} = $ 13 TeV have been measured for the first time by the CMS experiment using the decay channel $\mathrm{B^{+}} \to \mathrm{J}/\psi \mathrm{K^{+}}$, with $\mathrm{J}/\psi \to \mu^+\mu^-$, as a function of ${p_{\mathrm{T}}}^{{\mathrm{B}}}$ for $| {y^{{\mathrm{B}}}} | < $ 1.45 or $ | {y^{{\mathrm{B}}}} | < 2.1$, and as a function of $y^{{\mathrm{B}}}$ for 10 $ < {p_{\mathrm{T}}}^{{\mathrm{B}}} < $ 100 GeV or 17 $ < {p_{\mathrm{T}}}^{{\mathrm{B}}} < $ 100 GeV. The total cross section summed over all bins is measured to be 15.3 $\pm$ 0.4 (stat.) $\pm$ 2.1 (syst.) $\pm$ 0.4 (lumi.) $\mu$b. The measured distributions show reasonable agreement in terms of shape, as well as normalization, with FONLL calculations and with the prediction of the PYTHIA event generator, within the uncertainties. The ratios between the measurements at 13 and at 7 TeV tend to prefer higher values compared to the predictions. This study provides the first measurement of a b hadron cross section through the $ \mathrm{B^{+}} \to \mathrm{J}/\psi \mathrm{K^{+} } $ exclusive decay channel at the centre-of-mass energy of 13 TeV. |
| References | ||||
| 1 | UA1 Collaboration | Beauty production at the CERN proton-antiproton collider | PLB 186 (1987) 237 | |
| 2 | UA1 Collaboration | Measurement of the bottom quark production cross section in proton-antiproton Collisions at $ \sqrt{s} = $ 0.63 TeV | PLB 213 (1988) 405 | |
| 3 | CDF Collaboration | Measurement of the $ \mathrm{B} $ meson differential cross-section, $ {\mathrm{d}} \sigma / {\mathrm{d}} {p_{\mathrm{T}}} $, in $ {\mathrm{p}}\bar{{\mathrm{p}}} $ collisions at $ \sqrt{s} = $ 1.8 TeV | PRL 75 (1995) 1451 | hep-ex/9503013 |
| 4 | CDF Collaboration | Measurement of the $ \mathrm{B^{+}} $ total cross section and $ \mathrm{B^{+}} $ differential cross section $ {\mathrm{d}} \sigma/ {\mathrm{d}}{p_{\mathrm{T}}} $ in $ {\mathrm{p}}\mathrm{\bar{p}} $ collisions at $ \sqrt{s} = $ 1.8 TeV | PRD 65 (2002) 052005 | hep-ph/0111359 |
| 5 | CDF Collaboration | Measurement of the $ \mathrm{J}/\psi $ meson and b-hadron production cross sections in $ {\mathrm{p}}\mathrm{\bar{p}} $ collisions at $ \sqrt{s} = $ 1960 GeV | PRD 71 (2005) 032001 | hep-ex/0412071 |
| 6 | CDF Collaboration | Measurement of the $ \mathrm{B^{+}} $ production cross section in $ {\mathrm{p}}\mathrm{\bar{p}} $ collisions at $ \sqrt{s} = $ 1960 GeV | PRD 75 (2007) 012010 | hep-ex/0612015 |
| 7 | D0 Collaboration | Inclusive $ \mu $ and $ \mathrm{b} $ quark production cross-sections in $ {\mathrm{p}}\mathrm{\bar{p}} $ collisions at $ \sqrt{s} = $ 1.8 TeV | PRL 74 (1995) 3548 | |
| 8 | D0 Collaboration | Cross section for b jet production in $ \mathrm{\bar{p}}{\mathrm{p}} $ collisions at $ \sqrt{s} = $ 1.8 TeV | PRL 85 (2000) 5068 | hep-ex/0008021 |
| 9 | ATLAS Collaboration | Measurement of the $ \mathrm{b} $-hadron production cross section using decays to $ \mathrm{D}^{\ast}\mu^{-} {\rm X} $ final states in $ {\mathrm{p}}{\mathrm{p}} $ collisions at $ \sqrt{s} = $ 7 TeV with the ATLAS detector | NPB 864 (2012) 341 | 1206.3122 |
| 10 | ATLAS Collaboration | Measurement of the differential cross-section of $ \mathrm{B^{+}} $ meson production in $ {\mathrm{p}}{\mathrm{p}} $ collisions at $ \sqrt{s} = $ 7 TeV at ATLAS | JHEP 10 (2013) 042 | 1307.0126 |
| 11 | CMS Collaboration | Measurement of the $ \mathrm{B^{+}} $ production cross section in $ {\mathrm{p}}{\mathrm{p}} $ collisions at $ \sqrt{s} = $ 7 TeV | PRL 106 (2011) 112001 | CMS-BPH-10-004 1101.0131 |
| 12 | CMS Collaboration | Inclusive b-hadron production cross section with muons in $ {\mathrm{p}}{\mathrm{p}} $ collisions at $ \sqrt{s} = $ 7 TeV | JHEP 03 (2011) 090 | CMS-BPH-10-007 1101.3512 |
| 13 | CMS Collaboration | Measurement of the $ \mathrm{B}^{0} $ production cross section in $ {\mathrm{p}}{\mathrm{p}} $ collisions at $ \sqrt{s} = $ 7 TeV | PRL 106 (2011) 252001 | CMS-BPH-10-005 1104.2892 |
| 14 | CMS Collaboration | Measurement of the $ \mathrm{B}^{0}s $ production cross section with $ \mathrm{B}^{0}s \to \mathrm{J}/\psi {\phi} $ decays in $ {\mathrm{p}}{\mathrm{p}} $ collisions at $ \sqrt{s} = $ 7 TeV | PRD 84 (2011) 052008 | CMS-BPH-10-013 1106.4048 |
| 15 | CMS Collaboration | Measurement of the $ \Lambda_{\rm b} $ cross section and the $ \overline{\Lambda}_{\rm b} $ to $ \Lambda_{\rm b} $ ratio with $ \mathrm{J}/\psi \Lambda $ decays in $ {\mathrm{p}}{\mathrm{p}} $ collisions at $ \sqrt{s} = $ 7 TeV | PLB 714 (2012) 136 | CMS-BPH-11-007 1205.0594 |
| 16 | CMS Collaboration | Measurement of the cross section for production of $ \mathrm{b}\mathrm{\bar{b}} {\rm X} $, decaying to muons in $ {\mathrm{p}}{\mathrm{p}} $ collisions at $ \sqrt{s} = $ 7 TeV | JHEP 06 (2012) 110 | CMS-BPH-10-015 1203.3458 |
| 17 | CMS Collaboration | Measurement of the ratio of the production cross sections times branching fractions of $ \mathrm{B}_{\mathrm{c}}^{\pm} \to \mathrm{J}/\psi \pi^{\pm} $ and $ \mathrm{B^{\pm}} \to \mathrm{J}/\psi \mathrm{K^{\pm}} $ and $ \mathcal{B}(\mathrm{B}_{\mathrm{c}}^{\pm} \to \mathrm{J}/\psi \pi^{\pm}\pi^{\pm} {\pi^\mathrm{\mp}})/\mathcal{B}(\mathrm{B}_{\mathrm{c}}^{\pm} \to \mathrm{J}/\psi \pi^{\pm}) $ in $ {\mathrm{p}}{\mathrm{p}} $ collisions at $ \sqrt{s} = $ 7 TeV | JHEP 01 (2015) 063 | CMS-BPH-12-011 1410.5729 |
| 18 | LHCb Collaboration | Measurement of the $ \mathrm{B^{\pm}} $ production cross-section in $ {\mathrm{p}}{\mathrm{p}} $ collisions at $ \sqrt{s} = $ 7 TeV | JHEP 04 (2012) 093 | 1202.4812 |
| 19 | LHCb Collaboration | Measurement of $ \mathrm{B} $ meson production cross-sections in proton-proton collisions at $ \sqrt{s} = $ 7 TeV | JHEP 08 (2013) 117 | 1306.3663 |
| 20 | LHCb Collaboration | Measurement of $ \mathrm{B}_{\mathrm{c}}^+ $ production in proton-proton collisions at $ \sqrt{s} = $ 8 TeV | PRL 114 (2015) 132001 | 1411.2943 |
| 21 | LHCb Collaboration | Measurement of forward $ \mathrm{J}/\psi $ production cross-sections in $ {\mathrm{p}}{\mathrm{p}} $ collisions at $ \sqrt{s}= $ 13 TeV | JHEP 10 (2015) 172 | 1509.00771 |
| 22 | LHCb Collaboration | Measurement of the $ \mathrm{b} $-quark production cross-section in 7 and 13 $ TeV {\mathrm{p}}{\mathrm{p}} $ collisions | PRL 118 (2017) 052002 | 1612.05140 |
| 23 | T. Sjostrand, S. Mrenna, and P. Z. Skands | A brief introduction to PYTHIA 8.1 | CPC 178 (2008) 852 | 0710.3820 |
| 24 | M. Cacciari, M. Greco, and P. Nason | The $ {p_{\mathrm{T}}} $ spectrum in heavy flavor hadroproduction | JHEP 05 (1998) 007 | hep-ph/9803400 |
| 25 | M. Cacciari, S. Frixione, and P. Nason | The $ {p_{\mathrm{T}}} $ spectrum in heavy flavor photoproduction | JHEP 03 (2001) 006 | hep-ph/0102134 |
| 26 | CMS Collaboration | Performance of CMS muon reconstruction in $ {\mathrm{p}}{\mathrm{p}} $ collision events at $ \sqrt{s} = $ 7 TeV | JINST 7 (2012) P10002 | CMS-MUO-10-004 1206.4071 |
| 27 | CMS Collaboration | The CMS experiment at the CERN LHC | JINST 3 (2008) S08004 | CMS-00-001 |
| 28 | Particle Data Group, K. A. Olive et al. | Review of particle physics | CPC 38 (2014) 090001 and 2015 update | |
| 29 | CMS Collaboration | Event generator tunes obtained from underlying event and multiparton scattering measurements | EPJC 76 (2016) 155 | CMS-GEN-14-001 1512.00815 |
| 30 | NNPDF Collaboration | Parton distributions with QED corrections | NPB 877 (2013) 290 | 1308.0598 |
| 31 | GEANT4 Collaboration | GEANT4---a simulation toolkit | NIMA 506 (2003) 250 | |
| 32 | D. J. Lange | The $ EVTGEN $ particle decay simulation package | NIMA 462 (2001) 152 | |
| 33 | CMS Collaboration | Prompt and non-prompt $ \mathrm{J}/\psi $ production in $ {\mathrm{p}}{\mathrm{p}} $ collisions at $ \sqrt{s}= $ 7 TeV | EPJC 71 (2011) 1575 | CMS-BPH-10-002 1011.4193 |
| 34 | CMS Collaboration | Description and performance of track and primary-vertex reconstruction with the CMS tracker | JINST 9 (2014) P10009 | CMS-TRK-11-001 1405.6569 |
| 35 | CMS Collaboration | Cms luminosity measurement for the 2015 data taking period | CMS-PAS-LUM-15-001 | CMS-PAS-LUM-15-001 |
| 36 | T. Skwarnicki | A study of the radiative cascade transitions between the $\Upsilon'$ and $\Upsilon$ resonances | PhD thesis, Cracow, INP, 1986 DESY-F31-86-02 | |
| 37 | NNPDF Collaboration | Parton distributions for the LHC Run II | JHEP 04 (2015) 040 | 1410.8849 |
| 38 | M. Botje et al. | The PDF4LHC Working Group interim recommendations | 1101.0538 | |
| 39 | S. Alekhin et al. | The PDF4LHC Working Group interim report | 1101.0536 | |
|
|
Compact Muon Solenoid LHC, CERN |
|

|

|

|

|

|