

Compact Muon Solenoid
LHC, CERN
| CMS-BPH-18-005 ; CERN-EP-2019-128 | ||
| Study of the ${\mathrm{B^{+}} \to \mathrm{J}/\psi\bar{\Lambda} {\mathrm{p}}}$ decay in proton-proton collisions at $ \sqrt{s}= $ 8 TeV | ||
| CMS Collaboration | ||
| 11 July 2019 | ||
| JHEP 12 (2019) 100 | ||
| Abstract: A study of the ${\mathrm{B^{+}} \to \mathrm{J}/\psi\bar{\Lambda} {\mathrm{p}}}$ decay using proton-proton collision data collected at $\sqrt{s} = $ 8 TeV by the CMS experiment at the LHC, corresponding to an integrated luminosity of 19.6 fb$^{-1}$, is presented. The ratio of branching fractions ${\cal B}(\mathrm{B^{+}} \to \mathrm{J}/\psi\bar{\Lambda} {\mathrm{p}})/{\cal B}(\mathrm{B^{+}} \to \mathrm{J}/\psi \mathrm{K}^{*}(892)^{+})$ is measured to be (1.054 $\pm$ 0.057 (stat) $\pm$ 0.035 (syst) $\pm$ 0.011 (${\cal B}$) )%, where the last uncertainty reflects the uncertainties in the world-average branching fractions of $\bar{\Lambda}$ and $\mathrm{K}^{*}(892)^{+}$ decays to reconstructed final states. The invariant mass distributions of the $\mathrm{J}/\psi\bar{\Lambda}$, $\mathrm{J}/\psi{\mathrm{p}}$, and $\bar{\Lambda} {\mathrm{p}}$ systems produced in the $\mathrm{B^{+}} \to \mathrm{J}/\psi\bar{\Lambda} {\mathrm{p}}$ decay are investigated and found to be inconsistent with the pure phase space hypothesis. The analysis is extended by using a model-independent angular amplitude analysis, which shows that the inclusion of contributions from excited kaons decaying to the $\bar{\Lambda} {\mathrm{p}}$ system improves the description of the observed invariant mass distributions. | ||
| Links: e-print arXiv:1907.05461 [hep-ex] (PDF) ; CDS record ; inSPIRE record ; CADI line (restricted) ; | ||
| Figures & Tables | Summary | Additional Figures | References | CMS Publications |
|---|
| Figures | |

png pdf |
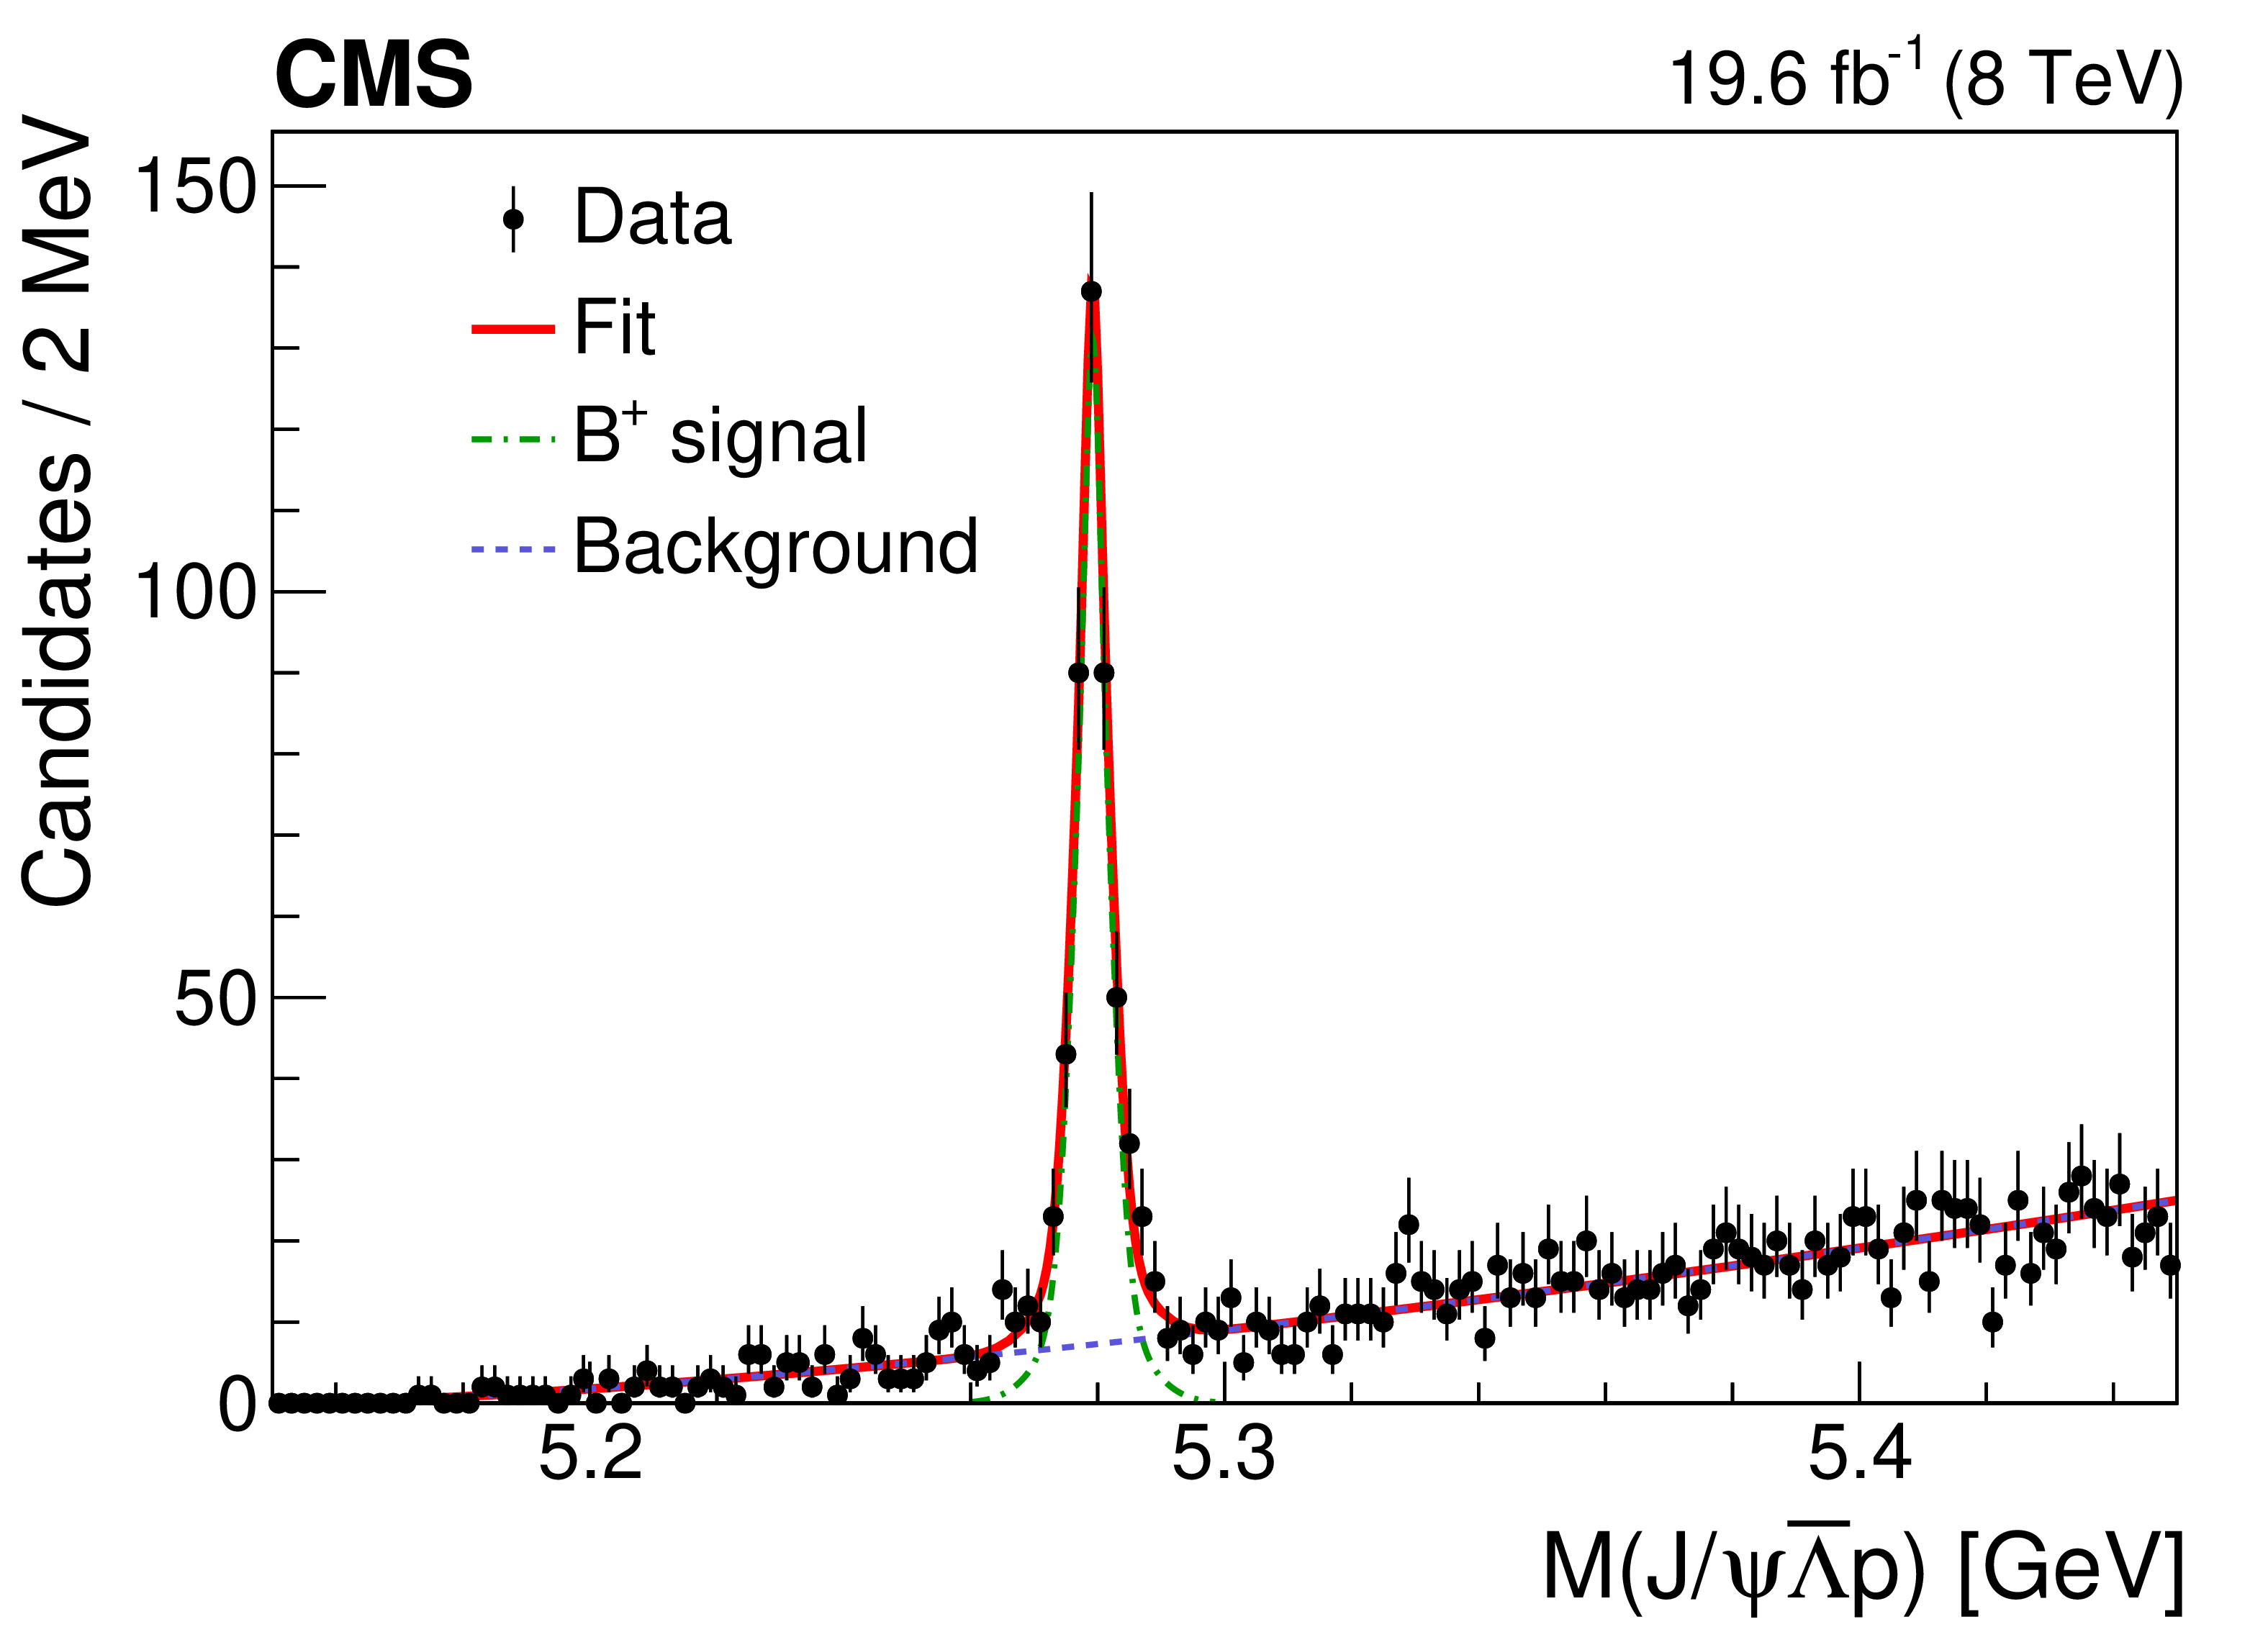
Figure 1:
The invariant mass distribution of the selected $\mathrm{B^{+}} \to {\mathrm{J}/\psi} \bar{\Lambda} {\mathrm{p}} $ candidates (upper). The invariant mass distributions of ${\mathrm{J}/\psi} {\mathrm{K^0_S}} \pi^{+} $ (lower left) and ${\mathrm{K^0_S}} \pi^{+} $ (lower right) for the $\mathrm{B^{+}} \to {\mathrm{J}/\psi} {{\mathrm{K}} ^{*+}} $ decay candidates. The points are data and the solid curves are the results of the fits explained in the text. The vertical bars represent the statistical uncertainty. On the lower right picture the background-subtracted candidates using the $M({\mathrm{J}/\psi} {\mathrm{K^0_S}} \pi^{+})$ as a discriminating variable are shown. The dash-dotted curves show the $\mathrm{B^{+}} $ signal in the upper and lower left plots, and the $ {{\mathrm{K}} ^{*+}} $ signal in the lower right plot. The dashed lines indicate the background contributions. The vertical lines in the lower right plot indicate the $ {{\mathrm{K}} ^{*+}} $ invariant mass window used for the normalization, as described in the text. |
png pdf |
Figure 1-a:
The invariant mass distribution of the selected $\mathrm{B^{+}} \to {\mathrm{J}/\psi} \bar{\Lambda} {\mathrm{p}} $ candidates. The points are data and the solid curves are the results of the fits explained in the text. The vertical bars represent the statistical uncertainty. The dash-dotted curves show the $\mathrm{B^{+}} $ signal. The dashed lines indicate the background contributions. |
png pdf |
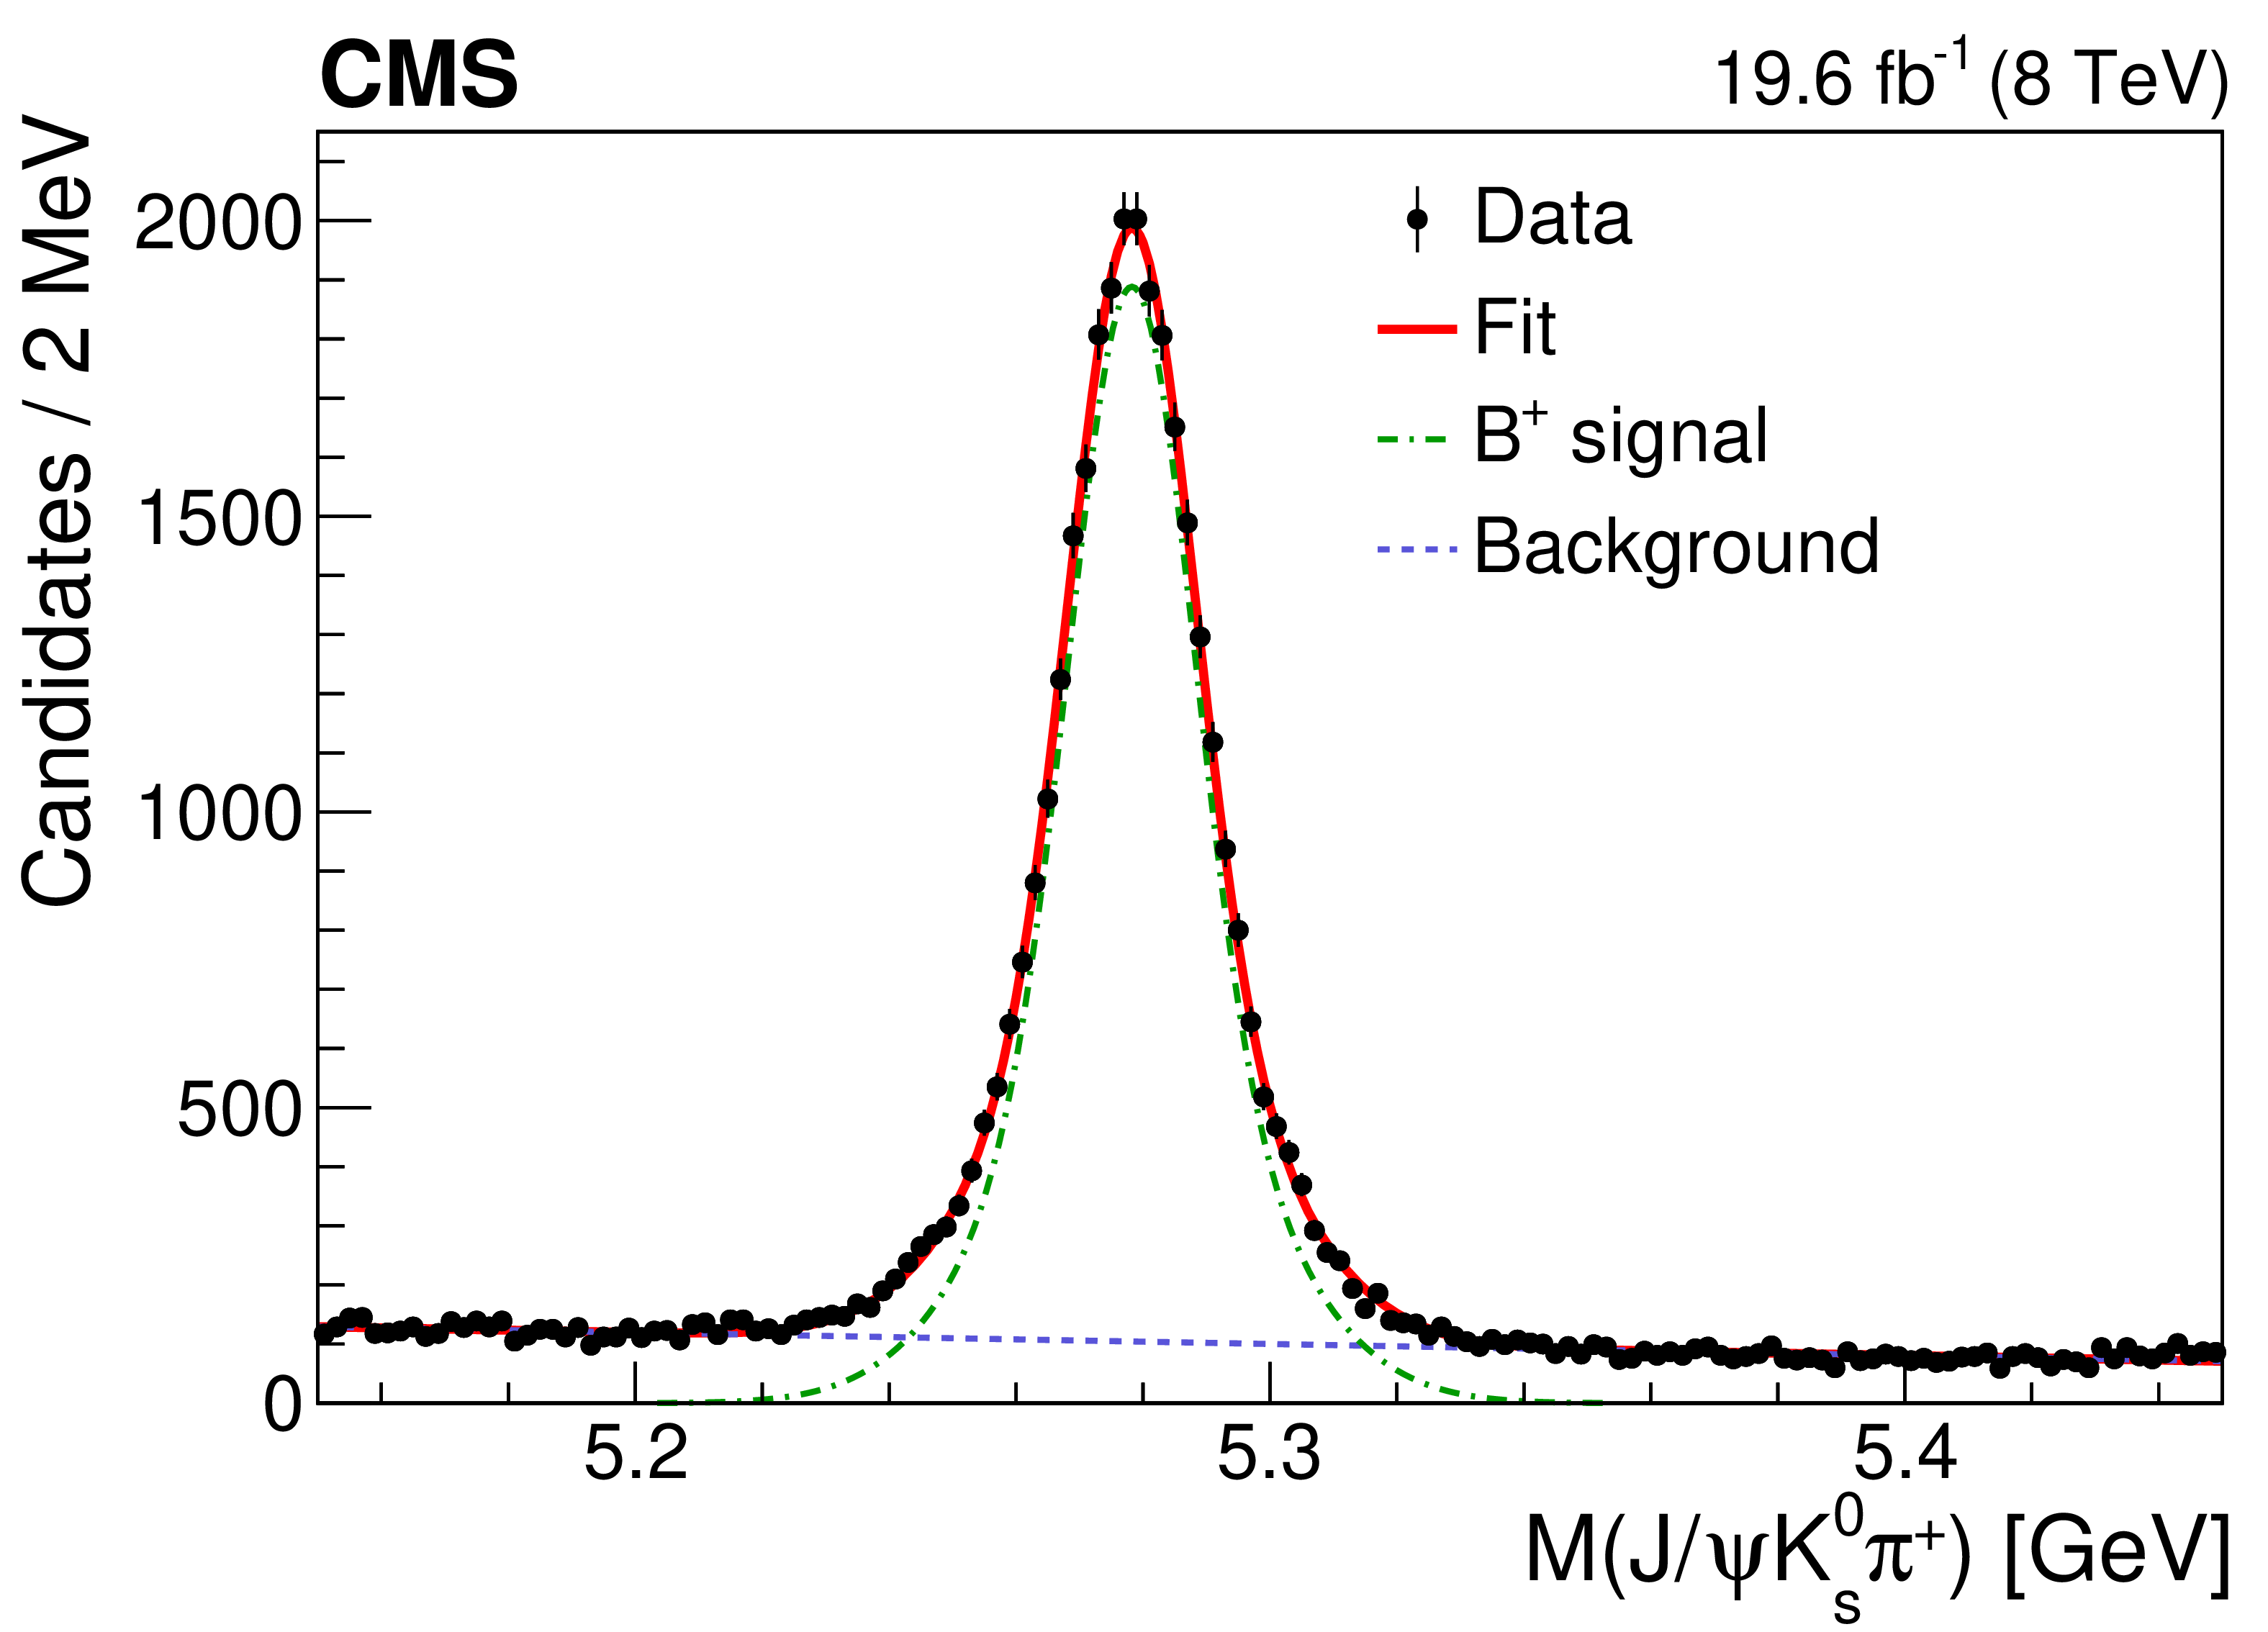
Figure 1-b:
The invariant mass distributions of ${\mathrm{J}/\psi} {\mathrm{K^0_S}} \pi^{+} $ for the $\mathrm{B^{+}} \to {\mathrm{J}/\psi} {{\mathrm{K}} ^{*+}} $ decay candidates. The points are data and the solid curves are the results of the fits explained in the text. The vertical bars represent the statistical uncertainty. The dash-dotted curves show the $\mathrm{B^{+}} $ signal. The dashed lines indicate the background contributions. |
png pdf |
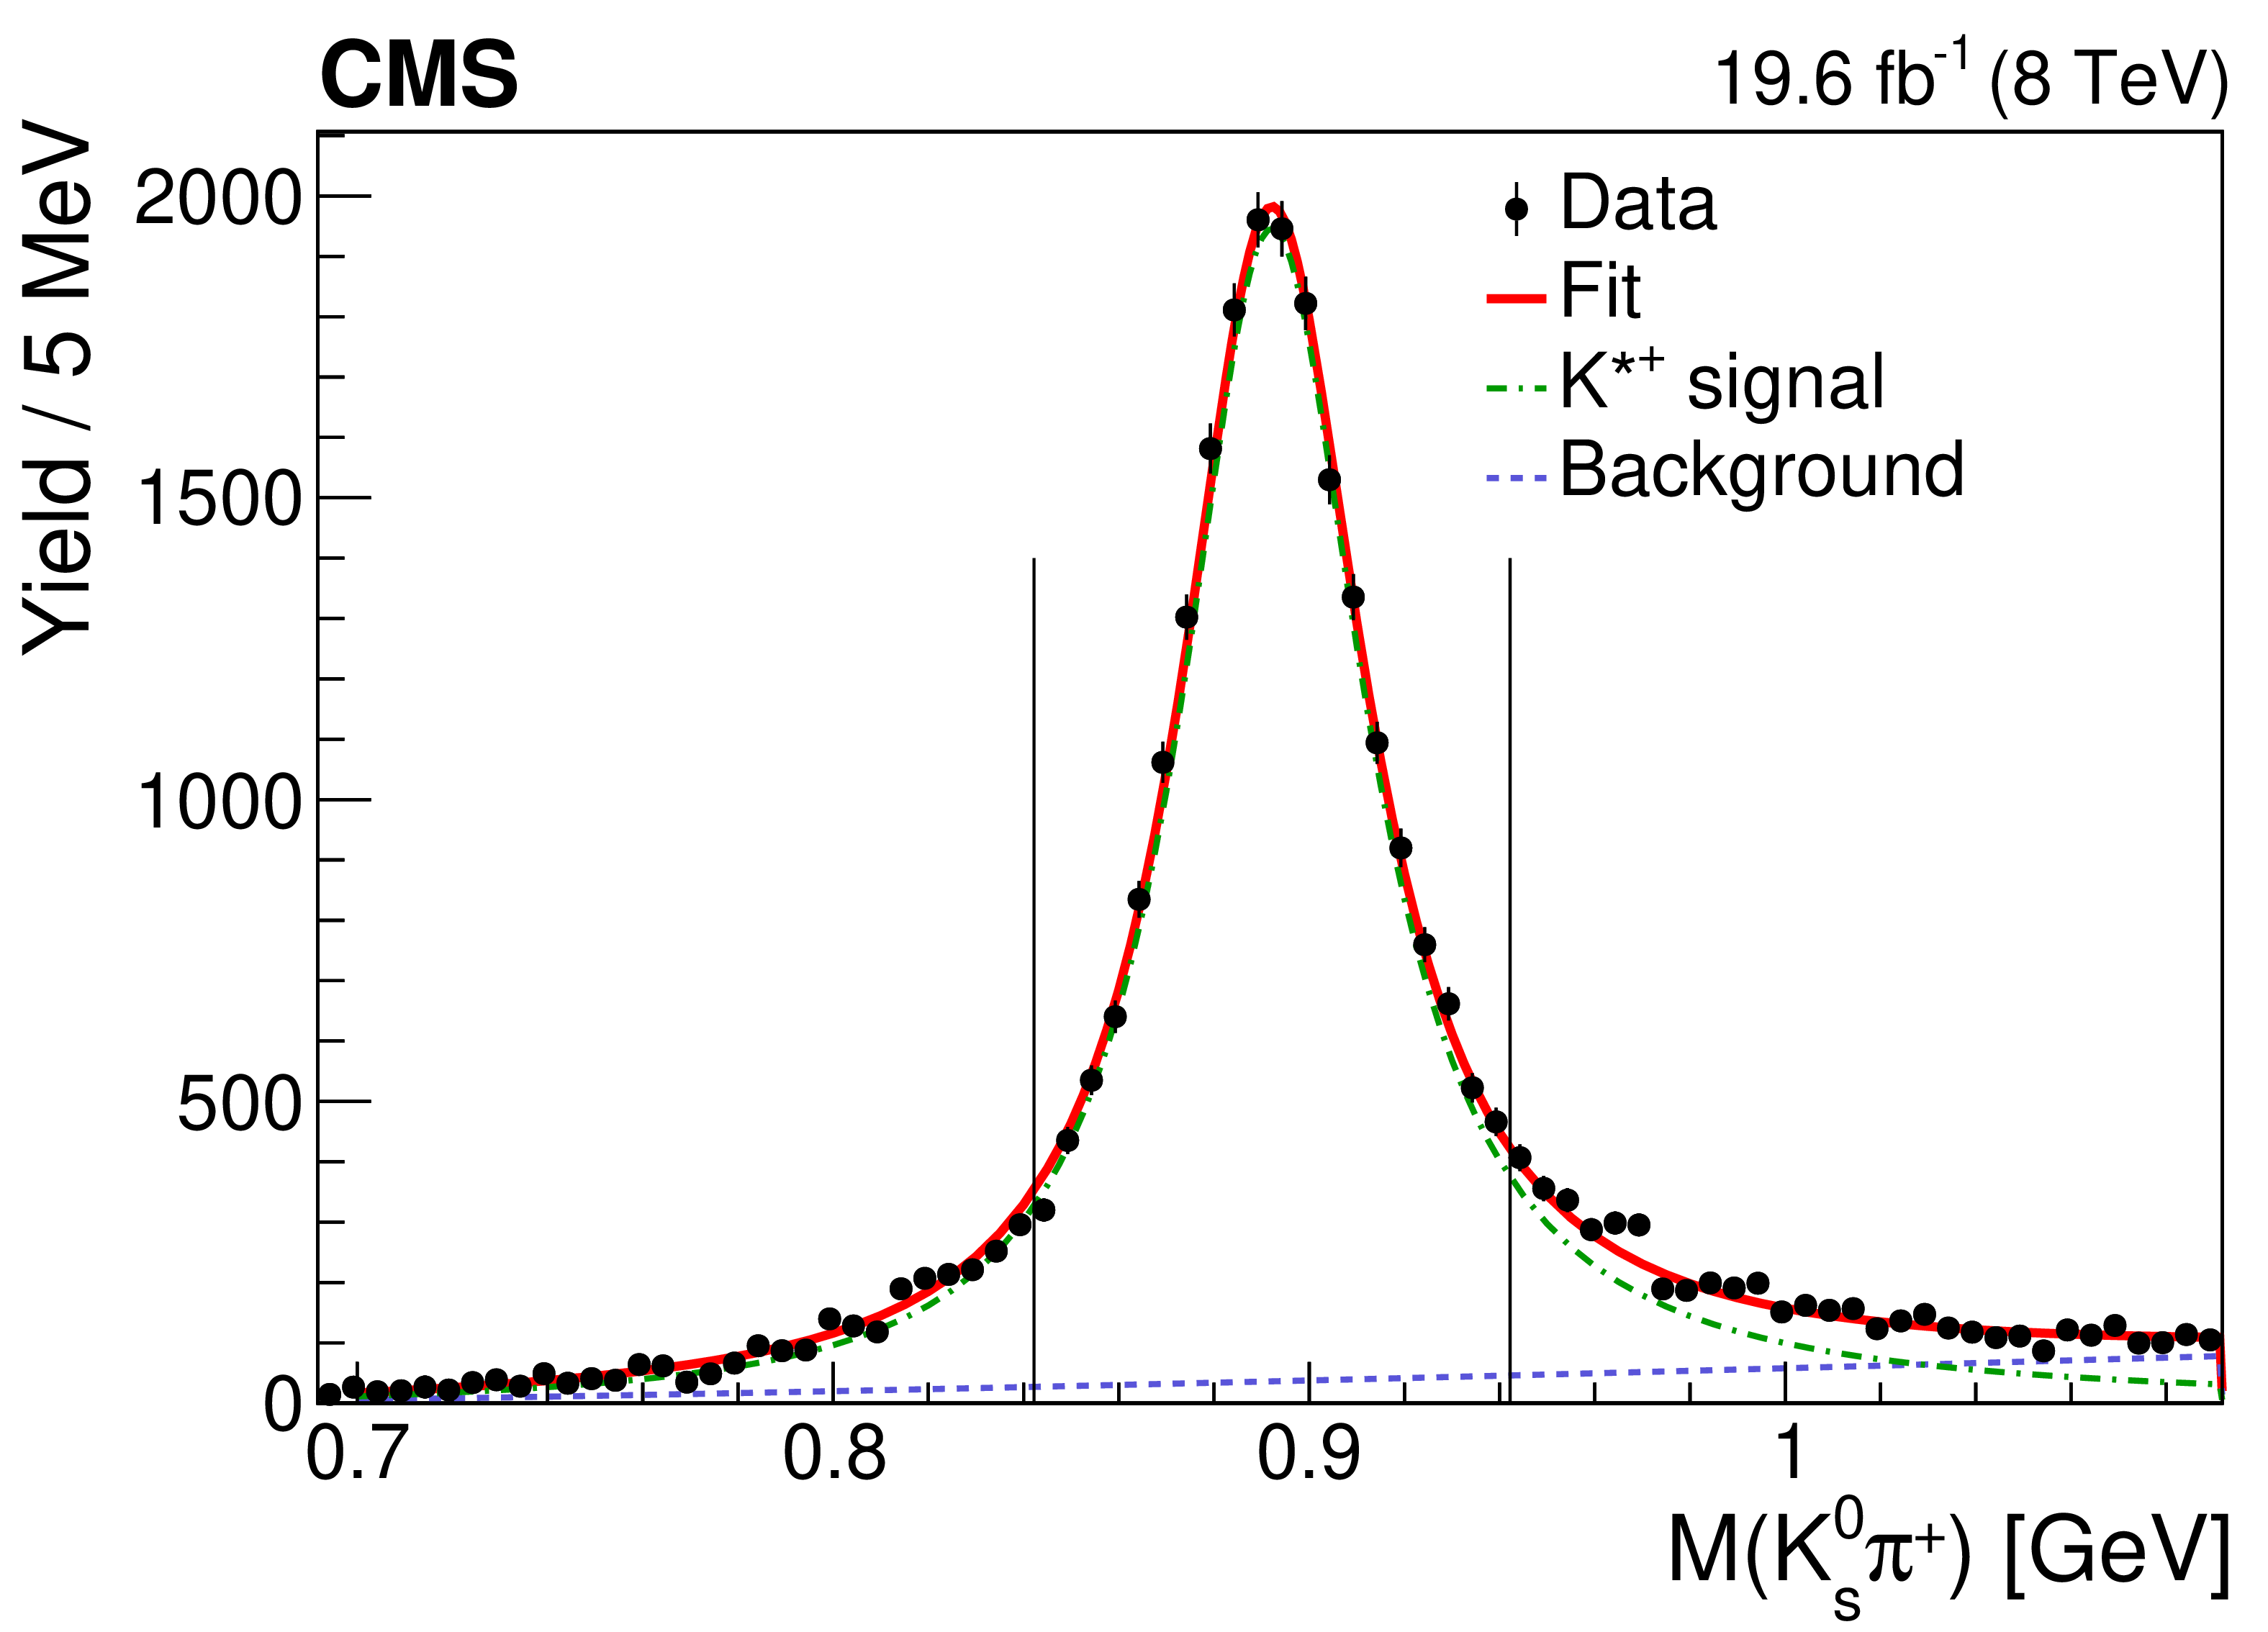
Figure 1-c:
The invariant mass distributions of ${\mathrm{K^0_S}} \pi^{+} $ for the $\mathrm{B^{+}} \to {\mathrm{J}/\psi} {{\mathrm{K}} ^{*+}} $ decay candidates. The points are data and the solid curves are the results of the fits explained in the text. The vertical bars represent the statistical uncertainty. The background-subtracted candidates using the $M({\mathrm{J}/\psi} {\mathrm{K^0_S}} \pi^{+})$ as a discriminating variable are shown. The dash-dotted curves show the $ {{\mathrm{K}} ^{*+}} $ signal. The dashed lines indicate the background contributions. The vertical lines indicate the $ {{\mathrm{K}} ^{*+}} $ invariant mass window used for the normalization, as described in the text. |
png pdf |
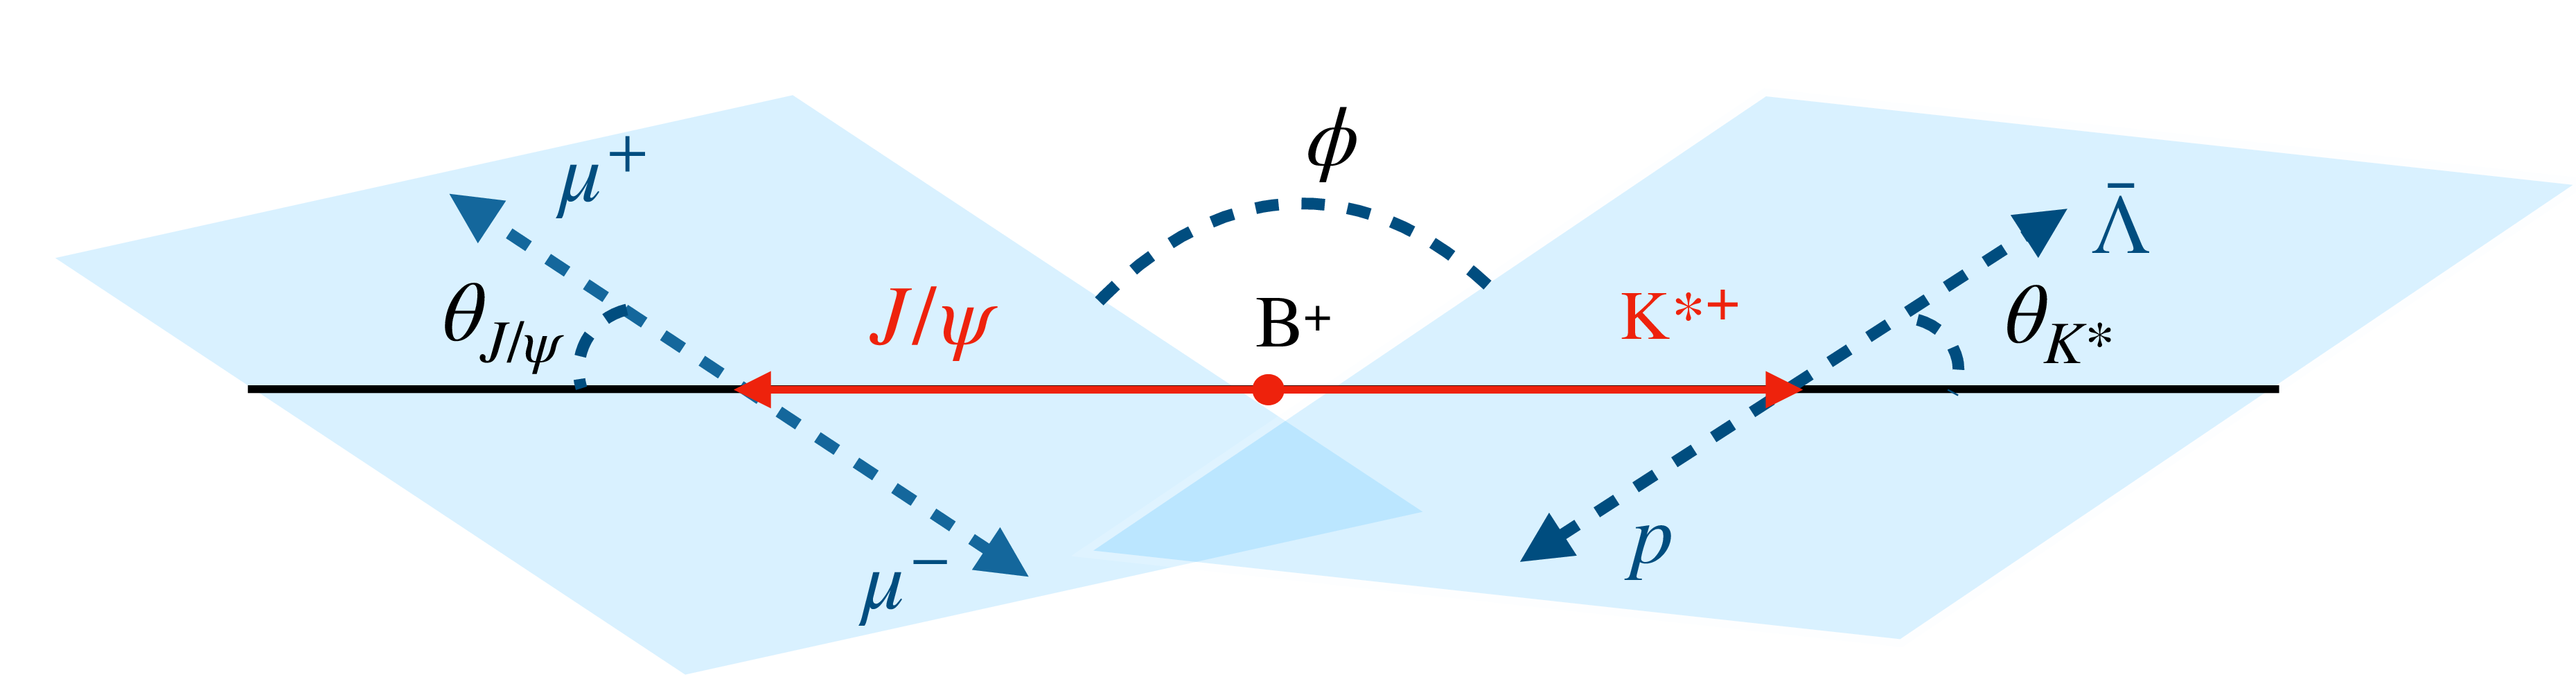
Figure 2:
An illustration of the decay angles in the $\mathrm{B^{+}} \to {\mathrm{J}/\psi} {{\mathrm{K}} ^{*+}} {}_{2,3,4}(\bar{\Lambda} {\mathrm{p}})$ decay. |
png pdf |
Figure 3:
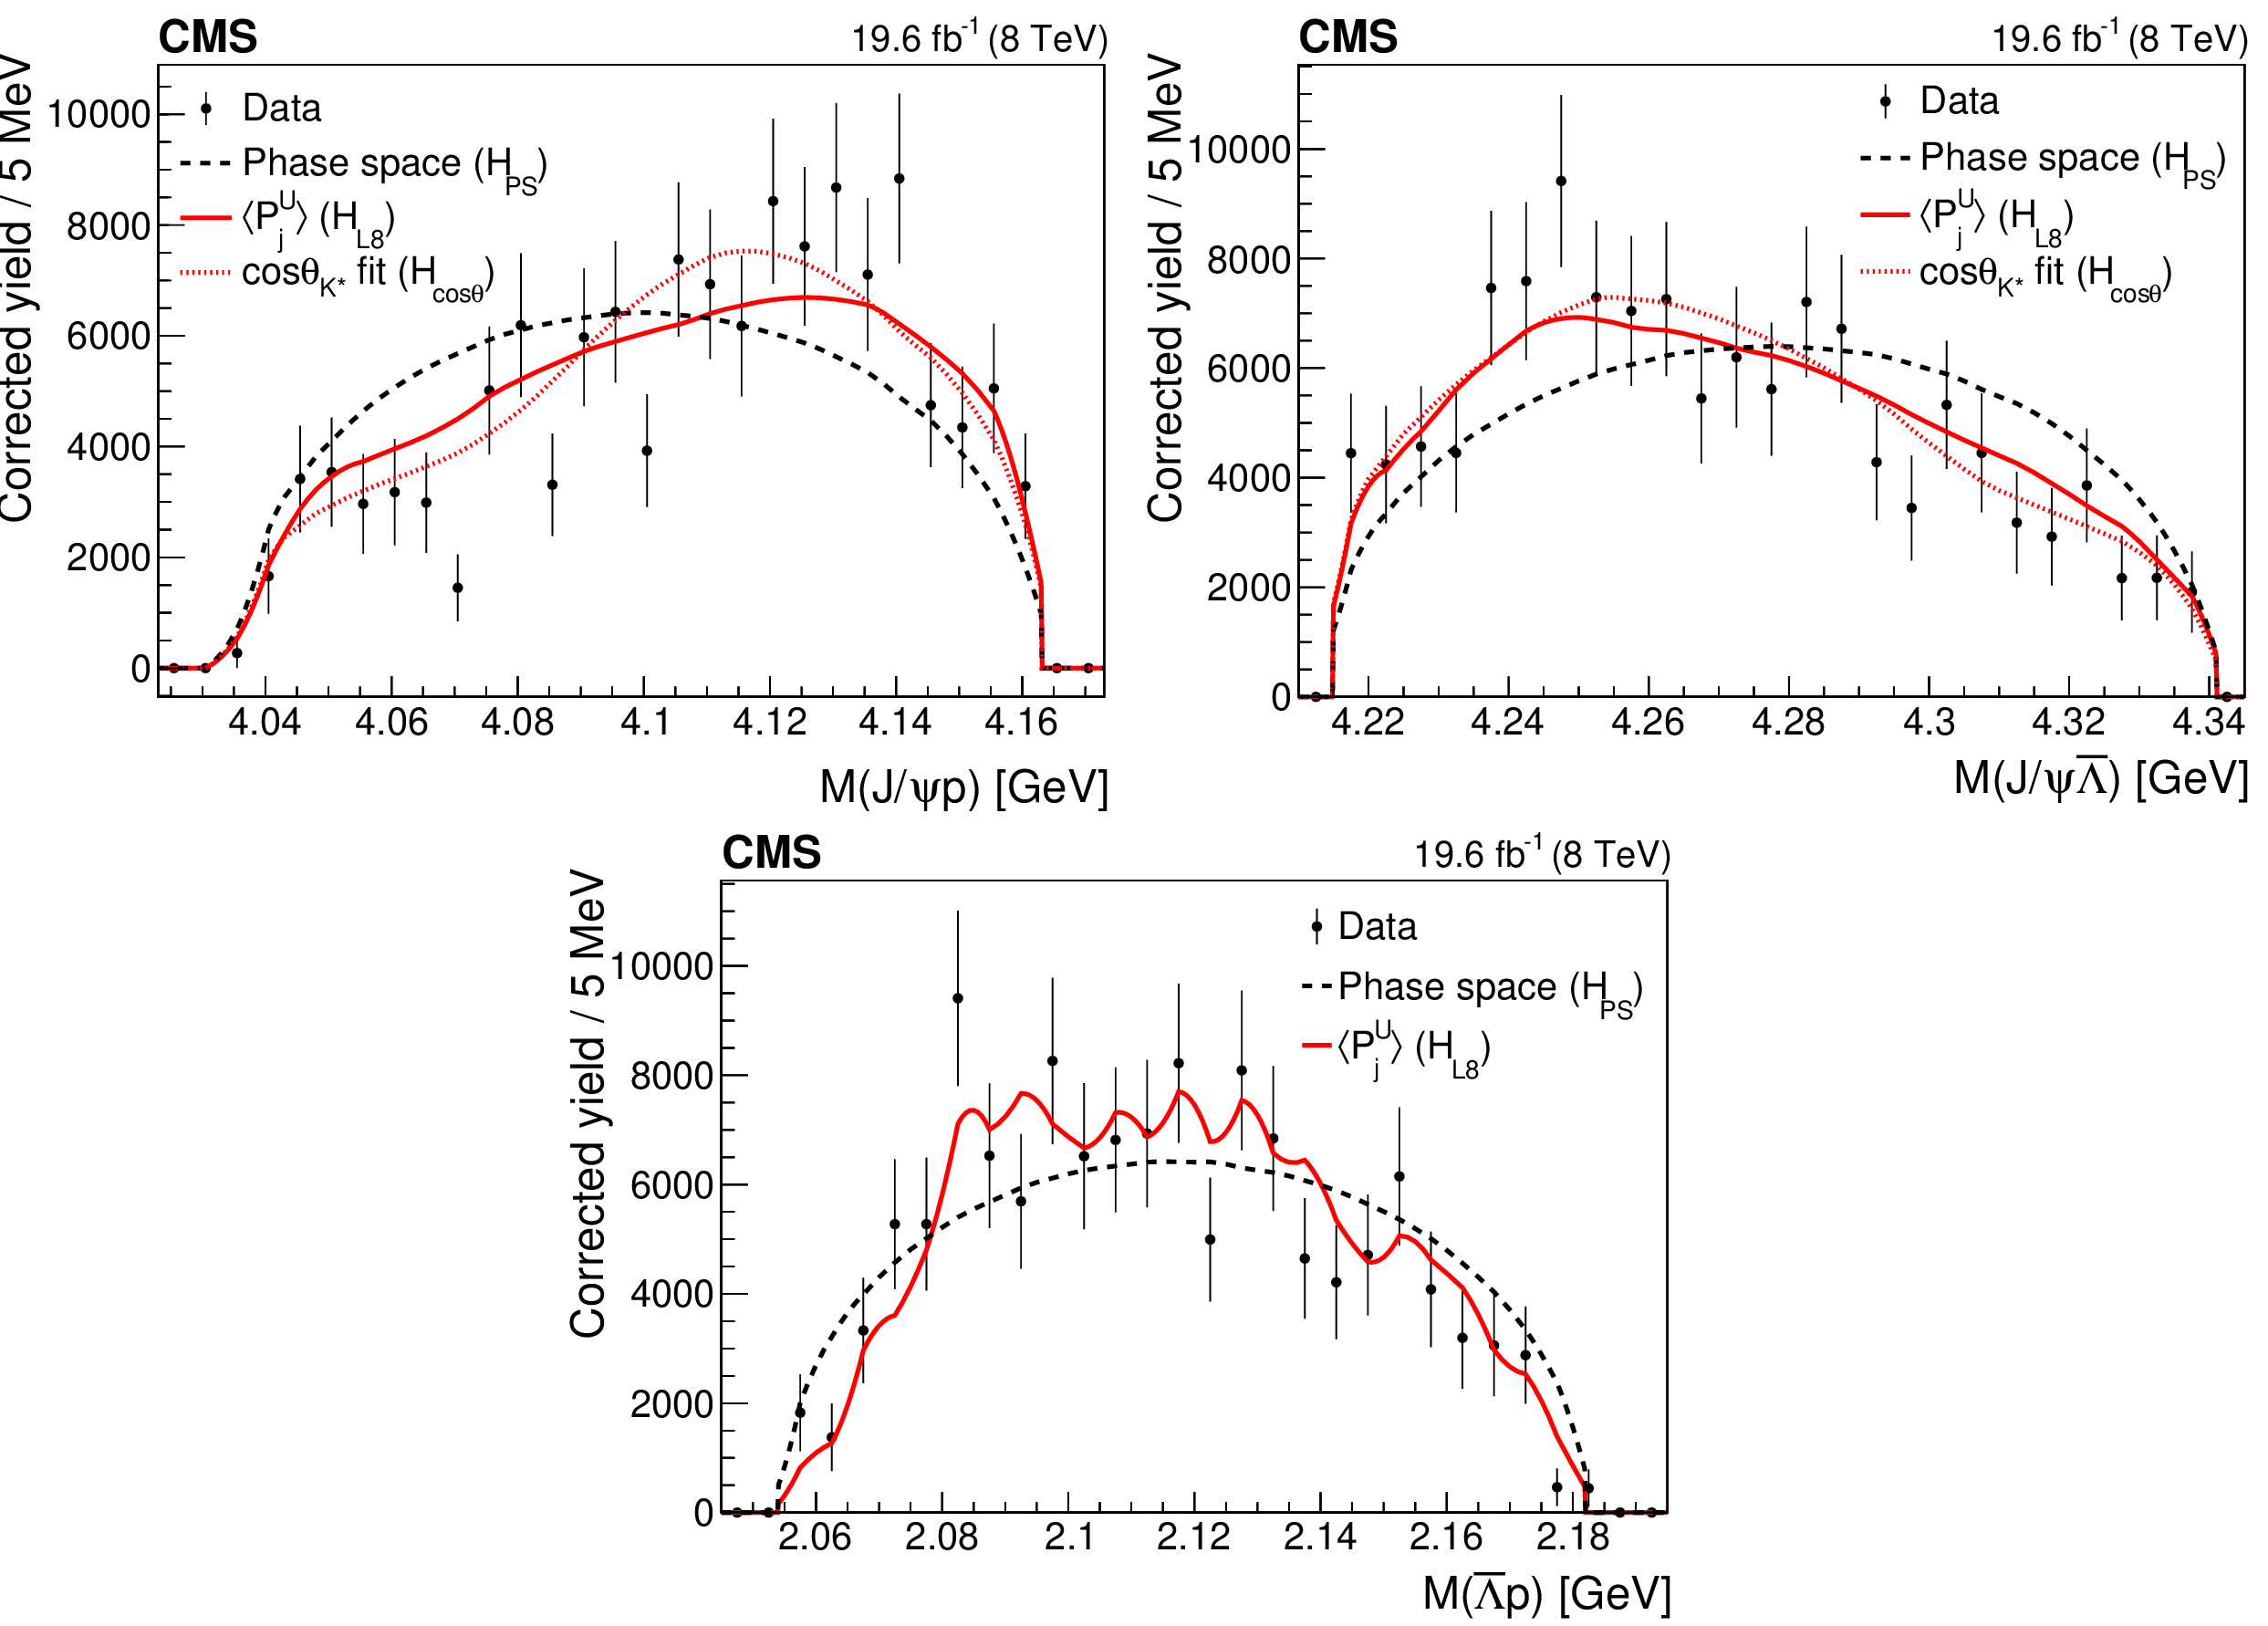
The invariant mass distributions of the ${\mathrm{J}/\psi} {\mathrm{p}} $ (upper left), ${\mathrm{J}/\psi} \bar{\Lambda} $ (upper right), and $\bar{\Lambda} {\mathrm{p}} $ (lower) systems from the $\mathrm{B^{+}} \to {\mathrm{J}/\psi} \bar{\Lambda} {\mathrm{p}} $ decay. The points show the efficiency-corrected, background-subtracted data; the vertical bars represent the statistical uncertainty. Superimposed curves are obtained from simulation: the dashed lines correspond to the pure phase space fit ($H_{\text {PS}}$); the solid curves represent the phase space distribution corrected for the $\bar{\Lambda} {\mathrm{p}} $ angular structure with the inclusion of the first eight moments, corresponding to resonances decaying to the $\bar{\Lambda} {\mathrm{p}} $ system with maximum spin of 4 ($H_{\text {L8}}$); the dotted curves show the fits to the phase space distribution reweighted according to the $ {\cos\theta _{{\mathrm{K}} ^*}} $ distribution, which is defined as the $H_{\cos\theta}$ hypothesis. The mentioned curves are explained in Section 8.1. |
png pdf |
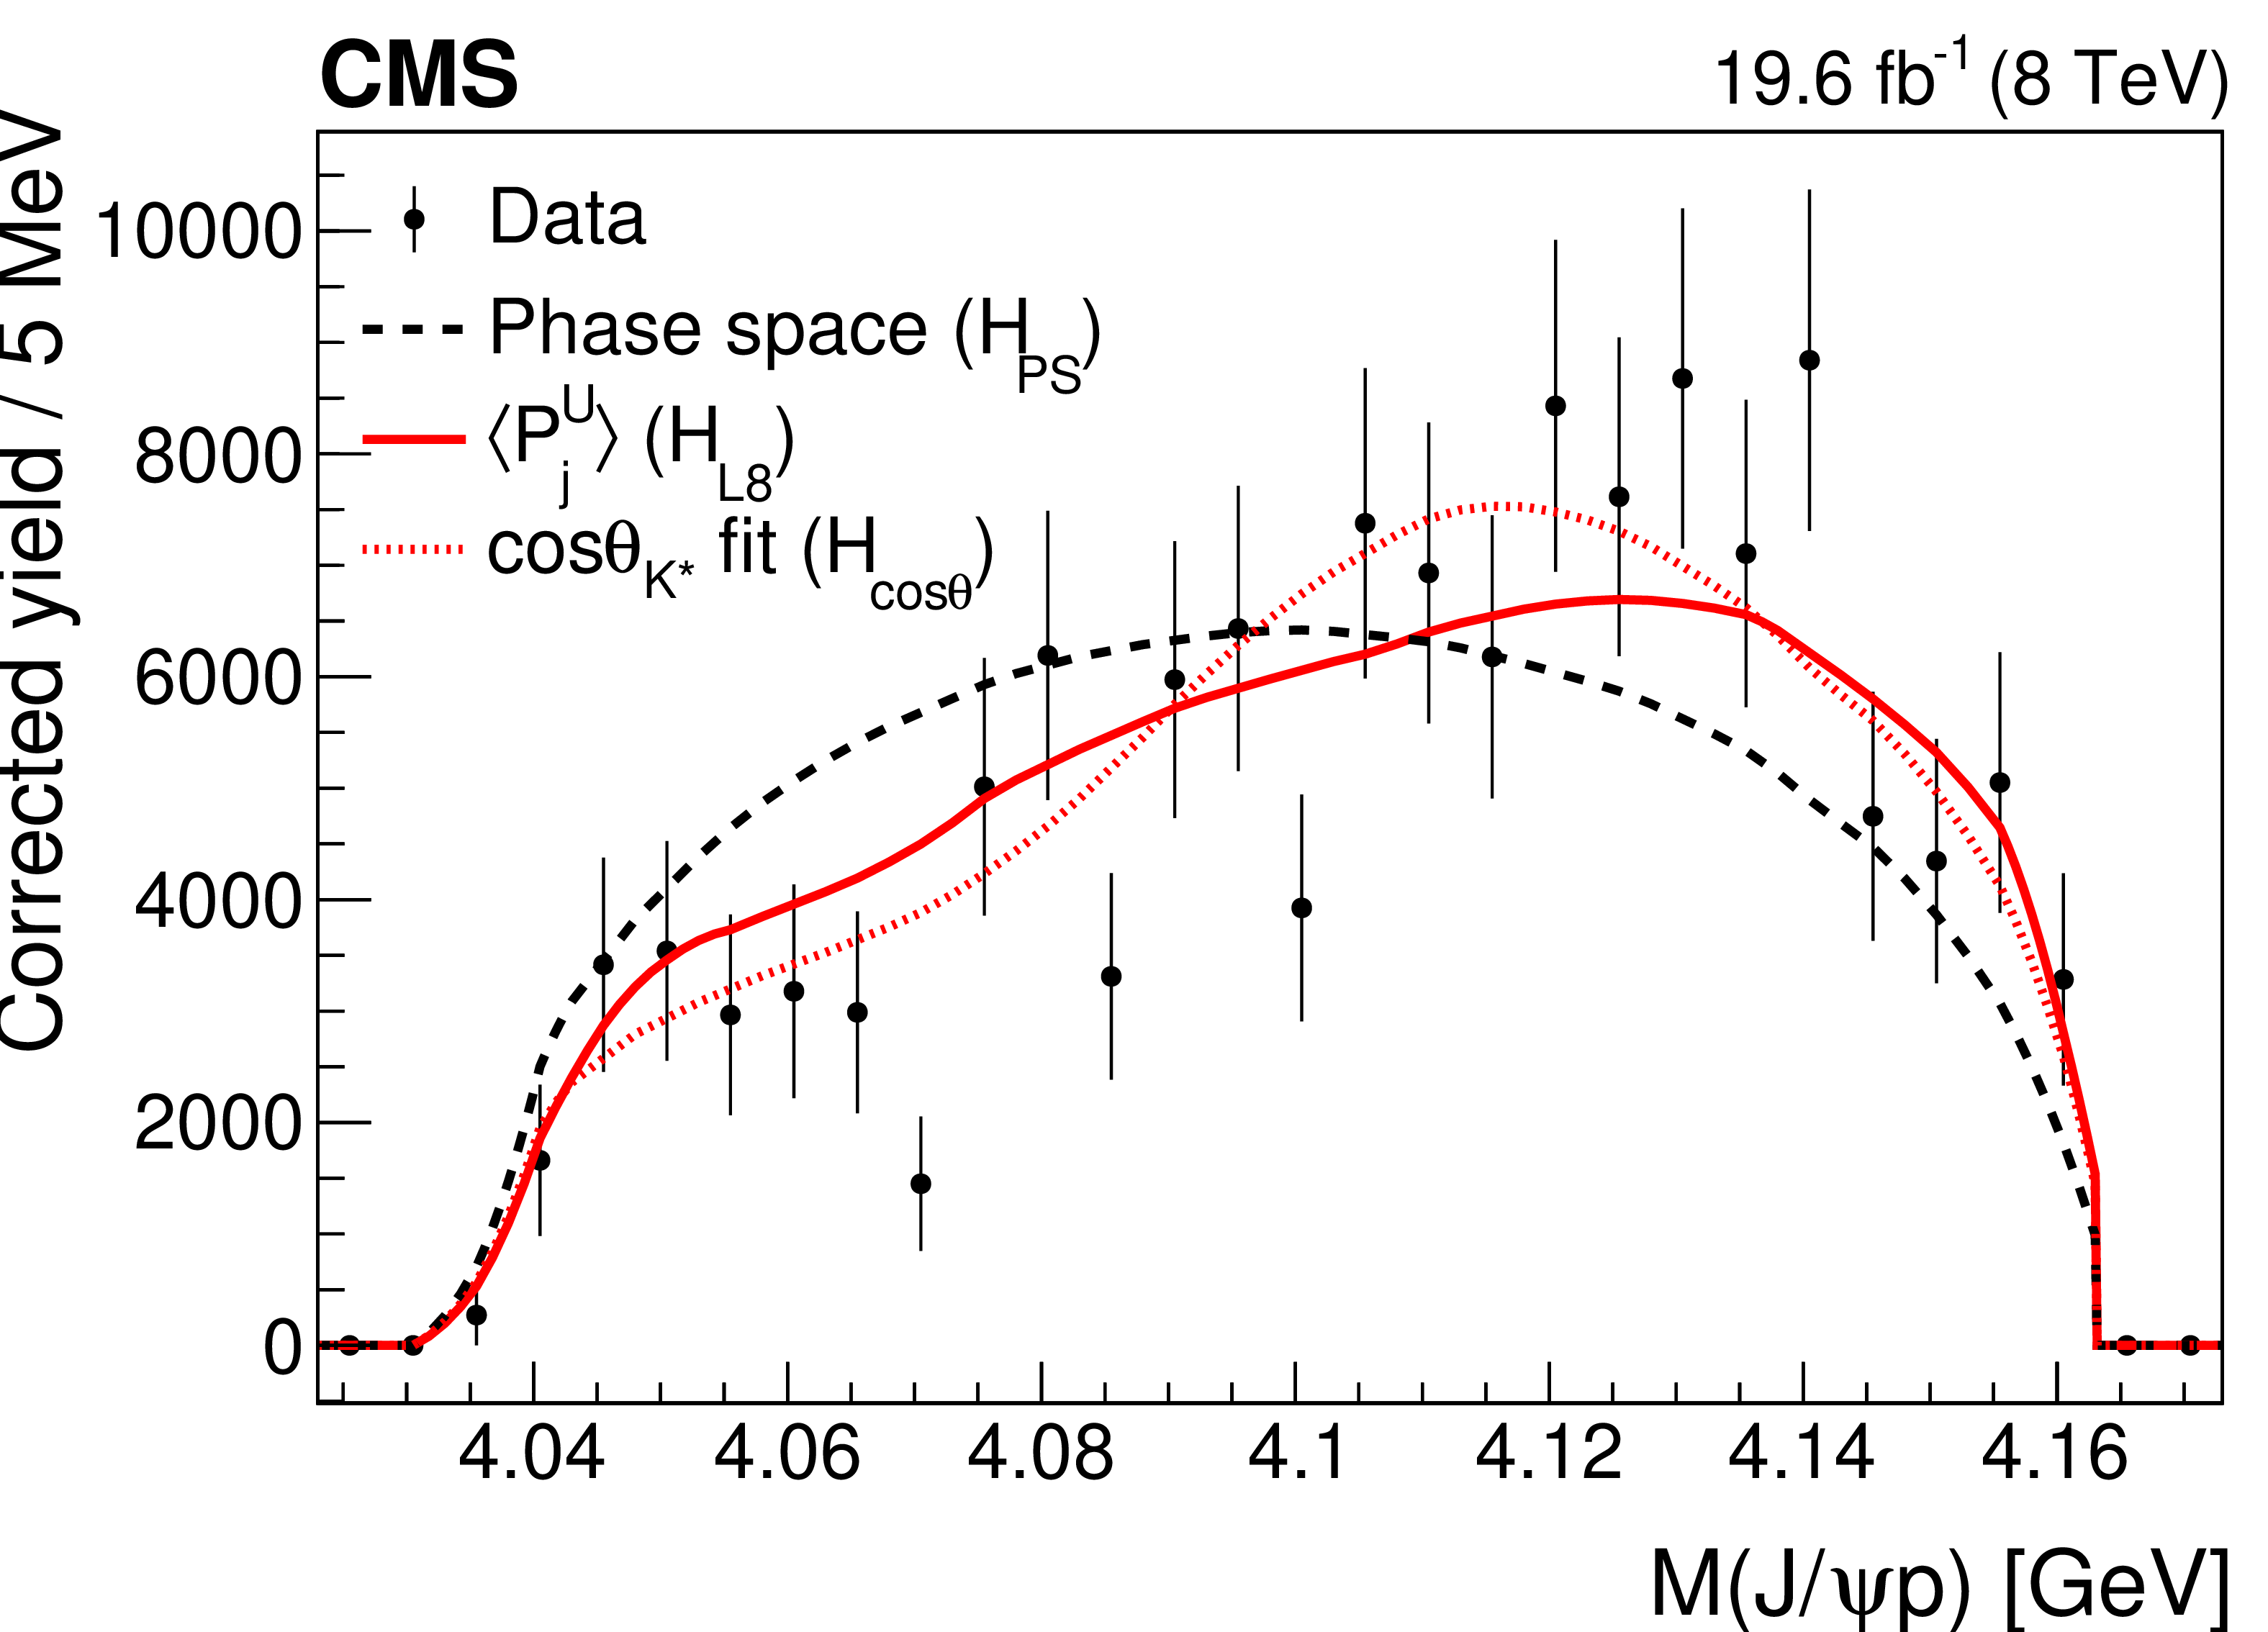
Figure 3-a:
The invariant mass distributions of the ${\mathrm{J}/\psi} {\mathrm{p}} $ systems from the $\mathrm{B^{+}} \to {\mathrm{J}/\psi} \bar{\Lambda} {\mathrm{p}} $ decay. The points show the efficiency-corrected, background-subtracted data; the vertical bars represent the statistical uncertainty. Superimposed curves are obtained from simulation: the dashed lines correspond to the pure phase space fit ($H_{\text {PS}}$); the solid curves represent the phase space distribution corrected for the $\bar{\Lambda} {\mathrm{p}} $ angular structure with the inclusion of the first eight moments, corresponding to resonances decaying to the $\bar{\Lambda} {\mathrm{p}} $ system with maximum spin of 4 ($H_{\text {L8}}$); the dotted curves show the fits to the phase space distribution reweighted according to the $ {\cos\theta _{{\mathrm{K}} ^*}} $ distribution, which is defined as the $H_{\cos\theta}$ hypothesis. The mentioned curves are explained in Section 8.1. |
png pdf |
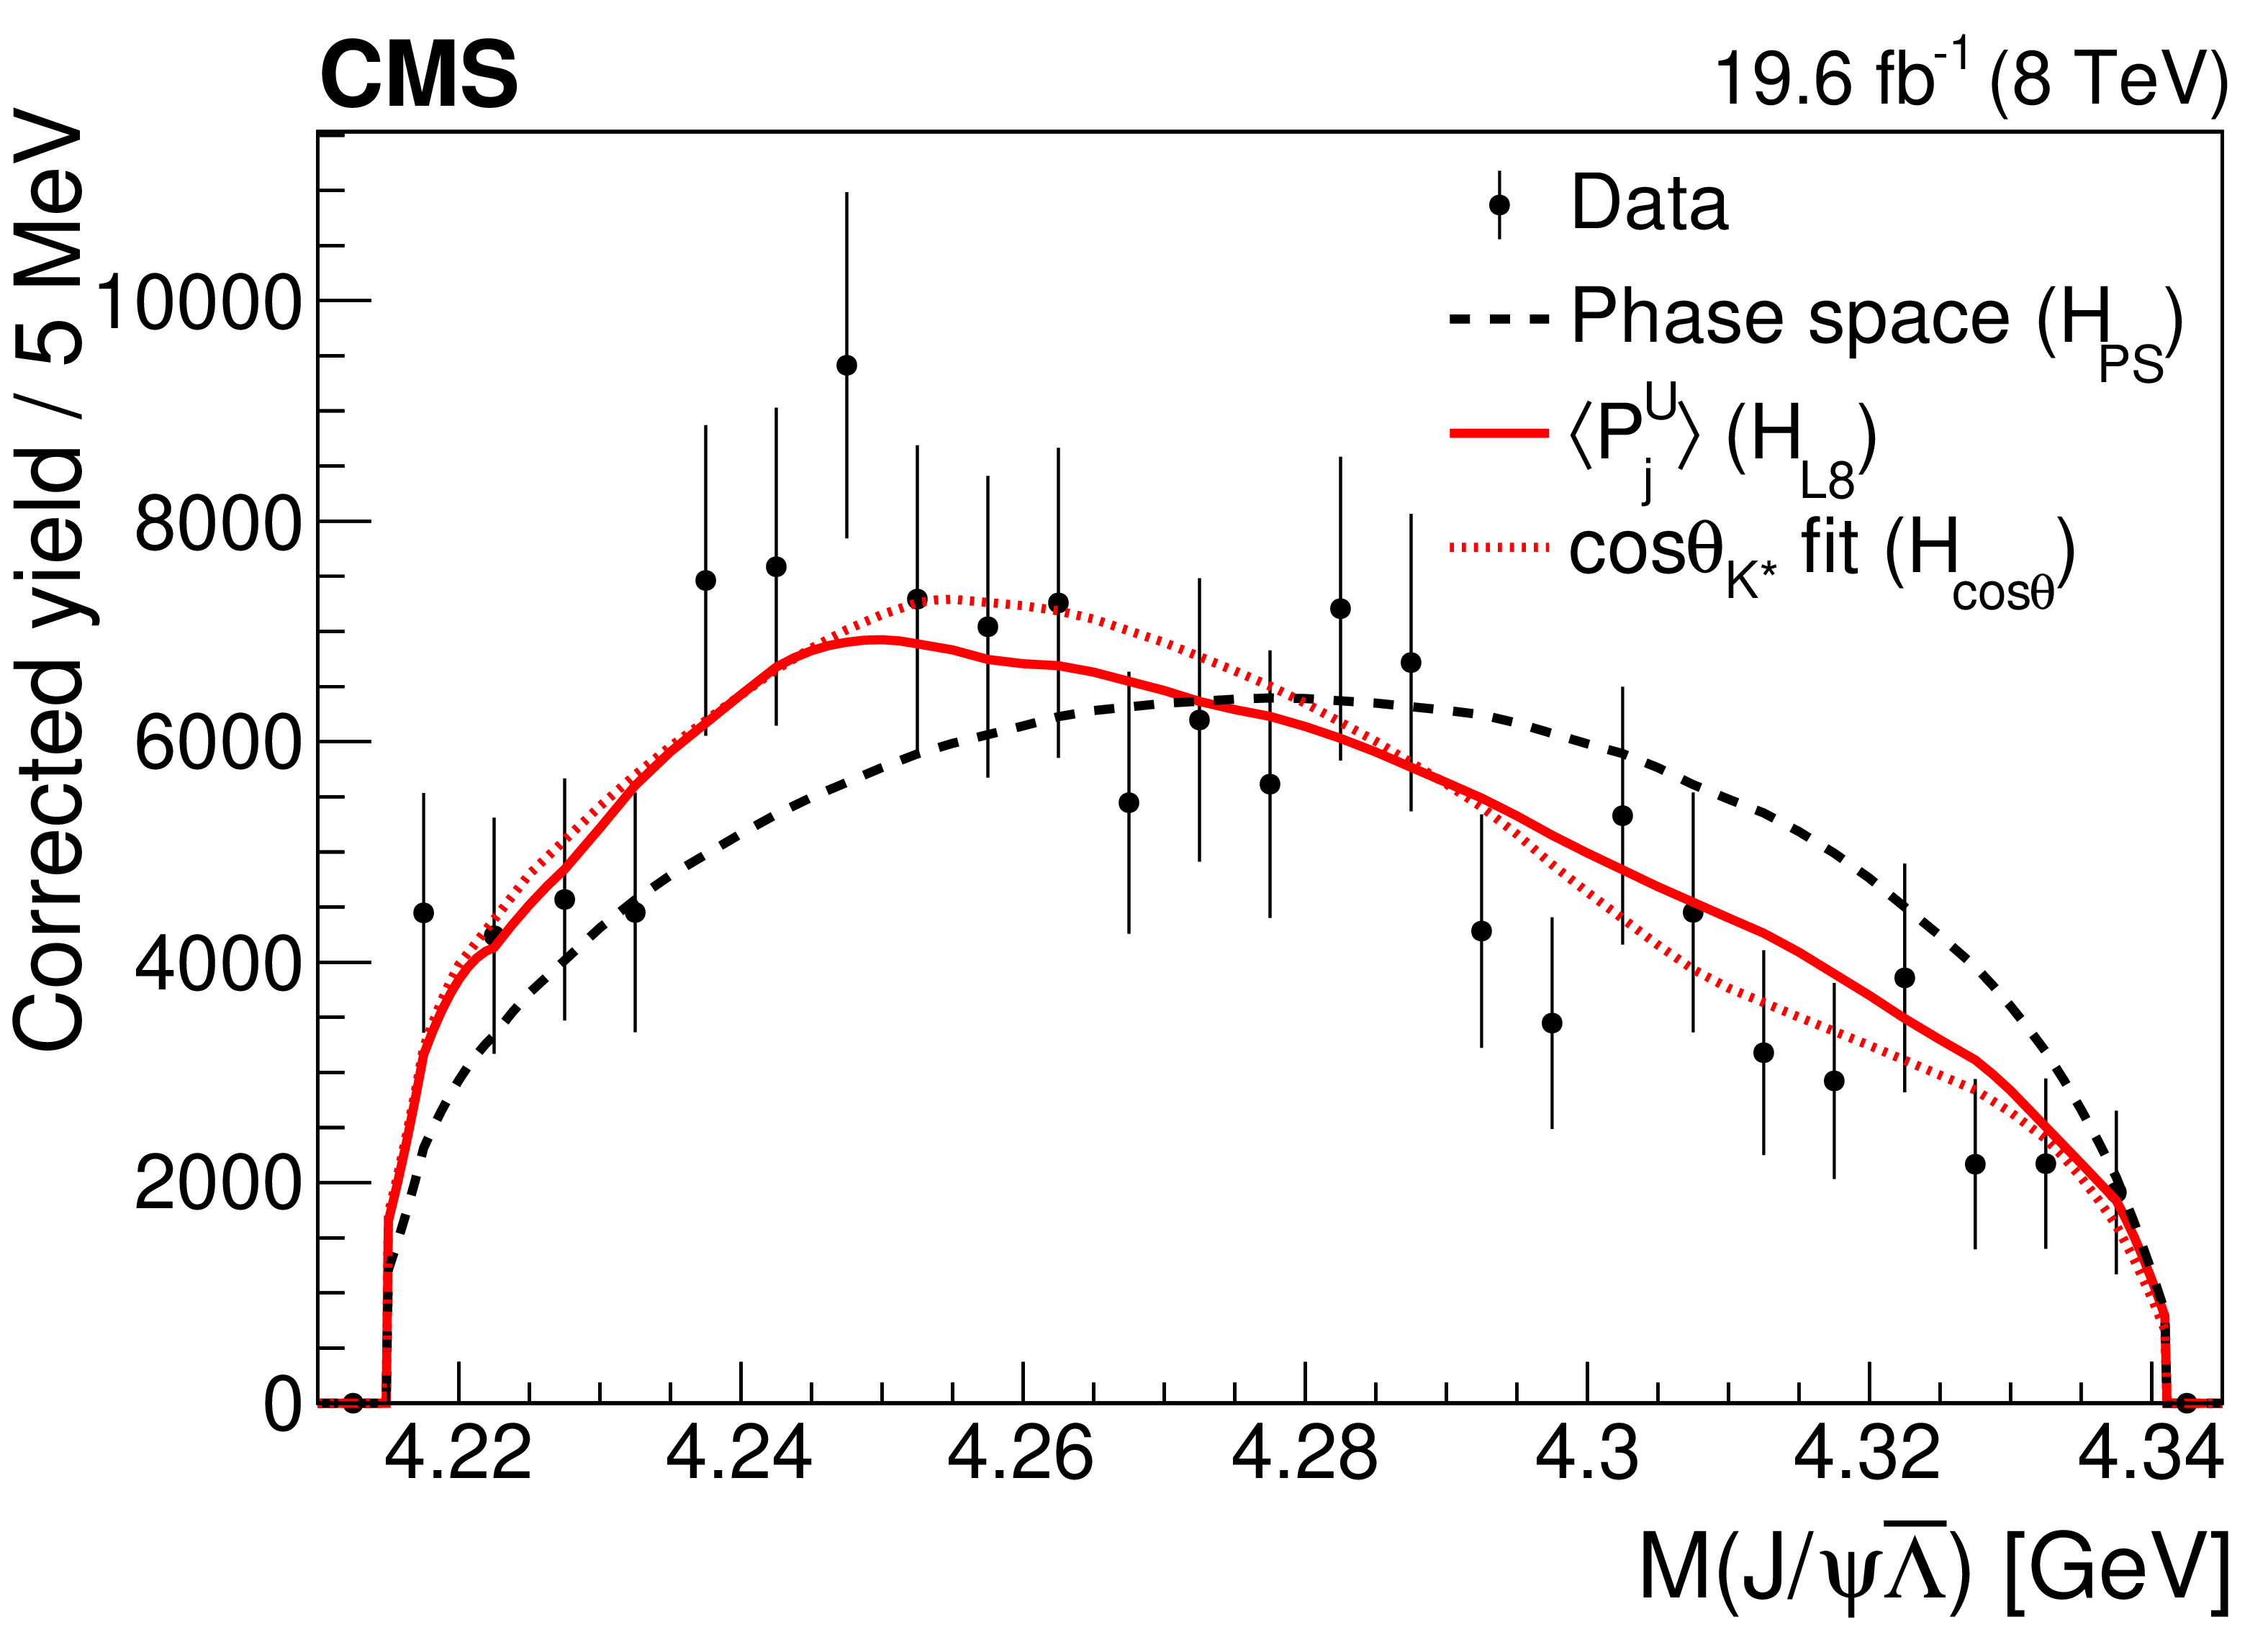
Figure 3-b:
The invariant mass distributions of the ${\mathrm{J}/\psi} \bar{\Lambda} $ systems from the $\mathrm{B^{+}} \to {\mathrm{J}/\psi} \bar{\Lambda} {\mathrm{p}} $ decay. The points show the efficiency-corrected, background-subtracted data; the vertical bars represent the statistical uncertainty. Superimposed curves are obtained from simulation: the dashed lines correspond to the pure phase space fit ($H_{\text {PS}}$); the solid curves represent the phase space distribution corrected for the $\bar{\Lambda} {\mathrm{p}} $ angular structure with the inclusion of the first eight moments, corresponding to resonances decaying to the $\bar{\Lambda} {\mathrm{p}} $ system with maximum spin of 4 ($H_{\text {L8}}$); the dotted curves show the fits to the phase space distribution reweighted according to the $ {\cos\theta _{{\mathrm{K}} ^*}} $ distribution, which is defined as the $H_{\cos\theta}$ hypothesis. The mentioned curves are explained in Section 8.1. |
png pdf |
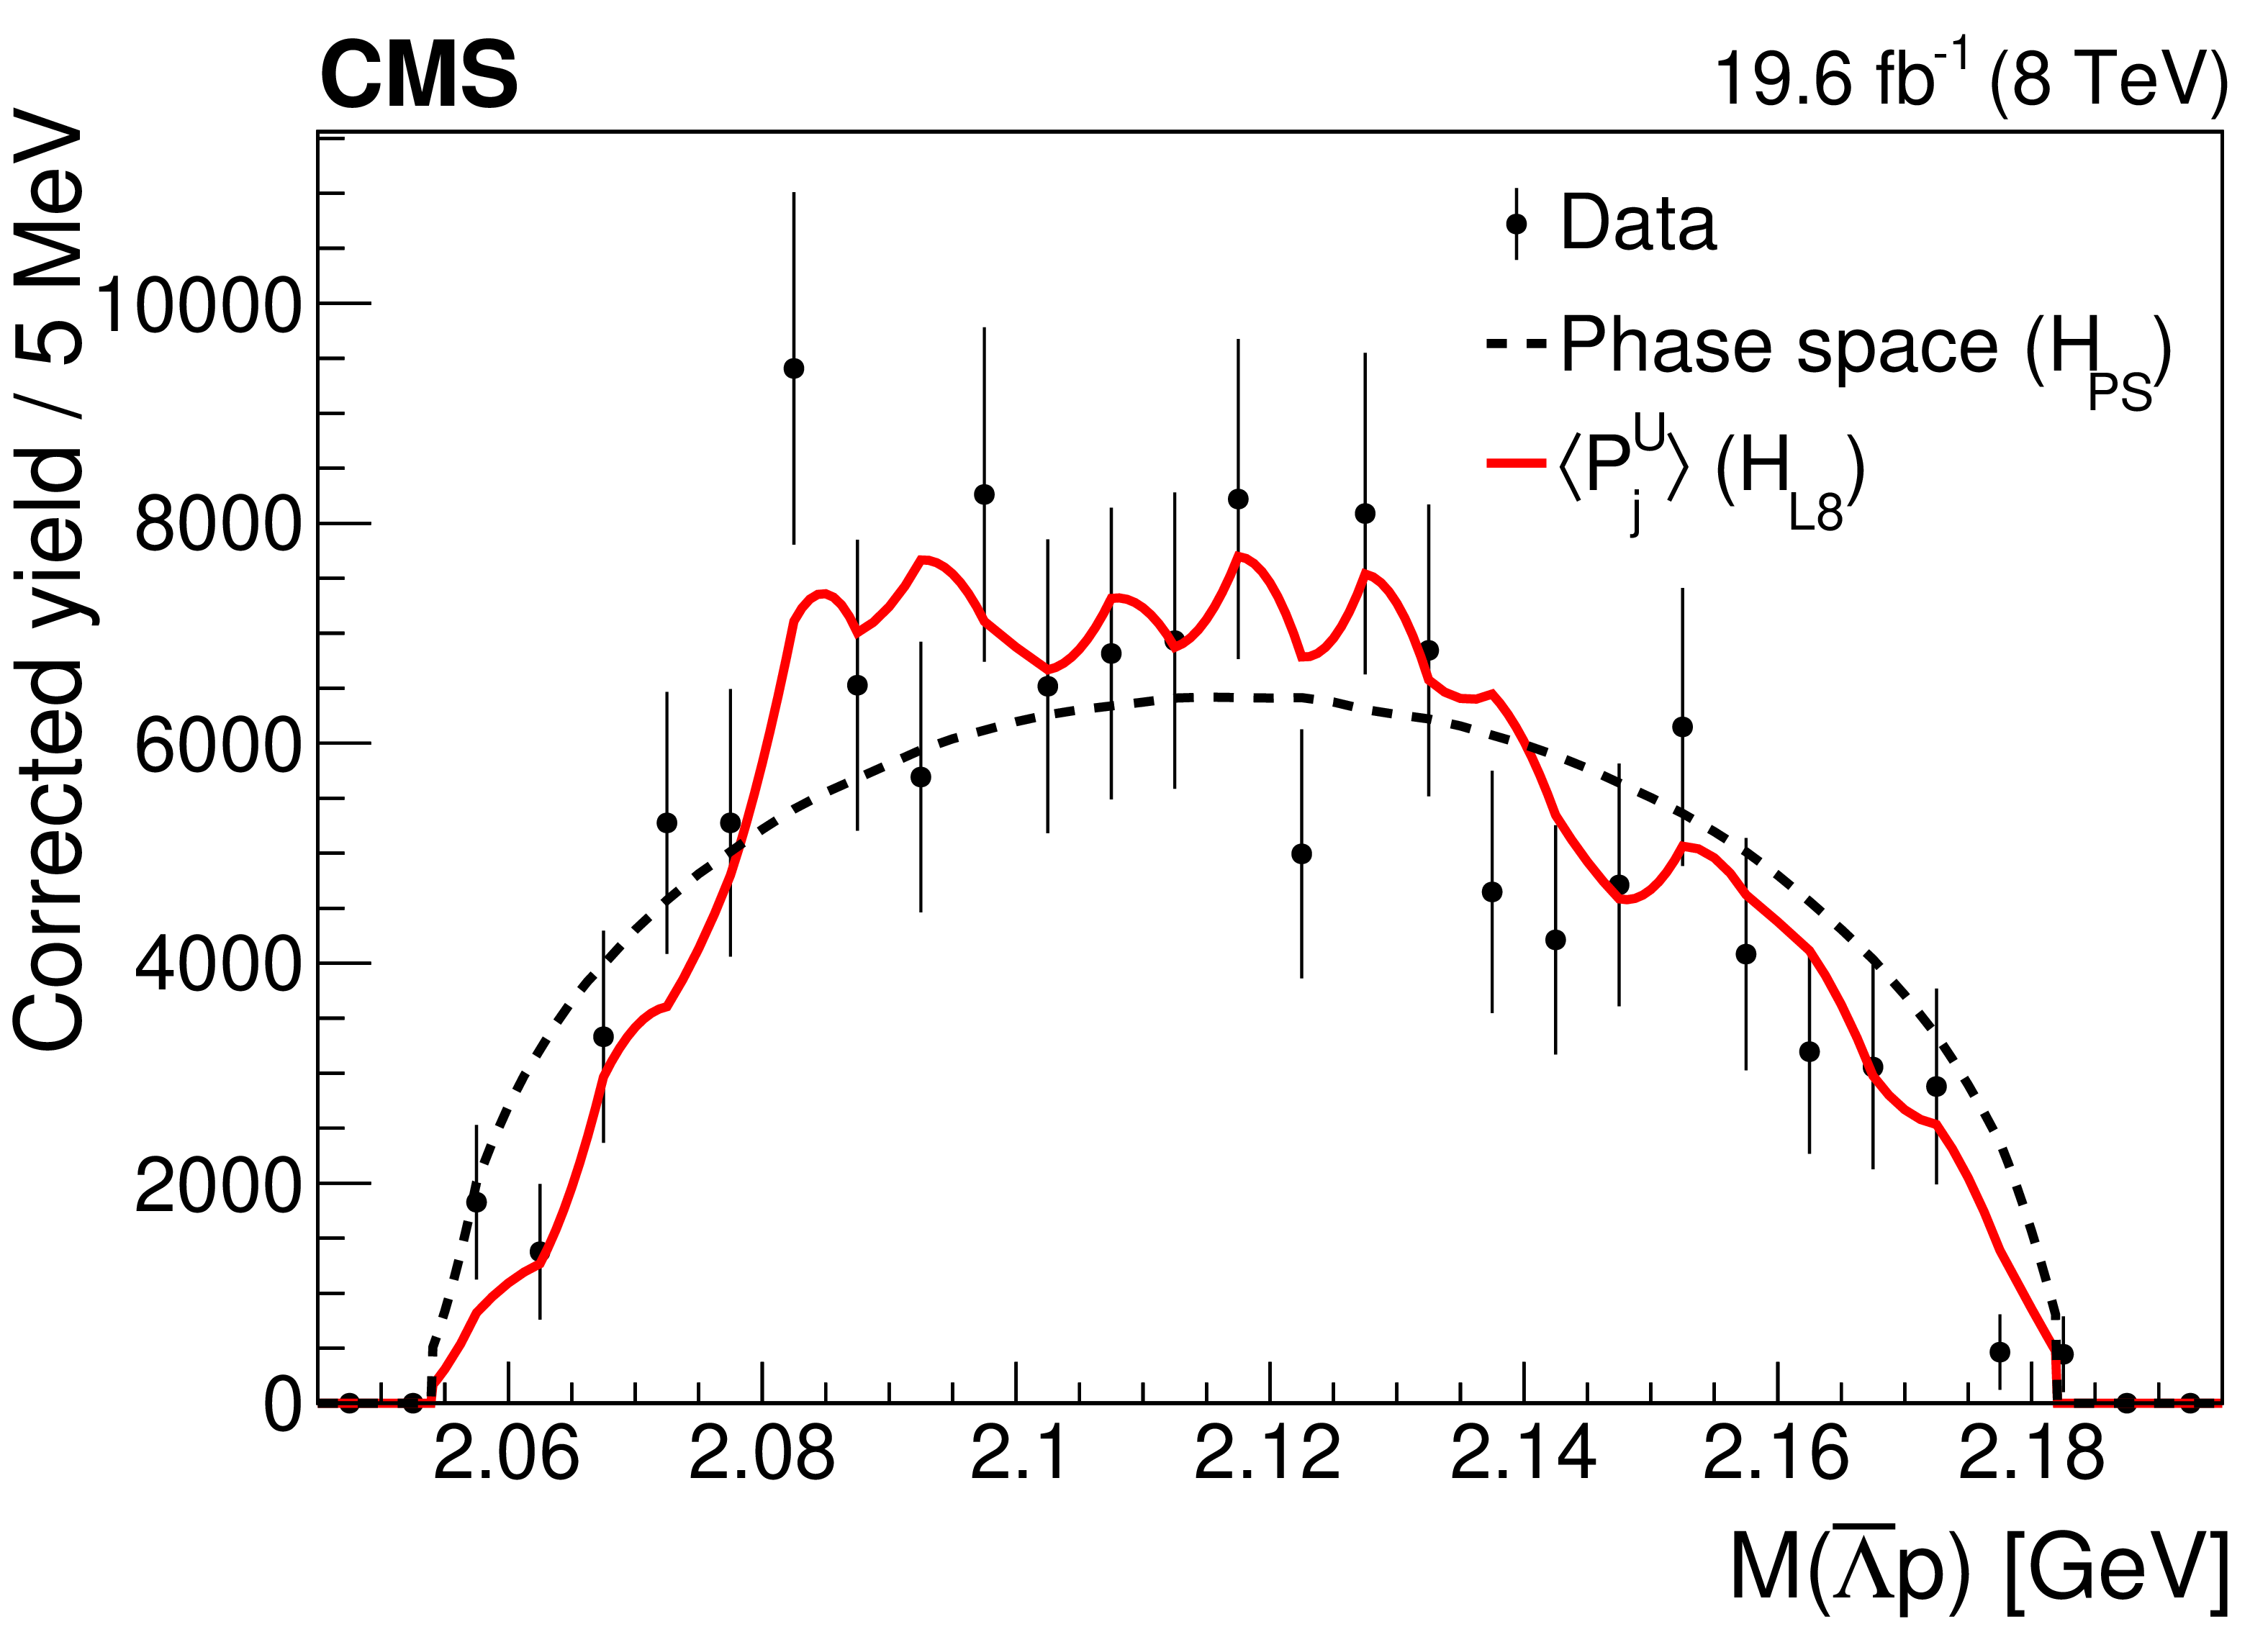
Figure 3-c:
The invariant mass distributions of the $\bar{\Lambda} {\mathrm{p}} $ systems from the $\mathrm{B^{+}} \to {\mathrm{J}/\psi} \bar{\Lambda} {\mathrm{p}} $ decay. The points show the efficiency-corrected, background-subtracted data; the vertical bars represent the statistical uncertainty. Superimposed curves are obtained from simulation: the dashed lines correspond to the pure phase space fit ($H_{\text {PS}}$); the solid curves represent the phase space distribution corrected for the $\bar{\Lambda} {\mathrm{p}} $ angular structure with the inclusion of the first eight moments, corresponding to resonances decaying to the $\bar{\Lambda} {\mathrm{p}} $ system with maximum spin of 4 ($H_{\text {L8}}$); the dotted curves show the fits to the phase space distribution reweighted according to the $ {\cos\theta _{{\mathrm{K}} ^*}} $ distribution, which is defined as the $H_{\cos\theta}$ hypothesis. The mentioned curves are explained in Section 8.1. |
png pdf |
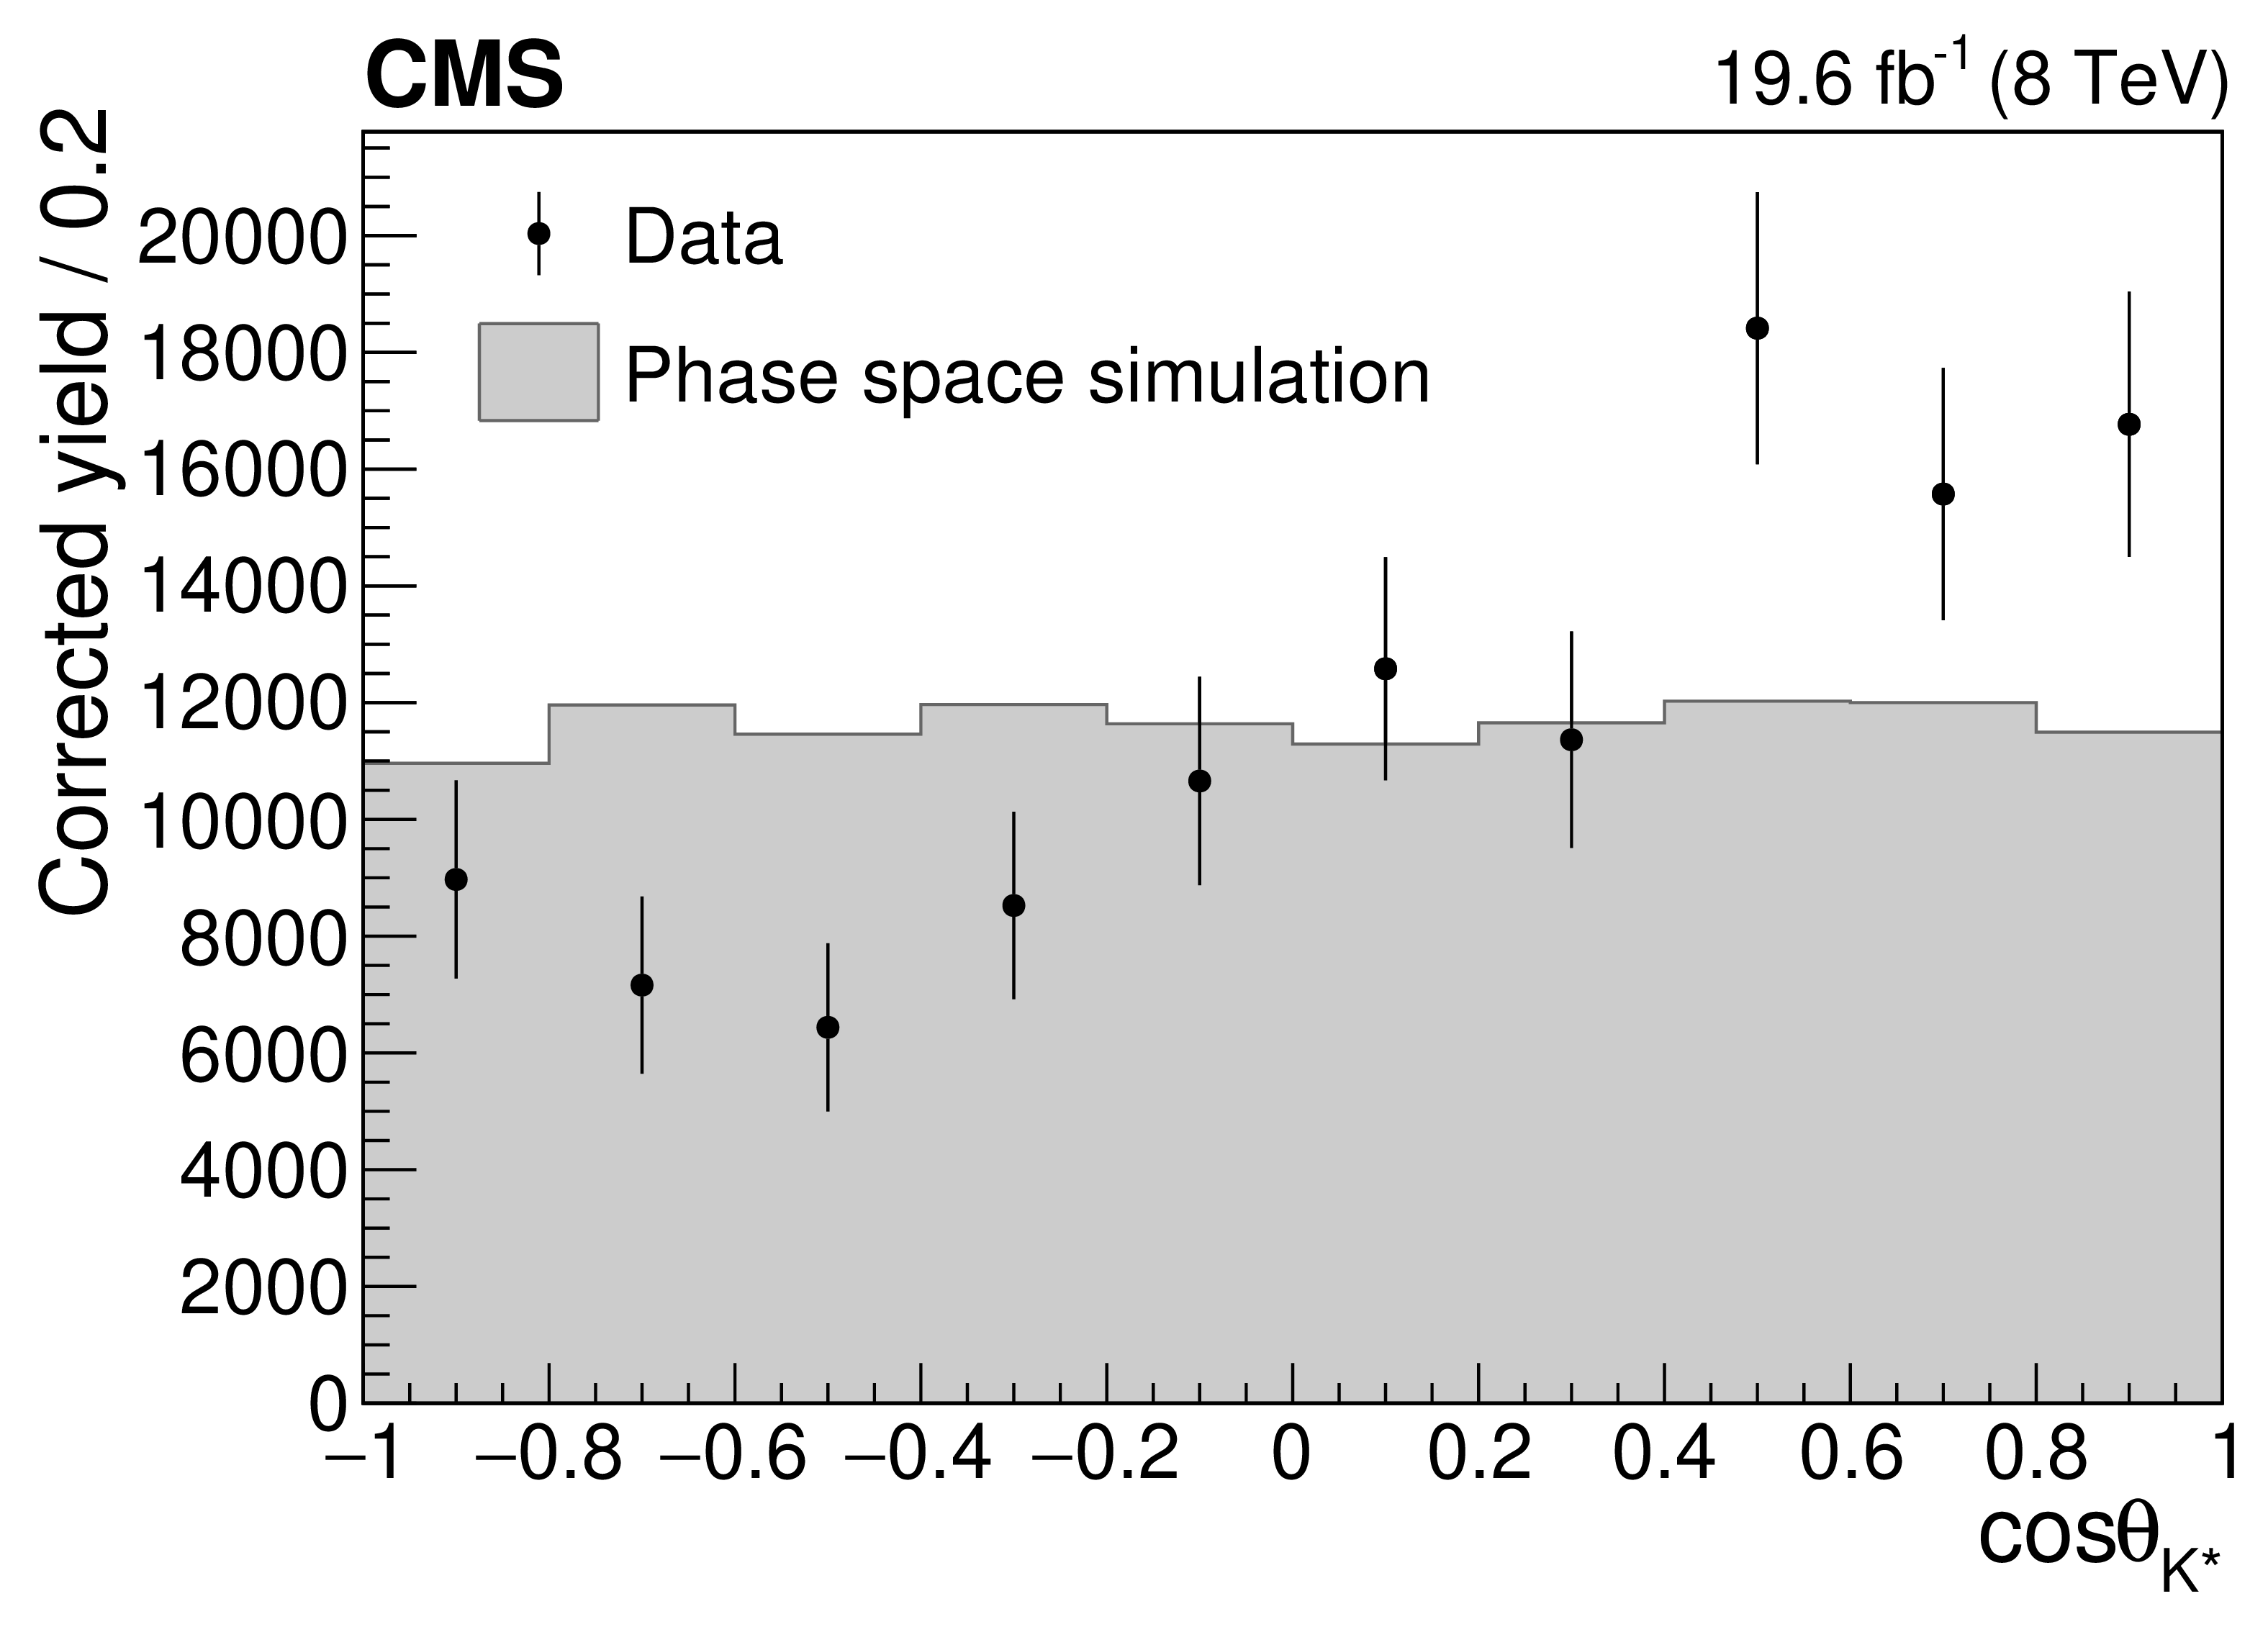
Figure 4:
The background-subtracted and efficiency-corrected $ {\cos\theta _{{\mathrm{K}} ^*}} $ distribution from the data (points with vertical bars) and the phase space simulation (shaded histogram). The vertical bars represent the statistical uncertainty. |

png pdf |
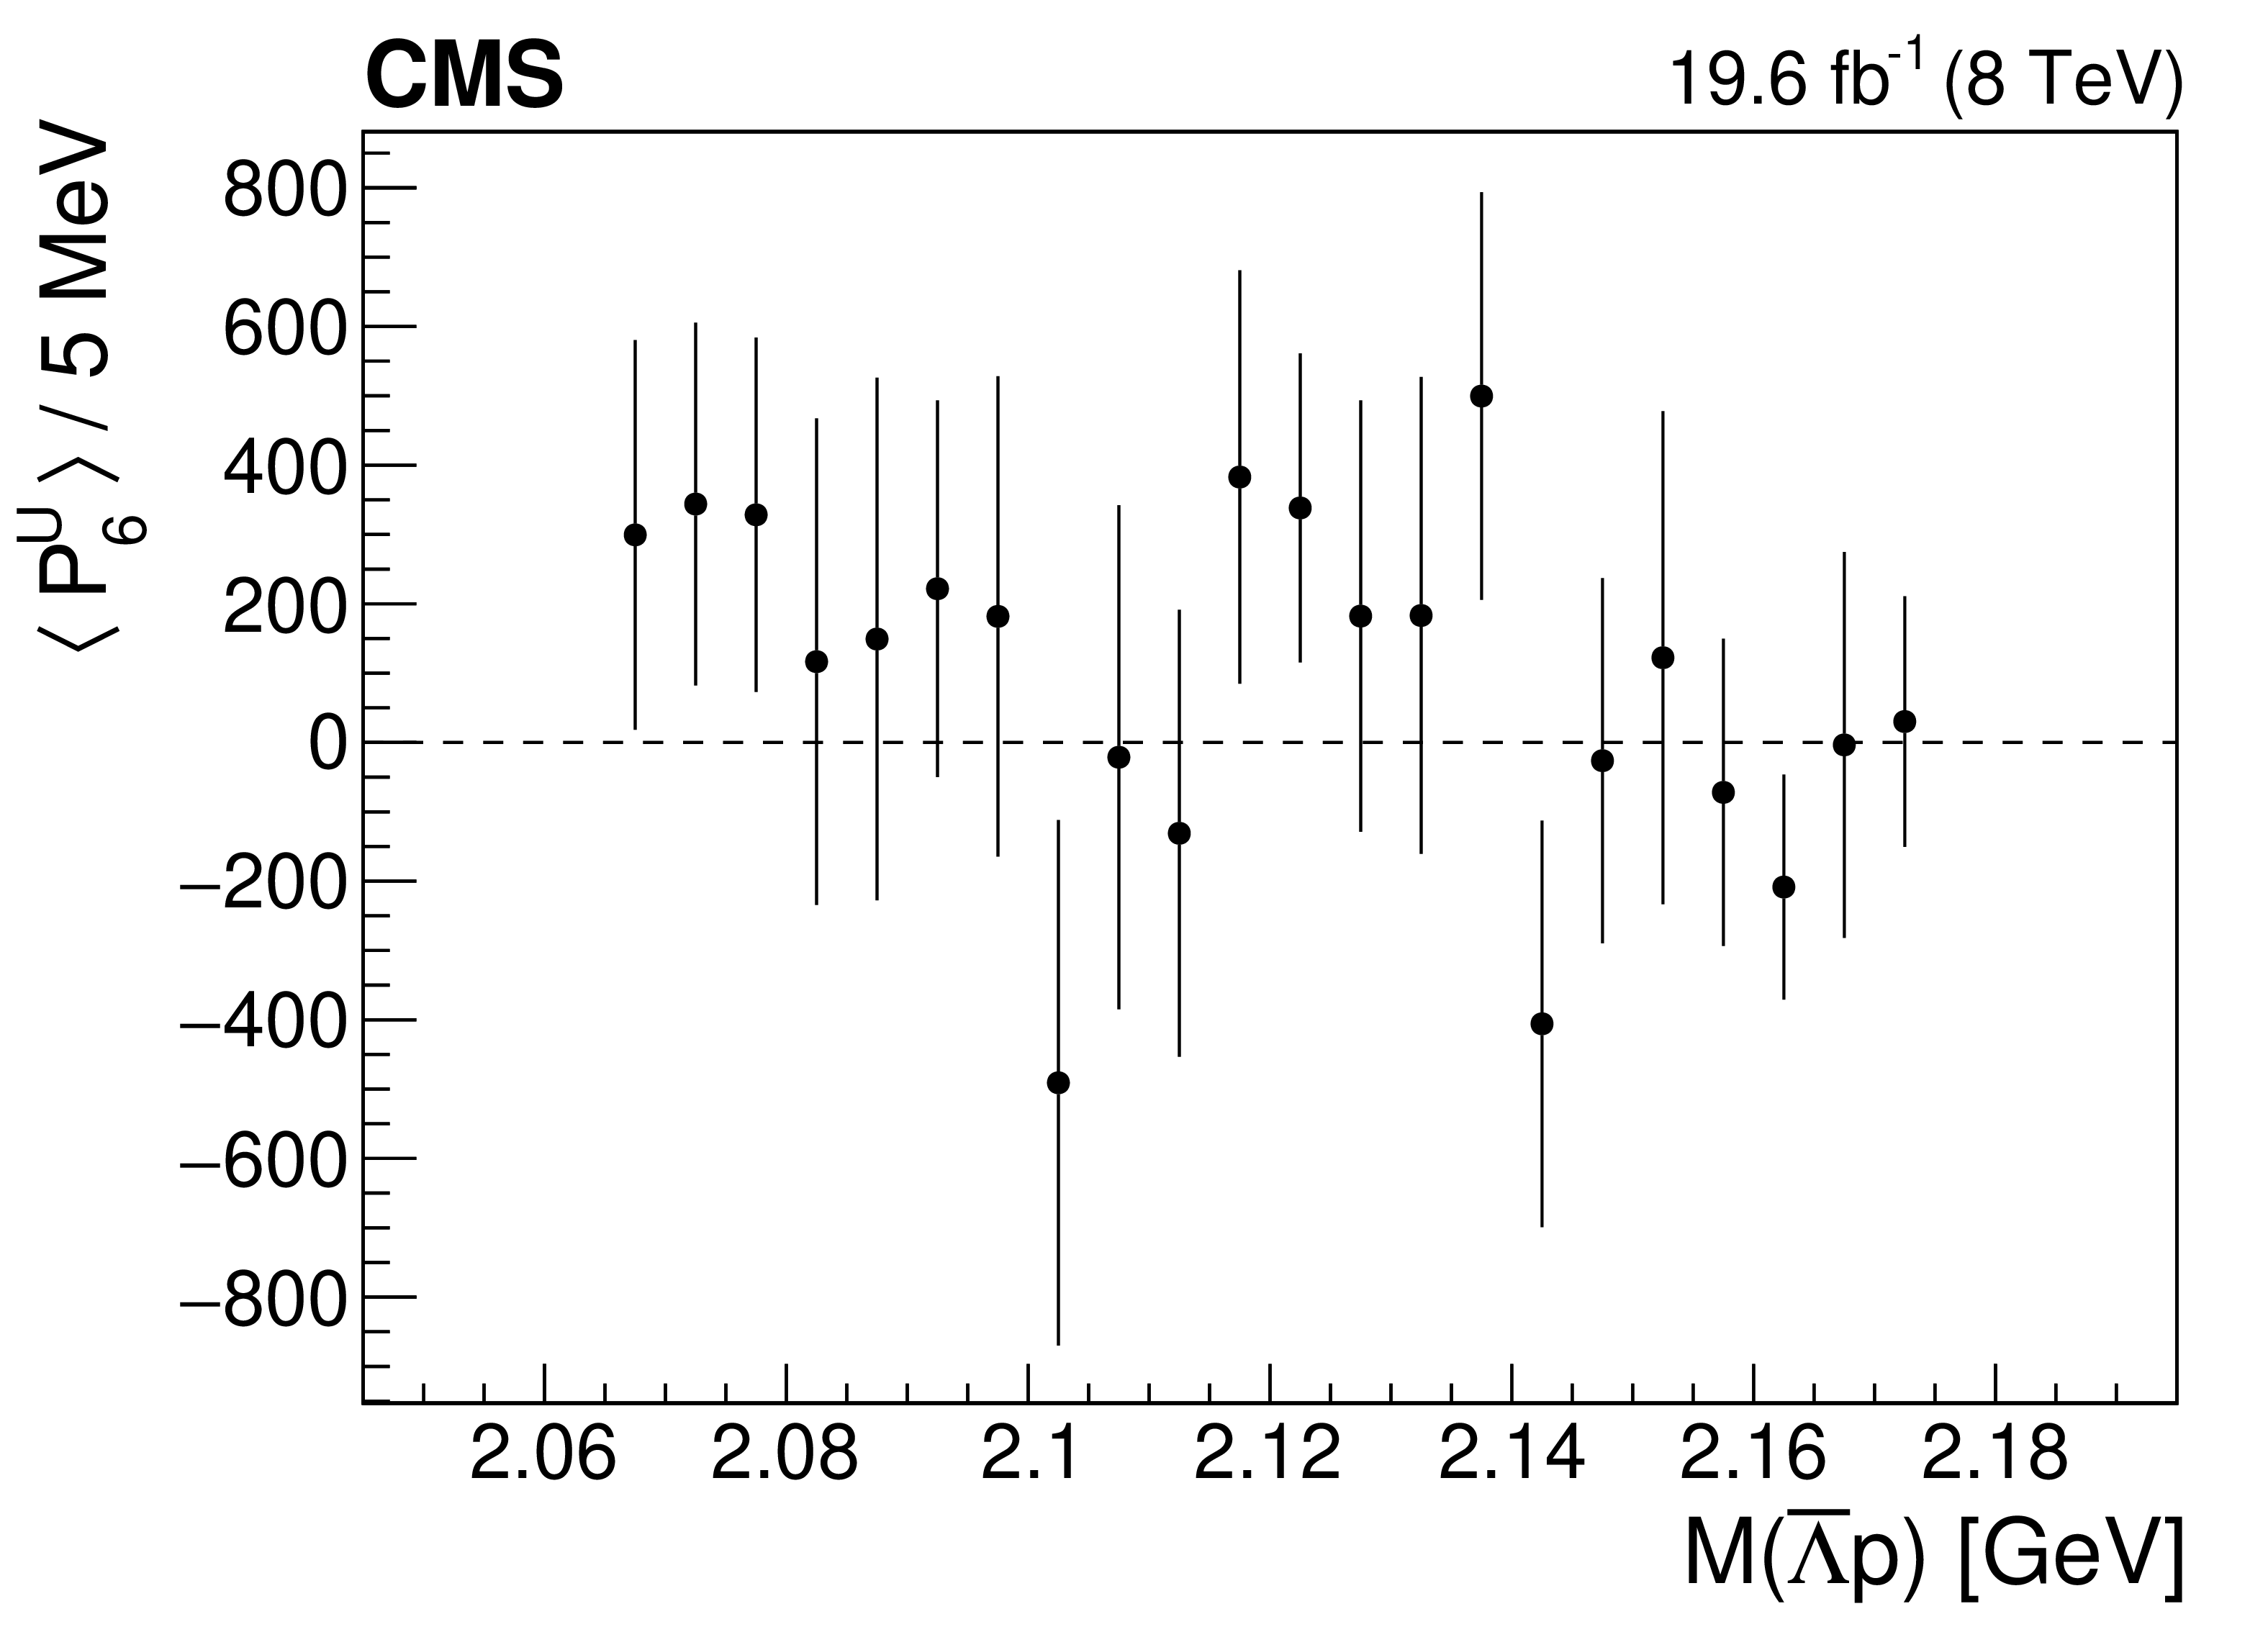
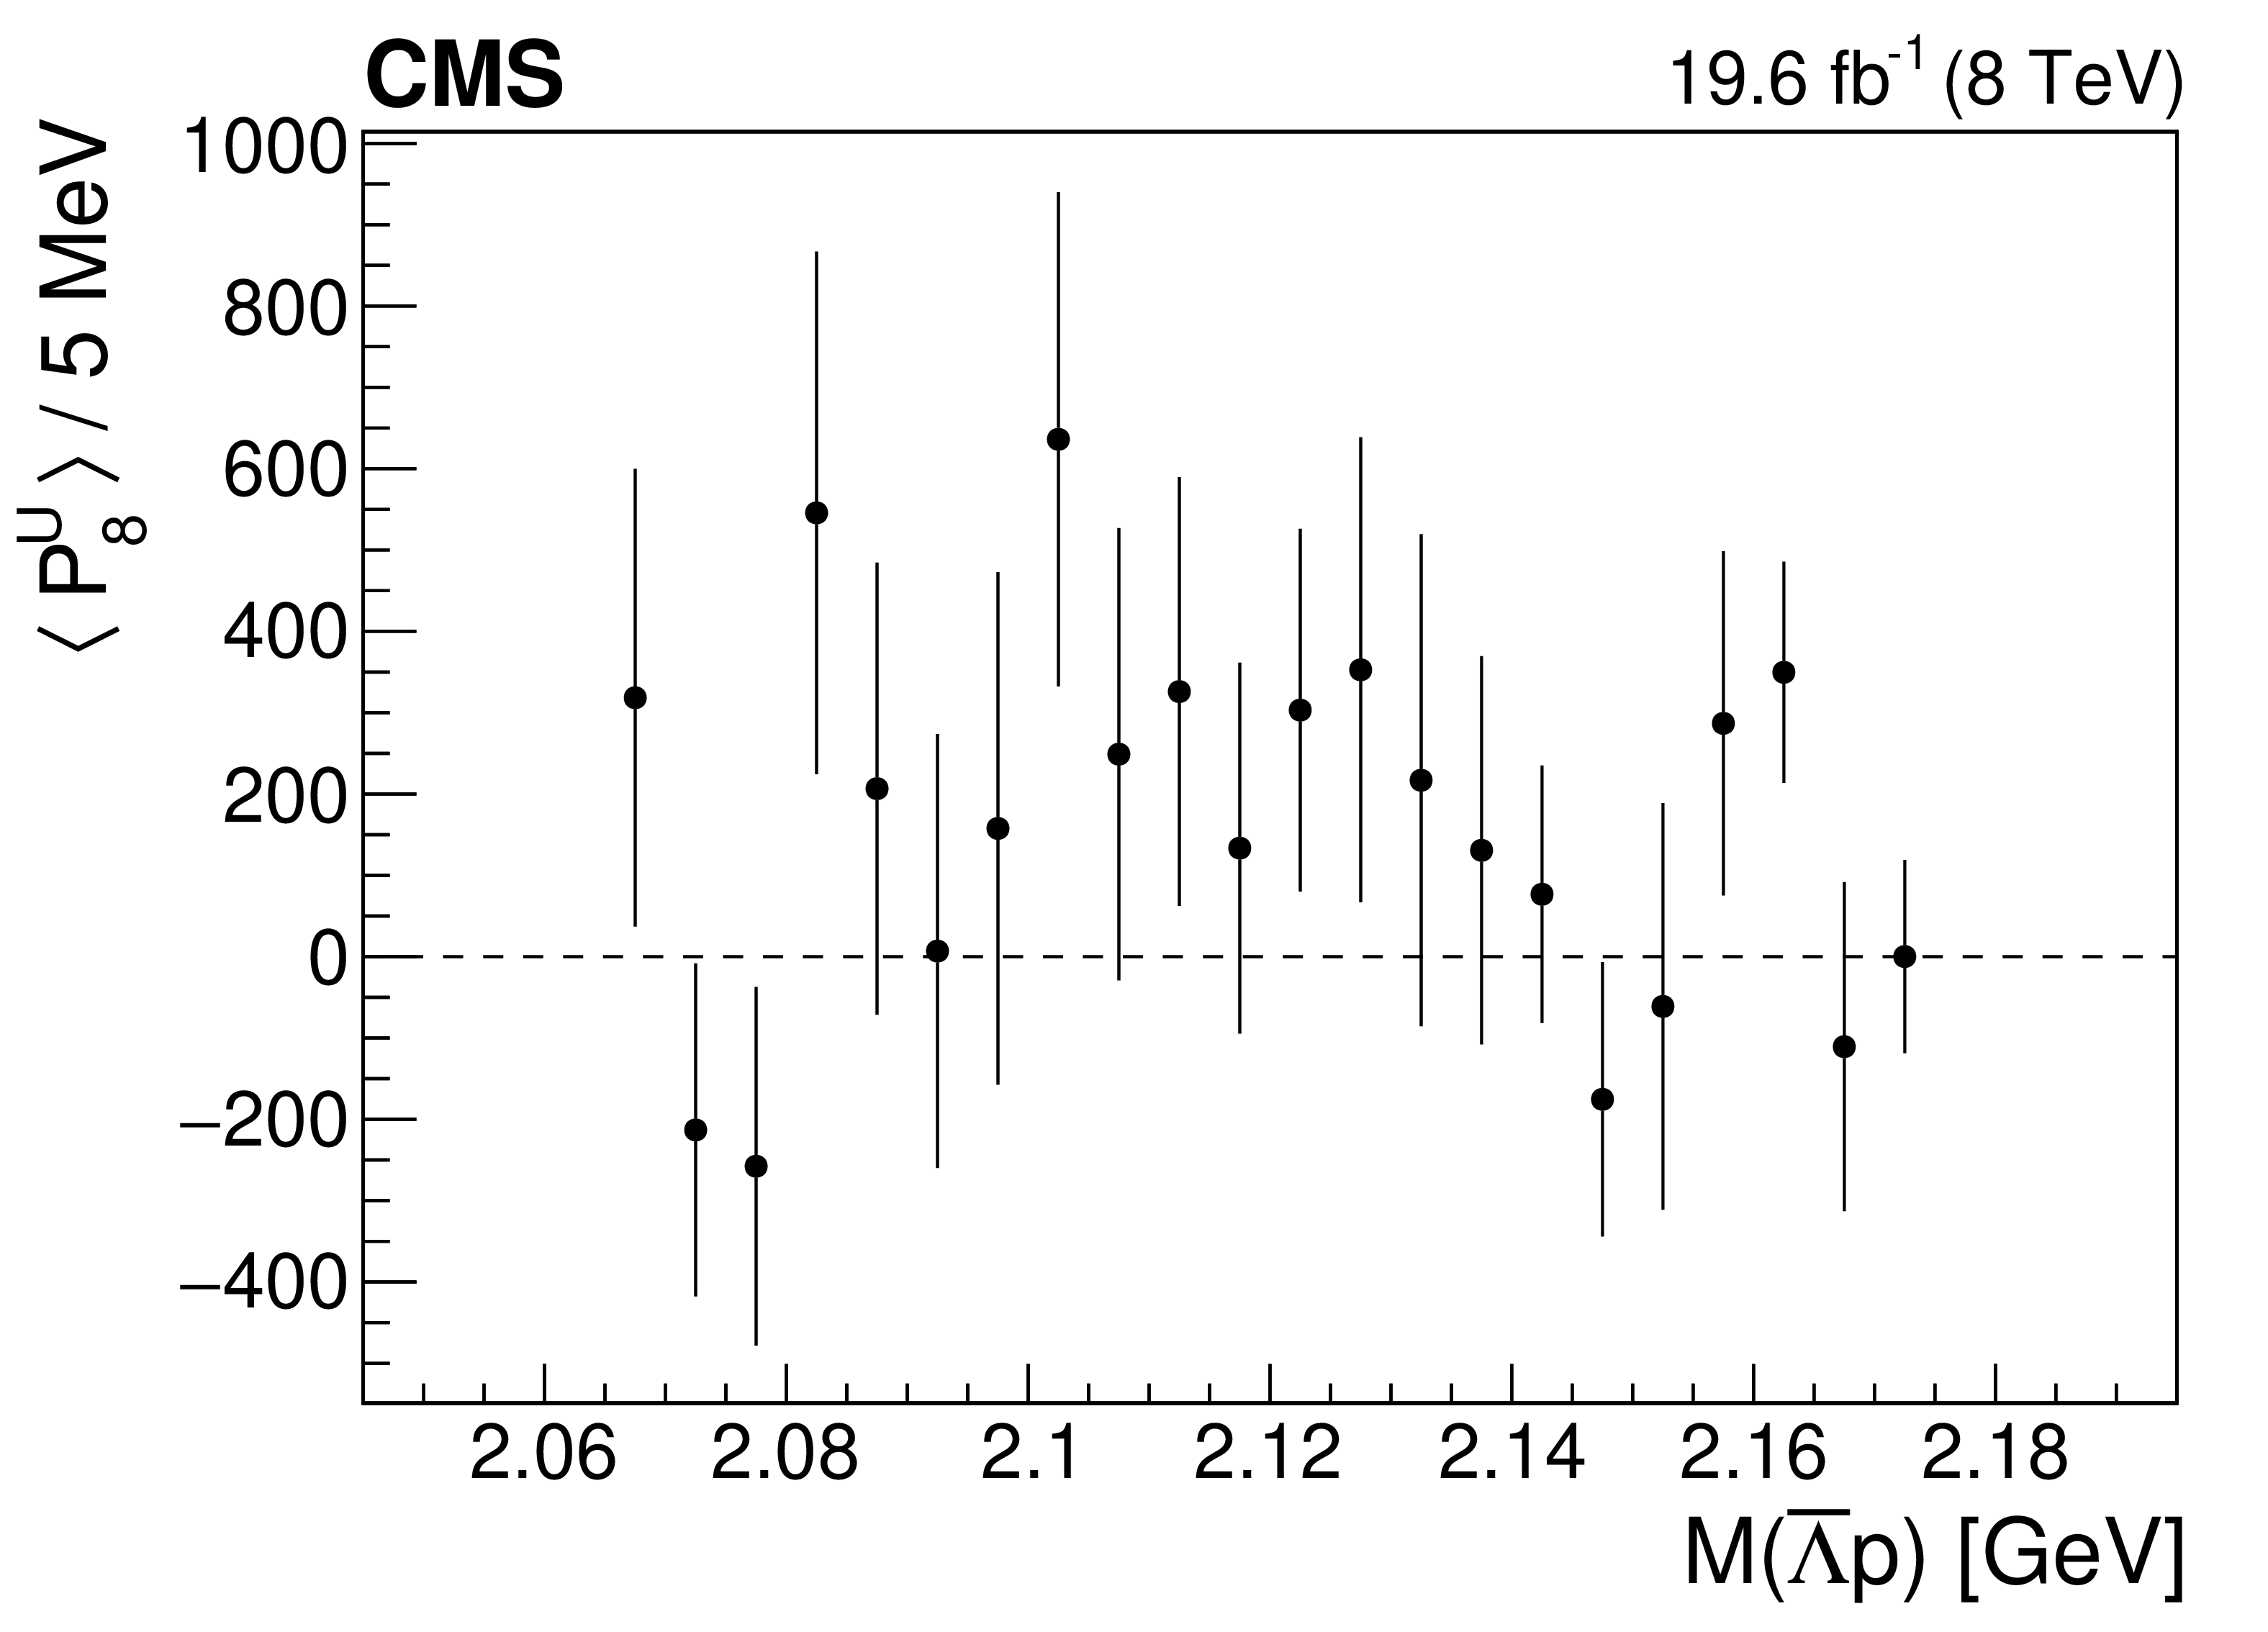
Figure 5:
The dependence of the first eight Legendre moments on $M(\bar{\Lambda} {\mathrm{p}})$. The vertical bars represent the statistical uncertainty. |

png pdf |
Figure 5-a:
The dependence of the first Legendre moment on $M(\bar{\Lambda} {\mathrm{p}})$. The vertical bars represent the statistical uncertainty. |
png pdf |
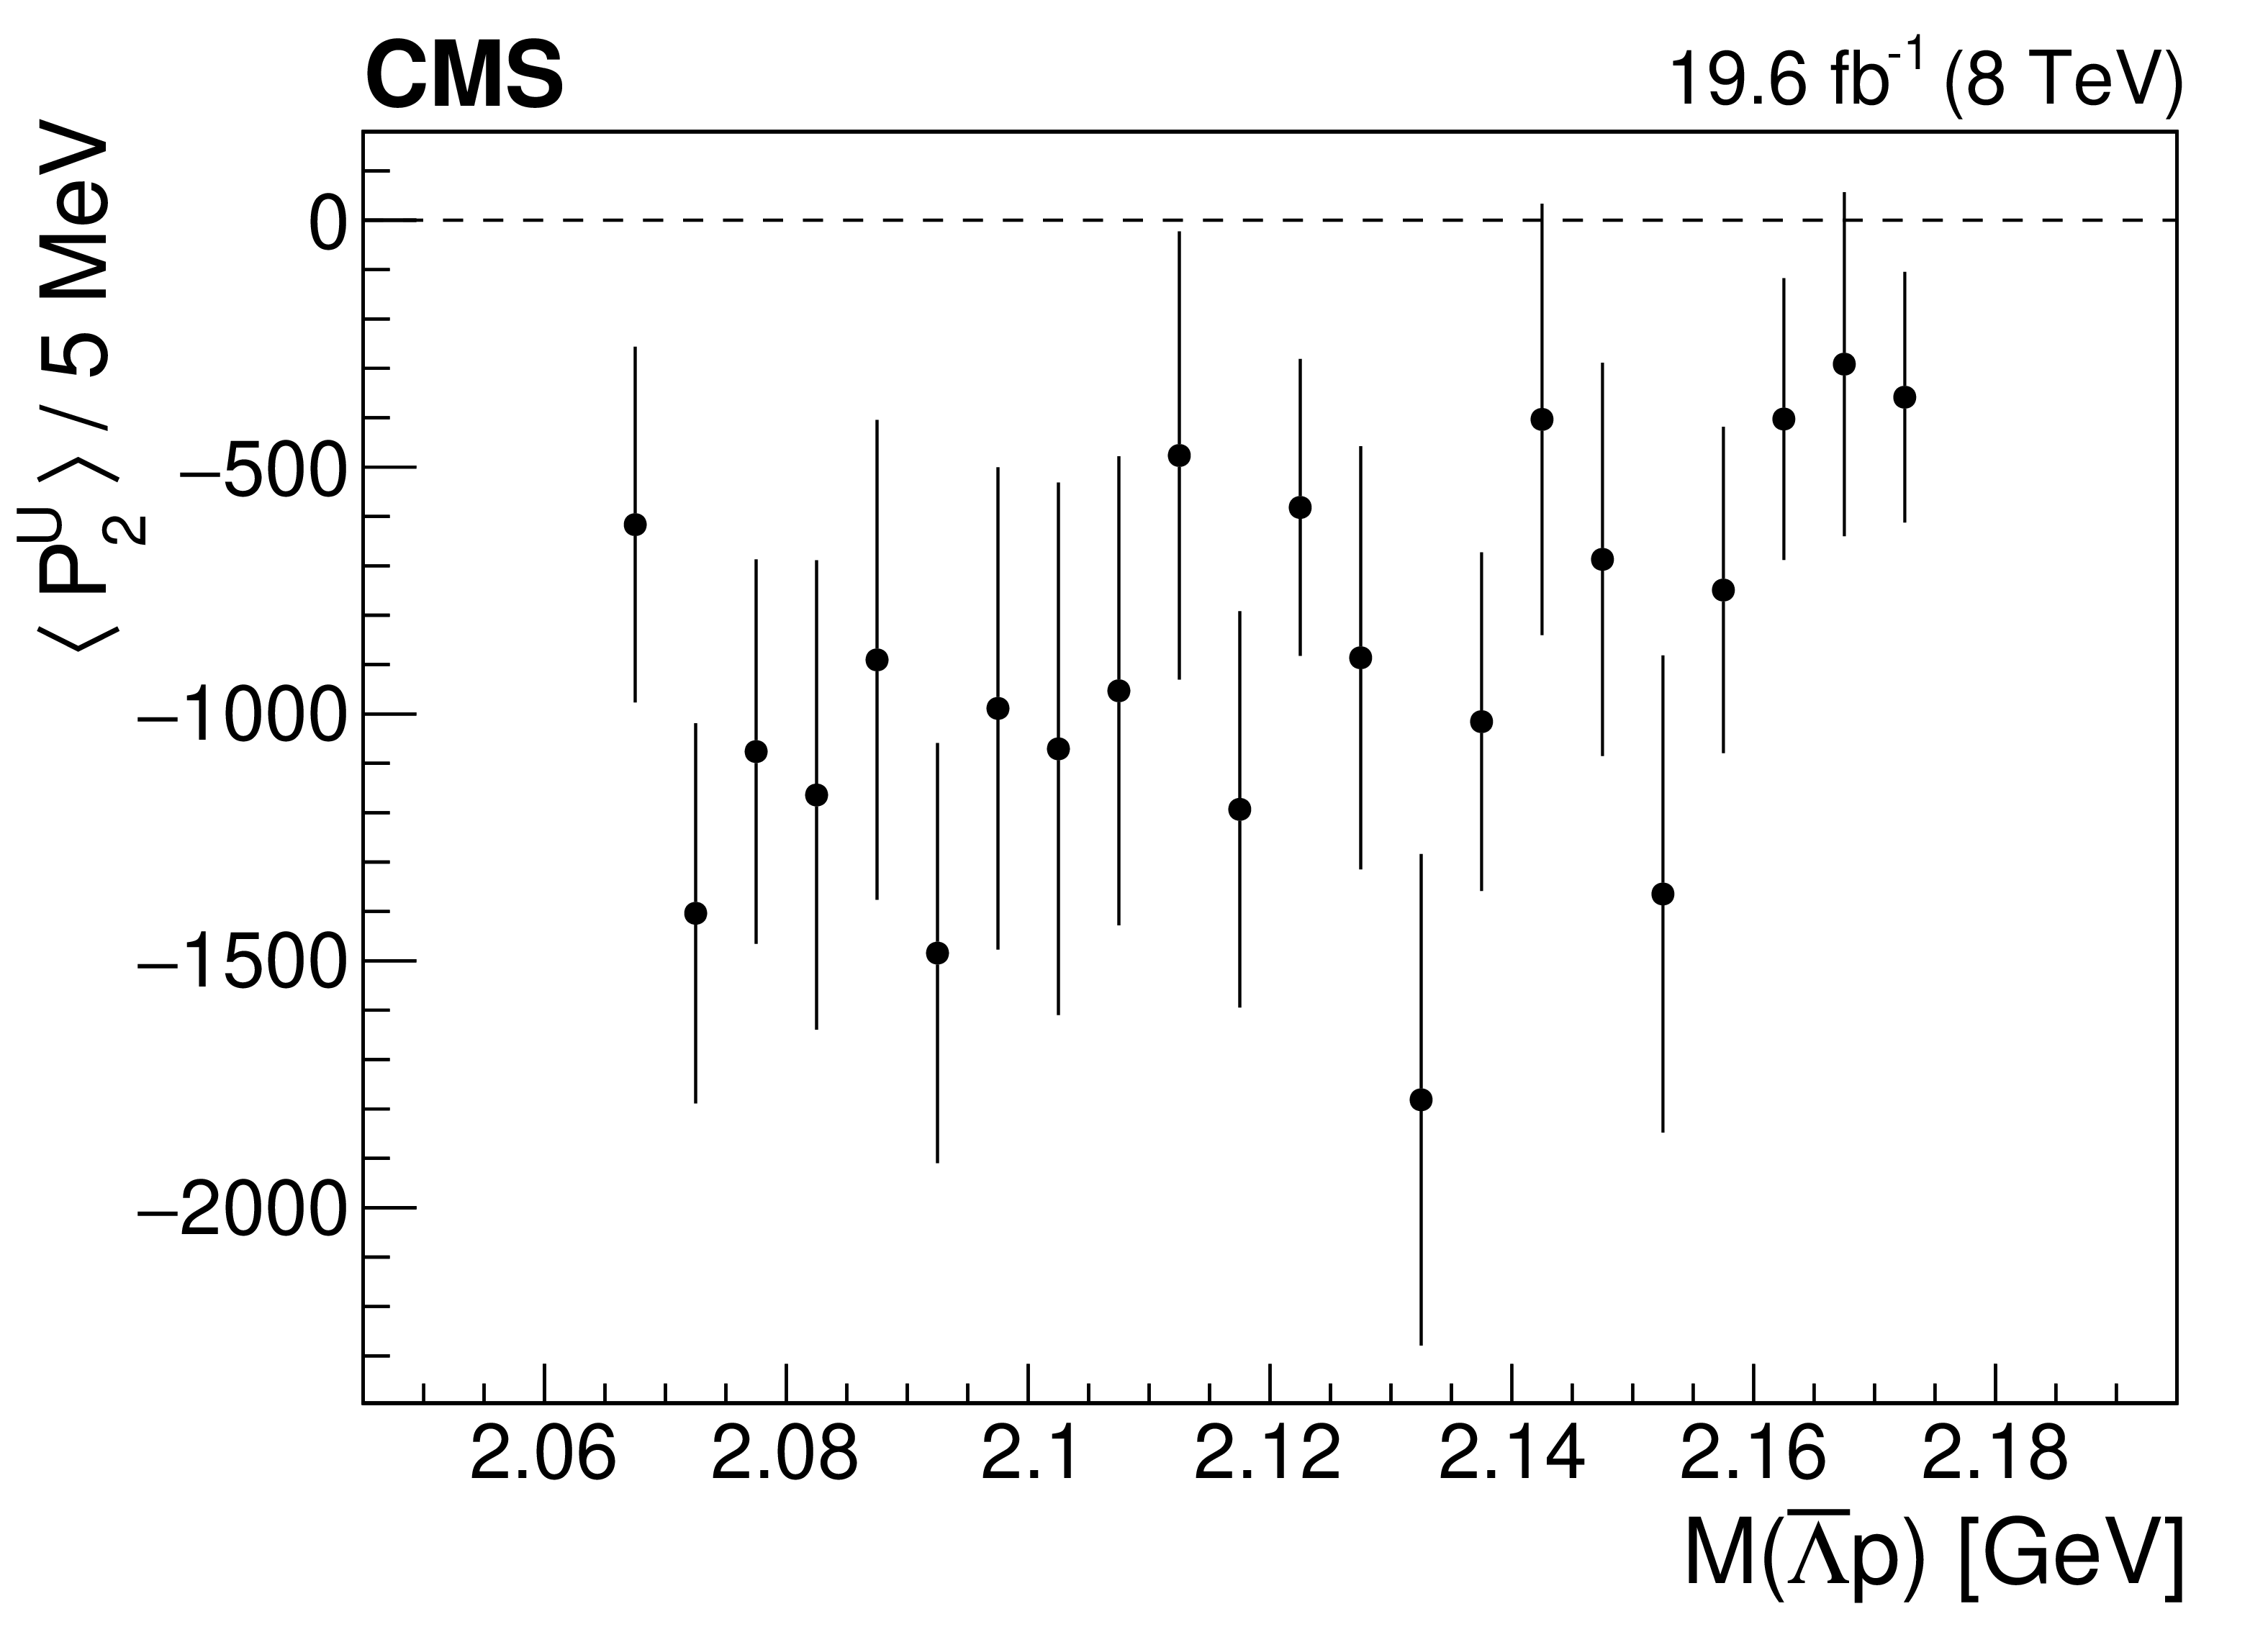
Figure 5-b:
The dependence of the second Legendre moment on $M(\bar{\Lambda} {\mathrm{p}})$. The vertical bars represent the statistical uncertainty. |

png pdf |
Figure 5-c:
The dependence of the third Legendre moment on $M(\bar{\Lambda} {\mathrm{p}})$. The vertical bars represent the statistical uncertainty. |
png pdf |
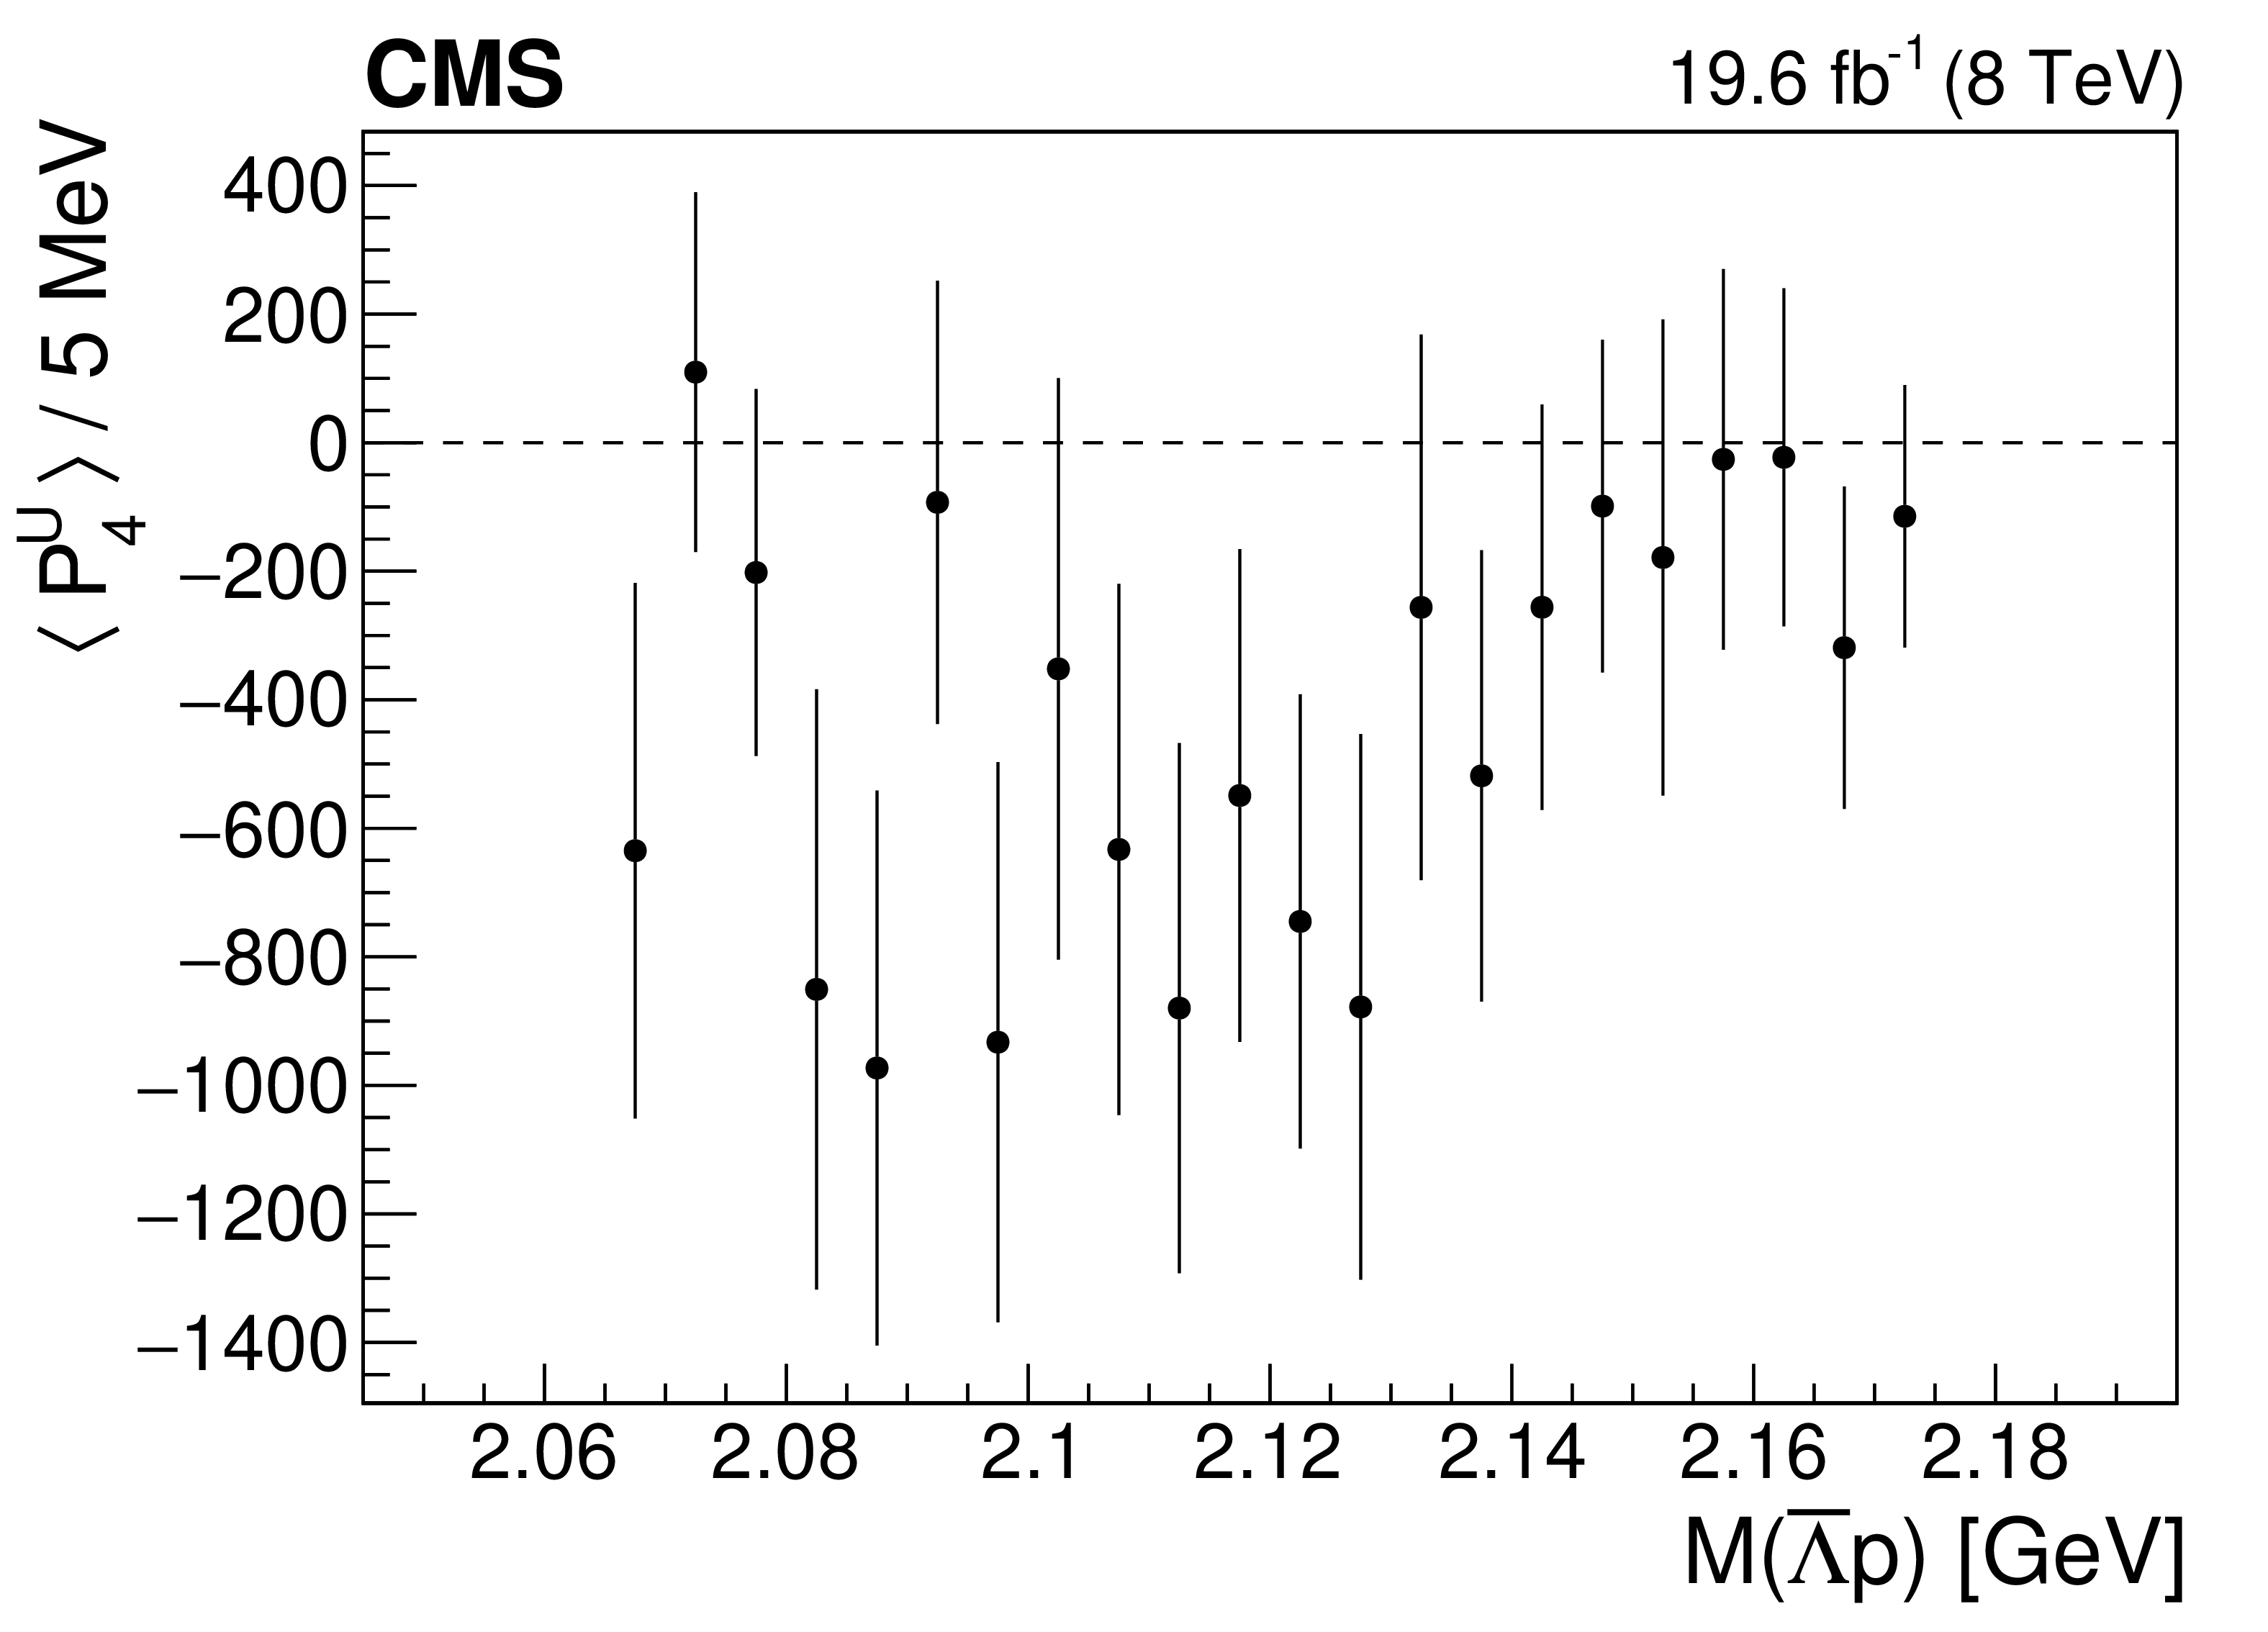
Figure 5-d:
The dependence of the fourth Legendre moment on $M(\bar{\Lambda} {\mathrm{p}})$. The vertical bars represent the statistical uncertainty. |
png pdf |
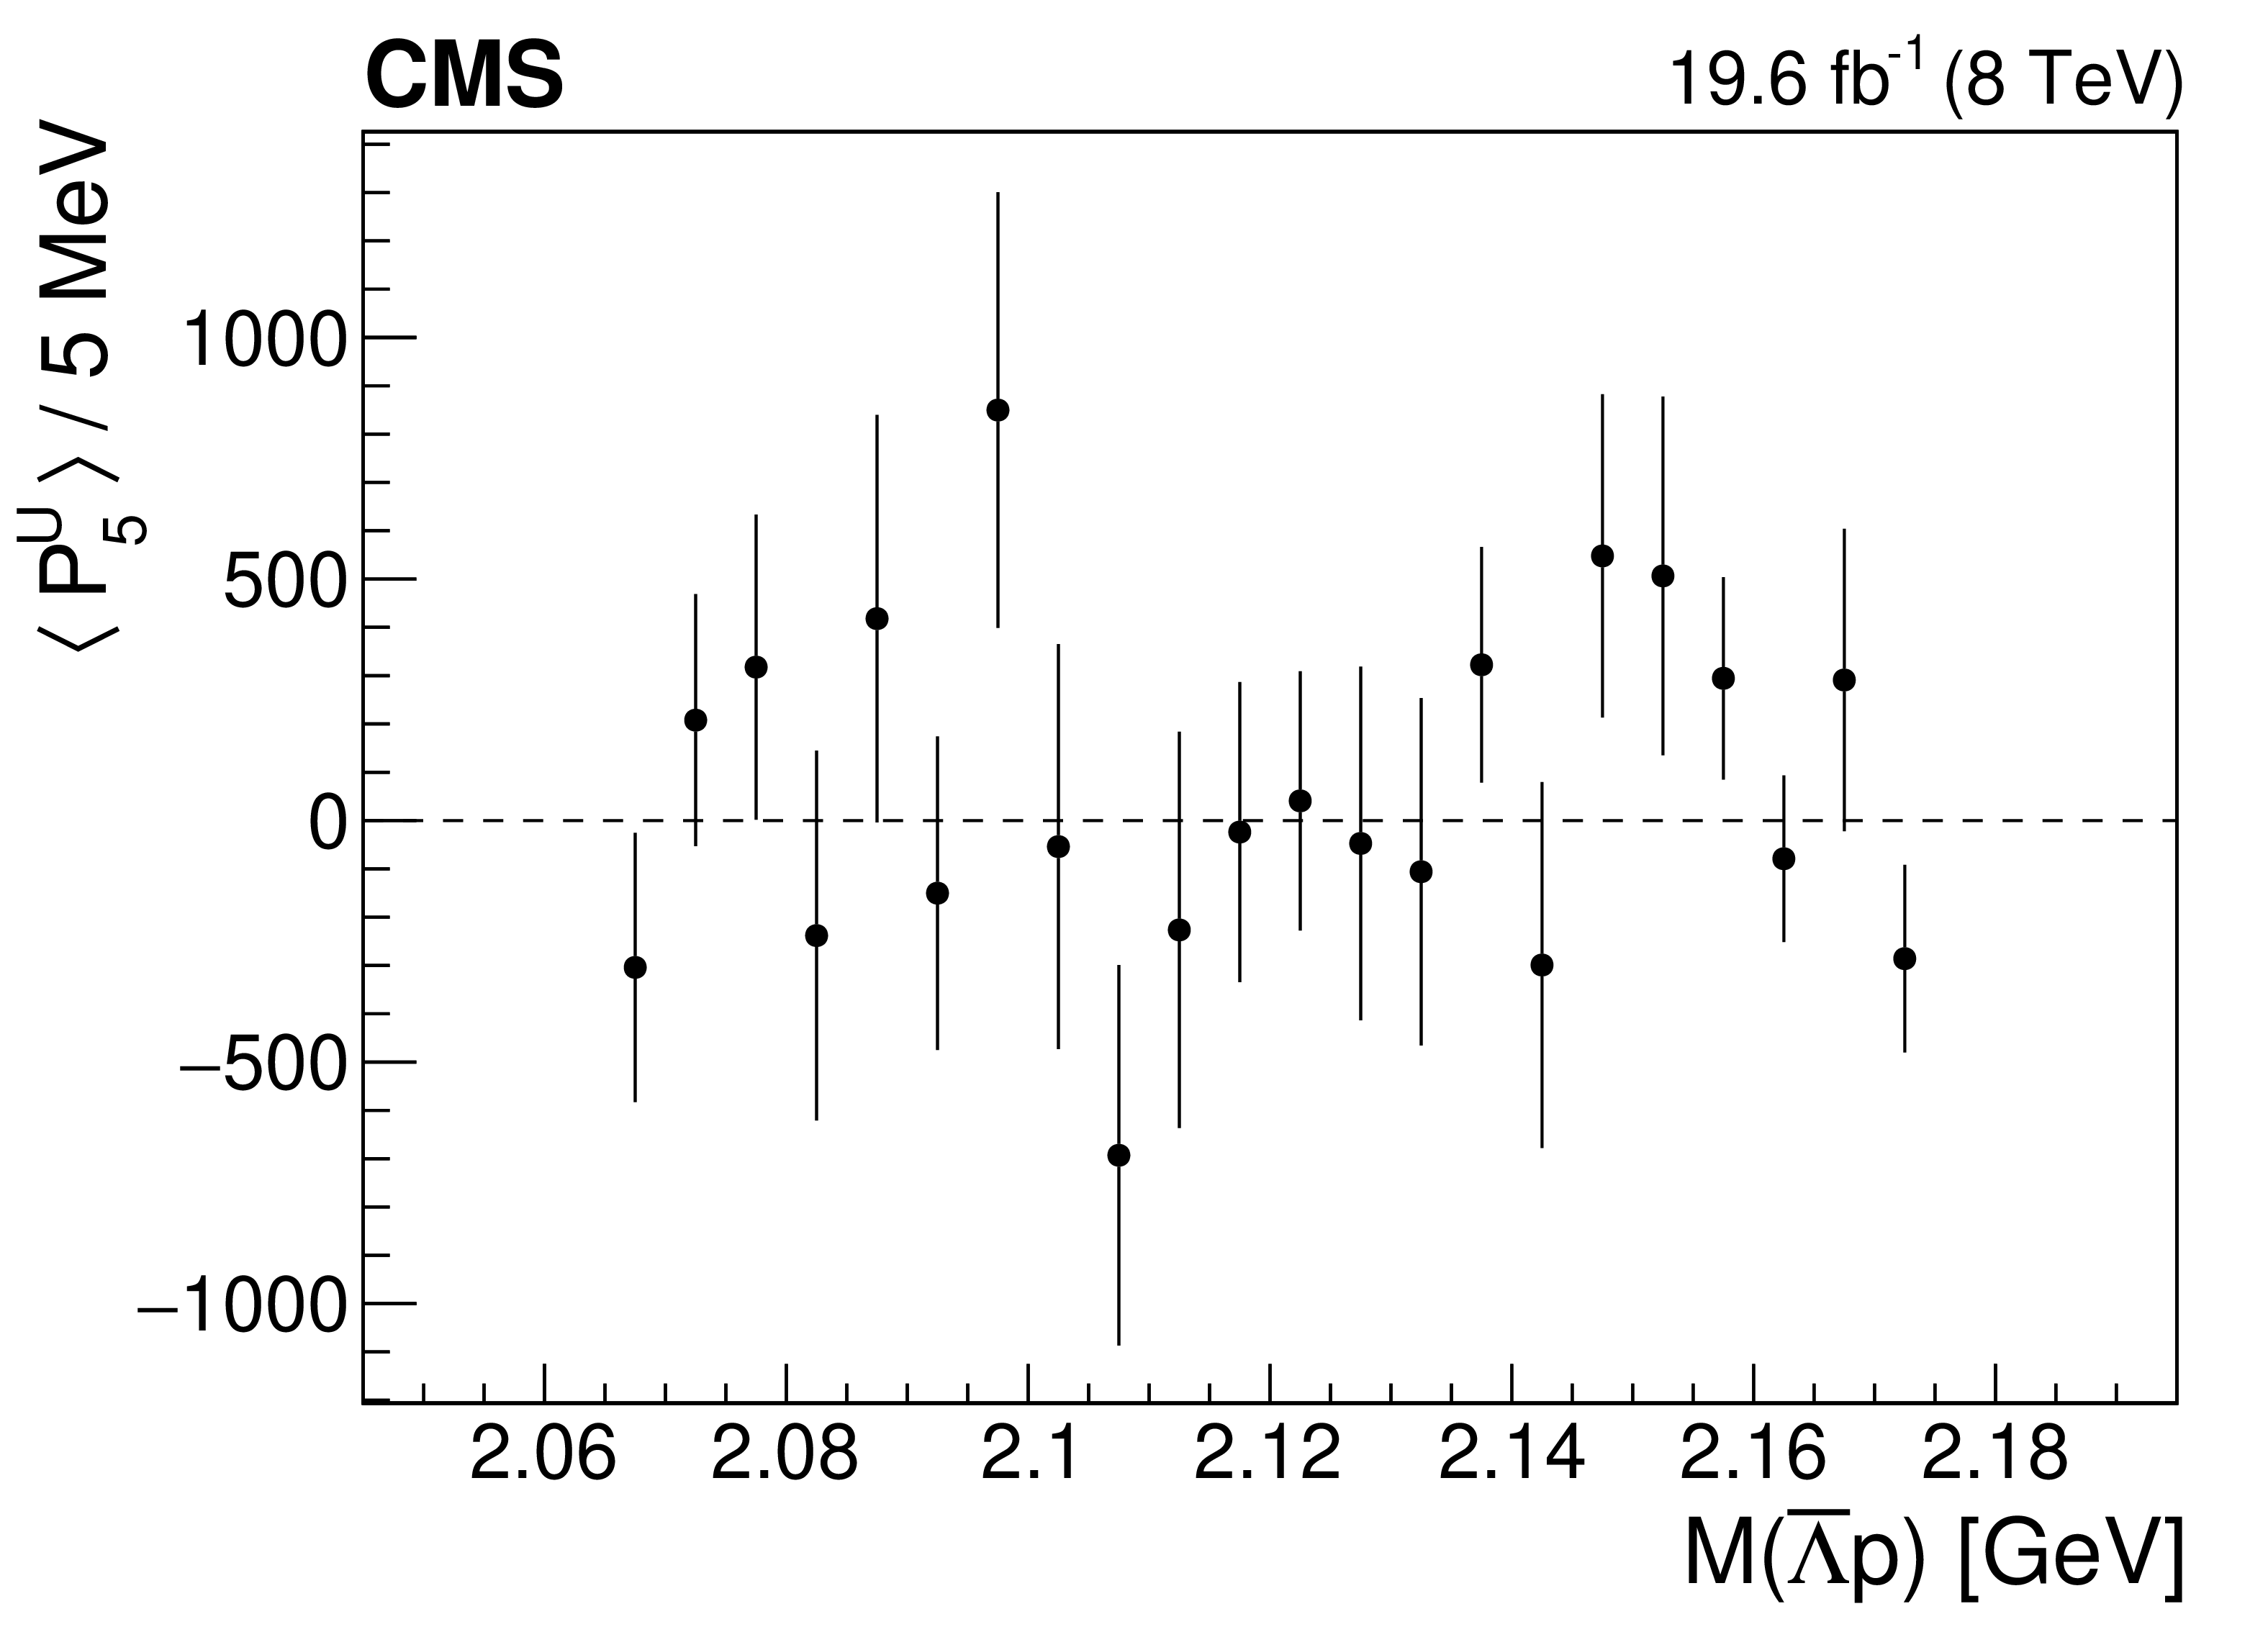
Figure 5-e:
The dependence of the fifth Legendre moment on $M(\bar{\Lambda} {\mathrm{p}})$. The vertical bars represent the statistical uncertainty. |
png pdf |
Figure 5-f:
The dependence of the sixth Legendre moment on $M(\bar{\Lambda} {\mathrm{p}})$. The vertical bars represent the statistical uncertainty. |

png pdf |
Figure 5-g:
The dependence of the seventh Legendre moment on $M(\bar{\Lambda} {\mathrm{p}})$. The vertical bars represent the statistical uncertainty. |
png pdf |
Figure 5-h:
The dependence of the eighth Legendre moment on $M(\bar{\Lambda} {\mathrm{p}})$. The vertical bars represent the statistical uncertainty. |
| Tables | |
png pdf |
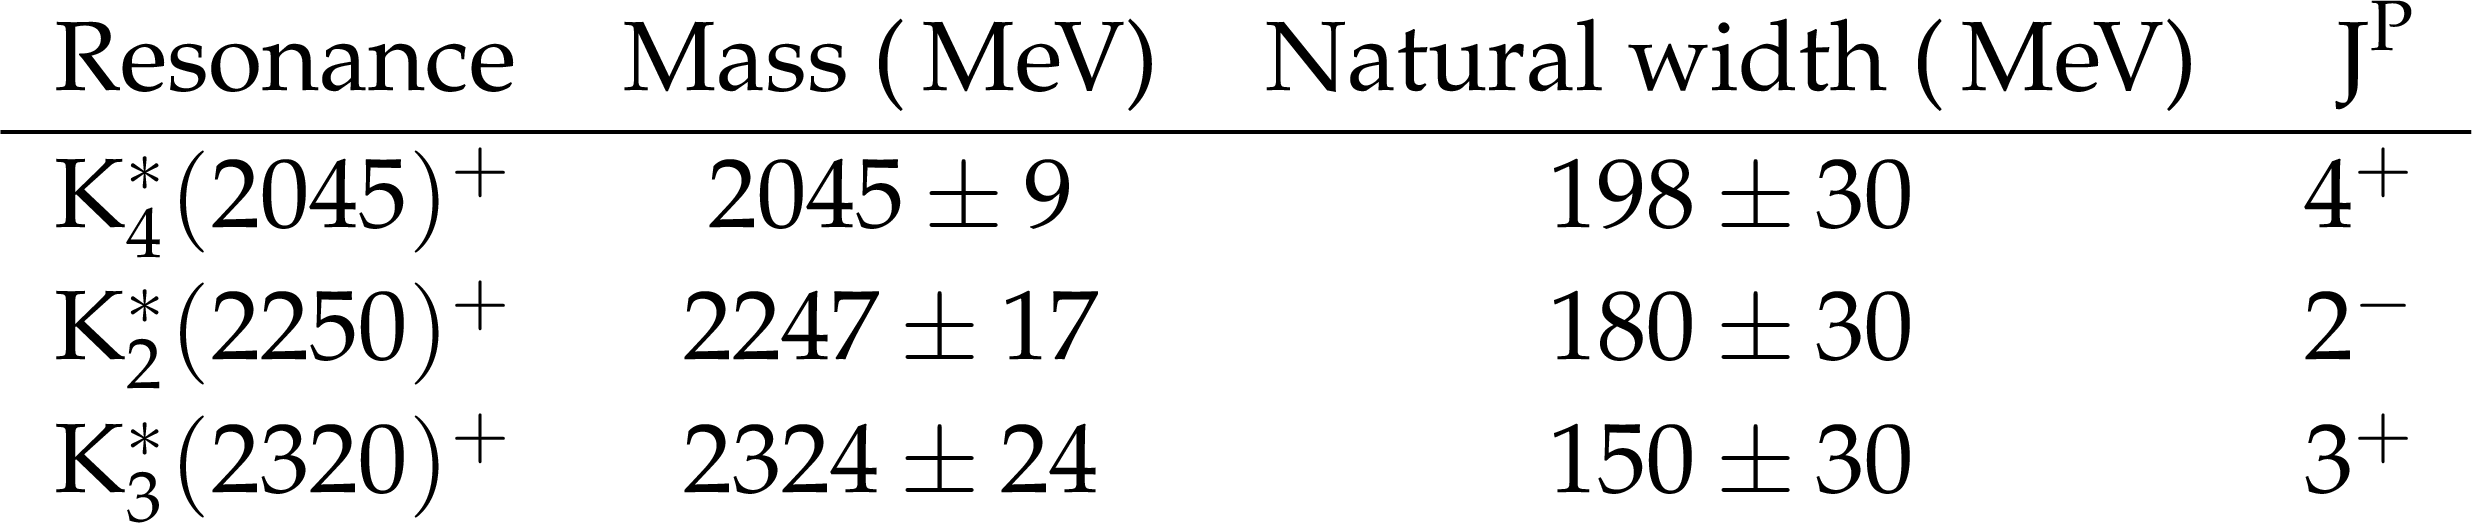
Table 1:
The mass, width, and $\text {J}^{\text {P}}$ quantum numbers for the known $ {{\mathrm{K}} ^{*+}} $ states [3] that can decay to $\bar{\Lambda} {\mathrm{p}} $. |
png pdf |
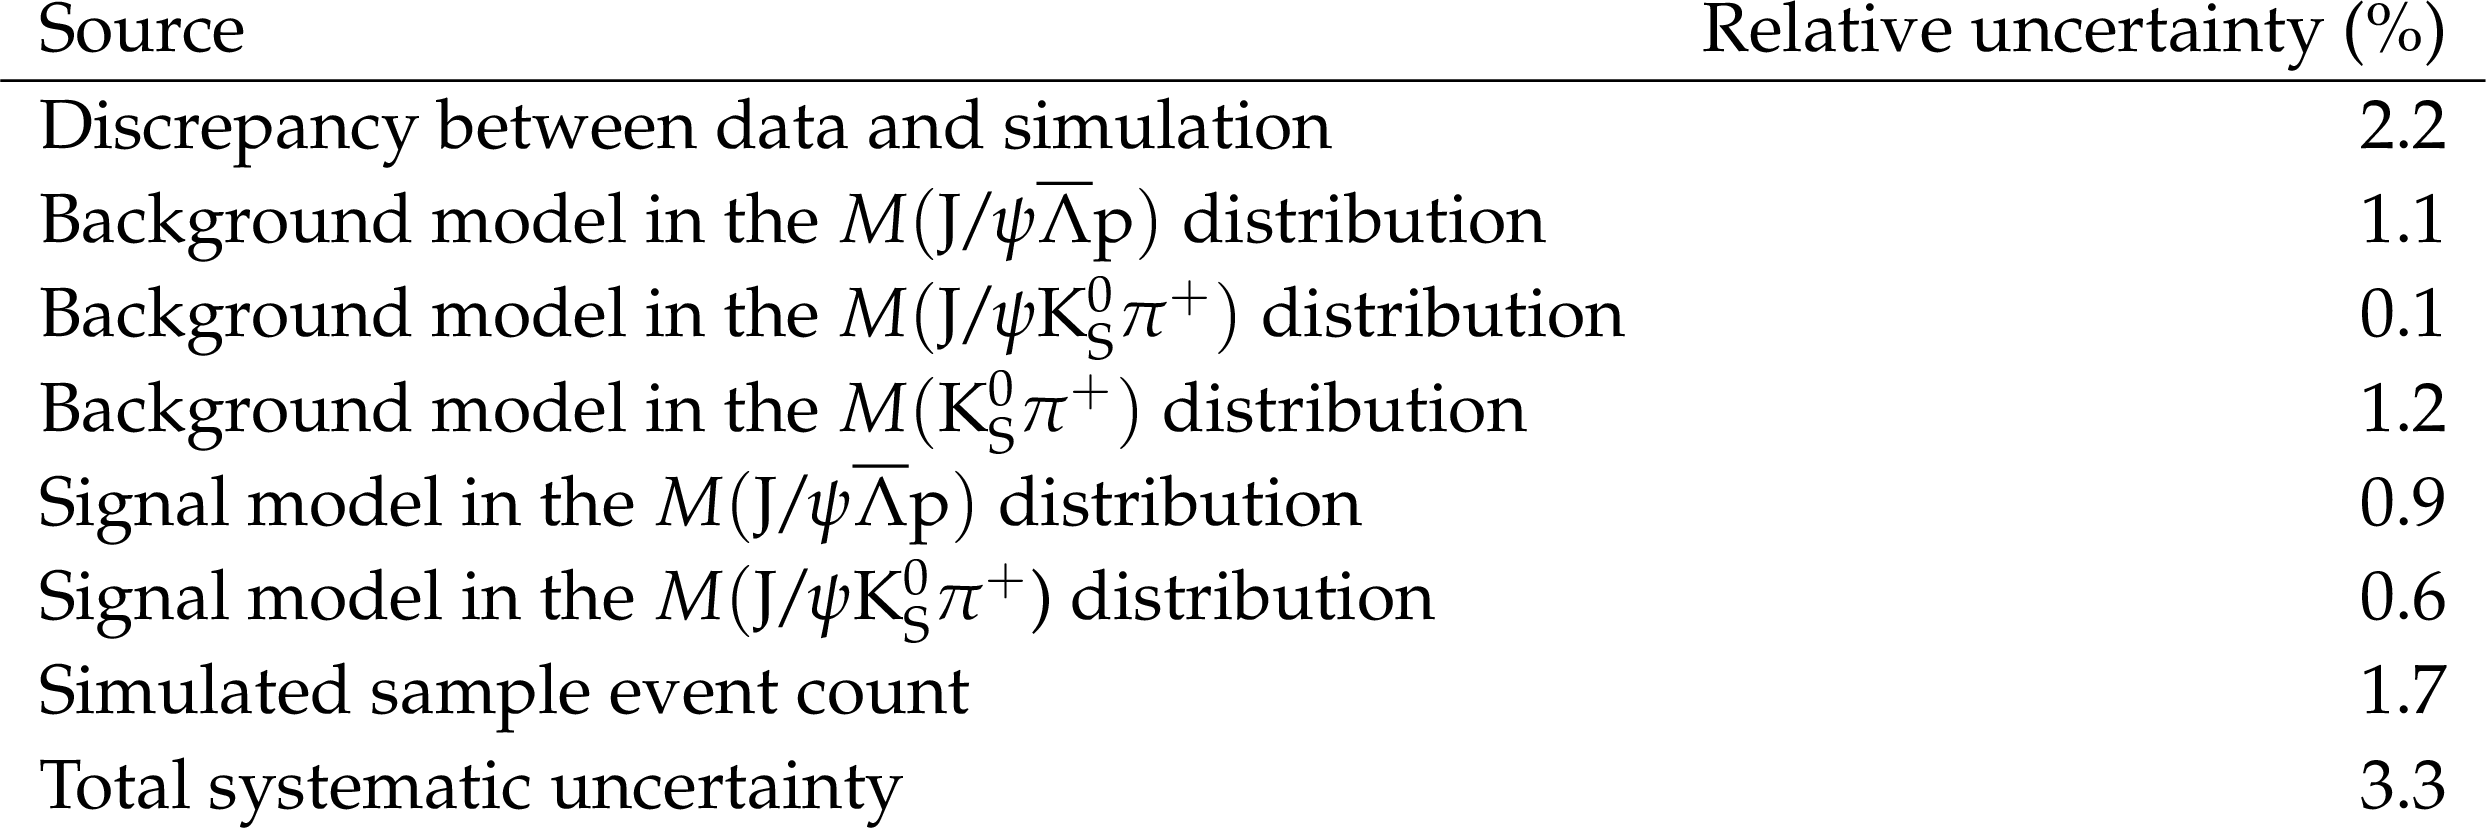
Table 2:
Summary of the relative systematic uncertainties in the ${\cal B}(\mathrm{B^{+}} \to {\mathrm{J}/\psi} \bar{\Lambda} {\mathrm{p}})/{\cal B}(\mathrm{B^{+}} \to {\mathrm{J}/\psi} {{\mathrm{K}} ^{*+}})$ ratio. |
| Summary |
| Using a data set of proton-proton collisions collected by the CMS experiment at $\sqrt{s} = $ 8 TeV and corresponding to an integrated luminosity of 19.6 fb$^{-1}$, the ratio of branching fractions has been measured to be ${\cal B}(\mathrm{B^{+}} \to \mathrm{J}/\psi\bar{\Lambda} {\mathrm{p}})/{\cal B}(\mathrm{B^{+}} \to \mathrm{J}/\psi \mathrm{K}^{*}(892)^{+}) = $ (1.054 $\pm$ 0.057 (stat) $\pm$ 0.035 (syst) $\pm$ 0.011 (${\cal B}$) )%. Using the world-average branching fraction of the $\mathrm{B^{+}} \to \mathrm{J}/\psi \mathrm{K}^{*}(892)^{+}$ decay, the branching fraction of the $\mathrm{B^{+}} \to \mathrm{J}/\psi\bar{\Lambda} {\mathrm{p}}$ decay is determined to be (15.1 $\pm$ 0.8 (stat) $\pm$ 0.5 (syst) $\pm$ 0.9 (${\cal B}$) )$\times 10^{-6}$, the most precise measurement to date. A study of the two-body invariant mass distributions of the $\mathrm{B^{+}} \to \mathrm{J}/\psi\bar{\Lambda} {\mathrm{p}}$ decay products demonstrates that these spectra cannot be adequately modeled with a pure phase space decay hypothesis. The incompatibility of the data with this hypothesis is more than 6.1, 5.5, and 3.4 standard deviations for the $\mathrm{J}/\psi{\mathrm{p}}$, $\mathrm{J}/\psi \bar{\Lambda}$, and $\bar{\Lambda} {\mathrm{p}}$ invariant mass spectra, respectively. A model-independent approach that accounts for the contribution from known $\mathrm{K}^{*+}_{2,3,4}$ resonances with spins up to 4 decaying to the $\bar{\Lambda} {\mathrm{p}}$ system improves the agreement significantly, decreasing the incompatibility with data to less than three standard deviations in both the $\mathrm{J}/\psi{\mathrm{p}}$ and $\mathrm{J}/\psi \bar{\Lambda}$ invariant mass spectra. |
| Additional Figures | |
png pdf |
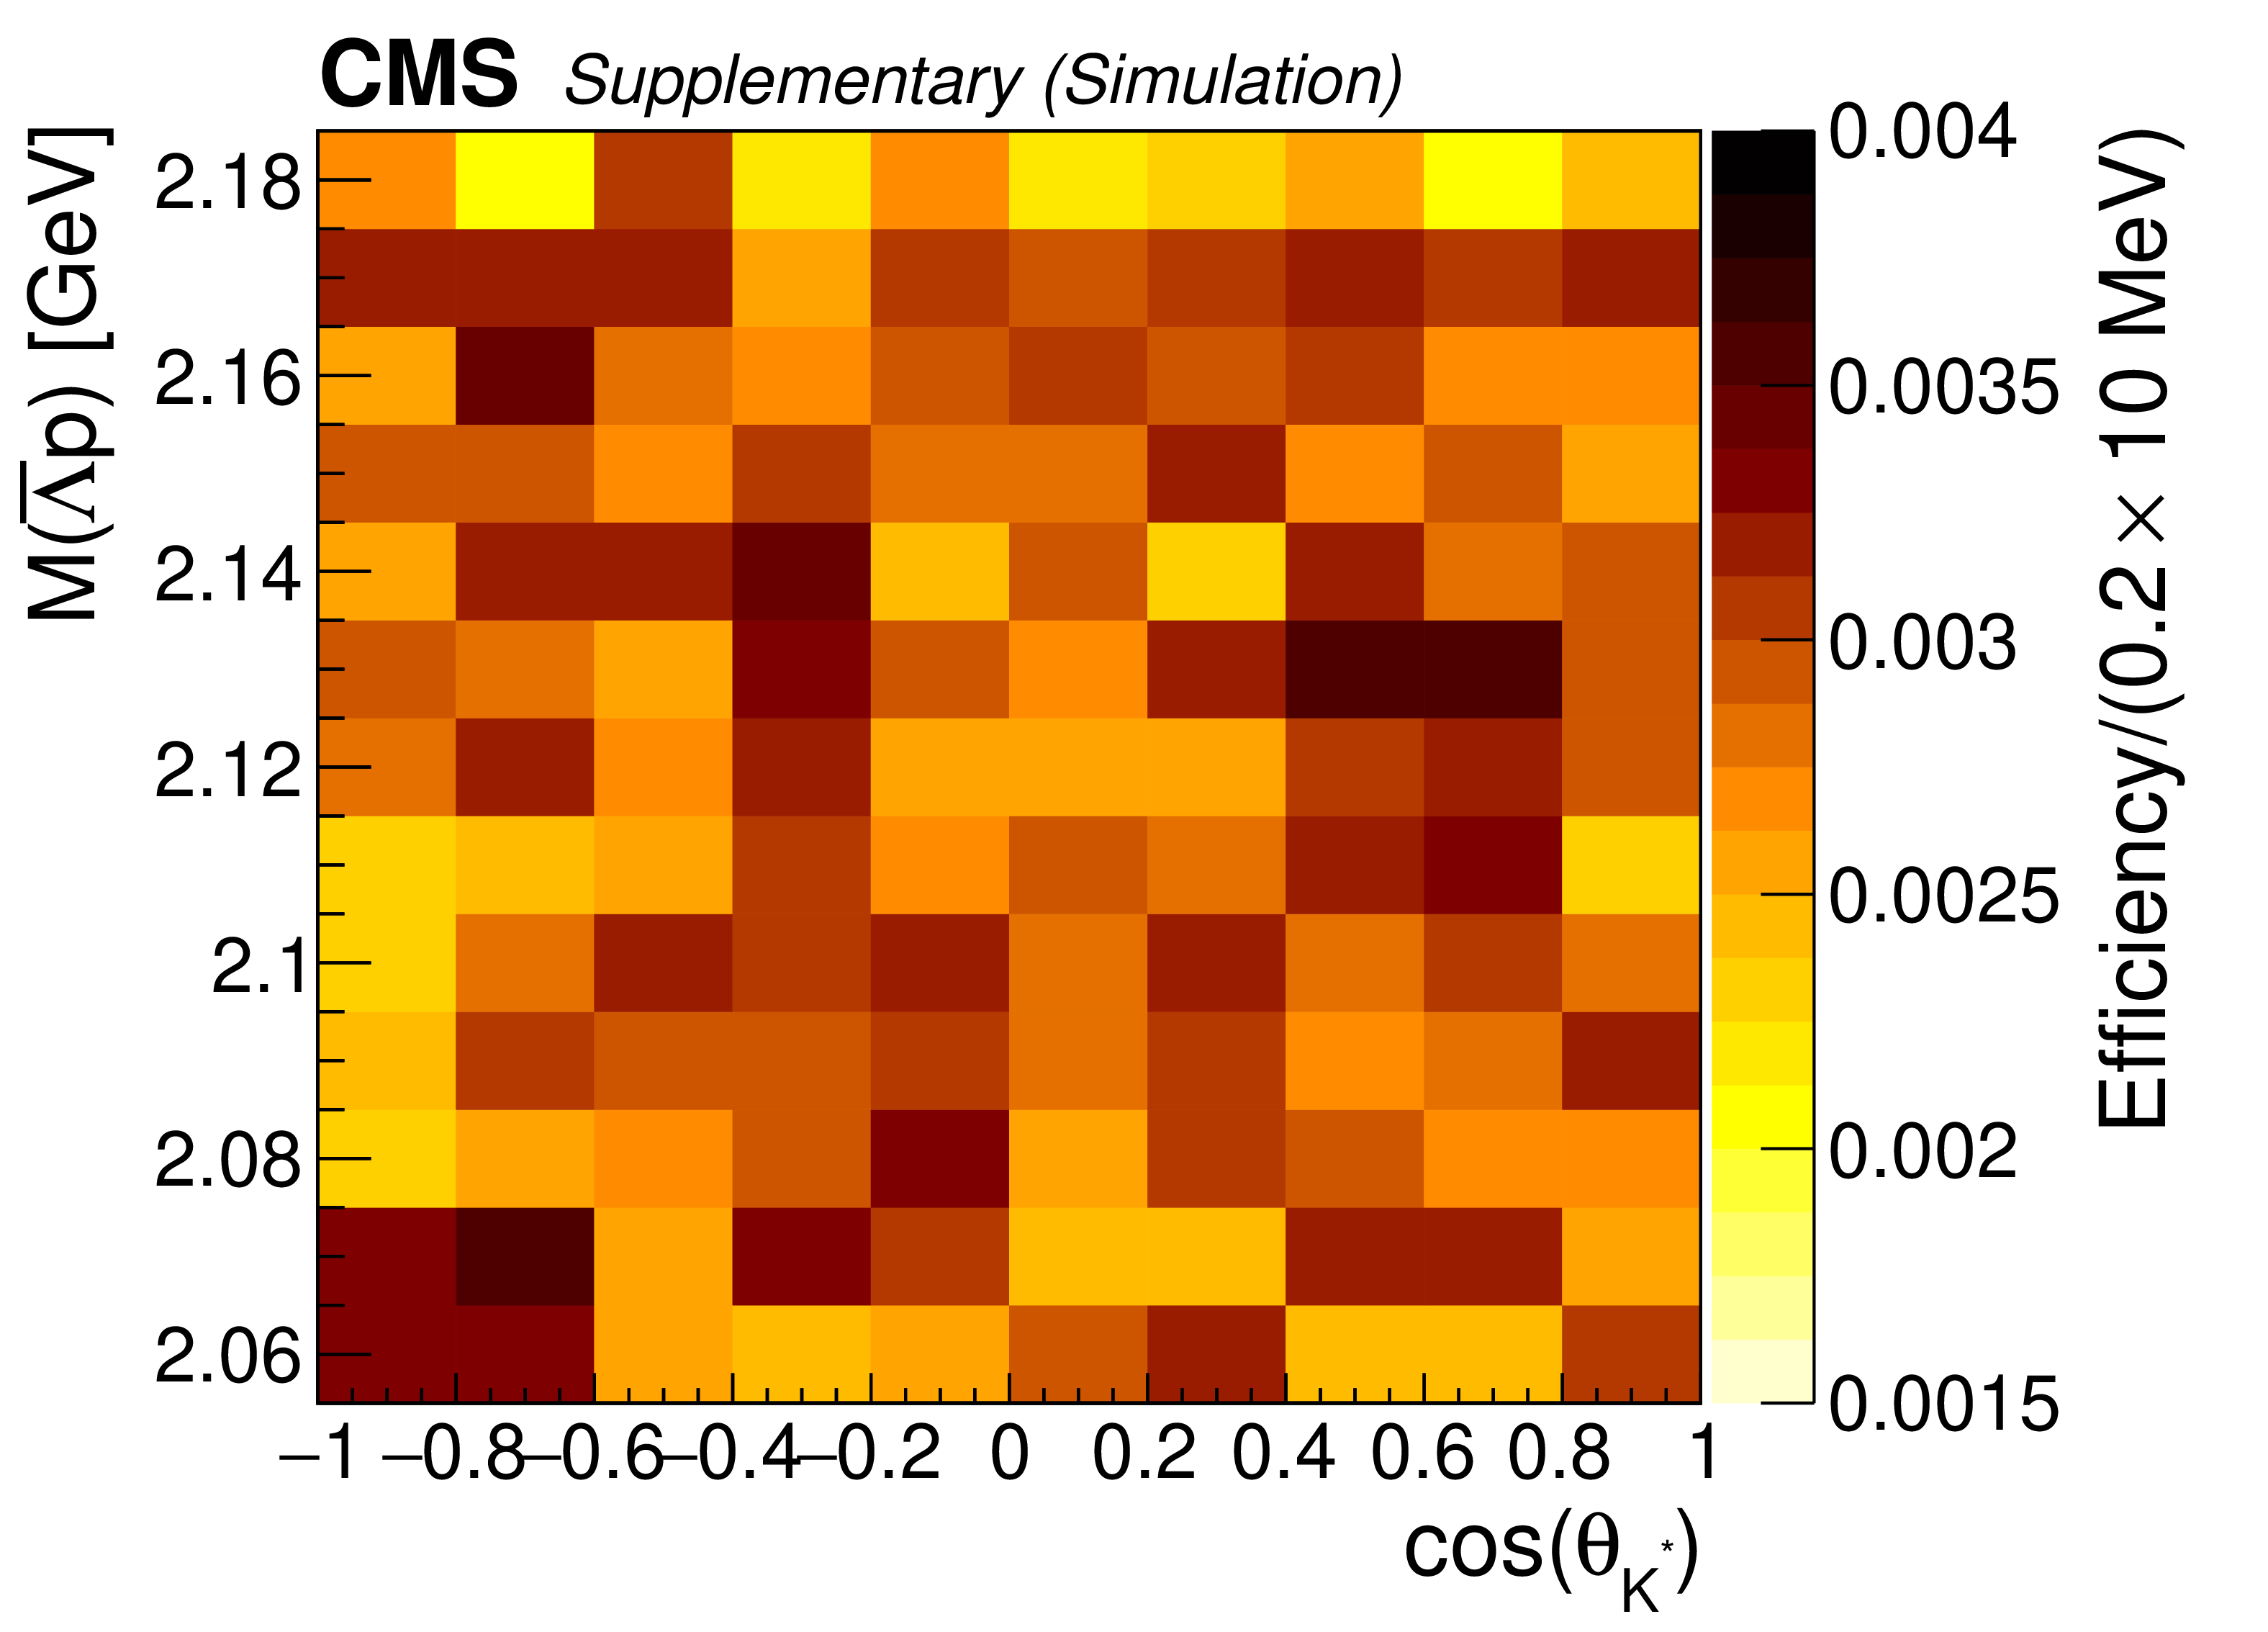
Additional Figure 1:
Efficiency as the function of $\cos(\theta _{{\mathrm {K}}^{*}})$ and $M({{\overline {\Lambda}}} {\mathrm {p}})$, $\epsilon (M({{\overline {\Lambda}}} {\mathrm {p}}),\cos(\theta _{{\mathrm {K}}^{*}}))$. |
| References | ||||
| 1 | BaBar Collaboration | Evidence for $ \mathrm{B}^+ \to \mathrm{J}/\psi\bar{\Lambda}{\mathrm{p}} $ and search for $ \mathrm{B}^0 \to \mathrm{J}/\psi {\mathrm{p}} \bar{{\mathrm{p}}} $ | PRL 90 (2003) 231801 | hep-ex/0303036 |
| 2 | Belle Collaboration | Observation of $ \mathrm{B}^- \to \mathrm{J}/\psi\Lambda\bar{\mathrm{p}} $ and searches for $ \mathrm{B}^- \to \mathrm{J}/\psi\Sigma^0 \bar{\mathrm{p}} $ and $ \mathrm{B}^0 \to \mathrm{J}/\psi {\mathrm{p}}\bar{\mathrm{p}} $ decays | PRD 72 (2005) 051105 | hep-ex/0508011 |
| 3 | Particle Data Group | Review of particle physics | PRD 98 (2018) 030001 | |
| 4 | LHCb Collaboration | Observation of $ \mathrm{J}/\psi {\mathrm{p}} $ resonances consistent with pentaquark states in $ \Lambda_b^0 \to \mathrm{J}/\psi \mathrm{K}^- {\mathrm{p}} $ decays | PRL 115 (2015) 072001 | 1507.03414 |
| 5 | LHCb Collaboration | Observation of a narrow pentaquark state, $ \mathrm{P}_{\mathrm{c}}(4312)^{+} $, and of two-peak structure of the $ \mathrm{P}_{\mathrm{c}}(4450)^{+} $ | PRL 122 (2019) 222001 | 1904.03947 |
| 6 | CMS Collaboration | Description and performance of track and primary-vertex reconstruction with the CMS tracker | JINST 9 (2014) P10009 | CMS-TRK-11-001 1405.6569 |
| 7 | CMS Collaboration | Performance of CMS muon reconstruction in $ {\mathrm{p}}{\mathrm{p}} $ collision events at $ \sqrt{s}= $ 7 TeV | JINST 7 (2012) P10002 | CMS-MUO-10-004 1206.4071 |
| 8 | CMS Collaboration | The CMS trigger system | JINST 12 (2017) P01020 | CMS-TRG-12-001 1609.02366 |
| 9 | CMS Collaboration | The CMS experiment at the CERN LHC | JINST 3 (2008) S08004 | CMS-00-001 |
| 10 | CMS Collaboration | CMS tracking performance results from early LHC operation | EPJC 70 (2010) 1165 | CMS-TRK-10-001 1007.1988 |
| 11 | T. Sjostrand, S. Mrenna, and P. Skands | PYTHIA 6.4 physics and manual | JHEP 05 (2006) 026 | hep-ph/0603175 |
| 12 | D. J. Lange | The EVTGEN particle decay simulation package | NIMA 462 (2001) 152 | |
| 13 | GEANT4 Collaboration | GEANT4--a simulation toolkit | NIMA 506 (2003) 250 | |
| 14 | M. Pivk and F. R. Le Diberder | $ \it $ sPlot: A statistical tool to unfold data distributions | NIMA 555 (2005) 356 | physics/0402083 |
| 15 | M. J. Oreglia | A study of the reactions $\psi' \to \gamma\gamma \psi$ | PhD thesis, Stanford University, 1980 SLAC Report SLAC-R-236, see Appendix D | |
| 16 | J. Gaiser | Charmonium Spectroscopy From Radiative Decays of the $\mathrm{J}/\psi$ | PhD thesis, SLAC | |
| 17 | BaBar Collaboration | Search for the Z(4430)$ ^- $ at BaBar | PRD 79 (2009) 112001 | 0811.0564 |
| 18 | LHCb Collaboration | Model-independent confirmation of the $ Z(4430)^- $ state | PRD 92 (2015) 112009 | 1510.01951 |
| 19 | LHCb Collaboration | Model-independent evidence for $ \mathrm{J}/\psi {\mathrm{p}} $ contributions to $ \Lambda_b^0\to \mathrm{J}/\psi {\mathrm{p}} \mathrm{K}^- $ decays | PRL 117 (2016) 082002 | 1604.05708 |
|
|
Compact Muon Solenoid LHC, CERN |
|

|

|

|

|

|