

Compact Muon Solenoid
LHC, CERN
| CMS-EXO-16-003 ; CERN-EP-2017-264 | ||
| Search for new long-lived particles at $\sqrt{s} = $ 13 TeV | ||
| CMS Collaboration | ||
| 25 November 2017 | ||
| Phys. Lett. B 780 (2018) 432 | ||
| Abstract: A search for long-lived particles was performed with data corresponding to an integrated luminosity of 2.6 fb$^{-1}$ collected at a center-of-mass energy of 13 TeV by the CMS experiment in 2015. The analysis exploits two customized topological trigger algorithms, and uses the multiplicity of displaced jets to search for the presence of a signal decay occurring at distances between 1 and 1000 mm. The results can be interpreted in a variety of different models. For pair-produced long-lived particles decaying to two b quarks and two leptons with equal decay rates between lepton flavors, cross sections larger than 2.5 fb are excluded for proper decay lengths between 70-100 mm for a long-lived particle mass of 1130 GeV at 95% confidence. For a specific model of pair-produced, long-lived top squarks with R-parity violating decays to a b quark and a lepton, masses below 550-1130 GeV are excluded at 95% confidence for equal branching fractions between lepton flavors, depending on the squark decay length. This mass bound is the most stringent to date for top squark proper decay lengths greater than 3 mm. | ||
| Links: e-print arXiv:1711.09120 [hep-ex] (PDF) ; CDS record ; inSPIRE record ; CADI line (restricted) ; | ||
| Figures & Tables | Summary | Additional Figures & Tables | References | CMS Publications |
|---|
| Figures | |
png pdf |
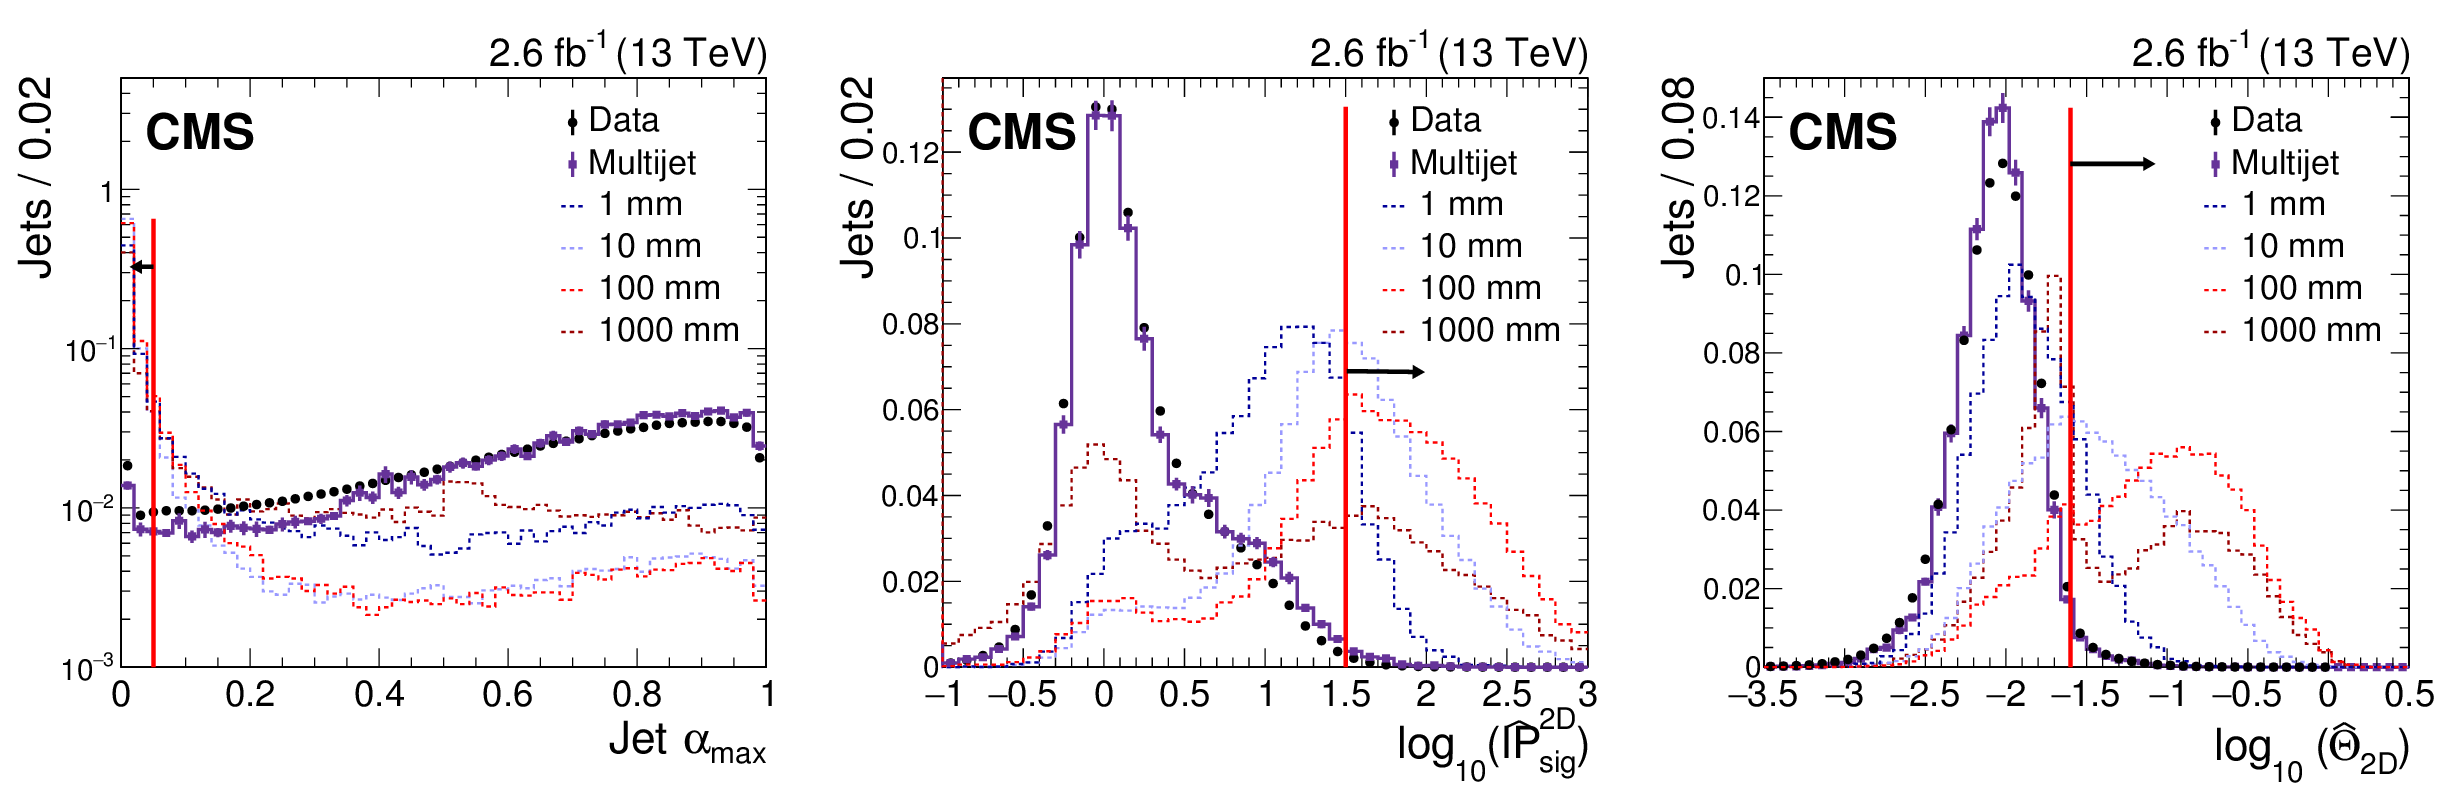
Figure 1:
Comparison of distributions for the displaced-jet tagging variables $\alpha _{\text {max}}$ (left), $\hat{\mathrm{IP}}{}^{\mathrm {2D}}_{\text {sig}}$ (center), and $\hat{\Theta}_{\mathrm {2D}}$ (right) in data and simulation. The data distributions (circles) are compared to the expected background distributions from multijet events (squares) and several Jet-Jet benchmark models (dotted histograms) of pair-produced long-lived neutral scalar particles with $m_{X^{0}} = $ 700 GeV and different values of $c\tau _0$. The vertical lines designate the value of the requirement for the chosen displaced-jet tag. The direction of the arrow indicates the values included in the requirement. All distributions have unit normalization. |
png pdf |
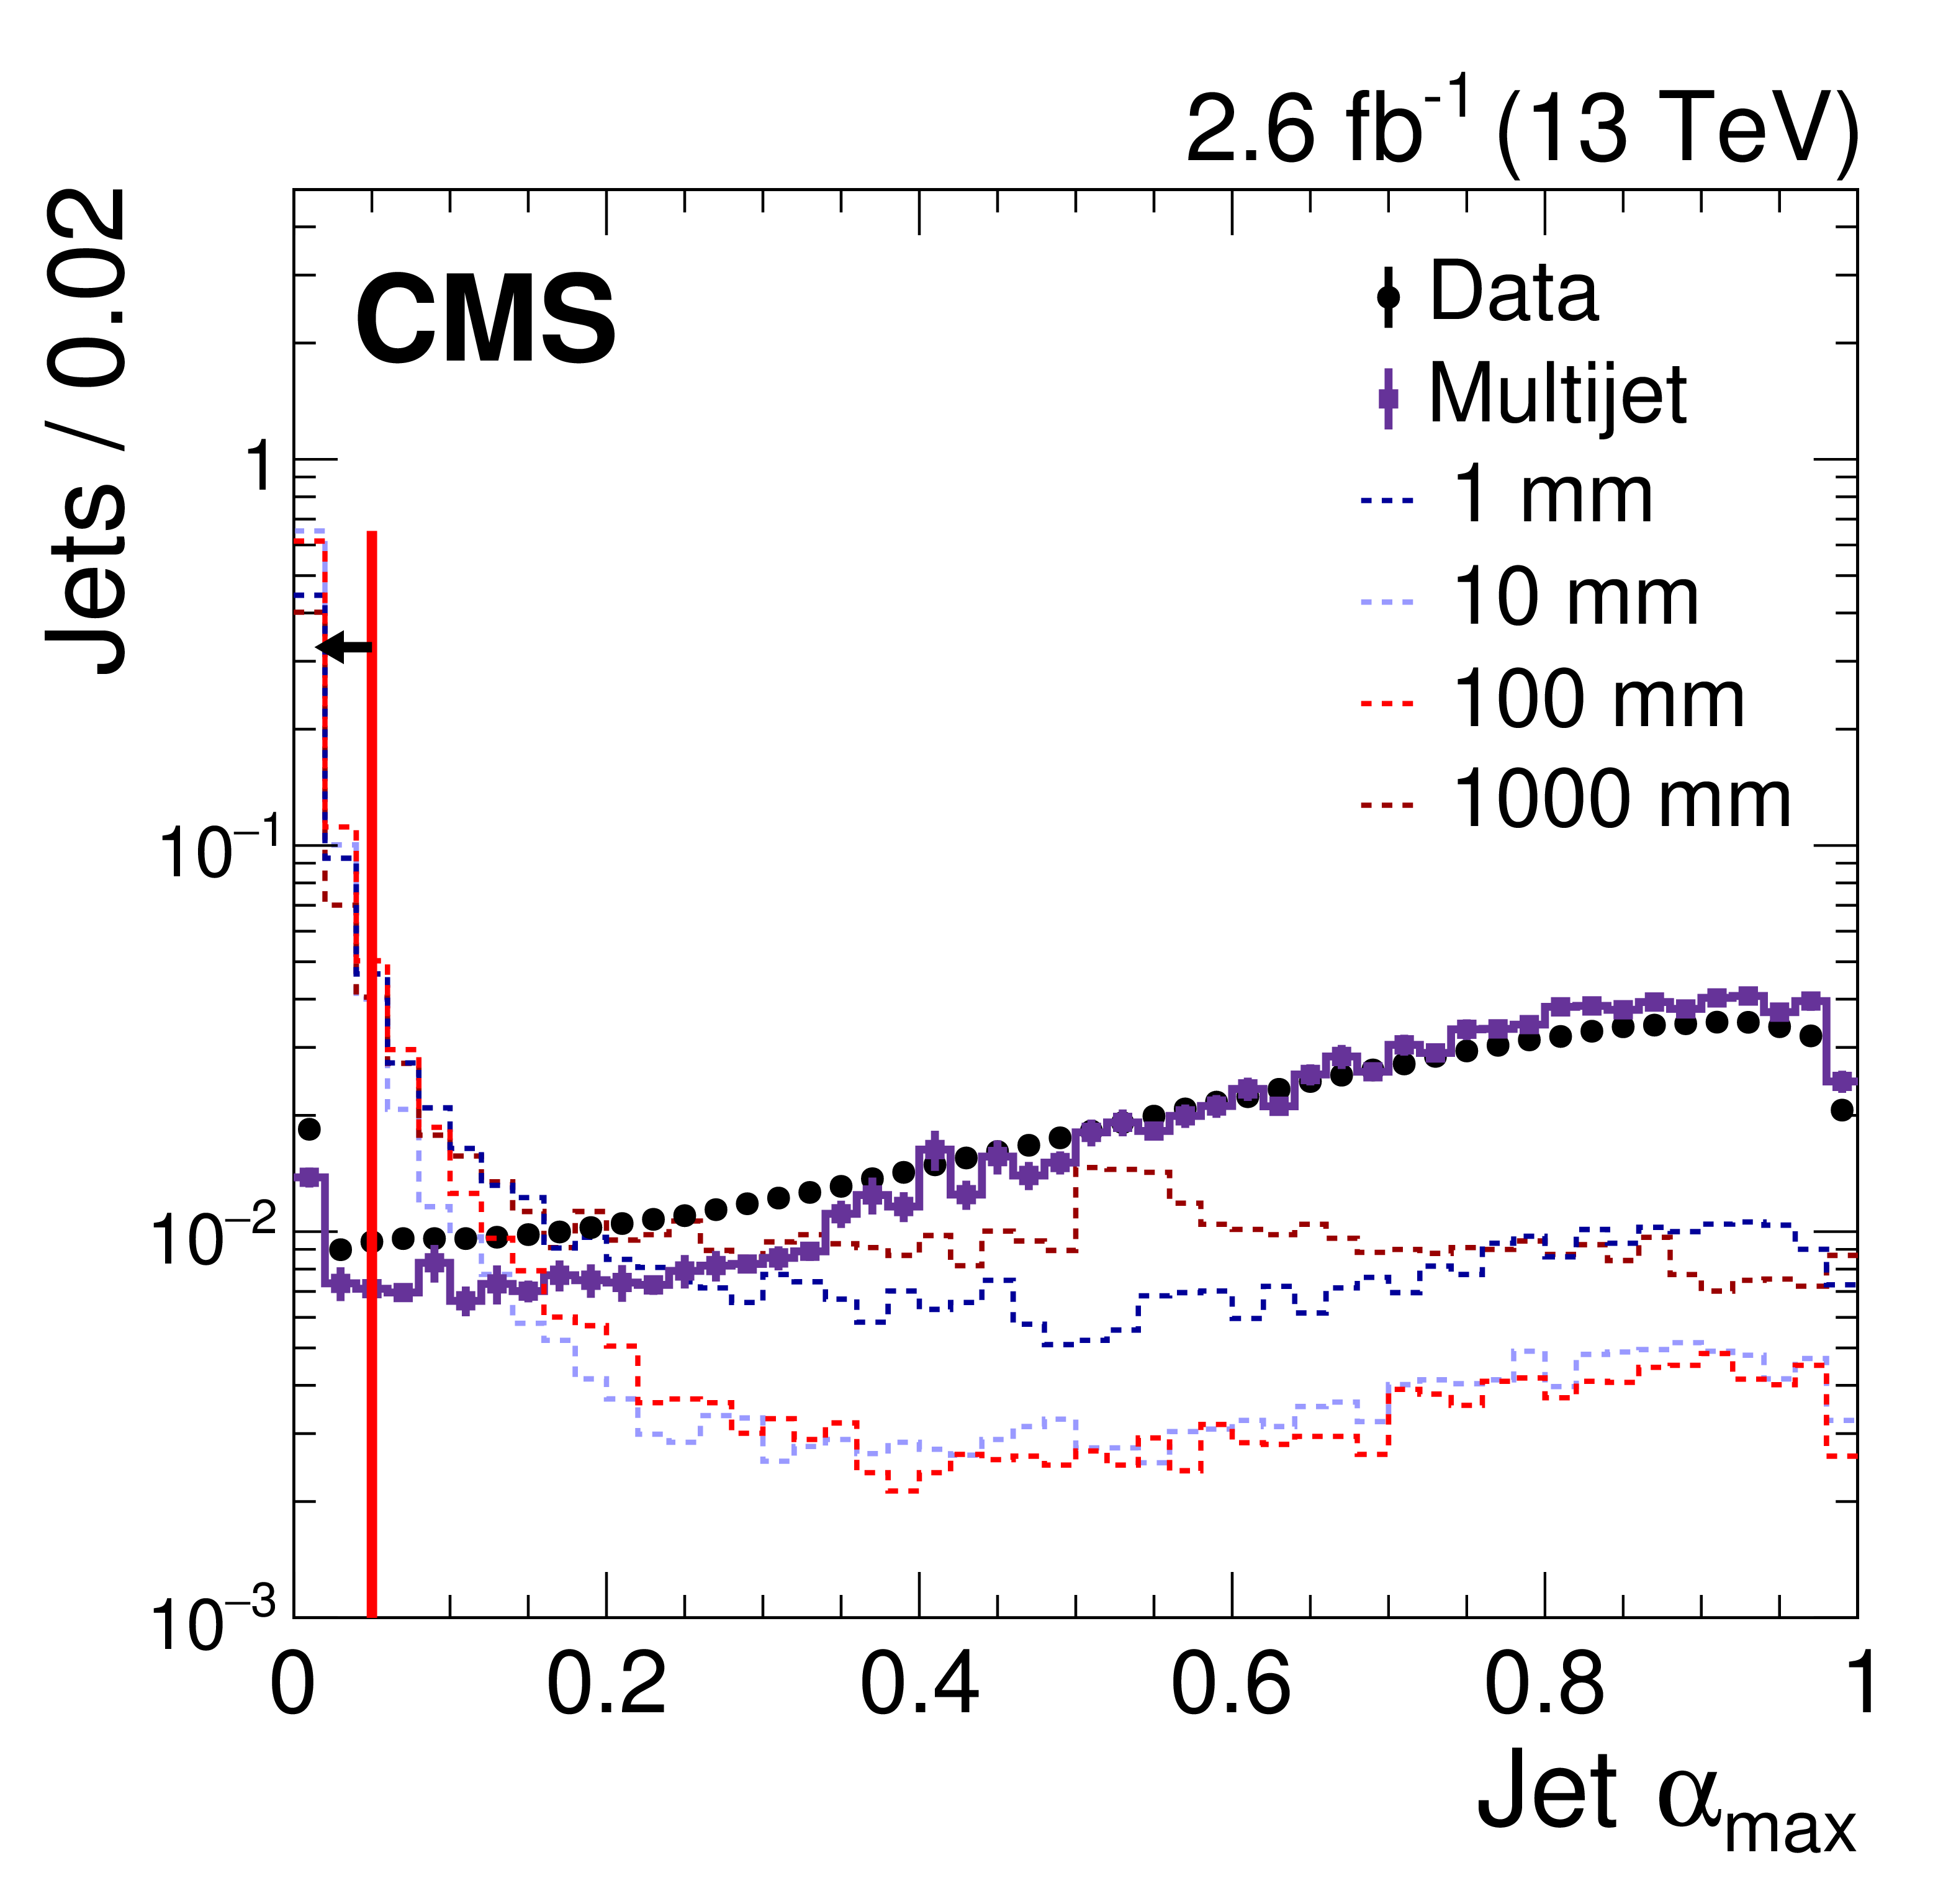
Figure 1-a:
Comparison of distributions for the displaced-jet tagging variables $\alpha _{\text {max}}$ in data and simulation. The data distribution (circles) is compared to the expected background distributions from multijet events (squares) and several Jet-Jet benchmark models (dotted histograms) of pair-produced long-lived neutral scalar particles with $m_{X^{0}} = $ 700 GeV and different values of $c\tau _0$. The vertical lines designate the value of the requirement for the chosen displaced-jet tag. The direction of the arrow indicates the values included in the requirement. All distributions have unit normalization. |
png pdf |
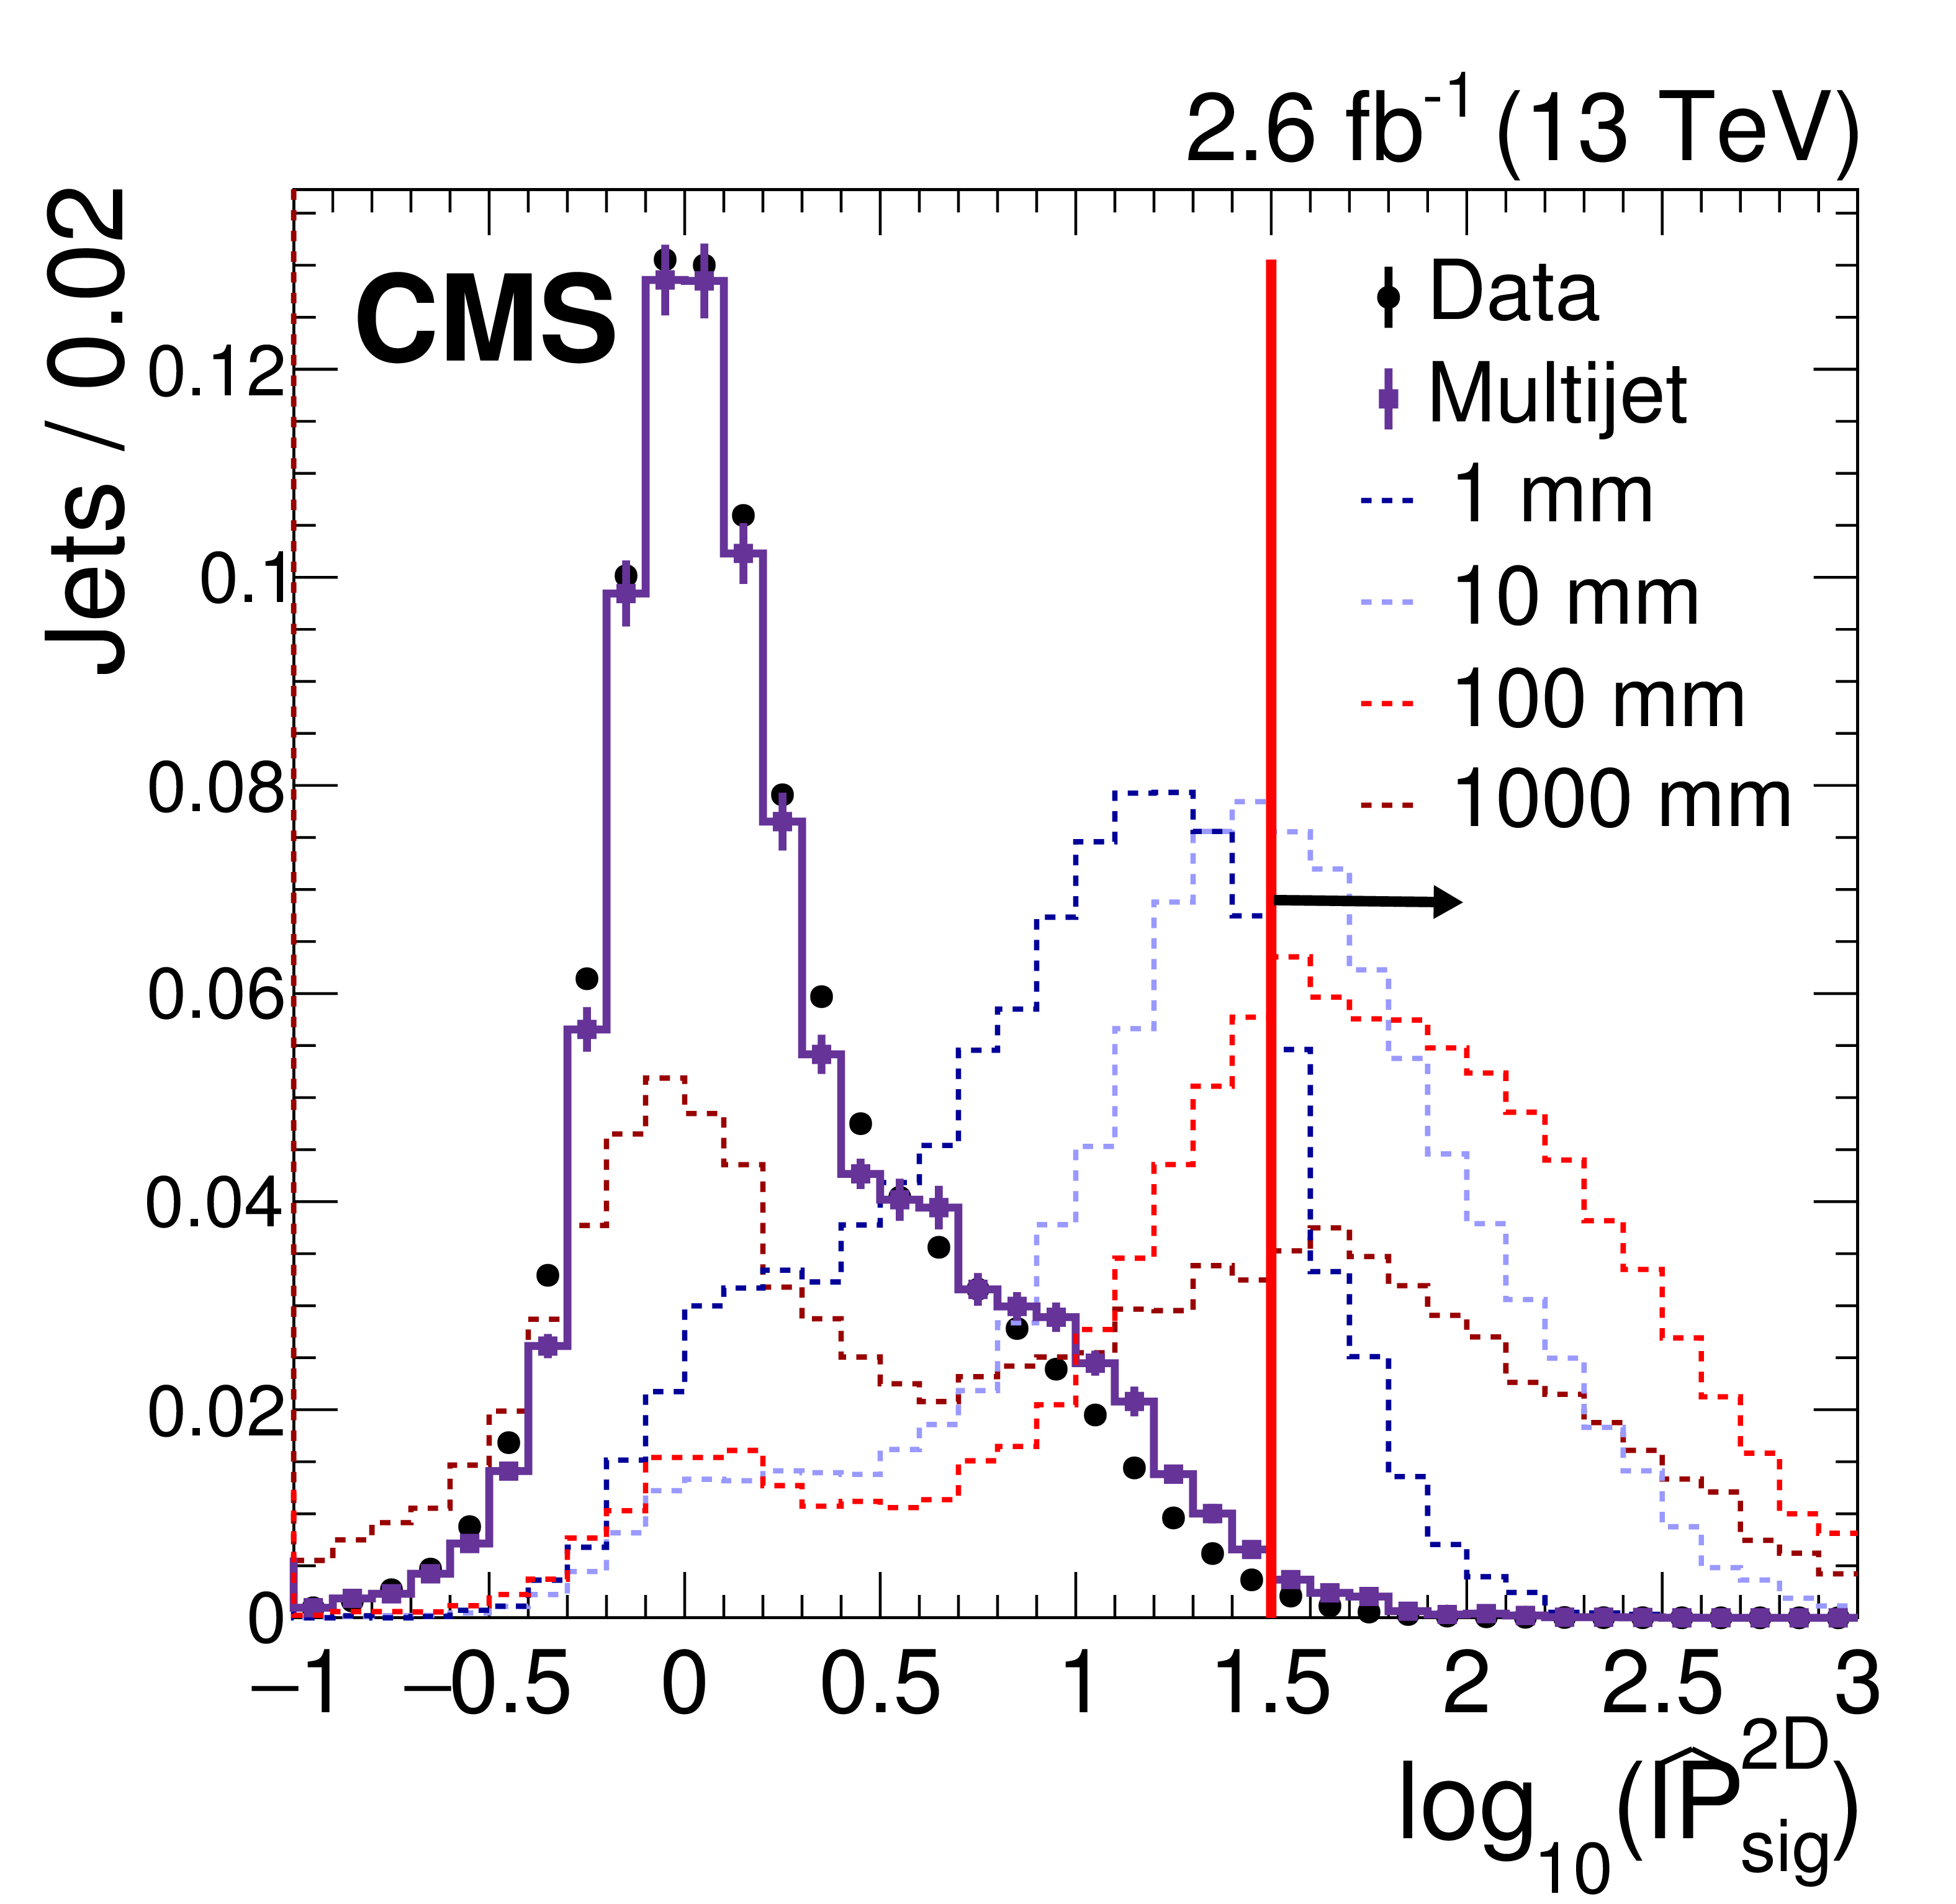
Figure 1-b:
Comparison of distributions for the displaced-jet tagging variables $\hat{\mathrm{IP}}{}^{\mathrm {2D}}_{\text {sig}}$ in data and simulation. The data distribution (circles) is compared to the expected background distributions from multijet events (squares) and several Jet-Jet benchmark models (dotted histograms) of pair-produced long-lived neutral scalar particles with $m_{X^{0}} = $ 700 GeV and different values of $c\tau _0$. The vertical lines designate the value of the requirement for the chosen displaced-jet tag. The direction of the arrow indicates the values included in the requirement. All distributions have unit normalization. |
png pdf |
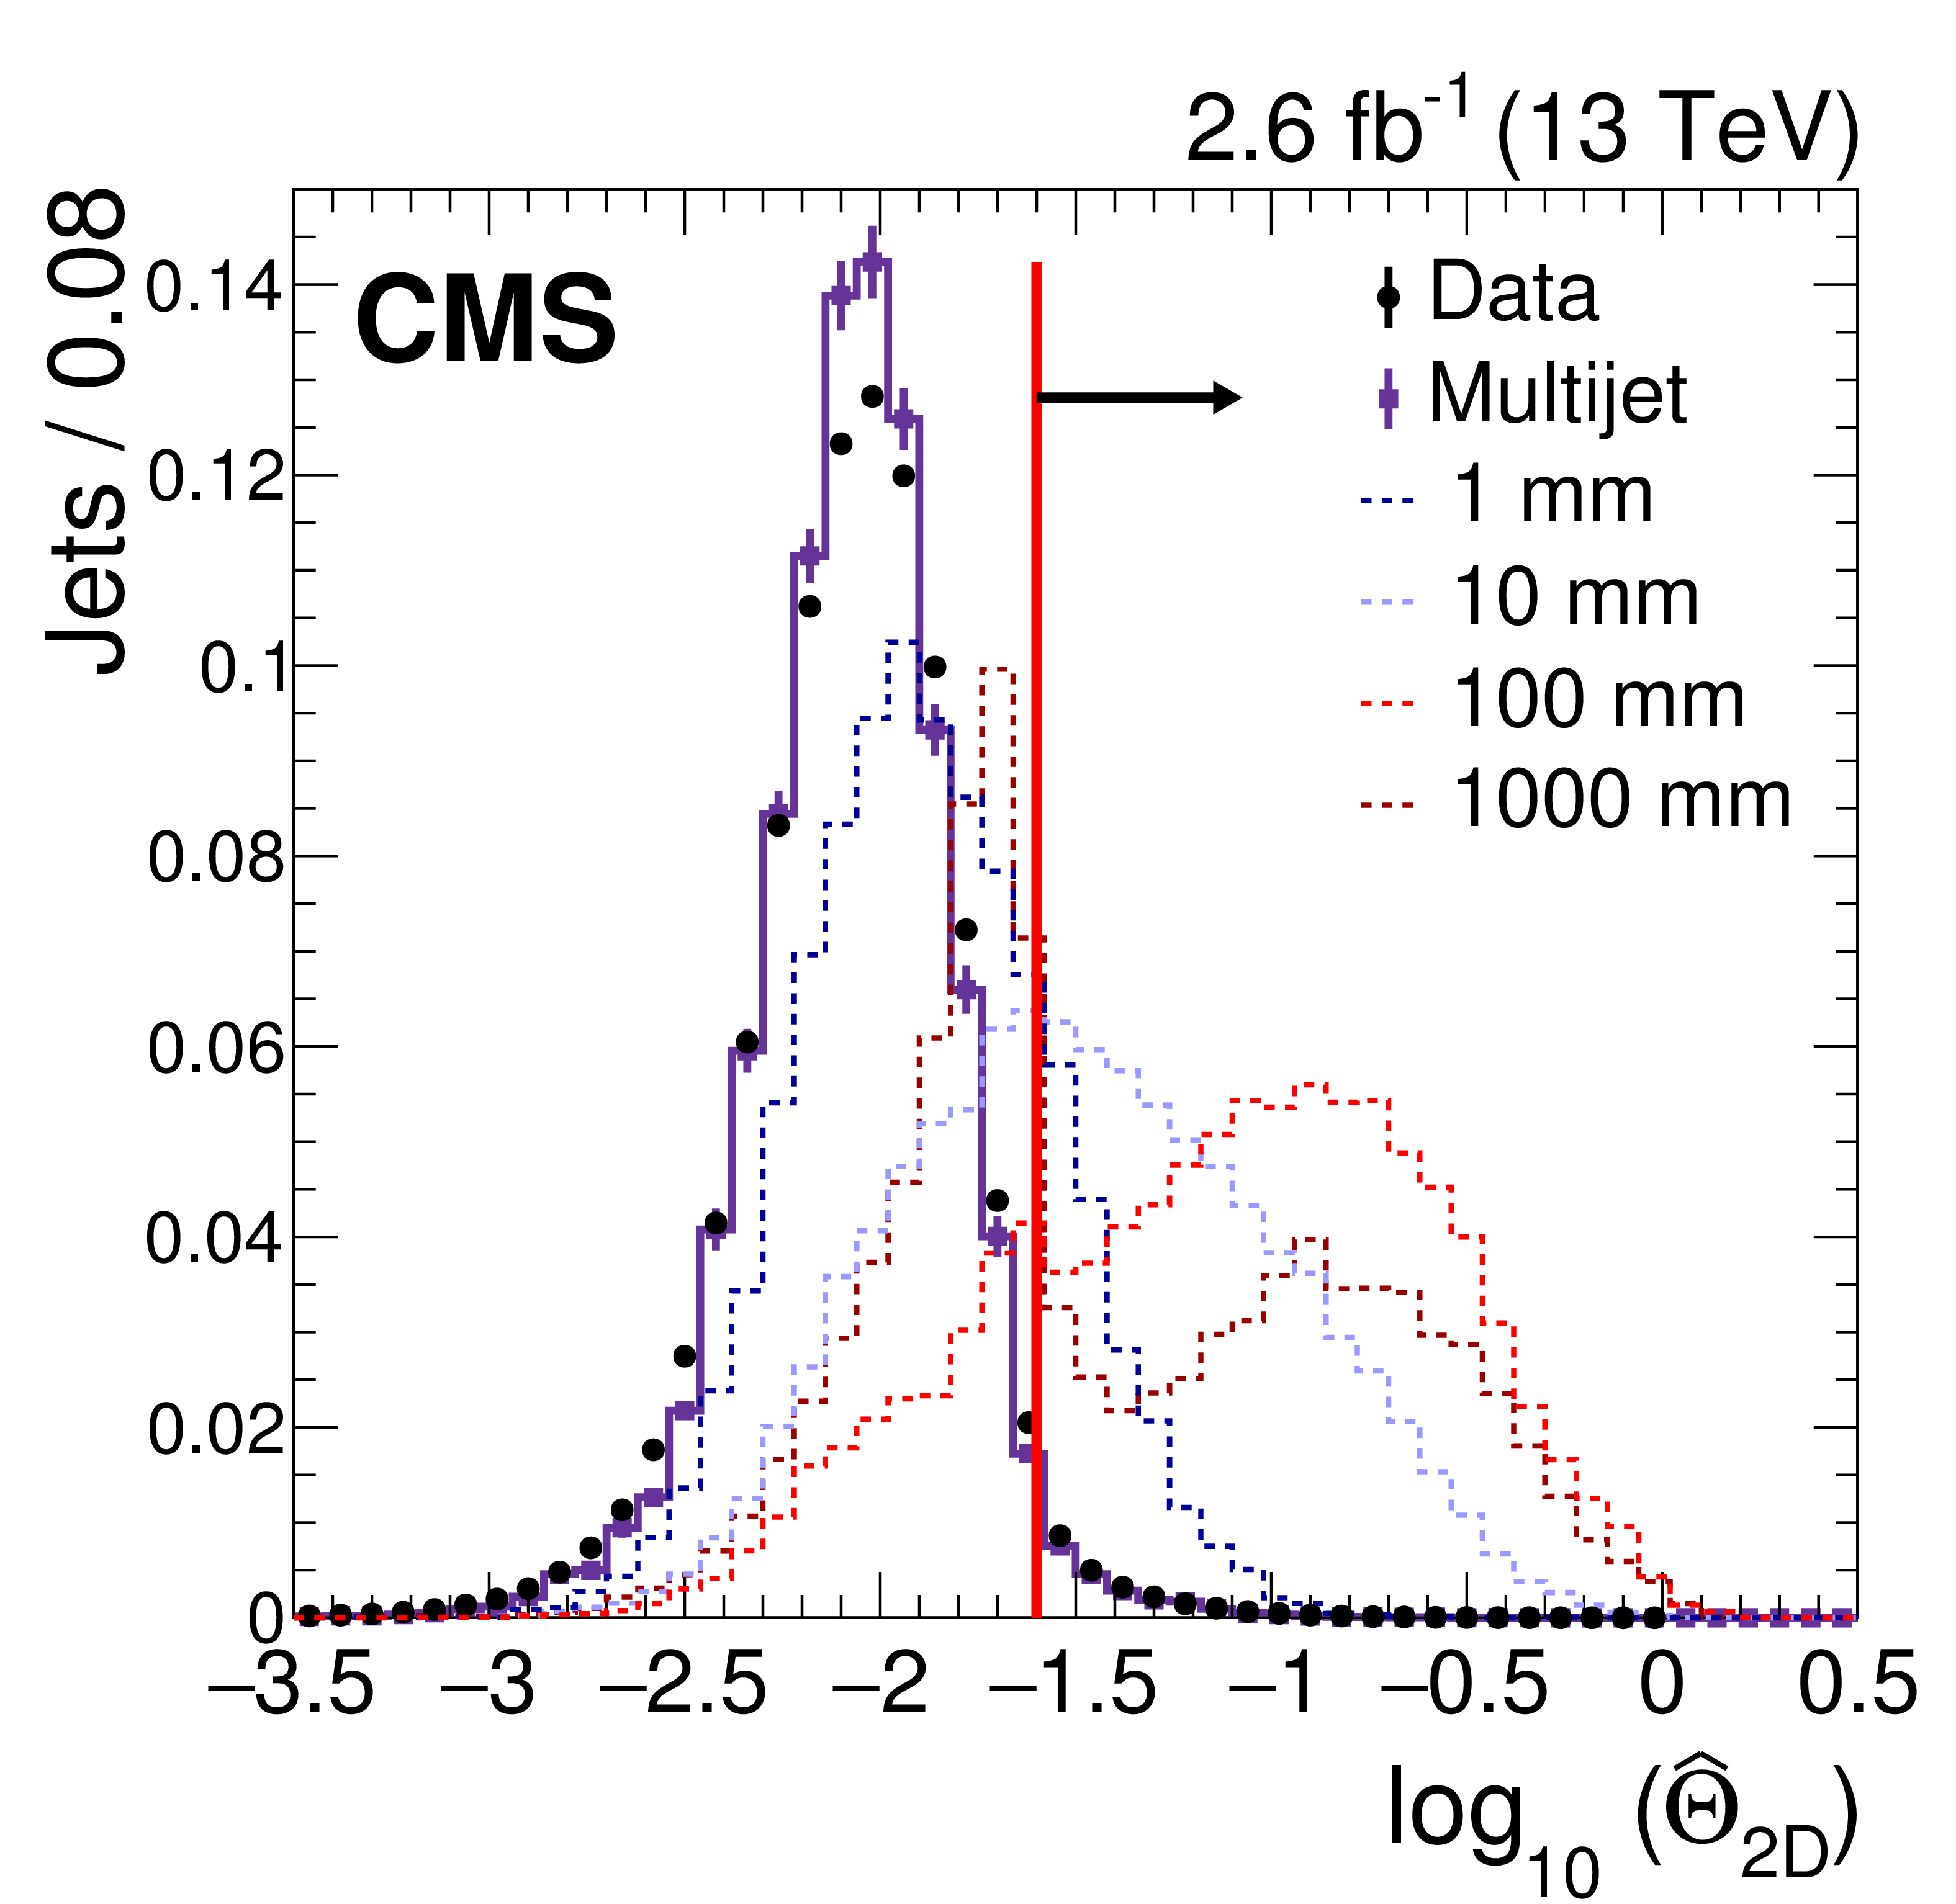
Figure 1-c:
Comparison of distributions for the displaced-jet tagging variables $\hat{\Theta}_{\mathrm {2D}}$ in data and simulation. The data distribution (circles) is compared to the expected background distributions from multijet events (squares) and several Jet-Jet benchmark models (dotted histograms) of pair-produced long-lived neutral scalar particles with $m_{X^{0}} = $ 700 GeV and different values of $c\tau _0$. The vertical lines designate the value of the requirement for the chosen displaced-jet tag. The direction of the arrow indicates the values included in the requirement. All distributions have unit normalization. |
png pdf |
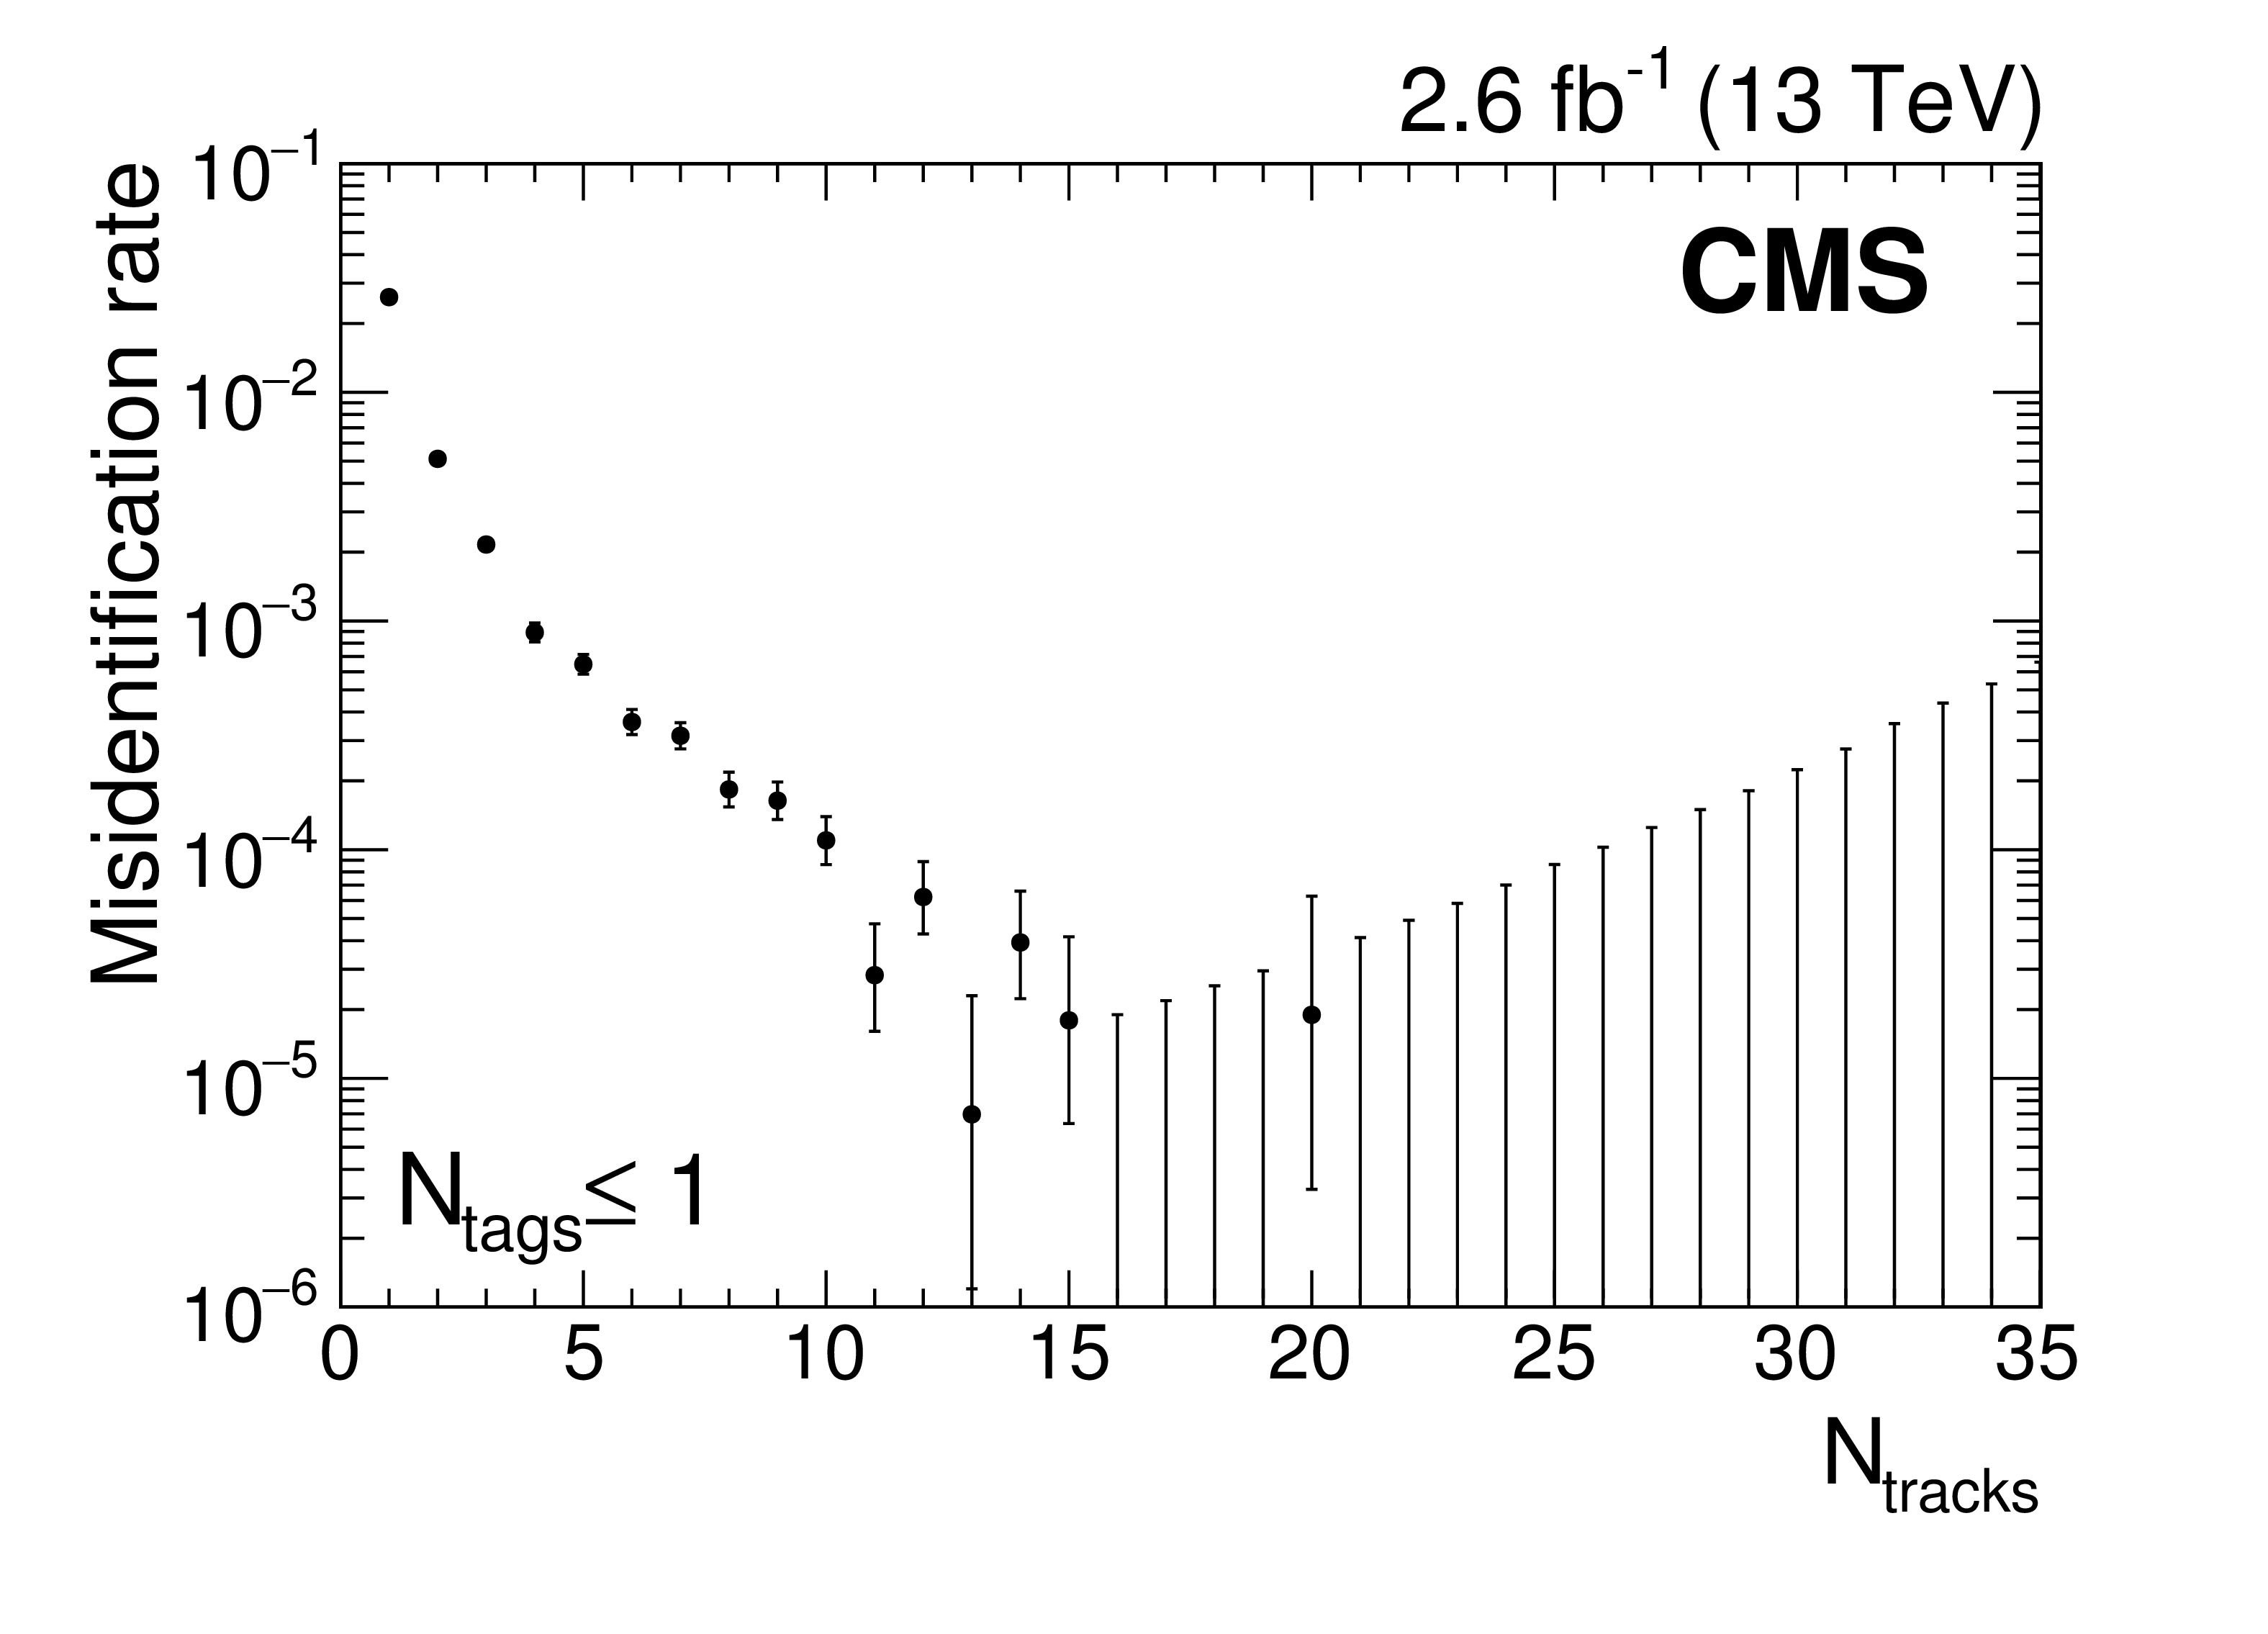
Figure 2:
The fraction of jets passing the displaced-jet tagging criteria as a function of the number of tracks associated with the jet. The results are from data events with $N_{\text {tags}} \leq $ 1, collected with the displaced-jet triggers and passing the offline selection criteria. |
png pdf |
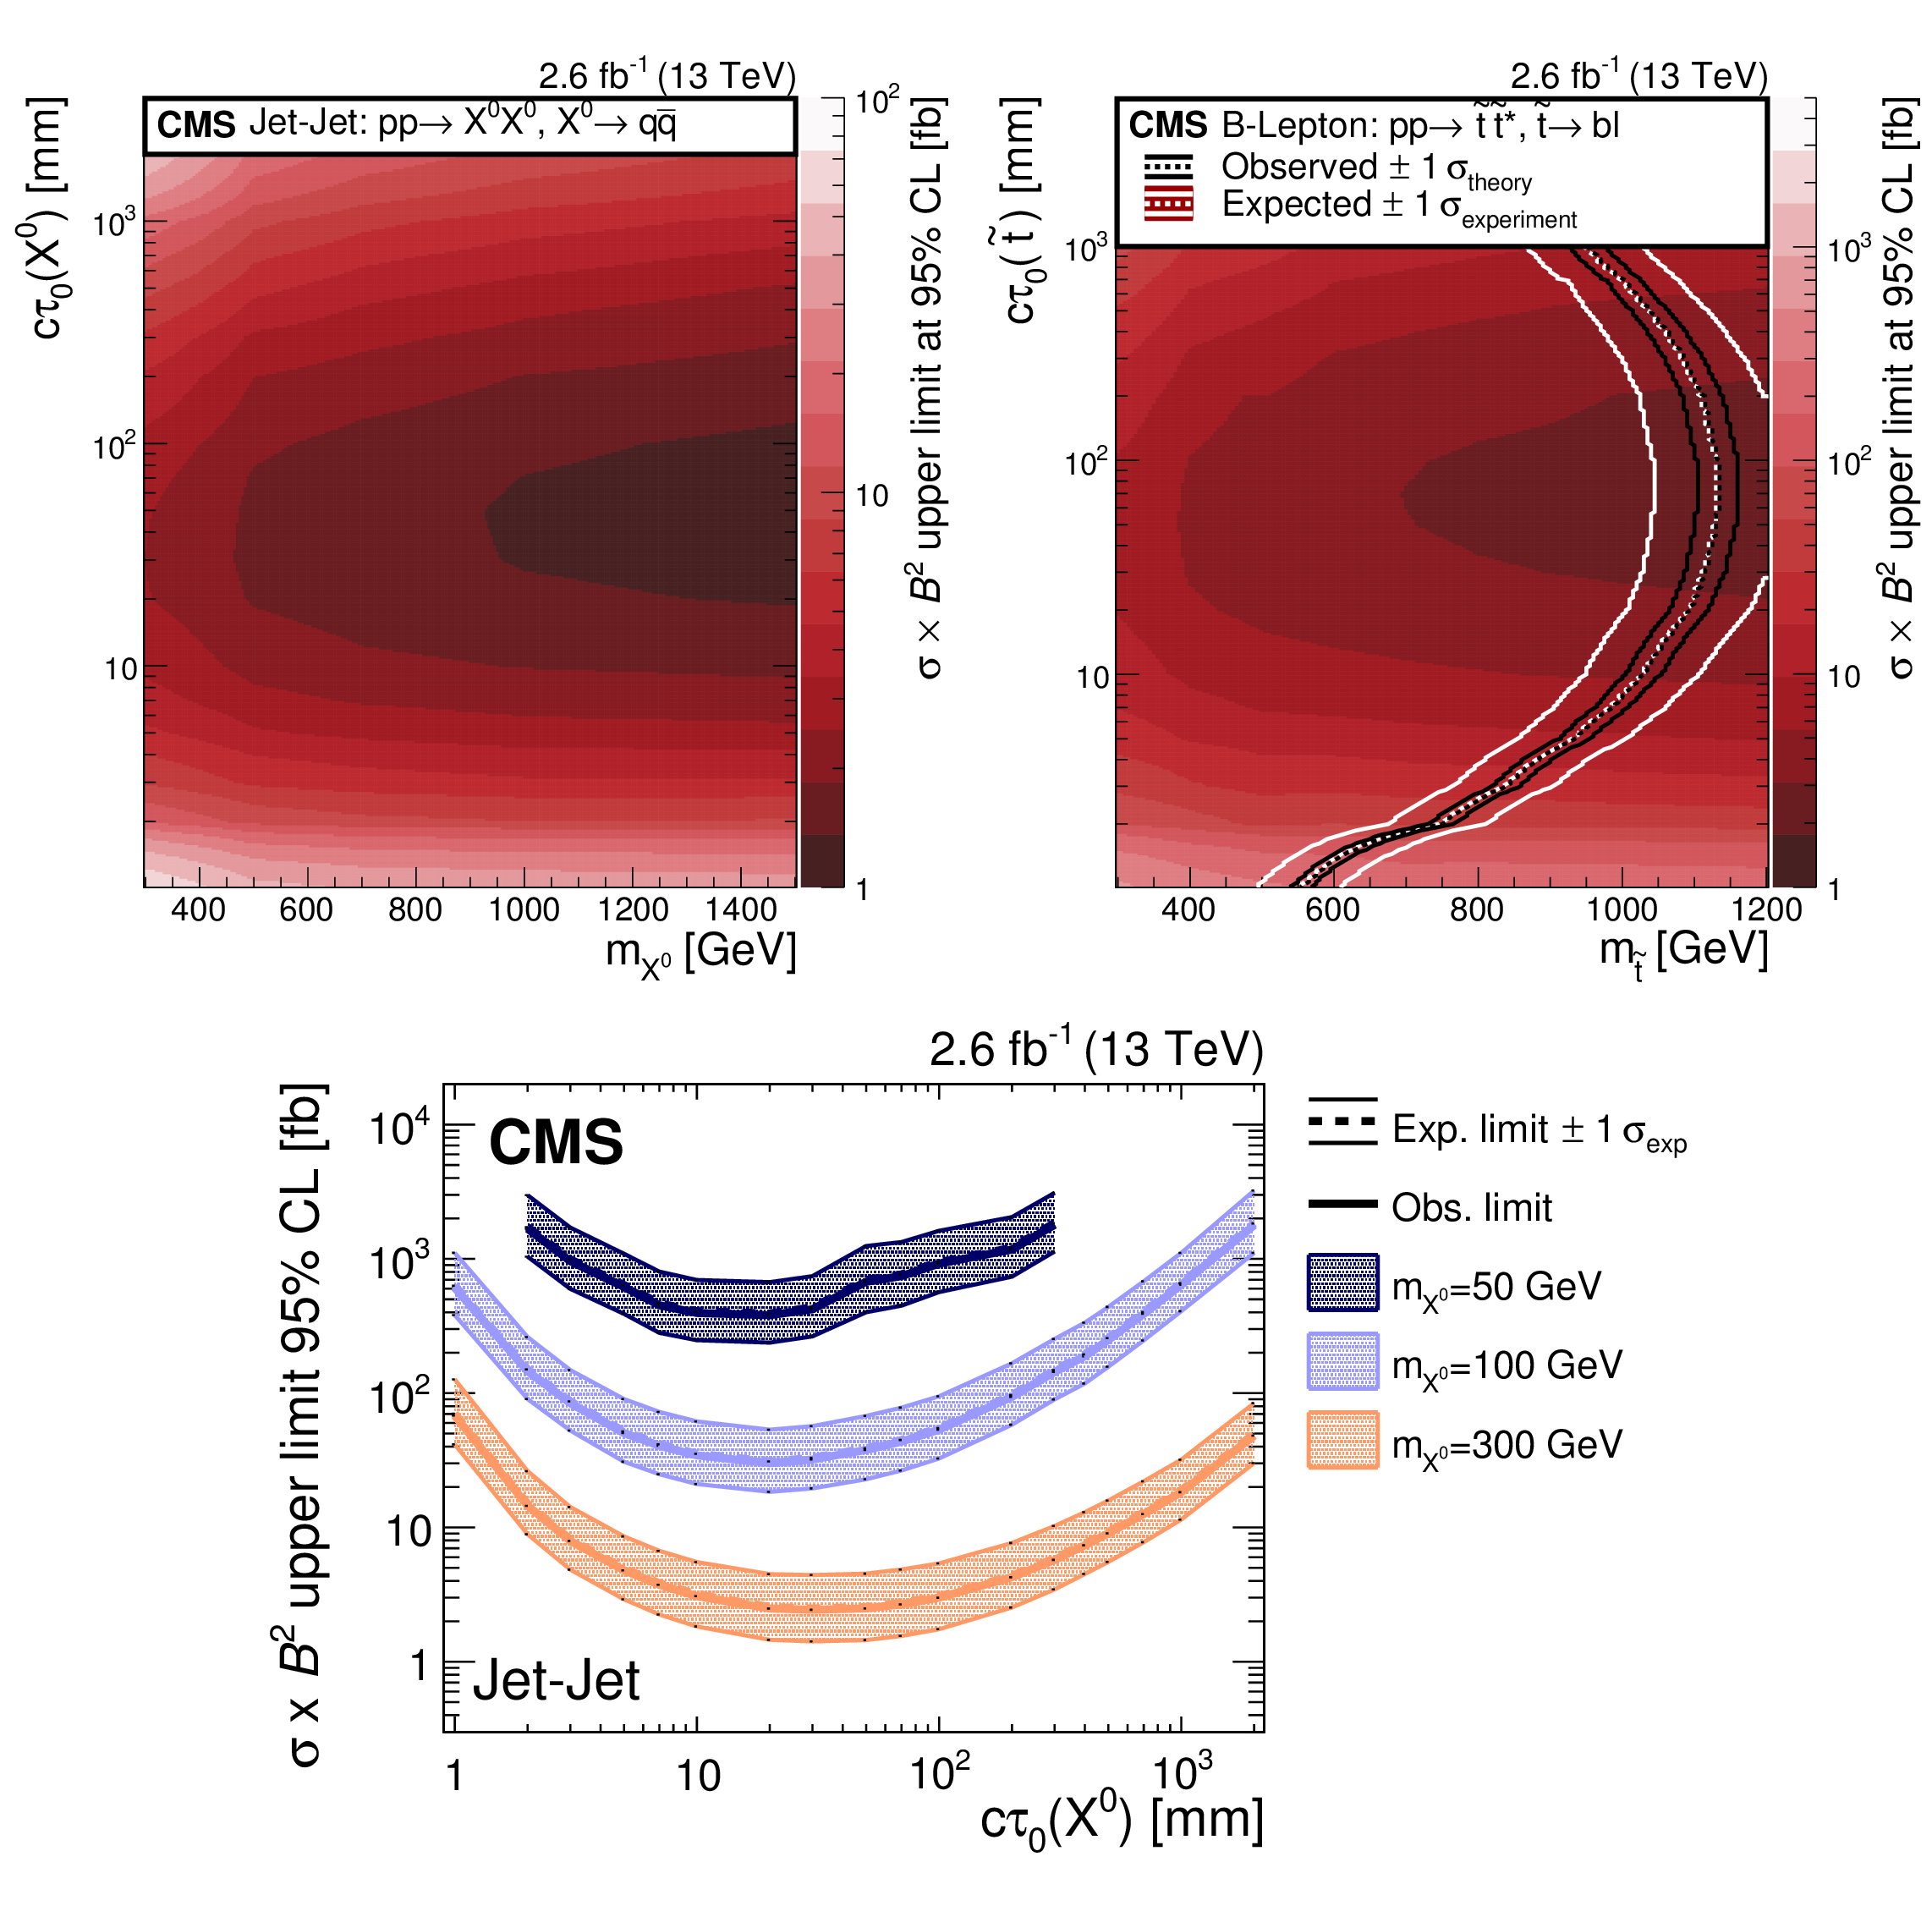
Figure 3:
The excluded cross section at 95% CL for the Jet-Jet model (upper left) and the B-Lepton model (upper right) as a function of the mass and proper decay length of the parent particle. The B-Lepton plot also shows the expected (observed) exclusion region with one standard deviation experimental (theoretical) uncertainties, utilizing a NLO+NLL calculation of the top squark production cross section. The lower plot shows the excluded cross section at 95% CL for the Jet-Jet model as a function of the proper decay length for three illustrative smaller values of the mass. The shaded bands in the lower plot represent the one standard deviation uncertainties in the expected limits. |

png pdf |
Figure 3-a:
The excluded cross section at 95% CL for the Jet-Jet model as a function of the mass and proper decay length of the parent particle. |

png pdf |
Figure 3-b:
The excluded cross section at 95% CL for the B-Lepton model as a function of the mass and proper decay length of the parent particle. The plot also shows the expected (observed) exclusion region with one standard deviation experimental (theoretical) uncertainties, utilizing a NLO+NLL calculation of the top squark production cross section. |
png pdf |
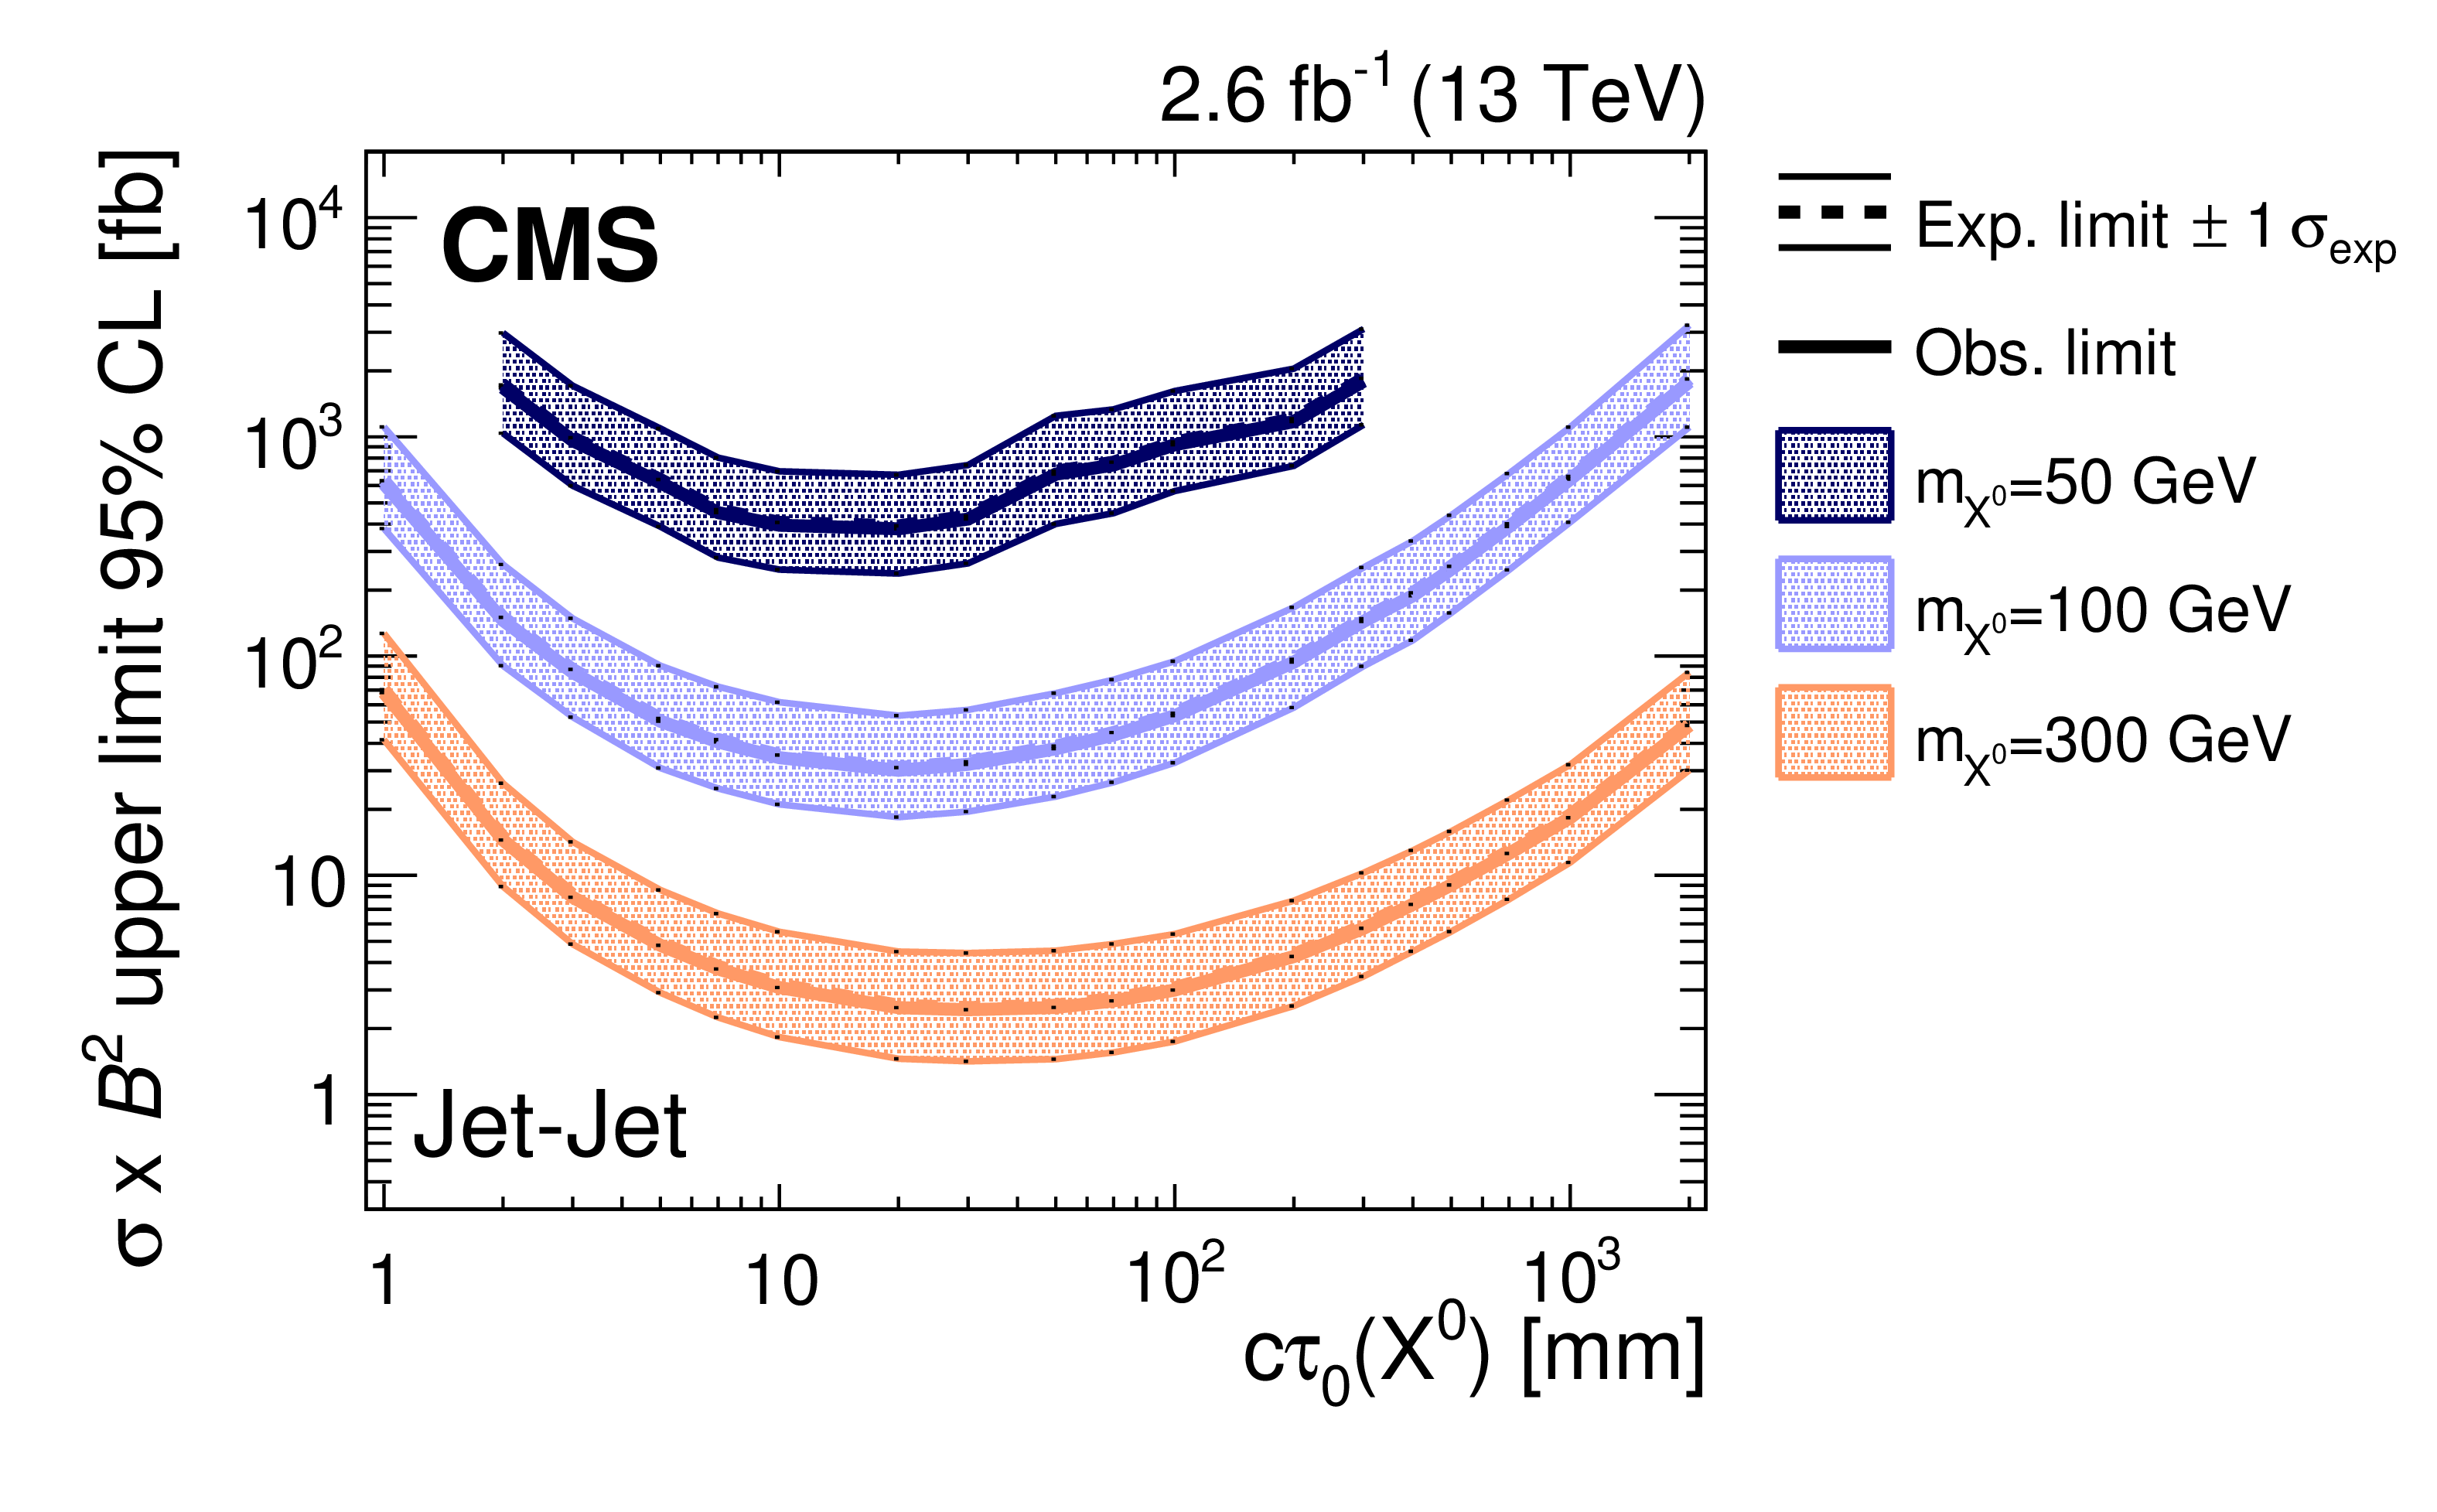
Figure 3-c:
The plot shows the excluded cross section at 95% CL for the Jet-Jet model as a function of the proper decay length for three illustrative smaller values of the mass. The shaded bands represent the one standard deviation uncertainties in the expected limits. |
| Tables | |
png pdf |
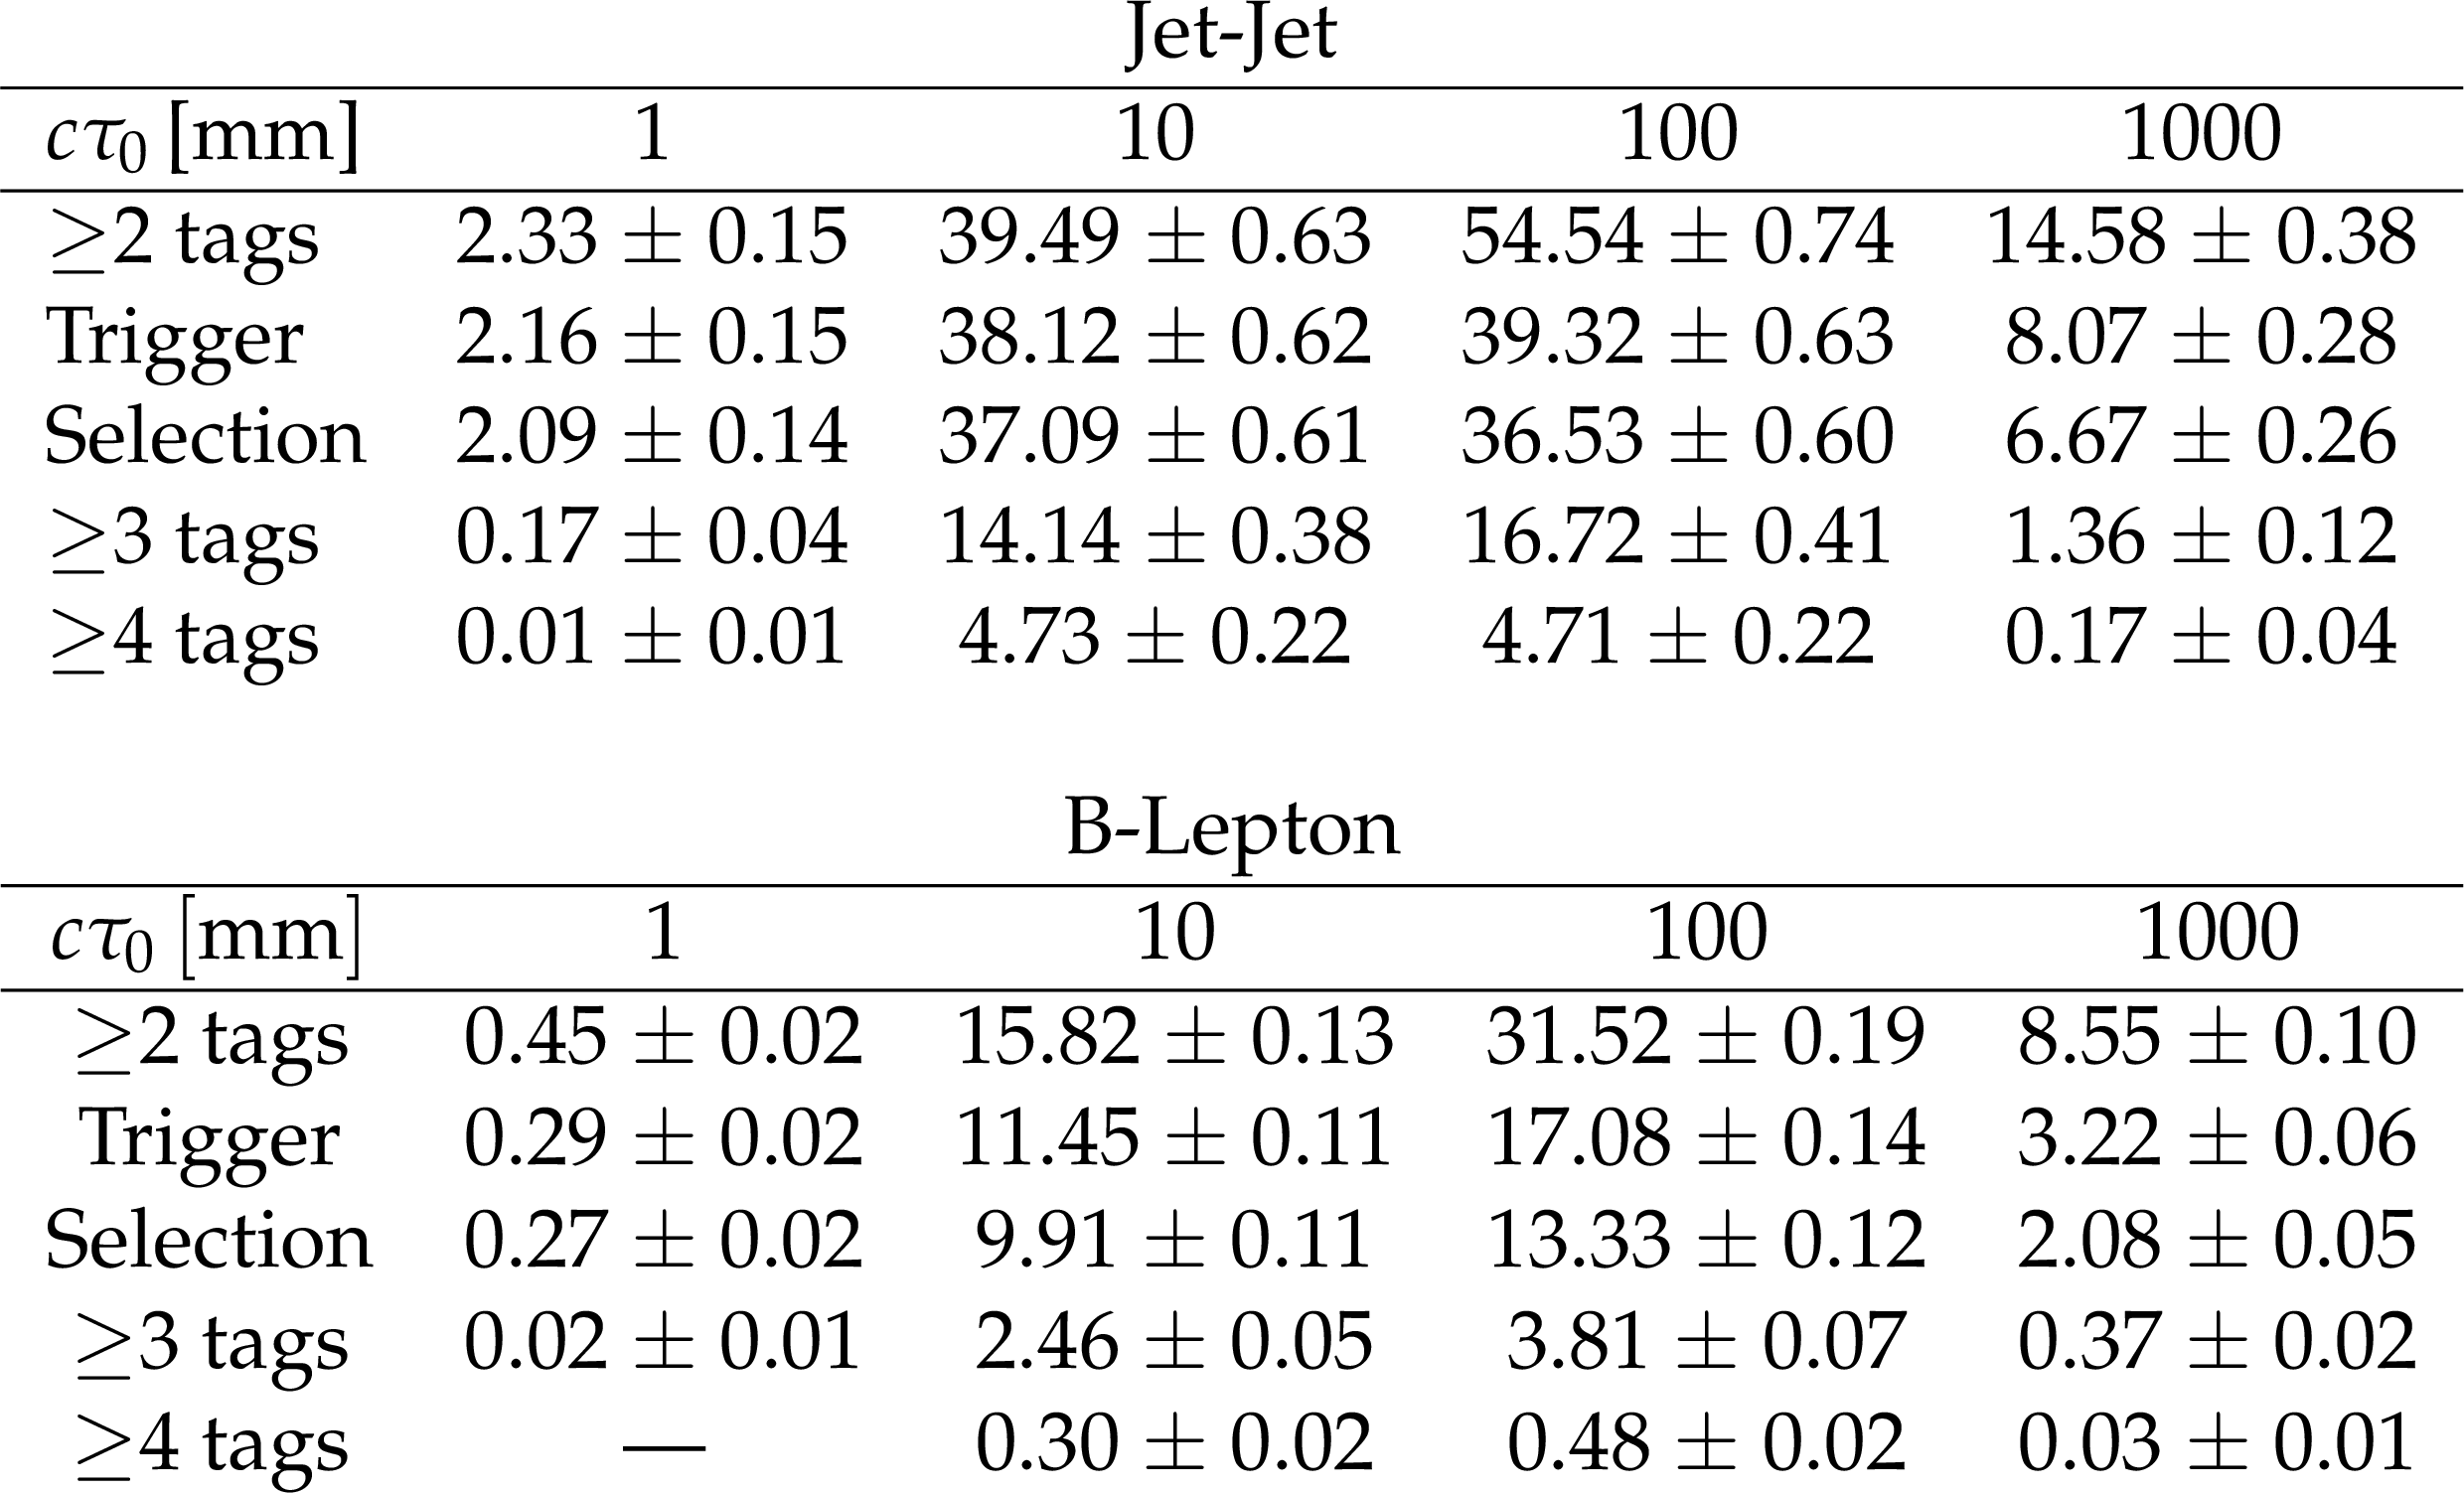
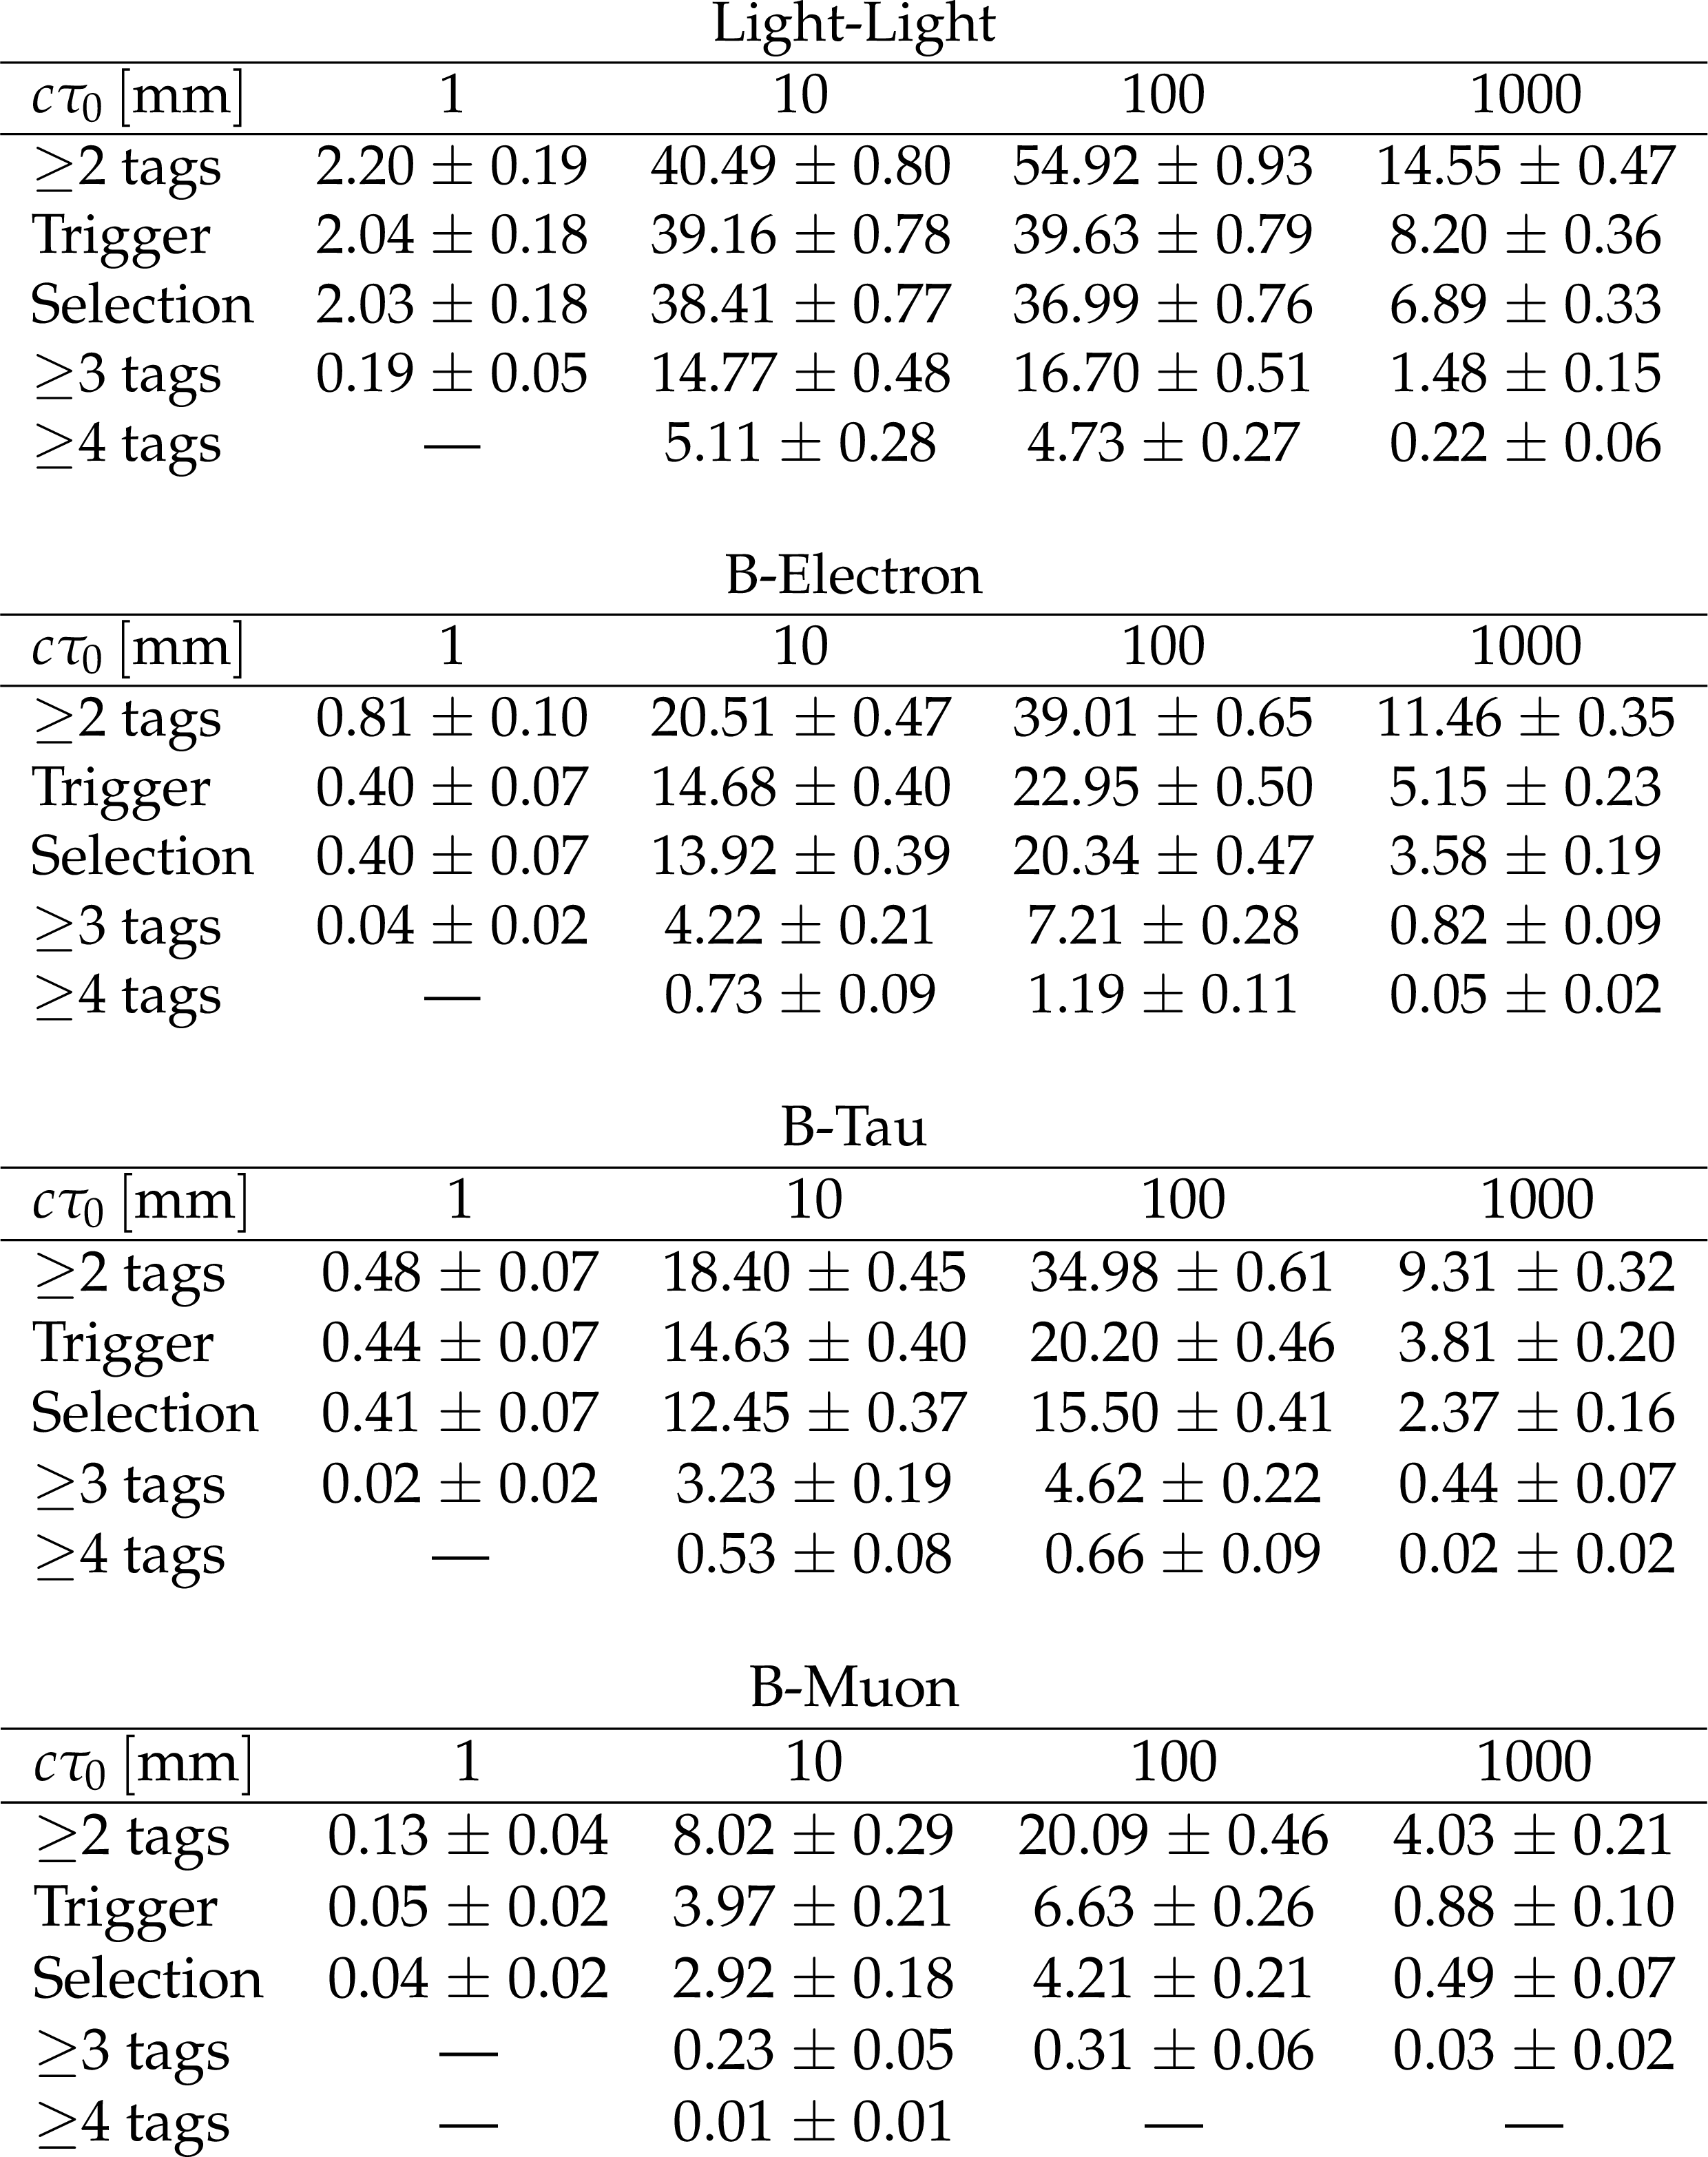
Table 1:
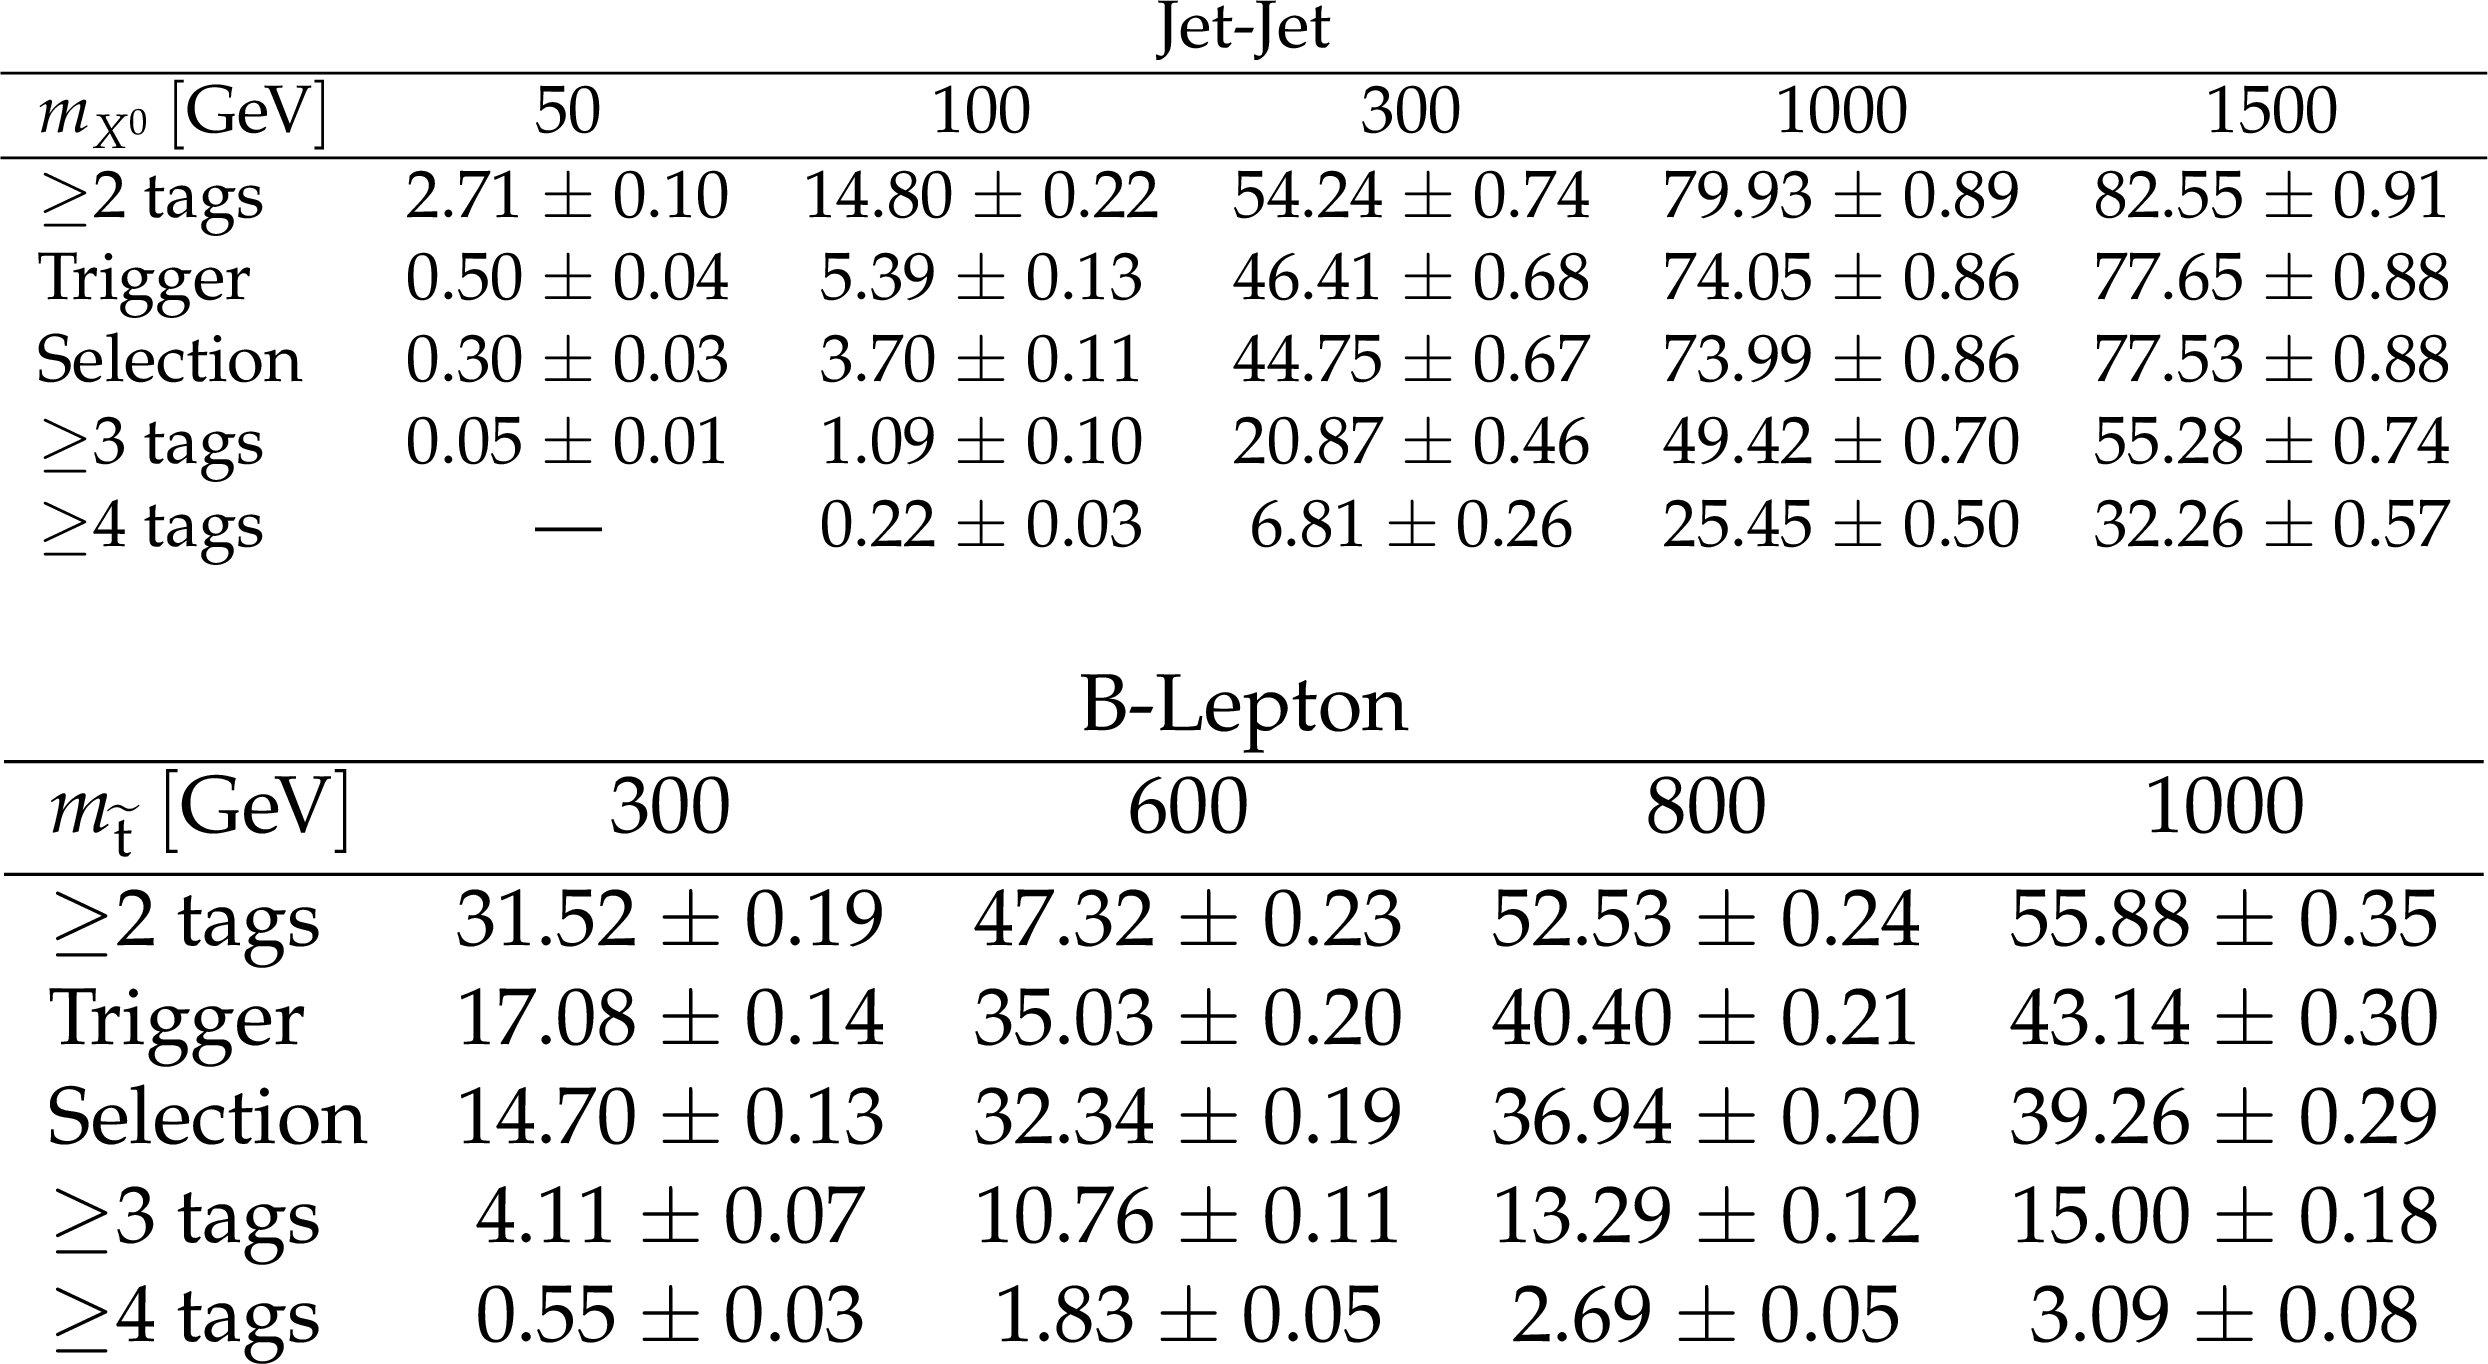
Signal efficiencies (in %) for $m_{X^0}=m_{\tilde{\mathrm{t}}} = $ 300 GeV for various values of $c\tau _0$ for the Jet-Jet and B-Lepton models. Selection requirements are cumulative from the first row to the last. |
png pdf |
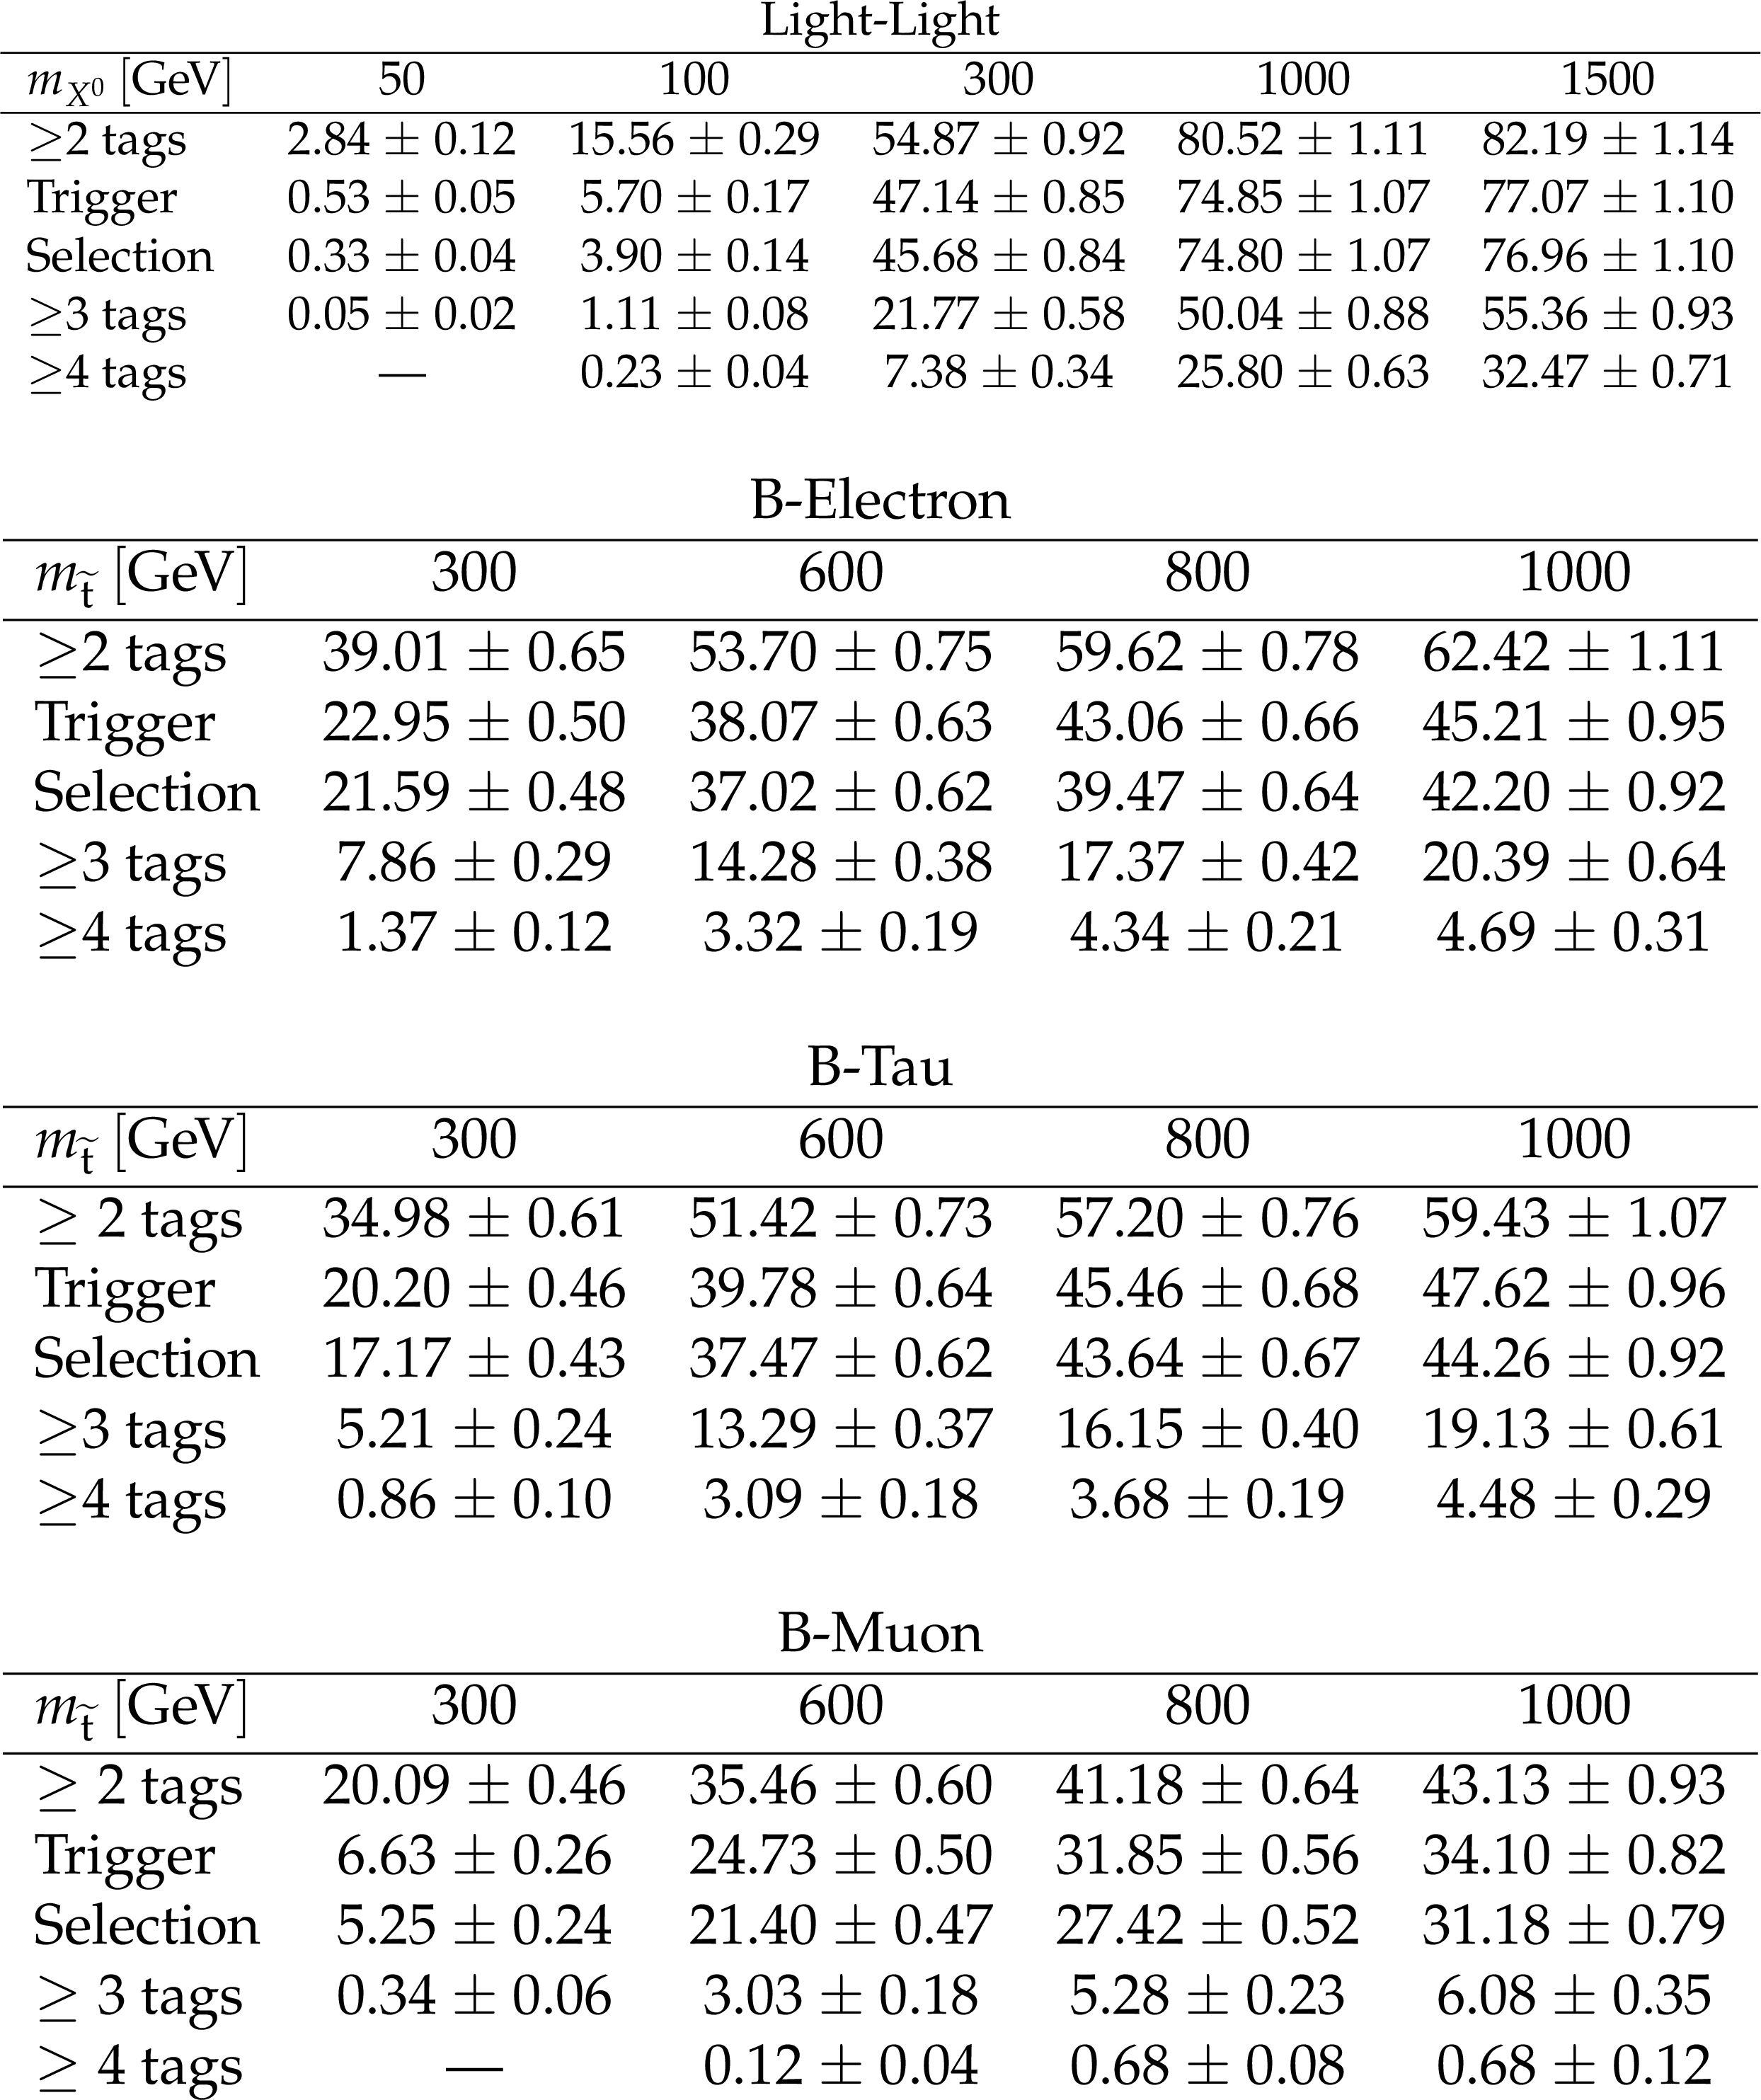
Table 2:
Signal efficiencies (in %) for the Jet-Jet and B-Lepton models with $c\tau _0= $ 30 mm and for various values of mass. Selection requirements are cumulative from the first row to the last. |
png pdf |
Table 3:
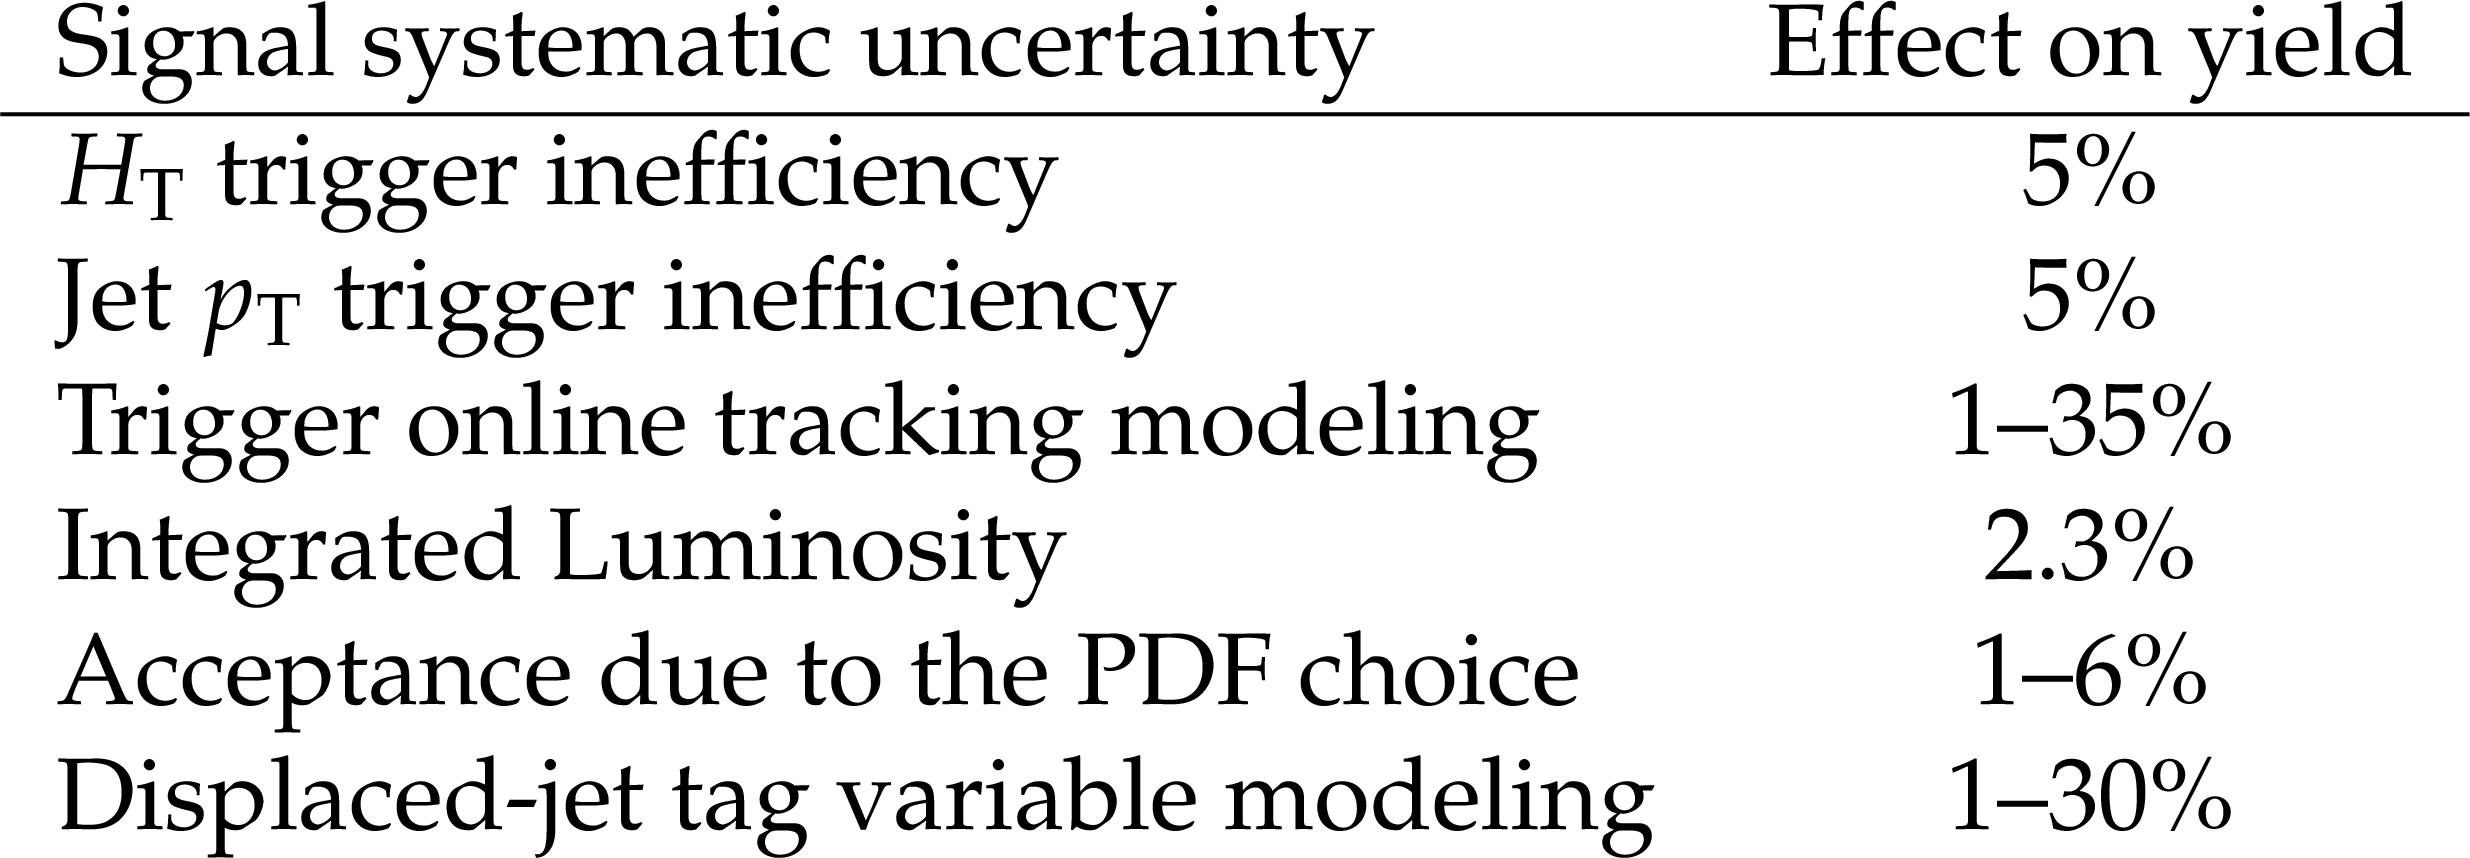
Summary of the signal systematic uncertainties. When the uncertainty depends on the specific features of the models (mass, decay length, and decay mode of the long-lived particle) a range is quoted, which refers to the computed uncertainty for $N_{\text {tags}}=$ 2 events. |
png pdf |
Table 4:
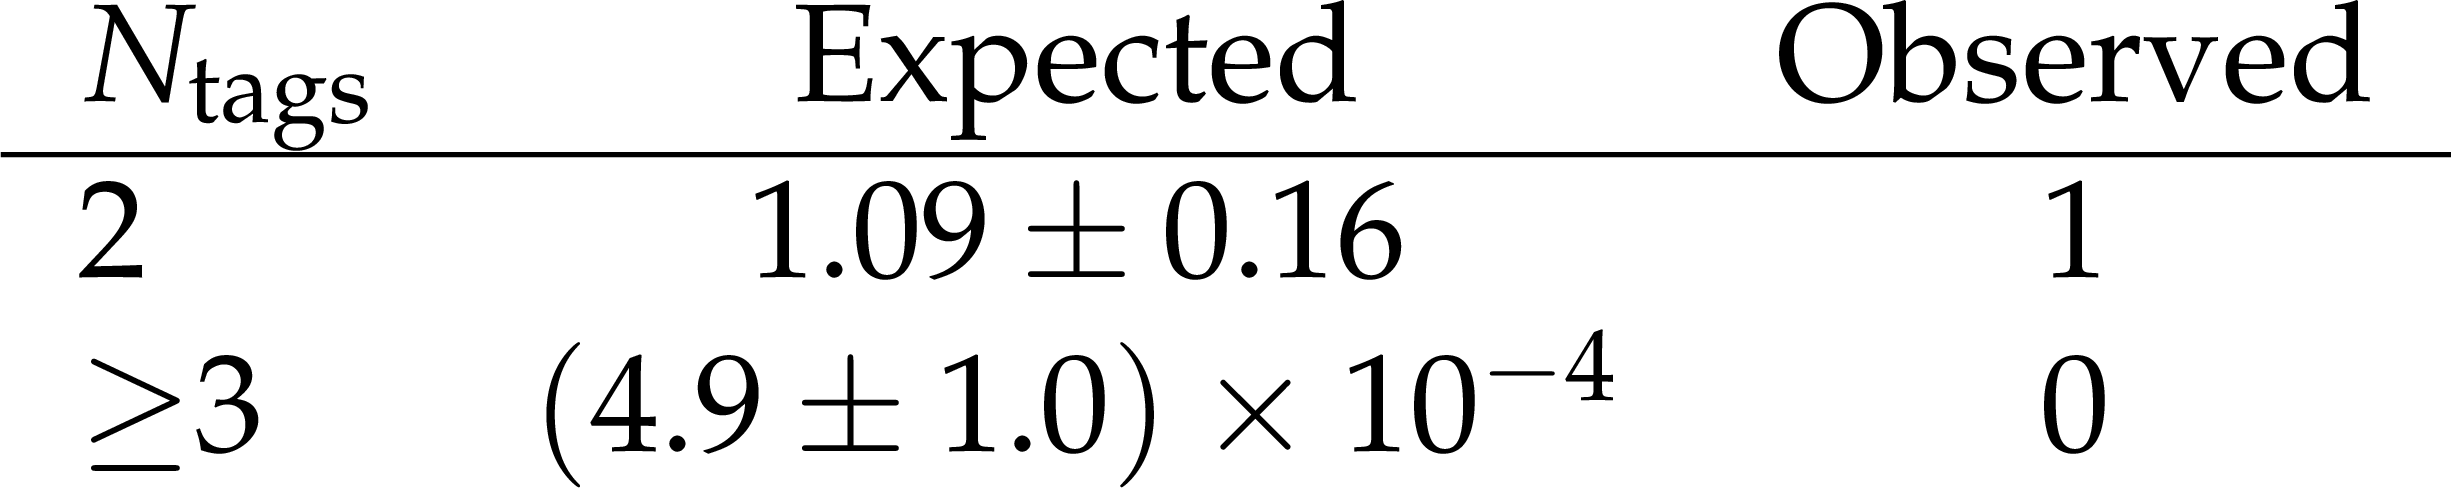
The predicted and observed number of events as a function of the number of tagged displaced jets. The prediction is based on the misidentification rate derived from events with fewer than two tags. The full event selection is applied. The uncertainty corresponds to the total background systematic uncertainty. |
| Summary |
| A search for long-lived particles has been performed with data corresponding to an integrated luminosity of 2.6 fb$^{-1}$ collected at a center-of-mass energy of 13 TeV by the CMS experiment in 2015. This is the first search for long-lived particles decaying to jet final states in 13 TeV data and the first search to demonstrate explicit sensitivity to long-lived particles decaying to $\tau$ leptons. The analysis utilizes two customized topological trigger algorithms and an offline displaced-jet tagging algorithm, where the multiplicity of displaced jets is used to search for the presence of a signal. As no excess above the predicted background is found, upper limits are set at 95% confidence level on the production cross section for long-lived resonances decaying to two jets or to a lepton and b quark. The limits are calculated as a function of the mass and proper decay length of the long-lived particles. For resonances decaying to a b quark and a lepton, cross sections larger than 2.5 fb are excluded for proper decay lengths of 70-100 mm. The cross section limits are also translated into mass exclusion bounds, using a calculation of the top squark production cross section as a reference. Assuming equal lepton branching fractions, pair-produced long-lived R-parity violating top squarks lighter than 550-1130 GeV are excluded, depending on the squark proper decay length. This mass exclusion bound is currently the most stringent bound available for top squark proper decay lengths greater than 3 mm. |
| Additional Figures | |
png pdf |
Additional Figure 1:
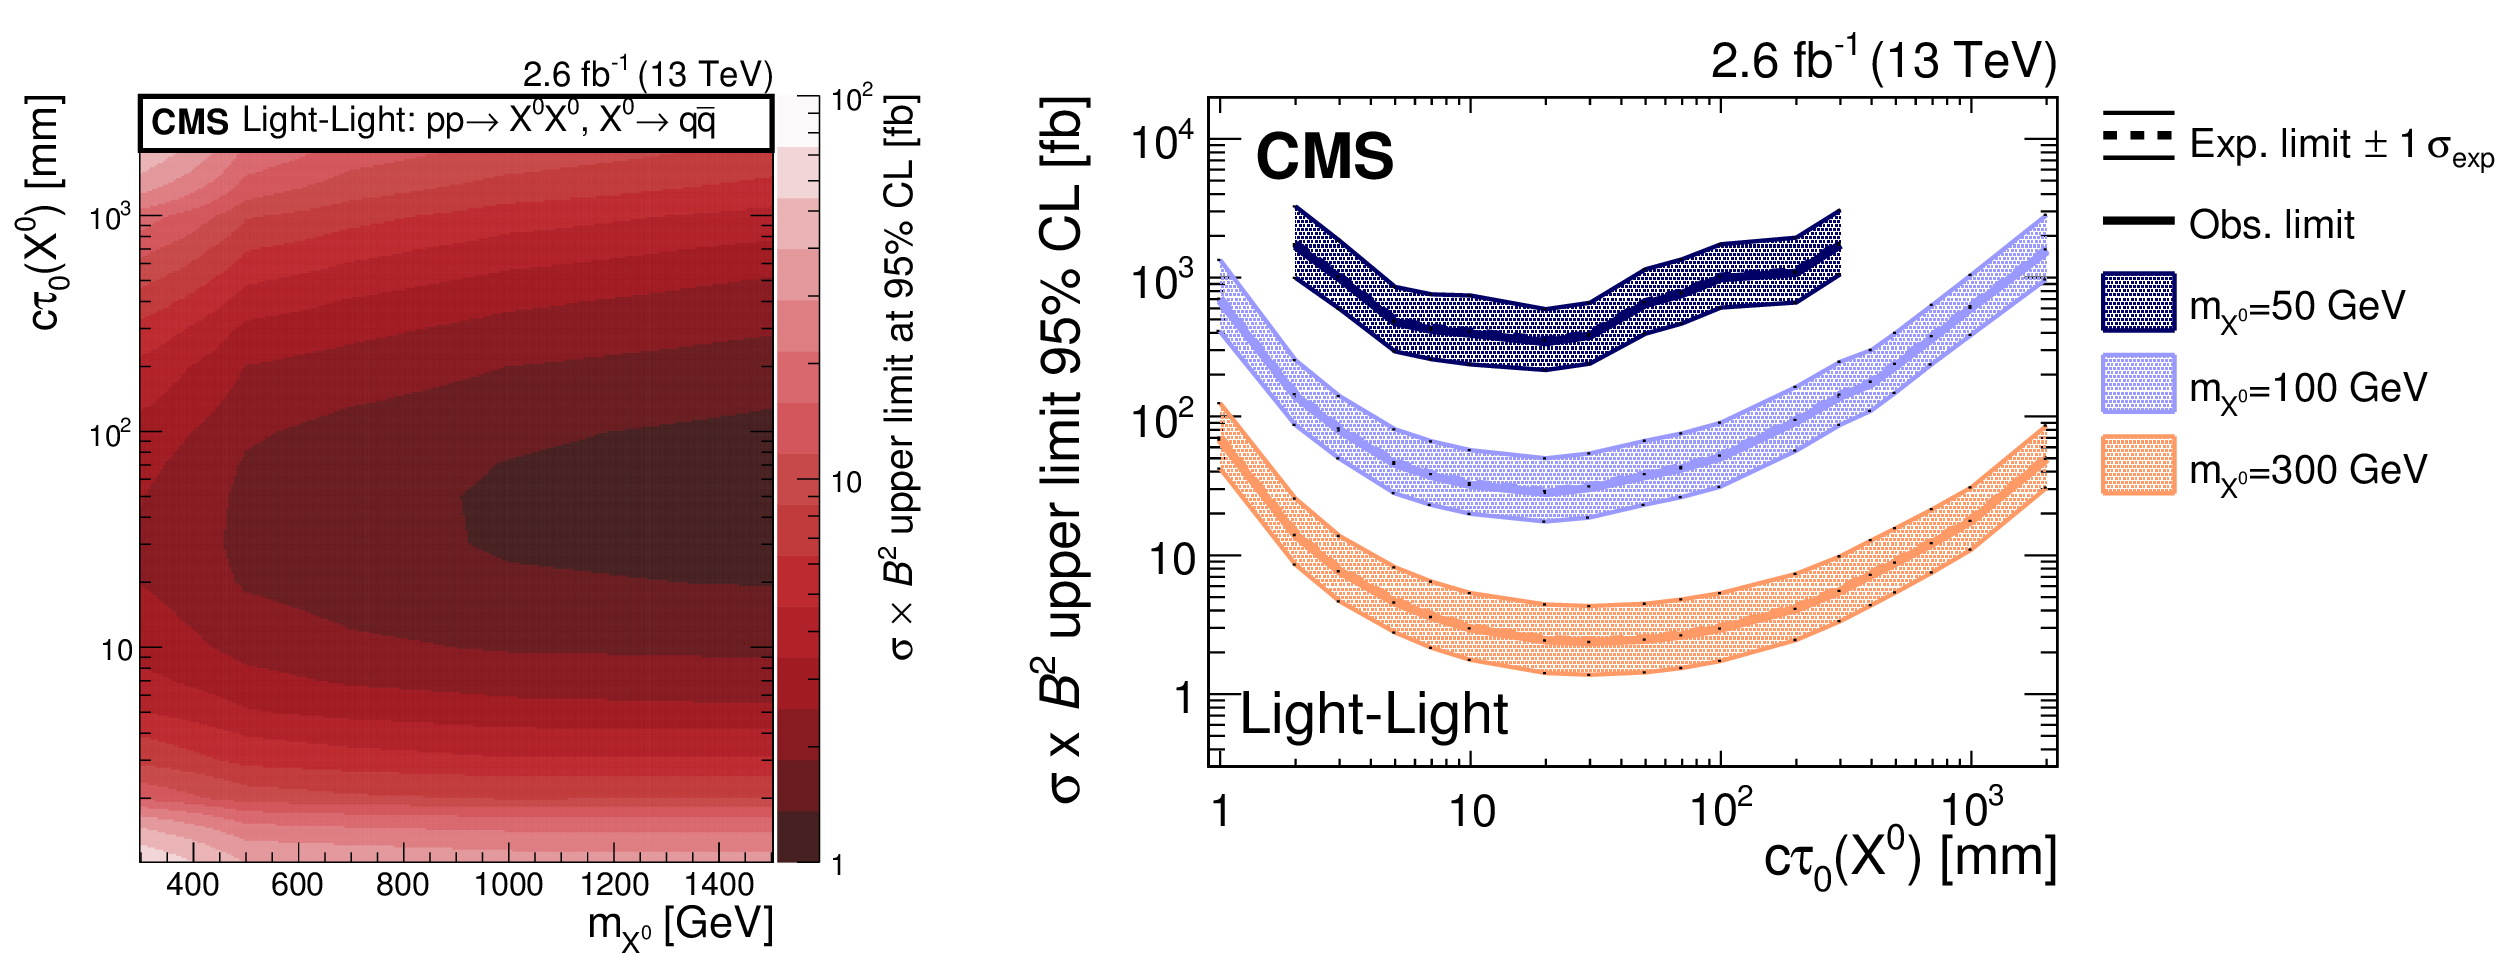
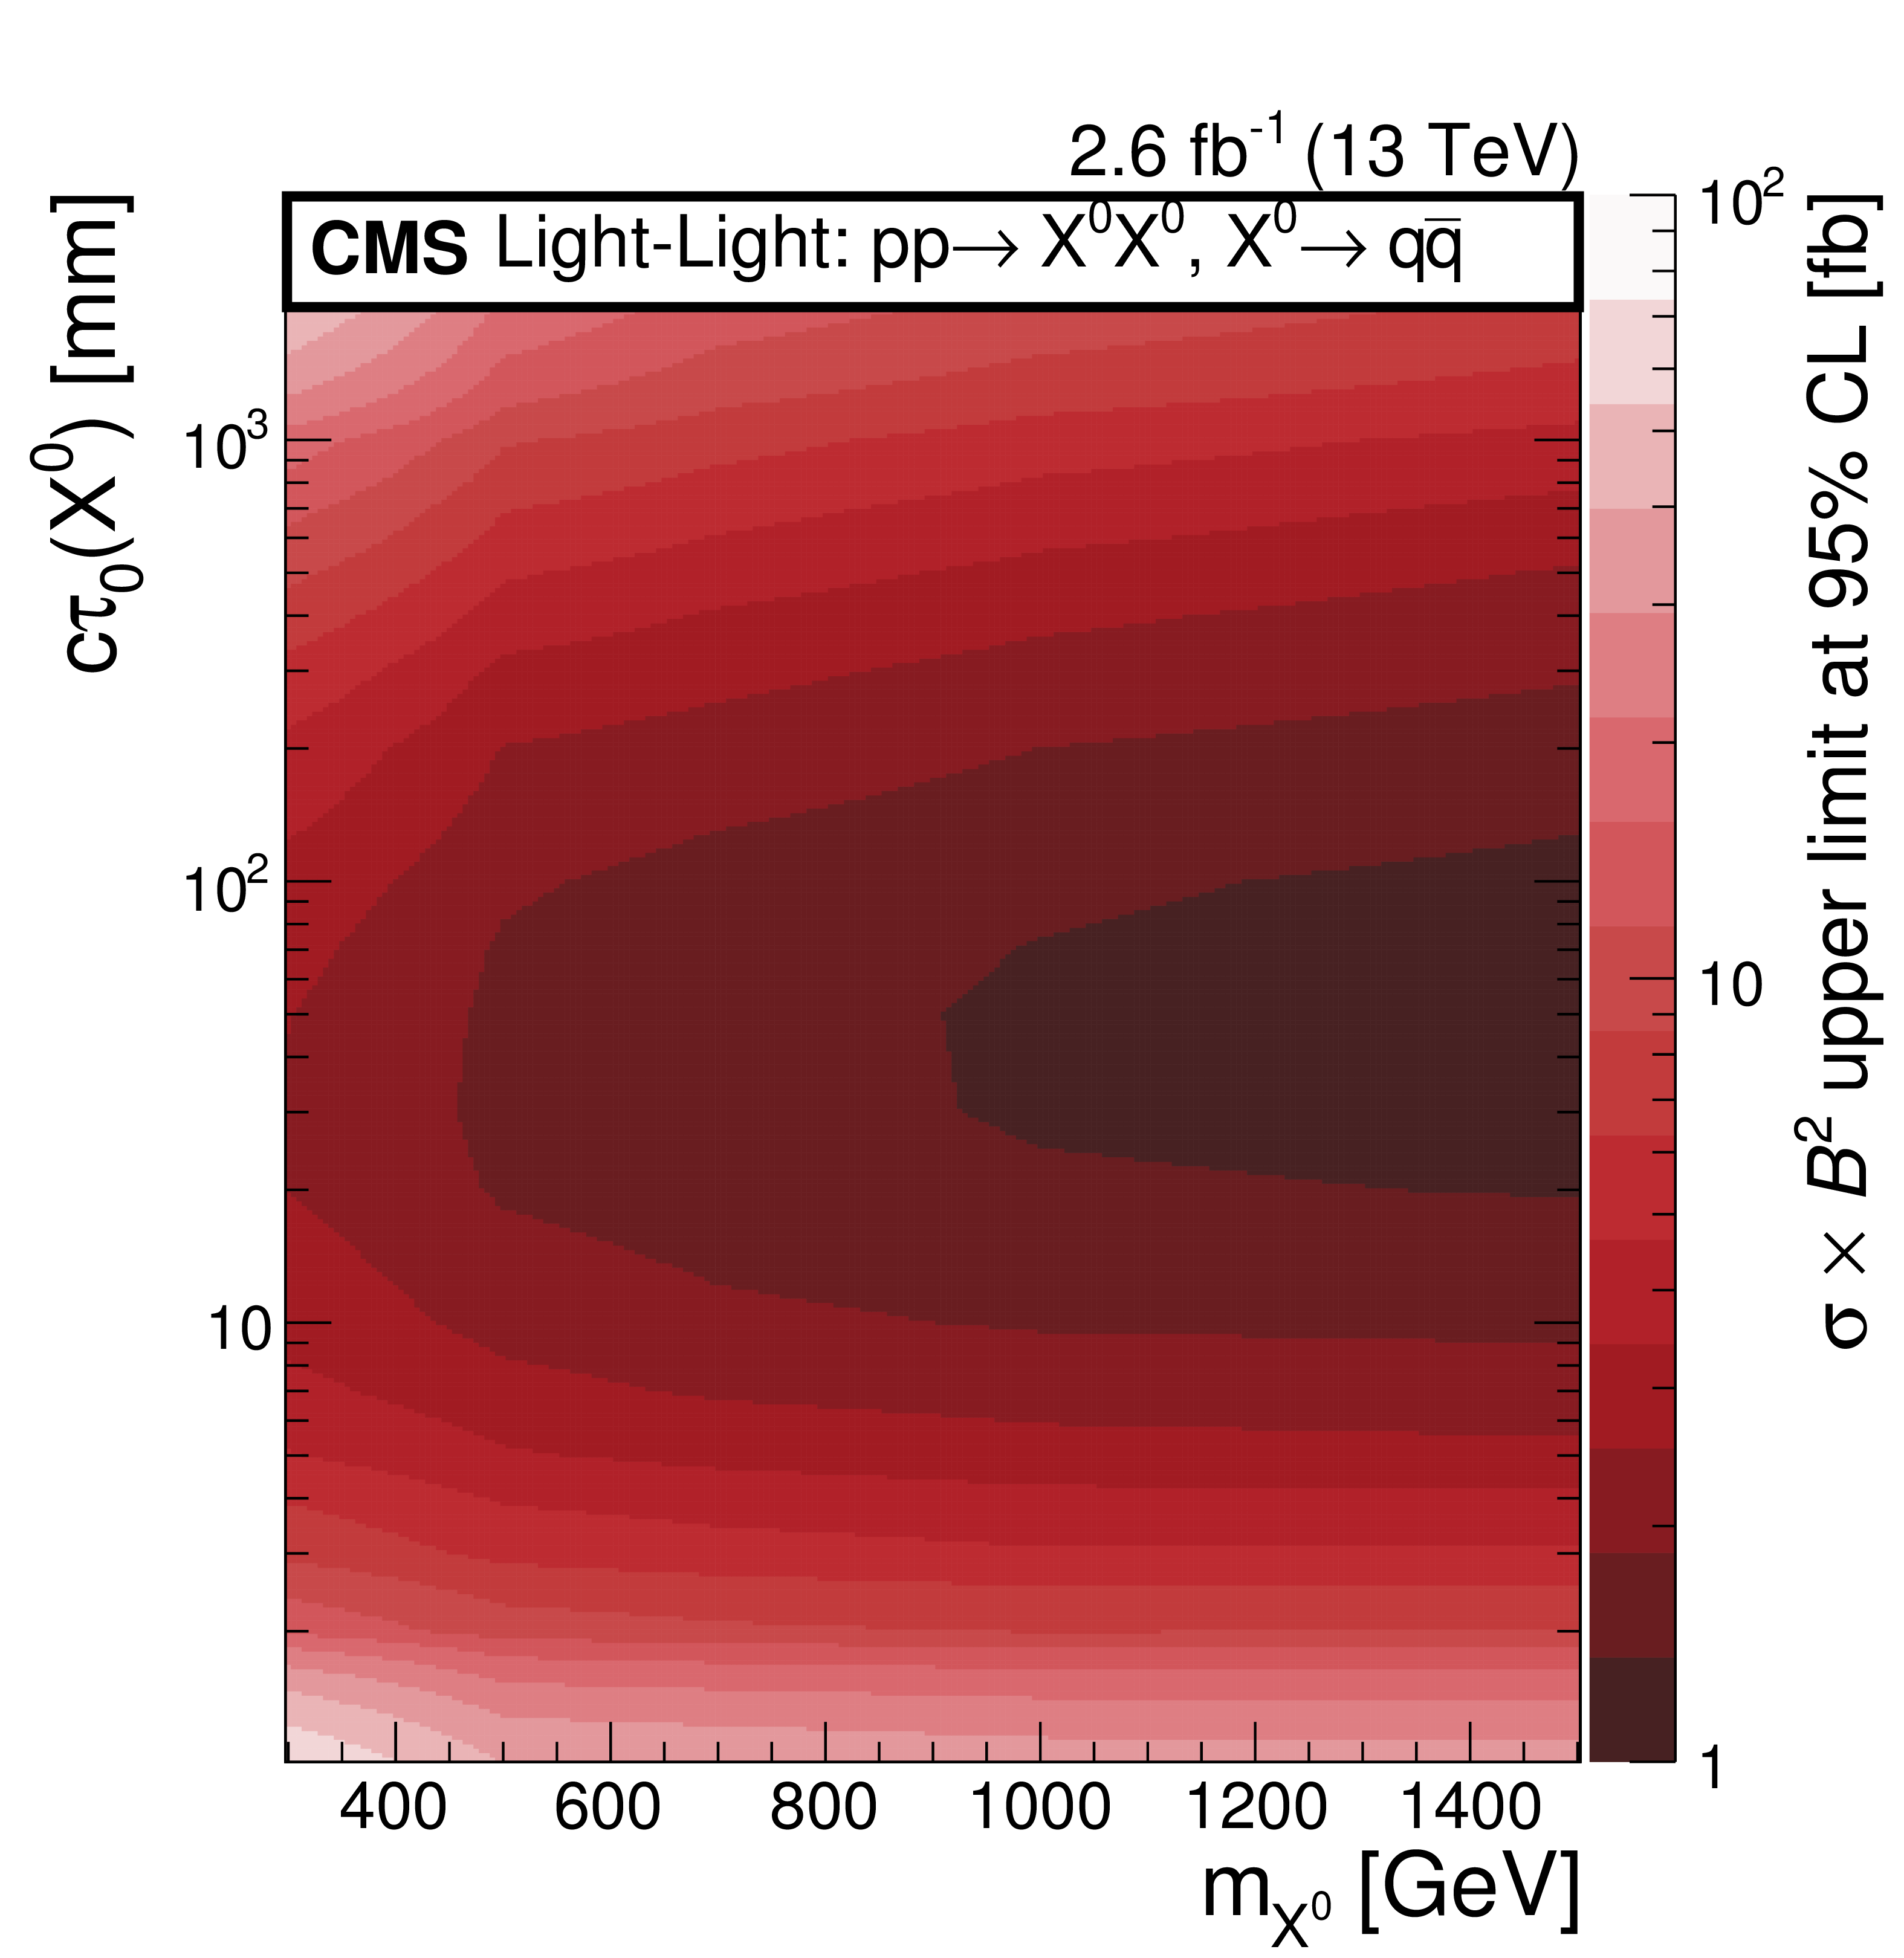
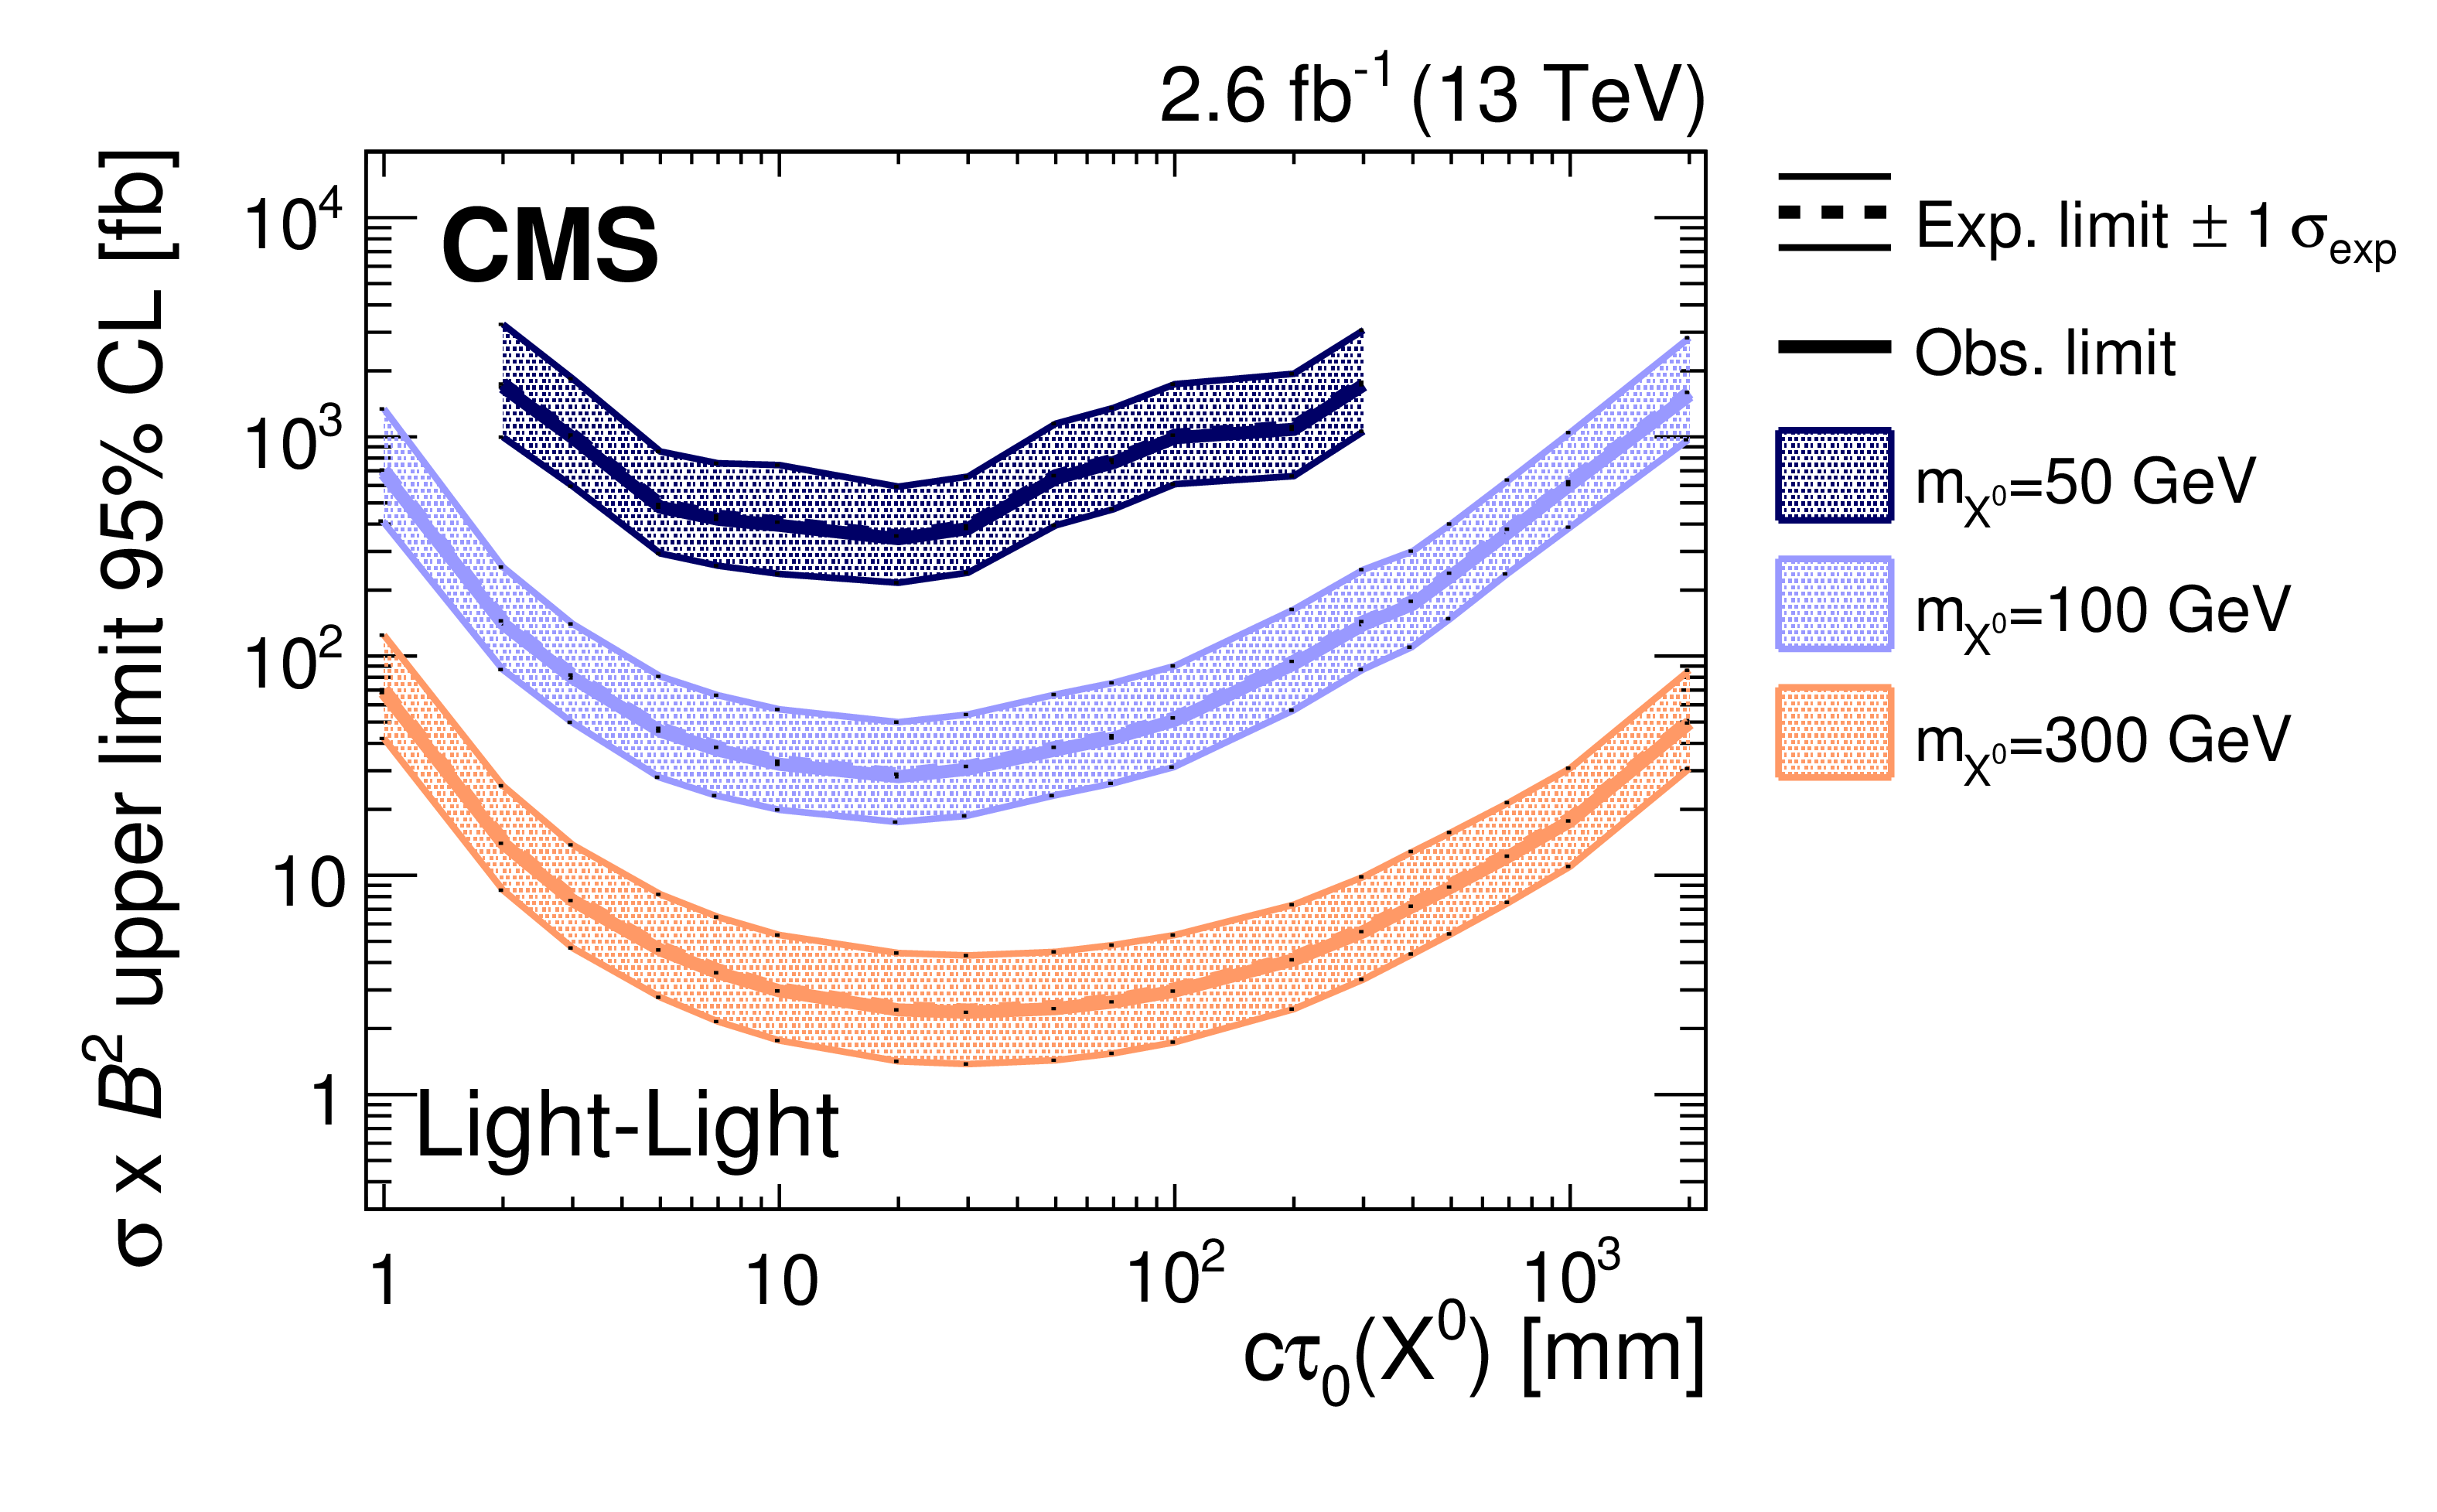
The excluded cross section at 95% CL for the Light-Light model as a function of the mass and proper decay length of the parent particle $X^0$ (upper) and as a function of the proper decay length for three illustrative smaller values of the mass (lower). The shaded bands in the lower plot represent the one standard deviation uncertainties in the expected limits. |
png pdf |
Additional Figure 1-a:
The excluded cross section at 95% CL for the Light-Light model as a function of the mass and proper decay length of the parent particle $X^0$ |
png pdf |
Additional Figure 1-b:
The excluded cross section at 95% CL for the Light-Light model as a function of the proper decay length for three illustrative smaller values of the mass. The shaded bands represent the one standard deviation uncertainties in the expected limits. |
png pdf |
Additional Figure 2:
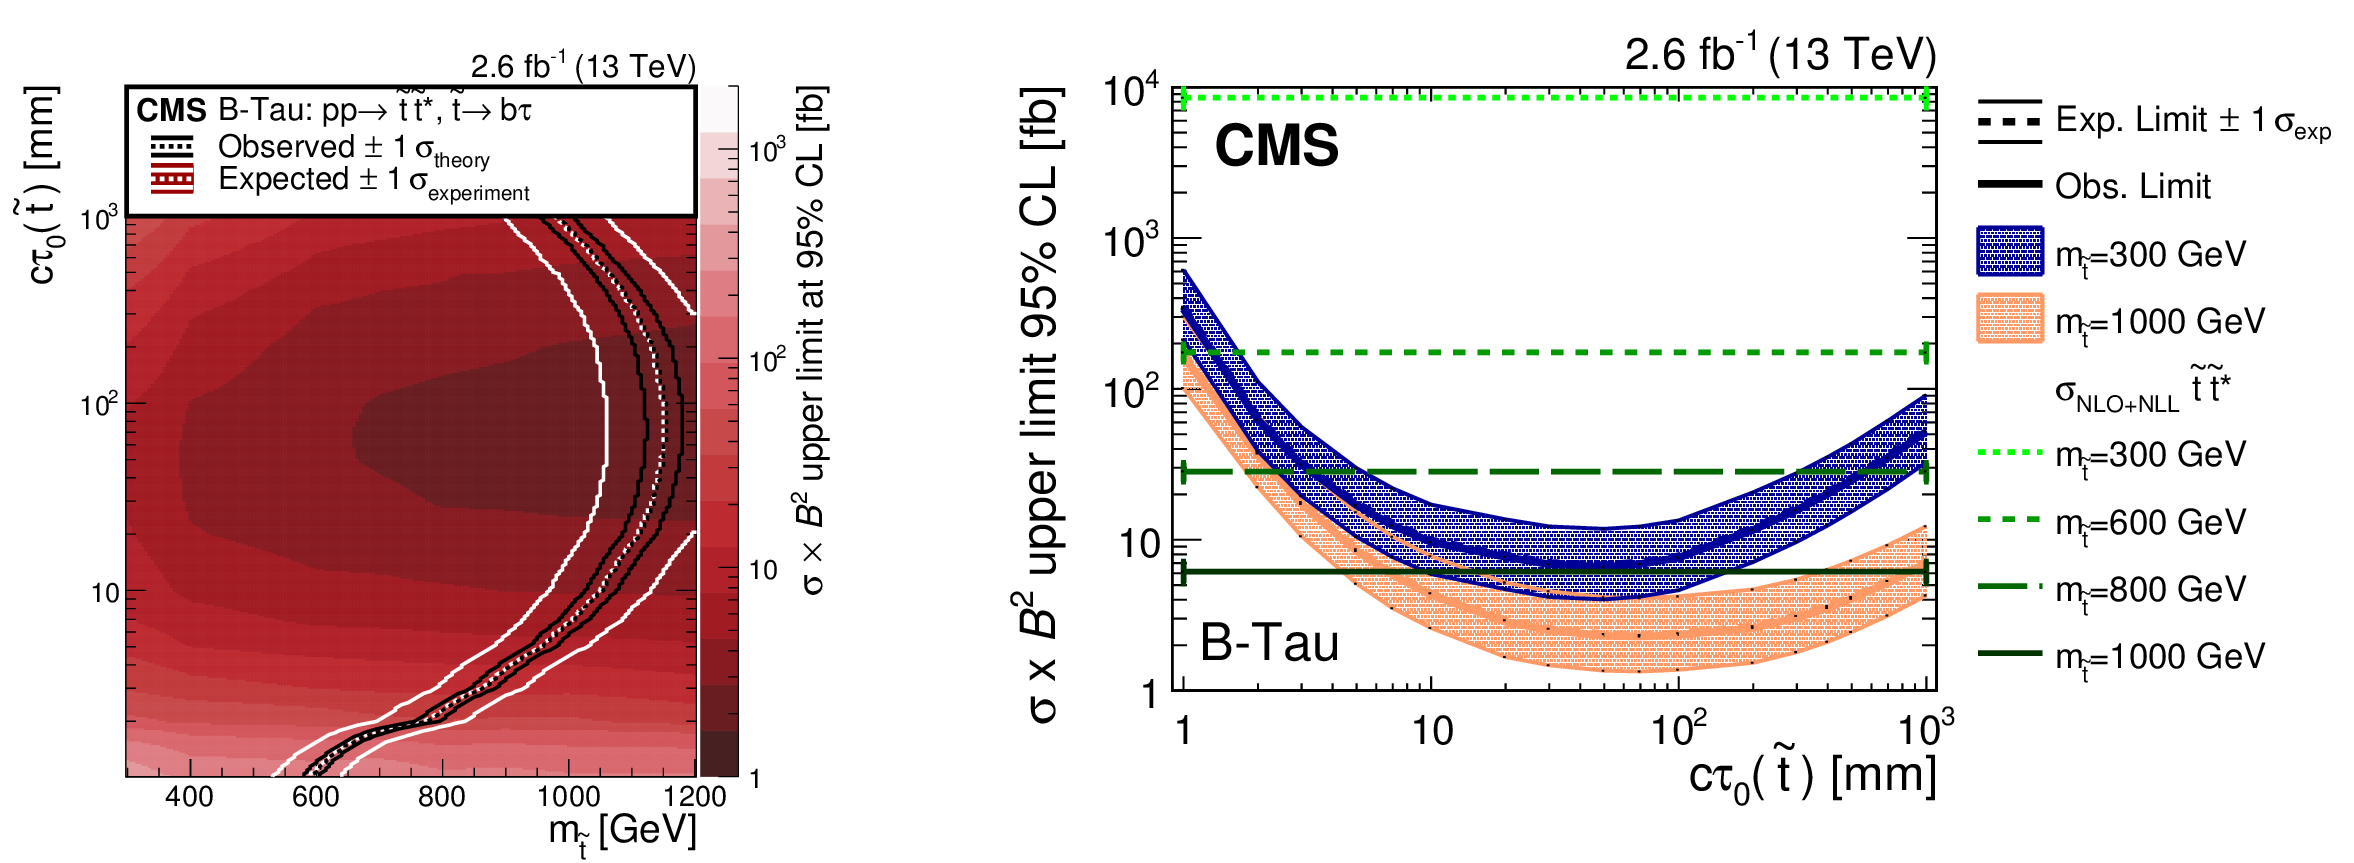
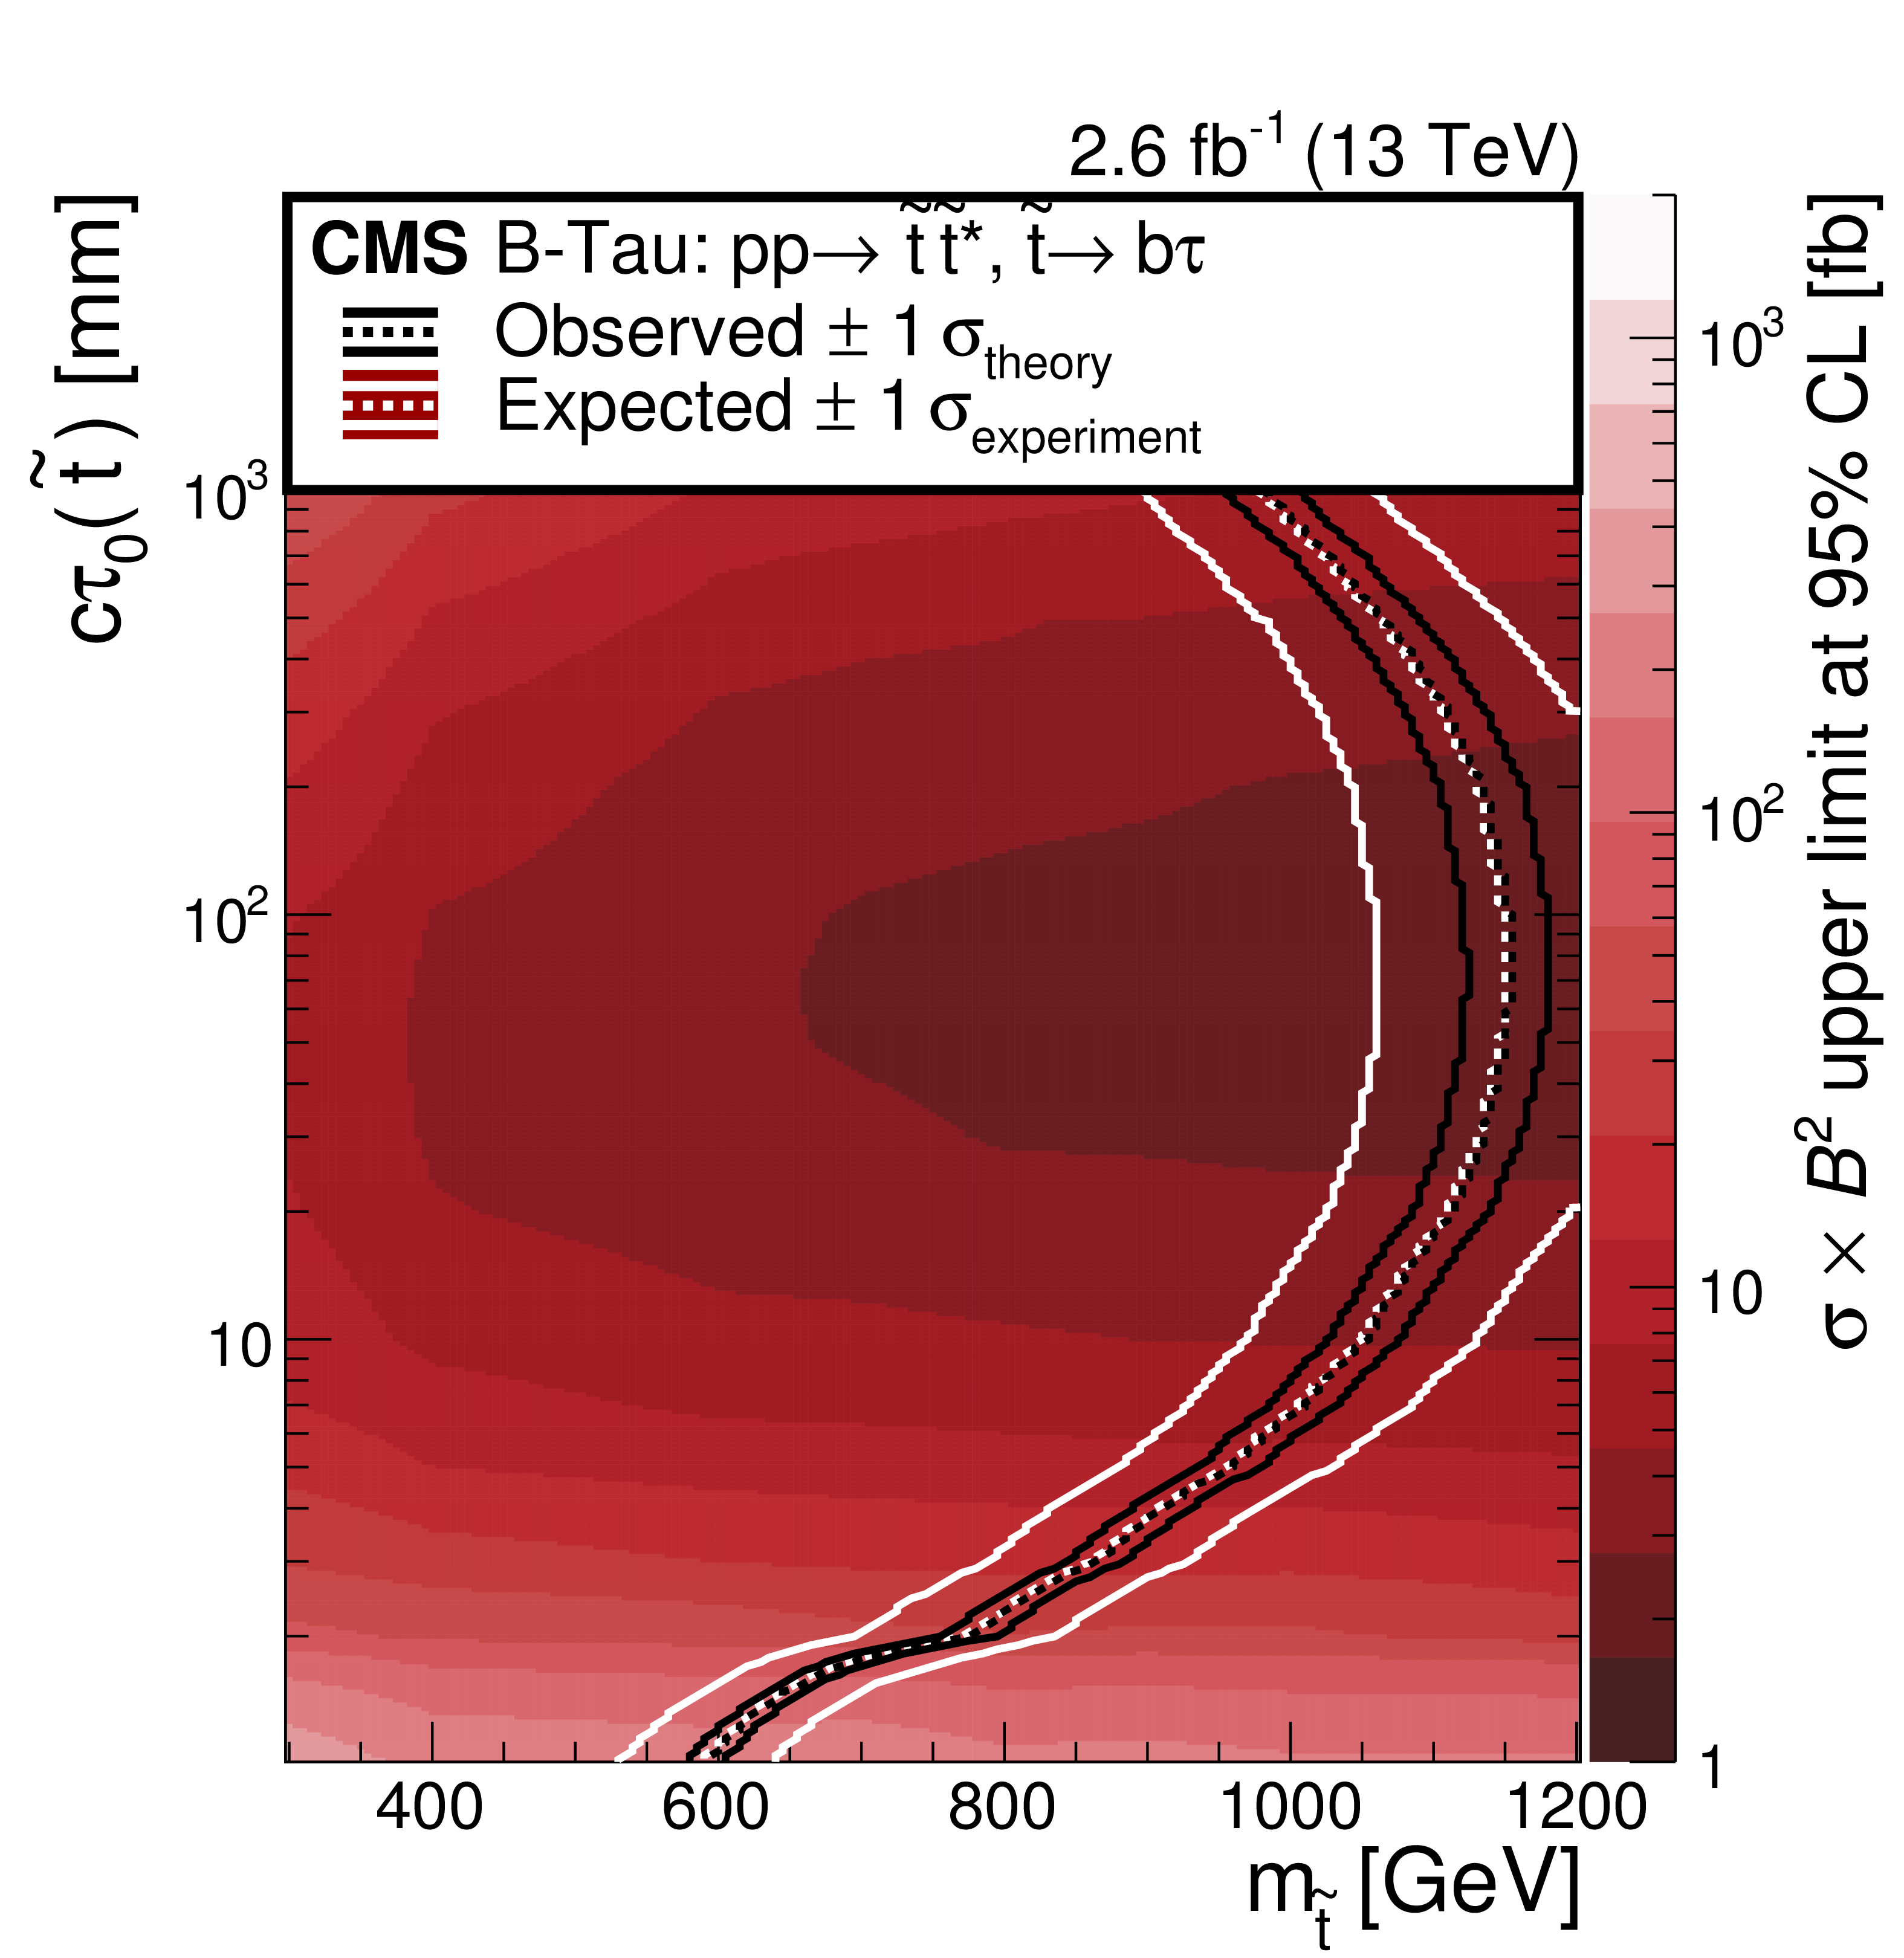
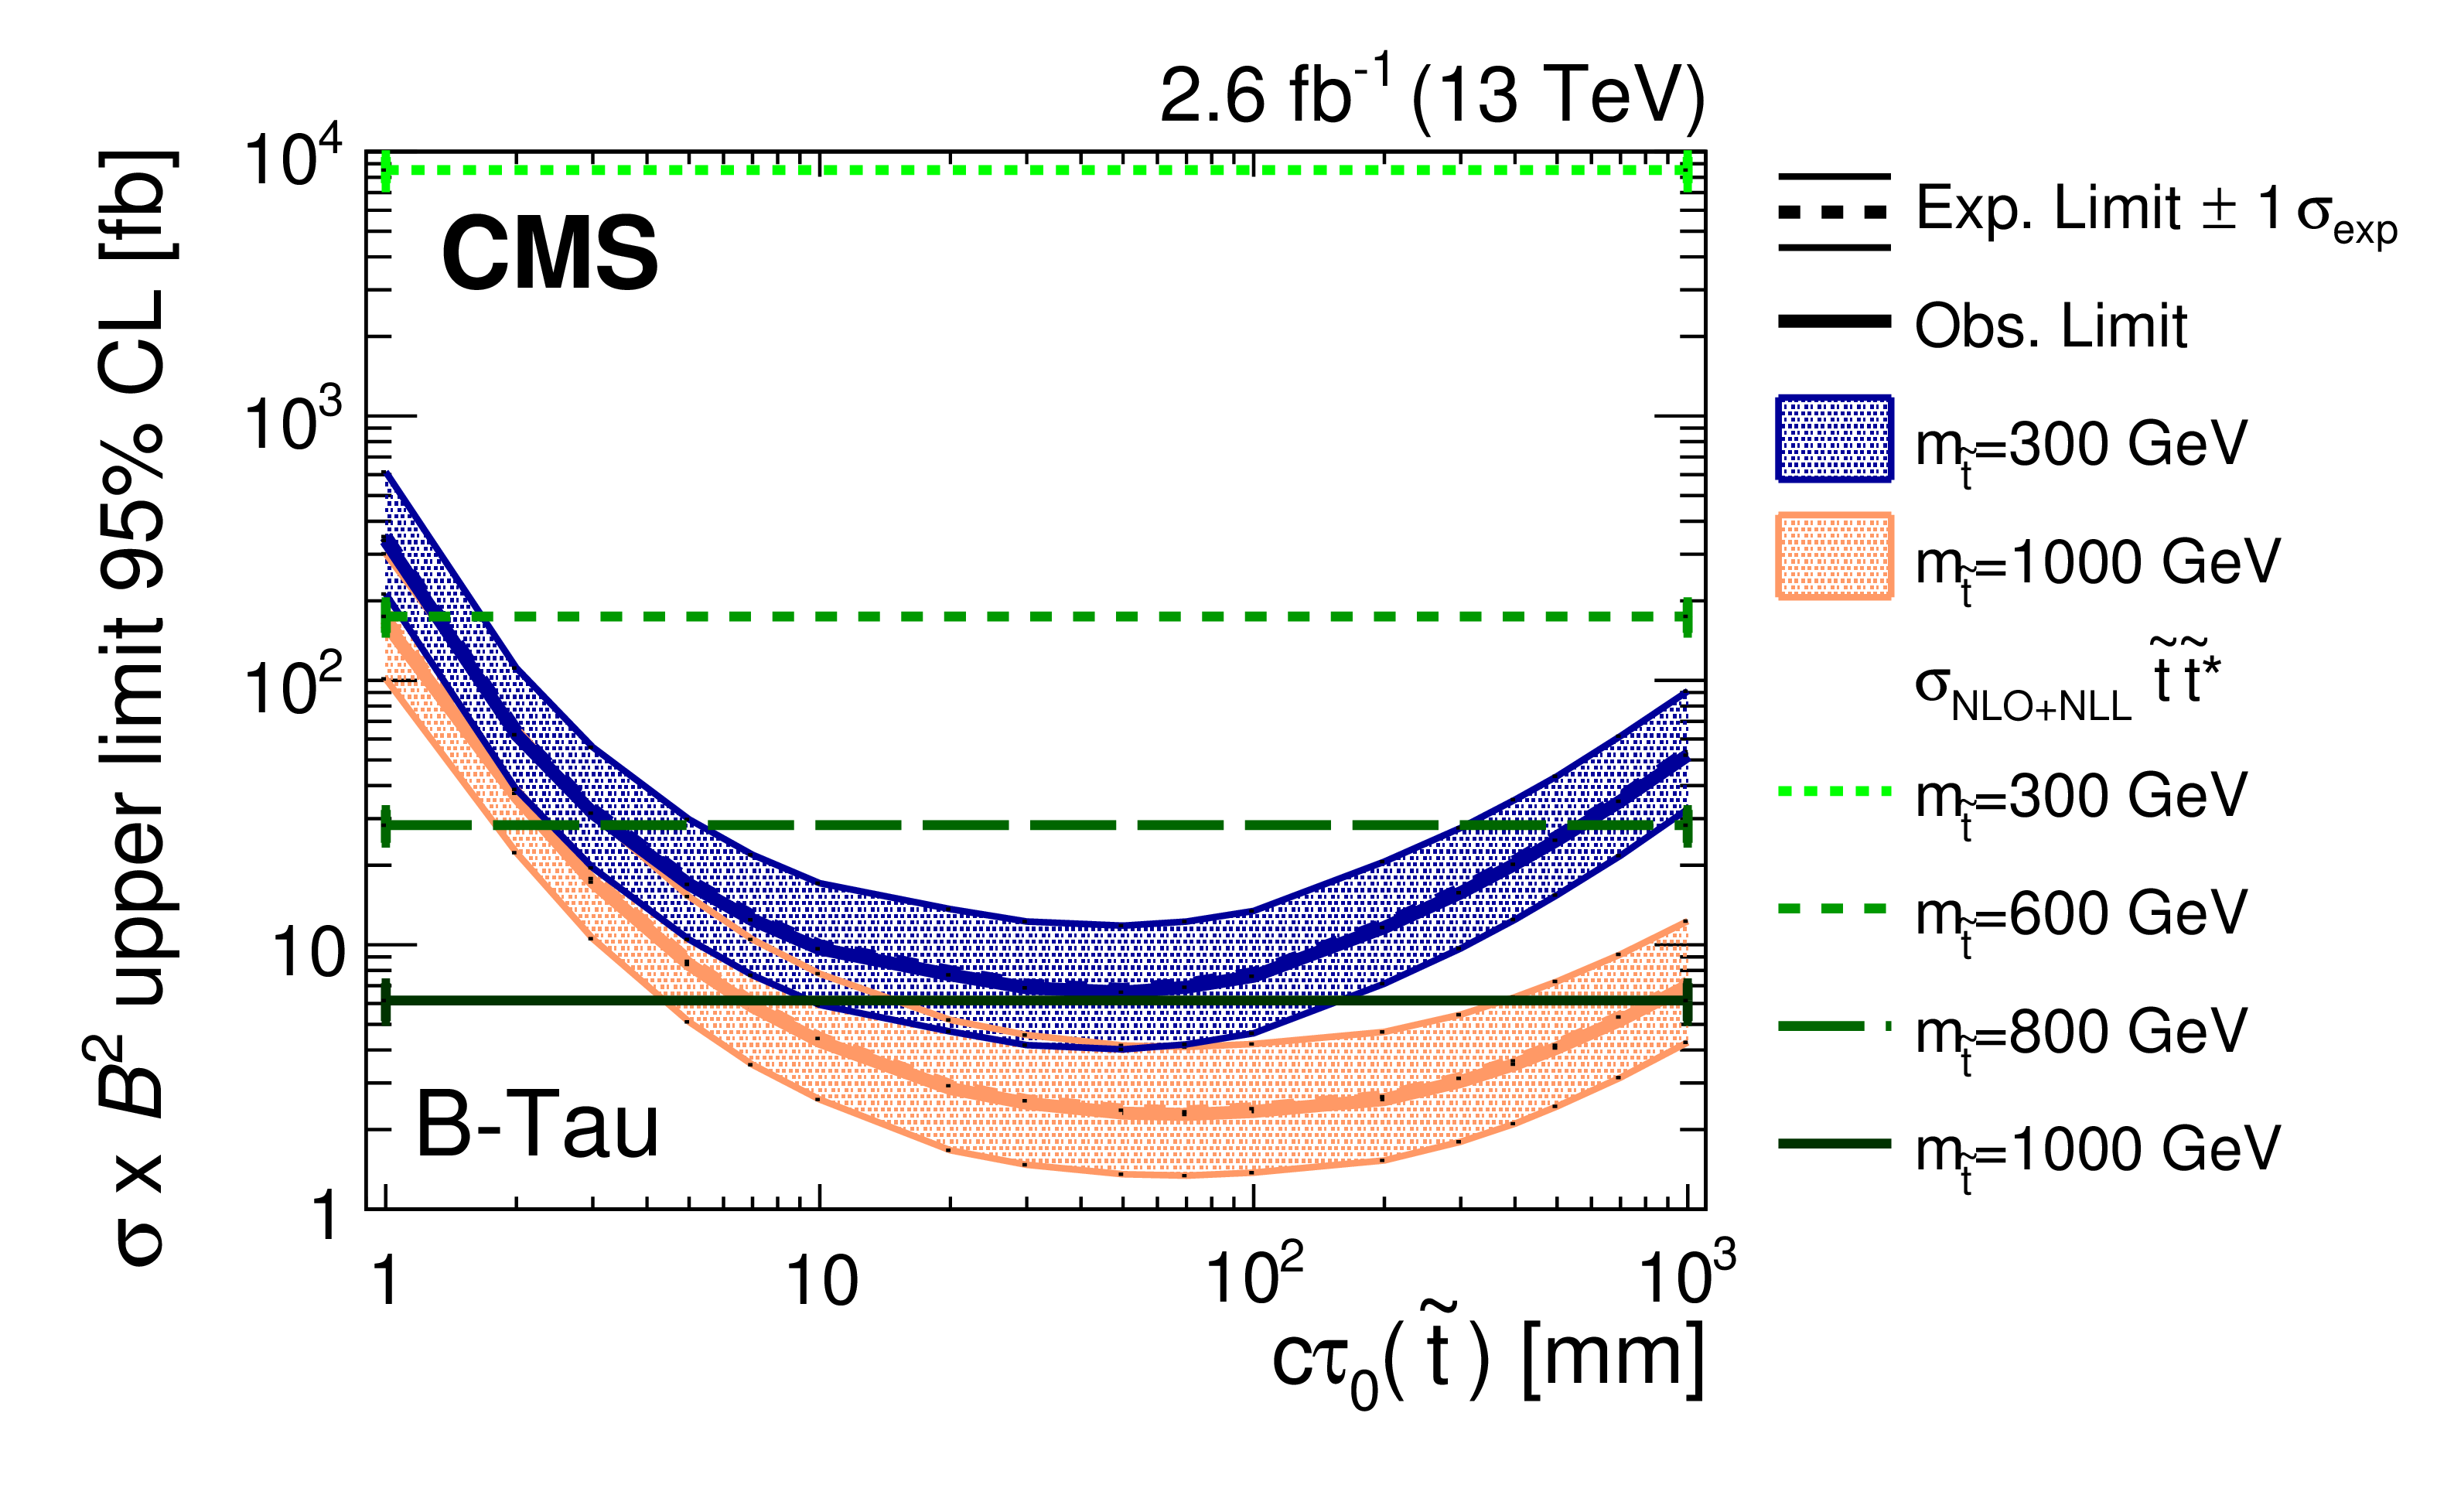
The excluded cross section at 95% CL for the B-Tau model as a function of the mass and proper decay length of the parent particle $\tilde{\mathrm{t}} $ (upper) and as a function of the proper decay length for two values of the mass (lower). The upper plot also shows the expected (observed) exclusion region with one standard deviation experimental (theoretical) uncertainties, utilizing a NLO+NLL calculation of the top squark production cross section. The lower plot also shows the expected upper limits with one standard deviation uncertainties as bands. The NLO+NLL calculation of the top squark production cross section is drawn horizontally in green for four mass values. |
png pdf |
Additional Figure 2-a:
The excluded cross section at 95% CL for the B-Tau model as a function of the mass and proper decay length of the parent particle $\tilde{\mathrm{t}} $. The plot also shows the expected (observed) exclusion region with one standard deviation experimental (theoretical) uncertainties, utilizing a NLO+NLL calculation of the top squark production cross section. |
png pdf |
Additional Figure 2-b:
The excluded cross section at 95% CL for the B-Tau model as a function of the proper decay length for two values of the mass. The plot also shows the expected upper limits with one standard deviation uncertainties as bands. The NLO+NLL calculation of the top squark production cross section is drawn horizontally in green for four mass values. |

png pdf |
Additional Figure 3:
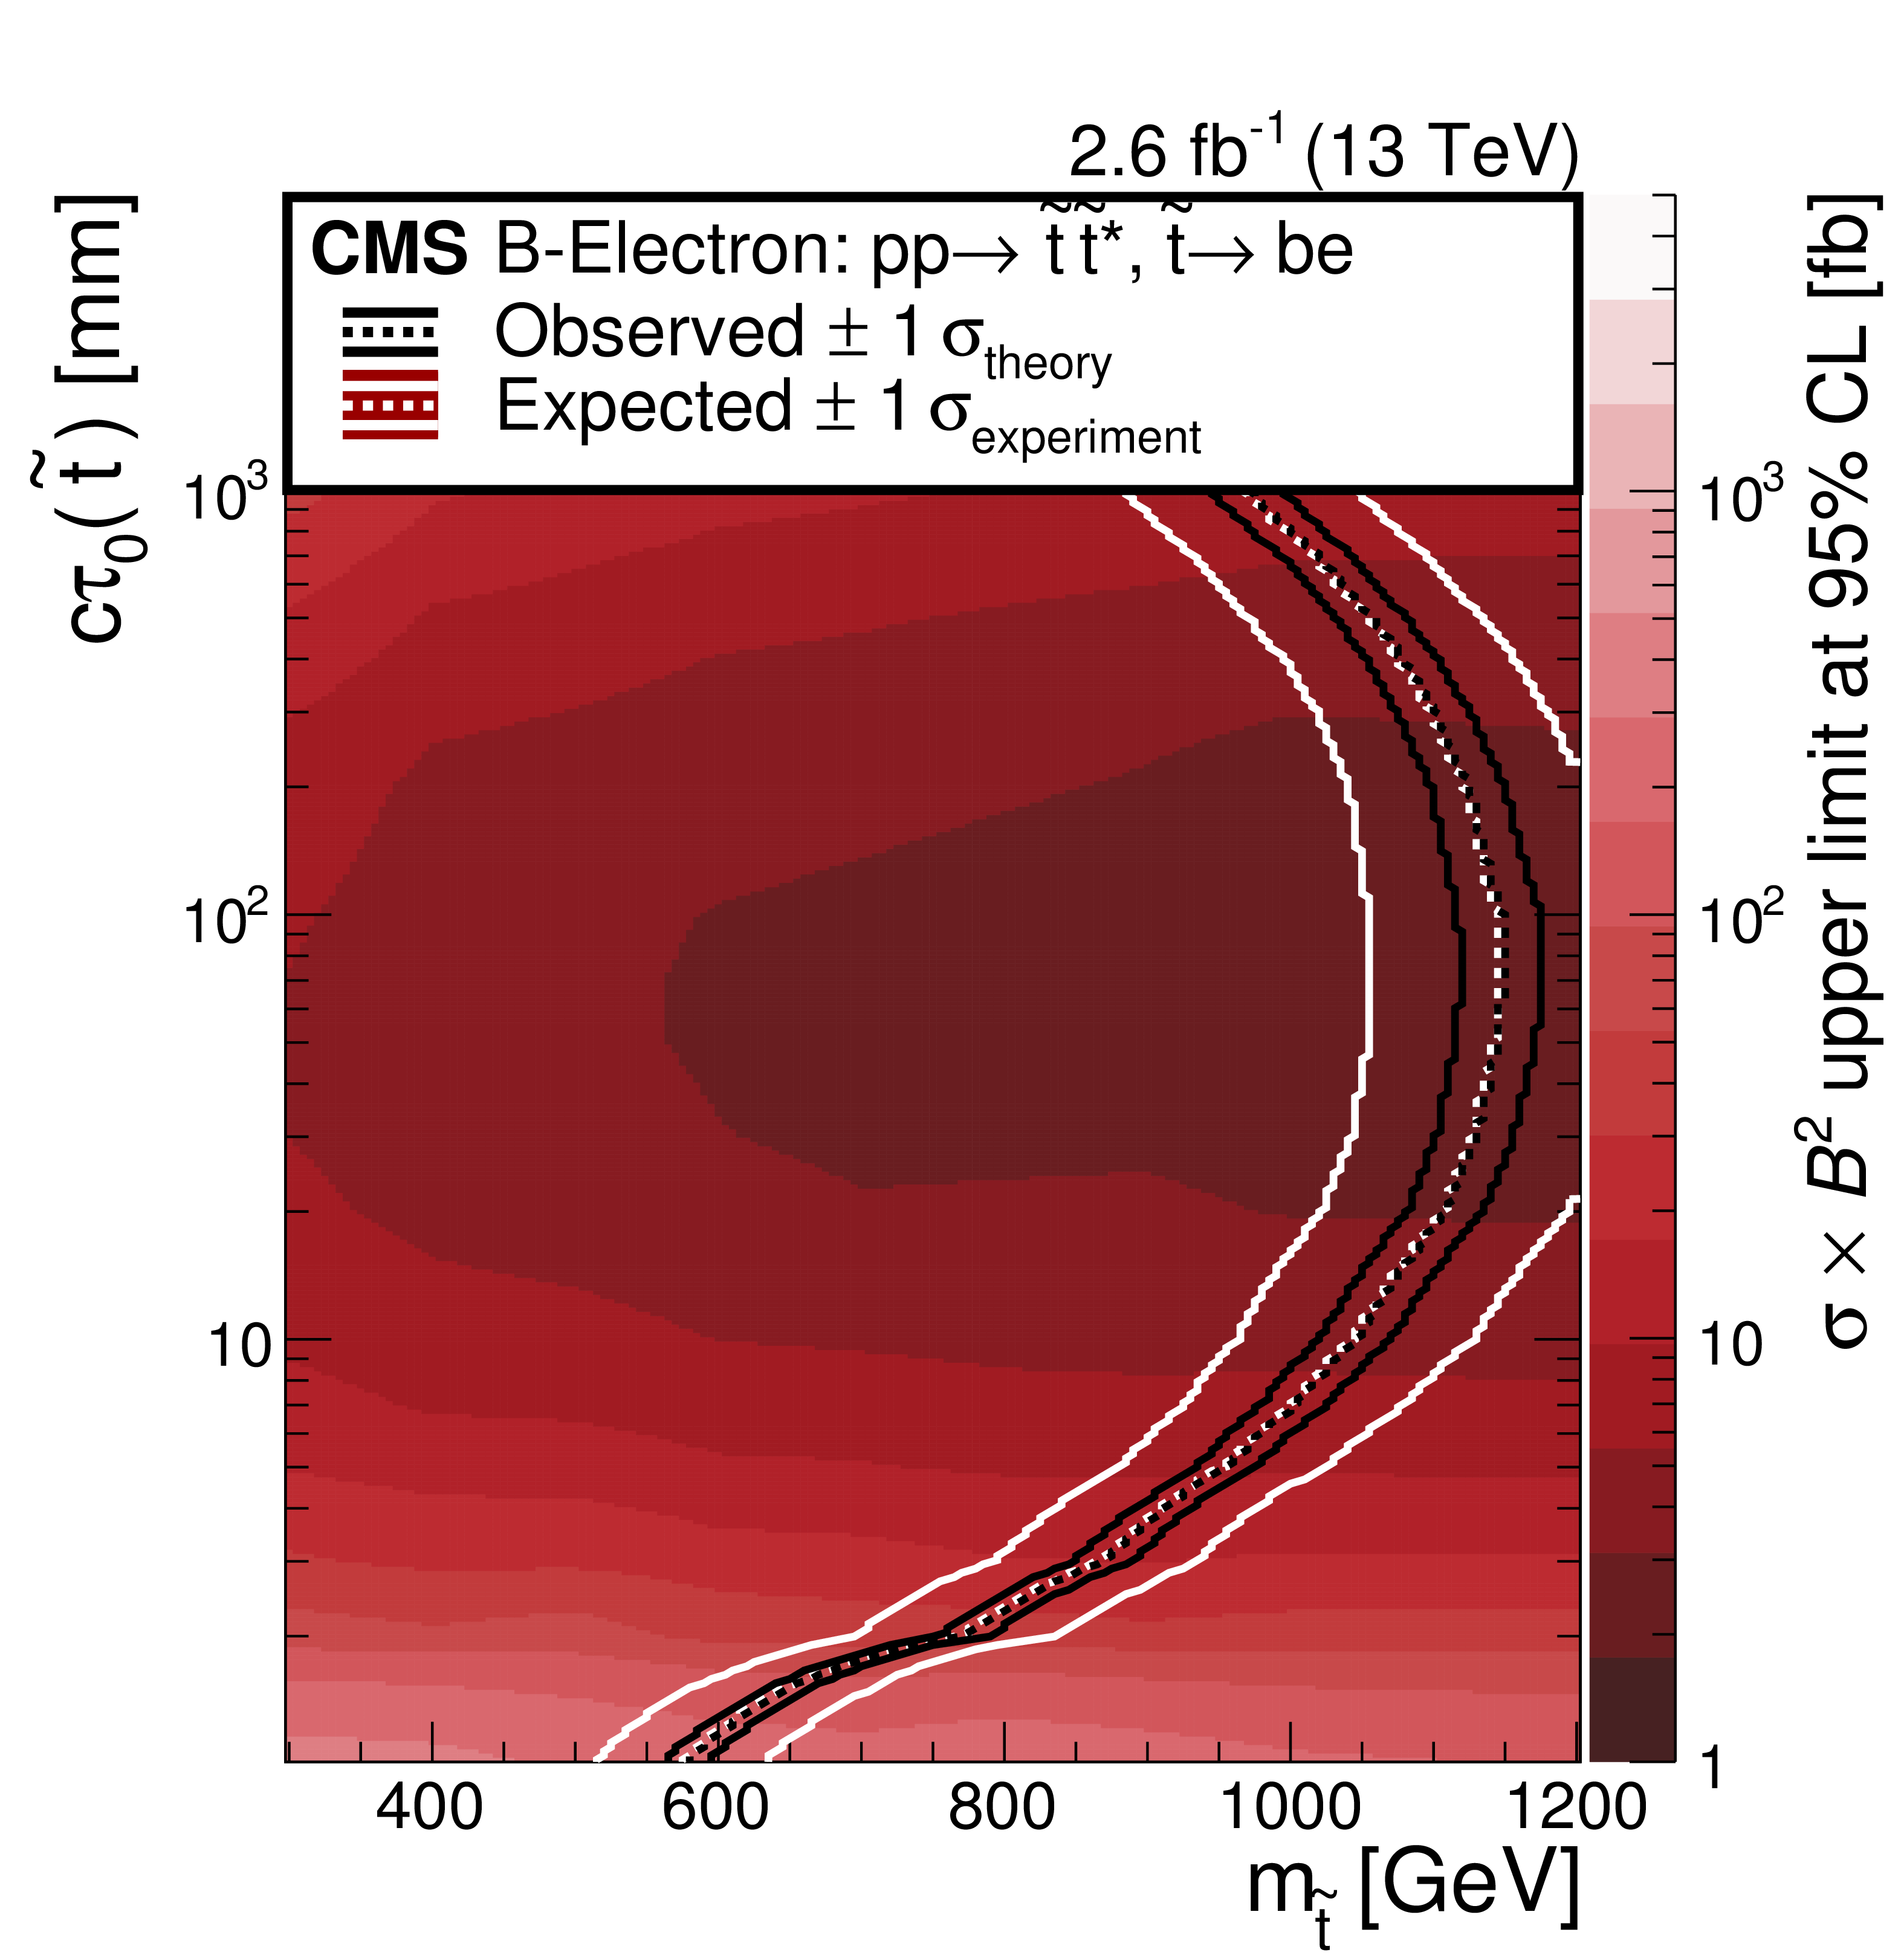
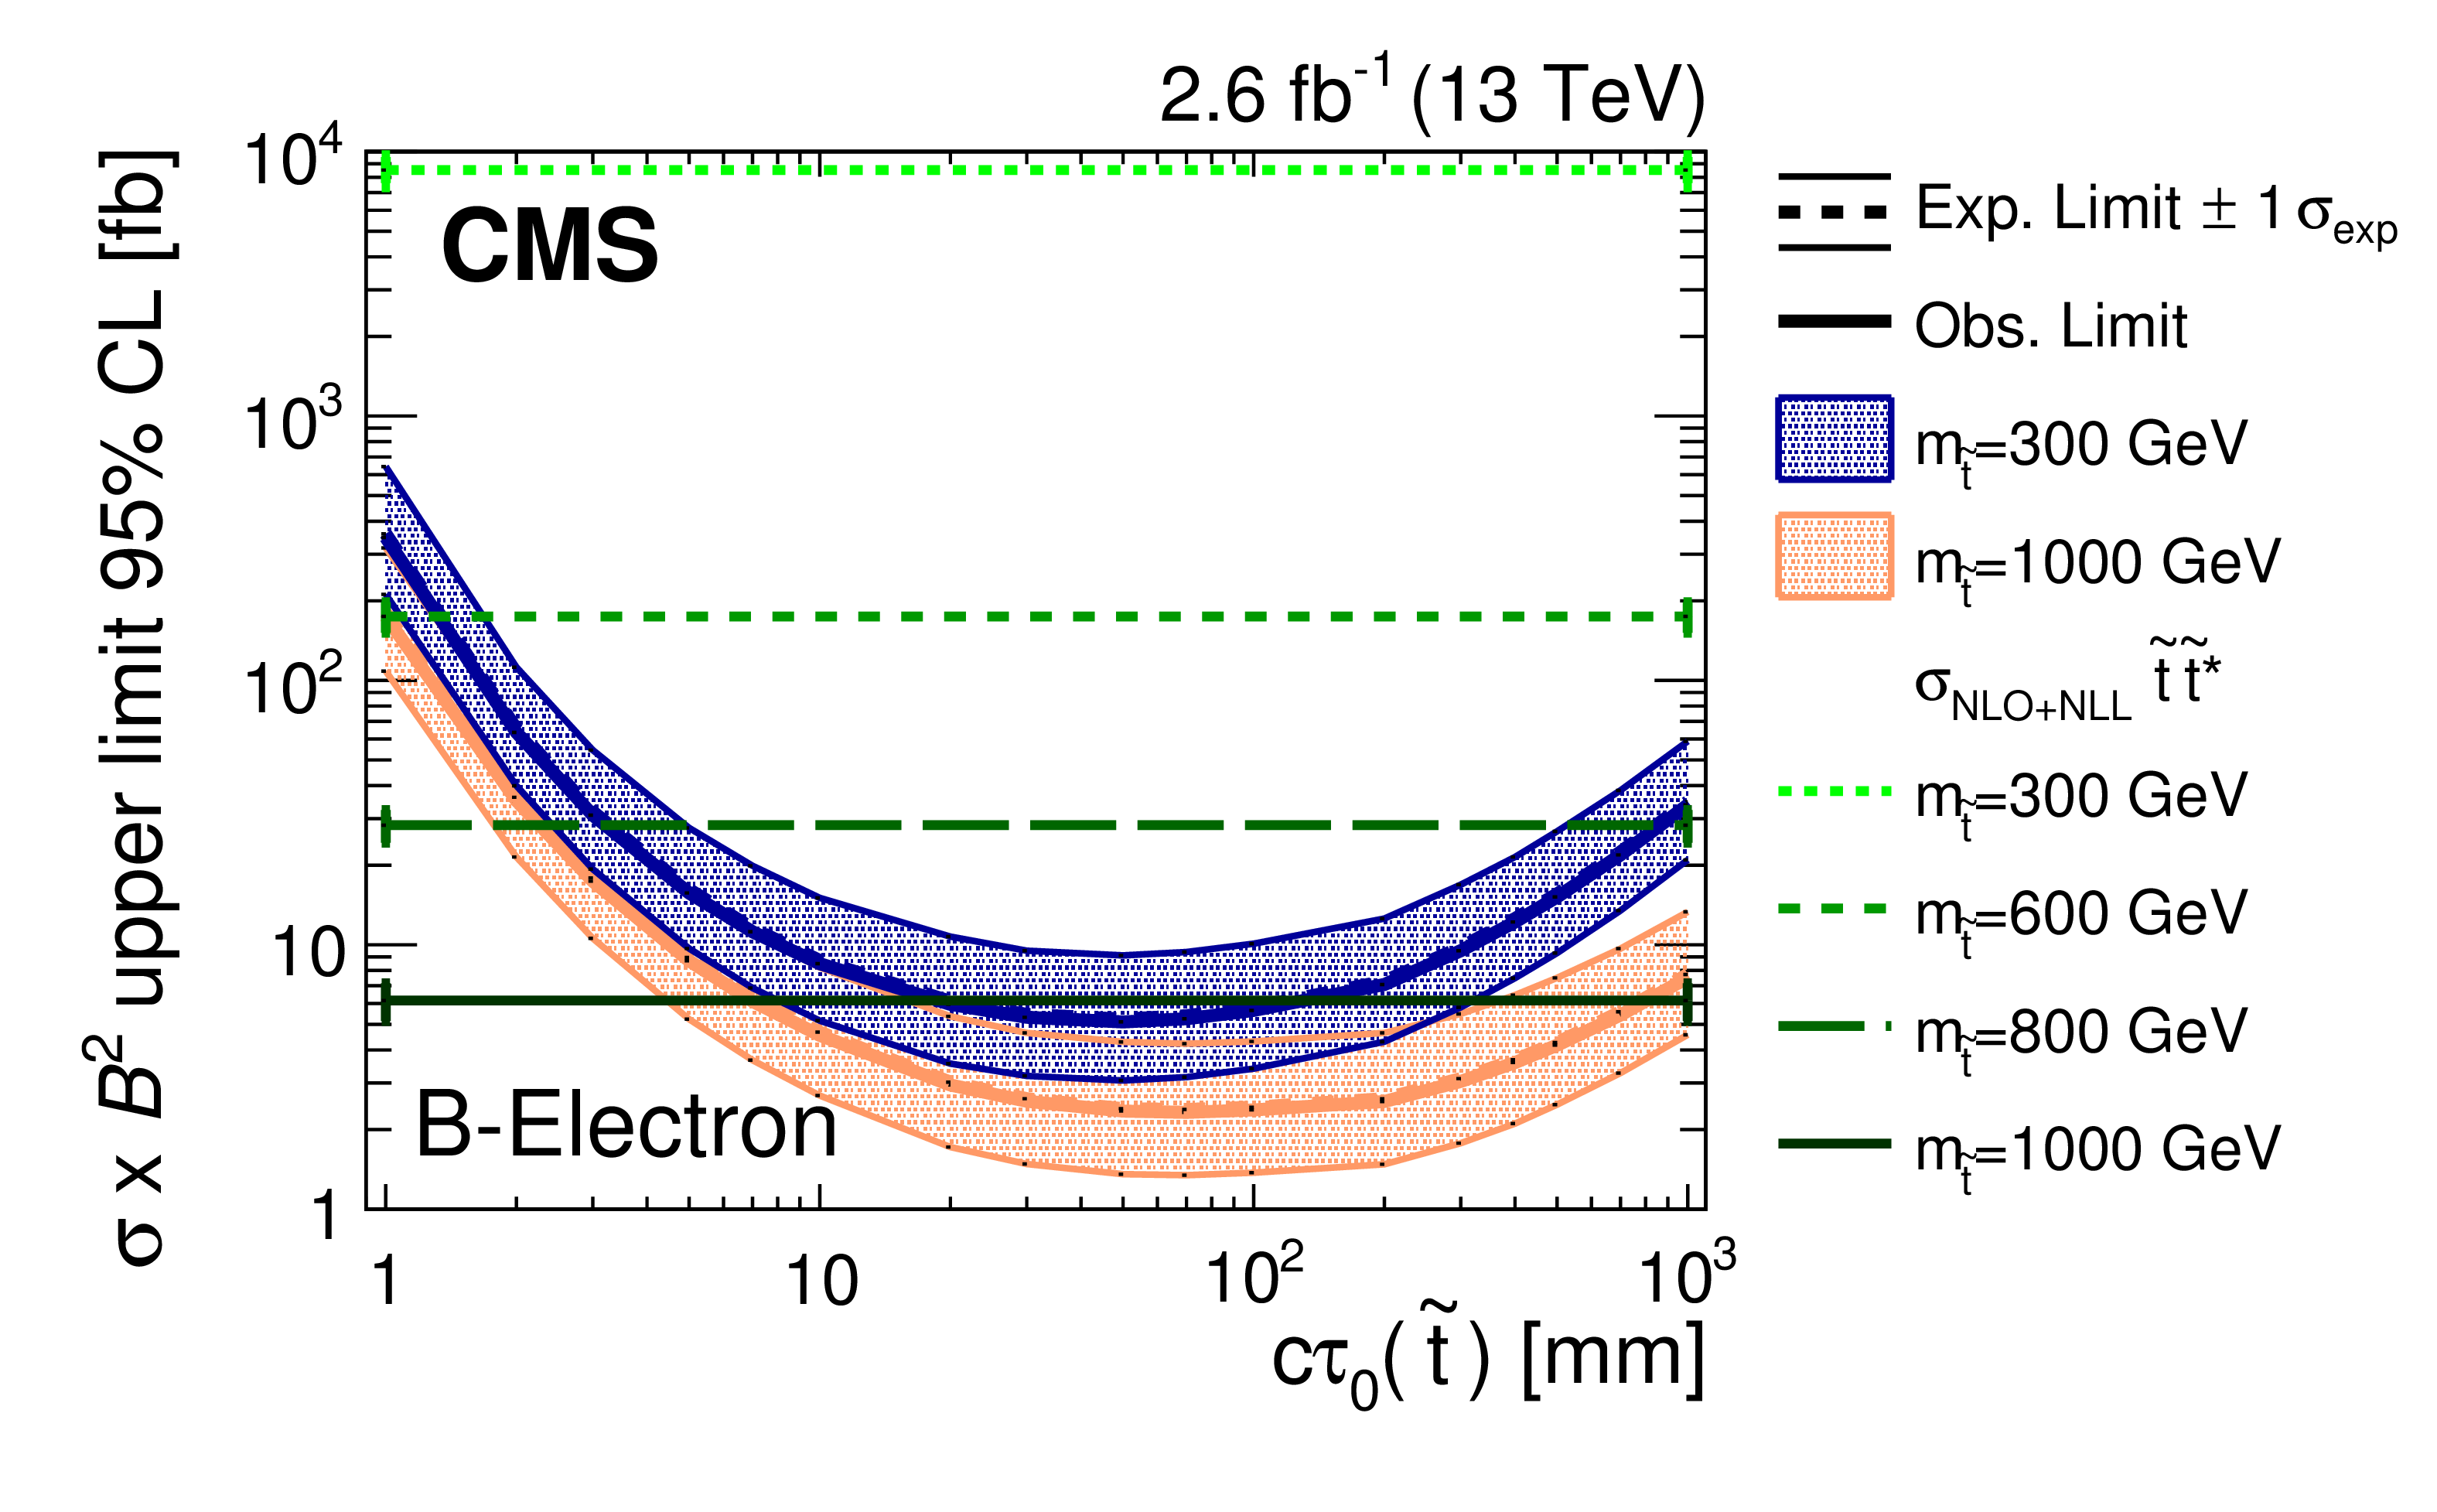
The excluded cross section at 95% CL for the B-Electron model as a function of the mass and proper decay length of the parent particle $\tilde{\mathrm{t}} $ (upper) and as a function of the proper decay length for two values of the mass (lower). The upper plot also shows the expected (observed) exclusion region with one standard deviation experimental (theoretical) uncertainties, utilizing a NLO+NLL calculation of the top squark production cross section. The lower plot also shows the expected upper limits with one standard deviation uncertainties as bands. The NLO+NLL calculation of the top squark production cross section is drawn horizontally in green for four mass values. |
png pdf |
Additional Figure 3-a:
The excluded cross section at 95% CL for the B-Electron model as a function of the mass and proper decay length of the parent particle $\tilde{\mathrm{t}} $. The plot also shows the expected (observed) exclusion region with one standard deviation experimental (theoretical) uncertainties, utilizing a NLO+NLL calculation of the top squark production cross section. |
png pdf |
Additional Figure 3-b:
The excluded cross section at 95% CL for the B-Electron model as a function of the proper decay length for two values of the mass. The plot also shows the expected upper limits with one standard deviation uncertainties as bands. The NLO+NLL calculation of the top squark production cross section is drawn horizontally in green for four mass values. |

png pdf |
Additional Figure 4:
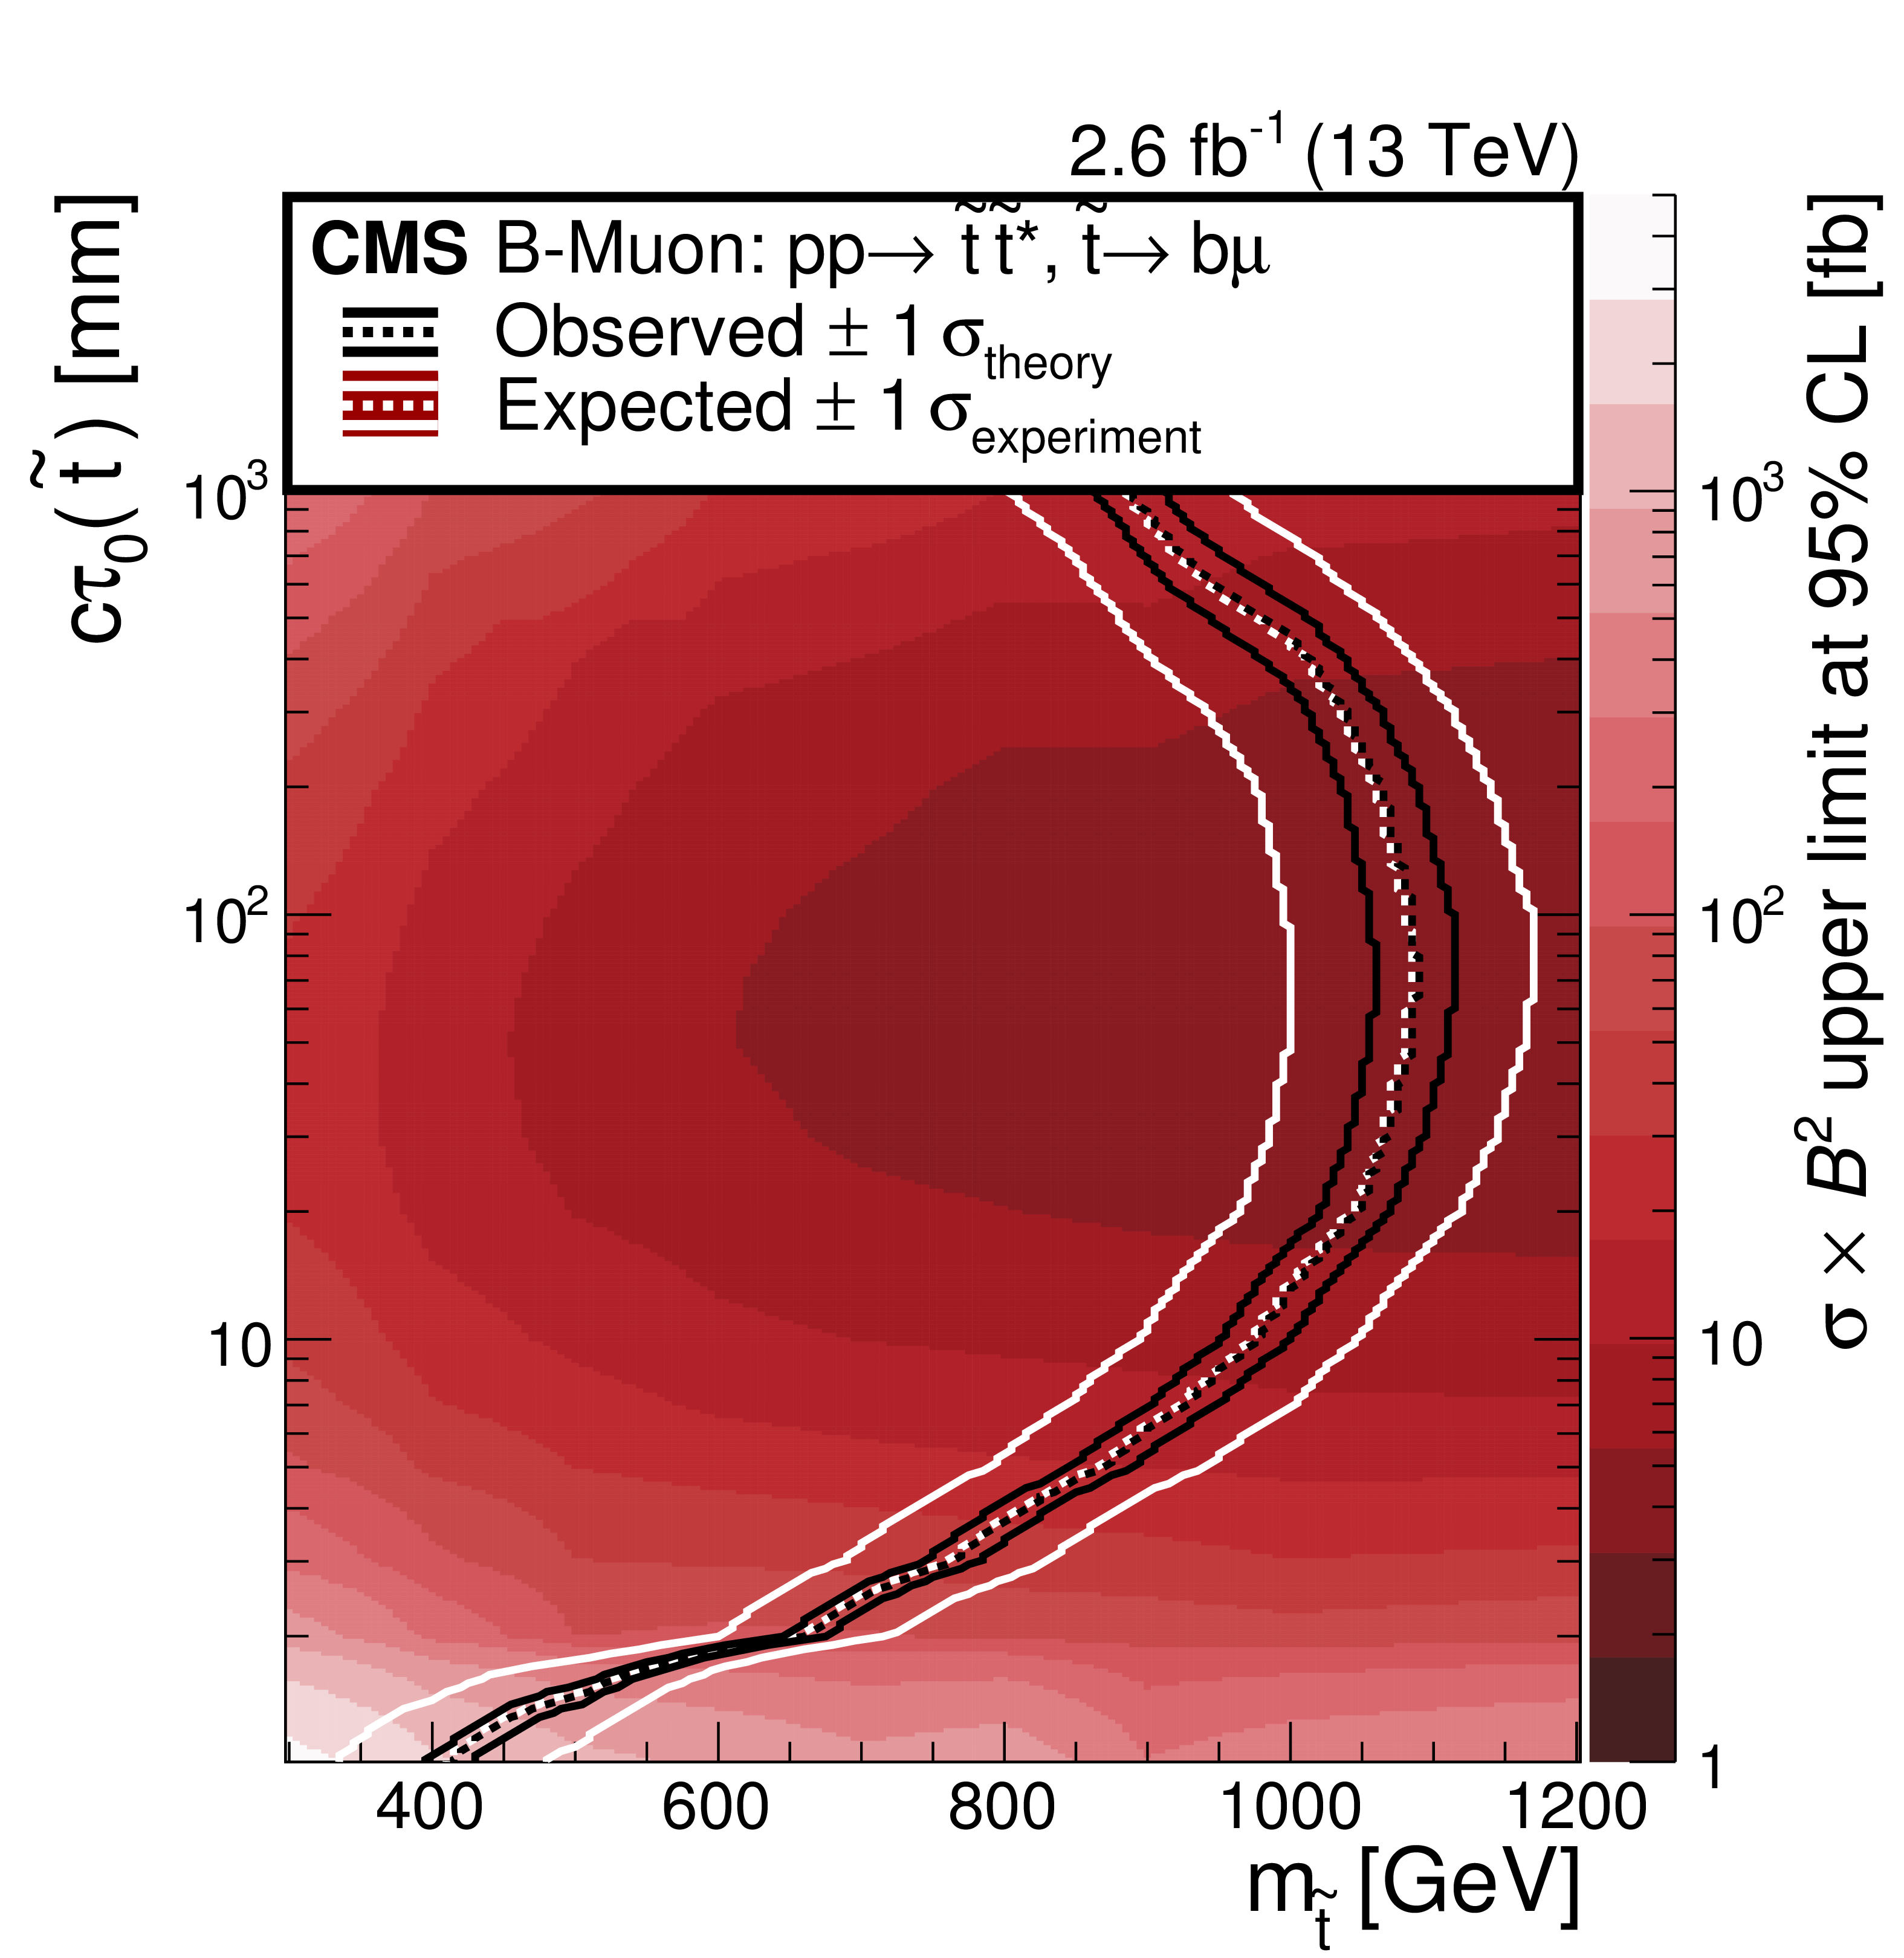
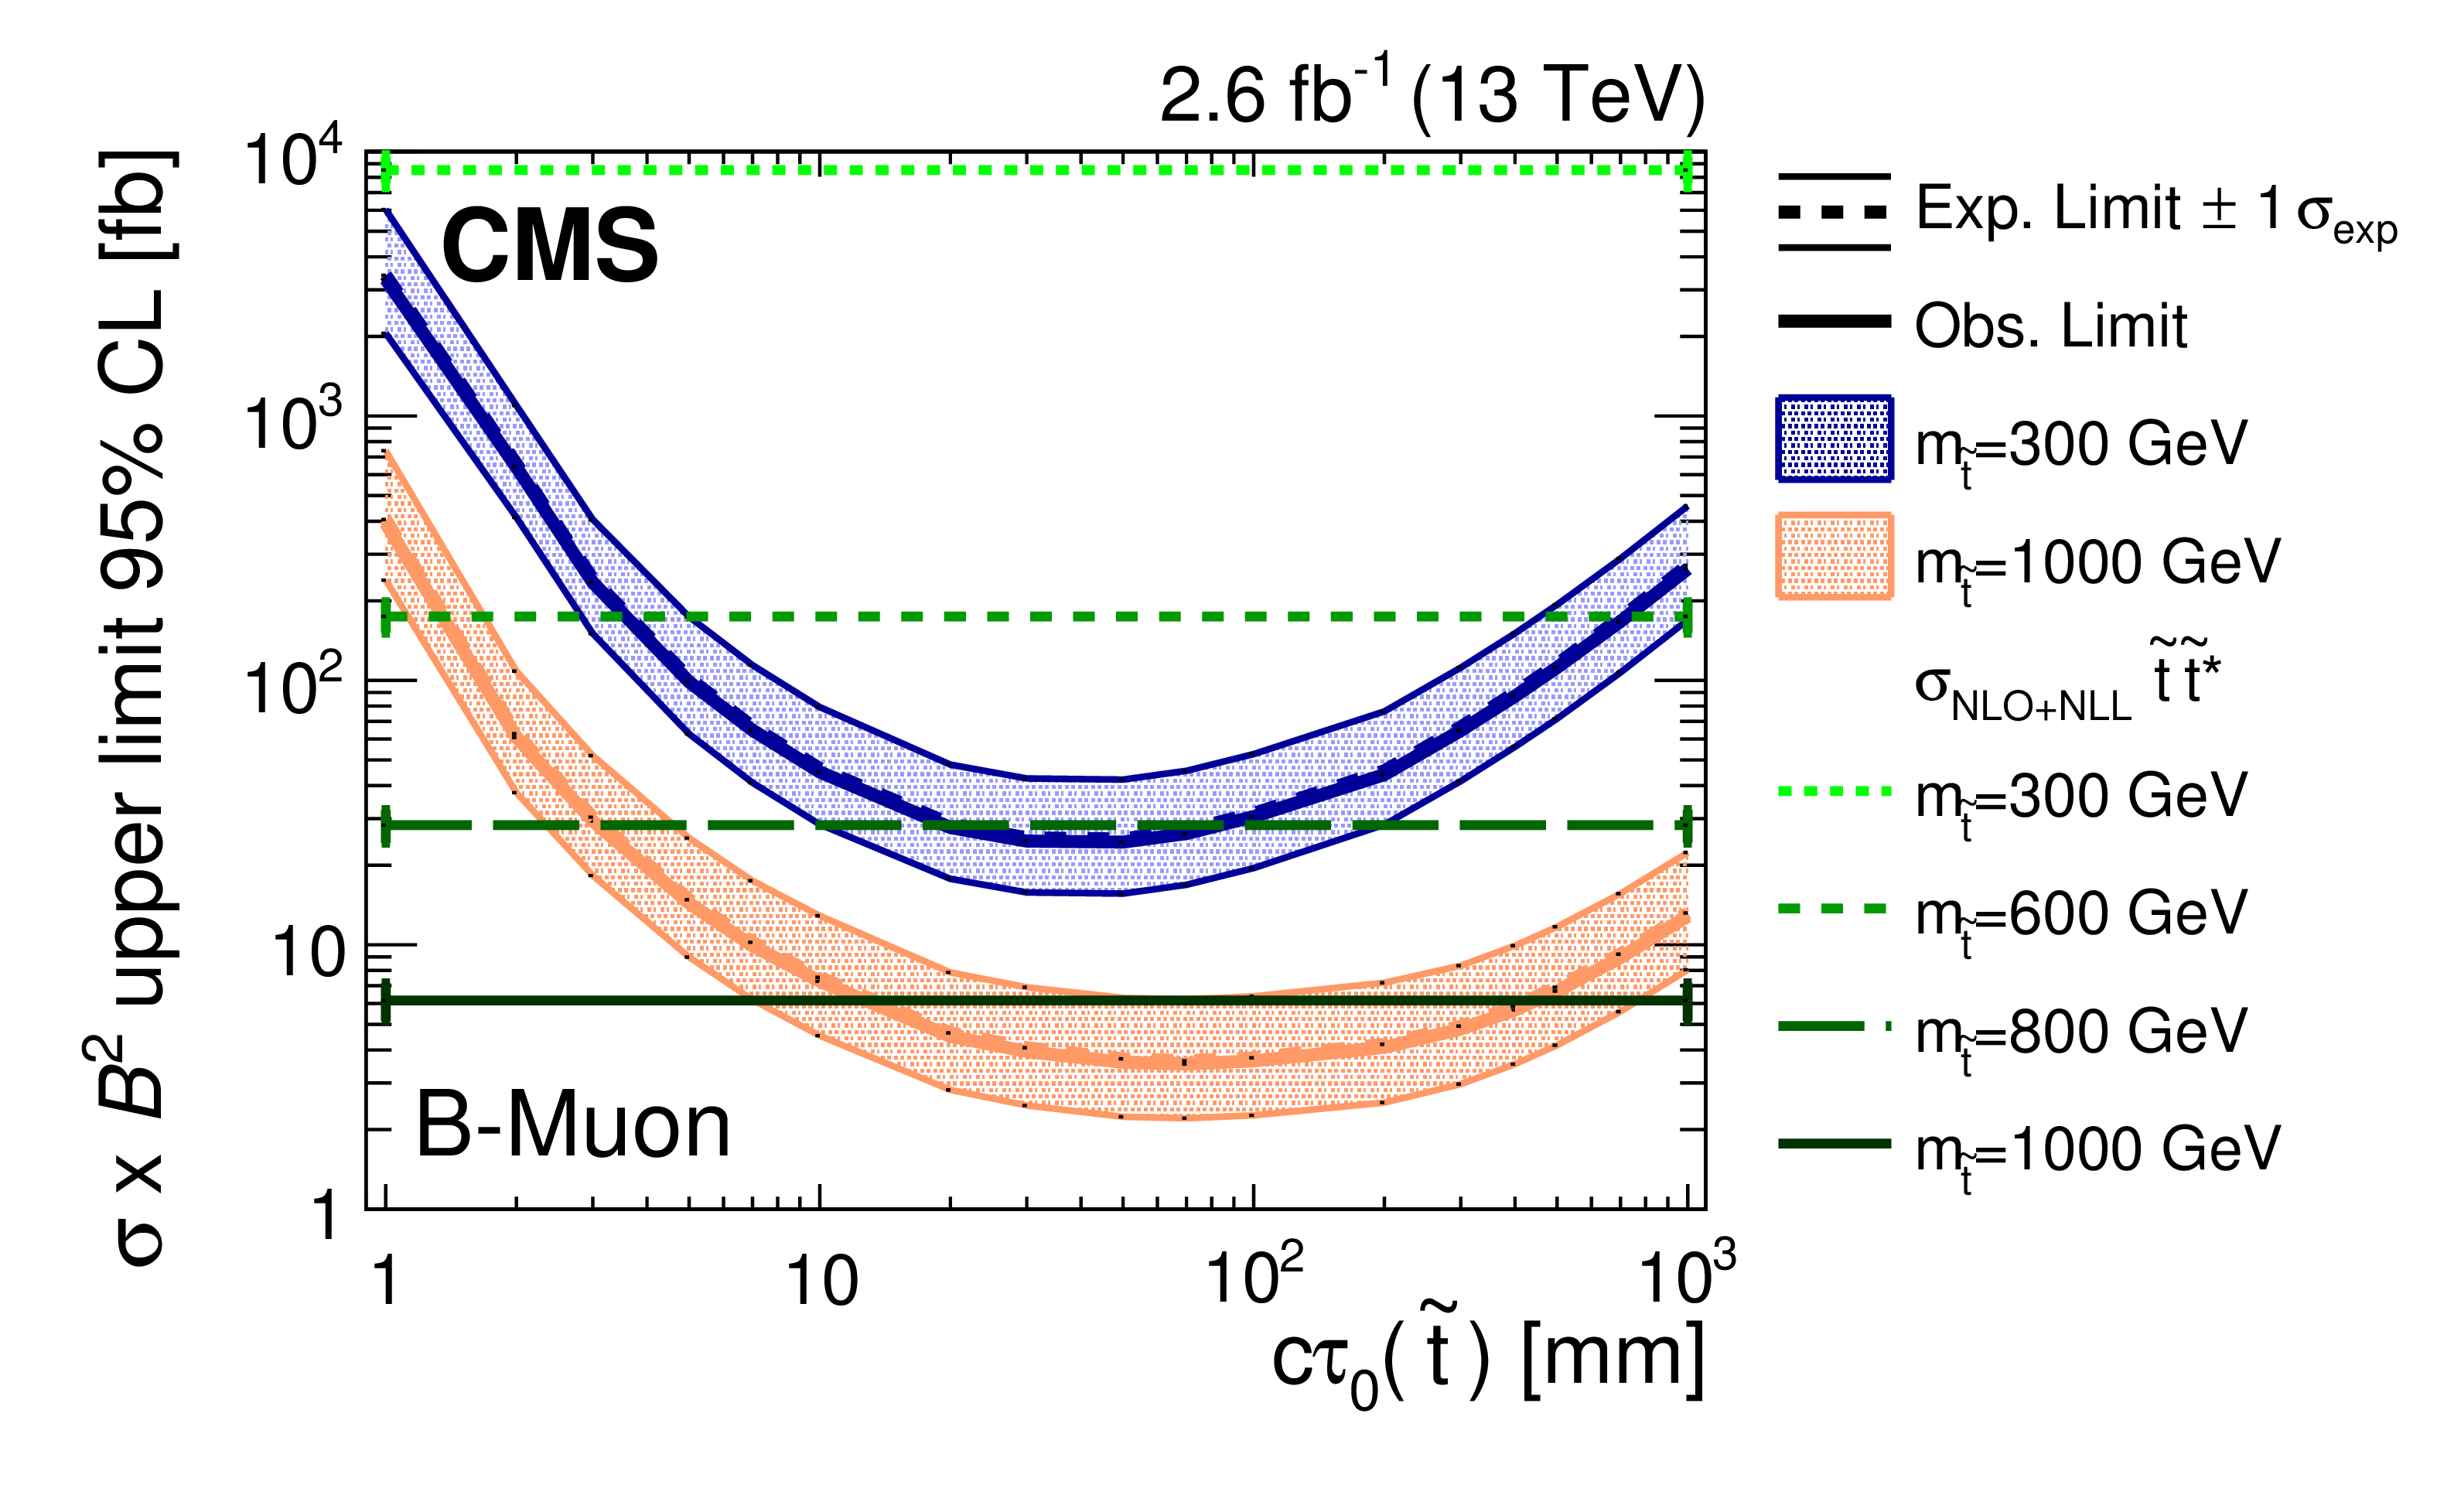
The excluded cross section at 95% CL for the B-Muon model as a function of the mass and proper decay length of the parent particle $\tilde{\mathrm{t}} $ (upper) and as a function of the proper decay length for two values of the mass (lower). The upper plot also shows the expected (observed) exclusion region with one standard deviation experimental (theoretical) uncertainties, utilizing a NLO+NLL calculation of the top squark production cross section. The lower plot also shows the expected upper limits with one standard deviation uncertainties as bands. The NLO+NLL calculation of the top squark production cross section is drawn horizontally in green for four mass values. |
png pdf |
Additional Figure 4-a:
The excluded cross section at 95% CL for the B-Muon model as a function of the mass and proper decay length of the parent particle $\tilde{\mathrm{t}} $. The plot also shows the expected (observed) exclusion region with one standard deviation experimental (theoretical) uncertainties, utilizing a NLO+NLL calculation of the top squark production cross section. |
png pdf |
Additional Figure 4-b:
The excluded cross section at 95% CL for the B-Muon model as a function of the proper decay length for two values of the mass. The plot also shows the expected upper limits with one standard deviation uncertainties as bands. The NLO+NLL calculation of the top squark production cross section is drawn horizontally in green for four mass values. |
| Additional Tables | |
png pdf |
Additional Table 1:
Signal efficiencies (in %) for $c\tau _0=$ 30 mm and various values of mass with modified branching ratios relative to the Jet-Jet and B-Lepton models. Selection requirements are cumulative from the first row to the last. |
png pdf |
Additional Table 2:
Signal efficiencies (in %) for $m_{X^0}=m_{\tilde{\mathrm{t}}}=$ 300 GeV and for various values of $c\tau _0$ with modified branching ratios relative to the Jet-Jet and B-Lepton models. Selection requirements are cumulative from the first row to the last. |
| References | ||||
| 1 | ATLAS Collaboration | Search for long-lived, weakly interacting particles that decay to displaced hadronic jets in proton-proton collisions at $ \sqrt{s}= $ 8 TeV with the atlas detector | PRD 92 (2015) 012010 | 1504.03634 |
| 2 | ATLAS Collaboration | Search for massive, long-lived particles using multitrack displaced vertices or displaced lepton pairs in pp collisions at $ \sqrt{s} = $ 8 TeV with the ATLAS detector | PRD 92 (2015) 072004 | 1504.05162 |
| 3 | CMS Collaboration | Search for long-lived neutral particles decaying to quark-antiquark pairs in proton-proton collisions at $ \sqrt{s} = $ 8 TeV | PRD 91 (2015) 012007 | CMS-EXO-12-038 1411.6530 |
| 4 | LHCb Collaboration | Search for long-lived particles decaying to jet pairs | EPJC 75 (2015) 152 | 1412.3021 |
| 5 | LHCb Collaboration | Search for Higgs-like bosons decaying into long-lived exotic particles | EPJC 76 (2016) 664 | 1609.03124 |
| 6 | M. Cacciari, G. P. Salam, and G. Soyez | FastJet user manual | EPJC 72 (2012) | 1111.6097 |
| 7 | M. Cacciari, G. P. Salam, and G. Soyez | The anti-$ k_t $ jet clustering algorithm | JHEP 04 (2008) 063 | 0802.1189 |
| 8 | CMS Collaboration | The CMS trigger system | JINST 12 (2017) P01020 | CMS-TRG-12-001 1609.02366 |
| 9 | CMS Collaboration | The CMS experiment at the CERN LHC | JINST 3 (2008) S08004 | CMS-00-001 |
| 10 | J. Alwall et al. | MadGraph 5: going beyond | JHEP 06 (2011) 128 | 1106.0522 |
| 11 | T. Sjostrand, S. Mrenna, and P. Z. Skands | A brief introduction to PYTHIA 8.1 | CPC 178 (2008) 852 | 0710.3820 |
| 12 | NNPDF Collaboration | Parton distributions with LHC data | NPB 867 (2013) 244 | 1207.1303 |
| 13 | GEANT4 Collaboration | GEANT4---a simulation toolkit | NIMA 506 (2003) 250 | |
| 14 | G. R. Farrar and P. Fayet | Phenomenology of the production, decay, and detection of new hadronic states associated with supersymmetry | PLB 76 (1978) 575 | |
| 15 | P. W. Graham, D. E. Kaplan, S. Rajendran, and P. Saraswat | Displaced supersymmetry | JHEP 07 (2012) 149 | 1204.6038 |
| 16 | CMS Collaboration | Description and performance of track and primary-vertex reconstruction with the CMS tracker | JINST 9 (2014) P10009 | CMS-TRK-11-001 1405.6569 |
| 17 | CMS Collaboration | Jet performance in pp collisions at $ \sqrt{s} = $ 7 TeV | CDS | |
| 18 | T. Junk | Confidence level computation for combining searches with small statistics | NIMA 434 (1999) 435 | hep-ex/9902006 |
| 19 | A. L. Read | Presentation of search results: the $ CL_s $ technique | in Durham IPPP Workshop: Advanced Statistical Techniques in Particle Physics, p. 2693 Durham, UK, March, 2002 [JPG 28 (2002) 2693] | |
| 20 | T. L. H. C. G. The ATLAS Collaboration, The CMS Collaboration | Procedure for the LHC Higgs boson search combination in Summer 2011 | CMS-NOTE-2011-005 | |
| 21 | G. Cowan, K. Cranmer, E. Gross, and O. Vitells | Asymptotic formulae for likelihood-based tests of new physics | EPJC 71 (2011) 1554 | 1007.1727 |
| 22 | W. Beenakker, R. Hopker, M. Spira, and P. M. Zerwas | Squark and gluino production at hadron colliders | NPB 492 (1997) 51 | hep-ph/9610490 |
| 23 | A. Kulesza and L. Motyka | Threshold resummation for squark-antisquark and gluino-pair production at the LHC | PRL 102 (2009) 111802 | 0807.2405 |
| 24 | A. Kulesza and L. Motyka | Soft gluon resummation for the production of gluino-gluino and squark-antisquark pairs at the LHC | PRD 80 (2009) 095004 | 0905.4749 |
| 25 | W. Beenakker et al. | Soft-gluon resummation for squark and gluino hadroproduction | JHEP 12 (2009) 041 | 0909.4418 |
| 26 | W. Beenakker et al. | Squark and gluino hadroproduction | Int. J. Mod. Phys. A 26 (2011) 2637 | 1105.1110 |
| 27 | C. Borschensky et al. | Squark and gluino production cross sections in pp collisions at $ \sqrt{s} = $ 13, 14, 33 and 100 TeV | EPJC 74 (2014), no. 12 | 1407.5066 |
|
|
Compact Muon Solenoid LHC, CERN |
|

|

|

|

|

|